Attached files
| file | filename |
|---|---|
| EX-99.1 - EX-99.1 - ARMSTRONG WORLD INDUSTRIES INC | awi-ex991_7.htm |
| 8-K - 8-K - ARMSTRONG WORLD INDUSTRIES INC | awi-8k_20170731.htm |
Earnings Call Presentation 2nd Quarter 2017 July 31, 2017 Exhibit 99.2
Our disclosures in this presentation, including without limitation, those relating to future financial results market conditions and guidance, and in our other public documents and comments contain forward-looking statements within the meaning of the Private Securities Litigation Reform Act. Those statements provide our future expectations or forecasts and can be identified by our use of words such as “anticipate,” “estimate,” “expect,” “project,” “intend,” “plan,” “believe,” “outlook,” “target,” “predict,” “may,” “will,” “would,” “could,” “should,” “seek,” and other words or phrases of similar meaning in connection with any discussion of future operating or financial performance. Forward-looking statements, by their nature, address matters that are uncertain and involve risks because they relate to events and depend on circumstances that may or may not occur in the future. As a result, our actual results may differ materially from our expected results and from those expressed in our forward-looking statements. A more detailed discussion of the risks and uncertainties that may affect our ability to achieve the projected performance is included in the “Risk Factors” and “Management’s Discussion and Analysis” sections of our reports on Forms 10-K and 10-Q filed with the U.S. Securities and Exchange Commission (“SEC”). Forward-looking statements speak only as of the date they are made. We undertake no obligation to update any forward-looking statements beyond what is required under applicable securities law. In addition, we will be referring to non-GAAP financial measures within the meaning of SEC Regulation G. A reconciliation of the differences between these measures with the most directly comparable financial measures calculated in accordance with GAAP are included within this presentation and available on the Investor Relations page of our website at www.armstrongceilings.com. The guidance in this presentation is only effective as of the date given, July 31, 2017, and will not be updated or affirmed unless and until we publicly announce updated or affirmed guidance. Safe Harbor Statement
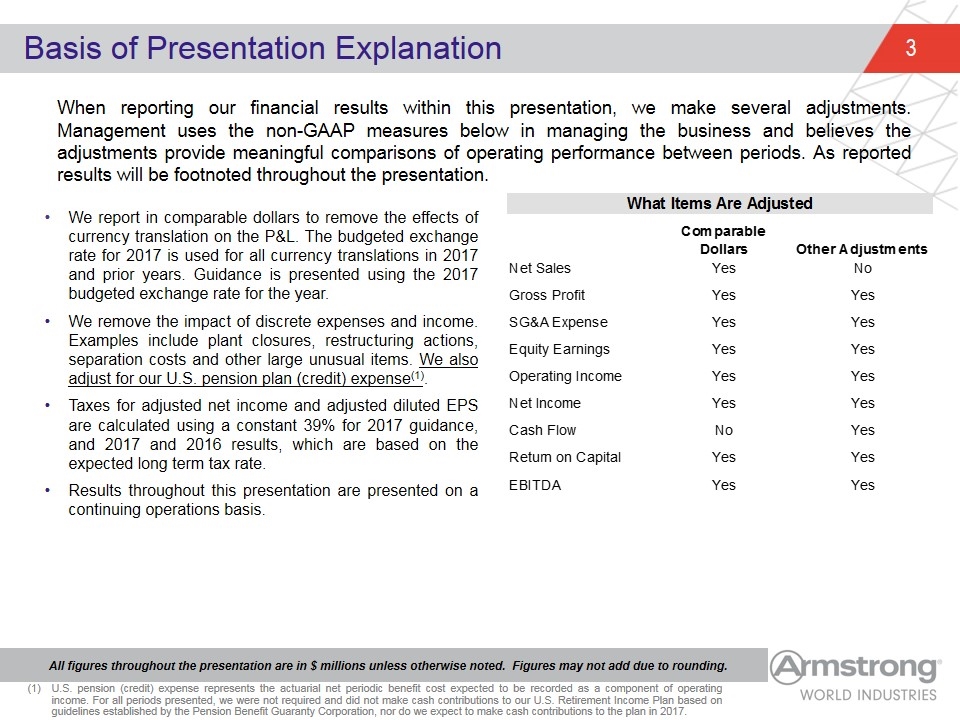
All figures throughout the presentation are in $ millions unless otherwise noted. Figures may not add due to rounding. When reporting our financial results within this presentation, we make several adjustments. Management uses the non-GAAP measures below in managing the business and believes the adjustments provide meaningful comparisons of operating performance between periods. As reported results will be footnoted throughout the presentation. Basis of Presentation Explanation We report in comparable dollars to remove the effects of currency translation on the P&L. The budgeted exchange rate for 2017 is used for all currency translations in 2017 and prior years. Guidance is presented using the 2017 budgeted exchange rate for the year. We remove the impact of discrete expenses and income. Examples include plant closures, restructuring actions, separation costs and other large unusual items. We also adjust for our U.S. pension plan (credit) expense(1). Taxes for adjusted net income and adjusted diluted EPS are calculated using a constant 39% for 2017 guidance, and 2017 and 2016 results, which are based on the expected long term tax rate. Results throughout this presentation are presented on a continuing operations basis. U.S. pension (credit) expense represents the actuarial net periodic benefit cost expected to be recorded as a component of operating income. For all periods presented, we were not required and did not make cash contributions to our U.S. Retirement Income Plan based on guidelines established by the Pension Benefit Guaranty Corporation, nor do we expect to make cash contributions to the plan in 2017. What Items Are Adjusted Comparable Dollars Other Adjustments Net Sales Yes No Gross Profit Yes Yes SG&A Expense Yes Yes Equity Earnings Yes Yes Operating Income Yes Yes Net Income Yes Yes Cash Flow No Yes Return on Capital Yes Yes EBITDA Yes Yes
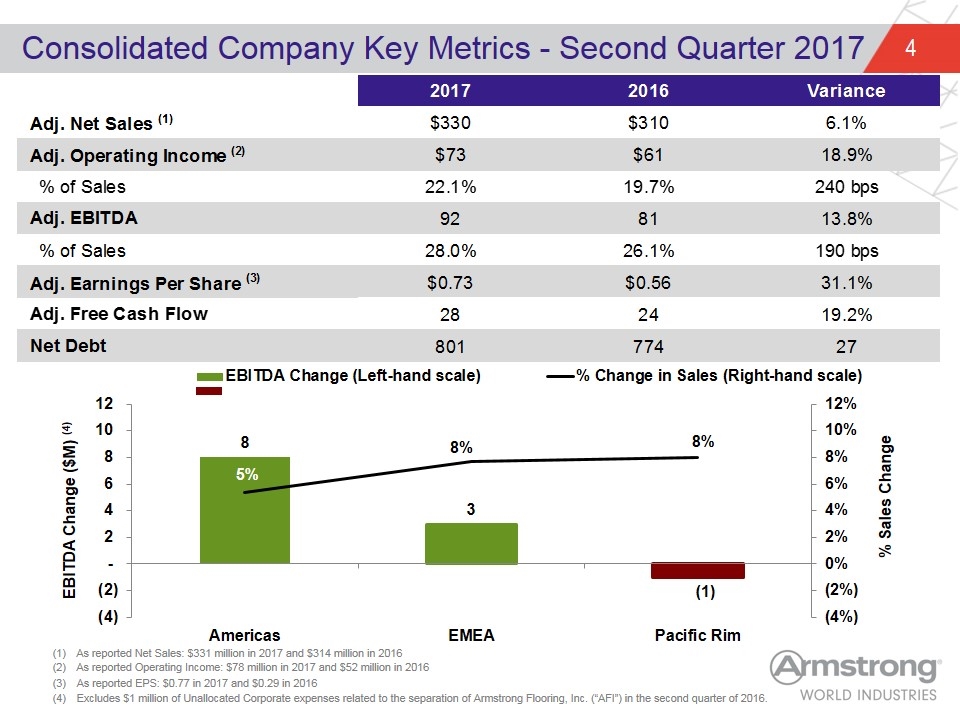
Consolidated Company Key Metrics - Second Quarter 2017 As reported Net Sales: $331 million in 2017 and $314 million in 2016 As reported Operating Income: $78 million in 2017 and $52 million in 2016 As reported EPS: $0.77 in 2017 and $0.29 in 2016 Excludes $1 million of Unallocated Corporate expenses related to the separation of Armstrong Flooring, Inc. (“AFI”) in the second quarter of 2016. 2017 2016 Variance Adj. Net Sales (1) $329.54939474456035 $310.48455249056917 6.1% Adj. Operating Income (2) $72.665809347377504 $61.129183481355895 0.18872533884801887 % of Sales 0.22050050919893838 0.19688317177458503 240 Adj. EBITDA 92.172286233037511 64 81.012817061035904 0.13774942752075819 % of Sales 0.27969186927040757 0.2609238250701591 190 Adj. Earnings Per Share (3) $0.73043098141341289 $0.55771428571428572 0.31068669823101697 Adj. Free Cash Flow 28 24 0.192 Net Debt 800.69999999999993 774.4 27
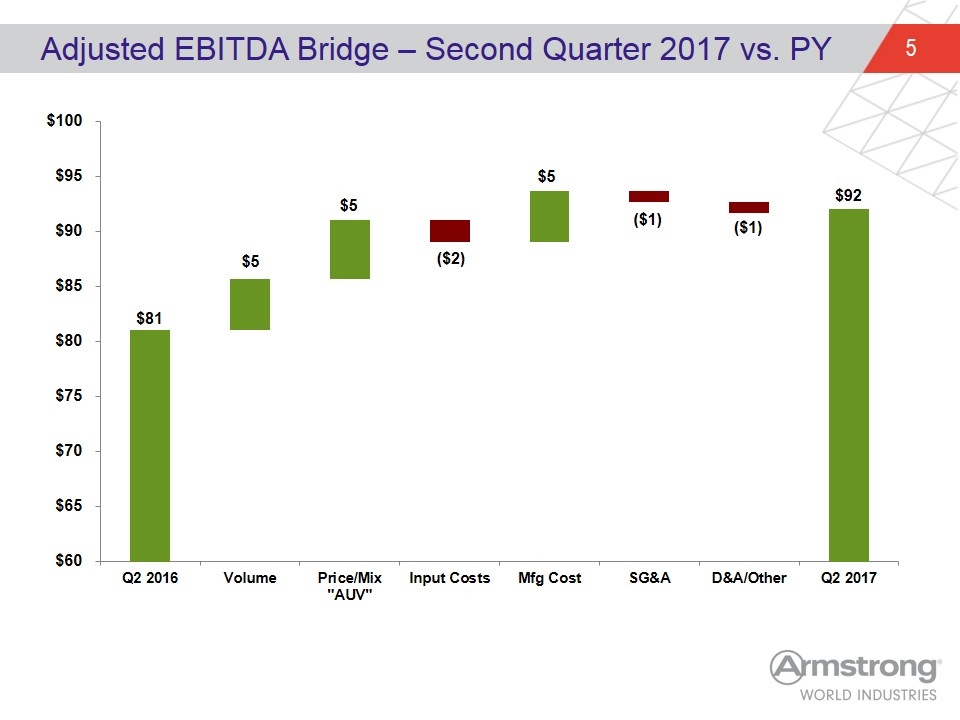
Adjusted EBITDA Bridge – Second Quarter 2017 vs. PY $5 $5 ($2) ($1) $5 ($1)
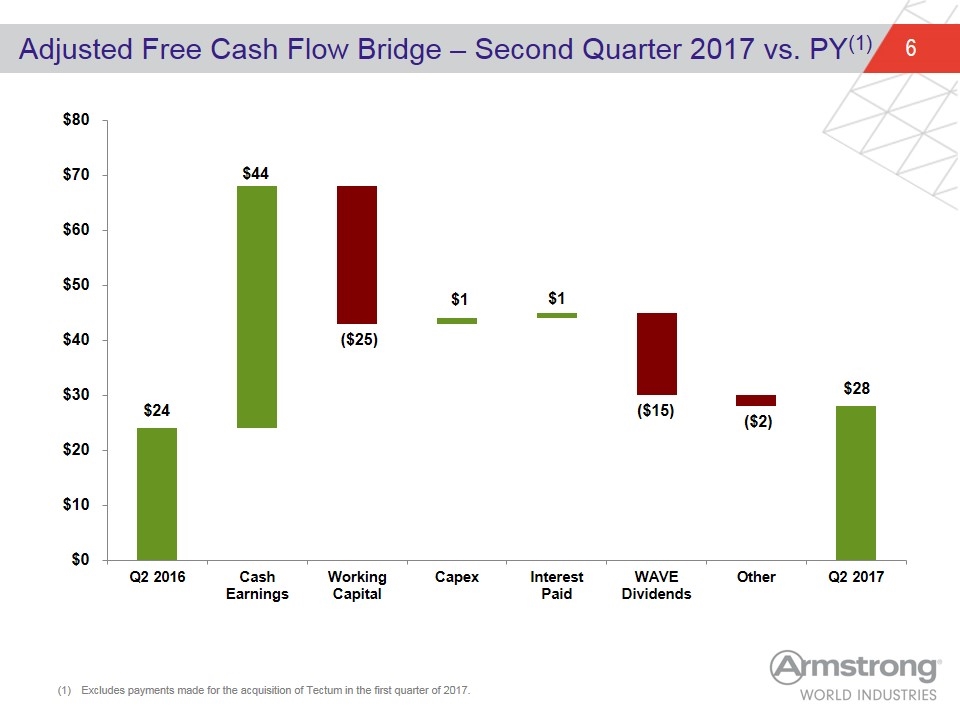
Adjusted Free Cash Flow Bridge – Second Quarter 2017 vs. PY(1) $44 Excludes payments made for the acquisition of Tectum in the first quarter of 2017. ($15) ($2)
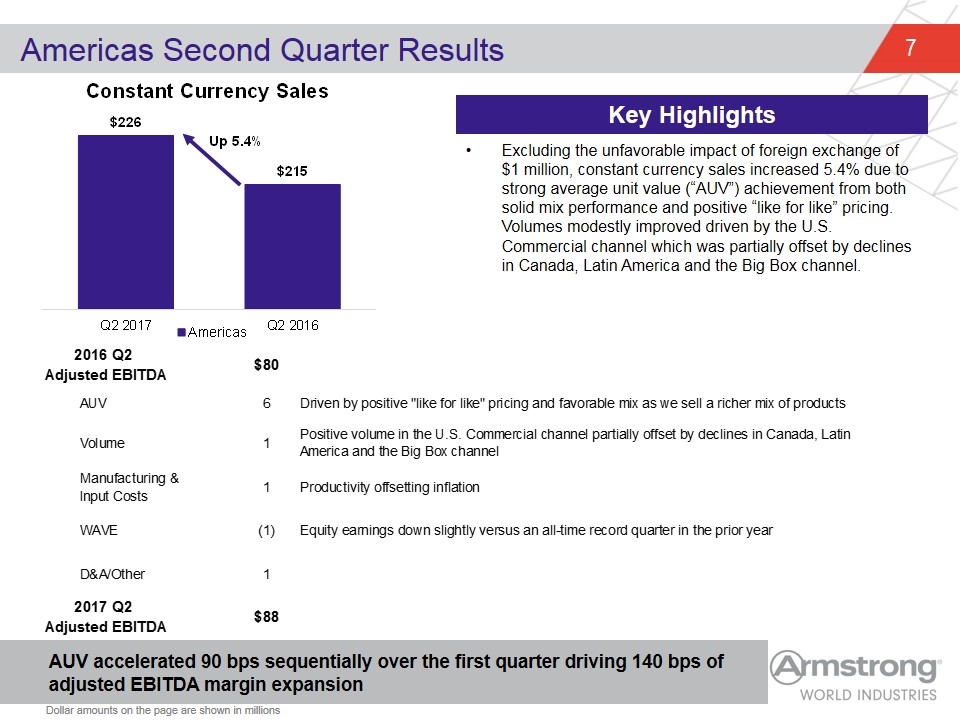
Excluding the unfavorable impact of foreign exchange of $1 million, constant currency sales increased 5.4% due to strong average unit value (“AUV”) achievement from both solid mix performance and positive “like for like” pricing. Volumes modestly improved driven by the U.S. Commercial channel which was partially offset by declines in Canada, Latin America and the Big Box channel. Americas Second Quarter Results AUV accelerated 90 bps sequentially over the first quarter driving 140 bps of adjusted EBITDA margin expansion Key Highlights Dollar amounts on the page are shown in millions 2016 Q2 Adjusted EBITDA $80.407799643032902 AUV 6 Driven by positive "like for like" pricing and favorable mix as we sell a richer mix of products Volume 1 Positive volume in the U.S. Commercial channel partially offset by declines in Canada, Latin America and the Big Box channel Manufacturing & Input Costs 1 Productivity offsetting inflation WAVE -1 Equity earnings down slightly versus an all-time record quarter in the prior year D&A/Other 1 2017 Q2 Adjusted EBITDA $87.938120279260119
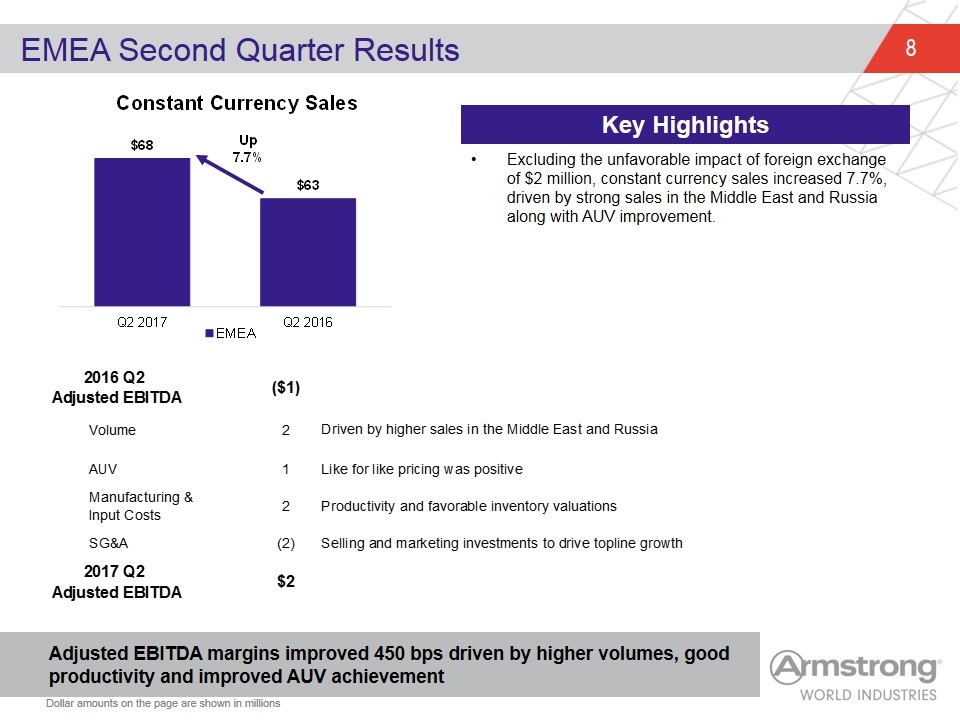
Excluding the unfavorable impact of foreign exchange of $2 million, constant currency sales increased 7.7%, driven by strong sales in the Middle East and Russia along with AUV improvement. EMEA Second Quarter Results Adjusted EBITDA margins improved 450 bps driven by higher volumes, good productivity and improved AUV achievement Key Highlights Dollar amounts on the page are shown in millions 2016 Q2 Adjusted EBITDA $-0.69728923185298686 Volume 2 Driven by higher sales in the Middle East and Russia AUV 1 Like for like pricing was positive Manufacturing & Input Costs 2 Productivity and favorable inventory valuations SG&A -2 Selling and marketing investments to drive topline growth 2017 Q2 Adjusted EBITDA $2.3182615031000235
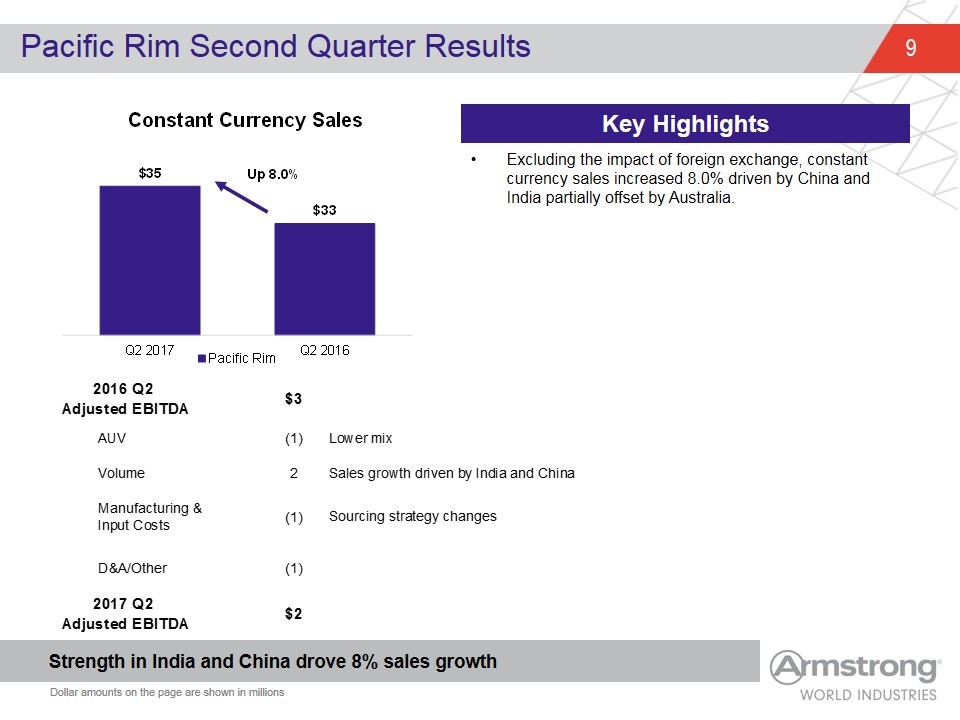
Excluding the impact of foreign exchange, constant currency sales increased 8.0% driven by China and India partially offset by Australia. Pacific Rim Second Quarter Results Strength in India and China drove 8% sales growth Key Highlights Dollar amounts on the page are shown in millions 2016 Q2 Adjusted EBITDA $2.5917366182447941 AUV -1 Lower mix Volume 2 Sales growth driven by India and China Manufacturing & Input Costs -1 Sourcing strategy changes D&A/Other -1 2017 Q2 Adjusted EBITDA $1.9421702713349986 0.15 adjustment
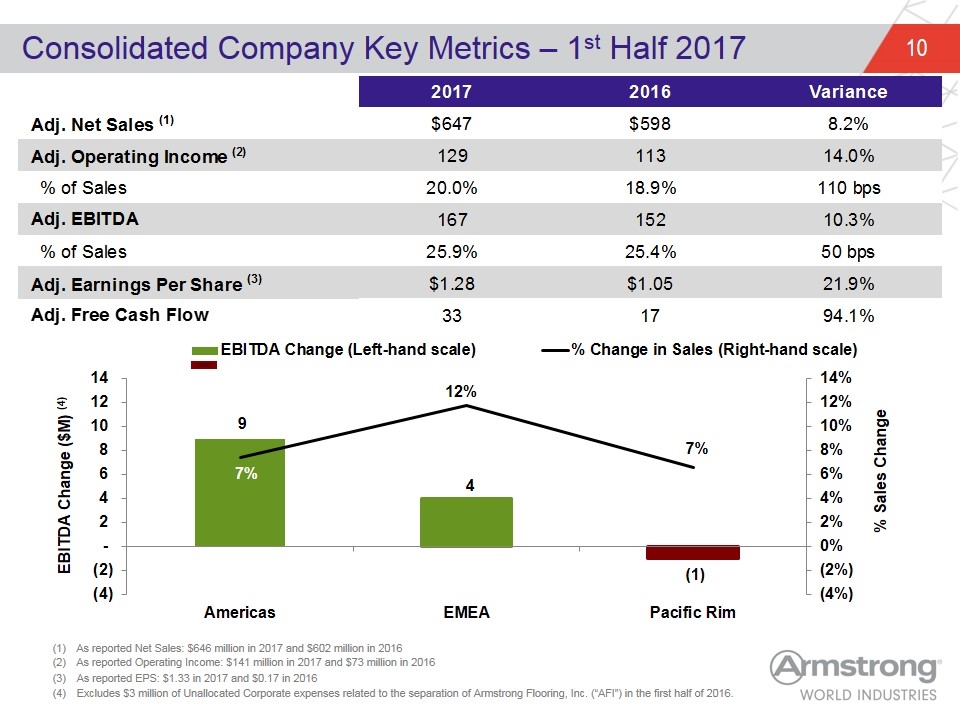
Consolidated Company Key Metrics – 1st Half 2017 As reported Net Sales: $646 million in 2017 and $602 million in 2016 As reported Operating Income: $141 million in 2017 and $73 million in 2016 As reported EPS: $1.33 in 2017 and $0.17 in 2016 Excludes $3 million of Unallocated Corporate expenses related to the separation of Armstrong Flooring, Inc. (“AFI”) in the first half of 2016. 2017 2016 Variance Adj. Net Sales (1) $646.97880981789058 $597.94220750577927 8.2% Adj. Operating Income (2) 129.08078511586902 113.153567560135 0.14000000000000001 % of Sales 0.19951315739722952 0.189 110 Adj. EBITDA 167.4 151.69999999999999 0.10299999999999999 % of Sales 0.25900000000000001 0.25370344841986048 50 adjustment 10 Adj. Earnings Per Share (3) $1.2763982199981565 $1.05 0.219 Adj. Free Cash Flow 33 17 0.94117647058823528
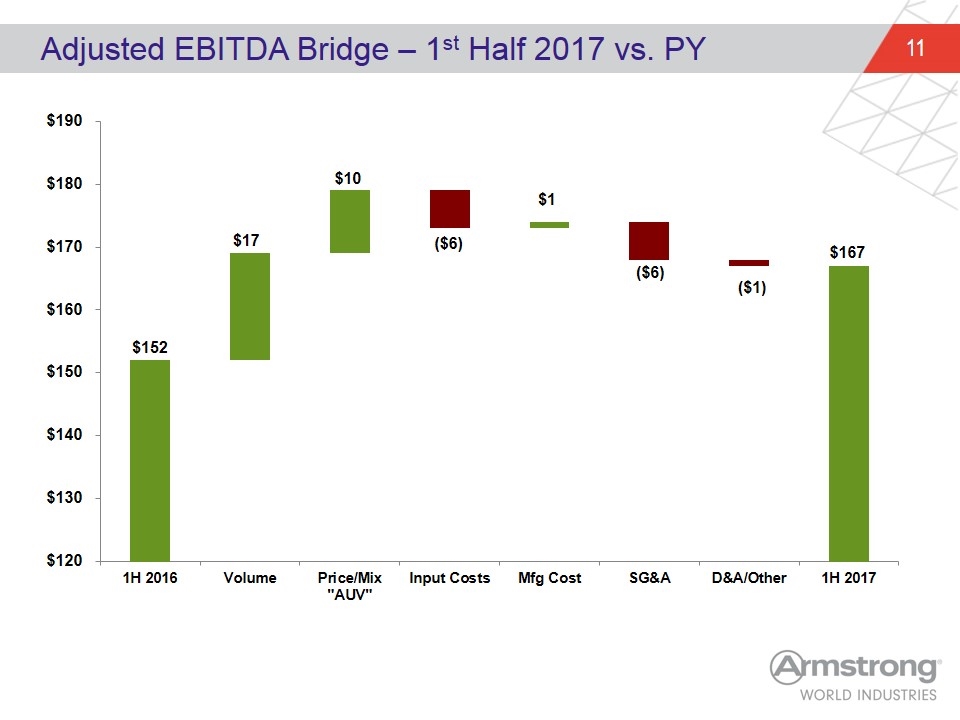
Adjusted EBITDA Bridge – 1st Half 2017 vs. PY $17 $10 ($6) ($6) $1 ($1)
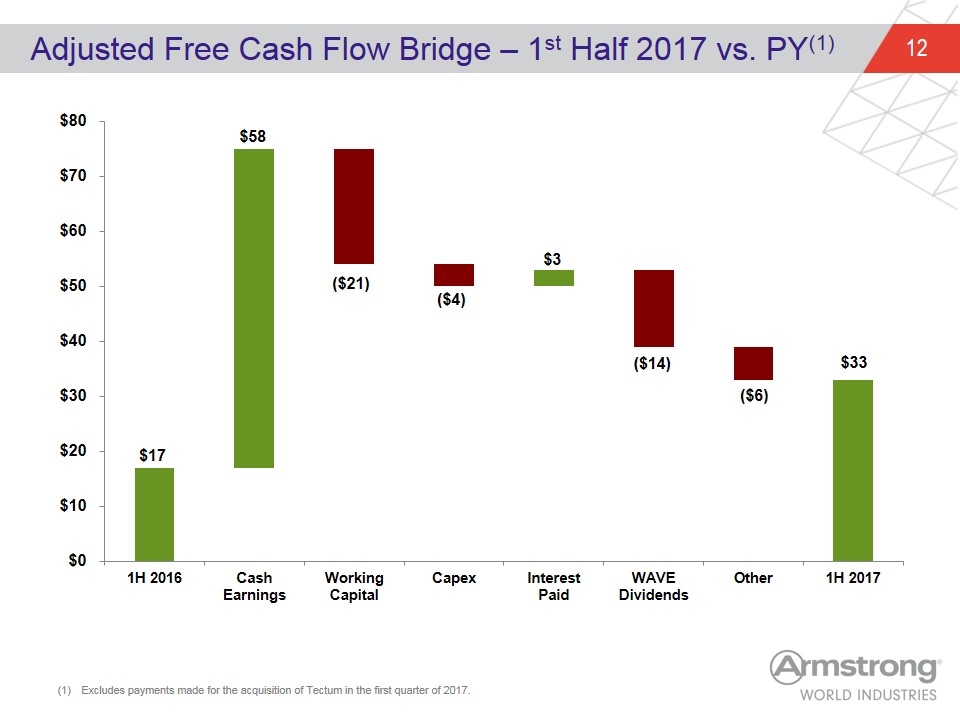
Adjusted Free Cash Flow Bridge – 1st Half 2017 vs. PY(1) $58 Excludes payments made for the acquisition of Tectum in the first quarter of 2017. ($14) $3 ($6)
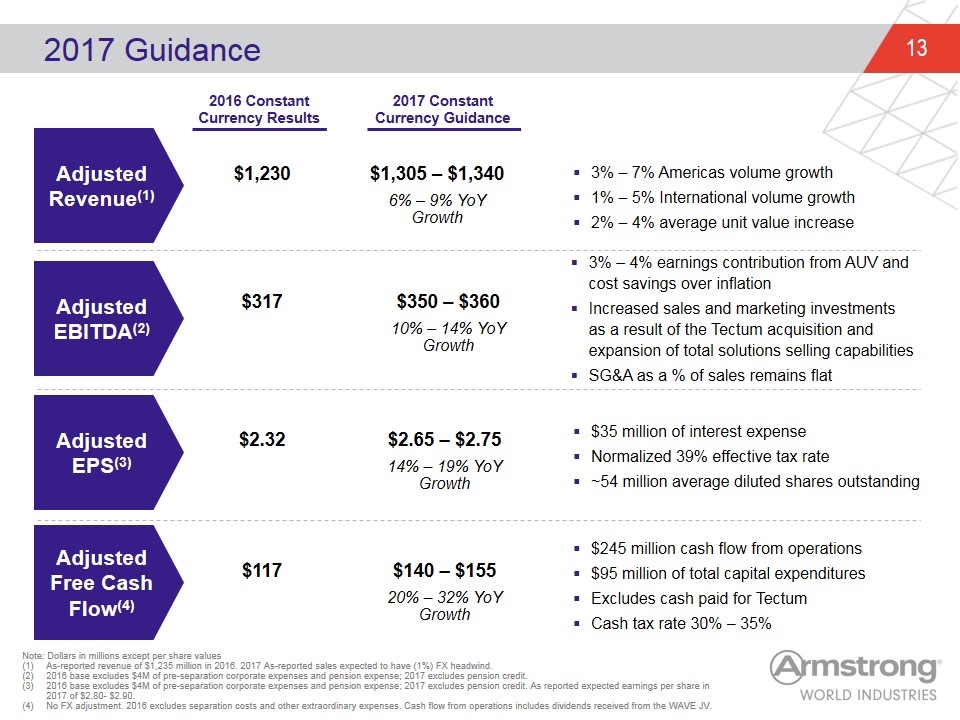
2017 Guidance $2.65 – $2.75 14% – 19% YoY Growth $2.32 Adjusted EBITDA(2) Adjusted EPS(3) Adjusted Free Cash Flow(4) Adjusted Revenue(1) $1,230 $317 $1,305 – $1,340 6% – 9% YoY Growth $350 – $360 10% – 14% YoY Growth $140 – $155 20% – 32% YoY Growth $117 Note: Dollars in millions except per share values As-reported revenue of $1,235 million in 2016. 2017 As-reported sales expected to have (1%) FX headwind. 2016 base excludes $4M of pre-separation corporate expenses and pension expense; 2017 excludes pension credit. 2016 base excludes $4M of pre-separation corporate expenses and pension expense; 2017 excludes pension credit. As reported expected earnings per share in 2017 of $2.80- $2.90. No FX adjustment. 2016 excludes separation costs and other extraordinary expenses. Cash flow from operations includes dividends received from the WAVE JV. 3% – 7% Americas volume growth 1% – 5% International volume growth 2% – 4% average unit value increase 3% – 4% earnings contribution from AUV and cost savings over inflation Increased sales and marketing investments as a result of the Tectum acquisition and expansion of total solutions selling capabilities SG&A as a % of sales remains flat $35 million of interest expense Normalized 39% effective tax rate ~54 million average diluted shares outstanding $245 million cash flow from operations $95 million of total capital expenditures Excludes cash paid for Tectum Cash tax rate 30% – 35% 2016 Constant Currency Results 2017 Constant Currency Guidance
Appendix
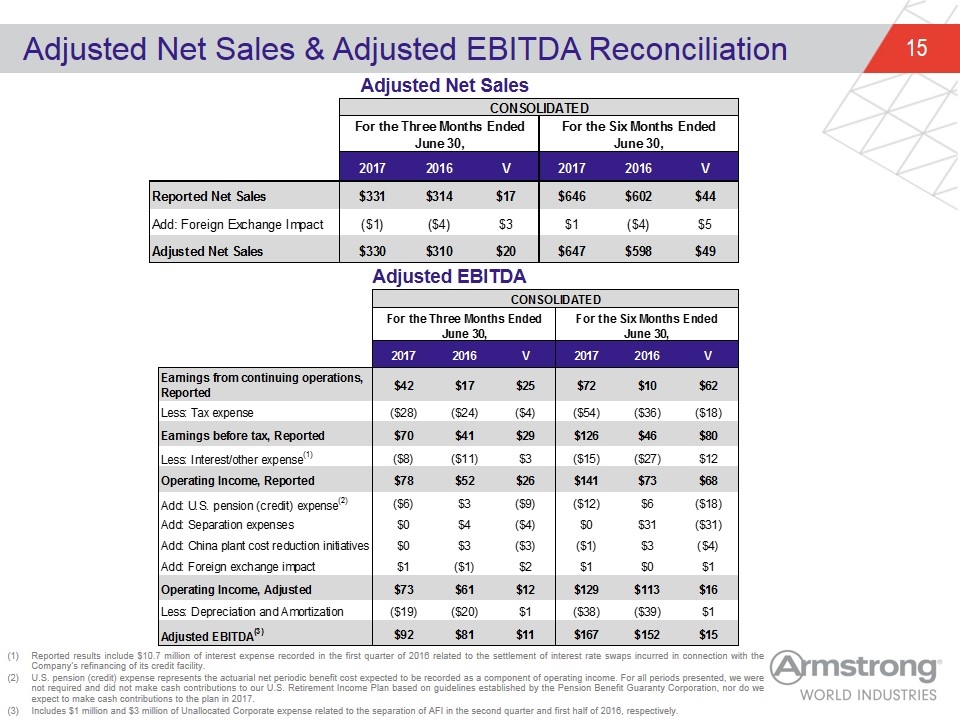
Adjusted Net Sales & Adjusted EBITDA Reconciliation Reported results include $10.7 million of interest expense recorded in the first quarter of 2016 related to the settlement of interest rate swaps incurred in connection with the Company’s refinancing of its credit facility. U.S. pension (credit) expense represents the actuarial net periodic benefit cost expected to be recorded as a component of operating income. For all periods presented, we were not required and did not make cash contributions to our U.S. Retirement Income Plan based on guidelines established by the Pension Benefit Guaranty Corporation, nor do we expect to make cash contributions to the plan in 2017. Includes $1 million and $3 million of Unallocated Corporate expense related to the separation of AFI in the second quarter and first half of 2016, respectively. Adjusted Net Sales Adjusted EBITDA CONSOLIDATED For the Three Months Ended June 30, For the Six Months Ended June 30, 2017 2016 V 2017 2016 V Reported Net Sales $330.8 $314.3 $16.5 $646.20000000000005 $601.70000000000005 $44 Add: Foreign Exchange Impact $-1 $-4 $3 $1 $-4 $5 Adjusted Net Sales $329.54939474456035 $310.48455249056917 $20 $646.97880981789058 $597.94220750577927 $49.036602312111313 CONSOLIDATED For the Three Months Ended June 30, For the Six Months Ended June 30, 2017 2016 V 2017 2016 V Earnings from continuing operations, Reported $41.500000000000021 $16.600000000000005 $24.900000000000016 $72.300000000000026 $9.5000000000000639 $62 Less: Tax expense $-28 $-24 $-4 $-54 $-36 $-18 Earnings before tax, Reported $70.100000000000023 $41.300000000000004 $28.800000000000018 $125.50000000000003 $46.200000000000067 $80 Less: Interest/other expense(1) $-8 $-11 $3 $-15 $-27 $12 Operating Income, Reported $78.40000000000002 $51.7 $26 $141.40000000000003 $73.300000000000068 $68.099999999999966 Add: U.S. pension (credit) expense(2) $-6 $3 $-9 $-12 $6 $-18 Add: Separation expenses $0 $4 $-4 $0 $31 $-31 Add: China plant cost reduction initiatives $0 $3 $-3 $-1 $3 $-4 Add: Foreign exchange impact $1 $-1 $2 $1 $0 $1 Operating Income, Adjusted $72.665809347377504 $61.129183481355895 $11.536625866021609 $129.08078511586902 $113.153567560135 $15.927217555734018 Less: Depreciation and Amortization $-19 $-19.883633579680009 $0.88363357968000855 $-38 $-39 $1 Adjusted EBITDA(3) $92.172286233037511 $81.012817061035904 $11.159469172001607 $167.4 $151.69999999999999 $15
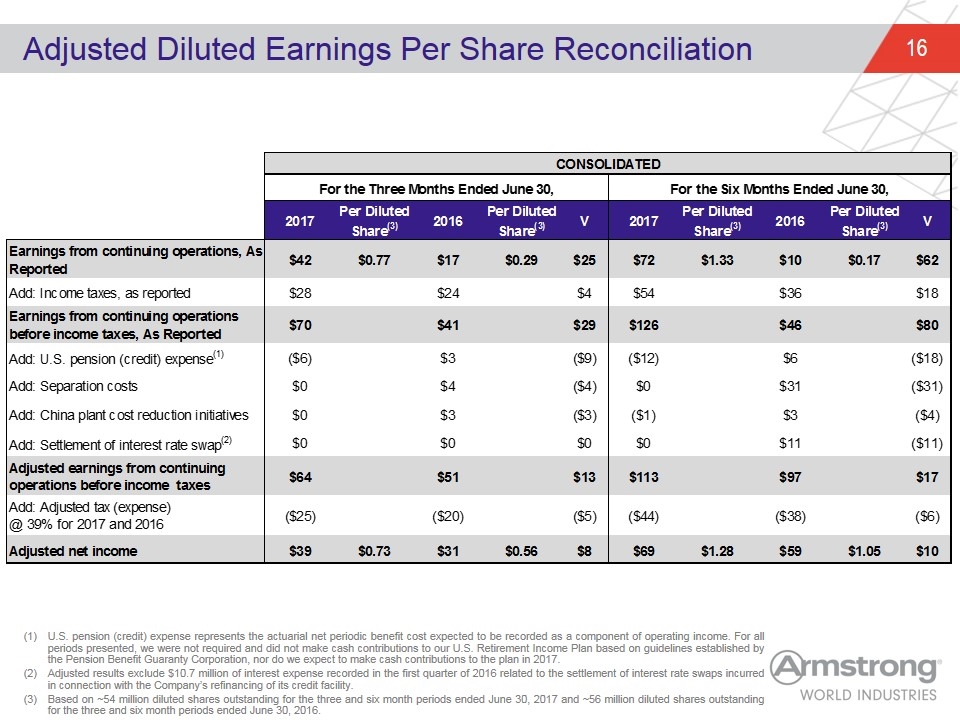
Adjusted Diluted Earnings Per Share Reconciliation U.S. pension (credit) expense represents the actuarial net periodic benefit cost expected to be recorded as a component of operating income. For all periods presented, we were not required and did not make cash contributions to our U.S. Retirement Income Plan based on guidelines established by the Pension Benefit Guaranty Corporation, nor do we expect to make cash contributions to the plan in 2017. Adjusted results exclude $10.7 million of interest expense recorded in the first quarter of 2016 related to the settlement of interest rate swaps incurred in connection with the Company’s refinancing of its credit facility. Based on ~54 million diluted shares outstanding for the three and six month periods ended June 30, 2017 and ~56 million diluted shares outstanding for the three and six month periods ended June 30, 2016. CONSOLIDATED For the Three Months Ended June 30, For the Six Months Ended June 30, 2017 Per DilutedShare(3) 2016 Per DilutedShare(3) V 2017 Per DilutedShare(3) 2016 Per DilutedShare(3) V Earnings from continuing operations, As Reported $41.500000000000021 $0.77 $16.600000000000005 $0.28999999999999998 $24.900000000000016 $72.300000000000026 $1.33 $9.5000000000000639 $0.17 $62 Add: Income taxes, as reported $28 $24 $4 $54 $36 $18 Earnings from continuing operations before income taxes, As Reported $70.100000000000023 $41.300000000000004 $28.800000000000018 $125.50000000000003 $46.200000000000067 $80 Add: U.S. pension (credit) expense(1) $-6 $3 $-9 $-12 $6 $-18 Add: Separation costs $0 $4 $-4 $0 $31 $-31 Add: China plant cost reduction initiatives $0 $3 $-3 $-1 $3 $-4 Add: Settlement of interest rate swap(2) $0 $0 $0 $0 $11 $-11 Adjusted earnings from continuing operations before income taxes $64.465809347377501 $51.2 $13.265809347377498 $113.26580934737751 $96.6 $16.665809347377518 Add: Adjusted tax (expense) @ 39% for 2017 and 2016 $-25 $-20 $-5 $-44 $-38 $-6 Adjusted net income $39.224143701900275 $0.73043098141341289 $31.231999999999999 $0.55771428571428572 $7.9921437019002752 $69.053143701900268 $1.2763982199981565 $58.9 $1.05 $10.153143701900269
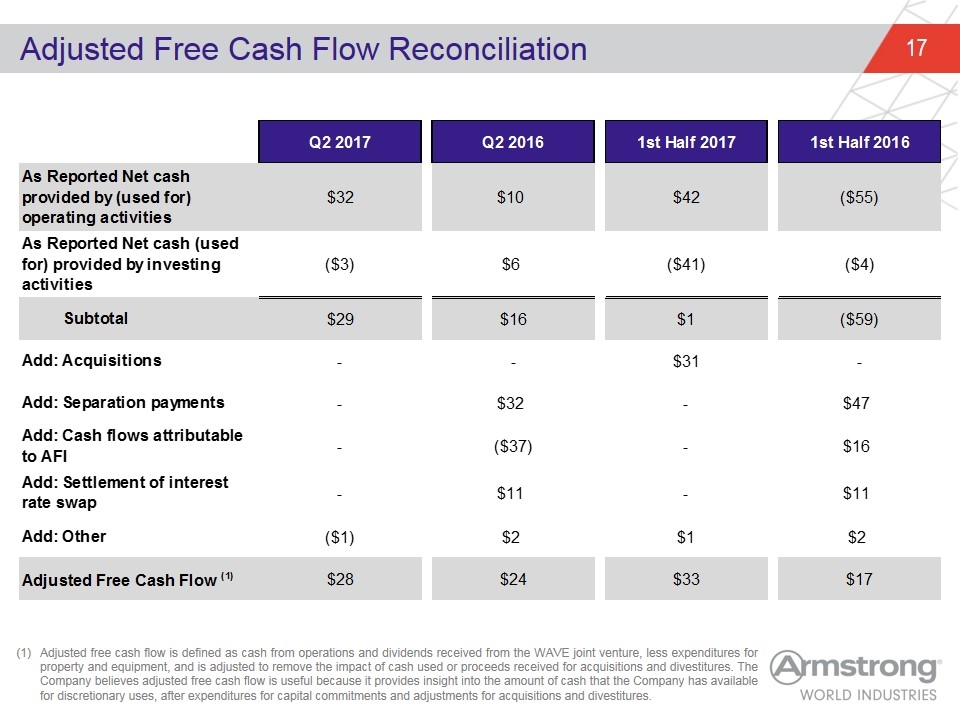
Adjusted Free Cash Flow Reconciliation Adjusted free cash flow is defined as cash from operations and dividends received from the WAVE joint venture, less expenditures for property and equipment, and is adjusted to remove the impact of cash used or proceeds received for acquisitions and divestitures. The Company believes adjusted free cash flow is useful because it provides insight into the amount of cash that the Company has available for discretionary uses, after expenditures for capital commitments and adjustments for acquisitions and divestitures. Q2 2017 Q2 2016 1st Half 2017 1st Half 2016 As Reported Net cash provided by (used for) operating activities $32 $10 $42.400000000000006 $-55.400000000000013 As Reported Net cash (used for) provided by investing activities $-3 $6 $-40.699999999999996 $-3.8999999999999959 Subtotal $29 $16 $1 $-59.300000000000011 Add: Acquisitions - - $31 - Add: Separation payments - $32 - $47 Add: Cash flows attributable to AFI - $-37 - $16 Add: Settlement of interest rate swap - $11 - $11 Add: Other $-1 $2 $1 $2 Adjusted Free Cash Flow (1) $28 $24 $33 $16.699999999999989
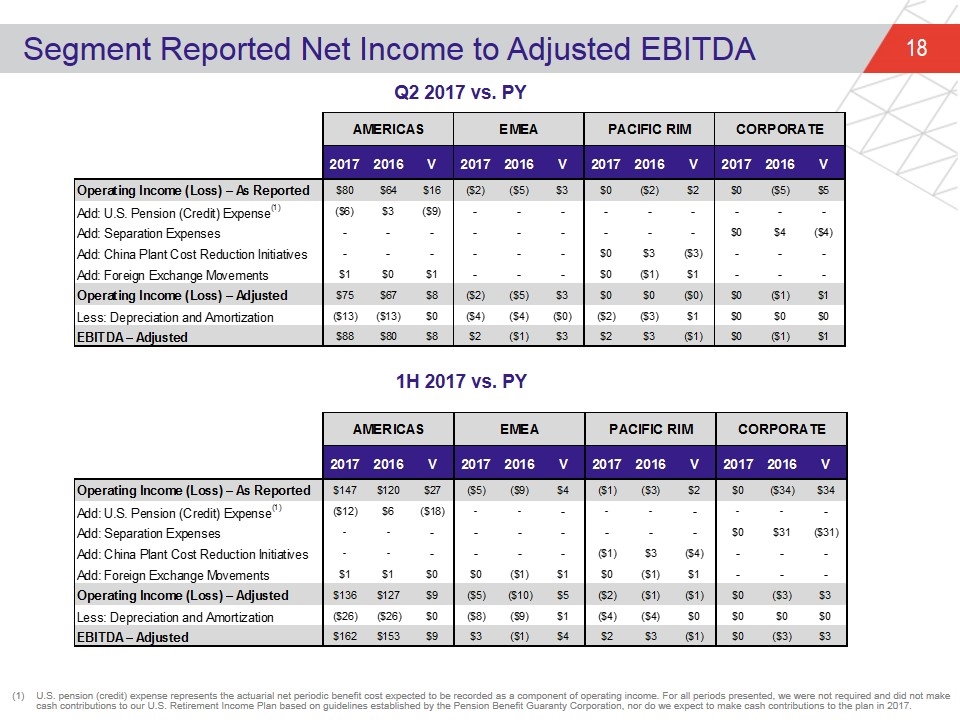
Segment Reported Net Income to Adjusted EBITDA Q2 2017 vs. PY 1H 2017 vs. PY U.S. pension (credit) expense represents the actuarial net periodic benefit cost expected to be recorded as a component of operating income. For all periods presented, we were not required and did not make cash contributions to our U.S. Retirement Income Plan based on guidelines established by the Pension Benefit Guaranty Corporation, nor do we expect to make cash contributions to the plan in 2017. AMERICAS EMEA PACIFIC RIM CORPORATE rounding factor 2016 V 2017 2016 V 2017 2016 V 2017 2016 V 2017 2016 V Operating Income (Loss) – As Reported $79.900000000000006 $64.3 $15.600000000000009 $-1.8 $-5.3 $3 $0.3 $-2.1 $2.4 $0 $-5.2 $5.2 Add: U.S. Pension (Credit) Expense(1) $-6 $3 $-9 - - - - - - - - - Add: Separation Expenses - - - - - - - - - $0 $4 $-4 Add: China Plant Cost Reduction Initiatives - - - - - - $0 $3 $-3 - - - Add: Foreign Exchange Movements $1 $0 $1 - - - $0 $-1 $1 - - - Operating Income (Loss) – Adjusted $74.510588926060109 $67.195206803032903 $8 $-1.7259206728599783 $-5.3648178340929897 $3 $0.10740691483499762 $0.43822448080479248 $-0.33081756596979484 $0 $-1.1341653261600035 $1.1341653261600035 0.2 Less: Depreciation and Amortization $-13 $-13.212592839999999 $0.21259283999999923 $-4.0441821759600014 $-4 $-4.4182175960001402E-2 $-1.834763356500001 $-3 $1.165236643499999 $0 $0 $0 EBITDA – Adjusted $87.938120279260119 $80.407799643032902 $8 $2.3182615031000235 $-0.69728923185298686 $3 $1.9421702713349986 $2.6417366182447943 $-0.69956634690979569 $0 $-1.1341653261600035 $1.1341653261600035 AMERICAS EMEA PACIFIC RIM CORPORATE 2016 V 2017 2016 V 2017 2016 V 2017 2016 V 2017 2016 V Operating Income (Loss) – As Reported $147.1 $120.4 $26.699999999999989 $-4.9000000000000004 $-9.3000000000000007 $4.4000000000000004 $-0.8 $-3.4 $2 $0 $-34.4 $34.4 Add: U.S. Pension (Credit) Expense(1) $-12 $6 $-18 - - - - - - - - - Add: Separation Expenses - - - - - - - - - $0 $31 $-31 Add: China Plant Cost Reduction Initiatives - - - - - - $-1 $3 $-4 - - - Add: Foreign Exchange Movements $1 $1 $0 $0 $-1 $1 $0 $-1 $1 - - - Operating Income (Loss) – Adjusted $136 $126.80482305943301 $9.195176940566995 $-4.7831476303599754 $-9.6999999999999993 $4.9168523696400239 $-1.5549112616746774 $-0.8 $-0.75491126167467737 $0 $-3.3132123580000203 $3.3132123580000203 Less: Depreciation and Amortization $-26 $-26.124177010000409 $0.12417701000040893 $-7.882976795940003 $-9 $1 $-3.6814550105900015 $-4 $0.31854498940999854 $0 $0 $0 EBITDA – Adjusted $162.18419280742 $152.92900006943341 $9.2551927379865901 $3.0998291655800276 $-1.1997349889868629 $4.299564154566891 $2.1265437489153243 $3.2664533864559933 $-1.139909637540669 $0 $-3.3132123580000203 $3.3132123580000203
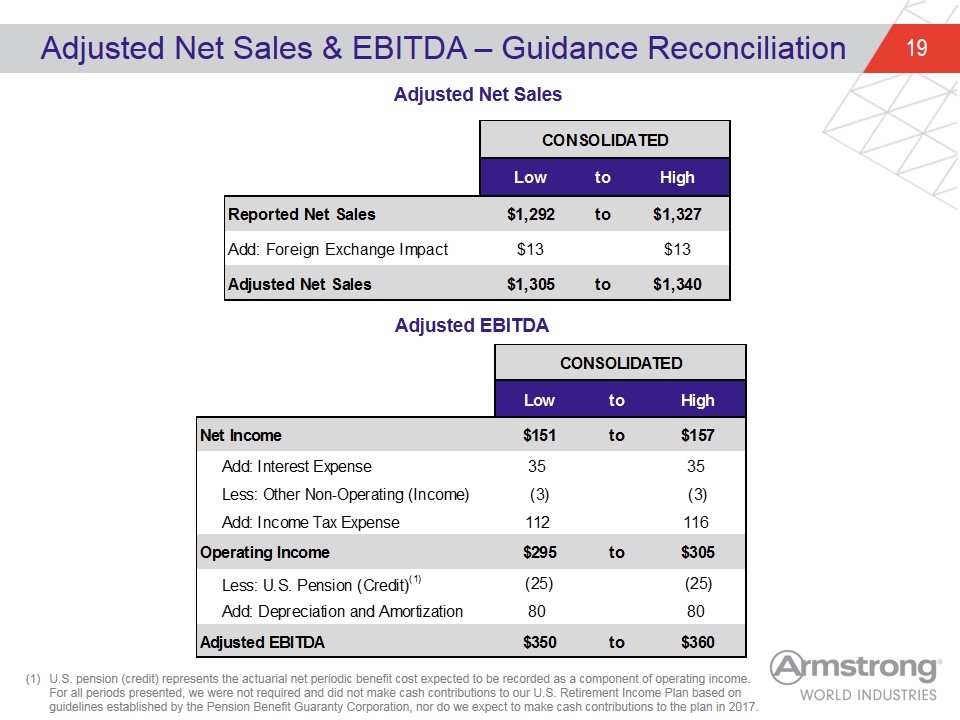
Adjusted Net Sales & EBITDA – Guidance Reconciliation U.S. pension (credit) represents the actuarial net periodic benefit cost expected to be recorded as a component of operating income. For all periods presented, we were not required and did not make cash contributions to our U.S. Retirement Income Plan based on guidelines established by the Pension Benefit Guaranty Corporation, nor do we expect to make cash contributions to the plan in 2017. Adjusted Net Sales Adjusted EBITDA CONSOLIDATED Low to High Reported Net Sales $1,292 to $1,327 Add: Foreign Exchange Impact $13 $13 Adjusted Net Sales $1,305 to $1,340 CONSOLIDATED Low to High Net Income $151 to $157 Add: Interest Expense 35 35 Less: Other Non-Operating (Income) -3 -3 Add: Income Tax Expense 112 116 Operating Income $295 to $305 Less: U.S. Pension (Credit)(1) -25 -25 Add: Depreciation and Amortization 80 80 Adjusted EBITDA $350 to $360
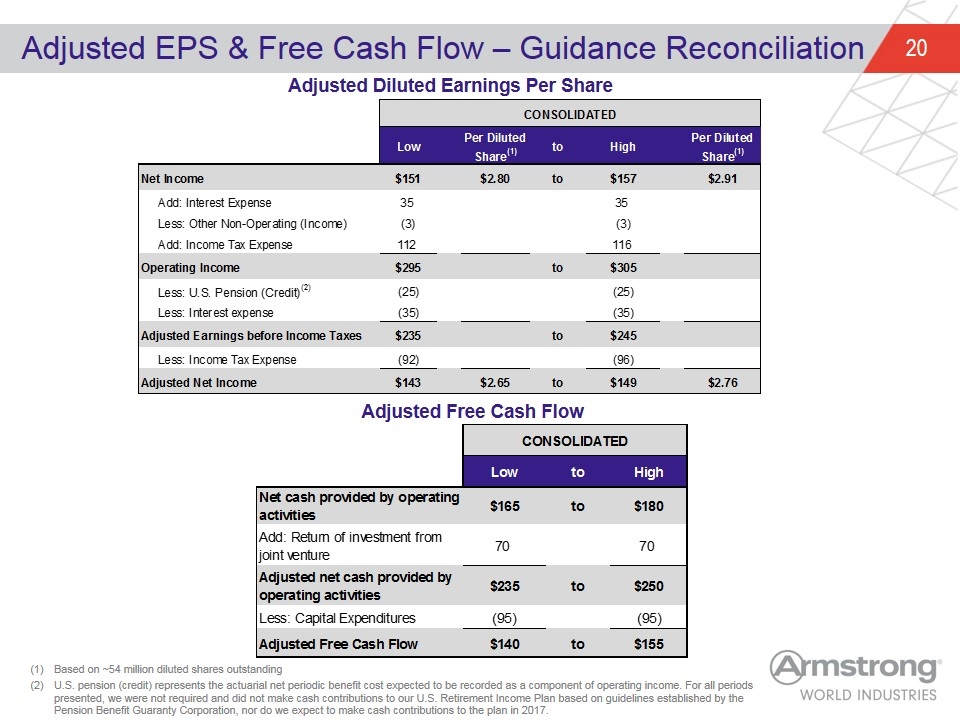
Adjusted EPS & Free Cash Flow – Guidance Reconciliation Based on ~54 million diluted shares outstanding U.S. pension (credit) represents the actuarial net periodic benefit cost expected to be recorded as a component of operating income. For all periods presented, we were not required and did not make cash contributions to our U.S. Retirement Income Plan based on guidelines established by the Pension Benefit Guaranty Corporation, nor do we expect to make cash contributions to the plan in 2017. Adjusted Diluted Earnings Per Share Adjusted Free Cash Flow CONSOLIDATED Low Per DilutedShare(1) to High Per DilutedShare(1) Net Income $151 $2.8 to $157 $2.91 Add: Interest Expense 35 35 Less: Other Non-Operating (Income) -3 -3 Add: Income Tax Expense 112 116 Operating Income $295 to $305 Less: U.S. Pension (Credit)(2) -25 -25 Less: Interest expense -35 -35 Adjusted Earnings before Income Taxes $235 to $245 Less: Income Tax Expense -92 -96 Adjusted Net Income $143 $2.65 to $149 $2.76 CONSOLIDATED Low to High Net cash provided by operating activities $165 to $180 Add: Return of investment from joint venture 70 70 Adjusted net cash provided by operating activities $235 to $250 Less: Capital Expenditures -95 -95 Adjusted Free Cash Flow $140 to $155
