Attached files
| file | filename |
|---|---|
| 8-K - 8-K - BYLINE BANCORP, INC. | d421366d8k.htm |

Q2 2017 Earnings Call Exhibit 99.1
Forward Looking Statements This communication contains forward-looking statements within the meaning of the U.S. federal securities laws. Forward-looking statements include, without limitation, statements concerning plans, estimates, calculations, forecasts and projections with respect to the anticipated future performance of the Company. These statements are often, but not always, made through the use of words or phrases such as ‘‘may’’, ‘‘might’’, ‘‘should’’, ‘‘could’’, ‘‘predict’’, ‘‘potential’’, ‘‘believe’’, ‘‘expect’’, ‘‘continue’’, ‘‘will’’, ‘‘anticipate’’, ‘‘seek’’, ‘‘estimate’’, ‘‘intend’’, ‘‘plan’’, ‘‘projection’’, ‘‘would’’, ‘‘annualized’’, “target” and ‘‘outlook’’, or the negative version of those words or other comparable words or phrases of a future or forward-looking nature. Forward-looking statements reflect various assumptions and involve elements of subjective judgment and analysis, which may or may not prove to be correct, and which are subject to uncertainties and contingencies outside the control of Byline and its respective affiliates, directors, employees and other representatives, which could cause actual results to differ materially from those presented in this communication. No representations, warranties or guarantees are or will be made by Byline as to the reliability, accuracy or completeness of any forward-looking statements contained in this communication or that such forward-looking statements are or will remain based on reasonable assumptions. You should not place undue reliance on any forward-looking statements contained in this communication. Forward-looking statements speak only as of the date they are made, and we assume no obligation to update any of these statements in light of new information, future events or otherwise unless required under the federal securities laws.
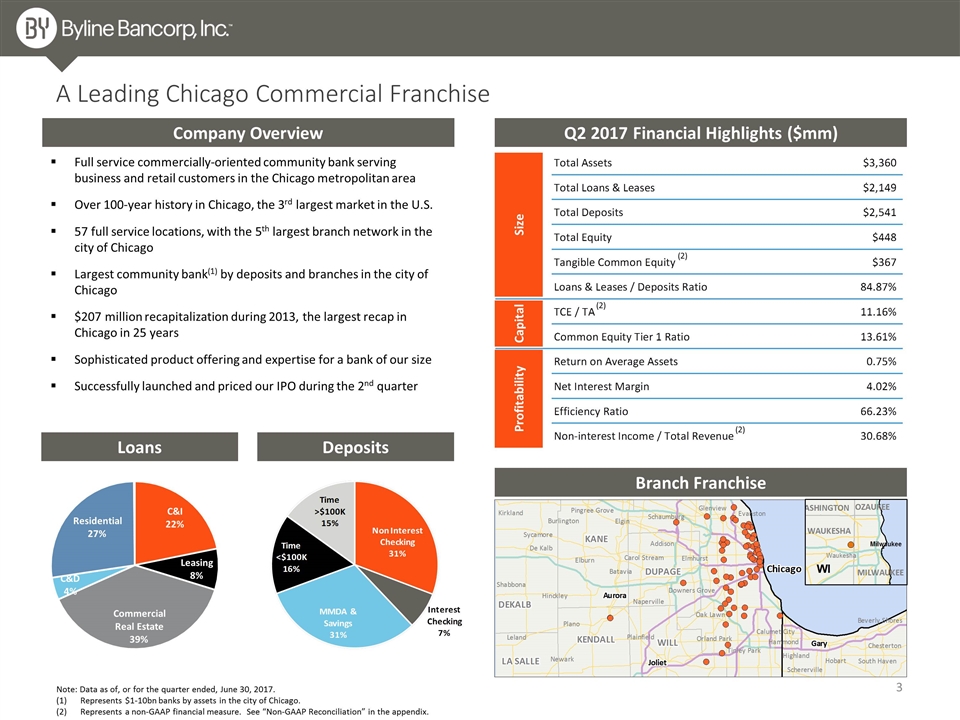
A Leading Chicago Commercial Franchise Company Overview Full service commercially-oriented community bank serving business and retail customers in the Chicago metropolitan area Over 100-year history in Chicago, the 3rd largest market in the U.S. 57 full service locations, with the 5th largest branch network in the city of Chicago Largest community bank(1) by deposits and branches in the city of Chicago $207 million recapitalization during 2013, the largest recap in Chicago in 25 years Sophisticated product offering and expertise for a bank of our size Successfully launched and priced our IPO during the 2nd quarter Note: Data as of, or for the quarter ended, June 30, 2017. Represents $1-10bn banks by assets in the city of Chicago. Represents a non-GAAP financial measure. See “Non-GAAP Reconciliation” in the appendix. Branch Franchise Loans Deposits Q2 2017 Financial Highlights ($mm) Size Capital Profitability (2) (2) (2) C&I 22% Leasing 8% Commercial Real Estate 39% C&D 4% Residential 27%
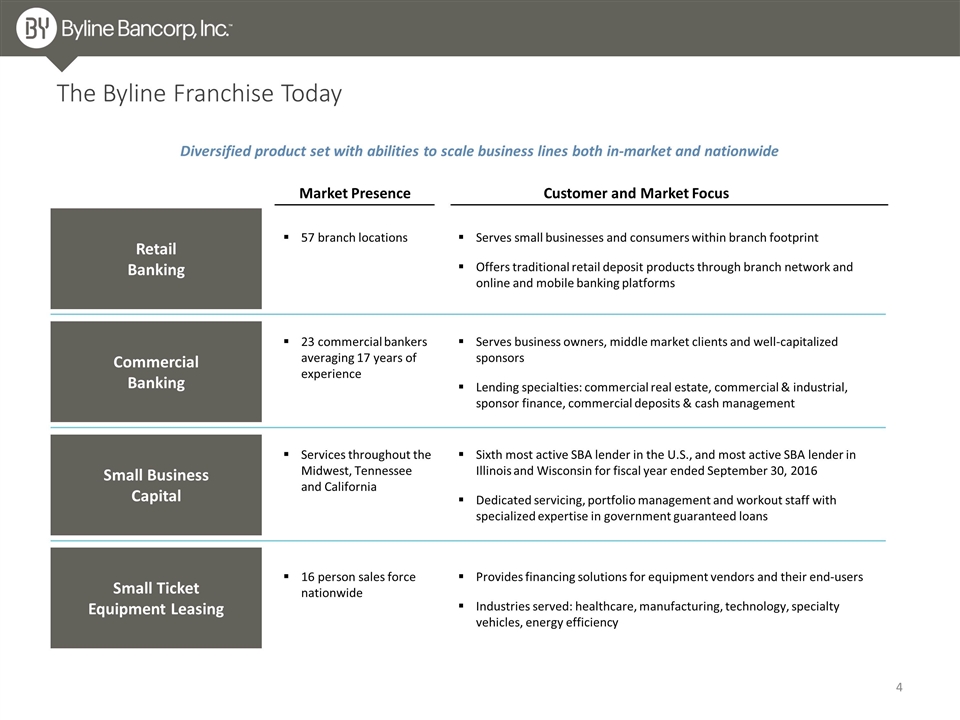
The Byline Franchise Today Retail Banking Commercial Banking Small Business Capital Small Ticket Equipment Leasing Diversified product set with abilities to scale business lines both in-market and nationwide Market Presence Customer and Market Focus 57 branch locations Serves small businesses and consumers within branch footprint Offers traditional retail deposit products through branch network and online and mobile banking platforms 23 commercial bankers averaging 17 years of experience Serves business owners, middle market clients and well-capitalized sponsors Lending specialties: commercial real estate, commercial & industrial, sponsor finance, commercial deposits & cash management Services throughout the Midwest, Tennessee and California Sixth most active SBA lender in the U.S., and most active SBA lender in Illinois and Wisconsin for fiscal year ended September 30, 2016 Dedicated servicing, portfolio management and workout staff with specialized expertise in government guaranteed loans 16 person sales force nationwide Provides financing solutions for equipment vendors and their end-users Industries served: healthcare, manufacturing, technology, specialty vehicles, energy efficiency
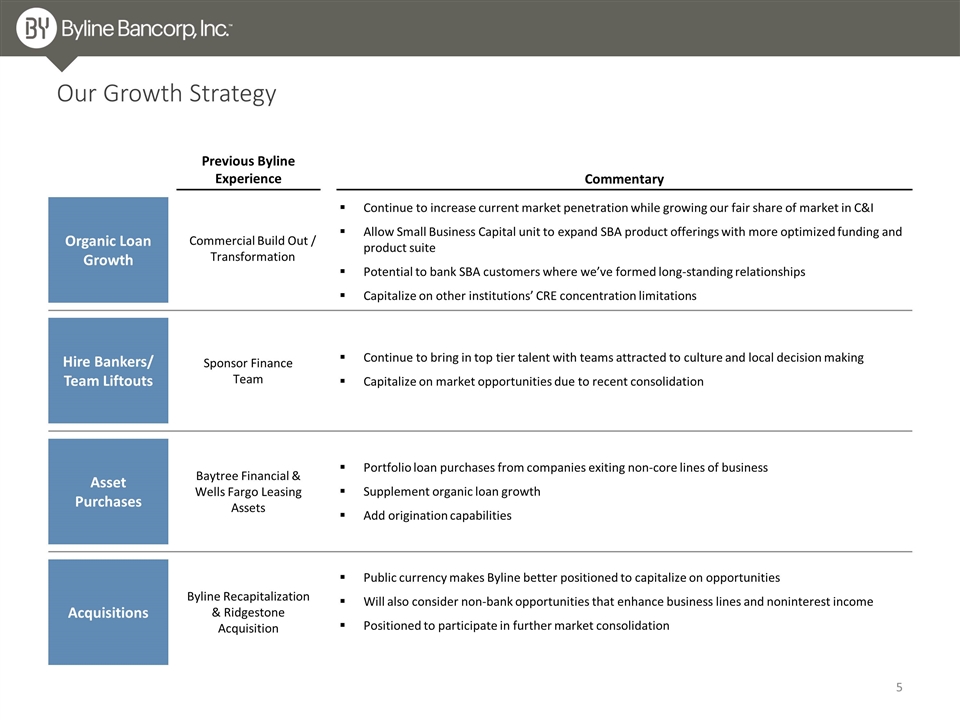
Hire Bankers/ Team Liftouts Asset Purchases Acquisitions Continue to bring in top tier talent with teams attracted to culture and local decision making Capitalize on market opportunities due to recent consolidation Portfolio loan purchases from companies exiting non-core lines of business Supplement organic loan growth Add origination capabilities Previous Byline Experience Commentary Sponsor Finance Team Public currency makes Byline better positioned to capitalize on opportunities Will also consider non-bank opportunities that enhance business lines and noninterest income Positioned to participate in further market consolidation Baytree Financial & Wells Fargo Leasing Assets Byline Recapitalization & Ridgestone Acquisition Organic Loan Growth Continue to increase current market penetration while growing our fair share of market in C&I Allow Small Business Capital unit to expand SBA product offerings with more optimized funding and product suite Potential to bank SBA customers where we’ve formed long-standing relationships Capitalize on other institutions’ CRE concentration limitations Commercial Build Out / Transformation Our Growth Strategy
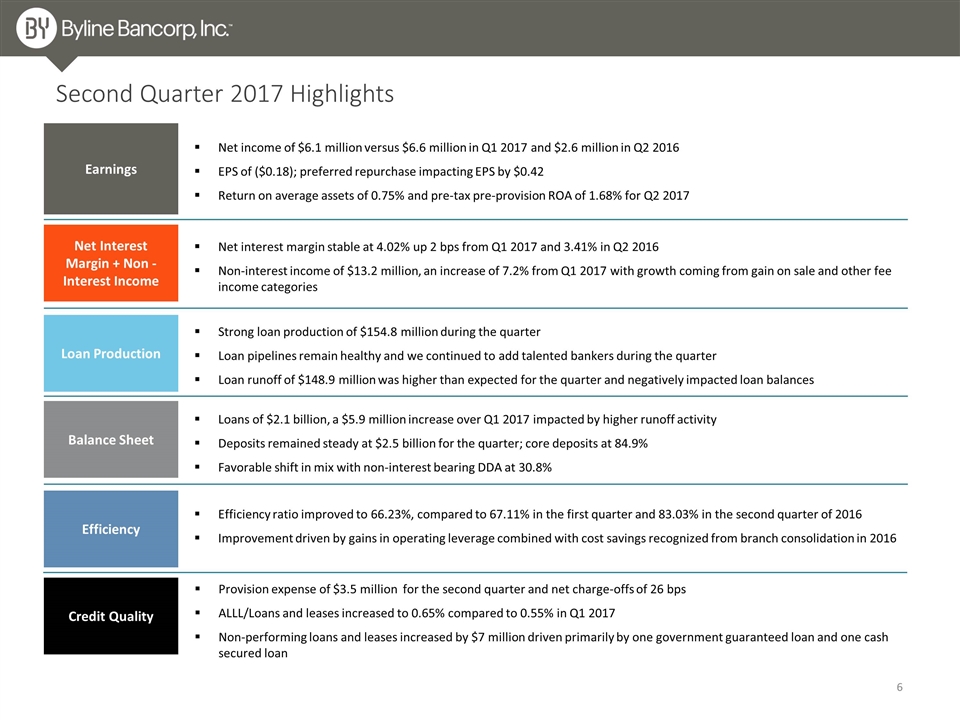
Second Quarter 2017 Highlights Earnings Net Interest Margin + Non -Interest Income Loan Production Balance Sheet Efficiency Net income of $6.1 million versus $6.6 million in Q1 2017 and $2.6 million in Q2 2016 EPS of ($0.18); preferred repurchase impacting EPS by $0.42 Return on average assets of 0.75% and pre-tax pre-provision ROA of 1.68% for Q2 2017 Net interest margin stable at 4.02% up 2 bps from Q1 2017 and 3.41% in Q2 2016 Non-interest income of $13.2 million, an increase of 7.2% from Q1 2017 with growth coming from gain on sale and other fee income categories Loans of $2.1 billion, a $5.9 million increase over Q1 2017 impacted by higher runoff activity Deposits remained steady at $2.5 billion for the quarter; core deposits at 84.9% Favorable shift in mix with non-interest bearing DDA at 30.8% Efficiency ratio improved to 66.23%, compared to 67.11% in the first quarter and 83.03% in the second quarter of 2016 Improvement driven by gains in operating leverage combined with cost savings recognized from branch consolidation in 2016 Credit Quality Strong loan production of $154.8 million during the quarter Loan pipelines remain healthy and we continued to add talented bankers during the quarter Loan runoff of $148.9 million was higher than expected for the quarter and negatively impacted loan balances Provision expense of $3.5 million for the second quarter and net charge-offs of 26 bps ALLL/Loans and leases increased to 0.65% compared to 0.55% in Q1 2017 Non-performing loans and leases increased by $7 million driven primarily by one government guaranteed loan and one cash secured loan
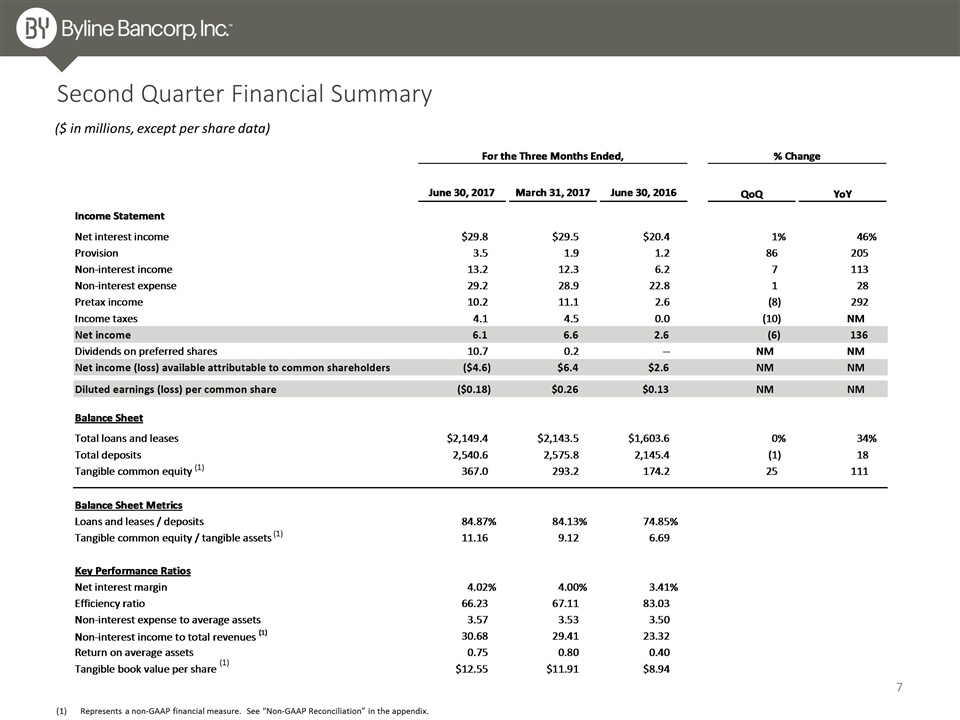
Second Quarter Financial Summary ($ in millions, except per share data) Represents a non-GAAP financial measure. See “Non-GAAP Reconciliation” in the appendix. (1) (1) (1)
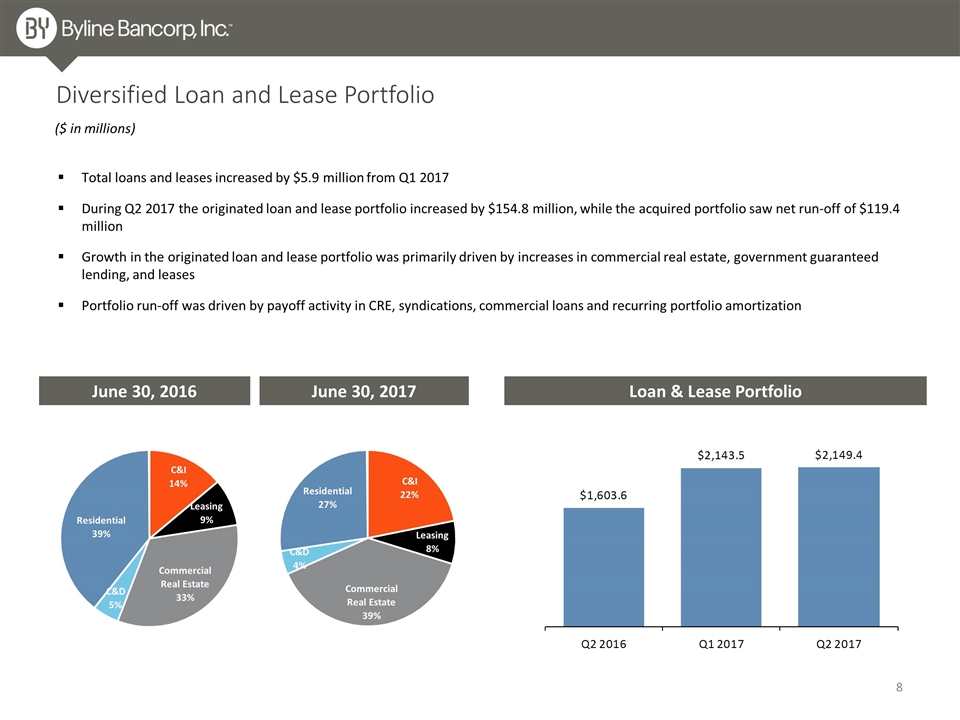
Diversified Loan and Lease Portfolio Loan & Lease Portfolio June 30, 2016 June 30, 2017 Total loans and leases increased by $5.9 million from Q1 2017 During Q2 2017 the originated loan and lease portfolio increased by $154.8 million, while the acquired portfolio saw net run-off of $119.4 million Growth in the originated loan and lease portfolio was primarily driven by increases in commercial real estate, government guaranteed lending, and leases Portfolio run-off was driven by payoff activity in CRE, syndications, commercial loans and recurring portfolio amortization ($ in millions) C&I 14% Leasing 9% Commercial Real Estate 33% C&D 5% Residential 39% C&I 22% Leasing 8% Commercial Real Estate 39% C&D 4% Residential 27%
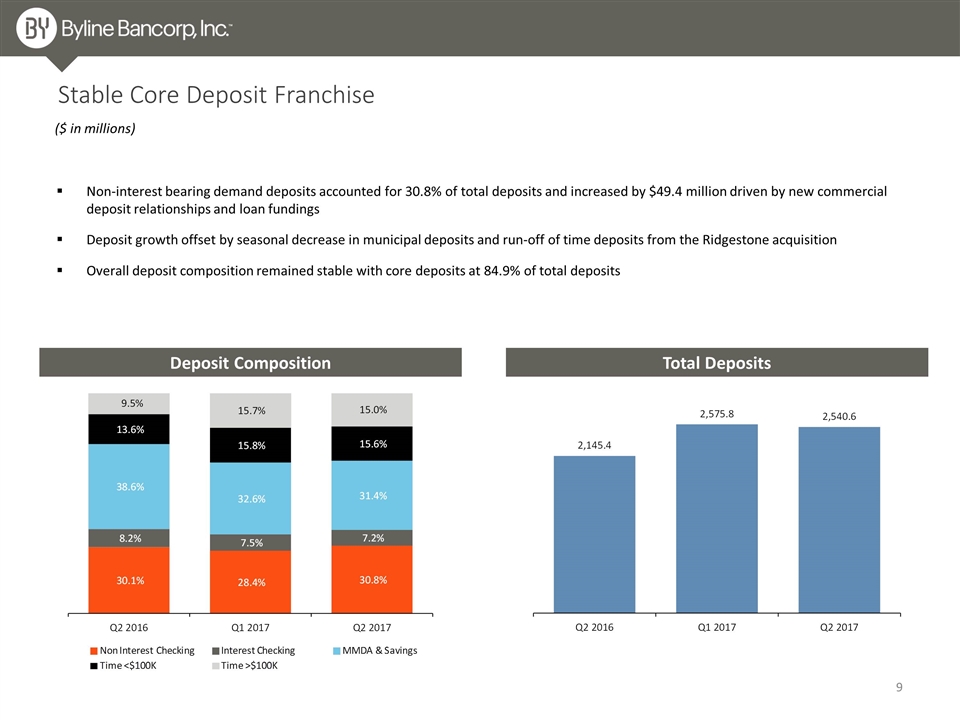
Non-interest bearing demand deposits accounted for 30.8% of total deposits and increased by $49.4 million driven by new commercial deposit relationships and loan fundings Deposit growth offset by seasonal decrease in municipal deposits and run-off of time deposits from the Ridgestone acquisition Overall deposit composition remained stable with core deposits at 84.9% of total deposits Stable Core Deposit Franchise Total Deposits ($ in millions) Deposit Composition
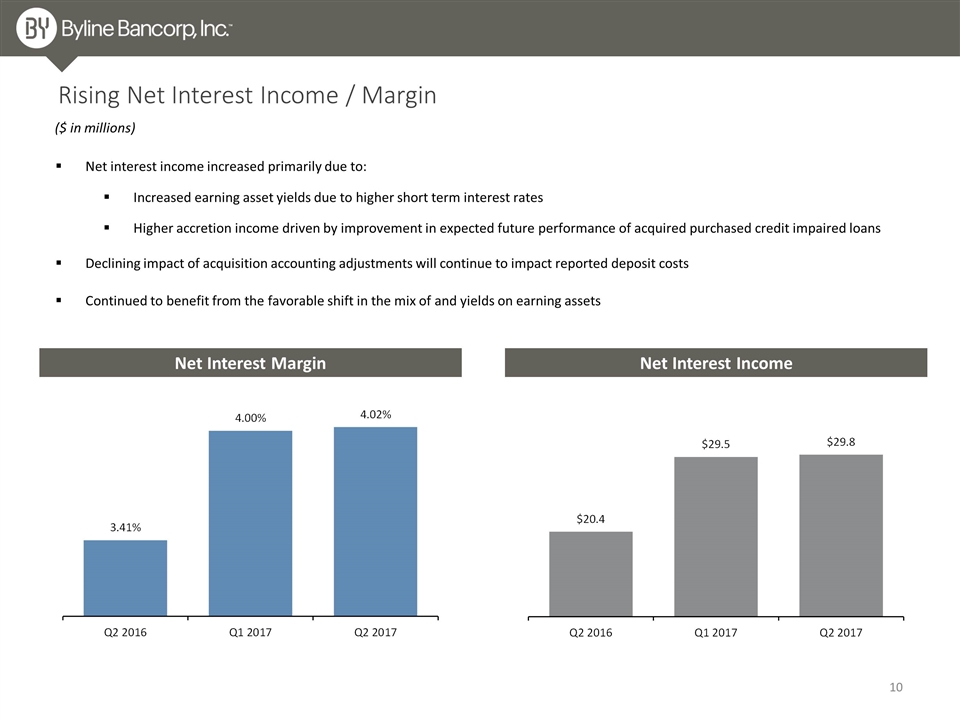
Net Interest Margin Net Interest Income Rising Net Interest Income / Margin Net interest income increased primarily due to: Increased earning asset yields due to higher short term interest rates Higher accretion income driven by improvement in expected future performance of acquired purchased credit impaired loans Declining impact of acquisition accounting adjustments will continue to impact reported deposit costs Continued to benefit from the favorable shift in the mix of and yields on earning assets ($ in millions)
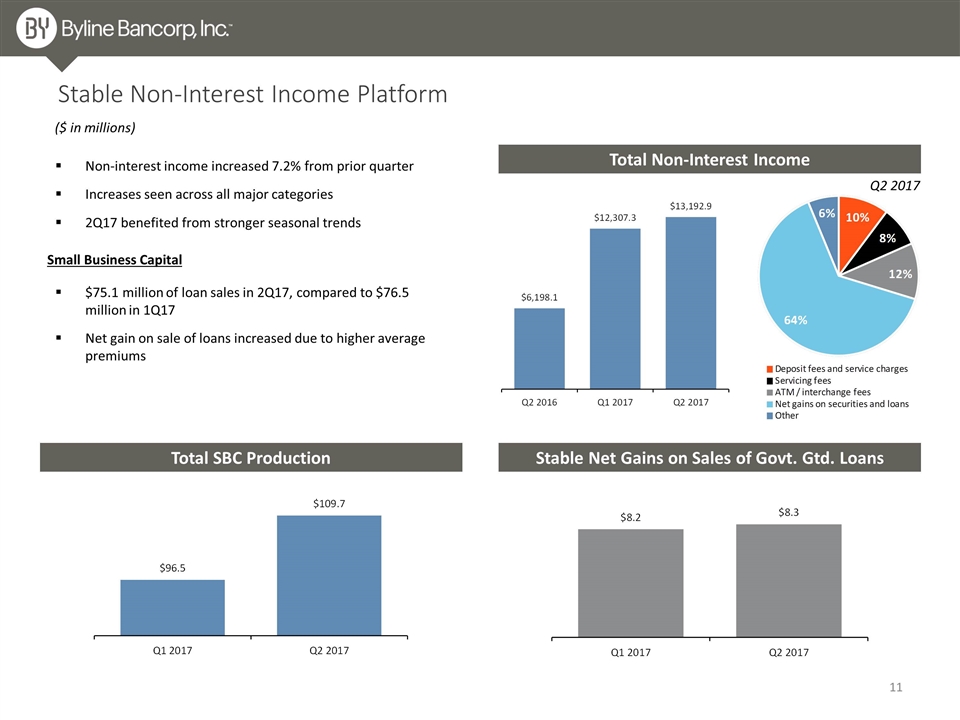
Total Non-Interest Income Stable Non-Interest Income Platform Non-interest income increased 7.2% from prior quarter Increases seen across all major categories 2Q17 benefited from stronger seasonal trends ($ in millions) Total SBC Production Stable Net Gains on Sales of Govt. Gtd. Loans $75.1 million of loan sales in 2Q17, compared to $76.5 million in 1Q17 Net gain on sale of loans increased due to higher average premiums Small Business Capital Q2 2017
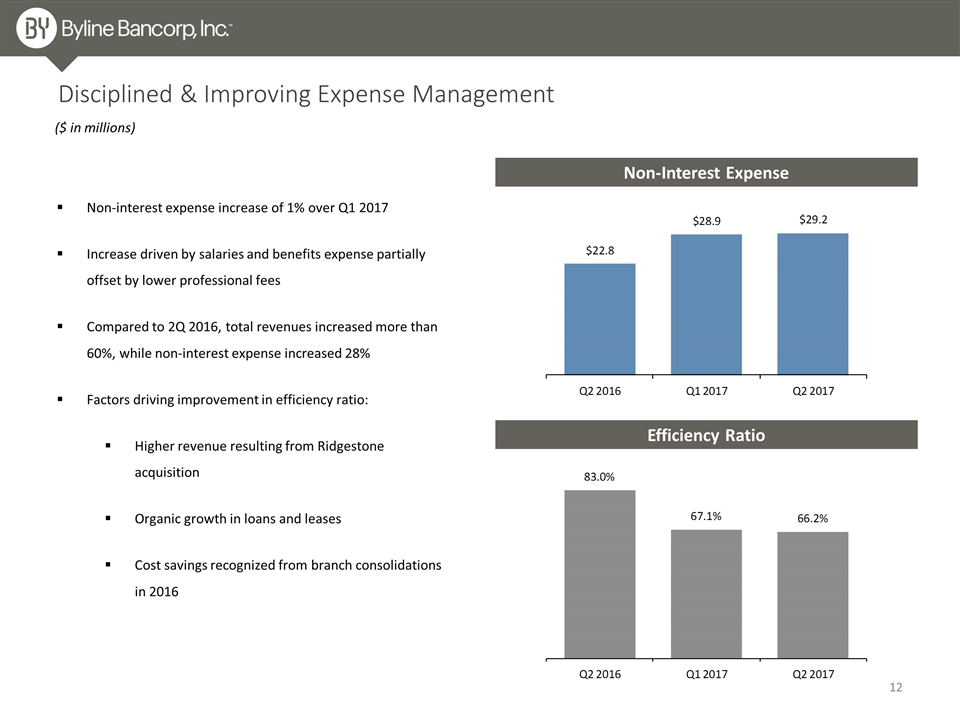
Disciplined & Improving Expense Management Non-interest expense increase of 1% over Q1 2017 Increase driven by salaries and benefits expense partially offset by lower professional fees Compared to 2Q 2016, total revenues increased more than 60%, while non-interest expense increased 28% Factors driving improvement in efficiency ratio: Higher revenue resulting from Ridgestone acquisition Organic growth in loans and leases Cost savings recognized from branch consolidations in 2016 ($ in millions) Efficiency Ratio Non-Interest Expense
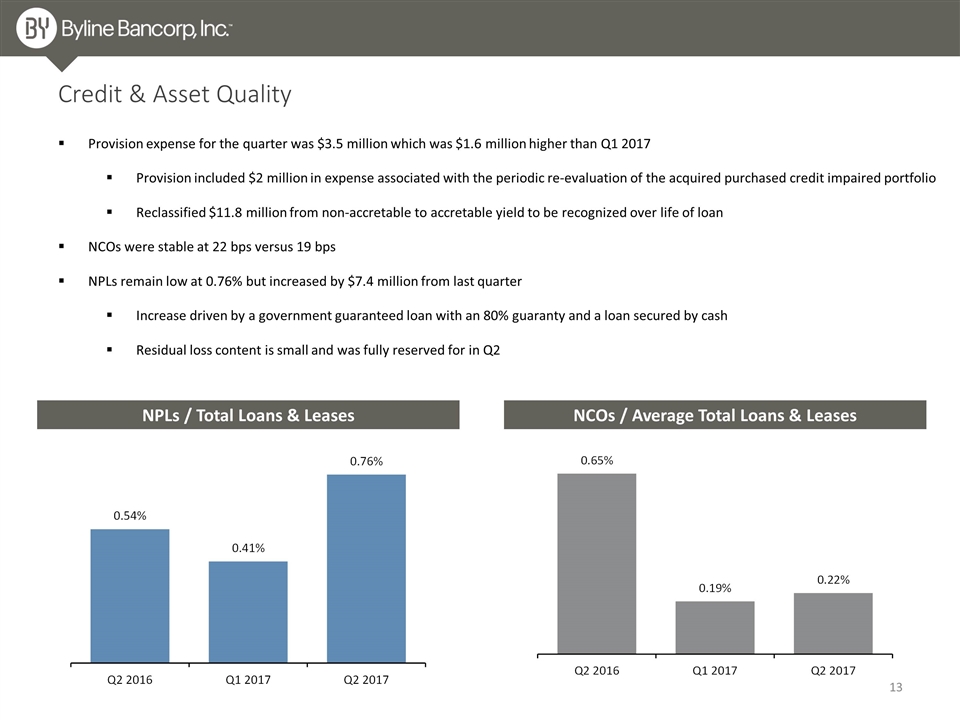
Credit & Asset Quality Provision expense for the quarter was $3.5 million which was $1.6 million higher than Q1 2017 Provision included $2 million in expense associated with the periodic re-evaluation of the acquired purchased credit impaired portfolio Reclassified $11.8 million from non-accretable to accretable yield to be recognized over life of loan NCOs were stable at 22 bps versus 19 bps NPLs remain low at 0.76% but increased by $7.4 million from last quarter Increase driven by a government guaranteed loan with an 80% guaranty and a loan secured by cash Residual loss content is small and was fully reserved for in Q2 NPLs / Total Loans & Leases NCOs / Average Total Loans & Leases
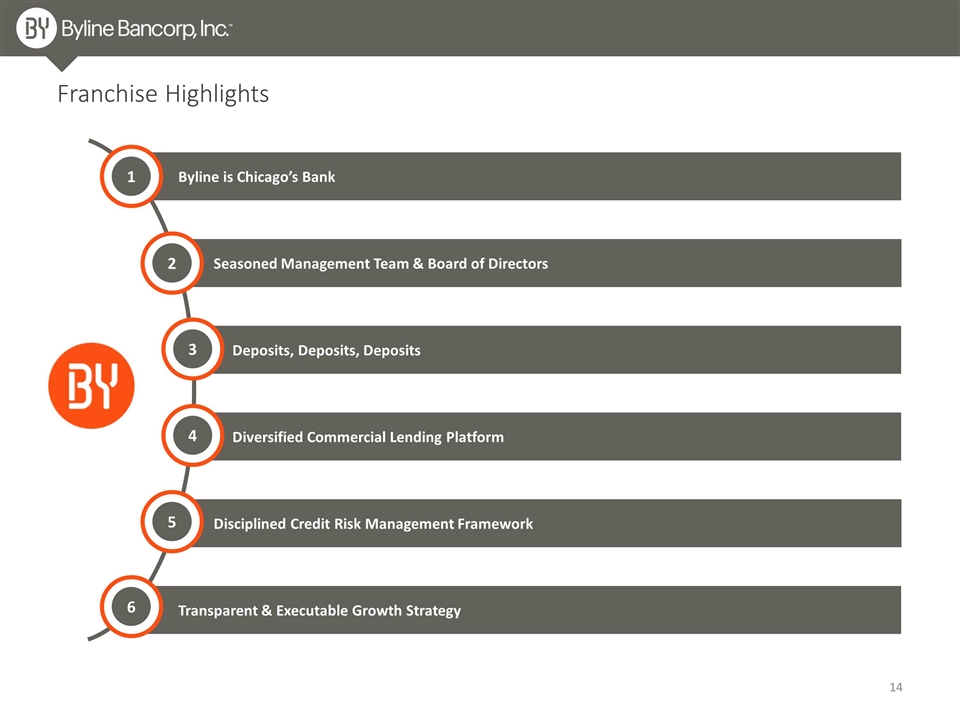
Transparent & Executable Growth Strategy Byline is Chicago’s Bank Seasoned Management Team & Board of Directors Diversified Commercial Lending Platform Disciplined Credit Risk Management Framework Deposits, Deposits, Deposits Franchise Highlights 1 2 3 4 5 6
Appendix
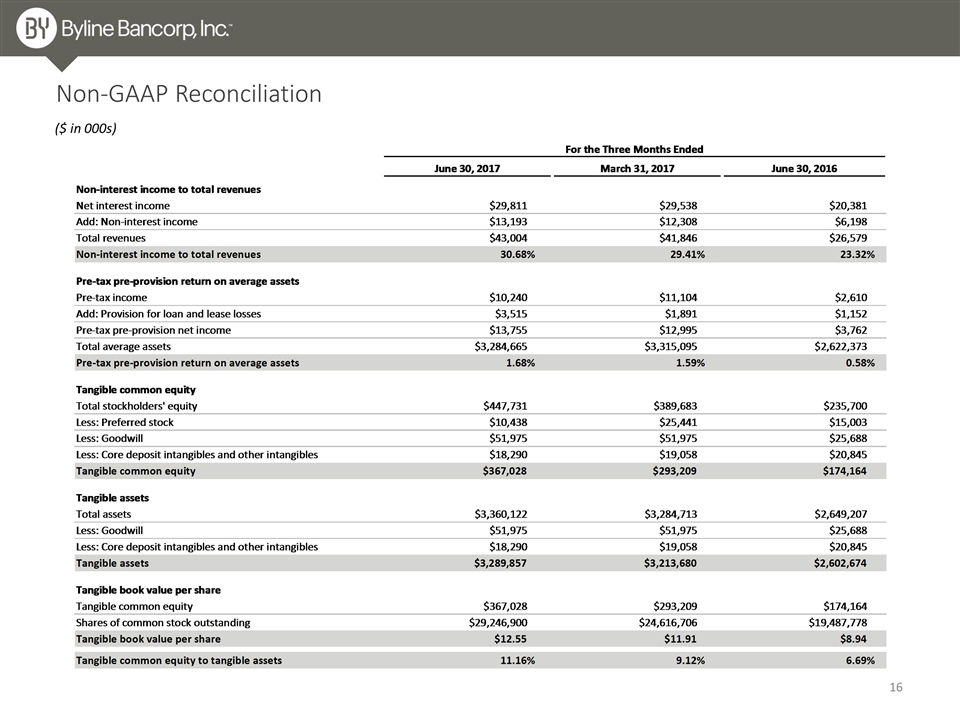
Non-GAAP Reconciliation ($ in 000s)
