Attached files
| file | filename |
|---|---|
| EX-99.2 - EXHIBIT 99.2 - INDEPENDENT BANK CORP /MI/ | ex99_2.htm |
| EX-99.1 - EXHIBIT 99.1 - INDEPENDENT BANK CORP /MI/ | ex99_1.htm |
| 8-K - 8-K - INDEPENDENT BANK CORP /MI/ | form8k.htm |
Exhibit 99.3

2 Cautionary Note Regarding Forward-Looking Statements This presentation contains forward-looking statements within the meaning of the Private Securities Litigation Reform Act of 1995, including statements of goals, intentions, and expectations as to future trends, plans, events, or results of Independent Bank Corporation’s operations and policies, including, but not limited to, Independent Bank Corporation’s outlook on earnings and the sufficiency of the allowance for loan losses, and statements regarding asset quality, projections of future revenue, earnings or other measures of economic performance, Independent Bank Corporation’s plans and expectations regarding non-performing assets, business opportunities, and general economic conditions. Forward-looking statements include expressions such as “will,” “may,” “should,” “believe,” “expect,” “forecast,” “anticipate,” “estimate,” “project,” “intend,” “likely,” “optimistic” and “plan,” and similar words or phrases, which are necessarily statements of belief as to expected outcomes of future events. These statements are based on current and anticipated economic conditions, nationally and in Independent Bank Corporation’s markets, interest rates and interest rate policy, competitive factors, and other conditions which by their nature are not susceptible to accurate forecast and are subject to significant uncertainty. Because of these uncertainties and the assumptions on which this presentation and the forward-looking statements are based, actual future operations and results may differ materially from those indicated in this presentation. For a discussion of certain factors, risks and uncertainties which could cause actual future operations and results to differ from estimates and projections discussed in these forward-looking statements, please read the “Risk Factors” section in Independent Bank Corporation’s 2016 Annual Report on Form 10-K. You should not place undue reliance on any such forward-looking statement. These forward-looking statements are not guarantees of future performance. Independent Bank Corporation does not undertake to publicly revise or update forward-looking statements in this presentation to reflect events or circumstances that arise after the date of this presentation.

3 Agenda Formal Remarks.William B. (Brad) Kessel, President and Chief Executive OfficerRobert N. Shuster, Executive Vice President and Chief Financial OfficerQuestion and Answer session.Closing Remarks.Note: This presentation is available at www.IndependentBank.com in the Investor Relations area under the “Presentations” tab.
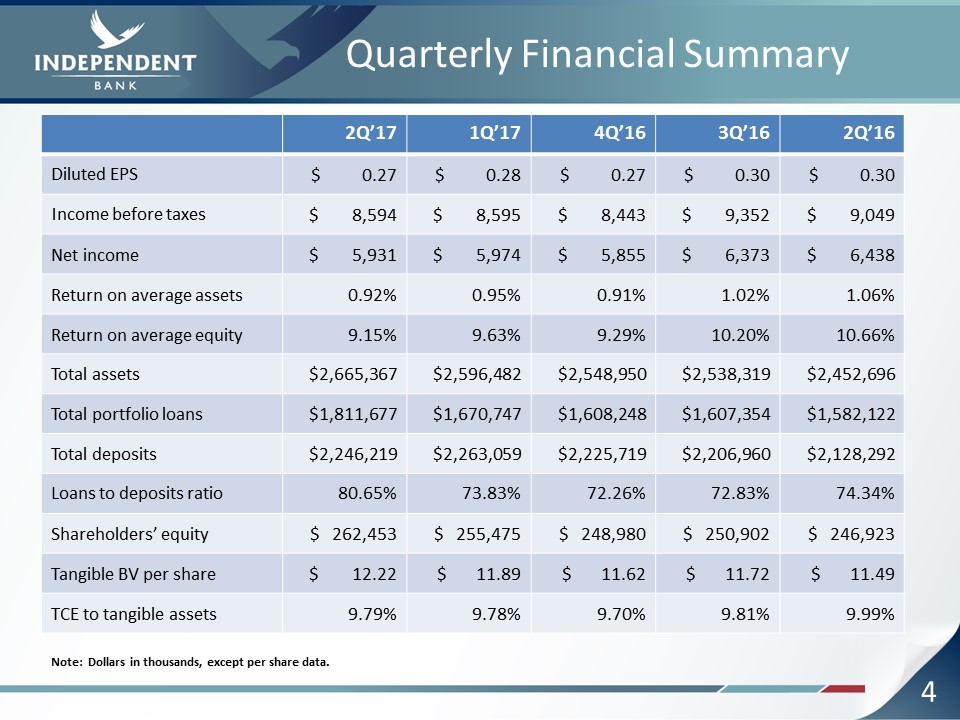
4 Quarterly Financial Summary 2Q’17 1Q’17 4Q’16 3Q’16 2Q’16 Diluted EPS $ 0.27 $ 0.28 $ 0.27 $ 0.30 $ 0.30 Income before taxes $ 8,594 $ 8,595 $ 8,443 $ 9,352 $ 9,049 Net income $ 5,931 $ 5,974 $ 5,855 $ 6,373 $ 6,438 Return on average assets 0.92% 0.95% 0.91% 1.02% 1.06% Return on average equity 9.15% 9.63% 9.29% 10.20% 10.66% Total assets $2,665,367 $2,596,482 $2,548,950 $2,538,319 $2,452,696 Total portfolio loans $1,811,677 $1,670,747 $1,608,248 $1,607,354 $1,582,122 Total deposits $2,246,219 $2,263,059 $2,225,719 $2,206,960 $2,128,292 Loans to deposits ratio 80.65% 73.83% 72.26% 72.83% 74.34% Shareholders’ equity $ 262,453 $ 255,475 $ 248,980 $ 250,902 $ 246,923 Tangible BV per share $ 12.22 $ 11.89 $ 11.62 $ 11.72 $ 11.49 TCE to tangible assets 9.79% 9.78% 9.70% 9.81% 9.99% Note: Dollars in thousands, except per share data.
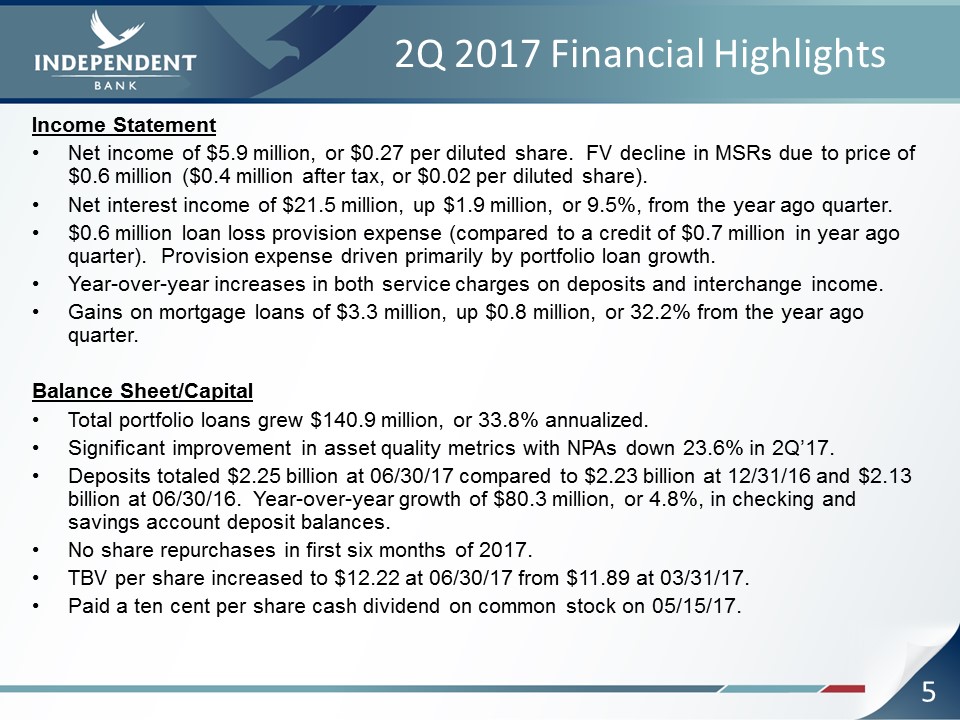
5 2Q 2017 Financial Highlights Income StatementNet income of $5.9 million, or $0.27 per diluted share. FV decline in MSRs due to price of $0.6 million ($0.4 million after tax, or $0.02 per diluted share). Net interest income of $21.5 million, up $1.9 million, or 9.5%, from the year ago quarter.$0.6 million loan loss provision expense (compared to a credit of $0.7 million in year ago quarter). Provision expense driven primarily by portfolio loan growth.Year-over-year increases in both service charges on deposits and interchange income.Gains on mortgage loans of $3.3 million, up $0.8 million, or 32.2% from the year ago quarter.Balance Sheet/CapitalTotal portfolio loans grew $140.9 million, or 33.8% annualized. Significant improvement in asset quality metrics with NPAs down 23.6% in 2Q’17.Deposits totaled $2.25 billion at 06/30/17 compared to $2.23 billion at 12/31/16 and $2.13 billion at 06/30/16. Year-over-year growth of $80.3 million, or 4.8%, in checking and savings account deposit balances.No share repurchases in first six months of 2017. TBV per share increased to $12.22 at 06/30/17 from $11.89 at 03/31/17.Paid a ten cent per share cash dividend on common stock on 05/15/17.
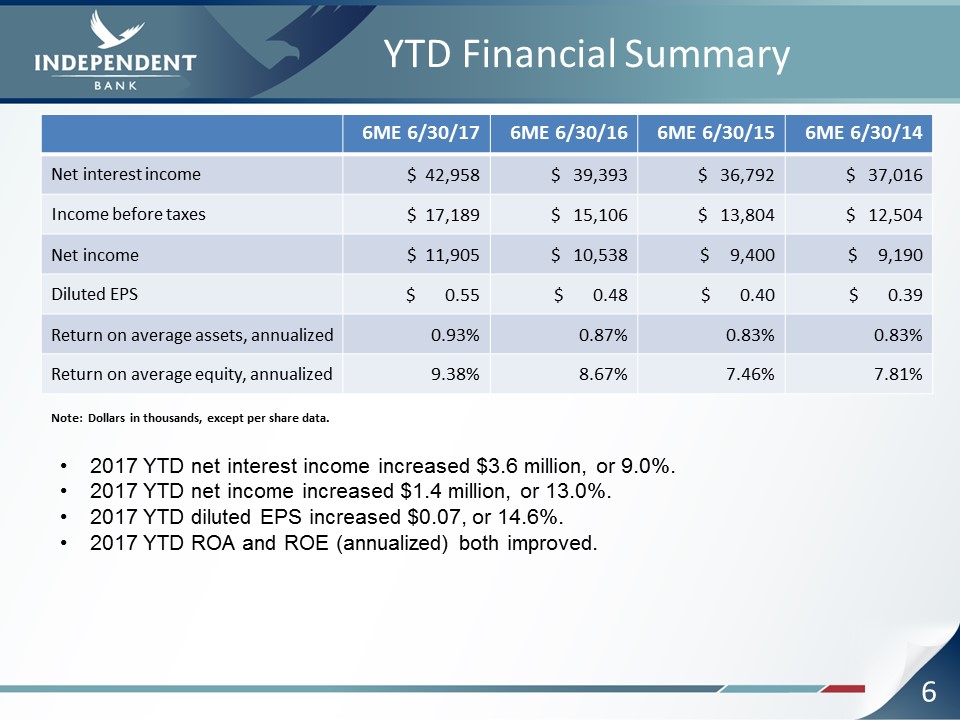
6 YTD Financial Summary 6ME 6/30/17 6ME 6/30/16 6ME 6/30/15 6ME 6/30/14 Net interest income $ 42,958 $ 39,393 $ 36,792 $ 37,016 Income before taxes $ 17,189 $ 15,106 $ 13,804 $ 12,504 Net income $ 11,905 $ 10,538 $ 9,400 $ 9,190 Diluted EPS $ 0.55 $ 0.48 $ 0.40 $ 0.39 Return on average assets, annualized 0.93% 0.87% 0.83% 0.83% Return on average equity, annualized 9.38% 8.67% 7.46% 7.81% Note: Dollars in thousands, except per share data. 2017 YTD net interest income increased $3.6 million, or 9.0%.2017 YTD net income increased $1.4 million, or 13.0%.2017 YTD diluted EPS increased $0.07, or 14.6%.2017 YTD ROA and ROE (annualized) both improved.
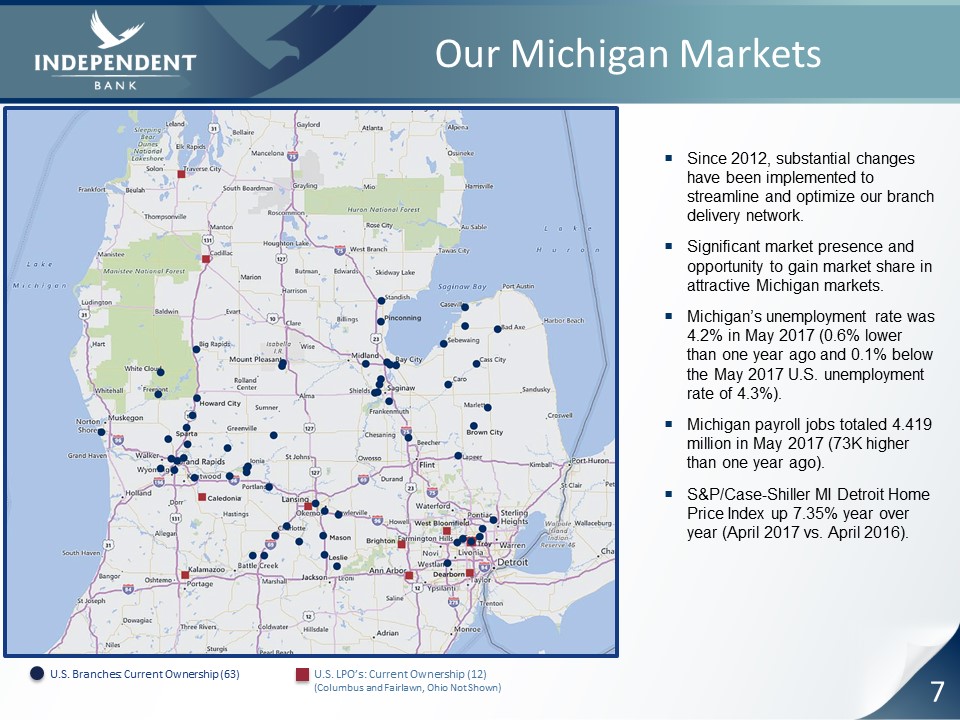
7 Our Michigan Markets U.S. Branches: Current Ownership (63) U.S. LPO’s: Current Ownership (12)(Columbus and Fairlawn, Ohio Not Shown) Since 2012, substantial changes have been implemented to streamline and optimize our branch delivery network.Significant market presence and opportunity to gain market share in attractive Michigan markets. Michigan’s unemployment rate was 4.2% in May 2017 (0.6% lower than one year ago and 0.1% below the May 2017 U.S. unemployment rate of 4.3%).Michigan payroll jobs totaled 4.419 million in May 2017 (73K higher than one year ago).S&P/Case-Shiller MI Detroit Home Price Index up 7.35% year over year (April 2017 vs. April 2016).
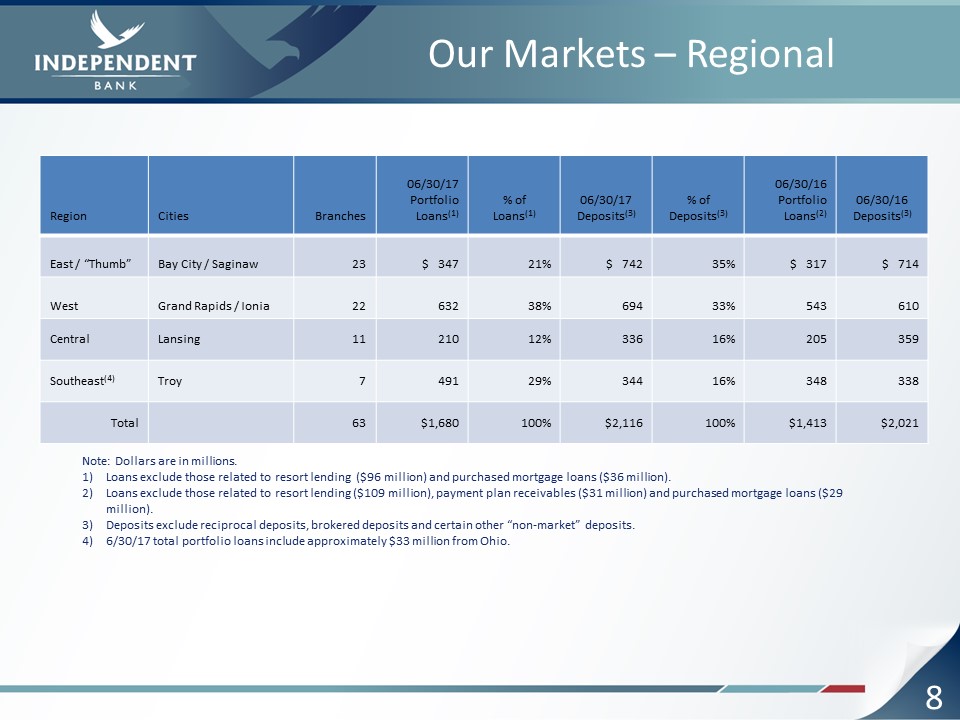
Our Markets – Regional Region Cities Branches 06/30/17Portfolio Loans(1) % ofLoans(1) 06/30/17Deposits(3) % of Deposits(3) 06/30/16 Portfolio Loans(2) 06/30/16 Deposits(3) East / “Thumb” Bay City / Saginaw 23 $ 347 21% $ 742 35% $ 317 $ 714 West Grand Rapids / Ionia 22 632 38% 694 33% 543 610 Central Lansing 11 210 12% 336 16% 205 359 Southeast(4) Troy 7 491 29% 344 16% 348 338 Total 63 $1,680 100% $2,116 100% $1,413 $2,021 Note: Dollars are in millions.Loans exclude those related to resort lending ($96 million) and purchased mortgage loans ($36 million).Loans exclude those related to resort lending ($109 million), payment plan receivables ($31 million) and purchased mortgage loans ($29 million). Deposits exclude reciprocal deposits, brokered deposits and certain other “non-market” deposits.6/30/17 total portfolio loans include approximately $33 million from Ohio. 8
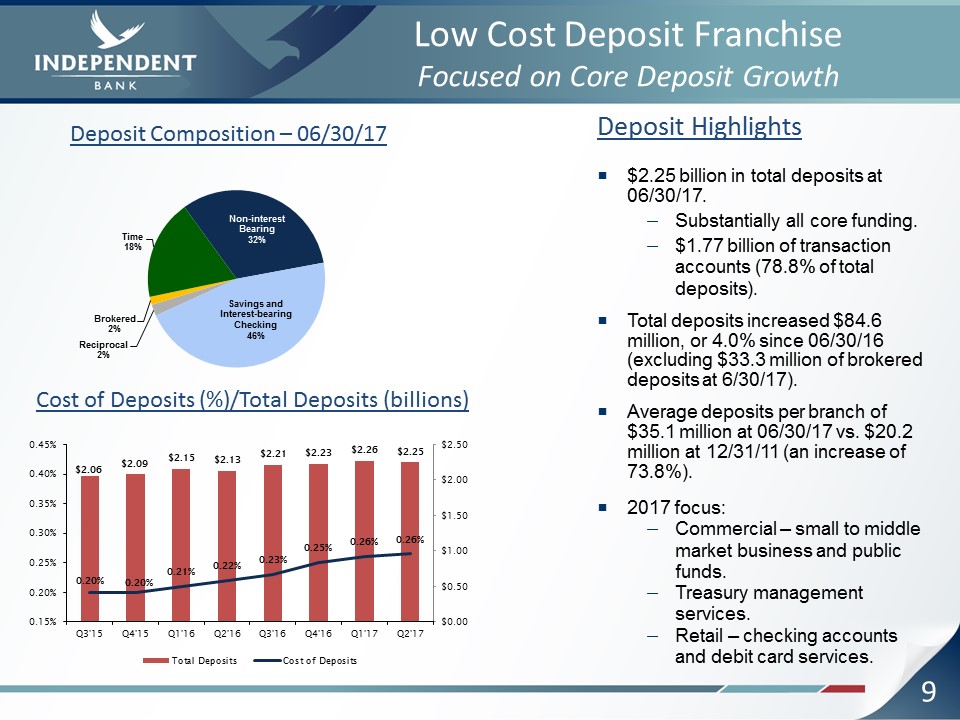
9 Low Cost Deposit Franchise Focused on Core Deposit Growth Deposit Highlights$2.25 billion in total deposits at 06/30/17.Substantially all core funding.$1.77 billion of transaction accounts (78.8% of total deposits).Total deposits increased $84.6 million, or 4.0% since 06/30/16 (excluding $33.3 million of brokered deposits at 6/30/17).Average deposits per branch of $35.1 million at 06/30/17 vs. $20.2 million at 12/31/11 (an increase of 73.8%).2017 focus:Commercial – small to middle market business and public funds.Treasury management services.Retail – checking accounts and debit card services. Deposit Composition – 06/30/17 Cost of Deposits (%)/Total Deposits (billions)
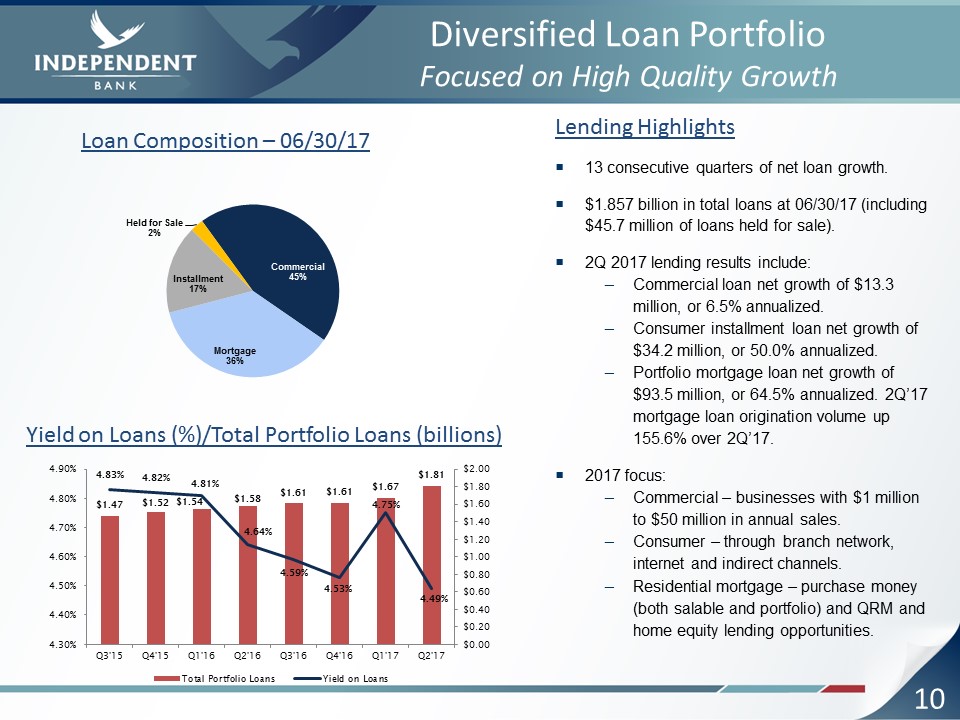
Diversified Loan PortfolioFocused on High Quality Growth Lending Highlights13 consecutive quarters of net loan growth.$1.857 billion in total loans at 06/30/17 (including $45.7 million of loans held for sale).2Q 2017 lending results include:Commercial loan net growth of $13.3 million, or 6.5% annualized.Consumer installment loan net growth of $34.2 million, or 50.0% annualized.Portfolio mortgage loan net growth of $93.5 million, or 64.5% annualized. 2Q’17 mortgage loan origination volume up 155.6% over 2Q’17.2017 focus:Commercial – businesses with $1 million to $50 million in annual sales.Consumer – through branch network, internet and indirect channels.Residential mortgage – purchase money (both salable and portfolio) and QRM and home equity lending opportunities. Loan Composition – 06/30/17 Yield on Loans (%)/Total Portfolio Loans (billions) 10
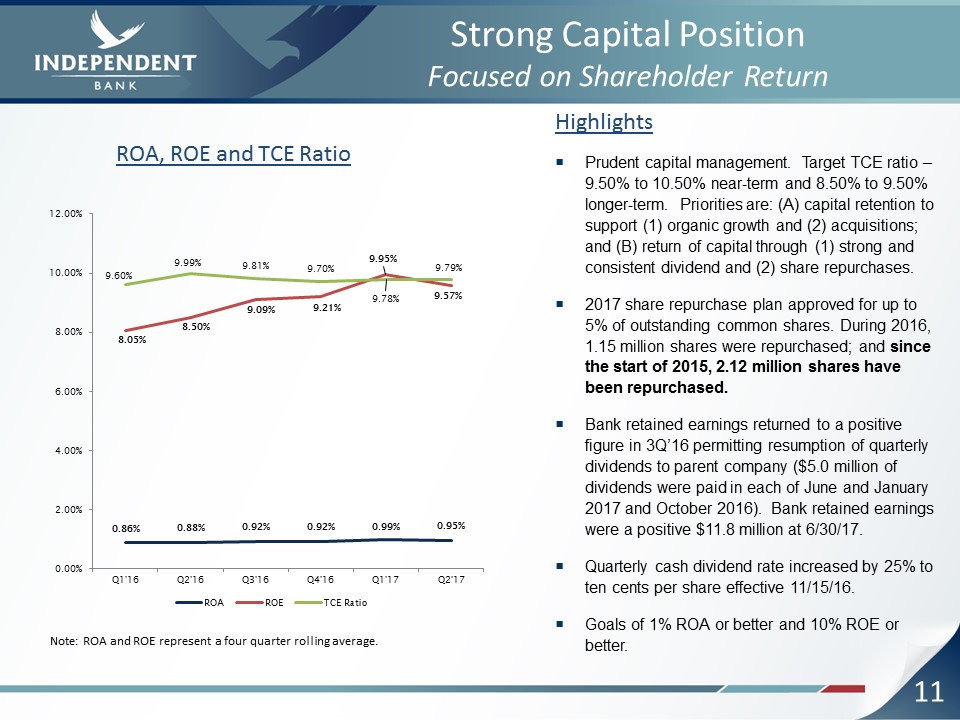
11 Strong Capital PositionFocused on Shareholder Return HighlightsPrudent capital management. Target TCE ratio – 9.50% to 10.50% near-term and 8.50% to 9.50% longer-term. Priorities are: (A) capital retention to support (1) organic growth and (2) acquisitions; and (B) return of capital through (1) strong and consistent dividend and (2) share repurchases.2017 share repurchase plan approved for up to 5% of outstanding common shares. During 2016, 1.15 million shares were repurchased; and since the start of 2015, 2.12 million shares have been repurchased.Bank retained earnings returned to a positive figure in 3Q’16 permitting resumption of quarterly dividends to parent company ($5.0 million of dividends were paid in each of June and January 2017 and October 2016). Bank retained earnings were a positive $11.8 million at 6/30/17.Quarterly cash dividend rate increased by 25% to ten cents per share effective 11/15/16.Goals of 1% ROA or better and 10% ROE or better. Note: ROA and ROE represent a four quarter rolling average. ROA, ROE and TCE Ratio
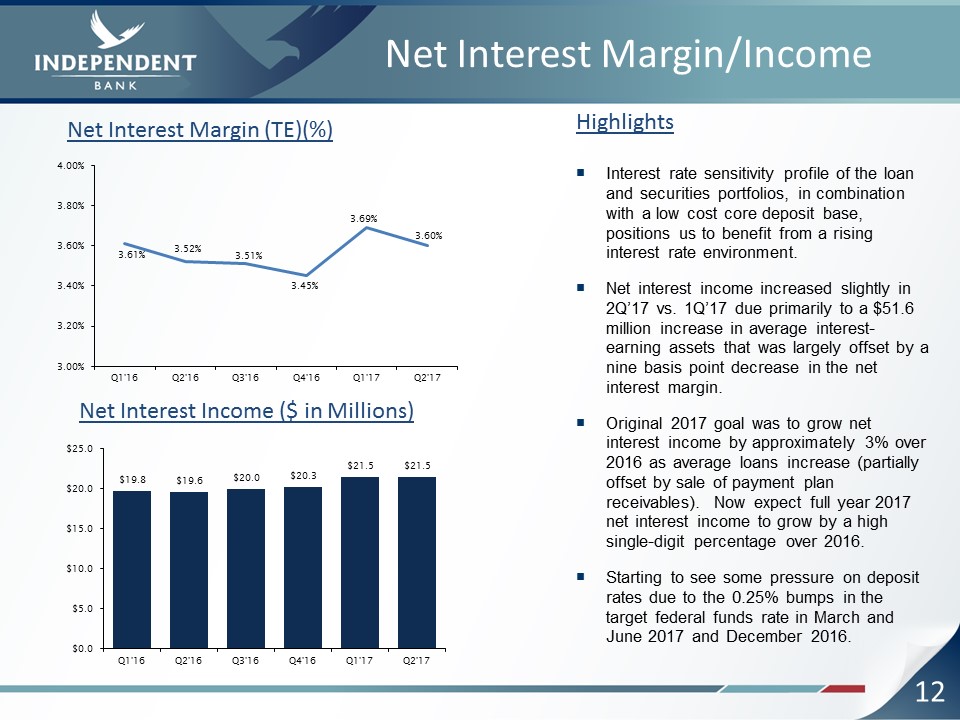
12 Net Interest Margin/Income HighlightsInterest rate sensitivity profile of the loan and securities portfolios, in combination with a low cost core deposit base, positions us to benefit from a rising interest rate environment.Net interest income increased slightly in 2Q’17 vs. 1Q’17 due primarily to a $51.6 million increase in average interest-earning assets that was largely offset by a nine basis point decrease in the net interest margin.Original 2017 goal was to grow net interest income by approximately 3% over 2016 as average loans increase (partially offset by sale of payment plan receivables). Now expect full year 2017 net interest income to grow by a high single-digit percentage over 2016. Starting to see some pressure on deposit rates due to the 0.25% bumps in the target federal funds rate in March and June 2017 and December 2016. Net Interest Margin (TE)(%) Net Interest Income ($ in Millions)
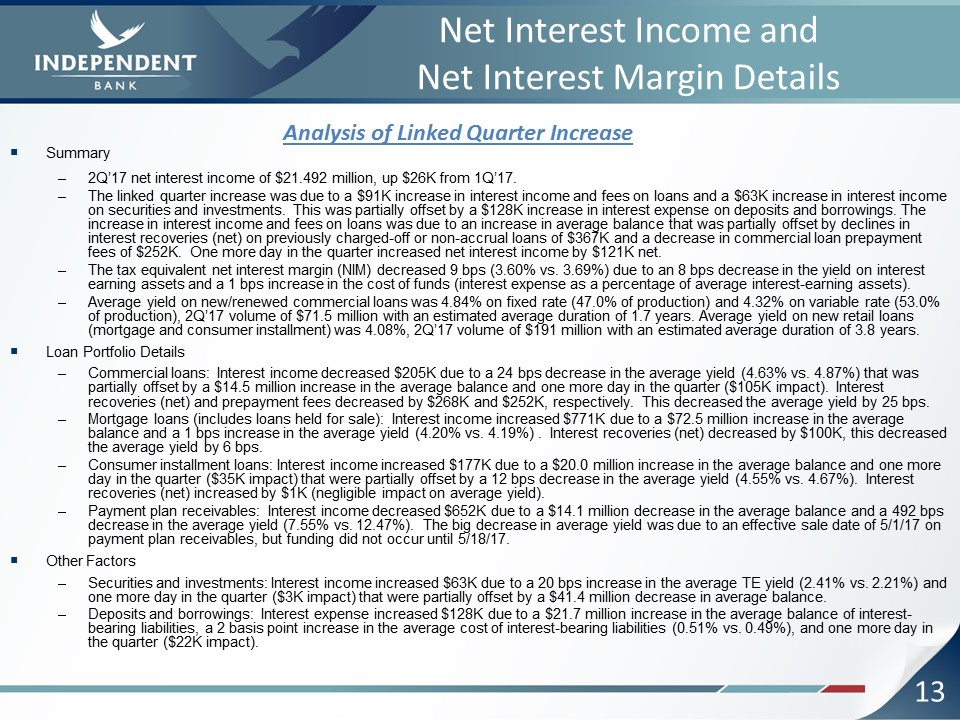
13 Net Interest Income and Net Interest Margin Details Summary2Q’17 net interest income of $21.492 million, up $26K from 1Q’17. The linked quarter increase was due to a $91K increase in interest income and fees on loans and a $63K increase in interest income on securities and investments. This was partially offset by a $128K increase in interest expense on deposits and borrowings. The increase in interest income and fees on loans was due to an increase in average balance that was partially offset by declines in interest recoveries (net) on previously charged-off or non-accrual loans of $367K and a decrease in commercial loan prepayment fees of $252K. One more day in the quarter increased net interest income by $121K net. The tax equivalent net interest margin (NIM) decreased 9 bps (3.60% vs. 3.69%) due to an 8 bps decrease in the yield on interest earning assets and a 1 bps increase in the cost of funds (interest expense as a percentage of average interest-earning assets). Average yield on new/renewed commercial loans was 4.84% on fixed rate (47.0% of production) and 4.32% on variable rate (53.0% of production), 2Q’17 volume of $71.5 million with an estimated average duration of 1.7 years. Average yield on new retail loans (mortgage and consumer installment) was 4.08%, 2Q’17 volume of $191 million with an estimated average duration of 3.8 years.Loan Portfolio DetailsCommercial loans: Interest income decreased $205K due to a 24 bps decrease in the average yield (4.63% vs. 4.87%) that was partially offset by a $14.5 million increase in the average balance and one more day in the quarter ($105K impact). Interest recoveries (net) and prepayment fees decreased by $268K and $252K, respectively. This decreased the average yield by 25 bps. Mortgage loans (includes loans held for sale): Interest income increased $771K due to a $72.5 million increase in the average balance and a 1 bps increase in the average yield (4.20% vs. 4.19%) . Interest recoveries (net) decreased by $100K, this decreased the average yield by 6 bps.Consumer installment loans: Interest income increased $177K due to a $20.0 million increase in the average balance and one more day in the quarter ($35K impact) that were partially offset by a 12 bps decrease in the average yield (4.55% vs. 4.67%). Interest recoveries (net) increased by $1K (negligible impact on average yield).Payment plan receivables: Interest income decreased $652K due to a $14.1 million decrease in the average balance and a 492 bps decrease in the average yield (7.55% vs. 12.47%). The big decrease in average yield was due to an effective sale date of 5/1/17 on payment plan receivables, but funding did not occur until 5/18/17. Other FactorsSecurities and investments: Interest income increased $63K due to a 20 bps increase in the average TE yield (2.41% vs. 2.21%) and one more day in the quarter ($3K impact) that were partially offset by a $41.4 million decrease in average balance.Deposits and borrowings: Interest expense increased $128K due to a $21.7 million increase in the average balance of interest-bearing liabilities, a 2 basis point increase in the average cost of interest-bearing liabilities (0.51% vs. 0.49%), and one more day in the quarter ($22K impact). Analysis of Linked Quarter Increase
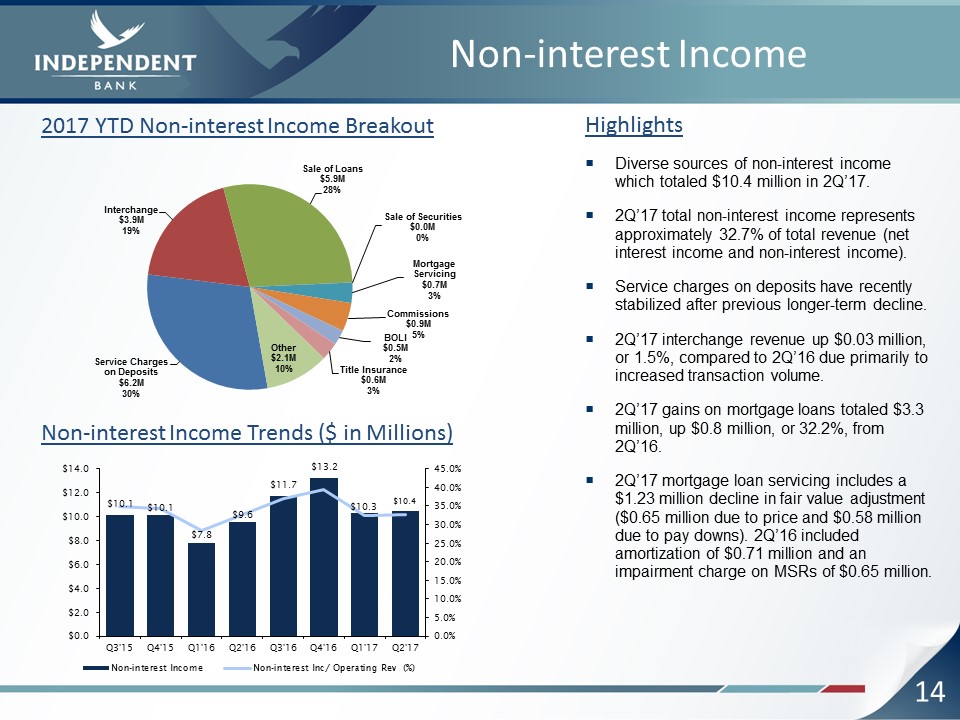
14 Non-interest Income HighlightsDiverse sources of non-interest income which totaled $10.4 million in 2Q’17.2Q’17 total non-interest income represents approximately 32.7% of total revenue (net interest income and non-interest income).Service charges on deposits have recently stabilized after previous longer-term decline.2Q’17 interchange revenue up $0.03 million, or 1.5%, compared to 2Q’16 due primarily to increased transaction volume.2Q’17 gains on mortgage loans totaled $3.3 million, up $0.8 million, or 32.2%, from 2Q’16.2Q’17 mortgage loan servicing includes a $1.23 million decline in fair value adjustment ($0.65 million due to price and $0.58 million due to pay downs). 2Q’16 included amortization of $0.71 million and an impairment charge on MSRs of $0.65 million. 2017 YTD Non-interest Income Breakout Non-interest Income Trends ($ in Millions)
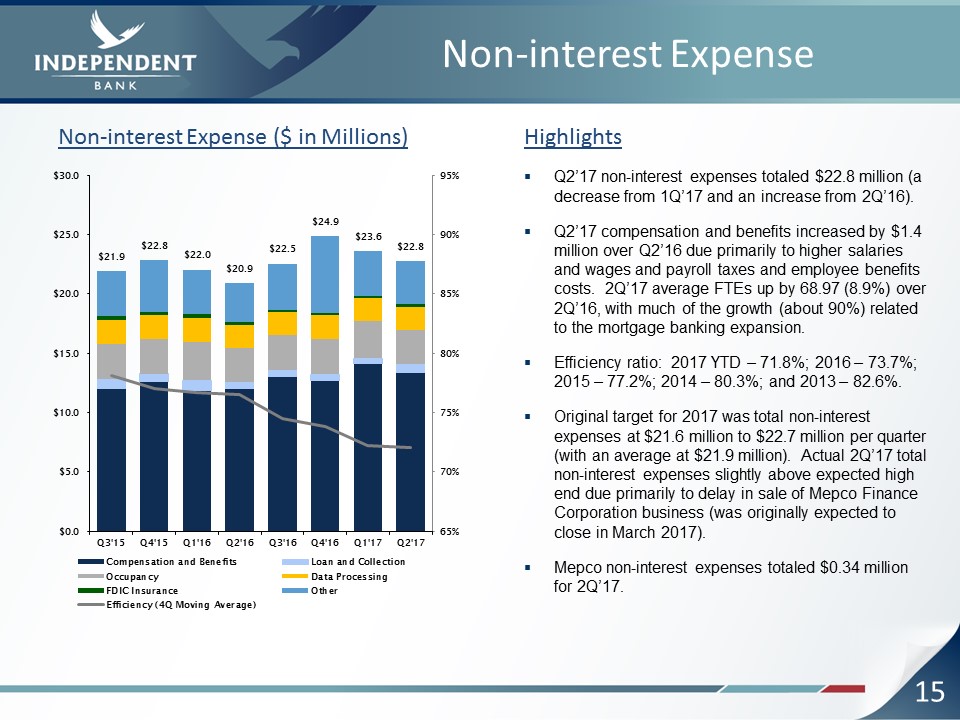
15 Non-interest Expense HighlightsQ2’17 non-interest expenses totaled $22.8 million (a decrease from 1Q’17 and an increase from 2Q’16).Q2’17 compensation and benefits increased by $1.4 million over Q2’16 due primarily to higher salaries and wages and payroll taxes and employee benefits costs. 2Q’17 average FTEs up by 68.97 (8.9%) over 2Q’16, with much of the growth (about 90%) related to the mortgage banking expansion. Efficiency ratio: 2017 YTD – 71.8%; 2016 – 73.7%; 2015 – 77.2%; 2014 – 80.3%; and 2013 – 82.6%.Original target for 2017 was total non-interest expenses at $21.6 million to $22.7 million per quarter (with an average at $21.9 million). Actual 2Q’17 total non-interest expenses slightly above expected high end due primarily to delay in sale of Mepco Finance Corporation business (was originally expected to close in March 2017).Mepco non-interest expenses totaled $0.34 million for 2Q’17. Non-interest Expense ($ in Millions)
16 Sale of Mepco Finance Corporation Sale Transaction SummarySigned Asset Purchase Agreement (APA) on December 30, 2016 to sell the business and majority of assets of Mepco Finance Corporation (Mepco) to Seabury Asset Management LLC (Seabury). Transaction closed on May 18, 2017 with an effective date of May 1, 2017.Under the terms of the APA, Seabury paid net book value for the assets acquired, assumed Mepco’s lease for office space in Chicago and retained Mepco’s employees.Mepco retained deferred tax assets (that can be used in the IBC consolidated tax return) as well as certain counterparty receivables that are being collected pursuant to various payment arrangements. Mepco was renamed “IB Holding Company” at closing and was liquidated on June 30, 2017 with the remaining assets and liabilities transferred to Independent Bank.Balance Sheet and Income Statement ImpactMepco sold $33.1 million of net payment plan receivables, $0.5 million of commercial loans, $0.2 million of furniture and equipment, and $1.6 million of other assets to Seabury, who also assumed $2.0 million of specified liabilities.During 2Q’17 Mepco had $0.34 million of net interest income and $0.34 million of non-interest expense (net income was zero). Expect full year 2017 impact to IBC (compared to 2016) to be slightly beneficial to net income.
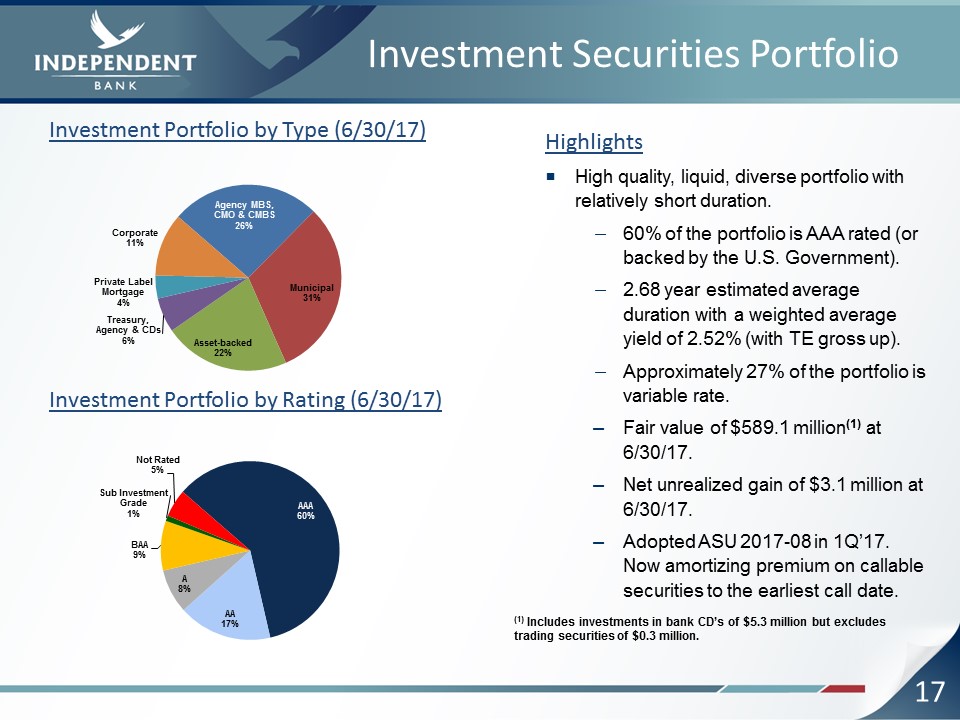
17 Investment Securities Portfolio HighlightsHigh quality, liquid, diverse portfolio with relatively short duration.60% of the portfolio is AAA rated (or backed by the U.S. Government).2.68 year estimated average duration with a weighted average yield of 2.52% (with TE gross up).Approximately 27% of the portfolio is variable rate.Fair value of $589.1 million(1) at 6/30/17.Net unrealized gain of $3.1 million at 6/30/17.Adopted ASU 2017-08 in 1Q’17. Now amortizing premium on callable securities to the earliest call date. (1) Includes investments in bank CD’s of $5.3 million but excludes trading securities of $0.3 million. Investment Portfolio by Type (6/30/17) Investment Portfolio by Rating (6/30/17)
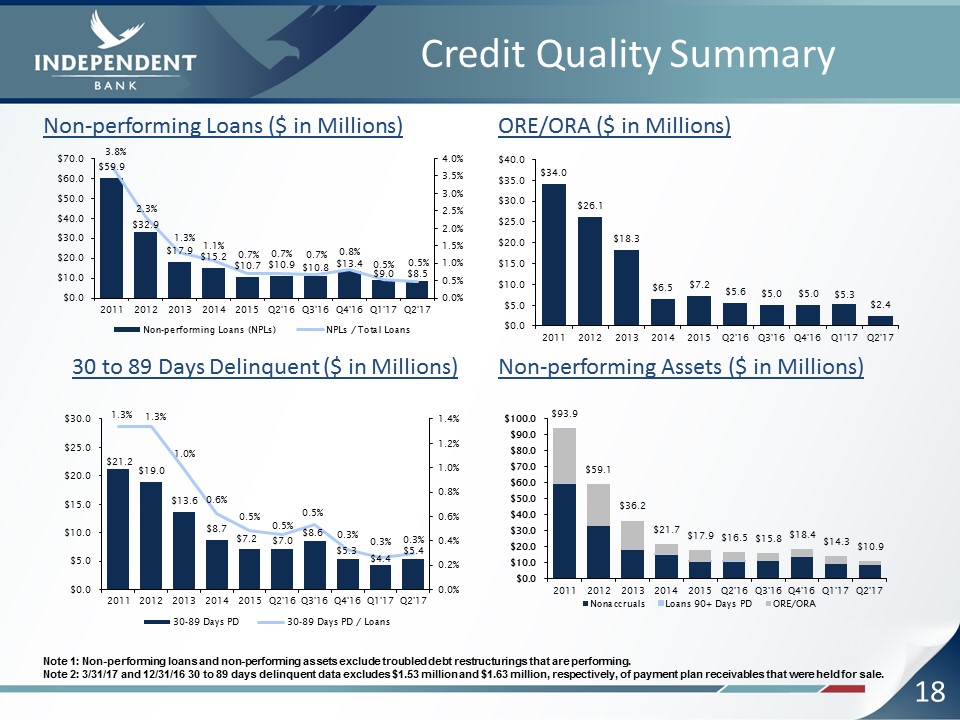
18 Credit Quality Summary Note 1: Non-performing loans and non-performing assets exclude troubled debt restructurings that are performing.Note 2: 3/31/17 and 12/31/16 30 to 89 days delinquent data excludes $1.53 million and $1.63 million, respectively, of payment plan receivables that were held for sale. Non-performing Assets ($ in Millions) ORE/ORA ($ in Millions) Non-performing Loans ($ in Millions) 30 to 89 Days Delinquent ($ in Millions)
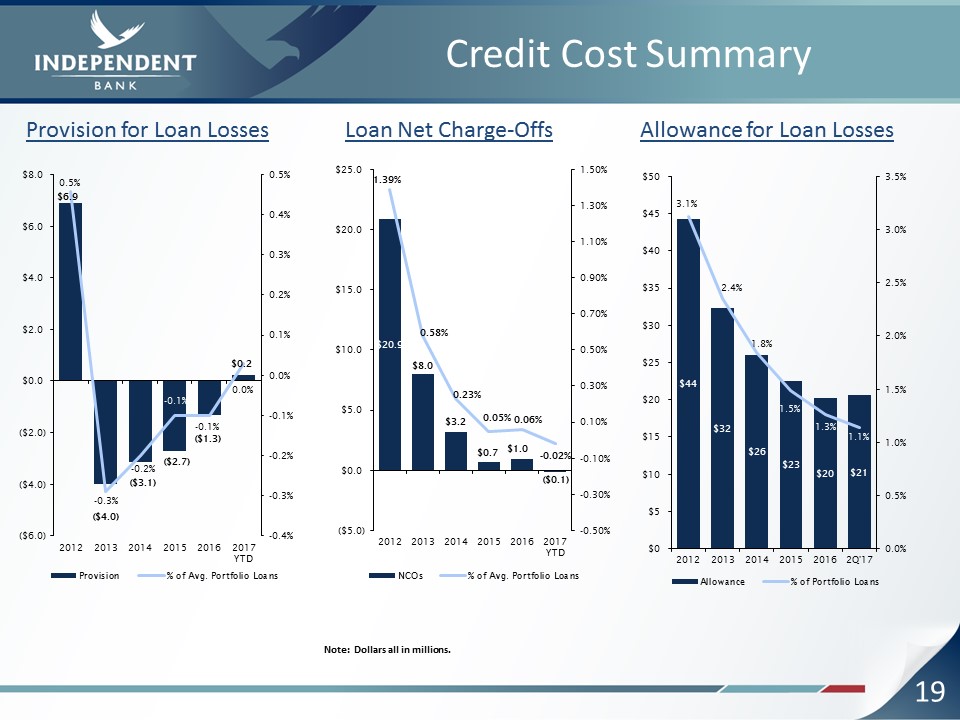
19 Credit Cost Summary Note: Dollars all in millions. Provision for Loan Losses Loan Net Charge-Offs Allowance for Loan Losses
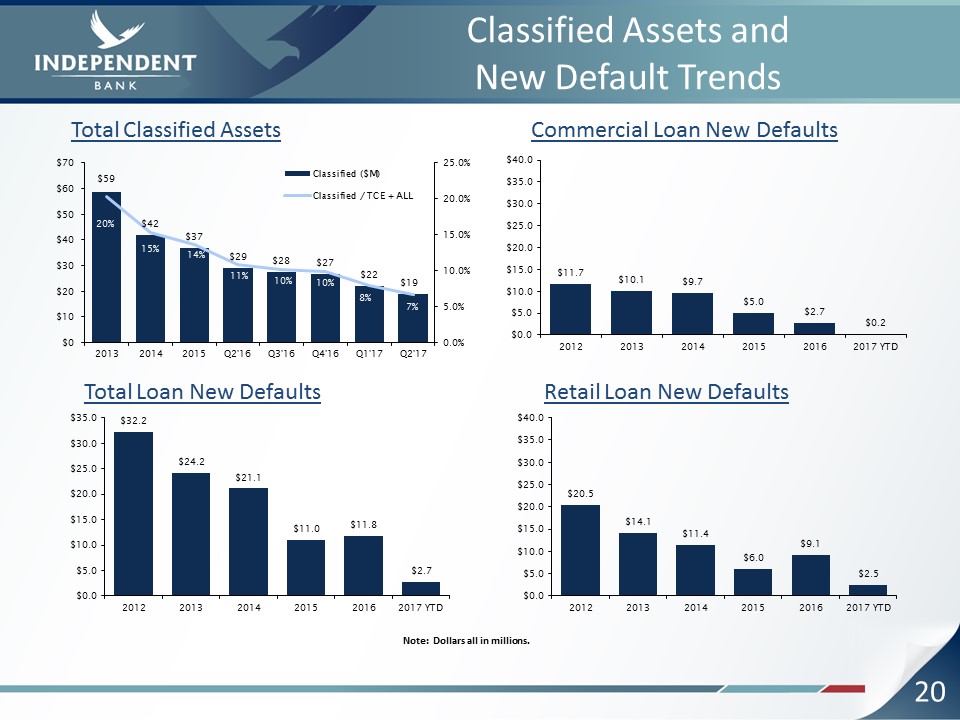
20 Classified Assets and New Default Trends Note: Dollars all in millions. Total Classified Assets Commercial Loan New Defaults Total Loan New Defaults Retail Loan New Defaults
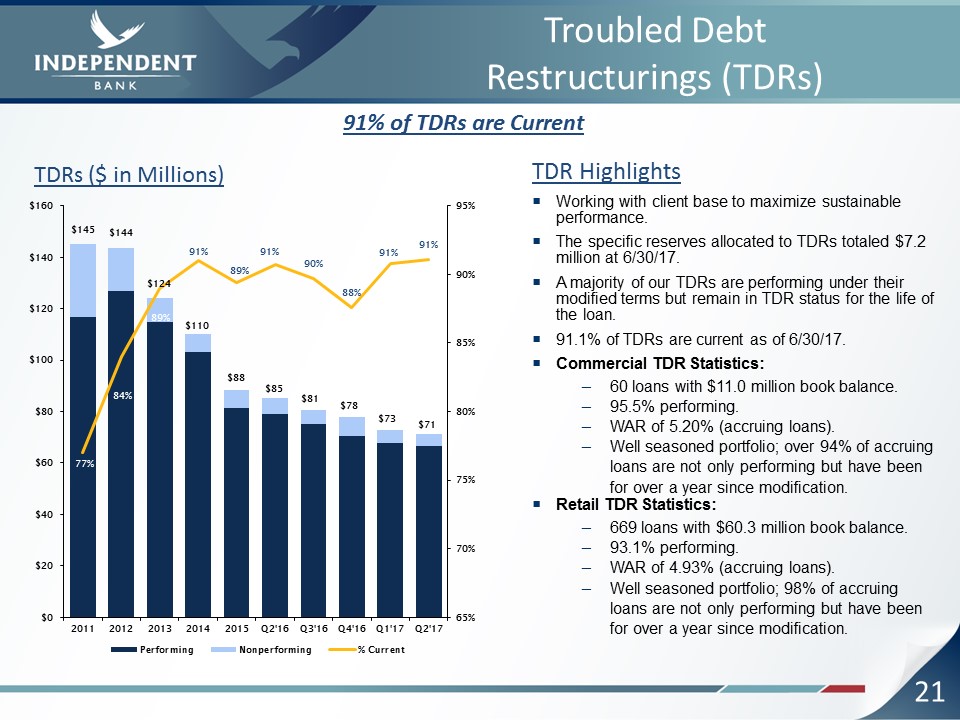
21 Troubled Debt Restructurings (TDRs) TDR HighlightsWorking with client base to maximize sustainable performance.The specific reserves allocated to TDRs totaled $7.2 million at 6/30/17.A majority of our TDRs are performing under their modified terms but remain in TDR status for the life of the loan.91.1% of TDRs are current as of 6/30/17.Commercial TDR Statistics:60 loans with $11.0 million book balance.95.5% performing.WAR of 5.20% (accruing loans).Well seasoned portfolio; over 94% of accruing loans are not only performing but have been for over a year since modification.Retail TDR Statistics:669 loans with $60.3 million book balance.93.1% performing.WAR of 4.93% (accruing loans).Well seasoned portfolio; 98% of accruing loans are not only performing but have been for over a year since modification. TDRs ($ in Millions) 91% of TDRs are Current
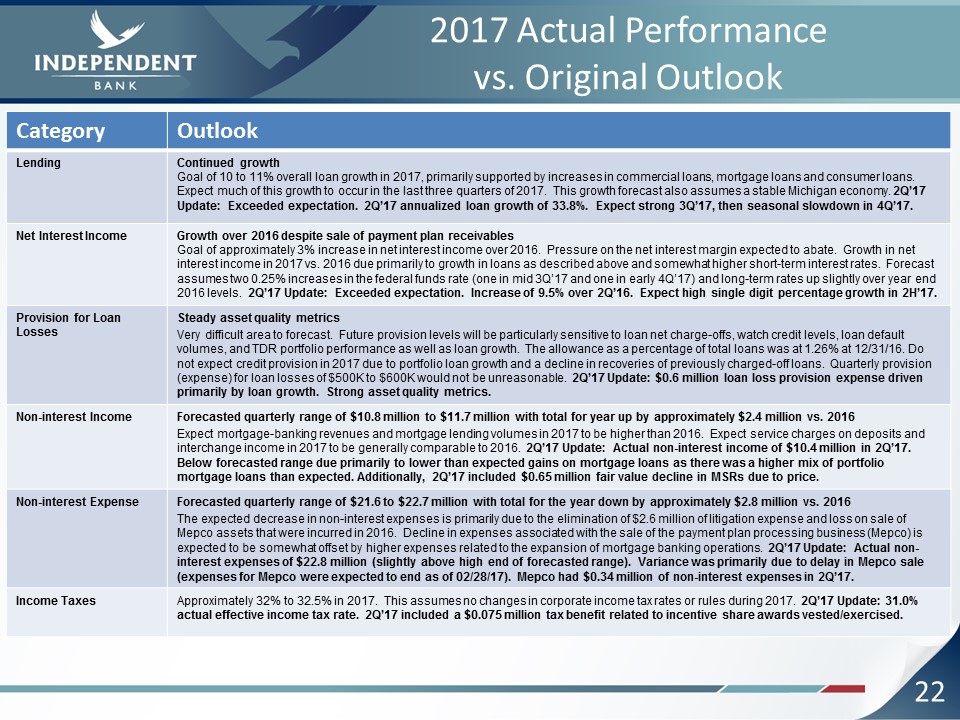
22 2017 Actual Performance vs. Original Outlook Category Outlook Lending Continued growthGoal of 10 to 11% overall loan growth in 2017, primarily supported by increases in commercial loans, mortgage loans and consumer loans. Expect much of this growth to occur in the last three quarters of 2017. This growth forecast also assumes a stable Michigan economy. 2Q’17 Update: Exceeded expectation. 2Q’17 annualized loan growth of 33.8%. Expect strong 3Q’17, then seasonal slowdown in 4Q’17. Net Interest Income Growth over 2016 despite sale of payment plan receivablesGoal of approximately 3% increase in net interest income over 2016. Pressure on the net interest margin expected to abate. Growth in net interest income in 2017 vs. 2016 due primarily to growth in loans as described above and somewhat higher short-term interest rates. Forecast assumes two 0.25% increases in the federal funds rate (one in mid 3Q’17 and one in early 4Q’17) and long-term rates up slightly over year end 2016 levels. 2Q’17 Update: Exceeded expectation. Increase of 9.5% over 2Q’16. Expect high single digit percentage growth in 2H’17. Provision for Loan Losses Steady asset quality metricsVery difficult area to forecast. Future provision levels will be particularly sensitive to loan net charge-offs, watch credit levels, loan default volumes, and TDR portfolio performance as well as loan growth. The allowance as a percentage of total loans was at 1.26% at 12/31/16. Do not expect credit provision in 2017 due to portfolio loan growth and a decline in recoveries of previously charged-off loans. Quarterly provision (expense) for loan losses of $500K to $600K would not be unreasonable. 2Q’17 Update: $0.6 million loan loss provision expense driven primarily by loan growth. Strong asset quality metrics. Non-interest Income Forecasted quarterly range of $10.8 million to $11.7 million with total for year up by approximately $2.4 million vs. 2016Expect mortgage-banking revenues and mortgage lending volumes in 2017 to be higher than 2016. Expect service charges on deposits and interchange income in 2017 to be generally comparable to 2016. 2Q’17 Update: Actual non-interest income of $10.4 million in 2Q’17. Below forecasted range due primarily to lower than expected gains on mortgage loans as there was a higher mix of portfolio mortgage loans than expected. Additionally, 2Q’17 included $0.65 million fair value decline in MSRs due to price. Non-interest Expense Forecasted quarterly range of $21.6 to $22.7 million with total for the year down by approximately $2.8 million vs. 2016The expected decrease in non-interest expenses is primarily due to the elimination of $2.6 million of litigation expense and loss on sale of Mepco assets that were incurred in 2016. Decline in expenses associated with the sale of the payment plan processing business (Mepco) is expected to be somewhat offset by higher expenses related to the expansion of mortgage banking operations. 2Q’17 Update: Actual non-interest expenses of $22.8 million (slightly above high end of forecasted range). Variance was primarily due to delay in Mepco sale (expenses for Mepco were expected to end as of 02/28/17). Mepco had $0.34 million of non-interest expenses in 2Q’17. Income Taxes Approximately 32% to 32.5% in 2017. This assumes no changes in corporate income tax rates or rules during 2017. 2Q’17 Update: 31.0% actual effective income tax rate. 2Q’17 included a $0.075 million tax benefit related to incentive share awards vested/exercised.
23 Strategic Initiatives Balance SheetGenerate quality loan growth with continued focus on commercial and consumer installment lending as well as salable and portfolio mortgage loans.Remain asset sensitive and positioned to benefit from higher interest rates (short duration investment portfolio, large variable rate loan portfolio and strong core deposit base with a significant amount of small to medium balance transaction accounts). Income StatementGenerate increased net interest income through change in earning asset mix (increased loans to deposits ratio and reduced level of investment securities).Increase non-interest income with focus on transaction related revenue (treasury management and debit card) and mortgage banking revenue.Continued selective reductions in certain non-interest expenses (credit related costs, branch optimization, process re-engineering and outsourcing). However, now expect growth in compensation and employee benefits expense and in occupancy expense as mortgage-banking operations are expanded.Improved efficiency ratio: Low 70% range near-term and mid 60% range longer-term. Achieve improvements primarily through revenue growth.Enterprise Risk ManagementSteady asset quality.Meet increased compliance and regulatory requirements.Focus on data security and loss prevention.
24 Q&A and Closing Remarks Question and Answer SessionClosing RemarksThank you for attending !NASDAQ: IBCP