Attached files
| file | filename |
|---|---|
| 8-K - 8-K - BOK FINANCIAL CORP | a20170630bokfconferencecal.htm |

1
Second Quarter 2017
Earnings Conference Call
July 26, 2017

2
Forward-Looking Statements: This presentation contains statements that are based on management’s
beliefs, assumptions, current expectations, estimates, and projections about BOK Financial Corporation, the
financial services industry, and the economy generally. These remarks constitute forward-looking statements
within the meaning of the Private Securities Litigation Reform Act of 1995. Words such as “anticipates”,
“believes”, “estimates”, “expects”, “forecasts”, “plans”, “projects”, variations of such words, and similar
expressions are intended to identify such forward-looking statements. Management judgments relating to,
and discussion of the provision and allowance for credit losses involve judgments as to future events and are
inherently forward-looking statements. Assessments that BOK Financial’s acquisitions and other growth
endeavors will be profitable are necessary statements of belief as to the outcome of future events, based in
part on information provided by others which BOKF has not independently verified. These statements are not
guarantees of future performance and involve certain risks, uncertainties, and assumptions which are difficult
to predict with regard to timing, extent, likelihood and degree of occurrence. Therefore, actual results and
outcomes may materially differ from what is expressed, implied or forecasted in such forward-looking
statements. Internal and external factors that might cause such a difference include, but are not limited to,
changes in interest rates and interest rate relationships, demand for products and services, the degree of
competition by traditional and non-traditional competitors, changes in banking regulations, tax laws, prices,
levies, and assessments, the impact of technological advances, and trends in customer behavior as well as
their ability to repay loans. For a discussion of risk factors that may cause actual results to differ from
expectations, please refer to BOK Financial Corporation’s most recent annual and quarterly reports. BOK
Financial Corporation and its affiliates undertake no obligation to update, amend, or clarify forward-looking
statements, whether as a result of new information, future events, or otherwise.
Non-GAAP Financial Measures: This presentation may refer to non-GAAP financial measures. Additional
information on these financial measures is available in BOK Financial’s 10-Q and 10-K filings with the
Securities and Exchange Commission which can be accessed at www.BOKF.com.
All data is presented as of June 30, 2017 unless otherwise noted.

3
Steven G. Bradshaw
Chief Executive Officer

4
Second Quarter Summary:
• Noteworthy items impacting Q2 profitability:
• Strong net interest margin and net interest revenue growth from full benefit from March 2017 Fed
rate hike and continued asset sensitivity of balance sheet in early part of rate cycle
• Fee income driven by strong performance from Fiduciary and Asset Management, Transaction
Card, and seasonal strength in mortgage banking
• Continued careful expense management, including $5.1 million refund from FDIC
• $5.7 million gain on the sale of a merchant banking investment
• Benign credit environment – no provision for loan losses in the quarter.
Q2 2017 Q1 2017 Q2 2016
Diluted EPS $1.35 $1.35 $1.00
Net income before
taxes ($M)
$136.6 $126.8 $96.8
Net income
attributable to BOKF
shareholders ($M)
$88.1 $88.4 $65.8
$65.8
$74.3
$50.0
$88.4 $88.1
$1.00
$1.13
$0.76
$1.35 $1.35
2Q16 3Q16 4Q16 1Q17 Q217
Net Income
Net income attributable to shareholders
Net income per share - diluted

5
Additional Details
($B)
Q2 2017
Quarterly
Growth
Annualized
Quarterly
Growth
Year over Year
Growth
Period-End Loans $17.2 1.1% 4.5% 4.7%
Average Loans $17.1 -% -% 5.3%
Fiduciary Assets $44.5 0.2% 0.8% 11.3%
Assets Under Management
or in Custody
$77.8 0.5% 2.0% 6.6%
• Mid single digit annualized loan growth in Q2 2017, driven by momentum in energy banking
• Modest AUM growth driven by market factors

6
Steven Nell
Chief Financial Officer
Financial Overview

7
Net Interest Revenue
Net Interest Margin
($mil)
Q2
2017
Q1
2017
Q4
2016
Q3
2016
Q2
2016
Net Interest Revenue $205.2 $201.2 $194.2 $187.8 $182.6
Provision For Credit Losses $ -- $ -- $ -- $ 10.0 $ 20.0
Net Interest Revenue After Provision $205.2 $201.2 $194.2 $177.8 $162.6
Net Interest Margin 2.89% 2.81% 2.69% 2.64% 2.63%
Add Back: Dilution due to FHLB/Fed Trade 0.13% 0.13% 0.12% 0.12% 0.12%
Normalized Net Interest Margin 3.02% 2.94% 2.81% 2.76% 2.75%
• Due to low deposit betas and low deposit pricing pressure, balance sheet continues to behave very asset
sensitive in the current interest rate cycle
• Net Interest Margin up 8 basis points sequentially due to:
• Full impact of March 2017 Fed rate hike
• Yield on AFS securities up 6 basis points
• Loan yields up 15 basis points
• Deposit costs up 5 basis points
• Normalized Net Interest Margin exceeds 3% for first time since Q3 2012

8
Fees and Commissions
Revenue, $mil Change:
Q2 17
Quarterly,
Sequential
Quarterly,
Year over Year
Trailing 12
Months
Brokerage and Trading $31.8 (5.5%) (19.6%) (1.4%)
Transaction Card 35.3 9.9% 1.0% 2.8%
Fiduciary and Asset Management 41.8 8.2% 20.1% 15.7%
Deposit Service Charges and Fees 23.4 1.4% 3.3% 2.0%
Mortgage Banking 30.3 20.2% (13.2%) 0.8%
Other Revenue 15.0 27.5% 12.2% 0.1%
Total Fees and Commissions $177.5 8.0% (1.5%) 3.8%
Fee and commission revenue drivers:
• Brokerage and trading: Soft quarter for fees due to impact of fiduciary rule implementation on retail brokerage
business, lower investment banking deal flow, and reduced institutional trading volume.
• Transaction card: Revenue momentum rebuilding due to strong sales activity in 1H2017. Year over year
comparison impacted by heavy contract buyout revenue in 2Q16.
• Fiduciary and asset management: Strong revenue growth from corporate trust and institutional wealth; zero fee
waivers this quarter compared to $1.8 million in 2Q16; and contribution from seasonal tax planning business.
• Mortgage banking: Strong sequential increase due to seasonality, higher retail gain on sale margins, and
improved pipeline hedge performance.
• NOTE: $1.6 million of revenue from repossessed oil wells included in “other revenue” line.

9
Expenses
($mil)
Q2 2017
Q1 2017
Q2 2016
%Incr.
Seq.
%Incr.
YOY
Personnel Expense $143.7 $136.4 $139.2 5.4% 3.3%
Other Operating Expense $107.1 $108.3 $112.2 (1.1)% (4.5)%
Total Operating Expense $250.9 $244.7 $251.4 2.5% (0.2)%
Personnel Expense:
• Increase due to full quarter’s impact of March merit increases, severance expense, and updated vesting assumptions on
equity incentive awards
Other Operating Expense:
• Business promotion expense up $1 million sequentially due to timing of advertising spend
• $5.1 million of FDIC expense rebates from prior quarters due to designation of BOKF as a custody bank.
• Expect FDIC expense run rate to be ~$1 million per quarter lower going forward
• Higher OREO expense due to $900,000 of operating costs, net of gain on partial property sales, associated with
repossessed oil wells (offsetting revenue of $1.6 million)
• Lower provision for recourse losses caused reduction in mortgage banking expense

10
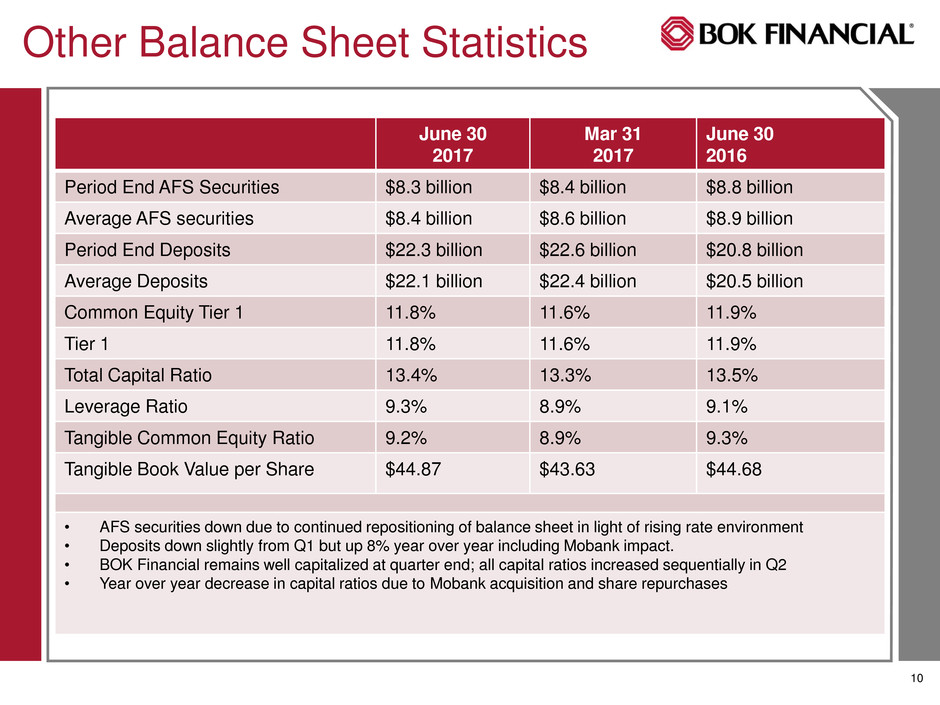
Other Balance Sheet Statistics
June 30
2017
Mar 31
2017
June 30
2016
Period End AFS Securities $8.3 billion $8.4 billion $8.8 billion
Average AFS securities $8.4 billion $8.6 billion $8.9 billion
Period End Deposits $22.3 billion $22.6 billion $20.8 billion
Average Deposits $22.1 billion $22.4 billion $20.5 billion
Common Equity Tier 1 11.8% 11.6% 11.9%
Tier 1 11.8% 11.6% 11.9%
Total Capital Ratio 13.4% 13.3% 13.5%
Leverage Ratio 9.3% 8.9% 9.1%
Tangible Common Equity Ratio 9.2% 8.9% 9.3%
Tangible Book Value per Share $44.87 $43.63 $44.68
• AFS securities down due to continued repositioning of balance sheet in light of rising rate environment
• Deposits down slightly from Q1 but up 8% year over year including Mobank impact.
• BOK Financial remains well capitalized at quarter end; all capital ratios increased sequentially in Q2
• Year over year decrease in capital ratios due to Mobank acquisition and share repurchases

11
2017 Assumptions
Mid-single-digit loan growth for the full year
Available-for-sale securities portfolio expected to be flat for balance of the year (*)
Stable to increasing net interest margin and modest sequential growth in net interest
income expected in Q3 and Q4
Loan loss provision of $0-$10 million for full year (*)
Low-single-digit revenue growth from fee-generating businesses on a trailing twelve
month basis
Expenses flat to slightly down compared to 2016
* Guidance changed from prior quarter

12
Stacy Kymes
EVP-Corporate Banking

13
($mil)
June 30
2017
Mar 31
2017
Seq.
Loan
Growth
Commercial and
Industrial
$10,638.0 $10,327.1 3.0%
Commercial
Real Estate
3,688.6 3,871.1 (4.7%)
Residential
Mortgage
1,939.2 1,946.3 (0.4%)
Personal 917.9 847.4 8.3%
Total $17,183.7 $16,991.9 1.1%
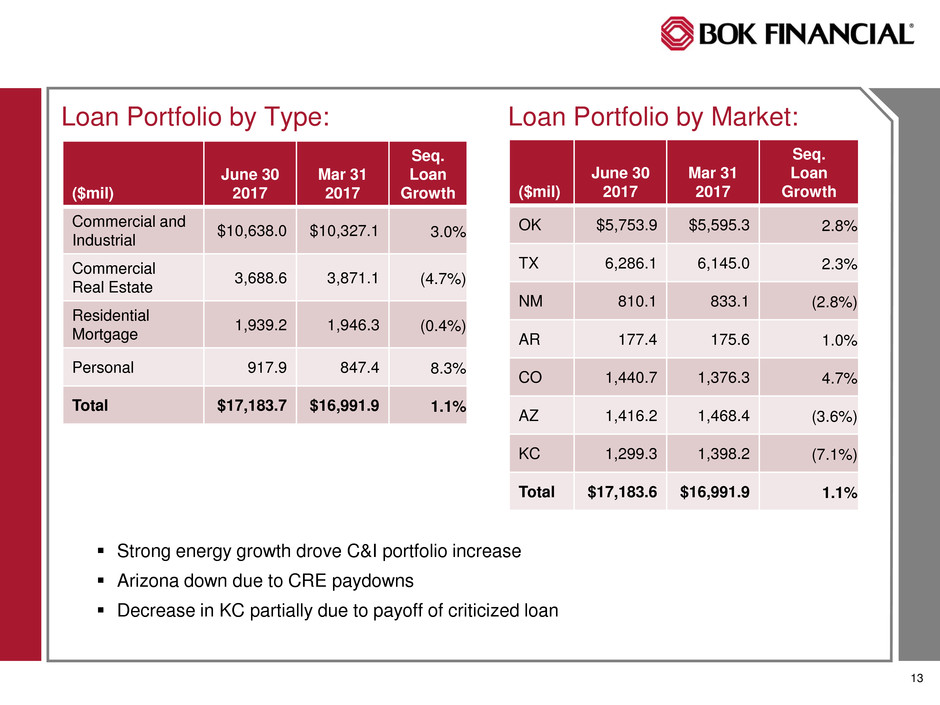
Loan Portfolio by Type:
($mil)
June 30
2017
Mar 31
2017
Seq.
Loan
Growth
OK $5,753.9 $5,595.3 2.8%
TX 6,286.1 6,145.0 2.3%
NM 810.1 833.1 (2.8%)
AR 177.4 175.6 1.0%
CO 1,440.7 1,376.3 4.7%
AZ 1,416.2 1,468.4 (3.6%)
KC 1,299.3 1,398.2 (7.1%)
Total $17,183.6 $16,991.9 1.1%
Loan Portfolio by Market:
Strong energy growth drove C&I portfolio increase
Arizona down due to CRE paydowns
Decrease in KC partially due to payoff of criticized loan

14
($mil)
June 30
2017
Mar 31
2017
Seq.
Loan
Growth
Energy $2,847.2 $2,537.1 12.2%
Services 2,958.8 3,013.4 (1.8%)
Healthcare 2,221.5 2,265.6 (1.9%)
Wholesale/retail 1,543.7 1,506.2 2.5%
Manufacturing 546.2 543.4 0.5%
Other 520.6 461.4 12.8%
Total C&I $10,638.0 $10,327.1 3.0%
($mil)
June 30
2017
Mar 31
2017
Seq.
Loan
Growth
Retail $722.8 $745.0 (3.0%)
Multifamily 952.4 923.0 3.2%
Office 863.0 860.9 0.2%
Industrial 693.6 871.5 (20.4%)
Residential Const.
and Land Dev.
141.6 136.0 4.1%
Other CRE 315.2 334.7 (5.8%)
Total CRE $3,688.6 $3,871.1 (4.7%)
Commercial & Industrial: Commercial Real Estate
Energy loan growth of 12.2% was primary driver of overall C&I growth
Healthcare portfolio growth temporarily stalled due to uncertain political environment
CRE portfolio down due to internal concentration management efforts combined with
higher-than-expected paydown activity in Q2.

15
Key Credit Quality Metrics
$168.1
$143.0 $132.5
$110.4
$124.0
79.1
94.0
98.5
97.2
121.5
$247.2
$237.0
$231.0
$207.6
$245.4
$-
$50.0
$100.0
$150.0
$200.0
$250.0
2Q16 3Q16 4Q16 1Q17 2Q17
Energy Non-Accruals Other Non-Accruals
1.54%
1.56%
1.52%
1.52%
1.49%
1.40%
1.42%
1.44%
1.46%
1.48%
1.50%
1.52%
1.54%
1.56%
1.58%
2Q16 3Q16 4Q16 1Q17 2Q17
Combined Allowance for Credit Losses
to Period End Loans
0.18% 0.15%
-0.03%
-0.02%
0.04%
-0.50%
0.00%
0.50%
1.00%
1.50%
2Q16 3Q16 4Q16 1Q17 2Q17
Net charge offs (annualized)
to average loans
No material signs of stress in any loan
portfolio
Appropriately reserved for any potential
issues with a combined allowance of 1.49%,
which is at or near the top of the peer group

16
Energy Lending Update
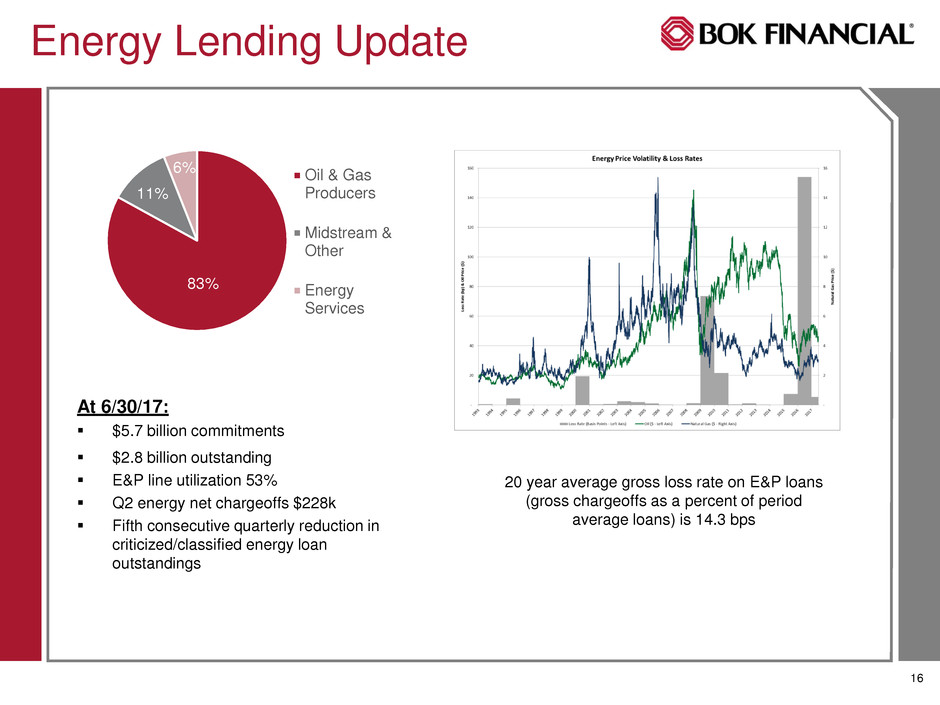
At 6/30/17:
$5.7 billion commitments
$2.8 billion outstanding
E&P line utilization 53%
Q2 energy net chargeoffs $228k
Fifth consecutive quarterly reduction in
criticized/classified energy loan
outstandings
20 year average gross loss rate on E&P loans
(gross chargeoffs as a percent of period
average loans) is 14.3 bps
83%
11%
6% Oil & Gas
Producers
Midstream &
Other
Energy
Services

17
$723 million outstanding at 6/30/17
Only $2 million criticized loans – no change from 3/31/17
60% of portfolio considered service based and less susceptible to online
competition
Diversified portfolio:
Top ten “goods based” retail CRE exposures total $192 million. Goods based
determined by:
>50% of gross potential rent from the Moody’s retail industry classifications that are most
susceptible to e-commerce threats.
Or >35% of gross potential rent from any one goods-based retailer.
Highly diversified tenant base with no material exposure to any one tenant.
Top five tenant concentrations are as follows:
1. Investment grade retail pharmacy chain: 13 loans totaling $45MM
2. Investment grade retail pharmacy chain: 4 loans totaling $8MM
3. Investment grade “dollar store” chain: 9 loans totaling $7.9MM
4. Investment grade arts and crafts supply chain: 4 loans totaling $7.8MM
5. Investment grade “dollar store” chain: 5 loans totaling $4.1MM
Retail CRE Update
Top 5 tenants
only represent
$72.8 million or
10.1% of retail
CRE exposure

18
Total Retail/Wholesale category outstandings at 6/30: $1,543.7 million
Retailers total $652.6 million or 42% of this category
65% of retailer outstandings are service-based retailers (61% of commitments)
Criticized loans total $8.6 million (1.32%)
Retail C&I portfolio by type:
Retail C&I Update
Store Type
Outstanding at
6/30/17
Notes:
Convenience Stores $128.3
Grocers $45.2
Auto Dealers $49.5
Restaurants $158.7
Other $270.9 Over $100 million to a single investment-grade retailer
with low risk of online competition
TOTAL $652.6

19
Steven G. Bradshaw
Chief Executive Officer
Closing Remarks

20
Question and Answer Session
