Attached files
| file | filename |
|---|---|
| 8-K - 8-K - SUNTRUST BANKS INC | a63017form8-ker.htm |
| EX-99.1 - EXHIBIT 99.1 - SUNTRUST BANKS INC | a63017earningsrelease-exhi.htm |

2Q 17 EARNINGS
PRESENTATION
July 21, 2017
© 2017 SunTrust Banks, Inc. SunTrust is a federally registered trademark of SunTrust Banks, Inc.
2
This presentation should be read in conjunction with the financial statements, notes and other information contained in the Company’s forthcoming Form 10-K, Quarterly Reports on Form 10-Q, and Current Reports on Form 8-K.
Non-GAAP Financial Measures
This presentation includes non-GAAP financial measures to describe SunTrust’s performance. The reconciliations of those measures to GAAP measures are provided within or in the appendix of this presentation beginning on slide 22.
In this presentation, consistent with Securities and Exchange Commission Industry Guide 3, the Company presents total revenue, net interest income, net interest margin, and efficiency ratios on a fully taxable equivalent (“FTE”) and
annualized basis. The FTE basis adjusts for the tax-favored status of net interest income from certain loans and investments using a federal tax rate of 35% and state income taxes where applicable to increase tax-exempt interest income
to a taxable-equivalent basis. The Company believes this measure to be the preferred industry measurement of net interest income and it enhances comparability of net interest income arising from taxable and tax-exempt sources. Total
revenue-FTE equals net interest income-FTE plus noninterest income.
The Company presents the following additional non-GAAP measures because many investors find them useful. Specifically:
• The Company presents certain capital information on a tangible basis, including tangible common equity, the ratio of tangible common equity to tangible assets, return on average tangible common equity, and tangible book
value per share. These measures exclude the after-tax impact of purchase accounting intangible assets. The Company believes these measures are useful to investors because, by removing the effect of intangible assets that
result from merger and acquisition activity (the level of which may vary from company to company), it allows investors to more easily compare the Company’s capital adequacy to other companies in the industry. These
measures are used by management to analyze capital adequacy of the Company.
• Similarly, the Company presents an efficiency ratio-FTE and a tangible efficiency ratio-FTE. The efficiency ratio is computed by dividing noninterest expense by total revenue. Efficiency ratio-FTE is computed by dividing
noninterest expense by total revenue-FTE. The tangible efficiency ratio-FTE excludes the amortization related to intangible assets and certain tax credits. The Company believes this measure is useful to investors because, by
removing the impact of amortization (the level of which may vary from company to company), it allows investors to more easily compare the Company’s efficiency to other companies in the industry. This measure is also
utilized by management to assess the efficiency of the Company and its lines of business.
• The Company presents the Basel III Common Equity Tier 1 (CET1) ratio on a fully-phased in basis. The fully phased-in ratio considers a 250% risk-weighting for MSRs and deduction from capital of certain carryforward DTAs, the
overfunded pension asset, and other intangible assets. The Company believes this measure may be useful to investors who wish to understand the Company's current compliance with future regulatory requirements. This
measure is used by management to analyze capital adequacy of the Company.
Important Cautionary Statement about Forward-Looking Statements
This presentation contains forward-looking statements. Statements regarding future levels of the net interest margin, deposit betas, premium amortization expense, tangible efficiency ratio, net charge-off ratio, loan loss provision
expense, ALLL, dividend yield, preferred dividends, and Common Equity Tier 1 ratio are forward-looking statements. Also, any statement that does not describe historical or current facts is a forward-looking statement. These statements
often include the words “believes,” “expects,” “anticipates,” “estimates,” “intends,” “forecast”, “goals”, “plans,” “targets,” “initiatives,” “opportunity,” “focus”, “potentially,” “probably,” “projects,” “outlook,” or similar expressions
or future conditional verbs such as “may,” “will,” “should,” “would,” and “could"; such statements are based upon the current beliefs and expectations of management and on information currently available to management. Such
statements speak as of the date hereof, and we do not assume any obligation to update the statements made herein or to update the reasons why actual results could differ from those contained in such statements in light of new
information or future events.
Forward-looking statements are subject to significant risks and uncertainties. Investors are cautioned against placing undue reliance on such statements. Actual results may differ materially from those set forth in the forward-looking
statements. Factors that could cause actual results to differ materially from those described in the forward-looking statements can be found in Part I, Item 1A., “Risk Factors,” in our Annual Report on Form 10-K for the year ended
December 31, 2016 and in other periodic reports that we file with the SEC. Those factors include: current and future legislation and regulation could require us to change our business practices, reduce revenue, impose additional costs,
or otherwise adversely affect business operations or competitiveness; we are subject to stringent capital adequacy and liquidity requirements and our failure to meet these would adversely affect our financial condition; the monetary
and fiscal policies of the federal government and its agencies could have a material adverse effect on our earnings; our financial results have been, and may continue to be, materially affected by general economic conditions, and a
deterioration of economic conditions or of the financial markets may materially adversely affect our lending and other businesses and our financial results and condition; changes in market interest rates or capital markets could adversely
affect our revenue and expenses, the value of assets and obligations, and the availability and cost of capital and liquidity; our earnings may be affected by volatility in mortgage production and servicing revenues, and by changes in
carrying values of our servicing assets and mortgages held for sale due to changes in interest rates; disruptions in our ability to access global capital markets may adversely affect our capital resources and liquidity; we are subject to
credit risk; we may have more credit risk and higher credit losses to the extent that our loans are concentrated by loan type, industry segment, borrower type, or location of the borrower or collateral; we rely on the mortgage secondary
market and GSEs for some of our liquidity; loss of customer deposits could increase our funding costs; any reduction in our credit rating could increase the cost of our funding from the capital markets, we are subject to litigation, and our
expenses related to this litigation may adversely affect our results; we may incur fines, penalties and other negative consequences from regulatory violations, possibly even inadvertent or unintentional violations; we are subject to
certain risks related to originating and selling mortgages, and may be required to repurchase mortgage loans or indemnify mortgage loan purchasers as a result of breaches of representations and warranties, or borrower fraud, and this
could harm our liquidity, results of operations, and financial condition; we face risks as a servicer of loans; we are subject to risks related to delays in the foreclosure process; consumers and small businesses may decide not to use banks
to complete their financial transactions, which could affect net income; we have businesses other than banking which subject us to a variety of risks; negative public opinion could damage our reputation and adversely impact business
and revenues; we may face more intense scrutiny of our sales training, and incentive compensation practices; we rely on other companies to provide key components of our business infrastructure; competition in the financial services
industry is intense and we could lose business or suffer margin declines as a result; we continually encounter technological change and must effectively develop and implement new technology; maintaining or increasing market share
depends on market acceptance and regulatory approval of new products and services; we have in the past and may in the future pursue acquisitions, which could affect costs and from which we may not be able to realize anticipated
benefits; we depend on the expertise of key personnel, and if these individuals leave or change their roles without effective replacements, operations may suffer; we may not be able to hire or retain additional qualified personnel and
recruiting and compensation costs may increase as a result of turnover, both of which may increase costs and reduce profitability and may adversely impact our ability to implement our business strategies; our framework for managing
risks may not be effective in mitigating risk and loss to us; our controls and procedures may not prevent or detect all errors or acts of fraud; we are at risk of increased losses from fraud; a failure in or breach of our operational or
security systems or infrastructure, or those of our third party vendors and other service providers, including as a result of cyber-attacks, could disrupt our businesses, result in the disclosure or misuse of confidential or proprietary
information, damage our reputation, increase our costs and cause losses; the soundness of other financial institutions could adversely affect us; we depend on the accuracy and completeness of information about clients and
counterparties; our accounting policies and processes are critical to how we report our financial condition and results of operation, and they require management to make estimates about matters that are uncertain; depressed market
values for our stock and adverse economic conditions sustained over a period of time may require us to write down some portion of our goodwill; our financial instruments measured at fair value expose us to certain market risks; our
stock price can be volatile; our ability to receive dividends from our subsidiaries or other investments could affect our liquidity and ability to pay dividends; we might not pay dividends on our stock; and certain banking laws and certain
provisions of our articles of incorporation may have an anti-takeover effect.
IMPORTANT CAUTIONARY STATEMENT
3
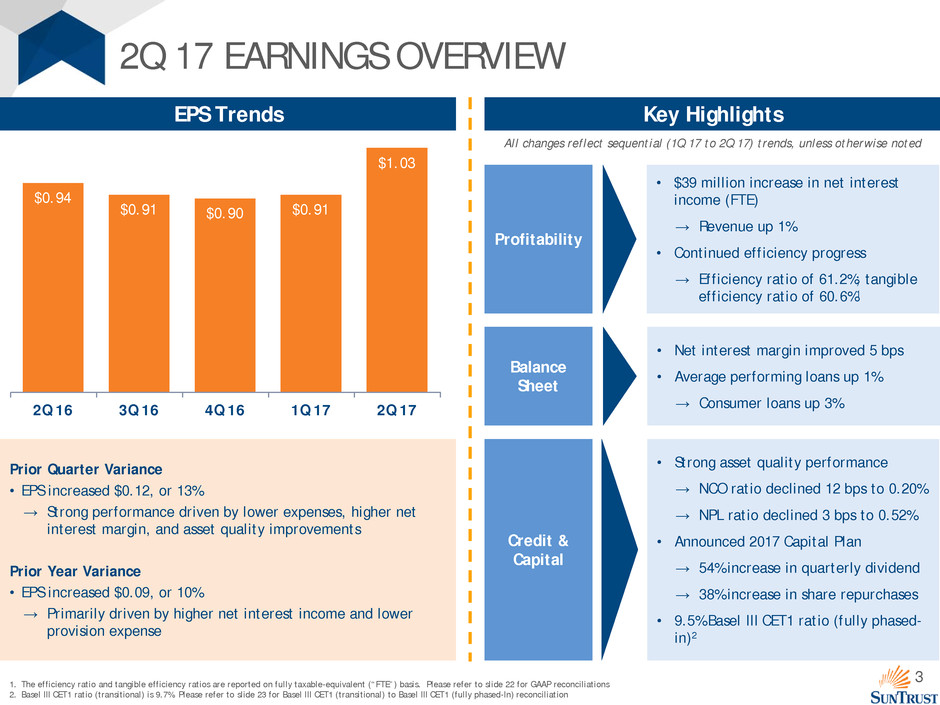
$0.94
$0.91 $0.90 $0.91
$1.03
2Q 16 3Q 16 4Q 16 1Q 17 2Q 17
1. The efficiency ratio and tangible efficiency ratios are reported on fully taxable-equivalent (“FTE”) basis. Please refer to slide 22 for GAAP reconciliations
2. Basel III CET1 ratio (transitional) is 9.7%. Please refer to slide 23 for Basel III CET1 (transitional) to Basel III CET1 (fully phased-In) reconciliation
2Q 17 EARNINGS OVERVIEW
EPS Trends
Profitability
• $39 million increase in net interest
income (FTE)
→ Revenue up 1%
• Continued efficiency progress
→ Efficiency ratio of 61.2%; tangible
efficiency ratio of 60.6%1
Balance
Sheet
• Net interest margin improved 5 bps
• Average performing loans up 1%
→ Consumer loans up 3%
Credit &
Capital
• Strong asset quality performance
→ NCO ratio declined 12 bps to 0.20%
→ NPL ratio declined 3 bps to 0.52%
• Announced 2017 Capital Plan
→ 54% increase in quarterly dividend
→ 38% increase in share repurchases
• 9.5% Basel III CET1 ratio (fully phased-
in)2
Key Highlights
All changes reflect sequential (1Q 17 to 2Q 17) trends, unless otherwise noted
Prior Quarter Variance
• EPS increased $0.12, or 13%
→ Strong performance driven by lower expenses, higher net
interest margin, and asset quality improvements
Prior Year Variance
• EPS increased $0.09, or 10%
→ Primarily driven by higher net interest income and lower
provision expense
4
NET INTEREST INCOME1
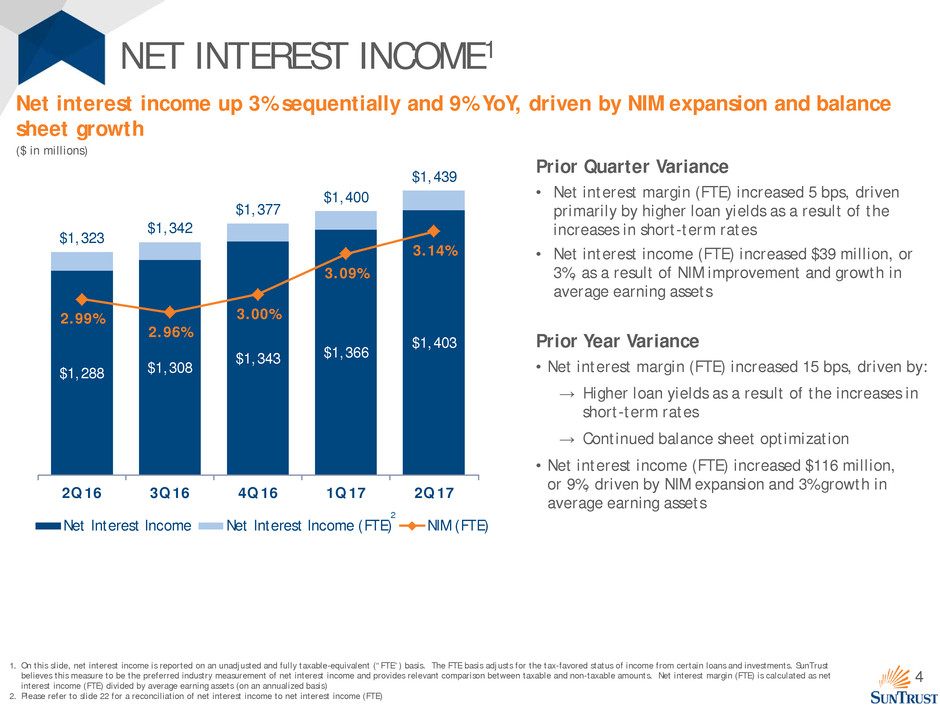
Net interest income up 3% sequentially and 9% YoY, driven by NIM expansion and balance
sheet growth
Prior Quarter Variance
• Net interest margin (FTE) increased 5 bps, driven
primarily by higher loan yields as a result of the
increases in short-term rates
• Net interest income (FTE) increased $39 million, or
3%, as a result of NIM improvement and growth in
average earning assets
Prior Year Variance
• Net interest margin (FTE) increased 15 bps, driven by:
→ Higher loan yields as a result of the increases in
short-term rates
→ Continued balance sheet optimization
• Net interest income (FTE) increased $116 million,
or 9%, driven by NIM expansion and 3% growth in
average earning assets
1. On this slide, net interest income is reported on an unadjusted and fully taxable-equivalent (“FTE”) basis. The FTE basis adjusts for the tax-favored status of income from certain loans and investments. SunTrust
believes this measure to be the preferred industry measurement of net interest income and provides relevant comparison between taxable and non-taxable amounts. Net interest margin (FTE) is calculated as net
interest income (FTE) divided by average earning assets (on an annualized basis)
2. Please refer to slide 22 for a reconciliation of net interest income to net interest income (FTE)
2
$1,288 $1,308
$1,343 $1,366
$1,403
$1,323
$1,342
$1,377
$1,400
$1,439
2.99%
2.96%
3.00%
3.09%
3.14%
2Q 16 3Q 16 4Q 16 1Q 17 2Q 17
Net Interest Income Net Interest Income (FTE) NIM (FTE)
($ in millions)
5
NONINTEREST INCOME
Prior Quarter Variance
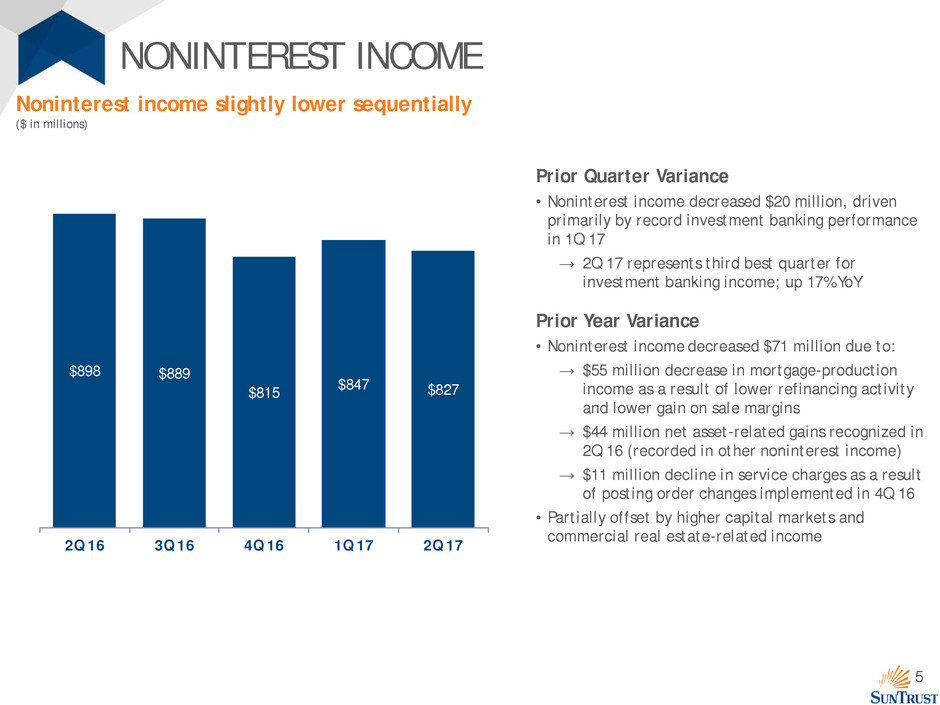
• Noninterest income decreased $20 million, driven
primarily by record investment banking performance
in 1Q 17
→ 2Q 17 represents third best quarter for
investment banking income; up 17% YoY
Prior Year Variance
• Noninterest income decreased $71 million due to:
→ $55 million decrease in mortgage-production
income as a result of lower refinancing activity
and lower gain on sale margins
→ $44 million net asset-related gains recognized in
2Q 16 (recorded in other noninterest income)
→ $11 million decline in service charges as a result
of posting order changes implemented in 4Q 16
• Partially offset by higher capital markets and
commercial real estate-related income
$898 $889
$815 $847 $827
2Q 16 3Q 16 4Q 16 1Q 17 2Q 17
Noninterest income slightly lower sequentially
($ in millions)
6
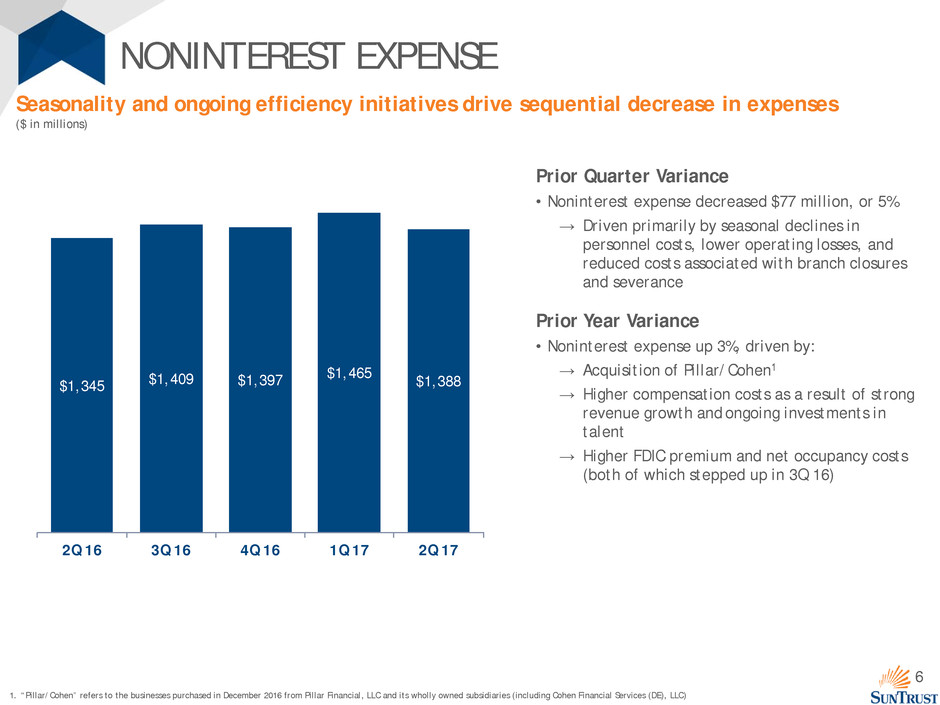
NONINTEREST EXPENSE
Prior Quarter Variance
• Noninterest expense decreased $77 million, or 5%
→ Driven primarily by seasonal declines in
personnel costs, lower operating losses, and
reduced costs associated with branch closures
and severance
Prior Year Variance
• Noninterest expense up 3%, driven by:
→ Acquisition of Pillar/Cohen1
→ Higher compensation costs as a result of strong
revenue growth and ongoing investments in
talent
→ Higher FDIC premium and net occupancy costs
(both of which stepped up in 3Q 16)
$1,345 $1,409 $1,397
$1,465 $1,388
2Q 16 3Q 16 4Q 16 1Q 17 2Q 17
Seasonality and ongoing efficiency initiatives drive sequential decrease in expenses
1. “Pillar/Cohen” refers to the businesses purchased in December 2016 from Pillar Financial, LLC and its wholly owned subsidiaries (including Cohen Financial Services (DE), LLC)
($ in millions)
7
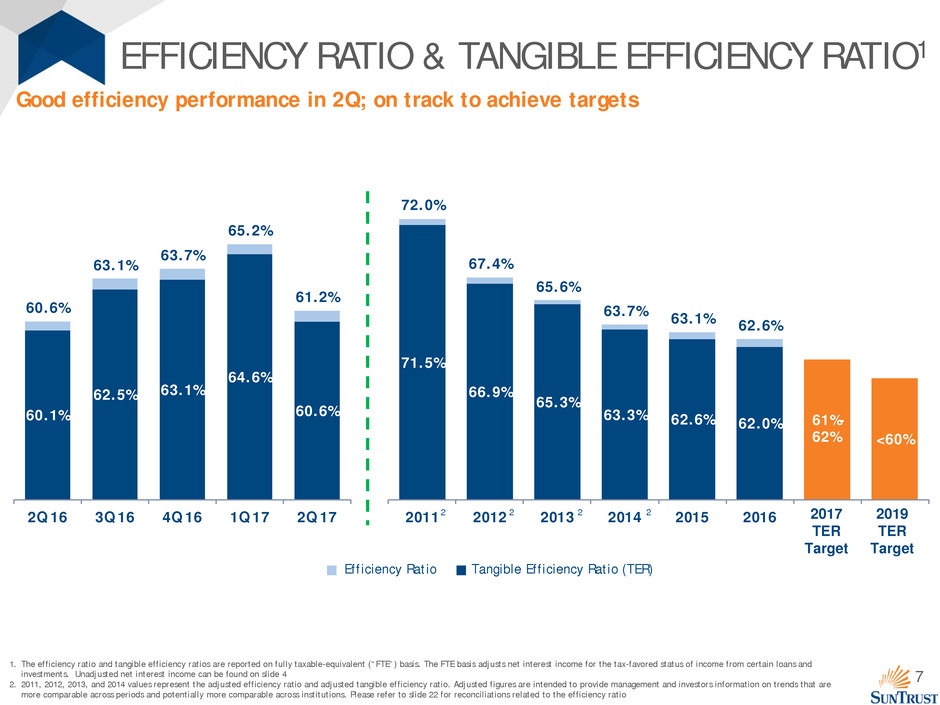
71.5%
66.9%
65.3%
63.3% 62.6% 62.0% 61%-
62% <60%
72.0%
67.4%
65.6%
63.7% 63.1% 62.6%
2011 2012 2013 2014 2015 2016
Good efficiency performance in 2Q; on track to achieve targets
1. The efficiency ratio and tangible efficiency ratios are reported on fully taxable-equivalent (“FTE”) basis. The FTE basis adjusts net interest income for the tax-favored status of income from certain loans and
investments. Unadjusted net interest income can be found on slide 4
2. 2011, 2012, 2013, and 2014 values represent the adjusted efficiency ratio and adjusted tangible efficiency ratio. Adjusted figures are intended to provide management and investors information on trends that are
more comparable across periods and potentially more comparable across institutions. Please refer to slide 22 for reconciliations related to the efficiency ratio
2019
TER
Target
EFFICIENCY RATIO & TANGIBLE EFFICIENCY RATIO1
2 2 2 2 2017
TER
Target
60.1%
62.5% 63.1%
64.6%
60.6%
60.6%
63.1%
63.7%
65.2%
61.2%
2Q 16 3Q 16 4Q 16 1Q 17 2Q 17
Tangible Efficiency Ratio (TER) Efficiency Ratio
8
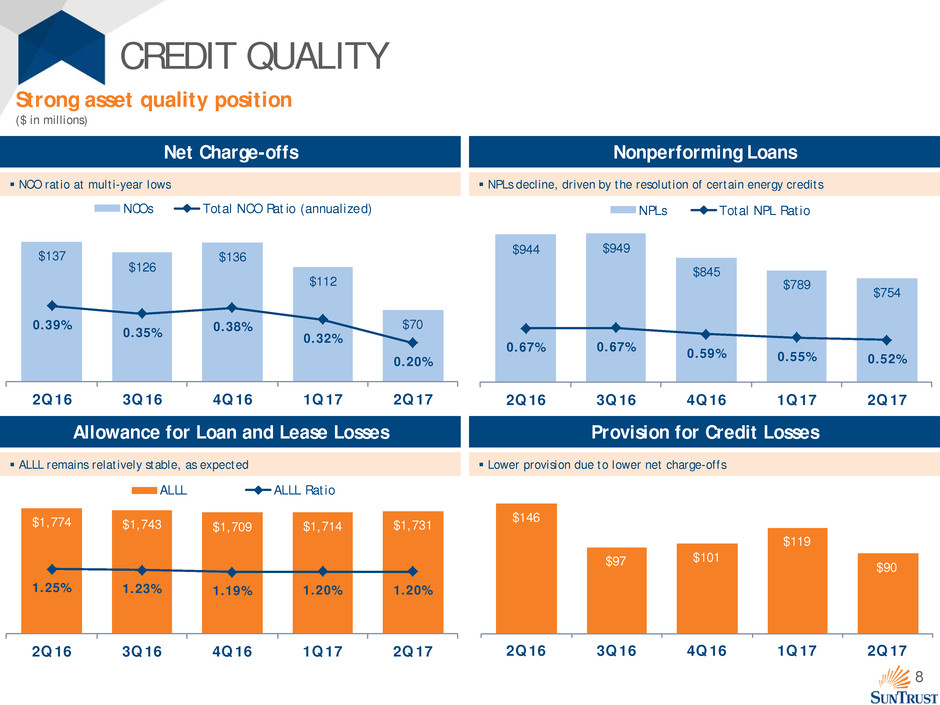
CREDIT QUALITY
ALLL remains relatively stable, as expected
Strong asset quality position
($ in millions)
NPLs decline, driven by the resolution of certain energy credits NCO ratio at multi-year lows
Nonperforming Loans Net Charge-offs
Provision for Credit Losses Allowance for Loan and Lease Losses
$944 $949
$845
$789
$754
0.67% 0.67% 0.59% 0.55% 0.52%
2Q 16 3Q 16 4Q 16 1Q 17 2Q 17
NPLs Total NPL Ratio
$137
$126
$136
$112
$70 0.39% 0.35% 0.38% 0.32%
0.20%
2Q 16 3Q 16 4Q 16 1Q 17 2Q 17
NCOs Total NCO Ratio (annualized)
$146
$97 $101
$119
$90
2Q 16 3Q 16 4Q 16 1Q 17 2Q 17
$1,774 $1,743 $1,709 $1,714 $1,731
1.25% 1.23% 1.19% 1.20% 1.20%
2Q 16 3Q 16 4Q 16 1Q 17 2Q 17
ALLL ALLL Ratio
Lower provision due to lower net charge-offs

9
LOANS
Average performing loans up 1% sequentially
($ in billions, average balances)
Note: Totals may not foot due to rounding
Prior Quarter Variance
• Average performing loans up 1% as a result of growth
in consumer lending
Prior Year Variance
• Average performing loans increased $3.4 billion, or 2%
• Positive mix shift continues, driven by ongoing
investments in LightStream, credit card, and other
consumer lending initiatives
→ Consumer loans up 14%
→ Commercial loans up 1%
$77.6 $77.1 $77.4 $78.2 $78.4
$38.8 $39.0 $38.8 $38.3 $38.1
$23.9 $25.2 $25.5 $26.3 $27.2
$140.3 $141.3 $141.7 $142.8 $143.7
2Q 16 3Q 16 4Q 16 1Q 17 2Q 17
Commercial Residential Consumer
10
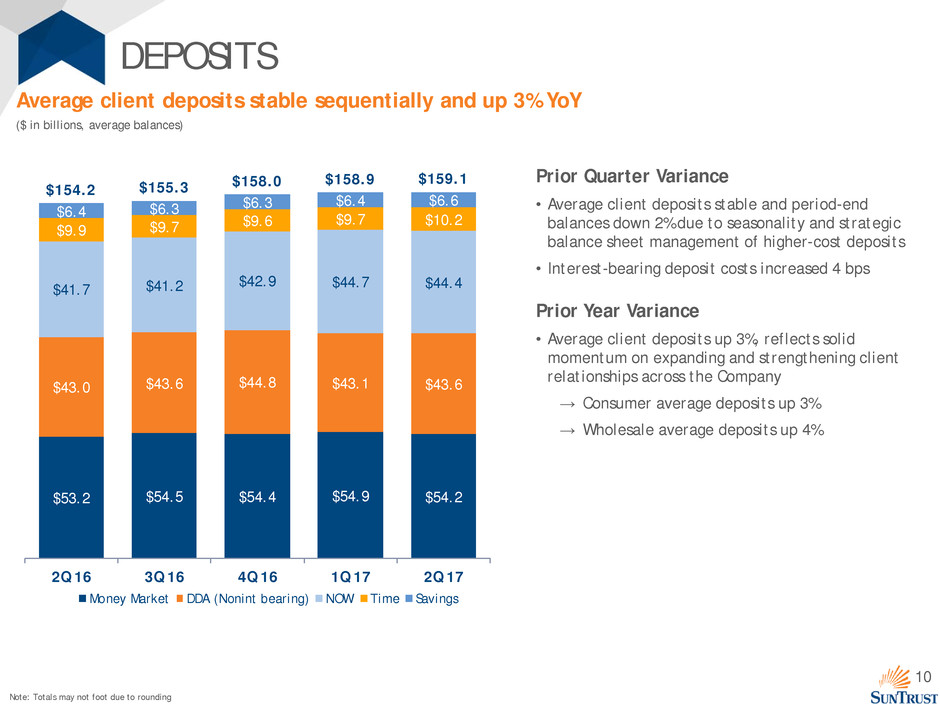
DEPOSITS
Average client deposits stable sequentially and up 3% YoY
($ in billions, average balances)
Prior Quarter Variance
• Average client deposits stable and period-end
balances down 2% due to seasonality and strategic
balance sheet management of higher-cost deposits
• Interest-bearing deposit costs increased 4 bps
Prior Year Variance
• Average client deposits up 3%, reflects solid
momentum on expanding and strengthening client
relationships across the Company
→ Consumer average deposits up 3%
→ Wholesale average deposits up 4%
$53.2 $54.5 $54.4 $54.9 $54.2
$43.0 $43.6 $44.8 $43.1 $43.6
$41.7 $41.2 $42.9 $44.7 $44.4
$9.9 $9.7
$9.6 $9.7 $10.2
$6.4 $6.3 $6.3
$6.4 $6.6
$154.2 $155.3 $158.0
$158.9 $159.1
2Q 16 3Q 16 4Q 16 1Q 17 2Q 17
Money Market DDA (Nonint bearing) NOW Time Savings
Note: Totals may not foot due to rounding
11
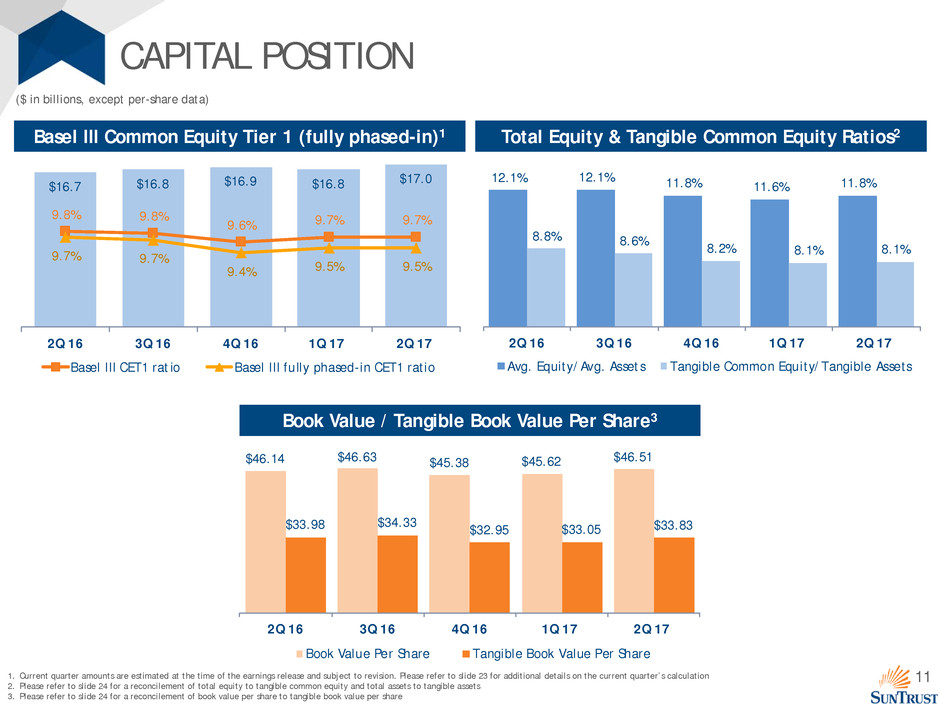
CAPITAL POSITION
($ in billions, except per-share data)
Total Equity & Tangible Common Equity Ratios2 Basel III Common Equity Tier 1 (fully phased-in)1
Book Value / Tangible Book Value Per Share3
1. Current quarter amounts are estimated at the time of the earnings release and subject to revision. Please refer to slide 23 for additional details on the current quarter’s calculation
2. Please refer to slide 24 for a reconcilement of total equity to tangible common equity and total assets to tangible assets
3. Please refer to slide 24 for a reconcilement of book value per share to tangible book value per share
12.1% 12.1% 11.8% 11.6% 11.8%
8.8% 8.6% 8.2% 8.1% 8.1%
2Q 16 3Q 16 4Q 16 1Q 17 2Q 17
Avg. Equity/Avg. Assets Tangible Common Equity/Tangible Assets
$46.14 $46.63 $45.38 $45.62 $46.51
$33.98 $34.33 $32.95 $33.05 $33.83
2Q 16 3Q 16 4Q 16 1Q 17 2Q 17
Book Value Per Share Tangible Book Value Per Share
$16.7 $16.8 $16.9 $16.8
$17.0
9.8% 9.8%
9.6% 9.7% 9.7%
9.7% 9.7%
9.4% 9.5% 9.5%
0
0
0
0
0
0
0
2Q 16 3Q 16 4Q 16 1Q 17 2Q 17
Basel III CET1 ratio Basel III fully phased-in CET1 ratio
12
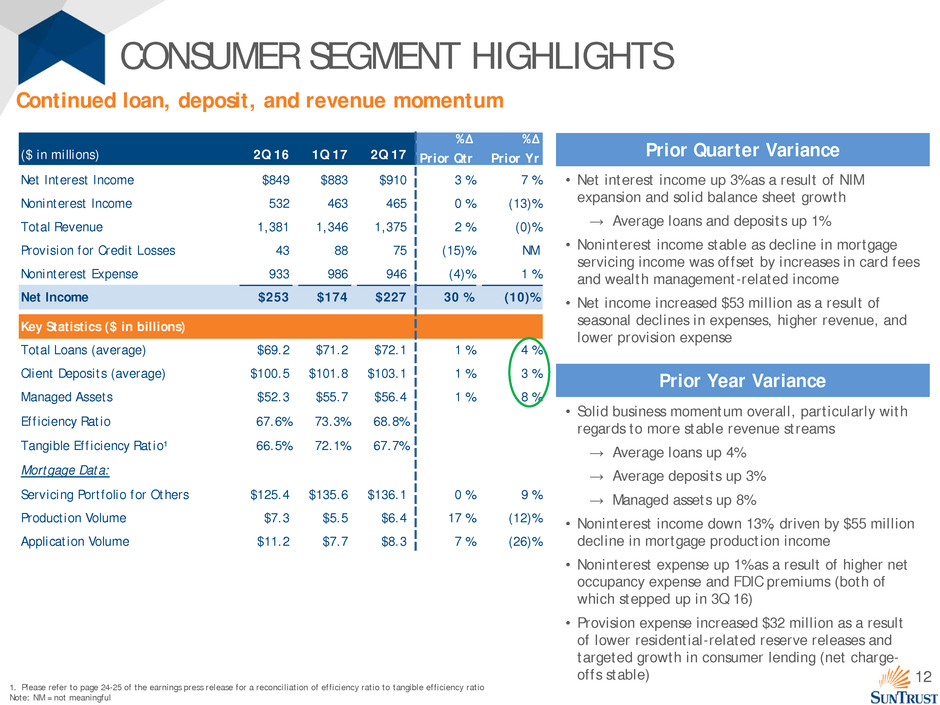
($ in millions) 2Q 16 1Q 17 2Q 17
%Δ
Prior Qtr
%Δ
Prior Yr
Net Interest Income $849 $883 $910 3 % 7 %
Noninterest Income 532 463 465 0 % (13)%
Total Revenue 1,381 1,346 1,375 2 % (0)%
Provision for Credit Losses 43 88 75 (15)% NM
Noninterest Expense 933 986 946 (4)% 1 %
Net Income $253 $174 $227 30 % (10)%
Key Statistics ($ in billions)
Total Loans (average) $69.2 $71.2 $72.1 1 % 4 %
Client Deposits (average) $100.5 $101.8 $103.1 1 % 3 %
Managed Assets $52.3 $55.7 $56.4 1 % 8 %
Efficiency Ratio 67.6% 73.3% 68.8%
Tangible Efficiency Ratio¹ 66.5% 72.1% 67.7%
Mortgage Data:
Servicing Portfolio for Others $125.4 $135.6 $136.1 0 % 9 %
Production Volume $7.3 $5.5 $6.4 17 % (12)%
Application Volume $11.2 $7.7 $8.3 7 % (26)%
CONSUMER SEGMENT HIGHLIGHTS
1. Please refer to page 24-25 of the earnings press release for a reconciliation of efficiency ratio to tangible efficiency ratio
Note: NM = not meaningful
Continued loan, deposit, and revenue momentum
• Net interest income up 3% as a result of NIM
expansion and solid balance sheet growth
→ Average loans and deposits up 1%
• Noninterest income stable as decline in mortgage
servicing income was offset by increases in card fees
and wealth management-related income
• Net income increased $53 million as a result of
seasonal declines in expenses, higher revenue, and
lower provision expense
Prior Quarter Variance
• Solid business momentum overall, particularly with
regards to more stable revenue streams
→ Average loans up 4%
→ Average deposits up 3%
→ Managed assets up 8%
• Noninterest income down 13%, driven by $55 million
decline in mortgage production income
• Noninterest expense up 1% as a result of higher net
occupancy expense and FDIC premiums (both of
which stepped up in 3Q 16)
• Provision expense increased $32 million as a result
of lower residential-related reserve releases and
targeted growth in consumer lending (net charge-
offs stable)
Prior Year Variance
13
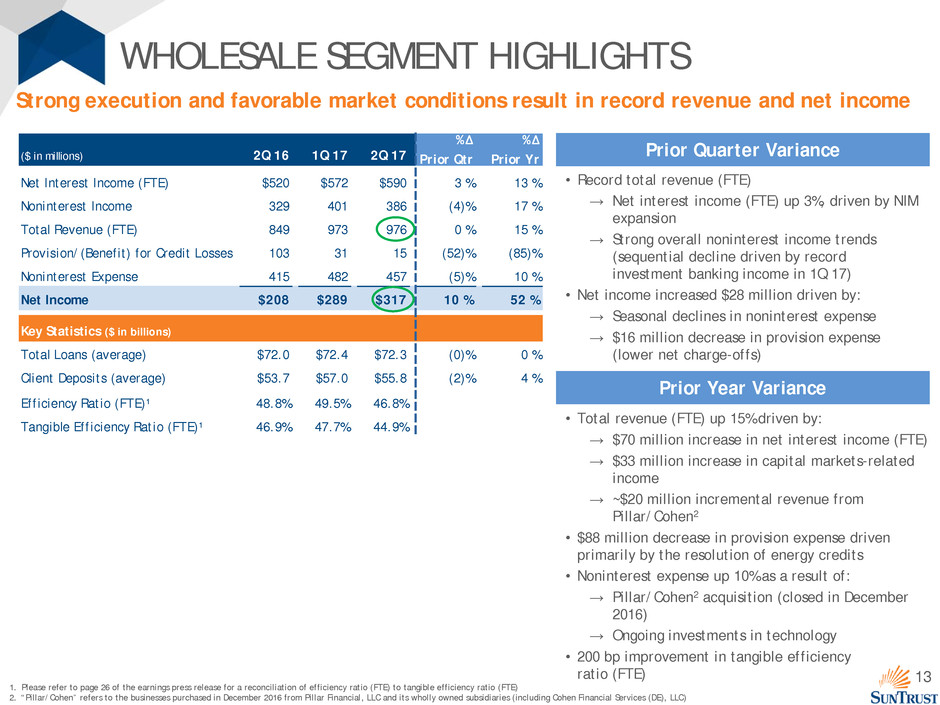
($ in millions) 2Q 16 1Q 17 2Q 17
%Δ
Prior Qtr
%Δ
Prior Yr
Net Interest Income (FTE) $520 $572 $590 3 % 13 %
Noninterest Income 329 401 386 (4)% 17 %
Total Revenue (FTE) 849 973 976 0 % 15 %
Provision/(Benefit) for Credit Losses 103 31 15 (52)% (85)%
Noninterest Expense 415 482 457 (5)% 10 %
Net Income $208 $289 $317 10 % 52 %
Key Statistics ($ in billions)
Total Loans (average) $72.0 $72.4 $72.3 (0)% 0 %
Client Deposits (average) $53.7 $57.0 $55.8 (2)% 4 %
Efficiency Ratio (FTE)¹ 48.8% 49.5% 46.8%
Tangible Efficiency Ratio (FTE)¹ 46.9% 47.7% 44.9%
WHOLESALE SEGMENT HIGHLIGHTS
1. Please refer to page 26 of the earnings press release for a reconciliation of efficiency ratio (FTE) to tangible efficiency ratio (FTE)
2. “Pillar/Cohen” refers to the businesses purchased in December 2016 from Pillar Financial, LLC and its wholly owned subsidiaries (including Cohen Financial Services (DE), LLC)
Strong execution and favorable market conditions result in record revenue and net income
• Record total revenue (FTE)
→ Net interest income (FTE) up 3%, driven by NIM
expansion
→ Strong overall noninterest income trends
(sequential decline driven by record
investment banking income in 1Q 17)
• Net income increased $28 million driven by:
→ Seasonal declines in noninterest expense
→ $16 million decrease in provision expense
(lower net charge-offs)
Prior Quarter Variance
• Total revenue (FTE) up 15% driven by:
→ $70 million increase in net interest income (FTE)
→ $33 million increase in capital markets-related
income
→ ~$20 million incremental revenue from
Pillar/Cohen2
• $88 million decrease in provision expense driven
primarily by the resolution of energy credits
• Noninterest expense up 10% as a result of:
→ Pillar/Cohen2 acquisition (closed in December
2016)
→ Ongoing investments in technology
• 200 bp improvement in tangible efficiency
ratio (FTE)
Prior Year Variance
14
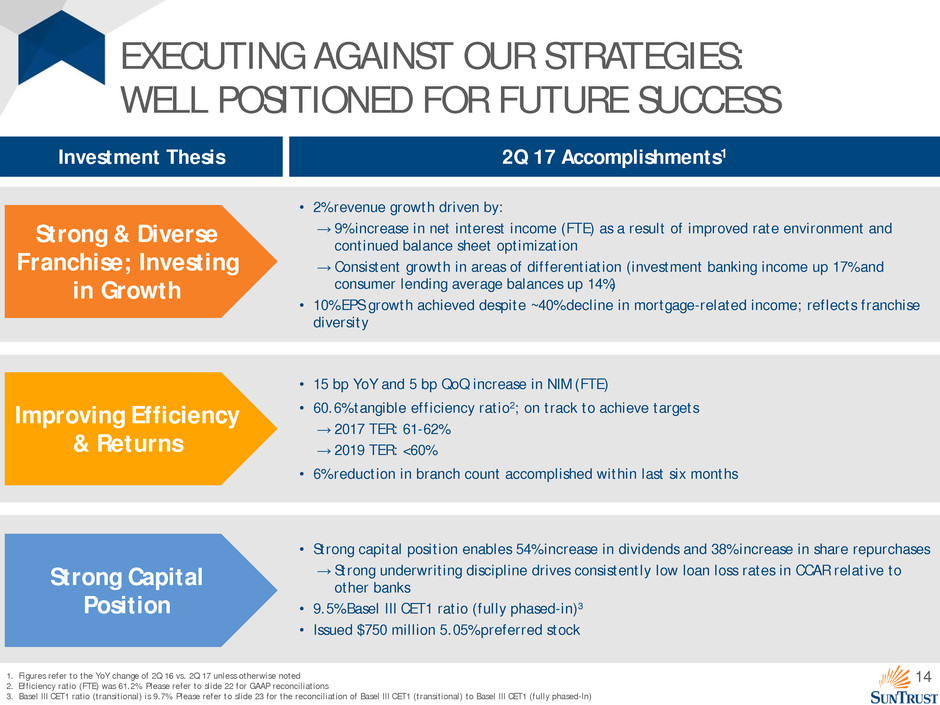
EXECUTING AGAINST OUR STRATEGIES:
WELL POSITIONED FOR FUTURE SUCCESS
• 15 bp YoY and 5 bp QoQ increase in NIM (FTE)
• 60.6% tangible efficiency ratio2; on track to achieve targets
→ 2017 TER: 61-62%
→ 2019 TER: <60%
• 6% reduction in branch count accomplished within last six months
Improving Efficiency
& Returns
• Strong capital position enables 54% increase in dividends and 38% increase in share repurchases
→ Strong underwriting discipline drives consistently low loan loss rates in CCAR relative to
other banks
• 9.5% Basel III CET1 ratio (fully phased-in)3
• Issued $750 million 5.05% preferred stock
Strong Capital
Position
Investment Thesis
Strong & Diverse
Franchise; Investing
in Growth
• 2% revenue growth driven by:
→ 9% increase in net interest income (FTE) as a result of improved rate environment and
continued balance sheet optimization
→ Consistent growth in areas of differentiation (investment banking income up 17% and
consumer lending average balances up 14%)
• 10% EPS growth achieved despite ~40% decline in mortgage-related income; reflects franchise
diversity
2Q 17 Accomplishments1
1. Figures refer to the YoY change of 2Q 16 vs. 2Q 17 unless otherwise noted
2. Efficiency ratio (FTE) was 61.2%. Please refer to slide 22 for GAAP reconciliations
3. Basel III CET1 ratio (transitional) is 9.7%. Please refer to slide 23 for the reconciliation of Basel III CET1 (transitional) to Basel III CET1 (fully phased-In)

APPENDIX
16
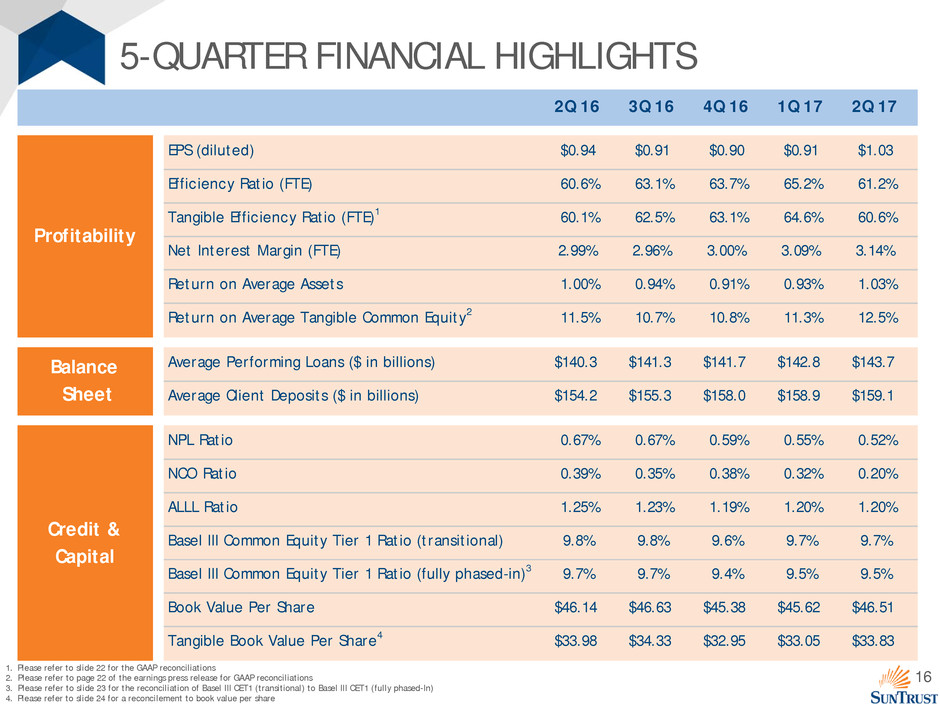
5-QUARTER FINANCIAL HIGHLIGHTS
1. Please refer to slide 22 for the GAAP reconciliations
2. Please refer to page 22 of the earnings press release for GAAP reconciliations
3. Please refer to slide 23 for the reconciliation of Basel III CET1 (transitional) to Basel III CET1 (fully phased-In)
4. Please refer to slide 24 for a reconcilement to book value per share
2Q 16 3Q 16 4Q 16 1Q 17 2Q 17
EPS (diluted) $0.94 $0.91 $0.90 $0.91 $1.03
Efficiency Ratio (FTE) 60.6% 63.1% 63.7% 65.2% 61.2%
Tangible Efficiency Ratio (FTE)1 60.1% 62.5% 63.1% 64.6% 60.6%
Net Interest Margin (FTE) 2.99% 2.96% 3.00% 3.09% 3.14%
Return on Average Assets 1.00% 0.94% 0.91% 0.93% 1.03%
Return on Average Tangible Common Equity2 11.5% 10.7% 10.8% 11.3% 12.5%
Average Performing Loans ($ in billions) $140.3 $141.3 $141.7 $142.8 $143.7
Average Client Deposits ($ in billions) $154.2 $155.3 $158.0 $158.9 $159.1
NPL Ratio 0.67% 0.67% 0.59% 0.55% 0.52%
NCO Ratio 0.39% 0.35% 0.38% 0.32% 0.20%
ALLL Ratio 1.25% 1.23% 1.19% 1.20% 1.20%
Basel III Common Equity Tier 1 Ratio (transitional) 9.8% 9.8% 9.6% 9.7% 9.7%
Basel III Common Equity Tier 1 Ratio (fully phased-in)3 9.7% 9.7% 9.4% 9.5% 9.5%
Book Value Per Share $46.14 $46.63 $45.38 $45.62 $46.51
Tangible Book Value Per Share4 $33.98 $34.33 $32.95 $33.05 $33.83
Balance
Sheet
Credit &
Capital
Profitability

17
MORTGAGE SERVICING INCOME:
SUPPLEMENTAL INFORMATION
1. Includes contractually specified servicing fees, late charges, interest curtailment expense, and other ancillary revenues
2. Due primarily to the receipt of monthly servicing fees and from prepayments
3. Includes both the fair value mark-to-market of the MSR asset from changes in market rates and other assumption updates, exclusive of the decay, and the impact of using derivatives to hedge the risk of changes in
the fair value of the MSR asset
Note: Totals may not foot due to rounding
($ in millions)
2Q 16 3Q 16 4Q 16 1Q 17 2Q 17
Servicing Fees1 $91 $93 $93 $100 $100
($55) ($60) ($69) ($50) ($57)
Net MSR Fair Value and Hedge Activity3 $15 $16 $1 $7 $1
Mortgage Servicing Income $52 $49 $25 $58 $44
Memo:
Total Loans Serviced for Others (average balance) $123,629 $124,729 $126,765 $134,444 $136,376
Annualized Servicing Fees / Average Loans Serviced for Others (bps) 30 30 29 30 30
Changes in MSR Value from Collection/Realization of Cash Flow (Decay)2
18
Memo:
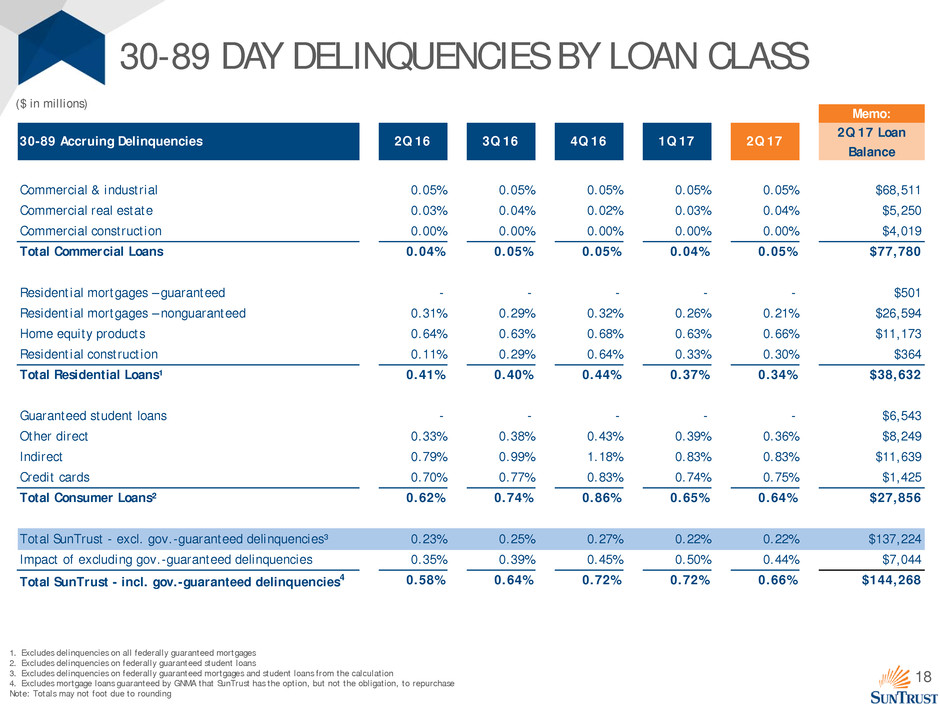
30-89 Accruing Delinquencies 2Q 16 3Q 16 4Q 16 1Q 17 2Q 17
2Q 17 Loan
Balance
Commercial & industrial 0.05% 0.05% 0.05% 0.05% 0.05% $68,511
Commercial real estate 0.03% 0.04% 0.02% 0.03% 0.04% $5,250
Commercial construction 0.00% 0.00% 0.00% 0.00% 0.00% $4,019
Total Commercial Loans 0.04% 0.05% 0.05% 0.04% 0.05% $77,780
Residential mortgages – guaranteed - - - - - $501
Residential mortgages – nonguaranteed 0.31% 0.29% 0.32% 0.26% 0.21% $26,594
Home equity products 0.64% 0.63% 0.68% 0.63% 0.66% $11,173
Residential construction 0.11% 0.29% 0.64% 0.33% 0.30% $364
Total Residential Loans¹ 0.41% 0.40% 0.44% 0.37% 0.34% $38,632
Guaranteed student loans - - - - - $6,543
Other direct 0.33% 0.38% 0.43% 0.39% 0.36% $8,249
Indirect 0.79% 0.99% 1.18% 0.83% 0.83% $11,639
Credit cards 0.70% 0.77% 0.83% 0.74% 0.75% $1,425
Total Consumer Loans² 0.62% 0.74% 0.86% 0.65% 0.64% $27,856
Total SunTrust - excl. gov.-guaranteed delinquencies³ 0.23% 0.25% 0.27% 0.22% 0.22% $137,224
Impact of excluding gov.-guaranteed delinquencies 0.35% 0.39% 0.45% 0.50% 0.44% $7,044
Total SunTrust - incl. gov.-guaranteed delinquencies4 0.58% 0.64% 0.72% 0.72% 0.66% $144,268
30-89 DAY DELINQUENCIES BY LOAN CLASS
1. Excludes delinquencies on all federally guaranteed mortgages
2. Excludes delinquencies on federally guaranteed student loans
3. Excludes delinquencies on federally guaranteed mortgages and student loans from the calculation
4. Excludes mortgage loans guaranteed by GNMA that SunTrust has the option, but not the obligation, to repurchase
Note: Totals may not foot due to rounding
($ in millions)
19
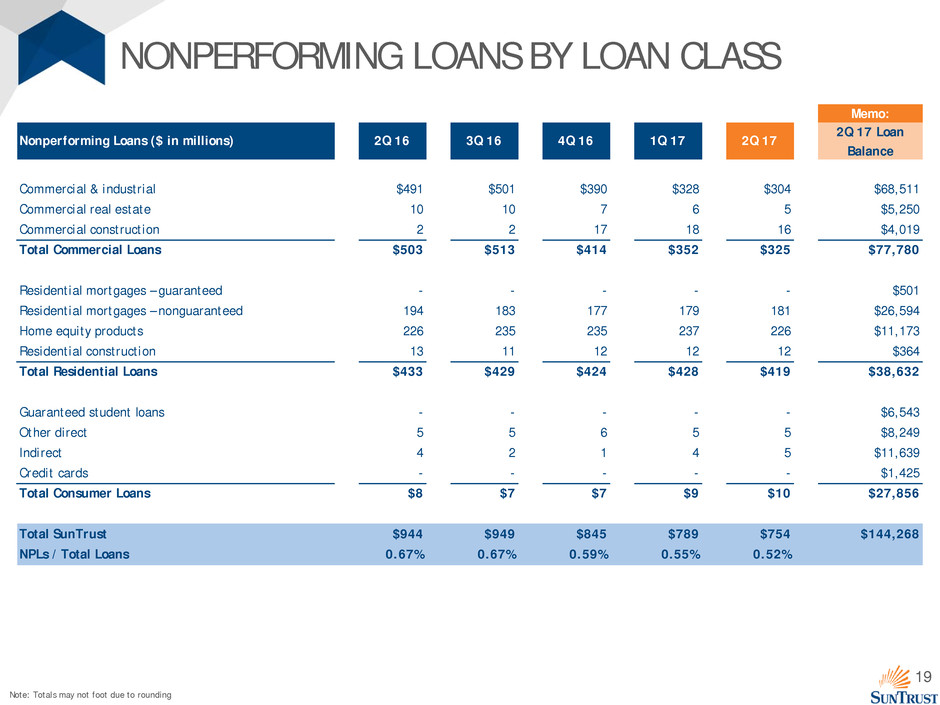
NONPERFORMING LOANS BY LOAN CLASS
Note: Totals may not foot due to rounding
Memo:
Nonperforming Loans ($ in millions) 2Q 16 3Q 16 4Q 16 1Q 17 2Q 17
2Q 17 Loan
Balance
Commercial & industrial $491 $501 $390 $328 $304 $68,511
Commercial real estate 10 10 7 6 5 $5,250
Commercial construction 2 2 17 18 16 $4,019
Total Commercial Loans $503 $513 $414 $352 $325 $77,780
Residential mortgages – guaranteed - - - - - $501
Residential mortgages – nonguaranteed 194 183 177 179 181 $26,594
Home equity products 226 235 235 237 226 $11,173
Residential construction 13 11 12 12 12 $364
Total Residential Loans $433 $429 $424 $428 $419 $38,632
Guaranteed student loans - - - - - $6,543
Other direct 5 5 6 5 5 $8,249
Indirect 4 2 1 4 5 $11,639
Credit cards - - - - - $1,425
Total Consumer Loans $8 $7 $7 $9 $10 $27,856
Total SunTrust $944 $949 $845 $789 $754 $144,268
NPLs / Total Loans 0.67% 0.67% 0.59% 0.55% 0.52%

20
NET CHARGE-OFF RATIOS BY LOAN CLASS
Note: Totals may not foot due to rounding
Memo:
Net Charge-off Ratio (annualized) 2Q 16 3Q 16 4Q 16 1Q 17 2Q 17
2Q 17 Loan
Balance
Commercial & industrial 0.52 % 0.41 % 0.35 % 0.29 % 0.10 % $68,511
Commercial real estate (0.01)% 0.01 % (0.01)% (0.02)% 0.00 % $5,250
Commercial construction (0.00)% (0.01)% 0.88 % (0.02)% 0.10 % $4,019
Total Commercial Loans 0.46 % 0.37 % 0.35 % 0.26 % 0.10 % $77,780
Residential mortgages – guaranteed - - - - - $501
Residential mortgages – nonguaranteed 0.20 % 0.17 % 0.23 % 0.17 % 0.14 % $26,594
Home equity products 0.36 % 0.31 % 0.37 % 0.35 % 0.20 % $11,173
Residential construction 0.07 % 0.11 % (0.50)% (0.34)% 0.84 % $364
Total Residential Loans 0.24 % 0.21 % 0.26 % 0.22 % 0.16 % $38,632
Guaranteed student loans - - - - - $6,543
Other direct 0.45 % 0.51 % 0.61 % 0.61 % 0.70 % $8,249
Indirect 0.34 % 0.62 % 0.81 % 0.78 % 0.45 % $11,639
Credit cards 2.48 % 2.20 % 2.32 % 2.61 % 2.77 % $1,425
Total Consumer Loans 0.39 % 0.52 % 0.64 % 0.64 % 0.54 % $27,856
Total SunTrust 0.39 % 0.35 % 0.38 % 0.32 % 0.20 % $144,268
($ in millions)

21
NET CHARGE-OFFS BY LOAN CLASS
Note: Totals may not foot due to rounding
Memo:
Net Charge-offs ($ in millions) 2Q 16 3Q 16 4Q 16 1Q 17 2Q 17
2Q 17 Loan
Balance
Commercial & industrial $90 $71 $60 $50 $18 $68,511
Commercial real estate 0 - - 0 - $5,250
Commercial construction - - 9 - 1 $4,019
Total Commercial Loans $90 $71 $69 $50 $19 $77,780
Residential mortgages – guaranteed - - - - - $501
Residential mortgages – nonguaranteed 12 11 15 10 9 $26,594
Home equity products 11 10 11 10 5 $11,173
Residential construction - - - - 1 $364
Total Residential Loans $24 $21 $26 $20 $15 $38,632
Guaranteed student loans - - - - - $6,543
Other direct 7 9 12 12 14 $8,249
Indirect 9 17 21 21 13 $11,639
Credit cards 7 7 8 9 9 $1,425
Total Consumer Loans $23 $34 $41 $42 $36 $27,856
Total SunTrust $137 $126 $136 $112 $70 $144,268
22
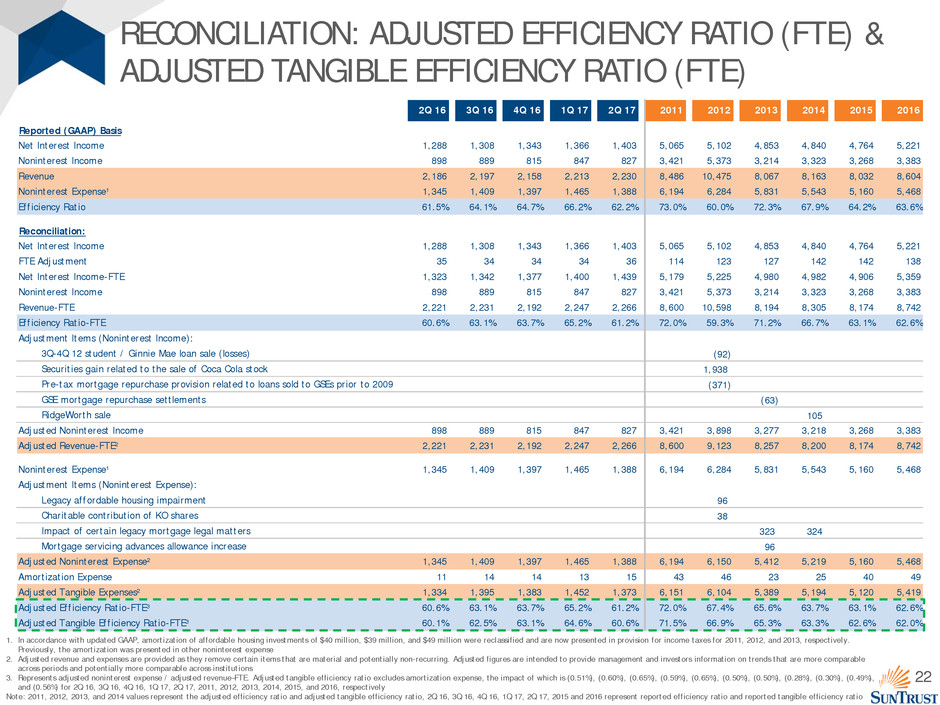
2Q 16 3Q 16 4Q 16 1Q 17 2Q 17 2011 2012 2013 2014 2015 2016
Reported (GAAP) Basis
Net Interest Income 1,288 1,308 1,343 1,366 1,403 5,065 5,102 4,853 4,840 4,764 5,221
Noninterest Income 898 889 815 847 827 3,421 5,373 3,214 3,323 3,268 3,383
Revenue 2,186 2,197 2,158 2,213 2,230 8,486 10,475 8,067 8,163 8,032 8,604
Noninterest Expense¹ 1,345 1,409 1,397 1,465 1,388 6,194 6,284 5,831 5,543 5,160 5,468
Efficiency Ratio 61.5% 64.1% 64.7% 66.2% 62.2% 73.0% 60.0% 72.3% 67.9% 64.2% 63.6%
Reconciliation:
Net Interest Income 1,288 1,308 1,343 1,366 1,403 5,065 5,102 4,853 4,840 4,764 5,221
FTE Adjustment 35 34 34 34 36 114 123 127 142 142 138
Net Interest Income-FTE 1,323 1,342 1,377 1,400 1,439 5,179 5,225 4,980 4,982 4,906 5,359
Noninterest Income 898 889 815 847 827 3,421 5,373 3,214 3,323 3,268 3,383
Revenue-FTE 2,221 2,231 2,192 2,247 2,266 8,600 10,598 8,194 8,305 8,174 8,742
Efficiency Ratio-FTE 60.6% 63.1% 63.7% 65.2% 61.2% 72.0% 59.3% 71.2% 66.7% 63.1% 62.6%
Adjustment Items (Noninterest Income):
3Q-4Q 12 student / Ginnie Mae loan sale (losses) (92)
Securities gain related to the sale of Coca Cola stock 1,938
Pre-tax mortgage repurchase provision related to loans sold to GSEs prior to 2009 (371)
GSE mortgage repurchase settlements (63)
RidgeWorth sale 105
Adjusted Noninterest Income 898 889 815 847 827 3,421 3,898 3,277 3,218 3,268 3,383
Adjusted Revenue-FTE² 2,221 2,231 2,192 2,247 2,266 8,600 9,123 8,257 8,200 8,174 8,742
Noninterest Expense¹ 1,345 1,409 1,397 1,465 1,388 6,194 6,284 5,831 5,543 5,160 5,468
Adjustment Items (Noninterest Expense):
Legacy affordable housing impairment 96
Charitable contribution of KO shares 38
Impact of certain legacy mortgage legal matters 323 324
Mortgage servicing advances allowance increase 96
Adjusted Noninterest Expense² 1,345 1,409 1,397 1,465 1,388 6,194 6,150 5,412 5,219 5,160 5,468
Amortization Expense 11 14 14 13 15 43 46 23 25 40 49
Adjusted Tangible Expenses² 1,334 1,395 1,383 1,452 1,373 6,151 6,104 5,389 5,194 5,120 5,419
Adjusted Efficiency Ratio-FTE³ 60.6% 63.1% 63.7% 65.2% 61.2% 72.0% 67.4% 65.6% 63.7% 63.1% 62.6%
Adjusted Tangible Efficiency Ratio-FTE³ 60.1% 62.5% 63.1% 64.6% 60.6% 71.5% 66.9% 65.3% 63.3% 62.6% 62.0%
RECONCILIATION: ADJUSTED EFFICIENCY RATIO (FTE) &
ADJUSTED TANGIBLE EFFICIENCY RATIO (FTE)
1. In accordance with updated GAAP, amortization of affordable housing investments of $40 million, $39 million, and $49 million were reclassified and are now presented in provision for income taxes for 2011, 2012, and 2013, respectively.
Previously, the amortization was presented in other noninterest expense
2. Adjusted revenue and expenses are provided as they remove certain items that are material and potentially non-recurring. Adjusted figures are intended to provide management and investors information on trends that are more comparable
across periods and potentially more comparable across institutions
3. Represents adjusted noninterest expense / adjusted revenue–FTE. Adjusted tangible efficiency ratio excludes amortization expense, the impact of which is (0.51%), (0.60%), (0.65%), (0.59%), (0.65%), (0.50%), (0.50%), (0.28%), (0.30%), (0.49%),
and (0.56%) for 2Q 16, 3Q 16, 4Q 16, 1Q 17, 2Q 17, 2011, 2012, 2013, 2014, 2015, and 2016, respectively
Note: 2011, 2012, 2013, and 2014 values represent the adjusted efficiency ratio and adjusted tangible efficiency ratio, 2Q 16, 3Q 16, 4Q 16, 1Q 17, 2Q 17, 2015 and 2016 represent reported efficiency ratio and reported tangible efficiency ratio
23
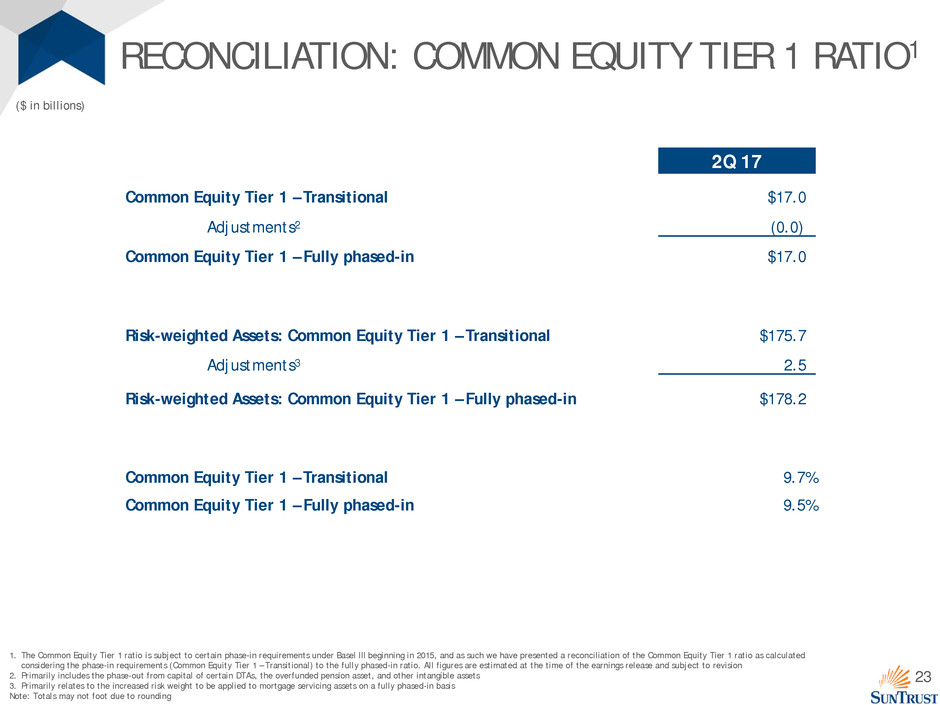
RECONCILIATION: COMMON EQUITY TIER 1 RATIO1
1. The Common Equity Tier 1 ratio is subject to certain phase-in requirements under Basel III beginning in 2015, and as such we have presented a reconciliation of the Common Equity Tier 1 ratio as calculated
considering the phase-in requirements (Common Equity Tier 1 – Transitional) to the fully phased-in ratio. All figures are estimated at the time of the earnings release and subject to revision
2. Primarily includes the phase-out from capital of certain DTAs, the overfunded pension asset, and other intangible assets
3. Primarily relates to the increased risk weight to be applied to mortgage servicing assets on a fully phased-in basis
Note: Totals may not foot due to rounding
2Q 17
Common Equity Tier 1 – Transitional $17.0
Adjustments2 (0.0)
Common Equity Tier 1 – Fully phased-in $17.0
Risk-weighted Assets: Common Equity Tier 1 – Transitional $175.7
Adjustments3 2.5
Risk-weighted Assets: Common Equity Tier 1 – Fully phased-in $178.2
Common Equity Tier 1 – Transitional 9.7%
Common Equity Tier 1 – Fully phased-in 9.5%
($ in billions)

24
RECONCILIATION: NON-GAAP MEASURES
Note: Totals may not foot due to rounding
2Q 16 3Q 16 4Q 16 1Q 17 2Q 17
Total Shareholders' Equity $24.5 $24.4 $23.6 $23.5 $24.5
Goodwill, Net of Deferred Taxes (6.1) (6.1) (6.1) (6.1) (6.1)
Other Intangible Assets Including MSRs, Net of Deferred Taxes (1.1) (1.1) (1.7) (1.7) (1.7)
MSRs 1.1 1.1 1.6 1.7 1.7
Tangible Equity $18.4 $18.4 $17.5 $17.4 $18.4
Noncontrolling Interest (0.1) (0.1) (0.1) (0.1) (0.1)
Preferred Stock (1.2) (1.2) (1.2) (1.2) (2.0)
Tangible Common Equity $17.0 $17.0 $16.2 $16.1 $16.3
Total Assets 198.9 205.1 204.9 205.6 207.2
Goodwill (6.3) (6.3) (6.3) (6.3) (6.3)
Other Intangible Assets Including MSRs, Net of Deferred Taxes (1.1) (1.1) (1.7) (1.7) (1.7)
MSRs 1.1 1.1 1.6 1.7 1.7
Tangible Assets $192.5 $198.7 $198.5 $199.3 $200.9
Average Equity / Average Assets 12.1% 12.1% 11.8% 11.6% 11.8%
Total Equity / Total Assets 12.3% 11.9% 11.5% 11.4% 11.8%
Tangible Equity / Tangible Assets 9.5% 9.2% 8.8% 8.7% 9.1%
Tangible Common Equity / Tangible Assets 8.8% 8.6% 8.2% 8.1% 8.1%
Book Value Per Common Share $46.14 $46.63 $45.38 $45.62 $46.51
Tangible Book Value Per Common Share $33.98 $34.33 $32.95 $33.05 $33.83
($ in billions, except per-share data)
