Attached files
| file | filename |
|---|---|
| EX-99.1 - TMUS EXHIBIT 99.1 - T-Mobile US, Inc. | tmus06302017ex991.htm |
| 8-K - TMUS FORM 8-K - T-Mobile US, Inc. | tmus06302017form8-k.htm |
EXHIBIT 99.2

1
T-Mobile US, Inc. | ||
Investor Factbook | ||
T-Mobile US Reports Second Quarter 2017 Results | ||
T-Mobile Delivers Record Results in Q2 2017,
Un-carrier Performing at Peak Levels Across the Board
Record Service Revenues, Strong Net Income, Record Adjusted EBITDA
1.3 Million Customer Net Additions, and Record-Low Churn of 1.10%
Customer Growth Expected to Lead the Industry:
•1.3 million total net additions - 17 straight quarters of adding more than 1 million
•817,000 total branded postpaid net additions - expect to lead industry for the 6th consecutive quarter
•786,000 branded postpaid phone net additions - expect to capture over 100% of industry growth
• | Record-low branded postpaid phone churn of 1.10% - down 17 bps YoY and 8 bps QoQ |
Financial Growth also Expected to Top the Competition (all percentages year-over-year):
• | $7.4 billion service revenues, up 8% - record-high, expect to lead industry in growth for 13th quarter in a row |
• | $10.2 billion total revenues, up 10% - expect to lead the industry in growth for 16th time in last 17 quarters |
• | Strong net income of $581 million, up 158%. Diluted earnings per share ("EPS") of $0.67, up 168% |
• | Record Adjusted EBITDA of $3.0 billion, up 19%(1) |
• | Net cash provided by operating activities of $1.8 billion. Free cash flow of $482 million(1) |
Strong Network and Distribution Expansion:
• | 315 million Americans covered by T-Mobile's network today and targeting 321 million by the end of 2017 |
• | 14 quarters in a row with the fastest download and upload speeds - widening the gap versus the competition |
• | 700 MHz deployment essentially complete, live in 575 market areas covering 271 million people |
• | 600 MHz deployment underway, more than 1.2 million sq mi to be cleared in 2017, first sites lighting up in August |
• | 3,000 total new stores planned for 2017, with 1,000 T-Mobile and 1,100 MetroPCS stores opened year-to-date |
Continued strong outlook for 2017:
• | Increasing guidance range for branded postpaid net customer additions to 3.0 - 3.6 million from 2.8 - 3.5 million |
• | Net income is not available on a forward looking basis(2) |
• | Increasing Adjusted EBITDA target to $10.5 - $10.9 billion from $10.4 - $10.8 billion, which includes leasing revenues of $0.85 - $0.95 billion(1), an increase from $0.8 - $0.9 billion |
• | Maintaining guidance of $4.8 - $5.1 billion of cash purchases of property and equipment, excluding capitalized interest; expect to be at the high end of our guidance range |
• | Three-year compound annual growth rates (CAGRs) for net cash provided by operating activities and free cash flow from FY 2016 to FY 2019 remain unchanged at 15% - 18% and 45% - 48%, respectively(1) |
________________________________________________________________
(1) | Adjusted EBITDA is a non-GAAP financial measure and Free Cash Flow is a non-GAAP financial metric. These non-GAAP financial items should be considered in addition to, but not as a substitute for, the information provided in accordance with GAAP. Reconciliations for these non-GAAP financial items to the most directly comparable GAAP financial items are provided in the financial tables on pages 26 - 34. |
(2) | T-Mobile is not able to forecast net income on a forward looking basis without unreasonable efforts due to the high variability and difficulty in predicting certain items that affect GAAP net income including, but not limited to, income tax expense, stock based compensation expense and interest expense. Adjusted EBITDA should not be used to predict net income as the difference between the two measures is variable. |
2
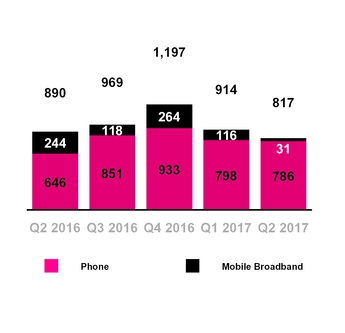
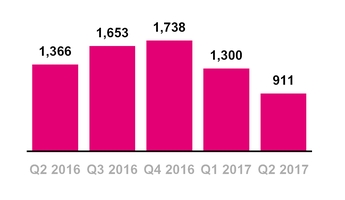
Total Branded Postpaid Net Additions
(in thousands)
CUSTOMER METRICS
Branded Postpaid Customers
▪ | Branded postpaid phone net customer additions were 786,000 in Q2 2017 compared to 798,000 in Q1 2017 and 646,000 in Q2 2016. This is expected to mark the 14th consecutive quarter that T-Mobile has led the industry in branded postpaid phone net customer additions. |
▪ | Sequentially, branded postpaid phone net customer additions were essentially flat as seasonally lower gross customer additions were largely offset by lower churn and the successful launch of DIGITS. |
▪ | The year-over-year increase was primarily due to a strong response to our Un-carrier initiatives and promotional activities, including the successful launch of DIGITS and the growing success of our business channel, @Work, and lower churn, partially offset by an increased competitive environment. |
▪ | On September 1, 2016, T-Mobile sold its marketing and distribution rights to certain existing T-Mobile co-branded customers to a current MVNO partner (the "MVNO Transaction"). The MVNO Transaction resulted in a re-categorization of 1.365 million branded postpaid phone customers and 326,000 branded prepaid customers to wholesale customers in Q3 2016. |
▪ | Branded postpaid mobile broadband net customer additions were 31,000 in Q2 2017, compared to 116,000 in Q1 2017 and 244,000 in Q2 2016. |
▪ | The sequential decrease was primarily due to seasonally lower gross customer additions and T-Mobile's choice not to pursue promotional tablet offers. |
▪ | The year-over-year decrease was primarily due to T-Mobile's choice not to pursue promotional tablet offers and higher deactivations resulting from churn on a growing customer base, partially offset by higher gross customer additions from the launch of SyncUP DRIVETM. |
▪ | Branded postpaid net customer additions were 817,000 in Q2 2017 compared to 914,000 in Q1 2017 and 890,000 in Q2 2016. This is expected to mark the 6th consecutive quarter that T-Mobile has led the industry in branded postpaid net customer additions. The sequential and year-over-year declines were primarily due to a lower level of branded postpaid mobile broadband net customer additions in Q2 2017. The year-over-year decline in mobile broadband net additions was partially offset by an increase in branded postpaid phone net additions. |
3
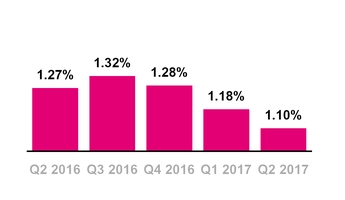
Branded Postpaid Phone Churn
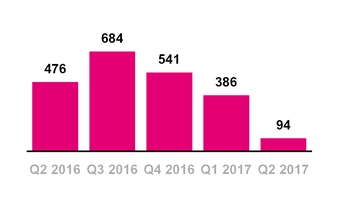
Total Branded Prepaid Net Additions
(in thousands)
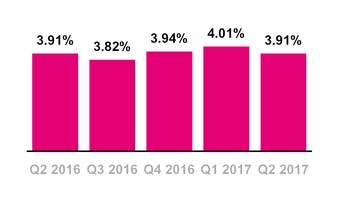
Branded Prepaid Churn
▪ | Branded postpaid phone churn was a record-low 1.10% in Q2 2017, down 8 basis points from 1.18% in Q1 2017 and down 17 basis points from 1.27% in Q2 2016. |
▪ | The sequential decrease in branded postpaid phone churn was primarily due to increased customer satisfaction and loyalty from ongoing improvements to network quality, customer service, and the overall value of our offerings in the marketplace. |
▪ | The year-over-year decrease in branded postpaid phone churn was primarily due to the MVNO Transaction, as the customers transferred had a higher rate of churn as well as increased customer satisfaction and loyalty. |
Branded Prepaid Customers
▪ | Branded prepaid net customer additions were 94,000 in Q2 2017, compared to 386,000 in Q1 2017 and 476,000 in Q2 2016. MetroPCS continues to perform strongly, but we chose not to respond to irrational offers from some of our competitors during the second quarter of 2017. |
▪ | The sequential decrease was primarily due to lower gross additions from increased competitive activity in the marketplace and seasonal fluctuations, partially offset by lower churn. |
▪ | The year-over-year decrease was primarily driven by lower gross additions from increased competitive activity in the marketplace and higher deactivations from a growing customer base. |
▪ | Migrations to branded postpaid plans reduced branded prepaid net customer additions in Q2 2017 by approximately 170,000, down from 185,000 in Q1 2017 and 210,000 in Q2 2016. |
▪ | Branded prepaid churn was 3.91% in Q2 2017, compared to 4.01% in Q1 2017 and 3.91% in Q2 2016. |
▪ | The sequential decrease was due to the optimization of our third-party distribution channels and a decrease in certain customers, which have a higher rate of branded prepaid churn, offset by increased competitive activity. |
4
Total Branded Net Additions
(in thousands)
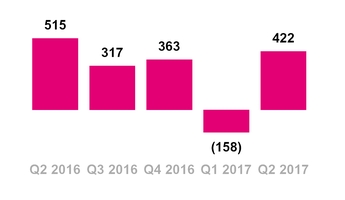
Wholesale Net Additions
(in thousands)
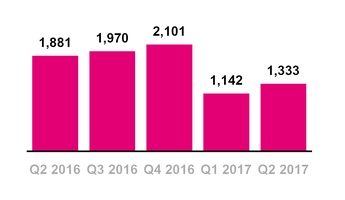
Total Net Additions
(in thousands)
Total Branded Customers
▪ | Total branded net customer additions were 911,000 in Q2 2017, compared to 1,300,000 in Q1 2017 and 1,366,000 in Q2 2016. |
Wholesale Customers
▪ | Wholesale net customer additions were 422,000 in Q2 2017 compared to net losses of 158,000 in Q1 2017 and net additions of 515,000 in Q2 2016. |
▪ | We believe current and future regulatory changes have made the Lifeline program offered by our wholesale partners uneconomical. We will continue to support our wholesale partners offering the Lifeline program, but have excluded the Lifeline customers from our reported wholesale subscriber base, resulting in the removal of 4.4 million reported wholesale customers as of the beginning of Q2 2017 (the "Lifeline Adjustment"). |
▪ | Sequentially, the increase was primarily due to lower customer deactivations, partially offset by lower gross customer additions. |
▪ | Year-over-year, the decrease was primarily due to lower customer gross additions, partially offset by lower customer deactivations. |
Total Customers
▪ | Total net customer additions were 1,333,000 in Q2 2017 compared to 1,142,000 in Q1 2017 and 1,881,000 in Q2 2016. This was the 17th consecutive quarter in which T-Mobile has added more than one million total net customers. |
▪ | T-Mobile ended Q2 2017 with 69.6 million total customers. The sequential decline in total customers was due to the Lifeline Adjustment, offset by net customer additions. |
5
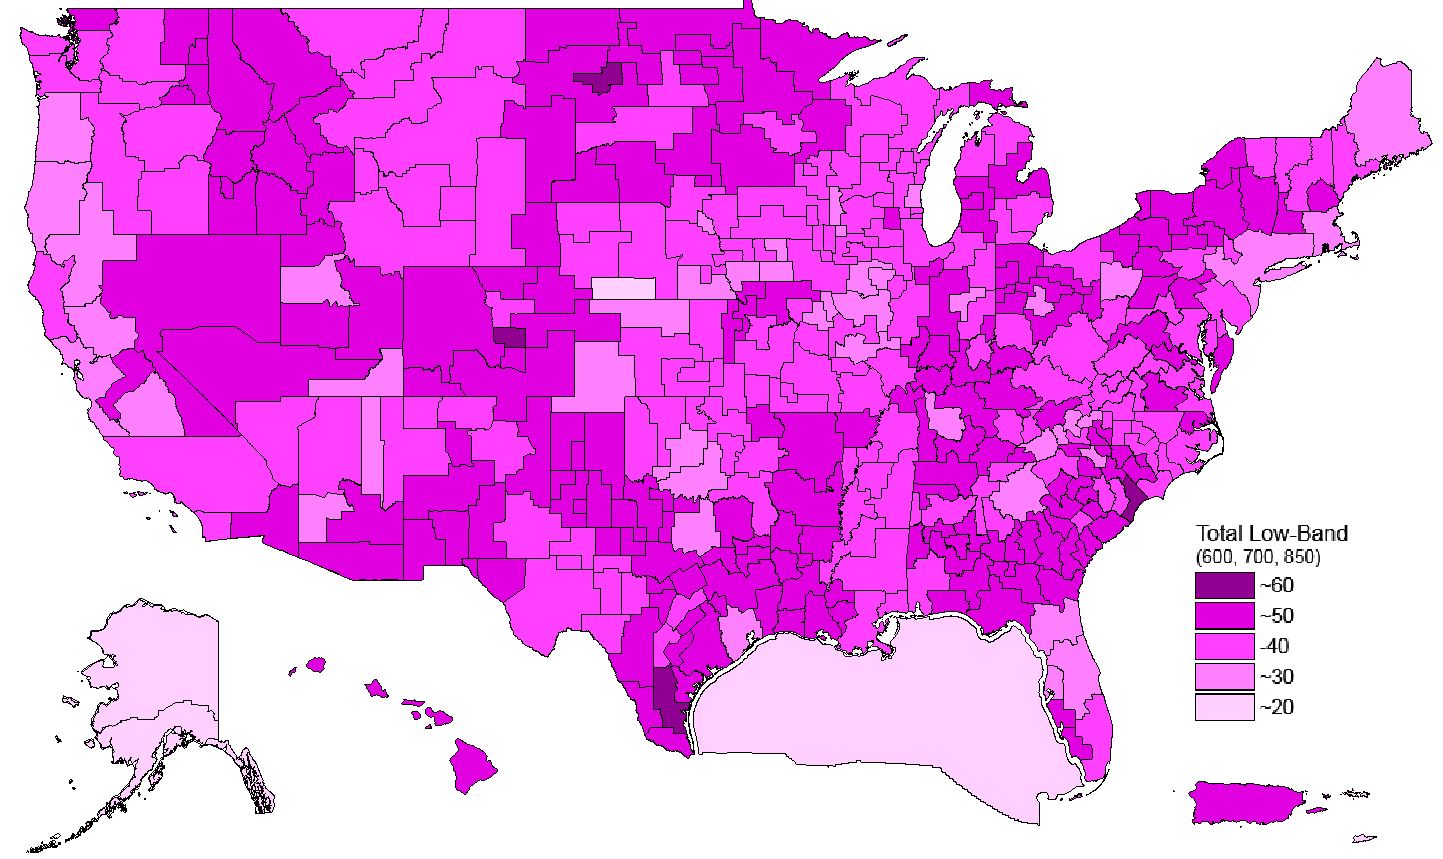
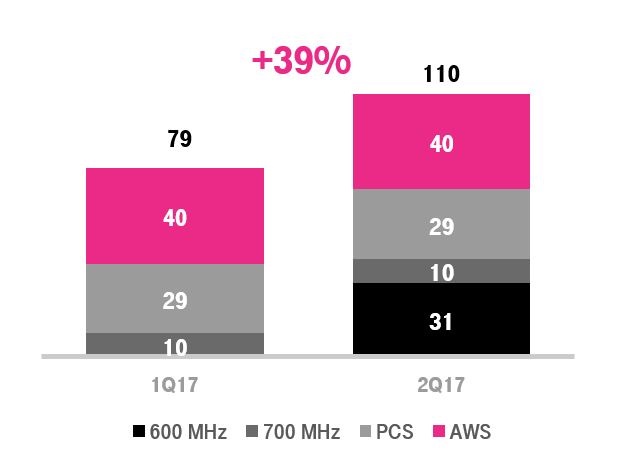
Depth of T-Mobile's Nationwide Low-Band Spectrum (600 MHz and 700 MHz)
T-Mobile Average Spectrum Ownership,
All Markets
(Band, in MHz)
NETWORK
▪ | T-Mobile continues to increase the depth, breadth and functionality of "America's Best Unlimited Network" by adding new spectrum, re-farming existing spectrum, and implementing new technology. Collectively, these network advancements are providing improved network performance and reliability for T-Mobile's customers. |
Broadcast Incentive Auction Update
▪ | On April 13, 2017, the FCC announced the results of the broadcast incentive auction which showed that T-Mobile purchased a nationwide average of 31 MHz of 600 MHz low-band spectrum covering 325 million POPs for $8.0 billion. T-Mobile now owns approximately 41 MHz in the low-band (600 MHz and 700 MHz), quadrupling its pre-auction low-band holdings. The purchased spectrum covers 100% of the U.S. |
▪ | T-Mobile expects that at least 10 MHz of 600 MHz spectrum covering over 1.2 million square miles will be clear and available for deployment in 2017. Deployment activities are already underway and spectrum will be in use as early as August 2017. |
▪ | T-Mobile has actively engaged with broadcasters to accelerate FCC clearance timelines and recently concluded a deal with the Public Broadcasting System ("PBS") to help cover the costs of the relocation process. |
▪ | 600 MHz compatible handsets will arrive in time for the 2017 Holiday season from both Samsung and LG. |
▪ | A portion of our 600 MHz spectrum holdings will be used to deploy America's first nationwide 5G network in 2019/2020. |
Spectrum Growth
▪ | At the end of Q2 2017, T-Mobile owned an average of 110 MHz of spectrum nationwide, an increase of 39% in spectrum holdings compared to the end of Q1 2017. The spectrum is comprised of an average of 31 MHz in the 600 MHz band, 10 MHz in the 700 MHz band, 29 MHz in the 1900 MHz PCS band and 40 MHz in the AWS band. |
6
T-Mobile Projected Coverage Map
(as of December 31, 2017)
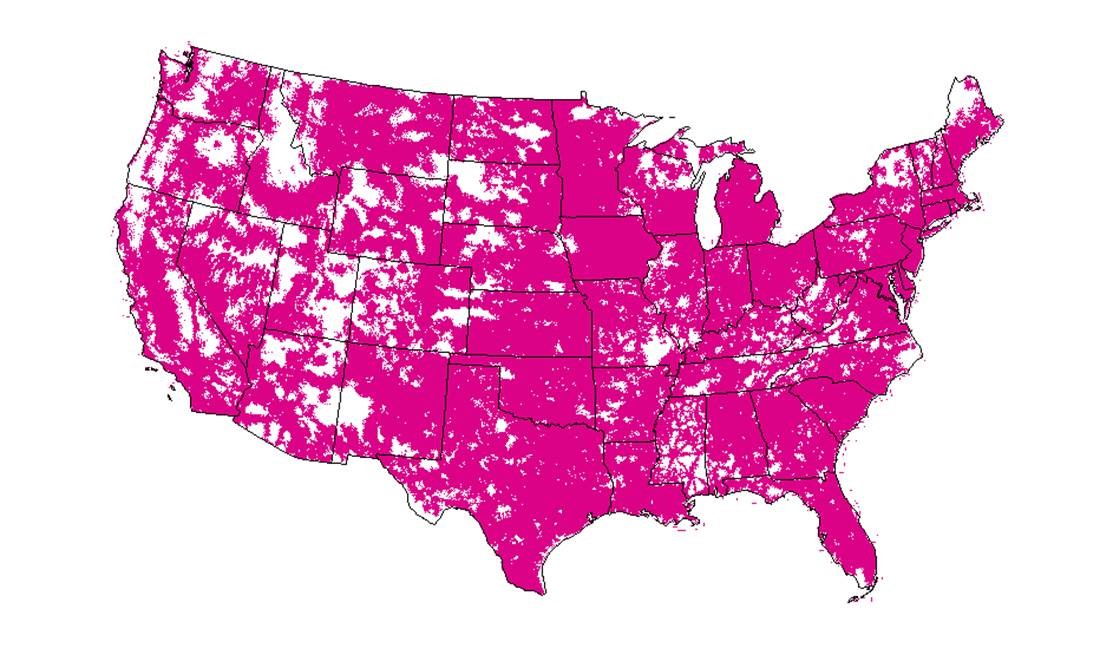
LTE Availability
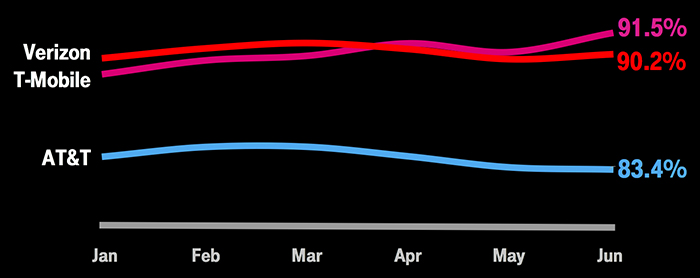
Based on T-Mobile's analysis of independent third party crowd-sourced data. Only those exceeding 84% anytime in 2017 represented. Sorry Sprint.
LTE Download Speeds
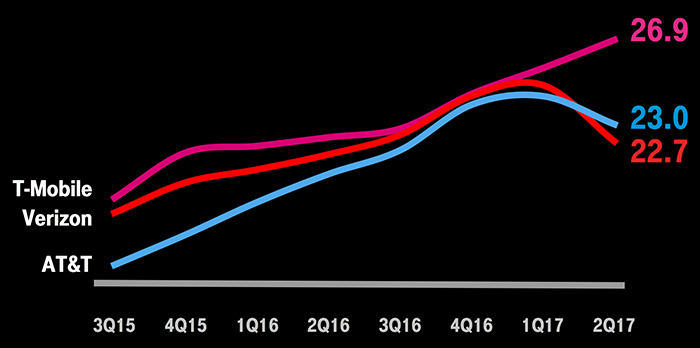
Based on T-Mobile’s analysis of national LTE results from Ookla® Speedtest data. Only speeds greater than 20 Mbps shown. Sorry Sprint.
Network Coverage Growth
▪ | T-Mobile continues to expand its coverage breadth and now provides 4G LTE coverage to 315 million people. |
▪ | We are targeting to provide 321 million people with 4G LTE coverage by year-end 2017. |
▪ | T-Mobile has 700 MHz A-Block spectrum holdings covering 272 million people or approximately 84% of the U.S. population. The spectrum covers all of the top 10 market areas and 29 of the top 30 market areas in the U.S. |
▪ | T-Mobile has substantially completed the deployment of its 700 MHz A-Block spectrum. "Extended Range LTE" is now live in 575 market areas covering 271 million people. |
▪ | In an analysis of independent third party network performance tests, T-Mobile ranked first in LTE availability, meaning our customers get an LTE signal more often than customers of any other national provider. |
Network Speed Leadership
▪ | T-Mobile continues to have the fastest nationwide 4G LTE network in the U.S. based on both download and upload speeds from millions of user-generated tests. This is the 14th consecutive quarter that T-Mobile has led the industry in both download and upload speeds. T-Mobile's network is built for unlimited and is "America's Best Unlimited Network". During Q2 2017, our network continued to get faster while the Duopoly's networks slowed after the full introduction of their unlimited offerings. |
▪ | In Q2 2017, T-Mobile’s average 4G LTE download speed was 26.9 Mbps compared to AT&T at 23.0 Mbps, Verizon at 22.7 Mbps and Sprint at 19.2 Mbps. |
▪ | In Q2 2017, T-Mobile's average 4G LTE upload speed was 11.9 Mbps compared to Verizon at 8.5 Mbps, AT&T at 7.3 Mbps and Sprint at 4.8 Mbps. |
7
Network Capacity Growth
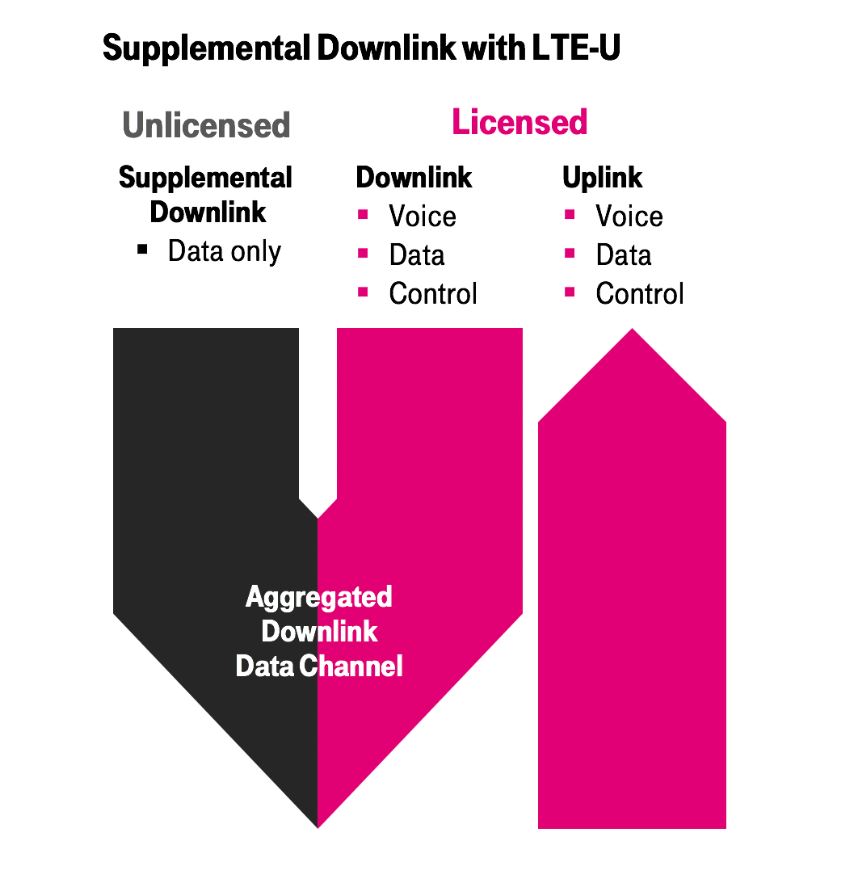
▪ | T-Mobile continues to expand its capacity through the re-farming of existing spectrum and implementation of new technologies including Voice over LTE ("VoLTE"), Carrier Aggregation, 4x4 MIMO, 256 Quadrature Amplitude Modulation ("QAM"), and LTE Unlicensed ("LTE-U"). |
▪ | VoLTE currently comprises approximately 72% of total voice calls in Q2 2017 compared to 70% in Q1 2017 and 57% in Q2 2016. Moving voice traffic to VoLTE frees up spectrum and allows for the transition of spectrum currently used for 2G and 3G to 4G LTE. T-Mobile is leading the U.S. wireless industry in the rate of VoLTE adoption. |
▪ | Carrier aggregation is live for T-Mobile customers in nearly 800 cities. This advanced technology delivers superior speed and performance by bonding two or three discrete spectrum channels together. |
▪ | 4x4 MIMO is currently available in more than 436 cities. This technology effectively delivers twice the speed, and incremental network capacity, to customers by doubling the number of data paths between the cell site and a customer's device. |
▪ | T-Mobile has rolled out 256 QAM, which increases the number of bits delivered per transmission to enable faster speed. T-Mobile is the only carrier to have rolled out the combination of carrier aggregation, 4x4 MIMO, and 256 QAM, maximizing customer speeds with capable handsets. |
▪ | In Q2 2017, T-Mobile became the first national wireless provider to make LTE-U available to customers. LTE-U uses publicly available 5 GHz airwaves to bolster existing LTE capacity and download speeds. LTE-U is currently live in multiple cities, and T-Mobile will expand the deployment through the coming year. |
8
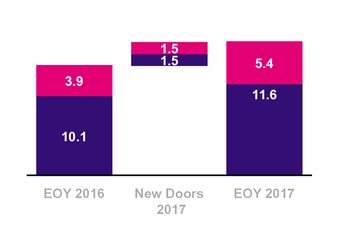
Retail Footprint - # of doors
(in thousands)
DISTRIBUTION
▪ | T-Mobile’s network expansion provides a unique opportunity to grow our distribution footprint by 30 to 40 million POPs by year-end 2017, bringing our total distribution footprint to 260 to 270 million people. |
▪ | To reach that target, we plan to open 3,000 stores in 2017, including 1,500 T-Mobile stores and 1,500 MetroPCS stores. |
▪ | We have opened more than 1,000 T-Mobile stores as of July, which is 2.5x the number of stores opened in 2016. This brings the current T-Mobile store count to approximately 5,000. At MetroPCS, we have opened more than 1,100 stores as of July, bringing the current store count to 11,100. Combined, we expect to have nearly 17,000 stores across the T-Mobile and MetroPCS brands by year-end 2017. |
▪ | Many of these store additions are in geographic areas where T-Mobile had not previously competed. In 2017, we have opened T-Mobile stores in over 400 cities and towns where we had not previously had a retail presence. |
▪ | We intend to bring the Un-carrier to every coverable inch of the United States, bringing real choice and competition to all wireless consumers including rural America. |
Devices Sold or Leased | ||||||
(in million units) | ||||||
Q2 2016 | Q1 2017 | Q2 2017 | ||||
Total Company | ||||||
Phones | 8.4 | 8.6 | 8.3 | |||
Mobile broadband devices | 0.5 | 0.4 | 0.3 | |||
Total Company | 8.9 | 9.0 | 8.6 | |||
DEVICES
▪ | Total devices sold or leased were 8.6 million units in Q2 2017, compared to 9.0 million units in Q1 2017 and 8.9 million units in Q2 2016. |
▪ | Total phones (smartphones and non-smartphones) sold or leased were 8.3 million units in Q2 2017 compared to 8.6 million units in Q1 2017 and 8.4 million units in Q2 2016. |
▪ | The upgrade rate for branded postpaid customers was approximately 7%, flat compared to Q1 2017 and up slightly from approximately 6% in Q2 2016. |
9
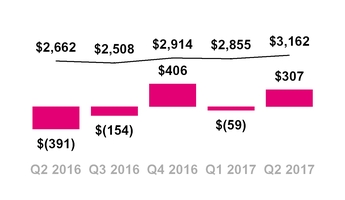
Total EIP Receivables, net and QoQ
Change in Total EIP Receivables
($ in millions)
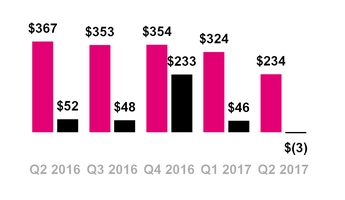
Leased Devices Transferred to P&E,
net and Lease Revenues
($ in millions)
DEVICE FINANCING
Equipment Installment Plans (EIP)
▪ | T-Mobile provided $1.657 billion in gross EIP device financing to its customers in Q2 2017, up 23.7% from $1.339 billion in Q1 2017 and up 6.1% from $1.562 billion in Q2 2016. |
▪ | Customers on T-Mobile plans had associated EIP billings of $1.402 billion in Q2 2017, flat compared to $1.402 billion in Q1 2017 and up 4.3% from $1.344 billion in Q2 2016. |
▪ | Total EIP receivables, net of imputed discount and allowances for credit losses, were $3.162 billion at the end of Q2 2017, compared to $2.855 billion at the end of Q1 2017 and $2.662 billion at the end of Q2 2016. |
▪ | The sequential increase was primarily due to growth in EIP device financing as higher device prices related to an iconic device launch more than offset lower unit volumes. The increase was also due to customers on leased devices reaching the end of lease term and financing their devices over nine-month EIP. |
▪ | The year-over-year increase was primarily due to growth in the gross amount of equipment financed on EIP, partially offset by an increase in EIP billings. The increase was also due to customers on leased devices reaching the end of lease term and financing their devices over nine-month EIP. |
Leasing Plans
▪ | Leased devices transferred to property and equipment from inventory, net was $(3) million in Q2 2017 compared to $46 million in Q1 2017 and $52 million in Q2 2016. |
▪ | The sequential and year-over-year decrease was primarily due to more customers returning their leased devices compared to new lease initiations primarily from the impact of an emphasis on EIP financing and certain customers reaching the end of their lease. |
▪ | Leased devices transferred from inventory to property and equipment was $270 million and Leased devices transferred from property and equipment to inventory was $273 million in Q2 2017. |
10
▪ | Depreciation expense associated with leased devices was $268 million in Q2 2017 compared to $379 million in Q1 2017 and $397 million in Q2 2016. The sequential and year-over-year decreases are due to a lower number of devices under lease. |
▪ | Leased devices included in property and equipment, net were $828 million at the end of Q2 2017, compared to $1.097 billion at the end of Q1 2017 and $1.878 billion at the end of Q2 2016. |
▪ | Lease revenues were $234 million in Q2 2017, compared to $324 million in Q1 2017 and $367 million in Q2 2016. |
▪ | Future minimum lease payments expected to be received were $508 million at the end of Q2 2017, down from $599 million at the end of Q1 2017 and down from $1.178 billion at the end of Q2 2016. Future minimum lease payments exclude optional residual buy-out amounts at the end of the lease term. |
Total Bad Debt Expense and Losses from Sales of Receivables
($ in millions, % of Total Revs (1))
(1) | The amortized imputed discount on EIP receivables previously recognized as Interest income has been retrospectively reclassified as Other revenues. See Effect of Change in Accounting Principle table for further detail. |
CUSTOMER QUALITY
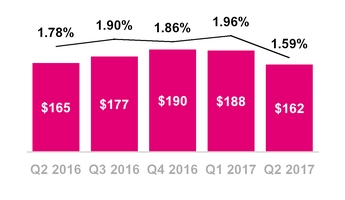
▪ | Total bad debt expense and losses from sales of receivables was $162 million in Q2 2017, compared to $188 million in Q1 2017 and $165 million in Q2 2016. |
▪ | As a percentage of total revenues, total bad debt expense and losses from sales of receivables was a record 1.59% in Q2 2017, compared to 1.96% in Q1 2017 and 1.78% in Q2 2016. |
▪ | Sequentially, total bad debt expense and losses from sales of receivables decreased by $26 million. As a percentage of total revenues, bad debt expense and losses from sales of receivables decreased 37 basis points sequentially, reflecting our ongoing focus on managing customer quality. |
▪ | Year-over-year, total bad debt expense and losses from sales of receivables decreased by $3 million. As a percentage of total revenues, bad debt expense and losses from sales of receivables decreased 19 basis points, reflecting our ongoing focus on managing customer quality. |
▪ | Including the EIP receivables sold, total EIP receivables classified as Prime were 52% of total EIP receivables at the end of Q2 2017, down compared to 53% at the end of Q1 2017 and 53% at the end of Q2 2016. Excluding the receivables sold, EIP receivables classified as Prime were 43% at the end of Q2 2017, flat compared to 43% at the end of Q1 2017 and up compared to 42% at the end of Q2 2016. |
11
Branded Postpaid Phone ARPU
($ per month)
Branded Postpaid ABPU
($ per month)
OPERATING METRICS
Branded Postpaid Phone ARPU
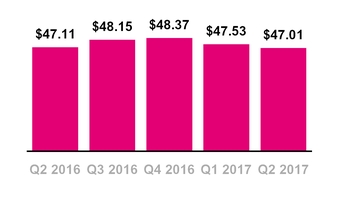
▪ | Branded postpaid phone ARPU was $47.01 in Q2 2017, down 1.1% from $47.53 in Q1 2017 and down 0.2% from $47.11 in Q2 2016. |
▪ | Sequentially, positive impacts from T-Mobile ONE rate plans were more than offset by decreases in taxes and fee revenue from the adoption of Un-carrier Next and promotional activity, including the successful launch of DIGITS. |
▪ | Year-over-year, branded postpaid phone ARPU was essentially flat as the adoption of T-Mobile ONE including taxes and fees and dilution from promotional activities, including the successful launch of DIGITS, were offset by benefits from Data Stash and the MVNO Transaction as those customers had a lower ARPU. |
▪ | T-Mobile continues to expect that branded postpaid phone ARPU in full-year 2017 will be generally stable compared to full-year 2016, with some quarterly variations driven by the actual migrations to T-Mobile ONE rate plans, including Un-carrier Next. |
Branded Postpaid ABPU
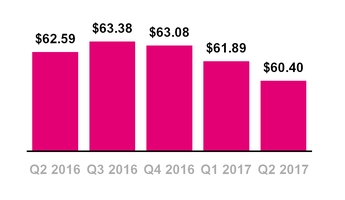
▪ | Branded postpaid ABPU was $60.40 in Q2 2017, down 2.4% from $61.89 in Q1 2017 and down 3.5% from $62.59 compared to Q2 2016. |
▪ | Sequentially, the decrease was primarily due to a decline in branded postpaid phone ARPU and lower lease revenues. |
▪ | Year-over-year, the decrease was primarily due to lower lease revenues and growth in the branded postpaid mobile broadband customer base with lower ARPU. |
12
Branded Postpaid Customers per Account
Branded Prepaid ARPU
($ per month)
Branded Postpaid Customers per Account
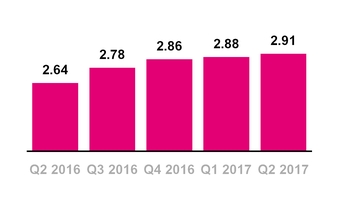
▪ | Branded postpaid customers per account was 2.91 at the end of Q2 2017, compared to 2.88 at the end of Q1 2017 and 2.64 at the end of Q2 2016. |
▪ | Sequentially, the increase was primarily due to growth in customers on promotions targeting families. |
▪ | Year-over-year, the increase was primarily due to growth in customers on promotions targeting families, and the impact from the MVNO Transaction as the customers transferred had a lower number of branded postpaid customers per account. |
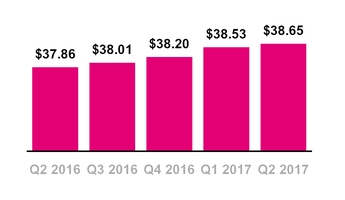
Branded Prepaid ARPU
▪ | Branded prepaid ARPU was a record-high $38.65 in Q2 2017, up 0.3% from $38.53 in Q1 2017 and up 2.1% compared to $37.86 in Q2 2016. |
▪ | Sequentially and year-over-year, the increase was primarily due to continued growth of MetroPCS customers who generate higher ARPU and a deliberate decision not to respond to irrational offers in the marketplace from some of our competitors. |
13
Service Revenue Growth at
Wireless Peers
(YoY % Growth)
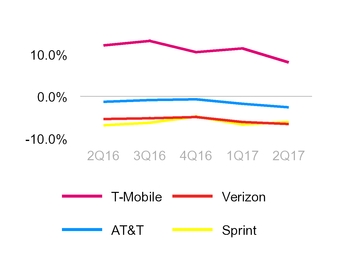
Based on reported results if available or based on consensus
expectations if company has not yet reported quarterly results.
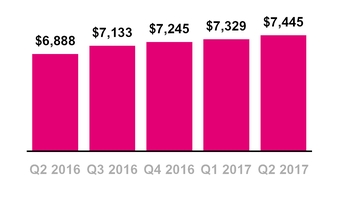
Service Revenues
($ in millions)
REVENUES
Service Revenues
▪ | T-Mobile is expected to once again lead the industry in year-over-year service revenue percentage growth in Q2 2017. This is expected to mark the 13th consecutive quarter that T-Mobile has led the industry in this measure. |
▪ | Service revenues were a record-high $7.445 billion in Q2 2017, up 1.6% from $7.329 billion in Q1 2017 and up 8.1% from $6.888 billion in Q2 2016. |
▪ | Sequentially, the increase was primarily due to growth in both postpaid and prepaid revenues driven by the continued growth in our customer base, partially offset by a decrease in wholesale service revenue. |
▪ | Year-over-year, the increase was primarily due to growth in our postpaid and prepaid revenues. |
◦ | Branded postpaid revenues increased due to growth in the customer base driven by strong customer response to our Un-carrier initiatives and promotions for services and devices, including the growing success of our business channel, @Work, the positive impact from a decrease in the non-cash net revenue deferral for Data Stash, partially offset by the MVNO Transaction. |
◦ | Prepaid revenues increased primarily due to higher average branded prepaid customers driven by the expansion into new markets and higher branded prepaid ARPU driven by the success of our MetroPCS brand, partially offset by the impact from the optimization of our third-party distribution channels and our decision not to respond to irrational offers from some of our competitors. |
14
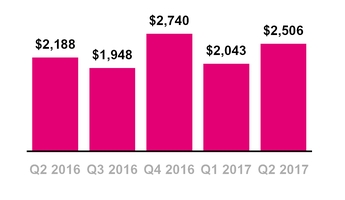
Equipment Revenues
($ in millions)
Total Revenues (1)
($ in millions)
(1) | The amortized imputed discount on EIP receivables previously recognized as Interest income has been retrospectively reclassified as Other revenues. See the Effect of Change in Accounting Principle table for further detail. |
Equipment Revenues
▪ | Equipment revenues were $2.506 billion in Q2 2017, up 22.7% from $2.043 billion in Q1 2017 and up 14.5% from $2.188 billion in Q2 2016. Equipment revenues in Q2 2017 were comprised of lease revenues of $234 million and non-lease revenues of $2.272 billion. |
▪ | Sequentially, the increase was due primarily to a higher average revenue per device sold due to increases in the high-end device mix driven by an iconic device launch, the purchase of leased devices at the end of their lease term, and accessory and upgrade revenue, partially offset by decreases in the number of devices sold and lease revenues due to the shifting focus to our EIP financing option beginning in Q1 2016. |
▪ | Year-over-year, the increase was primarily due to higher average revenue per device sold due to increases in the high-end device mix driven by an iconic device launch and decreased promotional spending, the purchase of leased devices at the end of their lease term, and SIM and upgrade revenue. These increases were partially offset by decreases in the number of devices sold and lease revenues due to the shifting focus to our EIP financing option beginning in Q1 2016. |
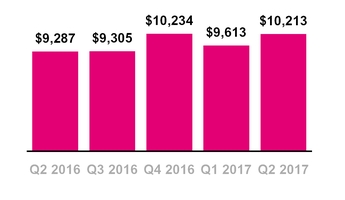
Total Revenues
▪ | T-Mobile is expected to once again lead the industry in year-over-year total revenue percentage growth in Q2 2017. This is expected to mark the 16th time in the past 17 quarters that T-Mobile has led the industry in year-over-year total revenue percentage growth. |
▪ | Total revenues were $10.213 billion in Q2 2017, up 6.2% from $9.613 billion in Q1 2017 and up 10.0% from $9.287 billion in Q2 2016. |
15
Cost of Services
($ in millions, % of Service Revs)
Cost of Equipment Sales
($ in millions, % of Equipment Revs)
OPERATING EXPENSES
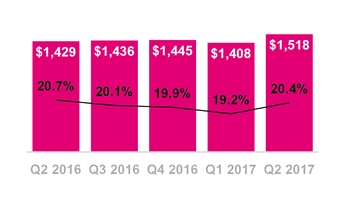
Cost of Services
▪ | Cost of services was $1.518 billion in Q2 2017, up 7.8% from $1.408 billion in Q1 2017 and up 6.2% from $1.429 billion in Q2 2016. |
▪ | Sequentially, the increase was primarily due to regulatory expenses related to T-Mobile ONE rate plans, inclusive of Un-carrier Next, higher international roaming primarily driven by Mobile without Borders, and higher lease costs associated with our network expansion, partially offset by lower long distance and toll costs as we continue to renegotiate contracts with vendors. As a percentage of service revenues, cost of service increased 120 basis points sequentially. |
▪ | Year-over-year, the increase was primarily due to the higher lease costs associated with our network expansion, and higher international roaming primarily driven by Mobile without Borders, partially offset by lower long distance and toll costs as we continue to renegotiate contracts with vendors. As a percentage of service revenues, cost of service declined 30 basis points year-over-year. |
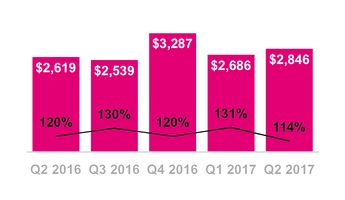
Cost of Equipment Sales
▪ | Cost of equipment sales was $2.846 billion in Q2 2017, up 6.0% from $2.686 billion in Q1 2017 and up 8.7% from $2.619 billion in Q2 2016. |
▪ | Sequentially, the increase was primarily due to a higher average cost per device sold due to an increase in the high-end device mix, and an increase in the recognition of costs for leased devices purchased at the end of the lease term, partially offset by a lower number of devices sold. |
▪ | Year-over-year, the increase was primarily due to recognition of cost for leased devices purchased at the end of the lease term and a higher average cost per device sold due to an increase in the high-end device mix, partially offset by a lower number of devices sold, and a decrease in other costs related to inventory and warranty exchange activities. |
16
SG&A Expense
($ in millions, % of Service Revs)
D&A Expense
($ in millions, % of Total Revs(1))
(1) | The amortized imputed discount on EIP receivables previously recognized as Interest income has been retrospectively reclassified as Other revenues. See the Effect of Change in Accounting Principle table for further detail. |
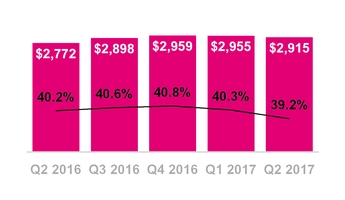
Selling, General and Admin. (SG&A) Expense
▪ | SG&A expense was $2.915 billion in Q2 2017, down 1.4% from $2.955 billion in Q1 2017 and up 5.2% from $2.772 billion in Q2 2016. |
▪ | Sequentially, the decrease was primarily due to focused cost control and lower bad debt expense, partially offset by strategic investments to support growing our customer base and expand our distribution footprint. As a percentage of service revenues, SG&A expense declined 110 basis points sequentially. |
▪ | Year-over-year, the increase was primarily due to strategic investments to support growing our customer base including higher commissions and employee-related costs, partially offset by focused cost control. As a percentage of service revenues, SG&A declined 100 basis points year-over-year. |
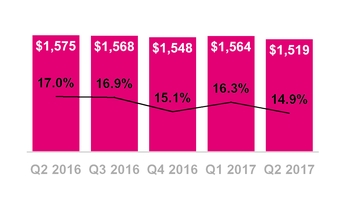
Depreciation and Amortization (D&A)
▪ | D&A was $1.519 billion in Q2 2017, down 2.9% from $1.564 billion in Q1 2017 and down 3.6% from $1.575 billion in Q2 2016. |
▪ | D&A related to leased devices was $268 million in Q2 2017 compared to $379 million in Q1 2017 and $397 million in Q2 2016. The sequential and year-over-year decline was primarily due to lower depreciation expense related to our JUMP! On Demand program resulting from a lower number of devices under lease. |
▪ | Non-lease related D&A was $1.251 billion in Q2 2017 compared to $1.185 billion in Q1 2017 and $1.178 billion in Q2 2016. The sequential and year-over-year increase was primarily due to the continued build-out of our 4G LTE network. |
17
Net Income
($ in millions)
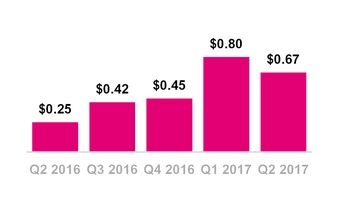
Diluted Earnings Per Share
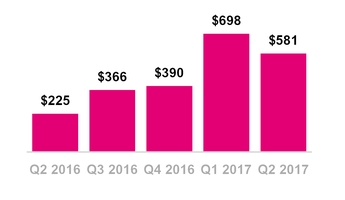
NET INCOME AND DILUTED EARNINGS PER SHARE
▪ | Net income was strong at $581 million in Q2 2017, down 16.8% from $698 million in Q1 2017 and up 158% from $225 million in Q2 2016. |
▪ | Diluted earnings per share was $0.67 in Q2 2017 down from $0.80 in Q1 2017 and up from $0.25 in Q2 2016. |
▪ | Sequentially, the decreases in net income and diluted earnings per share were primarily due to the impact of $270 million in net tax benefits recognized in Q1 2017 related to a valuation allowance release as well as a lower amount of spectrum gains and a net loss recognized from the early redemption of certain Senior Notes, partially offset by higher operating income. |
▪ | Year-over-year, the increases in net income and diluted earnings per share were primarily due to higher operating income; partially offset by a net loss recognized from the early redemption of certain Senior Notes and higher income tax expense. |
▪ | Net income margin was 8% in Q2 2017, compared to 10% in Q1 2017 and 3% in Q2 2016. Net income margin is calculated as Net income divided by service revenues. |
18
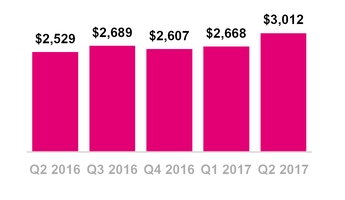
Adjusted EBITDA(1)
($ in millions)
(1) | The amortized imputed discount on EIP receivables previously recognized as Interest income has been retrospectively reclassified as Other revenues. See the Effect of Change in Accounting Principle table for further detail. |
ADJUSTED EBITDA
▪ | Adjusted EBITDA was a record-high $3.012 billion in Q2 2017, up 12.9% from $2.668 billion in Q1 2017 and up 19.1% from $2.529 billion in Q2 2016. |
▪ | Sequentially, the increase in Adjusted EBITDA was primarily due to lower losses on equipment and higher service revenues, partially offset by higher cost of service. In addition, Adjusted EBITDA was impacted by a lower level of pre-tax spectrum gains compared to Q1 2017. Excluding spectrum gains from all periods, Adjusted EBITDA growth was 14.4% sequentially. |
▪ | Year-over-year, the increase in Adjusted EBITDA was primarily due to higher service revenues and lower losses on equipment, partially offset by higher SG&A costs and higher cost of service. |
▪ | Adjusted EBITDA margin was 40% in Q2 2017, compared to 36% in Q1 2017 and 37% in Q2 2016. Adjusted EBITDA margin is calculated as Adjusted EBITDA divided by service revenues. |
19
Cash Purchases of Property and Equipment
($ in millions, % of Service Revs)
Cash Purchases of Property and Equipment, Excluding Capitalized Interest
($ in millions, % of Service Revs)
CAPITAL EXPENDITURES
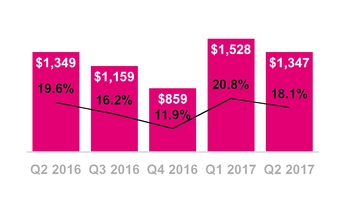
▪ | Cash purchases of property and equipment were $1.347 billion in Q2 2017, compared to $1.528 billion in Q1 2017 and $1.349 billion in Q2 2016. |
▪ | Sequentially, the decrease was primarily due to the substantial completion of our 700 MHz deployment, partially offset by our distribution expansion and initial deployment activities related to 600 MHz. |
▪ | Year-over-year, cash purchases of property and equipment were essentially flat primarily due to timing of network spend partially offset by an increase in distribution expansion during Q2 2017. |
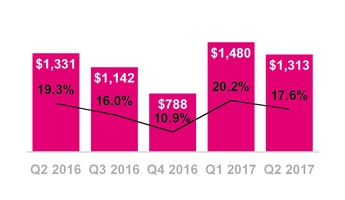
▪ | Cash purchases of property and equipment excluding capitalized interest were $1.313 billion in Q2 2017, compared to $1.480 billion in Q1 2017 and $1.331 billion in Q2 2016. |
▪ | Capitalized interest included in cash purchases of property and equipment was $34 million in Q2 2017 compared to $48 million in Q1 2017 and $18 million in Q2 2016. |
20
Net Cash Provided by Operating Activities
($ in millions)
Net Cash Used in Investing Activities
($ in millions)
CASH FLOW
Operating Activities
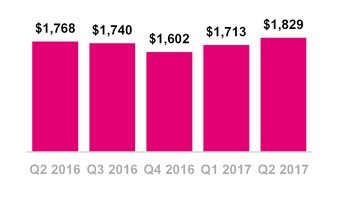
▪ | Net cash provided by operating activities was $1.829 billion in Q2 2017, compared to $1.713 billion in Q1 2017 and $1.768 billion in Q2 2016. |
▪ | Sequentially, the increase was primarily due to a higher non-cash Deferred income tax expense, partially offset by higher use from working capital changes primarily from Equipment installment plan receivables ("EIP"), Inventories, Other current and long-term assets and Other current and long term liabilities offset by lower Accounts payable and accrued liabilities. |
▪ | Year-over-year, the increase was primarily due to higher net income and higher non-cash Deferred income tax expense, partially offset by higher use from changes in working capital. Within working capital, changes in Equipment installment plan receivables, Inventories, Other current and long-term assets and Other current and long term liabilities were partially offset by improvements in Accounts payable and accrued liabilities. The change in EIP receivables was primarily due to an increase in devices financed on EIP as well a decrease in net cash proceeds from the sale of EIP receivables in Q2 2017 compared to Q2 2016 which benefited from net cash proceeds of $371 million primarily related to upsizing of the EIP securitization facility. |
Investing Activities
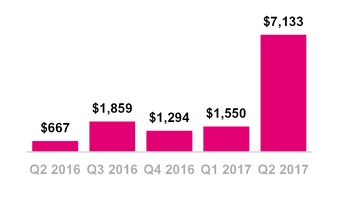
▪ | Cash used in investing activities was $7.133 billion in Q2 2017 compared to $1.550 billion in Q1 2017 and $667 million in Q2 2016. |
▪ | Sequentially, the increase was primarily due to an increase in capital invested in the purchase of spectrum licenses in Q2 2017 of $5.8 billion, partially offset by a decrease in cash purchases of property and equipment. |
▪ | Year-over-year, the increase was primarily due to an increase in capital invested in the purchase of spectrum licenses in Q2 2017 of $3.5 billion, primarily driven by our winning bid for 1,525 licenses in the 600 MHz spectrum auction and a decrease in sales of short-term investments. |
21
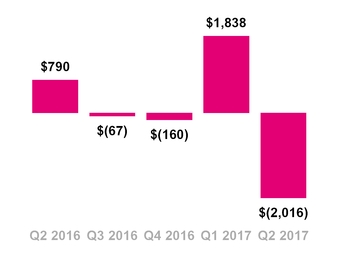
Net Cash Provided by (Used in)
Financing Activities
($ in millions)
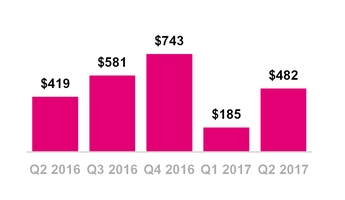
Free Cash Flow
($ in millions)
Financing Activities
▪ | Cash provided by financing activities was an outflow of $2.016 billion in Q2 2017 compared to an inflow of $1.838 billion in Q1 2017 and an inflow of $790 million in Q2 2016. |
▪ | Sequentially the decrease was primarily due to repayments of long-term debt, decreased proceeds from the issuance of long-term debt, repayments of short-term debt for purchases of inventory, property and equipment, net, and repayments of capital lease obligations; partially offset by proceeds from borrowing on our revolving credit facility, net. |
▪ | Year-over-year, the decrease was primarily due to repayments of long-term debt, short-term debt for purchases of inventory, property and equipment, net, and capital lease obligations; partially offset by proceeds from issuance of long-term debt and proceeds from borrowing on our revolving credit facility, net. |
FREE CASH FLOW
▪ | Free Cash Flow was $482 million in Q2 2017, compared to $185 million in Q1 2017 and $419 million in Q2 2016. |
▪ | Sequentially, the increase was due to a higher level of net cash provided by operating activities and lower cash purchases of property and equipment. Within cash flow from operations, the increase was primarily due to a higher non-cash Deferred income tax expense, partially offset by higher use from working capital changes primarily from Equipment installment plan receivables, Inventories, Other current and long-term assets and Other current and long term liabilities offset by lower Accounts payable and accrued liabilities. |
▪ | Year-over-year, the increase was due to a higher level of net cash provided by operating activities. Within cash flow from operations, the increase was primarily due to higher net income and non-cash deferred income tax expense, partially offset by higher use from changes in working capital. Within working capital, changes in Equipment installment plan receivables, Inventories, Other current and long-term assets and Other current and long term liabilities were partially offset by improvements in Accounts payable and accrued liabilities. The change in EIP receivables was primarily due to an increase in devices financed on EIP and decrease in net cash proceeds from the sale of EIP receivables in Q2 2017 compared to Q2 2016 which benefited from net cash proceeds of $371 million primarily related to upsizing of the EIP securitization facility. |
22
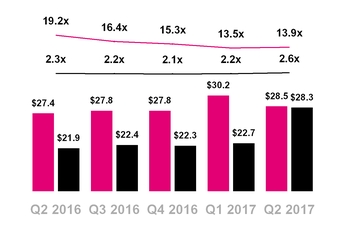
Total Debt and Net Debt (excl. Tower Obligations)
Net Debt to LTM Net Income
Net Debt to LTM Adjusted EBITDA
($ in billions)
— Net Debt (excl. Tower Obligations) to LTM Net income
— Net Debt (excl. Tower Obligations) to LTM Adj. EBITDA
(1) | The amortized imputed discount on EIP receivables previously recognized as Interest income has been retrospectively reclassified as Other revenues. See the Effect of Change in Accounting Principle table for further detail. |
CAPITAL STRUCTURE
▪ | Total debt, excluding tower obligations, at the end of Q2 2017 was $28.5 billion and was comprised of the following: |
▪ | $522.0 million of short-term debt; |
▪ | $680.0 million of short-term debt to affiliates; |
▪ | $13.2 billion of long-term debt; and |
▪ | $14.1 billion of long-term debt to affiliates. |
▪ | Net debt, excluding tower obligations, at the end of Q2 2017 was $28.3 billion. |
▪ | The ratio of net debt, excluding tower obligations, to net income for the trailing last twelve months ("LTM") period was 13.9x at the end of Q2 2017 compared to 13.5x at the end of Q1 2017 and 19.2x at the end of Q2 2016. |
▪ | The ratio of net debt, excluding tower obligations, to Adjusted EBITDA for the trailing last twelve month period was 2.6x at the end of Q2 2017 compared to 2.2x at the end of Q1 2017 and 2.3x at the end of Q2 2016. |
▪ | In January 2017, T-Mobile USA borrowed $4.0 billion under a secured term loan facility (“Incremental Term Loan Facility”) with Deutsche Telekom to refinance $1.98 billion of outstanding secured term loans under its Term Loan Credit Agreement dated November 9, 2015. The remaining proceeds from the transaction were used to redeem callable high yield debt. |
▪ | In March 2017, T-Mobile USA issued public Senior Notes with an aggregate principal amount of $1.5 billion. Issuance costs totaled $5 million. The net proceeds of $1.495 billion were used to redeem callable high yield debt. |
▪ | In April 2017, we issued to DT Senior Notes with an aggregate principal amount of $3.0 billion and concurrently redeemed the outstanding aggregate principal amounts on two Senior Notes totaling $2.5 billion. Early redemption fees of $79 million (included in cash interest paid) were recorded as discounts on the new Senior Notes. The proceeds from the net settlement of $421 million were used to redeem high yield debt. |
▪ | In May 2017, we exercised our option under existing high yield purchase agreements and issued three Senior Notes with an aggregate principal amount of $4.0 billion to DT. Net proceeds from these issuances include $64 million in debt premiums. The proceeds were used to fund a portion of the purchase price of spectrum licenses won in the 600 MHz spectrum auction. |
▪ | As of June 2017, we had $680 million of outstanding borrowings under our $1.5 billion senior secured revolving credit facility with DT. |
23
▪ | During the six months ended June 30, 2017, we redeemed seven Senior Notes with an aggregate principal amount of $8.25 billion for a total redemption price of $8.44 billion. |
2017 Guidance Outlook | |||||
Original | Q1 2017 Update | Q2 2017 Update | |||
Branded Postpaid Net Adds (in millions) | 2.4 - 3.4 | 2.8 - 3.5 | 3.0 - 3.6 | ||
Adjusted EBITDA ($ in billions) | $10.4 - $10.8 | Unchanged | $10.5 - $10.9 | ||
Cash purchases of prop and equip excl Cap Int ($ in billions) | $4.8 - $5.1 | Unchanged | Unchanged | ||
Net cash provided by op act 3-yr CAGR | 15% - 18% | Unchanged | Unchanged | ||
Free cash flow three-year CAGR | 45% - 48% | Unchanged | Unchanged | ||
GUIDANCE
▪ | Branded postpaid net customer additions for the full-year 2017 of 3.0 - 3.6 million, an increase from guidance provided in the previous quarter of 2.8 - 3.5 million. |
▪ | T-Mobile is not able to forecast net income on a forward looking basis without unreasonable efforts due to the high variability and difficulty in predicting certain items that affect GAAP net income including, but not limited to, income tax expense, stock based compensation expense and interest expense. Adjusted EBITDA should not be used to predict net income as the difference between the two measures is variable. |
▪ | For the full-year 2017, T-Mobile expects Adjusted EBITDA to be in the range of $10.5 - $10.9 billion an increase from guidance provided in the prior quarter of $10.4 - $10.8 billion. This target excludes future spectrum gains and includes expected leasing revenues of $0.85 - $0.95 billion, increased from the prior guidance range of $0.8 - $0.9 billion. |
▪ | Cash purchases of property and equipment for the full-year 2017 are expected to be in the range of $4.8 - $5.1 billion, excluding capitalized interest, unchanged from the guidance provided in the prior quarter, expected to be at the high end of our guidance range as a result of our initial 600 MHz deployment. |
▪ | Net cash provided by operating activities three-year compound annual growth rate (CAGR) from full-year 2016 to full-year 2019 is expected to be between 15% - 18%, unchanged from the guidance provided in the prior quarter. |
▪ | Free Cash Flow three-year CAGR from full-year 2016 to full-year 2019 is expected to be between 45% - 48%, unchanged from the prior quarter. Free Cash Flow is a non-GAAP metric and is defined as the difference between Net cash provided by operating activities and Cash purchases of property and equipment. |
24
UPCOMING EVENTS (All dates and attendance tentative)
▪ | Oppenheimer 20th Annual Technology, Internet & Communications Conference, August 8-9, Boston, MA |
▪ | 2017 Raymond James Park City TeleComVergence Summit, August 16-17, Park City, UT |
▪ | Goldman Sachs Communacopia, September 12-14, New York, NY |
▪ | Deutsche Bank Leveraged Finance Conference, October 2-4, Scottsdale, AZ |
CONTACT INFORMATION
Press:
Media Relations
T-Mobile US, Inc.
mediarelations@t-mobile.com
http://newsroom.t-mobile.com
Investor Relations:
Nils Paellmann, nils.paellmann@t-mobile.com
Ben Barrett, ben.barrett@t-mobile.com
Jon Perachio, jonathan.perachio@t-mobile.com
Cristal Dunkin, cristal.dunkin@t-mobile.com
877-281-TMUS or 212-358-3210
investor.relations@t-mobile.com
http://investor.t-mobile.com
25
T-Mobile US, Inc.
Effect of Change in Accounting Principle
(Unaudited)
Effective January 1, 2017, we began presenting the amortization of the imputed discount on our Equipment Installment Plan (“EIP”) receivables as Other revenue on our Condensed Consolidated Statements of Comprehensive Income. Prior to the change, the imputed interest was presented as Interest income. We made this change to provide a better representation of amounts earned from our major ongoing operations, align with industry practice and enhance comparability. We have applied this change in accounting principle retrospectively and presented the effect of the change in the table below. For additional information, see Note 1 - Basis of Presentation of the Notes to the Consolidated Financial Statements included in Part I, Item 1 of our Form 10-Q to be filed on or about July 20, 2017.
Quarter | Six Months Ended June 30, | |||||||||||||||||||||||||||||||
(in millions, except for margin %'s and Net Debt Ratios) | Q1 2016 | Q2 2016 | Q3 2016 | Q4 2016 | Q1 2017 | Q2 2017 | 2016 | 2017 | ||||||||||||||||||||||||
EIP imputed discount | $ | 65 | $ | 65 | $ | 59 | $ | 59 | $ | 62 | $ | 68 | $ | 130 | $ | 130 | ||||||||||||||||
Other revenue - as adjusted | $ | 235 | $ | 211 | $ | 224 | $ | 249 | $ | 241 | $ | 262 | $ | 446 | $ | 503 | ||||||||||||||||
Other revenues - unadjusted | 170 | 146 | 165 | 190 | 179 | 194 | 316 | 373 | ||||||||||||||||||||||||
Total revenues - as adjusted | $ | 8,664 | $ | 9,287 | $ | 9,305 | $ | 10,234 | $ | 9,613 | $ | 10,213 | $ | 17,951 | $ | 19,826 | ||||||||||||||||
Total revenues - unadjusted | 8,599 | 9,222 | 9,246 | 10,175 | 9,551 | 10,145 | 17,821 | 19,696 | ||||||||||||||||||||||||
Operating income - as adjusted | $ | 1,168 | $ | 833 | $ | 1,048 | $ | 1,001 | $ | 1,037 | $ | 1,416 | $ | 2,001 | $ | 2,453 | ||||||||||||||||
Operating income - unadjusted | 1,103 | 768 | 989 | 942 | 975 | 1,348 | 1,871 | 2,323 | ||||||||||||||||||||||||
Interest income - as adjusted | $ | 3 | $ | 3 | $ | 3 | $ | 4 | $ | 7 | $ | 6 | $ | 6 | $ | 13 | ||||||||||||||||
Interest income - unadjusted | 68 | 68 | 62 | 63 | 69 | 74 | 136 | 143 | ||||||||||||||||||||||||
Total other expense, net - as adjusted | $ | (417 | ) | $ | (461 | ) | $ | (450 | ) | $ | (395 | ) | $ | (430 | ) | $ | (482 | ) | $ | (878 | ) | $ | (912 | ) | ||||||||
Total other expense, net - unadjusted | (352 | ) | (396 | ) | (391 | ) | (336 | ) | (368 | ) | — | (414 | ) | (748 | ) | (782 | ) | |||||||||||||||
Net income - as adjusted | $ | 479 | $ | 225 | $ | 366 | $ | 390 | $ | 698 | $ | 581 | $ | 704 | $ | 1,279 | ||||||||||||||||
Net income - unadjusted | 479 | 225 | 366 | 390 | 698 | 581 | 704 | 1,279 | ||||||||||||||||||||||||
Adjusted EBITDA - as adjusted | $ | 2,814 | $ | 2,529 | $ | 2,689 | $ | 2,607 | $ | 2,668 | $ | 3,012 | $ | 5,343 | $ | 5,680 | ||||||||||||||||
Adjusted EBITDA - unadjusted | 2,749 | 2,464 | 2,630 | 2,548 | 2,606 | 2,944 | 5,213 | 5,550 | ||||||||||||||||||||||||
Net income margin - as adjusted | 7 | % | 3 | % | 5 | % | 5 | % | 10 | % | 8 | % | 5 | % | 9 | % | ||||||||||||||||
Net income margin - unadjusted | 7 | % | 3 | % | 5 | % | 5 | % | 10 | % | 8 | % | 5 | % | 9 | % | ||||||||||||||||
Adjusted EBITDA margin - as adjusted | 43 | % | 37 | % | 38 | % | 36 | % | 36 | % | 40 | % | 40 | % | 38 | % | ||||||||||||||||
Adjusted EBITDA margin - unadjusted | 42 | % | 36 | % | 37 | % | 35 | % | 36 | % | 40 | % | 39 | % | 38 | % | ||||||||||||||||
Last twelve months Net income - as adjusted | $ | 1,275 | $ | 1,139 | $ | 1,367 | $ | 1,460 | $ | 1,679 | $ | 2,035 | N/A | N/A | ||||||||||||||||||
Last twelve months Net income - unadjusted | 1,275 | 1,139 | 1,367 | 1,460 | 1,679 | 2,035 | N/A | N/A | ||||||||||||||||||||||||
Last twelve months Adjusted EBITDA - as adjusted (1) | $ | 9,124 | $ | 9,723 | $ | 10,396 | $ | 10,639 | $ | 10,493 | $ | 10,976 | N/A | N/A | ||||||||||||||||||
Last twelve months Adjusted EBITDA - unadjusted (1) | 8,754 | 9,401 | 10,123 | 10,391 | 10,248 | 10,728 | N/A | N/A | ||||||||||||||||||||||||
Net Debt (excluding Tower Obligations) to Last Twelve Months Net income - as adjusted | 15.6 | 19.2 | 16.4 | 15.3 | 13.5 | 13.9 | N/A | N/A | ||||||||||||||||||||||||
Net Debt (excluding Tower Obligations) to Last Twelve Months Net income - unadjusted | 15.6 | 19.2 | 16.4 | 15.3 | 13.5 | 13.9 | N/A | N/A | ||||||||||||||||||||||||
Net Debt (excluding Tower Obligations) to LTM Adjusted EBITDA Ratio - as adjusted | 2.2 | 2.3 | 2.2 | 2.1 | 2.2 | 2.6 | N/A | N/A | ||||||||||||||||||||||||
Net Debt (excluding Tower Obligations) to LTM Adjusted EBITDA Ratio - unadjusted | 2.3 | 2.3 | 2.2 | 2.1 | 2.2 | 2.6 | N/A | N/A | ||||||||||||||||||||||||
Quarter | |||||||||||
(in millions) | Q2 2015 | Q3 2015 | Q4 2015 | ||||||||
EIP imputed discount | $ | 113 | $ | 108 | $ | 84 | |||||
Net income - as adjusted | $ | 361 | $ | 138 | $ | 297 | |||||
Net income - unadjusted | 361 | 138 | 297 | ||||||||
Adjusted EBITDA - as adjusted | $ | 1,930 | $ | 2,016 | $ | 2,364 | |||||
Adjusted EBITDA - unadjusted | 1,817 | 1,908 | 2,280 | ||||||||
26
T-Mobile US, Inc.
Condensed Consolidated Balance Sheets
(Unaudited)
(in millions, except share and per share amounts) | June 30, 2017 | December 31, 2016 | |||||
Assets | |||||||
Current assets | |||||||
Cash and cash equivalents | $ | 181 | $ | 5,500 | |||
Accounts receivable, net of allowances of $83 and $102 | 1,719 | 1,896 | |||||
Equipment installment plan receivables, net | 2,060 | 1,930 | |||||
Accounts receivable from affiliates | 32 | 40 | |||||
Inventories | 1,208 | 1,111 | |||||
Asset purchase deposit | — | 2,203 | |||||
Other current assets | 1,580 | 1,537 | |||||
Total current assets | 6,780 | 14,217 | |||||
Property and equipment, net | 21,423 | 20,943 | |||||
Goodwill | 1,683 | 1,683 | |||||
Spectrum licenses | 35,060 | 27,014 | |||||
Other intangible assets, net | 296 | 376 | |||||
Equipment installment plan receivables due after one year, net | 1,102 | 984 | |||||
Other assets | 815 | 674 | |||||
Total assets | $ | 67,159 | $ | 65,891 | |||
Liabilities and Stockholders' Equity | |||||||
Current liabilities | |||||||
Accounts payable and accrued liabilities | $ | 6,225 | $ | 7,152 | |||
Payables to affiliates | 155 | 125 | |||||
Short-term debt | 522 | 354 | |||||
Short-term debt to affiliates | 680 | — | |||||
Deferred revenue | 851 | 986 | |||||
Other current liabilities | 395 | 405 | |||||
Total current liabilities | 8,828 | 9,022 | |||||
Long-term debt | 13,206 | 21,832 | |||||
Long-term debt to affiliates | 14,086 | 5,600 | |||||
Tower obligations | 2,606 | 2,621 | |||||
Deferred tax liabilities | 5,188 | 4,938 | |||||
Deferred rent expense | 2,660 | 2,616 | |||||
Other long-term liabilities | 971 | 1,026 | |||||
Total long-term liabilities | 38,717 | 38,633 | |||||
Commitments and contingencies | |||||||
Stockholders' equity | |||||||
5.50% Mandatory Convertible Preferred Stock Series A, par value $0.00001 per share, 100,000,000 shares authorized; 20,000,000 and 20,000,000 shares issued and outstanding; $1,000 and $1,000 aggregate liquidation value | — | — | |||||
Common Stock, par value $0.00001 per share, 1,000,000,000 shares authorized; 832,476,169 and 827,768,818 shares issued, 831,021,302 and 826,357,331 shares outstanding | — | — | |||||
Additional paid-in capital | 38,946 | 38,846 | |||||
Treasury stock, at cost, 1,454,867 and 1,411,487 shares issued | (4 | ) | (1 | ) | |||
Accumulated other comprehensive income | 3 | 1 | |||||
Accumulated deficit | (19,331 | ) | (20,610 | ) | |||
Total stockholders' equity | 19,614 | 18,236 | |||||
Total liabilities and stockholders' equity | $ | 67,159 | $ | 65,891 | |||
27
T-Mobile US, Inc.
Condensed Consolidated Statements of Comprehensive Income
(Unaudited)
Three Months Ended | Six Months Ended June 30, | ||||||||||||||||||
June 30, 2017 | March 31, 2017 | June 30, 2016 | 2017 | 2016 | |||||||||||||||
(in millions, except share and per share amounts) | As Adjusted (1) | As Adjusted (1) | |||||||||||||||||
Revenues | |||||||||||||||||||
Branded postpaid revenues | $ | 4,820 | $ | 4,725 | $ | 4,509 | $ | 9,545 | $ | 8,811 | |||||||||
Branded prepaid revenues | 2,334 | 2,299 | 2,119 | 4,633 | 4,144 | ||||||||||||||
Wholesale revenues | 234 | 270 | 207 | 504 | 407 | ||||||||||||||
Roaming and other service revenues | 57 | 35 | 53 | 92 | 104 | ||||||||||||||
Total service revenues | 7,445 | 7,329 | 6,888 | 14,774 | 13,466 | ||||||||||||||
Equipment revenues | 2,506 | 2,043 | 2,188 | 4,549 | 4,039 | ||||||||||||||
Other revenues (1) | 262 | 241 | 211 | 503 | 446 | ||||||||||||||
Total revenues (1) | 10,213 | 9,613 | 9,287 | 19,826 | 17,951 | ||||||||||||||
Operating expenses | |||||||||||||||||||
Cost of services, exclusive of depreciation and amortization shown separately below | 1,518 | 1,408 | 1,429 | 2,926 | 2,850 | ||||||||||||||
Cost of equipment sales | 2,846 | 2,686 | 2,619 | 5,532 | 4,993 | ||||||||||||||
Selling, general and administrative | 2,915 | 2,955 | 2,772 | 5,870 | 5,521 | ||||||||||||||
Depreciation and amortization | 1,519 | 1,564 | 1,575 | 3,083 | 3,127 | ||||||||||||||
Cost of MetroPCS business combination | — | — | 59 | — | 95 | ||||||||||||||
Gains on disposal of spectrum licenses | (1 | ) | (37 | ) | — | (38 | ) | (636 | ) | ||||||||||
Total operating expense | 8,797 | 8,576 | 8,454 | 17,373 | 15,950 | ||||||||||||||
Operating income (1) | 1,416 | 1,037 | 833 | 2,453 | 2,001 | ||||||||||||||
Other income (expense) | |||||||||||||||||||
Interest expense | (265 | ) | (339 | ) | (368 | ) | (604 | ) | (707 | ) | |||||||||
Interest expense to affiliates | (131 | ) | (100 | ) | (93 | ) | (231 | ) | (172 | ) | |||||||||
Interest income (1) | 6 | 7 | 3 | 13 | 6 | ||||||||||||||
Other (expense) income, net | (92 | ) | 2 | (3 | ) | (90 | ) | (5 | ) | ||||||||||
Total other expense, net (1) | (482 | ) | (430 | ) | (461 | ) | (912 | ) | (878 | ) | |||||||||
Income before income taxes | 934 | 607 | 372 | 1,541 | 1,123 | ||||||||||||||
Income tax (expense) benefit | (353 | ) | 91 | (147 | ) | (262 | ) | (419 | ) | ||||||||||
Net income | 581 | 698 | 225 | 1,279 | 704 | ||||||||||||||
Dividends on preferred stock | (14 | ) | (14 | ) | (14 | ) | (28 | ) | (28 | ) | |||||||||
Net income attributable to common stockholders | $ | 567 | $ | 684 | $ | 211 | $ | 1,251 | $ | 676 | |||||||||
Net income | $ | 581 | $ | 698 | $ | 225 | $ | 1,279 | $ | 704 | |||||||||
Other comprehensive income, net of tax | |||||||||||||||||||
Unrealized gain on available-for-sale securities, net of tax effect $1, $1, $2, $2 and $0 | 1 | 1 | 3 | 2 | — | ||||||||||||||
Other comprehensive income | 1 | 1 | 3 | 2 | — | ||||||||||||||
Total comprehensive income | $ | 582 | $ | 699 | $ | 228 | $ | 1,281 | $ | 704 | |||||||||
Earnings per share | |||||||||||||||||||
Basic | $ | 0.68 | $ | 0.83 | $ | 0.26 | $ | 1.51 | $ | 0.82 | |||||||||
Diluted | $ | 0.67 | $ | 0.80 | $ | 0.25 | $ | 1.47 | $ | 0.81 | |||||||||
Weighted average shares outstanding | |||||||||||||||||||
Basic | 830,971,528 | 827,723,034 | 822,434,490 | 829,356,255 | 820,933,126 | ||||||||||||||
Diluted | 870,456,447 | 869,395,250 | 829,752,956 | 870,853,652 | 829,662,053 | ||||||||||||||
(1) | The amortized imputed discount on EIP receivables previously recognized as Interest income has been retrospectively reclassified as Other revenues. See the Effect of Change in Accounting Principle table for further detail. |
28
T-Mobile US, Inc.
Condensed Consolidated Statements of Cash Flows
(Unaudited)
Three Months Ended | Six Months Ended June 30, | ||||||||||||||||||
(in millions) | June 30, 2017 | March 31, 2017 | June 30, 2016 | 2017 | 2016 | ||||||||||||||
Operating activities | |||||||||||||||||||
Net income | $ | 581 | $ | 698 | $ | 225 | $ | 1,279 | $ | 704 | |||||||||
Adjustments to reconcile net income to net cash provided by operating activities | |||||||||||||||||||
Depreciation and amortization | 1,519 | 1,564 | 1,575 | 3,083 | 3,127 | ||||||||||||||
Stock-based compensation expense | 72 | 67 | 60 | 139 | 112 | ||||||||||||||
Deferred income tax expense (benefit) | 345 | (97 | ) | 140 | 248 | 404 | |||||||||||||
Bad debt expense | 82 | 93 | 119 | 175 | 240 | ||||||||||||||
Losses from sales of receivables | 80 | 95 | 46 | 175 | 98 | ||||||||||||||
Deferred rent expense | 20 | 20 | 33 | 40 | 65 | ||||||||||||||
Gains on disposal of spectrum licenses | (1 | ) | (37 | ) | — | (38 | ) | (636 | ) | ||||||||||
Changes in operating assets and liabilities | |||||||||||||||||||
Accounts receivable | 21 | (68 | ) | (105 | ) | (47 | ) | (307 | ) | ||||||||||
Equipment installment plan receivables | (353 | ) | (13 | ) | 343 | (366 | ) | 452 | |||||||||||
Inventories | (185 | ) | 44 | 3 | (141 | ) | (798 | ) | |||||||||||
Deferred purchase price from sales of receivables | 1 | (19 | ) | (204 | ) | (18 | ) | (183 | ) | ||||||||||
Other current and long-term assets | (135 | ) | (11 | ) | (56 | ) | (146 | ) | 129 | ||||||||||
Accounts payable and accrued liabilities | 56 | (651 | ) | (345 | ) | (595 | ) | (837 | ) | ||||||||||
Other current and long-term liabilities | (189 | ) | 45 | (74 | ) | (144 | ) | 214 | |||||||||||
Other, net | (85 | ) | (17 | ) | 8 | (102 | ) | 9 | |||||||||||
Net cash provided by operating activities | 1,829 | 1,713 | 1,768 | 3,542 | 2,793 | ||||||||||||||
Investing activities | |||||||||||||||||||
Purchases of property and equipment, including capitalized interest of $34, $48, $18, $82 and $54 | (1,347 | ) | (1,528 | ) | (1,349 | ) | (2,875 | ) | (2,684 | ) | |||||||||
Purchases of spectrum licenses and other intangible assets, including deposits | (5,791 | ) | (14 | ) | (2,245 | ) | (5,805 | ) | (2,839 | ) | |||||||||
Sales of short-term investments | — | — | 2,923 | — | 2,998 | ||||||||||||||
Other, net | 5 | (8 | ) | 4 | (3 | ) | (2 | ) | |||||||||||
Net cash used in investing activities | (7,133 | ) | (1,550 | ) | (667 | ) | (8,683 | ) | (2,527 | ) | |||||||||
Financing activities | |||||||||||||||||||
Proceeds from issuance of long-term debt | 4,485 | 5,495 | 997 | 9,980 | 997 | ||||||||||||||
Proceeds from borrowing on revolving credit facility, net | 1,855 | — | — | 1,855 | — | ||||||||||||||
Repayments of revolving credit facility | (1,175 | ) | — | — | (1,175 | ) | — | ||||||||||||
Repayments of capital lease obligations | (119 | ) | (90 | ) | (43 | ) | (209 | ) | (79 | ) | |||||||||
Repayments of short-term debt for purchases of inventory, property and equipment, net | (292 | ) | — | (150 | ) | (292 | ) | (150 | ) | ||||||||||
Repayments of long-term debt | (6,750 | ) | (3,480 | ) | (5 | ) | (10,230 | ) | (10 | ) | |||||||||
Tax withholdings on share-based awards | (3 | ) | (92 | ) | (3 | ) | (95 | ) | (49 | ) | |||||||||
Dividends on preferred stock | (14 | ) | (14 | ) | (14 | ) | (28 | ) | (28 | ) | |||||||||
Other, net | (3 | ) | 19 | 8 | 16 | 9 | |||||||||||||
Net cash (used in) provided by financing activities | (2,016 | ) | 1,838 | 790 | (178 | ) | 690 | ||||||||||||
Change in cash and cash equivalents | (7,320 | ) | 2,001 | 1,891 | (5,319 | ) | 956 | ||||||||||||
Cash and cash equivalents | |||||||||||||||||||
Beginning of period | 7,501 | 5,500 | 3,647 | 5,500 | 4,582 | ||||||||||||||
End of period | $ | 181 | $ | 7,501 | $ | 5,538 | $ | 181 | $ | 5,538 | |||||||||
Supplemental disclosure of cash flow information | |||||||||||||||||||
Interest payments, net of amounts capitalized, of which $79, $0, $0, $79, $0 is recorded as debt discount | $ | 727 | $ | 495 | $ | 399 | $ | 1,222 | $ | 814 | |||||||||
Income tax payments | 6 | 15 | 17 | 21 | 19 | ||||||||||||||
Changes in accounts payable for purchases of property and equipment | 8 | (325 | ) | (101 | ) | (317 | ) | (228 | ) | ||||||||||
Leased devices transferred from inventory to property and equipment | 270 | 243 | 157 | 513 | 941 | ||||||||||||||
Returned leased devices transferred from property and equipment to inventory | (273 | ) | (197 | ) | (105 | ) | (470 | ) | (236 | ) | |||||||||
Issuance of short-term debt for financing of property and equipment | 2 | 288 | — | 290 | 150 | ||||||||||||||
Assets acquired under capital lease obligations | 313 | 284 | 171 | 597 | 295 | ||||||||||||||
29
T-Mobile US, Inc. Supplementary Operating and Financial Data
Quarter | Six Months Ended June 30, | ||||||||||||||||||||||
(in thousands) | Q1 2016 | Q2 2016 | Q3 2016 | Q4 2016 | Q1 2017 | Q2 2017 | 2016 | 2017 | |||||||||||||||
Customers, end of period | |||||||||||||||||||||||
Branded postpaid phone customers | 30,232 | 30,878 | 30,364 | 31,297 | 32,095 | 32,881 | 30,878 | 32,881 | |||||||||||||||
Branded postpaid mobile broadband customers | 2,504 | 2,748 | 2,866 | 3,130 | 3,246 | 3,277 | 2,748 | 3,277 | |||||||||||||||
Total branded postpaid customers | 32,736 | 33,626 | 33,230 | 34,427 | 35,341 | 36,158 | 33,626 | 36,158 | |||||||||||||||
Branded prepaid customers | 18,438 | 18,914 | 19,272 | 19,813 | 20,199 | 20,293 | 18,914 | 20,293 | |||||||||||||||
Total branded customers | 51,174 | 52,540 | 52,502 | 54,240 | 55,540 | 56,451 | 52,540 | 56,451 | |||||||||||||||
Wholesale customers | 14,329 | 14,844 | 16,852 | 17,215 | 17,057 | 13,111 | 14,844 | 13,111 | |||||||||||||||
Total customers, end of period | 65,503 | 67,384 | 69,354 | 71,455 | 72,597 | 69,562 | 67,384 | 69,562 | |||||||||||||||
Adjustments to branded postpaid phone customers (1) | — | — | (1,365 | ) | — | — | — | — | — | ||||||||||||||
Adjustments to branded prepaid customers (1) | — | — | (326 | ) | — | — | — | — | — | ||||||||||||||
Adjustments to wholesale customers (1) (2) | — | — | 1,691 | — | — | (4,368 | ) | — | (4,368 | ) | |||||||||||||
(1) | The MVNO Transaction resulted in a transfer of branded postpaid phone customers and branded prepaid customers to wholesale customers on September 1, 2016. |
(2) | We believe current and future regulatory changes have made the Lifeline program offered by our wholesale partners uneconomical. We will continue to support our wholesale partners offering the Lifeline program, but have excluded the Lifeline customers from our reported wholesale subscriber base resulting in the removal of 4.4 million reported wholesale customers as of the beginning of Q2 2017. |
Quarter | Six Months Ended June 30, | ||||||||||||||||||||||
(in thousands) | Q1 2016 | Q2 2016 | Q3 2016 | Q4 2016 | Q1 2017 | Q2 2017 | 2016 | 2017 | |||||||||||||||
Net customer additions (losses) | |||||||||||||||||||||||
Branded postpaid phone customers | 877 | 646 | 851 | 933 | 798 | 786 | 1,523 | 1,584 | |||||||||||||||
Branded postpaid mobile broadband customers | 164 | 244 | 118 | 264 | 116 | 31 | 408 | 147 | |||||||||||||||
Total branded postpaid customers | 1,041 | 890 | 969 | 1,197 | 914 | 817 | 1,931 | 1,731 | |||||||||||||||
Branded prepaid customers | 807 | 476 | 684 | 541 | 386 | 94 | 1,283 | 480 | |||||||||||||||
Total branded customers | 1,848 | 1,366 | 1,653 | 1,738 | 1,300 | 911 | 3,214 | 2,211 | |||||||||||||||
Wholesale customers (1) | 373 | 515 | 317 | 363 | (158 | ) | 422 | 888 | 264 | ||||||||||||||
Total net customer additions | 2,221 | 1,881 | 1,970 | 2,101 | 1,142 | 1,333 | 4,102 | 2,475 | |||||||||||||||
(1) | Net customer activity for Lifeline was excluded beginning in the second quarter of 2017 due to our determination based upon changes in the applicable government regulations that Lifeline is no longer a sustainable product for our wholesale providers. |
Quarter | Six Months Ended June 30, | ||||||||||||||||||||||
Q1 2016 | Q2 2016 | Q3 2016 | Q4 2016 | Q1 2017 | Q2 2017 | 2016 | 2017 | ||||||||||||||||
Branded postpaid phone churn | 1.33 | % | 1.27 | % | 1.32 | % | 1.28 | % | 1.18 | % | 1.10 | % | 1.30 | % | 1.14 | % | |||||||
Branded prepaid churn | 3.84 | % | 3.91 | % | 3.82 | % | 3.94 | % | 4.01 | % | 3.91 | % | 3.88 | % | 3.96 | % | |||||||
30
T-Mobile US, Inc. Supplementary Operating and Financial Data (continued)
Quarter | Six Months Ended June 30, | ||||||||||||||
Q1 2016 | Q2 2016 | Q3 2016 | Q4 2016 | Q1 2017 | Q2 2017 | 2016 | 2017 | ||||||||
Financial Metrics | |||||||||||||||
Service revenues (in millions) | $6,578 | $6,888 | $7,133 | $7,245 | $7,329 | $7,445 | $13,466 | $14,774 | |||||||
Total revenues (in millions) (1) | $8,664 | $9,287 | $9,305 | $10,234 | $9,613 | $10,213 | $17,951 | $19,826 | |||||||
Net income (in millions) | $479 | $225 | $366 | $390 | $698 | $581 | $704 | $1,279 | |||||||
Net income margin | 7% | 3% | 5% | 5% | 10% | 8% | 5% | 9% | |||||||
Adjusted EBITDA (in millions) (1) | $2,814 | $2,529 | $2,689 | $2,607 | $2,668 | $3,012 | $5,343 | $5,680 | |||||||
Adjusted EBITDA margin (1) | 43% | 37% | 38% | 36% | 36% | 40% | 40% | 38% | |||||||
Cash purchases of property and equipment including capitalized interest (in millions) | $1,335 | $1,349 | $1,159 | $859 | $1,528 | $1,347 | $2,684 | $2,875 | |||||||
Capitalized Interest (in millions) | $36 | $18 | $17 | $71 | $48 | $34 | $54 | $82 | |||||||
Cash purchases of property and equipment excluding capitalized interest (in millions) | $1,299 | $1,331 | $1,142 | $788 | $1,480 | $1,313 | $2,630 | $2,793 | |||||||
Net cash provided by operating activities (in millions) | $1,025 | $1,768 | $1,740 | $1,602 | $1,713 | $1,829 | $2,793 | $3,542 | |||||||
Net cash used in investing activities (in millions) | $(1,860) | $(667) | $(1,859) | $(1,294) | $(1,550) | $(7,133) | $(2,527) | $(8,683) | |||||||
Net cash provided by (used in) financing activities (in millions) | $(100) | $790 | $(67) | $(160) | $1,838 | $(2,016) | $690 | $(178) | |||||||
Free Cash Flow (in millions) | $(310) | $419 | $581 | $743 | $185 | $482 | $109 | $667 | |||||||
Revenue Metrics | |||||||||||||||
Branded postpaid phone ARPU | $46.21 | $47.11 | $48.15 | $48.37 | $47.53 | $47.01 | $46.67 | $47.26 | |||||||
Branded postpaid ABPU | $61.90 | $62.59 | $63.38 | $63.08 | $61.89 | $60.40 | $62.25 | $61.14 | |||||||
Branded prepaid ARPU | $37.58 | $37.86 | $38.01 | $38.20 | $38.53 | $38.65 | $37.72 | $38.59 | |||||||
Branded postpaid accounts, end of period (in thousands) | 12,639 | 12,753 | 11,932 | 12,055 | 12,275 | 12,432 | 12,753 | 12,432 | |||||||
Branded postpaid customers per account | 2.59 | 2.64 | 2.78 | 2.86 | 2.88 | 2.91 | 2.64 | 2.91 | |||||||
Device Sales and Leased Devices | |||||||||||||||
Phones (in millions) | 9.0 | 8.4 | 8.8 | 10.0 | 8.6 | 8.3 | 17.4 | 16.9 | |||||||
Branded postpaid handset upgrade rate | 7% | 6% | 7% | 10% | 7% | 7% | 13% | 14% | |||||||
Device Financing | |||||||||||||||
Gross EIP financed (in millions) | $1,246 | $1,562 | $1,372 | $1,956 | $1,339 | $1,657 | $2,808 | $2,996 | |||||||
EIP billings (in millions) | $1,324 | $1,344 | $1,394 | $1,370 | $1,402 | $1,402 | $2,668 | $2,804 | |||||||
EIP receivables, net (in millions) | $3,053 | $2,662 | $2,508 | $2,914 | $2,855 | $3,162 | $2,662 | $3,162 | |||||||
Lease revenues (in millions) | $342 | $367 | $353 | $354 | $324 | $234 | $709 | $558 | |||||||
Leased devices transferred from inventory to property and equipment (in millions) | $784 | $157 | $234 | $413 | $243 | $270 | $941 | $513 | |||||||
Returned leased devices transferred from property and equipment to inventory (in millions) | $(131) | $(105) | $(186) | $(180) | $(197) | $(273) | $(236) | $(470) | |||||||
Customer Quality | |||||||||||||||
EIP receivables classified as prime | 47% | 42% | 42% | 44% | 43% | 43% | 42% | 43% | |||||||
EIP receivables classified as prime (including EIP receivables sold) | 52% | 53% | 53% | 53% | 53% | 52% | 53% | 52% | |||||||
Total bad debt expense and losses from sales of receivables (in millions) | $173 | $165 | $177 | $190 | $188 | $162 | $338 | $350 | |||||||
(1) | The amortized imputed discount on EIP receivables previously recognized as Interest income has been retrospectively reclassified as Other revenues. See Effect of Change in Accounting Principle table for further detail. |
31
T-Mobile US, Inc.
Reconciliation of Non-GAAP Financial Measures to GAAP Financial Measures
(Unaudited)
This Investor Factbook includes non-GAAP financial measures. The non-GAAP financial measures should be considered in addition to, but not as a substitute for, the information provided in accordance with GAAP. Reconciliations for the non-GAAP financial measures to the most directly comparable GAAP financial measures are provided below. T-Mobile is not able to forecast net income on a forward looking basis without unreasonable efforts due to the high variability and difficulty in predicting certain items that affect GAAP net income including, but not limited to, income tax expense, stock based compensation expense and interest expense. Adjusted EBITDA should not be used to predict net income as the difference between the two measures is variable. We made an accounting change in 2017 to include imputed interest associated with EIP receivables in Other revenues which are included in Adjusted EBITDA.
Adjusted EBITDA is reconciled to net income as follows:
Quarter | Six Months Ended June 30, | ||||||||||||||||||||||||||||||||||||||||||
(in millions) | Q2 2015 | Q3 2015 | Q4 2015 | Q1 2016 | Q2 2016 | Q3 2016 | Q4 2016 | Q1 2017 | Q2 2017 | 2016 | 2017 | ||||||||||||||||||||||||||||||||
Net income | $ | 361 | $ | 138 | $ | 297 | $ | 479 | $ | 225 | $ | 366 | $ | 390 | $ | 698 | $ | 581 | $ | 704 | $ | 1,279 | |||||||||||||||||||||
Adjustments: | |||||||||||||||||||||||||||||||||||||||||||
Interest expense | 257 | 262 | 305 | 339 | 368 | 376 | 335 | 339 | 265 | 707 | 604 | ||||||||||||||||||||||||||||||||
Interest expense to affiliates | 92 | 121 | 134 | 79 | 93 | 76 | 64 | 100 | 131 | 172 | 231 | ||||||||||||||||||||||||||||||||
Interest income (1) | (1 | ) | (1 | ) | (1 | ) | (3 | ) | (3 | ) | (3 | ) | (4 | ) | (7 | ) | (6 | ) | (6 | ) | (13 | ) | |||||||||||||||||||||
Other expense (income), net | (1 | ) | 1 | 3 | 2 | 3 | 1 | — | (2 | ) | 92 | 5 | 90 | ||||||||||||||||||||||||||||||
Income tax expense (benefit) | 2 | 100 | 184 | 272 | 147 | 232 | 216 | (91 | ) | 353 | 419 | 262 | |||||||||||||||||||||||||||||||
Operating income (1) | 710 | 621 | 922 | 1,168 | 833 | 1,048 | 1,001 | 1,037 | 1,416 | 2,001 | 2,453 | ||||||||||||||||||||||||||||||||
Depreciation and Amortization | 1,075 | 1,157 | 1,369 | 1,552 | 1,575 | 1,568 | 1,548 | 1,564 | 1,519 | 3,127 | 3,083 | ||||||||||||||||||||||||||||||||
Cost of MetroPCS business combination (2) | 34 | 193 | 21 | 36 | 59 | 15 | (6 | ) | — | — | 95 | — | |||||||||||||||||||||||||||||||
Stock-based compensation (3) | 71 | 43 | 52 | 53 | 61 | 57 | 64 | 67 | 72 | 114 | 139 | ||||||||||||||||||||||||||||||||
Other, net (3) | 40 | 2 | — | 5 | 1 | 1 | — | — | 5 | 6 | 5 | ||||||||||||||||||||||||||||||||
Adjusted EBITDA (1) | $ | 1,930 | $ | 2,016 | $ | 2,364 | $ | 2,814 | $ | 2,529 | $ | 2,689 | $ | 2,607 | $ | 2,668 | $ | 3,012 | $ | 5,343 | $ | 5,680 | |||||||||||||||||||||
(1) | The amortized imputed discount on EIP receivables previously recognized as Interest income has been retrospectively reclassified as Other revenues. See the Effect of Change in Accounting Principle table for further detail. |
(2) | Beginning Q1 2017, we will no longer separately present Cost of MetroPCS business combination as it is insignificant. |
(3) | Stock-based compensation includes payroll tax impacts and may not agree to stock-based compensation expense in the condensed consolidated financial statements. Other, net may not agree to the Condensed Consolidated Statements of Comprehensive Income primarily due to certain non-routine operating activities, such as other special items that would not be expected to reoccur, and are therefore excluded in Adjusted EBITDA. |
32
T-Mobile US, Inc.
Reconciliation of Non-GAAP Financial Measures to GAAP Financial Measures (continued)
(Unaudited)
Net debt (excluding Tower obligations) to last twelve months Net income and Adjusted EBITDA ratios are calculated as follows:
(in millions, except net debt ratio) | Mar 31, 2016 | Jun 30, 2016 | Sep 30, 2016 | Dec 31, 2016 | Mar 31, 2017 | Jun 30, 2017 | |||||||||||||||||
Short-term debt | $ | 365 | $ | 258 | $ | 325 | $ | 354 | $ | 7,542 | $ | 522 | |||||||||||
Short-term debt to affiliates | — | — | — | — | — | 680 | |||||||||||||||||
Long-term debt | 20,505 | 21,574 | 21,825 | 21,832 | 13,105 | 13,206 | |||||||||||||||||
Long-term debt to affiliates | 5,600 | 5,600 | 5,600 | 5,600 | 9,600 | 14,086 | |||||||||||||||||
Less: Cash and cash equivalents | (3,647 | ) | (5,538 | ) | (5,352 | ) | (5,500 | ) | (7,501 | ) | (181 | ) | |||||||||||
Less: Short-term investments | (2,925 | ) | — | — | — | — | — | ||||||||||||||||
Net debt (excluding Tower Obligations) | $ | 19,898 | $ | 21,894 | $ | 22,398 | $ | 22,286 | $ | 22,746 | $ | 28,313 | |||||||||||
Divided by: Last twelve months Net income | $ | 1,275 | $ | 1,139 | $ | 1,367 | $ | 1,460 | $ | 1,679 | $ | 2,035 | |||||||||||
Net Debt (excluding Tower Obligations) to last twelve months Net income | 15.6 | 19.2 | 16.4 | 15.3 | 13.5 | 13.9 | |||||||||||||||||
Divided by: Last twelve months Adjusted EBITDA (1) | $ | 9,124 | $ | 9,723 | $ | 10,396 | $ | 10,639 | $ | 10,493 | $ | 10,976 | |||||||||||
Net Debt (excluding Tower Obligations) to last twelve months Adjusted EBITDA Ratio (1) | 2.2 | 2.3 | 2.2 | 2.1 | 2.2 | 2.6 | |||||||||||||||||
(1) | The amortized imputed discount on EIP receivables previously recognized as Interest income has been retrospectively reclassified as Other revenues. See the Effect of Change in Accounting Principle table for further detail. |
Free cash flow is calculated as follows:
Quarter | Six Months Ended June 30, | ||||||||||||||||||||||||||||||
(in millions) | Q1 2016 | Q2 2016 | Q3 2016 | Q4 2016 | Q1 2017 | Q2 2017 | 2016 | 2017 | |||||||||||||||||||||||
Net cash provided by operating activities | $ | 1,025 | $ | 1,768 | $ | 1,740 | $ | 1,602 | $ | 1,713 | $ | 1,829 | $ | 2,793 | $ | 3,542 | |||||||||||||||
Cash purchases of property and equipment | (1,335 | ) | (1,349 | ) | (1,159 | ) | (859 | ) | (1,528 | ) | (1,347 | ) | (2,684 | ) | (2,875 | ) | |||||||||||||||
Free Cash Flow | $ | (310 | ) | $ | 419 | $ | 581 | $ | 743 | $ | 185 | $ | 482 | $ | 109 | $ | 667 | ||||||||||||||
Net cash used in investing activities | $ | (1,860 | ) | $ | (667 | ) | $ | (1,859 | ) | $ | (1,294 | ) | $ | (1,550 | ) | $ | (7,133 | ) | $ | (2,527 | ) | $ | (8,683 | ) | |||||||
Net cash provided by (used in) financing activities | $ | (100 | ) | $ | 790 | $ | (67 | ) | $ | (160 | ) | $ | 1,838 | $ | (2,016 | ) | $ | 690 | $ | (178 | ) | ||||||||||
Free cash flow three-year CAGR is calculated as follows:
FY | FY | ||||||||||||||||
(in millions, except CAGR Range) | 2016 | 2019 Guidance Range | CAGR Range | ||||||||||||||
Net cash provided by operating activities | $ | 6,135 | $ | 9,400 | $ | 10,000 | 15 | % | 18 | % | |||||||
Cash purchases of property and equipment | (4,702 | ) | (5,000 | ) | (5,400 | ) | 2 | % | 5 | % | |||||||
Free Cash Flow | $ | 1,433 | $ | 4,400 | $ | 4,600 | 45 | % | 48 | % | |||||||
33
T-Mobile US, Inc.
Reconciliation of Operating Measures to Branded Postpaid Service Revenues
(Unaudited)
The following tables illustrate the calculation of our operating measures ARPU and ABPU and reconcile these measures to the related service revenues:
(in millions, except average number of customers, ARPU and ABPU) | Quarter | Six Months Ended June 30, | |||||||||||||||||||||||||||||
Q1 2016 | Q2 2016 | Q3 2016 | Q4 2016 | Q1 2017 | Q2 2017 | 2016 | 2017 | ||||||||||||||||||||||||
Calculation of Branded Postpaid Phone ARPU | |||||||||||||||||||||||||||||||
Branded postpaid service revenues | $ | 4,302 | $ | 4,509 | $ | 4,647 | $ | 4,680 | $ | 4,725 | $ | 4,820 | $ | 8,811 | $ | 9,545 | |||||||||||||||
Less: Branded postpaid mobile broadband revenues | (182 | ) | (193 | ) | (193 | ) | (205 | ) | (225 | ) | (255 | ) | (375 | ) | (480 | ) | |||||||||||||||
Branded postpaid phone service revenues | $ | 4,120 | $ | 4,316 | $ | 4,454 | $ | 4,475 | $ | 4,500 | $ | 4,565 | $ | 8,436 | $ | 9,065 | |||||||||||||||
Divided by: Average number of branded postpaid phone customers (in thousands) and number of months in period | 29,720 | 30,537 | 30,836 | 30,842 | 31,564 | 32,372 | 30,128 | 31,968 | |||||||||||||||||||||||
Branded postpaid phone ARPU | $ | 46.21 | $ | 47.11 | $ | 48.15 | $ | 48.37 | $ | 47.53 | $ | 47.01 | $ | 46.67 | $ | 47.26 | |||||||||||||||
Calculation of Branded Postpaid ABPU | |||||||||||||||||||||||||||||||
Branded postpaid service revenues | $ | 4,302 | $ | 4,509 | $ | 4,647 | $ | 4,680 | $ | 4,725 | $ | 4,820 | $ | 8,811 | $ | 9,545 | |||||||||||||||
EIP billings | 1,324 | 1,344 | 1,394 | 1,370 | 1,402 | 1,402 | 2,668 | 2,804 | |||||||||||||||||||||||
Lease revenues | 342 | 367 | 353 | 354 | 324 | 234 | 709 | 558 | |||||||||||||||||||||||
Total billings for branded postpaid customers | $ | 5,968 | $ | 6,220 | $ | 6,394 | $ | 6,404 | $ | 6,451 | $ | 6,456 | $ | 12,188 | $ | 12,907 | |||||||||||||||
Divided by: Average number of branded postpaid customers (in thousands) and number of months in period | 32,140 | 33,125 | 33,632 | 33,839 | 34,740 | 35,636 | 32,633 | 35,188 | |||||||||||||||||||||||
Branded postpaid ABPU | $ | 61.90 | $ | 62.59 | $ | 63.38 | $ | 63.08 | $ | 61.89 | $ | 60.40 | $ | 62.25 | $ | 61.14 | |||||||||||||||
Calculation of Branded Prepaid ARPU | |||||||||||||||||||||||||||||||
Branded prepaid service revenues | $ | 2,025 | $ | 2,119 | $ | 2,182 | $ | 2,227 | $ | 2,299 | $ | 2,334 | $ | 4,144 | $ | 4,633 | |||||||||||||||
Divided by: Average number of branded prepaid customers (in thousands) and number of months in period | 17,962 | 18,662 | 19,134 | 19,431 | 19,889 | 20,131 | 18,312 | 20,010 | |||||||||||||||||||||||
Branded prepaid ARPU | $ | 37.58 | $ | 37.86 | $ | 38.01 | $ | 38.20 | $ | 38.53 | $ | 38.65 | $ | 37.72 | $ | 38.59 | |||||||||||||||
34
Definitions of Terms
Operating and financial measures are utilized by T-Mobile's management to evaluate its operating performance and, in certain cases, its ability to meet liquidity requirements. Although companies in the wireless industry may not define measures in precisely the same way, T-Mobile believes the measures facilitate key operating performance comparisons with other companies in the wireless industry to provide management, investors and analysts with useful information to assess and evaluate past performance and assist in forecasting future performance.
1. | Customer - SIM number with a unique T-Mobile mobile identifier which is associated with an account that generates revenue. Branded customers generally include customers that are qualified either for postpaid service, where they generally pay after incurring service, or prepaid service, where they generally pay in advance. Wholesale customers include Machine-to-Machine (M2M) and Mobile Virtual Network Operator (MVNO) customers that operate on T-Mobile's network, but are managed by wholesale partners. |
2. | Churn - Number of customers whose service was disconnected as a percentage of the average number of customers during the specified period. The number of customers whose service was disconnected is presented net of customers that subsequently have their service restored within a certain period of time. |
3. | Customers per account - The number of branded postpaid customers as of the end of the period divided by the number of branded postpaid accounts as of the end of the period. An account may include branded postpaid phone and mobile broadband customers. |
4. | Average Revenue Per User (ARPU) - Average monthly service revenue earned from customers. Service revenues for the specified period divided by the average customers during the period, further divided by the number of months in the period. |
Branded postpaid phone ARPU excludes mobile broadband customers and related revenues.
Average Billings per User (ABPU) - Average monthly branded postpaid service revenue earned from customers plus monthly EIP billings and lease revenues divided by the average branded postpaid customers during the period, further divided by the number of months in the period. T-Mobile believes branded postpaid ABPU is indicative of estimated cash collections, including device financing payments, from T-Mobile's postpaid customers each month.
Service revenues - Branded postpaid, including handset insurance, branded prepaid, wholesale, and roaming and other service revenues.
5. | Cost of services - Costs directly attributable to providing wireless service through the operation of T-Mobile's network, including direct switch and cell site costs, such as rent, network access and transport costs, utilities, maintenance, associated labor costs, long distance costs, regulatory program costs, roaming fees paid to other carriers and data content costs. |
Cost of equipment sales - Costs of devices and accessories sold to customers and dealers, device costs to fulfill insurance and warranty claims, write-downs of inventory related to shrinkage and obsolescence, and shipping and handling costs.
Selling, general and administrative expenses - Costs not directly attributable to providing wireless service for the operation of sales, customer care and corporate activities. These include commissions paid to dealers and retail employees for activations and upgrades, labor and facilities costs associated with retail sales force and administrative space, marketing and promotional costs, customer support and billing, bad debt expense and administrative support activities.
6. | Net income margin - Margin % calculated as net income divided by service revenues. |
7. | Adjusted EBITDA - Earnings before interest expense, net of interest income, income tax expense, depreciation and amortization expense, non-cash stock-based compensation and certain expenses not reflective of T-Mobile's ongoing operating performance. Adjusted EBITDA margin represents Adjusted EBITDA divided by service revenues. Adjusted EBITDA is a non-GAAP financial measure utilized by T-Mobile's management to monitor the financial performance of our operations. T-Mobile uses Adjusted EBITDA internally as a metric to evaluate and compensate its personnel and management for their performance, and as a benchmark to evaluate T-Mobile's operating performance in comparison to its competitors. Management believes analysts and investors use Adjusted EBITDA as a supplemental measure to evaluate overall operating performance and facilitate comparisons with other wireless communications companies because it is indicative of T-Mobile's ongoing operating performance and trends by excluding the impact of interest expense from financing, non-cash depreciation and amortization from capital investments, non-cash stock-based compensation, network decommissioning costs as they are not indicative of T-Mobile's ongoing operating performance and certain other nonrecurring expenses. Adjusted EBITDA has limitations as an analytical tool and should not be considered in isolation or as a substitute for income from operations, net income or any other measure of financial performance reported in accordance with GAAP. In Q1 2017, we made an accounting change to include imputed interest associated with EIP receivables in Other revenues which are included in Adjusted EBITDA. |
8. | Adjusted EBITDA Margin - Margin % calculated as Adjusted EBITDA divided by service revenues. |
9. | Smartphones - UMTS/HSPA/HSPA+ 21/HSPA+ 42/4G LTE enabled converged devices, which integrate voice and data services. |
10. | Free Cash Flow - Net cash provided by operating activities less cash purchases of property and equipment. Free Cash Flow is utilized by T-Mobile's management, investors, and analysts to evaluate cash available to pay debt and provide further investment in the business. The reconciliation of Free Cash Flow to net cash provided by operating activities is detailed in the Reconciliation of Non-GAAP Financial Measures to GAAP Financial Measures schedule. |
11. | Net debt - Short-term debt, short-term debt to affiliates, long-term debt, and long-term debt (excluding tower obligations) to affiliates, less cash and cash equivalents and short-term investments. |
35
Forward-Looking Statements
This Investor Factbook includes "forward-looking statements" within the meaning of the U.S. federal securities laws. Any statements made herein that are not statements of historical fact, including statements about T-Mobile's plans, outlook, beliefs, opinion, projections, guidance, strategy, store openings, deployment of spectrum and expected network modernization and other advancements, are forward-looking statements. Generally, forward-looking statements may be identified by words such as "anticipate," "expect," "suggests," "plan," “project,” "believe," "intend," "estimates," "targets," "views," "may," "will," "forecast," and other similar expressions. The forward-looking statements speak only as of the date made, are based on current assumptions and expectations, and involve a number of risks and uncertainties. Important factors that could affect future results and cause those results to differ materially from those expressed in the forward-looking statements include, among others, the following: adverse economic or political conditions in the U.S. and international markets; competition in the wireless services market, including new competitors entering the industry as technologies converge; the effects any future merger or acquisition involving us, as well as the effects of mergers or acquisitions in the technology, media and telecommunications industry; challenges in implementing our business strategies or funding our wireless operations, including payment for additional spectrum or network upgrades; the possibility that we may be unable to renew our spectrum licenses on attractive terms or acquire new spectrum licenses at reasonable costs and terms; difficulties in managing growth in wireless data services, including network quality; material changes in available technology; the timing, scope and financial impact of our deployment of advanced network and business technologies; the impact on our networks and business from major technology equipment failures; breaches of our and/or our third party vendors’ networks, information technology and data security; natural disasters, terrorist attacks or similar incidents; existing or future litigation; any changes in the regulatory environments in which we operate, including any increase in restrictions on the ability to operate our networks; any disruption or failure of our third parties’ or key suppliers’ provisioning of products or services; material adverse changes in labor matters, including labor campaigns, negotiations or additional organizing activity, and any resulting financial, operational and/or reputational impact; the ability to make payments on our debt or to repay our existing indebtedness when due; adverse change in the ratings of our debt securities or adverse conditions in the credit markets; changes in accounting assumptions that regulatory agencies, including the Securities and Exchange Commission (“SEC”), may require, which could result in an impact on earnings; and changes in tax laws, regulations and existing standards and the resolution of disputes with any taxing jurisdictions; and other risks described in our filings with the SEC, including those described in our most recently filed Annual Report on Form 10-K. You should not place undue reliance on these forward-looking statements. We do not undertake to update forward-looking statements, whether as a result of new information, future events or otherwise, except as required by law.
About T-Mobile US, Inc.
As America's Un-carrier, T-Mobile US, Inc. (NASDAQ: TMUS) is redefining the way consumers and businesses buy wireless services through leading product and service innovation. Our advanced nationwide 4G LTE network delivers outstanding wireless experiences to 69.6 million customers who are unwilling to compromise on quality and value. Based in Bellevue, Washington, T-Mobile US provides services through its subsidiaries and operates its flagship brands, T-Mobile and MetroPCS. For more information, please visit http://www.T-Mobile.com or join the conversation on Twitter using $TMUS.
36