Attached files
| file | filename |
|---|---|
| EX-99.2 - EXHIBIT 99.2 - CASEYS GENERAL STORES INC | exhibit992rsuaward-nonxoff.htm |
| EX-99.1 - EXHIBIT 99.1 - CASEYS GENERAL STORES INC | exhibit991ltiaward-summary.htm |
| 8-K - 8-K - CASEYS GENERAL STORES INC | a8-kltincentiveprogramand2.htm |

INVESTOR DAY
JULY 20, 2017

Safe Harbor Statements
This presentation is dated as of July 19, 2017 and speaks as of that date.
Forward Looking Statements
This presentation contains statements that may constitute forward-looking statements within the meaning of the Private Securities
Litigation Reform Act of 1995. These forward-looking statements include any statements relating to our possible or assumed future
results of operations, business strategies, growth opportunities, and performance improvements at our stores. There are a number of
known and unknown risks, uncertainties, and other factors that may cause our actual results to differ materially from any future results
expressed or implied by those forward-looking statements, which are described in our most recent annual report on Form 10-K and
quarterly reports on Form 10-Q, as filed with the SEC and available on our website. Any forward-looking statements contained in this
presentation represent our current views as of the date of this presentation with respect to future events, and Casey's disclaims any
intention or obligation to update this presentation or revise any forward-looking statements attached in this presentation whether as a
result of new information, future events, or otherwise.
Use of Non-GAAP Measures
This presentation includes references to “EBITDA,” which we define as net income before net interest expense, depreciation and
amortization, and income taxes. EBITDA is not presented in accordance with accounting principles generally accepted in the United
States (“GAAP”). We believe EBITDA is useful to investors in evaluating our operating performance because securities analysts and
other interested parties use such calculations as a measure of financial performance and debt service capabilities, and it is regularly
used by management for internal purposes including our capital budgeting process, evaluating acquisition targets, and assessing
store performance. EBITDA is not a recognized term under GAAP and should not be considered as a substitute for net income, cash
flows from operating activities or other income or cash flow statement data. EBITDA has limitations as an analytical tool, and should
not be considered in isolation or as a substitute for analysis of our results as reported under GAAP. We strongly encourage investors
to review our financial statements and publicly filed reports in their entirety and not to rely on any single financial measure. Because
non-GAAP financial measures are not standardized, EBITDA, as defined by us, may not be comparable to similarly titled measures
reported by other companies. It therefore may not be possible to compare our use of this non-GAAP financial measure with those
used by other companies. A reconciliation of EBITDA to GAAP net income can be found in the recently filed Form 10-K for FYE
4/30/2017.

Agenda
Presentation
Terry Handley, President and CEO
Bill Walljasper, Senior Vice President and CFO
Q&A
Terry Handley, President and CEO
Bill Walljasper, Senior Vice President and CFO
Brian Johnson, Senior Vice President, Store Development
Jay Soupene, Senior Vice President, Operations
Distribution Center Tour
Store Tour & Product Sampling

Casey’s Mission
To provide quality products at competitive prices with
courteous service in clean stores at convenient
locations.
To provide a work environment where employees are
treated with respect, dignity and honesty and where
high performance is expected and rewarded.
To provide shareowners with a fair return on
investment.
Our Purpose
To make the daily lives of our
customers & communities better.
Our Vision
By 2030, proudly serve & satisfy
1.5 billion customers a year…one
customer at a time.

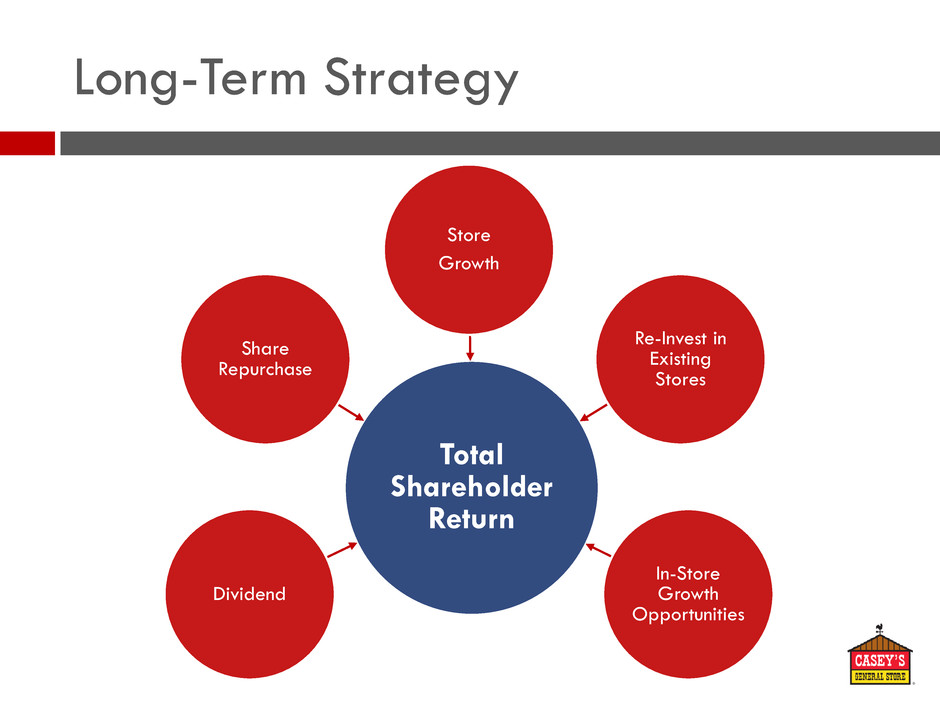
Long-Term Strategy
Total
Shareholder
Return
Store
Growth
Re-Invest in
Existing
Stores
In-Store
Growth
Opportunities
Share
Repurchase
Dividend

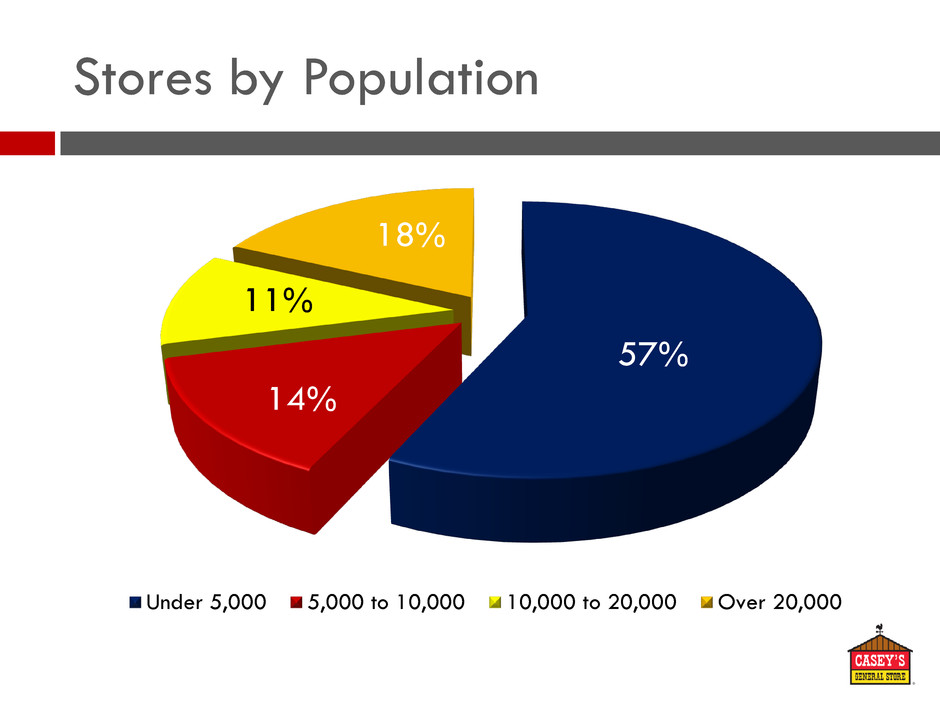
Stores by Population
57%
14%
11%
18%
Under 5,000 5,000 to 10,000 10,000 to 20,000 Over 20,000

Store Growth
1,749
1,808
1,878
1,931
1,978
2013 2014 2015 2016 2017
Fiscal Year
Fiscal Year New Builds
Acquired
Stores
2013 31 26
2014 44 28
2015 45 36
2016 51 5
2017 48 22
2018 Guidance: 80 to 120 Stores
Total Corporate Stores New Stores & Acquisitions
Type Sq Ft Land Building Equip.
Total
Invest.
Larger
Format
4,350 $0.7 $1.2 $1.4 $3.3
Smaller
Format
3,350 $0.5 $1.0 $1.2 $2.7
2017 New Store Average ($ in millions)

Core States Newer States(1)
State
FYE
2017
FYE
2012
5-Year
Growth
Iowa 518 477 41
Illinois 440 405 35
Missouri 326 309 17
Kansas 158 139 19
Minnesota 148 111 37
Nebraska 134 127 7
Indiana 91 75 16
S. Dakota 42 39 3
Wisconsin 18 10 8
Subtotal 1,875 1,692 183
State
FYE
2017
FYE
2012
5-Year
Growth
Arkansas 37 6 31
N. Dakota 26 0 26
Oklahoma 18 1 17
Kentucky 11 0 11
Tennessee 8 0 8
Ohio 3 0 3
Subtotal 103 7 96
All States 1,978 1,699 279
(1) States new to Casey’s within the last 10 years.
Store Growth

500-Mile Distribution Radius
42
26
148
18
440 91
518
134
158
18 37
326
11
8
3
1 - Ankeny, IA
2 - Terre Haute, IN
1
2

1,000 to 20,000 Population Communities
Core States Newer States(1)
State Total(2)
With
Casey’s
Without
Casey’s
Iowa 252 228 24
Illinois 547 299 248
Missouri 306 182 124
Kansas 172 99 73
Minnesota 300 96 204
Nebraska 96 58 38
Indiana 262 67 195
S. Dakota 59 24 35
Wisconsin 317 15 302
Subtotal 2,311 1,068 1,243
State Total(2)
With
Casey’s
Without
Casey’s
Arkansas 171 14 157
N. Dakota 45 8 37
Oklahoma 200 13 187
Kentucky 189 8 181
Tennessee 197 8 189
Ohio 447 3 444
Michigan 298 0 298
Subtotal 1,547 54 1,493
All States 3,858 1,122 2,736
(1) States new to Casey’s within the last 10 years plus Michigan.
(2) Source: http://factfinder.census.gov; Estimated 2016 Pop.

Re-Invest in Existing Stores
Fiscal
Year
Major
Remodels Replacements
2013 77 26
2014 25 20
2015 27 27
2016 102 11
2017 103 21
2018
Guidance
75 30
Type Sq Ft Building Equip.
Total
Investment
Major
Remodel
600 $0.35 $0.35 $0.7
2017 Remodel Average ($ in millions)
Generate Incremental Returns by
Adding Square Footage for Higher
Margin Products
Expanded Cooler Doors
Walk-in Beer Caves
Expanded Coffee and Fountain Bar
Made-to-Order Sub Sandwiches

In-Store Growth Opportunities
Fiscal
Year 24-Hours Delivery
2013 200 200
2014 130 80
2015 110 12
2016 110 110
2017 89 161
Since
Inception
1,000 580
2018
Guidance
75 100
Expanded Hours of
Operation
Delivery

In-Store Growth Opportunities
200
400
530
616
700
815
900
Q3
2016
Q4
2016
Q1
2017
Q2
2017
Q3
2017
Q4
2017
Current
Fiscal Quarter/Year
Mobile App Downloads (in thousands) Current
Digital Engagement
Mobile App
Online Ordering
~14% of All Pizza Sales
~20% Increase in Basket Size
Fuel Saver Programs
Future
Enhanced Digital Engagement
Customer Loyalty
Price Optimization
Fuel Saver Programs

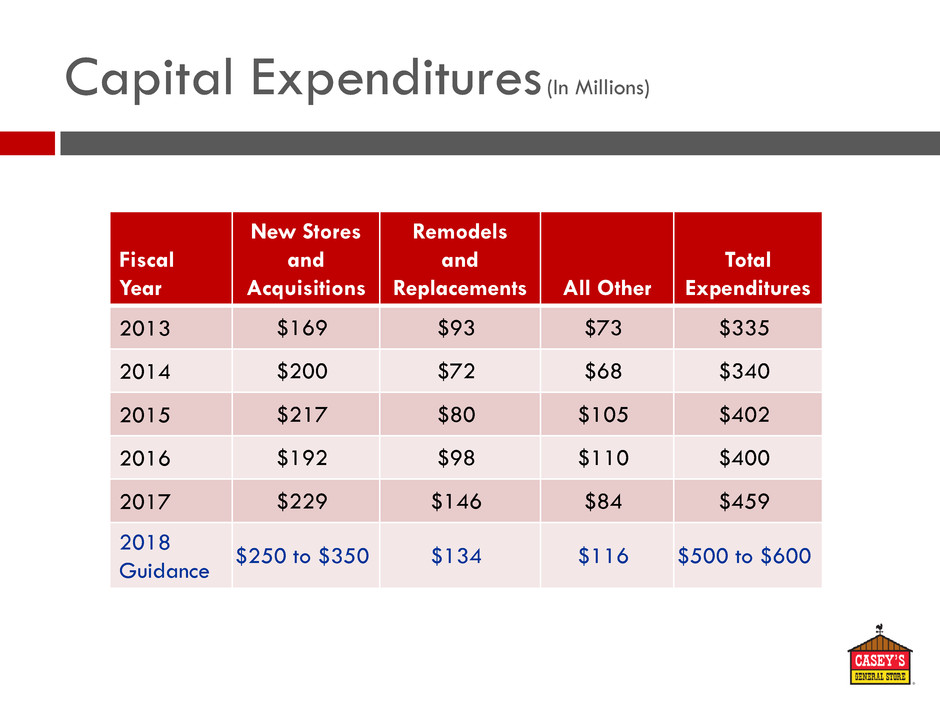
Capital Expenditures (In Millions)
Fiscal
Year
New Stores
and
Acquisitions
Remodels
and
Replacements All Other
Total
Expenditures
2013 $169 $93 $73 $335
2014 $200 $72 $68 $340
2015 $217 $80 $105 $402
2016 $192 $98 $110 $400
2017 $229 $146 $84 $459
2018
Guidance
$250 to $350 $134 $116 $500 to $600

Senior Note Summary
Issuance
Outstanding
Principal
(in Millions) Interest Rate Due
2006 (Series A) $22.5 5.72% September 30, 2019
2006 (Series B) $22.5 5.72% March 30, 2020
2010 $569 5.22% August 9, 2020
2013 (Series A) $150 3.67% June 15, 2028
2013 (Series B) $50 3.75% December 18, 2028
2016 (Series C) $50 3.65% May 2, 2031
2016 (Series D) $50 3.72% October 28, 2031
2017 (Series E) $150 3.51% June 13, 2025
2017 (Series F)* $250 3.77% August 22, 2028
* Expected to be issued August 22, 2017

Same-Store Sales and Margin
Same-Store Sales Gross Profit Margin
Fiscal Year
Fuel
Gallons
Grocery &
Other
Merchandise
Prepared
Food &
Fountain
2013 0.1% 0.8% 8.6%
2014 3.1% 7.4% 11.8%
2015 2.6% 7.8% 12.4%
2016 3.0% 7.1% 8.4%
2017 2.1% 2.9% 4.8%
2018
Guidance
1.0% -
2.0%
2.0% -
4.0%
5.0% -
7.0%
Fiscal Year
Fuel
(cents per
gallon)
Grocery &
Other
Merchandise
Prepared
Food &
Fountain
2013 14.4 32.6% 61.8%
2014 16.1 32.1% 61.1%
2015 19.3 32.1% 59.7%
2016 19.6 31.9% 62.5%
2017 18.4 31.5% 62.3%
2018
Guidance
18.0 -
20.0
31.0% -
32.0%
61.5% -
62.5%

Fuel Margin
10.6 10.5
9.8
11.1
9.6
10.9
10.1
10.7
11.5
10.4
13.9
12.9
13.9
15.2 15.1
14.4
16.1
19.3 19.6
18.4
8.0
12.0
16.0
20.0
C
e
nts
p
e
r
Ga
llo
n
Fiscal Year

Fuel
1,535
1,666
1,817
1,952
2,062
2013 2014 2015 2016 2017
Fiscal Year
Fuel Gallons Sold (in Millions) Gross Profit (in Millions)
$221
$268
$351
$382 $378
2013 2014 2015 2016 2017
Fiscal Year

Grocery & Other Merchandise
$1,419
$1,583
$1,795
$1,974
$2,087
2013 2014 2015 2016 2017
Fiscal Year
Revenue (in Millions) Gross Profit (in Millions)
$463
$508
$576
$629
$657
2013 2014 2015 2016 2017
Fiscal Year

Prepared Food & Fountain
$565
$659
$781
$881
$953
2013 2014 2015 2016 2017
Fiscal Year
Revenue (in Millions) Gross Profit (in Millions)
$349
$403
$466
$550
$594
2013 2014 2015 2016 2017
Fiscal Year

Financial Performance
$1,071
$1,222
$1,440
$1,614
$1,681
2013 2014 2015 2016 2017
Fiscal Year
Total Gross Profit (in Millions) EBITDA (in Millions)
$311
$365
$479
$560
$509
2013 2014 2015 2016 2017
Fiscal Year

Financial Performance
$104
$127
$181
$226
$177
2013 2014 2015 2016 2017
Fiscal Year
Net Income (in Millions) Diluted Earnings Per Share
$2.69
$3.26
$4.62
$5.73
$4.48
2013 2014 2015 2016 2017
Fiscal Year

Dividend
$0.66
$0.72
$0.80
$0.88
$0.96
2013 2014 2015 2016 2017
Fiscal Year
17 Consecutive Annual Dividend Increases

Share Repurchase
Authorized to repurchase up to an aggregate of
$300 million of the Company’s outstanding common
stock
Valid for a period of two years
Can be suspended or discontinued at any time
Period
Total Number of
Shares Purchased
(in thousands)
Average Price
Paid per Share
Maximum Dollar
Value of Shares Yet
to Be Purchased
(in Thousands)
March 9-31, 2017 215,900 $110.32 $276,182
April 1-30, 2017 227,900 $112.14 $250,626
As of April 30, 2017 443,800 $111.25 $250,626

Total Shareholder Return
$100 $104
$125
$151
$207 $209
$0
$50
$100
$150
$200
$250
2012 2013 2014 2015 2016 2017
In
ve
stme
nt
Fiscal Year
The graph assumes a $100 investment in the Company’s Common Stock on April 30, 2012 and reinvestment of all
dividends. The total shareholder return shown is not intended to be indicative of future returns.
