Attached files
| file | filename |
|---|---|
| 8-K - FORM 8-K - SYNOVUS FINANCIAL CORP | d426968d8k.htm |
| EX-99.2 - EX-99.2 - SYNOVUS FINANCIAL CORP | d426968dex992.htm |
| EX-99.1 - EX-99.1 - SYNOVUS FINANCIAL CORP | d426968dex991.htm |
Exhibit 99.3
Second Quarter 2017 Results
July 18, 2017
Forward Looking Statements
This slide presentation and certain of our other filings with the Securities and Exchange Commission contain statements that constitute “forward-looking
statements” within the meaning of, and subject to the protections of, Section 27A of the Securities Act of 1933, as amended, and Section 21E of the Securities Exchange Act of 1934, as amended. All statements other than statements of
historical fact are forward-looking statements. You can identify these forward-looking statements through Synovus’ use of words such as “believes,” “anticipates,” “expects,” “may,” “will,”
“assumes,” “should,” “predicts,” “could,” “should,” “would,” “intends,” “targets,” “estimates,” “projects,” “plans,” “potential”
and other similar words and expressions of the future or otherwise regarding the outlook for Synovus’ future business and financial performance and/or the performance of the banking industry and economy in general. These forward-looking
statements include, among others, statements on (1) future loan growth; (2) future deposit growth and loan to deposit ratios; (3) future net interest income and net interest margin; (4) future adjusted non-interest income; (5) future non-interest expense levels and e?ciency ratios; (6) future credit trends and key metrics; (7) future e?ective tax rates;
(8) our strategy and initiatives for future growth, capital management, strategic transactions, our brand initiative and ?nancial planning; (9) our expectations regarding the approval and closing of certain transactions, and (10) our
assumptions underlying these expectations. Prospective investors are cautioned that any such forward-looking statements are not guarantees of future performance and involve known and unknown risks and uncertainties which may cause the actual
results, performance or achievements of Synovus to be materially di?erent from the future results, performance or achievements expressed or implied by such forward-looking statements. Forward-looking statements are based on the information known to,
and current beliefs and expectations of, Synovus’ management and are subject to significant risks and uncertainties. Actual results may di?er materially from those contemplated by such forward-looking statements. A number of factors could cause
actual results to di?er materially from those contemplated by the forward-looking statements in this presentation. Many of these factors are beyond Synovus’ ability to control or predict.
These forward-looking statements are based upon information presently known to Synovus’ management and are inherently subjective, uncertain and subject to change due to any
number of risks and uncertainties, including, without limitation, the risks and other factors set forth in Synovus’ filings with the Securities and Exchange Commission, including its Annual Report on Form
10-K for the year ended December 31, 2016 under the captions “Cautionary Notice Regarding Forward-Looking Statements” and “Risk Factors” and in Synovus’ quarterly reports on Form 10-Q and current reports on Form 8-K. We believe these forward-looking statements are reasonable; however, undue reliance should not be placed on any forward-looking
statements, which are based on current expectations and speak only as of the date that they are made. We do not assume any obligation to update any forward-looking statements as a result of new information, future developments or otherwise, except
as otherwise may be required by law.
Use of Non-GAAP Financial Measures
This slide presentation contains certain non-GAAP financial measures determined by methods other than in accordance with generally accepted
accounting principles. Such non-GAAP financial measures include the following: return on average tangible common equity (ROATCE); average core transaction deposits; cost of interest bearing core deposits;
adjusted non-interest income; adjusted non-interest expense; adjusted efficiency ratio; tangible common equity ratio; and common equity Tier 1 (CET1) ratio (fully phased-in). The most comparable GAAP measures to these measures are return on average common equity; total average deposits; effective cost of funds; total non-interest
income; total non-interest expense; efficiency ratio; total shareholders’ equity to total assets ratio; and CET1 ratio, respectively. Management uses these non-GAAP
financial measures to assess the performance of Synovus’ business and the strength of its capital position. Management believes that these non-GAAP financial measures provide meaningful additional
information about Synovus to assist management, investors, and bank regulators in evaluating Synovus’ operating results, financial strength, the performance of its business and the strength of its capital position. However, these non-GAAP financial measures have inherent limitations as analytical tools and should not be considered in isolation or as a substitute for analyses of operating results or capital position as reported under GAAP.
The non-GAAP financial measures should be considered as additional views of the way our financial measures are affected by significant items and other factors, and since they are not required to be uniformly
applied, they may not be comparable to other similarly titled measures at other companies. Return on average tangible common equity is a measure used by management to compare Synovus’ performance with other financial institutions because it
calculates the return available to common shareholders without the impact of intangible assets and their related amortization, thereby allowing management to evaluate the performance of the business consistently. Average core transaction deposits is
a measure used by management to evaluate organic growth of deposits and the quality of deposits as a funding source. The cost of interest bearing core deposits is a measure used to evaluate the cost of deposits as a funding source exclusive of
brokered deposits and non-interest bearing deposits. Adjusted non-interest income is a measure used by management to evaluate
non-interest income exclusive of net investment securities gains/losses and changes in fair value of private equity investments, net. Adjusted non-interest expense and
the adjusted efficiency ratio are measures utilized by management to measure the success of expense management initiatives focused on reducing recurring controllable operating costs. Tangible common equity ratio and common equity Tier 1 (CET1) ratio
(fully phased-in) are used by management and bank regulators to assess the strength of our capital position. The computations of the non-GAAP financial measures used in
this slide presentation are set forth in the Appendix to this slide presentation.
2
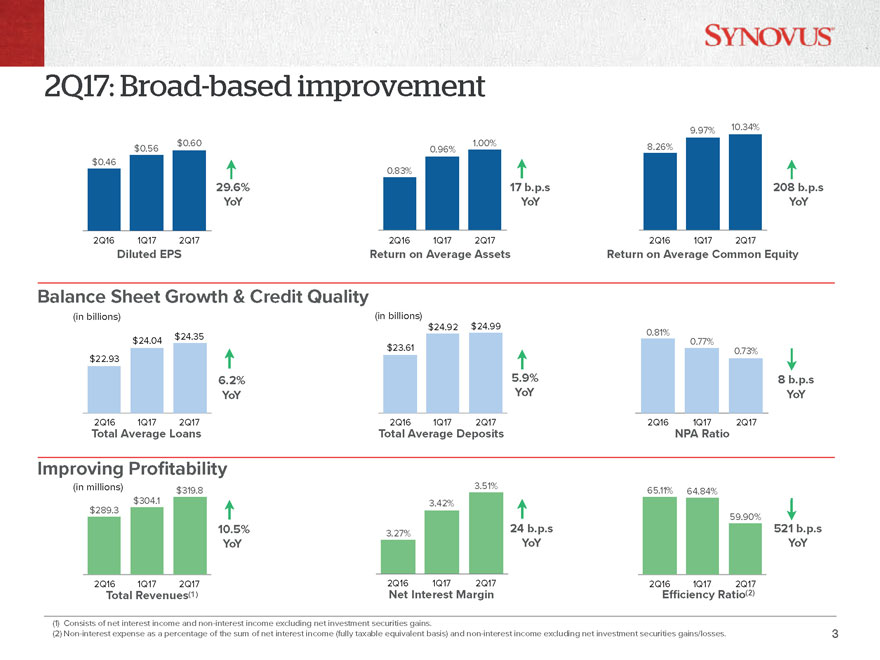
2Q17: Broad-based improvement
9.97% 10.34%
$0.60 1.00% 8.26%
$0.56 0.96%
$0.46
0.83%
29.6% 17 b.p.s 208 b.p.s YoY YoY YoY
2Q16 1Q17 2Q17 2Q16 1Q17 2Q17 2Q16 1Q17 2Q17
Diluted EPS Return on Average Assets Return on
Average Common Equity
Balance Sheet Growth & Credit Quality
(in
billions) (in billions)
$24.92 $24.99
0.81%
$24.35
$24.04 0.77%
$23.61 0.73%
$22.93
6.2% 5.9% 8 b.p.s YoY YoY YoY
2Q16 1Q17 2Q17 2Q16 1Q17 2Q17 2Q16 1Q17 2Q17
Total Average Loans Total Average Deposits NPA Ratio
Improving Profitability
(in millions) 3.51% $319.8 65.11% 64.84% $304.1 3.42% $289.3
59.90%
10.5% 24 b.p.s 521 b.p.s
3.27%
YoY YoY YoY
2Q16 1Q17 2Q17 2Q16 1Q17 2Q17 2Q16 1Q17 2Q17
Total Revenues(1) Net Interest Margin Effciency Ratio(2)
(1) Consists of net interest income
and non-interest income excluding net investment securities gains.
(2) Non-interest
expense as a percentage of the sum of net interest income (fully taxable equivalent basis) and non-interest income excluding net investment securities gains/losses. 3
(1)
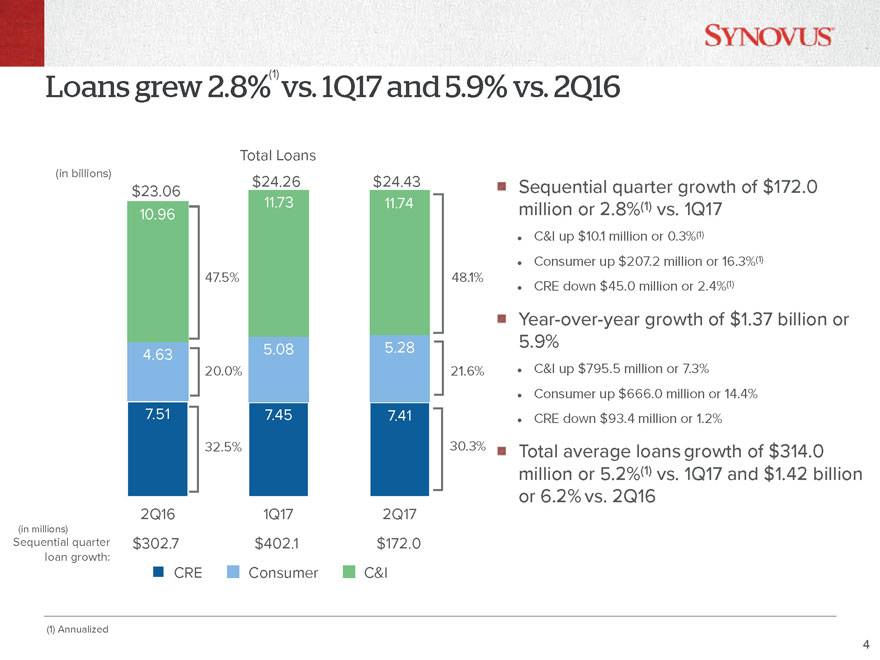
Loans grew
2.8% vs. 1Q17 and 5.9% vs. 2Q16
Total Loans
(in
billions)
$24.26 $24.43 Sequential quarter growth of $172.0
$23.06
11.73 11.74 .8%(1) vs.
10.96 million or 2 1Q17
C&I up $10.1 million or 0.3%(1)
Consumer up $207.2 million or 16.3%(1)
47.5% 48.1%
CRE down $45.0 million or 2.4%(1)
Year-over-year growth of $1.37 billion or
5.28 5.9%
4.63 5.08
20.0% 21.6% C&I up $795.5 million or 7.3%
Consumer up $666.0 million or 14.4%
7.51 7.45 7.41 • CRE down $93.4 million or
1.2%
32.5% 30.3% Total average loans growth of $314.0 million or 5.2%(1) vs. 1Q17 and $1.42 billion or 6.2% vs. 2Q16
2Q16 1Q17 2Q17
(in millions)
Sequential quarter $302.7 $402.1 $172.0 loan growth:
CRE Consumer C&I
(1) Annualized
4
(1)
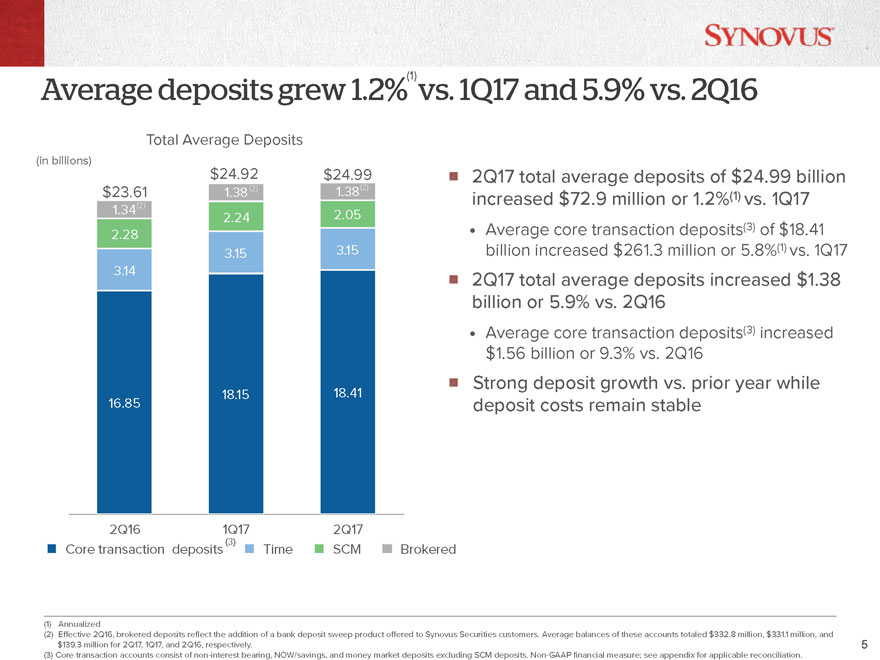
Average deposits grew
1.2% vs. 1Q17 and 5.9% vs. 2Q16
Total Average Deposits
(in billions)
$24.92 $24.99 2Q17 total average deposits of $24.99 billion
$23.61 1.38
(2) 1.38(2) increased $72.9 million or 1.2%(1) vs. 1Q17
1.34(2) 2.05
2.24
Average core transaction deposits(3) of $18.41
2.28
3.15 billion increased $261.3 million or 5.8%(1) vs. 1Q17
3.15
3.14
2Q17 total average deposits increased $1.38 billion or 5.9% vs. 2Q16
Average core transaction deposits(3) increased $1.56 billion or 9.3% vs. 2Q16
Strong deposit growth vs. prior year while
18.15 18.41
16.85 deposit costs remain stable
2Q16 1Q17 2Q17
(3)
Core transaction deposits Time SCM Brokered
(1) Annualized
(2) Effective 2Q16, brokered deposits reflect the addition of a bank deposit
sweep product offered to Synovus Securities customers. Average balances of these accounts totaled $332.8 million, $331.1 million,
and $139.3 million for 2Q17, 1Q17, and 2Q16, respectively. 5 (3) Core transaction accounts consist of
non-interest bearing, NOW/savings, and money market deposits excluding SCM deposits. Non-GAAP financial measure; see appendix for applicable reconciliation.
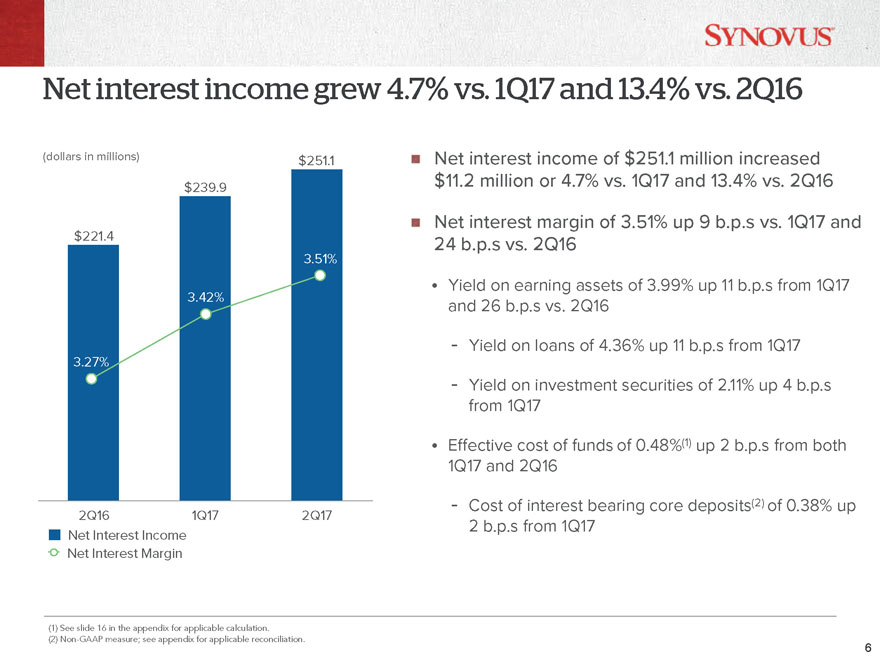
Net interest income grew 4.7% vs. 1Q17 and 13.4% vs. 2Q16
(dollars in millions) $251.1 Net interest income of $251.1 million increased $239.9 $11.2 million or 4.7% vs. 1Q17 and 13.4% vs. 2Q16 Net interest margin of 3.51% up 9
b.p.s vs. 1Q17 and $221.4 24 b.p.s vs. 2Q16
3.51%
3.42% Yield on earning
assets of 3.99% up 11 b.p.s from 1Q17 and 26 b.p.s vs. 2Q16
- Yield on loans of 4.36% up 11 b.p.s from 1Q17
3.27%
- Yield on investment securities of 2.11% up 4 b.p.s from 1Q17
Effective cost of funds of 0.48%(1) up 2 b.p.s from both 1Q17 and 2Q16
- Cost of interest
bearing core deposits(2) of 0.38% up
2Q16 1Q17 2Q17
2 b.p.s from 1Q17
Net Interest Income Net Interest Margin
(1) See slide 16 in the appendix for
applicable calculation.
(2) Non-GAAP measure; see appendix for applicable reconciliation.
6
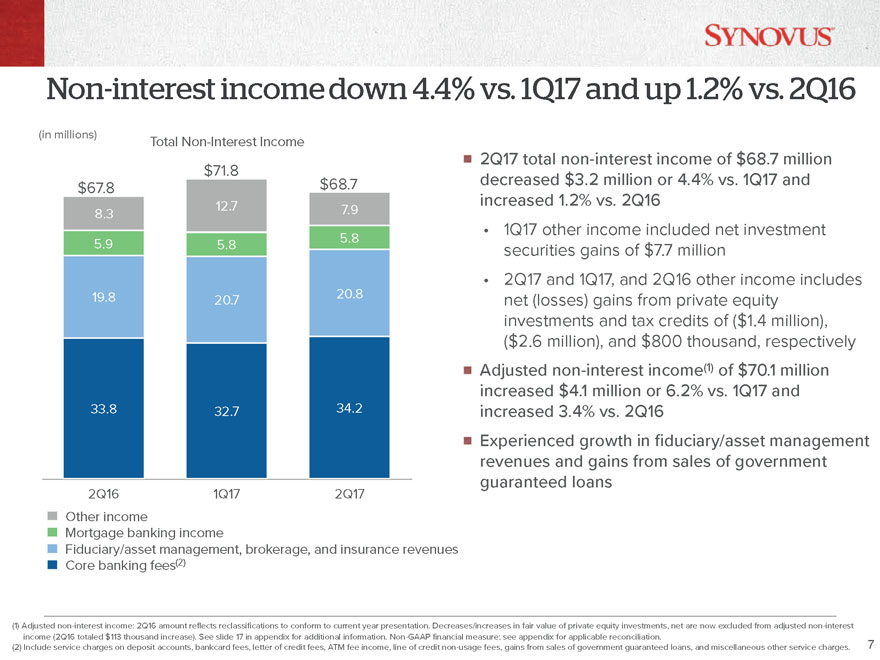
Non-interest income down 4.4% vs. 1Q17 and up 1.2% vs. 2Q16
(in millions)
Total Non-Interest Income
2Q17 total non-interest income of $68.7 million
$71.8
$68.7 decreased $3.2 million or 4.4% vs. 1Q17 and
$67.8
12.7 increased 1.2% vs. 2Q16
8.3 7.9
1Q17 other income included net investment
5.8
5.9 5.8 securities gains of $7.7 million
2Q17 and 1Q17, and 2Q16 other income includes
19.8 20.8
20.7 net (losses) gains from private equity investments and tax credits of ($1.4 million),
($2.6 million), and $800 thousand, respectively
Adjusted non-interest income(1) of $70.1 million increased $4.1 million or 6.2% vs. 1Q17 and
33.8 32.7 34.2 increased 3.4% vs.
2Q16
Experienced growth in fiduciary/asset management revenues and gains from sales of government 2Q16 1Q17 2Q17 guaranteed loans
Other income
Mortgage banking income
Fiduciary/asset management, brokerage, and insurance revenues Core banking fees(2)
(1)
Adjusted non-interest income: 2Q16 amount reflects reclassifications to conform to current year presentation. Decreases/increases in fair value of private equity investments, net are now excluded from adjusted
non-interest income (2Q16 totaled $113 thousand increase). See slide 17 in appendix for additional
information. Non-GAAP financial measure; see appendix for applicable reconciliation.
(2) Include service charges on deposit
accounts, bankcard fees, letter of credit fees, ATM fee income, line of credit non-usage fees, gains from sales of government guaranteed loans, and miscellaneous other service charges. 7
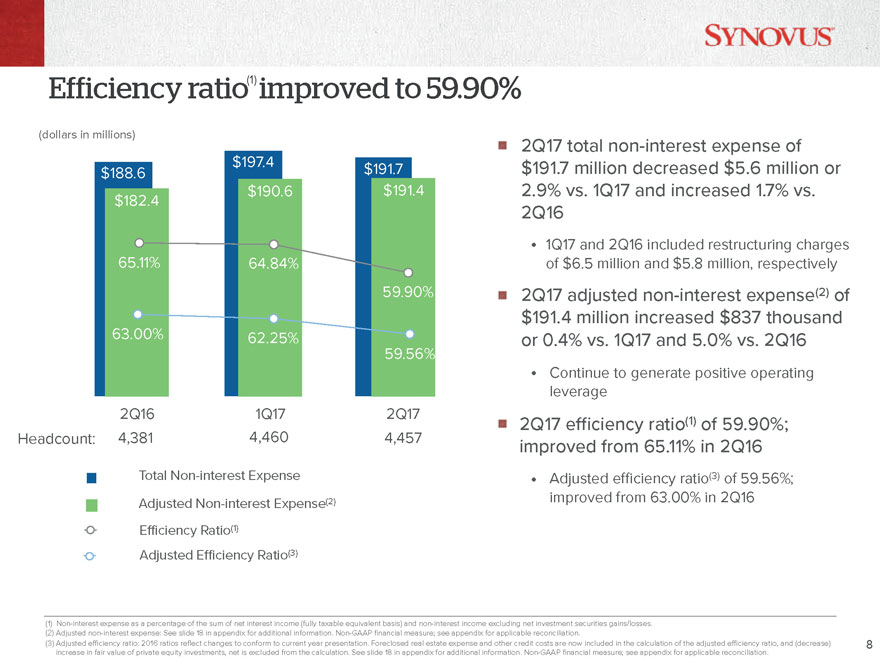
Efficiency ratio(1) improved to 59.90%
(dollars in millions)
2Q17 total non-interest expense
of $197.4 $191.7 million decreased $5.6 million or .4 2.9% vs. 1Q17 and increased 1.7% vs.
$182
2Q16
1Q17 and 2Q16 included restructuring charges
65.11% 64.84% of $6.5 million and $5.8 million, respectively
59.90% 2Q17 adjusted non-interest expense(2) of $191.4 million increased $837 thousand
63.00% 62.25% or 0.4% vs. 1Q17 and 5.0% vs. 2Q16
59.56%
Continue to generate positive operating leverage
2Q16 1Q17 2Q17
2Q17 efficiency ratio(1) of 59.90%;
Headcount: 4,381 4,460 4,457
improved from 65.11% in 2Q16
Total Non-interest Expense • Adjusted efficiency ratio(3) of 59.56%; (2) improved from 63.00% in 2Q16
Adjusted Non-interest Expense Ratio(1)
Efficiency
Ratio(3)
(1) Non-interest expense as a percentage of the sum of net interest income (fully taxable equivalent basis) and non-interest income excluding net investment securities gains/losses. (2) Adjusted non-interest expense: See slide 18 in appendix for additional information. Non-GAAP financial measure; see appendix for applicable reconciliation.
(3) Adjusted efficiency ratio: 2016 ratios reflect
changes to conform to current year presentation. Foreclosed real estate expense and other credit costs are now included in the calculation of the adjusted efficiency ratio, and (decrease)
8 increase in fair value of private equity investments, net is excluded from the calculation. See slide 18 in appendix for additional information. Non-GAAP financial measure; see appendix for applicable reconciliation.
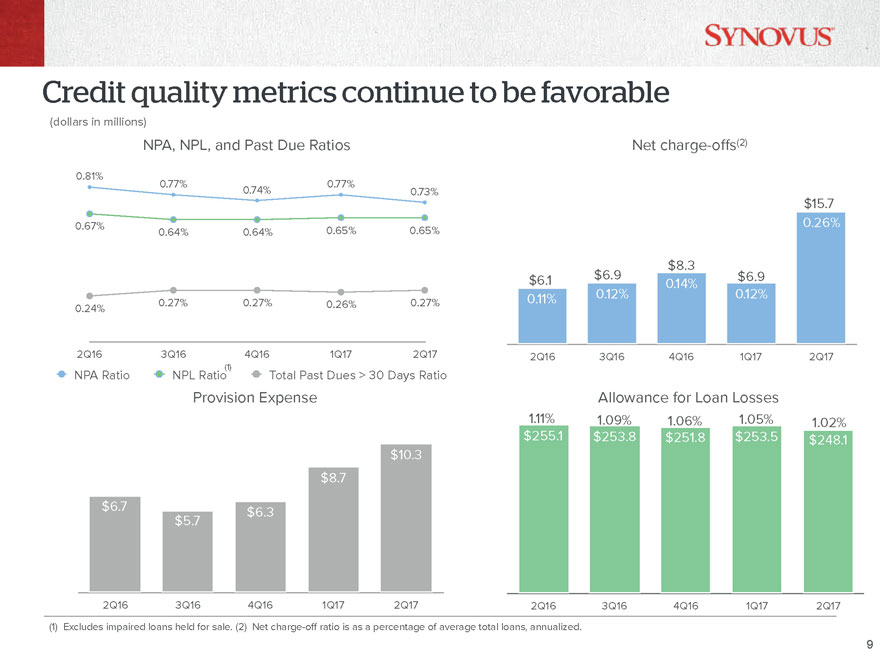
Credit quality metrics continue to be favorable
(dollars in millions)
NPA, NPL, and Past Due Ratios Net charge-offs(2)
0.90%
0.81%
0.77% 0.77%
0.80% 0.74% 0.73% 0.30%
$15.7
0.70%
0.67% 0.26%
0.60% 0.64% 0.64% 0.65% 0.65%
0.50%
0.40% 0.15% $8.3
$6.1 $6.9 $6.9
0.30% 0.14%
0.11% 0.12% 0.12%
0.20% 0.27% 0.27% 0.26% 0.27%
0.24%
0.10%
2Q16 3Q16 4Q16 1Q17 2Q17 0.00%
2Q16 3Q16 4Q16 1Q17 2Q17
(1)
NPA Ratio NPL Ratio Total Past Dues > 30 Days Ratio
Provision Expense Allowance for Loan Losses
$12 $260 1.11% 1.09% 1.06% 1.05% 1.02% $255.1
$253.8 $251.8 $253.5 $248.1
$10.3
$8.7
$6 $6.7 $130
$6.3
$5.7
$0 $0
2Q16 3Q16 4Q16 1Q17 2Q17 2Q16 3Q16 4Q16 1Q17 2Q17
(1) Excludes impaired loans
held for sale. (2) Net charge-off ratio is as a percentage of average total loans, annualized.
9
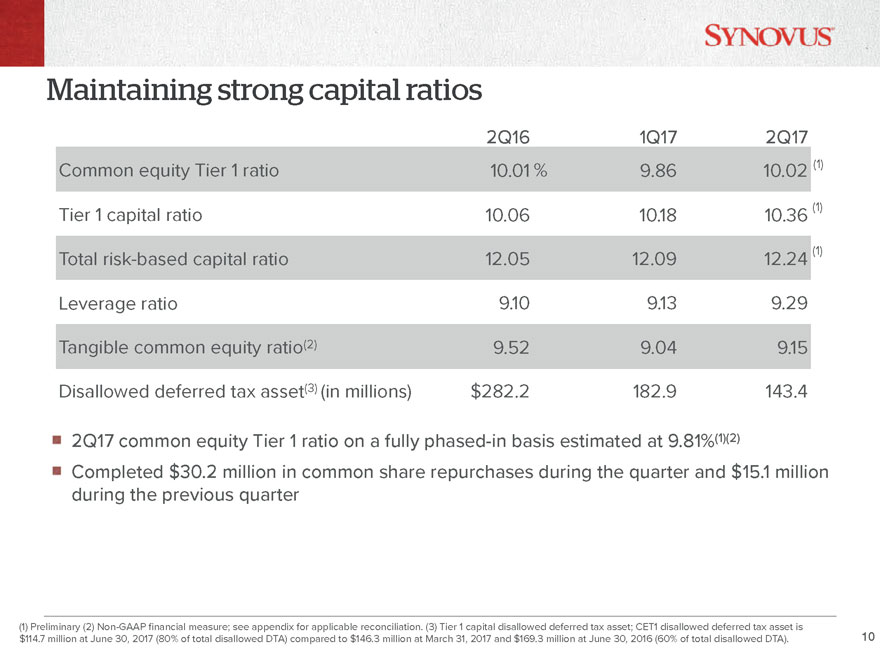
Maintaining strong capital ratios
2Q16 1Q17 2Q17
Common equity Tier 1 ratio 10.01 % 9.86 10.02 (1)
(1)
Tier 1 capital ratio 10.06 10.18 10.36
(1)
Total risk-based capital ratio 12.05 12.09 12.24 Leverage ratio 9.10 9.13 9.29 Tangible
common equity ratio(2) 9.52 9.04 9.15 Disallowed deferred tax asset(3) (in millions) $282.2 182.9 143.4
2Q17 common equity Tier 1 ratio on a fully phased-in basis estimated at 9.81%(1)(2)
Completed $30.2 million in common share repurchases during the quarter and
$15.1 million during the previous quarter
(1) Preliminary (2) Non-GAAP financial measure; see appendix for
applicable reconciliation. (3) Tier 1 capital disallowed deferred tax asset; CET1 disallowed deferred tax asset is $114.7 million at June 30, 2017 (80% of total disallowed DTA) compared to $146.3 million at March 31, 2017
and $169.3 million at June 30, 2016 (60% of total disallowed DTA). 10
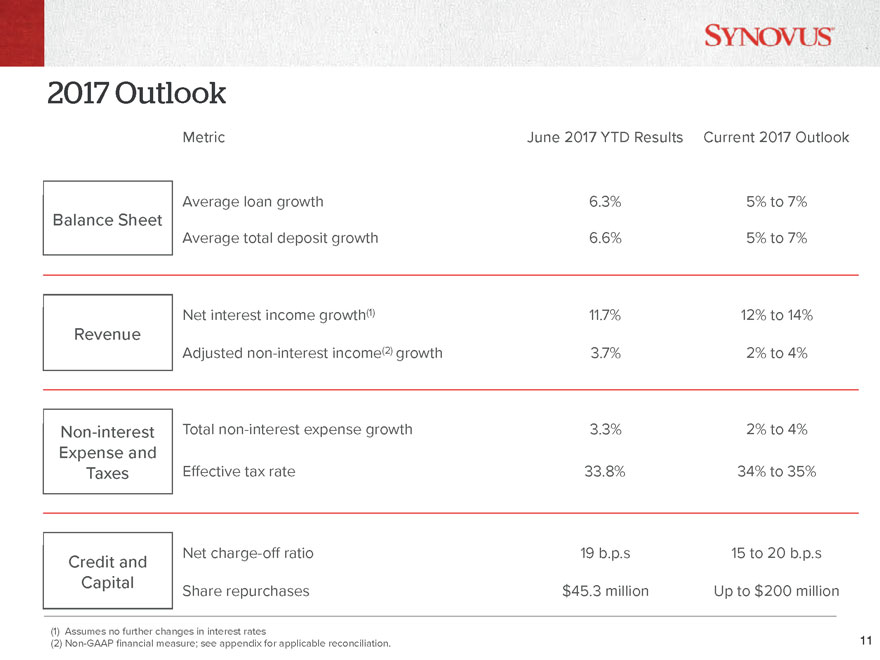
2017 Outlook
Metric June
2017 YTD Results Current 2017 Outlook
Average loan growth 6.3% 5% to 7%
Balance Sheet
Average total deposit growth 6.6% 5% to 7%
Net interest income growth(1) 11.7% 12% to 14%
Revenue
Adjusted non-interest income(2) growth 3.7% 2% to 4%
Non-interest Total non-interest expense growth 3.3% 2% to 4%
Expense and
Taxes Effective tax rate 33.8% 34% to 35%
Net
charge-off ratio 19 b.p.s 15 to 20 b.p.s
Credit and Capital
Share repurchases $45.3 million Up to $200 million
(1) Assumes no further changes in
interest rates
(2) Non-GAAP financial measure; see appendix for applicable reconciliation. 11

Appendix
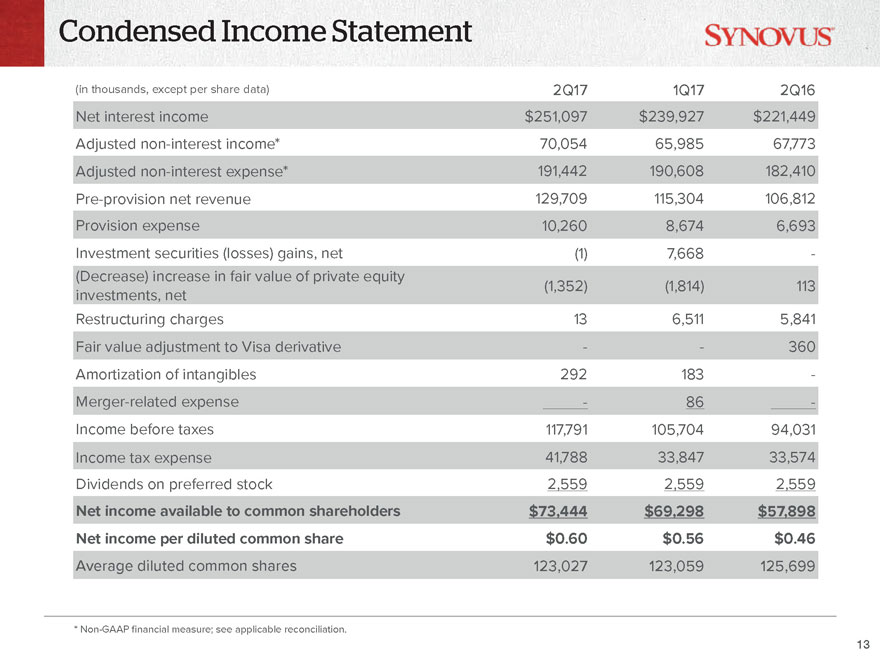
Condensed Income Statement
(in thousands, except per share data) 2Q17 1Q17 2Q16
Net interest income
$251,097 $239,927 $221,449 Adjusted non-interest income* 70,054 65,985 67,773 Adjusted non-interest expense* 191,442 190,608 182,410
Pre-provision net revenue 129,709 115,304 106,812 Provision expense 10,260 8,674 6,693 Investment securities (losses) gains, net (1) 7,668 -(Decrease) increase in fair value of private equity (1,352) (1,814)
113 investments, net Restructuring charges 13 6,511 5,841 Fair value adjustment to Visa derivative - - 360 Amortization of intangibles 292 183 -Merger-related
expense - 86 -Income before taxes
117,791 105,704 94,031 Income tax expense 41,788 33,847 33,574 Dividends on preferred stock 2,559 2,559 2,559
Net income available to common shareholders $73,444
$69,298 $57,898 Net income per diluted common share $0.60 $0.56 $0.46
Average diluted common shares 123,027 123,059 125,699
* Non-GAAP financial measure; see applicable reconciliation.
13
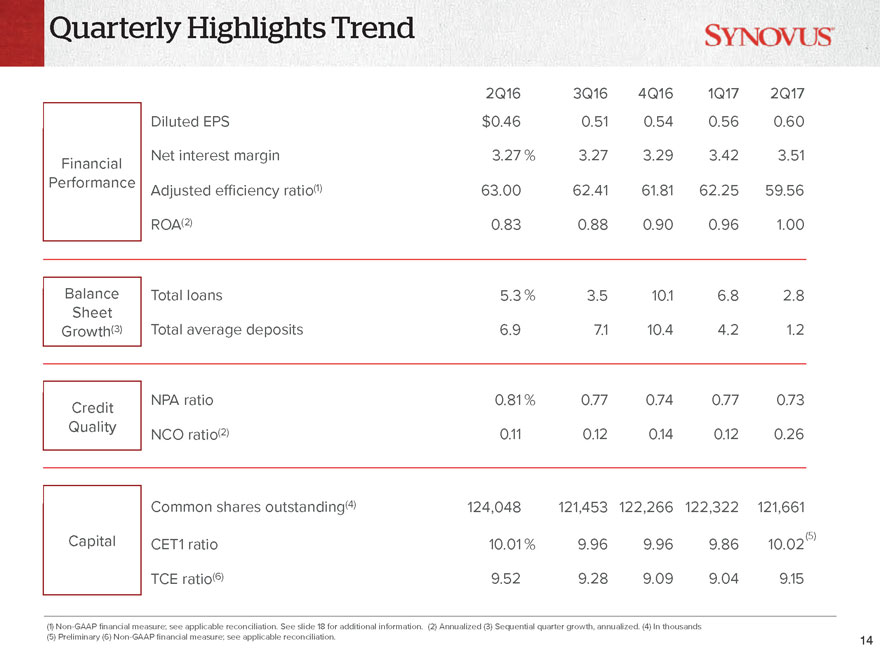
Quarterly Highlights Trend
2Q16 3Q16 4Q16 1Q17 2Q17
Diluted EPS $0.46 0.51 0.54 0.56 0.60
Net interest margin 3.27 % 3.27 3.29 3.42 3.51
Financial
Performance (1)
Adjusted efficiency ratio 63.00 62.41 61.81 62.25 59.56
ROA(2) 0.83 0.88 0.90 0.96 1.00
Balance Total loans 5.3 % 3.5 10.1 6.8 2.8
Sheet
Growth(3) Total average deposits 6.9 7.1 10.4 4.2 1.2
NPA ratio 0.81 % 0.77 0.74 0.77 0.73
Credit
Quality (2)
NCO ratio 0.11 0.12 0.14 0.12 0.26
Common shares outstanding(4) 124,048 121,453 122,266 122,322 121,661
Capital (5)
CET1 ratio 10.01 % 9.96 9.96 9.86 10.02
TCE ratio(6) 9.52 9.28 9.09 9.04 9.15
(1) Non-GAAP financial measure; see applicable reconciliation. See slide 18 for additional information. (2) Annualized (3) Sequential
quarter growth, annualized. (4) In thousands
(5) Preliminary (6) Non-GAAP financial measure; see applicable reconciliation. 14
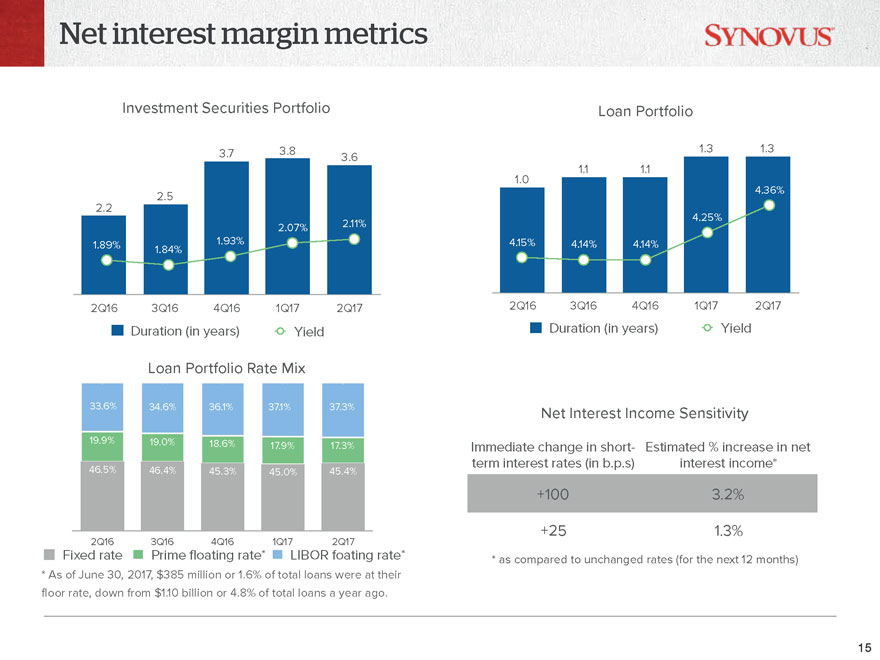
Net interest margin metrics
Net Interest Margin Trend
Investment Securities Portfolio Loan Portfolio
Net Interest Margin Trend Net Interest Margin Trend
3.8 1.3 1.3
3.7 3.6
1.1 1.1 1.0
4.36%
2.5
2.2
4.25%
2.07% 2.11%
1.89% 1.84% 1.93% 4.15% 4.14% 4.14%
2Q16 3Q16 4Q16 1Q17 2Q17 2Q16 3Q16 4Q16 1Q17 2Q17
Duration (in years) Yield Duration (in
years) Yield
Loan Net Interest Portfolio Margin Rate Trend Mix
0.3 0.3 0.4
0.4 0.4
33.6% 34.6% 36.1% 37.1% 37.3%
Net Interest Income Sensitivity
19.9% 19.0% 18.6%
17.9% 17.3% Immediate change in short- Estimated % increase
in net term interest rates (in b.p.s) interest income*
46.5% 46.4% 45.3% 45.0% 45.4%
+100 3.2%
+25 1.3%
2Q16 3Q16 4Q16 1Q17 2Q17
Fixed rate Prime floating rate* LIBOR floating rate*
* as compared to unchanged rates (for the next 12 months)
* As of June 30, 2017,
$385 million or 1.6% of total loans were at their floor rate, down from $1.10 billion or 4.8% of total loans a year ago.
15
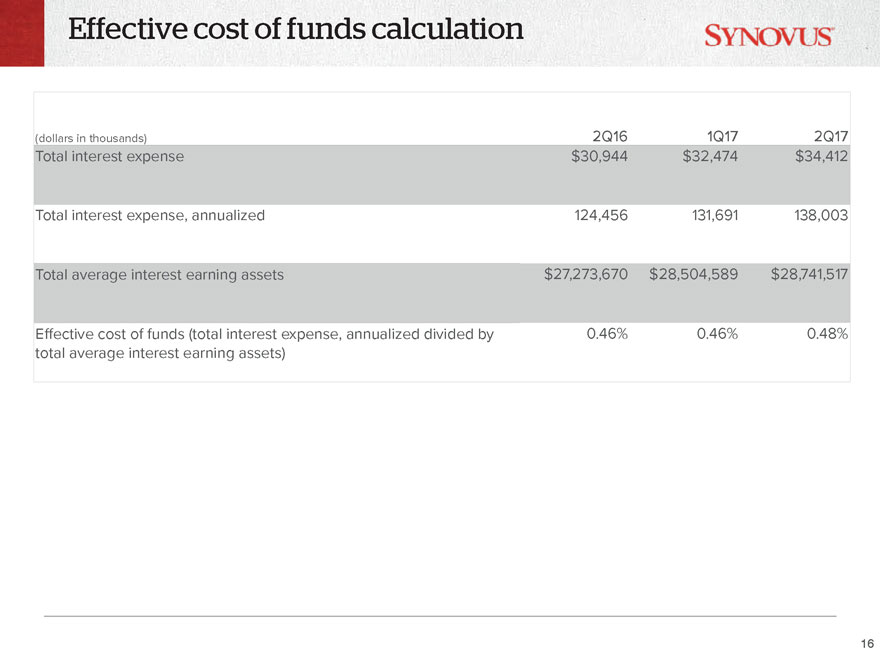
Effective cost of funds calculation
(dollars in thousands) 2Q16 1Q17 2Q17
Total interest expense $30,944 $32,474 $34,412 Total
interest expense, annualized 124,456 131,691 138,003 Total average interest earning assets $27,273,670 $28,504,589 $28,741,517
Effective cost of funds (total
interest expense, annualized divided by 0.46% 0.46% 0.48% total average interest earning assets)
16
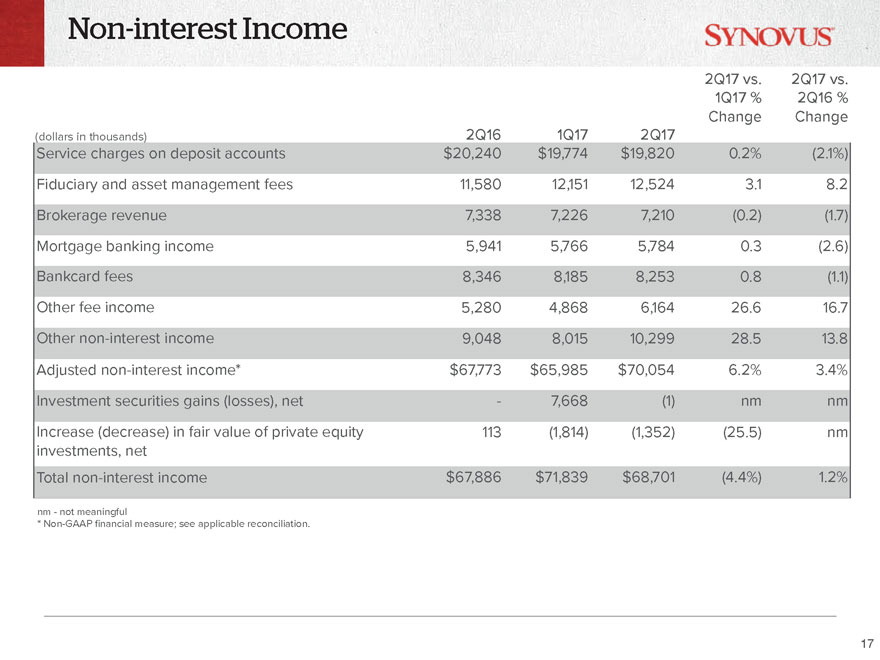
Non-interest Income
2Q17 vs. 2Q17 vs. 1Q17 % 2Q16 % Change Change
(dollars in thousands) 2Q16 1Q17 2Q17
Service charges on deposit accounts $20,240 $19,774 $19,820 0.2% (2.1%) Fiduciary and asset management fees 11,580 12,151 12,524 3.1 8.2 Brokerage revenue 7,338
7,226 7,210 (0.2) (1.7) Mortgage banking income 5,941 5,766 5,784 0.3 (2.6) Bankcard fees 8,346 8,185 8,253 0.8 (1.1) Other fee income 5,280 4,868 6,164 26.6 16.7 Other non-interest income 9,048 8,015 10,299
28.5 13.8 Adjusted non-interest income* $67,773 $65,985 $70,054 6.2% 3.4% Investment securities gains (losses), net - 7,668 (1) nm nm
Increase (decrease) in fair value of private equity 113 (1,814) (1,352) (25.5) nm investments, net Total non-interest income $67,886 $71,839
$68,701 (4.4%) 1.2%
nm - not meaningful
*
Non-GAAP financial measure; see applicable reconciliation.
17
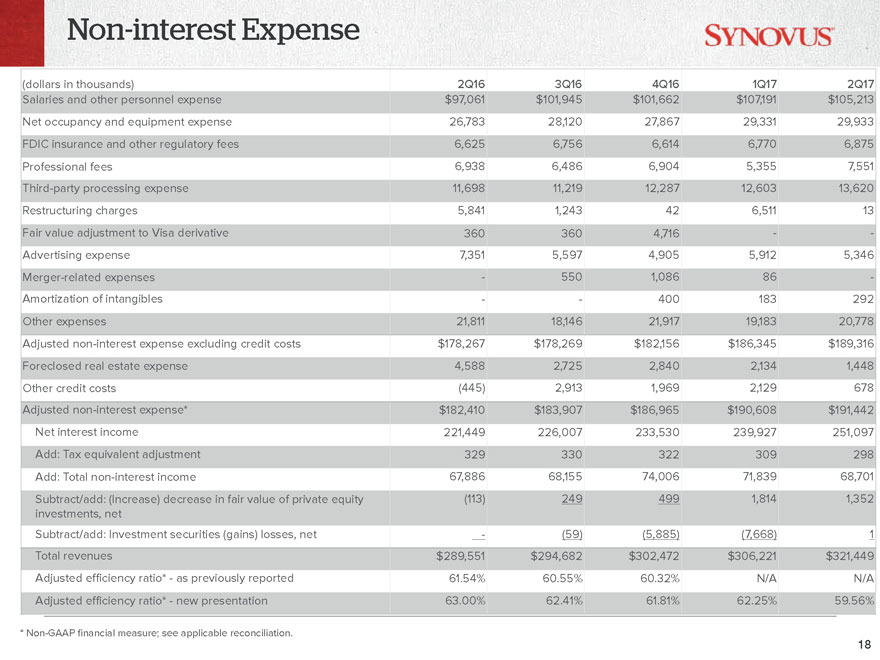
Non-interest Expense
(dollars in thousands) 2Q16 3Q16 4Q16 1Q17 2Q17 Salaries and other personnel expense $97,061 $101,945 $101,662 $107,191 $105,213
Net occupancy and equipment expense 26,783 28,120 27,867 29,331 29,933
FDIC insurance and
other regulatory fees 6,625 6,756 6,614 6,770 6,875
Professional fees 6,938 6,486 6,904 5,355 7,551 Third-party processing expense 11,698 11,219 12,287 12,603
13,620
Restructuring charges 5,841 1,243 42 6,511 13
Fair value adjustment to
Visa derivative 360 360 4,716 - -Advertising expense 7,351 5,597 4,905 5,912 5,346
Merger-related expenses - 550 1,086 86 -Amortization of intangibles - - 400 183
292
Other expenses 21,811 18,146 21,917 19,183 20,778 Adjusted non-interest expense excluding credit costs $178,267
$178,269 $182,156 $186,345 $189,316 Foreclosed real estate expense 4,588 2,725 2,840 2,134 1,448
Other credit costs (445) 2,913 1,969 2,129 678 Adjusted non-interest expense* $182,410 $183,907 $186,965 $190,608 $191,442
Net interest income 221,449 226,007 233,530 239,927 251,097
Add: Tax equivalent adjustment 329 330 322 309 298 Add: Total non-interest income 67,886 68,155 74,006 71,839 68,701
Subtract/add: (Increase) decrease in fair value of private equity (113) 249 499 1,814 1,352 investments, net Subtract/add: Investment securities (gains) losses,
net - (59) (5,885) (7,668) 1 Total revenues $289,551 $294,682 $302,472 $306,221 $321,449
Adjusted efficiency ratio* - as previously reported
61.54% 60.55% 60.32% N/A N/A
Adjusted efficiency ratio* - new presentation 63.00% 62.41% 61.81% 62.25% 59.56%
* Non-GAAP financial measure; see applicable reconciliation.
18
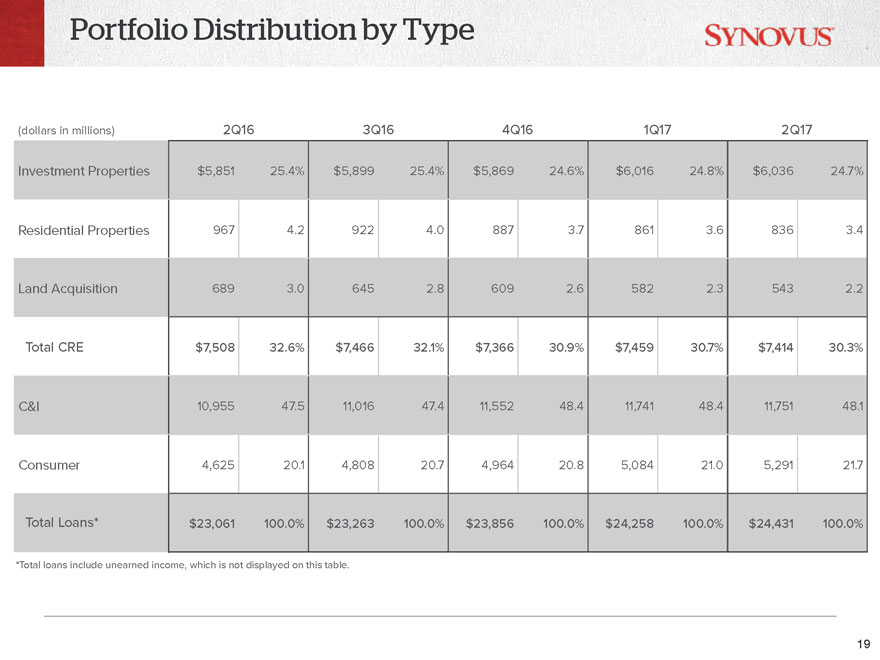
Portfolio Distribution by Type
(dollars in millions) 2Q16 3Q16 4Q16 1Q17 2Q17
Investment Properties $5,851 25.4% $5,899 25.4%
$5,869 24.6% $6,016 24.8% $6,036 24.7% Residential Properties 967 4.2 922 4.0 887 3.7 861 3.6 836 3.4 Land Acquisition 689 3.0 645 2.8 609 2.6 582 2.3 543 2.2
Total CRE $7,508 32.6% $7,466 32.1% $7,366 30.9% $7,459 30.7% $7,414 30.3%
C&I 10,955 47.5 11,016 47.4 11,552 48.4 11,741 48.4 11,751 48.1
Consumer
4,625 20.1 4,808 20.7 4,964 20.8 5,084 21.0 5,291 21.7
Total Loans* $23,061 100.0% $23,263 100.0% $23,856 100.0% $24,258 100.0% $24,431 100.0%
*Total loans include unearned income, which is not displayed on this table.
19
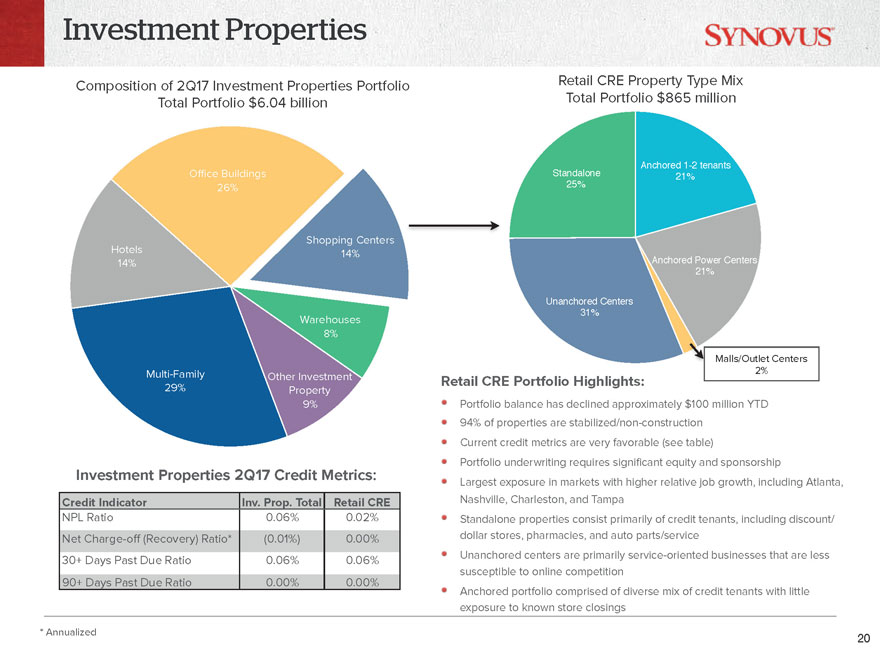
Investment Properties
Composition of 2Q17 Investment Properties Portfolio Retail CRE Property Type Mix Total Portfolio $6.04 billion Total Portfolio $865 million
Anchored 1-2 tenants
Office Buildings Standalone 21%
26% 25%
Shopping Centers Hotels 14%
14% Anchored Power Centers 21%
Unanchored Centers 31%
Warehouses 8%
Malls/Outlet Centers
Multi-Family 2%
Other Investment Retail CRE Portfolio Highlights:
29% Property
9% Portfolio balance has declined approximately $100 million YTD 94% of properties are stabilized/non-construction Current credit
metrics are very favorable (see table) Portfolio underwriting requires significant equity and sponsorship
Investment Properties 2Q17 Credit Metrics:
Largest exposure in markets with higher relative job growth, including Atlanta,
Credit
Indicator Inv. Prop. Total Retail CRE Nashville, Charleston, and Tampa
NPL Ratio 0.06% 0.02% Standalone properties consist primarily of credit tenants, including
discount/ Net Charge-off (Recovery) Ratio* (0.01%) 0.00% dollar stores, pharmacies, and auto parts/service Unanchored centers are primarily service-oriented businesses that are less
30+ Days Past Due Ratio 0.06% 0.06% susceptible to online competition
90+ Days Past Due Ratio
0.00% 0.00% Anchored portfolio comprised of diverse mix of credit tenants with little exposure to known store closings
* Annualized
20
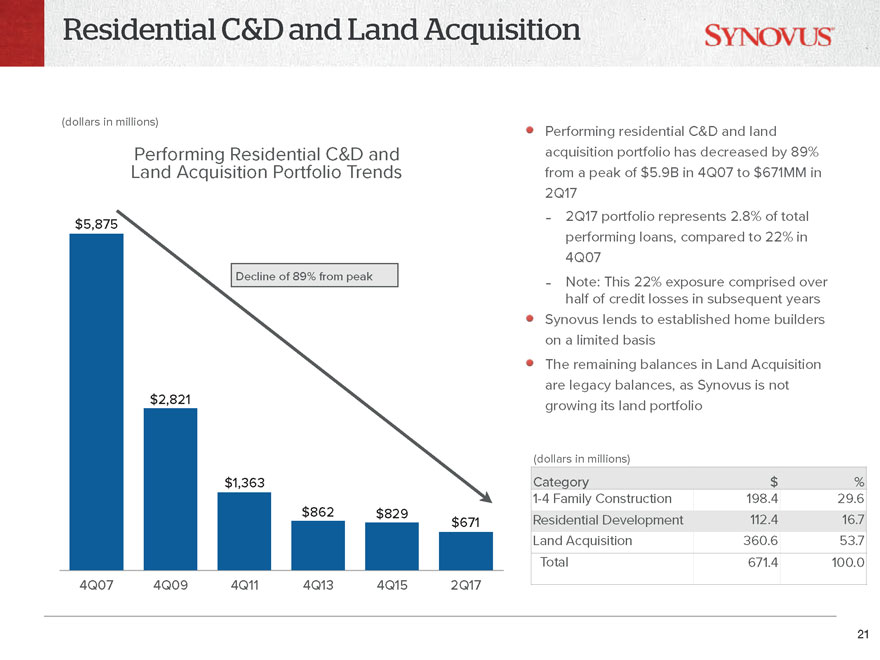
Residential C&D and Land Acquisition
(dollars in millions)
Performing residential C&D and land
Performing Residential C&D and acquisition portfolio has decreased by 89% Land Acquisition Portfolio Trends from a peak of $5.9B in 4Q07 to $671MM in 2Q17
- 2Q17 portfolio represents 2.8% of total $5,875 performing loans, compared to 22% in 4Q07 Decline of 89% from peak - Note: This 22% exposure comprised over half of credit losses
in subsequent years Synovus lends to established home builders on a limited basis The remaining balances in Land Acquisition are legacy balances, as Synovus is not $2,821 growing its land portfolio
(dollars in millions)
$1,363 Category $ %
1-4 Family Construction 198.4 29.6 $862 $829 $671 Residential Development 112.4 16.7 Land Acquisition 360.6
53.7 Total 671.4 100.0
4Q07 4Q09 4Q11 4Q13 4Q15 2Q17
21
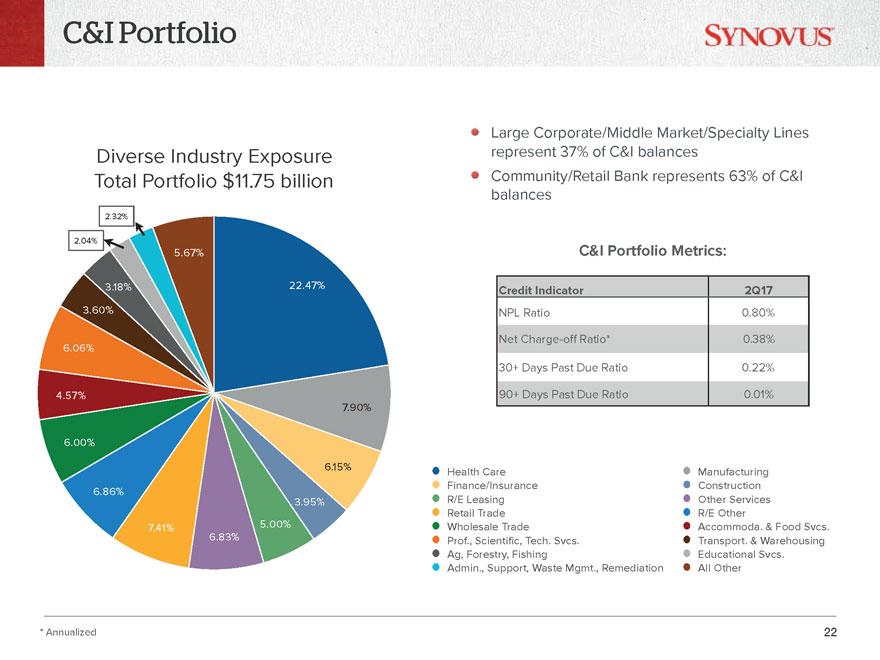
C&I Portfolio
Large
Corporate/Middle Market/Specialty Lines Diverse Industry Exposure represent 37% of C&I balances Total Portfolio $11.75 billion Community/Retail Bank represents 63% of C&I balances
2.32%
2.04% C&I Portfolio Metrics:
5.67%
3.18% 22.47%
Credit Indicator 2Q17
3.60% NPL Ratio 0.80%
6.06% Net Charge-off Ratio* 0.38% 30+ Days Past Due Ratio 0.22%
4.57% 90+ Days Past Due Ratio 0.01%
7.90%
6.00%
6.15%
Health Care Manufacturing Finance/Insurance Construction
6.86%
3.95% R/E Leasing Other Services Retail Trade R/E Other
7.41% 5.00% Wholesale Trade Accommoda.
& Food Svcs.
6.83% Prof., Scienti?c, Tech. Svcs. Transport. & Warehousing Ag, Forestry, Fishing Educational Svcs.
Admin., Support, Waste Mgmt., Remediation All Other
* Annualized 22
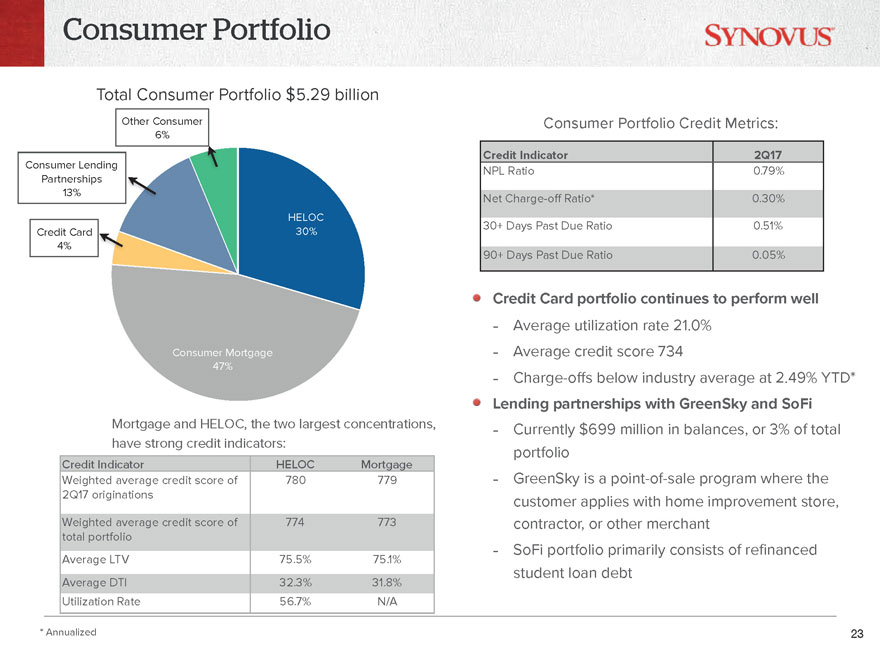
Consumer Portfolio
Total
Consumer Portfolio $5.29 billion
Other Consumer Consumer Portfolio Credit Metrics:
6%
Credit Indicator 2Q17
Consumer Lending
NPL Ratio 0.79%
Partnerships 13%
Net Charge-off Ratio* 0.30%
HELOC
30+ Days Past Due Ratio 0.51%
Credit Card 30%
4% 90+ Days Past Due Ratio 0.05%
Credit Card portfolio continues to perform well
- Average utilization rate 21.0% Consumer
Mortgage - Average credit score 734
47%
- Charge-offs below industry average
at 2.49% YTD*
Lending partnerships with GreenSky and SoFi
Mortgage and HELOC,
the two largest concentrations, - Currently $699 million in balances, or 3% of total have strong credit indicators:
portfolio
Credit Indicator HELOC Mortgage
Weighted average credit score of 780 779 - GreenSky is a point-of-sale program where the
2Q17 originations
customer applies with home improvement store,
Weighted average credit score of 774 773
contractor, or other merchant total portfolio
- SoFi portfolio primarily consists of refinanced
Average LTV 75.5% 75.1%
student loan debt
Average DTI 32.3% 31.8% Utilization Rate 56.7% N/A
* Annualized 23
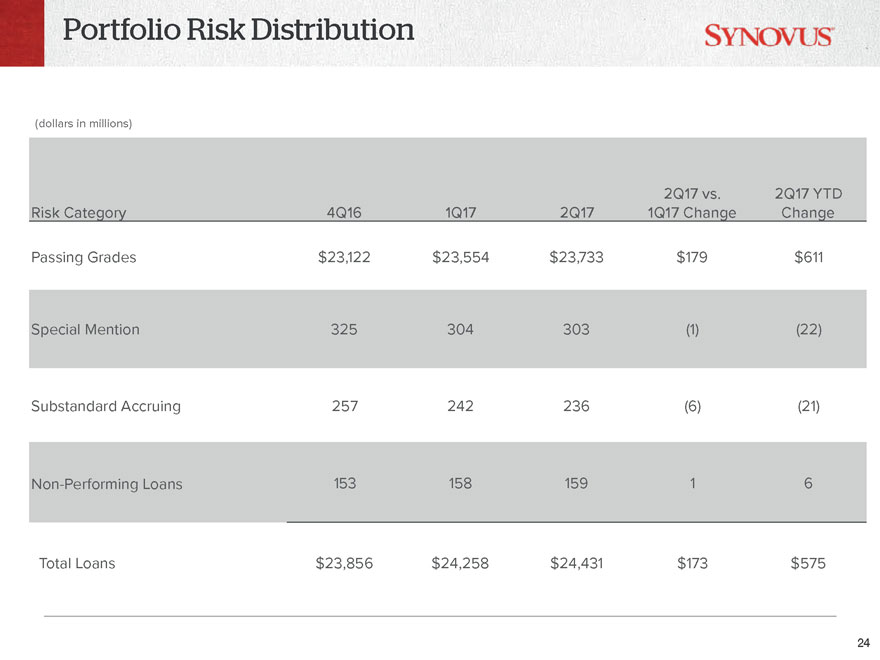
Portfolio Risk Distribution
(dollars in millions)
2Q17 vs. 2Q17 YTD Risk Category 4Q16 1Q17 2Q17 1Q17
Change Change
Passing Grades $23,122 $23,554 $23,733 $179 $611 Special Mention 325 304 303 (1) (22) Substandard Accruing 257 242 236 (6) (21) Non-Performing Loans 153 158 159 1 6 Total Loans $23,856 $24,258 $24,431 $173 $575
24
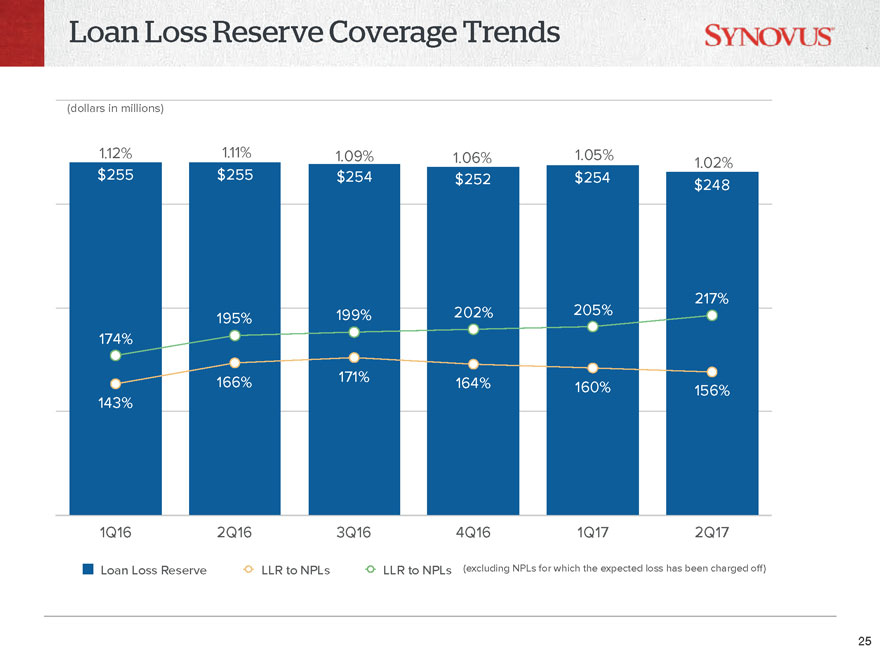
Loan Loss Reserve Coverage Trends
(dollars in millions)
1.12% 1.11% 1.09% 1.06% 1.05% $255 $255 1.02% $254 $252 $254 $248
217% 199% 202% 205% 195% 174%
166% 171% 164%
160% 156% 143%
1Q16 2Q16 3Q16 4Q16 1Q17 2Q17
Loan Loss Reserve LLR to NPLs LLR to NPLs (excluding NPLs for which the expected loss has been charged off)
25
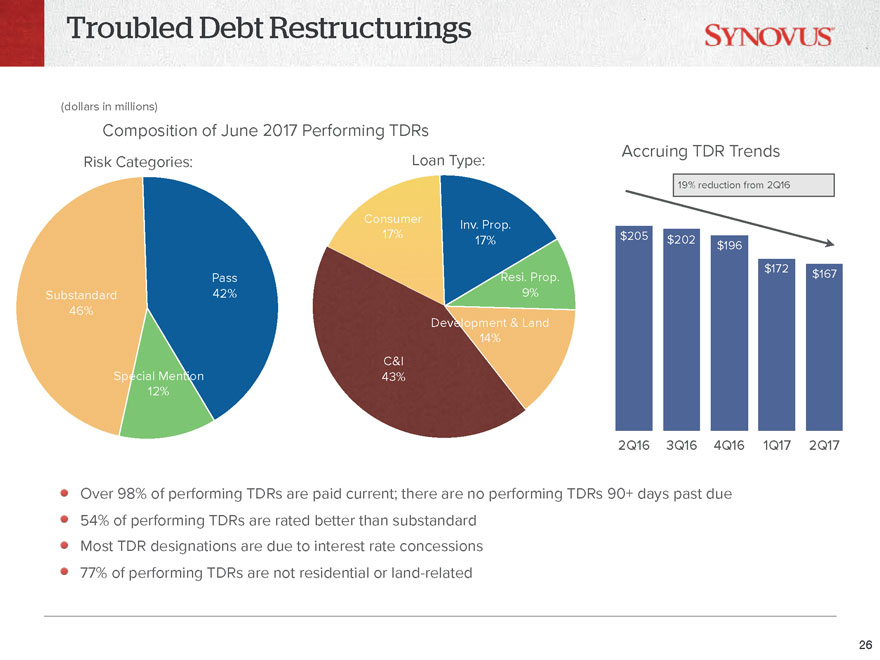
Troubled Debt Restructurings
(dollars in millions)
Composition of June 2017 Performing TDRs
Accruing TDR Trends
Risk Categories: Loan Type:
19% reduction from 2Q16
Consumer
Inv. Prop.
17% $205
17% $202 $196
$172
Pass Resi. Prop. $167 Substandard 42% 9% 46% Development & Land 14%
C&I Special
Mention 43% 12%
2Q16 3Q16 4Q16 1Q17 2Q17
Over 98% of performing TDRs are paid
current; there are no performing TDRs 90+ days past due 54% of performing TDRs are rated better than substandard Most TDR designations are due to interest rate concessions 77% of performing TDRs are not residential or land-related
26
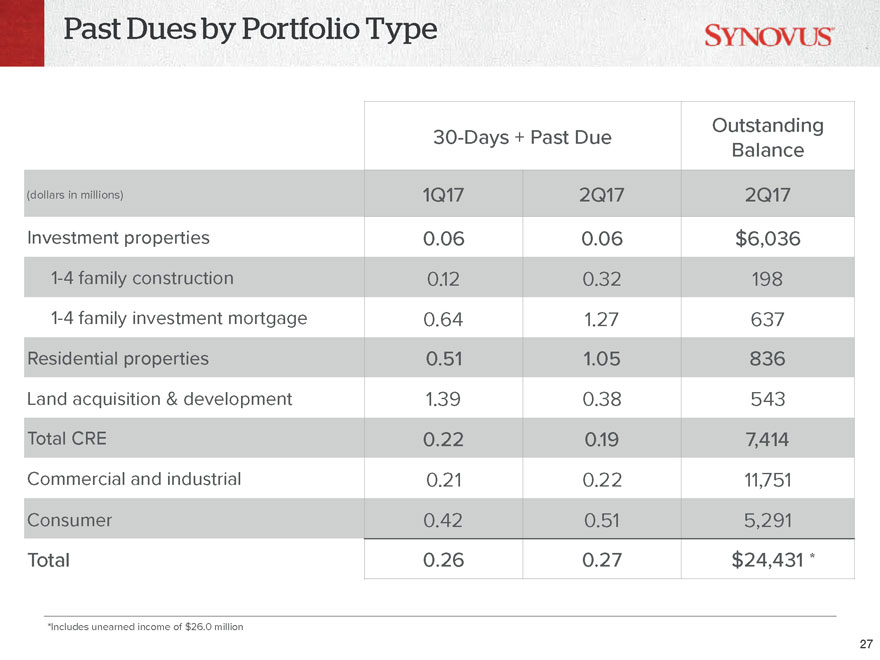
Past Dues by Portfolio Type
Outstanding
30-Days + Past Due
Balance
(dollars in millions) 1Q17 2Q17 2Q17
Investment properties 0.06 0.06 $6,036
1-4 family
construction 0.12 0.32 198
1-4 family investment mortgage 0.64 1.27 637
Residential properties 0.51 1.05 836
Land acquisition & development 1.39 0.38 543
Total CRE 0.22 0.19 7,414
Commercial and industrial 0.21 0.22 11,751
Consumer 0.42 0.51 5,291
Total 0.26 0.27 $24,431 *
*Includes unearned income of $26.0 million
27
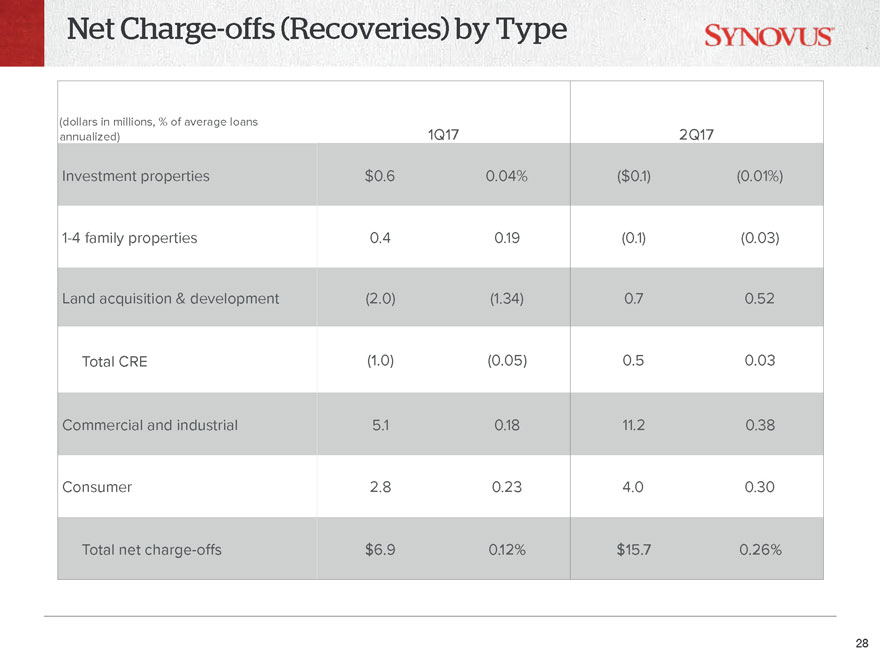
Net Charge-offs (Recoveries) by Type
(dollars in millions, % of average loans annualized) 1Q17 2Q17
Investment properties $0.6
0.04% ($0.1) (0.01%) 1-4 family properties 0.4 0.19 (0.1) (0.03) Land acquisition & development (2.0) (1.34) 0.7 0.52
Total CRE (1.0) (0.05) 0.5 0.03
Commercial and industrial 5.1 0.18 11.2 0.38
Consumer 2.8 0.23 4.0 0.30
Total net charge-offs $6.9 0.12% $15.7 0.26%
28
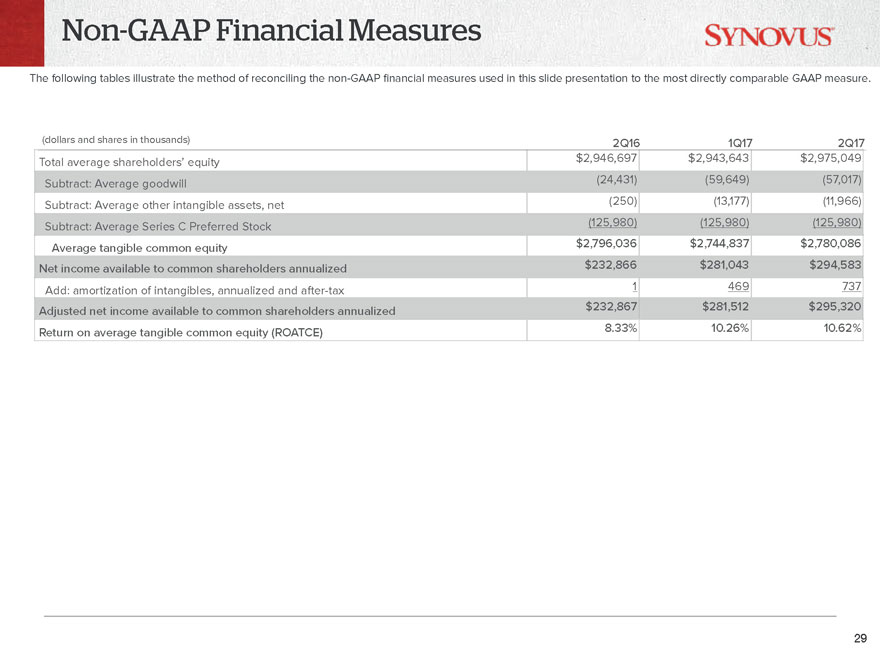
Non-GAAP Financial Measures
The following tables illustrate the method of reconciling the non-GAAP financial measures used in this slide presentation to the most
directly comparable GAAP measure.
(dollars and shares in thousands) 2Q16 1Q17 2Q17
Total average shareholders’ equity $2,946,697 $2,943,643 $2,975,049 Subtract: Average goodwill (24,431) (59,649) (57,017) Subtract: Average other intangible assets, net (250)
(13,177) (11,966) Subtract: Average Series C Preferred Stock (125,980) (125,980) (125,980)
Average tangible common equity $2,796,036 $2,744,837 $2,780,086 Net
income available to common shareholders annualized $232,866 $281,043 $294,583
Add: amortization of intangibles, annualized and
after-tax 1 469 737
Adjusted net income available to common shareholders annualized $232,867 $281,512 $295,320 Return on
average tangible common equity (ROATCE) 8.33% 10.26% 10.62%
29
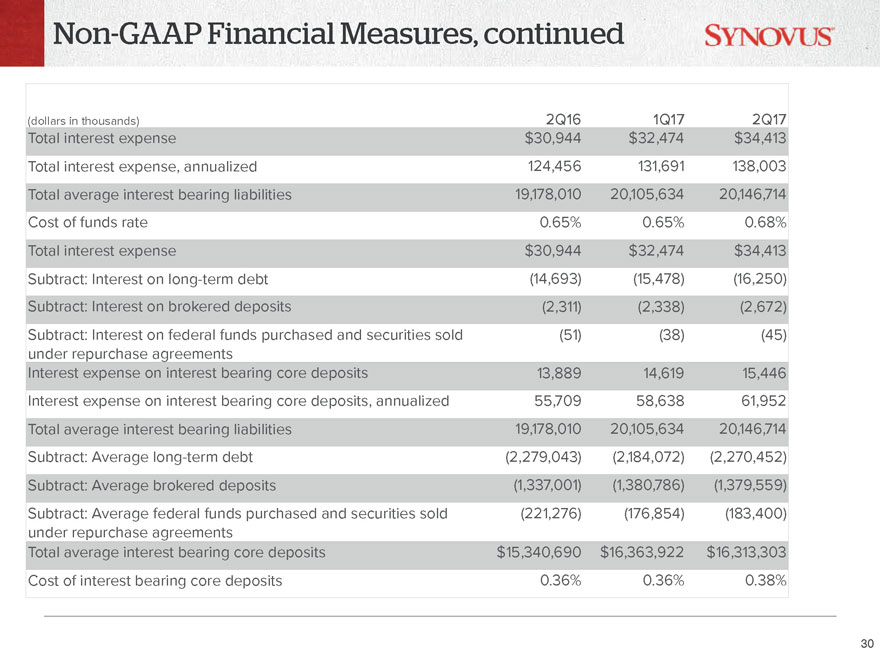
Non-GAAP Financial Measures, continued
(dollars in thousands) 2Q16 1Q17 2Q17
Total interest expense $30,944 $32,474 $34,413
Total interest expense, annualized 124,456 131,691 138,003
Total average
interest bearing liabilities 19,178,010 20,105,634 20,146,714 Cost of funds rate 0.65% 0.65% 0.68%
Total interest expense $30,944 $32,474 $34,413
Subtract: Interest on long-term debt (14,693) (15,478) (16,250) Subtract: Interest on brokered deposits (2,311) (2,338) (2,672)
Subtract: Interest on federal funds purchased and securities sold (51) (38) (45) under repurchase agreements Interest expense on interest bearing core deposits 13,889 14,619 15,446
Interest expense on interest bearing core deposits, annualized 55,709 58,638 61,952
Total average interest bearing liabilities 19,178,010 20,105,634 20,146,714
Subtract: Average long-term debt (2,279,043) (2,184,072) (2,270,452)
Subtract: Average brokered deposits (1,337,001) (1,380,786) (1,379,559)
Subtract: Average federal funds purchased and securities sold (221,276) (176,854) (183,400) under repurchase agreements Total average interest bearing core deposits $15,340,690
$16,363,922 $16,313,303
Cost of interest bearing core deposits 0.36% 0.36% 0.38%
30
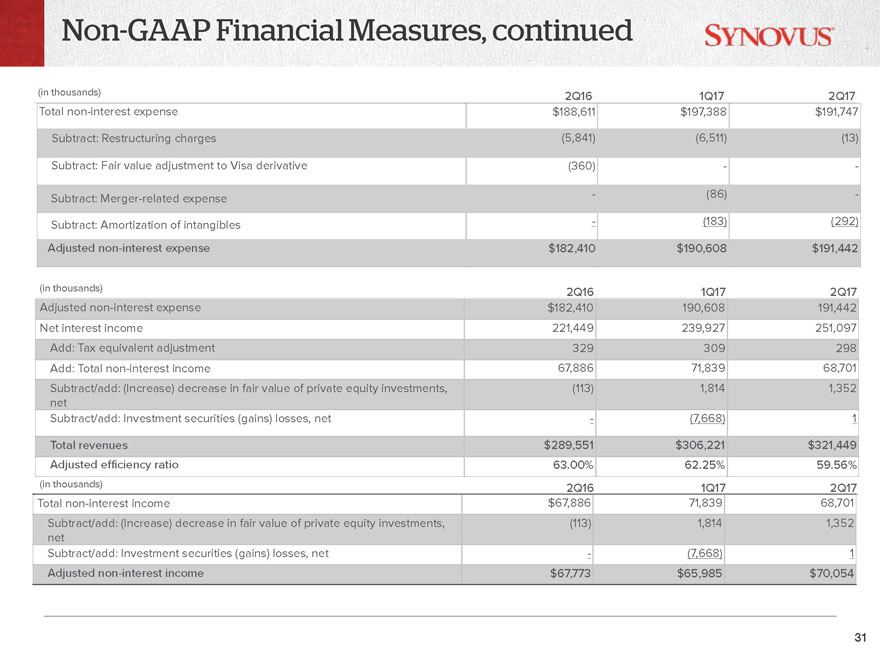
Non-GAAP Financial Measures, continued
(in thousands) 2Q16 1Q17 2Q17
Total non-interest
expense $188,611 $197,388 $191,747 Subtract: Restructuring charges (5,841) (6,511) (13) Subtract: Fair value adjustment to Visa derivative (360) - -
Subtract: Merger-related expense - (86) - Subtract: Amortization of intangibles - (183) (292)
Adjusted non-interest expense $182,410 $190,608 $191,442
(in thousands) 2Q16 1Q17 2Q17
Adjusted
non-interest expense $182,410 190,608 191,442 Net interest income 221,449 239,927 251,097 Add: Tax equivalent adjustment 329 309 298 Add: Total non-interest income
67,886 71,839 68,701 Subtract/add: (Increase) decrease in fair value of private equity investments, (113) 1,814 1,352 net Subtract/add: Investment securities (gains) losses, net - (7,668) 1
Total revenues $289,551 $306,221 $321,449 Adjusted efficiency ratio 63.00% 62.25% 59.56%
(in
thousands) 2Q16 1Q17 2Q17
Total non-interest income $67,886 71,839 68,701 Subtract/add: (Increase) decrease in fair value
of private equity investments, (113) 1,814 1,352 net Subtract/add: Investment securities (gains) losses, net - (7,668) 1
Adjusted
non-interest income $67,773 $65,985 $70,054
31
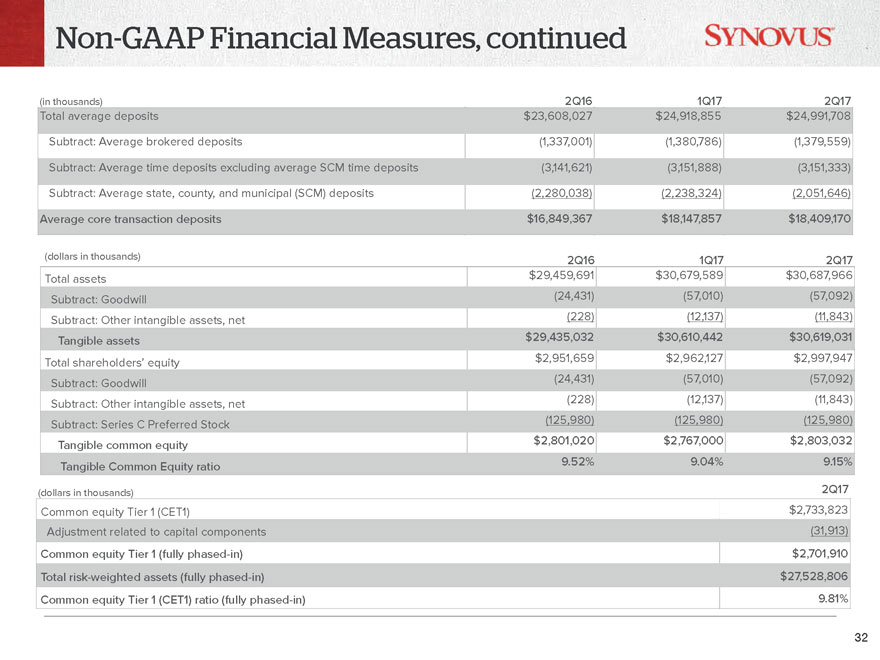
Non-GAAP Financial Measures, continued
(in thousands) 2Q16 1Q17 2Q17
Total average deposits $23,608,027 $24,918,855
$24,991,708 Subtract: Average brokered deposits (1,337,001) (1,380,786) (1,379,559) Subtract: Average time deposits excluding average SCM time deposits (3,141,621) (3,151,888)
(3,151,333) Subtract: Average state, county, and municipal (SCM) deposits (2,280,038) (2,238,324) (2,051,646)
Average core transaction
deposits $16,849,367 $18,147,857 $18,409,170
(dollars in thousands) 2Q16 1Q17 2Q17
Total assets $29,459,691 $30,679,589 $30,687,966 Subtract: Goodwill (24,431) (57,010) (57,092) Subtract: Other intangible assets, net (228) (12,137) (11,843)
Tangible assets $29,435,032 $30,610,442 $30,619,031
Total shareholders’ equity $2,951,659
$2,962,127 $2,997,947 Subtract: Goodwill (24,431) (57,010) (57,092) Subtract: Other intangible assets, net (228) (12,137) (11,843) Subtract: Series C Preferred Stock (125,980) (125,980) (125,980)
Tangible common equity $2,801,020 $2,767,000 $2,803,032 Tangible Common Equity ratio
9.52% 9.04% 9.15%
(dollars in thousands) 2Q17
Common equity Tier 1 (CET1)
$2,733,823 Adjustment related to capital components (31,913)
Common equity Tier 1 (fully phased-in) $2,701,910
Total risk-weighted assets (fully phased-in) $27,528,806 Common equity Tier 1 (CET1) ratio (fully
phased-in) 9.81%
32