Attached files
| file | filename |
|---|---|
| 8-K - Tri-State Generation & Transmission Association, Inc. | tris-20170717x8k.htm |
Exhibit 99.1
|
|
Forward-looking statements include statements concerning our plans, objectives, goals, strategies, future events, future revenue or performance, capital expenditures, financing needs, plans or intentions relating to acquisitions, business trends and other information that is not historical information. When used in this presentation, the words “estimates,” “expects,” “anticipates,” “projects,” “plans,” “intends,” “believes” and “forecasts” or future or conditional verbs, such as “will,” “should,” “could” or “may,” and variations of such words or similar expressions, are intended to identify forward-looking statements. These forward-looking statements are subject to a number of risks, uncertainties and assumptions, including those described from time to time in our filings with the Securities and Exchange Commission. All forward-looking statements, including, without limitation, management’s examination of historical operating trends and data, are based upon our current expectations and various assumptions. Our expectations and beliefs are expressed in good faith, and we believe there is a reasonable basis for them. However, we cannot assure you that management’s expectations and beliefs will be achieved. There are a number of risks, uncertainties and other important factors that could cause our actual results to differ materially from the forward-looking statements contained in this presentation. |
|
|
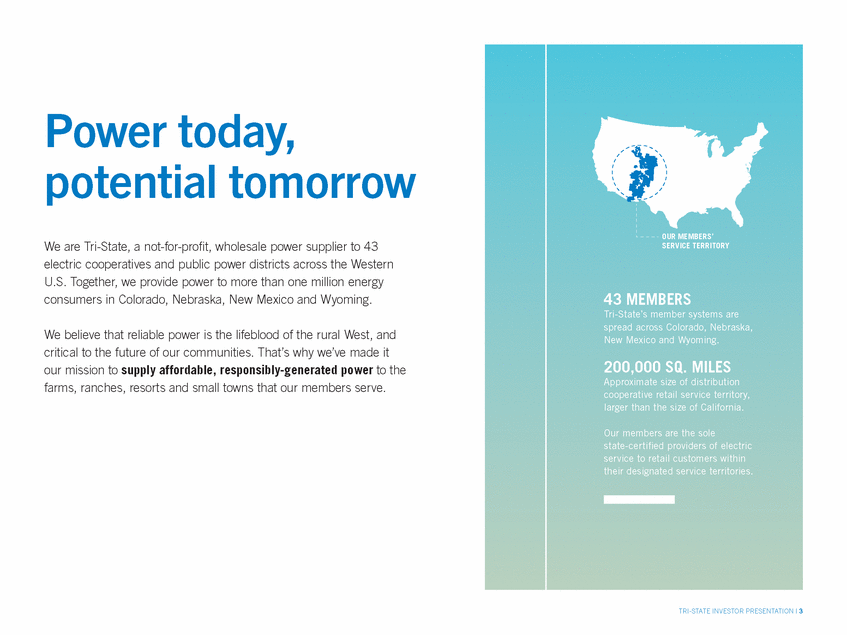
Power today, potential tomorrow We are Tri-State, a not-for-profit, wholesale power supplier to 43 electric cooperatives and public power districts across the Western U.S. Together, we provide power to more than one million energy consumers in Colorado, Nebraska, New Mexico and Wyoming. OUR MEMBERS’ SERVICE TERRITORY 43 MEMBERS Tri-State’s member systems are spread across Colorado, Nebraska, New Mexico and Wyoming. We believe that reliable power is the lifeblood of the rural West, and critical to the future of our communities. That’s why we’ve made it our mission to supply affordable, responsibly-generated power to the farms, ranches, resorts and small towns that our members serve. 200,000 SQ. MILES Approximate size of distribution cooperative retail service territory, larger than the size of California. Our members are the sole state-certified providers of electric service to retail customers within their designated service territories. TRI-STATE INVESTOR PRESENTATION | 3 |
|
|
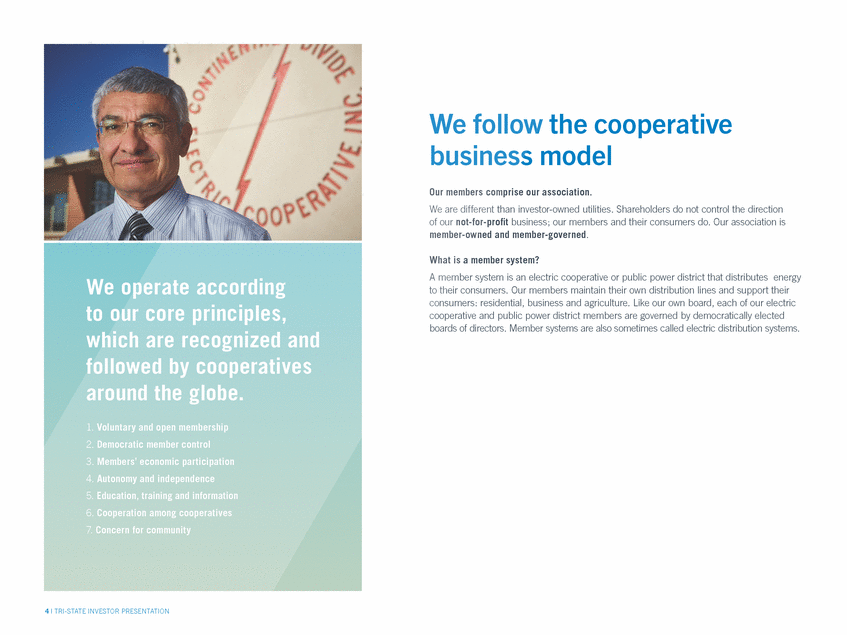
We follow the cooperative business model Our members comprise our association. We are different than investor-owned utilities. Shareholders do not control the direction of our not-for-profit business; our members and their consumers do. Our association is member-owned and member-governed. What is a member system? A member system is an electric cooperative or public power district that distributes energy to their consumers. Our members maintain their own distribution lines and support their consumers: residential, business and agriculture. Like our own board, each of our electric cooperative and public power district members are governed by democratically elected boards of directors. Member systems are also sometimes called electric distribution systems. 4 | TRI-STATE INVESTOR PRESENTATION |
|
|
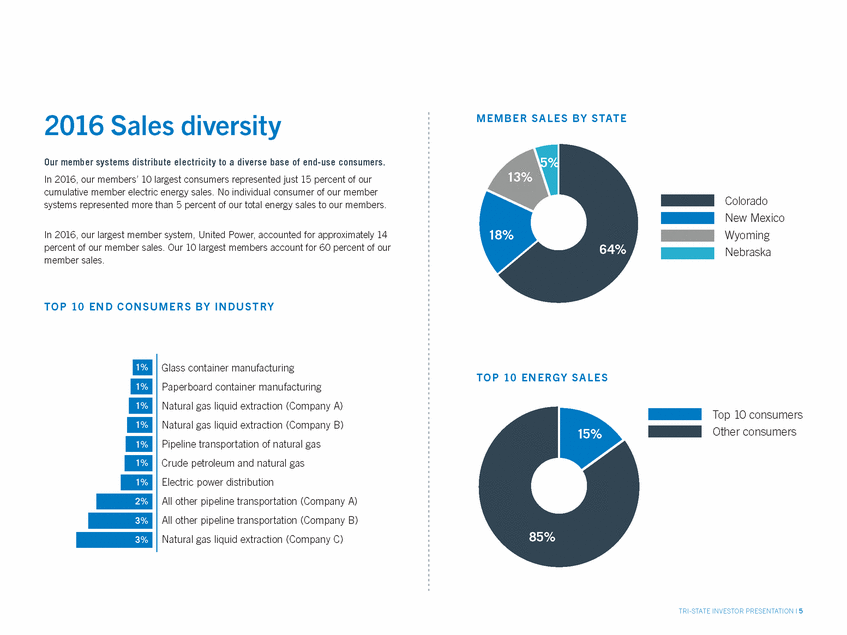
2016 Sales diversity Our member systems distribute electricity to a diverse base of end-use consumers. In 2016, our members’ 10 largest consumers represented just 15 percent of our cumulative member electric energy sales. No individual consumer of our member systems represented more than 5 percent of our total energy sales to our members. MEMB ER SA L E S B Y S TATE 5% 13% Colorado New Mexico Wyoming Nebraska % In 2016, our largest member system, United Power, accounted for approximately 14 percent of our member sales. Our 10 largest members account for 60 percent of our member sales. 64% T O P 10 E N D C O N S U M E R S B Y I N D U ST R Y Glass container manufacturing Paperboard container manufacturing Natural gas liquid extraction (Company A) Natural gas liquid extraction (Company B) Pipeline transportation of natural gas Crude petroleum and natural gas Electric power distribution All other pipeline transportation (Company A) All other pipeline transportation (Company B) Natural gas liquid extraction (Company C) T O P 10 ENER G Y SA L E S Top 10 consumers Other consumers 15% 85% Colorado New Mexico Wyoming Nebraska TRI-STATE INVESTOR PRESENTATION | 5 3% 3% 2% 1% 1% 1% 1% 1% 1% 1% |
|
|
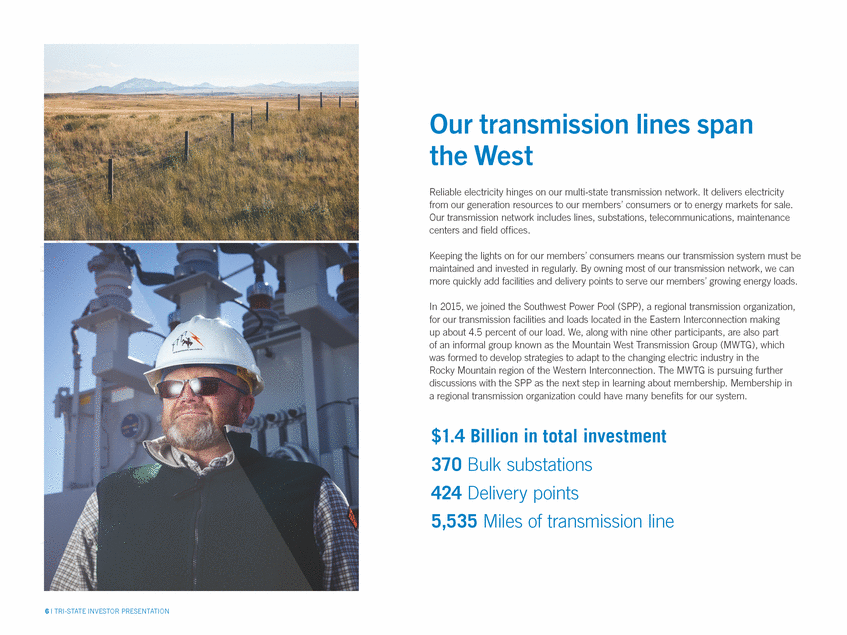
Our transmission lines span the West Reliable electricity hinges on our multi-state transmission network. It delivers electricity from our generation resources to our members’ consumers or to energy markets for sale. Our transmission network includes lines, substations, telecommunications, maintenance centers and field offices. Keeping the lights on for our members’ consumers means our transmission system must be maintained and invested in regularly. By owning most of our transmission network, we can more quickly add facilities and delivery points to serve our members’ growing energy loads. In 2015, we joined the Southwest Power Pool (SPP), a regional transmission organization, for our transmission facilities and loads located in the Eastern Interconnection making up about 4.5 percent of our load. We, along with nine other participants, are also part of an informal group known as the Mountain West Transmission Group (MWTG), which was formed to develop strategies to adapt to the changing electric industry in the Rocky Mountain region of the Western Interconnection. The MWTG is pursuing further discussions with the SPP as the next step in learning about membership. Membership in a regional transmission organization could have many benefits for our system. $1.4 Billion in total investment 370 Bulk substations 424 Delivery points 5,535 Miles of transmission line 6 | TRI-STATE INVESTOR PRESENTATION |
|
|
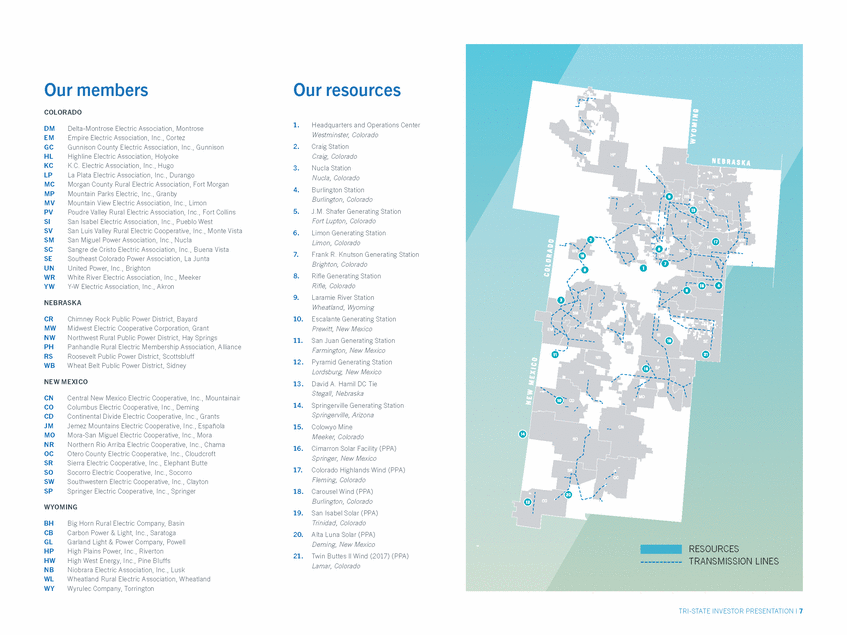
Our members COLORADO Our resources 1. Headquarters and Operations Center Westminster, Colorado Craig Station Craig, Colorado Nucla Station Nucla, Colorado Burlington Station Burlington, Colorado J.M. Shafer Generating Station Fort Lupton, Colorado Limon Generating Station Limon, Colorado Frank R. Knutson Generating Station Brighton, Colorado Rifle Generating Station Rifle, Colorado Laramie River Station Wheatland, Wyoming Escalante Generating Station Prewitt, New Mexico San Juan Generating Station Farmington, New Mexico Pyramid Generating Station Lordsburg, New Mexico David A. Hamil DC Tie Stegall, Nebraska Springerville Generating Station Springerville, Arizona Colowyo Mine Meeker, Colorado Cimarron Solar Facility (PPA) Springer, New Mexico Colorado Highlands Wind (PPA) Fleming, Colorado Carousel Wind (PPA) Burlington, Colorado San Isabel Solar (PPA) Trinidad, Colorado Alta Luna Solar (PPA) Deming, New Mexico Twin Buttes || Wind (2017) (PPA) Lamar, Colorado DM EM GC HL KC LP MC MP MV PV SI SV SM SC SE UN WR YW Delta-Montrose Electric Association, Montrose Empire Electric Association, Inc., Cortez Gunnison County Electric Association, Inc., Gunnison Highline Electric Association, Holyoke K.C. Electric Association, Inc., Hugo La Plata Electric Association, Inc., Durango Morgan County Rural Electric Association, Fort Morgan Mountain Parks Electric, Inc., Granby Mountain View Electric Association, Inc., Limon Poudre Valley Rural Electric Association, Inc., Fort Collins San Isabel Electric Association, Inc., Pueblo West San Luis Valley Rural Electric Cooperative, Inc., Monte Vista San Miguel Power Association, Inc., Nucla Sangre de Cristo Electric Association, Inc., Buena Vista Southeast Colorado Power Association, La Junta United Power, Inc., Brighton White River Electric Association, Inc., Meeker Y-W Electric Association, Inc., Akron 2. 3. 4. 5. 6. 7. 8. 9. NEBRASKA CR MW NW PH RS WB Chimney Rock Public Power District, Bayard Midwest Electric Cooperative Corporation, Grant Northwest Rural Public Power District, Hay Springs Panhandle Rural Electric Membership Association, Alliance Roosevelt Public Power District, Scottsbluff Wheat Belt Public Power District, Sidney 10. 11. 12. NEW MEXICO 13. CN CO CD JM MO NR OC SR SO SW SP Central New Mexico Electric Cooperative, Inc., Mountainair Columbus Electric Cooperative, Inc., Deming Continental Divide Electric Cooperative, Inc., Grants Jemez Mountains Electric Cooperative, Inc., Española Mora-San Miguel Electric Cooperative, Inc., Mora Northern Rio Arriba Electric Cooperative, Inc., Chama Otero County Electric Cooperative, Inc., Cloudcroft Sierra Electric Cooperative, Inc., Elephant Butte Socorro Electric Cooperative, Inc., Socorro Southwestern Electric Cooperative, Inc., Clayton Springer Electric Cooperative, Inc., Springer 14. 15. 16. 17. 18. WYOMING 19. BH CB GL HP HW NB WL WY Big Horn Rural Electric Company, Basin Carbon Power & Light, Inc., Saratoga Garland Light & Power Company, Powell High Plains Power, Inc., Riverton High West Energy, Inc., Pine Bluffs Niobrara Electric Association, Inc., Lusk Wheatland Rural Electric Association, Wheatland Wyrulec Company, Torrington 20. RESOURCES 21. TRANSMISSION LINES TRI-STATE INVESTOR PRESENTATION | 7 |
|
|
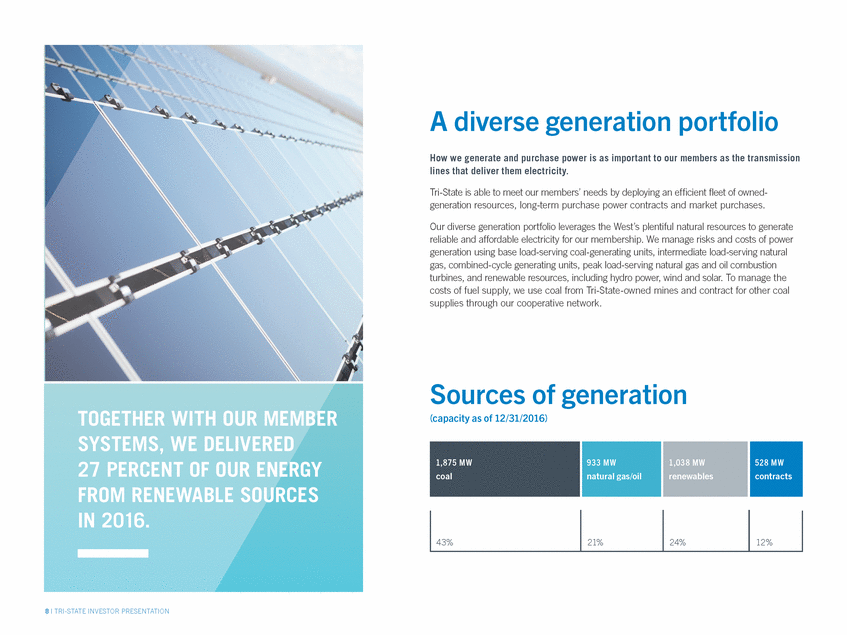
A diverse generation portfolio How we generate and purchase power is as important to our members as the transmission lines that deliver them electricity. Tri-State is able to meet our members’ needs by deploying an efficient fleet of owned-generation resources, long-term purchase power contracts and market purchases. Our diverse generation portfolio leverages the West’s plentiful natural resources to generate reliable and affordable electricity for our membership. We manage risks and costs of power generation using base load-serving coal-generating units, intermediate load-serving natural gas, combined-cycle generating units, peak load-serving natural gas and oil combustion turbines, and renewable resources, including hydro power, wind and solar. To manage the costs of fuel supply, we use coal from Tri-State-owned mines and contract for other coal supplies through our cooperative network. Sources of (capacity as of 12/31/2016) generation 8 | TRI-STATE INVESTOR PRESENTATION 43% 21% 24% 12% 1,875 MW coal 93 3 MW natural gas/oil 1,038 MW renewables 528 MW contracts |
|
|
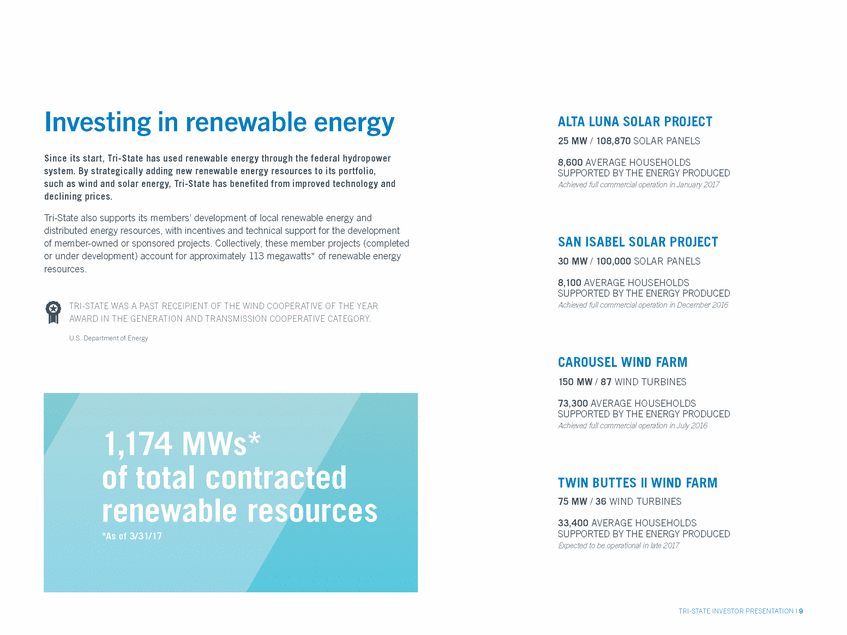
Investing in renewable energy Since its start, Tri-State has used renewable energy through the federal hydropower system. By strategically adding new renewable energy resources to its portfolio, such as wind and solar energy, Tri-State has benefited from improved technology and declining prices. ALTA LUNA SOLAR PROJECT 25 MW / 108,870 SOLAR PANELS 8,600 AVERAGE HOUSEHOLDS SUPPORTED BY THE ENERGY PRODUCED Achieved full commercial operation in January 2017 Tri-State also supports its members’ development of local renewable energy and distributed energy resources, with incentives and technical support for the development of member-owned or sponsored projects. Collectively, these member projects (completed or under development) account for approximately 113 megawatts* of renewable energy resources. SAN ISABEL SOLAR PROJECT 30 MW / 100,000 SOLAR PANELS 8,100 AVERAGE HOUSEHOLDS SUPPORTED BY THE ENERGY PRODUCED Achieved full commercial operation in December 2016 TRI-STATE WAS A PAST RECEIPIENT OF THE WIND COOPERATIVE OF THE YEAR AWARD IN THE GENERATION AND TRANSMISSION COOPERATIVE CATEGORY. U.S. Department of Energy CAROUSEL WIND FARM 150 MW / 87 WIND TURBINES 73,300 AVERAGE HOUSEHOLDS SUPPORTED BY THE ENERGY PRODUCED Achieved full commercial operation in July 2016 TWIN BUTTES || WIND FARM 75 MW / 36 WIND TURBINES 33,400 AVERAGE HOUSEHOLDS SUPPORTED BY THE ENERGY PRODUCED Expected to be operational in late 2017 TRI-STATE INVESTOR PRESENTATION | 9 |
|
|
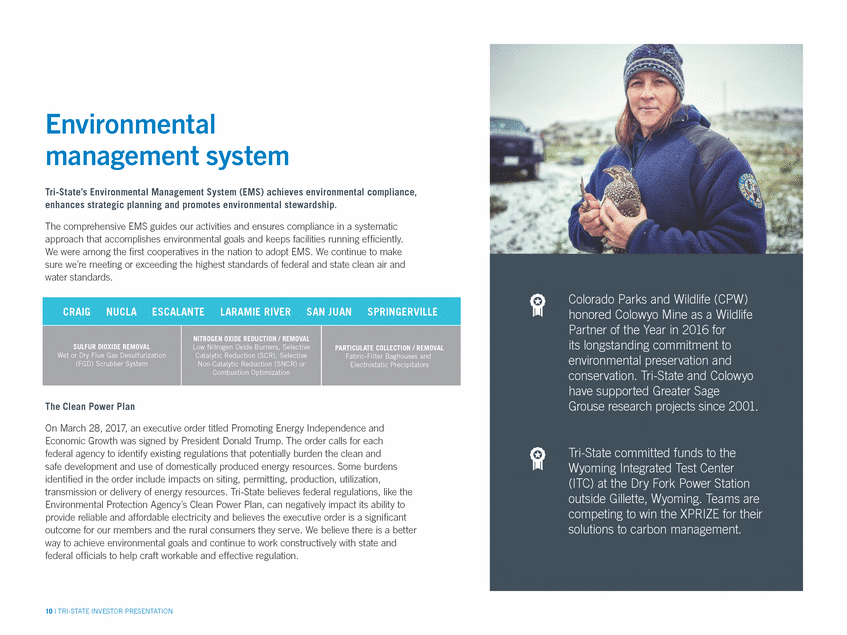
Environmental management system Tri-State’s Environmental Management System (EMS) achieves environmental compliance, enhances strategic planning and promotes environmental stewardship. The comprehensive EMS guides our activities and ensures compliance in a systematic approach that accomplishes environmental goals and keeps facilities running efficiently. We were among the first cooperatives in the nation to adopt EMS. We continue to make sure we’re meeting or exceeding the highest standards of federal and state clean air and water standards. Electrostatic Precipitators The Clean Power Plan On March 28, 2017, an executive order titled Promoting Energy Independence and Economic Growth was signed by President Donald Trump. The order calls for each federal agency to identify existing regulations that potentially burden the clean and safe development and use of domestically produced energy resources. Some burdens identified in the order include impacts on siting, permitting, production, utilization, transmission or delivery of energy resources. Tri-State believes federal regulations, like the Environmental Protection Agency’s Clean Power Plan, can negatively impact its ability to provide reliable and affordable electricity and believes the executive order is a significant outcome for our members and the rural consumers they serve. We believe there is a better way to achieve environmental goals and continue to work constructively with state and federal officials to help craft workable and effective regulation. 10 | TRI-STATE INVESTOR PRESENTATION CRAIGNUCLA ESCALANTELARAMIE RIVER SAN JUANSPRINGERVILLE SULFUR DIOXIDE REMOVAL Wet or Dry Flue Gas Desulfurization (FGD) Scrubber System NITROGEN OXIDE REDUCTION / REMOVAL Low Nitrogen Oxide Burners, Selective Catalytic Reduction (SCR), Selective Non-Catalytic Reduction (SNCR) or Combustion Optimization PARTICULATE COLLECTION / REMOVAL Fabric-Filter Baghouses and Colorado Parks and Wildlife (CPW) honored Colowyo Mine as a Wildlife Partner of the Year in 2016 for its longstanding commitment to environmental preservation and conservation. Tri-State and Colowyo have supported Greater Sage Grouse research projects since 2001. Tri-State committed funds to the Wyoming Integrated Test Center (ITC) at the Dry Fork Power Station outside Gillette, Wyoming. Teams are competing to win the XPRIZE for their solutions to carbon management. |
|
|
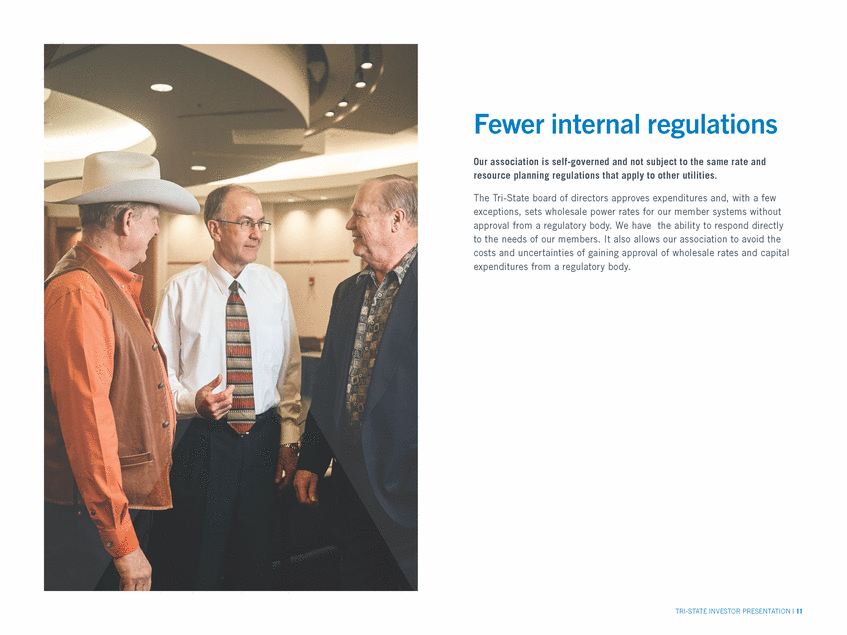
Fewer internal regulations Our association is self-governed and not subject to the same rate and resource planning regulations that apply to other utilities. The Tri-State board of directors approves expenditures and, with a few exceptions, sets wholesale power rates for our member systems without approval from a regulatory body. We have the ability to respond directly to the needs of our members. It also allows our association to avoid the costs and uncertainties of gaining approval of wholesale rates and capital expenditures from a regulatory body. TRI-STATE INVESTOR PRESENTATION | 11 |
|
|
Our rate design The strength of the cooperative business model brought the association’s members together to address Tri-State’s rate design in an inclusive approach that identified the need for change. AS A SIGN OF IMPROVED MEMBER RELATIONS, TRI-STATE’S 2016 AND 2017 RATES WERE IMPLEMENTED WITHOUT PROTEST. To address member concerns, in 2014 our board of directors passed a new rate design process policy to ensure our members have a full and fair opportunity to present rate design information to the board. After nine months of reviewing the cost of service and assessing various options, in May 2015, a rate design committee of our membership unanimously approved a set of recommendations to the Tri-State Board of Directors, which the board approved in September 2015. The rate structure, effective January 1, 2016, is based on 45 percent demand to 55 percent energy split, and was determined using a detailed cost of service study completed by an independent third party. Under the rate design, demand-related costs are recovered through peak demand generation and transmission/delivery billing units, and energy costs are recovered through a single energy rate. This rate structure remains in effect. Rather than having to go through a utility commission regulatory process, as is the case for investor-owned utilities, the cooperative model allows Tri-State to work with its members in an inclusive manner, identify their needs and make changes as needed. Our rate design policy and process are a strong testament to how we work together in the cooperative spirit to address our members’ needs and continue to move the association forward. 12 | TRI-STATE INVESTOR PRESENTATION |
|
|
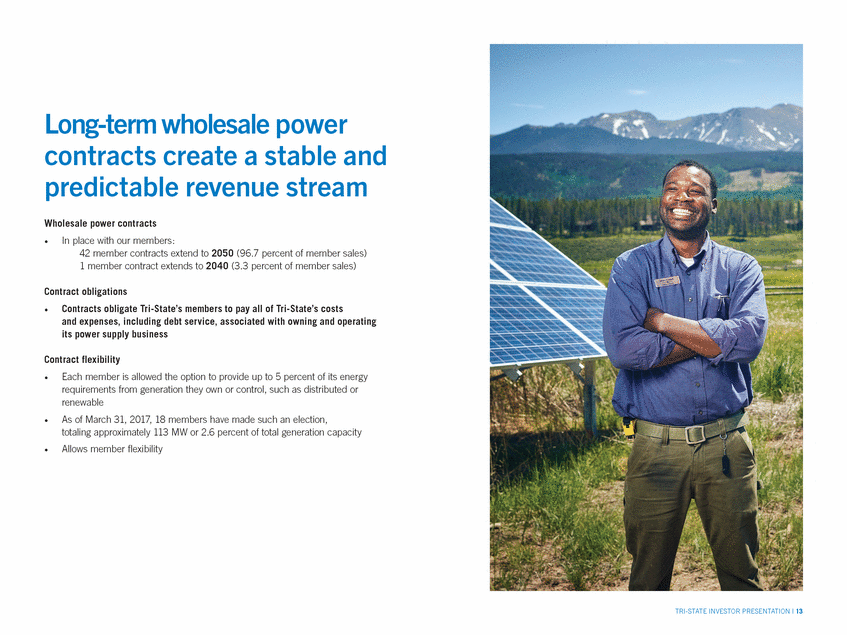
Long-term wholesale power contracts create a stable and predictable revenue stream Wholesale power contracts In place with our members: 42 member contracts extend to 2050 (96.7 percent of member sales) 1 member contract extends to 2040 (3.3 percent of member sales) • Contract obligations Contracts obligate Tri-State’s members to pay all of Tri-State’s costs and expenses, including debt service, associated with owning and operating its power supply business • Contract flexibility Each member is allowed the option to provide up to 5 percent of its energy requirements from generation they own or control, such as distributed or renewable As of March 31, 2017, 18 members have made such an election, totaling approximately 113 MW or 2.6 percent of total generation capacity Allows member flexibility • • • TRI-STATE INVESTOR PRESENTATION | 13 |
|
|
Numbers |
|
|
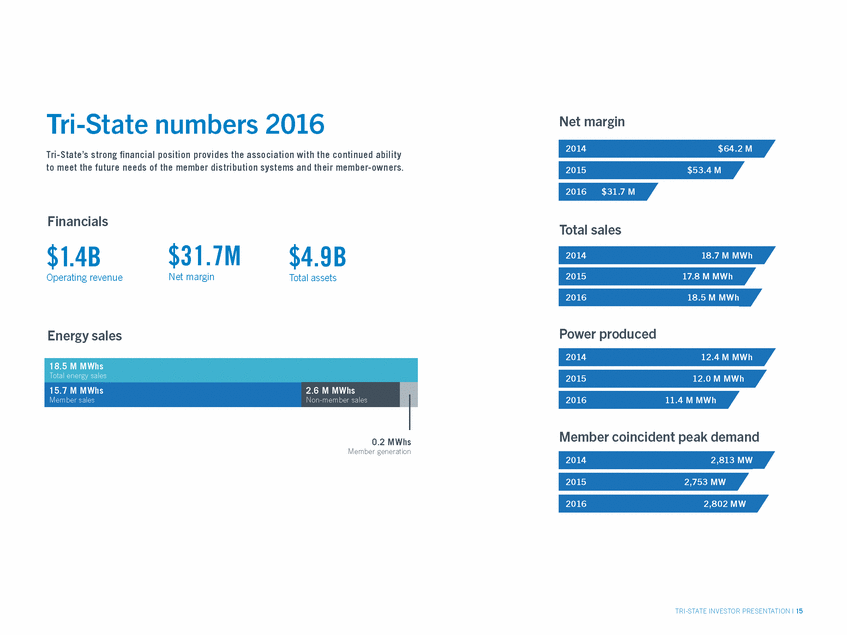
Tri-State numbers 2016 Tri-State’s strong financial position provides the association with the continued ability to meet the future needs of the member distribution systems and their member-owners. Net margin Financials Total sales $31.7M Net margin $1.4B Operating revenue $4.9B Total assets Power produced Energy sales Member coincident peak demand 0.2 MWhs Member generation TRI-STATE INVESTOR PRESENTATION | 15 2016 2,802 MW 2015 2,753 MW 2014 2,813 MW 2016 11.4 M MWh 2015 12.0 M MWh 18.5 M MWhs Total energy sales 15.7 M MWhs Member sales 2.6 M MWhs Non-member sales 2014 12.4 M MWh 2016 18.5 M MWh 2015 17.8 M MWh 2014 18.7 M MWh 2016 $31.7 M 2015 $53.4 M 2014 $64.2 M |
|
|
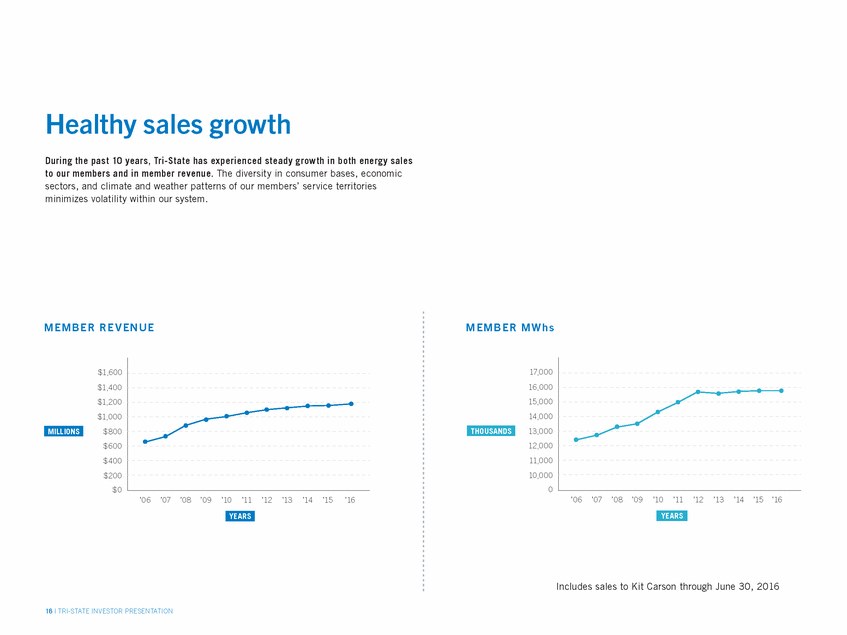
Healthy sales growth During the past 10 years, Tri-State has experienced steady growth in both energy sales to our members and in member revenue. The diversity in consumer bases, economic sectors, and climate and weather patterns of our members’ service territories minimizes volatility within our system. M E M B E R R E V E NUE MEMB ER M W h s $1,600 $1,400 $1,200 $1,000 $800 $600 $400 $200 $0 $1,600 17,000 16,000 15,000 14,000 13,000 12,000 11,000 10,000 0 ’07 ’08 16,000 15,000 14,000 13,0T0H0OUSANDS 12,000 11,000 10,000 0 ’09’06’10’07’11’08’12’09’13’10’14’11’15 ’12’16 ’13’14 ’15 ’16 ’06 ’07 ’08 ’09’10’11’12’13’14’15 ’16 ’06 Includes sales to Kit Carson through June 30, 2016 16 | TRI-STATE INVESTOR PRESENTATION YEARS YEARS MILLIONS |
|
|
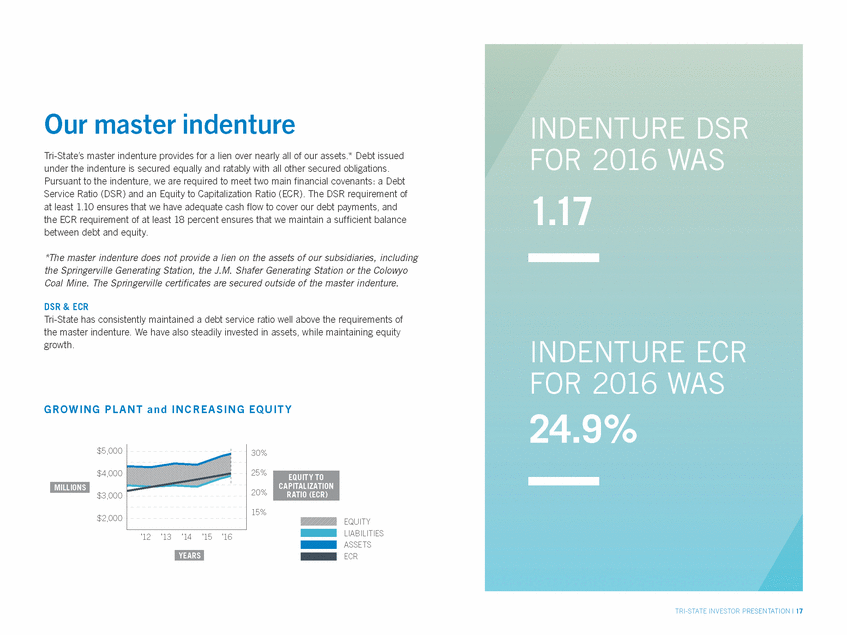
Our master indenture Tri-State’s master indenture provides for a lien over nearly all of our assets.* Debt issued under the indenture is secured equally and ratably with all other secured obligations. Pursuant to the indenture, we are required to meet two main financial covenants: a Debt Service Ratio (DSR) and an Equity to Capitalization Ratio (ECR). The DSR requirement of at least 1.10 ensures that we have adequate cash flow to cover our debt payments, and the ECR requirement of at least 18 percent ensures that we maintain a sufficient balance between debt and equity. INDENTURE DSR FOR 2016 WAS 1.17 *The master indenture does not provide a lien on the assets of our subsidiaries, including the Springerville Generating Station, the J.M. Shafer Generating Station or the Colowyo Coal Mine. The Springerville certificates are secured outside of the master indenture. DSR & ECR Tri-State has consistently maintained a debt service ratio well above the requirements of the master indenture. We have also steadily invested in assets, while maintaining equity growth. INDENTURE ECR FOR 2016 24.9% WAS GR O W I N G P L A N T an d IN C RE A S IN G E Q U IT Y $5,000 30% $4,000 25% MILLIONS 20% $3,000 15% $2,000 EQUITY LIABILITIES ASSETS ECR ’12’13’14’15 ’16 TRI-STATE INVESTOR PRESENTATION | 17 YEARS EQUITY TO CAPITALIZATION RATIO (ECR) |
|
|
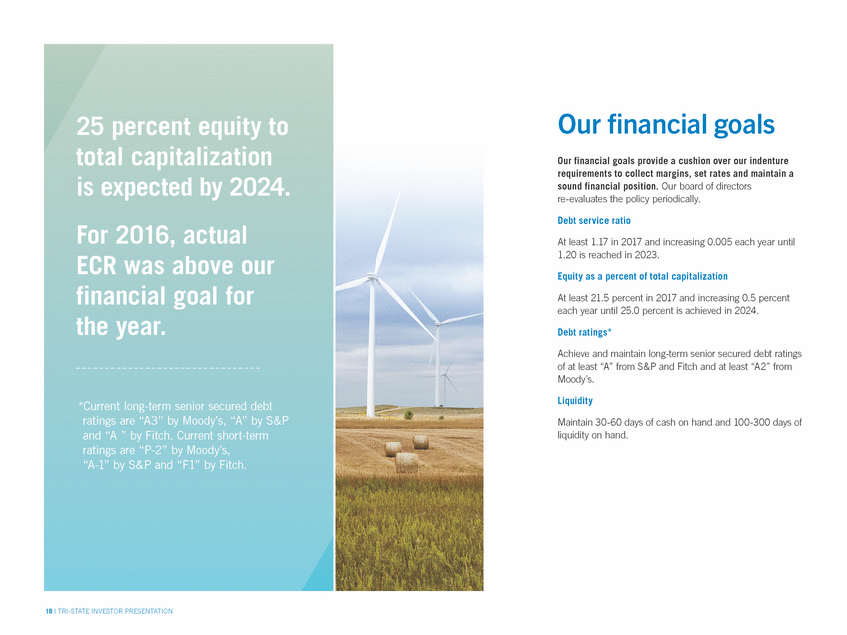
Our financial goals Our financial goals provide a cushion over our indenture requirements to collect margins, set rates and maintain a sound financial position. Our board of directors re-evaluates the policy periodically. Debt service ratio At least 1.17 in 2017 and increasing 0.005 each year until 1.20 is reached in 2023. Equity as a percent of total capitalization At least 21.5 percent in 2017 and increasing 0.5 percent each year until 25.0 percent is achieved in 2024. Debt ratings* Achieve and maintain long-term senior secured debt ratings of at least “A” from S&P and Fitch and at least “A2” from Moody’s. Liquidity Maintain 30-60 days of cash on hand and 100-300 days of liquidity on hand. 18 | TRI-STATE INVESTOR PRESENTATION |
|
|
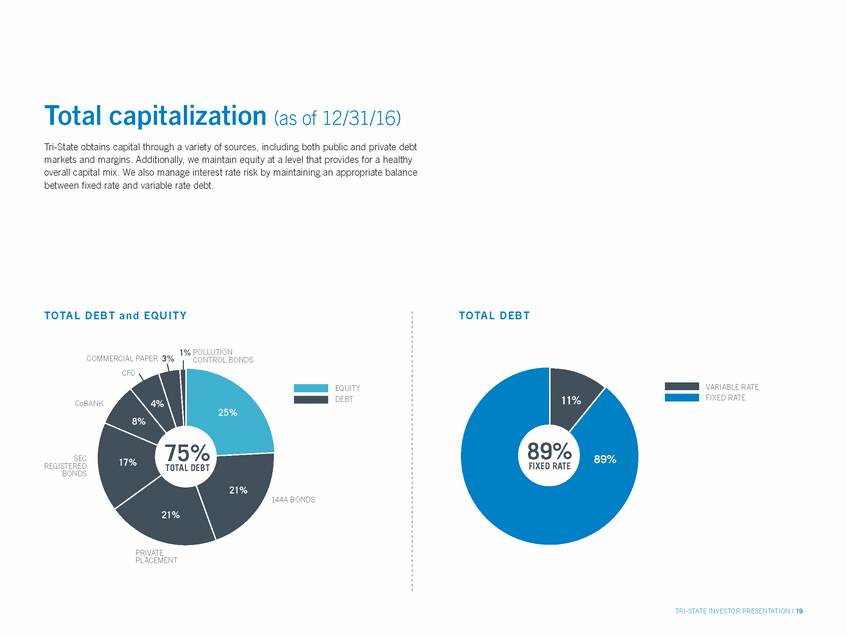
1% 3% Total capitalization (as of 12/31/16) Tri-State obtains capital through a variety of sources, including both public and private debt markets and margins. Additionally, we maintain equity at a level that provides for a healthy overall capital mix. We also manage interest rate risk by maintaining an appropriate balance between fixed rate and variable rate debt. 1% 3% 89% FIXED RATE T O TA L D E B T a n d E Q U I T Y TOTA L D E B T 1% POLLUTION COMMERCIAL PAPER 3% CONTROL BONDS CFC VARIABLE RATE FIXED RATE EQUITY DEBT 11% CoBANK 4% 25% 8% 89% FIXED RATE 75% TOTAL DEBT 89% SEC REGISTERED BONDS 17% 21% 144A BONDS 21% EQUITY VARIABLE RATE FIXED RATE DEBT PRIVATE PLACEMENT 89% FIXED RATE TRI-STATE INVESTOR PRESENTATION | 19 |
|
|
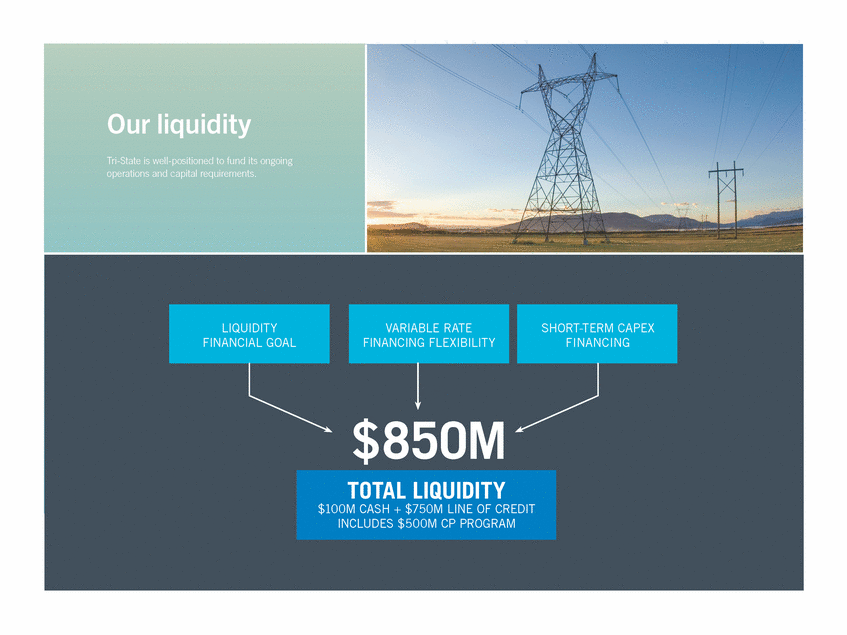
Our liquidity Tri-State is well-positioned to fund its ongoing operations and capital requirements. $850M TOTAL LIQUIDITY $100M CASH + $750M LINE OF CREDIT INCLUDES $500M CP PROGRAM SHORT-TERM CAPEX FINANCING LIQUIDITY FINANCIAL GOAL VARIABLE RATE FINANCING FLEXIBILITY |
|
|
The road ahead Tri-State anticipates financing through a variety of sources, giving us flexibility around how we structure our debt portfolio in relation to interest rate risk, maturity profile and amortization structure. With our commitment to the cooperative business model and to serving our member systems, Tri-State stands apart from other utilities. Our liquidity and healthy sales growth, and readiness to meet future obligations and challenges highlight our strong financial position. Our major financing sources PRIVATE PLACEMENT / SEC REGISTERED BONDS / CoBANK / CFC / CREDIT FACILITY / COMMERCIAL PAPER TRI-STATE INVESTOR PRESENTATION | 21 |
|
|
Our “different” is better We are a member-owned cooperative This means we are not driven by profits; we’re driven by the communities we serve. Unlike investor-owned utilities (IOUs), Tri-State has: • No EPS targets • No ancillary businesses • No high dividend payout ratios • No EPS-driven M&A activity Our equity levels Our equity is comprised solely of patronage capital, similar to retained earnings of a for-profit company. We don’t have paid-in capital on common stock. A valuable service Working with our member systems, we provide power to consumers in rural areas that IOUs and municipals have historically failed to serve. Cooperatives, on average, serve 7.4 consumers per mile of transmission line, while IOUs average 34 consumers per mile. Long-term wholesale power contracts Contracts obligate Tri-State’s members to pay all of our costs and expenses, including debt service, associated with owning and operating our power supply business. Our relationships with our members are built to last. Of our 43 member systems, 42 have contracts through 2050 and the remaining one through 2040. 22 | TRI-STATE INVESTOR PRESENTATION |
|
|
Tri-State credit strengths and 2016 in review • Increasingly diverse generation fleet provides options for supplying power to our member systems • Long-term wholesale power contracts for at least 95 percent of member kWh to 2050 with 42 of 43 members (one contract runs through 2040) • Safety record remains better than the national average • Expanded renewable generation portfolio with full commercial operation of the 150MW Carousel Wind Farm and the 30MW San Isabel Solar Project • Established $500 million commercial paper program which provides low rate, short-term financing • Improved communication and relationships with members resulted in the second consecutive year without a rate protest in New Mexico • Successful integration of eastern transmission facilities into the Southwest Power Pool decreased transmission expenses in 2016 and into the future • Announcement of early retirement of Nucla Station, New Horizon Mine and Craig Station Unit 1 to comply with federal visibility rules • Colowyo Mine Collom Pit expansion was approved by the U.S. Department of the Interior which will provide long-term fuel supply for Craig Station For investor inquiries, please contact us at investorrelations@tristategt.org TRI-STATE INVESTOR PRESENTATION | 23 |
|
|
TRI-STATE GENERATION AND TRANSMISSION ASSOCIATION, INC. P.O. BOX 33695, DENVER, COLORADO 80233 | WWW.TRISTATE.COOP 24 | TRI-STATE INVESTOR PRESENTATION 07/2017 |
|
|
TRI-STATE GENERATION AND TRANSMISSION ASSOCIATION, INC. P.O. BOX 33695, DENVER, COLORADO 80233 WWW.TRISTATE.COOP 07/2017 |

