Attached files
Table of Contents
Index to Financial Statements
As filed with the Securities and Exchange Commission on July 14, 2017
Registration No. 333-
UNITED STATES
SECURITIES AND EXCHANGE COMMISSION
Washington, D.C. 20549
FORM S-1
REGISTRATION STATEMENT
UNDER
THE SECURITIES ACT OF 1933
BJ Services, Inc.
(Exact name of registrant as specified in its charter)
| Delaware | 1389 | 30-0976566 | ||
| (State or other jurisdiction of incorporation or organization) |
(Primary Standard Industrial Classification Code Number) |
(I.R.S. Employer Identification Number) |
11211 FM 2920
Tomball, Texas 77375
(281) 408-2361
(Address, including zip code, and telephone number, including area code, of registrant’s principal executive offices)
Warren M. Zemlak
Chief Executive Officer
11211 FM 2920
Tomball, Texas 77375
(281) 408-2361
(Name, address, including zip code, and telephone number, including area code, of agent for service)
Copies to:
| Sean T. Wheeler Ryan J. Maierson Latham & Watkins LLP 811 Main Street, Suite 3700 Houston, Texas 77002 (713) 546-5400 |
Matthew R. Pacey Justin F. Hoffman Kirkland & Ellis LLP 600 Travis Street, Suite 3300 Houston, Texas 77002 (713) 835-3600 |
Approximate date of commencement of proposed sale to the public:
As soon as practicable after this Registration Statement becomes effective.
If any of the securities being registered on this form are to be offered on a delayed or continuous basis pursuant to Rule 415 under the Securities Act of 1933, check the following box. ☐
If this Form is filed to register additional securities for an offering pursuant to Rule 462(b) under the Securities Act, check the following box and list the Securities Act registration statement number of the earlier effective registration statement for the same offering. ☐
If this Form is a post-effective amendment filed pursuant to Rule 462(c) under the Securities Act, check the following box and list the Securities Act registration statement number of the earlier effective registration statement for the same offering. ☐
If this Form is a post-effective amendment filed pursuant to Rule 462(d) under the Securities Act, check the following box and list the Securities Act registration statement number of the earlier effective registration statement for the same offering. ☐
Indicate by check mark whether the registrant is a large accelerated filer, an accelerated filer, a non-accelerated filer, a smaller reporting company or an emerging growth company. See the definitions of “large accelerated filer,” “accelerated filer,” “smaller reporting company” and “emerging growth company” in Rule 12b-2 of the Exchange Act.
| Large accelerated filer | ☐ | Accelerated filer | ☐ | Emerging growth company | ☒ | |||||
| Non-accelerated filer | ☒ (Do not check if a smaller reporting company) | Smaller reporting company | ☐ | |||||||
If an emerging growth company, indicate by check mark if the registrant has elected not to use the extended transition period for complying with any new or revised financial accounting standards provided pursuant to Section 7(a)(2)(B) of the Securities Act. ☐
CALCULATION OF REGISTRATION FEE
|
| ||||
| Title of Each Class of Securities to be Registered |
Proposed Aggregate |
Amount of Registration Fee | ||
| Class A Common Stock, par value $0.001 per share |
$100,000,000 | $11,590 | ||
|
| ||||
|
| ||||
| (1) | Estimated solely for the purpose of calculating the registration fee pursuant to Rule 457(o) under the Securities Act of 1933, as amended. Includes shares issuable upon exercise of the underwriters’ option to purchase additional shares. |
The Registrant hereby amends this Registration Statement on such date or dates as may be necessary to delay its effective date until the Registrant shall file a further amendment which specifically states that this Registration Statement shall thereafter become effective in accordance with Section 8(a) of the Securities Act of 1933 or until the Registration Statement shall become effective on such date as the Securities and Exchange Commission, acting pursuant to said Section 8(a), may determine.
Table of Contents
Index to Financial Statements
The information in this preliminary prospectus is not complete and may be changed. These securities may not be sold until the registration statement filed with the Securities and Exchange Commission is effective. This preliminary prospectus is not an offer to sell nor does it seek an offer to buy these securities in any jurisdiction where the offer or sale is not permitted.
SUBJECT TO COMPLETION, DATED JULY 14, 2017
PROSPECTUS
Shares

BJ Services, Inc.
Class A Common Stock
This is an initial public offering of the Class A common stock of BJ Services, Inc. We are offering shares of our Class A common stock, par value $0.001 per share.
Prior to this offering, there has been no public market for our Class A common stock. It is currently estimated that the initial public offering price of shares of our Class A common stock will be between $ and $ per share. We have applied to list our Class A common stock on the New York Stock Exchange (the “NYSE”) under the symbol “BJS.” We are an “emerging growth company” as that term is used in the Jumpstart Our Business Startups Act of 2012 and will be subject to reduced public company reporting requirements.
You should consider the risks we have described in “Risk Factors” beginning on page 22.
Neither the Securities and Exchange Commission nor any state securities commission has approved or disapproved of these securities or passed upon the accuracy or adequacy of the prospectus. Any representation to the contrary is a criminal offense.
| Per Share | Total | |||||||
| Initial public offering price |
$ | $ | ||||||
| Underwriting discounts(1) |
$ | $ | ||||||
| Proceeds, before expenses, to us |
$ | $ | ||||||
| (1) | Please read “Underwriting” for a description of all underwriting compensation payable in connection with this offering. |
The underwriters have the option, exercisable for 30 days from the date of this prospectus, to purchase up to an additional shares of Class A common stock from us at the public offering price, less the underwriting discounts.
Delivery of shares of Class A common stock is expected to be made on or about , 2017 through the book-entry facilities of The Depository Trust Company.
| Goldman Sachs & Co. LLC | Morgan Stanley | Credit Suisse |
The date of this prospectus is , 2017.
Table of Contents
Index to Financial Statements
| Page | ||||
| 1 | ||||
| 16 | ||||
| SUMMARY HISTORICAL CONSOLIDATED AND PRO FORMA FINANCIAL DATA |
19 | |||
| 22 | ||||
| 49 | ||||
| 50 | ||||
| 51 | ||||
| 52 | ||||
| SELECTED HISTORICAL CONSOLIDATED AND PRO FORMA FINANCIAL DATA |
53 | |||
| MANAGEMENT’S DISCUSSION AND ANALYSIS OF FINANCIAL CONDITION AND RESULTS OF OPERATIONS |
55 | |||
| 77 | ||||
| 83 | ||||
| 102 | ||||
| 109 | ||||
| 117 | ||||
| 121 | ||||
| 123 | ||||
| 132 | ||||
| 135 | ||||
| MATERIAL U.S. FEDERAL INCOME TAX CONSEQUENCES TO NON-U.S. HOLDERS |
138 | |||
| 143 | ||||
| 150 | ||||
| 150 | ||||
| 150 | ||||
| 152 | ||||
| F-1 | ||||
| A-1 | ||||
Table of Contents
Index to Financial Statements
You should rely only on the information contained in this prospectus or in any free writing prospectus prepared by us or on behalf of us or to which we have referred you. Neither we nor the underwriters have authorized any other person to provide you with information different from that contained in this prospectus and any free writing prospectus. If anyone provides you with different or inconsistent information, you should not rely on it. Neither we nor the underwriters are making an offer to sell these securities in any jurisdiction where an offer or sale is not permitted. The information in this prospectus is accurate only as of the date of this prospectus, regardless of the time of delivery of this prospectus or any sale of our Class A common stock. Our business, financial condition, results of operations and prospects may have changed since that date.
This prospectus contains forward-looking statements that are subject to a number of risks and uncertainties, many of which are beyond our control. Please read “Risk Factors” and “Forward-Looking Statements.”
We own or have rights to various trademarks, service marks and trade names that we use in connection with the operation of our business. This prospectus may also contain trademarks, service marks and trade names of third parties, which are the property of their respective owners. Our use or display of third parties’ trademarks, service marks, trade names or products in this prospectus is not intended to, and does not imply, a relationship with, or endorsement or sponsorship by us. Solely for convenience, the trademarks, service marks and trade names referred to in this prospectus may appear without the ®, TM or SM symbols, but such references are not intended to indicate, in any way, that we will not assert, to the fullest extent under applicable law, our rights or the right of the applicable licensor to these trademarks, service marks and trade names.
Unless the context otherwise requires, the information in this prospectus (other than in the historical financial statements) assumes that the underwriters will not exercise their option to purchase additional shares of our Class A common stock.
References in this prospectus to North America include both the United States and Canada, unless otherwise specified or the context otherwise requires.
The data included in this prospectus regarding the industry in which we operate, including descriptions of trends in the market and our position and the position of our competitors within our industry, is based on a variety of sources, including independent publications, government publications, information obtained from clients, distributors, suppliers, trade and business organizations and publicly available information, as well as our good faith estimates, which have been derived from management’s knowledge and experience in the industry in which we operate. Specifically, much of the industry information set forth in this prospectus is derived from (i) Spears & Associates’ “Hydraulic Fracturing Market 2005-2017” published in the fourth quarter 2016, “Hydraulic Fracturing Market 2006-2018” published in the first quarter 2017 and “Cementing” published in the second quarter of 2016, (ii) Coras Oilfield Research’s fourth quarter 2016 data pack and “January 2017 Oilfield Trends” report and (iii) with respect to historical rig count information, Baker Hughes North America Rig Count as of June 30, 2017. We believe that these third-party sources are reliable and that the third-party information included in this prospectus and in our estimates is accurate and complete; however, we have not independently verified such information.
ii
Table of Contents
Index to Financial Statements
CERTAIN TERMS USED IN THIS PROSPECTUS
Unless the context otherwise requires, references in this prospectus to:
| • | “ABL credit facility” are to our $400.0 million senior secured asset-based loan facility that BJS LLC entered into on May 30, 2017, which we expect to join as a co-borrower in connection with the completion of this offering; |
| • | “Allied Asset Acquisition” are to the acquisition by Allied Energy Services of certain pressure pumping assets from Bayou Well Services, LLC on July 29, 2016; |
| • | “Allied Energy Services” are to Allied Energy Services, LLC, an entity controlled by CSL; |
| • | “Allied Completions Holdings” are to Allied Completions Holdings, LLC; |
| • | “Allied OFS” are to the business and operating assets of Allied Oil & Gas Holdings, LLC, a privately held services company providing cementing services throughout the United States, subsequent to its acquisition by Allied OFS, LLC; |
| • | “Allied Oil and Gas” are to the business of Allied Oil and Gas Holdings, LLC, acquired by CSL Allied Holdings, LLC, which subsequently transferred the assets to Allied OFS, LLC, on April 28, 2016; |
| • | “ALTCem” are to ALTCem, LLC, an entity controlled by CSL; |
| • | “Baker Hughes North America Land Pressure Pumping Business” or “BH N.A. PP” are to BHOO’s hydraulic fracturing and cementing services in North America, including personnel, expertise, technology, infrastructure and equipment; |
| • | “BHGE” are to (i) Baker Hughes Incorporated when used in reference to periods prior to the combination of such entity with General Electric Company’s oil and gas business on July 3, 2017 and (ii) Baker Hughes, a GE company, LLC when used in reference to periods following such combination. General Electric Company and Baker Hughes, a GE company (NYSE: BHGE), hold an approximately 62.5% and 37.5% economic interest, respectively, in Baker Hughes, a GE company, LLC; |
| • | “BHOO” are to Baker Hughes Oilfield Operations LLC and Baker Hughes International Holding LLC, wholly owned subsidiaries of BHGE through which BHGE owns its interest in us, collectively; |
| • | “BJS LLC Agreement” are to the Third Amended and Restated Limited Liability Company Agreement of BJS LLC to be entered into in connection with the completion of this offering; |
| • | “Class A shares” are to shares of Class A common stock, par value $0.001 per share, of the Company; |
| • | “Class B shares” are to shares of Class B common stock, par value $0.001 per share, of the Company; |
| • | “CSL” are to CSL Capital Management, LLC, an investment firm specializing in oilfield services, equipment and technology investments, and its affiliated funds; |
| • | “Company,” “we,” “us” and “our” are to (i) BJ Services, LLC (“BJS LLC”) and its subsidiaries when used in a historical context and (ii) BJ Services, Inc. and its subsidiaries when used in the present tense or prospectively; |
| • | “Existing Owners” are to the Joint Venture, our Sponsors, certain affiliates of BHGE and Management Holdings; |
| • | “Goldman Sachs Affiliated Funds” are to certain investment funds affiliated with Goldman Sachs & Co. LLC and managed by MBD; |
| • | “Joint Venture” is to Allied Energy JV Contribution, LLC, a joint venture among our Sponsors; |
iii
Table of Contents
Index to Financial Statements
| • | “LLC Unit Holders” are to the Existing Owners in their capacity as holders of units representing membership interests in BJS LLC (“LLC Units”) following this offering; |
| • | “Management Holdings” are to BJ Services Management Holdings, LLC, an entity owned by certain members of our management team; |
| • | “MBD” are to the Merchant Banking Division of Goldman Sachs & Co. LLC; |
| • | “Predecessor” are to (A) ALTCem from ALTCem’s inception on January 27, 2015 until the acquisition by Allied OFS, LLC of Allied Oil and Gas on April 28, 2016, (B) ALTCem and Allied OFS on a combined basis from the acquisition by Allied OFS, LLC of Allied Oil and Gas on April 28, 2016 until the Allied Asset Acquisition and (C) ALTCem, Allied OFS and the assets acquired in connection with the Allied Asset Acquisition on a combined basis following the completion of the Allied Asset Acquisition; and |
| • | “Sponsors” are to CSL and Goldman Sachs Affiliated Funds. |
iv
Table of Contents
Index to Financial Statements
This summary provides a brief overview of information contained elsewhere in this prospectus. This summary does not contain all of the information that you should consider before investing in our Class A shares. You should read the entire prospectus carefully, including the financial statements and the notes to those financial statements included in this prospectus. Unless indicated otherwise, the information presented in this prospectus assumes an initial public offering price of $ per Class A share (the midpoint of the price range on the cover page of this prospectus) and that the underwriters do not exercise their option to purchase additional Class A shares. You should read “Risk Factors” for more information about important risks that you should consider carefully before buying our Class A shares.
For a definition of certain terms used in this prospectus, please read “Certain Terms Used in this Prospectus” beginning on page (iii). In addition, we have provided definitions for some of the commonly used terms in the oil and natural gas industry used in this prospectus in the “Glossary of Oil and Natural Gas Terms” beginning on page A-1 of this prospectus.
BJ Services, Inc.
Our Mission: “Perfecting Operational Execution in the Oilfield”
We are the largest North American-focused, pure-play pressure pumping services provider. Our people, equipment and leading-edge technologies provide innovative solutions for exploration and production (“E&P”) clients in North America. Our management team and members of our Board of Directors have an extensive history of providing reliable, safe and efficient solutions for clients across all major North American shale plays. In December 2016, we combined a select set of assets, including certain well-maintained, land-based hydraulic fracturing and cementing equipment, premier facilities and an extensive intellectual property portfolio licensed from Baker Hughes, a GE company, LLC, with the hydraulic fracturing and cementing businesses of Allied Completions Holdings to form our company. Since our formation, we have rapidly and efficiently redeployed a significant portion of our fleets throughout North America.
BJ Services is one of the oilfield services industry’s oldest continuously operating brands, with a 145-year history. The BJ Services brand is recognized globally for its reliability, high-quality equipment and facilities and history of innovation. We are building on this legacy by developing tailored completion and cementing solutions for our clients through a vertically integrated, technology-driven approach that is centered around our flagship technology center in Tomball, Texas, network of regional laboratories and in-house equipment support facilities and access to an intellectual property portfolio containing approximately 500 active patents. Our reputation, commitment to reliability and tailored solutions enable us to provide services to some of North America’s most active and well-capitalized E&P companies.
We currently own 43 hydraulic fracturing fleets with an aggregate capacity of 2.2 million hydraulic horsepower (“HHP”), as well as 241 cementers, making us one of the largest hydraulic fracturing and cementing service providers in North America. We calculate our number of fleets by assuming an average HHP per fleet in excess of 50,000 HHP. As of June 30, 2017, we had 22 hydraulic fracturing fleets and 110 cementers operating across all major North American resource plays. We are also engaged in discussions and negotiations with clients or potential clients relating to the redeployment of an additional 9 fracturing fleets by December 2017. Based on our recent redeployment experience, ongoing contract negotiations and discussions with our existing clients, we expect to increase our operating fleet count to 31 hydraulic fracturing fleets and 140 cementers by December 2017.
1
Table of Contents
Index to Financial Statements
We believe the significant historical investment in, and the relatively young age of, our hydraulic fracturing and cementing equipment, will allow us to redeploy our equipment rapidly with an attractive level of expenditures for equipment reactivation. Between 2011 and 2016, BHGE invested approximately $3.5 billion in capital expenditures and repair and maintenance expenses for the hydraulic fracturing and cementing equipment that it contributed to BJS LLC. As a result of historically invested capital and past strategic events which resulted in lower asset utilization, our hydraulic fracturing fleets have an average engine run time since manufacturing, a measure of the relative age and condition of our equipment, of only 2.75 years as of December 31, 2016, based on an assumed 3,600 hours of engine run time per year for a fleet deployed on continuous operations.
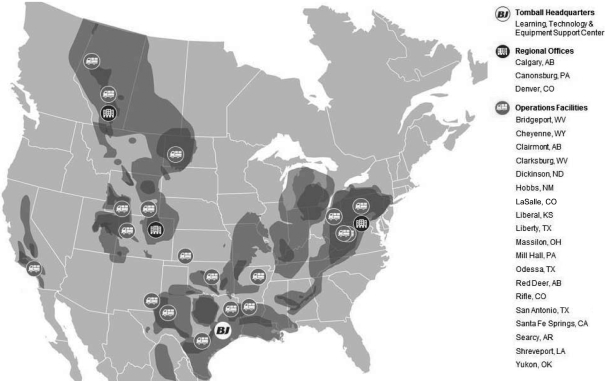
In addition to rapidly redeploying our fleets, we have streamlined the combined legacy footprint of BHGE’s and Allied Completions Holdings’ hydraulic fracturing and onshore cementing businesses from 55 field facilities to 14 owned and 9 leased operating locations that are strategically located within leading resource plays in North America.
The following map represents our facilities and areas of operation as of June 30, 2017:
Our Products and Solutions
Hydraulic Fracturing and Cementing
Hydraulic fracturing. In general, hydraulic fracture treatments are used to increase the productivity of a producing well by pumping fluids at high pressure down a wellbore, creating fractures in the rock formation to stimulate the flow of hydrocarbons. The majority of our tailored hydraulic
2
Table of Contents
Index to Financial Statements
fracturing services are performed in low permeability, damaged reservoirs or horizontal wells. Without successful hydraulic fracturing services, these resources would be uneconomical for our clients.
We own 43 hydraulic fracturing fleets with an aggregate capacity of 2.2 million HHP. We have increased our operating fleet count from six fleets as of December 31, 2016 to 22 fleets as of June 30, 2017, comprising approximately 1,100,000 operating HHP, 20 of which are dedicated to specific clients and operate on a continuous, 24-hour per day basis. We believe we can redeploy and upgrade all 43 of our hydraulic fracturing fleets for an aggregate cost of approximately $197.0 million by leveraging our in-house refurbishment capabilities that will allow us to control the timing and cost of fleet redeployment. As part of our fleet reactivation, we are deploying our proprietary Gorilla pumps, which we believe are among the highest specification mobile pressure pumping units currently in operation. Included in our equipment reactivation is the implementation of proprietary modifications to our equipment that enable us to reduce ongoing repair and maintenance (“R&M”) expense, reduce our total cost of ownership and minimize non-operational time for our clients.
Cementing. We also offer cementing services, which provide zonal isolation between the casing and the open hole, restricting fluid movement between formations or sensitive water aquifers and bond, support and protect the casing from corrosion.
We own 241 cementers, making us one of the largest providers of cementing services to E&P companies in North America. As of June 30, 2017, 110 of our 241 cementers were operating across all major North American resource plays, providing services to approximately 225 land drilling rigs in North America, representing approximately 20% of the land drilling rigs currently in operation. We intend to redeploy our idle cement pumping capacity, which we believe can be fully reactivated with approximately $25.0 million of capital expenditures. As the demand for cementing technologies increases, we expect to increase the number of operating cementers to 140 by December 2017. As trends in the drilling industry evolve, so does the demand for cementing technology solutions that can withstand the challenges associated with longer and deeper horizontal laterals and cyclical stresses across cemented casing strings during advanced completion techniques. We believe we are well-positioned to address that demand with a modernized fleet of cement pumps and premier cement additive technologies that increase job reliability and well integrity during the life of the well. Our standardized fleet is comprised primarily of our proprietary Falcon cementers, which, based on our operating experience, we believe are among the most reliable cementing pumps in the industry by incorporating our Pacemaker fluid pump and standardized control and automation packages.
3
Table of Contents
Index to Financial Statements
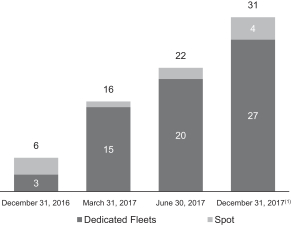
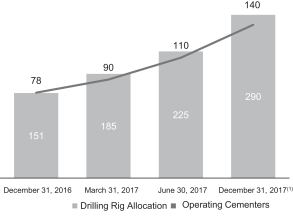
Rapid Redeployment of Hydraulic Fracturing and Cementing Fleet. The rapid growth in our operating fleet count has been driven by a number of factors, including our efforts to quickly and efficiently redeploy and upgrade our hydraulic fracturing capacity in response to increasing client demand and our proven ability to gain client share from other hydraulic fracturing service providers. Based on our experience redeploying 16 hydraulic fracturing fleets and 32 cementers since December 31, 2016, as well as contractual commitments, discussions with our existing clients and active negotiations with potential new clients, we expect to further increase the number of our hydraulic fracturing fleets and cementers operating in the field as follows:
| Operating Hydraulic Fracturing Fleets | Operating Cementers and Drilling Rig Allocations | |
|
| |
| (1) | Amounts presented represent estimates based on our recent redeployment experience, contractual commitments, ongoing contract negotiations and discussions with our existing and potential new clients, and there can be no guarantee that the anticipated increase in operating fleets will occur on the timeline indicated, or at all. Please read “Risk Factors—Risks Inherent in Our Business—We may not be able to reactivate and achieve the expansion and deployment of our fleets on our anticipated timeline, or at all.” |
Additional Technological Solutions
In addition to our hydraulic fracturing and cementing services, our flagship technology center and in-house technological expertise enable us to partner with our clients in the design, testing and implementation of hydraulic fracturing and cementing solutions. North American unconventional resource plays have been made economically viable not only by innovative technologies but also by decreasing the operating cost base realized through applying advances in technical and operational processes which improve operating efficiencies. We believe that we are well positioned to take advantage of our North American focused solution offerings, which include cementing systems, hydraulic fracturing systems, equipment design, performance monitoring, completion design and analysis, and integrated proprietary workflows. We believe our tailored, in-house hydraulic fracturing and cementing products are a key differentiator from competitors who may source such products from third parties, as we are able to customize the products we procure and develop for the specific needs of each client. We are also expanding our extensive intellectual property portfolio by developing additional patents for our well-specific fluid design technology, which we believe is at the forefront of fluid products designed to optimize proppant volumes while reducing pumping times and hydraulic horsepower required.
4
Table of Contents
Index to Financial Statements
Our Technology
We couple our industry expertise and premier products and services with innovative technology to develop tailored solutions for our clients. The BJ Services brand embodies 145 years of leadership in technological innovation that has helped position us as the hydraulic fracturing and cementing service provider of choice for a wide range of active E&P clients in North America. We believe there are several aspects of our technology solutions that differentiate us from our competitors:
| • | Flagship technology center. We own an industry-leading technology center spanning over 80 acres in Tomball, Texas, where our team of experts, including chemists, mechanical engineers, software engineers, geoscientists and reservoir engineers, develop, sustain and support technology to keep us at the forefront of hydraulic fracturing and cementing applications. Our flagship technology center represents a significant historical capital investment for equipment and new laboratory facilities used to develop and enhance hydraulic fracturing and cementing products and perform geomechanical, conductivity and fluid analyses. Our flagship technology center also houses a training center, an equipment support center, a high pressure treating iron repair center and equipment testing facilities. |
| • | Extensive intellectual property portfolio. We have access to a portfolio of approximately 500 active patents related to pressure pumping assets and techniques and non-exclusive licenses with BHGE to continue using these patents for an unlimited term, and we are in the process of filing for six new patents. In addition, we have filed trademarks for 14 product lines that differentiate our hydraulic fracturing and cementing service offerings. |
| • | Reservoir modeling. We believe our evolving reservoir expertise, which includes petrophysics, completions engineering, geosciences, geomechanics and reservoir engineering, will ensure our clients have access to a broad range of services to continually drive completion optimization as our industry evolves. |
| • | Tailored solutions. We have developed custom hydraulic fracturing and cementing designs for leading E&P companies across all major oil and natural gas resource plays in North America. Additionally, we have developed over 180 unique fluid systems tailored to particular reservoir properties and integrated with specific job-design requirements. |
| • | Big data analytics to optimize our equipment and wellsite performance. We continuously collect and analyze data from the performance of our equipment and operations to optimize asset deployment decisions and continually improve our predictive and preventative maintenance processes. For example, this capability has led to significant modifications to our equipment that have more than doubled the run life of most of our critical components, including extending the run life of our fluid ends by approximately 150%, improving uptime across our fleet, reducing our total cost of ownership and improving the safety and reliability of our services and equipment. |
Market Opportunity
North America has multiple hydrocarbon-rich basins with well-known geologic attributes and large, exploitable resource bases that deliver attractive economics to E&P companies at prevailing oil and natural gas prices. Since reaching a cyclical low in May 2016, the North American land rig count has grown 165% from 416 rigs to 1,103 rigs as of June 30, 2017 according to BHGE. We operate in all of the major North American basins, which provides us with an opportunity to develop our business as industry conditions improve. We believe there are several key drivers of demand for our products and services which will likely lead to tightening pressure pumping supply and demand fundamentals and
5
Table of Contents
Index to Financial Statements
continued pricing improvement for our services. In addition, an ongoing shift to larger, more complex well completions and an increased need to achieve drilling efficiencies to manage capital programs have significantly increased demand for the sophisticated hydraulic fracturing, cementing and other completion solutions we provide.
| • | Increasing capital expenditures by E&P companies with an emphasis on completions. In response to the improvement in hydrocarbon prices in the latter half of 2016, E&P companies have increased their capital spending on drilling and completion services, resulting in increased demand for oilfield services activities. According to Coras Oilfield Research, the industry is projected to spend $52 billion on drilling and completions activity in 2017 in the United States, as compared to $38 billion in 2016. Additionally, service intensity has increased the portion of total well costs E&P companies are expected to spend on completions to 75% in 2017 from 66% in 2013. |
| • | Increasing overall drilling activity, rig efficiency and lateral lengths. While rig counts are increasing, according to Coras Oilfield Research, drilling activity is also increasing due to the reduction in average drilling days per well in the United States from 28 days in 2014 to 21 days in 2016, leading to more wells drilled per rig per year. In addition to rig efficiency, lateral lengths have grown from an average of 6,284 feet in 2014 to an average of more than 7,496 feet in the United States in 2016 per Spears & Associates. |
| • | Increasing frac stages per lateral and increasing service intensity of completions. According to Coras Oilfield Research, frac stages per well in the United States have increased from an average of 21 in 2014 to an average of approximately 29 stages per well completed in 2016. Increased stages and service intensity are also expected to result in an increase in proppant usage per well from an average of six million pounds per well in 2014 to an average of approximately ten million pounds per well in 2016 in the United States. |
The aggregate effect of increased demand for greater recovery and completions intensity, as well as increased spending on North American drilling, is driving a trend towards E&P companies seeking partnerships with oilfield service providers that have the technology and facilities to provide complex, engineered hydraulic fracturing and cementing solutions. For more information on industry trends and our market opportunity, see “Industry Trends and Outlook.”
Our Competitive Strengths
Our primary business objectives are to create value for our shareholders and to serve as a strategic partner for our clients by continuing to provide reliable, high-quality, technology-driven solutions for the long-term development of their unconventional resources. We believe that the following strengths differentiate us from our peers and uniquely position us to execute on this strategy:
| • | An iconic oilfield services brand with a rich 145-year history. The BJ Services brand is recognized globally for its reliability, high-quality equipment and history of innovation. We are building on this legacy by developing tailored completion and cementing solutions for our clients through a vertically integrated, technology-driven approach that is centered around our flagship technology center in Tomball, Texas, network of regional laboratories and in-house equipment support facilities and access to an intellectual property portfolio containing approximately 500 active patents. Our reputation, commitment to reliability and tailored solutions enable us to partner with some of North America’s most active and well-capitalized E&P companies. |
| • | A lean, scalable platform with an active presence in every major North American oil and natural gas resource play. We are the largest North American focused, pure-play pressure |
6
Table of Contents
Index to Financial Statements
| pumping services provider, with leading hydraulic fracturing and cementing businesses. As of June 30, 2017, our platform comprised of 43 hydraulic fracturing fleets (of which 22 are operating) providing an aggregate of 2.2 million HHP (approximately 1,100,000 of which represent operating HHP) and 241 cementers (of which 110 are operating). We have aligned our operating infrastructure with key resource plays by streamlining the combined legacy footprint of BHGE’s and Allied Completions Holdings’ hydraulic fracturing and onshore cementing businesses from 55 field sites to 14 owned and 9 leased operating locations. We have also overhauled the legacy BJ Services supply chain and network of facilities to minimize overhead and redundant support services while driving “last-mile” logistics efficiencies across our platform. We believe that our lean, scalable, asset-light infrastructure footprint allows us to serve growing client demand for our services across North America while keeping our operating expenses and overhead at an optimal level. |
| • | Modern, high-quality equipment requiring minimal capital for reactivation and a low cost of ownership. Our hydraulic fracturing fleets and cementers are designed to reduce our operational footprint while maximizing the effectiveness, reliability and longevity of our equipment in the field. |
| • | Differentiated assets. We believe our hydraulic fracturing equipment is among the most standardized and highest-quality equipment in the industry and succeeds in maximizing horsepower and reliability while minimizing its footprint. Our proprietary Gorilla mobile fracturing pumps incorporate the latest high-pressure technology and provide up to 3,000 brake-horsepower. Their advanced capabilities enable us to design and pump jobs that were not previously possible and allow our clients to extract a better rate of return from wells. Our cementing platform is primarily comprised of Falcon cementers, which, based on our operating experience, we believe are among the most reliable cementing pump systems in the industry. Our cementers utilize higher horsepower cement pumps leading spacer and cement additive technology to reduce equipment needs and allow for more efficient operations on longer, higher volume jobs. Our equipment is engineered with the latest control and monitoring systems for precise control of job parameters, real-time job data acquisition and post-job analysis. Our proprietary designed assets enable us to reduce our operational footprint on location and provide better value to our clients. |
| • | Minimal expenditure for reactivation. The average age of our frac pumps is 6.3 years; however, we believe these assets have significant remaining operational life and will require only modest R&M due to past strategic events which resulted in low utilization. This lower utilization of our fleet resulted in having an average engine run time of approximately 9,900 hours or the equivalent of approximately 2.75 years of average engine run time as of December 31, 2016, based on an assumed 3,600 hours of engine run time per year for a fleet deployed on continuous operations, since construction. We also believe that our well-maintained, modern hydraulic fracturing fleets can be effectively upgraded with our proprietary modifications and redeployed for approximately $197.0 million, or approximately $4.6 million per hydraulic fracturing fleet, based on the average cost of reactivating and upgrading the 16 hydraulic fracturing fleets we have reactivated since December 31, 2016 and our knowledge of the costs required to activate the remaining fleets. At $4.6 million per hydraulic fracturing fleet, we believe our reactivation cost is significantly lower than the cost of building a new comparably equipped fleet, which we estimate would cost approximately $50.0 million, based on the experience of our management. Additionally, we expect the cost of redeploying our idle cementers will be approximately $25.0 million or approximately $150,000 per cementer, compared to approximately $1.4 million to build a comparable new cementer. The relative age of our equipment combined with our robust and proprietary maintenance program and vertically |
7
Table of Contents
Index to Financial Statements
| integrated, in-house refurbishment capabilities allows us to activate equipment at a significant cost advantage and efficient timing that is within our control. |
| • | Low overall cost of ownership. We provide vertically integrated client solutions and maintain state-of-the-art equipment support facilities, which are located in close proximity to the major resource plays we service. Our standardized fleets share common equipment and design, which reduces inventory costs and allows us to utilize our technicians across our entire fleet. Additionally, we have further reengineered certain of our equipment to extend the run life and reduce R&M costs of key components. For example, our proprietary modifications to major equipment have more than doubled the run life of most of our critical components, including extending the run life of our fluid ends by approximately 150%, and have reduced our total cost of ownership. We monitor and analyze data using a preventive maintenance model to assure equipment performance, safety and reliability throughout its lifetime. |
| • | Industry-leading technology innovation supported by high-quality research and development capabilities. We own a flagship technology center spanning over 80 acres in Tomball, Texas staffed with chemists, mechanical engineers, software engineers, geoscientists, completions and reservoir engineers who design, develop, sustain and support technology to keep us at the forefront of hydraulic fracturing and cementing applications. Our technology assets and intellectual property portfolio represent a significant historical capital investment to build new laboratory facilities for developing hydraulic fracturing and cementing products and engaging in geomechanical, conductivity and fluid analyses. Our Tomball headquarters also houses a training center, an equipment support center, high pressure treating iron repair center and equipment testing facilities. We also have access to a portfolio of approximately 500 active patents related to pressure pumping assets and techniques and non-exclusive licenses with BHGE to continue using these patents for an unlimited term, and we are in the process of filing for six new patents. In addition, we have filed trademarks for 14 product lines that differentiate our hydraulic fracturing and cementing service offerings. |
| • | Operations designed for a high reliability organization (“HRO”). Our HRO philosophy is designed to maximize returns by integrating our supply chain, sales, technical and operational workflows. The backbone of this system is our ability to collect and analyze “big data,” enhancing our ability to adjust operational parameters to create synergies across sales, supply chain and field operations within our organization. Additionally, our careful monitoring and analysis of our operating equipment has led to engineered solutions that reduce both our and our clients’ costs. We believe we have established a unique and proven management and team performance system that focuses on perfecting execution in the field. |
| • | Experienced executive team and field managers supported by world-class leadership. Our Board of Directors includes former chief executives from the world’s leading oilfield services companies and our senior management has extensive experience leading oilfield services operations. We believe our leadership team’s knowledge of the oilfield services industry is a key competitive advantage. In addition, our field managers have expertise in the resource plays in which they operate and understand the unique challenges that our clients face. We believe their knowledge of our industry and business lines enhances our ability to provide innovative, client-focused and basin-specific solutions, which we also believe strengthens our relationships with our clients. |
8
Table of Contents
Index to Financial Statements
Our Business Strategies
We intend to achieve our primary business objectives through the following business strategies:
| • | Focus on our mission of perfecting operational execution in the oilfield. We are a solutions-driven organization with a focus on maximizing returns and maintaining a low-cost operating model by leveraging our technology capabilities in chemistry, equipment design and reservoir engineering. We believe we have established a unique and proven management system for achieving optimal operational execution in the oilfield, which is based on the following organizational principles: |
| • | Repeatable execution. Our management systems have been designed to drive industry leading environmental, health and safety (“EH&S”) and quality standards. Our management systems also comply with API Q2 standards and are supported by our internally developed cloud-based reporting platform, which provides timely critical information to our operations and our clients. Our management team emphasizes our foundational focus on reliability, and we have established training and operational control procedures throughout the organization. We believe our organizational footprint, including training facilities and support structure, is scalable. Another aspect of our management systems includes an integrated process in which management, operations and supply chain work together to continuously synchronize our business requirements to meet our clients’ needs through sales and operations planning. Repeatable execution and focus on reliability have driven change in our organization as evidenced by improved safety and quality performance, as well as aligning all aspects of our organization to operate in an efficient, low-cost and consistent manner. |
| • | Responsible stewardship. We conduct ourselves at all times with the highest ethical standards. We respect the communities and environment in which we work, our clients and suppliers and all our stakeholders. We seek to safeguard our valuable assets through disciplined capital spending, prudent management of our balance sheet and diligent maintenance of our fleet. We also seek to maximize our returns and create efficiencies for our clients through an asset-light supply-chain and integrated sales, technical and operational workflows. We believe our physical infrastructure strategically targets key resource plays, our owned locations provide significant savings as compared to the rental cost of comparable facilities and our status as the largest North America-focused, pure-play pressure pumping service provider allows for scale and purchasing power to align key supplier strategies. In addition, we believe our centralized maintenance and asset-light distribution structure further drives efficiency, ensuring optimized returns on our investment. |
| • | Right team. We are committed to a learning culture with a focus on being an HRO. We seek to attract and retain the highest quality workforce. We have instituted a scalable infrastructure for learning and competency development. Our HRO philosophy begins with personnel who value our culture of reliability and safety, and at all levels we support their development through training programs and learning tools that make maintaining that culture and our policies and principles a continued focus within our organization. |
| • | Solutions driven. Our focus is to deliver high-quality client solutions through new technology and efficient cost-management. Our management team seeks to provide solutions tailored to the needs of our clients by focusing on our geographic footprint, the elimination of burdensome overhead costs and expenses and the implementation of proprietary engineering methods to reduce product and minimize ongoing R&M costs. We optimize the performance of our assets by incorporating data collection and analysis into our fleet operations and deployment, which provides us with continuous information on the |
9
Table of Contents
Index to Financial Statements
| performance of our assets to ensure we are providing efficient, high-quality services to our clients. These technologies result in less downtime, reduced equipment failure in demanding conditions, lower operating costs and improved safety and reliability. We believe the execution history of our personnel across multiple demand-markets, low overhead and propriety R&M model allow us to understand and respond to the needs of our clients with innovative, cost-effective and tailored solutions. Our experience and technological expertise allows us to meaningfully partner with and provide innovative solutions for our clients. For example, we have developed over 180 unique fluid systems tailored to the reservoir properties and integrated with specific job design requirements for our clients. We believe that the repeatable results we achieve deepen our relationships with our clients and allow us to grow as they expand their footprint both within and beyond their current operating regions. Additionally, we leverage our operational excellence and the knowledge we gain to win new clients and grow our operational footprint. |
| • | Deploying additional hydraulic fracturing horsepower. We expect to see a continued increase in demand for our hydraulic fracturing services based on trends in our industry and believe that we can continue to grow our base of operating assets by upgrading and redeploying our fleets. The average age of our frac pumps is 6.3 years; however, due to past strategic events which resulted in low utilization, our average engine run time is approximately 9,900 hours, or the equivalent of approximately 2.75 years of average engine run time as of December 31, 2016, based on an assumed 3,600 hours of engine run time per year for a fleet deployed on continuous operations, since manufacturing. As a result, we believe that these assets have significant remaining operational life and will require only modest R&M. By leveraging our in-house refurbishment capabilities that allow us to control the timing and cost of fleet redeployment, we also believe that all 43 of our hydraulic fracturing fleets can be effectively reactivated, upgraded with our proprietary modifications and redeployed for a cost of approximately $197.0 million, or approximately $4.6 million per hydraulic fracturing fleet, based on the average cost of reactivating and upgrading the 16 hydraulic fracturing fleets we have reactivated since December 31, 2016 and our knowledge of the costs required to activate the remaining fleets. Based on our experience with recent redeployments, the quality of our equipment and discussions with our clients, we expect to increase our operating fleet count from 22 fleets to 31 operating fleets, comprising approximately 1.6 million operating HHP, by December 2017. |
| • | Increasing our operating cementers. Drilling rig efficiency, combined with longer laterals and “monobore” well designs, are drastically increasing the demand for efficient cementing solutions. We believe we are strategically positioned to provide these solutions by utilizing our high horsepower cement pumps and proprietary spacer and cement additive technology that reduces equipment needs and allows for more efficient operations on longer, higher volume jobs. As of June 30, 2017, we had 110 of our 241 cementers operating in the field across all major North American resource plays and expect to redeploy cementers from our inventory to meet growing demand from our clients. Our cementing fleet, comprised primarily of Falcon cementers, which, based on our operating experience, we believe are among the most reliable cementing pump systems in the industry, has been upgraded to incorporate the significant improvements in available technology in recent years, and we believe these cementers can be fully upgraded and redeployed at an estimated cost of approximately $25.0 million or approximately $150,000 per cementer. |
| • | Maintaining a prudent balance sheet while focusing on profitable operations. We carefully manage our liquidity by continuously monitoring cash flow, capital spending and debt capacity with a focus on profitability and related returns to evaluate our performance. Maintaining our |
10
Table of Contents
Index to Financial Statements
| financial strength and flexibility provides us with the ability to execute our strategy through commodity price cycles. We intend to maintain a conservative approach to managing our balance sheet to preserve operational and strategic flexibility. At June 30, 2017, we had $68.1 million in cash and cash equivalents on hand and ample liquidity, providing us with the means to fund deployment of fleets and cementers and grow our operations. We also expect to join the existing $400.0 million ABL credit facility as a co-borrower in connection with the completion of this offering. As of June 30, 2017, there was a $50.0 million balance outstanding under the ABL credit facility. |
Our Sponsors and Existing Owners
Upon completion of this offering, the Existing Owners will initially own shares of Class A common stock, par value $0.001 per share, of the Company (“Class A shares”), representing approximately % of the voting power of BJ Services, Inc., units representing membership interests in BJ Services, LLC (“BJS LLC” and such units, the “LLC Units”) and shares of Class B common stock, par value $0.001 per share, of the Company (“Class B shares”), representing approximately % of the voting power of BJ Services, Inc. For more information on our reorganization and the ownership of our common stock by our principal shareholders, see “Corporate Reorganization” and “Principal Shareholders.”
CSL is an SEC-registered investment firm founded in early 2008 and headquartered in Houston that invests in energy services companies and entrepreneurs with a focus on oilfield services opportunities. Since its inception, CSL has raised in excess of $1.4 billion in equity capital and commitments across various investment vehicles, including startups, growth equity, recapitalizations and restructurings in energy services, consumables and equipment. Selected current and prior platform investments of CSL include Independence Oilfield Chemicals, a fracturing chemicals and solutions provider, Pyramax Ceramics, a ceramic proppant manufacturer, Mission Well Services, an Eagle Ford-focused fracturing company, and Ranger Energy Services, a production and completion services provider of high specification service rigs.
Founded in 1869, The Goldman Sachs Group, Inc., is a leading global investment banking, securities and investment management firm. Goldman Sachs’ Merchant Banking Division (“MBD”) is the primary center for the firm’s long-term principal investing activity. With nine offices across seven countries, MBD is one of the leading private capital investors in the world with equity and credit investments across corporate, real estate and infrastructure strategies. Since 1986, the group has invested over $170 billion of levered capital across a number of geographies, industries and transaction types.
Baker Hughes, a GE company, LLC (“BHGE”) is the world’s first and only fullstream provider of integrated oilfield products, services and digital solutions. BHGE’s employees today work in more than 120 countries.
Management Holdings is an entity owned and controlled by certain members of our management team and the entity through which such members hold their membership interests in BJS LLC. Management Holdings was formed in 2017.
BJS LLC is a privately owned company and a provider of hydraulic fracturing and cementing services in the oil and natural gas industry. BJS LLC was created in late 2016 pursuant to a Contribution Agreement (the “Contribution Agreement”) entered into among BJS LLC, BHOO, a wholly
11
Table of Contents
Index to Financial Statements
owned subsidiary of BHGE, Allied Completions Holdings and the Joint Venture. Under the terms of the Contribution Agreement, BHOO contributed to BJS LLC its hydraulic fracturing and cementing services in North America, including personnel, expertise, technology and infrastructure. Allied Completions Holdings contributed to BJS LLC cash and its pressure pumping business in the United States, including hydraulic fracturing and cementing services and other assets. Through the Joint Venture, CSL and Goldman Sachs Affiliated Funds contributed cash to BJS LLC in the amount of $325.0 million, of which $175.0 million was retained by BJS LLC and the remaining $150.0 million was paid to BHOO. Our Sponsors currently own approximately 53% of our company, and BHOO owns the remaining interest. Following the completion of this offering, CSL will own approximately % of our company, Goldman Sachs Affiliated Funds will own approximately % of our company, BHOO will own approximately % of our company and Management Holdings will own the remaining interest.
Corporate Reorganization
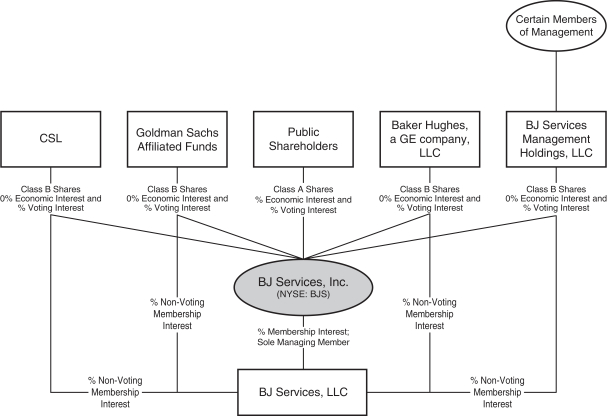
BJ Services, Inc. was incorporated by the Joint Venture as a Delaware corporation in March 2017. Following this offering and the transactions described below, BJ Services, Inc. will be a holding company whose sole material asset will consist of a membership interest in BJ Services, LLC (“BJS LLC”). BJS LLC owns, directly or indirectly, all of the outstanding equity interests in the operating subsidiaries through which we operate our assets. After the consummation of the transactions described below, BJ Services, Inc. will be the sole managing member of BJS LLC and will be responsible for all operational, management and administrative decisions relating to BJS LLC’s business and will consolidate the financial results of BJS LLC and its subsidiaries.
In connection with this offering, (a) all of the membership interests in BJS LLC held by the Existing Owners will be converted into a single class of units in BJS LLC (“LLC Units”) using an implied equity valuation for BJS LLC prior to the offering based on the initial public offering price for our Class A shares set forth on the cover page of this prospectus and the current relative levels of ownership in BJS LLC, (b) BJ Services, Inc. will contribute all of the net proceeds we receive from this offering to BJS LLC in exchange for LLC Units and (c) the Existing Owners (in their capacity as holders of LLC Units following this offering, the “LLC Unit Holders”) will purchase for par value a number of Class B shares equal to the number of LLC Units held by such Existing Owners following this offering. After giving effect to these transactions and the offering contemplated by this prospectus, BJ Services, Inc. will own an approximate % interest in BJS LLC (or % if the underwriters’ option to purchase additional Class A shares is exercised in full) and the Existing Owners will own an approximate % interest in BJS LLC (or % if the underwriters’ option to purchase additional Class A shares is exercised in full). Please see “Principal Shareholders.”
Each Class B share has no economic rights but entitles its holder to one vote on all matters to be voted on by shareholders generally. Holders of Class A shares and Class B shares will vote together as a single class on all matters presented to our shareholders for their vote or approval, except as otherwise required by applicable law or by our certificate of incorporation. We do not intend to list Class B shares on any stock exchange.
The Existing Owners will have the right to require BJS LLC to redeem (the “Redemption Right”) all or a portion of their LLC Units (together with a corresponding number of Class B shares) for Class A shares (or cash at our or BJS LLC’s election (the “Cash Option”)) on a one-for-one basis, as described under “Certain Relationships and Related Party Transactions—BJS LLC Agreement.” In addition, each of our Sponsors and BHGE will have the right, under certain circumstances, to cause us to register the offer and resale of their respective Class A shares as described under “Certain Relationships and Related Party Transactions—Registration Rights Agreement.”
12
Table of Contents
Index to Financial Statements
We will enter into a tax receivable agreement (the “Tax Receivable Agreement”) with BJS LLC and the Existing Owners. This agreement generally provides for the payment by us to an Existing Owner of 85% of the amount of tax benefits, if any, that we actually realize (or are deemed to realize in certain circumstances) in periods after this offering as a result of (a) increases in tax basis resulting from any redemptions of LLC Units described below under “—Redemption rights of holders of LLC Units” or in connection with this offering and (b) certain other tax benefits related to our entering into the Tax Receivable Agreement, including tax benefits attributable to payments under the Tax Receivable Agreement. BJ Services, Inc. will retain the benefit of the remaining 15% of these cash savings. We will be dependent on distributions from BJS LLC to make these payments under the Tax Receivable Agreement, and neither the timing nor the amount of any such distributions can be guaranteed. Payments under the Tax Receivable Agreement are not conditioned upon the Existing Owners maintaining a continued ownership interest in BJS LLC or us and, in the event that the Tax Receivable Agreement is not terminated, the payments under the Tax Receivable Agreement are anticipated to commence in the year following the first year that the Existing Owners redeem their units in a secondary offering and to continue for 15 years after the date of the last redemption or exchange of the LLC Units. See “Certain Relationships and Related Party Transactions—Tax Receivable Agreement.”
The following diagram indicates our simplified ownership structure immediately following this offering and the transactions related thereto (assuming that the underwriters’ option to purchase additional shares is not exercised):
13
Table of Contents
Index to Financial Statements
Controlled Company Status
Because the Existing Owners, together with their affiliates, will initially own LLC Units and shares of Class B common stock, representing approximately % of the voting power of the Company following the completion of this offering, we expect to be a controlled company as of the completion of the offering under Sarbanes-Oxley and NYSE corporate governance standards. A controlled company does not need its board of directors to have a majority of independent directors or to have an independent compensation or nominating and corporate governance committee comprised entirely of independent directors. As a controlled company, we will remain subject to listing rules of the NYSE that require us to have an audit committee composed entirely of independent directors. Under these rules, we must have at least one independent director on our audit committee by the date our Class A common stock is listed on the NYSE, at least two independent directors on our audit committee within 90 days of the listing date and at least three independent directors on our audit committee within one year of the listing date. We expect to have independent directors upon the closing of this offering.
If at any time we cease to be a controlled company, we will take all action necessary to comply with Sarbanes-Oxley and the listing rules of the NYSE, including by appointing a majority of independent directors to our Board of Directors and ensuring we have a compensation committee and a nominating and corporate governance committee, each composed entirely of independent directors, subject to a permitted “phase-in” period.
Risk Factors
Investing in our Class A shares involves risks. You should carefully read the section of this prospectus entitled “Risk Factors” beginning on page 22 and the other information in this prospectus for an explanation of these risks before investing in our Class A shares.
Principal Executive Offices and Internet Address
Our principal executive offices are located at 11211 FM 2920, Tomball, Texas, 77375, and our telephone number is (281) 408-2361. Following the closing of this offering, our website will be located at http://www.bjservices.com. We expect to make our periodic reports and other information filed with or furnished to the Securities and Exchange Commission (the “SEC”) available, free of charge, through our website, as soon as reasonably practicable after those reports and other information are electronically filed with or furnished to the SEC. Information on our website or any other website is not incorporated by reference into this prospectus and does not constitute a part of this prospectus.
Our Emerging Growth Company Status
As a company with less than $1.07 billion in revenue during our last fiscal year, we qualify as an “emerging growth company” as defined in the Jumpstart Our Business Startups Act of 2012 (the “JOBS Act”). As an emerging growth company, we may, for up to five years, take advantage of specified exemptions from reporting and other regulatory requirements that are otherwise applicable generally to public companies. These exemptions include:
| • | the presentation of only two years of audited financial statements and only two years of related Management’s Discussion and Analysis of Financial Condition and Results of Operations in this prospectus; |
14
Table of Contents
Index to Financial Statements
| • | deferral of the auditor attestation requirement on the effectiveness of our system of internal control over financial reporting; |
| • | exemption from the adoption of new or revised financial accounting standards until they would apply to private companies; |
| • | exemption from compliance with any new requirements adopted by the Public Company Accounting Oversight Board requiring mandatory audit firm rotation or a supplement to the auditor’s report in which the auditor would be required to provide additional information about the audit and the financial statements of the issuer; and |
| • | reduced disclosure about executive compensation arrangements. |
We may take advantage of these provisions until we are no longer an emerging growth company, which will occur on the earliest of (i) the last day of the fiscal year following the fifth anniversary of this offering, (ii) the last day of the fiscal year in which we have more than $1.07 billion in annual revenue, (iii) the date on which we issue more than $1.07 billion of non-convertible debt over a three-year period and (iv) the date on which we are deemed to be a “large accelerated filer,” as defined in Rule 12b-2 promulgated under the Securities Exchange Act of 1934, as amended (the “Exchange Act”).
We have elected to take advantage of the applicable JOBS Act provisions, including the exemption that allows emerging growth companies to extend the transition period for complying with new or revised financial accounting standards. Accordingly, the information that we provide you may be different than what you may receive from other public companies in which you hold equity interests.
15
Table of Contents
Index to Financial Statements
| Issuer |
BJ Services, Inc. | |
| Class A shares offered by us |
Class A shares. | |
| Class A shares outstanding after this offering |
Class A shares (or Class A shares, if the underwriters exercise in full their option to purchase additional Class A shares). | |
| Option to purchase additional Class A shares |
We have granted the underwriters a 30-day option to purchase up to an aggregate of additional Class A shares. | |
| Class B shares outstanding after this offering |
Class B shares, or one Class B share for each LLC Unit held by the Existing Owners immediately following this offering. Class B shares are non-economic. When an LLC Unit is exchanged for a Class A share, a corresponding Class B share will be cancelled. | |
| Voting power of Class A shares after this offering |
% (or 100% if all outstanding LLC Units are exchanged by the Existing Owners, along with a corresponding number of our Class B shares, for newly-issued shares of Class A shares on a one-for-one basis). | |
| Voting power of Class B shares after this offering |
% (or 0% if all outstanding LLC Units are exchanged by the Existing Owners, along with a corresponding number of our Class B shares, for newly-issued shares of Class A shares on a one-for-one basis). | |
| Voting rights |
Each of our Class A shares entitles its holder to one vote on all matters to be voted on by shareholders generally. Each of our Class B shares entitles its holder to one vote on all matters to be voted on by shareholders generally. Holders of our Class A shares and Class B shares vote together as a single class on all matters presented to our shareholders for their vote or approval, except as otherwise required by applicable law or by our certificate of incorporation. See “Description of Capital Stock.” | |
| Use of proceeds |
We expect to receive approximately $ million of net proceeds from this offering (or $ million if the underwriters exercise in full their option to purchase additional Class A shares), based upon the assumed initial public offering price of $ per share (the midpoint of the price range set forth on the cover page of this prospectus), after deducting underwriting | |
16
Table of Contents
Index to Financial Statements
| discounts and estimated offering expenses payable by us. | ||
| We intend to contribute all of the net proceeds we receive from this offering to BJS LLC, and we expect BJS LLC to use: approximately $ million of the proceeds for expanding its fleet, improving the reliability of its fleet by performing upgrades to extend component life, investing in facility improvements to optimize its fleet refurbishment program; approximately $ million of the proceeds for performing additional research and development; and the remainder of the proceeds for other general corporate purposes, including to repay borrowings outstanding under our ABL credit facility from time to time. Please read “Use of Proceeds.” | ||
| Dividend policy |
We do not anticipate paying any cash dividends on our Class A shares. In addition, our ABL credit facility places certain restrictions on our ability to pay cash dividends. Please read “Dividend Policy.” | |
| Redemption rights of holders of LLC Units |
The Existing Owners may from time to time at each of their options require BJS LLC to redeem all or a portion of their LLC Units in exchange for, at our election, newly-issued Class A shares on a one-for-one basis or, at our or BJS LLC’s option, the Cash Option; provided that, at our election, we may effect a direct exchange of such Class A shares or such cash, as applicable, for such LLC Units. The Existing Owners may exercise such Redemption Right for as long as their LLC Units remain outstanding. See “Certain Relationships and Related Party Transactions—BJS LLC Agreement.” Simultaneously with the payment of cash or Class A shares, as applicable, in connection with a redemption or exchange of LLC Units pursuant to the terms of the BJS LLC Agreement, a number of shares of our Class B shares registered in the name of the redeeming or exchanging Existing Owner will be cancelled for no consideration on a one-for-one basis with the number of LLC Units so redeemed or exchanged. | |
| Tax receivable agreement |
We will enter into a Tax Receivable Agreement with BJS LLC and the Existing Owners. This agreement generally provides for the payment by us to an Existing Owner of 85% of the amount of tax benefits, if any, that we actually realize (or are deemed to realize in certain circumstances) in periods after this offering as a result of (i) increases in tax basis resulting from any | |
17
Table of Contents
Index to Financial Statements
| redemptions of LLC Units described above under “—Redemption rights of holders of LLC Units” or in connection with this offering and (ii) certain | ||
| other tax benefits related to our entering into the Tax Receivable Agreement, including tax benefits attributable to payments under the Tax Receivable Agreement. BJ Services Company Inc. will retain the benefit of the remaining 15% of these cash savings. See “Certain Relationships and Related Party Transactions—Tax Receivable Agreement.” | ||
| Directed share program |
At our request, the underwriters have reserved up to % of the Class A shares being offered by this prospectus for sale, at the initial public offering price, to our directors, executive officers and employees. The sales will be made by the underwriters through a directed share program. We do not know if these persons will choose to purchase all or any portion of these reserved Class A shares, but any purchases they do make will reduce the number of Class A shares available to the general public. Please read “Underwriting—Directed Share Program.” | |
| Risk factors |
You should carefully read and consider the information set forth under the heading “Risk Factors” and all other information set forth in this prospectus before deciding to invest in our Class A shares. | |
| Listing and trading symbol |
We have applied to list our Class A shares on the New York Stock Exchange under the symbol “BJS.” | |
18
Table of Contents
Index to Financial Statements
SUMMARY HISTORICAL CONSOLIDATED AND PRO FORMA FINANCIAL DATA
The following table presents summary historical consolidated financial data of BJS LLC and our Predecessor as of the dates and for the periods indicated. Our Predecessor refers to (i) ALTCem from ALTCem’s inception on January 27, 2015 until the acquisition of Allied Oil and Gas, (ii) ALTCem and Allied OFS on a combined basis from the acquisition of Allied Oil and Gas until the Allied Asset Acquisition and (iii) ALTCem, Allied OFS and the assets acquired in connection with the Allied Asset Acquisition on a combined basis following the completion of the Allied Asset Acquisition. We conduct our business through two operating segments: hydraulic fracturing and cementing.
The summary historical consolidated financial data of BJS LLC presented in the following table for the three months ended March 31, 2017 and 2016 are derived from the unaudited condensed consolidated financial statements appearing elsewhere in this prospectus. The summary historical consolidated financial data of the Predecessor at December 31, 2016 and 2015 and for the year ended December 31, 2016 and the period from January 27, 2015 (Date of Inception) to December 31, 2015 are derived from the audited financial statements appearing elsewhere in this prospectus. The summary historical consolidated financial data presented below should be read in conjunction with “Risk Factors,” “Management’s Discussion and Analysis of Financial Condition and Results of Operations” and our consolidated financial statements and the related notes and other financial data included elsewhere in this prospectus.
The summary unaudited condensed pro forma financial data presented in the following table for the three months ended March 31, 2017 and the year ended December 31, 2016 are derived from the unaudited pro forma condensed financial statements included elsewhere in this prospectus. The summary unaudited pro forma condensed balance sheets as of March 31, 2017 assume the offering and the transactions described below occurred as of March 31, 2017 and the unaudited pro forma condensed statements of operations for the three months ended March 31, 2017, and the year ended December 31, 2016 assume the offering and the transactions described below occurred as of January 1, 2016. These transactions include, and the unaudited pro forma condensed financial statements give effect to, the following:
| • | with respect to the year ended December 31, 2016, our acquisition of Allied Oil and Gas; |
| • | with respect to the year ended December 31, 2016, the contribution by BHGE of its North American hydraulic fracturing and land cementing businesses to us; |
| • | the consummation of this offering and the completion of the transactions described under “—Corporate Reorganization”; and |
| • | the application of the net proceeds of this offering as described in “Use of Proceeds.” |
The following table also presents summary historical financial information of Allied Oil and Gas and Baker Hughes’s North American Pressure Pumping business (“BH N.A. PP”), two significant acquisitions that were completed during the year ended December 31, 2016 for the periods indicated. The summary historical financial information of Allied Oil and Gas for the period from January 1, 2016 to April 28, 2016 and for the years ended December 31, 2015 and 2014 have been derived from the historical financial statements included elsewhere in this prospectus, except for certain balance sheet data, which was derived from Allied Oil and Gas’ accounting records. The summary audited historical financial information of BH N.A. PP for the period from January 1, 2016 through December 30, 2016, and for the years ended December 31, 2015 and 2014 have been derived from the audited condensed abbreviated financial statements included elsewhere in this prospectus.
19
Table of Contents
Index to Financial Statements
| BH N.A. PP | Allied Oil and Gas | Predecessor | BJS LLC | Pro Forma | ||||||||||||||||||||||||||||||||||||||||||||
| (in millions, |
Years ended December 31, |
Period from January 1, 2016 to December 30, 2016 |
Years ended December 31, |
Period from January 1, 2016 to April 28, 2016 |
Period from January 27, 2015 (Date of Inception) to December 31, 2015 |
Year ended December 31, 2016 |
Three months ended March 31, |
Year ended December 31, 2016 |
Three months ended March 31, 2017 |
|||||||||||||||||||||||||||||||||||||||
| 2014 | 2015 | 2014 | 2015 | 2016 | 2017 | |||||||||||||||||||||||||||||||||||||||||||
| Statements of Operations Data: |
||||||||||||||||||||||||||||||||||||||||||||||||
| Revenue |
$ | 4,296.1 | $ | 1,272.0 | $ | 231.0 | $ | 132.6 | $ | 52.7 | $ | 9.2 | $ | 1.2 | $ | 37.0 | $ | 1.0 | $ | 180.1 | ||||||||||||||||||||||||||||
| Revenues in Excess (Deficit) of Direct Operating expenses |
187.3 | (636.8 | ) | (283.9 | ) | N/A | N/A | N/A | N/A | N/A | N/A | N/A | ||||||||||||||||||||||||||||||||||||
| Operating income (loss) |
N/A | N/A | N/A | 13.5 | (86.7 | )(a) | (9.6 | )(a) | (3.9 | ) | (2.0 | )(b) | (1.3 | ) | (64.4 | ) | ||||||||||||||||||||||||||||||||
| Net income (loss) |
N/A | N/A | N/A | 9.7 | (91.3 | ) | (11.1 | ) | (3.9 | ) | (2.3 | ) | (1.3 | ) | (63.4 | ) | ||||||||||||||||||||||||||||||||
| Other Financial Data: |
||||||||||||||||||||||||||||||||||||||||||||||||
| Capital expenditures |
N/A | N/A | N/A | 32.8 | 0.8 | — | 10.4 | 90.5 | (c) | — | 42.6 | |||||||||||||||||||||||||||||||||||||
| Adjusted EBITDA |
505.2 | (d) | (355.1 | )(d) | (220.8 | )(d) | 25.9 | (4.0 | ) | (7.4 | ) | (3.4 | ) | (20.0 | ) | (1.0 | ) | (30.9 | ) | |||||||||||||||||||||||||||||
| Per Share / Unit Data: |
||||||||||||||||||||||||||||||||||||||||||||||||
| Net loss per share: |
||||||||||||||||||||||||||||||||||||||||||||||||
| Basic and diluted |
N/A | N/A | N/A | N/A | N/A | N/A | (9.40 | ) | (5.23 | ) | (3.08 | ) | (71.16 | ) | ||||||||||||||||||||||||||||||||||
| Weighted average shares/units outstanding: |
||||||||||||||||||||||||||||||||||||||||||||||||
| Basic and diluted |
N/A | N/A | N/A | N/A | N/A | N/A | 411,964 | 435,630 | 419,914 | 891,000 | ||||||||||||||||||||||||||||||||||||||
| Balance Sheet Data (at end of period): |
||||||||||||||||||||||||||||||||||||||||||||||||
| Total assets |
N/A | N/A | N/A | 165.4 | 71.4 | 66.0 | 12.1 | 893.2 | N/A | 1,045.0 | ||||||||||||||||||||||||||||||||||||||
| Long-term liabilities |
N/A | N/A | N/A | 77.1 | 0.8 | 0.7 | 0.4 | 1.4 | N/A | 3.7 | ||||||||||||||||||||||||||||||||||||||
| (a) | Includes $70.4 million and $1.5 million in impairment charges in the year ended December 31, 2015 and the period from January 1, 2016 to April 28, 2016, respectively. |
| (b) | Includes a bargain purchase gain of $34.2 million recorded in the year ended December 31, 2016. |
| (c) | Capital expenditures for the Predecessor for 2016 include $20.3 million of noncash capital expenditures and $4.6 million of accrued capital expenditures and capital expenditures for BJS LLC for the three months ended March 31, 2017 include $22.7 million of accrued capital expenditures. |
| (d) | The BH N.A. PP financial information excludes certain indirect expenses incurred in connection with its ownership and operations on a fully standalone basis, including, but not limited to, corporate general and administrative expenses, interest expense, certain elements of depreciation and amortization and foreign, federal and state income taxes. See the audited combined abbreviated statements of direct revenues and direct operating expenses included elsewhere in this prospectus. |
Non-GAAP Financial Measures
Adjusted EBITDA is not a financial measure determined in accordance with GAAP. We define Adjusted EBITDA as net loss before interest expense, net; income tax provision (benefit); depreciation and amortization; bargain purchase gain; acquisition-related transaction costs and impairment of assets; and other noncash and other items that we do not view as indicative of our ongoing performance.
We believe the presentation of Adjusted EBITDA is useful to our investors because EBITDA is an appropriate measure of evaluating our operating performance and liquidity that reflects the resources available for strategic opportunities including, among others, investing in our business and strengthening our balance sheet. In particular, we believe Adjusted EBITDA helps our investors assess and understand our operating performance when comparing those results with previous and
20
Table of Contents
Index to Financial Statements
subsequent periods or forecasting performance for future periods, as management views the excluded items to be outside our normal operating results (i.e., not seen as typical in our results) or such items that do not impact cash. Further, Adjusted EBITDA is a widely used benchmark in the investment community. Adjusted EBITDA should not be considered as an alternative to, or more meaningful than, net income (loss) and net cash provided by (used in) operating activities determined in accordance with GAAP. Certain items excluded from Adjusted EBITDA are significant components in understanding and assessing our financial performance, such as our cost of capital and tax structure, as well as the historic costs of depreciable assets, some of which are reflected in Adjusted EBITDA. Our presentation of Adjusted EBITDA should not be construed as an indication that our results will be unaffected by the items excluded from Adjusted EBITDA. Our computations of Adjusted EBITDA may not be identical to other similarly titled measures of other companies. The following table presents reconciliations of Adjusted EBITDA to net income (loss) and net cash provided by (used in) operating activities, our most directly comparable financial measures calculated and presented in accordance with GAAP.
| BH N.A. PP | Allied Oil and Gas | Predecessor | BJS LLC | Pro Forma | ||||||||||||||||||||||||||||||||||||||||||||
| Years ended December 31, |
Period from January 1, 2016 to December 30, 2016 |
Year ended December 31, |
Period from January 1, 2016 to April 28, 2016 |
Period from January 27, 2015 (Date of Inception) to December 31, 2015 |
Year ended December 31, 2016 |
Three months ended March 31, |
Year ended December 31, 2016 |
Three months ended March 31, 2017 |
||||||||||||||||||||||||||||||||||||||||
| (in millions) |
2014 | 2015 | 2014 | 2015 | 2016 | 2017 | ||||||||||||||||||||||||||||||||||||||||||
| Revenues in Excess (Deficit) of Direct Operating Expenses |
$ | 187.3 | $ | (636.8 | ) | $ | (283.9 | ) | N/A | N/A | N/A | N/A | N/A | N/A | — | |||||||||||||||||||||||||||||||||
| Net income (loss) |
N/A | N/A | N/A | 9.7 | (b) | (91.3 | )(b) | (11.1 | )(b) | (3.9 | )(b) | (2.3 | )(b) | (1.3 | ) | (63.4 | ) | |||||||||||||||||||||||||||||||
| Depreciation and amortization |
317.9 | 281.7 | 63.1 | 12.3 | 12.3 | 2.2 | 0.4 | 9.4 | 0.3 | 25.5 | ||||||||||||||||||||||||||||||||||||||
| Interest expense (income), net |
N/A | N/A | — | 3.9 | 4.6 | 1.5 | 0.1 | — | — | (0.1 | ) | |||||||||||||||||||||||||||||||||||||
| Income tax (benefit) |
N/A | N/A | — | — | — | — | — | — | — | (1.0 | ) | |||||||||||||||||||||||||||||||||||||
|
|
|
|
|
|
|
|
|
|
|
|
|
|
|
|
|
|
|
|
|
|
|
|
|
|||||||||||||||||||||||||
| EBITDA |
$ | 505.2 | $ | (355.1 | ) | $ | (220.8 | ) | $ | 25.9 | $ | (74.4 | ) | $ | (7.4 | ) | $ | (3.4 | ) | $ | 7.1 | $ | (1.0 | ) | $ | (39.0 | ) | |||||||||||||||||||||
|
|
|
|
|
|
|
|
|
|
|
|
|
|
|
|
|
|
|
|
|
|
|
|
|
|||||||||||||||||||||||||
| Net cash provided by (used in) operating activities |
N/A | N/A | N/A | $ | 22.0 | $ | (3.2 | ) | $ | 0.1 | $ | (3.9 | ) | $ | (19.7 | ) | $ | (0.7 | ) | $ | (15.3 | ) | ||||||||||||||||||||||||||
| Adjustments to reconcile net income (loss) to net cash provided by (used in) operating activities |
N/A | N/A | N/A | (14.0 | ) | (84.5 | ) | (6.8 | ) | $ | (0.6 | ) | $ | 22.4 | $ | (0.4 | ) | $ | (27.1 | ) | ||||||||||||||||||||||||||||
| Changes in working capital |
N/A | N/A | N/A | $ | 1.7 | $ | (3.6 | ) | $ | (4.4 | ) | $ | 0.6 | $ | (5.0 | ) | $ | (0.2 | ) | $ | (21.0 | ) | ||||||||||||||||||||||||||
| Depreciation and amortization |
N/A | N/A | N/A | 12.3 | 12.3 | 2.2 | 0.4 | 9.4 | 0.3 | 25.5 | ||||||||||||||||||||||||||||||||||||||
| Interest expense (income), net |
N/A | N/A | N/A | 3.9 | 4.6 | 1.5 | 0.1 | — | — | (0.1 | ) | |||||||||||||||||||||||||||||||||||||
| Income tax (benefit) |
N/A | N/A | N/A | — | — | — | — | — | — | (1.0 | ) | |||||||||||||||||||||||||||||||||||||
|
|
|
|
|
|
|
|
|
|
|
|
|
|
|
|
|
|
|
|
|
|
|
|
|
|||||||||||||||||||||||||
| EBITDA |
N/A | N/A | N/A | $ | 25.9 | $ | (74.4 | ) | $ | (7.4 | ) | $ | (3.4 | ) | $ | 7.1 | $ | (1.0 | ) | $ | (39.0 | ) | ||||||||||||||||||||||||||
|
|
|
|
|
|
|
|
|
|
|
|
|
|
|
|
|
|
|
|
|
|
|
|
|
|||||||||||||||||||||||||
| Acquisition related costs |
— | — | — | — | — | — | — | 7.1 | — | — | ||||||||||||||||||||||||||||||||||||||
| Bargain purchase gain |
— | — | — | — | — | — | — | (34.2 | ) | — | — | |||||||||||||||||||||||||||||||||||||
| Impairments |
— | — | — | — | 70.4 | — | — | — | — | — | ||||||||||||||||||||||||||||||||||||||
| Sponsor-paid severance |
— | — | — | — | — | — | — | — | — | 5.0 | ||||||||||||||||||||||||||||||||||||||
| Severance, retention and milestone bonuses |
— | — | — | — | — | — | — | — | — | 1.5 | ||||||||||||||||||||||||||||||||||||||
| Fleet registration costs |
— | — | — | — | — | — | — | — | — | 1.6 | ||||||||||||||||||||||||||||||||||||||
|
|
|
|
|
|
|
|
|
|
|
|
|
|
|
|
|
|
|
|
|
|
|
|
|
|||||||||||||||||||||||||
| Adjusted EBITDA |
$ | 505.2 | (a) | $ | (355.1 | )(a) | $ | (220.8 | )(a) | $ | 25.9 | $ | (4.0 | ) | $ | (7.4 | ) | $ | (3.4 | ) | $ | (20.0 | ) | $ | (1.0 | ) | $ | (30.9 | ) | |||||||||||||||||||
|
|
|
|
|
|
|
|
|
|
|
|
|
|
|
|
|
|
|
|
|
|
|
|
|
|||||||||||||||||||||||||
| (a) | The BH N.A. PP financial information excludes certain indirect expenses incurred in connection with its ownership and operations on a fully standalone basis, including, but not limited to, corporate general and administrative expenses, interest expense, certain elements of depreciation and amortization and foreign, federal and state income taxes. See the audited combined abbreviated statements of direct revenues and direct operating expenses included elsewhere in this prospectus. |
| (b) | Included in net income (loss) are equity-based compensation costs of $1.1 million, $0.9 million and $3.1 million for the year ended December 31, 2014, the year ended December 31, 2015 and the period from January 1, 2016 to April 28, 2016, respectively, for Allied Oil and Gas. Similarly, included in net income (loss) are equity-based compensation costs of $0.1 million and $0.3 million for the period from January 27, 2015 to December 31, 2015 and the year ended December 31, 2016, respectively, for the Predecessor. |
21
Table of Contents
Index to Financial Statements
Investing in our Class A shares involves a high degree of risk. You should carefully consider the risks described below with all of the other information included in this prospectus before deciding to invest in our Class A shares. The risks discussed below are not the only risks we face. Additional risks or uncertainties not currently known to us, or that we currently deem immaterial, may also have a material adverse effect on our business, financial condition, prospects, results of operations or cash flows. If any of the following risks were to occur, our business, financial condition, results of operations and cash flows could be materially adversely affected. In that case, the trading price of our Class A common stock could decline and you could lose all or part of your investment.
Risks Inherent in Our Business
Our business and financial performance depend on the oil and natural gas industry and particularly on the level of capital spending and exploration and production activity within North America, and a decline in prices for oil and natural gas may have an adverse effect on our revenue, cash flows, profitability and growth.
Demand for most of our services depends substantially on the level of capital expenditures by E&P companies in North America. A prolonged reduction in oil and natural gas prices would generally depress the level of oil and natural gas exploration, development, production and well completion activity and would result in a corresponding decline in the demand for the hydraulic fracturing services that we provide. The significant decline in oil and natural gas prices beginning in late 2014 caused a reduction in our clients’ spending and associated drilling and completion activities, which had an adverse effect on our financial performance. If current prices were to decline, similar declines in our clients’ spending would have an adverse effect on our financial performance. In addition, a worsening of these conditions may result in a material adverse impact on the liquidity and financial position of certain of our clients, resulting in further spending reductions, delays in the collection of amounts owed to us and similar impacts. Despite recently announced production cuts by the Organization of Petroleum Exporting Countries (“OPEC”), there may not be a sustainable improvement in oil prices and customer spending may not improve as some sources predict.
Many factors over which we have no control affect the supply of and demand for, and our clients’ willingness to explore, develop and produce, oil and natural gas and influence prices for our services, including:
| • | the domestic and foreign supply of, and demand for, oil and natural gas; |
| • | the level of prices, and expectations about future prices, of oil and natural gas; |
| • | the level of global oil and natural gas exploration and production activity; |
| • | the cost of exploring for, developing, producing and delivering oil and natural gas; |
| • | the supply of, and demand for, drilling and hydraulic fracturing equipment, cementing equipment and other oilfield services and equipment; |
| • | the expected decline rates of current production levels; |
| • | the price and quantity of imports and exports of oil and natural gas; |
| • | political and economic conditions in oil and natural gas producing countries and regions, including the United States, Canada, the Middle East, Africa, South America and Russia; |
| • | actions by the members of OPEC with respect to oil production levels and announcements of potential changes in such levels; |
22
Table of Contents
Index to Financial Statements
| • | speculative trading in oil and natural gas derivative contracts; |
| • | the level of consumer product demand; |
| • | the discovery rates of new oil and natural gas reserves; |
| • | expansions or contractions in the credit market; |
| • | the strength or weakness of the U.S. dollar; |
| • | the levels of oil and natural gas storage; |
| • | weather conditions and other natural disasters; |
| • | domestic and foreign tax policy; |
| • | domestic and foreign governmental approvals and regulatory requirements and conditions; |
| • | the continued threat of terrorism and the impact of military and other action, including military action in the Middle East; |
| • | technical advances affecting energy production; |
| • | the proximity and capacity of oil and natural gas pipelines and other transportation facilities; |
| • | the availability of water resources, suitable proppant and chemicals in sufficient quantities for use in hydraulic fracturing fluids; |
| • | the price and availability of alternative sources of energy; |
| • | the ability of oil and natural gas producers to raise equity capital and debt financing; |
| • | merger and divestiture activity among oil and natural gas producers; and |
| • | overall domestic and global economic and geopolitical conditions. |
These factors, among others, and the volatility of the energy markets make it extremely difficult to predict future oil and natural gas price movements with any certainty. A significant or sustained decline in oil and natural gas prices would have a material adverse effect on our business, results of operation and financial condition.
Our operations require substantial capital, and we may be unable to obtain needed capital or financing on satisfactory terms or at all, which could limit our ability to redeploy our fleets and to grow.
The oilfield services industry is capital intensive. In conducting our business and operations, we have made, and expect to continue to make, substantial capital expenditures. Our total capital expenditures were approximately $70.0 million for the year ended December 31, 2016, and we expect to spend approximately $180.0 million in 2017. We have historically financed capital expenditures primarily with available cash on our balance sheet. Following the completion of this offering, we intend to finance our capital expenditures primarily with cash on hand, cash flow from operations and borrowings under our ABL credit facility. As of June 30, 2017, there was $50.0 million principal amount of borrowings outstanding under the ABL credit facility. We may be unable to generate sufficient cash from operations and other capital resources to maintain planned or future levels of capital expenditures which, among other things, may prevent us from acquiring new equipment or properly maintaining our existing equipment. Further, any disruptions or continuing volatility in the global financial markets may lead to an increase in interest rates or a contraction in credit availability impacting our ability to finance our operations. This could put us at a competitive disadvantage or interfere with our growth plans. Further, our actual capital expenditures for 2017 or future years could exceed our capital expenditure budget. In the event our capital expenditure requirements at any time are greater than the amount we
23
Table of Contents
Index to Financial Statements
have available under our ABL credit facility, we could be required to seek additional sources of capital, which may include additional debt financing, joint venture partnerships, sales of assets, offerings of debt or equity securities or other means. We may not be able to obtain any such alternative source of capital, in which case we may be required to curtail or eliminate contemplated activities. If we can obtain alternative sources of capital, the terms on which such capital is available may not be favorable to us. In particular, the terms of any debt financing may include covenants that significantly restrict our operations.
We may not be able to reactivate and achieve the expansion and deployment of our fleets on our anticipated timeline, or at all.
Based on recent redeployment experience, ongoing contract negotiations and discussions with our existing clients, we expect to increase our operating fleet count to 31 hydraulic fracturing fleets and 140 cementers by December 2017. However, we do not currently have contractual commitments for the additional hydraulic fracturing fleets and cementers that are not currently deployed, nor can we guarantee that we will be successful in achieving this growth on our anticipated timeline, or at all. Factors beyond our control may delay or prevent our fleet reactivation, including declines in the level of exploration and production activity in North America, increased competition in the oilfield services industry, insufficient capital for the upgrades and refurbishments required to reactivate our equipment and other unanticipated events. Our inability to grow as planned may reduce our ability to maintain and improve profitability and adversely impact our results of operations, liquidity and financial condition.
Our success will be affected by the use and protection of our proprietary technology. There are limitations to our intellectual property rights in our proprietary technology, and thus our right to exclude others from the use of such proprietary technology.
Our success will be affected by our development and implementation of new product designs and improvements and by our ability to protect and maintain critical intellectual property assets related to these developments. Although in some cases our products are not protected by any registered intellectual property rights, in other cases we rely on a combination of patents and trade secret laws to establish and protect this proprietary technology.
We currently have access to a portfolio of approximately 500 active patents related to pressure pumping assets and techniques and non-exclusive licenses with BHGE to continue using these patents for an unlimited term, and we are in the process of filing for new patents. Patent rights give the owner of a patent the right to exclude third parties from making, using, selling and offering for sale the inventions claimed in the patents in the applicable country. Patent rights do not necessarily grant the owner of a patent the right to practice the invention claimed in a patent, but merely the right to exclude others from practicing the invention claimed in the patent. It may also be possible for a third party to design around our patents. Furthermore, patent rights have strict territorial limits.
In addition, by customarily entering into confidentiality and/or license agreements with our employees, clients and potential clients and suppliers, we attempt to limit access to and distribution of our technology. Our rights in our confidential information, trade secrets and confidential know-how will not prevent third parties from independently developing similar technology. Publicly available information (e.g. information in expired issued patents, published patent applications and scientific literature) can also be used by third parties to independently develop technology. We cannot provide assurance that this independently developed technology will not be equivalent or superior to our proprietary technology.
Our competitors may infringe upon, misappropriate, violate or challenge the validity or enforceability of our intellectual property and we may not be able to adequately protect or enforce our intellectual property rights in the future.
24
Table of Contents
Index to Financial Statements
We may record losses or impairment charges related to idle assets or assets that we sell.
Prolonged periods of low utilization, changes in technology or the sale of assets below their carrying value may cause us to experience losses. These events could result in the recognition of impairment charges that decrease our net income or increase our net loss. Significant impairment charges as a result of a decline in market conditions or otherwise could have a material adverse effect on our results of operations in future periods.
Our business depends upon our ability to obtain specialized equipment, parts and key raw materials, including frac sand and chemicals, from third-party suppliers, and we may be vulnerable to delayed deliveries and future price increases.
We purchase specialized equipment, parts and raw materials (including, for example, frac sand, chemicals and fluid ends) from third party suppliers and affiliates. At times during the business cycle, there is a high demand for hydraulic fracturing and other oilfield services and extended lead times to obtain equipment and raw materials needed to provide these services. Should our current suppliers be unable or unwilling to provide the necessary equipment, parts or raw materials or otherwise fail to deliver the products timely and in the quantities required, any resulting delays in the provision of our services could have a material adverse effect on our business, financial condition, results of operations and cash flows. In addition, future price increases for this type of equipment, parts and raw materials could negatively impact our ability to purchase new equipment, to update or expand our existing fleet, to timely repair equipment in our existing fleet or meet the current demands of our clients.
We rely on a few key employees whose absence or loss could adversely affect our business.
Many key responsibilities within our business have been assigned to a small number of employees, and the loss of their services could adversely affect our business. In particular, the loss of the services of one or more members of our executive team, including our President and Chief Executive Officer, Chief Operating Officer and Chief Financial Officer, could disrupt our operations. We do not maintain “key person” life insurance policies on any of our employees. As a result, we are not insured against any losses resulting from the death of our key employees.
We may be unable to maintain key employees, technical personnel and other skilled or qualified workers due to immigration enforcement action or related loss.
We require full compliance with the Immigration Reform and Control Act of 1986 and other laws concerning immigration and the hiring of legally documented workers. We recognize that foreign nationals may be a valuable source of talent, but that not all foreign nationals are authorized to work for U.S. companies immediately. In some cases, it may be necessary to obtain a required work authorization from the U.S. Department of Homeland Security or similar government agency prior to a foreign national working as an employee for us. Although we do not know of any issues with our employees, we could lose an employee or be subject to an enforcement action that may have a material adverse effect on our business, financial condition, prospects or results of operations.
If we are unable to employ a sufficient number of skilled and qualified workers, our capacity and profitability could be diminished and our growth potential could be impaired.
The delivery of our services requires skilled and qualified workers with specialized skills and experience who can perform physically demanding work. As a result of the volatility of the oilfield services industry and the demanding nature of the work, workers may choose to pursue employment in fields that offer a more desirable work environment at wage rates that are competitive. Our ability to be productive and profitable will depend upon our ability to employ and retain skilled workers. In addition,
25
Table of Contents
Index to Financial Statements
our ability to expand our operations depends in part on our ability to increase the size of our skilled labor force. The demand for skilled workers is high, and the supply is limited. As a result, competition for experienced oilfield service personnel is intense, and we face significant challenges in competing for crews and management with other service providers. A significant increase in the wages paid by competing employers could result in a reduction of our skilled labor force, increases in the wage rates that we must pay, or both. Furthermore, a significant decrease in the wages paid by us or our competitors as a result of reduced industry demand could result in a reduction of the available skilled labor force, and there is no assurance that the availability of skilled labor will improve following a subsequent increase in demand for our services or an increase in wage rates. If any of these events were to occur, our capacity and profitability could be diminished and our growth potential could be impaired.
Delays in obtaining, or inability to obtain or renew, permits or authorizations by our clients for their operations or by us for our operations could impair our business.
In most states, our clients are required to obtain permits or authorizations from one or more governmental agencies or other third parties to perform drilling and completion activities, including hydraulic fracturing and cementing. Such permits or approvals are typically required by state agencies, but can also be required by federal and local governmental agencies or other third parties. The requirements for such permits or authorizations vary depending on the location where such drilling and completion activities will be conducted. As with most permitting and authorization processes, there is a degree of uncertainty as to whether a permit will be granted, the time it will take for a permit or approval to be issued and the conditions which may be imposed in connection with the granting of the permit. For example, in Texas, rural water districts have begun to impose restrictions on water use and may require permits for water used in drilling and completion activities. Permitting, authorization or renewal delays, the inability to obtain new permits or the revocation of current permits could have a materially adverse effect on our business, financial condition, prospects or results of operations.
Interruptions of service on the rail lines by which we receive raw materials could adversely affect our results of operations.
We receive a significant portion of the raw materials used in our hydraulic fracturing and cementing services by rail. Rail operations are subject to various risks that may result in a delay or lack of service, including lack of available capacity, mechanical problems, extreme weather conditions, work stoppages, labor strikes, terrorist attacks and operating hazards. Additionally, if we increase the amount of raw materials we require for delivery of our services, we may face difficulty in securing rail transportation for such additional amount of raw materials. Any delay or failure in the rail services on which we rely could have a material adverse effect on our financial condition and results of operations.
We are exposed to the credit risk of our clients, and any material nonpayment or nonperformance by our clients could adversely affect our business, results of operations and financial condition.
We are subject to the risk of loss resulting from nonpayment or nonperformance by our clients. Our credit procedures and policies may not be adequate to fully eliminate client credit risk. If we fail to adequately assess the creditworthiness of existing or future clients or unanticipated deterioration in their creditworthiness, any resulting increase in nonpayment or nonperformance by them and our inability to redeploy equipment at similar utilization or price levels could have a material adverse effect on our business, results of operations and financial condition. The decline and volatility in oil and natural gas prices in recent years has negatively impacted the financial condition of our clients and further declines, sustained lower prices or continued volatility could impact their ability to meet their financial obligations to us.
26
Table of Contents
Index to Financial Statements
We may not be able to renew our term contracts on attractive terms or at all, which could adversely impact our results of operations, financial condition and cash flows.
A portion our revenue is currently derived from term contracts of various lengths. Once these contracts expire, we may not be able to extend the contracts, enter into additional term contracts on favorable terms or at all or deploy our hydraulic fracturing fleets in the spot market on attractive terms. If we are not able to do so, our results of operations, financial condition and cash flows could be adversely impacted.
We may not be able to obtain new or renew our existing commercial arrangements on attractive terms or at all, which could adversely impact our results of operations, financial condition and cash flows.
Our revenue is derived from work for clients primarily through Master Service Agreements (“MSAs”), although we also enter into pricing agreements, blanket work orders, scope of work agreements and minimum commitment agreements from time to time. Each of these arrangements is subject to expiration or termination, and upon such expiration or termination, we may not be able to extend the arrangement or enter into a new contractual arrangement on favorable terms or at all, or be able to deploy our hydraulic fracturing fleets in the spot market at attractive pricing. If we are not able to enter into replacement arrangements or deploy our hydraulic fracturing fleets in the spot market, or if our fleets are underutilized under our MSAs, our results of operations, financial condition and cash flows could be adversely impacted.
Revenue generated and expenses incurred that are denominated in the Canadian dollar could be negatively impacted by currency fluctuations.
Any revenues and expenses that are denominated in the Canadian dollar could be materially affected by currency fluctuations. Changes in currency exchange rates could adversely affect our combined results of operations or financial position. Any cash balances denominated in the Canadian dollar could also be affected.
Our indebtedness and liquidity needs could restrict our operations and make us more vulnerable to adverse economic conditions.
Our existing and future indebtedness, whether incurred under our ABL credit facility, or in connection with acquisitions, operations or otherwise, may adversely affect our operations and limit our growth, and we may have difficulty making debt service payments on such indebtedness as payments become due. As of June 30, 2017, there was $50.0 million principal amount of borrowings outstanding under the ABL credit facility. Our level of indebtedness may affect our operations in several ways, including the following:
| • | increasing our vulnerability to general adverse economic and industry conditions; |
| • | the covenants that are contained in the agreements governing our indebtedness could limit our ability to borrow funds, dispose of assets, pay dividends and make certain investments; |
| • | our debt covenants could also affect our flexibility in planning for, and reacting to, changes in the economy and in our industry; |
| • | any failure to comply with the financial or other debt covenants, including covenants that impose requirements to maintain certain financial ratios, could result in an event of default, which could result in some or all of our indebtedness becoming immediately due and payable; |
| • | our level of debt could impair our ability to obtain additional financing, or obtain additional financing on favorable terms, for working capital, capital expenditures, acquisitions or other general corporate purposes; |
27
Table of Contents
Index to Financial Statements
| • | increasing our vulnerability to interest rate increases to the extent we incur variable rate indebtedness; and |
| • | our business may not generate sufficient cash flow from operations to enable us to meet our obligations under our indebtedness. |
Restrictions in our ABL credit facility and any future financing agreements may limit our ability to finance future operations or capital needs or capitalize on potential acquisitions and other business opportunities.
We expect to join the existing $400.0 million ABL credit facility as a co-borrower in connection with the completion of this offering. As of June 30, 2017, there was $50.0 million principal amount of borrowings outstanding under the ABL credit facility. The operating and financial restrictions and covenants in the ABL credit facility and any future financing agreements could restrict our ability to finance future operations or capital needs or to expand or pursue our business activities. For example, the ABL credit facility will restrict or limit, among other things, our ability to:
| • | grant liens; |
| • | incur additional indebtedness; |
| • | engage in a merger, consolidation or dissolution; |
| • | enter into transactions with affiliates; |
| • | sell or otherwise dispose of assets, businesses and operations; |
| • | materially alter the character of our business as conducted at the closing of this offering; |
| • | declare and pay dividends and pay distributions; |
| • | engage in certain swap contracts; and |
| • | make acquisitions, investments and capital expenditures. |
Furthermore, the ABL credit facility contains certain other operating and financial covenants. Our ability to comply with the covenants and restrictions contained in the ABL credit facility may be affected by events beyond our control, including prevailing economic, financial and industry conditions. If market or other economic conditions deteriorate, our ability to comply with these covenants may be impaired. If we violate any of the restrictions, covenants, ratios or tests in the ABL credit facility (after giving effect to any applicable grace period or cure), a significant portion of our indebtedness may become immediately due and payable and/or our lenders’ commitment to make further loans to us may become limited or terminate. We might not have, or be able to obtain, sufficient funds to make these accelerated payments. Any subsequent replacement of the ABL credit facility or any new indebtedness could have similar or greater restrictions. Please read “Management’s Discussion and Analysis of Financial Condition and Results of Operations—Liquidity and Capital Resources—ABL Credit Facility.”
The cyclical nature of the oil and natural gas industry may cause our operating results to fluctuate.
We derive our revenues from companies in the oil and natural gas exploration and production industry, a historically cyclical industry with levels of activity that are significantly affected by the levels and volatility of oil and natural gas prices. We have experienced, and may in the future experience, significant fluctuations in operating results as a result of the reactions of our clients to changes in oil and natural gas prices. For example, during the past three years, the posted WTI price for oil has ranged from a low of $26.21 per Bbl in February 2016 to a high of $107.26 per Bbl in June 2014. During 2016, WTI prices ranged from $26.21 to $54.06 per Bbl. Prolonged low commodity prices
28
Table of Contents
Index to Financial Statements
experienced by the oil and natural gas industry during 2015 and 2016, combined with adverse changes in the capital and credit markets, caused many E&P companies to reduce their capital budgets and drilling activity. This resulted in a significant decline in demand for oilfield services and adversely impacted the prices oilfield services companies could charge for their services. We at times contract for services or establish pricing for our services on a short-term basis, exposing us to the risks of a rapid reduction in market prices and utilization and resulting volatility in our revenues.
Concerns over general economic, business or industry conditions may have a material adverse effect on our results of operations, liquidity and financial condition.
Concerns over global economic conditions, geopolitical issues, interest rates, inflation, the availability and cost of credit and the United States and foreign financial markets have contributed to increased economic uncertainty and diminished expectations for the global economy. These factors, combined with volatility in commodity prices, business and consumer confidence and unemployment rates, have precipitated an economic slowdown. Concerns about global economic growth have had a significant adverse impact on global financial markets and commodity prices. If the economic climate in the United States or abroad deteriorates, worldwide demand for petroleum products could diminish, which could impact the price at which oil and natural gas can be sold, which could affect the ability of our clients to continue operations and ultimately adversely impact our results of operations, liquidity and financial condition.
Our operations are subject to unforeseen interruptions and hazards inherent in the oil and natural gas industry, for which we may not be adequately insured and which could cause us to lose clients and substantial revenue.
Our operations are exposed to the risks inherent to our industry, such as equipment defects, vehicle accidents, fires, explosions, blowouts, surface cratering, uncontrollable flows of gas or well fluids, pipe or pipeline failures, pressured formations and various environmental hazards, such as spills and releases of water, oil, chemicals and hazardous substances. For example, our operations are subject to risks associated with hydraulic fracturing, including any mishandling, surface spillage or potential underground migration of fracturing fluids, including chemical additives. In addition, our operations are exposed to potential natural disasters, including blizzards, tornadoes, storms, floods, other adverse weather conditions and earthquakes. The occurrence of any of these events could result in substantial losses to us due to injury or loss of life, damage to or destruction of property, natural resources and equipment, pollution or other environmental damage, clean-up responsibilities, regulatory investigations and penalties or other damage resulting in curtailment or suspension of our operations. The cost of managing such risks may be significant. The frequency and severity of such incidents can affect operating costs, insurability and relationships with clients, employees and regulators. In particular, our clients may elect not to purchase our services if they view our environmental or safety record as unacceptable, which could cause us to lose clients and substantial revenues.
Our insurance may not be adequate to cover all losses or liabilities we may suffer. Furthermore, we may be unable to maintain or obtain insurance of the type and amount we desire at reasonable rates. As a result of market conditions and based upon our environmental or safety record, premiums and deductibles for certain of our insurance policies could escalate over time. In some instances, certain insurance could become unavailable or available only for reduced amounts of coverage. If we were to incur a significant liability for which we are not fully insured, it could have a material adverse effect on our business, results of operations and financial condition. In addition, we may not be able to secure additional insurance or bonding that might be required by new governmental regulations. This may cause us to restrict our operations, which might severely impact our financial position.
29
Table of Contents
Index to Financial Statements
Because hydraulic fracturing activities are part of our operations, they are covered by our insurance against claims made for bodily injury, property damage and damages stemming from pollution. In addition, our policies do not provide coverage for all possible liabilities, the insurance coverage may not be adequate to cover claims that may arise, or we may not be able to maintain adequate insurance at rates we consider reasonable. A loss not fully covered by insurance could have a material adverse effect on our financial position, results of operations and cash flows.
Losses and liabilities from uninsured or underinsured completion and operating activities could have a material adverse effect on our financial condition and operations.
The operational insurance coverage we maintain for our business may not fully insure us against all risks, either because insurance is not available or because of the high premium costs relative to perceived risk. Further, any insurance obtained by us may not be adequate to cover any losses or liabilities and this insurance may not continue to be available at all or on terms which are acceptable to us. Insurance rates have in the past been subject to wide fluctuation and changes in coverage could result in less coverage, increases in cost or higher deductibles and retentions. Liabilities for which we are not insured, or which exceed the policy limits of our applicable insurance, could have a material adverse effect on our business activities, financial condition and results of operations.
We may be subject to claims for personal injury and property damage, which could materially adversely affect our financial condition and results of operations.
We operate with most of our clients under MSAs. We endeavor to allocate potential liabilities and risks between the parties in the MSAs. Generally, under our MSAs, including those relating to our hydraulic fracturing services, we assume responsibility for, including control and removal of, pollution or contamination which originates above surface and originates from our equipment or services. However, our clients typically assume responsibility for, including for the control and removal of, all other pollution or contamination which may occur during operations, including that which may result from seepage or any other uncontrolled flow of drilling fluids. Generally, our clients also agree to indemnify us against claims arising from personal injury to or death of their or their affiliates’ or invitees’ employees, service providers or other representatives in connection with the performance of the applicable services. Similarly, we typically agree to indemnify our clients for liabilities arising from personal injury to or death of any of our or our affiliates’ or invitees’ employees, service providers or other representatives. In addition, our clients generally agree to indemnify us for loss or destruction of client-owned property or equipment and in turn, we agree to indemnify our clients for loss or destruction of property or equipment we own. Losses due to catastrophic events, such as blowouts, are generally the responsibility of the client. However, despite this customary allocation of risk, we might not succeed in enforcing such contractual allocation, might incur an unforeseen liability falling outside the scope of such allocation or our insurance coverage or may be required to enter into an MSA with terms that vary from the above allocations of risk. Litigation arising from a catastrophic occurrence at a location where our equipment and services are being used may result in our being named as a defendant in lawsuits asserting large claims. As a result, we may incur substantial losses which could materially and adversely affect our financial condition and results of operation.
We face significant competition that may cause us to lose market share.
The oilfield services industry is highly competitive and has relatively few barriers to entry. The principal competitive factors impacting sales of our services are price, reputation and technical expertise, equipment and service quality and health and safety standards. The market is also fragmented and includes numerous small companies capable of competing effectively in our markets on a local basis, as well as several large companies that possess substantially greater financial and other resources than we do. Our larger competitors’ greater resources could allow them to compete
30
Table of Contents
Index to Financial Statements
more effectively than we can. For instance, our larger competitors may offer services at below-market prices or bundle ancillary services at no additional cost to clients. We compete with large national and multi-national companies that have greater financial, technical and other resources than we do. Several of our competitors provide a broader array of services and have a stronger presence in more geographic markets. In addition, we compete with several smaller companies capable of competing effectively on a regional or local basis.
Some jobs are awarded on a bid basis, which further increases competition based on price. Pricing is often the primary factor in determining which qualified contractor is awarded a job. The competitive environment may be further intensified by mergers and acquisitions among oil and natural gas companies or other events that have the effect of reducing the number of available clients. As a result of competition, we may lose market share or be unable to maintain or increase prices for our present services or to acquire additional business opportunities, which could have a material adverse effect on our business, financial condition, results of operations and cash flows.
Our competitors may be able to respond more quickly to new or emerging technologies and services and changes in client requirements. The amount of equipment available may exceed demand, which could result in active price competition. In addition, depressed commodity prices lower demand for hydraulic fracturing equipment and cementing services, which results in excess equipment and lower utilization rates. In addition, some E&P companies have commenced completing their wells using their own hydraulic fracturing and cementing equipment and personnel. Any increase in the development and utilization of in-house hydraulic fracturing or cementing capabilities by our clients could decrease the demand for our services and have a material adverse impact on our business.
In addition, competition among oilfield service and equipment providers is affected by each provider’s reputation for safety and quality. We cannot assure that we will be able to maintain our competitive position.
Our non-compete arrangement with our Sponsors and BHGE may terminate, and our Sponsors and BHGE could in the future compete with us in the United States or Canada and cause us to lose market share.
In connection with our formation in December 2016, our Sponsors and BHGE agreed that, until the earlier of (i) an initial public offering that results in BHGE holding less than 20% of our ownership interests or the occurrence of certain other deemed liquidation events and (ii) the delivery of a termination notice by BHGE, which may be delivered at any time after , none of our Sponsors, BHGE or certain of their respective affiliates will engage in any onshore pressure pumping business, or any other business that directly competes with us, in the United States or Canada. In addition, our Sponsors and BHGE agreed that, for so long as the non-compete arrangement continues in effect, we will not be permitted to enter into any new line of business or expand our operations outside of North America without the consent of BHGE and our Sponsors. Following the closing of this offering, it is expected that BHGE will own an aggregate % of our outstanding Class B common shares. If the non-compete restrictions terminate in the future, BHGE may elect to commence onshore pressure pumping operations in the United States or Canada, in which case we will face increased competition and may lose market share, which could have a material adverse effect on our business, financial condition, results of operations and cash flows.
The combination of BHGE’s and Allied Completions Holdings’ hydraulic fracturing and cementing businesses may not achieve its intended results, and we may not be able to successfully integrate the businesses.
In order to obtain all of the anticipated benefits of the combination of BHGE’s and Allied Completions Holdings’ hydraulic fracturing and cementing businesses, we will need to integrate the
31
Table of Contents
Index to Financial Statements
businesses, operations and assets of both parties. The BHGE business and assets we are integrating as a result of the combination represent a subset of BHGE’s overall business, and, as a result, we will not have the scope of assets, personnel and operational diversity associated with the remainder of BHGE’s business and will be required to establish independent information technology, human resources, legal compliance and back office support functions. While we anticipate that the combination will result in various benefits, including financial and operational benefits, there can be no assurance regarding when or to the extent to which we will be able to realize those benefits. Achieving the anticipated benefits is subject to a number of uncertainties, including whether the combined assets can be operated in the manner intended and independent from BHGE’s overall business. Events outside of our control, including but not limited to regulatory changes or developments, could also adversely affect our ability to realize the anticipated combination benefits. The integration of BHGE’s and Allied Completions Holdings’ separate businesses may be unpredictable and subject to delays or changed circumstances, and we can give no assurance that the assets will perform in accordance with expectations or that expectations with respect to integration as a result of the combination, including our operation of the BHGE’s business subset, will materialize. In addition, the anticipated costs to complete the integration may differ significantly from current estimates. The integration may place an additional burden on our management and internal resources, and the diversion of management’s attention during the integration process could have an adverse effect on our business, financial condition and expected operating results.
Our inability to control the inherent risks of acquiring and integrating businesses could disrupt our business, dilute shareholder value and adversely affect our operating results going forward.
We continuously evaluate acquisitions and dispositions and may elect to acquire or dispose of assets in the future. These activities may distract management from day-to-day tasks. Acquisitions involve numerous risks, including:
| • | unanticipated costs and exposure to unforeseen liabilities; |
| • | difficulty in integrating the operations and assets of the acquired businesses; |
| • | potential loss of key employees and clients of the acquired company; |
| • | potential inability to properly establish and maintain effective internal controls over an acquired company; and |
| • | risk of entering markets in which we have limited prior experience. |
Our failure to achieve consolidation savings, to incorporate the acquired businesses and assets into our existing operations successfully or to minimize any unforeseen operational difficulties could have a material adverse effect on our business. In addition, we may incur liabilities arising from events prior to the acquisition or prior to our establishment of adequate compliance oversight. While we generally seek to obtain indemnities for liabilities for events occurring before such acquisitions, these are limited in amount and duration or may be held to be unenforceable or the seller may not be able to indemnify us. We may also incur indebtedness to finance future acquisitions and also may issue equity securities in connection with such acquisitions. Debt service requirements could represent a burden on our results of operations and financial condition and the issuance of additional equity securities could be dilutive to our existing shareholders. In addition, we may dispose of assets or products that shareholders may consider beneficial to us.
The difficulties of such integration may be increased by the geographic breadth of the combined operations and the necessity of integrating and combining different corporate cultures. The inability of management to successfully integrate any one or all of the businesses could have a material adverse
32
Table of Contents
Index to Financial Statements
effect on our business, operating results and financial condition. Moreover, there can be no assurance that we will be able to gain market share or penetrate new markets successfully or that we will obtain the anticipated or desired benefits of future acquisitions. Despite management’s belief that each of our products, services and operations will provide an increased breadth of services and sufficient “critical mass” in key operating areas, there can be no assurance that each of the services will gain acceptance by our other business segments or our current clients or that they will enable us to gain market share or penetrate new markets. If we fail to manage these risks successfully, our results of operations could be adversely affected.
A third party may claim we infringed upon its intellectual property rights, and we may be subjected to costly litigation.
Our operations, including equipment, manufacturing and fluid and chemical operations may unintentionally infringe upon the patents or trade secrets of a competitor or other company that uses proprietary components or processes in its operations, and that company may have legal recourse against our use of its protected information. If this were to happen, these claims could result in legal and other costs associated with litigation. If found to have infringed upon protected information, we may have to pay damages or make royalty payments in order to continue using that information, which could substantially increase the costs previously associated with certain products or services, or we may have to discontinue use of the information or product altogether. Any of these could materially and adversely affect our business, financial condition or results of operations.
Adverse weather conditions could impact demand for our services or impact our costs.
Our business could be adversely affected by adverse weather conditions. For example, unusually warm winters could adversely affect the demand for our services by decreasing the demand for natural gas or unusually cold winters, particularly with respect to our operations in Canada, could adversely affect our capability to perform our services due to delays in the delivery of equipment, personnel and products that we need in order to provide our services and weather-related damage to facilities and equipment, resulting in delays in operations. Our operations in arid regions can be affected by droughts and limited access to water used in our hydraulic fracturing operations. These constraints could adversely affect our costs and results of operations.
Oilfield anti-indemnity provisions enacted by many states may restrict or prohibit a party’s indemnification of us.
We typically enter into agreements with our clients governing the provision of our services, which usually include certain indemnification provisions for losses resulting from operations. Such agreements may require each party to indemnify the other against certain claims regardless of the negligence or other fault of the indemnified party; however, many states place limitations on contractual indemnity agreements, particularly agreements that indemnify a party against the consequences of its own negligence. Furthermore, certain states, including Louisiana, New Mexico, Texas and Wyoming, have enacted statutes generally referred to as “oilfield anti-indemnity acts” expressly prohibiting certain indemnity agreements contained in or related to oilfield services agreements. Such oilfield anti-indemnity acts may restrict or void a party’s indemnification of us, which could have a material adverse effect on our business, financial condition, prospects and results of operations.
33
Table of Contents
Index to Financial Statements
Certain of our completion services, particularly our hydraulic fracturing services, are substantially dependent on the availability of water. Restrictions on our or our clients’ ability to obtain water may have an adverse effect on our financial condition, results of operations and cash flows.
Water is an essential component of unconventional shale oil and natural gas production during both the drilling and hydraulic fracturing processes. Over the past several years, certain of the areas in which we and our clients operate have experienced extreme drought conditions and competition for water in such areas is growing. In addition, some state and local governmental authorities have begun to monitor or restrict the use of water subject to their jurisdiction for hydraulic fracturing to ensure adequate local water supply. For instance, some states require E&P companies to report certain information regarding the water they use for hydraulic fracturing and to monitor the quality of groundwater surrounding some wells stimulated by hydraulic fracturing. Generally, our water requirements are met by our clients from sources on or near their sites, but our clients may not be able to obtain a sufficient supply of water from sources in these areas. Our or our clients’ inability to obtain water from local sources or to effectively utilize flowback water could have an adverse effect on our financial condition, results of operations and cash flows.
Unionization efforts and labor regulations in certain areas in which we operate could materially increase our costs or limit our flexibility.
We are not a party to any collective bargaining agreements. We operate in certain states and provinces within North America that have a history of unionization and we may become the subject of a unionization campaign. If some or all of our workforce were to become unionized and collective bargaining agreement terms were significantly different from our current compensation arrangements or work practices, our costs could be increased, our flexibility in terms of work schedules and reductions in force could be limited, and we could be subject to strikes or work slowdowns among other things.
Current trucking regulations may result in increased costs and negatively impact our results of operations.
In connection with our business operations, including the transportation and relocation of our hydraulic fracturing equipment and shipment of frac sand, we operate trucks and other heavy equipment. As such, we operate as a motor carrier in providing certain of our services and therefore are subject to regulation by the United States Department of Transportation, Transport Canada, and by various state and provincial agencies. These regulatory authorities exercise broad powers, governing activities such as the authorization to engage in motor carrier operations, driver licensing, insurance requirements, financial reporting and review of certain mergers, consolidations and acquisitions, and transportation of hazardous materials. Our trucking operations are subject to possible regulatory and legislative changes that may increase our costs. Some of these possible changes include increasingly stringent environmental regulations, changes in the hours of service regulations which govern the amount of time a driver may drive or work in any specific period, onboard black box recorder device requirements or limits on vehicle weight and size.
Interstate and inter-provincial motor carrier operations are subject to safety requirements prescribed by the United States Department of Transportation and Transport Canada, respectively. To a large degree, intrastate and intra-provincial motor carrier operations are subject to state and provincial safety regulations that mirror federal regulations. Matters such as the weight and dimensions of equipment are also subject to federal, state, and provincial regulations. In addition, certain motor vehicle operators are required to register with the Department of Transportation. This registration requires an acceptable operating record. The Department of Transportation periodically conducts
34
Table of Contents
Index to Financial Statements
compliance reviews and may revoke registration privileges based on certain safety performance criteria that could result in a suspension of operations. From time to time, various legislative proposals are introduced, including proposals to increase federal, state, provincial, or local taxes, including taxes on motor fuels, which may increase our costs or adversely impact the recruitment of drivers. We cannot predict whether, or in what form, any increase in such taxes applicable to us will be enacted.
We are subject to environmental laws and regulations, and future compliance, claims, and liabilities relating to such matters may have a material adverse effect on our results of operations, financial position or cash flows.
The nature of our operations, including the handling, transporting and disposing of a variety of fluids and substances, including hydraulic fracturing fluids and other regulated substances, air emissions, and wastewater discharges exposes us to the risk of environmental liability, including the release of pollutants and chemicals to the environment. The cost of compliance with laws concerning environmental matters can be significant. Failure to properly handle, transport or dispose of these materials or otherwise conduct our operations in accordance with these and other environmental laws could expose us to substantial liability for administrative, civil and criminal penalties, cleanup and site restoration costs and liability associated with releases of such materials, damages to natural resources and other damages, as well as potentially impair our ability to conduct our operations. Such liability is commonly on a strict, joint and several liability basis, without regard to fault. Liability may be imposed as a result of our conduct that was lawful at the time it occurred or the conduct of, or conditions caused by, prior operators or other third parties. Neighboring landowners and other third parties may file claims against us for personal injury or property damage allegedly caused by the release of pollutants into the environment. Environmental laws and regulations have changed in the past, and they may change in the future and become more stringent. Current and future claims and liabilities may have a material adverse effect on us because of potential adverse outcomes, defense costs, diversion of management resources, unavailability of insurance coverage and other factors. The ultimate costs of these liabilities are difficult to determine and may exceed any reserves we may have established. If existing environmental requirements or enforcement policies change, we may be required to make significant unanticipated capital and operating expenditures.
The adoption of climate change legislation or regulations restricting emissions of greenhouse gases could result in increased operating costs and reduced demand for oil and natural gas.
The U.S. Environmental Protection Agency (the “EPA”) has determined that greenhouse gases (“GHGs”) present an endangerment to public health and the environment because such gases contribute to warming of the earth’s atmosphere and other climatic changes. Based on these findings, the EPA has adopted and implemented, and continues to adopt and implement, regulations that restrict emissions of GHGs under existing provisions of the Clean Air Act (“CAA”). The EPA requires the annual reporting of GHG emissions from certain large sources of GHG emissions in the United States, including certain oil and natural gas production facilities. The EPA has also taken steps to limit methane emissions from oil and natural gas production facilities. In addition, the U.S. Congress has from time to time considered adopting legislation to reduce emissions of GHGs and almost one-half of the states have already taken legal measures to reduce emissions of GHGs primarily through the planned development of GHG emission inventories and/or regional GHG cap and trade programs. Canada has also taken steps to address GHG emissions. Environment Canada is currently developing regulations to reduce methane emissions from the upstream oil and natural gas industry, with final regulations expected by the end of the year. In addition, in December 2016, the federal government and eight provincial governments in Canada agreed to a national carbon pricing policy that sets a minimum price on GHG emissions throughout Canada. The Canadian federal government will implement a price in the remaining two provinces if they do not have a price or cap-and-trade program in place by 2018. Several other provincial initiatives have established various mechanisms to limit GHG
35
Table of Contents
Index to Financial Statements
emissions. In December 2015, the United States and Canada joined the international community at the 21st Conference of the Parties of the United Nations Framework Convention on Climate Change in Paris, France. The resulting Paris Agreement calls for the parties to undertake “ambitious efforts” to limit the average global temperature, and to conserve and enhance sinks and reservoirs of greenhouse gases. The Paris Agreement entered into force in November 2016. The United States and Canada are two of over 130 nations that have ratified or otherwise indicated that they intend to comply with the agreement. However, in June 2017, President Trump announced that the United States plans to withdraw from the Paris Agreement and to seek negotiations either to reenter the Paris Agreement on different terms or establish a new framework agreement. The Paris Agreement provides for a four-year exit process beginning when it took effect in November 2016, which would result in an effective exit date of November 2020. The United States’ adherence to the exit process and/or the terms on which the United States may reenter the Paris Agreement or a separately negotiated agreement are unclear at this time. Any restrictions on emissions of GHGs that may be imposed could adversely affect the oil and natural gas industry by reducing demand for hydrocarbons and by making it more expensive to develop and produce hydrocarbons, either of which could have a material adverse effect on future demand for our services.
Additionally, climate change may cause more extreme weather conditions and increased volatility in seasonal temperatures. Extreme weather conditions can interfere with our operations and increase our costs, and damage resulting from extreme weather may not be fully insured.
Federal, state, and provincial legislative and regulatory initiatives relating to hydraulic fracturing could result in increased costs and additional operating restrictions or delays.
Our hydraulic fracturing operations are a significant component of our business, and hydraulic fracturing is an important and common practice that is used to stimulate production of hydrocarbons, particularly oil and natural gas, from tight formations, including shales. The process, which involves the injection of water, sand and chemicals under pressure into formations to fracture the surrounding rock and stimulate production, is typically regulated by state and provincial oil and natural gas commissions. However, federal agencies have asserted regulatory authority over certain aspects of the process. For example, in May 2014, the EPA issued an Advanced Notice of Proposed Rulemaking seeking comment on the development of regulations under the Toxic Substances Control Act to require companies to disclose information regarding the chemicals used in hydraulic fracturing. Beginning in August 2012, the EPA issued a series of rules under the CAA that establish new emission control requirements for emissions of volatile organic compounds and methane from certain oil and natural gas production and natural gas processing operations and equipment. And in March 2015, the Bureau of Land Management finalized a rule governing hydraulic fracturing on federal lands; this regulation has been stayed pending resolution of the Bureau of Land Management’s appeal of a June 2016 federal court ruling invalidating the regulation, and the Secretary of Interior has ordered an administrative review of the regulation pursuant to a recent presidential executive order directing the same. Further, legislation has been proposed in recent sessions of Congress to amend the Safe Drinking Water Act to repeal the exemption for hydraulic fracturing (except when diesel fuels are used) from the definition of “underground injection” and require federal permitting and regulatory control of hydraulic fracturing on state and private lands, as well as to require disclosure of the chemical constituents of the fluids used in the fracturing process. Several states, provinces, and local jurisdictions in which we or our clients operate also have adopted or are considering adopting regulations that could restrict or prohibit hydraulic fracturing completely or in certain circumstances, impose more stringent operating standards and/or require the disclosure of the composition of hydraulic fracturing fluids. In recent years, hydraulic fracturing has been the subject of voter ballot initiatives in several states, provinces and local jurisdictions that proposed to restrict or prohibit hydraulic fracturing completely or in certain circumstances, and similar voter ballot initiatives could be introduced in the future.
36
Table of Contents
Index to Financial Statements
Federal, state, and provincial governments have been investigating whether activities associated with hydraulic fracturing and/or oil and gas exploration and production generally (including the disposal of produced water into underground injection wells) have caused increased seismic activity in certain areas. In response, some states, including states in which we and our clients operate, have imposed additional requirements on the construction and operation of underground disposal wells and on hydraulic fracturing operations. For example, the Oklahoma Corporation Commission’s Oil and Gas Conservation Division and the Oklahoma Geologic Survey recently released well completion seismicity guidance, which requires operators to take certain prescriptive actions, including mitigation, following anomalous seismic activity within 1.25 miles of hydraulic fracturing operations.
Increased regulation of hydraulic fracturing and related activities could subject us and our clients to additional permitting and financial assurance requirements, more stringent construction specifications, increased monitoring, reporting and recordkeeping obligations, and plugging and abandonment requirements. New requirements could result in increased operational costs for us and our clients, and reduce the demand for our services.
Seasonal weather conditions and natural disasters could severely disrupt normal operations and harm our business.
Our operations are located in different regions of North America. Some of these areas, including our operations in Canada, North Dakota, Colorado, West Virginia, Pennsylvania and Ohio, are adversely affected by seasonal weather conditions, primarily in the winter and spring. During periods of heavy snow, ice or rain, we may be unable to move our equipment between locations, thereby reducing our ability to provide services and generate revenues. The exploration activities of our customers may also be affected during such periods of adverse weather conditions. Additionally, extended drought conditions in our operating regions could impact our ability or our customers’ ability to source sufficient water or increase the cost for such water. As a result, a natural disaster or inclement weather conditions could severely disrupt the normal operation of our business and adversely impact our financial condition and results of operations.
A terrorist attack or armed conflict could harm our business.
Terrorist activities, anti-terrorist efforts and other armed conflicts involving the United States could adversely affect the U.S. and global economies and could prevent us from meeting financial and other obligations. We could experience loss of business, delays or defaults in payments from payors or disruptions of fuel supplies and markets if pipelines, production facilities, processing plants, refineries or transportation facilities are direct targets or indirect casualties of an act of terror or war. Such activities could reduce the overall demand for oil and natural gas, which, in turn, could also reduce the demand for our services. Terrorist activities and the threat of potential terrorist activities and any resulting economic downturn could adversely affect our results of operations, impair our ability to raise capital or otherwise adversely impact our ability to realize certain business strategies.
Restrictions on drilling and completion activities intended to protect certain species of wildlife may adversely affect our ability to conduct drilling activities in some of the areas where we operate.
Oil and natural gas operations in our operating areas can be adversely affected by seasonal or permanent restrictions on drilling and completion activities designed to protect various wildlife, which may limit our ability to operate in protected areas. Permanent restrictions imposed to protect endangered species could prohibit drilling and completion activities in certain areas or require the implementation of expensive mitigation measures. Additionally, the designation of previously unprotected species as threatened or endangered in areas where we operate could result in increased costs arising from species protection measures. Restrictions on oil and natural gas operations to protect wildlife could reduce demand for our services.
37
Table of Contents
Index to Financial Statements
Conservation measures, commercial development and technological advances could reduce demand for oil and natural gas and our services.
Fuel conservation measures, alternative fuel requirements, increasing consumer demand for alternatives to oil and natural gas, technological advances in fuel economy and energy generation devices could reduce demand for oil and natural gas, resulting in reduced demand for oilfield services. The impact of the changing demand for oil and natural gas services and products may have a material adverse effect on our business, financial condition, results of operations and cash flows.
The commercial development of economically-viable alternative energy sources and related products (such as electric vehicles, wind, solar, geothermal, tidal, fuel cells and biofuels) could have a similar effect. In addition, certain U.S. federal income tax deductions currently available with respect to oil and natural gas exploration and development, including the allowance of percentage depletion for oil and natural gas properties, may be eliminated as a result of proposed legislation. Any future decreases in the rate at which oil and natural gas reserves are discovered or developed, whether due to the passage of legislation, increased governmental regulation leading to limitations, or prohibitions on exploration and drilling activity, including hydraulic fracturing, or other factors, could have a material adverse effect on our business and financial condition, even in a stronger oil and natural gas price environment.
We are subject to cyber security risks. A cyber incident could occur and result in information theft, data corruption, operational disruption and/or financial loss.
The oil and natural gas industry has become increasingly dependent on digital technologies to conduct certain processing activities, and we seek to offer our clients technology-driven solutions. For example, we depend on digital technologies to perform many of our services and process and record operational and accounting data. At the same time, cyber incidents, including deliberate attacks or unintentional events, have increased. The U.S. government has issued public warnings that indicate that energy assets might be specific targets of cyber security threats. Our technologies, systems and networks, and those of our vendors, suppliers and other business partners, may become the target of cyberattacks or information security breaches that could result in the unauthorized release, gathering, monitoring, misuse, loss or destruction of proprietary and other information, or other disruption of our business operations. In addition, certain cyber incidents, such as surveillance, may remain undetected for an extended period. Our systems and insurance coverage for protecting against cyber security risks may not be sufficient. As cyber incidents continue to evolve, we may be required to expend additional resources to continue to modify or enhance our protective measures or to investigate and remediate any vulnerability to cyber incidents. Our insurance coverage for cyberattacks may not be sufficient to cover all the losses we may experience as a result of such cyberattacks.
Risks Related to This Offering and Ownership of Our Class A Common Stock
We are a holding company. Our sole material asset after completion of this offering will be our equity interest in BJS LLC, and accordingly we are dependent upon distributions from BJS LLC to pay taxes, make payments under the Tax Receivable Agreement and cover our corporate and other overhead expenses.
We are a holding company and will have no material assets other than our equity interest in BJS LLC. Please see “Corporate Reorganization.” We have no independent means of generating revenue. BJS LLC will be treated as a partnership for U.S. federal income tax purposes and, as such, will not be subject to any entity-level U.S. federal income tax. Instead, taxable income will be allocated to holders of its LLC Units, including us. As a result, we will incur income taxes on our allocable share of any net taxable income of BJS LLC. Under the terms of the BJS LLC Agreement, BJS LLC will be obligated to make tax distributions to holders of its LLC Units, including us, except to the extent such distributions would render BJS LLC insolvent or are otherwise prohibited by law or our ABL credit facility or any of
38
Table of Contents
Index to Financial Statements
our future debt agreements. In addition to tax expenses, we will also incur expenses related to our operations, our interests in BJS LLC and related party agreements, including payment obligations under the Tax Receivable Agreement, and expenses and costs of being a public company, all of which could be significant. See “Certain Relationships and Related Party Transactions—Tax Receivable Agreement.” To the extent that we need funds and BJS LLC or its subsidiaries is restricted from making such distributions under applicable law or regulation or under the terms of their financing arrangements, or are otherwise unable to provide such funds, it could materially adversely affect our liquidity and financial condition, including our ability to pay our income taxes when due.
The concentration of our capital stock ownership among our largest shareholders and their affiliates will limit your ability to influence corporate matters.
Upon completion of this offering (assuming no exercise of the underwriters’ option to purchase additional shares), the Existing Owners will own all of our outstanding Class B shares, representing approximately % of our outstanding common stock and voting power. Consequently, the Existing Owners will continue to have significant influence over all matters that require approval by our shareholders, including the election of directors and approval of significant corporate transactions. This concentration of ownership will limit your ability to influence corporate matters and, as a result, actions may be taken that you may not view as beneficial. Moreover, this concentration of stock ownership may also adversely affect the trading price of our Class A common stock to the extent investors perceive a disadvantage in owning stock of a company with a controlling shareholder.
Conflicts of interest could arise in the future between us, on the one hand, and the Existing Owners and their affiliates, including certain of their future portfolio companies, on the other hand, concerning among other things, potential competitive business activities or business opportunities.
Conflicts of interest could arise in the future between us, on the one hand, and our Existing Owners and their affiliates, including their future portfolio companies, on the other hand, concerning among other things, potential competitive business activities or business opportunities. Our Existing Owners include private equity and global investment banking firms and a leading supplier of oilfield services. As a result, the Existing Owners and certain of their future portfolio companies and investments which they control may compete with us for investment or business opportunities. These conflicts of interest may not be resolved in our favor. In any of these matters, the interests of our Existing Owners and their affiliates may differ or conflict with the interests of our other shareholders. Under our amended and restated certificate of incorporation, our Existing Owners and/or one or more of their affiliates are permitted to engage in business activities or invest in or acquire businesses which may compete with our business or do business with any client of ours. Any actual or perceived conflicts of interest with respect to the foregoing could have an adverse impact on the trading price of our Class A common stock.
The requirements of being a public company, including compliance with the reporting requirements of the Exchange Act and the requirements of the Sarbanes-Oxley Act, may strain our resources, increase our costs and distract management, and we may be unable to comply with these requirements in a timely or cost-effective manner.
As a public company, we will need to comply with new laws, regulations and requirements, certain corporate governance provisions of the Sarbanes-Oxley Act of 2002, related regulations of the SEC and the requirements of the NYSE, with which we are not required to comply as a private company. Complying with these statutes, regulations and requirements will occupy a significant amount of time of our board of directors and management and will significantly increase our costs and expenses. We will need to:
| • | institute a more comprehensive compliance function; |
39
Table of Contents
Index to Financial Statements
| • | comply with rules promulgated by the NYSE; |
| • | continue to prepare and distribute periodic public reports in compliance with our obligations under the federal securities laws; |
| • | establish new internal policies, such as those relating to insider trading; and |
| • | involve and retain to a greater degree outside counsel and accountants in the above activities. |
In addition, we expect that being a public company subject to these rules and regulations may make it more difficult and more expensive for us to obtain director and officer liability insurance and we may be required to accept reduced policy limits and coverage or incur substantially higher costs to obtain the same or similar coverage. As a result, it may be more difficult for us to attract and retain qualified individuals to serve on our board of directors or as executive officers. We are currently evaluating these rules, and we cannot predict or estimate the amount of additional costs we may incur or the timing of such costs.
We will be required to comply with certain provisions of Section 404 of the Sarbanes-Oxley Act as early as our fiscal year ending December 31, 2018. Section 404 requires that we document and test our internal control over financial reporting and issue management’s assessment of our internal control over financial reporting. This section also requires that our independent registered public accounting firm opine on those internal controls upon becoming a large accelerated filer, as defined in the SEC rules, or otherwise ceasing to qualify as an emerging growth company under the JOBS Act. We are evaluating our existing controls against the standards adopted by the Committee of Sponsoring Organizations of the Treadway Commission. During the course of our ongoing evaluation and integration of the internal control over financial reporting, we may identify areas requiring improvement, and we may have to design enhanced processes and controls to address issues identified through this review. For example, we anticipate the need to hire additional administrative and accounting personnel to conduct our financial reporting.
We cannot be certain at this time that we will be able to successfully complete the procedures, certification and attestation requirements of Section 404 or that we or our independent registered public accounting firm will not identify material weaknesses in our internal control over financial reporting. If we fail to comply with the requirements of Section 404 or if we or our independent registered public accounting firm identify and report such material weaknesses, the accuracy and timeliness of the filing of our annual and quarterly reports may be materially adversely affected and could cause investors to lose confidence in our reported financial information, which could have a negative effect on the stock price of our Class A common stock. In addition, a material weakness in the effectiveness of our internal control over financial reporting could result in an increased chance of fraud and the loss of clients, reduce our ability to obtain financing and require additional expenditures to comply with these requirements, each of which could have a material adverse effect on our business, results of operations and financial condition.
We have identified a material weakness in our internal control over financial reporting and may identify additional material weaknesses in the future or otherwise fail to maintain an effective system of internal controls, which may result in material misstatements of our financial statements or cause us to fail to meet our periodic reporting obligations.
As a public company, we will be required to maintain internal control over financial reporting and to report any material weaknesses in those internal controls, subject to any exemptions that we avail ourselves to under the JOBS Act. For example, we will be required to perform system and process evaluation and testing of our internal control over financial reporting to allow management to report on the effectiveness of our internal control over financial reporting, as required by Section 404 of the Sarbanes-Oxley Act. We are in the process of designing, implementing, and testing internal control over financial reporting required to comply with this obligation.
40
Table of Contents
Index to Financial Statements
We have identified a material weakness in internal control over financial reporting as of December 31, 2016. A material weakness is a deficiency, or a combination of deficiencies, in internal control over financial reporting such that there is a reasonable possibility that a material misstatement of our annual or interim financial statements will not be prevented or detected on a timely basis. The material weakness related to the lack of sufficient qualified accounting personnel, which led to inadequate segregation of duties related to our financial reporting processes. Specifically, there was inadequate segregation of duties related to journal entries, cash disbursements, account reconciliations and period end financial reporting. Additionally, this material weakness could result in misstatements to our financial statements or disclosures that would result in material misstatements to our annual or interim consolidated financial statements that would not be prevented or detected. Ineffective internal controls could also cause investors to lose confidence in our reported financial information, which could have a negative effect on the trading price of our Class A common stock.
There is no existing market for our Class A common stock, and a trading market that will provide you with adequate liquidity may not develop. The price of our Class A common stock may fluctuate significantly, and you could lose all or part of your investment.
Prior to this offering, there has been no public market for our Class A common stock. After this offering, there will be only publicly traded Class A shares held by our public common shareholders ( Class A shares if the underwriters exercise in full their option to purchase additional Class A shares). Our Sponsors will own Class A shares, LLC Units and Class B shares representing an aggregate % of the voting power (or % of the voting power, if the underwriters exercise in full their option to purchase additional Class A shares) of BJ Services, Inc. We do not know the extent to which investor interest will lead to the development of an active trading market or how liquid that market might become. If an active trading market does not develop, you may have difficulty reselling any of our Class A shares at or above the initial public offering price. Additionally, the lack of liquidity may result in wide bid-ask spreads, contribute to significant fluctuations in the market price of the Class A shares and limit the number of investors who are able to buy the Class A shares.
The initial public offering price for the Class A common stock offered hereby will be determined by negotiations between us and the representatives of the underwriters and may not be indicative of the market price of the Class A common stock that will prevail in the trading market. Consequently, you may not be able to sell Class A shares at prices equal to or greater than the price paid by you in this offering.
The following is a non-exhaustive list of factors that could affect our stock price:
| • | our operating and financial performance; |
| • | quarterly variations in the rate of growth of our financial indicators, such as net income per share, net income and revenues; |
| • | the public reaction to our press releases, our other public announcements and our filings with the SEC; |
| • | strategic actions by our competitors; |
| • | our failure to meet revenue or earnings estimates by research analysts or other investors; |
| • | changes in revenue or earnings estimates, or changes in recommendations or withdrawal of research coverage, by equity research analysts; |
| • | speculation in the press or investment community; |
| • | the failure of research analysts to cover our Class A common stock; |
41
Table of Contents
Index to Financial Statements
| • | sales of our Class A common stock by us or other shareholders, or the perception that such sales may occur; |
| • | changes in accounting principles, policies, guidance, interpretations or standards; |
| • | additions or departures of key management personnel; |
| • | actions by our shareholders; |
| • | general market conditions, including fluctuations in commodity prices; |
| • | domestic and international economic, legal and regulatory factors unrelated to our performance; and |
| • | the realization of any risks described under this “Risk Factors” section. |
The stock markets in general have experienced extreme volatility that has often been unrelated to the operating performance of particular companies. These broad market fluctuations may adversely affect the trading price of our Class A common stock. Securities class action litigation has often been instituted against companies following periods of volatility in the overall market and in the market price of a company’s securities. Such litigation, if instituted against us, could result in substantial costs, divert our management’s attention and resources and harm our business, operating results and financial condition.
If securities or industry analysts do not publish research reports or publish unfavorable research about our business, the price and trading volume of our Class A common stock could decline.
The trading market for our Class A common stock will depend in part on the research reports that securities or industry analysts publish about us or our business. We do not currently have and may never obtain research coverage by securities and industry analysts. If no securities or industry analysts commence coverage of us the trading price for our Class A common stock and other securities would be negatively affected. In the event we obtain securities or industry analyst coverage, if one or more of the analysts who covers us downgrades our securities, the price of our securities would likely decline. If one or more of these analysts ceases to cover us or fails to publish regular reports on us, interest in the purchase of our securities could decrease, which could cause the price of our Class A common stock and other securities and their trading volume to decline.
Our amended and restated certificate of incorporation and bylaws, as well as Delaware law, contain provisions that could discourage acquisition bids or merger proposals, which may adversely affect the market price of our common stock.
As permitted under Delaware law, our amended and restated certificate of incorporation will authorize our board of directors to issue preferred stock without shareholder approval. If our board of directors elects to issue preferred stock, it could be more difficult for a third party to acquire us. In addition, some provisions of our amended and restated certificate of incorporation and bylaws could make it more difficult for a third party to acquire control of us, even if the change of control would be beneficial to our shareholders, including:
| • | limitations on the removal of directors; |
| • | limitations on the ability of our shareholders to call special meetings; |
| • | advance notice provisions for shareholder proposals and nominations for elections to the board of directors to be acted upon at meetings of shareholders; |
| • | providing that the board of directors is expressly authorized to adopt, or to alter or repeal our bylaws; and |
42
Table of Contents
Index to Financial Statements
| • | establishing advance notice and certain information requirements for nominations for election to our board of directors or for proposing matters that can be acted upon by shareholders at shareholder meetings. |
Investors in this offering will experience immediate and substantial dilution of $ per Class A share.
Based on an assumed initial public offering price of $ per Class A share (the midpoint of the price range set forth on the cover of this prospectus), purchasers of our Class A common stock in this offering will experience an immediate and substantial dilution of $ per Class A share in the net tangible book value per Class A share from the initial public offering price, and our historical and pro forma net tangible book deficit as of December 31, 2016 would be $ per Class A share. Please see “Dilution.”
We have broad discretion in the use of the net proceeds we receive from this offering and may not use them effectively.
Our management will have broad discretion in the application of the net proceeds from this offering and could spend the proceeds in ways that do not improve our results of operations or enhance the value of our Class A common stock. We intend to contribute the net proceeds we receive from this offering to BJS LLC, and we expect BJS LLC to use: approximately $ million of the proceeds for expanding its fleet, improving the reliability of its fleet by performing upgrades to extend component life, investing in facility improvements to optimize its fleet refurbishment program; approximately $ million performing additional research and development; and the remainder of the proceeds for other general corporate purposes, including to repay borrowings outstanding under our ABL credit facility from time to time. However, our use of these proceeds may differ substantially from our current plans. The failure by our management to apply these funds effectively could result in financial losses that could have a material adverse effect on our business and cause the price of our Class A common stock to decline. Pending their use, we may invest the net proceeds we receive from this offering in a manner that does not produce income or that loses value.
We do not intend to pay dividends on our Class A common stock, and we expect that our debt agreements will place certain restrictions on our ability to do so. Consequently, your only opportunity to achieve a return on your investment is if the price of our Class A common stock appreciates.
We do not plan to declare dividends on our Class A shares in the foreseeable future. Additionally, the ABL credit facility places certain restrictions on our ability to pay cash dividends. Consequently, unless we revise our dividend policy, your only opportunity to achieve a return on your investment in us will be if you sell your Class A shares at a price greater than you paid for them. There is no guarantee that the price of our Class A common stock that will prevail in the market will ever exceed the price that you pay in this offering.
Future sales of our Class A common stock in the public market could reduce our stock price, and any additional capital raised by us through the sale of equity or convertible securities may dilute your ownership in us.
Subject to certain limitations and exceptions, the LLC Unit Holders may require BJS LLC to redeem all or a portion of their LLC Units (together with the cancellation of a corresponding number of Class B shares for no consideration) in exchange for newly-issued Class A shares on a one-for-one basis (subject to conversion rate adjustments for stock splits, stock dividends and reclassification and other similar transactions) and then sell those Class A shares. Additionally, we may issue additional
43
Table of Contents
Index to Financial Statements
Class A shares or convertible securities in subsequent public offerings. After the completion of this offering, we will have outstanding Class A shares and outstanding Class B shares. This number of Class A shares includes Class A shares that we are selling in this offering and the Class A shares that we may sell in this offering if the underwriters’ option to purchase additional Class A shares is fully exercised, which may be resold immediately in the public market. Following the completion of this offering, the Existing Owners will own Class A shares and Class B shares, representing approximately % (or % if the underwriters’ option to purchase additional Class A shares is exercised in full) of our total outstanding common stock. All such shares are restricted from immediate resale under the federal securities laws and are subject to the lock-up agreements between such parties and the underwriters described in “Underwriting,” but may be sold into the market in the future. We expect that certain of the Existing Owners will be party to a registration rights agreement with us that will require us to effect the registration of their shares in certain circumstances no earlier than the expiration of the lock-up period contained in the underwriting agreement entered into in connection with this offering. Employees will be subject to certain restrictions on the sale of their shares for 180 days after the date of this prospectus; however, after such period, and subject to compliance with the Securities Act or exemptions therefrom, these employees may sell such shares into the public market. See “Shares Eligible for Future Sale” and “Certain Relationships and Related Party Transactions—Registration Rights Agreement.”
We intend to file a registration statement with the SEC on Form S-8 providing for the registration of Class A shares issued or reserved for issuance under our equity incentive plan. Subject to the satisfaction of vesting conditions, the expiration of lock-up agreements and the requirements of Rule 144, Class A shares registered under the registration statement on Form S-8 will be available for resale immediately in the public market without restriction.
We cannot predict the size of future issuances of our Class A common stock or securities convertible into Class A common stock or the effect, if any, that future issuances and sales of Class A shares will have on the market price of our Class A common stock. Sales of substantial amounts of our Class A common stock (including Class A shares issued in connection with an acquisition), or the perception that such sales could occur, may adversely affect prevailing market prices of our Class A common stock.
The underwriters of this offering may waive or release parties to the lock-up agreements entered into in connection with this offering, which could adversely affect the price of our Class A common stock.
Prior to this offering, we, all of our directors and executive officers, our Sponsors and BHGE will enter into lock-up agreements with respect to their Class A shares, pursuant to which they are subject to certain resale restrictions for a period of 180 days following the effectiveness date of the registration statement of which this prospectus forms a part. may, at any time and without notice, release all or any portion of the Class A common stock subject to the foregoing lock-up agreements. If the restrictions under the lock-up agreements are waived, then Class A shares will be available for sale into the public markets, which could cause the market price of our Class A common stock to decline and impair our ability to raise capital.
We will be required to make payments under the Tax Receivable Agreement for certain tax benefits we may claim, and the amounts of such payments could be significant.
In connection with the consummation of this offering, we will enter into a Tax Receivable Agreement with BJS LLC and the Existing Owners. Pursuant to the Tax Receivable Agreement, we will be required to make cash payments to the Existing Owners equal to 85% of the amount of tax benefits, if any, that we actually realize (or are deemed to realize in certain circumstances) in periods after this offering as a result
44
Table of Contents
Index to Financial Statements
of (i) increases in tax basis resulting from any redemptions of LLC Units described under “Certain Relationships and Related Party Transactions—BJS LLC Agreement” or in connection with this offering and (ii) certain other tax benefits related to our entering into the Tax Receivable Agreement, including tax benefits attributable to payments under the Tax Receivable Agreement. We will retain the benefit of the remaining 15% of these cash savings. The amount of the cash payments that we may be required to make under the Tax Receivable Agreement could be significant and is dependent upon significant future events and assumptions, including the timing of the exchanges of LLC Units, the price of our Class A shares at the time of each exchange, the extent to which such exchanges are taxable transactions and the amount of the exchanging LLC Unit Holder’s tax basis in its LLC Units at the time of the relevant exchange. The amount of such cash payments is also based on assumptions as to the depreciation and amortization periods that apply to the increase in tax basis, the amount and timing of taxable income we generate in the future and the U.S. federal income tax rate then applicable and the portion of BJS LLC’s payments under the Tax Receivable Agreement that constitute imputed interest or give rise to depreciable or amortizable tax basis. Moreover, payments under the Tax Receivable Agreement will be based on the tax reporting positions that we determine, which tax reporting positions are subject to challenge by taxing authorities. We will be dependent on distributions from BJS LLC to make payments under the Tax Receivable Agreement, and we cannot guarantee that such distributions will be made in sufficient amounts or at the times needed to enable us to make our required payments under the Tax Receivable Agreement, or at all. Any payments made by us to the Existing Owners under the Tax Receivable Agreement will generally reduce the amount of overall cash flow that might have otherwise been available to us. To the extent that we are unable to make timely payments under the Tax Receivable Agreement for any reason, the unpaid amounts will be deferred and will accrue interest until paid by us. Nonpayment for a specified period may constitute a material breach of a material obligation under the Tax Receivable Agreement and therefore may accelerate payments due under the Tax Receivable Agreement. Furthermore, our future obligation to make payments under the Tax Receivable Agreement could make us a less attractive target for an acquisition, particularly in the case of an acquirer that cannot use some or all of the tax benefits that may be deemed realized under the Tax Receivable Agreement. The payments under the Tax Receivable Agreement are also not conditioned upon the Existing Owners maintaining a continued ownership interest in BJS LLC or us. In the event that the Tax Receivable Agreement is not terminated, the payments under the Tax Receivable Agreement are anticipated to commence in the year following the first year that the Existing Owners redeem their units in a secondary offering and to continue for 15 years after the date of the last redemption or exchange of the LLC Units. See “Certain Relationships and Related Party Transactions—Tax Receivable Agreement” for a discussion of the Tax Receivable Agreement and the related likely benefits to be realized by us and the Existing Owners.
In certain cases, payments under the Tax Receivable Agreement may be accelerated and/or significantly exceed the actual benefits, if any, we realize in respect of the tax attributes subject to the Tax Receivable Agreement.
The Tax Receivable Agreement provides that if certain mergers, asset sales, other forms of business combination, or other changes of control were to occur, if we materially breach any of our material obligations under the Tax Receivable Agreement or if, at any time, we elect an early termination of the Tax Receivable Agreement, then the Tax Receivable Agreement will terminate and our obligations, or our successor’s obligations, to make payments under the Tax Receivable Agreement would accelerate and become immediately due and payable. The amount due and payable in those circumstances is determined based on certain assumptions, including an assumption that we would have sufficient taxable income to fully utilize all potential future tax benefits that are subject to the Tax Receivable Agreement. We may need to incur debt to finance payments under the Tax Receivable Agreement to the extent our cash resources are insufficient to meet our obligations under the Tax Receivable Agreement as a result of timing discrepancies or otherwise.
45
Table of Contents
Index to Financial Statements
As a result of the foregoing, (i) we could be required to make cash payments to the Existing Owners that are greater than the specified percentage of the actual benefits we ultimately realize in respect of the tax benefits that are subject to the Tax Receivable Agreement and (ii) we would be required to make an immediate cash payment equal to the present value of the anticipated future tax benefits that are the subject of the Tax Receivable Agreement, which payment may be made significantly in advance of the actual realization, if any, of such future tax benefits. In these situations, our obligations under the Tax Receivable Agreement could have a substantial negative impact on our liquidity and could have the effect of delaying, deferring or preventing certain mergers, asset sales, other forms of business combination, or other changes of control due to the additional transaction costs a potential acquirer may attribute to satisfying such obligations. There can be no assurance that we will be able to finance our obligations under the Tax Receivable Agreement.
We are an “emerging growth company” and we cannot be certain if the reduced disclosure requirements applicable to emerging growth companies will make our Class A common stock less attractive to investors.
We are an “emerging growth company,” as defined in the JOBS Act, and we intend to take advantage of certain exemptions from various reporting requirements that are applicable to other public companies, including, but not limited to, not being required to comply with the auditor attestation requirements of Section 404 of the Sarbanes-Oxley Act, reduced disclosure obligations regarding executive compensation in our periodic reports and proxy statements, and exemptions from the requirements of holding a nonbinding advisory vote on executive compensation and shareholder approval of any golden parachute payments not previously approved. We intend to take advantage of these reporting exemptions until we are no longer an emerging growth company. We cannot predict if investors will find our Class A common stock less attractive because we will rely on these exemptions. If some investors find our Class A common stock less attractive as a result, there may be a less active trading market for our Class A common stock and our stock price may be more volatile.
We will remain an emerging growth company for up to five years, although we may lose that status sooner. We would cease to qualify as an emerging growth company on the earliest of (i) the last day of any fiscal year in which we have more than $1.07 billion of revenue, (ii) the last day of any fiscal year in which we have more than $700.0 million in market value of our common stock held by non-affiliates as of June 30 of such fiscal year and (iii) the date on which we issue more than $1.07 billion of non-convertible debt over a rolling three-year period.
Under the JOBS Act, emerging growth companies can delay adopting new or revised accounting standards until such time as those standards apply to private companies. We have elected to avail ourselves of this exemption from new or revised accounting standards and, therefore, we will be subject to the different new or revised accounting standards than public companies that are not emerging growth companies.
To the extent that we rely on any of the exemptions available to emerging growth companies, you will receive less information about our executive compensation and internal control over financial reporting than issuers that are not emerging growth companies. If some investors find our common stock to be less attractive as a result, there may be a less active trading market for our Class A common stock and our stock price may be more volatile.
We expect to be a “controlled company” within the meaning of the NYSE rules and, as a result, will qualify for and intend to rely on exemptions from certain corporate governance requirements.
Upon completion of this offering, our Sponsors and BHGE, together with their respective affiliates, will own a majority of the combined voting power of all classes of our outstanding voting stock. As a
46
Table of Contents
Index to Financial Statements
result, we expect to be a controlled company within the meaning of the NYSE corporate governance standards. Under the NYSE rules, a company of which more than 50% of the voting power is held by another person or group of persons acting together is a controlled company and may elect not to comply with certain NYSE corporate governance requirements, including the requirements that:
| • | a majority of the board of directors consists of independent directors as defined under the rules of the NYSE; |
| • | the nominating and governance committee be composed entirely of independent directors with a written charter addressing the committee’s purpose and responsibilities; and |
| • | the compensation committee be composed entirely of independent directors with a written charter addressing the committee’s purpose and responsibilities. |
These requirements will not apply to us as long as we remain a controlled company. Following this offering, we intend to utilize some or all of these exemptions. Accordingly, you may not have the same protections afforded to shareholders of companies that are subject to all of the corporate governance requirements of the NYSE. See “Management.”
Our amended and restated certificate of incorporation will designate the Court of Chancery of the State of Delaware as the sole and exclusive forum for certain types of actions and proceedings that may be initiated by our shareholders, which could limit our shareholders’ ability to obtain a favorable judicial forum for disputes with us or our directors, officers, employees or agents.
Our amended and restated certificate of incorporation will provide that, unless we consent in writing to the selection of an alternative forum, the Court of Chancery of the State of Delaware will, to the fullest extent permitted by applicable law, be the sole and exclusive forum for (i) any derivative action or proceeding brought on our behalf, (ii) any action asserting a claim of breach of a fiduciary duty owed by any of our directors, officers, employees or agents to us or our shareholders, (iii) any action asserting a claim arising pursuant to any provision of the Delaware General Corporation Law (the “DGCL”), our certificate of incorporation or our bylaws, or (iv) any action asserting a claim against us that is governed by the internal affairs doctrine, in each such case subject to such Court of Chancery having personal jurisdiction over the indispensable parties named as defendants therein. Any person or entity purchasing or otherwise acquiring any interest in shares of our capital stock will be deemed to have notice of, and consented to, the provisions of our certificate of incorporation described in the preceding sentence. This choice of forum provision may limit a shareholder’s ability to bring a claim in a judicial forum that it finds favorable for disputes with us or our directors, officers, employees or agents, which may discourage such lawsuits against us and such persons. Alternatively, if a court were to find these provisions of our certificate of incorporation inapplicable to, or unenforceable in respect of, one or more of the specified types of actions or proceedings, we may incur additional costs associated with resolving such matters in other jurisdictions, which could adversely affect our business, financial condition or results of operations.
Future offerings of debt securities and preferred stock, which would rank senior to our Class A common stock upon liquidation, may adversely affect the market value of our Class A common stock.
In the future, we may, from time to time, attempt to increase our capital resources by making offerings of debt or additional offerings of equity securities, including commercial paper, medium-term notes, senior or subordinated notes and classes of preferred stock. Upon liquidation, holders of our debt securities and preferred stock and lenders with respect to other borrowings will receive a distribution of our available assets prior to the holders of our Class A common stock. Our preferred
47
Table of Contents
Index to Financial Statements
stock, which may be issued without shareholder approval, if issued, could have a preference on liquidating distributions or a preference on dividend payments that would limit amounts available for distribution to holders of our Class A common stock. Because our decision to issue securities in any future offering will depend on market conditions and other factors beyond our control, we cannot predict or estimate the amount, timing or nature of our future offerings. Thus, holders of our Class A common stock bear the risk that our future offerings may reduce the market value of our Class A common stock.
48
Table of Contents
Index to Financial Statements
Our net proceeds from the sale of Class A shares in this offering are estimated to be $ million (or $ million if the underwriters exercise in full their option to purchase additional Class A shares), after deducting underwriting discounts and estimated offering expenses payable by us. We intend to contribute all of the net proceeds from this offering to BJS LLC, and we expect BJS LLC to use: approximately $ million of the proceeds for expanding its fleet, improving the reliability of its fleet by performing upgrades to extend component life, investing in facility improvements to optimize its fleet refurbishment program; approximately $ million of the proceeds for performing additional research and development; and the remainder of the proceeds for other general corporate purposes, including to repay borrowings outstanding under our ABL credit facility from time to time.
49
Table of Contents
Index to Financial Statements
We do not anticipate declaring or paying any cash dividends to holders of our Class A shares in the foreseeable future. We currently intend to retain future earnings, if any, to finance the growth of our business. Our future dividend policy is within the discretion of our board of directors and will depend upon then-existing conditions, including our results of operations, financial condition, capital requirements, investment opportunities, statutory restrictions on our ability to pay dividends and other factors our board of directors may deem relevant. In addition, the ABL credit facility places restrictions on our ability to pay cash dividends.
50
Table of Contents
Index to Financial Statements
The following table sets forth our cash and cash equivalents and capitalization as of March 31, 2017:
| • | on a historical basis; and |
| • | on an as adjusted basis to (i) give effect to the transactions described under “Corporate Reorganization,” and (ii) reflect this offering and the application of the net proceeds from this offering as described under “Use of Proceeds.” |
This table is derived from, should be read together with and is qualified in its entirety by reference to the unaudited condensed historical consolidated financial statements and the accompanying notes of BJ Services, Inc. and BJS LLC and the unaudited pro forma condensed financial statements and the accompanying notes included elsewhere in this prospectus. You should also read this table in conjunction with “Management’s Discussion and Analysis of Financial Condition and Results of Operations.”
| As of March 31, 2017 | ||||||||
| Historical | As Adjusted | |||||||
| (In thousands, except par value) |
||||||||
| Cash and cash equivalents(1) |
$ | 135,298 | ||||||
|
|
|
|
|
|||||
| Long-term debt, including current portion: |
||||||||
| ABL credit facility(2) |
— | |||||||
|
|
|
|
|
|||||
| Total long-term debt, including current portion |
— | |||||||
|
|
|
|
|
|||||
| Members’/Shareholders’ equity: |
||||||||
| Members’ equity |
815,407 | |||||||
| Class A common stock (par value $0.001 per share; shares authorized, issued and outstanding, actual historical; and shares authorized, shares issued and outstanding, as adjusted) |
— | |||||||
| Class B common stock (par value $0.001 per share; shares authorized, issued and outstanding, actual historical; and shares authorized, shares issued and outstanding, as adjusted) |
— | |||||||
| Preferred stock (par value $0.001 per share; shares authorized and no shares issued or outstanding, actual historical; and shares authorized and no shares issued or outstanding, as adjusted) |
— | |||||||
| Additional paid-in capital |
— | |||||||
|
|
|
|
|
|||||
| Total members’/shareholders’ equity |
815,407 | |||||||
|
|
|
|
|
|||||
| Total equity |
815,407 | |||||||
|
|
|
|
|
|||||
| Total Capitalization |
$ | 815,407 | $ | |||||
|
|
|
|
|
|||||
| (1) | As of June 30, 2017, we had a total of $68.1 million in cash and cash equivalents on hand. |
| (2) | As of June 30, 2017, there was $50.0 million principal amount of borrowings outstanding under the ABL credit facility. These outstanding borrowings initially bear interest at a rate of approximately 2.71% per annum. |
The information above assumes no exercise of the underwriters’ option to purchase additional Class A shares. The table does not reflect Class A shares reserved for issuance under our long-term incentive plan, which we plan to adopt in connection with this offering.
51
Table of Contents
Index to Financial Statements
Purchasers of our Class A common stock in this offering will experience immediate and substantial dilution in the net tangible book value (tangible assets less total liabilities) per share of our Class A common stock for accounting purposes. Our net tangible book value as of December 31, 2016 was approximately $ million, or $ per Class A share.
Pro forma net tangible book value per Class A share is determined by dividing our net tangible book value, or total tangible assets less total liabilities, by the total number of shares of our Class A common stock that will be outstanding immediately prior to the closing of this offering. Assuming an initial public offering price of $ per Class A share (which is the midpoint of the price range set forth on the cover page of this prospectus), after giving effect to the sale of the Class A shares in this offering and further assuming the receipt of the estimated net proceeds (after deducting estimated underwriting discounts and estimated offering expenses payable by us), our adjusted pro forma net tangible book value as of March 31, 2017 would have been approximately $ million, or $ per Class A share. This represents an immediate increase in the net tangible book value of $ per Class A share to our existing shareholders and an immediate dilution to new investors purchasing Class A shares in this offering of $ per Class A share, resulting from the difference between the offering price and the pro forma as adjusted net tangible book value after this offering. The following table illustrates the per share dilution to new investors purchasing Class A shares in this offering (assuming that 100% of our Class B common Stock has been exchanged for Class A common stock):
| Assumed initial public offering price per Class A share |
$ | |||||||
|
|
|
|||||||
| Pro forma net tangible book value per share as of March 31, 2017 (after giving effect to our corporate reorganization) |
$ | |||||||
|
|
|
|||||||
| Increase per share attributable to new investors in this offering |
||||||||
| As adjusted pro forma net tangible book value per share (after giving effect to the corporate reorganization and this offering) |
||||||||
| Dilution in pro forma net tangible book value per share to new investors in this offering |
$ | |||||||
|
|
|
|
|
A $1.00 increase (decrease) in the assumed initial public offering price of $ per Class A share, which is the midpoint of the price range set forth on the cover page of this prospectus, would increase (decrease) our as adjusted pro forma net tangible book value per Class A share after the offering by $ and increase (decrease) the dilution to new investors in this offering by $ per Class A share, assuming the number of Class A shares offered by us, as set forth on the cover page of this prospectus, remains the same, after deducting the estimated underwriting discounts and estimated offering expenses payable by us.
The following table summarizes, on an adjusted pro forma basis as of December 31, 2016, the total number of shares of Class A common stock owned by existing shareholders (assuming that 100% of our Class B common stock has been exchanged for Class A common stock) and to be owned by new investors at $ per Class A share, which is the midpoint of the price range set forth on the cover page of this prospectus, and the total consideration paid and the average price per Class A share paid by our existing shareholders and to be paid by new investors in this offering at $ , the midpoint of the price range set forth on the cover page of this prospectus, calculated before deduction of estimated underwriting discounts.
| Class A Shares Acquired |
Total Consideration |
Average Price Per Class A Share |
||||||||||||||||||
| Number | Percent | Amount | Percent | |||||||||||||||||
| Existing shareholders |
% | $ | % | $ | ||||||||||||||||
|
|
|
|
|
|
|
|
|
|
|
|||||||||||
| New investors in this offering |
||||||||||||||||||||
| Total |
100 | % | $ | 100 | % | $ | ||||||||||||||
|
|
|
|
|
|
|
|
|
|
|
|||||||||||
52
Table of Contents
Index to Financial Statements
SELECTED HISTORICAL CONSOLIDATED AND PRO FORMA FINANCIAL DATA
The following table presents selected historical consolidated financial data of BJS LLC and our Predecessor as of the dates and for the periods indicated. Our Predecessor refers to (i) ALTCem from ALTCem’s inception on January 27, 2015 until the acquisition of Allied Oil and Gas, (ii) ALTCem and Allied OFS on a combined basis from the acquisition of Allied Oil and Gas until the Allied Asset Acquisition and (iii) ALTCem, Allied OFS and the assets acquired in connection with the Allied Asset Acquisition on a combined basis following the completion of the Allied Asset Acquisition.
The selected historical consolidated financial data of BJS LLC presented in the following table for the three months ended March 31, 2017 and 2016 are derived from the unaudited condensed consolidated financial statements appearing elsewhere in this prospectus. The selected historical consolidated financial data of the Predecessor at December 31, 2016 and 2015 and for the year ended December 31, 2016 and the period from January 27, 2015 (Date of Inception) to December 31, 2015 are derived from the audited financial statements appearing elsewhere in this prospectus. The selected historical consolidated financial data presented below should be read in conjunction with “Risk Factors,” “Management’s Discussion and Analysis of Financial Condition and Results of Operations” and our consolidated financial statements and the related notes and other financial data included elsewhere in this prospectus.
The summary unaudited condensed pro forma financial data presented in the following table for the three months ended March 31, 2017 and the year ended December 31, 2016 are derived from the unaudited pro forma condensed financial statements included elsewhere in this prospectus. The summary unaudited pro forma condensed balance sheets as of March 31, 2017 assume the offering and the transactions described below occurred as of March 31, 2017 and the unaudited pro forma condensed statements of operations for the three months ended March 31, 2017 and the year ended December 31, 2016 assume the offering and the transactions described below occurred as of January 1, 2016. These transactions include, and the unaudited pro forma condensed financial statements give effect to, the following:
| • | with respect to the year ended December 31, 2016, our acquisition of Allied Oil and Gas; |
| • | with respect to the year ended December 31, 2016, the contribution by BHGE of its North American hydraulic fracturing and land cementing businesses to us; |
| • | the consummation of this offering and the completion of the transactions described under “—Corporate Reorganization”; and |
| • | the application of the net proceeds of this offering as described in “Use of Proceeds.” |
The following table also presents selected historical financial information of Allied Oil and Gas and BH N.A. PP, two significant acquisitions that were completed during the year ended December 31, 2016 for the periods indicated. The selected historical financial information of Allied Oil and Gas for the period from January 1, 2016 to April 28, 2016 and for the years ended December 31, 2015 and 2014 have been derived from the audited historical financial statements included elsewhere in this prospectus, except for certain balance sheet data, which was derived from Allied Oil and Gas accounting records. The selected audited historical financial information of BH N.A. PP for the period from January 1, 2016 through December 30, 2016, for the years ended December 31, 2015 and 2014 and as of December 31, 2015 have been derived from the historical audited consolidated financial statements included elsewhere in this prospectus.
53
Table of Contents
Index to Financial Statements
| BH N.A. PP | Allied Oil and Gas | Predecessor | BJS LLC | Pro Forma | ||||||||||||||||||||||||||||||||||||||||||||
| (in millions, |
Years ended December 31, |
Period from January 1, 2016 to December 30, 2016 |
Years ended December 31, |
Period from January 1, 2016 to April 28, 2016 |
Period from January 27, 2015 (Date of Inception) to December 31, 2015 |
Year ended December 31, 2016 |
Three months ended March 31, |
Year ended December 31, 2016 |
Three months ended March 31, 2017 |
|||||||||||||||||||||||||||||||||||||||
| 2014 | 2015 | 2014 | 2015 | 2016 | 2017 | |||||||||||||||||||||||||||||||||||||||||||
| Statements of Operations Data: |
||||||||||||||||||||||||||||||||||||||||||||||||
| Revenue |
$ | 4,296.1 | $ | 1,272.0 | $ | 231.0 | $ | 132.6 | $ | 52.7 | $ | 9.2 | $ | 1.2 | $ | 37.0 | $ | 1.0 | $ | 180.1 | ||||||||||||||||||||||||||||
| Revenues in Excess (Deficit) of Direct Operating expenses |
187.3 | (636.8 | ) | (283.9 | ) | N/A | N/A | N/A | N/A | N/A | N/A | N/A | ||||||||||||||||||||||||||||||||||||
| Operating income (loss) |
N/A | N/A | N/A | 13.5 | (86.7) | (a) | (9.6 | )(a) | (3.9 | ) | (2.0 | )(b) | (1.3 | ) | (64.4 | ) | ||||||||||||||||||||||||||||||||
| Net income (loss) |
N/A | N/A | N/A | 9.7 | (91.3 | ) | (11.1 | ) | (3.9 | ) | (2.3 | ) | (1.3 | ) | (63.4 | ) | ||||||||||||||||||||||||||||||||
| Other Financial Data: |
||||||||||||||||||||||||||||||||||||||||||||||||
| Capital expenditures |
N/A | N/A | N/A | 32.8 | 0.8 | — | 10.4 | 90.5 | (c) | — | 42.6 | |||||||||||||||||||||||||||||||||||||
| Adjusted EBITDA |
505.2 | (d) | (355.1) | (d) | (220.8 | )(d) | 25.9 | (4.0 | ) | (7.4 | ) | (3.4 | ) | (20.0 | ) | (1.0 | ) | (30.9 | ) | |||||||||||||||||||||||||||||
| Per Share / Unit Data: |
||||||||||||||||||||||||||||||||||||||||||||||||
| Net loss per share: |
||||||||||||||||||||||||||||||||||||||||||||||||
| Basic and diluted |
N/A | N/A | N/A | N/A | N/A | N/A | (9.40 | ) | (5.23 | ) | (3.08 | ) | (71.16 | ) | ||||||||||||||||||||||||||||||||||
| Weighted average shares/units outstanding: |
||||||||||||||||||||||||||||||||||||||||||||||||
| Basic and diluted |
N/A | N/A | N/A | N/A | N/A | N/A | 411,964 | 435,630 | 419,914 | 891,000 | ||||||||||||||||||||||||||||||||||||||
| Balance Sheet Data (at end of period): |
||||||||||||||||||||||||||||||||||||||||||||||||
| Total assets |
N/A | N/A | N/A | 165.4 | 71.4 | 66.0 | 12.1 | 893.2 | N/A | 1,045.0 | ||||||||||||||||||||||||||||||||||||||
| Long-term liabilities |
N/A | N/A | N/A | 77.1 | 0.8 | 0.7 | 0.4 | 1.4 | N/A | 3.7 | ||||||||||||||||||||||||||||||||||||||
| (a) | Includes $70.4 million and $1.5 million in impairment charges in the year ended December 31, 2015 and the period from January 1, 2016 to April 28, 2016, respectively. |
| (b) | Includes a bargain purchase gain of $34.2 million recorded in the year ended December 31, 2016. |
| (c) | Capital expenditures for the Predecessor for 2016 include $20.3 million of non-cash capital expenditures and $4.6 million of accrued capital expenditures and capital expenditures for BJS LLC for the three months ended March 31, 2017 include $22.7 million of accrued capital expenditures. |
| (d) | The BH N.A. PP financial information excludes certain indirect expenses incurred in connection with its ownership and operations on a fully standalone basis, including, but not limited to, corporate general and administrative expenses, interest expense, certain elements of depreciation and amortization and foreign, federal and state income taxes. See the audited combined abbreviated statements of direct revenues and direct operating expenses included elsewhere in this prospectus. |
54
Table of Contents
Index to Financial Statements
MANAGEMENT’S DISCUSSION AND ANALYSIS OF
FINANCIAL CONDITION AND RESULTS OF OPERATIONS
You should read the following discussion and analysis of our financial condition and results of operations together with our audited financial statements and the related notes appearing elsewhere in this prospectus. Some of the information contained in this discussion and analysis or set forth elsewhere in this prospectus, including information with respect to our plans and strategy for our business and related financing, including forward-looking statements that involve risks and uncertainties. You should read the “Risk Factors” section of this prospectus for a discussion of important factors that could cause actual results to differ materially from the results described in or implied by the forward-looking statements contained in the following discussion and analysis. Unless the context otherwise requires, references in this “Management’s Discussion and Analysis of Financial Condition and Results of Operations” to “BJ Services, Inc.,” “our company,” “we,” “our” and “us,” or like terms, refer to (i) BJ Services, LLC (“BJS LLC”) and its subsidiaries when used in a historical context and (ii) BJ Services, Inc. and its subsidiaries when used in the present tense or prospectively.
Executive Overview
We are the largest North American-focused, pure-play pressure pumping services provider, with leading hydraulic fracturing and cementing businesses, access to an expanding intellectual property portfolio and a track record of technology-driven solutions for exploration and production (“E&P”) companies. Our management team and members of our Board of Directors have an extensive history of providing reliable, safe and efficient solutions for clients across all major North American shale plays. We manage our operations through two segments: hydraulic fracturing and cementing.
Following this offering and the transactions described under “Corporate Reorganization,” BJ Services, Inc. will be a holding company whose sole material asset will consist of LLC Units in BJS LLC, which BJ Services, Inc. will control as the managing member. As the managing member of BJS LLC, we will be responsible for all operational, management and administrative decisions relating to BJS LLC and its business and will consolidate the financial results of BJS LLC and its subsidiaries.
BJS LLC was formed in late 2016 pursuant to a Contribution Agreement (“the Contribution Agreement”) entered into among Baker Hughes Oilfield Operations LLC (“BHOO”) (a wholly owned subsidiary of Baker Hughes, a GE company, LLC), the Joint Venture and Allied Completions Holdings, LLC (“Allied Completions Holdings”). Under the terms of the Contribution Agreement, BHOO contributed to BJS LLC its hydraulic fracturing and cementing services in the United States and Canada, including personnel, expertise, technology and infrastructure (the “Baker Hughes North America Land Pressure Pumping Business”). Allied Completions Holdings contributed to BJS LLC cash and its pressure pumping business in the United States, including hydraulic fracturing and cementing services and other assets. The Joint Venture contributed cash to BJS LLC in the amount of $325.0 million, of which $175.0 million was retained by BJS LLC and the remaining $150.0 million was paid to BHOO. Our Sponsors own approximately 53% of BJS LLC, and BHOO owns the remaining interest. BJ Services, Inc. was formed in March 2017 and does not have historical financial operating results. As of June 30, 2017, BJS LLC owned 43 hydraulic fracturing fleets with an aggregate capacity of 2.2 million HHP (assumes in excess of 50,000 HHP per fleet), as well as 241 cementers.
We generated $180.1 million in revenue during the first quarter of 2017, an increase of $179.1 million over the first quarter of 2016. Net loss was $63.4 million in the first quarter of 2017, as compared to $1.3 million in the first quarter of 2016. In January 2017, we commenced an aggressive fleet deployment program in response to the increased demand for our hydraulic fracturing and cementing services resulting from improving market conditions. Our weighted average number of
55
Table of Contents
Index to Financial Statements
fracturing fleets servicing our clients during the first quarter of 2017 was 10, compared to none in the first quarter of 2016. Similarly, we had a weighted average of 82 of our cementers servicing our clients during the first quarter of 2017, as compared to 49 of our cementers during the first quarter of 2016. Fracturing fleets and cementers enter the weighted average calculation during the first full month of revenue generation.
For 2016, BJS LLC generated revenue of $37.0 million, an increase of $35.8 million over the period from January 27, 2015 (Date of Inception) through December 31, 2015. This increase was attributable to the April 2016 acquisition of Allied Oil and Gas Holdings, LLC (Allied Oil and Gas), a provider of cementing services to oil and natural gas operators in the mid-continent, northeast, Rocky Mountain and southwest regions of the United States. The net loss was $2.3 million in 2016 as compared to net loss of $3.9 million for the period from January 27, 2015 through December 31, 2015. The 2016 operating results included a bargain purchase gain related to the Allied Oil and Gas acquisition of $34.2 million. Results for both periods were negatively impacted by the difficult market conditions in the North American oil and natural gas industry. Results for 2016 and for the period from January 27, 2015 through December 31, 2015 do not include the operations of the Baker Hughes North America Land Pressure Pumping Business, which closed on December 30, 2016.
Our Predecessor
For purposes of this “Management’s Discussion and Analysis of Financial Condition and Results of Operations,” our accounting predecessor is the “Predecessor,” which refers to (i) ALTCem from ALTCem’s inception on January 27, 2015 until the Allied OFS Acquisition on April 28, 2016, (ii) ALTCem and Allied OFS on a combined basis from the Allied Oil and Gas Acquisition until the Allied Asset Acquisition on April 28, 2016 and (iii) ALTCem, Allied OFS and the assets acquired in connection with the Allied Asset Acquisition on a combined basis following the completion of the Allied Asset Acquisition. For a definition of certain terms used in this “Management’s Discussion and Analysis of Financial Condition and Results of Operations,” please read “Certain Terms Used in this Prospectus” beginning on page (iii).
Outlook and Business Environment
The primary driver of our businesses is our clients’ capital and operating expenditures dedicated to oil and natural gas exploration, field development and production.
We believe relative oil price stability is required for confidence in the client community to improve and investment to accelerate. Also, activity must increase significantly before excess service capacity can be substantially absorbed and a pricing recovery takes place. We have observed increased drilling activity and other indications of increased activity and pricing improvements in several of the North American basins, but we believe there remains a significant amount of capacity that must be absorbed before service pricing will become more tightly correlated with higher commodity prices and increased activity.
In the North American market, onshore activity continues to climb upward, and we expect that trend to continue through the remainder of 2017. Despite the near-term volatility, the long-term outlook for our industry remains strong. We believe the world’s demand for energy will continue to rise, and the supply of energy will continue to increase in complexity, requiring greater service intensity and more advanced technology from oilfield service companies. As such, we remain focused on delivering innovative cost-efficient solutions that deliver step changes in operating and economic performance for our clients.
56
Table of Contents
Index to Financial Statements
Commodity Price Environment
We provide our clients with hydraulic fracturing and cementing services in both the United States and Canada. Our revenue is predominantly generated from the sale of services to major and independent oil and natural gas companies and is dependent on spending by our clients for oil and natural gas exploration, field development and production. This spending is driven by a number of factors, including our clients’ forecasts of future energy demand and supply, their access to resources to develop and produce oil and natural gas, their ability to fund their capital programs, the impact of new government regulations and their expectations for oil and natural gas prices as a key driver of their cash flows.
Oil and natural gas prices are summarized in the table below as averages of the daily closing prices during each of the periods indicated.
| Three Months Ended March 31, |
Year Ended December 31, | |||||||||||||||||||
| 2017 | 2016 | 2016 | 2015 | 2014 | ||||||||||||||||
| WTI oil prices ($ per Bbl)(1) |
$ | 51.70 | $ | 33.41 | $ | 43.31 | $ | 48.69 | $ | 93.05 | ||||||||||
|
|
|
|
|
|
|
|
|
|
|
|||||||||||
| Natural gas prices ($ per MMBtu)(2) |
$ | 2.98 | $ | 1.96 | $ | 2.49 | $ | 2.61 | $ | 4.35 | ||||||||||
| (1) | Bloomberg WTI Cushing Crude Oil Spot Price per Barrel |
| (2) | Bloomberg Henry Hub Natural Gas Spot Price per MMBtu |
In North America, client spending is highly driven by WTI oil prices, which fluctuated significantly since 2014. WTI oil prices began the first quarter of 2017 at $52.33 per Bbl and remained in a range of $47.00 per Bbl to $54.10 per Bbl for the rest of the quarter. In 2016, WTI oil prices ranged from a low of $26.21 per Bbl in February 2016 to a high of $54.06 per Bbl in December 2016.
Early in the first quarter of 2017, the oil market showed signs that a balance between supply and demand might be achieved by the end of 2017, which supported a recovery in WTI oil prices. Global economic activity remained healthy, supporting an increase in oil consumption, and voluntary oil production cuts agreed to in late 2016 by members of OPEC and some non-OPEC producers indicated a tightening of supply. At the same time, North American drilling activity and production increased in response to the higher oil prices, causing inventories to build. U.S. crude oil production was estimated to be 9.1 million Bbl per day in March 2017, the highest level in a year. This growth in the United States decreased OPEC market share, adding to the uncertainty of whether its members will extend voluntary supply reductions in the second half of 2017. According to the International Energy Agency, forecasted oil demand growth for 2017 was reduced to 1.4 million Bbl per day compared to 1.6 million Bbl per day in 2016. These supply uncertainties, combined with weaker projected oil demand growth, limited the upward price movement of WTI oil prices and further contributed to volatility in the oil market at the end of the first quarter of 2017 and into the second quarter of 2017.
In North America, natural gas prices, as measured by the Henry Hub Natural Gas Spot Price, fluctuated between $2.44 per MMBtu and $3.42 per MMBtu, and averaged $2.98 per MMBtu during the first quarter of 2017. Compared to the same quarter in the prior year, natural gas prices increased 52%, driven by higher drawdowns stemming from lower natural gas production and higher exports. According to the United States Department of Energy, working natural gas storage in the last week of the first quarter of 2017 was 2,051 Bcf, which was 27% lower than the previous five-year average, and 17%, or 417 Bcf below the corresponding week in 2016. The Henry Hub Natural Gas Spot Price averaged $2.49 per MMBtu in 2016, representing a 5% decrease over the prior year. The warmer-than-average winter at the start of 2016 significantly reduced demand and storage inventories experienced record highs. In late 2016, once production and drilling activity tapered off and the
57
Table of Contents
Index to Financial Statements
seasonal demand increased, the spot prices improved. According to the U.S. Department of Energy, working natural gas in storage at the end of 2016 was 3,311 Bcf, which was 11.8%, or 445 Bcf, below the corresponding week in 2015.
Market Outlook
Since late 2014, conditions in our industry declined as oil and natural gas commodity prices deteriorated to levels not seen in more than a decade. Clients reduced spending to cope with this challenging low-commodity price environment, resulting in significant price deterioration for our services, as well as steep volume declines. However, in response to improvements in hydrocarbon prices, partially driven by OPEC actions in the latter half of 2016, E&P companies increased their capital spending on drilling and completion services, resulting in an improved demand for oilfield services activities. In the first quarter of 2017, the North America land market experienced a 36% growth in rig count as compared to the fourth quarter of 2016. Similarly, fourth quarter 2016 North America land rig count increased by 29% as compared to the third quarter of 2016.
Oil prices started to rebound in the fourth quarter of 2016 as a result of the announced supply cut agreements by OPEC and 11 non-OPEC producers and a modest increase in the forecasted demand for oil. However, North American production remains uncertain due to the unpredictable actions of North American shale operators who can bring on production and impact commodity prices much more quickly than their peers in other operating environments. Since details of OPEC’s plans surfaced in October 2016, land rig counts for the fourth quarter of 2016 increased by 24% in the United States compared to the third quarter of 2016, with a corresponding increase in United States shale production already materializing. Continuing this trend, United States land rig counts increased by 27% in the first quarter of 2017 as compared to the fourth quarter of 2016. Therefore, the operators’ ability to quickly get resources from the ground into production could limit near-term commodity price gains. This dynamic, combined with uncertainty regarding OPEC’s ability to implement and sustain these cuts, makes it difficult to predict whether these agreed-upon production cuts will lead to a more sustainable improvement in oil prices, and in turn, to increased spending by our clients.
The Baker Hughes North America rig counts are an important business barometer for the oil and natural gas industry and its suppliers. When drilling rigs are active, they consume products and services produced by the oil service industry. Rig count trends are driven by the exploration and development spending by oil and natural gas companies, which in turn is influenced by current and future price expectations for oil and natural gas. Therefore, the counts may reflect the relative strength and stability of energy prices and overall market activity. However, these counts should not be solely relied on as other specific and pervasive conditions may exist that affect overall energy prices and market activity.
The rig counts are summarized in the table below as averages for each of the periods indicated.
| Three Months Ended March 31, |
Year Ended December 31, |
|||||||||||||||||||
| 2017 | 2016 | 2016 | 2015 | 2014 | ||||||||||||||||
| U.S.—Land |
719 | 522 | 487 | 943 | 1,789 | |||||||||||||||
| Canada—Land |
294 | 170 | 127 | 191 | 378 | |||||||||||||||
|
|
|
|
|
|
|
|
|
|
|
|||||||||||
| North America—Land |
1,013 | 692 | 614 | 1,134 | 2,167 | |||||||||||||||
|
|
|
|
|
|
|
|
|
|
|
|||||||||||
Notwithstanding the continuing uncertainty regarding oil and natural gas commodity prices, we believe we will be able to continue to increase the number of operating hydraulic fracturing fleets and cementers servicing our clients as the rig count increases or stabilizes near current levels. During the first quarter of 2017, we redeployed 10 hydraulic fracturing fleets and 12 cementers. We believe we will
58
Table of Contents
Index to Financial Statements
redeploy an additional 15 hydraulic fracturing fleets and 50 cementers by the end of 2017. However, we are unable to guarantee that we will be able to successfully redeploy such assets on the timeline contemplated, or at all, or that our ability to redeploy a significant number of fleets and cementers during the first quarter of 2017 is indicative of the anticipated results of future periods.
First Quarter 2017 Compared to First Quarter 2016
The land rig count in North America increased 46% in the first quarter of 2017 compared to the same period in 2016, primarily driven by a 47% increase in oil-directed rigs, as a result of increased spending from our clients as they reacted to the improvement in the oil price environment. The natural gas-directed rig count in North America increased 44% in the first quarter of 2017 as compared to the same period in 2016 as natural gas well productivity improved, with natural gas-directed drilling increasing 41% in the United States and 47% in Canada.
2016 Compared to 2015
The land rig count in North America decreased 46% in 2016 compared to 2015, primarily driven by a 44% decline in oil-directed rigs, as a result of reduced spending from our clients as they adapted to a lower oil price environment. The natural gas-directed rig count in North America declined 50% in 2016, as natural gas well productivity improved, with natural gas-directed drilling declining 56% in the United States and 38% in Canada.
2015 Compared to 2014
The land rig count in North America decreased 48% in 2015 compared to 2014, primarily driven by a 52% decline in oil-directed rigs, as a result of reduced spending from our clients as they adapted to a lower oil price environment. The natural gas-directed rig count in North America declined 31% in 2015, as natural gas prices deteriorated 40% compared to the 2014 average, with natural gas-directed drilling declining 31% in the United States and 33% in Canada.
How We Evaluate Our Operations
Our management intends to use a variety of metrics to analyze our operating results and profitability. These metrics include, among others, the following:
| • | Revenue; |
| • | Operating Income (Loss); and |
| • | Adjusted EBITDA. |
Revenue
We analyze our revenue by comparing actual revenue to our internal projections for a given period and to prior periods to assess our performance. We believe that revenue is a meaningful indicator of the demand and pricing for our services.
Operating Income (Loss)
We analyze our operating income (loss), which we define as revenues less cost of services, general and administrative expenses, depreciation and amortization, impairment and other operating expenses, to measure our financial performance. We believe operating income (loss) is a meaningful metric because it provides insight on profitability and true operating performance based on the historical costs of our assets. We also compare operating income (loss) to our internal projections for a given period and to prior periods.
59
Table of Contents
Index to Financial Statements
Adjusted EBITDA
We believe the presentation of Adjusted EBITDA is useful to our investors because EBITDA is an appropriate measure of evaluating our operating performance and liquidity that reflects the resources available for strategic opportunities including, among others, investing in our business and strengthening our balance sheet. In particular, we believe Adjusted EBITDA helps our investors assess and understand our operating performance when comparing those results with previous and subsequent periods or forecasting performance for future periods, as management views the excluded items to be outside our normal operating results (i.e., not seen as typical in our results) or such items that do not impact cash. Further, Adjusted EBITDA is a widely used benchmark in the investment community. See ‘‘Prospectus Summary—Summary Historical Combined Consolidated and Unaudited Pro Forma Financial and Operating Data’’ and ‘‘—Results of Operations—Note Regarding Non-GAAP Financial Measure’’ for more information and reconciliations of Adjusted EBITDA to net income (loss) and net cash provided by (used in) operating activities, the most directly comparable financial measures calculated and presented in accordance with GAAP.
Results of Operations
Factors Affecting the Comparability of Our Financial Results
Our future results of operations may not be comparable to our historical results of operations for the reasons described below:
Baker Hughes North America Land Pressure Pumping Business and Allied OFS Acquisitions
Our Predecessor’s historical consolidated financial statements for the year ended December 31, 2016 and for the period January 27, 2015 (Date of Inception) to December 31, 2015 do not include the results of the Baker Hughes North America Land Pressure Pumping Business because that acquisition closed on December 30, 2016. Further, the financial statements include the results of operations for Allied OFS beginning in April 2016. The historical results of operations should be read in conjunction with the unaudited pro forma condensed statement of operations for the year ended December 31, 2016, which reflects the Baker Hughes North America Land Pressure Pumping Business and the Allied OFS results as if these acquisitions were completed on January 1, 2016.
Public Company Costs
We expect to incur incremental, non-recurring costs related to our transition to a publicly traded and taxable corporation, including the costs of this initial public offering and the costs associated with the initial implementation of our Sarbanes-Oxley Section 404 internal control reviews and testing. We also expect to incur additional significant and recurring expenses as a publicly traded corporation, including costs associated with the employment of additional personnel, compliance under the Exchange Act, annual and quarterly reports to common shareholders, registrar and transfer agent fees, national stock exchange fees, audit fees, incremental director and officer liability insurance costs and director and officer compensation.
Corporate Reorganization
BJ Services, Inc. was incorporated in March 2017 to serve as the issuer in this offering and had no previous operations, assets or liabilities. BJS LLC will be contributed to us in connection with this offering pursuant to the transaction described under “Corporate Reorganization” and will thereby become our subsidiary. As we integrate our operations and further implement controls, processes and infrastructure, it is likely that we will incur incremental selling, general and administrative expenses relative to historical periods.
60
Table of Contents
Index to Financial Statements
In addition, we will enter into a Tax Receivable Agreement with BJS LLC and the Existing Owners. This agreement generally will provide for the payment by us to an Existing Owner of 85% of the net cash savings, if any, in U.S. federal, state and local income tax or franchise tax that we actually realize (or are deemed to realize in certain circumstances) in periods after this offering as a result of (i) the tax basis increases resulting from the exchange by such Existing Owner of LLC Units for Class A shares pursuant to the Redemption Right (or resulting from an exchange of LLC Units for cash pursuant to the Cash Option) and (ii) imputed interest deemed to be paid by us as a result of, and additional tax basis arising from, any payments we make under the Tax Receivable Agreement. We will retain the benefit of the remaining 15% of these cash savings. We will be dependent on distributions from BJS LLC to make these payments under the Tax Receivable Agreement, and neither the timing nor the amount of any such distributions can be guaranteed. Payments under the Tax Receivable Agreement are not conditioned upon the Existing Owners maintaining a continued ownership interest in BJS LLC or us and, in the event that the Tax Receivable Agreement is not terminated, the payments under the Tax Receivable Agreement are anticipated to commence in the year following the first year that the Existing Owners redeem their units in a secondary offering and to continue for 15 years after the date of the last redemption or exchange of the LLC Units. See “Certain Relationships and Related Party Transactions—Tax Receivable Agreement.”
Income Taxes
BJ Services, Inc. is a Subchapter C corporation under the Internal Revenue Code of 1986, as amended (the “Code”), and, as a result, will be subject to potential income tax in the United States, as well as the applicable states and foreign jurisdictions. We will record a federal and state income tax liability associated with our status as a corporation and will recognize a tax liability on our share of pre-tax book income, exclusive of the non-controlling interest. Although the Predecessor is subject to franchise tax in the State of Texas (at less than 1% of modified pre-tax earnings), it has historically passed through its taxable income to its owners for U.S. federal and other state and local income tax purposes and thus was not subject to U.S. federal income taxes or other state or local income taxes. Accordingly, the financial data attributable to our Predecessor contains no provision for U.S. federal income taxes or income taxes in any state or locality other than franchise tax in the State of Texas. We estimate that BJ Services, Inc. will be subject to U.S. federal, state and local taxes at a blended statutory rate of 37.4% of pre-tax earnings prior to consideration of non-controlling interests.
We account for income taxes under the asset and liability method. Under this method, deferred tax assets and liabilities are recognized for the estimated future tax consequences attributable to differences between the financial statement carrying amounts of existing assets and liabilities and their respective tax basis. Deferred tax assets and liabilities are measured using enacted tax rates in effect for the year in which those temporary differences are expected to be recovered or settled pursuant to the provisions of Accounting Standards Codification (‘‘ASC’’) 740, Income Taxes. The effect on deferred tax assets and liabilities of a change in tax rate is recognized in earnings in the period that includes the enactment date. Valuation allowances are established when necessary to reduce deferred tax assets to the amounts more likely than not to be realized.
In assessing the realization of deferred tax assets, we consider whether it is more likely than not that some portion or all of the deferred tax assets will not be realized. We consider and make judgments regarding whether a deferred tax asset will be realized on a tax filer and jurisdictional basis, and our determination is based on all of the available positive and negative evidence, including the timing of the reversal of deferred tax assets and liabilities, projected future taxable income, ongoing, prudent and feasible tax planning strategies and recent financial results of operations. The amount of the deferred tax assets considered realizable, however, could be adjusted in the future if objective negative evidence in the form of cumulative losses is no longer present and additional weight may be given to subjective evidence such as our projections for growth. We will record a valuation allowance if it is deemed more likely than not that all or a portion of our deferred tax assets will not be realized.
61
Table of Contents
Index to Financial Statements
Results of Operations of BJS LLC
The following table sets forth our selected operating data for the periods indicated (in thousands).
| Three Months Ended March 31, |
||||||||||||
| 2017 | 2016 | $ Change |
||||||||||
| Revenue: |
||||||||||||
| Hydraulic fracturing |
$ | 131,705 | $ | — | $ | 131,705 | ||||||
| Cementing |
48,367 | 951 | 47,416 | |||||||||
|
|
|
|
|
|
|
|||||||
| Consolidated |
$ | 180,072 | $ | 951 | $ | 179,121 | ||||||
|
|
|
|
|
|
|
|||||||
| Operating income (loss): |
||||||||||||
| Hydraulic fracturing |
$ | (35,836 | ) | $ | — | $ | (35,836 | ) | ||||
| Cementing |
(18,283 | ) | (950 | ) | (17,333 | ) | ||||||
| Corporate and non-allocated costs |
(10,289 | ) | (304 | ) | (9,985 | ) | ||||||
|
|
|
|
|
|
|
|||||||
| Consolidated |
$ | (64,408 | ) | $ | (1,254 | ) | $ | (63,154 | ) | |||
|
|
|
|
|
|
|
|||||||
| Net loss |
$ | (63,406 | ) | $ | (1,295 | ) | $ | (62,111 | ) | |||
|
|
|
|
|
|
|
|||||||
| Adjusted EBITDA |
$ | (30,859 | ) | $ | (978 | ) | $ | (29,881 | ) | |||
|
|
|
|
|
|
|
|||||||
Consolidated revenue for the three months ended March 31, 2017 increased by $179.1 million to $180.1 million compared to $1.0 million for the three months ended March 31, 2016. The increase in consolidated revenue was primarily attributable to our December 2016 acquisition of Baker Hughes North America Pressure Pumping Business, our April 2016 acquisition of Allied Oil and Gas, and hydraulic fracturing services related to the July 2016 Allied Asset Acquisition. In January 2017, we commenced an aggressive fleet deployment program in response to the increased demand for our hydraulic fracturing and cementing services resulting from improving market conditions. The weighted average number of hydraulic fracturing fleets servicing our clients during the first quarter of 2017 was 10, compared to none in the first quarter of 2016. Similarly, a weighted average of 82 cementers were servicing our clients during the first quarter of 2017, as compared to 49 cementers during the first quarter of 2016.
We reported a consolidated operating loss of $64.4 million for the three months ended March 31, 2017 as compared to a consolidated operating loss of $1.3 million for the three months ended March 31, 2016. Operating results were impacted by our acquisition of the Baker Hughes North America Pressure Pumping Business in December 2016, our acquisition of Allied Oil and Gas in April 2016, and hydraulic fracturing services related to the July 2016 Allied Asset Acquisition. Included in the results for the three months ended March 31, 2017 were training and recruitment costs for new employees of $6.4 million related to our fleet deployment program; expenses related to Sponsor-paid severance awards to employees of $5.0 million; fleet registration costs of $1.6 million; severance, retention, and milestone awards of $1.5 million; and $0.3 million of rebranding costs.
Operating Segments
Hydraulic Fracturing:
Hydraulic fracturing revenue for the three months ended March 31, 2017 increased by $131.7 million compared to the three months ended March 31, 2016. This increase was attributable to hydraulic fracturing services related to the July 2016 Allied Asset Acquisition, our December 2016 acquisition of the Baker Hughes North America Pressure Pumping Business and our fleet deployment program.
62
Table of Contents
Index to Financial Statements
Hydraulic fracturing operating loss increased $35.8 million for the three months ended March 31, 2017 compared to the three months ended March 31, 2016. This increase was attributable to hydraulic fracturing services related to the July 2016 Allied Asset Acquisition, our December 2016 acquisition of the Baker Hughes North America Pressure Pumping Business and our fleet deployment program. Included in the results for the three months ended March 31, 2017 were $4.2 million in training and recruitment costs for new employees and $1.3 million in fleet registration costs.
Cementing:
Cementing revenue for the three months ended March 31, 2017 increased by $47.4 million to $48.4 million compared to $1.0 million for the three months ended March 31, 2016. The increase in cementing revenue was attributable to our April 2016 acquisition of Allied Oil and Gas, our December 2016 acquisition of the Baker Hughes North America Pressure Pumping Business and our fleet deployment program.
Cementing operating loss for the three months ended March 31, 2017 increased by $17.3 million to $18.3 million compared to a loss of $1.0 million for the three months ended March 31, 2016. The increase in cementing operating loss was attributable to our April 2016 acquisition of Allied Oil and Gas, our December 2016 acquisition of the Baker Hughes North America Pressure Pumping Business and our fleet deployment program. Included in the results for the three months ended March 31, 2017 were $2.2 million in training and recruitment costs and $0.3 million in fleet registration costs.
Corporate and non-allocated costs
Corporate and non-allocated costs for the three months ended March 31, 2017 increased by $10.0 million to $10.3 million as compared to $0.3 million for the three months ended March 31, 2016. The increase was primarily attributable to the establishment of BJS LLC corporate functions early in 2017, $5.0 million related to Sponsor-paid severance and $1.5 million in severance, retention and milestone awards.
Note Regarding Non-GAAP Financial Measure
We believe the presentation of Adjusted EBITDA is useful to our investors because EBITDA is an appropriate measure of evaluating our operating performance and liquidity that reflects the resources available for strategic opportunities including, among others, investing in our business and strengthening our balance sheet. In particular, we believe Adjusted EBITDA helps our investors assess and understand our operating performance when comparing those results with previous and subsequent periods or forecasting performance for future periods, as management views the excluded items to be outside our normal operating results (i.e. not seen as typical in our results) or such items that do not impact cash. Further, Adjusted EBITDA is a widely used benchmark in the investment community.
Our presentation of Adjusted EBITDA should not be construed as an indication that our results will be unaffected by the items excluded from Adjusted EBITDA. Our computations of Adjusted EBITDA may not be identical to other similarly titled measures of other companies. The following table presents reconciliations of Adjusted EBITDA to net loss, our most directly comparable financial measure calculated and presented in accordance with GAAP.
63
Table of Contents
Index to Financial Statements
| Three Months Ended March 31, 2017 |
Three Months Ended March 31, 2016 |
$ Change | ||||||||||||||||||||||||||||||||||||||||||||||
| (in thousands) | Hydraulic Fracturing |
Cementing | Corporate | Total | Hydraulic Fracturing |
Cementing | Corporate | Total | Hydraulic Fracturing |
Cementing | Corporate | Total | ||||||||||||||||||||||||||||||||||||
| Net income (loss) |
$ | (35,262 | ) | $ | (18,010 | ) | $ | (10,134 | ) | $ | (63,406 | ) | $ | — | $ | (950 | ) | $ | (345 | ) | $ | (1,295 | ) | $ | (35,262 | ) | $ | (17,060 | ) | $ | (9,789 | ) | $ | (62,111 | ) | |||||||||||||
| Depreciation and amortization |
18,166 | 7,011 | 306 | 25,483 | — | 278 | 31 | 309 | 18,166 | 6,733 | 275 | 25,174 | ||||||||||||||||||||||||||||||||||||
| Interest expense, net |
— | — | (106 | ) | (106 | ) | — | — | 8 | 8 | — | — | (114 | ) | (114 | ) | ||||||||||||||||||||||||||||||||
| Income tax (benefit) expense |
(574 | ) | (272 | ) | (158 | ) | (1,004 | ) | — | — | — | — | (574 | ) | (272 | ) | (158 | ) | (1,004 | ) | ||||||||||||||||||||||||||||
|
|
|
|
|
|
|
|
|
|
|
|
|
|
|
|
|
|
|
|
|
|
|
|
|
|||||||||||||||||||||||||
| EBITDA |
$ | (17,670 | ) | $ | (11,271 | ) | $ | (10,092 | ) | $ | (39,033 | ) | $ | — | $ | (672 | ) | $ | (306 | ) | $ | (978 | ) | $ | (17,670 | ) | $ | (10,599 | ) | $ | (9,786 | ) | $ | (38,055 | ) | |||||||||||||
| Sponsor-paid severance(a) |
— | — | 5,000 | 5,000 | — | — | — | — | — | — | 5,000 | 5,000 | ||||||||||||||||||||||||||||||||||||
| Severance, retention and milestone bonuses |
— | — | 1,548 | 1,548 | — | — | — | — | — | — | 1,548 | 1,548 | ||||||||||||||||||||||||||||||||||||
| Fleet registration costs(b) |
1,301 | 325 | — | 1,626 | — | — | — | — | 1,301 | 325 | — | 1,626 | ||||||||||||||||||||||||||||||||||||
|
|
|
|
|
|
|
|
|
|
|
|
|
|
|
|
|
|
|
|
|
|
|
|
|
|||||||||||||||||||||||||
| Adjusted EBITDA |
$ | (16,369 | ) | $ | (10,946 | ) | $ | (3,544 | ) | $ | (30,859 | ) | $ | — | $ | (672 | ) | $ | (306 | ) | $ | (978 | ) | $ | (16,369 | ) | $ | (10,274 | ) | $ | (3,238 | ) | $ | (29,881 | ) | |||||||||||||
|
|
|
|
|
|
|
|
|
|
|
|
|
|
|
|
|
|
|
|
|
|
|
|
|
|||||||||||||||||||||||||
Notes:
| (a) | See first quarter 2017 Note 12 to condensed consolidated financial statements included elsewhere in this prospectus. |
| (b) | BJS LLC incurred $1.6 million in expense during the first quarter of 2017 to catch up on 2016 fleet registrations because these assets were idle. |
Adjusted EBITDA for the first quarter of 2017 decreased $29.9 million to $(30.9) million as compared to $(1.0) million for the first quarter of 2016. The changes were as follows:
Hydraulic Fracturing:
Hydraulic fracturing Adjusted EBITDA for the first quarter of 2017 was $(16.4) million as compared to zero the first quarter of 2016. This decrease was attributable to hydraulic fracturing services related to the July 2016 Allied Asset Acquisition and our December 2016 acquisition of the Baker Hughes North America Pressure Pumping Business and our fleet deployment program. Included in EBITDA for the first quarter of 2017 were $4.2 million in training and recruitment costs for new employees. Adjusted EBITDA for the first quarter of 2017 adds back $1.3 million in fleet registration costs.
Cementing:
Cementing Adjusted EBITDA for the first quarter of 2017 decreased $10.3 million to $(10.9) million as compared to the first quarter of 2016. This was attributable to our April 2016 acquisition of Allied Oil and Gas and our December 2016 acquisition of the Baker Hughes North America Pressure Pumping Business. Included in EBITDA for the first quarter of 2017 were $2.2 million in training and recruitment costs for new employees. Adjusted EBITDA for the first quarter of 2017 adds back $0.3 million in fleet registration costs.
Corporate:
Corporate Adjusted EBITDA decreased $3.2 million to $(3.5) million during the first quarter of 2017 as compared to the first quarter of 2016. First quarter 2017 EBITDA included costs related to the establishment of BJS LLC corporate functions. First quarter 2017 Adjusted EBITDA adds back $5.0 million related to Sponsor-paid severance and $1.5 million in severance, retention and milestone awards.
64
Table of Contents
Index to Financial Statements
Results of Operations of Our Predecessor
The following table sets forth our Predecessor’s selected operating data for the periods indicated (in thousands).
| Year ended December 31, 2016 |
Period from January 27, 2015 to December 31, 2015 |
$ Change | ||||||||||
| Revenue: |
||||||||||||
| Hydraulic fracturing |
$ | 2,577 | $ | — | $ | 2,577 | ||||||
| Cementing |
34,408 | 1,212 | 33,196 | |||||||||
|
|
|
|
|
|
|
|||||||
| Consolidated |
$ | 36,985 | $ | 1,212 | $ | 35,773 | ||||||
|
|
|
|
|
|
|
|||||||
| Operating income (loss): |
||||||||||||
| Hydraulic fracturing |
$ | (12,320 | ) | $ | — | $ | (12,320 | ) | ||||
| Cementing |
(14,602 | ) | (3,696 | ) | (10,906 | ) | ||||||
| Corporate and non-allocated (costs)/gains |
24,923 | (158 | ) | 25,081 | ||||||||
|
|
|
|
|
|
|
|||||||
| Consolidated |
$ | (1,999 | ) | $ | (3,854 | ) | $ | 1,855 | ||||
|
|
|
|
|
|
|
|||||||
| Net loss |
$ | (2,279 | ) | $ | (3,872 | ) | $ | 1,593 | ||||
|
|
|
|
|
|
|
|||||||
| Adjusted EBITDA |
$ | (19,659 | ) | $ | (3,297 | ) | $ | (16,362 | ) | |||
|
|
|
|
|
|
|
|||||||
Consolidated revenue for the year ended December 31, 2016 increased $35.8 million to $37.0 million compared to the period from January 27, 2015 (Date of Inception) through December 31, 2015. The increase in consolidated revenue was primarily attributable to our acquisition of Allied Oil and Gas in April 2016 which represented $27.2 million of the increase, a full year of results from ALTCem which did not start revenue generating activities until September 2015, which represented $6.0 million of the increase, and the commencement of hydraulic fracturing services following the July 2016 acquisition of hydraulic fracturing assets from Bayou Well Services, LLC (the “Allied Asset Acquisition”) which represented $2.6 million of the increase.
We reported a consolidated operating loss of $2.0 million for the year ended December 31, 2016, as compared to an operating loss of $3.9 million for the period from January 27, 2015 (Date of Inception) through December 31, 2015. Operating results were positively impacted by a bargain purchase gain of $34.2 million during the year ended December 31, 2016 related to the acquisition of Allied Oil and Gas (see the Notes to the consolidated financial statements of BJS LLC included elsewhere in this prospectus). Also impacting consolidated operating results was the commencement of hydraulic fracturing activities as a result of the Allied Asset Acquisition along with a full year of cementing activities associated with ALTCem during the year ended December 31, 2016 as compared to four months of activities during the period from January 27, 2015 (Date of Inception) through December 31, 2015. See Note 3 to the audited consolidated financial statements of BJS LLC for further discussion related to the bargain purchase gain associated with the acquisition of Allied Oil and Gas.
Operating Segments
Hydraulic Fracturing:
Hydraulic fracturing revenue for the year ended December 31, 2016 increased $2.6 million as compared to the period from January 27, 2015 (Date of Inception) through December 31, 2015. All of this increase was attributable to the commencement of hydraulic fracturing services following the July 2016 acquisition of pressure pumping and hydraulic fracturing assets from the Allied Asset Acquisition.
65
Table of Contents
Index to Financial Statements
Hydraulic fracturing operating loss for the year ended December 31, 2016 increased $12.3 million as compared to the period from January 27, 2015 (Date of Inception) through December 31, 2015. All of this increase was attributable to the commencement of hydraulic fracturing services following the July 2016 acquisition of pressure pumping and hydraulic fracturing assets from the Allied Asset Acquisition.
Cementing:
Cementing revenue for the year ended December 31, 2016 increased $33.2 million to $34.4 million as compared to the period from January 27, 2015 (Date of Inception) through December 31, 2015. The increase was primarily attributable to our acquisition of Allied Oil and Gas in April 2016, which represented $27.2 million of the increase. The remaining increase of $6.0 million was primarily attributable to approximately four months of activity at ALTCem from January 27, 2015 (date of inception) through December 31, 2015 as ALTCem did not start revenue generating activities until September 2015, as compared to twelve months of activity in 2016.
Cementing operating loss for the year ended December 31, 2016 increased by $10.9 million to $14.6 million as compared to the period from January 27, 2015 (Date of Inception) through December 31, 2015. The increase was primarily attributable to our acquisition of Allied Oil and Gas in April 2016, which represented $8.2 million of the increase. The remaining increase of $2.7 million was primarily attributable to approximately four months of activity at ALTCem from January 27, 2015 (date of inception) through December 31, 2015 as ALTCem did not start revenue generating activities until September 2015, as compared to twelve months of activity in 2016.
Other Items Impacting Income (Loss)
Operating income associated with corporate and non-allocated activity increased to $24.9 million for the year ended December 31, 2016 compared to a loss of $0.2 million for the period from January 27, 2015 (Date of Inception) through December 31, 2015, primarily due to the $34.2 million bargain purchase gain associated with the acquisition of the business of Allied Oil and Gas offset by primary transaction cost of $7.1 million and professional fees of $1.5 million.
Net loss included $0.3 million and $0.0 million in non-operating expenses, net for the year ended December 31, 2016 and the period January 27, 2015 (Date of Inception) to December 31, 2015, respectively. Non-operating expenses in 2016 consisted primarily of interest expense and other costs.
Note Regarding Non-GAAP Financial Measure
We believe the presentation of Adjusted EBITDA is useful to our investors because EBITDA is an appropriate measure of evaluating our operating performance and liquidity that reflects the resources available for strategic opportunities including, among others, investing in our business and strengthening our balance sheet. In particular, we believe Adjusted EBITDA helps our investors assess and understand our operating performance when comparing those results with previous and subsequent periods or forecasting performance for future periods, as management views the excluded items to be outside our normal operating results (i.e. not seen as typical in our results) or such items that do not impact cash. Further, Adjusted EBITDA is a widely used benchmark in the investment community. Our presentation of Adjusted EBITDA should not be construed as an indication that our results will be unaffected by the items excluded from Adjusted EBITDA. Our computations of Adjusted EBITDA may not be identical to other similarly titled measures of other companies. The following table presents reconciliations of Adjusted EBITDA to net income (loss), our most directly comparable financial measure calculated and presented in accordance with GAAP.
66
Table of Contents
Index to Financial Statements
| Year Ended December 31, 2016 |
Period from January 27, 2015 (Date of Inception) to December 31, 2015 |
$ Change | ||||||||||||||||||||||||||||||||||||||||||||||
| (in thousands) | Hydraulic Fracturing |
Cementing | Corporate | Total | Hydraulic Fracturing |
Cementing | Corporate | Total | Hydraulic Fracturing |
Cementing | Corporate | Total | ||||||||||||||||||||||||||||||||||||
| Net income (loss)(1) |
$ | (12,320 | ) | $ | (14,423 | ) | $ | 24,464 | $ | (2,279 | ) | $ | — | $ | (3,714 | ) | $ | (158 | ) | $ | (3,872 | ) | $ | (12,320 | ) | $ | (10,709 | ) | 24,622 | 1,593 | ||||||||||||||||||
| Depreciation and amortization |
3,861 | 5,537 | — | 9,398 | — | 417 | — | 417 | 3,861 | 5,120 |
|
— |
|
8,981 | ||||||||||||||||||||||||||||||||||
| Acquisition-related transaction costs |
— | — | |
— 7,119 |
|
7,119 | — | — | — | — | — | — | 7,119 | 7,119 | ||||||||||||||||||||||||||||||||||
| Bargain purchase gain |
— | — | (34,180 | ) | (34,180 | ) | — | — | — | — | — | — | (34,180 | ) | (34,180 | ) | ||||||||||||||||||||||||||||||||
| Interest expense, net |
— | — | 97 | 97 | — | — | 18 | 18 | — | — | 79 | 79 | ||||||||||||||||||||||||||||||||||||
|
|
|
|
|
|
|
|
|
|
|
|
|
|
|
|
|
|
|
|
|
|
|
|
|
|||||||||||||||||||||||||
| Adjusted EBITDA |
$ | (8,459 | ) | $ | (8,886 | ) | $ | (2,500 | ) | $ | (19,845 | ) | $ | — | $ | (3,297 | ) | $ | (140 | ) | $ | (3,437 | ) | $ | (8,459 | ) | $ | (5,589 | ) | $ | (2,360 | ) | (16,408 | ) | ||||||||||||||
|
|
|
|
|
|
|
|
|
|
|
|
|
|
|
|
|
|
|
|
|
|
|
|
|
|||||||||||||||||||||||||
| (1) | Included in net income (loss) are equity-based compensation costs of $0.1 million and $0.2 million for the period from January 27, 2015 to December 31, 2015 and the year ended December 31, 2016, respectively. |
Adjusted EBITDA for 2016 decreased $16.4 million to $(19.8) million as compared to $(3.4) million for the period January 27, 2015 (Date of Inception) to December 31, 2015. The changes were as follows:
Hydraulic Fracturing:
Hydraulic fracturing Adjusted EBITDA for the year ended December 31, 2016 decreased $8.5 million as compared to the period from January 27, 2015 (Date of Inception) through December 31, 2015. All of this increase was attributable to the commencement of hydraulic fracturing services following the July 2016 acquisition of pressure pumping and hydraulic fracturing assets from the Allied Asset Acquisition.
Cementing:
Cementing Adjusted EBITDA for the year ended December 31, 2016 decreased by $5.6 million to $8.9 million as compared to the period from January 27, 2015 (Date of Inception) through December 31, 2015. The decrease was primarily attributable to our acquisition of Allied Oil and Gas in April 2016, which represented $4.5 million of the decrease. The remaining decrease of $1.2 million was primarily attributable to approximately four months of activity at ALTCem from January 27, 2015 (date of inception) through December 31, 2015 as ALTCem did not start revenue generating activities until September 2015, as compared to twelve months of activity in 2016.
Corporate:
Corporate Adjusted EBITDA for the year ended December 31, 2016 of $(2.5) million consisted primary of professional services fees and title insurance cost.
Results of Operations for the Baker Hughes North America Land Pressure Pumping Business
The following table sets forth Baker Hughes North America Onshore Pressure Pumping (“BH N.A. PP”) abbreviated financial statements for the periods indicated.
67
Table of Contents
Index to Financial Statements
2016 Compared to 2015
| ($ in thousands) | Period from January 1, 2016 to December 30, 2016 |
Year Ended December 31, 2015 |
$ Change | |||||||||
| Revenue |
$ | 231,037 | $ | 1,271,975 | $ | (1,040,938 | ) | |||||
| Direct operating expenses |
515,493 | 1,896,827 | (1,381,334 | ) | ||||||||
|
|
|
|
|
|
|
|||||||
| Gross Profit (Loss) |
(284,456 | ) | (624,852 | ) | 340,396 | |||||||
|
|
|
|
|
|
|
|||||||
| Selling, general and administrative expenses |
(628 | ) | 11,963 | (12,591 | ) | |||||||
|
|
|
|
|
|
|
|||||||
| Revenue in Excess (Deficit) of Direct Operating Expenses |
$ | (283,828 | ) | $ | (636,815 | ) | $ | 352,987 | ||||
|
|
|
|
|
|
|
|||||||
Revenue:
Revenue for the period January 1, 2016 through December 30, 2016 decreased $1,040.9 million to $231.0 million compared to 2015. The decrease in revenues was driven by a combination of market activity and pricing, as well as reduced market participation in 2016. North America land rig activity declined 46% from 2015 to 2016, and pricing for pressure pumping services declined by approximately 15%. In response to the deterioration of market activity and pricing, BHGE reduced its participation in all but a select few North America land markets in 2016, as evidenced by a 68% decline in the average number of hydraulic fracturing fleets it deployed between 2015 and 2016.
Direct Operating Expenses:
Direct operating expenses for the period January 1, 2016 through December 30, 2016 decreased $1,381.3 million to $515.5 million as compared to 2015. The decrease was directly related to the significant decline in sales volumes experienced during these periods. Product cost of goods sold declined by $546.5 million on lower revenues, compensation costs declined by $278.7 million due to lower headcount because of workforce reductions, depreciation and amortization expense decreased by $217.3 million as a result of asset impairments recorded in both the period from January 1, 2016 through December 30, 2016 and in 2015, and repair and maintenance expenditures declined by $137.9 million.
Selling, General and Administrative Expenses:
Selling, general and administration expenses for the period January 1, 2016 through December 30, 2016 decreased $12.6 million to $(0.6) million as compared to 2015. The decrease was due to lower headcount for support employees due to workforce reductions and other cost-saving measures. Selling, general and administrative expense in 2016 was a net credit to expense due to $9.4 million of other income, (primarily gains on asset sales and insurance proceeds,) which exceeded the other elements of functional Selling, general and administrative expenses.
2015 Compared to 2014
| Year Ended December 31, | ||||||||||||
| ($ in thousands) | 2015 | 2014 | $ Change | |||||||||
| Revenue |
$ | 1,271,975 | $ | 4,296,126 | $ | (3,024,151 | ) | |||||
| Direct operating expenses |
1,896,827 | 4,065,317 | (2,168,490 | ) | ||||||||
|
|
|
|
|
|
|
|||||||
| Gross Profit (Loss) |
(624,852 | ) | 230,809 | (855,661 | ) | |||||||
|
|
|
|
|
|
|
|||||||
| Selling, general and administrative expenses |
11,963 | 43,457 | (31,494 | ) | ||||||||
|
|
|
|
|
|
|
|||||||
| Revenues in Excess (Deficit) of Direct Operating Expenses |
$ | (636,815 | ) | $ | 187,352 | $ | (824,167 | ) | ||||
|
|
|
|
|
|
|
|||||||
68
Table of Contents
Index to Financial Statements
Revenue:
Revenue for 2015 decreased $3,024.2 million to $1,272.0 million compared to 2014. The decrease was driven by the sharp downturn in oilfield service activity as commodity prices declined significantly during the year, with the North America land rig count falling 48% from 2014 to 2015. Further, pricing for pumping services declined approximately 30% between 2014 and 2015, reflecting the downturn in activity and over-supply of pumping capacity in the market. Market share losses were also incurred during this period.
Direct Operating Expenses:
Direct operating expenses for 2015 decreased $2,168.5 million to $1,896.8 million as compared to 2014. The decrease was directly related to the significant decline in sales volumes experienced during these periods. Product cost of goods sold declined $1,144.4 million on lower revenues, compensation costs decreased $378.7 million due to lower headcount because of workforce reductions, and repair and maintenance expenditures declined by $287.2 million.
Selling, General and Administrative Expenses:
Selling, general and administration expenses for 2015 decreased $31.5 million to $12.0 million as compared to 2014. The decrease was due to lower headcount for support employees due to workforce reductions and other cost-saving measures.
Note Regarding Non-GAAP Financial Measure
Adjusted EBITDA is not a financial measure determined in accordance with GAAP. We define Adjusted EBITDA for BH N.A. PP as revenues in excess (deficit) of direct operating expenses before depreciation and amortization.
We believe Adjusted EBITDA is a useful performance measure because it allows for an effective evaluation of our operating performance when compared to our peers, without regard to our noncash depreciation and amortization charges. We exclude depreciation and amortization from revenues in excess (deficit) of direct operating expenses in arriving at Adjusted EBITDA because these amounts can vary substantially within our industry depending upon accounting methods and book values of assets methods or capital structure. We exclude the items listed above from revenues in excess (deficit) of direct operating expenses in arriving at Adjusted EBITDA because these amounts can vary substantially within our industry depending upon accounting methods and book values of assets. Adjusted EBITDA should not be considered as an alternative to, or more meaningful than, revenues in excess (deficit) of direct operating expenses determined in accordance with GAAP. Certain items excluded from Adjusted EBITDA are significant components in understanding and assessing a company’s financial performance, such as our historic costs of depreciable and intangible assets which are reflected in Adjusted EBITDA. Our presentation of Adjusted EBITDA should not be construed as an indication that our results will be unaffected by the items excluded from Adjusted EBITDA. Our computations of Adjusted EBITDA may not be identical to other similarly titled measures of other companies. The following table presents reconciliations of Adjusted EBITDA to revenues in excess (deficit) of direct operating expenses, our most directly comparable financial measure calculated and presented in accordance with GAAP.
69
Table of Contents
Index to Financial Statements
| $ Change | ||||||||||||||||||||
| (in thousands) | Period from January 1, 2016 to December 30, 2016 |
Year Ended December 31, 2015 |
Year Ended December 31, 2014 |
2016 vs. 2015 |
2015 vs. 2014 |
|||||||||||||||
| Revenues in excess (deficit) of direct operating expenses |
$ | (283,828 | ) | $ | (636,815 | ) | $ | 187,352 | $ | 352,987 | $ | (824,167 | ) | |||||||
| Depreciation and amortization |
63,159 | 281,676 | 317,929 | (218,517 | ) | (36,253 | ) | |||||||||||||
|
|
|
|
|
|
|
|
|
|
|
|||||||||||
| Adjusted EBITDA |
$ | (220,669 | ) | $ | (355,139 | ) | $ | 505,281 | $ | 134,470 | $ | (860,420 | ) | |||||||
|
|
|
|
|
|
|
|
|
|
|
|||||||||||
2016 Compared to 2015
Adjusted EBITDA for 2016 increased $134.5 million to $(220.7) million from $(355.1) million. The increase was driven by North America land rig activity declining 46% from 2015 to 2016 in addition to price declines and a reduction in participation in all but a select few North America land markets resulting in a decrease in revenue of $1,040.9 million. This decrease in revenue was primarily offset by a decrease in direct operating expenses including a decrease in product cost of goods sold of $546.5 million, a decrease in compensation costs of $278.7 million, and a decrease in repair and maintenance expenditures of $137.9 million.
2015 Compared to 2014
Adjusted EBITDA for 2015 decreased $860.4 million to $(355.1) million from $505.3 million. The decrease was driven by the sharp downturn in oilfield service activity as commodity prices declined significantly during the year, with the North America land rig count falling 48% from 2014 to 2015 in addition to price declines and loss of market share resulting in a decrease in revenues of $3,024 million. This decrease in revenue was primarily offset by a decrease in direct operating expenses including a decrease in product cost of goods sold of $1,144.4 million on lower revenues, a decrease in compensation costs of $378.7 million due to lower headcount because of workforce reductions, and a decrease in repair and maintenance expenditures of $287.2 million.
Liquidity and Capital Resources
Since our inception on January 27, 2015 and prior to the closing of the Contribution Agreement on December 30, 2016, our primary sources of liquidity were cash on hand and capital contributions from our owners. As a result of the Contribution Agreement, at December 31, 2016, we had cash and cash equivalents on hand of $175.0 million and only a minor amount of debt on our consolidated balance sheet. As of June 30, 2017, we had cash and cash equivalents of $68.1 million. Following this offering, we expect our primary sources of liquidity to be cash on hand, cash generated from operations, proceeds from this offering and borrowings under our ABL credit facility. We strive to maintain financial flexibility and proactively monitor potential capital sources to meet our investment and target liquidity requirements and to permit us to manage the cyclicality associated with our business.
Sources of Cash
Sources of cash in the year ended December 31, 2016 arose primarily from $430.5 million in member contributions, including the $175.0 million included in the consolidated balance sheet at December 31, 2016.
In connection with the consummation of this offering, we expect to join the existing $400.0 million senior secured asset-based loan facility (our “ABL credit facility”) as a co-borrower. As of June 30,
70
Table of Contents
Index to Financial Statements
2017, there was a $50.0 million balance outstanding under the ABL credit facility. Please read “—ABL Credit Facility.”
Uses of Cash
During the first quarter of 2017, cash used in operating activities totaled $15.3 million, primarily related to working capital activities from the increased demand for our hydraulic fracturing and cementing services as a result of improving market conditions. We incurred $42.6 million in capital expenditures, of which $19.9 million was paid during the quarter. First quarter 2017 capital expenditures related to our fleet redeployment program were $37.9 million.
Exclusive of the Contribution Agreement that closed on December 30, 2016, uses of cash in 2016 included $19.7 million in net cash used in operating activities, primarily related to working capital needs, capital expenditures of $65.6 million (of which $44.4 million and $5.7 million related to the acquisition and refurbishment, respectively, of hydraulic fracturing assets and $15.5 million related to the acquisition and refurbishment of cementing assets), the cost of the Allied Oil and Gas acquisition of $20.9 million and cash consumed in operating activities of $20.0 million. The closing of the December 30, 2016 transaction resulted in a cash payment of $150.0 million for the acquisition of the Baker Hughes North America Land Pressure Pumping business.
We plan to make capital expenditures of approximately $180.0 million in 2017. Approximately $135.0 million of this amount will be used to reactivate 25 hydraulic fracturing fleets and 62 cementers, allowing us to have a deployed hydraulic fracturing fleet of 31 fleets (representing approximately 1.6 million HHP) and 140 cementers at December 31, 2017. The remaining amount of capital expenditures totaling $45.0 million will be used primarily for maintenance capital, purchase of certain equipment to complement our fleets, facility improvements and for the implementation of an enterprise resource planning system.
Beginning in 2018, we expect BJS LLC will begin making quarterly cash distributions to holders of its units approximating 45% of BJS LLC’s estimated taxable income, as required under the BJS LLC Agreement.
We expect the proceeds from this offering to be approximately $ million, which will be contributed to BJS LLC. See “Use of Proceeds.”
We believe that our cash on hand, operating cash flow and available borrowings under our ABL credit facility will be sufficient to fund our operations for at least the next twelve months.
ABL Credit Facility
In connection with the consummation of this offering, we expect to join the existing senior secured asset-based loan facility as a co-borrower. The ABL credit facility includes a $400.0 million senior secured revolving credit facility, subject to borrowing base limitations. The ABL credit facility includes a sublimit for letters of credit of $75.0 million, which may be issued in U.S. dollars or approved foreign currencies, and a sublimit for swing line loans of $40.0 million. These sublimits for letters of credit and swing line loans are part of, and not in addition to, the $400.0 million aggregate commitments for the ABL credit facility. In addition, the ABL credit facility permits us to request increases, on an uncommitted basis, to the amount potentially available under the ABL credit facility by up to an additional $200.0 million, subject to borrowing base limitations and other customary conditions to effectiveness.
The maximum amount available to borrow under the ABL credit facility will be determined in part by the amount of eligible inventory, eligible billed and unbilled accounts receivable and unrestricted
71
Table of Contents
Index to Financial Statements
cash, in each case, subject to limitations, exclusions, conditions and reserves. The borrowing base will be deemed to be $175.0 million at closing and adjusted within a range between $135.0 million and $175.0 million during a deemed borrowing base period, with the adjustments resulting from changes in unrestricted cash of the loan parties. Unless certain specified deliveries are made earlier, the deemed borrowing base period will last until August 28, 2017 (subject to a one time extension of no more than 30 days thereafter). After the deemed borrowing base period terminates, the borrowing base shall be calculated as set forth in the definitive documentation by reference to eligible inventory, eligible billed and unbilled accounts receivable and unrestricted cash, in each case, subject to limitations, exclusions, conditions and reserves.
Loans under the ABL credit facility bear interest, at our option, at either a base rate or at LIBOR, plus an applicable margin which ranges from 0.25% to 0.75% per annum for base rate loans and 1.25% to 1.75% per annum for LIBOR loans according to the average excess availability under the ABL credit facility. The unused portion of commitments under the ABL credit facility is subject to a commitment fee equal to a percentage varying from 0.250% to 0.375% per annum. We are also required to pay customary letter of credit fees and certain other fees.
The ABL credit facility is secured by a first-priority lien on our accounts receivable, inventory and related assets, along with cash and cash equivalents, deposit accounts, securities accounts, commodities accounts, certain other assets and proceeds thereof, in each case, subject to customary exclusions and limitations. As of the completion of this offering, the ABL credit facility is guaranteed by BJ Services Holdings Canada, ULC and BJ Allied Newco, LLC, each of which are direct or indirect wholly-owned subsidiaries. Following our joinder to the ABL credit facility in connection with the offering, the borrowers will be BJS LLC and the Company.
As of June 30, 2017, there was $50.0 million principal amount of borrowings outstanding under the ABL credit facility, initially bearing interest at a rate of approximately 2.71% per annum. We may repay any amounts borrowed prior to the maturity date without any premium or penalty other than customary LIBOR breakage costs.
In addition, the ABL credit facility contains limitations on our ability to, among other things, incur indebtedness and liens, make distributions, investments, acquisitions and dividends, sell assets, engage in mergers, consolidations, liquidations and certain transactions with affiliates, enter into burdensome agreements, change our lines of business, make certain changes to organizational documents, change our fiscal year and engage in certain swap contracts, in each case, subject to thresholds and carve-outs expected to be specified in the definitive documentation. The ABL credit facility contains customary events of default, including, without limitation, for failure to make payments under the ABL credit facility, breaches of covenants or representations and warranties, cross-default to other material indebtedness, material unstayed judgments, certain events related to bankruptcy or insolvency proceedings, certain ERISA events, certain events related to Canadian pensions, certain losses related to collateral, failure of guarantees or security, and change of control, in each case, subject to grace periods, thresholds and carve-outs specified in the definitive documentation. The ABL credit facility has a springing financial covenant requiring us to test and maintain a fixed charge coverage ratio of not less than 1.00 to 1.00 during periods where excess availability under the ABL credit facility falls below a certain liquidity threshold.
The obligations under our ABL credit facility mature on May 30, 2022, which may be extended for all or a portion of the principal amounts of the ABL credit facility, subject to terms and conditions set forth in the definitive documentation.
The foregoing description of the ABL credit facility does not purport to be complete and is qualified in its entirety by reference to the full text of the ABL credit facility, which has been filed as an exhibit to the registration statement of which this prospectus forms a part.
72
Table of Contents
Index to Financial Statements
Contractual and Commercial Commitments
The following table summarizes our contractual obligations and commercial commitments as of December 31, 2016 (in thousands):
| Payments Due by Period | ||||||||||||||||||||
| Total | Less Than 1 Year |
Years 2-3 | Years 4-5 |
More Than 5 Years |
||||||||||||||||
| Contractual obligations: |
||||||||||||||||||||
| Operating lease obligations |
$ | 7,427 | $ | 1,640 | $ | 2,385 | $ | 1,720 | $ | 1,682 | ||||||||||
| Capital lease obligations |
1,520 | 166 | 342 | 356 | 656 | |||||||||||||||
|
|
|
|
|
|
|
|
|
|
|
|||||||||||
| Total |
$ | 8,947 | $ | 1,806 | $ | 2,727 | $ | 2,076 | $ | 2,338 | ||||||||||
|
|
|
|
|
|
|
|
|
|
|
|||||||||||
Internal Controls and Procedures
We identified a material weakness in our internal control over financial reporting as of December 31, 2016. A material weakness is a deficiency, or a combination of deficiencies, in internal control over financial reporting such that there is a reasonable possibility that a material misstatement of our annual or interim financial statements will not be prevented or detected on a timely basis. The material weakness related to the lack of sufficient qualified accounting personnel, which led to inadequate segregation of duties related to our financial reporting processes. Specifically, there was inadequate segregation of duties related to journal entries, cash disbursements, account reconciliations and period end financial reporting.
We are in the process of implementing measures designed to improve our internal control over financial reporting and remediate the control deficiencies that led to our material weakness, including actively seeking to recruit additional finance and accounting personnel, are evaluating our personnel in all key finance and accounting positions and intend to employ additional finance and accounting personnel prior to the completion of this offering. We can give no assurance that these actions will remediate this deficiency in internal control or that additional material weaknesses or significant deficiencies in our internal control over financial reporting will not be identified in the future. Additionally, this material weakness could result in misstatements to our financial statements or disclosures that would result in material misstatements to our annual or interim consolidated financial statements that would not be prevented or detected.
We are not currently required to comply with the SEC’s rules implementing Section 404 of the Sarbanes Oxley Act of 2002, and are therefore not required in connection with this offering to make a formal assessment of the effectiveness of our internal control over financial reporting for that purpose. Upon becoming a public company, we will be required to comply with the SEC’s rules implementing Section 302 Sarbanes-Oxley, which will require our management to certify financial and other information in our quarterly and annual reports. Though we will be required to disclose changes made in our internal controls and procedures on a quarterly basis, we will not be required to make our first annual assessment of our internal control over financial reporting pursuant to Section 404 until the year following our first annual report required to be filed with the SEC. We will not be required to have our independent registered public accounting firm attest to the effectiveness of our internal control over financial reporting under Section 404 until our first annual report subsequent to our ceasing to be an “emerging growth company” within the meaning of Section 2(a)(19) of the Securities Act.
Quantitative and Qualitative Disclosure about Market Risks
The demand, pricing and terms for oil and natural gas services we provide are largely dependent upon the level of activity for the U.S. oil and natural gas industry. Industry conditions are influenced by
73
Table of Contents
Index to Financial Statements
numerous factors over which we have no control, including, but not limited to: the supply of and demand for oil and natural gas; the level of prices, and expectations about future prices of oil and natural gas; the cost of exploring for, developing, producing and delivering oil and natural gas; the expected rates of declining current production; the discovery rates of new oil and natural gas reserves; available pipeline and other transportation capacity; weather conditions; domestic and worldwide economic conditions; political instability in oil-producing countries; environmental regulations; technical advances affecting energy consumption; the price and availability of alternative fuels; the ability of oil and natural gas producers to raise equity capital and debt financing; and merger and divestiture activity among oil and natural gas producers.
The level of activity in the U.S. oil and natural gas exploration and production industry is volatile. Expected trends in oil and natural gas production activities may not continue and demand for our services may not reflect the level of activity in the industry. Any prolonged substantial reduction in oil and natural gas prices would likely affect oil and natural gas production levels and therefore affect demand for our services. A material decline in oil and natural gas prices or U.S. activity levels could have a material adverse effect on our business, financial condition, results of operations and cash flows. Recently, demand for our services has been strong and we are continuing our past practice of committing our equipment on a short-term or day-to-day basis.
Inflation
Inflation in the United States has been relatively low in recent years and did not have a material impact on our results of operations for the periods indicated. Although the impact of inflation has been insignificant in recent years, it is still a factor in the United States economy and we tend to experience inflationary pressure on the cost of oilfield services and equipment as increasing oil and natural gas prices increase drilling activity in our areas of operations.
Foreign Currency
We operate in the U.S. and Canadian markets and, as a result, our primary exposure to fluctuations in currency exchange rates relates to fluctuations between the U.S. dollar and the Canadian dollar. In Canada, the effects of currency fluctuations are largely mitigated because local expenses of such operations are also generally denominated in the local currency. However, there may be instances in which costs and revenue will not be matched with respect to currency denomination and we may experience economic loss and a negative impact on earnings or net assets solely as a result of foreign currency exchange rate fluctuations. We do not currently hedge our exposure to changes in foreign exchange rates. See “Risk Factors—Revenue generated and expenses incurred that are denominated in the Canadian dollar could be negatively impacted by currency fluctuations.”
Critical Accounting Estimates
The preparation of consolidated financial statements requires the use of judgments and estimates. Our critical accounting estimates are described below to provide a better understanding of how we develop our assumptions and judgments about future events and related estimations and how they can impact our consolidated financial statements. A critical accounting estimate is one that requires our most difficult, subjective or complex judgments and assessments and is fundamental to our results of operations. We identified our most critical accounting estimates to be:
| • | valuations of long-lived assets, including intangible assets; |
| • | purchase price allocation for acquired businesses; |
74
Table of Contents
Index to Financial Statements
| • | allowance for bad debts; and |
| • | equity-based compensation. |
We base our estimates on historical experience and on various other assumptions we believe to be reasonable according to the current facts and circumstances, the results of which form the basis for making judgments about the carrying values of assets and liabilities that are not readily apparent from other sources. We believe the following are the critical accounting estimates used in the preparation of our consolidated financial statements, as well as the significant estimates and judgments affecting the application of these estimates. This discussion and analysis should be read in conjunction with our consolidated financial statements and related notes included in this report.
Value of long-lived assets, including intangible assets. We carry a variety of long-lived assets on our consolidated balance sheet including property and equipment and intangible assets. We conduct impairment tests on long-lived assets whenever events or changes in circumstances indicate that the carrying value may not be recoverable. Impairment is the condition that exists when the carrying amount of a long-lived asset exceeds its fair value, and any impairment charge that we record reduces our earnings. We review the carrying value of these assets based upon estimated future cash flows while taking into consideration assumptions and estimates including the future use of the asset, remaining useful life of the asset and service potential of the asset.
Acquisition-purchase price allocation. We allocate the purchase price of an acquired business to its identifiable assets and liabilities based on estimated fair values. We use all available information to estimate fair values, including quoted market prices, the carrying value of acquired assets and widely accepted valuation techniques such as discounted cash flows. We engage third-party appraisal firms to assist in fair value determination of inventories, identifiable intangible assets and any other significant assets or liabilities when appropriate. The judgments made in determining the estimated fair value assigned to each class of assets acquired and liabilities assumed, as well as asset lives, can materially impact our results of operations.
Allowance for bad debts. We evaluate our accounts receivable through a continuous process of assessing our portfolio on an individual client and overall basis. This process consists of a thorough review of historical collection experience, current aging status and the financial condition of our clients. We also consider the economic environment of our clients, both from a marketplace and geographic perspective, in evaluating the need for an allowance. Based on our review of these factors, we establish or adjust allowances for specific clients and the accounts receivable portfolio as a whole. This process involves a high degree of judgment and estimation, and may involve significant dollar amounts. Accordingly, our results of operations can be affected by adjustments to the allowance due to actual write-offs that differ from estimated amounts.
Equity-based compensation. We record equity-based payments at fair value on the date of grant, and expense the value of these unit-based payments in compensation expense over the applicable vesting periods. Since we have not historically been publicly traded we do not have a listed price with which to calculate fair value. We estimate the fair value of our equity-based compensation using an option pricing model that includes certain assumptions, such as volatility, dividend yield and risk free interest rate. Changes in these assumptions could change the fair value of our unit based awards and associated compensation expense in our combined consolidated statements of operations.
Seasonality
Our results of operations have historically reflected seasonal tendencies relating to holiday seasons, inclement weather and the conclusion of our customers annual drilling and completion capital
75
Table of Contents
Index to Financial Statements
expenditure budgets. Our most notable declines occur in the first and fourth quarters of the year for the reasons described above. Additionally, some of the areas in which we have operations, including in Canada, North Dakota, Colorado, West Virginia, Pennsylvania and Ohio, are adversely affected by seasonal weather conditions, primarily in the winter and spring. During periods of heavy snow, ice or rain, we may be unable to move our equipment between locations, thereby reducing our ability to provide services and generate revenues. The exploration and production activities of our customers may also be affected during periods of such adverse weather conditions. Additionally, extended drought conditions in our operating regions could impact our ability or our customers’ ability to source sufficient water or increase the cost for such water. Our operations in Texas, California, Louisiana, Oklahoma and Kansas are not generally affected by seasonal weather conditions.
Off-Balance Sheet Arrangements
We currently have no off-balance sheet arrangements, other than operating leases for equipment used in the normal course of business. See “—Liquidity and Capital Resources—Contractual and Commercial Commitments.”
76
Table of Contents
Index to Financial Statements
Unless otherwise indicated, the information set forth under this “Industry Trends and Outlook,” including all statistical data and related forecasts, is derived from Spears & Associates’ “Hydraulic Fracturing Market 2005-2017” published in the fourth quarter 2016, “Hydraulic Fracturing Market 2006-2018” published in the first quarter 2017 and “Cementing” published in the second quarter of 2016, as well as Coras Oilfield Research’s fourth quarter 2016 data pack and “January 2017 Oilfield Trends” report. We believe that the third-party sources are reliable and that the third-party information included in this prospectus or in our estimates is accurate and complete. While we are not aware of any misstatements regarding the hydraulic fracturing or cementing industry data presented herein, estimates involve risks and uncertainties and are subject to change based on various factors, including those discussed under the heading “Risk Factors.”
Industry Trends and Outlook
Oil and Natural Gas Dynamics and the Role of North American Resource Plays
Advances in horizontal drilling and hydraulic fracturing in recent years have fundamentally altered the U.S. onshore oil and natural gas industry by allowing efficient and economic extraction of hydrocarbons from resource plays and positioning North America as a major supplier of oil and natural gas in a globally competitive energy market. Accordingly to EIA, from 2007 to 2015, U.S. unconventional oil production grew over 85% from approximately 5.1 million boepd to approximately 9.5 million boepd, comprising over half of the total U.S. crude production in 2015. The amplified activity is expected to continue into the future with an estimated 9.9 million boepd from the U.S. alone by 2022. In addition to oil production, U.S. natural gas production grew approximately 42% from 19.1 Tcfe in 2007 to 27.0 Tcfe in 2015. Canadian natural gas production also grew significantly over the period, increasing from 5.2 Bcf in 2009 to 8.2 Bcf in 2015. By 2020, U.S. production is expected to represent approximately 12% of global crude oil production, and with Canada, North American production is expected to represent approximately 18% of the world’s crude oil production by 2020.
Oil and natural gas prices dropped sharply in the second half of 2014 after the price of WTI crude oil reached a peak of $107.26 per Bbl and the price of Henry Hub natural gas reached a peak of $6.15 per MMBtu for the year. This decline, sustained by an oversupply of oil and natural gas, drove WTI crude oil prices to a low of $26.21 per Bbl in February 2016 and Henry Hub natural gas prices to a low of $1.64 per MMBtu in March 2016.
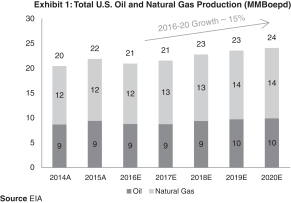
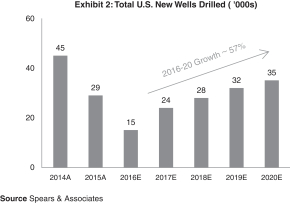
77
Table of Contents
Index to Financial Statements
E&P Capital Spending
Severe declines and sustained weakness and volatility in commodity prices over the course of 2015 and for most of 2016, and the consequent impact on the level of drilling, completion and production activity and capital expenditures, adversely affected the demand for oilfield services. Low prices forced E&P companies to reduce capital spending across all basins in 2016, reducing total wells drilled by approximately 76% from 2014. These factors caused completions spending in the U.S. to fall to $28 billion in 2016 from $102 billion in 2014, as shown in Exhibit 4, added to the inventory of drilled uncompleted wells (“DUCs”). The precipitous drop in demand for services and supply of equipment caused pricing for both hydraulic fracturing and cementing services to reach its lowest point in the first half of 2016 since hydraulic fracturing’s pricing peaked in fourth quarter 2014. Several service providers with high financial leverage began to close or file for bankruptcy protection in early first quarter 2015 and many are still laden with significant indebtedness.
In response to improvement in hydrocarbon prices, partially driven by OPEC actions in the latter half of 2016, E&P companies have increased their capital spending on drilling and completion services resulting in an improved demand for oilfield services. Exhibit 4 illustrates that the industry is projected to spend $52 billion on U.S. drilling and completions activity in 2017 as compared to $38 billion in 2016, with approximately 75% or $39 billion dedicated to completions. Early results of this spending can be seen in North American land rig activity, which has improved from a low of 416 rigs in May 2016 to 1,103 rigs as of June 30, 2017. The increased rig activity has added approximately 189 DUC wells per month through the first five months of 2017. The DUC inventory stood at 5,946 wells as of May 2017 according to EIA.
We believe that although most service providers will improve operational and financial performance in the near term, those that have maintained equipment and can maximize “throughput” or frac stages per day will benefit most. For hydraulic fracturing and cementing providers, this means the field-level familiarity with the operators, wireline crews and sand haulers necessary in order to streamline day-to-day operations and and perform more hydraulic fracturing stages per shift. In addition, we believe that multi-basin exposure, especially in basins with HHP capacity shortages, will be the key to taking advantage of potential pricing increases.
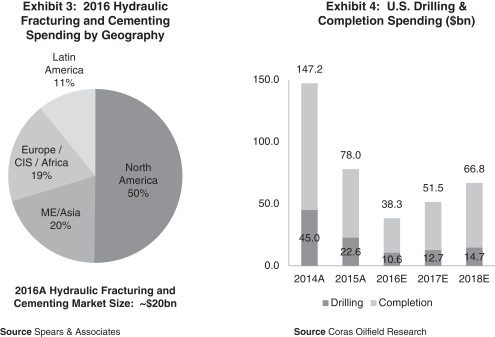
78
Table of Contents
Index to Financial Statements
North America has historically been, and we believe it will continue to be, the completion industry’s most important market by revenue, as shown in Exhibit 3. As long as macroeconomic conditions remain stable and commodity prices continue to improve, we expect higher levels of activity from North American E&P companies in 2017, which should result in continued operational and financial improvement in both hydraulic fracturing and cementing services.
The Hydraulic Fracturing Industry
Overview
Hydraulic fracturing produces fractures in a porous rock formations with low permeability that stimulate the flow of natural gas or oil, increasing the volumes that can be recovered. Wells may be drilled vertically thousands of feet below the surface and may include horizontal or directional sections also extending thousands of feet. To create a fracture, a mixture of water (approximately 90.0%), sand (approximately 9.5%) and chemicals (approximately 0.5%) is pumped at high pressure down a wellbore and into the target rock formation. The sand pumped with the mixture keeps the fractures open after the pressure is released, thus increasing the flow of hydrocarbons. To perform these hydraulic fracturing operations, service companies use a specialized set of equipment (a “fracturing fleet”). A fracturing fleet consists of hydraulic horsepower (“HHP”) fracturing pumps, blending equipment (to mix the water, chemicals and sand), a data van (equipped with equipment controls, data monitoring, and satellite communications) and various transport and storage equipment. North American sales for the hydraulic fracturing market were $8 billion in 2016, reduced from the industry’s peak of approximately $35 billion in 2014.
Key Market Trends and Outlook
Improvement in drilling economics from increased technological efficiency. Over the past decade, E&P companies have utilized advances in horizontal drilling and completion technologies to augment resource recovery and maximize returns. Technologies include geosteering techniques to allow better placement of the wellbore, multi-well pad development to allow drilling in multiple horizontal wellbores from the same pad and multi-stage hydraulic fracturing to allow more resource extraction per well. Through the development of these techniques, E&P companies have reduced the time to drill which has produced more favorable economics and in turn spurred an increase in overall drilling activity.
Given the expected returns reported by E&P companies for new well development activities, horizontal rig count is particularly indicative of the technological advancements in hydraulic fracturing. Horizontal land rigs in North America have increased from approximately 78%, as of December 31, 2014, to 87%, as of June 30, 2017, of the total North American land rig count. In addition to horizontal rig count increases, drilling efficiencies can be observed by the average days required to drill a well, which decreased from 28 days in 2014 to 21 days in 2016. More horizontal rigs and more drilling capacity per rig are shifting the proportion of spending on completion services, expected to be approximately 75% of total U.S. well spending in 2017, up from 66% in 2013.
Increased complexity and intensity of horizontal well completions. In addition to the improved rig efficiencies discussed above and shown in Exhibit 5, E&P companies are also improving the subsurface techniques and technologies used to maximize unconventional resource production. These improvements have targeted increasing the exposure of each wellbore to the reservoir by drilling longer horizontal lateral sections of the wellbore as shown in Exhibit 6. As wellbores have increased in length, the number of stages has also increased. From 2014 to 2016, as shown in Exhibit 7, the average stages per horizontal U.S. well has increased from an average of 21 to an average of approximately 29 stages per well. Further, E&P companies have improved production from
79
Table of Contents
Index to Financial Statements
each stage by applying increasing amounts of proppant. The aggregate effect of increased number of stages and the increasing amount of proppant in each stage is illustrated in Exhibit 8, as the amount of proppant used in each well grew to an average of approximately ten million pounds per well in 2016 from an average of six million in 2014.
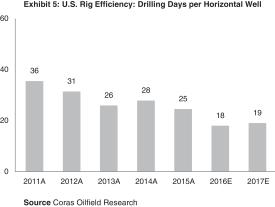
|
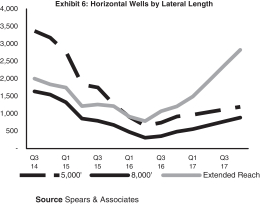
| |
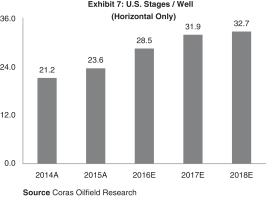
|
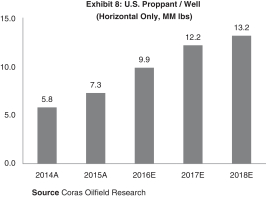
| |
Greater reliance on E&P and oilfield service company partnerships to optimize fracturing solutions. The focus on improving resource recovery amongst E&P companies is driving demand for engineered fracturing solutions that apply reservoir science to optimize completion job designs and real time measurements to deliver the lowest operating costs. Historically, operators have applied their own, less efficient techniques to fracturing design. However, the demand for complex, engineered hydraulic fracturing solutions and the capital investment required to provide these services has initiated a trend towards partnerships between E&P companies and hydraulic fracturing service providers who possess and are able to repeatedly apply these technologies.
Recent Trends in Hydraulic Horsepower Supply
According to Spears & Associates, between 2014 and 2016, annual revenue per active horsepower in North America declined from $1,847 to $586. During this downturn, many companies deferred capital expenditures on maintenance and replacement of pumps used in hydraulic fracturing and drilling applications. A substantial percentage of the installed base is more than five years old and operating beyond useful life according to industry best practices and safety standards. In addition, the potential cost to redeploy older, idle fleets has significantly increased creating an opportunity to capture market share as industry demand increases.
The hydraulic fracturing sector is expected to have among the highest growth rates of any subsector within the energy services and equipment space. Further, demand for hydraulic fracturing
80
Table of Contents
Index to Financial Statements
horsepower, which is a measure of frac pump demand, is expected to increase more than 48% from the fourth quarter of 2016 to the fourth quarter of 2018. We believe that our rigorous preventive maintenance program, in addition to scheduled and in-process fleet additions and upgrades, will position us to benefit from improving market dynamics.
Based on demand for new equipment exceeding active supply, we expect pricing improvements to benefit the broader oilfield services sector and the hydraulic fracturing industry in particular.
The Cementing Industry
Overview
Cementing operations are typically undertaken for several different reasons, both primary, which involves cementing operations during new well construction and accounts for approximately 85% of overall demand, and remedial, which is performed throughout the life of a well. Primary cementing is for the purpose of sealing the well annulus, or space between the rock and the steel casing “string” that has been run into the well. Remedial cementing is typically performed for the purpose of correcting problems associated with the primary cement job which could arise early in the life of a well or several years or decades after, or for operational requirements such as sealing a lost circulation zone, setting a plug into an existing well from which to push off with directional tools or plugging a well so that it may be abandoned.
Primary Cementing. During the course of drilling and constructing a well, the E&P company must run several thousand feet of steel casing pipe into a newly drilled section of hole to provide hole stability and to create a safe environment for future work on the well. During the drilling process, a string of casing will be lowered into the hole and cemented into place in order to protect the naturally occurring groundwater and to provide control over the fluids and gases that will be produced up the hole when the well is completed. Often influenced by regulatory requirements and responsible drilling practices, the typical well drilled on land in North America will have at least two strings of steel casing pipe and some may have as many as five. To perform the cementing job, liquid cement is pumped down the inside of the casing and displaced such that all the cement rises on the outside—or annulus—where it hardens to isolate the rock from the pipe and from the surface. Cement must be pumped down the inside of the casing and flushed out the bottom so that the cement will fill the annulus between the casing and the formation wall. Each one of these strings of casing gets a cement job and there are usually as many cement jobs as there are strings of casing. In primary cementing, units are typically dedicated to a drilling rig and revenues are driven by the amount of new wells it completes.
Remedial Cementing. During the life of a well, remedial cementing may be required to restore a well’s integrity or operating capability. Remedial operations consist of two categories: squeeze cementing and plug cementing. Squeeze cementing requires a special cement slurry to be pumped down a wellbore to an isolated squeeze target area and then requires pressure to be applied from surface to effectively force the slurry into all voids. The slurry is designed depending on the type of void. The void could be a split casing, micro-annuli (small crack), formation rock or another kind of cavity. Plug cementing prevents fluid flow in a wellbore or a mechanical barrier. Examples of the plug application include complete abandonment of a wellbore, a “kickoff” point to control the direction of drilling operations, lost circulation control during drilling operations or plugging a section of the wellbore for the purpose of controlling the inflow of water or unwanted gas production. Remedial “squeeze” cementing is driven by the overall producing well population.
In 2014, the North American cementing market generated $8.1 billion in revenue; however, due to the downturn in drilling and well construction activity, revenue fell to $2.1 billion in 2016. Due to the
81
Table of Contents
Index to Financial Statements
recent increase in drilling activity, this market is projected to grow to $2.9 billion in 2017. There were approximately 70 companies providing cementing services in the North American onshore market during 2016, although the top three companies, BJ Services (including the assets contributed to BJS LLC by BHOO in December 2016), Halliburton and Schlumberger, served approximately 71% of the market. The top service companies provide a differentiated product, tailored to the complexities and increasing intensity of North American horizontal drilling.
Key Market Trends and Outlook
E&P spending and horizontal rig efficiency are driving wells drilled. Projected rig counts and drilling activity directly drive cementing revenues. Cementers are expected to benefit from the amplified drilling activity as the total number of new wells drilled in the United States increases to 23,900 wells in 2017. However, beyond the revenue typically associated with new wells drilled, increasing rig efficiency has become an important driver of cementing revenues in all North American regions. In the field, most cementers are dedicated to support a specific rig and benefit if the assigned rig can improve the number of wells it can drill in a given period. Horizontal rig efficiency has improved from 10 to 18 wells drilled per rig between 2011 and 2016 and is expected to reach 20 wells drilled per rig in 2018, an 80% increase and a major source of additional cementing jobs.
Increases in wellbore lateral lengths. Recent improvements in drilling technologies have enabled E&P companies to drill longer lateral sections of horizontal well bores. Longer “laterals,” referring to the horizontal section of the wellbore drilled through the producing formation, typically lead to better economic results than shorter laterals. This is because a longer lateral is exposed to a longer section of producing formation while burdening the E&P company with the same amount of capital cost to set up the surface pad and to drill the vertical section of the wellbore (which is typically not produced in horizontal wells). The average lateral length of horizontal wells has increased from 5,768 feet in 2013 to more than 7,496 feet in 2016. Some E&P companies are currently drilling wells in excess of 10,000 feet in areas of the Bakken and the SCOOP/STACK. Furthermore, recent wells drilled in the Permian and Utica have extended beyond 13,000 and 15,000 feet, respectively. We believe that the trend toward longer laterals will continue due to the improved economics they provide to E&P companies. Further, longer, deeper well bores require not only more cement but also specialized blends and placement techniques designed to maintain integrity throughout the well. Average cementing revenues in 2016 reached $180,000 per well from just $50,000 per well in 2005.
Greater well complexity, depth and increasing requirement for “high spec” cementing. Along with the increase in volumes required by deeper horizontal and vertical drilling, the complexity of cementing technology is highly correlated to bottom hole temperatures. Though temperatures vary by basin, deeper wells have high temperatures and experience greater cyclical stresses that require cementers to build in thicker casing use advanced cement formulas and engineer technical placement solutions. Due to growing demand and concentration of capabilities, we expect that pricing will continue to increase for high intensity wells in more complicated basins.
Recent Trends in Cementing Equipment Supply
Cementing fleets underwent similar decreases in utilization and stacking as hydraulic fracturing fleets during 2015 and 2016. Though many small oilfield service providers have been known to enter this market for low intensity jobs, the market trend towards advanced cementing jobs creates opportunity for the larger oilfield service providers.
82
Table of Contents
Index to Financial Statements
Business Overview
We are the largest North American-focused, pure-play pressure pumping services provider. Our people, equipment and leading-edge technologies provide innovative solutions for E&P clients in North America. Our management team and members of our Board of Directors have an extensive history of providing reliable, safe and efficient solutions for clients across all major North American shale plays. In December 2016, we combined a select set of assets, including certain well-maintained, land-based hydraulic fracturing and cementing equipment, premier facilities and an extensive intellectual property portfolio licensed from Baker Hughes, a GE company, LLC (“BHGE”), with the hydraulic fracturing and cementing businesses of Allied Completions Holdings to form our company. Since our formation, we have rapidly and efficiently redeployed a significant portion of our fleets throughout North America.
BJ Services is one of the oilfield services industry’s oldest continuously operating brands, with a 145-year history. The BJ Services brand is recognized globally for its reliability, high-quality equipment and facilities and history of innovation. We are building on this legacy by developing tailored completion and cementing solutions for our clients through a vertically integrated, technology-driven approach that is centered around our flagship technology center in Tomball, Texas, network of regional laboratories and in-house equipment support facilities and access to an intellectual property portfolio containing approximately 500 active patents. Our reputation, commitment to reliability and tailored solutions enable us to provide services to some of North America’s most active and well-capitalized E&P companies.
We currently own 43 hydraulic fracturing fleets with an aggregate capacity of 2.2 million HHP, as well as 241 cementers, making us one of the largest hydraulic fracturing and cementing service providers in North America. We calculate our number of fleets by assuming an average HHP per fleet in excess of 50,000 HHP. As of June 30, 2017, we had 22 hydraulic fracturing fleets and 110 cementers operating across all major North American resource plays. We are also engaged in discussions and negotiations with clients or potential clients relating to the redeployment of an additional 9 hydraulic fracturing fleets by December 2017. Based on our recent redeployment experience, ongoing contract negotiations and discussions with our existing clients, we expect to increase our operating fleet count to 31 hydraulic fracturing fleets and 140 cementers by December 2017.
We believe the significant historical investment in, and the relatively young age of, our hydraulic fracturing and cementing equipment, will allow us to redeploy our equipment rapidly with an attractive level of expenditures for equipment reactivation. Between 2011 and 2016, BHGE invested approximately $3.5 billion in capital expenditures and repair and maintenance expenses for the hydraulic fracturing and cementing equipment that it contributed to BJS LLC. As a result of historically invested capital and past strategic events which resulted in lower asset utilization, our hydraulic fracturing fleets have an average engine run time since manufacturing, a measure of the relative age and condition of our equipment, of only 2.75 years as of December 31, 2016.
In addition to rapidly redeploying our fleets, we have streamlined the combined legacy footprint of BHGE’s and Allied Completions Holdings’ hydraulic fracturing and onshore cementing businesses from 55 field facilities to 14 owned and 9 leased operating locations that are strategically located within leading resource plays in North America.
83
Table of Contents
Index to Financial Statements
Our Products and Solutions
Hydraulic Fracturing and Cementing
Hydraulic fracturing. In general, hydraulic fracture treatments are used to increase the productivity index of a producing well by pumping fluids at high pressure down a wellbore, creating fractures in the rock formation to stimulate the flow of hydrocarbons. The productivity index defines the rate at which oil or gas can be produced at a given pressure differential between the reservoir and the wellbore. In many formations, chemical and/or physical processes alter the reservoir rock over time. These diagenetic processes may restrict openings in the rock and reduce the ability of fluids to flow through the rock, lowering permeability. Low-permeability rocks are normally excellent candidates for hydraulic fracturing. In many cases, including low-permeability formations, damaged reservoirs or horizontal wells in a layered reservoir, a well would be uneconomical unless a successful hydraulic fracture treatment is performed, and our tailored services allow our clients to develop these resources.
We own 43 hydraulic fracturing fleets with an aggregate capacity of 2.2 million HHP. We have increased our operating fleet count from six fleets as of December 31, 2016 to 22 fleets as of June 30, 2017, comprising approximately 1,100,000 operating HHP, 20 of which are dedicated to specific clients and operate on a continuous, 24-hour per day basis. We believe we can redeploy and upgrade all 43 of our hydraulic fracturing fleets for an aggregate cost of approximately $197.0 million by leveraging our in-house refurbishment capabilities that will allow us to control the timing and cost of fleet redeployment. As part of our fleet reactivation, we are deploying our proprietary Gorilla pumps, which we believe are among the highest specification mobile pressure pumping units currently in operation. Included in our equipment reactivation is the implementation of proprietary modifications to our equipment that enable us to reduce ongoing repair and maintenance (“R&M”) expense, reduce our total cost of ownership and minimize non-operational time for our clients.
Cementing. We also offer cementing services, which provide zonal isolation between the casing and the open hole, restricting fluid movement between formations or sensitive water aquifers and bond, support and protect the casing from corrosion.
We own 241 cementers, making us one of the largest providers of cementing services to E&P companies in North America. As of June 30, 2017, 110 of our 241 cementers were operating across all major North American resource plays, providing services to approximately 225 land drilling rigs in North America, representing approximately 20% of the land drilling rigs currently in operation. We intend to redeploy our idle cement pumping capacity, which we believe can be fully reactivated with approximately $25.0 million of capital expenditures. As the demand for cementing technologies increases, we expect to increase the number of operating cementers to 140 by December 2017. As trends in the drilling industry evolve, so does the demand for cementing technology solutions that can withstand the challenges associated with longer and deeper horizontal laterals and cyclical stresses across cemented casing strings during advanced completion techniques. We believe we are well-positioned to address that demand with a modernized fleet of cement pumps and premier cement additive technologies that increase job reliability and well integrity during the life of the well. Our standardized fleet is comprised primarily of our proprietary Falcon cementers, which, based on our operating experience, we believe are among the most reliable cementing pumps in the industry by incorporating our Pacemaker fluid pump and standardized control and automation packages.
Rapid Redeployment of Hydraulic Fracturing and Cementing Fleet. The rapid growth in our operating fleet count has been driven by a number of factors, including our efforts to quickly and efficiently redeploy and upgrade our hydraulic fracturing capacity in response to increasing client demand and our proven ability to gain client share from other hydraulic fracturing service providers. Based on our experience redeploying 16 hydraulic fracturing fleets and 32 cementers since
84
Table of Contents
Index to Financial Statements
December 31, 2016, as well as contractual commitments, discussions with our existing clients and active negotiations with potential new clients, we expect to further increase the number of our hydraulic fracturing fleets and cementers operating in the field as follows:
| Operating Hydraulic Fracturing Fleets | Operating Cementers and Drilling Rig Allocations | |
|
|
| |
| (1) | Amounts presented represent estimates based on our recent redeployment experience, contractual commitments, ongoing contract negotiations and discussions with our existing and potential new clients, and there can be no guarantee that the anticipated increase in operating fleets will occur on the timeline indicated, or at all. Please read “Risk Factors—Risks Inherent in Our Business—We may not be able to reactivate and achieve the expansion and deployment of our fleets on our anticipated timeline, or at all.” |
Additional Technological Solutions
In addition to our hydraulic fracturing and cementing services, our flagship technology center and in-house technological expertise enable us to partner with our clients in the design, testing and implementation of hydraulic fracturing and cementing solutions. North American unconventional resource plays have been made economically viable not only by innovative technologies but also by decreasing the operating cost base realized through applying advances in technical and operational processes which improve operating efficiencies. We believe that we are well positioned to take advantage of our North American focused solution offerings, which include cementing systems, hydraulic fracturing systems, equipment design, performance monitoring, completion design and analysis, and integrated proprietary workflows. We believe our tailored, in-house hydraulic fracturing and cementing products are a key differentiator from competitors who may source such products from third parties, as we are able to customize the products we procure and develop for the specific needs of each client. We are also expanding our extensive intellectual property portfolio by developing additional patents for our well-specific fluid design technology, which we believe is at the forefront of fluid products designed to optimize proppant volumes while reducing pumping times and hydraulic horsepower required.
Our Technology
We couple our industry expertise and premier products and services with innovative technology to develop tailored solutions for our clients. The BJ Services brand embodies 145 years of leadership in technological innovation that has helped position us as the hydraulic fracturing and cementing
85
Table of Contents
Index to Financial Statements
service provider of choice for a wide range of active E&P clients in North America. We believe there are several aspects of our technology solutions that differentiate us from our competitors:
| • | Flagship technology center. We own an industry-leading technology center spanning over 80 acres in Tomball, Texas, where our team of experts, including chemists, mechanical engineers, software engineers, geoscientists and reservoir engineers, develop, sustain and support technology to keep us at the forefront of hydraulic fracturing and cementing applications. Our flagship technology center represents a significant historical capital investment for equipment and new laboratory facilities used to develop and enhance hydraulic fracturing and cementing products and perform geomechanical, conductivity and fluid analyses. Our flagship technology center also houses a training center, an equipment support center, a high pressure treating iron repair center and equipment testing facilities. |
| • | Extensive intellectual property portfolio. We have access to a portfolio of approximately 500 active patents related to pressure pumping assets and techniques and non-exclusive licenses with BHGE to continue using these patents for an unlimited term, and we are in the process of filing for six new patents. In addition, we have filed trademarks for 14 product lines that differentiate our hydraulic fracturing and cementing service offerings. |
| • | Reservoir modeling. We believe our evolving reservoir expertise, which includes petrophysics, completions engineering, geosciences, geomechanics and reservoir engineering, will ensure our clients have access to a broad range of services to continually drive completion optimization as our industry evolves. |
| • | Tailored solutions. We have developed custom hydraulic fracturing and cementing designs for leading E&P companies across all major oil and natural gas resource plays in North America. Additionally, we have developed over 180 unique fluid systems tailored to particular reservoir properties and integrated with specific job-design requirements. |
| • | Big data analytics to optimize our equipment and wellsite performance. We continuously collect and analyze data from the performance of our equipment and operations to optimize asset deployment decisions and continually improve our predictive and preventative maintenance processes. For example, this capability has led to significant modifications to our equipment that have more than doubled the run life of most of our critical components, including extending the run life of our fluid ends by approximately 150%, improving uptime across our fleet, reducing our total cost of ownership and improving the safety and reliability of our services and equipment. |
Market Opportunity
North America has multiple hydrocarbon-rich basins with well-known geologic attributes and large, exploitable resource bases that deliver attractive economics to E&P companies at prevailing oil and natural gas prices. Since reaching a cyclical low in May 2016, the North American land rig count has grown 165% from 416 rigs to 1,103 rigs as of June 30, 2017 according to BHGE. We operate in all of the major North American basins, which provides us with an opportunity to develop our business as industry conditions improve. We believe there are several key drivers of demand for our products and services which will likely lead to tightening pressure pumping supply and demand fundamentals and continued pricing improvement for our services. In addition, an ongoing shift to larger, more complex well completions and an increased need to achieve drilling efficiencies to manage capital programs have significantly increased demand for the sophisticated hydraulic fracturing, cementing and other completion solutions we provide.
| • | Increasing capital expenditures by E&P companies with an emphasis on completions. In response to the improvement in hydrocarbon prices in the latter half of 2016, E&P |
86
Table of Contents
Index to Financial Statements
| companies have increased their capital spending on drilling and completion services resulting in increased demand for oilfield services activities. According to Coras Oilfield Research, the industry is projected to spend $52 billion on drilling and completions activity in 2017 in the United States as compared to $38 billion in 2016. Additionally, service intensity has increased the portion of total well costs E&P companies are expected to spend on completions to 75% in 2017 from 66% in 2013. |
| • | Increasing overall drilling activity rig efficiency and lateral lengths. While rig counts are increasing, according to Coras Oilfield Research, drilling activity is also increasing due to the reduction in average drilling days per well in the United States from 28 days in 2014 to 21 days in 2016, leading to more wells drilled per rig per year. In addition to rig efficiency, lateral lengths have grown from an average of 6,284 feet in 2014 to an average of more than 7,496 feet in the United States in 2016 per Spears & Associates. |
| • | Increasing frac stages per lateral and increasing service intensity of completions. According to Coras Oilfield Research, frac stages per well in the United States have increased from an average of 21 in 2014 to an average of approximately 29 stages per well completed in 2016. Increased stages and service intensity are also expected to result in an increase in proppant usage per well from an average of six million pounds per well in 2014 to an average of approximately ten million pounds per well in 2016 in the United States. |
The aggregate effect of increased demand for greater recovery and completions intensity, as well as increased spending on North American drilling, is driving a trend towards E&P companies seeking partnerships with oilfield service providers that have the technology and facilities to provide complex, engineered hydraulic fracturing and cementing solutions. For more information on industry trends and our market opportunity, see “Industry Trends and Outlook.”
Our Competitive Strengths
Our primary business objectives are to create value for our shareholders and to serve as a strategic partner for our clients by continuing to provide reliable, high quality, technology-driven solutions for the long term development of their unconventional resources. We believe that the following strengths differentiate us from our peers and uniquely position us to execute on this strategy:
| • | An iconic oilfield services brand with a rich 145-year history. The BJ Services brand is recognized globally for its reliability, high-quality equipment and history of innovation. We are building on this legacy by developing tailored completion and cementing solutions for our clients through a vertically integrated, technology-driven approach that is centered around our flagship technology center in Tomball, Texas, network of regional laboratories and in-house equipment support facilities and access to an intellectual property portfolio containing approximately 500 active patents. Our reputation, commitment to reliability and tailored solutions enable us to partner with some of North America’s most active and well-capitalized E&P companies. |
| • | A lean, scalable platform with an active presence in every major North American oil and natural gas resource play. We are the largest North American focused, pure-play pressure pumping services provider, with leading hydraulic fracturing and cementing businesses. As of June 30, 2017, our platform comprised of 43 hydraulic fracturing fleets (of which 22 are operating) providing an aggregate of 2.2 million HHP (approximately 1,100,000 of which represent operating HHP) and 241 cementers (of which 110 are operating). We have aligned our operating infrastructure with key resource plays by streamlining the combined legacy footprint of BHGE’s and Allied Completions Holdings’ hydraulic fracturing and onshore cementing businesses from 55 field sites to 14 owned and 9 leased operating locations. We have also |
87
Table of Contents
Index to Financial Statements
| overhauled the legacy BJ Services supply chain and network of facilities to minimize overhead and redundant support services while driving “last-mile” logistics efficiencies across our platform. We believe that our lean, scalable, asset-light infrastructure footprint allows us to serve growing client demand for our services across North America while keeping our operating expenses and overhead at an optimal level. |
| • | Modern, high-quality equipment requiring minimal capital for reactivation and a low cost of ownership. Our hydraulic fracturing fleets and cementers are designed to reduce our operational footprint while maximizing the effectiveness, reliability and longevity of our equipment in the field. |
| • | Differentiated assets. We believe our hydraulic fracturing equipment is among the most standardized and highest-quality equipment in the industry and succeeds in maximizing horsepower and reliability while minimizing its footprint. Our proprietary Gorilla mobile fracturing pumps incorporate the latest high-pressure technology and provide up to 3,000 brake-horsepower. Their advanced capabilities enable us to design and pump jobs that were not previously possible and allow our clients to extract a better rate of return from wells. Our cementing platform is primarily comprised of Falcon cementers, which, based on our operating experience, we believe are among the most reliable cementing pump systems in the industry. Our cementers utilize higher horsepower cement pumps leading spacer and cement additive technology to reduce equipment needs and allow for more efficient operations on longer, higher volume jobs. Our equipment is engineered with the latest control and monitoring systems for precise control of job parameters, real-time job data acquisition and post-job analysis. Our proprietary designed assets enable us to reduce our operational footprint on location and provide better value to our clients. |
| • | Minimal expenditure for reactivation. The average age of our frac pumps is 6.3 years; however, we believe these assets have significant remaining operational life and will require only modest R&M due to past strategic events which resulted in low utilization. This lower utilization of our fleet resulted in having an average engine run time of approximately 9,900 hours or the equivalent of approximately 2.75 years of average engine run time as of December 31, 2016, based on an assumed 3,600 hours of engine run time per year for a fleet deployed on continuous operations, since construction. We also believe that our well-maintained, modern hydraulic fracturing fleets can be effectively upgraded with our proprietary modifications and redeployed for approximately $197.0 million, or approximately $4.6 million per hydraulic fracturing fleet, based on the average cost of reactivating and upgrading the 10 hydraulic fracturing fleets we have reactivated since December 31, 2016 and our knowledge of the costs required to activate the remaining fleet. At $4.6 million per hydraulic fracturing fleet, we believe our reactivation cost is significantly lower than the cost of building a new comparably equipped fleet, which we estimate would cost approximately $50.0 million, based on the experience of our management. Additionally, we expect the cost of redeploying our idle cementers will be approximately $25.0 million or approximately $150,000 per cementer, compared to approximately $1.4 million to build a comparable new cementer. The relative age of our equipment combined with our robust and proprietary maintenance program and vertically integrated, in-house refurbishment capabilities allows us to activate equipment at a significant cost advantage and efficient timing that is within our control. |
| • | Low overall cost of ownership. We provide vertically integrated client solutions and maintain state-of-the-art equipment support facilities, which are located in close proximity to the major resource plays we service. Our standardized fleets share common equipment and design, which reduces inventory costs and allows us to utilize our technicians across our entire fleet. Additionally, we have further reengineered certain of our equipment to extend the useful life and reduce R&M costs of key components. For example, our proprietary |
88
Table of Contents
Index to Financial Statements
| modifications to major equipment have more than doubled the run life of most of our critical components, including extending the run life of our fluid ends by approximately 150%, and have reduced our total cost of ownership. We monitor and analyze data using a preventive maintenance model to assure equipment performance, safety and reliability throughout its lifetime. |
| • | Industry-leading technology innovation supported by high-quality research and development capabilities. We own a flagship technology center spanning over 80 acres in Tomball, Texas staffed with chemists, mechanical engineers, software engineers, geoscientists, completions and reservoir engineers who design, develop, sustain and support technology to keep us at the forefront of hydraulic fracturing and cementing applications. Our technology assets and intellectual property portfolio represent a significant historical capital investment to build new laboratory facilities for developing hydraulic fracturing and cementing products and engaging in geomechanical, conductivity and fluid analyses. Our flagship technology center also houses a training center, an equipment support center, high pressure treating iron repair center and equipment testing facilities. We also have access to a portfolio of approximately 500 active patents related to pressure pumping assets and techniques and non-exclusive licenses with BHGE to continue using these patents for an unlimited term, and we are in the process of filing for six new patents. In addition, we have filed trademarks for 14 product lines that differentiate our hydraulic fracturing and cementing service offerings. |
| • | Operations designed for a high reliability organization (“HRO”). Our HRO philosophy is designed to maximize returns by integrating our supply chain, sales, technical and operational workflows. The backbone of this system is our ability to collect and analyze “big data,” enhancing our ability to adjust operational parameters to create synergies across sales, supply chain and field operations within our organization. Additionally, our careful monitoring and analysis of our operating equipment has led to engineered solutions that reduce both our and our clients’ costs. We believe we have established a unique and proven management and team performance system that focuses on perfecting execution in the field. |
| • | Experienced executive team and field managers supported by world-class leadership. Our Board of Directors includes former chief executives from the world’s leading oilfield services companies and our senior management has extensive experience leading oilfield services operations. We believe our leadership team’s knowledge of the oilfield services industry is a key competitive advantage. In addition, our field managers have expertise in the resource plays in which they operate and understand the unique challenges that our clients face. We believe their knowledge of our industry and business lines enhances our ability to provide innovative, client-focused and basin-specific solutions, which we also believe strengthens our relationships with our clients. |
Our Business Strategies
We intend to achieve our primary business objectives through the following business strategies:
| • | Focus on our mission of perfecting operational execution in the oilfield. We are a solutions-driven organization with a focus on maximizing returns and maintaining a low-cost operating model by leveraging our technology capabilities in chemistry, equipment design and reservoir engineering. We believe we have established a unique and proven management system for achieving optimal operational execution in the oilfield, which is based on the following organizational principles: |
| • | Repeatable execution. Our management systems have been designed to drive industry leading EH&S and quality standards. Our management systems also comply with API Q2 standards and are supported by our internally developed cloud-based reporting platform, |
89
Table of Contents
Index to Financial Statements
| which provides timely critical information to our operations and our clients. Our management team emphasizes our foundational focus on reliability, and we have established training and operational control procedures throughout the organization. We believe our organizational footprint, including training facilities and support structure, is scalable. Another aspect of our management systems includes an integrated process in which management, operations and supply chain work together to continuously synchronize our business requirements to meet our clients’ needs through sales and operations planning. Repeatable execution and focus on reliability have driven change in our organization as evidenced by improved safety and quality performance, as well as aligning all aspects of our organization to operate in an efficient, low-cost and consistent manner. |
| • | Responsible stewardship. We conduct ourselves at all times with the highest ethical standards. We respect the communities and environment in which we work, our clients and suppliers and all our stakeholders. We seek to safeguard our valuable assets through disciplined capital spending, prudent management of our balance sheet and diligent maintenance of our fleet. We also seek to maximize our returns and create efficiencies for our clients through an asset-light supply-chain and integrated sales, technical and operational workflows. We believe our physical infrastructure strategically targets key resource plays, our owned locations provide significant savings as compared to the rental cost of comparable facilities and our status as the largest North America-focused, pure-play pressure pumping service provider allows for scale and purchasing power to align key supplier strategies. In addition, we believe our centralized maintenance and asset-light distribution structure further drives efficiency, ensuring optimized returns on our investment. |
| • | Right team. We are committed to a learning culture with a focus on being an HRO. We seek to attract and retain the highest quality workforce. We have instituted a scalable infrastructure for learning and competency development. Our HRO philosophy begins with personnel who value our culture of reliability and safety, and at all levels we support their development through training programs and learning tools that make maintaining that culture and our policies and principles a continued focus within our organization. |
| • | Solutions driven. Our focus is to deliver high-quality client solutions through new technology and efficient cost-management. Our management team seeks to provide solutions tailored to the needs of our clients by focusing on our geographic footprint, the elimination of burdensome overhead costs and expenses and the implementation of proprietary engineering methods to reduce product and minimize ongoing R&M costs. We optimize the performance of our assets by incorporating data collection and analysis into our fleet operations and deployment, which provides us with continuous information on the performance of our assets to ensure we are providing efficient, high-quality services to our clients. These technologies result in less downtime, reduced equipment failure in demanding conditions, lower operating costs and improved safety and reliability. We believe the execution history of our personnel across multiple demand-markets, low overhead and propriety R&M model allow us to understand and respond to the needs of our clients with innovative, cost-effective and tailored solutions. Our experience and technological expertise allows us to meaningfully partner with and provide innovative solutions for our clients. For example, we have developed over 180 unique fluid systems tailored to the reservoir properties and integrated with specific job design requirements for our clients. We believe that the repeatable results we achieve deepen our relationships with our clients and allow us to grow as they expand their footprint both within and beyond their current operating regions. Additionally, we leverage our operational excellence and the knowledge we gain to win new clients and grow our operational footprint. |
| • | Deploying additional hydraulic fracturing horsepower. We expect to see a continued increase in demand for our hydraulic fracturing services based on trends in our industry and |
90
Table of Contents
Index to Financial Statements
| believe that we can continue to grow our base of operating assets by upgrading and redeploying our fleets. The average age of our frac pumps is 6.3 years; however, due to past strategic events which resulted in low utilization, our average engine run time is approximately 9,900 hours, or the equivalent of approximately 2.75 years of average engine run time as of December 31, 2016, based on an assumed 3,600 hours of engine run time per year for a fleet deployed on continuous operations, since manufacturing. As a result, we believe that these assets have significant remaining operational life and will require only modest R&M. By leveraging our in-house refurbishment capabilities that allow us to control the timing and cost of fleet redeployment, we also believe that all 43 of our hydraulic fracturing fleets can be effectively reactivated, upgraded with our proprietary modifications and redeployed for a cost of approximately $197.0 million, or approximately $4.6 million per hydraulic fracturing fleet, based on the average cost of reactivating and upgrading the 16 hydraulic fracturing fleets we have reactivated since December 31, 2016 and our knowledge of the costs required to activate the remaining fleets. Based on our experience with recent redeployments, the quality of our equipment and discussions with our clients, we expect to increase our operating fleet count from 22 fleets to 31 operating fleets, comprising approximately 1.6 million operating HHP, by December 2017. |
| • | Increasing our operating cementers. Drilling rig efficiency, combined with longer laterals and “monobore” well designs, are drastically increasing the demand for efficient cementing solutions. We believe we are strategically positioned to provide these solutions by utilizing our high horsepower cement pumps and proprietary spacer and cement additive technology that reduces equipment needs and allows for more efficient operations on longer, higher volume jobs. As of June 30, 2017, we had 110 of our 241 cementers operating in the field across all major North American resource plays and expect to redeploy cementers from our inventory to meet growing demand from our clients. Our cementing fleet, comprised primarily of Falcon cementers, which, based on our operating experience, we believe are among the most reliable cementing pump systems in the industry, has been upgraded to incorporate the significant improvements in available technology in recent years, and we believe these cementers can be redeployed at an estimated cost of approximately $25.0 million or approximately $150,000 per cementer. |
| • | Delivering high-quality customer solutions through new technology and efficient cost-management. Our management team seeks to provide solutions tailored to the needs of our clients by focusing on our geographic footprint, the elimination of burdensome overhead costs and expenses and the implementation of proprietary engineering methods to minimize ongoing R&M costs. We optimize the performance of our assets by incorporating data collection and analysis into our fleet operations and deployment, which provides us with continuous information on the performance of our assets to ensure we are providing efficient, high-quality services to our clients. These technologies result in less downtime, reduced equipment failure in demanding conditions, lower operating costs and improved safety and reliability. We believe the execution history of our personnel across multiple demand-markets, low overhead and propriety R&M model allow us to understand and respond to the needs of our clients with innovative, cost-effective and tailored solutions. |
| • | Leveraging and expanding customer partnerships through tailored solutions. Our primary clients are well-capitalized E&P companies focused on operating efficiencies with robust development plans that drive high activity in the resource plays in which they operate. Our experience and technological expertise allows us to meaningfully partner with and provide innovative solutions for our clients. For example, we have developed over 180 unique fluid systems tailored to the reservoir properties and integrated with specific job design requirements for our clients. We believe that the repeatable results we achieve deepen our relationships with our clients and allow us to grow as they expand their footprint both within and beyond their |
91
Table of Contents
Index to Financial Statements
| current operating regions. Additionally, we leverage our operational excellence and the knowledge we gain to win new clients and grow our operational footprint. |
| • | Maintaining a prudent balance sheet while focusing on profitable operations. We carefully manage our liquidity by continuously monitoring cash flow, capital spending and debt capacity with a focus on profitability and related returns to evaluate our performance. Maintaining our financial strength and flexibility provides us with the ability to execute our strategy through commodity price cycles. We intend to maintain a conservative approach to managing our balance sheet to preserve operational and strategic flexibility. At June 30, 2017, we had $68.1 million in cash and cash equivalents on hand and ample liquidity, providing us with the means to fund deployment of fleets and grow our operations. We also expect to join the existing $400.0 million ABL credit facility as a co-borrower in connection with the completion of this offering. As of June 30, 2017, there was a $50.0 million balance outstanding under the ABL credit facility. |
Properties and Equipment
Properties
Our principal properties are wholly owned and include our corporate headquarters and technology center, regional offices, laboratories and operating sites, as well as our equipment support facilities. We believe our state of the art facilities are the industry benchmark and in excellent condition, and all locations are currently active.
The following map represents our facilities and areas of operation as of June 30, 2017:
92
Table of Contents
Index to Financial Statements
Our operations are managed from our offices located at our corporate headquarters in Tomball, Texas.
United States. In the United States, we service clients operating in the Permian Basin, the Eagle Ford Shale, the Haynesville Shale, the Bakken Formation, the DJ Basin, the San Joaquin Basin, the Marcellus Shale, the Utica Shale and the SCOOP/STACK formation. Total wells drilled in these resource plays are expected to increase from 9,293 wells drilled in 2016 to 11,946 in 2017, of which approximately 69% will be horizontal wells per Spears & Associates. We have 20 operating sites across Arkansas, California, Colorado, Kansas, Louisiana, New Mexico, North Dakota, Ohio, Pennsylvania, Texas, West Virginia and Wyoming, laboratories in California, Louisiana, New Mexico, North Dakota, Ohio, Pennsylvania and Texas and a central refurbishment and maintenance facility that services the region at our corporate headquarters in Tomball, Texas.
Canada. In Canada, we service clients operating in the Western Canada Sedimentary Basin. Total wells drilled in the Western Canada Sedimentary Basin are expected to increase from 3,469 wells drilled in 2016 to 4,727 in 2017 per Spears and Associates. We have two operating sites and a regional office and laboratory in Alberta.
Below is a table detailing our properties in North America as of June 30, 2017:
| Location |
Facility Type | Owned or Leased | ||
| Tomball, TX |
Headquarters, Technology Center, Equipment & Operations Support, Learning Center |
Owned | ||
| Searcy, AR |
Operations | Owned | ||
| Hobbs, NM |
Operations | Leased | ||
| Odessa, TX |
Operations | Owned | ||
| San Antonio, TX |
Operations | Owned | ||
| Liberty, TX |
Operations | Owned | ||
| Shreveport, LA |
Operations | Owned | ||
| Denver, CO |
Regional Headquarters | Leased | ||
| Dickinson, ND |
Operations | Owned | ||
| Cheyenne, WY |
Operations | Leased | ||
| LaSalle, CO |
Operations | Leased | ||
| Rifle, CO |
Operations | Owned | ||
| Liberal, KS |
Operations | Leased | ||
| Santa Fe Springs, CA |
Operations | Leased | ||
| Canonsburg, PA |
Regional Headquarters Operations |
Leased | ||
| Yukon, OK |
Operations | Owned | ||
| Mill Hall, PA |
Operations | Owned | ||
| Massilon, OH |
Operations | Owned | ||
| Bridgeport, WV |
Operations | Leased | ||
| Clarksburg, WV |
Operations | Owned | ||
| Calgary, AB |
Regional Headquarters Operations |
Leased | ||
| Clairmont, AB |
Operations | Owned | ||
| Red Deer, AB |
Operations | Owned |
93
Table of Contents
Index to Financial Statements
Equipment
Hydraulic Fracturing Equipment. We own 43 hydraulic fracturing fleets with an aggregate capacity of 2.2 million HHP (assumes in excess of 50,000 HHP per fleet). As of June 30, 2017, we had 22 fleets in operation, comprising approximately 1,100,000 operating HHP. Our hydraulic fracturing equipment has an average engine run time (a measure of relative age and condition, assuming an average of 3,600 hours per year) of approximately 2.75 years as of December 31, 2016. Each hydraulic fracturing fleet includes blending units, manifolds, data monitoring hardware and other ancillary equipment, including, amongst other equipment and the Dry-on-the-Fly polymer hydration units. Our standardized fleets share common equipment and design, which reduces inventory costs, allows us to cross-train our technicians across our entire fleet and provides the flexibility to allocate pressure pumps and other equipment among our fleets as needed to satisfy client demand.
Cementing Equipment. We also offer cementing services, which provide zonal isolation between the casing and the open hole, restricting fluid movement between formations or sensitive water aquifers and bond, support and protect the casing from corrosion.
We own 241 cementers, making us one of the largest providers of cementing services to E&P companies in North America. As of June 30, 2017, 110 of our 241 cementers are operating across all major North American resource plays, providing services to approximately 225 land drilling rigs in North America, representing approximately 20% of the land drilling rigs currently in operation in North America. We intend to redeploy our idle cement pumping capacity, which we believe can be fully reactivated with approximately $25.0 million of capital expenditures. As the demand for cementing technologies increases, we expect to increase the number of operating cementers to 140 by December 2017. As trends in the drilling industry evolve, so does the demand for cementing technology solutions that can withstand the challenges associated with longer and deeper horizontal laterals and cyclical stresses across cemented casing strings during advanced completion techniques. We are well-positioned to address that demand with a modernized fleet of cement pumps and premier cement additive technologies that increase job reliability and well integrity during the life of the well. Our standardized fleet is comprised primarily of our proprietary Falcon cementers, which, based on our operating experience, we believe are among the most reliable cementing pumps in the industry by incorporating our Pacemaker fluid pump and standardized control and automation packages.
Our Clients
Our clients consist primarily of oil and natural gas producers in North America. Our top ten clients accounted for approximately 63%, 70% and 100% of our revenue for the three months ended March 31, 2017, the year ended December 31, 2016 and the period from January 27, 2015 to December 31, 2015, respectively. For the year ended December 31, 2016, two customers (Antero Resources and EQT Production) accounted for approximately 14%, and 12% of the Company’s revenue, totaling $9.8 million. For the period from January 27, 2015 (Date of Inception) to December 31, 2015 three customers (Whiting Oil and Gas, GRMR Oil and Gas and Wexpro) accounted for approximately 31%, 30% and 22% of the Company’s revenue, totaling $1.0 million.
Our Relationship with Our Sponsors and BHGE
Our principal shareholders are CSL and Goldman Sachs Affiliated Funds, or our Sponsors, and Baker Hughes, a GE company, LLC.
CSL is an SEC-registered investment firm founded in early 2008 and headquartered in Houston that invests in energy services companies and entrepreneurs with a focus on oilfield services
94
Table of Contents
Index to Financial Statements
opportunities. Since its inception, CSL has raised in excess of $1.4 billion in equity capital and commitments across various investment vehicles, including startups, growth equity, recapitalizations and restructurings in energy services, consumables and equipment. Selected current and prior platform investments of CSL include Independence Oilfield Chemicals, a fracturing chemicals and solutions provider, Pyramax Ceramics, a ceramic proppant manufacturer, Mission Well Services, an Eagle Ford-focused fracturing company, and Ranger Energy Services, a production and completion services provider of high specification service rigs.
Founded in 1869, The Goldman Sachs Group, Inc., is a leading global investment banking, securities and investment management firm. Goldman Sachs’ Merchant Banking Division (“MBD”) is the primary center for the firm’s long-term principal investing activity. With nine offices across seven countries, MBD is one of the leading private capital investors in the world with equity and credit investments across corporate, real estate and infrastructure strategies. Since 1986, the group has invested over $170 billion of levered capital across a number of geographies, industries and transaction types.
Baker Hughes, a GE company, LLC (“BHGE”), is the world’s first and only fullstream provider of integrated oilfield products, services and digital solutions. BHGE’s employees today work in more than 120 countries.
We believe that our relationships with our Sponsors and BHGE are a competitive advantage, as they bring significant financial, operational and management experience, which we believe they will use to help support our business, and also relationships throughout the energy industry, which we may benefit from as we seek to grow our business through potential acquisitions.
Competition
We provide our services across all major North American resource plays, and we compete against different companies in each service and product line we offer. Our competitors include many large and small oilfield services companies, including Halliburton, Schlumberger, FTS International, Patterson UTI Energy and a number of locally oriented businesses. Competitive factors impacting sales of our services are price, reputation and technical expertise, access to available labor, service and equipment quality access to proppants and other commodities used in our business and health and safety standards. Although we believe our clients consider all of these factors, we believe price is a key factor in E&P companies’ criteria in choosing a service provider. While we seek to price our services competitively, we believe many of our clients elect to work with us based on our modern fleet of high-quality equipment, repeatable execution and consistent quality, efficiency and close proximity to our clients.
Seasonality
Our results of operations have historically reflected seasonal tendencies relating to holiday seasons, inclement weather and the conclusion of our customers annual drilling and completion capital expenditure budgets. Our most notable declines occur in the first and fourth quarters of the year for the reasons described above. Additionally, some of the areas in which we have operations, including in Canada, North Dakota, Colorado, West Virginia, Pennsylvania and Ohio, are adversely affected by seasonal weather conditions, primarily in the winter and spring. During periods of heavy snow, ice or rain, we may be unable to move our equipment between locations, thereby reducing our ability to provide services and generate revenues. The exploration and production activities of our customers may also be affected during periods of such adverse weather conditions. Additionally, extended drought conditions in our operating regions could impact our ability or our customers’ ability to source
95
Table of Contents
Index to Financial Statements
sufficient water or increase the cost for such water. Our operations in Texas, California, Louisiana, Oklahoma and Kansas are not generally affected by seasonal weather conditions.
Operating Risks and Insurance
Our revenue is derived from work for clients primarily through MSAs, although we also enter into pricing agreements, blanket work orders, scope of work agreements and minimum commitment agreements from time to time. Generally, under our MSAs, particularly those relating to our hydraulic fracturing services, we assume responsibility for, including control and removal of, pollution or contamination which originates above surface and originates from our equipment or services. However, our clients typically assume responsibility for, including for the control and removal of, all other pollution or contamination which may occur during operations, including that which may result from seepage or any other uncontrolled flow of drilling fluids. Generally, our clients also agree to indemnify us against claims arising from personal injury to or death of their or their affiliates’ or invitees’ employees, service providers or other representatives in connection with the performance of the applicable services. Similarly, we typically agree to indemnify our clients for liabilities arising from personal injury to or death of any of our or our affiliates’ or invitees’ employees, service providers or other representatives. In addition, our clients generally agree to indemnify us for loss or destruction of customer-owned property or equipment and in turn, we agree to indemnify our clients for loss or destruction of property or equipment we own. Losses due to catastrophic events, such as blowouts, are generally the responsibility of the client. Our insurance program, discussed below, is designed to be consistent with this approach to risk allocation under our MSAs. However, despite this customary allocation of risk, we might not succeed in enforcing such contractual allocation of risk, might incur an unforeseen liability falling outside the scope of such allocation or our insurance coverage or may be required to enter into an MSA with terms that vary from the above allocations of risk. Litigation arising from a catastrophic occurrence at a location where our equipment and services are being used may result in our being named as a defendant in lawsuits asserting large claims. As a result, we may incur substantial losses which could materially and adversely affect our financial condition and results of operation.
Our operations are subject to hazards inherent in the oilfield services industry, such as equipment defects, vehicle accidents, blowouts, explosions, fires and various environmental hazards, such as oil spills and releases of, and exposure to, hazardous substances. In addition, our operations are exposed to potential natural disasters, including blizzards, tornadoes, storms, floods, other adverse weather conditions and earthquakes. The occurrence of any of these events could result in substantial losses to us due to personal injury or loss of life, severe damage or destruction of property, equipment, natural resources and pollution or other environmental damage, clean up responsibilities, regulatory investigations and penalties or other damage resulting in curtailment or suspension of our operations. In addition, claims for loss of oil and natural gas production and damage to formations can occur in the oilfield services industry. If a serious accident were to occur at a location where our equipment and services are being used, it could result in us being named as a defendant in lawsuits asserting large claims. Because our business involves the transportation of heavy equipment and materials, we may also experience traffic accidents which may result in spills, property damage and personal injury.
Despite our efforts to maintain safety standards, we from time to time have suffered accidents in the past and anticipate that we could experience accidents in the future. In addition to the property damage, personal injury and other losses from these accidents, the frequency and severity of these incidents affect our operating costs and insurability and our relationships with clients, employees, regulatory agencies and other parties. Any significant increase in the frequency or severity of these incidents, or the general level of compensation awards, could adversely affect the cost of, or our ability to obtain, workers’ compensation and other forms of insurance, and could have other material adverse effects on our financial condition and results of operations.
96
Table of Contents
Index to Financial Statements
We maintain commercial general liability, workers’ compensation, business auto, commercial property, umbrella liability, in certain instances, excess liability, and directors and officers insurance policies providing coverages of risks and amounts that we believe to be customary in our industry. Further, we have pollution legal liability coverage for our business entities, which would cover, among other things, third party liability and costs of clean-up relating to environmental contamination on our premises while our equipment are in transit and while on our clients’ job site. With respect to our hydraulic fracturing operations, coverage would be available under our pollution legal liability policy for any surface or subsurface environmental clean-up and liability to third parties arising from any surface or subsurface contamination. We also have certain specific coverages for some of our businesses, including for our hydraulic fracturing services.
Although we maintain insurance coverage of types and amounts that we believe to be customary in the industry, we are not fully insured against all risks, either because insurance is not available or because of the high premium costs relative to perceived risk. Further, insurance rates have in the past been subject to wide fluctuation and changes in coverage could result in less coverage, increases in cost or higher deductibles and retentions. Liabilities for which we are not insured, or which exceed the policy limits of our applicable insurance, could have a material adverse effect on us. See “Risk Factors” for a description of certain risks associated with our insurance policies.
Environmental and Occupational Health and Safety Regulations
Environmental, Health and Safety Matters and Regulation
Our operations are subject to stringent laws and regulations governing the discharge of materials into the environment or otherwise relating to environmental protection, and occupational health and safety. Numerous federal, state, provincial, and local governmental agencies issue regulations that often require difficult and costly compliance measures that could carry substantial administrative, civil and criminal penalties and may result in injunctive obligations for non-compliance. These laws and regulations may, for example, restrict the types, quantities and concentrations of various substances that can be released into the environment, limit or prohibit construction or drilling activities on certain lands lying within wilderness, wetlands, ecologically or seismically sensitive areas and other protected areas, or require action to prevent or remediate pollution associated with current or former operations or property we own, lease or occupy. Moreover, it is not uncommon for neighboring landowners and other third parties to file claims for personal injury and property damage allegedly caused by the release of hazardous substances, hydrocarbons or other waste products into the environment. Changes in environmental, health and safety laws and regulations occur frequently, and any changes that result in more stringent and costly requirements could materially adversely affect our operations and financial position. We have not experienced any material adverse effect from compliance with these requirements. This trend, however, may not continue in the future.
Below is an overview of some of the more significant environmental, health and safety requirements with which we must comply. Our clients’ operations are subject to similar laws and regulations. Any material adverse effect of these laws and regulations on our clients operations and financial position may also have an indirect material adverse effect on our operations and financial position.
Waste Handling. We handle, transport, store and dispose of wastes that are subject to the Resource Conservation and Recovery Act (“RCRA”) and comparable state laws and regulations, which affect our activities by imposing requirements regarding the generation, transportation, treatment, storage, disposal and cleanup of hazardous and non-hazardous wastes. With federal approval, the individual states administer some or all of the provisions of RCRA, sometimes in conjunction with their own, more stringent requirements. Although certain petroleum production wastes are exempt from
97
Table of Contents
Index to Financial Statements
regulation as hazardous wastes under RCRA, such wastes may constitute “solid wastes” that are subject to the less stringent requirements of non-hazardous waste provisions.
Administrative, civil and criminal penalties can be imposed for failure to comply with waste handling requirements. Moreover, the EPA or state or local governments may adopt more stringent requirements for the handling of non-hazardous wastes or recategorize some non-hazardous wastes as hazardous for future regulation. Indeed, legislation has been proposed from time to time in Congress to recategorize certain oil and natural gas exploration, development and production wastes as hazardous wastes. Several environmental organizations have also petitioned the EPA to modify existing regulations to recategorize certain oil and natural gas exploration, development and production wastes as hazardous. Any such changes in these laws and regulations could have a material adverse effect on our capital expenditures and operating expenses. Although we do not believe the current costs of managing our wastes, as presently classified, to be significant, any legislative or regulatory reclassification of oil and natural gas exploration and production wastes could increase our costs to manage and dispose of such wastes.
Remediation of Hazardous Substances. The Comprehensive Environmental Response, Compensation and Liability Act (“CERCLA” or “Superfund”) and analogous state laws generally impose liability without regard to fault or legality of the original conduct, on classes of persons who are considered to be responsible for the release of a hazardous substance into the environment. These persons include the current owner or operator of a contaminated facility, a former owner or operator of the facility at the time of contamination and those persons that disposed or arranged for the disposal of the hazardous substance at the facility. Liability for the costs of removing or remediating previously disposed wastes or contamination, damages to natural resources, the costs of conducting certain health studies, amongst other things, is strict and joint and several. In addition, it is not uncommon for neighboring landowners and other third parties to file claims for personal injury and property damage allegedly caused by the hazardous substances released into the environment. In the course of our operations, we use materials that, if released, would be subject to CERCLA and comparable state laws. Therefore, governmental agencies or third parties may seek to hold us responsible under CERCLA and comparable state statutes for all or part of the costs to clean up sites at which such hazardous substances have been released.
NORM. In the course of our operations, some of our equipment may be exposed to naturally occurring radioactive materials (“NORM”) associated with oil and natural gas deposits and, accordingly may result in the generation of wastes and other materials containing NORM. NORM exhibiting levels of naturally occurring radiation in excess of established state standards are subject to special handling and disposal requirements, and any storage vessels, piping and work area affected by NORM may be subject to remediation or restoration requirements.
Water Discharges. The Clean Water Act, Safe Drinking Water Act, Oil Pollution Act and analogous state laws and regulations impose restrictions and strict controls regarding the unauthorized discharge of pollutants, including produced waters and other gas and oil wastes, into regulated waters. The discharge of pollutants into regulated waters is prohibited, except in accordance with the terms of a permit issued by the EPA or the state. Also, spill prevention, control and countermeasure plan requirements require appropriate containment berms and similar structures to help prevent the contamination of regulated waters.
The EPA and the Army Corps of Engineers (“Corps”) released a rule to revise the definition of “waters of the United States” (“WOTUS”) for all Clean Water Act programs, which went into effect in August 2015. In October 2015, the U.S. Court of Appeals for the Sixth Circuit stayed the WOTUS rule nationwide pending further action of the court. In response to this decision, the EPA and the Corps resumed nationwide use of the agencies’ prior regulations defining the term “waters of the United
98
Table of Contents
Index to Financial Statements
States.” Those regulations will be implemented as they were prior to the effective date of the new WOTUS rule. In January 2017, the U.S. Supreme Court accepted review of the WOTUS rule to determine whether jurisdiction to hear challenges to the rule rests with the federal district or appellate courts. In February 2017, the new Presidential administration issued an Executive Order directing the EPA and the Corps to review and, consistent with applicable law, to initiate a rulemaking to rescind or revise the WOTUS rule. The EPA and the Corps published a notice of intent to review and rescind or revise the rule in March 2017. In addition, the U.S. Department of Justice filed a motion with the U.S. Supreme Court in March 2017 requesting that the U.S. Supreme Court stay the suit concerning which court should hear challenges to the rule. The U.S. Supreme Court denied the motion in April 2017. In June 2017, the EPA and the U.S. Army Corps proposed a rule that would initiate the first step in a two-step process intended to review and revise the definition of “waters of the United States” consistent with President Trump’s executive order. Under the proposal, the first step would be to rescind the May 2015 final rule and put back into effect the narrower language defining “waters of the United States” under the Clean Water Act that existed prior to the rule. The second step would be a notice-and-comment rulemaking in which the agencies will conduct a substantive reevaluation of the definition of “waters of the United States.” If upheld, the WOTUS rule could significantly expand federal control of land and water resources across the U.S., triggering substantial additional permitting and regulatory requirements.
Air Emissions. The Clean Air Act (“CAA”) and comparable state laws and regulations, regulate emissions of various air pollutants through the issuance of permits and the imposition of other emissions control requirements. The EPA has developed, and continues to develop, stringent regulations governing emissions of air pollutants from specified sources. New facilities may be required to obtain permits before work can begin, and existing facilities may be required to obtain additional permits and incur capital costs in order to remain in compliance. These and other laws and regulations may increase the costs of compliance for some facilities where we operate. Obtaining or renewing permits also has the potential to delay the development of oil and natural gas projects.
Climate Change. The EPA has determined that greenhouse gases (“GHG”) present an endangerment to public health and the environment because such gases contribute to warming of the earth’s atmosphere and other climatic changes. Based on these findings, the EPA has adopted and implemented, and continues to adopt and implement, regulations that restrict emissions of GHGs under existing provisions of the CAA. The EPA also requires the annual reporting of GHG emissions from certain large sources of GHG emissions in the United States, including certain oil and natural gas production facilities. The U.S. Congress has from time to time considered adopting legislation to reduce emissions of GHGs and almost one-half of the states have already taken legal measures to reduce emissions of GHGs primarily through the planned development of GHG emission inventories and/or regional GHG cap and trade programs. Canada has also taken steps to address GHG emissions. Environment Canada is currently developing regulations to reduce methane emissions from the upstream oil and natural gas industry, with final regulations expected by the end of the year. In addition, in December 2016, the federal government and eight provincial governments in Canada agreed to a national carbon pricing policy that sets a minimum price on GHG emissions throughout Canada. The Canadian federal government will implement a price in the remaining two provinces if they do not have a price or cap-and-trade program in place by 2018. Several other provincial initiatives have established various mechanisms to limit GHG emissions. In December 2015, the United States and Canada joined the international community at the 21st Conference of the Parties of the United Nations Framework Convention on Climate Change in Paris, France. The resulting Paris Agreement calls for the parties to undertake “ambitious efforts” to limit the average global temperature, and to conserve and enhance sinks and reservoirs of greenhouse gases. The Paris Agreement entered into force in November 2016. The United States and Canada are two of over 130 nations that have ratified or otherwise indicated that they intend to comply with the agreement. However, in June 2017, President Trump announced that the United States plans to withdraw from the Paris Agreement and to
99
Table of Contents
Index to Financial Statements
seek negotiations either to reenter the Paris Agreement on different terms or establish a new framework agreement. The Paris Agreement provides for a four-year exit process beginning when it took effect in November 2016, which would result in an effective exit date of November 2020. The United States’ adherence to the exit process and/or the terms on which the United States may reenter the Paris Agreement or a separately negotiated agreement are unclear at this time. Any restrictions on emissions of GHGs that may be imposed could adversely affect the oil and natural gas industry by reducing demand for hydrocarbons and by making it more expensive to develop and produce hydrocarbons, either of which could have a material adverse effect on future demand for our services.
Moreover, climate change may cause more extreme weather conditions and increased volatility in seasonal temperatures. Extreme weather conditions can interfere with our operations and increase our costs, and damage resulting from extreme weather may not be fully insured.
Endangered and Threatened Species. Environmental laws such as the Endangered Species Act (“ESA”) and analogous state laws may impact exploration, development and production activities in areas where we operate. The ESA provides broad protection for species of fish, wildlife and plants that are listed as threatened or endangered. Similar protections are offered to migratory birds under the Migratory Bird Treaty Act and various state analogs. On February 11, 2016, the U.S. Fish and Wildlife Service published a final policy which alters how it identifies critical habitat for endangered and threatened species. Moreover, the U.S. Fish and Wildlife Service continues its six-year effort to make listing decisions and critical habitat designations where necessary for over 250 species before the end of the agency’s 2017 fiscal year, as required under a 2011 settlement approved by the U.S. District Court for the District of Columbia, and many hundreds of additional anticipated listing decisions have already been identified beyond those recognized in the 2011 settlement. The U.S. Fish and Wildlife Service may identify previously unidentified endangered or threatened species or may designate critical habitat and suitable habitat areas that it believes are necessary for survival of a threatened or endangered species, which could cause us or our clients to incur additional costs or become subject to operating restrictions or operating bans in the affected areas.
Regulation of Hydraulic Fracturing and Related Activities. Our hydraulic fracturing operations are a significant component of our business. Hydraulic fracturing is an important and common practice that is used to stimulate production of hydrocarbons, particularly natural gas, from tight formations, including shales. The process, which involves the injection of water, sand and chemicals under pressure into formations to fracture the surrounding rock and stimulate production, is typically regulated by state and provincial oil and natural gas commissions. However, federal agencies have asserted regulatory authority over certain aspects of the process. For example, in May 2014, the EPA issued an Advanced Notice of Proposed Rulemaking seeking comment on the development of regulations under the Toxic Substances Control Act to require companies to disclose information regarding the chemicals used in hydraulic fracturing. Beginning in August 2012, the EPA issued a series of rules under the CAA that establish new emission control requirements for certain oil and natural gas production and natural gas processing operations and associated equipment. And in March 2015, the Bureau of Land Management finalized a rule governing hydraulic fracturing on federal lands; this regulation was struck down in June 2016. The Bureau of Land Management appealed the decision to the U.S. Circuit Court of Appeals for the Tenth Circuit in 2016. However, in March 2017, the Bureau of Land Management filed a request with the Tenth Circuit to put the appeal on hold as it launches a new rulemaking process to review and rescind the 2015 final rule. Further, legislation to amend the Safe Drinking Water Act to repeal the exemption for hydraulic fracturing (except when diesel fuels are used) from the definition of “underground injection” and require federal permitting and regulatory control of hydraulic fracturing, as well as legislative proposals to require disclosure of the chemical constituents of the fluids used in the fracturing process, have been proposed in recent sessions of Congress. Several states, provinces, and local jurisdictions in which we or our clients operate also have adopted or are considering adopting regulations that could restrict or prohibit hydraulic fracturing
100
Table of Contents
Index to Financial Statements
in certain circumstances, impose more stringent operating standards and/or require the disclosure of the composition of hydraulic fracturing fluids.
More recently, federal, state, and provincial governments have begun investigating whether the disposal of produced water into underground injection wells (and to a lesser extent, hydraulic fracturing) has caused increased seismic activity in certain areas. In response, some states, including states in which we and our clients operate, have imposed additional requirements on the construction and operation of underground disposal wells. For example, the Oklahoma Corporation Commission’s Oil and Gas Conservation Division and the Oklahoma Geologic Survey recently released well completion seismicity guidance, which requires operators to take certain prescriptive actions, including mitigation, following anomalous seismic activity within 1.25 miles of hydraulic fracturing operations.
Increased regulation of hydraulic fracturing and related activities could subject us and our clients to additional permitting and financial assurance requirements, more stringent construction specifications, increased monitoring, reporting and recordkeeping obligations, and plugging and abandonment requirements. New requirements could result in increased operational costs for us and our clients, and reduce the demand for our services.
OSHA Matters. The Occupational Safety and Health Act (“OSHA”) and comparable state statutes regulate the protection of the health and safety of workers. In December 2015, the U.S. Departments of Justice and Labor announced a plan to more frequently and effectively prosecute worker health and safety violations, including enhanced penalties. In addition, the OSHA hazard communication standard requires that information be maintained about hazardous materials used or produced in operations and that this information be provided to employees, state and local government authorities and the public.
Employees
As of June 30, 2017, we employed approximately 2,600 people. None of our employees are represented by labor unions or subject to collective bargaining agreements.
Legal Proceedings
From time to time we may be involved in litigation relating to claims arising out of our operations in the normal course of business. We are not currently a party to any legal proceedings that we believe would have a material adverse effect on our financial position, results of operations or cash flows and are not aware of any material legal proceedings contemplated by governmental authorities.
101
Table of Contents
Index to Financial Statements
Directors and Executive Officers of BJ Services, Inc.
The following table sets forth the names, ages and titles of our directors and executive officers. Directors hold office until their successors have been elected or qualified or until their earlier death, resignation, removal or disqualification. Executive officers are appointed by, and serve at the discretion of, the board of directors. The following table shows information for the directors and executive officers as of June 30, 2017.
| Name |
Age | Position with BJ Services, Inc. | ||||
| Warren M. Zemlak |
47 | Director, President and Chief Executive Officer | ||||
| Evelyn M. Angelle |
50 | Executive Vice President and Chief Financial Officer | ||||
| Caleb J. Barclay |
38 | Executive Vice President and Chief Operating Officer | ||||
| John R. Bakht |
48 | Executive Vice President, General Counsel, Chief Compliance Officer and Secretary | ||||
| Andrew F. J. Gould |
70 | Director | ||||
| Scott L. Lebovitz |
41 | Director | ||||
| Charles S. Leykum |
39 | Chairman of the Board | ||||
| William D. Marsh |
54 | Director | ||||
| Derek Mathieson |
46 | Director | ||||
| James W. Stewart |
73 | Director | ||||
| Brian Worrell |
41 | Director | ||||
| Dorothy M. Ables |
59 | Director | ||||
Warren M. Zemlak—President and Chief Executive Officer. Warren Zemlak has served as our President and Chief Executive Officer since April 2017 and as the President and Chief Executive Officer of BJS LLC since January 2017. Mr. Zemlak has served on our board of directors since June 2017. Prior to joining BJ Services, Mr. Zemlak served as President and Chief Executive Officer of Allied Energy Services from June 2016 to December 2016 and, prior to that, served as the Chief Operating Officer of the Sanjel Corporation from January 2011 to May 2016, Vice President Well Services Schlumberger North America from September 2009 to January 2011 and as Schlumberger’s Senior Vice President of Production Services in Russia from April 2006 to September 2009 where he was responsible for pressure pumping, completions and artificial lift. Mr. Zemlak also served on the board of directors for Sanjel Saudi Arabia International from 2014 until March 2017. On April 4, 2016, the Sanjel Corporation and certain of its affiliates filed for protection under Canada’s Companies’ Creditors Arrangement Act (the “CCAA”) and a petition for recognition of a foreign proceeding under Chapter 15 of Title 11 of the U.S. Bankruptcy Code. Mr. Zemlak has over 28 years of experience with oilfield services companies and has held progressively senior global and North American leadership roles encompassing operations, technology, business development, manufacturing and executive positions related to cementing, hydraulic fracturing, coiled tubing and completions services. Mr. Zemlak’s technical and operational expertise has resulted in several patents related to reservoir stimulation, subsea intervention and horizontal drilling technology. Additionally, Mr. Zemlak has lead business optimization throughout several market cycles in both public and private entities. Mr. Zemlak completed a field engineering cross over program from Dowell Schlumberger in 1991 (Bottesford, England) as well as several Schlumberger Management Development programs supported by IMD (Lausanne, Switzerland) and other select academic institutions. We believe Mr. Zemlak’s extensive experience in the oilfield services business and executive leadership experience make him well qualified to serve on our board of directors.
Evelyn M. Angelle—Executive Vice President and Chief Financial Officer. Evelyn Angelle has served as our Executive Vice President and Chief Financial Officer since April 2017 and as the
102
Table of Contents
Index to Financial Statements
Executive Vice President and Chief Financial Officer of BJS LLC since January 2017. From January 2014 through January 2015, Ms. Angelle served as Senior Vice President—Supply Chain for Halliburton, responsible for global procurement, materials, logistics and manufacturing. From January 2011 until December 2013, Ms. Angelle was Senior Vice President and Chief Accounting Officer for Halliburton, responsible for financial reporting, planning, budgeting, financial analysis and accounting services. From January 2008 until January 2011, Ms. Angelle was Vice President, Corporate Controller and Principal Accounting Officer for Halliburton. From December 2007 until January 2008, Ms. Angelle was Vice President of Operations Finance for Halliburton, leading finance employees located around the world. From April 2005 until November 2007, she also served as Vice President of Investor Relations, overseeing Halliburton’s communications and relationships with investors and analysts. Prior to that, she was responsible for internal and external reporting of consolidated financial statements, technical accounting research and consultation and income tax accounting. Before joining Halliburton, Ms. Angelle worked for 15 years in the audit department of Ernst & Young LLP, where she specialized in serving large, multinational public companies and provided technical accounting and consultation to clients and other professionals. She has served on the Board of Directors and Audit Committee of Forum Energy Technologies, Inc. since 2011. She is a certified public accountant in Texas and a certified management accountant. Ms. Angelle has a Bachelor of Business Administration degree in Accounting from Saint Mary’s College (Notre Dame, Indiana).
Caleb J. Barclay—Executive Vice President and Chief Operating Officer. Caleb Barclay has served as our Executive Vice President and Chief Operating Officer since April 2017 and as the Executive Vice President and Chief Operating Officer of BJS LLC since December 2016. Prior to joining BJ Services, Mr. Barclay served as Chief Operating Officer of Allied Energy Services from June 2016 to January 2017 and, prior to that, served as Vice President of Sanjel USA from November 2013 to June 2016 and various senior management and operational roles at Sanjel USA overseeing Fracturing, Cementing, and Coiled Tubing Operations, Supply Chain, Engineering, and Sales, from December 2003 to June 2013. On April 4, 2016, Sanjel USA filed for protection under the CCAA and a petition for recognition of a foreign proceeding under Chapter 15 of Title 11 of the U.S. Bankruptcy Code. Mr. Barclay began his career in 2000 as a Field Engineer in Fracturing for Schlumberger in the Permian Basin and has over 16 years of experience with oilfield services companies. He holds a Bachelor of Science in Bio-Resource Engineering from Colorado State University.
John R. Bakht—Executive Vice President, General Counsel, Chief Compliance Officer and Secretary. John Bakht has served as our Executive Vice President, General Counsel, Chief Compliance Officer and Secretary since June 2017 and as the Executive Vice President, General Counsel, Chief Compliance Officer and Secretary of BJS LLC since June 2017. From June 2015 through June 2017, Mr. Bakht served as Vice President, General Counsel, Corporate Secretary and Chief Compliance Officer at CARBO Ceramics Inc. Mr. Bakht joined CARBO Ceramics Inc. after 13 years with Baker Hughes Incorporated, where he last served as Vice President – Legal, U.S. Operations, Strategy and Corporate Development, and Reservoir Development Services. Mr. Bakht holds a B.A. in Economics from the University of North Carolina at Chapel Hill and a J.D. from The University of Texas.
Andrew F. J. Gould—Director. Andrew Gould has served on our board of directors since June 2017 and on the board of directors of BJS LLC since January 2017. Mr. Gould has also served as a consultant to BJS LLC since January 2017. Mr. Gould served as the Chairman of the Board of Directors and Chief Executive Officer of Schlumberger Limited from 2003 until his retirement in 2011. Mr. Gould started his career at Schlumberger in 1975 and held various leadership roles throughout the world before his appointment as the Chief Executive Officer. Mr. Gould currently serves as an independent director of Saudi Aramco. He previously served as a non-executive director of Rio Tinto, a resources and mining corporation, from 2002 until 2012, and a non-executive director and Chairman of BG Group, an international exploration and production company, from 2012 until 2016. Mr. Gould has
103
Table of Contents
Index to Financial Statements
a Bachelor’s degree in Economic History from Cardiff University and qualified as a chartered accountant in the United Kingdom. We believe Mr. Gould’s extensive background in the oilfield services business and executive experience make him well qualified to serve on our board of directors.
Scott L. Lebovitz—Director. Scott Lebovitz has served on our board of directors since June 2017 and on the board of directors of BJS LLC since January 2017. Mr. Lebovitz is a member of the Merchant Banking Division of Goldman Sachs & Co. LLC. He leads transaction execution and portfolio management in the energy and power industries. He joined Goldman Sachs in 1997, was named managing director in 2007 and partner in 2012. Mr. Lebovitz also serves on the boards of Edgemarc Energy Holdings, LLC and Energy Future Holdings Corp. Mr. Lebovitz has also served on the boards of Cobalt International Energy, Inc. and Associated Asphalt Partners, L.L.C. Mr. Lebovitz earned a BS from the University of Virginia. We believe Mr. Lebovitz’s extensive background in the energy finance business and banking experience make him well qualified to serve on our board of directors.
Charles S. Leykum—Chairman of the Board. Charles Leykum has served as Chairman of our board of directors since June 2017. Mr. Leykum is a Co-Founder of United Oilfield Services. Mr. Leykum is also the Founding Partner, Founder and Managing Partner at CSL, which he founded in May 2008. He served as a Portfolio Manager at Soros Fund Management from 2004 to 2007, where he managed an energy portfolio and sat on the board of several energy companies. He co-founded and managed several oilfield services businesses and has sourced, evaluated and invested in upstream, midstream and downstream companies, creating significant value for investors. Mr. Leykum served at Goldman Sachs & Co. LLC from 1999 to 2002 in the Principal Investment Area and the Investment Banking Division. Mr. Leykum also serves as the Chairman of the Board for PyraMax Ceramics, LLC and Independence Oilfield Chemicals, LLC. He has also served as an Independent Director of Niko Resources Ltd. from September 12, 2013 to August 13, 2014. Mr. Leykum holds a B.A. from Columbia University and an M.B.A. from Harvard Business School. We believe Mr. Leykum’s knowledge of the energy industry and his transactional experience as a private investor make him well qualified to serve on our board of directors.
William D. Marsh—Director. William D. Marsh has served on our board of directors since June 2017 and on the board of directors of BJS LLC since January 2017. Mr. Marsh has been the Chief Legal Officer of Baker Hughes, a GE company, since July 2017. He was the Vice President and General Counsel of Baker Hughes Incorporated (the predecessor of Baker Hughes, a GE company, LLC) from February 2013 to July 2017. From 2009 to 2013, Mr. Marsh was the Vice President-Legal for the western hemisphere operations of Baker Hughes Incorporated, and from 1998 to 2009, he held various other executive, legal and corporate roles within Baker Hughes Incorporated. He was also a partner at Ballard Spahr LLP from 1997 to 1998. Mr. Marsh served on the Board of Directors of People’s Utah Bancorp from April 2015 until April 2017. Mr. Marsh has a Juris Doctorate and a Bachelor of Science in Accounting from Brigham Young University. We believe Mr. Marsh’s extensive legal experience associated with the oilfield services business make him well qualified to serve on our board of directors.
Derek Mathieson—Director. Derek Mathieson has served on our board of directors since June 2017 and on the board of directors of BJS LLC since January 2017. Mr. Mathieson has been the Chief Marketing and Technology Officer of Baker Hughes, a GE company, since July 2017. He was the Chief Commercial Officer of Baker Hughes Incorporated (the predecessor of Baker Hughes, a GE company, LLC) from May 2016 to July 2017. From 2015 to 2016, Mr. Mathieson served as the Chief Technology and Marketing Officer of Baker Hughes Incorporated, and prior to that, he held various other executive and corporate roles within Baker Hughes Incorporated from 2008 onward. Derek Mathieson has a Ph.D. in electro mechanical systems and a Bachelor’s Degree in electrical and electronic engineering from Heriot-Watt University in Edinburgh, Scotland. He is a chartered engineer with the United Kingdom Engineering Council. We believe that Mr. Mathieson’s extensive experience with the oilfield services business and engineering background make him well qualified to serve on our board of directors.
104
Table of Contents
Index to Financial Statements
James W. Stewart—Director. James W. Stewart has served on our board of directors since June 2017 and on the board of directors of BJS LLC since January 2017. Mr. Stewart served as an independent director at Baker Hughes Incorporated (the predecessor of Baker Hughes, a GE company, LLC) from 2010 until July 2017. Mr. Stewart was the Chairman of the Board of Directors, President and Chief Executive Officer of BJ Services, from 1990 until its acquisition by Baker Hughes Incorporated in 2010. Prior to 1990, Mr. Stewart held various management and staff positions with BJ Services and its predecessor company. Mr. Stewart is a member of the Board of Directors of Delta SubSea, The Alley Theatre of Houston, and a Trustee of the Menil Collection and Chair of the Finance Committee of the Menil Collection. Mr. Stewart has a Bachelor of Science in Electrical Engineering from the University of Texas at Austin and a Juris Doctorate from the University of Houston Law School. We believe Mr. Stewart’s extensive background in the oilfield services business, familiarity with the BJ Services legacy and executive experience make him well qualified to serve on our board of directors.
Brian Worrell—Director. Brian Worrell has served on our board of directors since July 2017. Mr. Worrell has been the Chief Financial Officer of Baker Hughes, a GE company, since July 2017. With 25 years of experience as a financial executive at General Electric Company (“GE”), he most recently served as Chief Financial Officer of GE Oil & Gas, where he led the company’s finance function and global teams since January 2014. Mr. Worrell worked previously as Vice President of corporate financial planning and analysis where he supported GE’s CEO and CFO. He also held the role of Vice President of GE’s corporate audit staff from 2006 to 2010, where he led the team responsible for ensuring financial statement integrity, controllership, compliance, and best practices throughout the company. Worrell joined GE in 1992 as a member of the Financial Management Program and earned an honors degree in economics from the University of North Carolina, Chapel Hill. We believe that Mr. Worrell’s extensive experience with the oilfield services business and financial background make him well qualified to serve on our board of directors.
Dorothy M. Ables—Director. Dorothy M. Ables has served on our board of directors since July 2017. Ms. Ables has more than 31 years of industry experience with Spectra Energy and predecessor companies. Ms. Ables was the Chief Administrative Officer of Spectra Energy Corp. from 2008 to 2017, and she was the Vice President, Audit Services and Chief Ethics and Compliance Officer of Spectra Energy Corp. from 2007 to 2008. Ms. Ables was the Vice President, Audit Services of Duke Energy Corporation from 2004 to 2006, and she was the Senior Vice President and Chief Financial Officer of Duke Energy Gas Transmission from 1998 to 2004. Ms. Ables started her career in the audit department of Peat, Marwick, Mitchell & Co. Ms. Ables also is a member of the board of directors of Cabot Oil & Gas Corporation and served on the board of directors of Spectra Energy Partners from December 2013 to February 2017. Ms. Ables is a current member of the board of directors for Houston Methodist Hospital Foundation and a former member of the board of trustees for the United Way of Greater Houston. Ms. Ables received her Bachelor of Business Administration degree in accounting from the University of Texas at Austin. We believe Ms. Ables’s extensive background in the energy industry and executive experience make her well qualified to serve on our board of directors.
Board of Directors and Committees
Composition of our Board of Directors
When considering whether directors and nominees have the experience, qualifications, attributes or skills, taken as a whole, to enable our board of directors to satisfy its oversight responsibilities effectively in light of our business and structure, the board of directors focuses primarily on each person’s background and experience as reflected in the information discussed in each of the directors’ individual biographies set forth above. We believe that our directors provide an appropriate mix of experience and skills relevant to the size and nature of our business.
105
Table of Contents
Index to Financial Statements
Pursuant to the Shareholders’ Agreement described under “Certain Relationships and Related Party Transactions—Shareholders’ Agreement,” each of our Sponsors and BHGE will be entitled to designate individuals to be included in the slate of nominees recommended by our board of directors for election to our board of directors. Our Sponsors and BHGE have agreed to vote their Class A shares and Class B shares in favor of the directors nominated by such parties pursuant to the Shareholders’ Agreement.
Pursuant to the terms of the Shareholders’ Agreement, directors nominated by each of our Sponsors or BHGE may only be removed with or without cause at the request of the party entitled to nominate such director. In all other cases and at any other time, directors may only be removed for cause by the affirmative vote of at least a majority of the combined voting power of our Class A shares and Class B shares.
Our amended and restated certificate of incorporation and bylaws will provide for the division of our board of directors into three classes, as nearly equal in number as possible, with the directors in each class serving for a three-year term, and one class being elected each year by our shareholders. At each annual meeting of shareholders after the initial classification, the successors to the directors whose terms will then expire will be elected to serve from the time of election and qualification until the third annual meeting following their election. Our directors will be divided among the three classes as follows:
| • | the Class I directors will be , and their terms will expire at the annual meeting of shareholders to be held in 2018; |
| • | the Class II directors will be , and their terms will expire at the annual meeting of shareholders to be held in 2019; and |
| • | the Class III directors will be , and their terms will expire at the annual meeting of shareholders to be held in 2020. |
Any increase or decrease in the number of directors will be distributed among the three classes so that, as nearly as possible, each class will consist of one-third of the directors. This classification of our board of directors may have the effect of delaying or preventing changes in control of our company.
Status as a Controlled Company
Because our Sponsors and BHGE, together with their respective affiliates, will initially own approximately % of the voting power of our capital stock following the completion of this offering, we expect to be a controlled company as of the completion of the offering under Sarbanes-Oxley and NYSE corporate governance standards. A controlled company does not need its board of directors to have a majority of independent directors or to have an independent compensation and nominating and governance committees. As a controlled company, we will remain subject to rules of Sarbanes-Oxley and the NYSE that require us to have an audit committee composed entirely of independent directors. Under these rules, we must have at least one independent director on our audit committee by the date our Class A common stock is listed on the NYSE, at least two independent directors on our audit committee within 90 days of the listing date, and at least three independent directors on our audit committee within one year of the listing date.
If at any time we cease to be a controlled company, we will take all action necessary to comply with Sarbanes-Oxley and NYSE corporate governance standards, including by appointing a majority of independent directors to our board of directors and ensuring we have a compensation committee and a nominating and corporate governance committee, each composed entirely of independent directors, subject to a permitted “phase-in” period.
106
Table of Contents
Index to Financial Statements
Director Independence
Prior to the consummation of this offering, our board of directors undertook a review of the independence of our directors and considered whether any director has a material relationship with us that could compromise that director’s ability to exercise independent judgment in carrying out that director’s responsibilities. Our board of directors has affirmatively determined that Dorothy M. Ables is an “independent director” as defined under the rules of the NYSE.
Audit Committee
Our board of directors will establish an audit committee in connection with this offering whose functions include the following:
| • | assist the board of directors in its oversight responsibilities regarding the integrity of our financial statements, our compliance with legal and regulatory requirements, the independent accountant’s qualifications and independence and our accounting and financial reporting processes of and the audits of our financial statements; |
| • | prepare the report required by the SEC for inclusion in our annual proxy or information statement; |
| • | approve audit and non-audit services to be performed by the independent accountants; and |
| • | perform such other functions as the board of directors may from time to time assign to the audit committee. |
The specific functions and responsibilities of the audit committee will be set forth in the audit committee charter. Rules implemented by the NYSE and the SEC require us to have an audit committee comprised of at least three directors who meet the independence and experience standards established by the NYSE and the Exchange Act, subject to transitional relief during the one-year period following the completion of this offering. Our audit committee initially consists of three directors, one of whom is independent under the rules of the SEC. As required by the rules of the SEC and listing standards of the NYSE, after the applicable transition period, the audit committee will consist solely of independent directors. Dorothy M. Ables (Chair), , and will initially serve as members of our audit committee. Each member of the audit committee is financially literate, and our board of directors has determined that qualifies as an “audit committee financial expert” as defined in applicable SEC rules.
Compensation Committee
Because we expect to be a “controlled company” as of the closing of this offering within the meaning of NYSE corporate governance standards, we will not be required to, and do not currently expect to, have a compensation committee as of the closing of this offering. If and when we are no longer a “controlled company” within the meaning of NYSE corporate governance standards, we will be required to establish a compensation committee. We anticipate that such a compensation committee would consist of three directors each of whom will be “independent” under the rules of the SEC, Sarbanes Oxley and the NYSE. This committee would establish salaries, incentives and other forms of compensation for officers and other employees. Any compensation committee would also administer our incentive compensation and benefit plans. Upon formation of a compensation committee, we would expect to adopt a compensation committee charter defining the committee’s primary duties in a manner consistent with the rules of the SEC, the Public Company Accounting Oversight Board and applicable stock exchange or market standards.
107
Table of Contents
Index to Financial Statements
Nominating and Corporate Governance Committee
Because we expect to be a “controlled company” as of the closing of this offering within the meaning of NYSE corporate governance standards, we will not be required to, and do not currently expect to, have a nominating and corporate governance committee. If and when we are no longer a “controlled company” within the meaning of NYSE corporate governance standards, we will be required to establish a nominating and corporate governance committee. We anticipate that such a nominating and corporate governance committee would consist of three directors each of whom will be “independent” under the rules of the SEC. This committee would identify, evaluate and recommend qualified nominees to serve on our board of directors, develop and oversee our internal corporate governance processes and maintain a management succession plan. Upon formation of a nominating and corporate governance committee, we would expect to adopt a nominating and corporate governance committee charter defining the committee’s primary duties in a manner consistent with the rules of the SEC and NYSE standards.
Compensation Committee Interlocks and Insider Participation
None of our executive officers serve on the board of directors or compensation committee of a company that has an executive officer that serves on our board or compensation committee. No member of our board is an executive officer of a company in which one of our executive officers serves as a member of the board of directors or compensation committee of that company.
Board Role in Risk Oversight
Our corporate governance guidelines will provide that the board of directors is responsible for reviewing the process for assessing the major risks facing us and the options for their mitigation. This responsibility will be largely satisfied by our audit committee, which is responsible for reviewing and discussing with management and our independent registered public accounting firm our major risk exposures and the policies management has implemented to monitor such exposures, including our financial risk exposures and risk management policies.
108
Table of Contents
Index to Financial Statements
EXECUTIVE AND DIRECTOR COMPENSATION
Executive Compensation
This section discusses the material components of the executive compensation program offered to the named executive officers who served with us or our Predecessor during fiscal year 2016, which individuals are:
| • | Warren M. Zemlak; President and Chief Executive Officer; |
| • | Caleb J. Barclay; Executive Vice President and Chief Operating Officer; and |
| • | Eric Snell, Former Chief Executive Officer, Allied OFS. |
We are an “emerging growth company,” within the meaning of the JOBS Act, and have elected to comply with the reduced compensation disclosure requirements available to emerging growth companies under the JOBS Act. For Messrs. Zemlak and Barclay, amounts shown for 2016 represent the compensation paid in respect of our named executive officers’ performance of services rendered to Allied Energy Services since the commencement of their employment in June 2016. For Mr. Snell, amounts shown reflect compensation paid for services to Allied OFS in 2016. Mr. Snell has not served as an executive officer since the consummation of the Baker Hughes North America Land Pressure Pumping transaction in December 2016 and terminated employment on March 31, 2017.
2016 Summary Compensation Table
| Name and Principal Position |
Year | Salary ($) | Bonus ($)(2) | All Other Compensation |
Total ($) | |||||||||||||||
| Warren M. Zemlak |
2016 | 218,750 | (1) | 464,000 | — | 682,750 | ||||||||||||||
| Caleb J. Barclay |
2016 | 154,545 | (1) | 305,000 | — | 459,545 | ||||||||||||||
| Eric Snell |
2016 | 225,000 | 150,000 | 24,000 | (4) | 399,000 | ||||||||||||||
| (1) | Messrs. Zemlak and Barclay commenced service with us in June 2016. The amounts shown reflect a pro-rated salary amount earned for 2016. |
| (2) | Amounts shown represent annual cash performance bonuses earned for 2016 of $164,000 for Mr. Zemlak, $105,000 for Mr. Barclay and $150,000 for Mr. Snell, and, for Messrs. Zemlak and Barclay, cash bonuses of $300,000 and $200,000, respectively, paid in connection with the closing of the Baker Hughes North America Land Pressure Pumping transaction in December 2016. For additional information, refer to the discussion in the “Narrative Disclosure to 2016 Summary Compensation Table” below under the headings “—2016 Annual Incentive Compensation” and “—2016 Transaction Bonus Awards.” |
| (3) | Mr. Snell’s employment terminated effective as of March 31, 2017. |
| (4) | Amount shown represents 401(k) matching contributions and the cost to us of providing Mr. Snell with a company-owned car and fuel expense reimbursements. For additional information, refer to the discussion in the “Narrative Disclosure to 2016 Summary Compensation Table” below under the heading “—Retirement, Health, Welfare and Additional Benefits.” |
Narrative Disclosure to 2016 Summary Compensation Table
The primary elements of compensation for our named executive officers are base salary, annual performance bonuses and, beginning in 2017 for Messrs. Zemlak and Barclay, equity-based
109
Table of Contents
Index to Financial Statements
compensation awards. The named executive officers also participate in employee benefit plans and programs that we offer to our other full-time employees on the same basis.
Base Salaries
We pay our named executive officers a base salary to compensate them for the satisfactory performance of services rendered to our company. The base salary payable to each named executive officer is intended to provide a fixed component of compensation reflecting the executive’s skill set, experience, role and responsibilities. Base salaries for our named executive officers have generally been set at levels deemed necessary to attract and retain individuals with superior talent and were originally established in each named executive officer’s employment agreement or offer letter. The following table shows the annual base salaries for 2016 and 2017 of our named executive officers. Amounts shown for 2016 represent the base salary payable in respect of our named executive officers’ performance of services rendered to Allied Energy Services since the commencement of their employment in June 2016.
| Name |
2016 Annual Base Salary ($) | 2017 Annual Base Salary ($) | ||||||
| Warren M. Zemlak |
375,000 | 425,000 | ||||||
| Caleb J. Barclay |
300,000 | 375,000 | ||||||
| Eric Snell(1) |
225,000 | 225,000 | ||||||
| (1) | Mr. Snell’s employment terminated effective as of March 31, 2017. |
2016 Annual Incentive Compensation
Our named executive officers have the opportunity to earn annual cash bonuses to compensate them for attaining short-term company and individual performance goals. Each named executive officer has an annual target bonus that that is expressed as a percentage of his annual base salary. The 2016 target bonus percentages for our named executive officers in respect of our named executive officers’ performance of services rendered to Allied Energy Services were 75% for Mr. Zemlak, 60% for Mr. Barclay and 67% for Mr. Snell. For 2016, bonuses were paid at 100% of target levels based on an overall satisfactory performance assessment (without reference to specific performance targets), including taking into account the successful completion of the Baker Hughes North America Land Pressure Pumping transaction and Messrs. Zemlak’s and Barclay’s partial years of service in 2016. The actual annual cash bonuses earned by our named executive officers for 2016 were pro-rated for Messrs. Zemlak’s and Barclay’s partial years of service and the amounts awarded to our named executive officers in respect of these cash bonuses were $164,000 for Mr. Zemlak, $105,000 for Mr. Barclay and $150,000 for Mr. Snell. These amounts are reported under the “Bonus” column of the 2016 Summary Compensation Table above.
2016 Transaction Bonus Awards
As part of their compensation for 2016, Messrs. Zemlak and Barclay were eligible to receive a one-time discretionary transaction-related bonus based on the successful completion of the Baker Hughes North America Land Pressure Pumping transaction in December 2016. These bonus amounts were earned as of December 30, 2016 and were paid in March 2017. The amounts awarded to our named executive officers in respect of this cash bonus were $300,000 for Mr. Zemlak and $200,000 for Mr. Barclay. These amounts are reported under the “Bonus” column of the 2016 Summary Compensation Table above.
Equity Compensation
We did not grant any equity compensation awards to our named executive officers in 2016 and, as of December 31, 2016, none of our named executive officers held outstanding equity awards in us.
110
Table of Contents
Index to Financial Statements
In March 2017, Messrs. Zemlak and Barclay received awards in BJS LLC which are nonvoting “profits interests” in BJS LLC. These awards were intended to allow the recipients to share in a percentage of distributions made by BJS LLC after a return of capital invested by the Existing Owners. Subject to continued service with us or any of our subsidiaries, 75% of these 2017 awards are eligible to vest in substantially equal annual installments over a period of four years with the first installment vesting on June 1, 2017 and June 28, 2017 for Messrs. Zemlak and Barclay, respectively, subject to accelerated vesting upon a change in control of BJS LLC and certain similar events (not including the consummation of this offering). Subject to continued service with us or any of our subsidiaries, 25% of these 2017 awards (“CCVUs”) are eligible to vest six months following a change in control of BJS LLC or other similar event, provided that, upon the consummation of this offering, one-half of the CCVUs will vest and any remaining unvested CCVUs will remain eligible to vest twelve months after the consummation of a subsequent change in control transaction. In connection with the consummation of this offering, all of membership interests in BJS LLC, including these Class A Unit awards, will be converted into a single class of LLC Units using an implied equity valuation for BJS LLC prior to the offering based on the initial public offering price for our Class A shares in the offering. These LLC Units, along with other LLC Units held by our executive officers and employees will be contributed to Management Holdings, which is a limited liability company through which our executives and employees will hold all of their interests in BJS LLC. Based on the midpoint of the pricing range shown on the cover of this prospectus, the number of LLC Units into which the Class A Unit awards for our named executive officers will convert is shown in the table below. These LLC Units and the named executives officers’ corresponding interests in Management Holdings will remain subject to the vesting provisions described above.
| Name |
LLC Units (#) | |||
| Warren M. Zemlak |
||||
| Caleb J. Barclay |
||||
Following the consummation of this offering, we may also grant equity compensation awards under our 2017 Incentive Award Plan, which is described in more detail below under “—Our Incentive Award Plan.”
Retirement, Health, Welfare and Additional Benefits
Our named executive officers are eligible to participate in our employee benefit plans and programs, including medical and dental benefits, flexible spending accounts, long-term care benefits, and short- and long-term disability and life insurance, to the same extent as our other full-time employees, subject to the terms and eligibility requirements of those plans.
We sponsor a 401(k) defined contribution plan in which our named executive officers may participate, subject to limits imposed by the Internal Revenue Code, to the same extent as our other full-time employees. Currently, we match 100% of contributions made by participants in the 401(k) plan up to a maximum company match of 5% of a participant’s eligible compensation. However, we did not make matching contributions for Messrs. Zemlak and Barclay in 2016 and for 2016, Mr. Snell participated in a legacy 401(k) program of Allied OFS that included different matching contribution terms. We did not provide any perquisites or special personal benefits to our named executive officers except that for 2016, Mr. Snell was entitled to use of a company-owned car and reimbursement of fuel expenses.
Employment Arrangements
We have entered into employment agreements with Messrs. Zemlak and Barclay. Certain key terms of these agreements are described below.
111
Table of Contents
Index to Financial Statements
The executive employment agreements each have an initial term of three years commencing on January 1, 2017 and December 31, 2016 for Messrs. Zemlak and Barclay, respectively. The agreements provide for an annual base salary in the amount of $425,000 for Mr. Zemlak and $375,000 for Mr. Barclay, and the opportunity to earn an annual performance-based bonus, with a target of 75% of base salary for Mr. Zemlak and 60% of base salary for Mr. Barclay, payable in the sole discretion of our board of directors based on achievement of pre-determined performance conditions. If an executive dies, resigns for Good Reason (as defined below), or is terminated by us upon his disability or without Cause (as defined below), or if the employment agreement is not extended at the end of its term, the executive will be entitled to receive any earned but unpaid bonus amounts for the year prior to the year of termination in addition to the severance amounts described below.
In the event that an executive is terminated without Cause, or resigns for Good Reason, (as such terms are defined below) then, subject to his timely execution of a release of claims in our favor, the executive would be entitled to receive (i) continuation of health benefits at our expense for 12 months (or, if the termination date occurs prior to the first anniversary of the effective date of the employment agreement, 18 months) and (ii) a cash amount equal to the sum of (x) an amount equal to the annual cash bonus paid to the executive for the full calendar year prior to the year in which the date of termination occurs and (y) twelve months of base salary (or, if the termination date occurs prior to the first anniversary of the effective date of the employment agreement, $750,000) in installments in accordance with our normal payroll practices.
Each executive has agreed to refrain from disclosing our confidential information during or at any time following his employment with us and from competing with us or soliciting our employees or customers during his employment and for one year following termination of his employment.
For purposes of each executive’s employment agreement, “Cause” generally means the executive’s (i) breach of a material provision of the employment agreement; (ii) continued failure to perform his duties to the reasonable satisfaction of our board of directors; (iii) any acts of fraud, dishonesty or disloyalty with respect to any aspect of our business, operations or customers; (iv) insubordination, neglect or failure to follow the lawful and reasonable instructions of our board of directors (or, for Mr. Barclay, the chief executive officer); (v) willful or reckless misconduct or gross negligence in the performance of his duties; (vi) the executive’s breach of fiduciary duty or duty of loyalty; (vii) acceptance by the executive of employment or work with another employer or business other than us or our affiliates or the performance of work or services for any such other employer or business without the prior written approval of our board of directors; (viii) any act by the executive attempting to secure or securing any personal profit or benefit not fully disclosed to and approved by our board of directors in connection with any transaction entered into on behalf of us or our affiliates; (ix) the executive’s breach of the restrictive covenants of the employment agreement; (x) the executive’s habitual drug or alcohol abuse, (xi) the executive’s conviction (by plea of nolo contendere, guilty or otherwise) of any (a) felony, (b) of a crime of theft, fraud, or dishonesty, or (c) crime involving moral turpitude; (xii) the executive’s violation of federal or state securities laws or other laws applicable to the business of us or our affiliates; or (xiii) conduct on the part of the executive that could result in serious prejudice to our interests or those of our affiliates.
For purposes of each executive’s employment agreement, “Good Reason” generally means (i) a material diminution in the executive’s responsibilities, duties or authority, or assignment of duties that are materially inconsistent with his position or certain changes of the executive’s reporting relationship; (ii) a material diminution in the executive’s base compensation; or (iii) a breach by us of any material provision of the employment agreement.
112
Table of Contents
Index to Financial Statements
Consulting Agreement
We did not enter into an employment agreement with Mr. Snell that entitled him to any severance or post-termination payments upon a termination of employment. Mr. Snell’s employment terminated effective as of March 31, 2017. In connection with his termination, we entered into a consulting agreement with Mr. Snell, pursuant to which Mr. Snell is entitled to receive an aggregate fee of $1,000,000, payable in three installments during 2017, for his satisfactory performance of general advisory consulting services to us for up to 10 hours per week through the end of 2017. Pursuant to this agreement, Mr. Snell has agreed to refrain from disclosing our confidential information during or at any time following his employment with us and from competing with us or soliciting our vendors, suppliers, customers, clients, employees or former employees until December 31, 2018.
Our Incentive Award Plan
Effective prior to the first public trading date of our Class A common stock, we will have adopted and our shareholders will have approved the 2017 Incentive Award Plan, or the 2017 Plan, under which we may grant cash and equity-based incentive awards to eligible service providers in order to attract, retain and motivate the persons who make important contributions to our company. We anticipate that the 2017 Plan will be adopted with material terms as summarized below.
Eligibility and Administration. Our employees, consultants and directors, and employees and consultants of our subsidiaries, will be eligible to receive awards under the 2017 Plan. The 2017 Plan will be administered by our board of directors, which may delegate its duties and responsibilities to one or more committees of our directors and/or officers (referred to collectively as the plan administrator below), subject to the limitations imposed under the 2017 Plan, Section 16 of the Exchange Act, stock exchange rules and other applicable laws. The plan administrator will have the authority to take all actions and make all determinations under the 2017 Plan, to interpret the 2017 Plan and award agreements and to adopt, amend and repeal rules for the administration of the 2017 Plan as it deems advisable. The plan administrator will also have the authority to determine which eligible service providers receive awards, grant awards and set the terms and conditions of all awards under the 2017 Plan, including any vesting and vesting acceleration provisions, subject to the conditions and limitations in the 2017 Plan.
Award Limits. An aggregate of Class A shares will initially be available for issuance under the 2017 Plan. No more than Class A shares may be issued under the 2017 Plan upon the exercise of incentive stock options. Shares issued under the 2017 Plan may be authorized but unissued shares, shares purchased on the open market or treasury shares.
If an award under the 2017 Plan expires, lapses or is terminated, exchanged for cash, surrendered, repurchased, canceled without having been fully exercised or forfeited, any unused shares subject to the award will again be available for new grants under the 2017 Plan. Awards granted under the 2017 Plan in substitution for any options or other stock or stock-based awards granted by an entity before the entity’s merger or consolidation with us or our acquisition of the entity’s property or stock will not reduce the shares available for grant under the 2017 Plan, but will count against the maximum number of shares that may be issued upon the exercise of incentive stock options.
In addition, the maximum aggregate grant date fair value as determined in accordance with FASB ASC Topic 718 (or any successor thereto), of awards granted to any non-employee director for services as a director pursuant to the 2017 Plan during any fiscal year may not exceed $ (or, in the fiscal year of any director’s initial service, $ ). The plan administrator may, however, make exceptions to such limit on director compensation in extraordinary circumstances, subject to the limitations in the 2017 Plan.
In addition, the aggregate amount of cash that may be paid under the 2017 Plan pursuant to awards that are not denominated in and settled in shares to individuals who are “covered employees”
113
Table of Contents
Index to Financial Statements
within the meaning of Treasury Regulation Section 1.162-27(c)(2) shall not exceed $100 million, provided, however, that this limitation shall no longer apply or otherwise limit the amount of any cash awards after the date of our regular annual shareholders meeting that occurs after the close of the third calendar year following the calendar year in which this offering occurs.
Awards. The 2017 Plan provides for the grant of stock options, including incentive stock options, or ISOs, and nonqualified stock options, or NSOs, stock appreciation rights, or SARs, restricted stock, dividend equivalents, restricted stock units, or RSUs, and other stock or cash based awards. Certain awards under the 2017 Plan may constitute or provide for payment of “nonqualified deferred compensation” under Section 409A of the Code. All awards under the 2017 Plan will be set forth in award agreements, which will detail the terms and conditions of awards, including any applicable vesting and payment terms and post-termination exercise limitations. A brief description of each award type follows.
| • | Stock Options and SARs. Stock options provide for the purchase of Class A shares in the future at an exercise price set on the grant date. ISOs, by contrast to NSOs, may provide tax deferral beyond exercise and favorable capital gains tax treatment to their holders if certain holding period and other requirements of the Code are satisfied. SARs entitle their holder, upon exercise, to receive from us an amount equal to the appreciation of the shares subject to the award between the grant date and the exercise date. The plan administrator will determine the number of shares covered by each option and SAR, the exercise price of each option and SAR and the conditions and limitations applicable to the exercise of each option and SAR. The exercise price of a stock option or SAR will not be less than 100% of the fair market value of the underlying share on the grant date (or 110% in the case of ISOs granted to certain significant shareholders), except with respect to certain substitute awards granted in connection with a corporate transaction. The term of a stock option or SAR may not be longer than ten years (or five years in the case of ISOs granted to certain significant shareholders). The maximum aggregate number of shares of Class A common stock with respect to one or more options or SARs that may be granted to any one person during any fiscal year of the company will be . |
| • | Restricted Stock and RSUs. Restricted stock is an award of nontransferable Class A shares that remain forfeitable unless and until specified conditions are met and which may be subject to a purchase price. RSUs are contractual promises to deliver shares of our Class A common stock in the future, which may also remain forfeitable unless and until specified conditions are met and may be accompanied by the right to receive the equivalent value of dividends paid on Class A shares prior to the delivery of the underlying shares. The plan administrator may provide that the delivery of the shares underlying RSUs will be deferred on a mandatory basis or at the election of the participant. The terms and conditions applicable to restricted stock and RSUs will be determined by the plan administrator, subject to the conditions and limitations contained in the 2017 Plan. |
| • | Other Stock or Cash Based Awards. Other stock or cash based awards are awards of cash, fully vested Class A shares and other awards valued wholly or partially by referring to, or otherwise based on, Class A shares or other property. Other stock or cash based awards may be granted to participants and may also be available as a payment form in the settlement of other awards, as standalone payments and as payment in lieu of compensation to which a participant is otherwise entitled. The plan administrator will determine the terms and conditions of other stock or cash based awards, which may include any purchase price, performance goal, transfer restrictions and vesting conditions. |
Performance Criteria. The plan administrator may select performance criteria for an award to establish performance goals for a performance period. Performance criteria under the 2017 Plan may
114
Table of Contents
Index to Financial Statements
include, but are not limited to, the following: net earnings or losses (either before or after one or more of interest, taxes, depreciation, amortization, and non-cash equity-based compensation expense); gross or net sales or revenue or sales or revenue growth; net income (either before or after taxes) or adjusted net income; profits (including but not limited to gross profits, net profits, profit growth, net operation profit, or economic profit), profit return ratios or operating margin; budget or operating earnings (either before or after taxes or before or after allocation of corporate overhead and bonus); cash flow (including operating cash flow and free cash flow or cash flow return on capital); return on assets; return on capital or invested capital; cost of capital; return on equity; total shareholder return; return on sales; costs, reductions in costs and cost control measures; expenses; working capital; earnings or loss per share; adjusted earnings or loss per share; price per share or dividends per share (or appreciation in or maintenance of such price or dividends); regulatory achievements or compliance; implementation, completion or attainment of objectives relating to research, development, regulatory, commercial, or strategic milestones or developments; market share; economic value or economic value added models; division, group or corporate financial goals; customer satisfaction/growth; customer service; employee satisfaction; recruitment and maintenance of personnel; human resources management; supervision of litigation and other legal matters; strategic partnerships and transactions; financial ratios (including those measuring liquidity, activity, profitability or leverage); debt levels or reductions; sales-related goals; financing and other capital raising transactions; cash on hand; acquisition activity; investment sourcing activity; safety; and marketing initiatives, any of which may be measured in absolute terms or as compared to any incremental increase or decrease. Such performance goals also may be based solely by reference to the company’s performance or the performance of a subsidiary, division, business segment or business unit of the company or a subsidiary, or based upon performance relative to performance of other companies or upon comparisons of any of the indicators of performance relative to performance of other companies. When determining performance goals, the plan administrator may provide for exclusion of the impact of an event or occurrence which the plan administrator determines should appropriately be excluded, including, without limitation, non-recurring charges or events, acquisitions or divestitures, changes in the corporate or capital structure, events unrelated to the business or outside of the control of management, foreign exchange considerations, and legal, regulatory, tax or accounting changes.
Certain Transactions. In connection with certain corporate transactions and events affecting our Class A common stock, including a change in control, or change in any applicable laws or accounting principles, the plan administrator has broad discretion to take action under the 2017 Plan to prevent the dilution or enlargement of intended benefits, facilitate the transaction or event or give effect to the change in applicable laws or accounting principles. This includes canceling awards for cash or property, accelerating the vesting of awards, providing for the assumption or substitution of awards by a successor entity, adjusting the number and type of shares subject to outstanding awards and/or with respect to which awards may be granted under the 2017 Plan and replacing or terminating awards under the 2017 Plan. In addition, in the event of certain non-reciprocal transactions with our shareholders, the plan administrator will make equitable adjustments to the 2017 Plan and outstanding awards as it deems appropriate to reflect the transaction.
Plan Amendment and Termination. Our board of directors may amend or terminate the 2017 Plan at any time; however, no amendment, other than an amendment that increases the number of shares available under the 2017 Plan, may materially and adversely affect an award outstanding under the 2017 Plan without the consent of the affected participant and shareholder approval will be obtained for any amendment to the extent necessary to comply with applicable laws. Further, the plan administrator cannot, without the approval of our shareholders, amend any outstanding stock option or SAR to reduce its price per share. The 2017 Plan will remain in effect until the tenth anniversary of its effective date, unless earlier terminated by our board of directors. No awards may be granted under the 2017 Plan after its termination.
115
Table of Contents
Index to Financial Statements
Foreign Participants, Claw-Back Provisions, Transferability and Participant Payments. The plan administrator may modify awards granted to participants who are foreign nationals or employed outside the United States or establish subplans or procedures to address differences in laws, rules, regulations or customs of such foreign jurisdictions. All awards will be subject to any company claw-back policy as set forth in such claw-back policy or the applicable award agreement. Except as the plan administrator may determine or provide in an award agreement, awards under the 2017 Plan are generally non-transferrable, except by will or the laws of descent and distribution, or, subject to the plan administrator’s consent, pursuant to a domestic relations order, and are generally exercisable only by the participant. With regard to tax withholding obligations arising in connection with awards under the 2017 Plan, and exercise price obligations arising in connection with the exercise of stock options under the 2017 Plan, the plan administrator may, in its discretion, accept cash, wire transfer or check, Class A shares that meet specified conditions, a promissory note, a “market sell order,” such other consideration as the plan administrator deems suitable or any combination of the foregoing.
Director Compensation
Our or our subsidiaries’ officers, employees, consultants or advisors who also serve as directors do not receive additional compensation for their service as directors. Our directors who are not our or our subsidiaries’ officers, employees, consultants or advisors, who we refer to as our non-employee directors, will receive cash and equity-based compensation for their services as directors.
We did not pay or accrue any director compensation for 2016 or prior periods other than with respect to Mr. Gould, as set forth in the table below under the heading “2016 Director Compensation.” Our board of directors will approve the initial terms of our non-employee director compensation program, which is expected to consist of the following:
| • | an annual retainer of $ ; |
| • | an additional annual retainer for service on each standing committee as follows: |
| • | Audit: $ ($ for Chair); |
| • | Compensation: $ ($ for Chair); |
| • | Nominating and Governance: $ ($ for Chair); and |
| • | an annual equity-based award granted under our 2017 Plan, having a value as of the grant date of approximately $ . |
Non-employee directors will also receive reimbursement for out-of-pocket expenses associated with attending board or committee meetings and director and officer liability insurance coverage. Each director will be fully indemnified by us for actions associated with being a director to the fullest extent permitted under Delaware law.
2016 Director Compensation
| Name |
All Other Compensation ($)(1) |
Total ($) | ||
| Andrew F. J. Gould |
1,503 | 1,503 |
| (1) | On December 30, 2016, BJS LLC entered into a consulting agreement with Mr. Gould, pursuant to which Mr. Gould provides consulting services and is entitled to receive an annual fee of $275,000. The amount shown in this column reflects the pro-rated portion of consulting fees earned by Mr. Gould in 2016. For additional information, see “Certain Relationships and Related Party Transactions—Consulting Agreement.” |
116
Table of Contents
Index to Financial Statements
Incorporation of BJ Services, Inc.
BJ Services, Inc. was incorporated by the Joint Venture as a Delaware corporation in March 2017. Following this offering and the transactions described below, BJ Services, Inc. will be a holding company whose sole material asset will consist of a membership interest in BJS LLC. BJS LLC owns, directly or indirectly, all of the outstanding equity interests in the operating subsidiaries through which we operate our assets. After the consummation of the transactions described below, BJ Services, Inc. will be the sole managing member of BJS LLC and will be responsible for all operational, management and administrative decisions relating to BJS LLC’s business and will consolidate the financial results of BJS LLC and its subsidiaries.
In connection with this offering, (a) all of the membership interests (including outstanding incentive units) in BJS LLC held by the Existing Owners will be converted into a single class of units in BJS LLC, the LLC Units, using an implied equity valuation for BJS LLC prior to the offering based on the initial public offering price to the public for our Class A shares set forth on the cover page of this prospectus and the current relative levels of ownership in BJS LLC, (b) BJ Services, Inc. will contribute all of the net proceeds we receive from this offering to BJS LLC in exchange for LLC Units and (c) the Existing Owners will purchase for par value a number of Class B shares equal to the number of LLC Units held by such Existing Owners following this offering. After giving effect to these transactions and the offering contemplated by this prospectus, BJ Services, Inc. will own an approximate % interest in BJS LLC (or % if the underwriters’ option to purchase additional Class A shares is exercised in full) and the Existing Owners will own an approximate % interest in BJS LLC (or % if the underwriters’ option to purchase additional Class A shares is exercised in full). Please see “Principal Shareholders.”
Each Class B share has no economic rights but entitles its holder to one vote on all matters to be voted on by shareholders generally. Holders of Class A shares and Class B shares will vote together as a single class on all matters presented to our shareholders for their vote or approval, except as otherwise required by applicable law or by our certificate of incorporation. We do not intend to list Class B shares on any stock exchange.
The Existing Owners will have the Redemption Right, subject to the Cash Option, as described under “Certain Relationships and Related Party Transactions—BJS LLC Agreement.” In addition, each of our Sponsors and BHGE will have the right, under certain circumstances, to cause us to register the offer and resale of their respective Class A shares as described under “Certain Relationships and Related Party Transactions—Registration Rights Agreement.”
117
Table of Contents
Index to Financial Statements
The following diagram indicates our simplified ownership structure immediately following this offering and the transactions related thereto (assuming that the underwriters’ option to purchase additional shares is not exercised):
The Offering
Only Class A shares will be sold to investors pursuant to this offering. Immediately following this offering, there will be Class A shares issued and outstanding and Class A shares reserved for exchanges of LLC Units and Class B shares pursuant to the BJS LLC Agreement. We estimate that our net proceeds from this offering, after deducting estimated underwriting discounts and commissions and other offering related expenses payable by us, will be approximately $ million (or $ million if the underwriters exercise in full their option to purchase additional Class A shares). We intend to contribute all of the net proceeds we receive from this offering to BJS LLC, and we expect BJS LLC to use: approximately $ million of the proceeds for expanding its fleet, investing in improving the reliability of its fleet by performing upgrades to extend component life, facility improvements to optimize its fleet refurbishment program; approximately $ million of the proceeds for performing additional research and development; and the remainder of the proceeds for other general corporate purposes, including to repay borrowings outstanding under our ABL credit facility from time to time, in exchange for LLC Units.
As a result of the corporate reorganization and the offering described above (and prior to any exchanges of LLC Units):
| • | the investors in this offering will collectively own Class A shares (or Class A shares if the underwriters exercise in full their option to purchase additional Class A shares); |
118
Table of Contents
Index to Financial Statements
| • | We will hold LLC Units; |
| • | the Existing Owners will hold (i) Class A shares and (ii) Class B shares and a corresponding number of LLC Units; |
| • | the investors in this offering will collectively hold % of the total voting power in us; and |
| • | assuming no exercise of the underwriters’ option to purchase additional Class A shares, the Existing Owners will hold % of the voting power in us (or % if the underwriters exercise in full their option to purchase additional Class A shares). |
Holding Company Structure
Our post-offering organizational structure will allow the LLC Unit Holders to retain their equity ownership in BJS LLC, a partnership for U.S. federal income tax purposes. Investors in this offering will, by contrast, hold their equity ownership in the form of our Class A shares, and we are classified as a domestic corporation for U.S. federal income tax purposes. We believe that the LLC Unit Holders find it advantageous to hold their equity interests in an entity that is not taxable as a corporation for U.S. federal income tax purposes. The LLC Unit Holders will generally incur U.S. federal, state and local income taxes on their proportionate share of any taxable income of BJS LLC.
In addition, pursuant to our amended and restated certificate of incorporation and the BJS LLC Agreement, our capital structure and the capital structure of BJS LLC will generally replicate one another and will provide for customary antidilution mechanisms in order to maintain the one-for-one exchange ratio between the number of LLC Units held by us and the number of our outstanding Class A shares, among other things.
The holders of LLC Units, including us, will generally incur U.S. federal, state and local income taxes on their proportionate share of any taxable income of BJS LLC and will be allocated their proportionate share of any taxable loss of BJS LLC. Under the terms of the BJS LLC Agreement, BJS LLC will be obligated to make tax distributions to holders of its LLC Units, including us, except to the extent such distributions would render BJS LLC insolvent or are otherwise prohibited by law or our ABL credit facility or any of our future debt agreements. Generally, these tax distributions will be computed based on our estimate of the taxable income of BJS LLC that is allocable to a holder of LLC Units, multiplied by an assumed tax rate equal to the highest effective marginal combined U.S. federal, state and local income tax rate prescribed for an individual (or, if higher, a corporation) resident in New York (taking into account the nondeductibility of certain expenses and the character of the allocated income).
We may accumulate cash balances in future years resulting from distributions from BJS LLC exceeding our tax liabilities and our obligations to make payments under the Tax Receivable Agreement. To the extent we do not distribute such cash balances as a dividend on our Class A common stock and instead decide to hold or recontribute such cash balances to BJS LLC for use in its operations, LLC Unit Holders who exchange their LLC Units for Class A shares in the future could also benefit from any value attributable to any such accumulated cash balances.
We will enter into a Tax Receivable Agreement with BJS LLC and the Existing Owners. Pursuant to the Tax Receivable Agreement, we will be required to make cash payments to the Existing Owners equal to 85% of the amount of tax benefits, if any, that we actually realize (or are deemed to realize in certain circumstances) in periods after this offering as a result of (i) increases in tax basis resulting from any redemptions of LLC Units described under “Certain Relationships and Related Party Transactions—BJS LLC Agreement” or in connection with this offering and (ii) certain other tax benefits related to our entering into the Tax Receivable Agreement, including tax benefits attributable to
119
Table of Contents
Index to Financial Statements
payments under the Tax Receivable Agreement. We will retain the benefit of the remaining 15% of these cash savings. We will be dependent on distributions from BJS LLC to make these payments under the Tax Receivable Agreement, and neither the timing nor the amount of any such distributions can be guaranteed. Payments under the Tax Receivable Agreement are not conditioned upon the Existing Owners maintaining a continued ownership interest in BJS LLC or us and, in the event that the Tax Receivable Agreement is not terminated, the payments under the Tax Receivable Agreement are anticipated to commence in the year following the first year that the Existing Owners redeem their units in a secondary offering and to continue for 15 years after the date of the last redemption or exchange of the LLC Units. See “Certain Relationships and Related Party Transactions—Tax Receivable Agreement” for a discussion of the Tax Receivable Agreement and the related likely benefits to be realized by us and the Existing Owners.
120
Table of Contents
Index to Financial Statements
The following table sets forth the beneficial ownership of our Class A shares and Class B shares that, upon the consummation of this offering, will be owned by:
| • | each person known to us to beneficially own more than 5% of any class of our outstanding common stock, including our Sponsors and BHGE; |
| • | each of our directors; |
| • | each of our named executive officers; and |
| • | all of our directors and executive officers as a group. |
The amounts and percentage of shares of Class A shares and Class B shares beneficially owned are reported on the basis of regulations of the SEC governing the determination of beneficial ownership of securities. Under the rules of the SEC, a person is deemed to be a “beneficial owner” of a security if that person has or shares “voting power,” which includes the power to vote or to direct the voting of such security, or “investment power,” which includes the power to dispose of or to direct the disposition of such security. In computing the number of shares beneficially owned by a person and the percentage ownership of that person, shares of common stock subject to options or warrants held by that person that are currently exercisable or exercisable within 60 days of the date of this prospectus, if any, are deemed outstanding, but are not deemed outstanding for computing the percentage ownership of any other person. Except as indicated by footnote, the persons named in the table below have sole voting and investment power with respect to all shares of Class A common stock or Class B common stock shown as beneficially owned by them, subject to community property laws where applicable.
The underwriters have an option to purchase a maximum of additional Class A shares from us. The following table assumes no exercise of such option. The following table also does not include any shares of common stock that directors, director nominees and named executive officers may purchase in this offering through the directed share program described under “Underwriting.”
| Shares Beneficially Owned Before this Offering(2) |
Shares Beneficially Owned After this Offering(2) | |||||||||||||||||||||||||||||||
| Name of Beneficial Owner(1) |
Class A Common Stock |
Class B Common Stock |
Combined Voting Power(3) |
|||||||||||||||||||||||||||||
| Number | Percentage | Number | Percentage | Number | Percentage | Number | Percentage | |||||||||||||||||||||||||
| 5% or Greater Shareholders |
||||||||||||||||||||||||||||||||
| CSL(4) |
% | % | % | % | ||||||||||||||||||||||||||||
| Goldman Sachs Affiliated Funds(5) |
% | % | % | % | ||||||||||||||||||||||||||||
| Baker Hughes, a GE company, LLC(6) |
% | % | % | % | ||||||||||||||||||||||||||||
| Directors/Named Executive Officers |
% | % | % | % | ||||||||||||||||||||||||||||
| Warren M. Zemlak |
% | % | % | % | ||||||||||||||||||||||||||||
| Evelyn M. Angelle |
% | % | % | % | ||||||||||||||||||||||||||||
| Caleb J. Barclay |
% | % | % | % | ||||||||||||||||||||||||||||
| John R. Bakht |
% | % | % | % | ||||||||||||||||||||||||||||
| Andrew F. J. Gould |
% | % | % | % | ||||||||||||||||||||||||||||
| Scott L. Lebovitz |
% | % | % | % | ||||||||||||||||||||||||||||
| Charles S. Leykum |
% | % | % | % | ||||||||||||||||||||||||||||
| William D. Marsh |
% | % | % | % | ||||||||||||||||||||||||||||
| Derek Mathieson |
% | % | % | % | ||||||||||||||||||||||||||||
| James W. Stewart |
% | % | % | % | ||||||||||||||||||||||||||||
| Brian Worrell |
% | % | % | % | ||||||||||||||||||||||||||||
| Dorothy M. Ables |
% | % | % | % | ||||||||||||||||||||||||||||
| All Directors and Executive Officers as a group ( persons) |
% | % | % | % | ||||||||||||||||||||||||||||
| * | Less than 1%. |
| (1) | Unless otherwise indicated, the address for each beneficial owner in this table is c/o BJ Services, Inc., 11211 FM 2920, Tomball, Texas 77375. |
121
Table of Contents
Index to Financial Statements
| (2) | Subject to the terms of the BJS LLC Agreement, the LLC Unit Holders will have the right to exchange all or a portion of their LLC Units (together with a corresponding number of Class B shares) for Class A shares (or the Cash Option) at an exchange ratio of one Class A share for each LLC Unit (and corresponding Class B share) exchanged. See “Certain Relationships and Related Person Transactions—BJS LLC Agreement.” Pursuant to Rule 13d-3 under the Exchange Act, a person has beneficial ownership of a security as to which that person, directly or indirectly, through any contract, arrangement, understanding, relationship, or otherwise has or shares voting power and/or investment power of such security and as to which that person has the right to acquire beneficial ownership of such security within 60 days. The Company has the option to deliver cash in lieu of Class A shares upon exercise by a LLC Unit Holder of its Redemption Right. As a result, beneficial ownership of Class B shares and LLC Units is not reflected as beneficial ownership of Class A shares for which such units and stock may be exchanged. |
| (3) | Represents percentage of voting power of our Class A shares and Class B shares voting together as a single class. The LLC Unit Holders will hold one Class B share for each LLC Unit that they own. Each Class B share has no economic rights, but entitles the holder thereof to one vote for each LLC Unit held by such holder. Accordingly, the LLC Unit Holders collectively have a number of votes in the Company equal to the number of LLC Units that they hold. See “Corporation Reorganization,” “Description of Capital Stock—Class A Common Stock” and “—Class B Common Stock.” |
| (4) | Represents Class B shares held by an affiliate of CSL, Allied Completions Holdings, LLC (“Allied Holdings”). Allied Holdings is managed by a board of managers, a majority of which is selected by CSL Completions Co-Invest, LLC (“CSL Completions”). CSL Completions is controlled by its managing member, CSL Completions Co-Invest Advisors, LLC (“CSL Advisors”), which is controlled by its managing member, Charles Leykum. Mr. Leykum serves as Chairman of our board of directors and also serves on the board of managers of Allied Holdings. Allied Holdings, CSL Completions CSL Advisors and Mr. Leykum each disclaim beneficial ownership of the Class B shares owned by the Joint Venture, except to the extent of their pecuniary interest therein, if any. The address for Allied Holdings, CSL Completions, CSL Advisors and Mr. Leykum is c/o CSL Capital Management, LLC, 1000 Louisiana Street, Suite 3850, Houston, Texas 77002. |
| (5) | Consists of (i) Class A shares held directly by , an entity newly formed to hold Class A shares contributed by certain investment funds and affiliated with Goldman Sachs & Co. LLC (the “Goldman Sachs Affiliated Funds”), and (ii) Class B shares held by the Goldman Sachs Affiliated Funds indirectly through Allied Energy JV Contribution, LLC. The Goldman Sachs Group, Inc. and certain affiliates, including Goldman Sachs & Co. LLC, may be deemed to directly or indirectly own the Class A shares and Class B shares which are owned directly or indirectly by the Goldman Sachs Affiliated Funds (of which affiliates of The Goldman Sachs Group, Inc. and Goldman, Sachs & Co. are the general partner, limited partner or the managing partner). Goldman Sachs & Co. LLC is the investment manager for certain of the Goldman Sachs Affiliated Funds. Goldman Sachs & Co. LLC is a wholly owned subsidiary of The Goldman Sachs Group, Inc. The Goldman Sachs Group, Inc., Goldman Sachs & Co. LLC, and the Goldman Sachs Affiliated Funds share voting power and investment power with certain of their respective affiliates. The Goldman Sachs Group, Inc. and Goldman Sachs & Co. LLC each disclaim beneficial ownership of the Class A shares and Class B shares owned directly or indirectly by the Goldman Sachs Affiliated Funds, except to the extent of their pecuniary interest therein, if any. The address for the Goldman Sachs Affiliated Funds, The Goldman Sachs Group, Inc. and Goldman Sachs & Co. LLC is 200 West Street, New York, New York 10282. |
| (6) | EHHC Newco, LLC (“EHHC LLC”) is the sole managing member of BHGE. Baker Hughes, a GE company (“BHGE PubCo”), a publicly traded company on the NYSE, is the sole managing member of EHHC Newco, LLC. General Electric Company, a publicly traded company on the NYSE, and BHGE PubCo hold an approximately 62.5% and 37.5% economic interest in BHGE, respectively. The address for BHGE is 17021 Aldine Westfield Road, Houston, Texas 77073. |
122
Table of Contents
Index to Financial Statements
CERTAIN RELATIONSHIPS AND RELATED PARTY TRANSACTIONS
Procedures for Review, Approval and Ratification of Related Person Transactions
Our board of directors will adopt a code of business conduct and ethics in connection with the completion of this offering that will provide that the board of directors or its authorized committee will review on at least a quarterly basis all transactions with related persons that are required to be disclosed under SEC rules and, when appropriate, initially authorize or ratify all such transactions. In connection with this offering, we will establish an audit committee that, following applicable phase-in periods, will consist solely of independent directors whose functions will be set forth in the audit committee charter. We anticipate that one of the audit committee’s functions will be to review and approve all relationships and transactions in which we and our directors, director nominees and executive officers and their immediate family members, as well as holders of more than 5% of any class of our voting securities and their immediate family members, have a direct or indirect material interest. We anticipate that such policy will be a written policy included as part of the audit committee charter that will be implemented by the audit committee and in the code of business conduct and ethics that our board of directors will adopt prior to the completion of this offering.
The code of business conduct and ethics will provide that, in determining whether or not to recommend the initial approval or ratification of a transaction with a related person, the board of directors or its authorized committee should consider all of the relevant facts and circumstances available, including (if applicable) but not limited to: (i) whether there is an appropriate business justification for the transaction; (ii) the benefits that accrue to us as a result of the transaction; (iii) the terms available to unrelated third parties entering into similar transactions; (iv) the impact of the transaction on a director’s independence (in the event the related person is a director, an immediate family member of a director or an entity in which a director or an immediate family member of a director is a partner, shareholder, member or executive officer); (v) the availability of other sources for comparable services; (vi) whether it is a single transaction or a series of ongoing, related transactions; and (vii) whether entering into the transaction would be consistent with the code of business conduct and ethics.
A “related person” means:
| • | any person who is, or at any time during the applicable period was, one of our executive officers or one of our directors; |
| • | any person who is known by us to be the beneficial owner of more than 5.0% of our common stock; |
| • | any immediate family member of any of the foregoing persons, which means any child, stepchild, parent, stepparent, spouse, sibling, mother-in-law, father-in-law, son-in-law, daughter-in-law, brother-in-law or sister-in-law of a director, executive officer or a beneficial owner of more than 5.0% of our common stock, and any person (other than a tenant or employee) sharing the household of such director, executive officer or beneficial owner of more than 5.0% of our common stock; and |
| • | any firm, corporation or other entity in which any of the foregoing persons is a partner or principal or in a similar position or in which such person has a 10.0% or greater beneficial ownership interest. |
The code of business conduct and ethics above will be adopted in connection with the completion of this offering and, therefore, the transactions described below were not reviewed under such policy.
123
Table of Contents
Index to Financial Statements
BJS LLC Agreement
The BJS LLC Agreement is filed as an exhibit to the registration statement of which this prospectus forms a part, and the following description of the BJS LLC Agreement is qualified in its entirety by reference thereto.
The BJS LLC Agreement will provide a redemption right to the Existing Owners the (“Redemption Right”) which will entitle them to have their LLC Units redeemed from time to time at their election for, at our election, newly-issued Class A shares on a one-for-one basis or a cash payment equal to a volume weighted average market price of one of our Class A shares for each LLC Units redeemed (or, if the Class A shares are not traded on a securities exchange, then for a cash payment equal to the fair market value of one Class A share, as determined by a majority of our independent directors (within the meaning of the rules of the NYSE)), in each case in accordance with the terms of the BJS LLC Agreement; provided that, at our election, we may effect a direct exchange of the Class A shares or such cash, as applicable, for such LLC Units. The Existing Owners may exercise such Redemption Right for as long as their LLC Units remain outstanding. In connection with the exercise of the redemption or exchange of LLC Units (i) the Existing Owners will be required to surrender a number of our Class B shares registered in the name of such redeeming or exchanging Existing Owner, which we will cancel for no consideration on a one-for-one basis with the number of LLC Units so redeemed or exchanged and (ii) all redeeming members will surrender LLC Units to BJS LLC for cancellation.
The BJS LLC Agreement will require that we contribute cash or Class A shares, as applicable, to BJS LLC in exchange for an amount of newly-issued LLC Units in BJS LLC that will be issued to us equal to the number of LLC Units redeemed from the Existing Owners. BJS LLC will then distribute the cash or Class A shares, as applicable, to such Existing Owner to complete the redemption. In the event of such election by an Existing Owner, we may, at our option, effect a direct exchange of cash or Class A shares, as applicable, for such LLC Units in lieu of such a redemption. Whether by redemption or exchange, we are obligated to ensure that at all times the number of LLC Units that we own equals the number of our outstanding Class A shares (subject to certain exceptions for treasury shares and shares underlying certain convertible or exchangeable securities).
Under the BJS LLC Agreement, we will have the right to determine when distributions will be made to the holders of LLC Units and the amount of any such distributions. Following this offering, if we authorize a distribution, such distribution will be made to the holders of LLC Units on a pro rata basis in accordance with their respective percentage ownership of LLC Units.
The BJS LLC Agreement will provide that, except as otherwise determined by us, at any time we issue a share of our Class A common stock or any other equity security, the net proceeds received by us with respect to such issuance, if any, shall be concurrently invested in BJS LLC, and BJS LLC shall issue to us one LLC Unit or other economically equivalent equity interest. Conversely, if at any time, any Class A shares are redeemed, repurchased or otherwise acquired, BJS LLC shall redeem, repurchase or otherwise acquire an equal number of LLC Units held by us, upon the same terms and for the same price, as the Class A shares are redeemed, repurchased or otherwise acquired.
Under the BJS LLC Agreement, the members have agreed that the LLC Unit Holders and/or their respective affiliates will be permitted to engage in business activities or invest in or acquire businesses which may compete with our business or do business with any client of ours.
BJS LLC will be dissolved only upon the first to occur of (i) the sale of substantially all of its assets or (ii) an election by us to dissolve BJS LLC. Upon dissolution, BJS LLC will be liquidated and the proceeds from any liquidation will be applied and distributed in the following manner: (a) first, to creditors (including to the extent permitted by law, creditors who are members) in satisfaction of the
124
Table of Contents
Index to Financial Statements
liabilities of BJS LLC, (b) second, to establish cash reserves for contingent or unforeseen liabilities and (c) third, to the members in proportion to the number of LLC Units owned by each of them.
Tax Receivable Agreement
We expect to obtain an increase in our share of the tax basis of the assets of BJS LLC when (as described above under “—BJS LLC Agreement”) an Existing Owner receives Class A shares or, if we or BJS LLC elect, cash in connection with an exercise of such Existing Owner’s right to have LLC Units held by such Existing Owner redeemed by BJS LLC or, at our election, directly exchanged (such basis increases, the “Basis Adjustments”). We intend to treat such acquisition of LLC Units as our direct purchase of LLC Units from an Existing Owner for U.S. federal income and other applicable tax purposes, regardless of whether such LLC Units are surrendered by an Existing Owner to BJS LLC for redemption or sold to us upon the exercise of our election to acquire such LLC Units directly. A Basis Adjustment may have the effect of reducing the amounts that we would otherwise pay in the future to various tax authorities. The Basis Adjustments may also decrease gains (or increase losses) on future dispositions of certain capital assets to the extent tax basis is allocated to those capital assets.
In connection with the transactions described above, we will enter into a Tax Receivable Agreement with BJS LLC and the Existing Owners that will provide for the payment by us to such persons of 85% of the amount of tax benefits, if any, we actually realize, or in some circumstances are deemed to realize, as a result of the transactions described above, including the Basis Adjustments, any tax basis increases resulting from any payments we make under the Tax Receivable Agreement and imputed interest deemed to be paid by us as a result of payments made under the Tax Receivable Agreement. BJS LLC will have in effect an election under Section 754 of the Code effective for each taxable year in which a redemption or exchange (including deemed exchange) of LLC Units for cash or stock occurs. These tax benefit payments are not conditioned upon one or more of the Existing Owners maintaining a continued ownership interest in BJS LLC or us and, in the event that the Tax Receivable Agreement is not terminated, the payments under the Tax Receivable Agreement are anticipated to commence in the year following the first year that the Existing Owners redeem their units in a secondary offering and to continue for 15 years after the date of the last redemption or exchange of the LLC Units. In general, each Existing Owner’s rights under the Tax Receivable Agreement are assignable, including to transferees of its LLC Units (other than us as transferee pursuant to a redemption or exchange of LLC Units). We expect to benefit from the remaining 15% of the tax benefits, if any, that we may actually realize.
At the time of a redemption or exchange of LLC Units, we will record a liability to reflect the future payments under the Tax Receivable Agreement. Further, we anticipate that we will account for the effect of the Basis Adjustments and associated payments under the Tax Receivable Agreement arising from future redemptions or exchanges as follows:
| • | when future redemptions or exchanges occur, we will record a deferred tax asset for the gross amount of the income tax effect along with an offset of 85% of this asset as a payable under the Tax Receivable Agreement; the remaining difference between the deferred tax asset and tax receivable agreement liability will be recorded as additional paid-in capital; |
| • | to the extent we have recorded a deferred tax asset for a Basis Adjustment to which a benefit is no longer expected to be realized due to lower future taxable income, we will reduce the deferred tax asset with a valuation allowance; and |
| • | the initial accounting for any deferred tax asset or liability recorded in connection with our purchase of LLC Units prior to or in connection with the offering and the initial accounting for any subsequent redemptions are recorded in equity. The valuation allowance assessment with respect to the deferred tax asset will be based on whether available evidence supports the “more-likely-than-not” threshold for recognizing the deferred tax asset, whereas the |
125
Table of Contents
Index to Financial Statements
| assessment of the tax receivable agreement liability will be recognized when a payment is probable and reasonably estimable. The subsequent accounting for any changes to previously recorded liabilities and deferred tax assets are recognized in earnings. |
The actual Basis Adjustments, as well as any amounts paid to the Existing Owners under the Tax Receivable Agreement, will vary depending on a number of factors, including:
| • | the timing of any future redemptions or exchanges—for instance, the increase in any tax deductions will vary depending on the fair value, which may fluctuate over time, of the depreciable or amortizable assets of BJS LLC at the time of each redemption or exchange, and the amount of any tax benefit will depend on the U.S. federal and state income tax rate in effect at the time we are able to utilize any such increased tax deductions; |
| • | the depreciation and amortization periods that apply to the increase in tax basis—the tax benefits generated from a redemption or exchange, and the TRA payments due with respect to such redemption or exchange, will depend on the timing and amount of the tax deductions generated from the increased tax basis; |
| • | the amount of the exchanging LLC Unit Holder’s tax basis in the LLC Units at the time of the relevant redemption or exchange—the Basis Adjustments, as well as any related increase in any tax deductions, are directly related to the LLC Unit Holder’s tax basis in the LLC Units at the time of the redemption or exchange; |
| • | the price of our Class A shares at the time of any future redemptions or exchanges—the Basis Adjustments, as well as any related increase in any tax deductions, are directly related to the price of our Class A shares at the time of future redemptions or exchanges; |
| • | the extent to which such redemptions or exchanges are taxable—if a redemption or exchange is not taxable for any reason, increased tax deductions will not be available; and |
| • | the amount and timing of our income—the Tax Receivable Agreement generally will require us to pay 85% of the tax benefits as and when those benefits are treated as realized under the terms of the Tax Receivable Agreement. If we do not have taxable income, we generally will not be required (absent a change of control or other circumstances requiring an early termination payment) to make payments under the Tax Receivable Agreement for that taxable year because no tax benefits will have been actually realized. However, any tax benefits that do not result in realized tax benefits in a given taxable year will likely generate tax attributes that may be utilized to generate tax benefits in previous or future taxable years. The utilization of any such tax attributes will result in payments under the Tax Receivable Agreement. |
For purposes of the Tax Receivable Agreement, cash savings in income tax will be computed by comparing our actual income tax liability to the amount of such taxes that we would have been required to pay had there been no Basis Adjustments, had the Tax Receivable Agreement not been entered into and had there been no tax benefits to us as a result of any payments made under the Tax Receivable Agreement; provided that, for purposes of determining cash savings with respect to state and local income taxes we will use an assumed tax rate. The Tax Receivable Agreement will generally apply to each of our taxable years, beginning with our first taxable year ending after this offering. There is no maximum term for the Tax Receivable Agreement; however, the Tax Receivable Agreement may be terminated by us pursuant to an early termination procedure that requires us to pay the Existing Owners an agreed-upon amount equal to the estimated present value of the remaining payments to be made under the agreement (calculated with certain assumptions).
The payment obligations under the Tax Receivable Agreement are our obligations and not obligations of BJS LLC; however, we will be dependent on distributions from BJS LLC to make these
126
Table of Contents
Index to Financial Statements
payments, and neither the timing or amount of any such distributions can be guaranteed. Although the actual timing and amount of any payments that may be made under the Tax Receivable Agreement will vary, we expect that the payments that we may be required to make to the Existing Owners could be substantial. Any payments made by us to the Existing Owners under the Tax Receivable Agreement will generally reduce the amount of overall cash flow that might have otherwise been available to us or to BJS LLC and, to the extent that we are unable to make payments under the Tax Receivable Agreement for any reason, the unpaid amounts will be deferred and will accrue interest until paid by us; provided, however, that nonpayment for a specified period may constitute a material breach of a material obligation under the Tax Receivable Agreement and therefore may accelerate payments due under the Tax Receivable Agreement. We anticipate funding ordinary course payments under the Tax Receivable Agreement with cash flow from operations of our subsidiaries, available cash and/or available borrowings. Decisions made by us in the course of running our business, such as with respect to mergers, asset sales, other forms of business combinations or other changes in control, may influence the timing and amount of payments that are received by an Existing Owner under the Tax Receivable Agreement. For example, the earlier disposition of assets following an exchange or acquisition transaction will generally accelerate payments under the Tax Receivable Agreement and increase the present value of such payments.
The Tax Receivable Agreement provides that if certain mergers, asset sales, other forms of business combination, or other changes of control were to occur, if we materially breach any of our material obligations under the Tax Receivable Agreement or if, at any time, we elect an early termination of the Tax Receivable Agreement, then the Tax Receivable Agreement will terminate and our obligations, or our successor’s obligations, under the Tax Receivable Agreement would accelerate and become due and payable, based on certain assumptions, including an assumption that we would have sufficient taxable income to fully utilize all potential future tax benefits that are subject to the Tax Receivable Agreement. We may elect to completely terminate the Tax Receivable Agreement early only with the written approval of a majority of our “independent directors” (within the meaning of Rule 10A-3 promulgated under the Exchange Act and the corresponding rules of the NYSE).
As a result of the foregoing, (i) we could be required to make cash payments to the Existing Owners that are greater than the specified percentage of the actual benefits we ultimately realize in respect of the tax benefits that are subject to the Tax Receivable Agreement, and (ii) we would be required to make an immediate cash payment equal to the present value of the anticipated future tax benefits that are the subject of the Tax Receivable Agreement, which payment may be made significantly in advance of the actual realization, if any, of such future tax benefits. In these situations, our obligations under the Tax Receivable Agreement could have a material adverse effect on our liquidity and could have the effect of delaying, deferring or preventing certain mergers, asset sales, other forms of business combination, or other changes of control due to the additional transaction costs a potential acquirer may attribute to satisfying such obligations. Assuming that no material changes in the relevant tax law occur, we expect that if the Tax Receivable Agreement were terminated immediately after this offering, the estimated termination payment would be approximately $ (calculated using a discount rate equal to the LIBOR plus basis points, applied against an undiscounted liability of $ ).There can be no assurance that we will be able to finance our obligations under the Tax Receivable Agreement.
Payments under the Tax Receivable Agreement will be based on the tax reporting positions that we determine. We will not be reimbursed for any cash payments previously made to the Existing Owners pursuant to the Tax Receivable Agreement if any tax benefits initially claimed by us are subsequently challenged by a taxing authority and ultimately disallowed. Instead, any excess cash payments made by us to an Existing Owner will be netted against any future cash payments that we might otherwise be required to make under the terms of the Tax Receivable Agreement. However, a challenge to any tax benefits initially claimed by us may not arise for a number of years following the
127
Table of Contents
Index to Financial Statements
initial time of such payment or, even if challenged early, such excess cash payment may be greater than the amount of future cash payments that we might otherwise be required to make under the terms of the Tax Receivable Agreement and, as a result, there might not be future cash payments from which to net against. The applicable U.S. federal income tax rules are complex and factual in nature, and there can be no assurance that the IRS or a court will not disagree with our tax reporting positions. As a result, it is possible that we could make cash payments under the Tax Receivable Agreement that are substantially greater than our actual cash tax savings.
We will have full responsibility for, and sole discretion over, all of our tax matters, including the filing and amendment of all tax returns and claims for refund and defense of all tax contests, subject to certain participation rights held by the Existing Owners.
Under the Tax Receivable Agreement, we are required to provide the Existing Owners with a schedule showing the calculation of payments that are due under the Tax Receivable Agreement with respect to each taxable year with respect to which a payment obligation arises within 90 days after filing our U.S. federal income tax return for such taxable year. This calculation will be based upon the advice of our tax advisors. Payments under the Tax Receivable Agreement will generally be made to the Existing Owners within three business days after this schedule becomes final pursuant to the procedures set forth in the Tax Receivable Agreement, although interest on such payments will begin to accrue at a rate of LIBOR plus basis points from the due date (without extensions) of such tax return. Any late payments that may be made under the Tax Receivable Agreement will continue to accrue interest at a rate of LIBOR plus basis points, until such payments are made, generally including any late payments that we may subsequently make because we did not have enough available cash to satisfy our payment obligations at the time at which they originally arose.
Assuming that the Existing Owners sell all of their LLC Units to us on the date of this offering in connection with this initial public offering, there are no material changes in the relevant tax law, BJS LLC is able to fully depreciate or amortize its assets, we earn sufficient taxable income to realize the full tax benefit of the increased depreciation and amortization of our assets and the market value of one Class A share is equal to the initial public offering price per share, future payments under the Tax Receivable Agreement in respect of such purchases could aggregate approximately $ and range from approximately $ to $ per year over the next years.
The foregoing amounts are merely estimates, and the actual payments and timing of such payments could differ materially depending on a number of factors. As discussed above, actual amounts of payments under the Tax Receivable Agreement and the timing of such payments will vary and will be determined based on a number of factors, including the timing of future redemptions or exchanges of LLC Units in BJS LLC, the price of a Class A share at the time of each redemption or exchange, the extent to which such redemptions or exchanges are taxable, the amount and timing of the taxable income we generate in the future and the tax rate then applicable and the timing and amount of any subsequent asset dispositions. Thus, it is likely that future transactions or events could increase or decrease the actual tax benefits realized and the corresponding payments under the Tax Receivable Agreement as compared to the estimates set forth above.
Contribution Agreement
We will be a holding company whose sole material asset will consist of a membership interest in BJS LLC. BJS LLC owns, directly or indirectly, all of the outstanding equity interests in the operating subsidiaries through which we operate our assets. BJS LLC was created in late 2016 pursuant to a Contribution Agreement (the “Contribution Agreement”), by and among BHOO, Allied Completions Holdings, BJS LLC and the Joint Venture. Under the terms of the Contribution Agreement, (i) Allied
128
Table of Contents
Index to Financial Statements
Completions Holdings contributed cash and its pressure pumping business in the United States, including assets acquired in the Allied Asset Acquisition, to BJS LLC in exchange for membership interests in BJS LLC (which were subsequently contributed to our Sponsors) (the “Allied Contribution”), (ii) BHOO contributed its hydraulic fracturing and cementing businesses in the United States and Canada to BJC LLC in exchange for membership interests in BJS LLC (the “BHOO Contribution”), (iii) our Sponsors, through the Joint Venture, contributed cash to BJS LLC in exchange for membership interests in BJS LLC and (iv) BHOO and its affiliates received cash in reimbursement for certain prior capital expenditures.
Under the Contribution Agreement, BHOO and Allied Completions Holdings agreed to indemnify BJS LLC for certain losses or damages arising from the breach of their respective representations, warranties and covenants or arising out of certain retained obligations, excluded assets and specified or excluded liabilities. The indemnification obligations of BHOO and Allied Completions Holdings are subject to certain limitations, including individual claim thresholds, deductibles and caps. The indemnification obligations of BHOO and Allied Completions Holdings with respect to the breach of representations, other than fundamental representations, generally survive until December 30, 2017, and their respective indemnification obligations with respect to certain retained obligations and specified environmental liabilities survive until December 30, 2018 and December 30, 2019, respectively. The indemnification obligations of BHOO and Allied Completions Holdings with respect to breach of fundamental representations and excluded assets and liabilities survive indefinitely. Under the Contribution Agreement, BJS LLC also agreed to indemnify BHOO and Allied Completions Holdings, for an indefinite period, for certain losses or damages arising out of the excluded assets and liabilities or arising from the breach of BJS LLC’s post-closing covenants. Additionally, BHOO and BJS LLC entered into a transition services agreement (described in more detail below) relating to the provision by BHOO of transition services associated with certain assets and business contributed in the BHOO Contribution, and it contains separate indemnification obligations with regard to such services.
Consulting Agreement
On December 30, 2016, BJS LLC entered into a consulting agreement with Andrew F. J. Gould, a member of our board of directors, to provide advisory services to us. Under the terms of the agreement, we will pay Mr. Gould $275,000 per year to provide strategic guidance, engage with existing and prospective customers, recruit personnel and expertise and assist with other matters at the request of and on behalf of BJS LLC. Either party, upon 10-days written notice, can terminate the agreement.
IP License Agreement
In connection with the Contribution Agreement, BJS LLC entered into an Intellectual Property License Agreement (the “IP License Agreement”) with BHGE. Pursuant to the IP License Agreement, BHGE granted BJS LLC a perpetual, irrevocable, non-exclusive, royalty-free license to use certain of BHGE’s intellectual property rights (i.e., patents, software and other technology and know-how) in connection with BJS LLC’s onshore pressure pumping business in the United States and Canada (excluding any operations in the Gulf of Mexico). Similarly, BJS LLC granted BHGE a perpetual, irrevocable, non-exclusive, royalty-free license to use certain of BJS LLC’s intellectual property rights in connection with BHGE’s business outside of the United States and Canada. Each party under the IP License Agreement may sublicense the applicable licensed intellectual property rights to its customers, distributors, suppliers and service providers to the extent necessary to conduct its business, although the licensed party will remain responsible for any breach of the IP License Agreement by any sublicensee. In addition, each party agreed to indemnify the other party for any material breaches of
129
Table of Contents
Index to Financial Statements
the IP License Agreement. The licenses granted under the IP License Agreement may be terminated only upon the mutual agreement of both parties.
Transition Services Agreement
In connection with the Contribution Agreement, BJS LLC also entered into a Transition Services Agreement (the “TSA”) with BHOO. Pursuant to the TSA, and in order to facilitate BJS LLC’s integration of the businesses acquired pursuant to the Contribution Agreement, BHOO agreed to provide certain transition services to BJS LLC relating to the assets and business contributed by BHOO on an interim basis. The specific services are set forth in the TSA, and will generally be provided through December 30, 2017 unless the parties agree to prior termination. Under the TSA, (i) BJS LLC agreed to indemnify BHOO and its related persons against any claims or damages arising in connection with the services provided by BHOO under the TSA, except to the extent related to BHOO’s willful breach of the TSA or gross negligence or willful misconduct in performing the services and other transactions contemplated under the TSA, and (ii) BHOO agreed to indemnify BJS LLC and its related persons against any claims or damages arising in connection with any such willful breach, gross negligence or willful misconduct of BHOO. The indemnification obligations of the parties are subject to customary procedures and limitations, including that BHOO’s indemnification liability under the TSA cannot exceed the aggregate service charges paid, or to be paid, to BHOO thereunder.
Registration Rights Agreement
Simultaneously with the closing of this offering, we will enter into a registration rights agreement with our Sponsors and BHGE covering all of their Class A shares (including Class A shares that may be issued upon the exchange of LLC Units and corresponding Class B shares), which will provide such shareholders and their permitted transfers with the right to demand we undertake an underwritten offering of such shareholders’ Class A shares (including Class A shares that may be issued upon the exchange of LLC Units and corresponding Class B shares) at any time after the first anniversary of the consummation of this offering, in addition to certain “piggyback” rights when we undertake an underwritten offering of our Class A shares. Please see “Shares Eligible for Future Sale—Registration Rights Agreement.”
Shareholders’ Agreement
In connection with the consummation of this offering, we expect to enter into a new shareholders’ agreement with our Sponsors and BHGE. The Shareholders’ Agreement will contain specific rights, obligations and agreements of these parties as owners of our Class A shares and Class B shares.
Under the Shareholders’ Agreement, our Sponsors and BHGE will agree to take all necessary action, including casting all votes to which such members are entitled to cast at any annual or special meeting of shareholders, so as to ensure that the composition of our board of directors and its committees complies with the provisions of the Shareholders’ Agreement related to the composition of our board of directors and its committees. Please see “Management—Board of Directors and Committees.”
Indemnification Agreements
Our amended and restated bylaws will provide that we will indemnify our directors and officers to the fullest extent permitted by law. In addition, we intend to enter into separate indemnification agreements with our directors and certain officers. Each indemnification agreement will provide, among
130
Table of Contents
Index to Financial Statements
other things, for indemnification to the fullest extent permitted by law and our bylaws against any and all expenses, judgments, fines, penalties and amounts paid in settlement of any claim. The indemnification agreements will provide for the advancement or payment of all expenses to the indemnitee and for the reimbursement to us if it is found that such indemnitee is not entitled to such indemnification under applicable law and our bylaws.
Corporate Reorganization
In connection with our corporate reorganization, we engaged in certain transactions with certain affiliates and the members of BJS LLC. Please read “Corporation Reorganization.”
For additional information on related party transactions, please see Footnote 12 “Related-Party Transactions” to the audited consolidated financial statements our Predecessor included elsewhere in this prospectus.
131
Table of Contents
Index to Financial Statements
We are a Delaware corporation. Upon completion of this offering, the authorized capital stock of BJ Services, Inc. will consist of shares of Class A common stock, $0.001 par value per share, of which shares will be issued and outstanding, shares of Class B common stock, $0.001 par value per share, of which shares will be issued and outstanding, and shares of preferred stock, $0.001 par value per share, of which no shares will be issued and outstanding
The following description of the anticipated capital stock and amended and restated certification of incorporation and bylaws of BJ Services, Inc. does not purport to be complete and is qualified in its entirety by reference to the provisions of applicable law and to our anticipated amended and restated certificate of incorporation and bylaws, which are filed as exhibits to the registration statement of which this prospectus is a part.
Class A Common Stock
Voting Rights. Holders of Class A shares are entitled to one vote per share held of record on all matters to be voted upon by the shareholders. The holders of Class A shares do not have cumulative voting rights in the election of directors.
Dividend Rights. Holders of Class A shares are entitled to ratably receive dividends when and if declared by our board of directors out of funds legally available for that purpose, subject to any statutory or contractual restrictions on the payment of dividends and to any prior rights and preferences that may be applicable to any of our outstanding shares of preferred stock.
Liquidation Rights. Upon our liquidation, dissolution, distribution of assets or other winding up, the holders of Class A shares are entitled to receive ratably the assets available for distribution to the shareholders after payment of liabilities and the liquidation preference of any of our outstanding shares of preferred stock.
Other Matters. The Class A shares have no preemptive or conversion rights and are not subject to further calls or assessment by us. There are no redemption or sinking fund provisions applicable to the Class A shares. All outstanding Class A shares, including the Class A shares offered in this offering, are fully paid and non-assessable.
Class B Common Stock
Generally. In connection with the reorganization and this offering, each LLC Unit Holder will receive one Class B share for each LLC Unit that it holds. Accordingly, each LLC Unit Holder will have a number of votes in BJ Services, Inc. equal to the aggregate number of LLC Units that it holds.
Voting Rights. Holders of Class B shares are entitled to one vote per share held of record on all matters to be voted upon by the shareholders. Holders of Class A shares and Class B shares vote together as a single class on all matters presented to our shareholders for their vote or approval, except with respect to the amendment of certain provisions of our amended and restated certificate of incorporation that would alter or change the powers, preferences or special rights of the holders of the Class B common stock so as to affect them adversely, which amendments must be by a majority of the votes entitled to be cast by the holders of the shares affected by the amendment, voting as a separate class, or as otherwise required by applicable law.
Dividend and Liquidation Rights. Holders of our Class B shares do not have any right to receive dividends, unless the dividend consists of Class B shares or of rights, options, warrants or other
132
Table of Contents
Index to Financial Statements
securities convertible or exercisable into or exchangeable for Class B shares paid proportionally with respect to each outstanding Class B share and a dividend consisting of Class A shares or of rights, options, warrants or other securities convertible or exercisable into or exchangeable for Class A shares on the same terms is simultaneously paid to the holders of Class A shares. Holders of Class B shares do not have any right to receive a distribution upon a liquidation or winding up of BJ Services, Inc.
Preferred Stock
Our amended and restated certificate of incorporation authorizes our board of directors, subject to any limitations prescribed by law, without further shareholder approval, to establish and to issue from time to time one or more classes or series of preferred stock, par value $0.001 per share, covering up to an aggregate of shares of preferred stock. Each class or series of preferred stock will cover the number of shares and will have the powers, preferences, rights, qualifications, limitations and restrictions determined by the board of directors, which may include, among others, dividend rights, liquidation preferences, voting rights, conversion rights, preemptive rights and redemption rights. Except as provided by law or in a preferred stock designation, the holders of preferred stock will not be entitled to vote at or receive notice of any meeting of shareholders.
Classified Board
Our amended and restated certificate of incorporation will divide our board of directors into three classes, as nearly equal in number as possible, with staggered three-year terms. Subject to our Shareholders’ Agreement, under our amended and restated certificate of incorporation and our amended and restated bylaws, any vacancy on our board of directors, including a vacancy resulting from an enlargement of our board of directors, may be filled only by the affirmative vote of a majority of our directors then in office, even though less than a quorum of the board of directors. The classification of our board of directors and the limitations on the ability of our shareholders to remove directors and fill vacancies could make it more difficult for a third party to acquire, or discourage a third party from seeking to acquire, control of us. See “Management—Board of Directors and Committees— Composition of Our Board of Directors.”
Anti-Takeover Effects of Provisions of Our Amended and Restated Certificate of Incorporation, our Amended and Restated Bylaws and Delaware Law
Some provisions of Delaware law, our amended and restated certificate of incorporation and our amended and restated bylaws will contain provisions that could make the following transactions more difficult: acquisitions of us by means of a tender offer, a proxy contest or otherwise or removal of our directors. These provisions may also have the effect of preventing changes in our management. It is possible that these provisions could make it more difficult to accomplish or could deter transactions that shareholders may otherwise consider to be in their best interest or in our best interests, including transactions that might result in a premium over the market price for our Class A shares.
These provisions are expected to discourage coercive takeover practices and inadequate takeover bids. These provisions are also designed to encourage persons seeking to acquire control of us to first negotiate with us. We believe that the benefits of increased protection and our potential ability to negotiate with the proponent of an unfriendly or unsolicited proposal to acquire or restructure us outweigh the disadvantages of discouraging these proposals because, among other things, negotiation of these proposals could result in an improvement of their terms.
133
Table of Contents
Index to Financial Statements
Delaware Law
Section 203 of the DGCL prohibits a Delaware corporation, including those whose securities are listed for trading on the NYSE, from engaging in any business combination (as defined in Section 203) with any interested stockholder (as defined in Section 203) for a period of three years following the date that the stockholder became an interested stockholder, unless:
| • | the business combination or the transaction which resulted in the shareholder becoming an interested shareholder is approved by the board of directors before the date the interested shareholder attained that status; |
| • | upon consummation of the transaction that resulted in the shareholder becoming an interested shareholder, the interested shareholder owned at least 85% of the voting stock of the corporation outstanding at the time the transaction commenced; or |
| • | on or after such time the business combination is approved by the board of directors and authorized at a meeting of shareholders by at least two-thirds of the outstanding voting stock that is not owned by the interested shareholder. |
A corporation may elect not to be subject to Section 203 of the DGCL. We have elected to not be subject to the provisions of Section 203 of the DGCL.
Transfer Agent and Registrar
The transfer agent and registrar for our common stock is .
Listing
We have applied to list our common stock on the NYSE under the symbol “BJS.”
134
Table of Contents
Index to Financial Statements
SHARES ELIGIBLE FOR FUTURE SALE
Prior to this offering, there has been no public market for our Class A common stock. Future sales of our Class A common stock in the public market, or the availability of such shares for sale in the public market, could adversely affect the market price of our Class A common stock prevailing from time to time. As described below, only a limited number of shares will be available for sale shortly after this offering due to contractual and legal restrictions on resale. Nevertheless, sales of a substantial number of Class A shares in the public market after such restrictions lapse, or the perception that those sales may occur, could adversely affect the prevailing market price of our Class A common stock at such time and our ability to raise equity-related capital at a time and price we deem appropriate.
Sales of Restricted Shares
Upon completion of this offering, we will have outstanding an aggregate of Class A shares. Of these shares, all of the Class A shares to be sold in this offering (or Class A shares assuming the underwriters exercise the option to purchase additional shares in full) will be freely tradable without restriction or further registration under the Securities Act, unless the shares are held by any of our “affiliates” as such term is defined in Rule 144 under the Securities Act. All remaining Class A shares will be deemed “restricted securities” as such term is defined under Rule 144. The restricted securities were, or will be, issued and sold by us in private transactions and are eligible for public sale only if registered under the Securities Act or if they qualify for an exemption from registration under Rule 144 or Rule 701 under the Securities Act, which rules are summarized below.
In addition, subject to certain limitations and exceptions, pursuant to the terms of the BJS LLC Agreement, the LLC Unit Holders will each have the right to exchange all or a portion of their LLC Units (together with a corresponding number of Class B shares) for Class A shares (or the Cash Option) at an exchange ratio of one Class A share for each LLC Unit (and corresponding Class B share) exchanged, subject to conversion rate adjustments for stock splits, stock dividends and reclassifications. Upon consummation of this offering, the LLC Unit Holders will hold LLC Units, all of which (together with a corresponding number of Class B shares) will be exchangeable for Class A shares. See “Certain Relationships and Related Party Transactions—BJS LLC Agreement.” The Class A shares we issue upon such exchanges would be “restricted securities” as defined in Rule 144 described below. However, upon the closing of this offering, we intend to enter into a registration rights agreement with the LLC Unit Holders that will require us to register under the Securities Act these Class A shares. See “—Registration Rights Agreement.”
As a result of the lock-up agreements described below and the provisions of Rule 144 and Rule 701 under the Securities Act, all of the Class A shares (excluding the shares to be sold in this offering) will be available for sale in the public market upon the expiration of the lock-up agreements, beginning 180 days after the date of this prospectus (subject to extension) and when permitted under Rule 144 or Rule 701.
Lock-up Agreements
We, all of our directors and executive officers, our Sponsors and BHGE will agree not to sell any Class A shares or securities convertible into or exchangeable for Class A shares for a period of 180 days from the date of this prospectus, subject to certain exceptions. For a description of these lock-up provisions, please see the section entitled “Underwriting.”
135
Table of Contents
Index to Financial Statements
Rule 144
In general, under Rule 144 under the Securities Act as currently in effect, a person (or persons whose shares are aggregated) who is not deemed to have been an affiliate of ours at any time during the three months preceding a sale, and who has beneficially owned restricted securities within the meaning of Rule 144 for a least six months (including any period of consecutive ownership of preceding non-affiliated holders) would be entitled to sell those shares, subject only to the availability of current public information about us. A non-affiliated person who has beneficially owned restricted securities within the meaning of Rule 144 for at least one year would be entitled to sell those shares without regard to the provisions of Rule 144.
A person (or persons whose shares are aggregated) who is deemed to be an affiliate of ours and who has beneficially owned restricted securities within the meaning of Rule 144 for at least six months would be entitled to sell within any three-month period a number of shares that does not exceed the greater of one percent of the then outstanding Class A shares or the average weekly trading volume of our Class A common stock reported through the NYSE during the four calendar weeks preceding the filing of notice of the sale. Such sales are also subject to certain manner of sale provisions, notice requirements and the availability of current public information about us.
Rule 701
In general, under Rule 701 under the Securities Act, any of our employees, directors, officers, consultants or advisors who purchases shares from us in connection with a compensatory stock or option plan or other written agreement before the effective date of this offering is entitled to sell such shares 90 days after the effective date of this offering in reliance on Rule 144, without having to comply with the holding period requirement of Rule 144 and, in the case of non-affiliates, without having to comply with the public information, volume limitation or notice filing provisions of Rule 144. The SEC has indicated that Rule 701 will apply to typical stock options granted by an issuer before it becomes subject to the reporting requirements of the Exchange Act, along with the shares acquired upon exercise of such options, including exercises after the date of this prospectus.
Stock Issued Under Employee Plans
We intend to file a registration statement on Form S-8 under the Securities Act to register stock issuable under our long-term incentive plan. This registration statement on Form S-8 is expected to be filed following the effective date of the registration statement of which this prospectus is a part and will be effective upon filing. Accordingly, Class A shares registered under such registration statement will be available for sale in the open market following the effective date, unless such Class A shares are subject to vesting restrictions with us, Rule 144 restrictions applicable to our affiliates or the lock-up restrictions described above.
Registration Rights Agreement
Simultaneously with the closing of this offering, we will enter into a registration rights agreement with our Sponsors and BHGE covering all of their Class A shares (including Class A shares that may be issued upon the exchange of LLC Units and corresponding Class B shares). Pursuant to the registration rights agreement, certain shareholders have the right to demand we undertake an underwritten offering of such shareholders’ Class A shares (including Class A shares that may be issued upon the exchange of LLC Units and corresponding Class B shares) at any time after the first anniversary of the consummation of this offering, in addition to certain “piggyback” rights when we undertake an underwritten offering of our Class A shares. See “Certain Relationships and Related Party Transactions—Registration Rights Agreement.”
136
Table of Contents
Index to Financial Statements
Indemnification Agreements
Our amended and restated bylaws will provide that we will indemnify our directors and officers to the fullest extent permitted by law. In addition, we intend to enter into separate indemnification agreements with our directors and certain officers. Each indemnification agreement will provide, among other things, for indemnification to the fullest extent permitted by law and our amended and restated bylaws against any and all expenses, judgments, fines, penalties and amounts paid in settlement of any claim. The indemnification agreements will provide for the advancement or payment of all expenses to the indemnitee and for the reimbursement to us if it is found that such indemnitee is not entitled to such indemnification under applicable law and our amended and restated bylaws.
137
Table of Contents
Index to Financial Statements
MATERIAL U.S. FEDERAL INCOME TAX CONSEQUENCES TO NON-U.S. HOLDERS
The following discussion is a summary of the material U.S. federal income tax consequences to Non-U.S. Holders (as defined below) of the purchase, ownership and disposition of our Class A common stock issued pursuant to this offering, but does not purport to be a complete analysis of all potential tax effects. The effects of other U.S. federal tax laws, such as estate and gift tax laws, and any applicable state, local or non-U.S. tax laws are not discussed. This discussion is based on the U.S. Internal Revenue Code of 1986, as amended (the “Code”), Treasury regulations promulgated thereunder (“Treasury Regulations”), judicial decisions, and published rulings and administrative pronouncements of the U.S. Internal Revenue Service (the “IRS”), in each case as in effect as of the date hereof. These authorities may change or be subject to differing interpretations. Any such change or differing interpretation may be applied retroactively in a manner that could adversely affect a Non-U.S. Holder of our Class A common stock. We have not sought and will not seek any rulings from the IRS regarding the matters discussed below. There can be no assurance the IRS or a court will not take a contrary position to those discussed below regarding the tax consequences of the purchase, ownership and disposition of our Class A common stock.
This discussion is limited to Non-U.S. Holders that hold our Class A common stock as a “capital asset” within the meaning of Section 1221 of the Code (generally, property held for investment). This discussion does not address all U.S. federal income tax consequences relevant to a Non-U.S. Holder’s particular circumstances, including the impact of the Medicare contribution tax on net investment income. In addition, it does not address consequences relevant to Non-U.S. Holders subject to special rules, including, without limitation:
| • | U.S. expatriates and former citizens or long-term residents of the United States; |
| • | persons subject to the alternative minimum tax; |
| • | persons holding our Class A common stock as part of a hedge, straddle or other risk reduction strategy or as part of a conversion transaction or other integrated investment; |
| • | banks, insurance companies, and other financial institutions; |
| • | real estate investment trusts or regulated investment companies; |
| • | brokers, dealers or traders in securities; |
| • | “controlled foreign corporations,” “passive foreign investment companies,” and corporations that accumulate earnings to avoid U.S. federal income tax; |
| • | partnerships or other entities or arrangements treated as partnerships for U.S. federal income tax purposes (and investors therein); |
| • | tax-exempt organizations or governmental organizations; |
| • | persons deemed to sell our Class A common stock under the constructive sale provisions of the Code; |
| • | persons who hold or receive our Class A common stock pursuant to the exercise of any employee stock option or otherwise as compensation; |
| • | “qualified foreign pension funds” (within the meaning of Section 897(1)(2) of the Code and entities, all of the interests of which are held by qualified foreign pension funds); and |
| • | tax-qualified retirement plans. |
If an entity treated as a partnership for U.S. federal income tax purposes holds our Class A common stock, the tax treatment of a partner in the partnership will depend on the status of the
138
Table of Contents
Index to Financial Statements
partner, the activities of the partnership and certain determinations made at the partner level. Accordingly, partnerships holding our Class A common stock and partners in such partnerships should consult their tax advisors regarding the U.S. federal income tax consequences to them.
THIS DISCUSSION IS FOR INFORMATIONAL PURPOSES ONLY AND IS NOT TAX ADVICE. INVESTORS SHOULD CONSULT THEIR TAX ADVISORS WITH RESPECT TO THE APPLICATION OF THE U.S. FEDERAL INCOME TAX LAWS TO THEIR PARTICULAR SITUATIONS AS WELL AS ANY TAX CONSEQUENCES OF THE PURCHASE, OWNERSHIP AND DISPOSITION OF OUR CLASS A COMMON STOCK ARISING UNDER THE U.S. FEDERAL ESTATE OR GIFT TAX LAWS OR UNDER THE LAWS OF ANY STATE, LOCAL OR NON-U.S. TAXING JURISDICTION OR UNDER ANY APPLICABLE INCOME TAX TREATY.
Definition of a Non-U.S. Holder
For purposes of this discussion, a “Non-U.S. Holder” is any beneficial owner of our Class A common stock that is neither a “U.S. person” nor an entity treated as a partnership for U.S. federal income tax purposes. A U.S. person is any person that, for U.S. federal income tax purposes, is or is treated as any of the following:
| • | an individual who is a citizen or resident of the United States; |
| • | a corporation, or an entity treated as a corporation for U.S. federal income tax purposes, created or organized under the laws of the United States, any state thereof, or the District of Columbia; |
| • | an estate, the income of which is subject to U.S. federal income tax regardless of its source; or |
| • | a trust that (1) is subject to the primary supervision of a U.S. court and the control of one or more “United States persons” (within the meaning of Section 7701(a)(30) of the Code), or (2) has a valid election in effect to be treated as a United States person for U.S. federal income tax purposes. |
Distributions
As described in the section entitled “Dividend Policy” we do not anticipate declaring or paying dividends to holders of our Class A common stock in the foreseeable future. However, if we do make distributions of cash or property on our Class A common stock, such distributions will constitute dividends for U.S. federal income tax purposes to the extent paid from our current or accumulated earnings and profits, as determined under U.S. federal income tax principles. Amounts not treated as dividends for U.S. federal income tax purposes will constitute a return of capital and first be applied against and reduce a Non-U.S. Holder’s adjusted tax basis in its Class A common stock (determined on a share by share basis), but not below zero. Any excess will be treated as capital gain and will be treated as described below under “—Sale or Other Taxable Disposition.”
Subject to the discussion below on effectively connected income, dividends paid to a Non-U.S. Holder of our Class A common stock will be subject to U.S. federal withholding tax at a rate of 30% of the gross amount of the dividends (or such lower rate specified by an applicable income tax treaty, provided the Non-U.S. Holder furnishes to the applicable withholding agent prior to the payment of dividends a valid IRS Form W-8BEN or W-8BEN-E (or other applicable documentation) certifying qualification for the lower treaty rate). A Non-U.S. Holder that does not timely furnish the required documentation, but that qualifies for a reduced treaty rate, may obtain a refund of any excess amounts withheld by timely filing an appropriate claim for refund with the IRS. Non-U.S. Holders should consult their tax advisors regarding their entitlement to benefits under any applicable income tax treaty.
139
Table of Contents
Index to Financial Statements
If dividends paid to a Non-U.S. Holder are effectively connected with the Non-U.S. Holder’s conduct of a trade or business within the United States (and, if required by an applicable income tax treaty, the Non-U.S. Holder maintains a permanent establishment in the United States to which such dividends are attributable), the Non-U.S. Holder will be exempt from the U.S. federal withholding tax described above. To claim the exemption, the Non-U.S. Holder must furnish to the applicable withholding agent a valid IRS Form W-8ECI, certifying that the dividends are effectively connected with the Non-U.S. Holder’s conduct of a trade or business within the United States.
Any such effectively connected dividends will be subject to U.S. federal income tax on a net income basis at the regular graduated rates. A Non-U.S. Holder that is a corporation also may be subject to a branch profits tax at a rate of 30% (or such lower rate specified by an applicable income tax treaty) on its effectively connected earnings and profits (as adjusted for certain items), which will include such effectively connected dividends. Non-U.S. Holders should consult their tax advisors regarding any applicable tax treaties that may provide for different rules.
Sale or Other Taxable Disposition
Subject to the discussions below on backup witholding and FATCA, a Non-U.S. Holder will not be subject to U.S. federal income tax on any gain realized upon the sale or other taxable disposition of our Class A common stock unless:
| • | the gain is effectively connected with the Non-U.S. Holder’s conduct of a trade or business within the United States (and, if required by an applicable income tax treaty, the Non-U.S. Holder maintains a permanent establishment in the United States to which such gain is attributable); |
| • | the Non-U.S. Holder is a nonresident alien individual present in the United States for 183 days or more during the taxable year of the disposition and certain other requirements are met; or |
| • | our Class A common stock constitutes a United States real property interest (“USRPI”) by reason of our status as a United States real property holding corporation (“USRPHC”) for U.S. federal income tax purposes. |
Gain described in the first bullet point above generally will be subject to U.S. federal income tax on a net income basis at the regular graduated rates. A Non-U.S. Holder that is a corporation also may be subject to a branch profits tax at a rate of 30% (or such lower rate specified by an applicable income tax treaty) on its effectively connected earnings and profits (as adjusted for certain items), which will include such effectively connected gain.
A Non-U.S. Holder described in the second bullet point above will be subject to U.S. federal income tax at a rate of 30% (or such lower rate specified by an applicable income tax treaty) on any gain derived from the disposition, which may generally be offset by U.S. source capital losses of the Non-U.S. Holder (even though the individual is not considered a resident of the United States), provided the Non-U.S. Holder has timely filed U.S. federal income tax returns with respect to such losses.
With respect to the third bullet point above, we believe we currently are not, and do not anticipate becoming, a USRPHC. Because the determination of whether we are a USRPHC depends, however, on whether the fair market value of our USRPIs equals or exceeds 50% of the sum of the fair market value of our non-U.S. real property interests and our other business assets, there can be no assurance we currently are not a USRPHC or will not become one in the future. Even if we are or were to become a USRPHC, gain arising from the sale or other taxable disposition by a Non-U.S. Holder of our Class A common stock will not be subject to U.S. federal income tax as long as our Class A common stock
140
Table of Contents
Index to Financial Statements
continues to be “regularly traded,” as defined by applicable Treasury Regulations, on an established securities market, and such Non-U.S. Holder owned, actually and constructively, 5% or less of our Class A common stock throughout the shorter of the five-year period ending on the date of the sale or other taxable disposition or the Non-U.S. Holder’s holding period. If we were to become a USRPHC and our Class A common stock were not considered to be “regularly traded” on an established securities market during the calendar year in which the relevant disposition by a Non-U.S. Holder occurs, such Non-U.S. Holder (regardless of the percentage of stock owned) would be subject to U.S. federal income tax on a sale or other taxable disposition of our Class A common stock and a 15% withholding tax would apply to the gross proceeds from such disposition.
Non-U.S. Holders should consult their tax advisors regarding potentially applicable income tax treaties that may provide for different rules.
Information Reporting and Backup Withholding
Payments of dividends on our Class A common stock will not be subject to backup withholding, provided the applicable withholding agent does not have actual knowledge or reason to know the Non-U.S. Holder is a United States person and the Non-U.S. Holder either certifies its non-U.S. status, such as by furnishing a valid IRS Form W-8BEN, W-8BEN-E or W-8ECI, or otherwise establishes an exemption. However, information returns are required to be filed with the IRS in connection with any dividends on our Class A common stock paid to the Non-U.S. Holder, regardless of whether any tax was actually withheld. In addition, proceeds of the sale or other taxable disposition of our Class A common stock within the United States or conducted through certain U.S.-related brokers generally will not be subject to backup withholding or information reporting if the applicable withholding agent receives the certification described above and does not have actual knowledge or reason to know that such Non-U.S. Holder is a United States person, or the Non-U.S. Holder otherwise establishes an exemption. Proceeds of a disposition of our Class A common stock conducted through a non-U.S. office of a non-U.S. broker generally will not be subject to backup withholding or information reporting.
Copies of information returns that are filed with the IRS may also be made available under the provisions of an applicable treaty or agreement to the tax authorities of the country in which the Non-U.S. Holder resides or is established.
Backup withholding is not an additional tax. Any amounts withheld under the backup withholding rules may be allowed as a refund or a credit against a Non-U.S. Holder’s U.S. federal income tax liability, provided the required information is timely furnished to the IRS.
Additional Withholding Tax on Payments Made to Foreign Accounts
Withholding taxes may be imposed under Sections 1471 to 1474 of the Code (such Sections commonly referred to as the Foreign Account Tax Compliance Act, or “FATCA”) on certain types of payments made to non-U.S. financial institutions and certain other non-U.S. entities. Specifically, a 30% withholding tax may be imposed on dividends on, or gross proceeds from the sale or other disposition of, our Class A common stock paid to a “foreign financial institution” or a “non-financial foreign entity” (each as defined in the Code) (including, in some cases, when such foreign financial institution or non-financial foreign entity is acting as an intermediary), unless (1) the foreign financial institution undertakes certain diligence and reporting obligations, (2) the non-financial foreign entity either certifies it does not have any “substantial United States owners” (as defined in the Code) or furnishes identifying information regarding each direct and indirect substantial United States owner, or (3) the foreign financial institution or non-financial foreign entity otherwise qualifies for an exemption from these rules. If the payee is a foreign financial institution and is subject to the diligence and
141
Table of Contents
Index to Financial Statements
reporting requirements in (1) above, it must enter into an agreement with the U.S. Department of the Treasury requiring, among other things, that it undertake to identify accounts held by certain “specified United States persons” or “United States-owned foreign entities” (each as defined in the Code), annually report certain information about such accounts, and withhold 30% on certain payments to non-compliant foreign financial institutions and certain other account holders. Foreign financial institutions located in jurisdictions that have an intergovernmental agreement with the United States governing FATCA may be subject to different rules.
Under the applicable Treasury Regulations and administrative guidance, withholding under FATCA generally applies to payments of dividends on our Class A common stock, and will apply to payments of gross proceeds from the sale or other disposition of such stock on or after January 1, 2019.
Prospective investors should consult their tax advisors regarding the potential application of withholding under FATCA to their investment in our Class A common stock.
142
Table of Contents
Index to Financial Statements
The Company and the underwriters named below have entered into an underwriting agreement with respect to the Class A shares being offered. Subject to certain conditions, each underwriter has severally agreed to purchase the number of Class A shares indicated in the following table. Goldman Sachs & Co. LLC, Morgan Stanley & Co. LLC and Credit Suisse Securities (USA) LLC are the representatives of the underwriters.
| Underwriters |
Number of Shares | |||
| Goldman Sachs & Co. LLC |
||||
| Morgan Stanley & Co. LLC |
||||
| Credit Suisse Securities (USA) LLC |
||||
|
|
|
|||
| Total |
||||
|
|
|
|||
The underwriters are committed to take and pay for all of the shares being offered, if any are taken, other than the shares covered by the option described below unless and until this option is exercised.
The underwriters have an option to buy up to an additional Class A shares from the Company to cover sales by the underwriters of a greater number of shares than the total number set forth in the table above. They may exercise that option for 30 days. If any shares are purchased pursuant to this option, the underwriters will severally purchase shares in approximately the same proportion as set forth in the table above.
Commissions and Expenses
The following tables show the per share and total underwriting discounts and commissions to be paid to the underwriters by the Company. Such amounts are shown assuming both no exercise and full exercise of the underwriters’ option to purchase additional Class A shares.
| No Exercise | Full Exercise | |||||||
| Per Share |
$ | $ | ||||||
| Total |
$ | $ | ||||||
Class A shares sold by the underwriters to the public will initially be offered at the initial public offering price set forth on the cover of this prospectus. Any shares sold by the underwriters to securities dealers may be sold at a discount of up to $ per share from the initial public offering price. After the initial offering of the Class A shares, the representatives may change the offering price and the other selling terms. The offering of the shares by the underwriters is subject to receipt and acceptance and subject to the underwriters’ right to reject any order in whole or in part.
We have also agreed to reimburse the underwriters for certain of their expenses set forth in the underwriting agreement.
The Company estimates that its share of the total expenses of the offering, excluding underwriting discounts and commissions, will be approximately $ .
Lock-Up Agreements
The Company, all of its directors and executive officers, our Sponsors and BHGE have agreed with the underwriters, subject to certain exceptions, not to dispose of or hedge any of their Class A
143
Table of Contents
Index to Financial Statements
shares or securities convertible into or exchangeable for Class A shares during the period from the date of this prospectus continuing through the date 180 days after the date of this prospectus, except with the prior written consent of the representatives.
The lock-up restrictions described in the foregoing do not apply to our directors, executive officers, our Sponsors and BHGE with respect to:
| • | transactions relating to Class A shares or securities convertible into or exercisable or exchangeable for Class A shares being sold, cancelled or transferred pursuant to the transactions contemplated by the Underwriting Agreement in connection with this offering; |
| • | transactions relating to Class A shares or other securities acquired in open market transactions after the completion of this offering; |
| • | the establishment of a trading plan pursuant to Rule 10b5-1 under the Exchange Act for the transfer of Class A shares, provided that (i) such plan does not provide for the transfer of Class A shares during the restricted period and (ii) to the extent a public announcement or filing under the Exchange Act, if any, is required of or voluntarily made by or on behalf of the holder or the Company regarding the establishment of such plan, such announcement or filing will include a statement to the effect that no transfer of Class A shares may be made under such plan during the restricted period; |
| • | transfers or dispositions of Class A shares or any security convertible into Class A shares (i) to an immediate family member, (ii) by will, other testamentary document or intestate succession or (iii) as a bona fide gift or gifts; provided that each donee, distributee or other transferee will sign and deliver a lock-up agreement substantially in the form entered into by the holder; |
| • | transfers or dispositions of Class A shares or any security convertible into Class A shares to affiliates of the shareholder, or any current or former partners, members, managers, shareholders or other principals of such person or entity, or to a person or entity controlled by, controlling or under common control or management with the shareholder, or to the partners, members, managers, shareholders or other principals of such person or entity or to subsidiaries of the shareholder or to any investment fund or other entity which manages or is managed by the shareholder; provided that each transferee or transferees will sign and deliver a lock-up agreement substantially in the form entered into by the holder; |
| • | transfers of Class A shares or any security convertible into Class A shares to the Company in connection with the exercise of options or warrants or the vesting, exercise or settlement of any other equity-based award, in each case, granted pursuant to the Company’s equity incentive plans or otherwise outstanding on the date of the lock-up agreement and disclosed in this prospectus, including any Class A shares withheld by the Company or any of its subsidiaries to pay the applicable exercise price or tax withholding associated with such awards; |
| • | pursuant to any exchange of common units of BJS LLC for a corresponding number of Class A shares in accordance with the Third Amended and Restated Limited Liability Company Agreement of BJS LLC, including in connection with this offering; or |
| • | as a result of the redemption by the Company, BJS LLC or their affiliates of Class A shares held by or on behalf of an employee in connection with the termination of such employee’s employment; |
provided that, with respect to the preceding bullets, (i) the restrictions do not apply to the Class A shares issued upon such exercise, conversion, vesting or settlement and (ii) no filing under Section 16(a) of the Exchange Act, reporting a reduction in beneficial ownership of Class A shares, will be required or will be voluntarily made during the restricted period (other than a Form 5 made when required or to the extent any such filing under Section 16(a) of the Exchange Act indicates that such transfer or distribution did not involve a disposition for value).
144
Table of Contents
Index to Financial Statements
The lock-up restrictions described in the foregoing do not apply to us with respect to:
| • | the sale of Class A shares to the underwriters; |
| • | the issuance by us of Class A shares upon the exercise of an option or a warrant or the conversion of a security outstanding on the date of this prospectus and described in this prospectus; |
| • | the issuance by us of Class A shares or securities convertible into, exchangeable for or representing the right to receive Class A shares in connection with the acquisition by us or any of our subsidiaries of the securities, business, technology, property or other assets of another person or entity, or pursuant to an employee benefit plan assumed by us in connection with any such acquisition; provided that (i) each recipient of such securities shall sign and deliver a lock-up agreement substantially in the form entered into by the holder, and (ii) the aggregate number of Class A shares that we may sell or issue or agree to sell or issue shall not exceed 5% of the total number of Class A shares outstanding immediately following the completion of this offering; |
| • | the filing of any registration statement on Form S-8 relating to securities granted or to be granted pursuant to our equity incentive plans that are described in this prospectus or any assumed employee benefit plan contemplated by the preceding bullet; or |
| • | the establishment of a trading plan pursuant to Rule 10b5-1 under the Exchange Act for the transfer of Class A shares, provided that (i) such plan is described in this prospectus and is in existence on the date of this prospectus, (ii) such plan does not provide for the transfer of shares during the restricted period and (iii) to the extent a public announcement or filing under the Exchange Act, if any, is required or voluntarily made regarding the establishment of such plan, such announcement or filing will include a statement to the effect that no transfer of shares may be made under such plan during the restricted period. |
Offering Price Determination
Prior to the offering, there has been no public market for the Class A shares. The initial public offering price has been negotiated among the company and the representatives. Among the factors to be considered in determining the initial public offering price of the Class A shares, in addition to prevailing market conditions, will be the company’s historical performance, estimates of the business potential and earnings prospects of the company, an assessment of the company’s management and the consideration of the above factors in relation to market valuation of companies in related businesses.
Indemnification
We have agreed to indemnify the several underwriters against certain liabilities, including liabilities under the Securities Act and liabilities incurred in connection with the directed share program referred to below.
Directed Share Program
At our request, the underwriters have reserved up to % of the Class A shares being offered by this prospectus for sale, at the initial public offering price, to our directors, executive officers and employees. The number of Class A shares available for sale to the general public will be reduced to the extent such persons purchase such reserved Class A shares. Any reserved Class A shares not so purchased will be offered by the underwriters to the general public on the same basis as the other
145
Table of Contents
Index to Financial Statements
shares offered hereby. The program will be arranged through . Any participants in this program shall be prohibited from selling, pledging or assigning any shares sold to them pursuant to this program for a period of 180 days after the date of this prospectus. See “—Lock-Up Agreements” above.
New York Stock Exchange
We have applied to list the Class A shares on the NYSE under the symbol “BJS.” In order to meet one of the requirements for listing the Class A shares on the NYSE, the underwriters have undertaken to sell lots of 100 or more shares to a minimum of 400 beneficial holders.
Short Positions, Stabilization and Penalty Bids
In connection with the offering, the underwriters may purchase and sell Class A shares in the open market. These transactions may include short sales, stabilizing transactions and purchases to cover positions created by short sales. Short sales involve the sale by the underwriters of a greater number of shares than they are required to purchase in the offering, and a short position represents the amount of such sales that have not been covered by subsequent purchases. A “covered short position” is a short position that is not greater than the amount of additional shares for which the underwriters’ option described above may be exercised. The underwriters may cover any covered short position by either exercising their option to purchase additional shares or purchasing shares in the open market. In determining the source of shares to cover the covered short position, the underwriters will consider, among other things, the price of shares available for purchase in the open market as compared to the price at which they may purchase additional shares pursuant to the option described above. “Naked” short sales are any short sales that create a short position greater than the amount of additional shares for which the option described above may be exercised. The underwriters must cover any such naked short position by purchasing shares in the open market. A naked short position is more likely to be created if the underwriters are concerned that there may be downward pressure on the price of the Class A shares in the open market after pricing that could adversely affect investors who purchase in the offering. Stabilizing transactions consist of various bids for or purchases of Class A shares made by the underwriters in the open market prior to the completion of the offering.
The underwriters may also impose a penalty bid. This occurs when a particular underwriter repays to the underwriters a portion of the underwriting discount received by it because the representatives have repurchased shares sold by or for the account of such underwriter in stabilizing or short covering transactions.
Purchases to cover a short position and stabilizing transactions, as well as other purchases by the underwriters for their own accounts, may have the effect of preventing or retarding a decline in the market price of the company’s stock, and together with the imposition of the penalty bid, may stabilize, maintain or otherwise affect the market price of the Class A shares. As a result, the price of the Class A shares may be higher than the price that otherwise might exist in the open market. The underwriters are not required to engage in these activities and may end any of these activities at any time. These transactions may be effected on the NYSE in the over-the-counter market or otherwise.
Electronic Distribution
A prospectus in electronic format may be made available on the Internet sites or through other online services maintained by one or more of the underwriters participating in this offering, or by their affiliates. In those cases, prospective investors may view offering terms online and, depending upon the particular underwriter, prospective investors may be allowed to place orders online. The underwriters may agree with us to allocate a specific number of shares for sale to online brokerage account holders. Any such allocation for online distributions will be made by the representative on the same basis as other allocations.
146
Table of Contents
Index to Financial Statements
Other than the prospectus in electronic format, the information on any underwriter’s website and any information contained in any other website maintained by an underwriter is not part of the prospectus or the registration statement of which this prospectus forms a part, has not been approved and/or endorsed by us or any underwriter in its capacity as underwriter and should not be relied upon by investors.
Relationships
The underwriters and their respective affiliates are full service financial institutions engaged in various activities, which may include sales and trading, commercial and investment banking, advisory, investment management, investment research, principal investment, hedging, market making, brokerage and other financial and non-financial activities and services. Certain of the underwriters and their respective affiliates have provided, and may in the future provide, a variety of these services to the company and to persons and entities with relationships with the company, for which they received or will receive customary fees and expenses.
In the ordinary course of their various business activities, the underwriters and their respective affiliates, officers, directors and employees may purchase, sell or hold a broad array of investments and actively trade securities, derivatives, loans, commodities, currencies, credit default swaps and other financial instruments for their own account and for the accounts of their clients, and such investment and trading activities may involve or relate to assets, securities and/or instruments of the company (directly, as collateral securing other obligations or otherwise) and/or persons and entities with relationships with the company. The underwriters and their respective affiliates may also communicate independent investment recommendations, market color or trading ideas and/or publish or express independent research views in respect of such assets, securities or instruments and may at any time hold, or recommend to clients that they should acquire, long and/or short positions in such assets, securities and instruments.
Selling Restrictions
European Economic Area
In relation to each Member State of the European Economic Area which has implemented the Prospectus Directive (each, a “Relevant Member State”) an offer to the public of our Class A shares may not be made in that Relevant Member State, except that an offer to the public in that Relevant Member State of our Class A shares may be made at any time under the following exemptions under the Prospectus Directive:
| • | To any legal entity which is a qualified investor as defined in the Prospectus Directive; |
| • | To fewer than 150 natural or legal persons (other than qualified investors as defined in the Prospectus Directive), subject to obtaining the prior consent of the representatives for any such offer; or |
| • | In any other circumstances falling within Article 3(2) of the Prospectus Directive; |
provided that no such offer or shares of our Class A shares shall result in a requirement for the publication by us or any Brazilian placement agent of a prospectus pursuant to Article 3 of the Prospectus Directive.
For the purposes of this provision, the expression an “offer to public” in relation to our Class A shares in any Relevant Member State means the communication in any form and by any means of sufficient information on the terms of the offer and our Class A shares to be offered so as to enable an investor to decide to purchase our Class A shares, as the same may be varied in that Member State by any measure implementing the Prospectus Directive in that Member State, the expression “Prospectus
147
Table of Contents
Index to Financial Statements
Directive” means Directive 2003/71/EC (as amended), including by Directive 2010/73/EU and includes any relevant implementing measure in the Relevant Member State.
This European Economic Area selling restriction is in addition to any other selling restrictions set out below.
United Kingdom
In the United Kingdom, this prospectus is only addressed to and directed as qualified investors who are (i) investment professionals falling within Article 19(5) of the Financial Services and Markets Act 2000 (Financial Promotion) Order 2005 (the Order); or (ii) high net worth entities and other persons to whom it may lawfully be communicated, falling within Article 49(2)(a) to (d) of the Order (all such persons together being referred to as “relevant persons”). Any investment or investment activity to which this prospectus relates is available only to relevant persons and will only be engaged with relevant persons. Any person who is not a relevant person should not act or relay on this prospectus or any of its contents.
Canada
The securities may be sold in Canada only to purchasers purchasing, or deemed to be purchasing, as principal that are accredited investors, as defined in National Instrument 45-106 Prospectus Exemptions or subsection 73.3(1) of the Securities Act (Ontario), and are permitted clients, as defined in National Instrument 31-103 Registration Requirements, Exemptions, and Ongoing Registrant Obligations. Any resale of the securities must be made in accordance with an exemption from, or in a transaction not subject to, the prospectus requirements of applicable securities laws.
Securities legislation in certain provinces or territories of Canada may provide a purchaser with remedies for rescission or damages if this prospectus (including any amendment thereto) contains a misrepresentation, provided that the remedies for rescission or damages are exercised by the purchaser within the time limit prescribed by the securities legislation of the purchaser’s province or territory. The purchaser should refer to any applicable provisions of the securities legislation of the purchaser’s province or territory for particulars of these rights or consult with a legal advisor.
Pursuant to section 3A.3 of National Instrument 33-105 Underwriting Conflicts (NI 33-105), the underwriters are not required to comply with the disclosure requirements of NI 33-105 regarding underwriter conflicts of interest in connection with this offering.
Hong Kong
The shares may not be offered or sold in Hong Kong by means of any document other than (i) in circumstances which do not constitute an offer to the public within the meaning of the Companies (Winding Up and Miscellaneous Provisions) Ordinance (Cap. 32 of the Laws of Hong Kong) (“Companies (Winding Up and Miscellaneous Provisions) Ordinance”) or which do not constitute an invitation to the public within the meaning of the Securities and Futures Ordinance (Cap. 571 of the Laws of Hong Kong) (“Securities and Futures Ordinance”), or (ii) to “professional investors” as defined in the Securities and Futures Ordinance and any rules made thereunder, or (iii) in other circumstances which do not result in the document being a “prospectus” as defined in the Companies (Winding Up and Miscellaneous Provisions) Ordinance, and no advertisement, invitation or document relating to the shares may be issued or may be in the possession of any person for the purpose of issue (in each case whether in Hong Kong or elsewhere), which is directed at, or the contents of which are likely to be accessed or read by, the public in Hong Kong (except if permitted to do so under the securities laws of Hong Kong) other than with respect to shares which are or are intended to be disposed of only to persons outside Hong Kong or only to “professional investors” in Hong Kong as defined in the Securities and Futures Ordinance and any rules made thereunder.
148
Table of Contents
Index to Financial Statements
Singapore
This prospectus has not been registered as a prospectus with the Monetary Authority of Singapore. Accordingly, this prospectus and any other document or material in connection with the offer or sale, or invitation for subscription or purchase, of the shares may not be circulated or distributed, nor may the shares be offered or sold, or be made the subject of an invitation for subscription or purchase, whether directly or indirectly, to persons in Singapore other than (i) to an institutional investor (as defined under Section 4A of the Securities and Futures Act, Chapter 289 of Singapore (the “SFA”)) under Section 274 of the SFA, (ii) to a relevant person (as defined in Section 275(2) of the SFA) pursuant to Section 275(1) of the SFA, or any person pursuant to Section 275(1A) of the SFA, and in accordance with the conditions specified in Section 275 of the SFA or (iii) otherwise pursuant to, and in accordance with the conditions of, any other applicable provision of the SFA, in each case subject to conditions set forth in the SFA.
Where the shares are subscribed or purchased under Section 275 of the SFA by a relevant person which is a corporation (which is not an accredited investor (as defined in Section 4A of the SFA)) the sole business of which is to hold investments and the entire share capital of which is owned by one or more individuals, each of whom is an accredited investor, the securities (as defined in Section 239(1) of the SFA) of that corporation shall not be transferable for 6 months after that corporation has acquired the shares under Section 275 of the SFA except: (1) to an institutional investor under Section 274 of the SFA or to a relevant person (as defined in Section 275(2) of the SFA), (2) where such transfer arises from an offer in that corporation’s securities pursuant to Section 275(1A) of the SFA, (3) where no consideration is or will be given for the transfer, (4) where the transfer is by operation of law, (5) as specified in Section 276(7) of the SFA, or (6) as specified in Regulation 32 of the Securities and Futures (Offers of Investments) (Shares and Debentures) Regulations 2005 of Singapore (“Regulation 32”).
Where the shares are subscribed or purchased under Section 275 of the SFA by a relevant person which is a trust (where the trustee is not an accredited investor (as defined in Section 4A of the SFA)) whose sole purpose is to hold investments and each beneficiary of the trust is an accredited investor, the beneficiaries’ rights and interest (howsoever described) in that trust shall not be transferable for 6 months after that trust has acquired the shares under Section 275 of the SFA except: (1) to an institutional investor under Section 274 of the SFA or to a relevant person (as defined in Section 275(2) of the SFA), (2) where such transfer arises from an offer that is made on terms that such rights or interest are acquired at a consideration of not less than $200,000 (or its equivalent in a foreign currency) for each transaction (whether such amount is to be paid for in cash or by exchange of securities or other assets), (3) where no consideration is or will be given for the transfer, (4) where the transfer is by operation of law, (5) as specified in Section 276(7) of the SFA, or (6) as specified in Regulation 32.
Japan
The securities have not been and will not be registered under the Financial Instruments and Exchange Act of Japan (Act No. 25 of 1948, as amended), or the FIEA. The securities may not be offered or sold, directly or indirectly, in Japan or to or for the benefit of any resident of Japan (including any person resident in Japan or any corporation or other entity organized under the laws of Japan) or to others for reoffering or resale, directly or indirectly, in Japan or to or for the benefit of any resident of Japan, except pursuant to an exemption from the registration requirements of the FIEA and otherwise in compliance with any relevant laws and regulations of Japan.
149
Table of Contents
Index to Financial Statements
The validity of the shares of common stock offered by this prospectus will be passed upon for us by Latham & Watkins LLP, Houston, Texas. The validity of the shares of common stock offered hereby will be passed upon for the underwriters by Kirkland & Ellis LLP, Houston, Texas.
The balance sheet of BJ Services, Inc. as of March 31, 2017, included in this prospectus, has been so included in reliance on the report of PricewaterhouseCoopers LLP, an independent registered public accounting firm, given on the authority of said firm as an expert in auditing and accounting.
The financial statements of BJ Services, LLC as of December 31, 2016 and 2015, for the year ended December 31, 2016 and the period from January 27, 2015 (Date of Inception) to December 31, 2015, included in this prospectus, have been so included in reliance on the report of PricewaterhouseCoopers LLP, an independent registered public accounting firm, given on the authority of said firm as an expert in auditing and accounting.
The financial statements of Allied Oil and Gas Holdings, LLC for the period from January 1, 2016 to April 28, 2016 and as of the years ended December 31, 2015 and 2014, included in this prospectus, have been so included in reliance on the report of PricewaterhouseCoopers LLP, an independent registered public accounting firm, given on the authority of said firm as an expert in auditing and accounting.
The statements of direct revenues and direct operating expenses of the Baker Hughes North America Land Pressure Pumping Business for the period from January 1, 2016 through December 30, 2016 and for the years ended December 31, 2015 and 2014, included in this Prospectus have been audited by Deloitte & Touche LLP, independent auditors, as stated in their report appearing herein, and are included in reliance upon the report of such firm given upon their authority as experts in accounting and auditing.
WHERE YOU CAN FIND ADDITIONAL INFORMATION
We have filed with the SEC a registration statement on Form S-1 relating to the shares of common stock offered by this prospectus. This prospectus, which constitutes a part of the registration statement, does not contain all of the information set forth in the registration statement. For further information regarding us and the shares of common stock offered by this prospectus, we refer you to the full registration statement, including its exhibits and schedules, filed under the Securities Act. The registration statement, of which this prospectus constitutes a part, including its exhibits and schedules, may be inspected and copied at the SEC’s Public Reference Room at 100 F Street, N.E., Washington, D.C. 20549. Copies of the materials may also be obtained from the SEC at prescribed rates by writing to the Public Reference Room. You may obtain information on the operation of the Public Reference Room by calling the SEC at 1-800-SEC-0330.
The SEC maintains a website at http://www.sec.gov that contains reports, information statements and other information regarding issuers that file electronically with the SEC. Our registration statement, of which this prospectus constitutes a part, can be downloaded from the SEC’s website. After the completion of this offering, we will file with or furnish to the SEC periodic reports and other information. These reports and other information may be inspected and copied at the Public Reference Room maintained by the SEC or obtained from the SEC’s website as provided above. Following the
150
Table of Contents
Index to Financial Statements
completion of this offering, our website will be located at www.bjservices.com. We intend to make our periodic reports and other information filed with or furnished to the SEC available, free of charge, through our website, as soon as reasonably practicable after those reports and other information are electronically filed with or furnished to the SEC. Information on our website or any other website is not incorporated by reference into this prospectus and does not constitute a part of this prospectus.
We intend to furnish or make available to our shareholders annual reports containing our audited financial statements prepared in accordance with GAAP. We also intend to furnish or make available to our shareholders quarterly reports containing our unaudited interim financial information, including the information required by Form 10-Q, for the first three fiscal quarters of each fiscal year.
151
Table of Contents
Index to Financial Statements
This prospectus contains forward-looking statements. Statements that are predictive in nature, that depend upon or refer to future events or conditions or that include the words “may,” “could,” “plan,” “project,” “budget,” “predict,” “pursue,” “target,” “seek,” “objective,” “believe,” “expect,” “anticipate,” “intend,” “estimate,” and other expressions that are predictions of or indicate future events and trends and that do not relate to historical matters identify forward-looking statements. Our forward-looking statements include statements about our business strategy, our industry, our future profitability, our expected capital expenditures and the impact of such expenditures on our performance, the costs of being a publicly traded corporation and our capital programs.
A forward-looking statement may include a statement of the assumptions or bases underlying the forward-looking statement. We believe that we have chosen these assumptions or bases in good faith and that they are reasonable. You are cautioned not to place undue reliance on any forward-looking statements. You should also understand that it is not possible to predict or identify all such factors and should not consider the following list to be a complete statement of all potential risks and uncertainties. Factors that could cause our actual results to differ materially from the results contemplated by such forward-looking statements include:
| • | the level of production of crude oil, natural gas and other hydrocarbons and the resultant market prices of such commodities; |
| • | changes in general economic and geopolitical conditions; |
| • | competitive conditions in our industry; |
| • | changes in the long-term supply of and demand for oil and natural gas; |
| • | actions taken by our clients, competitors and third-party operators; |
| • | changes in the availability and cost of capital; |
| • | our ability to successfully implement our business plan; |
| • | large or multiple client defaults, including defaults resulting from actual or potential insolvencies; |
| • | the price and availability of debt and equity financing (including changes in interest rates); |
| • | our ability to complete growth projects on time and on budget; |
| • | changes in our tax status; |
| • | technological changes; |
| • | operating hazards, natural disasters, weather-related delays, casualty losses and other matters beyond our control; |
| • | the effects of existing and future laws and governmental regulations (or the interpretation thereof); |
| • | the effects of future litigation; and |
| • | other factors discussed in this prospectus. |
You should not place undue reliance on our forward-looking statements. Although forward-looking statements reflect our good faith beliefs at the time they are made, forward-looking statements involve known and unknown risks, uncertainties and other factors, including the factors described under “Risk Factors,” which may cause our actual results, performance or achievements to differ materially from anticipated future results, performance or achievements expressed or implied by such forward-looking
152
Table of Contents
Index to Financial Statements
statements. We undertake no obligation to publicly update or revise any forward-looking statement, whether as a result of new information, future events, changed circumstances or otherwise, unless required by law. These cautionary statements qualify all forward-looking statements attributable to us or persons acting on our behalf.
153
Table of Contents
Index to Financial Statements
Historical Consolidated Financial Statements
BJ Services, Inc.
F-1
Table of Contents
Index to Financial Statements
REPORT OF INDEPENDENT REGISTERED PUBLIC ACCOUNTING FIRM
To the Board of Directors and Stockholders:
In our opinion, the accompanying balance sheet presents fairly, in all material respects, the financial position of BJ Services, Inc. (the “Company”) as of March 31, 2017, in conformity with accounting principles generally accepted in the United States of America. This financial statement is the responsibility of the Company’s management. Our responsibility is to express an opinion on this financial statement based on our audit. We conducted our audit of this financial statement in accordance with the standards of the Public Company Accounting Oversight Board (United States). Those standards require that we plan and perform the audit to obtain reasonable assurance about whether the financial statement is free of material misstatement. An audit includes examining, on a test basis, evidence supporting the amounts and disclosures in the balance sheet, assessing the accounting principles used and significant estimates made by management, and evaluating the overall financial statement presentation. We believe that our audit provides a reasonable basis for our opinion.
/s/ PricewaterhouseCoopers LLP
Houston, Texas
April 13, 2017
F-2
Table of Contents
Index to Financial Statements
BJ SERVICES, INC.
(whole dollars)
| March 31, 2017 |
||||
| Assets |
||||
| Total Assets |
$ | — | ||
|
|
|
|||
| Commitments & Contingencies |
||||
| Liabilities |
||||
| Total Liabilities |
$ | — | ||
|
|
|
|||
| Stockholder’s equity |
||||
| Note receivable from BJ Services, LLC |
(10 | ) | ||
|
|
|
|||
| Common stock, $0.01 par value; 1,000 shares authorized, issued and outstanding |
10 | |||
|
|
|
|||
| Total stockholder’s equity |
— | |||
|
|
|
|||
| Total Liabilities and stockholder’s equity |
$ | — | ||
|
|
|
|||
The accompanying notes are integral to the balance sheet.
F-3
Table of Contents
Index to Financial Statements
BJ SERVICES, INC.
| 1. | Organization and Basis of Presentation |
BJ Services, Inc. (“the Company”) is a corporation formed under the laws of the State of Delaware on March 23, 2017 (Date of Inception). The Company has adopted a fiscal year-end of December 31. The Company has the authority to issue 1,000 shares of common stock with a par value of $0.01 per share. Each holder of shares of common stock is entitled to attend all special and annual meetings of the shareholders of the corporation and to cast one vote for each outstanding share of common stock.
The Company issued 1,000 shares of common stock to Allied Energy JV Contribution LLC in exchange for a $10 note receivable. As of March 31, 2017, the $10 initial capitalization has not been funded. As a result, the Company has presented this receivable as contra equity.
This balance sheet has been prepared in accordance with accounting principles generally accepted in the United States.
Through March 31, 2017, the Company had not earned any revenue and had not incurred any expenses; therefore, the statements of income, stockholder’s equity and cash flows have been omitted. There have been no other transactions involving the Company as of March 31, 2017.
| 2. | Subsequent Events |
BJ Services has evaluated subsequent events through April 13, 2017, the date the financial statements were available to be issued.
F-4
Table of Contents
Index to Financial Statements
BJ SERVICES, LLC
CONDENSED CONSOLIDATED BALANCE SHEETS
(Unaudited)
(In thousands)
| March 31, 2017 |
December 31, 2016 |
|||||||
| ASSETS |
||||||||
| Current assets |
||||||||
| Cash and cash equivalents |
$ | 135,298 | $ | 175,000 | ||||
| Accounts receivable, net |
160,956 | — | ||||||
| Inventories |
67,248 | 57,982 | ||||||
| Other current assets |
12,721 | 11,464 | ||||||
|
|
|
|
|
|||||
| Total current assets |
376,223 | 244,446 | ||||||
| Property and equipment, net |
638,311 | 618,263 | ||||||
| Intangible assets, net |
29,756 | 30,428 | ||||||
| Other assets |
689 | 72 | ||||||
|
|
|
|
|
|||||
| Total assets |
$ | 1,044,979 | $ | 893,209 | ||||
|
|
|
|
|
|||||
| LIABILITIES AND MEMBERS’ EQUITY |
||||||||
| Current liabilities |
||||||||
| Accounts payable |
$ | 193,383 | $ | — | ||||
| Accrued expenses and other liabilities |
24,792 | 2,678 | ||||||
| Notes payable |
7,701 | 11,464 | ||||||
|
|
|
|
|
|||||
| Total current liabilities |
225,876 | 14,142 | ||||||
| Notes payable, net of current maturities |
— | 331 | ||||||
| Other long-term liabilities |
3,696 | 1,050 | ||||||
|
|
|
|
|
|||||
| Total liabilities |
229,572 | 15,523 | ||||||
|
|
|
|
|
|||||
| Commitments and contingencies |
||||||||
| Members’ equity |
||||||||
| Members’ equity, 891,000 Class B-1 units issued and outstanding |
815,407 | 877,686 | ||||||
|
|
|
|
|
|||||
| Total members’ equity |
815,407 | 877,686 | ||||||
|
|
|
|
|
|||||
| Total liabilities and members’ equity |
$ | 1,044,979 | $ | 893,209 | ||||
|
|
|
|
|
|||||
The accompanying notes are an integral part of these condensed consolidated financial statements.
F-5
Table of Contents
Index to Financial Statements
BJ SERVICES, LLC
CONDENSED CONSOLIDATED STATEMENTS OF OPERATIONS
(Unaudited)
(In thousands, except for unit and per unit information)
| Three Months Ended March 31, |
||||||||
| 2017 | 2016 | |||||||
| Revenue |
$ | 180,072 | $ | 951 | ||||
| Operating costs and expense |
||||||||
| Cost of revenue |
223,667 | 1,616 | ||||||
| Selling, general and administrative |
20,813 | 589 | ||||||
|
|
|
|
|
|||||
| Operating loss |
(64,408 | ) | (1,254 | ) | ||||
| Other income (expense) |
||||||||
| Interest income, net |
106 | (8 | ) | |||||
| Other expense, net |
(108 | ) | (33 | ) | ||||
|
|
|
|
|
|||||
| Total other expense |
(2 | ) | (41 | ) | ||||
|
|
|
|
|
|||||
| Loss before taxes |
(64,410 | ) | (1,295 | ) | ||||
| Income tax benefit |
1,004 | — | ||||||
|
|
|
|
|
|||||
| Net loss |
$ | (63,406 | ) | $ | (1,295 | ) | ||
|
|
|
|
|
|||||
| Weighted average shares outstanding: |
||||||||
| Basic |
891,000 | 419,914 | ||||||
| Diluted |
891,000 | 419,914 | ||||||
| Loss per share: |
||||||||
| Basic |
$ (71.16) | $ (3.08) | ||||||
| Diluted |
$ (71.16) | $ (3.08) | ||||||
| Comprehensive income (loss): |
||||||||
| Net loss |
(63,406 | ) | (1,295 | ) | ||||
| Foreign currency translation, net of tax |
(431 | ) | — | |||||
|
|
|
|
|
|||||
| Comprehensive loss |
$ | (63,837 | ) | $ | (1,295 | ) | ||
|
|
|
|
|
|||||
The accompanying notes are an integral part of these condensed consolidated financial statements.
F-6
Table of Contents
Index to Financial Statements
BJ SERVICES, LLC
CONDENSED CONSOLIDATED STATEMENTS OF MEMBERS’ EQUITY
(Unaudited)
(In thousands)
| March 31, 2017 |
March 31, 2016 |
|||||||
| Beginning of period |
$ | 877,686 | $ | 11,121 | ||||
| Net loss |
(63,406 | ) | (1,295 | ) | ||||
| Sponsor severance awards to employees |
1,467 | — | ||||||
| Equity-based compensation |
91 | 47 | ||||||
| Member contributions |
— | 565 | ||||||
| Cumulative translation adjustment |
(431 | ) | — | |||||
|
|
|
|
|
|||||
| End of period |
$ | 815,407 | $ | 10,438 | ||||
|
|
|
|
|
|||||
The accompanying notes are an integral part of these condensed consolidated financial statements.
F-7
Table of Contents
Index to Financial Statements
BJ SERVICES, LLC
CONDENSED CONSOLIDATED STATEMENTS OF CASH FLOWS
(Unaudited)
(In thousands)
| Three Months Ended March 31, |
||||||||
| 2017 | 2016 | |||||||
| Net cash used in operating activities |
$ | (15,271 | ) | $ | (722 | ) | ||
| Cash flows from investing activities |
||||||||
| Purchase of property and equipment |
(19,860 | ) | (71 | ) | ||||
| Other |
(83 | ) | — | |||||
|
|
|
|
|
|||||
| Net cash used in investing activities |
(19,943 | ) | (71 | ) | ||||
| Cash flows from financing activities |
||||||||
| Principal payments on notes |
(4,425 | ) | (36 | ) | ||||
| Proceeds from issuance of equity |
— | 565 | ||||||
|
|
|
|
|
|||||
| Net cash provided by (used in) financing activities |
(4,425 | ) | 529 | |||||
| Effect of exchange rate changes on cash |
(63 | ) | — | |||||
|
|
|
|
|
|||||
| Net decrease in cash and cash equivalents |
(39,702 | ) | (264 | ) | ||||
| Cash and cash equivalents, beginning of period |
175,000 | 1,174 | ||||||
|
|
|
|
|
|||||
| Cash and cash equivalents, end of period |
$ | 135,298 | $ | 910 | ||||
|
|
|
|
|
|||||
| Supplemental disclosures of cash flow information: |
||||||||
| Noncash investing and financing activities: |
||||||||
| Property and equipment acquisition included in accounts payable |
$ | 22,726 | $ | — | ||||
The accompanying notes are an integral part of these condensed consolidated financial statements.
F-8
Table of Contents
Index to Financial Statements
BJ SERVICES, LLC
NOTES TO UNAUDITED CONDENSED CONSOLIDATED FINANCIAL STATEMENTS
| 1. | Organization and Nature of Operations |
BJ Services, LLC (sometimes referred to as “we” or the “Company”) is a leading supplier of pressure pumping services to the United States and Canada land-based oil and natural gas industry. We manage our operations through two segments: hydraulic fracturing and cementing. We operate out of 20 field locations, serving all major North American oil and natural gas shale basins. We currently own 43 hydraulic fracturing fleets with an aggregate capacity of 2.2 million HHP (in excess of 50,000 HHP per fleet), as well as 241 cementers. As of March 31, 2017, we had approximately 2,000 employees.
BJ Services, LLC was formed in late 2016 through a Contribution Agreement (“the Contribution Agreement”) among Baker Hughes Oilfield Operations, Inc. (“BHOO”) (a wholly owned subsidiary of Baker Hughes Incorporated), Allied Energy JV Contribution, LLC (the “Joint Venture”), a joint venture among CSL Capital Management, LLC and its affiliated funds (“CSL”) and certain funds affiliated with Goldman Sachs & Co. LLC and managed by the Merchant Banking Division of Goldman Sachs & Co. LLC (“Goldman Sachs Affiliated Funds” and, together with CSL, the “Sponsors”), and Allied Completions Holdings, LLC (“Allied Completions Holdings”). Under the terms of the Contribution Agreement, BHOO contributed its hydraulic fracturing and cementing services in the United States and Canada, including personnel, expertise, technology and infrastructure (the “Baker Hughes North America Land Pressure Pumping Business”). Allied Completions Holdings contributed cash and its pressure pumping business in the United States, including hydraulic fracturing and cementing services and certain of its other assets. Through the Joint Venture, CSL and Goldman Sachs Affiliated Funds contributed cash of $325.0 million, of which $175.0 million was retained by the Company, while the remaining $150.0 million was paid to BHOO. Our Sponsors own approximately 53% of BJS LLC and BHOO owns the remaining interest. The Contribution Agreement closed and became effective on December 30, 2016.
In connection with the Contribution Agreement, the Company’s Amended and Restated LLC Agreement dated as of December 30, 2016 defines the Company’s principal business as land based hydraulic fracturing services (“Hydraulic Fracturing”) and land based well cementing and acidizing services (“Cementing”). The Company’s members are prohibited from competing in the Company’s principal business until a deemed liquidation event.
| 2. | Basis of Presentation |
The accompanying unaudited condensed consolidated financial statements were prepared using United States generally accepted accounting principles (“U.S. GAAP”) for interim financial information and Regulation S-X. Accordingly, these financial statements do not include all information or notes required by U.S. GAAP for annual financial statements and should be read together with our 2016 audited financial statements included elsewhere in this prospectus.
Our accounting policies are in accordance with U.S. GAAP. The preparation of financial statements in conformity with these accounting principles requires us to make estimates and assumptions that affect:
| • | the reported amounts of assets and liabilities and disclosure of contingent assets and liabilities at the date of the financial statements; and |
| • | the reported amounts of revenue and expenses during the reporting period. |
| • | Ultimate results could differ from our estimates. |
In our opinion, the condensed consolidated financial statements included herein contain all adjustments necessary to state fairly our financial position as of March 31, 2017, the results of our operations for the three months ended March 31, 2017 and 2016, and our cash flows for the three months ended March 31, 2017 and 2016. Such adjustments are of a normal recurring
F-9
Table of Contents
Index to Financial Statements
BJ SERVICES, LLC
NOTES TO UNAUDITED CONDENSED CONSOLIDATED FINANCIAL STATEMENTS
nature. The results of our operations for the three months ended March 31, 2017 may not be indicative of results for the full year.
| 3. | Business Segment and Client Information |
The Company presents its operations under two reportable segments: (1) Hydraulic Fracturing and (2) Cementing. The results for these operating segments are evaluated regularly by the chief operating decision maker in deciding how to allocate resources and assessing performance. Intersegment sales and transfers are not material.
Summarized financial information for the Company’s reportable segments is presented in the following table (in thousands):
Business Segments
| March 31, 2017 | March 31, 2016 | |||||||
| Revenue: |
||||||||
| Hydraulic fracturing |
$ | 131,705 | $ | — | ||||
| Cementing |
48,367 | 951 | ||||||
|
|
|
|
|
|||||
| Consolidated |
$ | 180,072 | $ | 951 | ||||
|
|
|
|
|
|||||
| Operating income (loss): |
||||||||
| Hydraulic fracturing |
(35,836 | ) | — | |||||
| Cementing |
(18,283 | ) | (950 | ) | ||||
| Corporate and non-allocated costs |
(10,289 | ) | (304 | ) | ||||
|
|
|
|
|
|||||
| Consolidated |
$ | (64,408 | ) | $ | (1,254 | ) | ||
|
|
|
|
|
|||||
Client Information
For the first quarter of 2017, one client represented 20% of total revenue. As of March 31, 2017, one client represented 20% of accounts receivable and another client represented 11% of accounts receivable. No other individual client represented greater than 10% of accounts receivable. Accounts receivable for United States services and Canadian Services totaled 79% and 21%, respectively, as of March 31, 2017.
| 4. | Income Taxes |
The Company’s members have elected to have the Company taxed as a partnership under the provisions of the Internal Revenue Code of 1986, as amended, (IRC) and applicable state laws. Thus, the Company is not directly subject to income taxes in the United States under provisions of the IRC or applicable state laws and taxable income or loss is reported to the members for inclusion in their respective tax returns. The Company is subject to tax in Canada and in the state of Texas. The tax benefit for the quarter of $1,004,000 is limited to the State of Texas and excludes any tax benefit of Canadian pretax book losses subject to a valuation allowance.
In assessing the realization of deferred tax assets, the Company considers whether it is more likely than not that some portion or all of the deferred tax assets will not be realized. We consider and make judgments regarding whether a deferred tax asset will be realized on a tax filer and jurisdictional basis and is based on all the available positive and negative evidence, including the
F-10
Table of Contents
Index to Financial Statements
BJ SERVICES, LLC
NOTES TO UNAUDITED CONDENSED CONSOLIDATED FINANCIAL STATEMENTS
timing of the reversal of deferred tax assets and liabilities, projected future taxable income, ongoing, prudent and feasible tax planning strategies and recent financial results of operations. The amount of the deferred tax assets considered realizable, however, could be adjusted in the future if objective negative evidence in the form of cumulative losses is no longer present, and additional weight may be given to subjective evidence such as our projections for growth. We will record a valuation allowance if it is deemed more likely than not that all or a portion of our deferred tax assets will not be realized.
| 5. | Per Unit Information |
Basic and diluted loss per unit were equal for both periods presented because of the net loss. The amounts used to compute the loss per unit are illustrated below (in thousands except for unit and per unit information):
| March 31, 2017 | March 31, 2016 | |||||||
| Loss per Unit |
||||||||
| Net loss |
$ | (63,406 | ) | $ | (1,295 | ) | ||
| Weighted average common units |
891,000 | 419,914 | ||||||
|
|
|
|
|
|||||
| Basic and diluted loss per unit |
$ | (71.16 | ) | $ | (3.08 | ) | ||
|
|
|
|
|
|||||
Excluded from the weighted average common units calculation were 2,228,000 Class A units awarded during the first quarter of 2017. These units were anti-dilutive because a net loss was incurred during the period.
| 6. | Inventories |
Inventory consisted of the following at March 31, 2017 and December 31, 2016 (in thousands):
| March 31, 2017 | December 31, 2016 | |||||||
| Finished goods |
$ | 33,882 | $ | 36,525 | ||||
| Raw materials, parts and supplies |
33,366 | 21,457 | ||||||
|
|
|
|
|
|||||
| $ | 67,248 | $ | 57,982 | |||||
|
|
|
|
|
|||||
There were no inventory reserves as of March 31, 2017 or December 31, 2016.
| 7. | Property and Equipment |
Property and equipment consisted of the following as of March 31, 2017 and December 31, 2016 (in thousands):
| Useful Lives | March 31, 2017 | December 31, 2016 | ||||||||||
| Land |
— | $ | 33,619 | $ | 33,619 | |||||||
| Buildings and improvements |
5-30 | 94,535 | 94,535 | |||||||||
| Machinery, equipment and other |
2-10 | 543,078 | 499,802 | |||||||||
|
|
|
|
|
|||||||||
| 671,232 | 627,956 | |||||||||||
| Less: Accumulated depreciation and amortization |
(32,921 | ) | (9,693 | ) | ||||||||
|
|
|
|
|
|||||||||
| $ | 638,311 | $ | 618,263 | |||||||||
|
|
|
|
|
|||||||||
F-11
Table of Contents
Index to Financial Statements
BJ SERVICES, LLC
NOTES TO UNAUDITED CONDENSED CONSOLIDATED FINANCIAL STATEMENTS
Depreciation expense totaled approximately $23,229,000 and $309,000 during the three months ended March 31, 2017 and 2016, respectively.
| 8. | Intangible Assets |
The following summarizes the carrying amounts of intangible assets and related amortization as of March 31, 2017 and changes from December 31, 2016 (in thousands):
| Technology | Trade names & other | Total | ||||||||||
| Balance as of December 31, 2016 |
$ | 25,000 | $ | 5,428 | $ | 30,428 | ||||||
| Additions |
— | 83 | 83 | |||||||||
| Amortization expense |
(625 | ) | (130 | ) | (755 | ) | ||||||
|
|
|
|
|
|
|
|||||||
| Balance as of March 31, 2017 |
$ | 24,375 | $ | 5,381 | $ | 29,756 | ||||||
|
|
|
|
|
|
|
|||||||
Technology relates to the perpetual, irrevocable, royalty-free license to use Baker Hughes’ onshore pressure pumping technologies in the United States and Canada per the terms of the Contribution Agreement.
| 9. | Debt |
The Company has financed the payment of its insurance premiums. The financed premiums totaled $7,701,000 and $11,464,000 as of March 31, 2017 and December 31, 2016 respectively, and are generally payable in monthly installments, including interest, at 3.50% through December 2017. The notes are secured by the unearned premium under the financed policies, which is included in “Other assets.”
The Company had equipment notes outstanding at December 31, 2016 totaling approximately $509,000. These notes were paid in full during the first quarter of 2017.
| 10. | Commitments and Contingencies |
Litigation
In the ordinary course of business, the Company is involved in various pending or threatened legal actions, some of which may or may not be covered by insurance. Management has reviewed such pending judicial and legal proceedings, the reasonably anticipated costs and expenses in connection with such proceedings, and the availability and limits of insurance coverage. There were no litigation reserves accrued as of March 31, 2017 and December 31, 2016. In the opinion of management, the Company’s ultimate liability, if any, with respect to these actions is not expected to have a material adverse effect on the Company’s financial position, results of operations or cash flows.
| 11. | Members’ Equity |
Class A Unit Awards
The Second Amended and Restated Limited Liability Company Agreement, dated as of December 30, 2016 (“LLC Agreement”), of BJ Services provides for the issuance of up to 5,000,000 Class A Units (profits interests) to persons who provide services to the Company, such as members of management, other key personnel, consultants or independent contractors, or as otherwise provided in the LLC Agreement. Class A Units are nonvoting, are intended to be “profits interests,” and are assigned a hurdle amount, as defined, upon issuance.
F-12
Table of Contents
Index to Financial Statements
BJ SERVICES, LLC
NOTES TO UNAUDITED CONDENSED CONSOLIDATED FINANCIAL STATEMENTS
The Company issued 2,228,000 Class A restricted units to members of management during the first quarter of 2017. The units vest 75% based on time vesting (approximately four years) and 25% upon a change of control. The grant date fair value of $2,874,000 is being amortized over the estimated vesting period.
The fair value of each Class A Unit award was estimated on the date of grant using a valuation model that used the assumptions noted in the following table. Expected volatility was based on historical volatility of comparative public companies in the same industry, as the Company is private and has no trading volume. The expected term of awards granted represents the period that awards are expected to be outstanding.
| BJ Services, LLC | ||||
| Expected volatility |
36.5 | % | ||
| Discount for lack of marketability |
5.0 | % | ||
| Risk free interest rate |
0.8 | % | ||
| Expected dividend yield |
None | |||
| Expected life in years |
0.3 years | |||
Class B-2 Unit Investments
During April 1 through May 19, 2017, certain members of management purchased 4,000 Class B-2 Units for $4,000,000.
| 12. | Related Party Transactions |
In connection with the Contribution Agreement, the Company entered into a Transition Services Agreement (“TSA”) with BHI dated December 30, 2016, which has a term of one year. The TSA provides for the following services: Information Technology, Finance and Accounting, International Trade Compliance, Insurance and Risk Management, Health, Safety, and Environment, Commercial and Contract Support, Real Estate, Supply Chain, Field Operations, and Technology. The Company is billed on a monthly basis for the services provided during that month per the terms of the TSA. During the first quarter of 2017, the Company expensed $3,656,000 and $406,000 under the TSA in cost of revenue and selling, general and administrative, respectively. In addition, the Company recognized income of $360,000 under the TSA during the first quarter of 2017.
During the first quarter of 2017, affiliates of our Sponsors entered into severance arrangements totaling $5,000,000 with certain employees. The entire amount of these arrangements is reflected as selling, general and administrative expense in the three months ended March 31, 2017 condensed consolidated statement of operations. Of this amount, $1,467,000 was paid by affiliates of our Sponsors during the first quarter of 2017 and is reflected as an increase to members’ equity. However, no change in ownership percentages resulted from these transactions. The unpaid amounts of $3,533,000 are expected to be paid by affiliates of our Sponsors during the remainder of 2017 and are reflected as accrued expenses and other liabilities in the March 31, 2017 condensed consolidated balance sheet.
| 13. | Subsequent Events |
Subsequent events have been evaluated through May 23, 2017, which is the date these financial statements were available to be issued.
F-13
Table of Contents
Index to Financial Statements
BJ SERVICES, LLC
NOTES TO UNAUDITED CONDENSED CONSOLIDATED FINANCIAL STATEMENTS
| 14. | Recent Accounting Pronouncements |
Accounting Standards Not Yet Adopted
In January 2017, the FASB issued Accounting Standards Update No. 2017-04, Intangibles-Goodwill and Other (Topic 350): Simplifying the Test for Goodwill Impairment. ASU 2017-04 intended to simplify the subsequent measurement of goodwill by eliminating the second step in the current two-step goodwill impairment test. The update will require an entity to perform its annual, or interim, goodwill impairment test by comparing the fair value of a reporting unit with its carrying amount. An entity will recognize an impairment charge for the amount by which the carrying amount exceeds the reporting unit’s fair value, if applicable. Additionally, the update will eliminate the requirement that a reporting unit with a zero or negative carrying amount perform a qualitative assessment and the second step of the two-step goodwill impairment test and will instead require disclosure of the amount of goodwill allocated to each reporting unit with a zero or negative carrying amount of net assets. This update is effective for public entities for interim and annual reporting periods beginning after December 15, 2019, although early adoption is permitted for interim and annual goodwill impairment tests performed on testing dates after January 1, 2017. The prospective transition method will be required for this new guidance. The Company is currently evaluating the potential impact of this authoritative guidance on its consolidated financial statements and will adopt this guidance by January 1, 2020.
In January 2017, the FASB issued Accounting Standards Update No. 2017-01, Business Combinations (Topic 805): Clarifying the Definition of a Business (“ASU 2017-01”). ASU 2017-01 intended to clarify the definition of a business to assist entities with evaluation of whether transactions should be accounted for as acquisitions or disposals of assets or businesses. The new definition requires that when substantially all of the fair value of the gross assets acquired or disposed of is concentrated in a single identifiable asset or group of similar identifiable assets, the asset or group is not a business. The update will require that to be considered a business, a set of assets and activities must include, at a minimum, an input and a substantive process that together significantly contribute to the ability to create output. Additionally, the update will remove the evaluation of whether a market participant could replace missing elements in order to consider the set of assets and activities a business, will provide more stringent criteria for sets without outputs and will narrow the definition of output. The new standard is effective for interim and annual reporting periods beginning after December 15, 2017, although early adoption is permitted for certain transactions. The prospective transition method will be required for this new guidance. The Company is currently evaluating the potential impact of this authoritative guidance on its consolidated financial statements and will adopt this guidance by January 1, 2018.
In March 2016, the FASB issued Accounting Standards Update No. 2016-09, Compensation—Stock Compensation (Topic 718) Improvements to Employee Share-Based Payment Accounting (“ASU 2016-09”). ASU 2016-09 includes provisions intended to simplify accounting for share-based payment transactions including the income tax consequences, classification of awards as either equity or liabilities, and classification on the statement of cash flows. Under ASU 2016-09, all excess tax benefits (or tax deficiencies) will be recognized as income tax benefit (or expense) in the statement of operations. Additionally, when applying the treasury stock method for computing diluted earnings per share under ASU 2016-09 the assumed proceeds will not include any windfall tax benefits, resulting in equity awards which may result in a greater number of dilutive shares outstanding. Further, excess tax benefits will be classified along with other income tax cash flows as an operating activity. ASU 2016-09 also permits withholding up to the maximum statutory tax rate in applicable jurisdictions as the threshold to qualify for equity classification. ASU 2016-09 will be effective for the Company in fiscal 2018 and interim reporting periods within
F-14
Table of Contents
Index to Financial Statements
BJ SERVICES, LLC
NOTES TO UNAUDITED CONDENSED CONSOLIDATED FINANCIAL STATEMENTS
that year. Early adoption is permitted as of the beginning of an interim or annual reporting period with all adjustments to be reflected as of the beginning of the fiscal year of adoption. The Company is currently evaluating the effect of the adoption of this guidance on the Company’s consolidated financial statements.
In February 2016, the FASB issued ASU No. 2016-02, Leases (“ASC 842”), which replaces the existing guidance in ASC 840, Leases. ASC 842 requires lessees to recognize most leases on their balance sheets as lease liabilities with corresponding right-of-use assets. The new lease standard does not substantially change lessor accounting. The new standard is effective for interim and annual reporting periods beginning after December 15, 2018, with early adoption permitted. The Company is currently evaluating the impact of the adoption of this guidance.
In September 2015, the FASB issued Accounting Standards Update No. 2015-16, Business Combinations (Topic 805): Simplifying the Accounting for Measurement-Period Adjustments (“ASU 2015-16”). ASU 2015-16 replaces the requirement for an acquirer in a business combination to retrospectively adjust provisional amounts recognized at the acquisition date with a corresponding adjustment to goodwill when measurement period adjustments are identified. The new guidance requires an acquirer to recognize adjustments in the reporting period in which the adjustment amounts are determined. The acquirer must record, in the same period’s financial statements, the effect on earnings of changes in depreciation, amortization, or other income effects, if any, as a result of the change to the provisional amounts, calculated as if the accounting had been completed at the acquisition date. Additionally, the acquirer must present separately on the face of the income statement, or disclose in the notes, the portion of the amount recorded in current period earnings by line item that would have been recorded in previous reporting periods if the adjustments had been recognized as of the acquisition date. ASU 2015-16 will be effective for the Company in fiscal 2017 and interim reporting periods beginning after December 15, 2017. The adoption of the guidance is not expected to have a material effect on the Company’s consolidated financial statements.
In May 2014, the FASB issued an update that supersedes most current revenue recognition guidance, as well as some cost recognition guidance. The update requires that the recognition of revenue related to the transfer of goods or services to customers reflects the consideration to which the entity expects to be entitled in exchange for those goods or services. This update also requires new qualitative and quantitative disclosures about the nature, amount, timing and uncertainty of revenues and cash flows arising from customer contracts, including significant judgments and changes in judgments, information about contract balances and performance obligations, and assets recognized from costs incurred to obtain or fulfill a contract. In July 2015, the FASB affirmed its proposal to defer the effective date until fiscal years beginning on or after December 15, 2017. The guidance can be applied on a full retrospective or modified retrospective basis whereby the entity records a cumulative effect of initially applying this update at the date of initial application. The Company is currently evaluating this standard in order to select a transition method and the effective date. The Company has not determined the effect of this standard on its financial statements and related disclosures.
Accounting Standards Adopted
Effective January 1, 2017, the Company adopted ASU No. 2014-15, Presentation of Financial Statements—Going Concern. The new standard requires management to evaluate whether there are conditions and events that raise substantial doubt about an entity’s ability to continue as a going concern for both annual and interim reporting. Management performed an evaluation of the
F-15
Table of Contents
Index to Financial Statements
BJ SERVICES, LLC
NOTES TO UNAUDITED CONDENSED CONSOLIDATED FINANCIAL STATEMENTS
Company’s ability to fund operations and to continue as a going concern according to ASC Topic 205-40, Presentation of Financial Statements—Going Concern. The guidance did not have a material impact on the Company’s financial statements.
Effective January 1, 2017, the Company adopted ASU No. 2015-17, Balance Sheet Classification of Deferred Taxes. This standard requires that all deferred taxes, along with any related valuation allowance, to be presented as a non current deferred asset or liability. This ASU did not have a material impact on the Company’s financial statements.
Effective January 1, 2017, the Company adopted ASU No. 2015-11. Simplifying the Measurement of Inventory, which requires companies to measure inventory at the lower of cost or net realizable value rather than the lower of cost or market. This ASU did not have a material impact on the Company’s financial statements.
F-16
Table of Contents
Index to Financial Statements
Report of Independent Registered Public Accounting Firm
To the Board of Directors and
Members of BJ Services, LLC
In our opinion, the accompanying consolidated balance sheets and the related consolidated statements of operations, of members’ equity and of cash flows present fairly, in all material respects, the financial position of BJ Services, LLC and its subsidiaries as of December 31, 2016 and 2015, and the results of their operations and their cash flows for the year ended December 31, 2016 and the period from January 27, 2015 (Date of Inception) to December 31, 2015 in conformity with accounting principles generally accepted in the United States of America. These financial statements are the responsibility of the Company’s management. Our responsibility is to express an opinion on these financial statements based on our audits. We conducted our audits of these financial statements in accordance with the standards of the Public Company Accounting Oversight Board (United States). Those standards require that we plan and perform the audit to obtain reasonable assurance about whether the financial statements are free of material misstatement. An audit includes examining, on a test basis, evidence supporting the amounts and disclosures in the financial statements, assessing the accounting principles used and significant estimates made by management, and evaluating the overall financial statement presentation. We believe that our audits provide a reasonable basis for our opinion.
/s/ PricewaterhouseCoopers LLP
Houston, TX
April 13, 2017
F-17
Table of Contents
Index to Financial Statements
BJ SERVICES, LLC
DECEMBER 31, 2016 AND 2015
| December 31, | ||||||||
| 2016 | 2015 | |||||||
| (in thousands) | ||||||||
| Assets |
||||||||
| Current assets |
||||||||
| Cash and cash equivalents |
$ | 175,000 | $ | 1,174 | ||||
| Accounts receivable, net |
— | 579 | ||||||
| Inventories, net |
57,982 | 251 | ||||||
| Prepaid expenses and other |
11,464 | 108 | ||||||
|
|
|
|
|
|||||
| Total current assets |
244,446 | 2,112 | ||||||
| Property and equipment, net |
618,263 | 9,966 | ||||||
| Intangible assets, net |
30,428 | — | ||||||
| Other assets |
72 | 63 | ||||||
|
|
|
|
|
|||||
| Total assets |
$ | 893,209 | $ | 12,141 | ||||
|
|
|
|
|
|||||
| Liabilities and Members’ Equity |
||||||||
| Current liabilities |
||||||||
| Notes payable |
$ | 11,464 | $ | — | ||||
| Accounts payable |
— | 158 | ||||||
| Accrued expenses and other liabilities |
2,678 | 429 | ||||||
|
|
|
|
|
|||||
| Total current liabilities |
14,142 | 587 | ||||||
| Long-term liabilities, less current maturities |
||||||||
| Equipment notes |
331 | 433 | ||||||
| Other long-term liabilities |
1,050 | — | ||||||
|
|
|
|
|
|||||
| Total long-term liabilities |
1,381 | 433 | ||||||
|
|
|
|
|
|||||
| Commitments and contingencies |
||||||||
| Members’ equity |
||||||||
| Members’ equity, 891,000 Class B-1 units authorized, issued and outstanding |
877,686 | 11,121 | ||||||
|
|
|
|
|
|||||
| Total liabilities and members’ equity |
$ | 893,209 | $ | 12,141 | ||||
|
|
|
|
|
|||||
The accompanying notes are an integral part of these consolidated financial statements.
F-18
Table of Contents
Index to Financial Statements
BJ SERVICES, LLC
CONSOLIDATED STATEMENTS OF OPERATIONS
YEAR ENDED DECEMBER 31, 2016 AND
PERIOD FROM JANUARY 27, 2015 (DATE OF INCEPTION) THROUGH DECEMBER 31, 2015
| Year ended December 31, |
Period from January 27, 2015 to December 31, |
|||||||
| 2016 | 2015 | |||||||
| (in thousands, except unit and per unit amounts) |
||||||||
| Revenue |
$ | 36,985 | $ | 1,212 | ||||
| Operating costs and expenses |
||||||||
| Cost of revenue |
51,923 | 1,800 | ||||||
| Selling, general and administrative |
20,573 | 3,266 | ||||||
| Bargain purchase gain |
(34,180 | ) | — | |||||
| Other |
668 | — | ||||||
|
|
|
|
|
|||||
| Operating loss |
(1,999 | ) | (3,854 | ) | ||||
| Other income (expense) |
||||||||
| Interest expense, net |
(97 | ) | (18 | ) | ||||
| Other income (expense), net |
(183 | ) | — | |||||
|
|
|
|
|
|||||
| Total other expense |
(280 | ) | (18 | ) | ||||
|
|
|
|
|
|||||
| Net loss |
$ | (2,279 | ) | $ | (3,872 | ) | ||
|
|
|
|
|
|||||
| Per unit information |
||||||||
| Basic and diluted net loss per unit |
$ | (5.23 | ) | $ | (9.40 | ) | ||
| Basic and diluted weighted average units outstanding |
435,630 | 411,964 | ||||||
| Pro forma information (unaudited): |
||||||||
| Net income (loss) |
||||||||
| Pro forma provision for income taxes |
||||||||
| Pro forma net income (loss) |
||||||||
| Pro forma net income (loss) per common share |
||||||||
| Basic and diluted |
||||||||
| Weighted average pro forma common shares outstanding |
||||||||
| Basic and diluted |
||||||||
The accompanying notes are an integral part of these consolidated financial statements.
F-19
Table of Contents
Index to Financial Statements
BJ SERVICES, LLC
CONSOLIDATED STATEMENTS OF MEMBERS’ EQUITY
YEAR ENDED DECEMBER 31, 2016 AND
PERIOD FROM JANUARY 27, 2015 (DATE OF INCEPTION) THROUGH DECEMBER 31, 2015
| Year ended December 31, |
Period from January 27, 2015 to December 31, |
|||||||
| 2016 | 2015 | |||||||
| (in thousands) | ||||||||
| Beginning of period |
$ | 11,121 | $ | — | ||||
| Member contributions |
450,801 | 14,853 | ||||||
| Issuance of equity to Baker Hughes |
416,000 | — | ||||||
| Distribution of net liabilities |
1,857 | — | ||||||
| Equity-based compensation expense |
186 | 140 | ||||||
| Net loss |
(2,279 | ) | (3,872 | ) | ||||
|
|
|
|
|
|||||
| End of period |
$ | 877,686 | $ | 11,121 | ||||
|
|
|
|
|
|||||
The accompanying notes are an integral part of these consolidated financial statements.
F-20
Table of Contents
Index to Financial Statements
BJ SERVICES, LLC
CONSOLIDATED STATEMENTS OF CASH FLOWS
YEAR ENDED DECEMBER 31, 2016 AND
PERIOD FROM JANUARY 27, 2015 (DATE OF INCEPTION) THROUGH DECEMBER 31, 2015
| Year ended December 31, |
Period from January 27, 2015 to December 31, |
|||||||
| 2016 | 2015 | |||||||
| (in thousands) | ||||||||
| Operating activities |
||||||||
| Net loss |
$ | (2,279 | ) | $ | (3,872 | ) | ||
| Adjustments to reconcile net loss to net cash used in operating activities |
||||||||
| Bargain purchase gain |
(34,180 | ) | — | |||||
| Depreciation |
9,209 | 417 | ||||||
| Amortization |
189 | — | ||||||
| Provision for doubtful accounts receivable |
1,690 | — | ||||||
| Other |
733 | 140 | ||||||
| Changes in: |
||||||||
| Accounts receivable |
(8,302 | ) | (579 | ) | ||||
| Inventories |
(1,356 | ) | (251 | ) | ||||
| Other assets |
73 | (171 | ) | |||||
| Accounts payable and accrued expenses |
14,559 | 397 | ||||||
|
|
|
|
|
|||||
| Net cash used in operating activities |
(19,664 | ) | (3,919 | ) | ||||
|
|
|
|
|
|||||
| Investing activities |
||||||||
| Acquisition of Baker Hughes N.A. PP business |
(150,000 | ) | — | |||||
| Acquisition of Allied Oil & Gas, net of cash acquired |
(20,923 | ) | — | |||||
| Purchase of property and equipment |
(65,613 | ) | (10,355 | ) | ||||
| Other |
443 | — | ||||||
|
|
|
|
|
|||||
| Net cash used in investing activities |
(236,093 | ) | (10,355 | ) | ||||
|
|
|
|
|
|||||
| Financing activities |
||||||||
| Member contributions |
430,501 | 14,853 | ||||||
| Proceeds from issuance of notes |
— | 768 | ||||||
| Principal payments on notes |
(140 | ) | (173 | ) | ||||
| Cash distributions from assets not contributed |
(778 | ) | — | |||||
|
|
|
|
|
|||||
| Net cash provided by financing activities |
429,583 | 15,448 | ||||||
|
|
|
|
|
|||||
| Increase in cash |
173,826 | 1,174 | ||||||
|
|
|
|
|
|||||
| Cash |
||||||||
| Beginning of period |
1,174 | — | ||||||
|
|
|
|
|
|||||
| End of period |
$ | 175,000 | $ | 1,174 | ||||
|
|
|
|
|
|||||
| Noncash investing and financing activities |
||||||||
| Issuance of equity to Baker Hughes for the acquisition of Baker Hughes N.A. PP business |
$ | 416,000 | $ | — | ||||
| Issuance of equity to Bayou Well Services for property and equipment |
20,300 | — | ||||||
| Prepaid insurance financed |
11,464 | — | ||||||
| Distribution of net liabilities |
2,635 | — | ||||||
| Sale of property and equipment for note receivable |
350 | — | ||||||
The accompanying notes are an integral part of these consolidated financial statements.
F-21
Table of Contents
Index to Financial Statements
BJ SERVICES, LLC
NOTES TO CONSOLIDATED FINANCIAL STATEMENTS
DECEMBER 31, 2016 AND 2015
| 1. | Organization and Nature of Operations |
BJ Services, LLC (sometimes referred to as “we” or the “Company”) is a leading supplier of pressure pumping services in the United States and Canada land-based oil and natural gas industry. We manage our operations through two segments: hydraulic fracturing and cementing. We operate out of 20 field locations, serving all major North American oil and natural gas shale basins. We currently own 43 hydraulic fracturing fleets with an aggregate capacity of 2.2 million HHP (in excess of 50,000 HHP per fleet), as well as 241 cementers. As of December 31, 2016, we had approximately 1,445 employees.
BJ Services, LLC was formed in late 2016 through a Contribution Agreement (“the Contribution Agreement”) among Baker Hughes Oilfield Operations, Inc. (“BHOO”) (a wholly owned subsidiary of Baker Hughes Incorporated), Allied Energy JV Contribution, LLC (the “Joint Venture”), a joint venture among CSL Capital Management, LLC and its affiliated funds (“CSL”) and certain funds affiliated with Goldman Sachs & Co. LLC and managed by the Merchant Banking Division of Goldman Sachs & Co. LLC (“Goldman Sachs Affiliated Funds” and, together with CSL, the “Sponsors”), and Allied Completions Holdings, LLC (“Allied Completions Holdings”). Under the terms of the Contribution Agreement, BHOO contributed its hydraulic fracturing and cementing services in the United States and Canada, including personnel, expertise, technology and infrastructure (the “Baker Hughes North America Land Pressure Pumping Business”). Allied Completions Holdings contributed cash and its pressure pumping business in the United States, including hydraulic fracturing and cementing services and certain of its other assets. Through the Joint Venture, CSL and Goldman Sachs Affiliated Funds contributed cash of $325.0 million, of which $175.0 million was retained by the Company, while the remaining $150.0 million was paid to BHOO. Our Sponsors own approximately 53% of BJS LLC and BHOO owns the remaining interest. The Contribution Agreement closed and became effective on December 30, 2016.
In connection with the Contribution Agreement, the Company’s Amended and Restated LLC Agreement dated as of December 30, 2016 defines the Company’s principal business as land based hydraulic fracturing services (“Hydraulic Fracturing”) and land based well cementing and acidizing services (“Cementing”). The Company’s members are prohibited from competing in the Company’s principal business until a deemed liquidation event.
In connection with the formation of BJ Services, LLC, certain assets and liabilities of Allied were not contributed to the Company. Below is a summary of the assets and liabilities not contributed to BJ Services, LLC from these entities (in thousands):
| Accounts receivable |
$ | 10,043 | ||
| Prepaid expenses |
626 | |||
| Property and equipment |
7,172 | |||
| Accounts payable(a) |
(16,442 | ) | ||
| Accrued expenses |
(4,034 | ) | ||
|
|
|
|||
| Non-cash distribution |
(2,635 | ) | ||
| Cash |
778 | |||
|
|
|
|||
| Total distribution |
$ | (1,857 | ) | |
|
|
|
| (a) | Accounts payable contributed included approximately $4,571,000 related to property and equipment maintained by the Company. |
F-22
Table of Contents
Index to Financial Statements
BJ SERVICES, LLC
NOTES TO CONSOLIDATED FINANCIAL STATEMENTS
DECEMBER 31, 2016 AND 2015
Allied was determined to be the predecessor to the Company, and its historical operations have been presented from January 27, 2015 (Date of Inception) to December 31, 2016. These financial statements include the combined results of entities under common control for that period, including ALTCem, LLC (“ALTCem”), Allied OFS, LLC (“Allied OFS”), and Allied Energy Services (“Allied Energy”).
| 2. | Summary of Significant Accounting Policies |
Basis of Presentation
The accompanying consolidated financial statements present the operations of BJ Services, LLC from January 27, 2015 (Date of Inception) to December 31, 2015 and for the year ended December 31, 2016 and include the accounts of BJ Services, LLC and its subsidiaries (BJ Services Luxembourg S.A.R.L, a Luxembourg company, and BJ Services Holdings Canada, ULC, a Canadian company) as well as entities under common control during periods of common ownership prior to the formation of the Company. All significant intercompany accounts and transactions have been eliminated in consolidation. These financial statements are prepared in accordance with accounting principles generally accepted in the United States of America (GAAP) which, requires management to make estimates and assumptions that affect the reported amounts of assets and liabilities and disclosure of contingent assets and liabilities at the date of the financial statements and the reported amounts of revenues and expenses during the reporting period.
Use of Estimates
The preparation of financial statements in conformity with GAAP requires management to make estimates and judgments that affect the reported amounts of assets and liabilities, disclosure of any contingent assets or liabilities at the date of the financial statements and the reported amounts of revenue and expenses during the reporting period. Estimates and judgments are based on historical experience and on various other assumptions and information that are believed to be reasonable under the circumstances. Estimates and assumptions about future events and their effects cannot be perceived with certainty, and accordingly, these estimates may change as new events occur, as more experience is acquired, as additional information is obtained and as the operating environment changes. While the Company believes that the estimates and assumptions used in the preparation of the consolidated financial statements are appropriate, actual results could differ from those estimates. Estimates are used for, but are not limited to, determining the following: allowance for doubtful accounts and inventory valuation reserves; recoverability of long-lived assets; useful lives used in depreciation and amortization; accruals for contingencies; equity-based compensation expense and the fair value of assets acquired and liabilities assumed in acquisitions.
Revenue Recognition
The Company’s services are sold based upon contracts or other agreements with the client that include fixed or determinable prices. Revenue for hydraulic fracturing and cementing services is recognized as the services are rendered and when collectability is reasonably assured. Rates for services are typically determined per the contract or agreement with clients. Pressure pumping services consist of downhole pumping services, including hydraulic fracturing and cementing. The Company recognizes revenue when services are performed, collection of receivables is probable, and a price is fixed or determinable. The Company prices services for its pressure pumping by the job, project or day, depending on the type of service performed and request from the client.
F-23
Table of Contents
Index to Financial Statements
BJ SERVICES, LLC
NOTES TO CONSOLIDATED FINANCIAL STATEMENTS
DECEMBER 31, 2016 AND 2015
Income Taxes
The Company’s members have elected to have the Company taxed as a partnership under the provisions of the Internal Revenue Code of 1986, as amended (IRC) and applicable state laws. Thus, the Company is not directly subject to income taxes in the United States under provisions of the IRC or applicable state laws and taxable income or loss is reported to the members for inclusion in their respective tax returns. Therefore, no provision for federal or state income taxes is included in these financial statements. The Company is subject to income tax in the state of Texas (less than 1% of modified pretax earnings) and Canada which were not material for either period presented.
Foreign Currency
Results of operations for the Company’s Canadian subsidiary with functional currency as the Canadian dollar are translated using average exchange rates during the period. Assets and liabilities of these foreign subsidiaries are translated using the exchange rates in effect at the balance sheet dates, and the resulting translation adjustments are included in Accumulated Other Comprehensive Income or Loss, a component of Members’ equity. As the Company’s Canadian subsidiary was formed on December 30, 2016 there was no comprehensive income or loss for the year ended December 31, 2016.
Equity-based Compensation
The Company accounts for equity-based compensation using the modified prospective method, which requires measurement of compensation cost for all share-based awards at fair value on date of grant. The incentive units historically granted by the Company have had a service component tied to employment at the Company. The Company recognizes share based compensation over the service periods matching the terms of the specific option vesting. The compensation charge is determined with reference to the fair value of rights to receive shares of stock which in turn is determined based on the number of shares granted and the fair value of equity at the date of the grant. The fair value of equity units is determined using the Black-Scholes Model. The following sections address the assumptions used related to the Black-Scholes option pricing model:
Expected Term—The expected term of restricted units represents the period the restricted units are expected to remain outstanding. Since the Company does not have sufficient historical experience for determining the expected term of the restricted units awards granted, management based the expected term for awards issued to employees on the “simplified” method under the provisions of Accounting Standard Codification (ASC) Topic 718-10, Compensation-Stock Compensation. The expected term is based on the midpoint between the vesting date and contractual term of an option. The expected term represents the period that the equity-based awards are expected to be outstanding.
Expected volatility—Expected volatility measures the amount that a unit price has fluctuated or is expected to fluctuate during a period. Since the Company’s units are not publicly traded, the Company developed its expected volatility by using the historical volatilities of the Company’s peer group of public companies for a period equal to the expected life of the units.
Risk-free interest rate—The risk-free interest rates for units granted are based on the ten year constant maturity Treasury bond rates whose term is consistent with the expected life of a unit from the date of grant.
F-24
Table of Contents
Index to Financial Statements
BJ SERVICES, LLC
NOTES TO CONSOLIDATED FINANCIAL STATEMENTS
DECEMBER 31, 2016 AND 2015
Earnings Per Unit
Basic earnings per unit is computed based on the weighted average number of common units outstanding during the period.
Comprehensive Loss
Components of comprehensive loss include all changes in equity during a period except those resulting from changes in the Company’s capital related accounts. The Company records other comprehensive income or loss for foreign currency translation adjustments related to its foreign operations and for other revenues, expenses, gains and losses that are included in comprehensive income but excluded from net income. Comprehensive loss was equal to net loss for period from January 27, 2015 (Date of Inception) to December 31, 2015 and the year ended December 31, 2016.
Business Combinations
The Company accounts for business combinations under the acquisition method of accounting. The purchase price of each business acquired is allocated to the tangible and intangible assets acquired and the liabilities assumed based on information regarding their respective fair values on the date of acquisition. Any excess of the purchase price over the fair value of the separately identifiable assets acquired and the liabilities assumed is allocated to goodwill.
Management determines the fair values used in purchase price allocations for intangible assets based on historical data, estimated discounted future cash flows, as well as certain other information. The valuation of assets acquired and liabilities assumed requires management judgments and is subject to revision as additional information about the fair value of assets and liabilities becomes available. Additional information, which existed as of the acquisition date but unknown to the Company at that time, may become known during the remainder of the measurement period, a period not to exceed twelve months from the acquisition date. Acquisition costs are expensed as incurred. The results of operations of businesses acquired are included in the consolidated financial statements from their dates of acquisition.
Management utilizes various valuation methods, including an income approach, a market approach and a cost approach, to determine the fair value of intangible assets acquired based on the appropriateness of each method in relation to the type of asset being valued. The Company believes that these valuation methods represent the methods that would be used by other market participants in determining fair value.
Fair Value of Financial Instruments
The Company’s financial instruments primarily consist of cash and cash equivalents, accounts receivable, accounts payable, certain accrued expenses, and debt. The carrying amounts of these items approximate fair value due to their short maturities.
Concentration of Credit Risk
The Company grants credit to its clients who primarily operate in the oil and natural gas industry. The Company performs periodic credit evaluations of its clients’ financial condition, including
F-25
Table of Contents
Index to Financial Statements
BJ SERVICES, LLC
NOTES TO CONSOLIDATED FINANCIAL STATEMENTS
DECEMBER 31, 2016 AND 2015
monitoring of clients’ payment history and current credit worthiness to manage this risk. The Company does not generally require collateral in support of its trade receivables, but the Company may require payment in advance or security in the form of a letter of credit or bank guarantee. For the year ended December 31, 2016, two Cementing Segment clients (Antero Resources and EQT Production) accounted for approximately 14% and 12%, of the Company’s revenue, respectively, totaling $9,835,000.
For the period from January 27, 2015 (Date of Inception) to December 31, 2015 three Cementing Segment clients (Whiting Oil and Gas, GRMR Oil and Gas, and Wexpro) accounted for approximately 31%, 30%, and 22% of the Company’s revenue, respectively, totaling $998,000. At December 31, 2015, approximately 85% of accounts receivable outstanding was made up of amounts due from these clients.
Cash and cash equivalents
Cash equivalents includes only those investments with an original maturity of three months or less. The Company maintains cash deposits with major financial institutions. At times, such amounts may exceed federally insured limits. The Company monitors the credit ratings and its concentration of risk with these financial institutions on a continuing basis to safeguard its cash deposits.
Accounts Receivable and Allowance for Doubtful Accounts
Trade accounts receivables are carried at their estimated collectible amounts. Trade credit is generally extended on a short-term basis; thus receivables do not bear interest, although a finance charge may be applied to amounts past due. The Company maintains an allowance for doubtful accounts for estimated losses that may result from the inability of its clients to make required payments. Earnings are charged with a provision for doubtful accounts based on a current review of the collectability of client accounts by management. Such allowances are based upon several factors including, but not limited, to credit approval practices, industry and client historical experience as well as the current and projected financial condition of the specific client. Accounts deemed uncollectible are applied against the allowance for doubtful accounts.
Inventories
Inventories consist of supplies necessary for the Company to perform its primary services to its clients, as well as spare parts to service its fleets. Supplies may also be sold to clients. Cost is determined using the average cost method and includes the cost of materials, labor and overhead. The Company regularly reviews inventory quantities on a hand and compares them to estimates of future product demand, market conditions, technology developments and other factors to determine any necessary provision for excess, slow moving and obsolete inventory.
Property and Equipment
Property and equipment are stated at cost less accumulated depreciation and amortization. Depreciation and amortization is charged to expense on the straight-line basis over the estimated
F-26
Table of Contents
Index to Financial Statements
BJ SERVICES, LLC
NOTES TO CONSOLIDATED FINANCIAL STATEMENTS
DECEMBER 31, 2016 AND 2015
useful life of each asset. Leasehold improvements are amortized over the shorter of the lease term or their respective estimated useful lives.
Intangible Assets
Intangible assets with finite useful lives are amortized on a basis that reflects the pattern in which the economic benefits of the intangible assets are realized, which is generally on a straight-line basis over the asset’s estimated useful life.
Impairment of Property and Equipment, Intangible Assets and Other Long-lived Assets
The Company reviews property and equipment, intangible assets and certain other long-lived assets for impairment whenever events or changes in circumstances indicate that the carrying amount may not be recoverable and at least annually for certain intangible assets. The determination of recoverability is made based upon the estimated undiscounted future net cash flows. The amount of impairment loss, if any, is determined by comparing the fair value, as determined by a discounted cash flow analysis, with the carrying value of the related assets. No impairment losses have been incurred.
| 3. | Acquisitions |
BJ Services
On December 30, 2016, through the closing of the Contribution Agreement, the Company acquired the Baker Hughes North American Pressure Pumping business. The purchase price for the acquisition was determined to be $566.0 million as summarized below (in thousands):
| Cash |
$ | 150,000 | ||
| Equity (Class B-1 units) |
416,000 | |||
|
|
|
|||
| Total purchase price |
$ | 566,000 | ||
|
|
|
The assets and liabilities acquired are recorded at their respective fair values as of the acquisition date in the Company’s consolidated balance sheet. The following table summarizes the preliminary purchase price allocation of the fair values of the assets and liabilities acquired at December 30, 2016 (in thousands):
| Property and equipment |
$ | 480,500 | ||
| Inventory |
55,500 | |||
| Intangible assets |
30,000 | |||
|
|
|
|||
| $ | 566,000 | |||
|
|
|
The fair value of the Class B-1 units issued in connection with the acquisition of the Baker Hughes North American Pressure Pumping business, totaled $416.0 million, which was the fair value of 46.7% of the equity of BJ Services, LLC. The Company utilized a discounted cash flow model to estimate the fair value of BJ Services, LLC on formation date at December 30, 2016 in addition to considering the fair value of consideration given including cash of $325.0 million and the Allied assets contributed by CSL to obtain 53.3% of the new company. The Discounted cash flow model incorporated various observable and unobservable inputs and assumptions including an implied rate of return / discount factor of 19.55%. The terminal growth rate utilized was 3.00%.
F-27
Table of Contents
Index to Financial Statements
BJ SERVICES, LLC
NOTES TO CONSOLIDATED FINANCIAL STATEMENTS
DECEMBER 31, 2016 AND 2015
The acquisition included transactions costs of approximately $6,564,000. Such costs were expensed and included in Selling, General and Administrative Expenses in the Consolidated Statements of Operations.
As part of the Contribution Agreement, the Company was granted a perpetual, irrevocable, royalty-free license to use Baker Hughes’ onshore pressure pumping technologies in the United States and Canada. Technology intangible assets primarily relate to the following three categories:
| • | Hydraulic Fracturing A—Includes the following Baker Hughes patented technologies: Lightning, Lightning Plus, PrimeStar, ShaleXcel, SpectraFrac G, Medallion, and Medallion HT. |
| • | Hydraulic Fracturing B—Includes the following Baker Hughes patented technologies: MaxPerm, BrineCare, Smartflo, Dry FR, and Floback. |
| • | Cementing—Includes the following Baker Hughes patented technologies: ColdSet, DeepLite, DeepSet, DuraSet, EnviroSet, FireSet, LiteSet, PermaSet, SaltSet, XtremeSet, Magne-Block, Magne-Link, Magne-plus, SureFill, SurePlug, Thixofil, Thixolite, and Ultrafine. |
Allied Oil and Gas
On April 29, 2016 the Company acquired the assets of Allied Oil and Gas Services, LLC (Allied OFS), a provider of cementing services to oil and natural gas operators in the mid-continent, northeast, Rocky Mountains and southwest regions of the United States for approximately $21.5 million.
The preliminary fair value of the identifiable net assets acquired of approximately $55.7 million exceeded the purchase price. When the fair value of the net assets acquired exceeds the purchase price, resulting in a bargain purchase of a business, the acquirer must reassess the reasonableness of the values assigned to all of the net assets acquired, liabilities assumed and consideration transferred. The bargain purchase gain is summarized as follows (in thousands):
| Assets and liabilities acquired, net of cash |
$ | 55,103 | ||
| Cash acquired |
552 | |||
|
|
|
|||
| Total net assets acquired |
55,655 | |||
| Purchase price |
21,475 | |||
|
|
|
|||
| Bargain purchase gain |
$ | 34,180 | ||
|
|
|
The Allied Oil and Gas acquisition was a strategic acquisition for the Company and was acquired through direct negotiation with the Allied Oil and Gas lender, as the entity was in default of certain debt covenants and was in financial distress. After initially calculating a bargain purchase gain, the Company reassessed the assumptions and measurement of the fair value of the identifiable net assets acquired and liabilities assumed, and consideration transferred. The Company used discounted cash flows to estimate the fair value of assets acquired and liabilities assumed before finalizing the purchase price allocation. The Company’s estimate of the net fair value of assets and liabilities acquired exceeded the fair value of consideration transferred by $34,180,000. The gain is included within “bargain purchase gain” in the Consolidated Statements of Operations for the year ended December 31, 2016.
The assets and liabilities acquired at the date of acquisition are recorded at their respective fair values as of the acquisition date in the Company’s consolidated balance sheet. The Company recognized no goodwill in connection with this transaction.
F-28
Table of Contents
Index to Financial Statements
BJ SERVICES, LLC
NOTES TO CONSOLIDATED FINANCIAL STATEMENTS
DECEMBER 31, 2016 AND 2015
The following table summarizes the final purchase price allocation of the fair values of the assets and liabilities acquired at December 30, 2016 (in thousands):
| Accounts receivable |
$ | 2,853 | ||
| Inventory |
876 | |||
| Other assets |
252 | |||
| Property and equipment |
55,049 | |||
| Intangible assets |
550 | |||
| Accounts payable |
(1,990 | ) | ||
| Accrued liabilities |
(1,294 | ) | ||
| Capital lease obligation |
(1,193 | ) | ||
|
|
|
|||
| $ | 55,103 | |||
|
|
|
The acquisition included transactions costs of approximately $555,000. Such costs were expensed as incurred and included in Selling, General and Administrative Expenses in the Consolidated Statements of Operations.
Revenues and net loss from Allied OFS included in the 2016 Consolidated Statement of Operations were $27.2 million and ($9.2) million (excluding the bargain purchase gain of $34.2 million), respectively.
Pro forma
The unaudited supplemental pro forma results of operations have been provided for illustrative purposes only and do not purport to be indicative of the actual results that would have been achieved by the combined companies for the periods presented or that may be achieved by the combined companies in the future. Future results may vary significantly from the results reflected in the following pro forma financial information because of future events not known at this time (in thousands):
| Year ended December 31, 2016 |
Period from January 27, 2015 to December 31, 2015 |
|||||||
| Revenue |
$ | 277,204 | $ | 1,325,872 | ||||
| Net loss |
(290,911 | ) | (515,589 | ) | ||||
The pro forma combined results of operations for the year ended December 31, 2016 and the period from January 27, 2015 (Date of Inception) to December 31, 2015 have been prepared by adjusting the historical results of the Company to include the historical results of the 2016 acquisitions as if they occurred on January 27, 2015 (Date of Inception). The pro forma results of operations do not include any adjustments to eliminate the impact of acquisition related costs or any cost savings or other synergies that may result from the 2016 acquisitions.
| 4. | Segment and Geographic Information |
The Company presents its operations under two reportable segments: (1) Hydraulic Fracturing and (2) Cementing. The results for these operating segments are evaluated regularly by the chief operating decision maker in deciding how to allocate resources and assessing performance.
The Company evaluates the performance of its segments based on operating income. Intersegment sales and transfers are not material.
F-29
Table of Contents
Index to Financial Statements
BJ SERVICES, LLC
NOTES TO CONSOLIDATED FINANCIAL STATEMENTS
DECEMBER 31, 2016 AND 2015
Summarized financial information for the Company’s reportable segments is presented in the following table (in thousands):
Business Segments
| Year ended December 31, 2016 |
Period from January 27, 2015 to December 31, 2015 |
|||||||
| Revenue: |
||||||||
| Hydraulic fracturing |
$ | 2,577 | $ | — | ||||
| Cementing |
34,408 | 1,212 | ||||||
|
|
|
|
|
|||||
| Consolidated |
$ | 36,985 | $ | 1,212 | ||||
|
|
|
|
|
|||||
| Operating income (loss): |
||||||||
| Hydraulic fracturing |
$ | (12,320 | ) | $ | — | |||
| Cementing |
(14,602 | ) | (3,696 | ) | ||||
| Corporate and non-allocated costs |
24,923 | (158 | ) | |||||
|
|
|
|
|
|||||
| Consolidated |
$ | (1,999 | ) | $ | (3,854 | ) | ||
|
|
|
|
|
|||||
| Total assets: |
||||||||
| Hydraulic fracturing |
$ | 497,085 | $ | — | ||||
| Cementing |
369,704 | 12,141 | ||||||
| Corporate and other(1) |
26,420 | — | ||||||
|
|
|
|
|
|||||
| Consolidated |
$ | 893,209 | $ | 12,141 | ||||
|
|
|
|
|
|||||
| Capital expenditures: |
||||||||
| Hydraulic fracturing(2) |
$ | 74,974 | $ | — | ||||
| Cementing |
15,510 | 10,355 | ||||||
|
|
|
|
|
|||||
| Consolidated |
$ | 90,484 | $ | 10,355 | ||||
|
|
|
|
|
|||||
| Depreciation and amortization: |
||||||||
| Hydraulic fracturing |
$ | 3,861 | $ | — | ||||
| Cementing |
5,537 | 417 | ||||||
|
|
|
|
|
|||||
| Consolidated |
$ | 9,398 | $ | 417 | ||||
|
|
|
|
|
|||||
| (1) | Corporate assets include tradenames and corporate headquarters facility. |
| (2) | Hydraulic fracturing capital expenditures include non-cash capital expenditures of $20.3 million and accrued capital expenditures of $4.6 million during 2016. |
F-30
Table of Contents
Index to Financial Statements
BJ SERVICES, LLC
NOTES TO CONSOLIDATED FINANCIAL STATEMENTS
DECEMBER 31, 2016 AND 2015
Geographic Information
| Year ended December 31, 2016 |
Period from January 27, 2015 to December 31, 2015 |
|||||||
| Revenue: |
||||||||
| United States |
$ | 36,985 | $ | 1,212 | ||||
| Canada |
— | — | ||||||
|
|
|
|
|
|||||
| Consolidated |
$ | 36,985 | $ | 1,212 | ||||
|
|
|
|
|
|||||
| Long-lived assets: |
||||||||
| United States |
$ | 599,291 | $ | 9,966 | ||||
| Canada |
49,400 | — | ||||||
|
|
|
|
|
|||||
| Consolidated |
$ | 648,691 | $ | 9,966 | ||||
|
|
|
|
|
|||||
| 5. | Per Unit Information: |
As of December 31, 2016, 891,000 Class B-1 units were authorized, issued and outstanding. Basic earnings (loss) per unit is computed using the weighted average number of units outstanding during the period, and diluted earnings (loss) per share is computed using the weighted average number of units outstanding during the period adjusted for all potentially dilutive common unit equivalents, except in cases where the effect of the common unit equivalents would be antidilutive. Equity issued to Baker Hughes has been treated prospectively while all other equity issuances in connection with acquisitions have been retroactively adjusted as if they occurred on January 27, 2015. Basic and diluted earnings (loss) per unit were equal for both periods presented because of the net loss. The amounts used to compute the earnings (loss) per unit for the year ended December 31, 2016 and the period from January 27, 2015 (Date of Inception) to December 31, 2015 are illustrated below (in thousands except for per unit information):
| Year Ended December 31, 2016 |
Period from January 27, 2015 to December 31, 2015 |
|||||||
| Earnings (Loss) per Unit |
||||||||
| Net loss |
$ | (2,279 | ) | $ | (3,872 | ) | ||
| Weighted average common units |
435,630 | 411,964 | ||||||
|
|
|
|
|
|||||
| Basic Loss per unit |
$ | (5.23 | ) | $ | (9.40 | ) | ||
|
|
|
|
|
|||||
| 6. | Inventories |
Inventories consisted of the following at December 31, 2016 and 2015 (in thousands):
| 2016 | 2015 | |||||||
| Finished products and parts |
$ | 36,525 | $ | — | ||||
| Raw materials and supplies |
21,457 | 251 | ||||||
|
|
|
|
|
|||||
| $ | 57,982 | $ | 251 | |||||
|
|
|
|
|
|||||
There were no inventory reserves as of December 31, 2016 and 2015.
F-31
Table of Contents
Index to Financial Statements
BJ SERVICES, LLC
NOTES TO CONSOLIDATED FINANCIAL STATEMENTS
DECEMBER 31, 2016 AND 2015
| 7. | Property and Equipment |
Property and equipment consisted of the following as of December 31, 2016 and 2015 (in thousands):
| Useful Lives |
2016 | 2015 | ||||||||||
| Land |
— | $ | 33,619 | $ | — | |||||||
| Buildings and improvements |
5-25 | 94,535 | 1,432 | |||||||||
| Machinery, equipment and other |
5-10 | 499,802 | 8,951 | |||||||||
|
|
|
|
|
|||||||||
| 627,956 | 10,383 | |||||||||||
| Less: Accumulated depreciation and amortization |
(9,693 | ) | (417 | ) | ||||||||
|
|
|
|
|
|||||||||
| $ | 618,263 | $ | 9,966 | |||||||||
|
|
|
|
|
|||||||||
On July 29, 2016 the Company purchased property and equipment from Bayou Well Services, LLC for total consideration of $51,800,000. In connection with the purchase the Company paid cash of $31,500,000 and issued equity to Bayou Well Services, LLC of $20,300,000. The fair value of the assets acquired was determined based on comparable transactions for the specific types of assets acquired including consideration of the age and condition of the asset. The Company determined the cost approach was appropriate based on recent acquisitions and from experience with similar projects that contain the same types of assets. This is considered to be Level 2 measurement with the fair value hierarchy. The fair value of the equity issued was determined based on the fair value of the overall transaction considering the fair value of the assets acquired.
| 8. | Intangible Assets |
The following summarizes the carrying amounts of intangible assets and related amortization, at December 31, 2016 (in thousands):
| 2016 | ||||||||||||||||
| Useful Lives | Gross Carrying Amounts |
Accumulated Amortization |
Net | |||||||||||||
| Amortizable assets |
||||||||||||||||
| Technology |
10 years | $ | 25,000 | $ | — | $ | 25,000 | |||||||||
| Trade names |
3—15 years | 5,550 | (122 | ) | 5,428 | |||||||||||
|
|
|
|
|
|
|
|||||||||||
| $ | 30,550 | $ | (122 | ) | $ | 30,428 | ||||||||||
|
|
|
|
|
|
|
|||||||||||
Technology relates to the perpetual, irrevocable, royalty-free license to use Baker Hughes’ onshore pressure pumping technologies in the United States and Canada per the terms of the Contribution Agreement.
F-32
Table of Contents
Index to Financial Statements
BJ SERVICES, LLC
NOTES TO CONSOLIDATED FINANCIAL STATEMENTS
DECEMBER 31, 2016 AND 2015
Future amortization expense is as follows (in thousands):
| Total | ||||
| 2017 |
$ | 3,017 | ||
| 2018 |
3,017 | |||
| 2019 |
2,894 | |||
| 2020 |
2,833 | |||
| 2021 |
2,833 | |||
| Thereafter |
15,834 | |||
|
|
|
|||
| $ | 30,428 | |||
|
|
|
|||
| 9. | Debt |
The Company has financed the payment of its insurance premiums. The financed premiums totaled $11,464,000 at December 31, 2016, and are generally payable in monthly installments, including interest, at 3.50% through December 2017. The notes are secured by the unearned premium under the financed policies, which is included in “prepaid expenses and other.”
The Company had equipment notes outstanding at December 31, 2016 and 2015 totaling approximately $509,000 and $580,000, respectively. Equipment notes were secured by heavy and light duty vehicles. These notes were paid in full in March 2017.
| 10. | Commitments and Contingencies |
Litigation
In the ordinary course of business, the Company is involved in various pending or threatened legal actions, some of which may or may not be covered by insurance. Management has reviewed such pending judicial and legal proceedings, the reasonably anticipated costs and expenses in connection with such proceedings, and the availability and limits of insurance coverage. There were no litigation reserves accrued as of December 31, 2016 and 2015. In the opinion of management, the Company’s ultimate liability, if any, with respect to these actions is not expected to have a material adverse effect on the Company’s financial position, results of operations or cash flows.
Operating Leases
Noncancelable operating leases for the Company’s operating locations expire in various years through 2020. The Company also leases certain equipment under short-term rental agreements. These leases generally contain renewal options for periods ranging from zero to 5 years and require the Company to pay all executory costs (property taxes, maintenance and insurance). Rent expense for all operating leases totaled approximately $1,129,000 and $178,000 for the year ended December 31, 2016 and the period from January 27, 2015 (Date of Inception) through December 31, 2015, respectively.
F-33
Table of Contents
Index to Financial Statements
BJ SERVICES, LLC
NOTES TO CONSOLIDATED FINANCIAL STATEMENTS
DECEMBER 31, 2016 AND 2015
Future minimum lease payments at December 31, 2016, were (in thousands):
| 2017 |
$ | 1,640 | ||
| 2018 |
1,232 | |||
| 2019 |
1,153 | |||
| 2020 |
953 | |||
| 2021 |
767 | |||
| Thereafter |
1,682 | |||
|
|
|
|||
| $ | 7,427 | |||
|
|
|
| 11. | Members’ Equity |
Membership Interests
The Company’s LLC Agreement allocates membership interests into Class A, Class B-1, and Class B-2 units. As of December 31, 2016, 891,000 Class B-1 units were authorized, issued, and outstanding. There were no Class A or Class B-2 units issued or outstanding as of December 31, 2016. Class B-1 units have voting rights while Class A and Class B-2 units do not have any voting rights.
Distributions will be made first to the Class B units based on an 8% preference, then to Class B units based upon the proportion of each Class B unitholder’s unreturned capital, and then to the holders of the vested Class A units pro rata in proportion to their ownership of the issued and authorized vested Class A units an amount equal to 10% of the portion of any distribution.
Equity-based Compensation
ALTCem and Allied OFS
The Limited Liability Company Agreements (LLC Agreements) of ALTCem and Allied OFS, respectively, provided for the issuance of up to 1,000,000, and 150,000 Equity Units to persons who provide services to the Company, such as members of management, other key personnel, consultants or independent contractors, or as otherwise provided in the LLC Agreements. Equity Units are nonvoting, are intended to be “profits interests,” and are assigned a hurdle amount, as defined, upon issuance. Generally, 75% of each Equity Unit award is subject to a three-year forfeiture schedule (time vesting units), and 25% of each Equity Unit award is forfeitable until a change of control, as defined, transaction (change of control units). In the event of an initial public offering, as defined, then with respect to the time vesting units, any nonforfeited units at that date are no longer forfeitable.
The fair value of each Equity Unit award is estimated on the date of grant using a valuation model that uses the assumptions noted in the following table. Expected volatility is based on historical volatility of comparative public companies in the same industry, as the Company is private and has no trading volume. The expected term of awards granted represents the period that awards are expected to be outstanding.
| ALTCem | Allied OFS | |||||||
| Expected volatility |
32 | % | 72 | % | ||||
| Discount for lack of marketability |
45 | % | 47 | % | ||||
| Risk free interest rate |
1.51 | % | 1.07 | % | ||||
| Expected dividend yield |
0 | % | 0 | % | ||||
| Expected life in years |
5 years | 4 years | ||||||
F-34
Table of Contents
Index to Financial Statements
BJ SERVICES, LLC
NOTES TO CONSOLIDATED FINANCIAL STATEMENTS
DECEMBER 31, 2016 AND 2015
A summary of the status of the Equity Units at December 31, 2016, and changes during the period from January 27, 2015 (Date of Inception) through December 31, 2015, is presented below:
| 2016 | ||||||||||||||||
| ALTCem | Allied OFS | |||||||||||||||
| Class B Units |
Grant-date Fair Value |
Class B Units |
Grant-date Fair Value |
|||||||||||||
| Forfeitable, beginning of period |
815,000 | $ | 0.92 | 128,000 | $ | 17.61 | ||||||||||
| Awarded |
— | — | — | — | ||||||||||||
| Nonforfeitable |
(203,750 | ) | 0.92 | — | — | |||||||||||
| Forfeited |
— | — | — | — | ||||||||||||
|
|
|
|
|
|
|
|
|
|||||||||
| Forfeitable, end of period |
611,250 | $ | 0.92 | 128,000 | $ | 17.61 | ||||||||||
|
|
|
|
|
|
|
|
|
|||||||||
| Nonforfeitable, end of period |
203,750 | — | ||||||||||||||
|
|
|
|
|
|||||||||||||
| 2015 | ||||||||
| ALTCem | ||||||||
| Class B Units |
Grant-date Fair Value |
|||||||
| Forfeitable, beginning of period |
— | $ | — | |||||
| Awarded |
815,000 | 0.92 | ||||||
| Nonforfeitable |
— | — | ||||||
| Forfeited |
— | — | ||||||
|
|
|
|
|
|||||
| Forfeitable, end of period |
815,000 | $ | 0.92 | |||||
|
|
|
|
|
|||||
| Nonforfeitable, end of period |
— | |||||||
|
|
|
|||||||
For the year ended December 31, 2016 and for the period from January 27, 2015 (Date of Inception) to December 31, 2015, stock-based compensation expense of approximately $186,000 and $141,000, respectively, was recognized in the accompanying consolidated financial statements related to ALTCem units.
For the year ended December 31, 2016, stock-based compensation expense of approximately $282,000 was recognized for the Allied OFS units during the year. However, at December 31, 2016 and because of the formation of BJ Services, LLC, it was determined that it was not probable that the Allied OFS employees would vest and therefore all stock compensation expense was reversed. Refer to the subsequent events footnote for further information on the settlement of these awards.
BJ Services, LLC
The Limited Liability Company Agreement (LLC Agreement) of BJ Services provides for the issuance of up to 5,000,000 Class A Units to persons who provide services to the Company, such as members of management, other key personnel, consultants or independent contractors, or as otherwise provided in the LLC Agreement. Class A Units are nonvoting, are intended to be “profits interests,” and are assigned a hurdle amount, as defined, upon issuance. Generally, 75% of each Class A Unit award is subject to a three-year forfeiture schedule (time vesting units), and 25% of each Class A Unit award is forfeitable until a change of control, as defined, transaction (change of control units). In the event of an initial public offering, as defined, then with respect to
F-35
Table of Contents
Index to Financial Statements
BJ SERVICES, LLC
NOTES TO CONSOLIDATED FINANCIAL STATEMENTS
DECEMBER 31, 2016 AND 2015
the time vesting units, any nonforfeited units at that date are no longer forfeitable. There were no Class A Units issued or outstanding as of December 31, 2016.
| 12. | Related-Party Transactions |
In connection with the Contribution Agreement, the Company entered into a Transition Services Agreement (“TSA”) with BHI dated December 30, 2016, which has a term of one year. The TSA provides for the following services: Information Technology, Finance and Accounting, International Trade Compliance, Insurance and Risk Management, Health, Safety, and Environment, Commercial and Contract Support, Real Estate, Supply Chain, Field Operations, and Technology. The Company will be billed on a monthly basis for the services provided during that month per the terms of the TSA. No amounts were expensed related to the TSA during the year ended December 31, 2016.
During the year ended December 31, 2016 and the period from January 27, 2015 (Date of Inception) through December 31, 2015, the Company reimbursed certain nonmanagement members of ALTCem, LLC approximately $58,000 and $63,000 for travel and related expenses, respectively. Additionally, the Company paid a certain nonmanagement member approximately $28,000 for board meeting fees.
| 13. | Subsequent Events |
Subsequent events have been evaluated through April 13, 2017 which is the date the financial statements were available to be issued.
The Company issued 2,228,000 Class A restricted units to members of management during the first quarter of 2017. The units vest 75% based on time vesting and 25% upon a change of control. The restricted units will be accounted for as equity awards and the grant date fair value determined will be amortized over the vesting period beginning in the first quarter of 2017.
In the first quarter of 2017, the Company purchased inventory from Baker Hughes totaling $3,526,000, payable as follows: $600,000 in 2017 and $2,926,000 in 2018.
In the first quarter of 2017, CSL entered into agreements with former employees of Allied OFS on behalf of the Company to settle restricted unit awards previously issued in 2016. These settlement agreements, valued at approximately $4,333,000, will be paid in 2017 by CSL and recorded as expense of the Company during the first quarter of 2017.
| 14. | Recent Accounting Pronouncements |
Accounting Standards Not Yet Adopted
In January 2017, the FASB issued Accounting Standards Update No. 2017-04, Intangibles-Goodwill and Other (Topic 350): Simplifying the Test for Goodwill Impairment. ASU 2017-04 intended to simplify the subsequent measurement of goodwill by eliminating the second step in the current two-step goodwill impairment test. The update will require an entity to perform its annual, or interim, goodwill impairment test by comparing the fair value of a reporting unit with its carrying amount. An entity will recognize an impairment charge for the amount by which the carrying amount exceeds the reporting unit’s fair value, if applicable. Additionally, the update will eliminate the requirement that a reporting unit with a zero or negative carrying amount perform a
F-36
Table of Contents
Index to Financial Statements
BJ SERVICES, LLC
NOTES TO CONSOLIDATED FINANCIAL STATEMENTS
DECEMBER 31, 2016 AND 2015
qualitative assessment and the second step of the two-step goodwill impairment test and will instead require disclosure of the amount of goodwill allocated to each reporting unit with a zero or negative carrying amount of net assets. This update is effective for public entities for interim and annual reporting periods beginning after December 15, 2021, although early adoption is permitted for interim and annual goodwill impairment tests performed on testing dates after January 1, 2017. The prospective transition method will be required for this new guidance. The Company is currently evaluating the potential impact of this authoritative guidance on its consolidated financial statements and will adopt this guidance by January 1, 2022.
In January 2017, the FASB issued Accounting Standards Update No. 2017-01, Business Combinations (Topic 805): Clarifying the Definition of a Business (“ASU 2017-01”). ASU 2017-01 intended to clarify the definition of a business to assist entities with evaluation of whether transactions should be accounted for as acquisitions or disposals of assets or businesses. The new definition requires that when substantially all of the fair value of the gross assets acquired or disposed of is concentrated in a single identifiable asset or group of similar identifiable assets, the asset or group is not a business. The update will require that to be considered a business, a set of assets and activities must include, at a minimum, an input and a substantive process that together significantly contribute to the ability to create output. Additionally, the update will remove the evaluation of whether a market participant could replace missing elements in order to consider the set of assets and activities a business, will provide more stringent criteria for sets without outputs and will narrow the definition of output. The new standard is effective for interim and annual reporting periods beginning after December 15, 2018 and interim periods within annual periods beginning after December 15, 2019, although early adoption is permitted for certain transactions. The prospective transition method will be required for this new guidance. The Company is currently evaluating the potential impact of this authoritative guidance on its consolidated financial statements and will adopt this guidance by January 1, 2019.
In March 2016, the FASB issued Accounting Standards Update No. 2016-09, Compensation—Stock Compensation (Topic 718) Improvements to Employee Share-Based Payment Accounting (“ASU 2016-09”). ASU 2016-09 includes provisions intended to simplify accounting for share-based payment transactions including the income tax consequences, classification of awards as either equity or liabilities, and classification on the statement of cash flows. Under ASU 2016-09, all excess tax benefits (or tax deficiencies) will be recognized as income tax benefit (or expense) in the statement of operations. Additionally, when applying the treasury stock method for computing diluted earnings per share under ASU 2016-09 the assumed proceeds will not include any windfall tax benefits, resulting in equity awards which may result in a greater number of dilutive shares outstanding. Further, excess tax benefits will be classified along with other income tax cash flows as an operating activity. ASU 2016-09 also permits withholding up to the maximum statutory tax rate in applicable jurisdictions as the threshold to qualify for equity classification. ASU 2016-09 will be effective for annual periods beginning after December 15, 2017 and interim periods within annual periods beginning after December 15, 2018. Early adoption is permitted as of the beginning of an interim or annual reporting period with all adjustments to be reflected as of the beginning of the fiscal year of adoption. The Company is currently evaluating the effect of the adoption of this guidance on the Company’s consolidated financial statements.
In February 2016, the FASB issued ASU No. 2016-02, Leases (“ASC 842”), which replaces the existing guidance in ASC 840, Leases. ASC 842 requires lessees to recognize most leases on their balance sheets as lease liabilities with corresponding right-of-use assets. The new lease standard does not substantially change lessor accounting. The new standard is effective for
F-37
Table of Contents
Index to Financial Statements
BJ SERVICES, LLC
NOTES TO CONSOLIDATED FINANCIAL STATEMENTS
DECEMBER 31, 2016 AND 2015
interim and annual reporting periods beginning after December 15, 2019 and interim periods within fiscal periods beginning after December 15, 2020, with early adoption permitted. The Company is currently evaluating the impact of the adoption of this guidance.
In November 2015, the FASB issued ASU No. 2015-17, Balance Sheet Classification of Deferred Taxes. This standard requires all deferred taxes, along with any related valuation allowance, to be presented as a noncurrent deferred asset or liability. The guidance is effective for fiscal years beginning after December 15, 2017 and interim periods within annual periods beginning after December 15, 2018. Early adoption is permitted and the guidance may be applied either prospectively, for all deferred tax assets and liabilities, or retrospectively by reclassifying the comparative balance sheet. The Company does not expect this ASU to have a material impact on our financial statements.
In September 2015, the FASB issued Accounting Standards Update No. 2015-16, Business Combinations (Topic 805): Simplifying the Accounting for Measurement-Period Adjustments (“ASU 2015-16”). ASU 2015-16 replaces the requirement for an acquirer in a business combination to retrospectively adjust provisional amounts recognized at the acquisition date with a corresponding adjustment to goodwill when measurement period adjustments are identified. The new guidance requires an acquirer to recognize adjustments in the reporting period in which the adjustment amounts are determined. The acquirer must record, in the same period’s financial statements, the effect on earnings of changes in depreciation, amortization, or other income effects, if any, as a result of the change to the provisional amounts, calculated as if the accounting had been completed at the acquisition date. Additionally, the acquirer must present separately on the face of the income statement, or disclose in the notes, the portion of the amount recorded in current period earnings by line item that would have been recorded in previous reporting periods if the adjustments had been recognized as of the acquisition date. ASU 2015-16 will be effective for fiscal years beginning after December 15, 2016, and interim periods within fiscal years beginning after December 15, 2017. The adoption of the guidance is not expected to have a material effect on the Company’s consolidated financial statements.
In July 2015, the FASB issued ASU No. 2015-11, Simplifying the Measurement of Inventory, which requires companies to measure inventory at the lower of cost or net realizable value rather than at the lower of cost or market. Net realizable value is the estimated selling price in the ordinary course of business, less reasonably predictable costs of completion, disposal and transportation. The new standard is effective for the Company for fiscal years beginning after December 15, 2016, and interim periods within fiscal years beginning after December 15, 2017. The Company is currently evaluating the impact of adopting this standard on our financial statements.
In May 2014, the FASB issued an update that supersedes most current revenue recognition guidance, as well as some cost recognition guidance. The update requires that the recognition of revenue related to the transfer of goods or services to customers reflects the consideration to which the entity expects to be entitled in exchange for those goods or services. This update also requires new qualitative and quantitative disclosures about the nature, amount, timing and uncertainty of revenues and cash flows arising from customer contracts, including significant judgments and changes in judgments, information about contract balances and performance obligations, and assets recognized from costs incurred to obtain or fulfill a contract. In July 2015, the FASB affirmed its proposal to defer the effective date until fiscal years beginning after December 15, 2018 and interim periods beginning after December 15, 2019. The guidance can be applied on a full retrospective or modified retrospective basis whereby the entity records a
F-38
Table of Contents
Index to Financial Statements
BJ SERVICES, LLC
NOTES TO CONSOLIDATED FINANCIAL STATEMENTS
DECEMBER 31, 2016 AND 2015
cumulative effect of initially applying this update at the date of initial application. We are currently evaluating this standard in order to select a transition method and the effective date. We have not determined the effect of this standard on our financial statements and related disclosures.
Accounting Standards Adopted
In August 2014, the FASB issued ASU No. 2014-15, Presentation of Financial Statements—Going Concern. The new standard requires management to evaluate whether there are conditions and events that raise substantial doubt about an entity’s ability to continue as a going concern for both annual and interim reporting. The guidance is effective for the Company for the annual period ended after December 15, 2016 and interim periods thereafter. Management performed an evaluation of the Company’s ability to fund operations and to continue as a going concern according to ASC Topic 205-40, Presentation of Financial Statements—Going Concern. The guidance did not have a material impact on the Company’s financial statements.
F-39
Table of Contents
Index to Financial Statements
Report of Independent Auditors
To the Board of Directors and Management of
Allied Oil & Gas Holdings, LLC and Subsidiaries
We have audited the accompanying consolidated financial statements of Allied Oil & Gas Holdings, LLC and its subsidiaries, which comprise the consolidated statements of earnings, members’ equity, and cash flows for the period from January 1, 2016 to April 28, 2016 and the years ended December 31, 2015 and 2014.
Management’s Responsibility for the Consolidated Financial Statements
Management is responsible for the preparation and fair presentation of the consolidated financial statements in accordance with accounting principles generally accepted in the United States of America; this includes the design, implementation, and maintenance of internal control relevant to the preparation and fair presentation of consolidated financial statements that are free from material misstatement, whether due to fraud or error.
Auditors’ Responsibility
Our responsibility is to express an opinion on the consolidated financial statements based on our audits. We conducted our audits in accordance with auditing standards generally accepted in the United States of America. Those standards require that we plan and perform the audit to obtain reasonable assurance about whether the consolidated financial statements are free from material misstatement.
An audit involves performing procedures to obtain audit evidence about the amounts and disclosures in the consolidated financial statements. The procedures selected depend on the auditor’s judgment, including the assessment of the risks of material misstatement of the consolidated financial statements, whether due to fraud or error. In making those risk assessments, the auditor considers internal control relevant to the entity’s preparation and fair presentation of the consolidated financial statements in order to design audit procedures that are appropriate in the circumstances, but not for the purpose of expressing an opinion on the effectiveness of the entity’s internal control. Accordingly, we express no such opinion. An audit also includes evaluating the appropriateness of accounting policies used and the reasonableness of significant accounting estimates made by management, as well as evaluating the overall presentation of the consolidated financial statements. We believe that the audit evidence we have obtained is sufficient and appropriate to provide a basis for our audit opinion.
Opinion
In our opinion, the consolidated financial statements referred to above present fairly, in all material respects, the results of operations and cash flows for Allied Oil & Gas Holdings, LLC and its subsidiaries for the period from January 1, 2016 to April 28, 2016 and the years ended December 31, 2015 and 2014 in accordance with accounting principles generally accepted in the United States of America.
Emphasis of a Matter
As discussed in Note 1, on April 28, 2016 the Company was sold to an unrelated third party. The consolidated financial statements do not include any adjustments related to the sale. Our opinion is not modified with respect to this matter.
/s/ PricewaterhouseCoopers LLP
Houston, TX
April 13, 2017
F-40
Table of Contents
Index to Financial Statements
ALLIED OIL & GAS HOLDINGS, LLC AND SUBSIDIARIES
CONSOLIDATED STATEMENTS OF OPERATIONS
PERIOD FROM JANUARY 1, 2016 TO APRIL 28, 2016 AND
YEARS ENDED DECEMBER 31, 2015 AND 2014
| January 1 to April 28, 2016 |
Year ended December 31, | |||||||||||
| 2015 | 2014 | |||||||||||
| (in thousands) | ||||||||||||
| Revenue |
$ | 9,182 | $ | 52,684 | $ | 132,550 | ||||||
| Operating costs and expenses |
||||||||||||
| Cost of revenue |
(15,011 | ) | (61,382 | ) | (108,380 | ) | ||||||
| Selling, general and administrative expenses |
(2,142 | ) | (4,793 | ) | (8,321 | ) | ||||||
| Depreciation and amortization expense |
(76 | ) | (1,890 | ) | (1,912 | ) | ||||||
| Property and equipment impairment |
(1,537 | ) | (36,749 | ) | — | |||||||
| Goodwill and intangible asset impairment |
— | (33,653 | ) | — | ||||||||
| Other income (expenses) |
26 | (899 | ) | (416 | ) | |||||||
|
|
|
|
|
|
|
|||||||
| Operating income (loss) |
(9,558 | ) | (86,682 | ) | 13,521 | |||||||
|
|
|
|
|
|
|
|||||||
| Interest expense, (net) |
(1,495 | ) | (4,613 | ) | (3,859 | ) | ||||||
|
|
|
|
|
|
|
|||||||
| Net income (loss) |
$ | (11,053 | ) | $ | (91,295 | ) | $ | 9,662 | ||||
|
|
|
|
|
|
|
|||||||
The accompanying notes are an integral part of these consolidated financial statements.
F-41
Table of Contents
Index to Financial Statements
ALLIED OIL & GAS HOLDINGS, LLC AND SUBSIDIARIES
CONSOLIDATED STATEMENTS OF MEMBERS’ EQUITY
PERIOD FROM JANUARY 1, 2016 TO APRIL 28, 2016 AND
YEARS ENDED DECEMBER 31, 2015 AND 2014
| Members’ Equity | Notes Receivable From Members |
Total Members’ Equity |
||||||||||
| (in thousands) | ||||||||||||
| Balances at December 31, 2013 |
$ | 61,805 | $ | (623 | ) | $ | 61,182 | |||||
| Units issued |
15,565 | — | 15,565 | |||||||||
| Equity-based compensation |
1,059 | — | 1,059 | |||||||||
| Units issued with notes receivable |
255 | (255 | ) | — | ||||||||
| Payments received on notes receivable |
— | 289 | 289 | |||||||||
| Units redeemed |
(16,712 | ) | — | (16,712 | ) | |||||||
| Distributions to members |
(4,952 | ) | — | (4,952 | ) | |||||||
| Net income |
9,662 | — | 9,662 | |||||||||
|
|
|
|
|
|
|
|||||||
| Balances at December 31, 2014 |
66,682 | (589 | ) | 66,093 | ||||||||
| Units issued |
10,826 | — | 10,826 | |||||||||
| Equity-based compensation |
891 | — | 891 | |||||||||
| Payments received on notes receivable |
— | 110 | 110 | |||||||||
| Cancellation of notes receivable |
(377 | ) | 377 | — | ||||||||
| Share repurchases |
(293 | ) | — | (293 | ) | |||||||
| Distributions to members |
(32 | ) | — | (32 | ) | |||||||
| Net loss |
(91,295 | ) | — | (91,295 | ) | |||||||
|
|
|
|
|
|
|
|||||||
| Balances at December 31, 2015 |
(13,598 | ) | (102 | ) | (13,700 | ) | ||||||
| Equity-based compensation |
3,066 | — | 3,066 | |||||||||
| Net loss |
(11,053 | ) | — | (11,053 | ) | |||||||
|
|
|
|
|
|
|
|||||||
| Balances at April 28, 2016 |
$ | (21,585 | ) | $ | (102 | ) | $ | (21,687 | ) | |||
|
|
|
|
|
|
|
|||||||
The accompanying notes are an integral part of these consolidated financial statements.
F-42
Table of Contents
Index to Financial Statements
ALLIED OIL & GAS HOLDINGS, LLC AND SUBSIDIARIES
CONSOLIDATED STATEMENTS OF CASH FLOWS
PERIOD FROM JANUARY 1, 2016 TO APRIL 28, 2016 AND
YEARS ENDED DECEMBER 31, 2015 AND 2014
| 2016 | 2015 | 2014 | ||||||||||
| (in thousands) | ||||||||||||
| Cash flows from operating activities |
||||||||||||
| Net income (loss) |
$ | (11,053 | ) | $ | (91,295 | ) | $ | 9,662 | ||||
| Adjustments to reconcile net income (loss) to net cash provided by operating activities |
||||||||||||
| Depreciation and amortization |
2,179 | 12,258 | 12,318 | |||||||||
| Property and equipment impairment |
1,537 | 36,749 | — | |||||||||
| Goodwill and intangible asset impairment |
— | 33,653 | — | |||||||||
| Amortization of deferred loan costs |
115 | 322 | 252 | |||||||||
| (Gain) loss on sale of property and equipment |
(57 | ) | 720 | (139 | ) | |||||||
| Deferred gain on sale-leaseback |
(28 | ) | (34 | ) | 502 | |||||||
| Equity-based compensation |
3,066 | 891 | 1,059 | |||||||||
| Change in operating assets and liabilities |
||||||||||||
| Accounts receivable |
1,353 | 9,935 | (1,745 | ) | ||||||||
| Inventories |
961 | 911 | (636 | ) | ||||||||
| Prepaid expenses and other |
(151 | ) | 90 | (55 | ) | |||||||
| Accounts payable |
1,177 | (5,654 | ) | 785 | ||||||||
| Accrued payroll |
166 | (2,320 | ) | (243 | ) | |||||||
| Other accrued expenses |
856 | 618 | 245 | |||||||||
|
|
|
|
|
|
|
|||||||
| Net cash provided by (used in) operating activities |
121 | (3,156 | ) | 22,005 | ||||||||
|
|
|
|
|
|
|
|||||||
| Cash flows from investing activities |
||||||||||||
| Purchases of property and equipment |
(47 | ) | (797 | ) | (32,789 | ) | ||||||
| Proceeds from sale of property and equipment |
91 | 2,922 | 6,537 | |||||||||
|
|
|
|
|
|
|
|||||||
| Net cash provided by (used in) investing activities |
44 | 2,125 | (26,252 | ) | ||||||||
|
|
|
|
|
|
|
|||||||
| Cash flows from financing activities |
||||||||||||
| Proceeds from issuance of long-term debt |
114 | 6,526 | 27,750 | |||||||||
| Payments on long-term debt |
(722 | ) | (15,944 | ) | (19,848 | ) | ||||||
| Proceeds from issuance of CSL notes |
1,000 | — | — | |||||||||
| Payments on capital lease obligation |
(73 | ) | (383 | ) | (64 | ) | ||||||
| Debt issuance costs incurred |
— | (246 | ) | (148 | ) | |||||||
| Proceeds from issuance of units |
— | 10,826 | 15,565 | |||||||||
| Units redeemed |
— | (293 | ) | (16,712 | ) | |||||||
| Distributions to members |
— | (32 | ) | (4,952 | ) | |||||||
| Payments received on notes receivable from members |
— | 110 | 289 | |||||||||
|
|
|
|
|
|
|
|||||||
| Net cash provided by financing activities |
319 | 564 | 1,880 | |||||||||
|
|
|
|
|
|
|
|||||||
| Net increase (decrease) in cash and cash equivalents |
484 | (467 | ) | (2,367 | ) | |||||||
| Cash and cash equivalents |
||||||||||||
| Beginning of year |
68 | 535 | 2,902 | |||||||||
|
|
|
|
|
|
|
|||||||
| End of year |
$ | 552 | $ | 68 | $ | 535 | ||||||
|
|
|
|
|
|
|
|||||||
| Supplemental disclosures of cash flow information |
||||||||||||
| Cash paid for interest |
$ | 335 | $ | 4,292 | $ | 3,626 | ||||||
| Noncash investing and financing activities |
||||||||||||
| Property and equipment additions in accounts payable |
— | — | 2,356 | |||||||||
| Property and equipment additions under a capital lease |
— | 1,388 | 6,096 | |||||||||
| Notes receivable issued for units purchased |
— | — | 255 | |||||||||
| Cancellation of notes receivable |
— | 377 | — | |||||||||
| Notes payable issued for property and equipment additions |
— | 1,258 | 6,182 | |||||||||
The accompanying notes are an integral part of these consolidated financial statements.
F-43
Table of Contents
Index to Financial Statements
ALLIED OIL & GAS HOLDINGS, LLC AND SUBSIDIARIES
NOTES TO CONSOLIDATED FINANCIAL STATEMENTS
APRIL 28, 2016 AND DECEMBER 31, 2015 AND 2014
| 1. | Organization and Liquidity |
Allied Cementing Holdings, LLC was organized as a Delaware Limited Liability Company on December 14, 2011. Effective January 10, 2012, Allied Cementing Holdings, LLC changed its name to Allied Oil & Gas Holdings, LLC (“Allied” or the “Company”). Allied provides cementing services to oil and natural gas operators in the mid-continent, northeast, Rockies and southwest regions of the United States.
On April 28, 2016, CSL Allied Holdings, LLC (“CSL”), an unrelated third party, acquired the assets of the Company for total consideration of $21,475,000 including closing cash consideration of $20,000,000, $1,000,000 in previously issued loans to Allied, and reimbursement of expenses to Intervale Capital, LLC (“Intervale”), parent of certain Allied members, of $475,000. Per the terms of the escrow agreement, 24 months after the closing date the remaining funds after settlement of any claims shall be distributed to CSL. The consolidated financial statements do not include any adjustments related to the sale.
As further described in Note 4, as a result of a downturn in the oil services industry, the Company was not in compliance with certain debt covenants starting in 2015 including minimum EBITDA and the leverage ratio related to its senior notes payable. The Company was in compliance with these covenants at December 31, 2014 but not as of December 31, 2015 and April 28, 2016. Upon failing to comply with these covenants the Company was in default of the senior notes payable and entered into a forbearance agreement with its lenders. This forbearance agreement was in effect through the sale of the Company on April 28, 2016. Upon receipt of the closing cash consideration of $20,000,000 per the asset purchase agreement dated April 28, 2016, a paydown letter was delivered to CSL in which the lenders agreed to release all of the liens against the purchased assets under the credit agreement. As of April 28, 2016 and December 31, 2015, all debt of the Company was immediately due and payable.
| 2. | Summary of Significant Accounting Policies |
Basis of Presentation
The Company’s consolidated financial statements include the accounts and operations of Allied Oil & Gas Holdings, LLC and its wholly owned subsidiaries; Allied Oil & Gas Services, LLC, Allied Cementing Company, LLC, Allied Acidizing, LLC, and Treat-Em-Rite Pressure Pumping Services, LLC. All significant balances and transactions among the consolidated entities have been eliminated. These financial statements are prepared in accordance with accounting principles generally accepted in the United States of America (GAAP) which requires management to make estimates and assumptions that affect the reported amounts of assets and liabilities and disclosure of contingent assets and liabilities at the date of the financial statements and the reported amounts of revenues and expenses during the reporting period.
Use of Estimates
In preparing the consolidated financial statements in conformity with GAAP, management is required to make estimates and assumptions that affect the reported amounts of assets and liabilities, the disclosure of contingent assets and liabilities at the date of the financial statements and the reported amounts of revenues and expenses during the reporting periods. Actual results could differ from those estimates.
F-44
Table of Contents
Index to Financial Statements
ALLIED OIL & GAS HOLDINGS, LLC AND SUBSIDIARIES
NOTES TO CONSOLIDATED FINANCIAL STATEMENTS
APRIL 28, 2016 AND DECEMBER 31, 2015 AND 2014
Revenue Recognition
Revenue is recognized upon the completion of services rendered on cementing and acidizing projects. The Company commences revenue recognition when all of the following conditions are satisfied: 1) persuasive evidence of an arrangement exists; 2) the service or product has been or is being provided to the client; 3) the fee is fixed or determinable; and 4) collection is probable. The Company generally enters into a master-service agreement with its clients, and services are generally performed, or product is delivered to clients, under individual work orders. These work orders are generally fulfilled within 24 hours of commencement. Revenues from the provision of cementing services and the sale of products are recognized when final delivery is made and the client signs-off on the field ticket.
Income Taxes
The Company is classified as a partnership for federal and state income tax purposes and, accordingly, the earnings or loss will be included in the tax return of the members. As a result, no provision for income taxes has been recorded in these consolidated financial statements.
Stock Based Compensation
The Company measures stock based compensation expense based on the estimated fair value of the unit based awards on the grant date and recognizes compensation expense on a straight-line basis over the requisite service period, which is generally the vesting period. The compensation charge is determined with reference to the fair value of rights to receive shares of stock which in turn is determined based on the number of shares granted and the fair value of equity at the date of the grant. The fair value of stock options is determined using the Black-Scholes Model.
Fair Value of Financial Instruments
Fair value is defined as the price that would be received to sell an asset or paid to transfer a liability in an orderly transaction between market participants at the measurement date. The carrying amount reported in the balance sheets for all financial instruments, including cash and cash equivalents, certain payables, and debt instruments, approximates fair value due to variable rates and/or short-term maturities.
Concentration of Credit Risk
The Company had one client that represented approximately 22%, 15% and 28% of revenue in 2014, 2015 and 2016, respectively, and approximately 30%, 10% and 10% of accounts receivable as of April 28, 2016 and December 31, 2015 and 2014, respectively.
Property and Equipment
Property and equipment acquired as part of business acquisitions are stated at the fair value determined on the acquisition dates. Other purchased property and equipment is stated at cost. Maintenance, repairs and renewals, which do not enhance the value of or increase the life of the asset, are expensed as incurred.
F-45
Table of Contents
Index to Financial Statements
ALLIED OIL & GAS HOLDINGS, LLC AND SUBSIDIARIES
NOTES TO CONSOLIDATED FINANCIAL STATEMENTS
APRIL 28, 2016 AND DECEMBER 31, 2015 AND 2014
Property and equipment are depreciated using the straight-line method of depreciation over the following estimated useful lives:
| Buildings, including building improvements | 10 – 40 years | |
| Machinery, equipment and vehicles | 3 – 20 years |
The Company reviews property and equipment for impairment when events have occurred that may be indicators of potential impairment. The Company estimates the future undiscounted cash flows expected to result from the use of the asset. If the sum of the expected undiscounted cash flows is less than the carrying value of the asset, an impairment loss is recognized. The amount of the impairment loss is calculated as the difference between the carrying value of the assets and the fair value of the assets. There was no impairment during the year ended December 31, 2014. For the year ended December 31, 2015 a triggering event was identified. An impairment loss to property and equipment of $36,900,000 was recorded during the year ended December 31, 2015.
As of April 28, 2016 the Company recorded an impairment of $1,537,000 related to construction in progress for the construction of a new bulk and acid plant and new software development. In July 2016 the Company agreed with the respective vendors for these projects to give up rights to these assets in lieu of making remaining payments of approximately $506,000.
Goodwill and Intangible Assets
The Company’s goodwill represents the excess of the cost of businesses acquired over the fair value of the net assets acquired at the date of acquisition. Goodwill is not amortized but, instead, tested for impairment annually at December 31 or more frequently if circumstances indicate potential impairment. The impairment test for goodwill utilizes a two-step fair value approach. The first step of the goodwill impairment test is used to identify potential impairment by comparing the fair value of the reporting unit, to its carrying amount. If the fair value of the reporting unit exceeds its carrying amount, goodwill is not considered impaired. If the carrying amount of the reporting unit exceeds its fair value, the second step of the goodwill impairment test is performed to measure the amount of impairment loss, if any. The second step of the goodwill impairment test compares the implied fair value of the reporting unit’s goodwill with the carrying amount of that goodwill. The implied fair value of goodwill is determined by performing an assumed purchase price allocation, using the reporting unit fair value (as determined in the first step) as the purchase price. If the carrying amount of goodwill exceeds the implied fair value, an impairment loss is recognized in an amount equal to that excess.
As of December 31, 2015, the Company determined that the fair value of the Company’s reporting unit was less than the carrying value of the net assets of the reporting unit, and thus, the Company performed step two of the impairment test. In step two of the impairment test, the Company determined the implied fair value of the goodwill in the reporting unit and compared it to the carrying value of its goodwill. The fair value of the reporting unit was allocated to all of its assets and liabilities as if the reporting unit had been acquired in a business combination and the fair value of the reporting unit was the price paid to acquire the reporting unit. The step two analysis resulted in an implied fair value of goodwill of zero for the reporting unit, and therefore, the Company recognized a goodwill impairment charge of $4,558,000 as of December 31, 2015. No goodwill impairment charge was recorded in the accompanying consolidated financial statements for the year ended December 31, 2014.
F-46
Table of Contents
Index to Financial Statements
ALLIED OIL & GAS HOLDINGS, LLC AND SUBSIDIARIES
NOTES TO CONSOLIDATED FINANCIAL STATEMENTS
APRIL 28, 2016 AND DECEMBER 31, 2015 AND 2014
Tradenames were determined to have an indefinite life and were initially measured based on their fair values at acquisition date. Tradenames are tested by comparing their fair value to their carrying value. No tradename impairment charge was recorded in the accompanying consolidated financial statements for the year ended December 31, 2014. As of December 31, 2015, the Company determined that the fair value of the tradenames was below the carrying value and recorded an impairment charge of $5,710,000.
Other intangible assets consist of client lists and noncompete agreements. Client lists consist of information about clients, such as their name, contact information, and order history. Client lists were initially measured based on their fair value at acquisition date and are amortized using the straight-line method over the estimated useful life of the client relationships, which approximates twenty years. In connection with an acquisition, the Company entered into noncompete agreements which prohibit the Predecessor Entity owners from engaging in competition in cementation and pressure pumping services in North America for a period of four years, commencing on the acquisition date. The fair value of the noncompete agreements is being amortized using the straight-line method over the estimated economic life of the agreements, which is six years.
The Company reviews amortizing intangible assets for impairment when events have occurred that may be indicators of potential impairment. For the year ended December 31, 2015 a triggering event was identified. After comparing the sum of the expected undiscounted cash flows to the carrying value, impairment losses of $22,721,000 and $664,000 related to client list intangible assets and non-compete agreements was recorded representing the difference between the carrying value of the assets and the fair value.
Deferred Loan Costs
Deferred loan costs are amortized to interest expense over the term of the related financing agreement.
Recent Accounting Pronouncements
In February 2016, the FASB issued ASU No. 2016-02, Leases. The new standard requires lessees to recognize a right of use asset and a lease liability for virtually all leases. The guidance is effective for the Company for the fiscal year beginning January 1, 2020 and interim periods thereafter. The Company is currently evaluating the impacts of adoption of this standard.
In November 2015, the FASB issued ASU 2015-17, Income Taxes (Topic 740): Balance Sheet Classification of Deferred Taxes, which changes how deferred taxes are classified on organizations’ balance sheets. The ASU eliminates the current requirement for organizations to present deferred tax liabilities and assets as current and noncurrent in a classified balance sheet. Instead, organizations will be required to classify all deferred tax assets and liabilities as noncurrent. The amendments apply to all organizations that present a classified balance sheet. The Company has adopted this accounting standard on a retrospective basis as of December 31, 2015. This adoption had no material impact on the Company’s financial statements.
In April 2015, the FASB issued ASU 2015-03, Simplifying the Presentation of Debt Issuance Costs, which requires that debt issuance costs related to a recognized debt liability be presented in the balance sheet as a direct deduction from the carrying amount of that debt liability. For private entities, the ASU is effective for financial statements issued for fiscal years beginning after
F-47
Table of Contents
Index to Financial Statements
ALLIED OIL & GAS HOLDINGS, LLC AND SUBSIDIARIES
NOTES TO CONSOLIDATED FINANCIAL STATEMENTS
APRIL 28, 2016 AND DECEMBER 31, 2015 AND 2014
December 15, 2015. Entities should apply the new guidance on a retrospective basis, wherein the balance sheet of each individual period presented should be adjusted to reflect the period-specific effects of applying the new guidance. The Company adopted ASU 2015-03 as of April 28, 2016, and applied its provisions retrospectively. The adoption of ASU 2015-03 resulted in the reclassification of $837,256 and $952,740 of unamortized debt issuance costs from other non-current assets to long-term debt within the consolidated balance sheets as of April 28, 2016 and December 31, 2015, respectively. Other than this reclassification, the adoption of ASU 2015-03 did not have an impact on the Company’s consolidated financial statements.
In August 2014, the FASB issued ASU No. 2014-15, Presentation of Financial Statements—Going Concern. The new standard requires management to evaluate whether there are conditions and events that raise substantial doubt about an entity’s ability to continue as a going concern for both annual and interim reporting periods. The guidance is effective for the Company for the fiscal year beginning January 1, 2016 and interim periods thereafter. The guidance is not expected to have a material impact on the Company’s consolidated financial statements.
In May 2014, the FASB issued ASU No. 2014-09, Revenue from Contracts with Customers (Topic 606). The new standard is effective for reporting periods beginning after December 15, 2017 and early adoption is not permitted. The comprehensive new standard will supersede existing revenue recognition guidance and require revenue to be recognized when promised goods or services are transferred to customers in amounts that reflect the consideration to which the Company expects to be entitled in exchange for those goods or services. Adoption of the new rules could affect the timing of revenue recognition for certain transactions. The guidance permits two implementation approaches, one requiring retrospective application of the new standard with restatement of prior years and one requiring prospective application of the new standard with disclosure of results under old standards. The Company is currently evaluating the impacts of adoption and the implementation approach to be used.
| 3. | Goodwill and Other Intangible Assets |
Changes in the carrying value of goodwill for the Company’s reporting unit were as follows:
| (in thousands) | ||||
| Balance at December 31, 2013 |
$ | 4,558 | ||
| Goodwill impairment |
— | |||
|
|
|
|||
| Balance at December 31, 2014 |
4,558 | |||
| Goodwill impairment |
(4,558 | ) | ||
|
|
|
|||
| Balance at December 31, 2015 |
$ | — | ||
|
|
|
|||
F-48
Table of Contents
Index to Financial Statements
ALLIED OIL & GAS HOLDINGS, LLC AND SUBSIDIARIES
NOTES TO CONSOLIDATED FINANCIAL STATEMENTS
APRIL 28, 2016 AND DECEMBER 31, 2015 AND 2014
The following summarizes the carrying amounts of intangible assets other than goodwill and related amortization, if applicable, at April 28, 2016, December 31, 2015, and December 31, 2014:
| 2016 | 2015 | 2014 | ||||||||||||||||||||||||||||||||||
| Gross Carrying Amounts |
Accumulated Amortization |
Net | Gross Carrying Amounts |
Accumulated Amortization |
Net | Gross Carrying Amounts |
Accumulated Amortization |
Net | ||||||||||||||||||||||||||||
| (in thousands) | ||||||||||||||||||||||||||||||||||||
| Nonamortizable assets |
||||||||||||||||||||||||||||||||||||
| Tradenames |
$ | — | $ | — | $ | — | $ | — | $ | — | $ | — | $ | 5,710 | $ | — | $ | 5,710 | ||||||||||||||||||
| Amortizable assets |
||||||||||||||||||||||||||||||||||||
| Tradenames |
600 | (50 | ) | 550 | 600 | — | 600 | — | — | — | ||||||||||||||||||||||||||
| Client lists |
— | — | — | 28,774 | (4,021 | ) | 24,753 | |||||||||||||||||||||||||||||
| Noncompete agreements |
— | — | — | — | — | — | 2,062 | (1,031 | ) | 1,031 | ||||||||||||||||||||||||||
|
|
|
|
|
|
|
|
|
|
|
|
|
|
|
|
|
|
|
|||||||||||||||||||
| $ | 600 | $ | (50 | ) | $ | 550 | $ | 600 | $ | — | $ | 600 | $ | 36,546 | $ | (5,052 | ) | $ | 31,494 | |||||||||||||||||
|
|
|
|
|
|
|
|
|
|
|
|
|
|
|
|
|
|
|
|||||||||||||||||||
Amortization of intangible assets was $50,000 for the period from January 1, 2016 to April 28, 2016 and $1,799,000 for each of the years ended December 31, 2015 and 2014, respectively, and is included in selling, general and administrative expenses on the consolidated statements of operations. Subsequent to the impairment of tradename intangible assets at December 31, 2015, these intangible assets were determined to be amortizable assets with an estimated remaining useful life of 4 years.
Future amortization expense at April 28, 2016 is as follows:
| Total | ||||
| (in thousands) | ||||
| 2016 |
$ | 100 | ||
| 2017 |
150 | |||
| 2018 |
150 | |||
| 2019 |
150 | |||
|
|
|
|||
| $ | 550 | |||
|
|
|
|||
| 4. | Long-Term Debt |
Long-term debt consisted of the following at April 28, 2016, December 31, 2015, and December 31, 2014:
| 2016 | 2015 | |||||||
| (in thousands) | ||||||||
| Senior notes payable |
||||||||
| Term loan |
$ | 48,199 | $ | 48,199 | ||||
| Delayed draw loan |
14,882 | 14,882 | ||||||
| Revolver |
4,142 | 4,142 | ||||||
| CSL notes |
1,000 | — | ||||||
| Other promissory notes |
7,922 | 8,530 | ||||||
| Less: Deferred financing costs, net |
(837 | ) | (952 | ) | ||||
|
|
|
|
|
|||||
| Total debt |
75,308 | 74,801 | ||||||
| Less: Current maturities |
75,308 | 74,801 | ||||||
|
|
|
|
|
|||||
| Long-term debt, less current maturities |
$ | — | $ | — | ||||
|
|
|
|
|
|||||
F-49
Table of Contents
Index to Financial Statements
ALLIED OIL & GAS HOLDINGS, LLC AND SUBSIDIARIES
NOTES TO CONSOLIDATED FINANCIAL STATEMENTS
APRIL 28, 2016 AND DECEMBER 31, 2015 AND 2014
Senior Notes Payable
On October 24, 2013, the Company entered into a credit agreement with existing lenders which was subsequently amended on March 28, 2014 and October 23, 2014. At December 31, 2014 the credit agreement provided for a $57,000,000 term loan (Term Loan), $20,000,000 delayed draw term loan (Delayed Draw Loan), $20,000,000 revolving line of credit (Revolver) and $1,000,000 swingline loan (Swingline Loan), respectively. The Company may elect to increase the Term Loan and/or Revolver commitments in total by an amount not to exceed $18,000,000 any time prior to October 24, 2018 subject to approval by the lenders. The Delayed Draw Loan is available for advances through June 30, 2014 and is to be used to fund the purchases of capital equipment as permitted under the agreement. Advances are made at 85% of the purchase price of the new equipment. The amount available under the Revolver is reduced by the amount of outstanding letters of credit on behalf of the Company, of which none were issued as of December 31, 2014. The Revolver is limited by a borrowing base calculation that is based on 85% of eligible domestic accounts receivable plus 50% of eligible inventory. The credit agreement required equity contributions of $15,000,000 on or before January 15, 2014 which was received by the Company on January 15, 2014. The credit agreement is collateralized by substantially all assets of the Company.
The amendment to the credit agreement on March 28, 2014 increased the Term Loan by $7,000,000 and the Delayed Draw Loan commitment by $5,000,000. This amendment also required certain majority members to guarantee the additional $7,000,000 Term Loan borrowing and allowed the Company to make $18,381,852 of restricted payments to redeem certain senior preferred units.
The amendment to the credit agreement on October 23, 2014 increased the Revolver commitment by $5,000,000 and released the partial guarantee of the Term Loan by certain majority members.
The amendment to the credit agreement on May 20, 2015 waived covenant violations as March 31, 2015, reduced the aggregate revolving commitment to $10,000,000, amended the total leverage and fixed charges covenant requirements, changed the capex cap to $7,000,000 for the year ended December 31, 2015, and changed required equity contributions per the respective equity support agreements to an aggregate amount equal to $8,000,000 between May 19, 2015 and December 31, 2015.
The Term Loan, Delayed Draw Loan and Revolver accrue interest at a rate equal to a variable rate based on an index plus an applicable margin. The margin adjusts on a sliding scale ranging from 2.00% to 4.25% based on a debt to EBITDA ratio. In addition, a fee is charged for any unused portion of the Delayed Draw Loan and Revolver and is adjusted on a sliding scale ranging from 0.375% to 0.50% based on a debt to EBITDA ratio. The effective interest rate for the period from January 1, 2016 to April 28, 2016, and the years ended December 31, 2015 and 2014 was 3.94%, respectively.
Quarterly principal and interest payments are due on the Term Loan and the Delayed Draw Loan. Quarterly interest only payments are due on the Revolver. Mandatory prepayments are required for certain insurance proceeds, assets sales and other assets dispositions. The Company is also required to prepay borrowings equal to 50% of any excess cash flow as defined in the credit agreement beginning December 31, 2014 if the total leverage ratio as of the last day of the year is greater than 2.00 to 1.00. The remaining balances of all loans under the credit agreement were due at the maturity date of October 24, 2018, prior to the events of default noted below.
F-50
Table of Contents
Index to Financial Statements
ALLIED OIL & GAS HOLDINGS, LLC AND SUBSIDIARIES
NOTES TO CONSOLIDATED FINANCIAL STATEMENTS
APRIL 28, 2016 AND DECEMBER 31, 2015 AND 2014
The Company’s credit agreement contains certain financial covenants relating to EBITDA requirements, certain debt ratios as well as various other provisions including limitations on distributions, capital expenditures, leases and indebtedness.
As a result of a downturn in the oil services industry, the Company was not in compliance with certain debt covenants starting in 2015 including minimum EBITDA and the leverage ratio related to its senior notes payable. The Company was in compliance with these covenants at December 31, 2014 but not as of December 31, 2015 and April 28, 2016. Upon failing to comply with these covenants the Company was in default of the senior notes payable and entered into a forbearance agreement with its lenders. This forbearance agreement was in effect through the sale of the Company on April 28, 2016.
The amendment to the credit agreement on March 25, 2016 discussed existing defaults including failure to make principal payments on or before January 8, 2016 on the term loan and delayed draw loan (as extended per the amendment to the credit agreement on December 31, 2015) and failure to meet the fixed charge coverage ratio and leverage ratio covenant requirements as of December 31, 2015. This amendment allowed the Company to borrow $500,000 on or about March 24, 2016 from CSL pending completion of participation agreements with the lenders and also provided the order of application for available funds should insufficient funds be available to fully satisfy outstanding obligations.
Upon receipt of the closing cash consideration of $20,000,000 per the asset purchase agreement dated April 28, 2016, the lenders agreed to release all of the liens against the purchased assets under the credit agreement.
Other Promissory Notes
The Company has entered into various promissory notes totaling $7,921,966 and $8,529,997 as of April 28, 2016 and December 31, 2015, respectively, related to the purchase of property and equipment. The notes bear interest at rates ranging from 4.49% to 5.84% and are payable in monthly installments totaling approximately $240,000 with the remaining principal balances due through December 2018.
CSL Notes
In contemplation of the closing of the asset purchase on April 28, 2016, the Company entered into a loan with CSL and received $500,000 on each of March 25, 2016 and April 25, 2016.
As of April 28, 2016 and December 31, 2015, all debt of the Company was immediately due and payable.
| 5. | Commitments and Contingencies |
Leases
The Company has operating leases for land and buildings for various district locations, sales offices and corporate offices. Certain district location leases include the option to purchase the leased property at fair value based on terms of the lease agreements. Initial lease terms range from one to fifteen years with renewal options generally being available. The Company leases certain vehicles under operating leases with an initial term of four years. For certain operating
F-51
Table of Contents
Index to Financial Statements
ALLIED OIL & GAS HOLDINGS, LLC AND SUBSIDIARIES
NOTES TO CONSOLIDATED FINANCIAL STATEMENTS
APRIL 28, 2016 AND DECEMBER 31, 2015 AND 2014
leases, the difference between the actual lease payments and the amount of rent expense recorded on a straight-line basis is recorded as deferred rent over the expected lease term. Deferred rent totaled $724,000, $752,000 and $577,000 at April 28, 2016 and December 31, 2015 and 2014, respectively.
Deferred rent includes a deferred gain of $707,000 and $727,000 as of April 28, 2016 and December 31, 2015, respectively, related to the sale and leaseback of two district location properties sold and leased back during 2014 and 2015. The related leases were accounted for as capital leases.
The Company leases certain corporate office furniture under a capital lease with an initial three year term. There are other various month-to-month rental agreements. Rent expense was $426,000, $1,797,000 and $1,556,000 for the period from January 1, 2016 to April 28, 2016, years ended December 31, 2015 and 2014, respectively.
Future minimum lease payments for all noncancellable capital and operating leases at April 28, 2016 are as follows:
| Capital | Operating | |||||||
| 2017 |
$ | 509 | $ | 1,220 | ||||
| 2018 |
777 | 1,227 | ||||||
| 2019 |
792 | 1,240 | ||||||
| 2020 |
808 | 1,103 | ||||||
| 2021 |
824 | 794 | ||||||
| Thereafter |
7,184 | 4,290 | ||||||
|
|
|
|
|
|||||
| Total minimum lease payments |
10,894 | $ | 9,874 | |||||
|
|
|
|||||||
| Less: Amount representing interest |
3,837 | |||||||
|
|
|
|||||||
| Present value of minimum lease payments |
7,057 | |||||||
| Less: Current portion |
7,057 | |||||||
|
|
|
|||||||
| Capital lease obligations, excluding current portion |
$ | — | ||||||
|
|
|
|||||||
Employment Agreements
The Company has employment agreements with various key executives. The agreements are generally for a term of four years but may be terminated by the Company or key executive and include provisions for annual compensation, bonus, benefits, and severance pay, as defined in the agreements. Severance expense totaled $463,000 for the year ended December 31, 2015.
F-52
Table of Contents
Index to Financial Statements
ALLIED OIL & GAS HOLDINGS, LLC AND SUBSIDIARIES
NOTES TO CONSOLIDATED FINANCIAL STATEMENTS
APRIL 28, 2016 AND DECEMBER 31, 2015 AND 2014
| 6. | Members’ Units |
Outstanding member units by class consist of the following at April 28, 2016 and December 31, 2015 and 2014:
| Outstanding Units | ||||||||||||
| 2016 | 2015 | 2014 | ||||||||||
| 2015 Senior Preferred |
2,385 | 2,385 | — | |||||||||
| 2014 Senior Preferred |
— | — | 224 | |||||||||
| Class A Preferred |
1,469 | 1,469 | 988 | |||||||||
| Class B Preferred |
25 | 25 | 26 | |||||||||
| Common |
127 | 127 | 116 | |||||||||
The Company’s limited liability company agreement (“LLC Agreement”) was amended and restated effective January 1, 2014 for the issuance of the 2014 Senior Preferred units.
Senior Preferred units may be converted at any time by a vote or consent of a majority of the holders of the then outstanding Senior Preferred units into the number of Class A Preferred units equal to the greater of (i) the number of Senior Preferred units being converted or (ii) $40.865 multiplied by the number of Senior Preferred units being converted divided by the fair market value, based on a formula as defined, of a Class A Preferred unit. The Senior Preferred units are mandatorily convertible to Class A Preferred units eighteen months after issuance, using the above formula, unless redeemed prior to that date. If converted, the preferred return on the Senior Preferred units will be reduced to equal the preferred return on the Class A Preferred units.
The 2014 Senior Preferred units may be converted at any time by a vote or consent of a majority of the holders of the then outstanding 2014 Senior Preferred units into the number of Class A Preferred units equal to the greater of (i) the number of 2014 Senior Preferred units being converted or (ii) $66.869 multiplied by the number of 2014 Senior Preferred units being converted divided by the fair market value, based on a formula as defined, of a Class A Preferred unit. The 2014 Senior Preferred units are mandatorily convertible to Class A Preferred units eighteen months after issuance, using the above formula, unless redeemed prior to that date. If converted, the preferred return on the 2014 Senior Preferred units will be reduced to equal the preferred return on the Class A Preferred units.
On January 15, 2014 the Company issued 224,000 of 2014 Senior Preferred units with an equity contribution of $15,000,000. On January 27, 2014, the Company redeemed 61,177 Senior Preferred units related to the July 2012 issuance for $3,282,234 including a cumulative preferred return of $782,000. On March 28, 2014, the Company redeemed the remaining 347,789 Senior Preferred units related to the October and November 2012 issuances for $18,382,000 including a cumulative preferred return of $4,169,000.
The Company may repurchase the Class B Preferred units if the member’s employment is terminated. The repurchase price is equal to cost or based on a fair value formula, in accordance with the agreement.
Common units have been granted to certain members of management and employees. The Common units are considered profits interests and vest over four years, with 25% vesting on the first anniversary of the grant date and 6.25% each succeeding fiscal quarter thereafter as long as the unitholder is a full time employee. In accordance with the terms of the agreements,
F-53
Table of Contents
Index to Financial Statements
ALLIED OIL & GAS HOLDINGS, LLC AND SUBSIDIARIES
NOTES TO CONSOLIDATED FINANCIAL STATEMENTS
APRIL 28, 2016 AND DECEMBER 31, 2015 AND 2014
the Company may repurchase the vested Common units or terminate the agreement under certain circumstances. In the event of a sale of the Company the units become fully vested. The Company has approximately 9,000 additional Common units available for grant.
The fair value of each Common unit is estimated on the grant date using the Black-Scholes model. Compensation expense is recognized on a straight line basis over the requisite service period. Compensation expense related to the Common units totaled approximately $3,066,000, $891,000 and $1,059,000 for the period from January 1, 2016 to April 28, 2016 and the years ended December 31, 2015 and 2014, respectively. As of April 28, 2016, total unrecognized compensation expense of $2,706,000 was fully recognized during the period from January 1, 2016 through April 28, 2016 due to the acquisition of the Company which accelerated vesting under the change of control clause within the equity-based compensation plans. The Company has 81,362, 68,812 and 59,187 of vested Common units as of April 28, 2016 and December 31, 2015 and 2014, respectively.
A summary of the Company’s nonvested Common unit activity is presented below:
| Units | Weighted Average Fair Value |
|||||||
| Outstanding at December 31, 2013 |
59,531 | $ | 38.58 | |||||
| Granted |
31,750 | 57.02 | ||||||
| Vested |
(30,603 | ) | 39.21 | |||||
| Forfeited |
(5,250 | ) | 43.44 | |||||
|
|
|
|
|
|||||
| Outstanding at December 31, 2014 |
55,428 | 51.20 | ||||||
| Granted |
81,000 | 59.25 | ||||||
| Vested |
(9,625 | ) | 45.32 | |||||
| Forfeited |
(67,728 | ) | 53.48 | |||||
|
|
|
|
|
|||||
| Outstanding at December 31, 2015 |
59,075 | 50.32 | ||||||
| Granted |
— | — | ||||||
| Vested |
(12,550 | ) | 52.67 | |||||
| Forfeited |
— | — | ||||||
|
|
|
|
|
|||||
| Outstanding at April 28, 2016 |
46,525 | 53.83 | ||||||
|
|
|
|
|
|||||
All units are nonvoting. The business and affairs of the Company are managed by the Management Board, which currently consists of four Managers. The Management Board was appointed by and may be removed by the majority owner of the Preferred units. The Management Board acts by majority vote of the Managers then in office.
Distributions to Members
The LLC Agreement provides for pro rata tax distributions from available cash, in sufficient amounts, to allow the members to pay all applicable federal and state income taxes on allocated earnings.
Distributions to members in excess of tax distributions are in the following order and priority:
| • | First, pro rata on the Senior Preferred units equal to a 20% cumulative return, |
| • | Second, pro rata on the Senior Preferred units equal to their initial capital contribution, |
F-54
Table of Contents
Index to Financial Statements
ALLIED OIL & GAS HOLDINGS, LLC AND SUBSIDIARIES
NOTES TO CONSOLIDATED FINANCIAL STATEMENTS
APRIL 28, 2016 AND DECEMBER 31, 2015 AND 2014
| • | Third, pro rata on the 2014 Senior Preferred units equal to a 20% cumulative return, |
| • | Fourth, pro rata on the 2014 Senior Preferred units equal to their initial capital contribution, |
| • | Fifth, pro rata on the Class A units equal to an 8% cumulative return, |
| • | Sixth, pro rata on the Class A units equal to their initial capital contribution, |
| • | Seventh, pro rata on the Class B units equal to the Class A members distributions per unit (Class B Preferred unit catch-up amount) and |
| • | Eighth, pro rata on all Class A and B Preferred and vested Common units. |
Allocation of Earnings and Losses
To the extent that the Company makes a distribution of cash flow to a Preferred member representing a preferred return, earnings shall be allocated first to Preferred member to the extent of the distribution. All other earnings or losses are allocated to all members in accordance with their respective membership interests.
Notes Receivable From Members
Notes receivable are from certain members of management and employees for the purchase of Class A Preferred units. The notes accrue interest at a rates ranging from 4% to 5% with interest payments due annually and generally a term of seven years, although the notes become due and payable in certain circumstances including termination of employment. Required principal payments are equal to 50% of any aggregate bonus amount received from the Company, net of all applicable taxes. The notes are secured by all units held by the member.
| 7. | Related Party Transactions |
Effective December 21, 2011, the Company entered into a management services agreement with Intervale, which requires the Company to pay Intervale an annual advisory fee in an amount equal to the greater of $350,000 or 3.0% of EBITDA, payable monthly in twelve equal installments. Intervale limited the advisory fee charges to a maximum of $650,000 for 2014 and has waived the advisory fees for 2015 and 2016. The Company incurred $482,000 in advisory fees and $73,000 of other miscellaneous fees or expense reimbursements to Intervale for the year ended December 31, 2014. The Company incurred no advisory fees and $31,000 and $180,000 of other miscellaneous fees or expense reimbursements to Intervale for the period from January 1, 2016 to April 28, 2016 and the year ended December 31, 2015, respectively. Advisory fees paid are limited annually to $650,000 by the senior credit agreement.
| 8. | Retirement Plan |
The Company provides eligible employees who are at least 21 years of age with immediate eligibility for retirement benefits under a 401(k) plan (“the Plan”). The Plan establishes discretionary matching employer contributions in a percentage to be determined annually. During 2016, 2015 and 2014, the Company matched 50% of the employee’s contributions up to a maximum of 8%. The expense under the Plan was $33,000, $216,000 and $467,000 for the period from January 1, 2016 to April 28, 2016 and the years ended December 31, 2015 and
F-55
Table of Contents
Index to Financial Statements
ALLIED OIL & GAS HOLDINGS, LLC AND SUBSIDIARIES
NOTES TO CONSOLIDATED FINANCIAL STATEMENTS
APRIL 28, 2016 AND DECEMBER 31, 2015 AND 2014
2014, respectively. For the period from January 1, 2016 to April 28, 2016 and the year ended December 31, 2015 the Company also received forfeitures of 401(k) contributions that were not vested from executive management of $36,000 and $239,000, respectively.
| 9. | Subsequent Events |
The Company has evaluated and disclosed subsequent events, if any, through April 13, 2017, which represents the date which the financial statements were available to be issued.
F-56
Table of Contents
Index to Financial Statements
To the Board of Directors of
BJ Services, LLC:
We have audited the accompanying financial statements of the Baker Hughes North America Land Pressure Pumping Business (the “Business”) of BJ Services, LLC (the “Company”), which comprise the statements of direct revenues and direct operating expenses for the period from January 1, 2016 to December 30, 2016 and for the years ended December 31, 2015 and 2014, and the related notes to the financial statements.
Management’s Responsibility for the Financial Statements
Management is responsible for the preparation and fair presentation of these financial statements in accordance with accounting principles generally accepted in the United States of America; this includes the design, implementation, and maintenance of internal control relevant to the preparation and fair presentation of financial statements that are free from material misstatement, whether due to fraud or error.
Auditors’ Responsibility
Our responsibility is to express an opinion on these financial statements based on our audit. We conducted our audit in accordance with auditing standards generally accepted in the United States of America. Those standards require that we plan and perform the audit to obtain reasonable assurance about whether the financial statements are free from material misstatement.
An audit involves performing procedures to obtain audit evidence about the amounts and disclosures in the financial statements. The procedures selected depend on the auditor’s judgment, including the assessment of the risks of material misstatement of the financial statements, whether due to fraud or error. In making those risk assessments, the auditor considers internal control relevant to the Company’s preparation and fair presentation of the financial statements in order to design audit procedures that are appropriate in the circumstances, but not for the purpose of expressing an opinion on the effectiveness of the Business’ internal control. Accordingly, we express no such opinion. An audit also includes evaluating the appropriateness of accounting policies used and the reasonableness of significant accounting estimates made by management, as well as evaluating the overall presentation of the financial statements.
We believe that the audit evidence we have obtained is sufficient and appropriate to provide a basis for our audit opinion.
Opinion
In our opinion, the financial statements referred to above present fairly, in all material respects, the direct revenue and direct operating expenses for the period from January 1, 2016 to December 30, 2016 and for the years ended December 31, 2015 and 2014 in accordance with accounting principles generally accepted in the United States of America.
F-57
Table of Contents
Index to Financial Statements
Emphasis of Matter
As discussed in Note 1 to the financial statements, the accompanying financial statements have been derived from the accounting records of Baker Hughes Incorporated and have been prepared for the purposes of the transaction discussed in Note 1 to the financial statements. The financial statements were prepared to present the direct revenues and direct operating expenses of the Baker Hughes North America Land Pressure Pumping Business, and are not intended to be a complete presentation of the Baker Hughes North America Land Pressure Pumping Business’ financial position or results of operations. Our opinion is not modified with respect to this matter.
/s/ Deloitte & Touche LLP
Houston, TX
April 3, 2017
F-58
Table of Contents
Index to Financial Statements
BAKER HUGHES NORTH AMERICA LAND PRESSURE PUMPING BUSINESS
COMBINED STATEMENTS OF DIRECT REVENUES AND DIRECT OPERATING EXPENSES
| For the period January 1, 2016 through December 30, 2016 |
For the year ended December 31, | |||||||||||
| 2015 | 2014 | |||||||||||
| (in millions) | ||||||||||||
| Revenues |
$ | 231.0 | $ | 1,272.0 | $ | 4,296.1 | ||||||
| Direct operating expenses |
515.5 | 1,896.8 | 4,065.3 | |||||||||
|
|
|
|
|
|
|
|||||||
| Gross Profit (Loss) |
(284.5 | ) | (624.8 | ) | 230.8 | |||||||
|
|
|
|
|
|
|
|||||||
| Selling, general and administrative expenses |
(0.6 | ) | 12.0 | 43.5 | ||||||||
|
|
|
|
|
|
|
|||||||
| Revenues in Excess (Deficit) of Direct Operating Expenses |
$ | (283.9 | ) | $ | (636.8 | ) | $ | 187.3 | ||||
|
|
|
|
|
|
|
|||||||
The accompanying notes are an integral part of these combined abbreviated financial statements.
F-59
Table of Contents
Index to Financial Statements
BAKER HUGHES NORTH AMERICA LAND PRESSURE PUMPING BUSINESS
NOTES TO COMBINED ABBREVIATED FINANCIAL STATEMENTS
Note 1. DESCRIPTION OF TRANSACTION, DESCRIPTION OF BUSINESS AND BASIS OF PRESENTATION
Description of Transaction
On November 29, 2016, Baker Hughes Incorporated (“BHI”), parent company to the Baker Hughes North America Land Pressure Pumping Business (the “Business”), CSL Capital Management and Goldman Sachs Affiliated Funds announced an agreement to create a pure-play North American land pressure pumping company (the “Transaction”). The Transaction closed on December 30, 2016 in accordance with the executed Contribution Agreement. The new company will leverage operational experience and industry expertise to provide customers with leading hydraulic fracturing and cementing services supported by the current Baker Hughes world-class technology portfolio. The new company is headquartered in Tomball, Texas and operates under the BJ Services brand (“BJ Services”).
Under the terms of the contribution agreement, BHI contributed its North American land cementing and hydraulic fracturing businesses, which comprises assets in the U.S. and Canada including personnel outside of executive management, expertise, technology and infrastructure.
Description of Business
The Business, whose operations trace back to the Byron Jackson Company founded in 1872, was organized in 1990 under the corporate laws of the state of Delaware, and was acquired by Baker Hughes in 2010. The Business is one of the leading providers of pressure pumping services for the petroleum industry. The pressure pumping services consist of cementing and hydraulic fracturing services used in the completion and stimulation of new oil and natural gas wells and in remedial work on existing wells. The Business includes some of the highest-spec equipment in the market, including assets that are customized to service the full North America land pressure pumping market in highly efficient manner.
Basis of Presentation
The Business has historically operated as part of BHI and not as a separate stand-alone entity. The accompanying Statements of Direct Revenues and Direct Operating Expenses represent the interest in the revenue and direct operating expenses of the Business contributed by BHI on December 30, 2016 for $150.0 million in cash and equity in BJ Services, subject to customary post close adjustments.
The Statements of Direct Revenues and Direct Operating Expenses have been derived from BHI’s historical financial records. The accompanying Statements of Direct Revenues and Direct Operating Expenses vary from a complete income statement in accordance with the accounting principles generally accepted in the United States of America (“GAAP”) in that they do not reflect certain indirect expenses incurred in connection with the ownership and operation of the Business on a fully standalone basis, including but not limited to corporate general and administrative expenses, interest expenses, certain elements of indirect depreciation, depletion and amortization, and federal and state income taxes. These costs were not separately allocated to the working interests of the Business in the accounting records of BHI due to the shared or indirect nature of the costs and functions that supported numerous, and in some cases all, of Baker Hughes product and service lines. In addition, these allocations, if made using historical general and administrative structures and tax burdens, would not produce allocations indicative of the historical performance of the Business, due to
F-60
Table of Contents
Index to Financial Statements
BAKER HUGHES NORTH AMERICA LAND PRESSURE PUMPING BUSINESS
NOTES TO COMBINED ABBREVIATED FINANCIAL STATEMENTS
the differing size, structure, and nature of the operations. Compensation expenses for the dedicated employees that are to be transferred with the Business are included in the direct operating expense or selling, general and administrative expenses as appropriate. Allocations of other selling, general and administrative expenses directly related to the Business, including net periodic benefit costs related to participation by employees of the Business in defined benefit plans sponsored by BHI, are based on reasonable allocation methods.
Balance sheets, statements of cash flows and statements of shareholders’ equity have not been presented for the Business because the acquired Business was not accounted for or operated as a separate subsidiary or division by BHI and complete financial statements are not available and preparation of such statements is not meaningful. All cash flow requirements of the Business were funded by BHI and cash management functions were not performed at the Business level. Therefore it is impracticable to present a statement of cash flows, including cash flows from operating activities, investing or financing activities, as the Business did not maintain cash balances of that nature. Accordingly, the historical Statements of Direct Revenues and Direct Operating Expenses of the Business are presented in lieu of the full financial statements required under Item 3-05 of the Securities and Exchange Commission’s Regulation S-X.
These Statements of Direct Revenues and Direct Operating Expenses are not indicative of the results of operations for the Business on a go forward basis.
Note 2. SUMMARY OF SIGNIFICANT ACCOUNTING POLICIES
Use of Estimates – The Statements of Direct Revenues and Direct Operating Expenses are derived from the historical operating statements of the Business. GAAP requires management to make estimates and assumptions that affect the amounts reported in the Statements of Direct Revenues and Direct Operating Expenses. Actual results could be different from those estimates.
Revenue Recognition – Our revenue is composed of service, product sales, and other ancillary revenue. Product sales and services are generally sold based on fixed or determinable priced purchase orders or contracts with the customer and do not typically include the right of return. We recognize revenue from product sales when title passes to the customer, the customer assumes risks and rewards of ownership, and collectability is reasonably assured. Service and other revenue is recognized when the services are provided in accordance with the respective commercial agreement and collectability is reasonably assured.
Direct Operating Expenses – Direct operating expenses are recognized when incurred and consist of the direct expenses of the Business. Direct operating expenses include the cost of products (namely proppants, cement, chemicals, and other additives,) labor, equipment maintenance, transportation, fuel costs, and equipment and facilities directly related to the business. Depreciation and amortization expense included in the direct operating expenses financial statement line item above is $62.2 million, $279.6 million, and $314.7 million for the period January 1, 2016 through December 30, 2016, and the years ended 2015 and 2014, respectively.
Selling, General and Administrative Expenses – Selling, General, and Administrative expenses are recognized when incurred and consist of finance, marketing, engineering and administrative support function costs directly related to the business, and other income and expense. Depreciation and amortization expense included in the selling, general and administrative financial statement line item above is $0.9 million, $2.1 million, and $3.2 million for the period January, 1 2016 through December 30, 2016, and the years ended 2015 and 2014, respectively.
F-61
Table of Contents
Index to Financial Statements
BAKER HUGHES NORTH AMERICA LAND PRESSURE PUMPING BUSINESS
NOTES TO COMBINED ABBREVIATED FINANCIAL STATEMENTS
Note 3. RESTRUCTURING CHARGES (UNAUDITED)
During 2016 and 2015 amidst the prolonged downturn in the North America and Global energy industry, BHI recognized restructuring charges for costs associated with workforce reductions, contract terminations, facility closures and impairments related to the permanent removal from service and disposal of excess machinery and equipment. As a result of the downturn in the industry in 2015 and its impact on the business outlook, BHI took actions to restructure and adjust operations and cost structures to reflect current and expected activity levels. During the second quarter of 2016, to address ongoing industry challenges, BHI took additional actions to reduce costs, simplify the organization, refine and rationalize the operating strategy and adjust their capacity to meet expected levels of future demand. The decision to record the respective restructuring charges were that of BHI and not that of the individual product lines and any payments associated with the restructuring will be paid by BHI. BJ Services, Inc. did not assume any of the respective liabilities associated with BHI’s restructuring. Certain of the restructuring activities were associated with the North American operations but not directly attributable to the operations of the historical assets that were ultimately contributed to BJ Services. Restructuring charges associated with the North American operations of $1,049.3 million, $205.1 million and $0.0 million during the period January 1, 2016 through December 30, 2016 and for the year ended December 31, 2015 and 2014, respectively.
While these restructuring costs were associated with the North America Land Pressure Pumping business, they are not included in the combined abbreviated Financial Statements because they are not by definition direct operating expenses associated with the revenue generating activity of the business.
The restructuring charges associated with the North America Pressure Pumping business are as summarized below:
| For the year ended | ||||||||
| 2016 | 2015 | |||||||
| Restructuring Charges | (in millions) | |||||||
| Workforce reductions |
$ | 44.7 | $ | 13.3 | ||||
| Contract terminations |
1.8 | 58.2 | ||||||
| Impairment of buildings and improvements |
101.2 | 133.6 | ||||||
| Impairment of machinery and equipment |
901.6 | — | ||||||
|
|
|
|
|
|||||
| Total restructuring charges |
$ | 1,049.3 | $ | 205.1 | ||||
|
|
|
|
|
|||||
Note 4. SUBSEQUENT EVENTS
The Business has evaluated subsequent events through April 3, 2017, and has concluded that no events need to be reported in relation to this period.
F-62
Table of Contents
Index to Financial Statements
BJ Services, Inc.
UNAUDITED PRO FORMA CONDENSED FINANCIAL STATEMENTS
Introduction
The following unaudited pro forma condensed financial statements of BJ Services, Inc. (the “Company” or the “Registrant”) as of and for the year ended December 31, 2016, are derived from the historical financial statements of BJ Service, LLC and our Predecessor set forth elsewhere in this prospectus and are qualified in their entirety by reference to such historical financial statements and related notes contained therein. These unaudited pro forma condensed financial statements have been prepared to reflect our formation, certain business combinations, the initial public offering and related transactions.
These unaudited pro forma condensed financial statements include the following adjustments: (a) changes to equity and cash accounts as a result of the offering of common stock to the public, (b) the issuance of common stock to the Existing Owners and an estimate of the effects associated with the Tax Receivable Agreement we will enter into as part of the reorganization (the exchange will be recorded at historical cost as it is considered to be a reorganization of entities under common control), (c) adjustments associated with the change in tax status to a corporation, and (d) the purchase accounting adjustments in connection with the Allied Oil and Gas Houlding, LLC (“Allied Oil and Gas”) and BH N.A. PP acquisitions (as defined elsewhere in this prospectus) that occurred during the year ended December 31, 2016. The Allied Oil and Gas and BH N.A. PP acquisitions were accounted for as business combinations using the acquisition method of accounting. Accordingly, the preliminary purchase price (as adjusted at closing) was allocated to the assets acquired and liabilities assumed based upon management’s preliminary estimates of fair value. The determination of fair value is dependent upon valuations as of the acquisition date and the final adjustments to the purchase price, which when they occur may result in an adjustment to the value of the acquired assets reflected in the unaudited pro forma condensed financial statements. Any such adjustments may be material.
The unaudited pro forma condensed balance sheets and the unaudited pro forma condensed statements of operations were derived by adjusting the historical unaudited and audited financial statements of BJS LLC and our Predecessor. The adjustments are based upon currently available information and certain estimates and assumptions. Actual effects of the transactions may differ from the pro forma adjustments. Management believes, however, that the assumptions provide a reasonable basis for presenting the significant effects of the transactions as contemplated and that the pro forma adjustments are factually supportable and give appropriate effect to those assumptions and are properly applied in the unaudited pro forma financial data.
The pro forma adjustments have been prepared as if the offering and the related transactions had taken place on March 31, 2017, in the case of the unaudited pro forma condensed balance sheet as of March 31, 2017, and as if the offering and the related transactions, along with the Allied Oil and Gas and BH N.A. PP acquisitions, had taken place on January 1, 2016, in the case of the unaudited pro forma condensed statements of operations. The unaudited pro forma condensed financial statements have been prepared on the assumption that the Company will be treated as a corporation for federal income tax purposes. The unaudited pro forma condensed financial statements should be read in conjunction with the notes accompanying such unaudited pro forma financial statements and with the historical unaudited and audited financial statements and related notes, as well as “Use of Proceeds” and “Management’s Discussion and Analysis of Financial Condition and Results of Operations,” each included elsewhere in this prospectus.
The unaudited pro forma condensed financial statements presented does not assume the underwriters exercise their option to purchase any additional shares of common stock from us. See
F-63
Table of Contents
Index to Financial Statements
“Use of Proceeds” to see how certain aspects of the offering would be affected by an initial public offering price per share of common stock at higher or lower prices than indicated on the front cover of this prospectus.
The unaudited pro forma condensed statements of operations exclude certain transaction costs, such as costs associated with this offering that are not capitalized as part of this offering. The unaudited pro forma condensed financial statements are presented for illustrative purposes only and do not purport to indicate the financial condition or results of operations of future periods or the financial condition or results of operations that actually would have been realized had the offering of common stock to the public, the issuance of common stock to the Existing Owners, the change in tax status to a corporation or the Allied Oil and Gas and BH N.A. PP acquisitions occurred on the dates or for the periods presented. The unaudited pro forma condensed financial statements are subject to certain risks and uncertainties that could cause actual results to differ materially from those anticipated. See “Risk Factors.”
F-64
Table of Contents
Index to Financial Statements
BJ Services, Inc.
UNAUDITED PRO FORMA CONDENSED BALANCE SHEET
AS OF MARCH 31, 2017
(in thousands)
| BJ Services, LLC(a) |
Corporate Reorganization Adjustments |
Offering Adjustments |
Pro Forma | |||||||||||||
| Assets |
||||||||||||||||
| Current assets |
||||||||||||||||
| Cash and cash equivalents |
$ | 135,298 | $ | $ | (d) | $ | ||||||||||
| Accounts receivable, net |
160,956 | |||||||||||||||
| Inventories, net |
67,248 | |||||||||||||||
| Other assets |
12,721 | |||||||||||||||
|
|
|
|
|
|
|
|
|
|||||||||
| Total current assets |
376,223 | |||||||||||||||
| Property and equipment, net |
638,311 | |||||||||||||||
| Deferred tax asset |
— | (b) | ||||||||||||||
| Intangible assets, net |
29,756 | |||||||||||||||
| Other assets |
689 | (e) | ||||||||||||||
|
|
|
|
|
|
|
|
|
|||||||||
| Total assets |
$ | 1,044,979 | $ | $ | $ | |||||||||||
|
|
|
|
|
|
|
|
|
|||||||||
| Liabilities and Members’ / Stockholders’ Equity |
||||||||||||||||
| Current liabilities |
||||||||||||||||
| Accounts payable |
$ | 193,383 | $ | $ | $ | |||||||||||
| Notes payable |
24,792 | — | — | |||||||||||||
| Accrued expenses and other liabilities |
7,701 | |||||||||||||||
|
|
|
|
|
|
|
|
|
|||||||||
| Total current liabilities |
225,876 | |||||||||||||||
| Long-term liabilities, less current maturities |
||||||||||||||||
| Other long-term liabilities |
3,696 | |||||||||||||||
| Liability under tax receivable agreement |
— | (b) | ||||||||||||||
|
|
|
|
|
|
|
|
|
|||||||||
| Total long-term liabilities |
3,696 | |||||||||||||||
|
|
|
|
|
|
|
|
|
|||||||||
| Members’ Equity |
229,572 | (c) | ||||||||||||||
| Class A common stock |
— | (f) | ||||||||||||||
| Class B common stock |
— | (f) | ||||||||||||||
| Preferred stock |
— | (f) | ||||||||||||||
| Additional paid in capital |
— | (b)(c) | (f) | |||||||||||||
|
|
|
|
|
|
|
|
|
|||||||||
| Net members’ / stockholders’ equity |
815,407 | |||||||||||||||
| Non-controlling interest |
— | (b)(c) | ||||||||||||||
|
|
|
|
|
|
|
|
|
|||||||||
| Total members’ / stockholders’ equity |
815,407 | |||||||||||||||
|
|
|
|
|
|
|
|
|
|||||||||
| Total liabilities and members’ / stockholders’ equity |
$ | 1,044,979 | $ | — | $ | |||||||||||
|
|
|
|
|
|
|
|
|
|||||||||
The accompanying notes are an integral part of these unaudited pro forma condensed financial statements.
F-65
Table of Contents
Index to Financial Statements
BJ Services, Inc.
UNAUDITED PRO FORMA CONDENSED STATEMENT OF OPERATIONS
FOR THE THREE MONTHS ENDED MARCH 31, 2017
(in thousands)
| BJ Services, LLC(a) |
Financing and Offering Adjustments |
Pro Forma |
||||||||||
| Revenue |
$ | 180,072 | $ | |||||||||
| Operating costs and expenses |
||||||||||||
| Cost of revenue |
223,667 | |||||||||||
| Selling, general and administrative |
20,813 | |||||||||||
|
|
|
|
|
|
|
|||||||
| Operating loss |
(64,408 | ) | ||||||||||
|
|
|
|
|
|
|
|||||||
| Other income (expense) |
||||||||||||
| Interest income, net |
106 | |||||||||||
| Other (expense), net |
(108 | ) | ||||||||||
|
|
|
|
|
|
|
|||||||
| Loss before income taxes |
(64,410 | ) | ||||||||||
| Income tax provision (benefit) |
1,004 | |||||||||||
|
|
|
|
|
|
|
|||||||
| Net loss |
$ | (63,406 | ) | $ | $ | |||||||
|
|
|
|
|
|
|
|||||||
The accompanying notes are an integral part of these unaudited pro forma condensed financial statements.
F-66
Table of Contents
Index to Financial Statements
BJ Services, Inc.
UNAUDITED PRO FORMA CONDENSED STATEMENT OF OPERATIONS
FOR THE YEAR ENDED DECEMBER 31, 2016
(in thousands)
| Predecessor(a) | Allied Oil and Gas(b) |
BH N.A. PP(c) | Acquisition Related Adjustments |
Financing and Offering Adjustments |
Pro Forma |
|||||||||||||||||||
| Revenue |
$ | 36,985 | $ | 9,182 | $ | 231,037 | $ | |||||||||||||||||
| Operating costs and expenses |
||||||||||||||||||||||||
| Cost of revenues |
51,923 | 15,011 | 515,492 | $ | 37,943 | (d) | ||||||||||||||||||
| Selling, general and administrative |
20,573 | 2,142 | (628 | ) | (8,109 | )(e)(f) | ||||||||||||||||||
| Bargain purchase gain |
(34,180 | ) | — | — | — | — | ||||||||||||||||||
| Other |
668 | 1,587 | * | — | — | — | ||||||||||||||||||
|
|
|
|
|
|
|
|
|
|
|
|
|
|||||||||||||
| Operating loss |
(1,999 | ) | (9,558 | ) | (283,827 | ) | (29,834 | ) | ||||||||||||||||
| Other income (expense) |
||||||||||||||||||||||||
| Interest expense, net |
(97 | ) | (1,495 | ) | — | — | — | |||||||||||||||||
| Other income (expense), net |
(183 | ) | — | — | — | — | ||||||||||||||||||
|
|
|
|
|
|
|
|
|
|
|
|
|
|||||||||||||
| Loss before income taxes |
(2,279 | ) | (11,053 | ) | (283,827 | ) | (29,834 | ) | ||||||||||||||||
|
|
|
|
|
|
|
|
|
|
|
|
|
|||||||||||||
| Income tax provision (benefit) |
— | — | — | — | 510 | (g) | ||||||||||||||||||
|
|
|
|
|
|
|
|
|
|
|
|
|
|||||||||||||
| Net loss |
$ | (2,279 | ) | $ | (11,053 | ) | $ | (283,827 | ) | $ | (29,834 | ) | $ | — | $ | |||||||||
|
|
|
|
|
|
|
|
|
|
|
|
|
|||||||||||||
| * | Includes $1.5 million in property and equipment impairment. |
The accompanying notes are an integral part of these unaudited pro forma condensed financial statements.
F-67
Table of Contents
Index to Financial Statements
BJ Services, Inc.
NOTES TO UNAUDITED PRO FORMA CONDENSED FINANCIAL STATEMENTS
1. Basis of presentation, transaction and this offering
The historical financial information is derived from the historical unaudited and audited financial statements of BJS LLC and our Predecessor. The pro forma adjustments have been prepared as if the offering of common stock and the related transactions described in this prospectus had taken place on March 31, 2017, in the case of the unaudited pro forma condensed balance sheet as of March 31, 2017, and as if the offering of common stock and the related transactions along with the Allied Oil and Gas and BH N.A. PP acquisitions had taken place as of January 1, 2016, in the case of the unaudited pro forma condensed statements of operations. The adjustments are based on currently available information and certain estimates and assumptions and therefore the actual effects of these transactions will differ from the pro forma adjustments.
As a result of presenting combined abbreviated statements of revenues and direct operating expenses for BH N.A. PP business, the pro forma condensed financial statements are not indicative of the financial condition or results of operations of the Issuer following this offering because of the changes in the business and the omission of various operating expenses.
2. Unaudited pro forma condensed balance sheet adjustments and assumptions
(a) Represents the historical unaudited or audited consolidated balance sheet of BJS LLC or our Predecessor included elsewhere in this prospectus.
(b) Represents the estimated income tax effects of the Company becoming a taxable corporation under the U.S. Internal Revenue Code of 1986 in connection with the transaction described under “Corporate Reorganization” and entering into the TRA by recording the following adjustments:
| • | a deferred tax asset of for the estimated income tax effects of the adjustment to tax basis resulting from the purchase by the Company of Units prior to or in connection with this offering, |
| • | the recognition of a tax receivable agreement liability, representing 85% of the estimated net cash savings, if any, that the Registrant actually realizes (or is deemed to realize in certain circumstances) in periods after the Offering, and |
| • | an adjustment to Stockholders’ equity of which is an amount equal to the difference between the increase in Deferred Tax Assets and the recognition of Tax Receivable Agreement Liability due to the Existing Owners. |
(c) Reflects the pro forma adjustments to net parent investment and to non-controlling interest to give effect to the Corporate Reorganization.
(d) Represents the net adjustment to cash and cash equivalents related to the sources and uses of proceeds of the offering at an assumed initial public offering price of $ per share (the midpoint of the price range set forth on the cover page of this prospectus), calculated as follows (in thousands):
| Three Months Ended March 31, 2017 |
||||
| Proceeds from the offering |
$ | — | ||
| Offering related costs |
||||
| Pro forma net adjustment to cash and cash equivalents |
$ | — | ||
|
|
|
|||
F-68
Table of Contents
Index to Financial Statements
BJ Services, Inc.
NOTES TO UNAUDITED PRO FORMA CONDENSED FINANCIAL STATEMENTS
(e) Reflects the capitalization of costs directly attributable to the offering. This will be reclassified as stockholders’ equity in connection with the consummation of this offering.
(f) Reflects the proceeds to the Company of $ thousand from the issuance and sale of million shares of Class A common stock in the offering at an assumed initial public offering price of $ per share (the midpoint of the price range set forth on the cover page of this prospectus), and after deducting estimated underwriting discounts and commission and estimated offering expense of approximately $ thousand, in the aggregate.
3. Unaudited pro forma condensed statement of operations adjustments and assumptions
(a) Reflects the historical unaudited or audited consolidated statement of operations of BJS LLC or our Predecessor included elsewhere in this prospectus.
(b) Reflects the historical audited consolidated statement of operations of Allied Oil and Gas for the period from January 1, 2016 through April 28, 2016, included elsewhere in this prospectus.
(c) Reflects the historical audited combined statement of direct revenues and direct operating expenses of BH N.A. PP for the period from January 1, 2016 through December 30, 2016 included elsewhere in this prospectus.
(d) Reflects the estimated pro forma adjustment to depreciation and amortization due to the fair value adjustments to the property and equipment acquired in the Allied Oil and Gas Holdings, LLC and BH N.A. PP acquisitions (in thousands). See the notes to the the historical audited financial statements of BJS LLC, included elsewhere in this prospectus, for a discussion of the useful lives of the Company’s property, equipment and intangible assets.
| Year Ended December 31, 2016 |
||||
| Pro Forma Depreciation—Allied Oil and Gas Acquisition |
$ | 1,685 | ||
| Pro Forma Depreciation—BH N.A. PP Acquisition |
97,721 | |||
| Pro Forma Amortization—Allied Oil and Gas Acquisition |
60 | |||
| Pro Forma Amortization—BH N.A. PP Acquisition |
2,826 | |||
| Less: |
||||
| Historical Depreciation and Amortization—Allied Oil and Gas Acquisition |
(2,103 | ) | ||
| Historical Depreciation and Amortization—BH N.A. PP Acquisition |
(62,246 | ) | ||
|
|
|
|||
| Pro Forma net adjustment to depreciation and amortization |
$ | 37,943 | ||
|
|
|
|||
(e) Reflects the elimination of transaction costs of $7,119,000 related to the Allied Oil and Gas and BA N.A. PP acquisitions.
F-69
Table of Contents
Index to Financial Statements
BJ Services, Inc.
NOTES TO UNAUDITED PRO FORMA CONDENSED FINANCIAL STATEMENTS
(f) Reflects the elimination of the historical depreciation and amortization that was included in the operating expenses in the selling, general and administrative financial statement line item in Allied Oil and Gas historical financial statements for the period from 1/1/2016 through 4/28/2016 and in BH N.A. PP historical financial statements for the period from 1/1/2016 through 12/30/2016 (in thousands). Pro Forma Depreciation and Amortization is added to depreciation expense financial statement line item in the note above:
| Year Ended December 31, 2016 |
||||
| Historical Depreciation and Amortization—Allied Oil and Gas Acquisition |
(76 | ) | ||
| Historical Depreciation and Amortization—BH N.A. PP Acquisition |
(914 | ) | ||
|
|
|
|||
| Pro Forma net adjustment to cost of revenues earned |
(990 | ) | ||
|
|
|
|||
(g) Reflects the tax effect of pro forma adjustments and adjustment related to the reorganization transaction described in “Corporate Reorganization” whereby we will become a tax paying corporation. Tax effects are limited to the State of Texas (less than 1% of modified pre-tax earnings) and excludes the tax benefit of U.S. federal, state and Canadian pretax book losses subject to valuation allowance.
F-70
Table of Contents
Index to Financial Statements
GLOSSARY OF OIL AND NATURAL GAS TERMS
API Q2. The American Petroleum Institute Specification Q2 Certification, an advanced industry certification standard for oil and natural gas service companies.
Bcf. Billion cubic feet.
Blowout. An uncontrolled flow of reservoir fluids into the wellbore, and sometimes catastrophically to the surface. A blowout may consist of salt water, oil, natural gas or a mixture of these. Blowouts can occur in all types of exploration and production operations, not just during drilling operations. If reservoir fluids flow into another formation and do not flow to the surface, the result is called an underground blowout. If the well experiencing a blowout has significant open-hole intervals, it is possible that the well will bridge over (or seal itself with rock fragments from collapsing formations) down-hole and intervention efforts will be averted.
boepd. Barrel of oil equivalent per day.
Cementing. To use pressure pumping equipment to deliver a slurry of liquid cement that is pumped down a well between the casing and the borehole. Cementing provides isolation between fluid zones behind the casing to minimize potential damage to hydrocarbon bearing formations or the freshwater aquifers, and provides structural integrity for the casing by securing it to the earth.
Completion. A generic term used to describe the assembly of down-hole tubulars and equipment required to enable safe and efficient production from an oil or gas well. The point at which the completion process begins may depend on the type and design of the well.
Downhole. Pertaining to or in the wellbore (as opposed to being on the surface).
Downhole motor. A drilling motor located in the drill string above the drilling bit powered by the flow of drilling mud. Down-hole motors are used to increase the speed and efficiency of the drill bit or can be used to steer the bit in directional drilling operations. Drilling motors have become very popular because of horizontal and directional drilling applications and the increase of day rates for drilling rigs.
Drilling rig. The machine used to drill a wellbore.
Extended Reach. A lateral well in excess of 8,000 feet.
Fleet. All of the fracturing units, other equipment and vehicles necessary to perform fracturing jobs.
Flowback. The process of allowing fluids to flow from the well following a treatment, either in preparation for a subsequent phase of treatment or in preparation for cleanup and returning the well to production.
Frac sand. A proppant used in the completion and re-completion of unconventional oil and natural gas wells to stimulate and maintain oil and natural gas production through the process of hydraulic fracturing.
Frac stage. A specified portion of the section of the wellbore that is being stimulated through hydraulic fracturing techniques. The average number of frac stages per horizontal well has increased dramatically as hydraulic fracturing has become standard industry practice and as the lateral lengths of horizontal wells has increased.
Fracturing fleet. A fracturing fleet consists of hydraulic horsepower (HHP) fracturing pumps, blending equipment (to mix the water, chemicals and sand), a data van (equipped with equipment controls, data monitoring, and satellite communications) and various transport and storage equipment.
A-1
Table of Contents
Index to Financial Statements
Horizontal drilling. A subset of the more general term “directional drilling,” used where the departure of the wellbore from vertical exceeds about 80 degrees. Note that some horizontal wells are designed such that after reaching true 90-degree horizontal, the wellbore may actually start drilling upward. In such cases, the angle past 90 degrees is continued, as in 95 degrees, rather than reporting it as deviation from vertical, which would then be 85 degrees. Because a horizontal well typically penetrates a greater length of the reservoir, it can offer significant production improvement over a vertical well.
Hydraulic fracturing. A stimulation treatment routinely performed on oil and natural gas wells in low permeability reservoirs. Specially engineered fluids are pumped at high pressure and rate into the reservoir interval to be treated, causing a vertical fracture to open. The wings of the fracture extend away from the wellbore in opposing directions according to the natural stresses within the formation. Proppant, such as grains of sand of a particular size, is mixed with the treatment fluid to keep the fracture open when the treatment is complete. Hydraulic fracturing creates high-conductivity communication with a large area of formation and bypasses any damage that may exist in the near-wellbore area.
Hydrocarbon. A naturally occurring organic compound comprising hydrogen and carbon. Hydrocarbons can be as simple as methane, but many are highly complex molecules, and can occur as gases, liquids or solids. Petroleum is a complex mixture of hydrocarbons. The most common hydrocarbons are natural gas, oil and coal.
MMBtu. One million British Thermal Units.
Natural gas liquids. Components of natural gas that are liquid at surface in field facilities or in gas-processing plants. Natural gas liquids can be classified according to their vapor pressures as low (condensate), intermediate (natural gasoline) and high (liquefied petroleum gas) vapor pressure.
Plugging. The process of permanently closing oil and natural gas wells no longer capable of producing in economic quantities. Plugging work can be performed with a well servicing rig along with wireline and cementing equipment; however, this service is typically provided by companies that specialize in plugging work.
Pressure pumping. Services that include the pumping of liquids under pressure.
Producing formation. An underground rock formation from which oil, natural gas or water is produced. Any porous rock will contain fluids of some sort, and all rocks at considerable distance below the Earth’s surface will initially be under pressure, often related to the hydrostatic column of ground waters above the reservoir. To produce, rocks must also have permeability, or the capacity to permit fluids to flow through them.
Proppant. Sized particles mixed with fracturing fluid to hold fractures open after a hydraulic fracturing treatment. In addition to naturally occurring sand grains, man-made or specially engineered proppants, such as resin-coated sand or high-strength ceramic materials like sintered bauxite, may also be used. Proppant materials are carefully sorted for size and sphericity to provide an efficient conduit for production of fluid from the reservoir to the wellbore.
Shale. A fine-grained, fissile, sedimentary rock formed by consolidation of clay- and silt-sized particles into thin, relatively impermeable layers.
Stimulation. A treatment performed to restore or enhance the productivity of a well. Stimulation treatments fall into two main groups, hydraulic fracturing treatments and matrix treatments. Fracturing
A-2
Table of Contents
Index to Financial Statements
treatments are performed above the fracture pressure of the reservoir formation and create a highly conductive flow path between the reservoir and the wellbore. Matrix treatments are performed below the reservoir fracture pressure and generally are designed to restore the natural permeability of the reservoir following damage to the near-wellbore area. Stimulation in shale gas reservoirs typically takes the form of hydraulic fracturing treatments.
Tcfe. Trillion cubic feet equivalents.
TVD. The true vertical depth of a well, measuring the vertical distance from a point in the well (usually the current or final depth) to a point at the surface.
Unconventional resource. An umbrella term for oil and natural gas that is produced by means that do not meet the criteria for conventional production. What has qualified as “unconventional” at any particular time is a complex function of resource characteristics, the available exploration and production technologies, the economic environment, and the scale, frequency and duration of production from the resource. Perceptions of these factors inevitably change over time and often differ among users of the term. At present, the term is used in reference to oil and natural gas resources whose porosity, permeability, fluid trapping mechanism, or other characteristics differ from conventional sandstone and carbonate reservoirs. Coalbed methane, gas hydrates, shale gas, fractured reservoirs and tight gas sands are considered unconventional resources.
Utilization. The percentage of our fleet in use by our clients at the applicable time or for the applicable period of determination.
Wellbore. The physical conduit from surface into the hydrocarbon reservoir.
WTI. West Texas Intermediate crude oil.
A-3
Table of Contents
Index to Financial Statements
BJ Services, Inc.
Class A Shares
Prospectus
, 2017
| Goldman Sachs & Co. LLC | Morgan Stanley | Credit Suisse |
Through and including , 2017 (the 25th day after the date of this prospectus), all dealers effecting transactions in these securities, whether or not participating in this offering, may be required to deliver a prospectus. This is in addition to a dealer’s obligation to deliver a prospectus when acting as an underwriter and with respect to an unsold allotment or subscription.
Table of Contents
Index to Financial Statements
Part II
Information Not Required in Prospectus
Item 13. Other Expenses of Issuance and Distribution
Set forth below are the expenses (other than underwriting discounts and the structuring fee) expected to be incurred in connection with the issuance and distribution of the securities registered hereby. With the exception of the SEC registration fee, the FINRA filing fee and NYSE listing fee, the amounts set forth below are estimates.
| SEC registration fee |
$ | 11,590 | ||
| FINRA filing fee |
15,500 | |||
| NYSE listing fee |
* | |||
| Printing and engraving expenses |
* | |||
| Fees and expenses of legal counsel |
* | |||
| Accounting fees and expenses |
* | |||
| Transfer agent and registrar fees |
* | |||
| Miscellaneous |
* | |||
|
|
|
|||
| Total |
$ | * | ||
|
|
|
| * | To be filed by amendment. |
Item 14. Indemnification of Directors and Officers
We are a Delaware corporation. Our amended and restated certificate of incorporation will provide that a director will not be liable to the corporation or its stockholders for monetary damages to the fullest extent permitted by the DGCL. In addition, if the DGCL is amended to authorize the further elimination or limitation of the liability of directors, then the liability of a director of the corporation, in addition to the limitation on personal liability provided for in our amended and restated certificate of incorporation, will be limited to the fullest extent permitted by the amended DGCL. Our amended and restated bylaws will provide that the corporation will indemnify, and advance expenses to, any officer or director to the fullest extent authorized by the DGCL.
Section 145 of the DGCL provides that a corporation may indemnify directors and officers as well as other employees and individuals against expenses, including attorneys’ fees, judgments, fines and amounts paid in settlement in connection with specified actions, suits and proceedings whether civil, criminal, administrative, or investigative, other than a derivative action by or in the right of the corporation, if they acted in good faith and in a manner they reasonably believed to be in or not opposed to the best interests of the corporation and, with respect to any criminal action or proceeding, had no reasonable cause to believe their conduct was unlawful. A similar standard is applicable in the case of derivative actions, except that indemnification extends only to expenses, including attorneys’ fees, incurred in connection with the defense or settlement of such action and the statute requires court approval before there can be any indemnification where the person seeking indemnification has been found liable to the corporation. The statute provides that it is not exclusive of other indemnification that may be granted by a corporation’s certificate of incorporation, bylaws, disinterested director vote, stockholder vote, agreement or otherwise.
Our amended and restated certificate of incorporation will also contain indemnification rights for our directors and our officers. Specifically, our amended and restated certificate of incorporation will provide that we shall indemnify our officers and directors to the fullest extent authorized by the DGCL. Further, we may maintain insurance on behalf of our officers and directors against expense, liability or loss asserted incurred by them in their capacities as officers and directors.
II-1
Table of Contents
Index to Financial Statements
We have obtained directors’ and officers’ insurance to cover our directors, officers and some of our employees for certain liabilities.
We will enter into written indemnification agreements with our directors and executive officers. Under these proposed agreements, if an officer or director makes a claim of indemnification to us, either a majority of the independent directors or independent legal counsel selected by the independent directors must review the relevant facts and make a determination whether the officer or director has met the standards of conduct under Delaware law that would permit (under Delaware law) and require (under the indemnification agreement) us to indemnify the officer or director.
The underwriting agreement provides for indemnification by the underwriters of us and our officers and directors, and by us of the underwriters, for certain liabilities arising under the Securities Act or otherwise in connection with this offering.
Item 15. Recent Sales of Unregistered Securities
During the past three years, we have issued unregistered securities to a limited number of persons. None of these transactions involved any underwriters, underwriting discounts or commissions or any public offering, and we believe that each of these transactions was exempt from the registration requirements pursuant to Section 4(a)(2) of the Securities Act, Regulation D or Regulation S promulgated thereunder or Rule 701 of the Securities Act.
Item 16. Exhibits
The following documents are filed as exhibits to this registration statement:
| Exhibit |
Description | |
| 1.1* | Form of Underwriting Agreement | |
| 2.1** | Contribution Agreement, dated as of November 29, 2016, by and among Baker Hughes Oilfield Operations LLC, Allied Completions Holdings, LLC, BJ Services, LLC and Allied Energy JV Contribution, LLC | |
| 3.1* | Form of Amended and Restated Certificate of Incorporation of BJ Services, Inc. | |
| 3.2* | Form of Amended and Restated Bylaws of BJ Services, Inc. | |
| 4.1 | Specimen Class A Common Stock Certificate | |
| 4.2* | Form of Registration Rights Agreement | |
| 5.1 | Form of Opinion of Latham & Watkins LLP as to the legality of the securities being registered | |
| 10.1* | Form of Indemnification Agreement | |
| 10.2* | Form of Tax Receivable Agreement | |
| 10.3* | Form of Third Amended and Restated Limited Liability Company Agreement of BJ Services, LLC | |
| 10.4* | Form of Shareholders’ Agreement | |
| 10.5 | Revolving Credit and Guaranty Agreement, dated as of May 30, 2017, by and among BJ Services, LLC, as the Borrower, JP Morgan Chase Bank, N.A., as Administrative Agent, Swing Line Lender, an L/C Issuer and Bookrunner, the Other Borrowers From Time to Time, the Guarantors From Time to Time, the Other Lenders, and JPMorgan Chase Bank, N.A. and Wells Fargo Bank, National Association, as joint lead arrangers and joint book managers | |
II-2
Table of Contents
Index to Financial Statements
| Exhibit |
Description | |
| 10.6 | Intellectual Property License Agreement, dated as of December 30, 2016, by and between BJ Services, LLC and Baker Hughes Incorporated | |
| 10.7 | Transition Services Agreement, dated as of December 30, 2016, by and between Baker Hughes Oilfield Operations, Inc. and BJ Services, LLC | |
| 10.8† | Employment Agreement, dated as of January 1, 2017, by and between BJ Services, LLC and Warren Zemlak | |
| 10.9† | Employment Agreement, dated as of January 16, 2017, by and between BJ Services, LLC and Evelyn Angelle | |
| 10.10† | Employment Agreement, dated as of December 31, 2016, by and between BJ Services, LLC and Caleb Barclay | |
| 10.11† | Agreement for Services as Independent Contractor, dated as of March 31, 2017, by and between BJ Services, LLC and Eric Snell | |
| 10.12† | Consulting Agreement, dated as of December 30, 2016, by and between BJ Services, LLC and Andrew Gould | |
| 10.13† | BJ Services, LLC Class A Unit Incentive Plan | |
| 10.14† | Form of BJ Services, LLC Class A Unit Incentive Plan Award Letter | |
| 10.15†* | 2017 Incentive Award Plan (and related form of award agreements) | |
| 21.1 | List of Subsidiaries of BJ Services, Inc. | |
| 23.1 | Consent of PricewaterhouseCoopers LLP | |
| 23.2 | Consent of PricewaterhouseCoopers LLP | |
| 23.3 | Consent of PricewaterhouseCoopers LLP | |
| 23.4 | Consent of Deloitte & Touche LLP | |
| 23.5 | Consent of Latham & Watkins LLP (contained in Exhibit 5.1) | |
| 24.1 | Powers of Attorney (contained on the signature page to this Registration Statement) | |
| * | To be filed by amendment. |
| ** | Schedules and exhibits have been omitted pursuant to Item 601(b)(2) of Regulation S-K. The registrant agrees to furnish supplementally a copy of the omitted schedules and exhibits to the SEC upon request. |
| † | Compensatory plan, contract or arrangement |
Item 17. Undertakings
The undersigned registrant hereby undertakes to provide to the underwriters at the closing specified in the underwriting agreement certificates in such denominations and registered in such names as required by the underwriters to permit prompt delivery to each purchaser.
Insofar as indemnification for liabilities arising under the Securities Act may be permitted to directors, officers and controlling persons of the registrant pursuant to the foregoing provisions, or otherwise, the registrant has been advised that in the opinion of the Securities and Exchange Commission such indemnification is against public policy as expressed in the Securities Act and is, therefore, unenforceable. In the event that a claim for indemnification against such liabilities (other than
II-3
Table of Contents
Index to Financial Statements
the payment by the registrant of expenses incurred or paid by a director, officer or controlling person of the registrant in the successful defense of any action, suit or proceeding) is asserted by such director, officer or controlling person in connection with the securities being registered, the registrant will, unless in the opinion of its counsel the matter has been settled by controlling precedent, submit to a court of appropriate jurisdiction the question whether such indemnification by it is against public policy as expressed in the Securities Act and will be governed by the final adjudication of such issue.
The undersigned registrant hereby undertakes that, for the purpose of determining liability under the Securities Act to any purchaser, each prospectus filed pursuant to Rule 424(b) as part of a registration statement relating to an offering, other than registration statements relying on Rule 430B or other than prospectuses filed in reliance on Rule 430A, shall be deemed to be part of and included in the registration statement as of the date it is first used after effectiveness. Provided, however, that no statement made in a registration statement or prospectus that is part of the registration statement or made in a document incorporated or deemed incorporated by reference into the registration statement or prospectus that is part of the registration statement will, as to a purchaser with a time of contract of sale prior to such first use, supersede or modify any statement that was made in the registration statement or prospectus that was part of the registration statement or made in any such document immediately prior to such date of first use.
The undersigned registrant hereby undertakes that, for the purpose of determining liability of the registrant under the Securities Act to any purchaser in the initial distribution of the securities, in a primary offering of securities of the undersigned registrant pursuant to this registration statement, regardless of the underwriting method used to sell the securities to the purchaser, if the securities are offered or sold to such purchaser by means of any of the following communications, the undersigned registrant will be a seller to the purchaser and will be considered to offer or sell such securities to such purchaser:
(1) Any preliminary prospectus or prospectus of the undersigned registrant relating to this offering required to be filed pursuant to Rule 424;
(2) Any free writing prospectus relating to this offering prepared by or on behalf of the undersigned registrant or used or referred to by the undersigned registrant;
(3) The portion of any other free writing prospectus relating to this offering containing material information about the undersigned registrant or its securities provided by or on behalf of the undersigned registrant; and
(4) Any other communication that is an offer in this offering made by the undersigned registrant to the purchaser.
The undersigned registrant hereby undertakes that,
(1) For purposes of determining any liability under the Securities Act, the information omitted from the form of prospectus filed as part of this registration statement in reliance upon Rule 430A and contained in a form of prospectus filed by the registrant pursuant to Rule 424(b)(1) or (4) or 497(h) under the Securities Act shall be deemed to be part of this registration statement as of the time it was declared effective.
(2) For the purpose of determining any liability under the Securities Act, each post-effective amendment that contains a form of prospectus shall be deemed to be a new registration statement relating to the securities offered therein, and the offering of such securities at that time shall be deemed to be the initial bona fide offering thereof.
II-4
Table of Contents
Index to Financial Statements
SIGNATURES
Pursuant to the requirements of the Securities Act of 1933, as amended, the registrant has duly caused this Registration Statement to be signed on its behalf by the undersigned, thereunto duly authorized, in the City of Houston, Texas, on July 14, 2017.
| BJ Services, Inc. | ||
| By: | /s/ Warren M. Zemlak | |
| Warren M. Zemlak | ||
| Chief Executive Officer | ||
Each person whose signature appears below appoints Warren Zemlak, Evelyn Angelle and John Bakht, and each of them, any of whom may act without the joinder of the other, as his or her true and lawful attorneys-in-fact and agents, with full power of substitution and re-substitution, for him or her and in his or her name, place and stead, in any and all capacities, to sign any and all amendments (including post-effective amendments) to this Registration Statement and any Registration Statement (including any amendment thereto) for this offering that is to be effective upon filing pursuant to Rule 462(b) under the Securities Act of 1933, as amended, and to file the same, with all exhibits thereto, and all other documents in connection therewith, with the Securities and Exchange Commission, granting unto said attorneys-in-fact and agents, and each of them, full power and authority to do and perform each and every act and thing requisite and necessary to be done in connection therewith, as fully to all intents and purposes as he or she might or could do in person, hereby ratifying and confirming all that said attorneys-in-fact and agents, or any of them, or their or his or her substitute and substitutes, may lawfully do or cause to be done by virtue hereof.
Pursuant to the requirements of the Securities Act of 1933, as amended this Registration Statement has been signed by the following persons in the capacities indicated on July 14, 2017.
| Signature |
Title | |||
| /s/ Warren M. Zemlak | Director, President and Chief Executive Officer (Principal Executive Officer) | |||
| Warren M. Zemlak | ||||
| /s/ Evelyn M. Angelle | Executive Vice President and Chief Financial Officer (Principal Financial Officer and Principal Accounting Officer) | |||
| Evelyn M. Angelle | ||||
| /s/ Andrew F. J. Gould | Director | |||
| Andrew F. J. Gould | ||||
| /s/ Scott L. Lebovitz | Director | |||
| Scott L. Lebovitz | ||||
| /s/ Charles S. Leykum | Director | |||
| Charles S. Leykum | ||||
| /s/ William D. Marsh | Director | |||
| William D. Marsh | ||||
II-5
Table of Contents
Index to Financial Statements
| Signature |
Title | |||
| /s/ Derek Mathieson | Director | |||
| Derek Mathieson | ||||
| /s/ James W. Stewart | Director | |||
| James W. Stewart | ||||
| /s/ Brian Worrell | Director | |||
| Brian Worrell | ||||
| /s/ Dorothy M. Ables | Director | |||
| Dorothy M. Ables | ||||
II-6
Table of Contents
Index to Financial Statements
EXHIBIT INDEX
| Exhibit |
Description | |
| 1.1* | Form of Underwriting Agreement | |
| 2.1** | Contribution Agreement, dated as of November 29, 2016, by and among Baker Hughes Oilfield Operations LLC, Allied Completions Holdings, LLC, BJ Services, LLC and Allied Energy JV Contribution, LLC | |
| 3.1* | Form of Amended and Restated Certificate of Incorporation of BJ Services, Inc. | |
| 3.2* | Form of Amended and Restated Bylaws of BJ Services, Inc. | |
| 4.1 | Specimen Class A Common Stock Certificate | |
| 4.2* | Form of Registration Rights Agreement | |
| 5.1 | Form of Opinion of Latham & Watkins LLP as to the legality of the securities being registered | |
| 10.1* | Form of Indemnification Agreement | |
| 10.2* | Form of Tax Receivable Agreement | |
| 10.3* | Form of Third Amended and Restated Limited Liability Company Agreement of BJ Services, LLC | |
| 10.4* | Form of Shareholders’ Agreement | |
| 10.5 | Revolving Credit and Guaranty Agreement, dated as of May 30, 2017, by and among BJ Services, LLC, as the Borrower, JP Morgan Chase Bank, N.A., as Administrative Agent, Swing Line Lender, an L/C Issuer and Bookrunner, the Other Borrowers From Time to Time, the Guarantors From Time to Time, the Other Lenders, and JPMorgan Chase Bank, N.A. and Wells Fargo Bank, National Association, as joint lead arrangers and joint book managers. | |
| 10.6 | Intellectual Property License Agreement , dated as of December 30, 2016, by and between BJ Services, LLC and Baker Hughes Incorporated | |
| 10.7 | Transition Services Agreement, dated as of December 30, 2016, by and between Baker Hughes Oilfield Operations, Inc. and BJ Services, LLC | |
| 10.8† | Employment Agreement, dated as of January 1, 2017, by and between BJ Services, LLC and Warren Zemlak | |
| 10.9† | Employment Agreement, dated as of January 16, 2017, by and between BJ Services, LLC and Evelyn Angelle | |
| 10.10† | Employment Agreement, dated as of December 31, 2016, by and between BJ Services, LLC and Caleb Barclay | |
| 10.11† | Agreement for Services as Independent Contractor, dated as of March 31, 2017, by and between BJ Services, LLC and Eric Snell | |
| 10.12† | Consulting Agreement, dated as of December 30, 2016, by and between BJ Services, LLC and Andrew Gould | |
| 10.13† | BJ Services, LLC Class A Unit Incentive Plan | |
| 10.14† | Form of BJ Services, LLC Class A Unit Incentive Plan Award Letter | |
| 10.15†* | 2017 Incentive Award Plan (and related form of award agreements) | |
| 21.1 | List of Subsidiaries of BJ Services, Inc. | |
| 23.1 | Consent of PricewaterhouseCoopers LLP | |
Table of Contents
Index to Financial Statements
| Exhibit |
Description | |
| 23.2 | Consent of PricewaterhouseCoopers LLP | |
| 23.3 | Consent of PricewaterhouseCoopers LLP | |
| 23.4 | Consent of Deloitte & Touche LLP | |
| 23.5 | Consent of Latham & Watkins LLP (contained in Exhibit 5.1) | |
| 24.1 | Powers of Attorney (contained on the signature page to this Registration Statement) | |
| * | To be filed by amendment. |
| ** | Schedules and exhibits have been omitted pursuant to Item 601(b)(2) of Regulation S-K. The registrant agrees to furnish supplementally a copy of the omitted schedules and exhibits to the SEC upon request. |
| † | Compensatory plan, contract or arrangement |