Attached files
| file | filename |
|---|---|
| EX-32.2 - EXHIBIT 32.2 Q417 - Barnes & Noble Education, Inc. | bned-ex322_20170429xq417.htm |
| EX-32.1 - EXHIBIT 32.1 Q417 - Barnes & Noble Education, Inc. | bned-ex321_20170429xq417.htm |
| EX-31.2 - EXHIBIT 31.2 Q417 - Barnes & Noble Education, Inc. | bned-ex312_20170429xq417.htm |
| EX-31.1 - EXHIBIT 31.1 Q417 - Barnes & Noble Education, Inc. | bned-ex311_20170429xq417.htm |
| EX-23.1 - EXHIBIT 23.1 CONSENT - Barnes & Noble Education, Inc. | bned-ex231_20170429xq417.htm |
| EX-21.1 - EXHIBIT 21.1 LIST OF SUBSIDIARIES - Barnes & Noble Education, Inc. | bned-ex211_20170429xq417.htm |
UNITED STATES
SECURITIES AND EXCHANGE COMMISSION
Washington, D.C. 20549
FORM 10-K
(Mark One)
x | ANNUAL REPORT PURSUANT TO SECTION 13 OR 15(d) OF THE SECURITIES EXCHANGE ACT OF 1934 |
For the fiscal year ended April 29, 2017
OR
¨ | TRANSITION REPORT PURSUANT TO SECTION 13 OR 15(d) OF THE SECURITIES EXCHANGE ACT OF 1934 |
For the transition period from to
Commission File Number: 1-37499
BARNES & NOBLE EDUCATION, INC.
(Exact Name of Registrant as Specified in Its Charter)
Delaware | 46-0599018 | |
(State or Other Jurisdiction of Incorporation or Organization) | (I.R.S. Employer Identification No.) | |
120 Mountain View Blvd., Basking Ridge, NJ | 07920 | |
(Address of Principal Executive Offices) | (Zip Code) | |
Registrant’s Telephone Number, Including Area Code: (908) 991-2665
Securities registered pursuant to Section 12(b) of the Act:
Title of Class | Name of Exchange on which registered | |
Common Stock, $0.01 par value per share | New York Stock Exchange | |
Securities registered pursuant to Section 12(g) of the Act: None
Indicate by check mark if the registrant is a well-known seasoned issuer, as defined in Rule 405 of the Securities Act. Yes ¨ No x
Indicate by check mark if the registrant is not required to file reports pursuant to Section 13 or 15(d) of the Act. Yes ¨ No x
Indicate by check mark whether the registrant (1) has filed all reports required to be filed by Section 13 or 15(d) of the Securities Exchange Act of 1934 during the preceding 12 months (or for such shorter period that the registrant was required to file such reports), and (2) has been subject to such filing requirements for the past 90 days. Yes x No ¨
Indicate by check mark whether the registrant has submitted electronically and posted on its corporate Website, if any, every Interactive Data File required to be submitted and posted pursuant to Rule 405 of Regulations S-T (§232.405 of this chapter) during the preceding 12 months (or for such shorter period that the registrant was required to submit and post such files). Yes x No ¨
Indicate by check mark if disclosure of delinquent filers pursuant to Item 405 of Regulation S-K (Section 229.405 of this chapter) is not contained herein, and will not be contained, to the best of registrant’s knowledge, in definitive proxy or information statements incorporated by reference in Part III of this Form 10-K or any amendment to this Form 10-K. ¨
Indicate by check mark whether the registrant is a large accelerated filer, an accelerated filer, a non-accelerated filer, or a smaller reporting company. See definition of “large accelerated filer,” “accelerated filer” and “smaller reporting company” in Rule 12b-2 of the Exchange Act.(Check one):
Large accelerated filer | ¨ | Accelerated filer | x | ||
Non-accelerated filer | ¨ (Do not check if a smaller reporting company) | Smaller reporting company | ¨ | ||
Emerging Growth Company | ¨ | ||||
If an emerging growth company, indicate by check mark if the registrant has elected not to use the extended transition period for complying with any new or revised financial accounting standards provided pursuant to Section 13(a) of the Exchange Act. ¨
Indicate by check mark whether the registrant is a shell company (as defined in Rule 12b-2 of the Exchange Act). Yes ¨ No x
The aggregate market value of the voting and non-voting stock held by non-affiliates of the registrant was approximately $423 million based upon the closing market price of $9.25 per share of Common Stock on the New York Stock Exchange as of October 29, 2016. As of June 16, 2017, 46,516,890 shares of Common Stock, par value $0.01 per share, were outstanding.
DOCUMENTS INCORPORATED BY REFERENCE
Portions of the Registrant’s Proxy Statement for the 2017 Annual Meeting of Shareholders are incorporated by reference into Part III.
BARNES & NOBLE EDUCATION, INC. AND SUBSIDIARIES
INDEX TO FORM 10-K | ||
Page No. | ||
2
DISCLOSURE REGARDING FORWARD-LOOKING STATEMENTS
This annual report on Form 10-K contains certain “forward-looking statements” within the meaning of the Private Securities Litigation Reform Act of 1995 and information relating to us and our business that are based on the beliefs of our management as well as assumptions made by and information currently available to our management. When used in this communication, the words “anticipate,” “believe,” “estimate,” “expect,” “intend,” “plan,” “will,” “forecasts,” “projections,” and similar expressions, as they relate to us or our management, identify forward-looking statements. Moreover, we operate in a very competitive and rapidly changing environment. New risks emerge from time to time. It is not possible for our management to predict all risks, nor can we assess the impact of all factors on our business or the extent to which any factor, or combination of factors, may cause actual results to differ materially from those contained in any forward-looking statements we may make. In light of these risks, uncertainties and assumptions, the future events and trends discussed in this Form 10-K may not occur and actual results could differ materially and adversely from those anticipated or implied in the forward-looking statements.
Such statements reflect our current views with respect to future events, the outcome of which is subject to certain risks, including, among others:
• | general competitive conditions, including actions our competitors may take to grow their businesses; |
• | a decline in college enrollment or decreased funding available for students; |
• | decisions by colleges and universities to outsource their physical and/or online bookstore operations or change the operation of their bookstores; |
• | the general economic environment and consumer spending patterns; |
• | decreased consumer demand for our products, low growth or declining sales; |
• | our ability to continue to successfully integrate the operations of MBS Textbook Exchange, LLC into our Company, while facing competition from not only physical bookstore operations, but also virtual solutions; |
• | the strategic objectives, anticipated synergies, and/or other expected potential benefits of the MBS Textbook Exchange, LLC acquisition may not be fully realized or may take longer than expected; |
• | the integration of MBS Textbook Exchange, LLC’s operations into our own may also increase the risk of our internal controls being found ineffective; |
• | risks associated with operation or performance of MBS Textbook Exchange, LLC’s point-of-sales systems that are sold to college bookstore customers; |
• | implementation of our digital strategy may not result in the expected growth in our digital sales and/or profitability; |
• | risk that digital sales growth does not exceed the rate of investment spend; |
• | the performance of our online, digital and other initiatives, integration of and deployment of, additional products and services, and enhancements to higher education digital products, and the inability to achieve the expected cost savings; |
• | our ability to successfully implement our strategic initiatives including our ability to identify, compete for and execute upon additional acquisitions and strategic investments; |
• | technological changes; |
• | risks associated with counterfeit and piracy of digital and print materials; |
• | our international operations could result in additional risks; |
• | our ability to attract and retain employees; |
• | changes to purchase or rental general terms, payment terms, return policies, the discount or margin on products or other terms with our suppliers; |
• | risks associated with data privacy, information security and intellectual property; |
• | trends and challenges to our business and in the locations in which we have stores; |
• | non-renewal of managed bookstore, physical and/or online store contracts and higher-than-anticipated store closings; |
• | disruptions to our information technology systems, infrastructure and data due to computer malware, viruses, hacking and phishing attacks, resulting in harm to our business and results of operations; |
• | disruption of or interference with third party web service providers and our own proprietary technology; |
• | work stoppages or increases in labor costs; |
3
• | the risk of price reduction or change in format of course materials by publishers, which could negatively impact revenues and margin; |
• | possible increases in shipping rates or interruptions in shipping service; |
• | product shortages, including risks associated with merchandise sourced indirectly from outside the United States; |
• | changes in law or regulation; |
• | enactment of laws which may restrict or prohibit our use of emails or similar marketing activities; |
• | the amount of our indebtedness and ability to comply with covenants applicable to any future debt financing; |
• | our ability to satisfy future capital and liquidity requirements; |
• | our ability to access the credit and capital markets at the times and in the amounts needed and on acceptable terms; |
• | adverse results from litigation, governmental investigations or tax-related proceedings or audits; |
• | changes in accounting standards; and |
• | the other risks and uncertainties detailed in the section titled “Risk Factors” in Part I - Item 1A of this Form 10-K. |
Should one or more of these risks or uncertainties materialize, or should underlying assumptions prove incorrect, actual results or outcomes may vary materially from those described as anticipated, believed, estimated, expected, intended or planned. Subsequent written and oral forward-looking statements attributable to us or persons acting on our behalf are expressly qualified in their entirety by the cautionary statements in this paragraph. We undertake no obligation to publicly update or revise any forward-looking statements, whether as a result of new information, future events or otherwise after the date of this Form 10-K.
AVAILABILITY OF INFORMATION
You may read and copy any materials Barnes & Noble Education, Inc. files with the SEC at the SEC’s Public Reference Room at 100 F Street, N.E., Room 1580, Washington, D.C. 20549. Copies of such materials also can be obtained free of charge at the SEC’s website, www.sec.gov, or by mail from the Public Reference Room of the SEC, at prescribed rates. Please call the SEC at 1-800-SEC-0330 for further information on the operation of the Public Reference Room. Barnes & Noble Education, Inc.’s SEC filings are also available to the public, free of charge, on its corporate website, www.bned.com, as soon as reasonably practicable after Barnes & Noble Education, Inc. electronically files such material with, or furnishes it to, the SEC. You may also request a copy of any of our filings with the SEC at no cost by writing us at Investor Relations, Barnes & Noble Education, Inc., 120 Mountain View Blvd., Basking Ridge, N.J. 07920. Barnes & Noble Education, Inc.’s common stock is traded on the New York Stock Exchange. Material filed by Barnes & Noble Education, Inc. can be inspected at the offices of the New York Stock Exchange at 20 Broad Street, New York, N.Y. 10005.
4
EXPLANATORY NOTE
On August 2, 2015, we completed the legal separation ("Spin-Off") from Barnes & Noble, Inc., at which time we began to operate as an independent publicly-traded company.
For the results of operations for the 13 weeks ended August 1, 2015 (first quarter of Fiscal 2016), our consolidated financial statements are presented on a stand-alone basis since we were still part of Barnes & Noble, Inc. until the consummation of the Spin-Off on August 2, 2015, and for the results of operations for the 39 weeks ended April 30, 2016, our consolidated financial statements are presented on a consolidated basis as we became a separate consolidated entity. For Fiscal 2017, the results of operations for the entire 52 weeks ended April 29, 2017 reflected in our consolidated financial statements are presented on a consolidated basis.
On February 27, 2017, we acquired MBS Textbook Exchange, LLC ("MBS"). The consolidated financial statements for the 52 weeks ended April 29, 2017 include the financial results of MBS from the acquisition date, February 27, 2017, to April 29, 2017. For additional information on the MBS acquisition, see Form 8-K filed on February 28, 2017 and Form 8K/A pro forma information filed on May 8, 2017.
Additionally, effective with the acquisition of MBS, we determined that we have two reportable segments: Barnes & Noble College Booksellers, LLC ("BNC") and MBS, whereas BNC was previously our only reportable segment prior to the acquisition.
5
PART I
Item 1. BUSINESS
Unless the context otherwise indicates, references to “we,” “us,” “our” and “the Company” refer to Barnes & Noble Education, Inc., a Delaware corporation. References to “Barnes & Noble College” or “BNC” refer to our college bookstore business operated through our subsidiary Barnes & Noble College Booksellers, LLC. References to “MBS” refer to our virtual bookstore and wholesale textbook distribution business operated through our subsidiary MBS Textbook Exchange, LLC, a Delaware corporation.
Our fiscal year is comprised of 52 or 53 weeks, ending on the Saturday closest to the last day of April. “Fiscal 2017” means the 52 weeks ended April 29,2017, “Fiscal 2016” means the 52 weeks ended April 30, 2016, “Fiscal 2015” means the 52 weeks ended May 2, 2015, “Fiscal 2014” means the 53 weeks ended May 3, 2014, and “Fiscal 2013” means the 52 weeks ended April 27, 2013.
Unless otherwise indicated, market and industry information contained in this Form 10-K is based on information provided by the National Association of College Stores ("NACS") and management estimates of market shares.
OVERVIEW
General
Barnes & Noble Education, Inc. (“BNED”) is one of the largest contract operators of physical and virtual bookstores for college and university campuses, and private/parochial K-12 schools, across the United States, and a leading provider of digital education services. Through our Barnes & Noble College (“BNC”) and MBS Textbook Exchange (“MBS”) subsidiaries, we operate 1,481 physical and virtual bookstores and serve more than 6 million students enrolled in higher education institutions and K-12 schools.
Effective with the acquisition of MBS on February 27, 2017, we have determined that we operate two reportable segments: BNC and MBS. See the BNC and MBS segment discussions below.
BNC operates 769 physical campus bookstores, the majority of which also have school-branded e-commerce sites operated by BNC, and BNC also includes our digital operations. Our campus stores are a social and academic hub through which students can access affordable course materials and affinity products, including new and used print and digital textbooks, which are available for sale or rent; emblematic apparel and gifts; trade books; computer products; school and dorm supplies; café offerings; convenience food and beverages; and graduation products. BNC product offerings also include a suite of digital content, software, and services through our LoudCloud platform, such as predictive analytics, a variety of courseware built on a foundation of open educational resources ("OER"), and competency-based learning solutions.
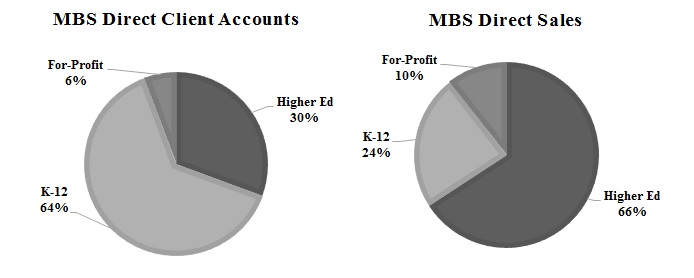
Our MBS subsidiary operates two highly integrated businesses. The MBS Direct business is the largest contract operator of virtual bookstores for college and university campuses, and private/parochial K-12 schools. MBS Direct operates 712 virtual bookstores, offering new and used print and digital textbooks, which are available for sale or rent. Additionally, MBS Direct sells textbooks directly to students through textbooks.comSM, one of the largest e-commerce sites for new and used textbooks. MBS Wholesale is one of the largest textbook wholesalers in the country, providing a comprehensive selection of new and used textbooks at a low cost of supply to more than 3,700 physical bookstores, including BNC’s 769 campus bookstores.
Educational institutions increasingly are outsourcing bookstore operations, investing in data-driven analytical tools, and offering students more affordable options for textbooks and other learning tools. Given these continuing trends, we are well-positioned to capture new market share and partner with an increasing number of schools across the country. As demand for new, improved, and more affordable products and services increase in the rapidly changing education landscape, we are working to evolve our business model and enhance our solutions. We aim to be an even stronger partner for schools and meet customer needs by expanding our physical and virtual bookstore service capabilities, courseware offerings and digital platform services. We believe that our recent strategic actions, including the acquisition of LoudCloud, Promoversity and MBS, and development of courseware, have substantially enhanced our competitive position. We continue to aggressively innovate and collaborate with our partners to provide solutions that extend well beyond course materials sourcing and sales to include new digital services that support successful student outcomes.
Strength of Our Business
We believe our product offerings and services for students, faculty and administrators enable a more personalized learning experience, which improves student success rates and retention. We strive to be the first stop for students, educators and administrators by offering the most comprehensive resources available with our flexible physical and/or virtual bookstore options. The strengths of our business are as follows:
6
• | Large Footprint with Well-Recognized Brand: We operate 1,481 physical and virtual bookstores and serve more than 6 million students enrolled in higher education institutions and K-12 schools. The Barnes & Noble brand is virtually synonymous with bookselling, and we believe it is one of the most widely recognized and respected brands in the United States. Our large Barnes & Noble College footprint, reputation, and credibility in the marketplace not only support our marketing efforts to universities, students and faculty, but are also important for leading publishers who rely on us as one of their primary distribution channels. The addition of MBS’s wholesale and virtual bookstore customers meaningfully expanded our customer base, and MBS Direct’s advanced virtual bookstore capabilities increased our footprint to include higher education institutions and K-12 schools that prefer virtual bookstore solutions, enabling us to offer existing and prospective clients physical, virtual and hybrid bookstore models. |
• | Ability to Meet Students’ Affordability Needs: We are dedicated to providing quality, cost-effective course materials and are constantly seeking new ways to deliver the most affordable and easily accessible materials possible. We offer a comprehensive range of cost-effective options for textbooks (new and used, for rent or for sale), as well as programs that help students to secure the best price, such as our “price match” program. The MBS Wholesale distribution channel, warehousing systems and fulfillment expertise allow us to provide an expanded selection of new and used textbooks. Our digital courseware utilizing open educational resources (“OER”), defined as any type of educational materials that are available to a learning community at little or no cost, is a cost-effective solution for today’s educators, providing course materials at a significantly lower cost to students. |
• | Comprehensive Suite of Course Materials: Our physical bookstores and accompanying e-commerce sites offer new and used print and digital textbooks, which are available to buy or rent. Through our MBS Wholesale business, we have a robust inventory comprised of approximately 300,000 textbook titles in stock and a comprehensive catalog of new and used textbooks and digital course material solutions. We offer alternative forms of educational materials, including digital courseware built on a foundation of OER, so that students and educators have the flexibility to learn and teach in digital and/or print formats. |
• | Well-Established, Deep Relationships with Partners: We have strong partnerships with college and university administrators, as well as with publishers, vendors and suppliers. |
• | Our Barnes & Noble College campus bookstores have an average relationship tenure of 15 years. Our BNC decentralized management structure empowers local teams to make decisions based on the local campus needs and foster collaborative working relationships with our partners. |
• | We have long-term relationships with over 10,000 publishers, who can partner with us to access one of the largest distribution networks of college and K-12 educational materials in the United States. |
• | MBS has developed deep relationships with its wholesale customer base as a result of its substantial inventory of used textbooks, a comprehensive catalog of textbooks, superior service and systems support. MBS Wholesale provides inventory management, hardware and point-of-sale software to approximately 477 college bookstores. |
• | Direct Access to Students and Faculty: We have excellent visibility into the needs of our customers. At our physical campus stores, we serve as social hubs for over 5 million students and their faculty, allowing us to forge deep customer relationships and seamlessly integrate their systems with our technology. For our MBS Direct and Wholesale businesses, we are connected with our customers’ students online and through our proprietary systems. Our multi-channel strategies focus on building close relationships and one-to-one connections with our students, faculty, administrators and alumni, whether in-store, online or mobile. We provide connectivity to our services whether our customers are in the classroom, at the stadium, or at orientation. Our Student Point of View (POV) panel gains insights from more than 8,000 college students, and allows us to adjust our offerings to better meet expressed needs. Through this unique relationship with students, we also operate as a media channel that drives revenue through brands looking to target the college demographic. |
• | Integrated Systems with Our Customers: We are deeply ingrained in the course material adoption processes of our customers. Both BNC and MBC have highly integrated online systems that streamline the adoption process for faculty, enabling them to research, update, approve and submit textbook adoptions online, as well as make informed decisions on adoptions as the application gives real-time information regarding title availability, edition status and price. |
• | Stable, Long-Term Contracts: BNC physical bookstores are operated under management contracts with colleges and universities that are typically for five year terms with renewal options, but can range from one to 15 years, and are typically cancelable by either party without penalty with 90 to 120 days' notice. From Fiscal 2014 through Fiscal 2017, 94% of these contracts were renewed or extended, often before their termination dates. Virtual bookstores offered through MBS Direct operate under a contract with the school as the exclusive seller of course materials. Over the past three years, we have retained more than 95% of our contracts, with the majority of the contracts being automatically renewed as per the contract terms or renewed before their expiration dates without going through a formal bid process. |
7
• | Seasoned Management Team: Both BNC and MBS possess experienced senior management teams with proven track records, and demonstrated expertise in bookstore outsourcing, virtual bookstore operations, wholesale distribution and fulfillment operations, content distribution, marketing and retail operations, and in scaling digital educational and other digital products and services. |
Growth Drivers
The primary factors that we expect will enable us to grow our business are as follows:
• | Increasing Market Share with New Accounts: New store openings are an important driver of growth. In Fiscal 2017, BNC signed 38 new stores for estimated first year annual sales of $118 million. Currently, approximately 52% of college and university affiliated physical bookstores in the United States are operated by their respective institutions. Based on the anticipated continuing trend towards outsourcing in the campus bookstore market, we intend to aggressively pursue these opportunities to grow BNC’s core business. Additionally, our acquisition of MBS expands our addressable market to include K-12 and higher education schools that prefer virtual bookstore solutions. MBS Direct signed 80 new accounts in Fiscal 2017 for $17 million of estimated annual sales. Our ability to offer existing and prospective clients physical, virtual and hybrid bookstore models is a key element of our competitive strategy. We believe that our message of affordability and convenience will continue to gain traction and allow us to capture market share by offering flexible physical and virtual bookstores options, as well as digital solutions. |
• | Scalable and Advanced Digital Solutions: We leverage our digital technology platform to provide product and service offerings designed to address the most pressing issues in higher education, such as affordable and accessible course materials, retention solutions driven by our analytics platform, and products designed to drive and improve student outcomes. Through our LoudCloud platform, we address the growing demand for alternative forms of educational materials and learning tools. By focusing on advanced OER courseware, we plan to continue to enhance and grow our digital content and services in an efficient, low-cost/high-value manner to complement our printed textbook businesses. Additionally, we believe that our predictive analytics solution has strong benefits for higher education institutions, and therefore potentially strong demand characteristics in this emerging space. Our recently announced partnership with Unizin underscores the value proposition of our predictive analytics solutions in helping client institutions improve student success rates and retention. |
• | Expanding Strategic Opportunities through Acquisitions and Partnerships: We intend to pursue strategic relationships with companies that enhance our educational services or distribution platform, or create compelling content offerings. Our acquisitions and partnerships this fiscal year helped us expand into new educational verticals and markets, such as workforce and skills gap training and K-12, but other markets for expansion remain, including international markets. These will continue to be opportunistically evaluated. |
Segments
Effective with the acquisition of MBS on February 27, 2017, we have determined that we operate two reportable segments: BNC and MBS. We identified our segments based on the way our business is managed (focusing on the financial information distributed) and the manner in which our chief operating decision maker allocates resources and assesses financial performance.
BARNES & NOBLE COLLEGE
General
As of April 29, 2017, BNC operates 769 physical campus bookstores, the majority of which also have school-branded e-commerce sites operated by BNC, and BNC also includes our digital operations. During Fiscal 2017, we opened 38 stores with estimated first year annual sales of $118 million, and closed 20 stores, primarily comprised of satellite store locations that we elected to close and we continue to operate the main contract, contracts with low sales volume, as well as those contracts that may have been lost in a competitive bid process. As of June 16, 2017, BNC has signed additional contracts for 23 new physical stores with estimated first year annual sales of $50 million, which we expect to open during our Fiscal 2018.
Contracts
Our BNC stores are typically operated under management agreements with the college or university to be the official university bookstore and the exclusive seller of course materials and supplies, including physical and digital products sold in-store, online or through learning management systems. We offer existing and prospective clients physical, virtual and hybrid bookstore models. Agreements are typically five years with renewal options, but can range from one to 15 years, and are typically cancelable by either party without penalty with 90 to 120 days' notice. We pay the school a percentage of sales for the right to be the official college or university bookstore and the use of the premises; more than half of our agreements do not have any minimum guaranteed amount to be paid to our partners. In addition, we have the non-exclusive right to sell all items typically sold in a college bookstore both in-store and online. We also have the ability to integrate our systems with the university’s systems in order to accept student financial aid, university debit cards and other forms of payment. We obtain student and faculty email lists for direct communication which provide for seamless integration into the university community and potential co-branded marketing opportunities.
8
Over the past four years, we have renewed more than 94% of our agreements, with the majority of the agreements being renewed before their expiration dates and without going through an RFP process.
Customers and Distribution Network
We leverage our BNC physical bookstores, e-commerce sites and digital platform to serve and interact with the key constituents in our business ecosystem and act as a key partner for students, universities and publishers. As of April 29, 2017, we operate 769 physical bookstores nationwide.
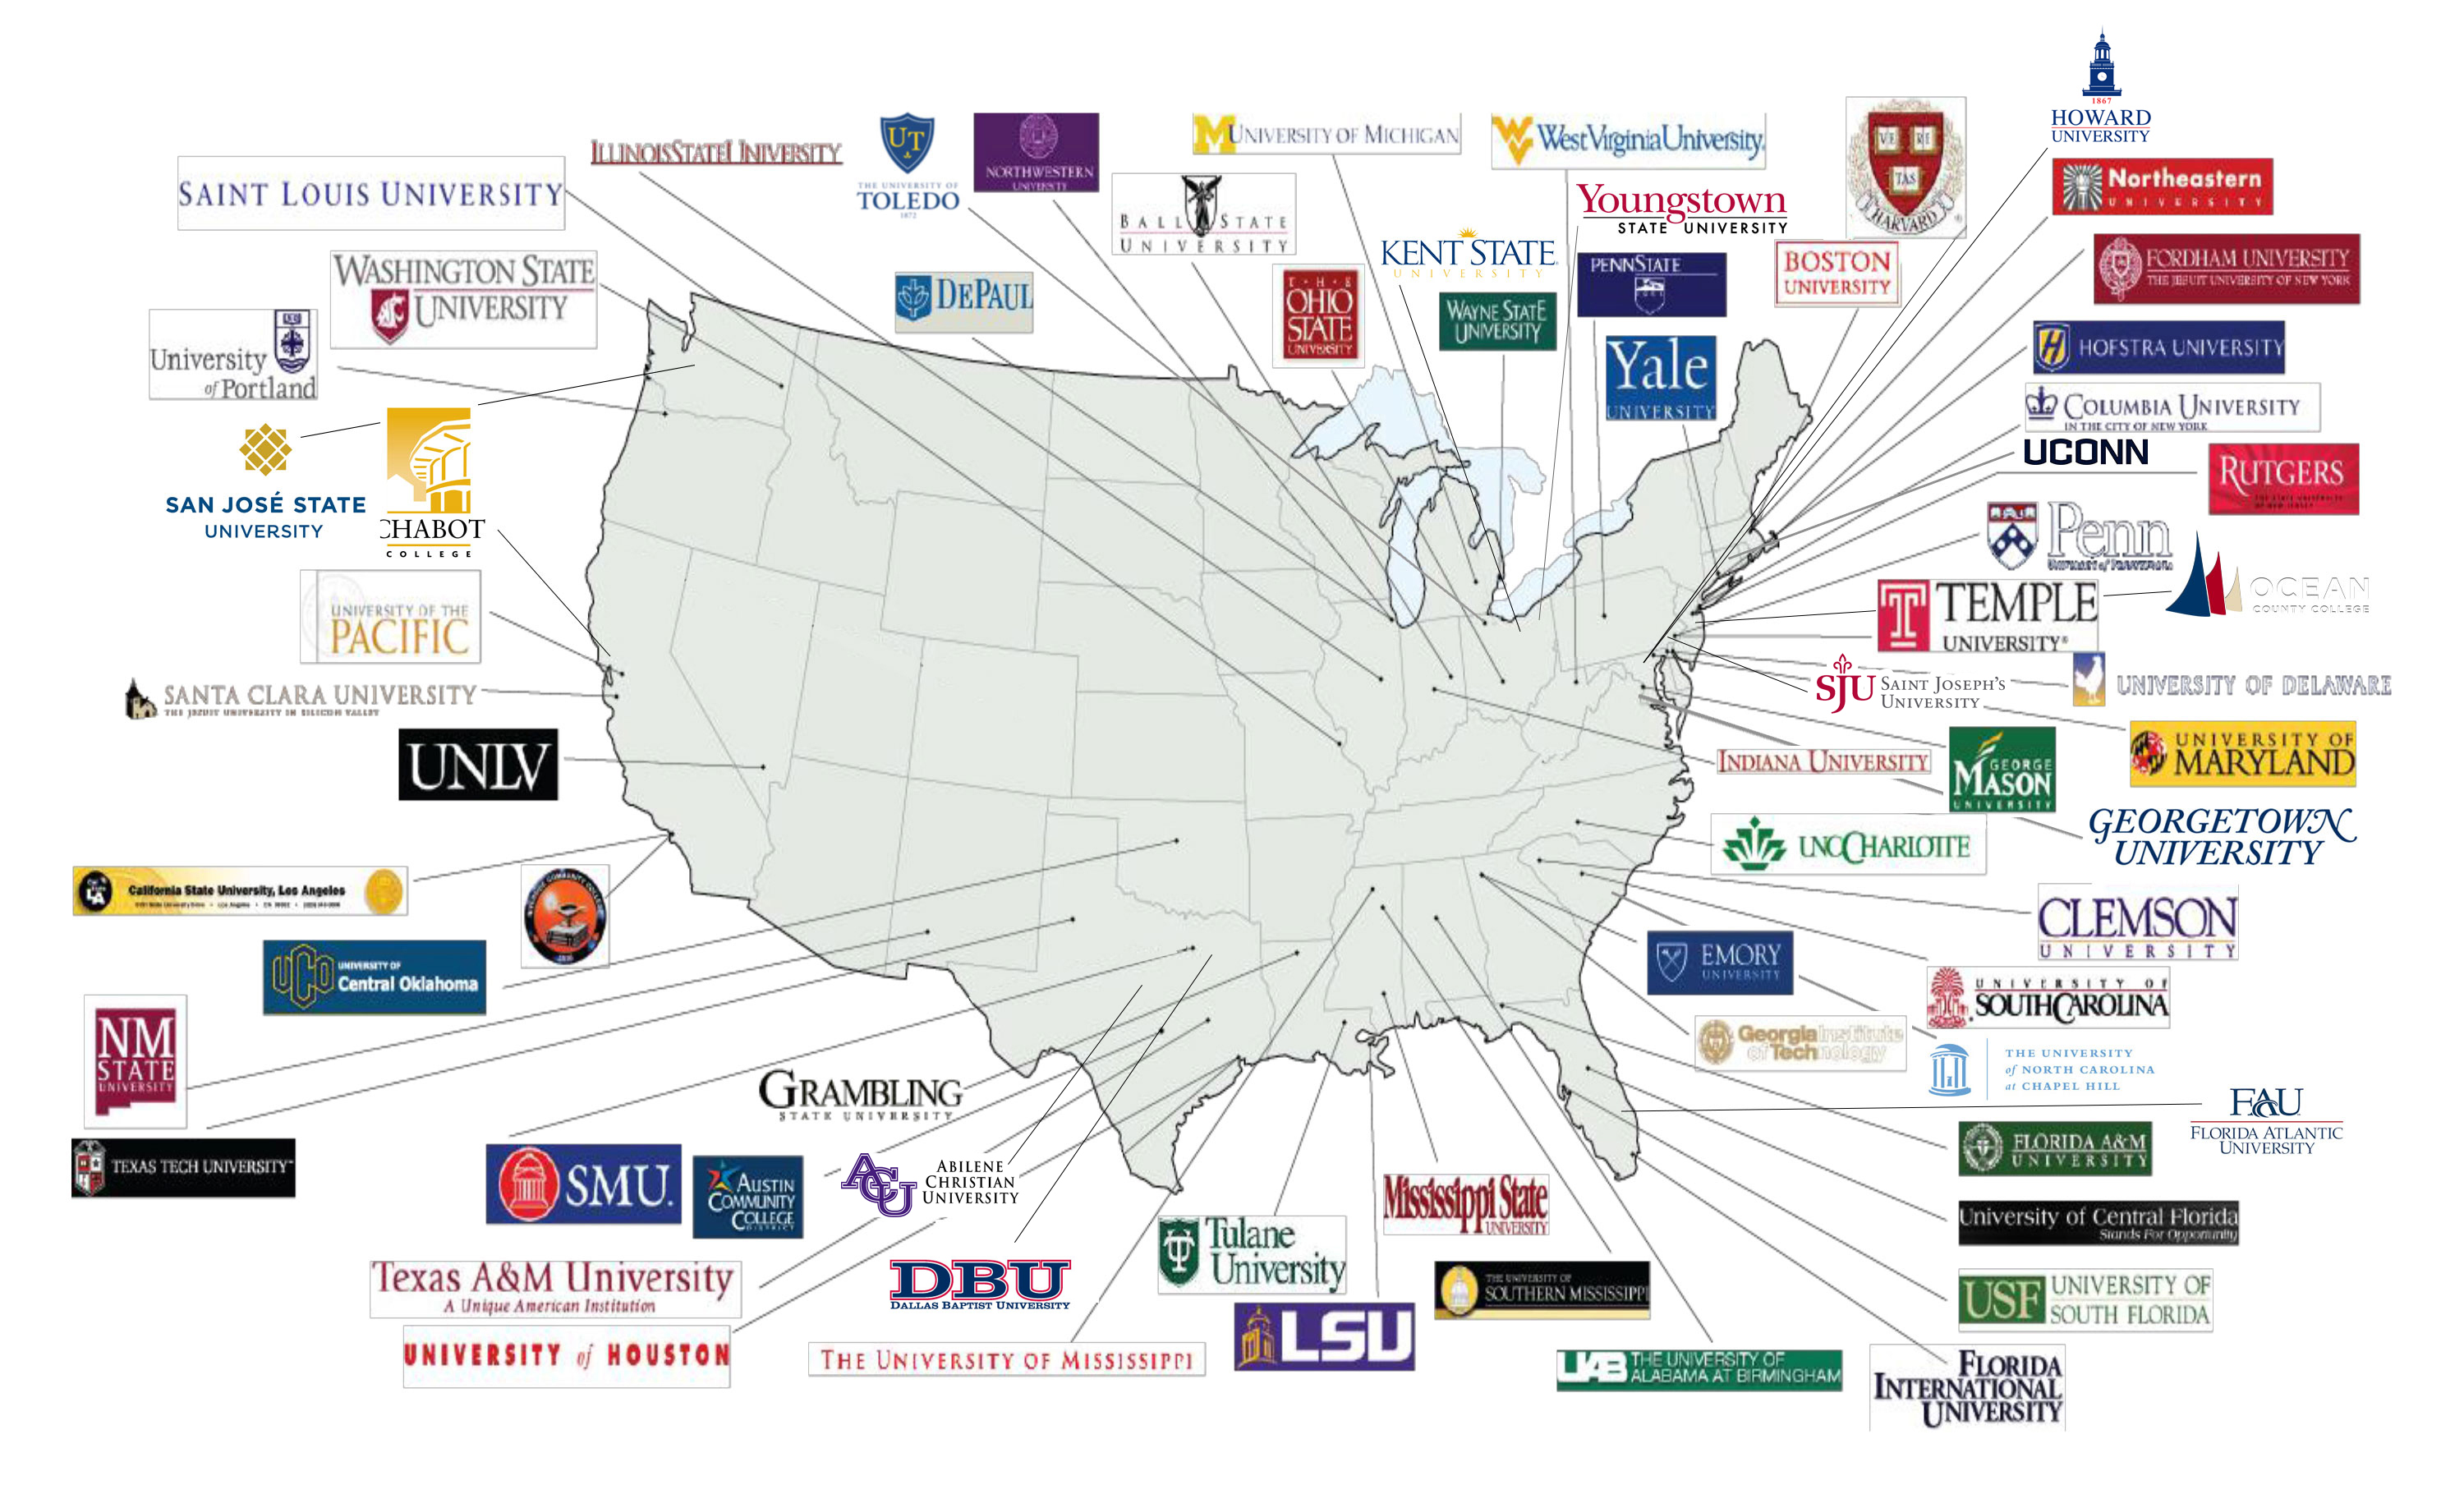
The number of BNC college and university bookstores operations located in the United States as of April 29, 2017, is listed below:
STATE | NUMBER OF STORES | STATE | NUMBER OF STORES | STATE | NUMBER OF STORES | |||||
Alabama | 18 | Kentucky | 30 | North Dakota | 1 | |||||
Arizona | 8 | Louisiana | 14 | Ohio | 42 | |||||
Arkansas | 7 | Maryland | 20 | Oklahoma | 5 | |||||
California | 46 | Massachusetts | 29 | Oregon | 5 | |||||
Colorado | 7 | Michigan | 36 | Pennsylvania | 64 | |||||
Connecticut | 14 | Minnesota | 7 | Rhode Island | 3 | |||||
Delaware | 2 | Mississippi | 8 | South Carolina | 20 | |||||
District of Columbia | 6 | Missouri | 9 | South Dakota | 2 | |||||
Florida | 45 | Nebraska | 1 | Tennessee | 13 | |||||
Georgia | 14 | Nevada | 2 | Texas | 65 | |||||
Hawaii | 3 | New Hampshire | 4 | Virginia | 19 | |||||
Illinois | 19 | New Jersey | 22 | Washington | 21 | |||||
Indiana | 14 | New Mexico | 6 | West Virginia | 11 | |||||
Iowa | 5 | New York | 67 | Wisconsin | 6 | |||||
Kansas | 2 | North Carolina | 27 | |||||||
9
Product and Service Offerings
Our campus stores are a social and academic hub through which students can access affordable course materials and affinity products, including new and used print and digital textbooks, which are available for sale or rent; emblematic apparel and gifts; trade books; computer products; school and dorm supplies; café offerings; convenience food and beverages; and graduation products. BNC product offerings also include a suite of digital content, software, and services through our LoudCloud platform, such as learning analytics, a variety of courseware developed utilizing OER, and competency-based learning solutions, which allow students to advance in a course based on their ability to master a skill or competency at their own pace.
BNC’s full suite of product offerings include:
• | Course Material Sales and Rentals: Sales and rentals of print textbooks are a core revenue driver. Our online platform and registration solutions (discussed below) are deeply ingrained in our partner schools’ textbook selection process.We work directly with faculty to ensure the textbooks they have chosen for their courses are available in all required formats before the start of classes. MBS’s wholesale distribution channel enables us to optimize our textbook sourcing, purchasing and liquidation processes, and we are able to more efficiently source and distribute a comprehensive inventory of affordable course materials to customers with the highest and greatest need. On average, MBS Wholesale has approximately 300,000 textbook titles in stock at any given time to support the course offerings of our partner schools. |
• | OER Courseware: In Fall 2016, we launched OER courseware, a turnkey solution for colleges and universities, within our existing physical bookstore footprint and beyond, which offers advanced, affordable learning materials built on a high-quality foundation of OER and enhanced with content such as videos and self-assessments. Our high-quality OER courseware significantly reduces course material costs for students and enables easier implementation for faculty, all with the objective of ultimately improving learning outcomes. Our courseware is delivered digitally on our LoudCloud platform, with analytics integrated into the solution, and companion print versions available to students and educators who prefer the flexibility to learn and teach in either format. Courseware offerings include general education courses, including sociology, psychology and economics, which were piloted in 2016 at institutions such as the Pennsylvania State University, Cuyahoga Community College and West Liberty State College. |
• | eTextbooks: We have partnered with VitalSource, a global leader in building, enhancing and delivering digital content, on our digital reading platform and a broad digital catalog. |
• | General Merchandise: We drive general merchandise sales through both our instore and online channels, including pop up retail locations at major sporting events, throughout the academic year. Our stores feature collegiate and athletic apparel, other custom-branded school spirit products, technology, supplies and convenience items. We continue to see significant year over year growth in our e-commerce sales and in the demand for our True Spirit fan sites, which are dedicated virtual stores that appeal specifically to the alumni and sports fanbase. As of April 29, 2017, we operate 61 True Spirit sites. Additionally, in June 2016, we enhanced our merchandise offering through the acquisition of Promoversity, a custom merchandise supplier and e-commerce storefront solution serving the collegiate bookstore business and its customers. This acquisition provides us with a wide customer base outside of the BNC footprint, as Promoversity’s standalone e-commerce solution can serve any school, corporation or group looking for customized apparel, corporate gifts and novelties, and merchandise. |
• | Cafes and Convenience Stores: We operate 83 customized cafés, featuring Starbucks Coffee®, and 17 stand-alone convenience stores, as well as diverse grab-and-go options including organic, vegan, gluten-free and ethnic fare for students. These offerings increase traffic and time spent in our physical stores. |
• | Brand Partnerships: Through our unique relationship with students, colleges and universities, and our premier position on campus, we operate as a media channel for brands looking to target the college demographic, and derive revenue from these marketing share programs. We create strategic, integrated campaigns which include research, email, social media, display advertising, on-campus events, signage, and sampling. Our client list includes brands like Target, MasterCard, GEICO, Kellogg’s, Verizon, Samsung Pay, and more. |
Platform Services
• | FacultyEnlight®: Used by approximately 310,000 faculty members, FacultyEnlight®, our proprietary online platform enhances content search, discovery and adoption (i.e. textbook selection) by faculty on each campus, enabling them to find and select the course materials that are both relevant to their subject matter and affordable to their students. FacultyEnlight®, which is available to faculty at no cost, also provides us with a communication platform to connect with faculty directly, allowing us to better understand their needs, preferences and challenges when it comes to the textbook adoption process, and deliver our affordability message. |
• | Campus Connect Technologies™: Our Campus Connect Technologies™ platform is customizable technology that delivers a seamless experience, providing students and faculty with the ability to research, find and purchase the most affordable course materials. The platform includes registration integration, learning management system (“LMS”) integration, real-time financial |
10
aid platform, point of sale ("POS") platform and course fee solution. Through our fully integrated purchasing process, students can purchase their course materials in-store or online, or buy them when registering for classes through our Registration Integration solution.
• | LoudCloud platform: Through our LoudCloud platform, we address the growing demand for alternative forms of educational materials and learning tools. LoudCloud is a sophisticated digital platform comprised of learning analytics, LoudSight; advanced OER courseware; and competency learning solutions. |
Our LoudSight predictive analytics solution captures and analyzes key demographic, behavioral and performance metrics from students, allowing educators to identify, monitor and support at-risk student to improve student success. LoudCloud's analytics solution connects disparate systems on campus, builds predictive models based upon data collected by institutions, and presents advisors with a unified view of the factors that drive student success on their campus. By sharing predictive models with institutions, LoudCloud promotes collaboration to ensure advisors and administrators understand what drives student performance. Additionally, LoudSight integrates with campus communication systems, allowing advisors and faculty to easily reach out to students for support in a timely manner. LoudSight has the ability to capture and analyze over 200 parameters across demographic, performance and participation data points. Its powerful predictive engine has the ability to support advisors, faculty and students with real-time alerts and insights into managing and improving student outcomes.
◦ | Through our partnership with Instructure, a leading educational technology company and creator of the Canvas LMS, LoudSight can be fully integrated in Canvas’s platform, providing higher education institutions with actionable insights that provide a comprehensive view of the student journey. Instructure is a leading LMS provider at schools across the country, and we believe the ability to integrate with a school’s Canvas system makes our analytics solution more efficient and effective. |
◦ | We entered into an agreement with Unizin, Ltd. ("Unizin") in May 2017 to provide its 22 member universities with LoudSight. As a result, faculty and advisors will have access to a customized solution that helps educators identify, monitor, and support at-risk students, with the goal of improving student success rates and retention. |
• | Career Now: Our Career Now initiative provides early career preparation for students through personal brand building workshops, faculty resource guides, career prep podcasts and dedicated content through The College Juice, our student blog. We also help build a stronger connection between students and campus resources, including career fairs, mentors, career sponsors and other career services. These career preparatory programs help students achieve their post-graduation goals, which supports our campus partners’ recruitment and retention goals. |
Merchandising and Supply Chain Management
Our purchasing procedures vary by product type (i.e. textbooks, general merchandise or trade books). Purchases are made at the store level based on the relationships our managers have with the faculty, with strategic corporate oversight, while maintaining appropriate inventory levels.
After titles are adopted for an upcoming term, we determine how much inventory we will need to purchase based on several factors, including student enrollment and the previous term’s textbook sales history. We use our automated sourcing systems to determine if our stores have the necessary new or used books on hand and may transfer the inventory to the appropriate store. MBS has historically been one of our largest suppliers of new and used books, and our acquisition of MBS significantly increased our textbook supply at competitive prices. MBS’s broad wholesale distribution channel and warehousing systems also drive inventory efficiencies, allowing us to optimize our textbook sourcing, purchasing and liquidation processes.
After internal sourcing, we purchase books from outside suppliers. As part of our contracts with institutions, we guarantee that we will order textbooks for all courses. Our primary suppliers of new textbooks include Pearson Education, Cengage Learning, McGraw-Hill, MPS, and John Wiley & Sons. Our primary suppliers of used textbooks are students, through returns of previously rented and purchased books. The stores offer a "Cash for Books" program in which students can sell their books back to the store at the end of the semester, typically in December and May. Students typically receive 50% of the price they originally paid for the book if it has been adopted for a future class or the current wholesale price if it has not. Both unsold textbooks and trade books are generally returnable to publishers for full credit. For textbook sales and rentals, we utilize our sophisticated inventory management platforms to manage pricing and inventory across all our stores.
The larger stores feature an expanded selection of trade (general reading) books and use the Barnes & Noble, Inc. Book Master system, a proprietary merchandising system licensed from Barnes & Noble, Inc. Our merchants meet with publishers on a regular basis to identify new titles and trends to support this changing business. In the smaller stores, trade book purchasing is controlled at the store level.
General merchandise vendors and products are initially selected by our merchants using the analytics and insights from our planning and allocation systems. This data is used to establish benchmarks across school type, region and the socio-economics of each of our partner institution’s student base to help local store management team forecast sales and trends. Recommended
11
assortments are provided to the stores, and stores then make selections based on the perceived needs of each campus, reaching back out to the home office merchants with their recommendations on any additional campus specific needs.
Omnichannel Retailer and Customer Marketing Strategies
We operate bookstores in our dynamic, multichannel format virtually and on campuses of state universities, private universities and community colleges of various sizes. Our omnichannel strategies focus on building close relationships and one-to-one connections where our customers need us to be - in-store, online, mobile, at the stadium, at orientation, or wherever they are.
Students, Parents, Alumni
We have flexible research channels that help us stay ahead of the rapidly changing needs and behaviors of our customers, and proactively respond with dynamic solutions. Our Student Point of View (POV) panel gains insights from more than 8,000 college students, and helps us to create the ideal customer experience.
Our marketing efforts are centered around an active digital community of over 6.6 million people, which includes engaged email subscribers and continuous dialogue with customers on our school-customized social media channels, including Facebook, Instagram and Twitter, as well as our student blog, The College Juice. Our exclusive Student POV online panel of over 8,000 students nationwide and our Parent POV online panel of over 2,800 parents help us to better understand their attitudes, values and behaviors. Using a marketing automation platform, we segment students based on demographics and purchasing behavior to ensure our audience receives the most relevant messages and experience. Our dynamic email campaigns educate students on format and affordability options as well as ongoing promotions from game day to graduation.
Through our search engine marketing strategies, BNC has been able to grow online textbook and apparel sales significantly. BNC’S official online bookstores for colleges or universities drove over $438 million of sales in Fiscal 2017. Nationwide, during the current fiscal year, we have built more than 695,000 connections with incoming students and their parents. These efforts have allowed us to maintain and expand market share and cement the college bookstore as the student's first choice for everything they need for academic success.
Promoversity has provided us with the ability to further customize our e-commerce solution to promote our partners’ brands more effectively and drive on-campus merchandise sales. Our True Spirit e-commerce sites for athletic branded merchandise continue to build our partner schools’ brands through alumni and athletics, fostering school spirit and capturing the excitement of collegiate sports. Our ability to support and promote our partner schools’ brands strengthens and deepens our relationships with the administration, faculty, alumni, parents and students. Additionally, our access to alumni through university alumni offices, including over 920,000 alumni with existing customer accounts, allow us to leverage digital marketing strategies on our dedicated fan and alumni e-commerce sites focused on athletic game day and other milestone events for further general merchandise sales growth in school-spirit apparel and related items.
Seasonality
BNC’s business is highly seasonal, with the major portion of sales and operating profit realized during the second and third fiscal quarters, when college students generally purchase and rent textbooks for the upcoming semesters. Revenue from the rental of physical textbooks is deferred and recognized over the rental period commencing at point of sale. Revenue from the rental of digital textbooks is recognized at time of sale. Our fiscal year is comprised of 52 or 53 weeks, ending on the Saturday closest to the last day of April.
MBS TEXTBOOK EXCHANGE
In February 2017, we acquired MBS, the largest contract operator of virtual bookstores for the higher education and private/parochial K-12 school markets, and one of the largest textbook wholesalers in the United States. For additional information, see Item 8. Financial Statements and Supplementary Data - Note 4. Acquisitions and Strategic Agreements.
This acquisition significantly enhances our competitive positioning, increasing our addressable market to include K-12 schools and higher education institutions that need virtual bookstore solutions as an alternative to or in addition to a physical store on campus. The acquisition also increases our addressable market for our digital courseware and analytics solutions, and enables us to generate more value from the textbook marketplace through inventory and procurement synergies.
Our MBS subsidiary operates two highly integrated businesses: MBS Direct and MBS Wholesale. The MBS Direct business is the largest contract operator of virtual bookstores for college and university campuses, and private/parochial K-12 schools, operating 712 virtual bookstores. MBS Direct signed 80 new accounts in Fiscal 2017 with estimated first year annual sales of $17 million, and has signed additional contracts to open 46 new accounts in Fiscal 2018 for estimated first year annual sales of $8 million. MBS Direct offers new and used print and digital textbooks, which are available for sale or rent. Our ability to offer existing and prospective clients physical, virtual and hybrid bookstore models is a key element of our competitive strategy. Additionally, MBS Direct sells textbooks directly to students through textbooks.comSM, one of the largest e-commerce sites for new and used textbooks.
12
MBS Wholesale is one of the largest textbook wholesalers in the country, providing an expanded selection of new and used textbooks at a lower cost of supply. MBS Wholesale business centrally sources and sells new and used textbooks to physical college bookstores, including BNC’s campus bookstores. MBS Wholesale purchases new and used textbooks from bookstore operators, institutional bookstores, book dealers, publishers, other distributors and wholesalers, and students. To secure a steady supply of in-demand used books, MBS Wholesale has a large national sales force to call on college bookstores. MBS Wholesale has deep relationships with clients due to the large inventory of used textbooks, a comprehensive catalog of textbooks, superior service and systems support. The MBS Database Buying Guide has the most complete and accurate source of college textbook information available.
Contracts
Virtual bookstores offered through MBS Direct operate under a contract with the school as the exclusive seller of course materials. Agreements typically have a term that ranges between 3-5 years, with automatic renewal periods. Over the past three years, we have retained more than 95% of our contracts, with the majority of the contracts being automatically renewed as per the contract or renewed before their expiration dates without going through an RFP process.
Customers and Distribution Network
MBS Direct operates 712 virtual bookstores, including 454 virtual stores at K-12 schools. Through contracts with its clients, MBS Direct operates as the institution’s official source of course materials with exclusive rights to booklists and access to online programs that link course materials to the courses offered by the school. MBS Direct utilizes Course Director, a web-based product that allows faculty and/or staff to research, update, approve and submit textbook adoptions online, as well as make informed decisions on adoptions based on real-time information regarding title availability, edition status and price. This real-time information is primarily sourced from the MBS Wholesale used textbook inventory. MBS also operates textbooks.comsm one of the largest e-commerce sites for new and used textbooks. This division is primarily for direct-to-student sales.
13
The number of MBS Direct accounts located in the United States as of April 29, 2017, is listed below:
Number of Stores | Number of Stores | Number of Stores | ||||||||||||||
STATE | K-12 | Higher Ed | STATE | K-12 | Higher Ed | STATE | K-12 | Higher Ed | ||||||||
Alabama | 12 | 3 | Kentucky | 8 | 1 | Ohio | 11 | 12 | ||||||||
Alaska | — | 6 | Louisiana | 14 | 2 | Oklahoma | 3 | 2 | ||||||||
Arizona | 3 | 3 | Maine | 2 | 8 | Oregon | 1 | 9 | ||||||||
Arkansas | 1 | 3 | Maryland | 28 | 7 | Pennsylvania | 13 | 17 | ||||||||
California | 58 | 14 | Massachusetts | 16 | 6 | Rhode Island | 3 | — | ||||||||
Colorado | 7 | — | Michigan | 17 | 8 | South Carolina | 8 | 2 | ||||||||
Connecticut | 14 | 2 | Minnesota | 1 | 6 | South Dakota | — | — | ||||||||
Delaware | 3 | 1 | Mississippi | 2 | — | Tennessee | 4 | 1 | ||||||||
District of Columbia | 5 | — | Missouri | 13 | 16 | Texas | 43 | 9 | ||||||||
Florida | 33 | 12 | Nebraska | 1 | 6 | Utah | 1 | 2 | ||||||||
Georgia | 24 | 12 | Nevada | 3 | — | Vermont | 1 | 2 | ||||||||
Hawaii | 15 | — | New Hampshire | 2 | 4 | Virginia | 26 | 9 | ||||||||
Idaho | — | 2 | New Jersey | 5 | 4 | Washington | 6 | 3 | ||||||||
Illinois | 14 | 16 | New Mexico | — | 3 | West Virginia | — | 5 | ||||||||
Indiana | 3 | 2 | New York | 17 | 8 | Wisconsin | 3 | 1 | ||||||||
Iowa | — | 10 | North Carolina | 9 | 9 | International | — | 1 | ||||||||
Kansas | 1 | 7 | North Dakota | — | 1 | Puerto Rico | — | 1 | ||||||||
Product and Service Offerings
MBS’s full suite of product offerings includes:
• | Virtual Bookstores: MBS Direct services 712 virtual bookstores with a comprehensive e-commerce experience and a broad suite of affordable course materials, including new and used print and digital textbooks, which are available for sale or rent. MBS Direct offers a robust used textbook selection, unique guaranteed buyback program, dynamic pricing, and marketplace offerings. |
• | Wholesale Textbook Distribution: MBS Wholesale centrally sources and sells new and used textbooks to over 3,700 physical college bookstores, including BNED’s 769 campus bookstores. Its large inventory of used textbooks consists of approximately 300,000 textbook titles in stock, and it has a highly automated distribution facility that process more than 13 million textbooks annually. Additionally, MBS Wholesale provides inventory management, hardware and point-of-sale software to approximately 477 college bookstores. |
• | OER Courseware: MBS’s broad base of wholesale and virtual bookstore customers provides us with new sales opportunities for LoudCloud’s digital suite of course materials and platforms as discussed above under the BNC segment discussion. |
• | E-Commerce Site: Through textbooks.comSM, MBS offers new, used and digital textbooks online directly to students. |
• | eTextbooks: MBS has partnered with VitalSource, a global leader with a broad digital catalogue to build, enhance and deliver digital content. |
Platform Services
MBS Direct utilizes Course Director, a web-based product that allows faculty and/or staff to research, update, approve and submit textbook adoptions online, as well as make informed decisions on adoptions as the application gives real-time information regarding title availability, edition status and price. This real-time inventory information is leveraged from the inventory sourced first from MBS Wholesale, primarily for used textbooks. Using the MBS Direct system ensures that the fulfillment order is directed first to MBS Wholesale before other sources of inventory are utilized.
Our MBS Wholesale business also provides inventory management, hardware and point-of-sale software to more than 477 college bookstore customers. MBS provides on-site installation for point-of-sale terminals and servers, and offers technical assistance through user training and our support center facility. The cost savings and ease of deployment ensure clients get the
14
most out of their management systems and create strong customer loyalty. These systems also direct all orders through MBS, giving MBS first rights to fill or refuse the order.
Supply Chain Management
MBS is one of our largest suppliers of used textbooks, as well as new textbooks. An extensive national sales force secures a steady supply of highly-prized used books, which is critical to the success of the MBS Wholesale business. MBS’s broad wholesale distribution channel and warehousing systems also drive inventory efficiencies, allowing us to optimize our textbook sourcing, purchasing and liquidation processes. We can leverage MBS Wholesale’s distribution channel and warehousing systems to more efficiently source and distribute a robust, comprehensive inventory of affordable course materials to customers with the highest and greatest need. Through the proprietary MBS Database Buying Guide, we have access to the best maintained, most accurate, and most complete source of college textbook information available - a key asset that allows us to develop superior supply and demand insights and risk management capabilities.
MBS’s primary suppliers of used textbooks are students, through returns of previously rented and purchased books. MBS also purchases new and used textbooks from BNC, other bookstore operators, institutional bookstores, book dealers, publishers, other distributors and other wholesalers. MBS offers a "Cash for Books" program in which students can sell their books back to the store at the end of the semester, typically in December and May.
Customer Marketing Strategies
Students
MBS student marketing programs promote the retail businesses of MBS Direct and textbooks.comSM. MBS Direct marketing efforts target the student population of contracted schools. We email students frequently throughout the year to promote the online bookstore, offer purchasing incentives and encourage buyback, in addition to other communications. Textbooks.comSM marketing strategies target an online population of students, lifelong learners, parents and general textbook shoppers through a variety of channels including email, search engine marketing, affiliate marketing and display marketing.
School Administrators
To market MBS Direct and Wholesale services, MBS maintains an active contact list of school management and administrators of over 37,000 contacts. We produce and distribute print and digital marketing campaigns to this list several times throughout the year. MBS employs a field sales and marketing force tasked with representing the entire MBS line of products and services to schools across North America.
During the last fiscal year, we have built more than 34,000 connections with current and potential clients through our blog sites and social media presence, and have had over 1.6 million visits to our primary business websites, mbsbooks.com and mbsdirect.net. These efforts have allowed us to capture market share and successfully engage administrators.
Seasonality
MBS’s business is highly seasonal. For MBS’s retail operations (virtual bookstores), a major portion of sales and operating profit are realized during the second and third quarters, when students generally purchase and rent textbooks for the upcoming semesters. For MBS’s wholesale business, a major portion of sales and operating profit is realized during the first, second and third fiscal quarters, as it sells textbooks for retail distribution, which somewhat offsets the decreased first quarter sales attributable to our retail business.
BUSINESS CONDITIONS AND COMPETITION
The market for educational materials is undergoing unprecedented change. Overall spending on education, including tuition, continues to increase dramatically. As tuition and other costs rise, colleges and universities face increasing pressure to attract and retain students and provide them with innovative, affordable educational content and tools that support their educational development.
Current competitive dynamics in the market for distribution of course materials include:
• | A Majority of Traditional Campus Bookstores Have Yet to be Outsourced: Approximately 52% of college and university affiliated bookstores in the United States are operated by their respective institutions. As the delivery of educational materials continues to evolve, driven in large part by the growth of rentals and digital content, and the complexity of modern campus bookstore operations increases, institutions are increasingly outsourcing bookstore operations to third parties such as us, because we can offer a complete set of solutions to students and faculty. We believe that we will benefit from the continuing trend towards outsourcing across the physical and virtual bookstore market. Our expanded capabilities enable us to customize our bookstores to meet customer needs, offering our partners the option of physical, virtual and hybrid bookstore models. |
15
• | Direct Relationship with a Coveted Demographic: Due to the disproportionate impact on trend-setting and early adoption, marketing to college students is important for many brands, as they seek more effective methods to engage with this audience. We work with a number of brands in partnership marketing efforts, often engaging our Student POV panel of more than 8,000 students to learn how a certain brand is perceived on campus. The importance of this demographic provides a significant opportunity to further monetize our direct relationship with more than 6 million students both during and beyond their college years. |
• | Increased Use of Online and Digital Platforms as Companions to Printed Course Materials: Students and faculty can now choose from a wider variety of educational content and tools than ever before, delivered across both print and digital platforms. Students and faculty are increasingly relying on online and digital platforms as a means to discover, consume and share educational content and access affordable non-traditional educational content, including online coursework and supplemental materials. Whereas some companies are creating digital delivery systems that would seek to make traditional textbooks obsolete, others are developing new technologies to complement traditional offerings. Importantly, we have the ability to adjust and grow our digital offering efficiently to complement our printed textbook sales and rental business. |
• | Enrollment Trends: Community college enrollments saw continued declines in 2016, but the overall enrollment trend is expected to be positive over the longer term, and we remain confident in the industry projections of higher education enrollments to reach 22.6 million students by 2026. Technology-enabled education is a key growth area in the higher education industry, with an increasing number of students taking courses away from a traditional campus. According to a Digital Learning Compass report, students taking at least one distance education course comprised 29.7% of all higher education enrollments as of fall 2015. Online degree program enrollments continue to grow, even in the face of declining overall higher education enrollment. Our comprehensive digital offering, particularly with our OER courseware program and analytics capabilities, as well as our virtual bookstore solution, which provides students with the ability to purchase course materials directly through a dedicated e-commerce site, leave us well positioned to capitalize on this trend. |
• | Distribution Network Evolving: The way course materials are distributed and consumed is changing significantly, a trend that is expected to continue. It is clear that significant change in the distribution of course materials is already underway as a result of start-ups promoting free online textbooks and generating revenue from related services, institutions licensing digital materials and providing them to students for a fee, or the surge of textbook rental programs in campus bookstores and online platforms. In addition to the official physical or virtual campus bookstore, course materials are also sold through off-campus bookstores, e-commerce outlets, digital platform companies, publishers’ direct sales to institutions and students, and student-to-student marketplaces. |
The market for course materials, including textbooks and supplemental materials, is intensely competitive and subject to rapid change. We are experiencing growing competition from alternative media and alternative sources of textbooks and course-related materials, such as websites that sell or rent textbooks, eTextbooks, digital content and other merchandise directly to students; online resources, including open educational resources; publishers including Cengage, Pearson and McGraw Hill, bypassing the bookstore distribution channel by selling directly to students and educational institutions; print-on-demand textbooks; textbook rental companies; and student-to-student transactions over the Internet.
In addition to the competition we face from alternative distribution sources, we also have competition from other college bookstore operators and educational content providers, including Akademos, a virtual bookstore and marketplace for academic institutions; Amazon.com, an e-commerce operator and a provider of contract services to colleges and universities; BBA Solutions, a college textbook retailer; bn.com, the e-commerce platform of Barnes & Noble, Inc.; Chegg.com, an online textbook rental company; Civitas Learning, a learning analytics platform; eCampus, an online provider of course materials; Follett Corporation, a contract operator of campus bookstores; IndiCo, an entity created by National Association of College Bookstores (“NACS”); Texas Book Company, bookstore management and operations; and Vital Source Technologies, Inc., a digital course materials provider. We also have competition from providers of eTextbooks, such as Apple iTunes, Blackboard, Google, and Redshelf, and various private textbook rental websites.
In addition, Akademos and Amazon have recently begun to develop relationships with colleges and universities to provide online bookstore solutions which not only competes with our physical bookstore operations but also competes with our subsidiary MBS’ Direct virtual solution. MBS Direct also faces competition from Ambassador Educational Solutions, eCampus, edMap, EdTech, Follett Corporation, Texas Book Company, Tree of Life, and VitalSource Technologies, Inc. MBS Wholesale competes with Amazon, BBA Solutions, Follett, IndiCo, Nebraska Book Company, and Texas Book Company.
Competitors that compete with our general merchandise offerings include Fanatics, Sodexo & Aramark, online retailers, and physical and online office supply stores.
Students often purchase from multiple textbook providers, are highly price sensitive, and can easily shift spending from one provider or format to another. As a consequence, in addition to being competitive in the services we provide to our customers, our textbook business faces significant price competition. Some of our competitors have adopted, and may continue to adopt, aggressive pricing policies and devote substantial resources to marketing, website and systems development.
16
In addition, a variety of business models are being pursued for the provision of print and digital textbooks, some of which may be more profitable or successful than our business model. Furthermore, the market for course materials is diluted from counterfeiting and piracy of digital and print copies or illegal copies of selected chapters made by students or others; user and faculty created content; and sharing or non-purchase of required course materials by students.
TRENDS AND OTHER FACTORS AFFECTING OUR BUSINESS
Current trends and other factors affecting our business include:
• | Overall Economic Environment, College Enrollment and Consumer Spending Patterns: Our business is affected by funding levels at colleges and universities, by changes in enrollments at colleges and universities, and spending on textbooks and general merchandise. The growth of our business depends on our ability to attract new students and to increase the level of engagement by existing students. Historically, increasing enrollment has been a significant driver of sales growth at campus bookstores, a trend that is expected to continue in the long term. According to the National Center for Education Statistics of the U.S. Department of Education ("NCES"), total enrollment in post-secondary degree-granting institutions is expected to increase 9.6%, from 20.6 million in 2012 to 22.6 million in 2026 driven by increased demand for educational services. |
• | Supply Chain and Inventory: Since the demand for used and new textbooks has historically been greater than the available supply, our financial results are highly dependent upon MBS Wholesale’s ability to build its textbook inventory from suppliers in advance of the selling season. |
• | Demand for Digital Offerings: Over the longer-term, we anticipate significant new opportunities for our digital product offerings. Through our LoudCloud platform, we address the growing demand for alternative forms of educational materials and learning tools. Technology-enabled learning is a key growth area in the higher education industry, as a growing number of students are enrolling in online digital courses, and we are ready to meet demand with our virtual bookstore and e-commerce solutions, as well as our OER courseware offering. |
• | New and Existing Bookstore Contracts: We expect awards of new accounts resulting in new physical and virtual store openings will continue to be an important driver of future growth in our business. We are awarded additional contracts for stores as colleges and universities decide to outsource their bookstore, and we also obtain new contracts for stores that were previously operated by competitors. Our virtual bookstore capability expands our addressable market to include schools that cannot or prefer not to have a physical campus bookstore. Sales trends are primarily impacted by new store openings, increasing the students and faculty served, as well as changes in comparable store sales and store closings. Closed stores are primarily comprised of satellite store locations that we elected to close and we continue to operate the main contract, contracts with low sales volume, as well as those contracts that may have been lost in a competitive bid process. During Fiscal 2017, BNC opened 38 stores with estimated first year annual sales of $118 million, and closed 20 stores. As of June 16, 2017, BNC has signed additional contracts for 23 new physical stores with estimated first year annual sales of $50 million, which we expect to open during our Fiscal 2018. MBS Direct has opened 80 virtual bookstores during the 52 weeks ending April 29, 2017, with estimated first year annual sales of $17 million, and has signed additional contracts to open 46 new accounts in Fiscal 2018 for estimated first year annual sales of $8 million. |
• | Campus Bookstore Outsourcing: We continue to see increasing trends towards outsourcing in the campus bookstore market, including virtual bookstores and online marketplace websites. We also continue to see a variety of business models being pursued for the provision of textbooks, course materials and general merchandise. Contract costs, which are included in cost of sales, and primarily consist of the payments we make to the colleges and universities to operate their official bookstores (management service agreement costs), including rent expense, have generally increased as a percentage of sales as a result of increased competition for renewals and new store contracts. |
• | Course Materials Market: In addition to the competition in the services we provide to our customers, our textbook business faces significant price competition. Many students purchase from multiple textbook providers, are highly price sensitive and can easily shift spending from one provider or format to another. Some of our competitors have adopted, and may continue to adopt, aggressive pricing policies and devote substantial resources to marketing, website and systems development. As we expanded our textbook rental offerings, students have been shifting away from higher priced textbook purchases to lower priced rental options, which has resulted in lower textbook sales and increasing rental income. After several years of comparable store sales declines, primarily due to lower textbook unit volume, during the 52 weeks ended May 2, 2015, our comparable store sales trends improved for both textbooks and general merchandise. For the 52 weeks ended April 29, 2017, our comparable store sales declined by 3.0% primarily due to lower community college enrollment and general weakness in the retail environment. |
• | Retail Environment: BNC general merchandise sales, which are subject to short-term fluctuations driven by the broader retail environment, continue to increase over the long term as our product assortments continue to emphasize and reflect the changing consumer trends, and we evolve our presentation concepts and merchandising of products in stores and online. However, lighter store traffic and a continued reluctance by the consumer to make discretionary purchases have created a softer retail |
17
environment. We are confident in our assortment and have received encouraging customer response to our promotional and digital marketing efforts, especially as it relates to web orders. We are encouraged by the growth in our e-commerce sales and expect general merchandise sales to improve as the general retail environment rebounds, but we are taking a cautious approach given the overall uncertainty in the market.
EMPLOYEES
As of April 29, 2017, BNC and MBS had approximately 5,800 and 900 full time and regularly scheduled part-time employees, respectively, or a total of 6,700 full time and regularly scheduled part-time employees. In addition, both BNC and MBS hired approximately 13,000 and 350 additional temporary employees, respectively, during peak periods during Fiscal 2017. Our employees are not represented by unions, with the exception of 25 employees. We believe that our relationship with our employees is good.
EXECUTIVE OFFICERS
The following sets forth information regarding our executive officers, including their positions (ages as of June 16, 2017):
Name | Age | Position | ||
Michael P. Huseby | 62 | Executive Chairman | ||
Max J. Roberts | 64 | Chief Executive Officer | ||
Patrick Maloney | 61 | Executive Vice President and Chief Operating Officer Executive Vice President and President, Barnes & Noble College | ||
William Maloney | 68 | Executive Vice President | ||
Barry Brover | 56 | Chief Financial Officer | ||
Kanuj Malhotra | 50 | Chief Strategy and Development Officer and Chief Operating Officer, Digital Education | ||
Michael C. Miller | 45 | Chief Legal Officer and Vice President of Corporate Affairs | ||
Suzanne E. Andrews | 57 | Vice President, General Counsel, and Corporate Secretary | ||
Jay Chakrapani | 46 | Vice President, Chief Digital Officer | ||
Stephen Culver | 52 | Vice President, Chief Information Officer | ||
Thomas D. Donohue | 47 | Vice President, Treasurer and Investor Relations | ||
Joel Friedman | 66 | Vice President, Chief Merchandising Officer | ||
JoAnn Magill | 63 | Vice President, Chief Human Resources Officer | ||
Lisa Malat | 57 | Vice President, Operations and Chief Marketing Officer | ||
Seema C. Paul | 53 | Vice President, Chief Accounting Officer | ||
Michael P. Huseby, age 62, serves as our Executive Chairman, elected in August 2015, and a director, elected in July 2013. He has served as the Chief Executive Officer and a member of the board of directors of Barnes & Noble, Inc. from January 2014 until the Spin-Off. Previously, Mr. Huseby was appointed Chief Executive Officer of NOOK Media LLC and President of Barnes & Noble, Inc. in July 2013, and Chief Financial Officer of Barnes & Noble, Inc. in March 2012. From 2004 to 2011, Mr. Huseby served as Executive Vice President and Chief Financial Officer of Cablevision Systems Corporation, a leading telecommunications and media company acquired by Altice Group. He served on the Cablevision Systems Corporation Board in 2000 and 2001. Prior to joining Cablevision, Mr. Huseby served as Executive Vice President and Chief Financial Officer of Charter Communications, Inc., then the fourth largest cable operator in the United States. Mr. Huseby served on the Board of Directors of Charter Communications from May 2013 to May 2016. From 1999 to 2002, Mr. Huseby served as Executive Vice President, Finance and Administration, of AT&T Broadband, a provider of cable television services. Since July 2016 to present, Mr. Huseby is a member of the Board of Directors of Commercehub, Inc., serving as the Chair of the Audit Committee and member of the Compensation Committee. In addition, Mr. Huseby spent over 23 years at Arthur Andersen, LLP and Andersen Worldwide, S.C., where he held the position of Global Equity Partner.
Max J. Roberts, age 64, serves as our Chief Executive Officer. Mr. Roberts joined our company in 1996 as President, and has served as Chief Executive Officer, of Barnes & Noble College since August of 2013. Prior to joining Barnes & Noble College in 1996, Mr. Roberts held senior executive positions at Petrie Retail, R.H. Macy & Company and May Department Stores. Mr. Roberts started his professional career at the global public accounting firm of Touche Ross & Company (currently Deloitte).
Patrick Maloney, age 61, serves as our Executive Vice President and Chief Operating Officer. Mr. Maloney is also President of Barnes & Noble College. In this role, he oversees operations at all bookstores nationwide, including bookstore e-commerce, store design and construction, internal operations, learning and development, and book and general merchandising departments. Mr. Maloney began his career at Barnes & Noble in 1974 as a student and assistant manager at SUNY Stony Brook University.
18
William Maloney, age 68, serves as our Executive Vice President. Mr. Maloney has served as Executive Vice President of Barnes & Noble College since 2002. In this role, he oversees campus relations activities, builds partnerships and handles strategic planning and corporate marketing activities. Mr. Maloney began his career at Barnes & Noble in 1971 as a Regional Manager and Operations Director.
Barry Brover, age 56, serves as our Chief Financial Officer. In this role, he oversees all aspects of accounting and finance, including treasury, investor relations, risk management, and tax, as well as provides strategic leadership in areas related to operations and business development. Mr. Brover has served as Chief Financial Officer of Barnes & Noble College since 2006. Mr. Brover joined Barnes & Noble College in 1986 and has held various executive positions with increasing responsibility. Prior to joining Barnes & Noble College, Mr. Brover started his career at KPMG where he earned his CPA.
Kanuj Malhotra, age 50, serves as our Chief Strategy and Development Officer and Chief Operating Officer, Digital Education. Mr. Malhotra was appointed Chief Financial Officer of NOOK Media LLC in July 2013. He joined Barnes & Noble as Vice President of Corporate Development in May 2012. Prior to joining the Company, Mr. Malhotra was Vice President and Finance Head for Kaplan Test Prep, a division of The Washington Post Company, from 2011 to 2012. At Kaplan, he led a business transformation from physical test centers to a digital online learning platform. From 2008 to 2010, Mr. Malhotra was Chief Financial Officer of Sloane Square Partners LLC. Between 2005 and 2007, he was the Chief Financial Officer for the International Division of the Cendant Marketing Group and Affinion International, which was divested by Cendant Corporation to Apollo Management. Mr. Malhotra began his career in Mergers and Acquisitions at Lehman Brothers.
Michael C. Miller, age 45, has been Chief Legal Officer and Vice President of Corporate Affairs for Barnes & Noble Education, and its subsidiaries since April 2017. Before joining the Company, he served as Executive Vice President, General Counsel and Secretary of Monster Worldwide, Inc. from December 2008 through December 2016, as Vice President and Deputy General Counsel from July 2008 to December 2008, and as Vice President and Associate General Counsel from October 2007 to July 2008. Prior to Monster, Mr. Miller was Senior Counsel for Motorola, Inc. from February 2007 to September 2007. From June 2002 to January 2007, he served in various capacities as Senior Corporate Counsel for Symbol Technologies, Inc. Prior to joining Symbol, Mr. Miller was associated with both Sullivan & Cromwell, LLP and Winthrop, Stimson, Putnam & Roberts in New York.
Suzanne E. Andrews, age 57, joined the Company in September 2015 as Vice President, General Counsel, and Corporate Secretary. Ms. Andrews provides guidance to the Company and its Board of Directors on corporate governance and Securities and Exchange Commission matters, including public disclosures, mergers and acquisitions, compliance, intellectual property, vendor management, e-commerce, litigation, and employment. Prior to joining Barnes & Noble Education, Ms. Andrews served as General Counsel to Investors Bank from 2013 to 2015, and General Counsel to Healthcare Finance Group from 2004 to 2013. Ms. Andrews has also held positions with several law firms in New York.
Jay Chakrapani, age 46, joined the Company in August 2015 as our Chief Digital Officer. In this role he leads the product planning and development for the digital business and is responsible for development of digital content offerings and operations. Prior to joining the Company, Mr. Chakrapani served as President of CK-12 Foundation, a digital learning company, from February 2013 to January 2015 and prior to that he was with McGraw-Hill Higher Education-Digital from 2007 to 2013.
Stephen Culver, age 52, serves as our Vice President, Chief Information Officer and is responsible for overseeing the Company’s Information Technology operations and strategic development. Prior to joining Barnes & Noble College in 2005, Mr. Culver held leadership positions in both the private and public sectors. He owned and presided over an Information Technology consulting company, which specialized in the retail and wholesale industries. As CIO of Giorgio Armani Corporation, he led the Information Technology operations during the development and expansion of their North American operations.
Thomas D. Donohue, age 47, serves as our Vice President, Investor Relations and Treasurer. Mr. Donohue served as Treasurer of Barnes & Noble, Inc. since June 2012. In that role, he was responsible for the leadership and direction of all treasury activities including corporate finance, capital structure, cash management, financial risk management, international finance, debt management and relationships with financial institutions. Prior to joining Barnes & Noble Inc., he worked at The Interpublic Group of Companies for 12 years, a global provider of advertising and marketing services, where he served as Vice President, Assistant Treasurer, International from May 2004 to May 2012.
Joel Friedman, age 66, serves as our Vice President, Chief Merchandising Officer. In his time at Barnes & Noble College, Mr. Friedman has managed the non-book sales, developed store concepts and directed the planning, design and interior build outs of the Company’s many store renovations and new store projects. He joined Barnes & Noble College in 1998 after a 20 year career in department store merchandising of menswear apparel in Boston with Federated based Filene’s and Jordan Marsh, a five year term in product development and sourcing of menswear and children’s apparel with Fredrick Atkins and a one year term with Capital Mercury, a wholesale importer, running their product development and design department.
19
JoAnn Magill, age 63, serves as our Vice President, Chief Human Resources Officer. In her time at Barnes & Noble College, Ms. Magill has been responsible for the development, implementation, and coordination of policies, practices and programs to include employee relations, recruitment, benefits, payroll and compensation for the bookstores and home office. She joined the company in 2003 after a five year career as the Vice President of Human Resources for the AT&T Broadband Media Services Team. Prior to that she had an extensive 25 year career with Pathmark Supermarkets, where she held a variety of field and corporate leadership roles.
Lisa Malat, age 57, serves as our Vice President, Operations and Chief Consumer Marketing Officer. Ms. Malat provides strategic direction and executive oversight to Barnes & Noble College’s campus stores in the areas of consumer and corporate marketing, learning and development and in-store and e-commerce strategy and operational efficiencies. Prior to joining Barnes & Noble College in 1996, Ms. Malat held several senior level management positions at Macy’s, including roles in store operations, process re-engineering, distribution, customer service, and learning and development.
Seema C. Paul, age 53, joined the Company in July 2015 as our Vice President, Chief Accounting Officer. In this role she manages external reporting and technical accounting, corporate accounting, and financial reporting functions of the Company. Prior to joining the Company, Ms. Paul held positions of increasing responsibility at Covanta Holding Corporation, including Corporate Controller from July 2014 to July 2015, Senior Director-External Reporting & Technical Accounting from June 2013 to July 2014, Director-External Reporting from January 2011 to May 2013 and Manager-External Reporting from August 2005 to December 2010. Ms. Paul is a Certified Public Accountant and has held various senior financial roles with several large companies, including Net2Phone, Sybase, Inc. and Liberty Mutual Insurance Company.
20
Item 1A. RISK FACTORS
The risks and uncertainties described below are not the only ones faced by us. Additional risks and uncertainties not presently known or that are currently deemed immaterial also may impair our business operations. If any of the following risks occur, our business, financial condition, operating results and cash flows and the trading price of our Common Stock could be materially adversely affected.
Risks Relating to Our Business
We face significant competition in our business, and we expect such competition to increase.
The market for course materials, including textbooks and supplemental materials, is intensely competitive and subject to rapid change. We are experiencing growing competition from alternative media and alternative sources of textbooks and course-related materials, such as websites that sell or rent textbooks, eTextbooks, digital content and other merchandise directly to students; online resources, including open educational resources; publishers including Cengage, Pearson and McGraw Hill, bypassing the bookstore distribution channel by selling directly to students and educational institutions; print-on-demand textbooks; textbook rental companies; and student-to-student transactions over the Internet. We also have competition from other college bookstore operators and educational content providers, including Akademos, a virtual bookstore and marketplace for academic institutions; Amazon.com, an e-commerce operator and a provider of contract services to colleges and universities; BBA Solutions, a college textbook retailer; bn.com, the e-commerce platform of Barnes & Noble, Inc.; Chegg.com, an online textbook rental company; Civitas Learning, a learning analytics platform; eCampus, an online provider of course materials; Follett Corporation, a contract operator of campus bookstores; IndiCo, an entity created by National Association of College Bookstores (“NACS”); Texas Book Company, bookstore management and operations; and Vital Source Technologies, Inc., a digital course materials provider. We also have competition from providers of eTextbooks, such as Apple iTunes, Blackboard, Google, and Redshelf; Vital Source Technologies, Inc., and various private textbook rental websites. In addition, Akademos and Amazon have recently begun to develop relationships with colleges and universities to provide online bookstore solutions which not only competes with our physical bookstore operations but also competes with our subsidiary MBS’ Direct virtual solution. MBS Direct also faces competition from Ambassador Educational Solutions, eCampus, edMap, EdTech, Follett Corporation, Texas Book Company, Tree of Life, and VitalSource Technologies, Inc. MBS Wholesale competes with Amazon, BBA Solutions, Follett Corporation, IndiCo, Nebraska Book Company, and Texas Book Company. Competitors that compete with our general merchandise offerings include Fanatics, Sodexo & Aramark, online retailers, and physical and online office supply stores. Students often purchase from multiple textbook providers, are highly price sensitive, and can easily shift spending from one provider or format to another. As a consequence, in addition to being competitive in the services we provide to our customers, our textbook business faces significant price competition. Some of our competitors have adopted, and may continue to adopt, aggressive pricing policies and devote substantial resources to marketing, website and systems development. In addition, a variety of business models are being pursued for the provision of print and digital textbooks, some of which may be more profitable or successful than our business model. Furthermore, the market for course materials is diluted from counterfeiting and piracy of digital and print copies or illegal copies of selected chapters made by students or others; user and faculty created content; and sharing or non-purchase of required course materials by students.
We may not be able to enter into new managed bookstore contracts or successfully retain or renew our managed bookstore contracts on profitable terms.
An important part of our business strategy for both BNC and MBS Direct is to expand sales for our college bookstore operations by being awarded additional contracts to manage physical and/or online bookstores for colleges and universities, and private/parochial K-12 schools, across the United States. Our ability to obtain those additional contracts is subject to a number of factors that we are not able to control. In addition, the anticipated strategic benefits of new and additional college and university bookstores may not be realized at all or may not be realized within the time frames contemplated by management. In particular for BNC’s operation of physical bookstores, contracts for additional managed stores may involve a number of special risks, including adverse short-term effects on operating results, diversion of management’s attention and other resources, standardization of accounting systems, dependence on retaining, hiring and training key personnel, unanticipated problems or legal liabilities, and actions of our competitors and customers. Because certain terms of any contract are generally fixed for the initial term of the contract and involve judgments and estimates that may not be accurate, including for reasons outside of our control, we have contracts that are not profitable and may have such contracts in the future. The retail price charged to the consumer for textbooks is set by our contracts with colleges and universities to be a maximum markup based on the publishers’ costs and if prices were reduced by publishers, it could negatively impact our revenues and margin. Even if we have the right to terminate a contract, we may be reluctant to do so even when a contract is unprofitable due to, among other factors, the potential effect on our reputation.
In addition, we may face significant competition in retaining existing physical and online store contracts and when renewing those contracts as they expire. Our BNC contracts are typically for five years with renewal options, but can range from one to 15 years, and most contracts are cancelable by either party without penalty with 90 to 120 days' notice. Our MBS Direct contracts are typically for three to five years and most are cancellable without penalty with notice. Despite the lower startup and ongoing
21
operating expense associated with online stores, the loss of such contracts could impact revenue and profitability. We may not be successful in retaining our current contracts, renewing our current contracts or renewing our current contracts on terms that provide us the opportunity to improve or maintain the profitability of managing stores that are the subject matter of such contracts.
We face the risk of disruption of supplier relationships and/or supply chain and/or inventory surplus.
The retail products that we sell and products for the MBS wholesale business originate from a wide variety of domestic and international vendors. During Fiscal 2017, BNC’s four largest retail suppliers, including MBS, accounted for approximately 42% of our merchandise purchased, with the largest supplier accounting for approximately 17% of our merchandise purchased. MBS Wholesale sources over 80% of its inventory from two primary channels, approximately 50% from retail bookstores (including BNC) and approximately 32% from third party suppliers. While we believe that our relationships with our suppliers are good, suppliers may modify the terms of these relationships due to general economic conditions or otherwise or, especially with respect to wholesale inventory, publishers could terminate distribution to wholesalers such as MBS.
We do not have long-term arrangements with most of our suppliers to guarantee availability of merchandise, content or services, particular payment terms or the extension of credit limits. If our current suppliers were to stop selling merchandise, content or services to us on acceptable terms, including as a result of one or more supplier bankruptcies due to poor economic conditions, we may be unable to procure the same merchandise, content or services from other suppliers in a timely and efficient manner and on acceptable terms, or at all. Furthermore, certain of our merchandise is sourced indirectly from outside the United States. Political or financial instability, merchandise quality issues, product safety concerns, trade restrictions, work stoppages, tariffs, foreign currency exchange rates, transportation capacity and costs, inflation, civil unrest, natural disasters, outbreaks of pandemics and other factors relating to foreign trade are beyond our control and could disrupt our supply of foreign-sourced merchandise.
In addition, our retail and wholesale businesses are dependent on the continued supply of textbooks. The publishing industry generally has suffered recently due to, among other things, changing consumer preferences away from the print medium and the economic climate. A significant disruption in this industry generally or a significant unfavorable change in our relationships with key suppliers could adversely impact our business. In addition, any significant change in the terms that we have with our key suppliers including, purchase or rental general terms, payment terms, return policies, the discount or margin on products or changes to the distribution model of textbooks, could adversely affect our financial condition and liquidity. For example, some textbook publishers have proposed to supply textbooks on consignment terms, instead of selling to us, which would eliminate those titles from the used textbook inventory supply. With respect to the business of MBS Wholesale, the demand for used and new textbooks is typically greater than the available supply, and MBS is highly dependent upon its ability to build its textbook inventory from publishers and suppliers in advance of the selling season. These relationships are not generally governed by long-term contracts and publishers and suppliers could choose not to sell to MBS. Any negative impact on MBS's ability to build its textbook inventory could have an adverse impact on financial results.
In addition, we have significantly increased our textbook rental business, offering students a lower cost alternative to purchasing textbooks, which is also subject to certain inventory risks, such as textbooks not being resold or re-rented due to textbooks being returned late or in poor condition, faculty members not continuing to adopt or use certain textbooks, or, as discussed above, changes in the way publishers supply textbooks to us.
Our results also depend on the successful implementation of our strategic initiatives. We may not be able to implement these strategies successfully, on a timely basis, or at all.
Our ability to grow depends upon a number of factors, including our ability to implement our strategic initiatives to retain and expand existing customer relationships, acquire new accounts, expand sales channels and marketing efforts, develop and market higher education digital products and adapt to changing industry trends. While we believe we have the capital resources, experience, management resources and internal systems to successfully operate our business, we may not be successful in implementing these strategies. The implementation of our digital strategy is a complex process and relies on leveraging our core products, services and relationships to help accelerate the adoption of our new digital products and services. Success of our future operating results will be dependent upon rapid customer adoption of our new digital products and services and our ability to scale our business to meet customer demand appropriately. If colleges and universities, faculty and students are not receptive to our new products and services or our new products and services do not meet the expectations of these constituencies, there could be a negative impact on the implementation of our strategy. To successfully execute on this strategy, we need to continue to further evolve the focus of our organization towards the delivery of cost effective and unique solutions for our customers. Any failure to successfully execute this strategy could adversely affect our operating results. Further, even if successfully implemented, our business strategy may not ultimately produce positive results.
22
We may not achieve the strategic objectives, anticipated synergies, and/or other expected potential benefits of the recent acquisition of MBS Textbook Exchange, LLC.
We recently announced the acquisition of MBS Textbook Exchange, LLC (“MBS”). MBS is the largest contract operator of virtual bookstores for the institutional client market and one of the largest textbook wholesalers in the U.S. We expect to realize strategic and other financial and operating benefits as a result of the acquisition of MBS, including leveraging MBS’s wholesale distribution channel and warehousing systems to enable BNC to optimize its textbook sourcing, purchasing and liquidation processes, and increasing sales of product offerings through relationships with MBS customers. However, we cannot predict with certainty the extent to which these benefits will actually be achieved or the timing of any such benefits. The following factors, among others, may prevent us from realizing these benefits:
• | we may not be able to leverage additional sales from the expanded customer base; |
• | we may fail to retain key employees; and |
• | we may not be able to integrate the business of MBS in an efficient and effective manner. |
In addition, the integration process could also take longer than we anticipate and could result in the disruption of ongoing businesses, processes and systems or inconsistencies in standards, controls, procedures, practices and policies, any of which could adversely affect our ability to achieve the benefits it anticipates.
MBS Wholesale may not be able to manage its inventory levels effectively which may lead to excess inventory or inventory obsolescence.
MBS Wholesale sources new textbooks from publishers and new and used textbooks from other suppliers to resell to its customers. If it is unable to appropriately manage its inventory and anticipate the release of new editions of titles, faculty’s change in choice of titles, return rate, or use of alternative educational material, MBS Wholesale could be exposed to risks of excess inventory and less marketable or obsolete inventory. This may lead to excess or obsolete inventory which might have to be sold at a deep discount impacting its revenues and profit margin and may have a negative impact on our financial condition and results of operations.
Our strategy includes pursuing strategic acquisitions and partnerships and we may not be able to identify and successfully complete such transactions.
In addition to the MBS acquisition, as part of our strategy, we have acquired, and, may in the future acquire, businesses or business operations, or enter into other business transactions, such as our acquisition of LoudCloud Systems, Inc. and strategic commercial agreement with Vital Source Technologies, Inc. We may not be able to identify suitable candidates for additional business combinations and strategic investments, obtain financing on acceptable terms for such transactions, obtain necessary regulatory approvals, if any, or otherwise consummate such transactions on acceptable terms, or at all. In addition, we compete for acquisitions with other potential acquirers, some of which may have greater financial or operational resources than we do. This competition may increase costs of acquiring desirable businesses, and, as a result, we may be unable to make acquisitions or be forced to pay more or agree to less advantageous acquisition terms for the businesses that we are able to acquire. Any strategic acquisitions or investments that we are able to identify and complete may also involve a number of risks, including our inability to successfully or profitably integrate, operate, maintain and manage our newly acquired operations or employees; the diversion of our management’s attention from our existing business to integrate operations and personnel; possible material adverse effects on our results of operations during the integration process; becoming subject to contingent or other liabilities, including liabilities arising from events or conduct predating the acquisition that were not known to us at the time of the acquisition; and our possible inability to achieve the intended objectives of the transaction, including the inability to achieve cost savings and synergies. Acquisitions may also have unanticipated tax, legal, regulatory and accounting ramifications, including recording goodwill and non-amortizable intangible assets that are subject to impairment testing on a regular basis and potential periodic impairment charges and incurring amortization expenses related to certain intangible assets.
Our business is dependent on the overall economic environment, college enrollment and consumer spending patterns.
A deterioration of the current economic environment could have a material adverse effect on our financial condition and operating results, as well as our ability to fund our growth and strategic business initiatives. Our business is affected by funding levels at colleges and universities and by changes in enrollments at colleges and universities, changes in student enrollments and lower spending on textbooks and general merchandise. The growth of our business depends on our ability to attract new students and to increase the level of engagement by existing students. To the extent we are unable to attract new students or students spend less generally, our business could be adversely affected.
Our business relies on certain key personnel.
Management believes that our continued success will depend to a significant extent upon the efforts and abilities of certain of our key personnel. The loss of the services of any of these key personnel could have a material adverse effect on our business. We do not maintain “key man” life insurance on any of our officers or other employees.
23
Our business is seasonal.
Our retail business is seasonal, with sales generally highest in the second and third fiscal quarters, when college students generally purchase textbooks for the upcoming semesters, and lowest in the first and fourth fiscal quarters. Sales attributable to the MBS wholesale business are generally highest in our first, second and third quarter as it sells textbooks for retail distribution, which somewhat offsets the decreased first quarter sales attributable to our retail business. Less than satisfactory net sales during our peak fiscal quarters could have a material adverse effect on our financial condition or operating results for the year, and our results of operations from those quarters may not be sufficient to cover any losses that may be incurred in the other fiscal quarters of the year.
Our international operations could result in additional risks.
Historically, our operations have been limited to the United States; however, we contract with service providers outside the United States and we recently have acquired operations in India (and we may continue to expand internationally). Such international expansion may result in additional risks that are not present domestically and which could adversely affect our business or our results of operations, including compliance with additional United States regulations and those of other nations applicable to international operations; cultural and language differences; currency fluctuations between the U.S. dollar and foreign currencies, which are harder to predict in the current adverse global economic climate; restrictions on the repatriation of earnings; potentially adverse tax consequences and limitations on our ability to utilize losses generated in our foreign operations; different regulatory requirements and other barriers to conducting business; and different or less stable political and economic environments. Further, conducting business abroad subjects us to increased regulatory compliance and oversight. For example, in connection with our international operations, we are subject to laws prohibiting certain payments to governmental officials, such as the Foreign Corrupt Practices Act. A failure to comply with applicable regulations could result in regulatory enforcement actions as well as substantial civil and criminal penalties assessed against us and our employees.
We face data security risks with respect to personal information.
Our business involves the receipt, storage, processing and transmission of personal information about customers and employees. We may share information about such persons with vendors and third parties that assist with certain aspects of our business. Also, in connection with our student financial aid platform and the processing of university debit cards, we secure and have access to certain student personal information that has been provided to us by the universities we serve. Our handling and use of personal information is regulated at the international, federal and state levels and by industry standards, such as the Payment Card Industry Data Security Standard. As an entity that provides services to institutions of higher education, we are contractually bound to handle certain personal information from student education records in accordance with the requirements of Family Educational Rights and Privacy Act (“FERPA”). Privacy and information security laws, regulations, and industry standards change from time to time, and compliance with them may result in cost increases due to necessary systems changes and the development of new processes and may be difficult to achieve. If we fail to comply with these laws, regulations and standards, we could be subjected to legal risk. In addition, even if we fully comply with all laws, regulations and standards, and even though we have taken significant steps to protect personal information, we could experience a data security breach, and our reputation could be damaged, possibly resulting in a material breach of contract with one or more of our clients, lost future sales or decreased usage of credit and debit card products. Further, in the event that we disclose student information in violation of FERPA, the U.S. Department of Education could require a client to suspend our access to their student information for at least five years. Because the techniques used to obtain unauthorized access, disable or degrade service, or sabotage systems change frequently and often are not recognized until launched against a target, we may be unable to anticipate these techniques or to implement adequate preventative measures. A party that is able to circumvent our security measures could misappropriate our or our users’ proprietary information and cause interruption in our operations. Any compromise of our data security could result in a violation of applicable privacy and other laws or standards, significant legal and financial exposure beyond the scope or limits of insurance coverage, increased operating costs associated with remediation, equipment acquisitions or disposal and added personnel, and a loss of confidence in our security measures, which could harm our business or affect investor confidence. Data security breaches may also result from non-technical means, for example, actions by an employee.
Computer malware, viruses, hacking and phishing attacks could harm our business and results of operations.
We are increasingly dependent upon information technology systems, infrastructure and data. Our computer systems may be vulnerable to service interruption or destruction, malicious intrusion, ransomware and random attack. Cyber-attacks are increasing in their frequency, sophistication and intensity, and have become increasingly difficult to detect. Cyber-attacks could include the deployment of harmful malware, denial-of service, social engineering, ransomware and other means to affect service reliability and threaten data confidentiality, integrity and availability. Our key business partners face similar risks, and a security breach of their systems could adversely affect our security posture. While we continue to invest data protection and information technology, there can be no assurance that our efforts will prevent service interruptions, or identify breaches in our systems, that could adversely affect our business and operations and/or result in the loss of critical or sensitive information, which could result in financial, legal, business or reputational harm.
24
Laws or regulations may be enacted which restrict or prohibit use of emails or similar marketing activities that we currently rely on.
Our marketing efforts are centered around an active digital community, which includes engaged email subscribers and our continuous dialogue with customers on our school-customized social media channels. For example, the following laws and regulations may apply:
•the CAN-SPAM Act of 2003 and similar laws adopted by a number of states regulate unsolicited commercial emails, create civil and criminal penalties for emails containing fraudulent headers and control other abusive online marketing practices; and
•the U.S. Federal Trade Commission (FTC) has guidelines that impose responsibilities on companies with respect to communications with consumers and impose fines and liability for failure to comply with rules with respect to advertising or marketing practices they may deem misleading or deceptive.
Even if no relevant law or regulation is enacted, we may discontinue use or support of these activities if we become concerned that students or potential students deem them intrusive or they otherwise adversely affect our goodwill and brand. If our marketing activities are curtailed, our ability to attract new students may be adversely affected.
Our business could be impacted by changes in federal, state, local or international laws, rules or regulations.
We are subject to general business regulations and laws relating to all aspects of our business. These regulations and laws may cover taxation, privacy, data protection, our access to student financial aid, pricing and availability of educational materials, competition and/or antitrust, content, copyrights, distribution, college distribution, mobile communications, electronic contracts and other communications, consumer protection, the provision of online payment services, unencumbered Internet access to our services, the design and operation of websites, digital content (including governmental investigations and litigation relating to the agency pricing model for digital content distribution), the characteristics and quality of products and services and labor and employee benefits (including the costs associated with complying with the Patient Protection and Affordable Care Act or any legislation enacted in connection with repeal of the Affordable Care Act). Changes in federal, state, local or international laws, rules or regulations relating to these matters could increase regulatory compliance requirements in addition to increasing our costs of doing business or otherwise impact our business. For example, changes in federal and state minimum wage laws could raise the wage requirements for certain of our employees at our retail locations, which would increase our selling costs and may cause us to reexamine our wage structure for such employees.
Changes in tax laws and regulations might adversely impact our businesses or financial performance.
We collected sales tax on the majority of the products and services that we sold in our respective prior fiscal years that were subject to sales tax, and we generally have continued the same policies for sales tax within the current fiscal year. While management believes that the financial statements included elsewhere in this Form 10-K reflect management’s best current estimate of any potential additional sales tax liability based on current discussions with taxing authorities, we cannot assure you that the outcome of any discussions with any taxing authority will not result in the payment of sales taxes for prior periods or otherwise, or that the amount of any such payments will not be materially in excess of any liability currently recorded. In the future, our businesses may be subject to claims for not collecting sales tax on the products and services we currently sell for which sales tax is not collected. In addition, our provision for income taxes and our obligation to pay income tax is based on existing federal, state and local tax laws. Changes to these laws, in particular as they relate to depreciation, amortization and cost of goods sold, could have a significant impact on our income tax provision, our projected cash tax liability, or both.
Our expansion into new products, services and technologies subjects us to additional business, legal, financial and competitive risks.
We may require additional capital in the future to sustain or grow our business. Our gross profits and margins in our newer activities may be lower than in our traditional activities, and we may not be successful enough in these newer activities to recoup our investments in them. In addition, we may have limited or no experience in our newer products and services, and our customers may not adopt our new product or service offerings. Some of these offerings may present new and difficult technological challenges, and we may be subject to claims if customers of these offerings experience service disruptions or failures or other quality issues.
We are dependent upon access to the capital markets, bank credit facilities, and short-term vendor financing for liquidity needs.
We must have sufficient sources of liquidity to fund working capital requirements. We believe that the combination of cash-on-hand, cash flow received from operations, funds available under our revolving senior credit facility and short-term vendor financing will be sufficient to meet our normal working capital and debt service requirements for at least the next twelve months. If these sources of liquidity do not satisfy our requirements, we may need to seek additional financing. The future availability of financing will depend on a variety of factors, such as economic and market conditions, and the availability of credit. These factors could materially adversely affect our costs of borrowing, and our financial position and results of operations would be adversely impacted. Volatility in global financial markets may also limit our ability to access the capital markets at a time when we would
25
like, or need, to raise capital, which could have an impact on our ability to react to changing economic and business conditions. Accordingly, if the economy worsens, our business, results of operations and financial condition could be materially and adversely affected.
We rely upon third party web service providers to operate certain aspects of our service and any disruption of or interference with such services would impact our operations and our business would be materially and adversely impacted.
Amazon Web Services (“AWS”) and other third party web service providers provide a distributed computing infrastructure platform for business operations, or what is commonly referred to as a “cloud” computing service. We have architected our software and computer systems so as to utilize data processing, storage capabilities, and other services provided by AWS and other providers. Any disruption of or interference with our use of AWS or other third party service providers would impact our operations and our business would be materially and adversely impacted.
We rely heavily on proprietary technology to process deliveries and returns of the textbooks and to manage other aspects of our operations.
We, primarily through our subsidiary MBS, use a proprietary system to source, distribute and manage inventory of textbooks and to manage other aspects of our operations, including systems to consider the market pricing for textbooks, general availability of textbook titles and other factors to determine how to buy textbooks and set prices for textbooks and other content in real time. MBS has invested significant amounts of resources in the hardware and software to develop this system. We rely on the expertise of our engineering and software development teams to maintain and enhance the equipment and software used for our distribution operations. We cannot be sure that the maintenance and enhancements we make to our distribution operations will achieve the intended results or otherwise be of value to students. If we are unable to maintain and enhance our technology to manage textbook sourcing, distribution and inventory, it could disrupt our business operation and have a material adverse impact on our results.
Defects, errors, installation difficulties or performance issues with our point-of-sales and other systems could expose us to potential liability, harm our reputation and negatively impact our business.
MBS sells and services point-of-sales systems to its college bookstore customers. These systems are complex and incorporate third-party hardware and software. Despite testing and quality control, we cannot be certain that defects or errors will not be found in these systems. In addition, because these systems are installed in different environments, we may experience difficulty or delay in installation. Our products may be integrated with other components or software, and, in the event that there are defects or errors, it may be difficult to determine the origin of defects or errors. Additionally, any difficulty or failure in the operation of these systems could cause business disruption for MBS’ customers. If any of these risks materialize, they could result in additional costs and expenses, exposure to liability claims, diversion of technical and other resources to engage in remediation efforts, loss of customers or negative publicity, each of which could impact our business and operating results.
Our MBS subsidiary relies on a sophisticated system for warehousing and distribution of the vast majority of our textbooks and any material failure of that system could impair our ability to operate our businesses.
MBS is dependent on sophisticated equipment and related software technology for the warehousing and distribution of the vast majority of textbooks supplied to us and others located at MBS’ facility in Columbia, Missouri. MBS’ ability to efficiently manage its business depends significantly on the reliability and capacity of these systems. The failure of these systems to operate effectively, problems with maintenance, upgrading or transitioning to replacement systems, especially if such events were to occur during peak periods, could adversely affect our operation, the ability to serve our customers and our results of operations. In addition, substantially all of MBS’ inventory is located in the Columbia warehouse facility. We could experience significant interruption in the operation of this facility or damage or destruction of our inventory due to physical damage to the facility caused by natural disasters, accidents or otherwise. If a material portion of our inventory were to be damaged or destroyed, we would likely incur significant financial loss, including loss of revenue and harm to our customer relationships.
We may not be able to adequately protect our intellectual property rights or may be accused of infringing upon intellectual property rights of third parties.
We regard our trademarks, service marks, copyrights, patents, trade dress, trade secrets, proprietary technology and similar intellectual property as important to our success, and we rely on trademark, copyright and patent law, domain name regulations, trade secret protection and confidentiality or license agreements to protect our proprietary rights, including our use of the Barnes & Noble trademark. Laws and regulations may not adequately protect our trademarks and similar proprietary rights. We may be unable to prevent third parties from acquiring domain names that are similar to, infringe upon or diminish the value of our trademarks and other proprietary or licensed rights.
We may not be able to discover or determine the extent of any unauthorized use of our proprietary rights. The protection of our intellectual property may require the expenditure of significant financial and managerial resources. Moreover, the steps we take to protect our intellectual property may not adequately protect our rights or prevent third parties from infringing or
26
misappropriating our proprietary rights. We also cannot be certain that others will not independently develop or otherwise acquire equivalent or superior technology or other intellectual property rights.
Other parties also may claim that we infringe their proprietary rights. Because of the changes in Internet commerce and digital content businesses, current extensive patent coverage, and the rapid rate of issuance of new patents, it is possible that certain components of our products and business methods may unknowingly infringe existing patents or intellectual property rights of others.
Our digital content offerings depend in part on effective digital rights management technology to control access to digital content. If the digital rights management technology that we use is compromised or otherwise malfunctions, we could be subject to claims, and content providers may be unwilling to include their content in our service.
In addition, the publishing industry has been, and we expect in the future will continue to be, the target of counterfeiting and piracy. While we have in place anti-counterfeit policies and procedures (which include removing from distribution suspected counterfeit titles) for preventing the proliferation of counterfeit textbooks, we may inadvertently purchase counterfeit textbooks which may unknowingly be included in the textbooks we offer for sale or rent to students or we may purchase such textbooks through our buyback program. As such, we may be subject to allegations of selling counterfeit books. We have in the past and may continue to receive communications from publishers alleging that certain textbooks sold or rented by us are counterfeit. When receiving such communications, we cooperate, and will continue to cooperate in the future, with such publishers in identifying fraudulent textbooks and removing them from our inventory. We may implement measures in an effort to protect against these potential liabilities that could require us to spend substantial resources. Any costs incurred as a result of liability or asserted liability relating to sales of counterfeit textbooks could harm our business, reputation and financial condition.
Legal proceedings may significantly harm our business.
From time to time, we may become involved in litigation or other proceedings in the ordinary course of business. It is possible that such litigation or proceedings may significantly harm our future results of operations or financial condition due to expenses we may incur to defend ourselves or the ramifications of an adverse decision.
We do not own the Barnes & Noble trademark and instead rely on a license of that trademark and certain other trademarks, which license imposes limits on what those trademarks can be used to do.
In connection with the Spin-Off, Barnes & Noble, Inc. granted us an exclusive, perpetual, fully paid up, non-transferable and non-assignable license to use the trademarks “Barnes & Noble College,” “B&N College,” “Barnes & Noble Education” and “B&N Education” and the non-exclusive, perpetual, fully paid up, non-transferable and non-assignable license to use the marks “Barnes & Noble,” “B&N” and “BN,” solely in connection with the contract management of college and university bookstores and other bookstores associated with academic institutions and related websites, as well as education products and services (including digital education products and services) and related websites. These restrictions may materially limit our ability to use the licensed marks in the expansion of our operations in the future. In addition, we are reliant on Barnes & Noble, Inc. to maintain the licensed trademarks.
We rely on third-party digital content and applications, which may not be available to us on commercially reasonable terms or at all.
We contract with certain third-parties to offer their digital content. Our licensing arrangements with these third-parties do not guarantee the continuation or renewal of these arrangements on reasonable terms, if at all. Some third-party content providers currently or in the future may offer competing products and services, and could take action to make it more difficult or impossible for us to license our content in the future. Other content owners, providers or distributors may seek to limit our access to, or increase the total cost of, such content. If we are unable to offer a wide variety of content at reasonable prices with acceptable usage rules, our business may be materially adversely affected.
Risks Relating to Our Spin-Off from Barnes & Noble, Inc.
We could have an indemnification obligation to Barnes & Noble, Inc. if the Spin-Off were determined not to qualify for non-recognition treatment.
If, due to any of our covenants in the Tax Matters Agreement being breached, it were determined as a tax matter that the Spin-Off did not qualify for non-recognition of gain and loss, we could be required to indemnify Barnes & Noble, Inc. for the resulting taxes and related expenses. In addition, Section 355(e) of the Internal Revenue Code of 1986, as amended (the “Code”), generally creates a presumption that the Spin-Off would be taxable to Barnes & Noble, Inc., but not to holders, if we or our stockholders were to engage in transactions that result in a 50% or greater change by vote or value in the ownership of our stock during the four-year period beginning on the date that begins two years before the date of the Spin-Off, unless it were established that such transactions and the Spin-Off were not part of a plan or series of related transactions giving effect to such a change in ownership. If the Spin-Off were taxable to Barnes & Noble, Inc. due to such 50% or greater change in the ownership of our stock, Barnes & Noble, Inc. would have to recognize gain in an amount up to the fair market value of our stock held by it immediately before the
27
Spin-Off, and we generally would be required to indemnify Barnes & Noble, Inc. for the tax on such gain and related expenses. See “Certain Relationships and Related Party Transactions-Agreements with Barnes & Noble-Tax Matters Agreement” in our Prospectus dated July 15, 2015 and filed with SEC on that date for more information.
We have agreed to numerous restrictions to preserve the non-recognition treatment of the Spin-Off, which may reduce our strategic and operating flexibility.
We have agreed in the Tax Matters Agreement to covenants and indemnification obligations that address compliance with Section 355(e) of the Code. These covenants and indemnification obligations may limit our ability to pursue strategic transactions or engage in new businesses or other transactions that might maximize the value of our business, and could discourage or delay a strategic transaction that our stockholders may consider favorable. See “Certain Relationships and Related Party Transactions-Agreements with Barnes & Noble-Tax Matters Agreement” in our Prospectus dated July 15, 2015 and filed with SEC on that date for more information.
We have limited operating history as an independent publicly-traded company, and our historical financial information is not necessarily representative of the results we would have achieved as an independent publicly-traded company and may not be a reliable indicator of our future results.
We derived certain historical financial information for the period prior to the Spin-Off included in this Form 10-K from Barnes & Noble, Inc.’s consolidated financial statements, and this information does not necessarily reflect the results of operations and financial position we would have achieved as an independent publicly-traded company during the periods presented (prior to the Spin-Off) or those that we will achieve in the future. Prior to the Spin-Off, we operated as part of Barnes & Noble, Inc.’s broader corporate organization, and Barnes & Noble, Inc. performed various corporate functions for us. Our historical financial information reflects allocations of corporate expenses from Barnes & Noble, Inc. for these and similar functions. These allocations do not necessarily reflect the costs we now incur for similar services as an independent publicly-traded company.
For additional information about our past financial performance and the basis of presentation of our financial statements, see Part II - Item 8. Financial Statements and Supplementary Data and Part II - Item 7. Management’s Discussion and Analysis of Financial Condition and Results of Operations in this Form 10-K.
We may have been able to receive better terms from unaffiliated third parties than the terms we received in our agreements with Barnes & Noble, Inc..
We entered into agreements with Barnes & Noble, Inc. related to our separation from Barnes & Noble, Inc., including the Separation Agreement, Transition Services Agreement, Tax Matters Agreement, the Trademark License Agreement and Employee Matters Agreement, while we were still part of Barnes & Noble, Inc.. Accordingly, these agreements may not reflect terms that would have resulted from arms-length negotiations between unaffiliated parties. The terms of the agreements relate to, among other things, allocations of assets, liabilities, rights, indemnifications and other obligations between Barnes & Noble, Inc. and us. We may have received better terms from third parties than we received from Barnes & Noble, Inc. because third parties would have competed with each other to win our business, but we are now bound by the terms of the agreements we entered into with Barnes & Noble. See “Certain Relationships and Related Party Transactions” in our Prospectus dated July 15, 2015 and filed with SEC on that date for more information.
We are dependent on Barnes & Noble, Inc. to provide certain services pursuant to the Transition Services Agreement and the Separation and Distribution Agreement.
Although we have developed the capabilities to handle certain corporate and administrative services such as information technology and financial, we will continue to rely on Barnes & Noble, Inc. to provide Human Resources Information Systems pursuant to the Transition Services Agreement until we provide such services from unaffiliated third parties. If Barnes & Noble, Inc. is unable or unwilling to provide such services pursuant to the Transition Services Agreement, or if the agreement is terminated prior to the end of its term, we may be unable to provide such services ourselves or we may have to incur additional expenditures to obtain such services from another provider. Pursuant to the Separation and Distribution Agreement, we were granted access to Barnes & Noble, Inc.’s product procurement and merchandising systems for a perpetual period of time unless a termination event occurs. These systems provide inventory management and buying for BNC’s trade books. In the event these systems no longer operated or were otherwise not available to BNC, BNC would incur substantial expense replicating these systems.
Risks Relating to our Common Stock and the Securities Market
Our stock price may fluctuate significantly.
We cannot predict the prices at which our Common Stock may trade. The market price of our Common Stock may fluctuate widely, depending on many factors, some of which may be beyond our control, including:
• | actual or anticipated fluctuations in our operating results due to factors related to our businesses; |
28
• | success or failure of our business strategies, including our digital education initiative; |
• | our quarterly or annual earnings or those of other companies in our industries; |
• | our ability to obtain financing as needed; |
• | announcements by us or our competitors of significant acquisitions or dispositions; |
• | changes in accounting standards, policies, guidance, interpretations or principles; |
• | the failure of securities analysts to cover our Common Stock; |
• | changes in earnings estimates by securities analysts or our ability to meet those estimates; |
• | the operating and stock price performance of other comparable companies; |
• | investor perception of our Company and the college bookstore industry; |
• | overall market fluctuations; |
• | results from any material litigation or government investigation; |
• | changes in laws and regulations (including tax laws and regulations) affecting our business; |
• | changes in capital gains taxes and taxes on dividends affecting stockholders; and |
• | general economic conditions and other external factors. |
Stock markets in general have experienced volatility that has often been unrelated to the operating performance of a particular company. These broad market fluctuations could adversely affect the trading price of our Common Stock.
The concentration of our Common Stock ownership may limit our stockholders’ ability to influence corporate matters and may involve other risks.
A portion of our Common Stock is controlled by a few stockholders. This control may limit the ability of the Company’s other stockholders to influence corporate matters and, as a result, we may take actions with which our other stockholders do not agree.
We do not intend to pay any cash dividends in the foreseeable future and, therefore, any return on your investment in our Common Stock must come from increases in the fair market value and trading price of our Common Stock.
We do not intend to pay cash dividends on our Common Stock in the foreseeable future. We expect to retain future earnings, if any, for reinvestment in our business. Also, our credit agreements may restrict our ability to pay dividends. Whether we pay cash dividends in the future will be at the discretion of our Board and will be dependent upon our financial condition, results of operations, cash requirements, future prospects and any other factors our Board deems relevant. Therefore, any return on your investment in our Common Stock must come from increases in the fair market value and trading price of our Common Stock. For more information, see Part II - Item 5. Market for Registrants - Dividends.
Your percentage ownership in the Company may be diluted in the future.
Your percentage ownership in the Company may be diluted in the future because of equity awards that we expect to grant to our directors, officers and other employees. We have an incentive plan that provides for the grant of Common Stock-based equity awards to our directors, officers and other employees. In addition, we may issue equity as all or part of the consideration paid for acquisitions and strategic investments that we may make in the future or as necessary to finance our ongoing operations.
Provisions in our Amended and Restated Certificate of Incorporation and Amended and Restated By-laws and of Delaware law may prevent or delay an acquisition of the Company, which could affect the trading price of our Common Stock.
Our Amended and Restated Certificate of Incorporation and our Amended and Restated By-laws contain provisions which, together with applicable Delaware law, may discourage, delay or prevent a merger or acquisition that our stockholders consider favorable, including provisions that:
• | divide our Board into three staggered classes of directors that are each elected to three-year terms; |
• | prohibit stockholder action by written consent; |
• | authorize the issuance of “blank check” preferred stock that could be issued by our Board to increase the number of outstanding shares of capital stock, making a takeover more difficult and expensive; |
• | provide that special meetings of the stockholders may be called only by or at the direction of a majority of our Board or the chairman of our Board; and |
• | require advance notice to be given by stockholders for any stockholder proposals or director nominations. |
In addition, Section 203 of the General Corporation Law of the State of Delaware, or the DGCL, may affect the ability of an “interested stockholder” to engage in certain business combinations, for a period of three years following the time that the stockholder becomes an “interested stockholder”.
29
These provisions may discourage, delay or prevent certain types of transactions involving an actual or a threatened acquisition or change in control of the Company, including unsolicited takeover attempts, even though the transaction may offer our stockholders the opportunity to sell their Common Stock at a price above the prevailing market price. See “Description of Our Capital Stock-Certain Provisions of Delaware Law, Our Amended and Restated Certificate of Incorporation and Amended and Restated By-laws” in our Prospectus dated July 15, 2015 and filed with SEC on that date for more information.
Our Amended and Restated By-laws designate courts in the State of Delaware as the sole and exclusive forum for certain types of actions and proceedings that may be initiated by our stockholders, which could limit our stockholders’ ability to obtain a favorable judicial forum for disputes with us or our directors, officers or employees.
Our Amended and Restated By-laws provide that, subject to limited exceptions, the state and federal courts of the State of Delaware are the sole and exclusive forum for (a) any derivative action or proceeding brought on our behalf, (b) any action asserting a claim of breach of a fiduciary duty owed by any of our directors, officers or other employees to us or our stockholders, (c) any action asserting a claim arising pursuant to any provision of the DGCL, our Amended and Restated Certificate of Incorporation or our Amended and Restated By-laws or (d) any other action asserting a claim that is governed by the internal affairs doctrine. Any person or entity purchasing or otherwise acquiring or holding any interest in shares of our capital stock will be deemed to have notice of and to have consented to these provisions. This provision may limit a stockholder’s ability to bring a claim in a judicial forum that it finds favorable for disputes with us or our directors, officers or other employees, which may discourage such lawsuits against us and our directors, officers and employees.
Alternatively, if a court were to find this provision of our Amended and Restated By-laws inapplicable to, or unenforceable in respect of, one or more of the specified types of actions or proceedings, we may incur additional costs associated with resolving such matters in other jurisdictions.
Item 1B. UNRESOLVED STAFF COMMENTS
None.
Item 2. PROPERTIES
Facilities
We lease approximately 81,500 square feet of space for our corporate headquarters in Basking Ridge, New Jersey, and 340,000 square feet of office and warehouse space for our MBS operations in Columbia, Missouri pursuant to leases that expire in October 2023 and September 2023, respectively. In addition, we also lease approximately 55,000 square feet, in aggregate, of office space located in Crystal Lake, Illinois, Dallas, Texas, New York, New York and Mumbai, India to support our operations pursuant to leases that expire between 2017 and 2023.
For BNC, we typically have the exclusive right to operate the official physical school bookstore on college campuses, the majority of which also have school-branded e-commerce sites operated by BNC, through multi-year management service agreements with our schools. In turn, we pay the school a percentage of store sales and, in some cases, a minimum fixed guarantee. These contracts with colleges and universities are typically five years with renewal options, but can range from one to 15 years, and are typically cancelable by either party without penalty with 90 to120 days' notice. As of April 29, 2017, these BNC contracts for the 769 stores that we operate expire as follows:
Contract Terms to Expire During (12 months ending on or about April 30) | BNC Number of Stores | |
2018 | 58 | |
2019 | 31 | |
2020 | 69 | |
2021 | 69 | |
2022 | 46 | |
2023 and later | 496 | |
30
Item 3. LEGAL PROCEEDINGS
We are involved in a variety of claims, suits, investigations and proceedings that arise from time to time in the ordinary course of our business, including actions with respect to contracts, intellectual property, taxation, employment, benefits, personal injuries and other matters. We record a liability when we believe that it is both probable that a loss has been incurred and the amount of loss can be reasonably estimated. Based on our current knowledge, we do not believe that there is a reasonable possibility that the final outcome of any pending or threatened legal proceedings to which we or any of our subsidiaries are a party, either individually or in the aggregate, will have a material adverse effect on our future financial results. However, legal matters are inherently unpredictable and subject to significant uncertainties, some of which are beyond our control. As such, there can be no assurance that the final outcome of these matters will not materially and adversely affect our business, financial condition, results of operations or cash flows.
The litigation matter described below is the only material legal proceeding in which we are currently involved. Under the Separation Agreement, Barnes & Noble, Inc. is obligated to indemnify us against any expenses and liabilities incurred in connection with the matter; consequently, we do not expect an adverse outcome to this litigation to adversely impact our financial condition, results of operations or cash flows.
Adrea LLC v. Barnes & Noble, Inc., NOOK Digital, LLC (formerly barnesandnoble.com llc) and B&N Education, LLC (formerly Nook Media LLC):
On June 14, 2013, Adrea LLC (“Adrea”) filed a complaint against Barnes & Noble, Inc., NOOK Digital, LLC (formerly barnesandnoble.com llc) and B&N Education, LLC (formerly NOOK Media LLC) (collectively, “B&N”) in the United States District Court for the Southern District of New York alleging that various B&N NOOK products and related online services infringe U.S. Patent Nos. 7,298,851 (the “’851 patent”), 7,299,501 (the “’501 patent”) and 7,620,703 (the “’703 patent”). B&N filed its Answer on August 9, 2013, denying infringement and asserting several affirmative defenses. At the same time, B&N filed counterclaims seeking declaratory judgments of non-infringement and invalidity with respect to each of the patents-in-suit. Discovery was commenced and completed and summary judgment motions were filed. On July 1, 2014, the Court issued a decision granting partial summary judgment in B&N’s favor, and in particular granting B&N’s motion to dismiss one of Adrea’s infringement claims, and granting B&N’s motion to limit any damages award with respect to another of Adrea’s infringement claims. Beginning October 7, 2014, through and including October 22, 2014, the case was tried before a jury in the Southern District of New York. The jury returned its verdict on October 27, 2014. The jury found no infringement with respect to the ‘851 patent, and infringement with respect to the ‘501 patent and ‘703 patent. It awarded damages in the amount of $1.3 million. The jury further found no willful infringement with respect to any patent.
On July 24, 2015, the Court granted B&N’s post trial application to invalidate one of the two patents (the ‘501 patent) the jury found to have been infringed. The Court heard oral argument on September 28, 2015 on the post-trial motions on the jury’s infringement and validity determinations. On February 24, 2016, the Court issued a decision upholding the jury’s determination of infringement and validity with respect to the ‘703 patent and ordered a new trial on damages with respect to ‘703 patent since the original damages award was a total award for both the ‘501 patent and the ‘703 patent. The court held a trial on June 23-24 and July 15, 2016 to determine the damage award related to the '703 patent. The Court awarded Adrea $266,832 for B&N's non-willful infringement of the ‘703 patent. By order dated January 12, 2017, the Court granted Adrea $3,000 in prejudgement interest; final judgment was entered against defendants in the total amount of $269,832. On February 2, 2017, Adrea filed a motion for supplemental damages seeking royalties on all Nook devices sold through the date of final judgment and for an ongoing royalty with respect to post-final judgment sales. B&N filed its responsive brief on February 16, 2017. On March 22, 2017, the court awarded $12,606 in supplemental damages on old devices only. On April 5, 2017, Adrea re-filed its Bill of Costs seeking to recover costs as the prevailing party. The period for notice of appeal expired on April 24, 2017. The Court will make a final determination of costs and after such determination and satisfaction of judgment, this matter may be deemed resolved.
Item 4. MINE SAFETY DISCLOSURES
Not applicable.
31
PART II
Item 5. | MARKET FOR THE REGISTRANT'S COMMON EQUITY, RELATED STOCKHOLDER MATTERS AND ISSUER PURCHASES OF EQUITY SECURITIES |
Our authorized capital stock consists of 200,000,000 shares of common stock, par value $0.01 per share, and 5,000,000 shares of preferred stock, par value $0.01 per share. Our Common Stock trades on the New York Stock Exchange ("NYSE") under the symbol “BNED.”
As of April 29, 2017, 46,516,890 shares of our Common Stock and 0 shares of our preferred stock were outstanding. We had reserved 2,409,345 shares and 4,000,000 shares of Common Stock for future grants during the second quarter of Fiscal 2016 and second quarter of Fiscal 2017, respectively, in accordance with the Barnes & Noble Education Inc. Equity Incentive Plan. See Item 8. Financial Statements and Supplementary Data - Note 13. Stock-Based Compensation.
The following table sets forth the high and low stock prices of our Common Stock for the quarterly periods indicated since we began publicly trading on August 3, 2015:
Fiscal 2017 | Fiscal 2016 | |||||||||||||||
High | Low | High | Low | |||||||||||||
First Quarter | $ | 11.88 | $ | 8.50 | N/A | N/A | ||||||||||
Second Quarter | $ | 12.31 | $ | 9.15 | $ | 15.34 | $ | 11.75 | ||||||||
Third Quarter | $ | 13.15 | $ | 8.75 | $ | 15.49 | $ | 8.15 | ||||||||
Fourth Quarter | $ | 11.30 | $ | 9.09 | $ | 11.93 | $ | 8.71 | ||||||||
On June 16, 2017, there were approximately 836 holders of record of our Common Stock and the closing price of our Common Stock on the New York Stock Exchange was $10.31 per share.
Dividends
We have not, and we do not intend to pay cash dividends on our Common Stock in the foreseeable future. We expect to retain future earnings, if any, for reinvestment in our business. Any credit agreements which we may enter into may restrict our ability to pay dividends. The payment of dividends in the future will be subject to the discretion of our Board of Directors and will depend, among other things, on our financial condition, results of operations, cash requirements, future prospects and any other factors our Board of Directors deems relevant.
Issuer Purchases of Equity Securities
On December 14, 2015, our Board of Directors authorized a stock repurchase program of up to $50 million, in the aggregate, of our outstanding Common Stock. The stock repurchase program is carried out at the direction of management (which may include a plan under Rule 10b5-1 of the Securities Exchange Act of 1934). The stock repurchase program may be suspended, terminated, or modified at any time. Any repurchased shares will be held as treasury stock and will be available for general corporate purposes. During Fiscal 2016, we repurchased 1,715,269 shares for approximately $16.6 million at a weighted average cost per share of $9.95. During Fiscal 2017, we repurchased 688,948 shares for approximately $6.7 million at a weighted average cost per share of $10.10. As of April 29, 2017, approximately $26.7 million remains available under the stock repurchase program. We did not purchase shares under the stock repurchase program during the fourth quarter of Fiscal 2017.
During the year ended April 29, 2017, we also repurchased 276,292 shares of our Common Stock in connection with employee tax withholding obligations for vested stock awards.
32
Item 6. SELECTED FINANCIAL DATA
The selected financial information presented below should be read in conjunction with Item 7. Management's Discussion and Analysis of Financial Condition and Results of Operations and Item 8. Financial Statements and Supplementary Data.
Fiscal Year (a) | ||||||||||||||||||||
(In thousands of dollars, except for share and per share amounts) | 2017 | 2016 | 2015 | 2014 | 2013 | |||||||||||||||
STATEMENT OF OPERATIONS DATA: | ||||||||||||||||||||
Sales: | ||||||||||||||||||||
Product sales and other (b) | $ | 1,638,934 | $ | 1,579,617 | $ | 1,544,975 | $ | 1,536,180 | $ | 1,631,454 | ||||||||||
Rental income (c) | 235,428 | 228,412 | 228,023 | 211,742 | 131,793 | |||||||||||||||
Total sales | 1,874,362 | 1,808,029 | 1,772,998 | 1,747,922 | 1,763,247 | |||||||||||||||
Cost of sales: | ||||||||||||||||||||
Product and other cost of sales | 1,280,374 | 1,224,955 | 1,198,300 | 1,180,727 | 1,270,381 | |||||||||||||||
Rental cost of sales | 136,625 | 129,725 | 131,125 | 130,430 | 88,250 | |||||||||||||||
Total cost of sales | 1,416,999 | 1,354,680 | 1,329,425 | 1,311,157 | 1,358,631 | |||||||||||||||
Gross profit | 457,363 | 453,349 | 443,573 | 436,765 | 404,616 | |||||||||||||||
Selling and administrative expenses | 379,095 | 372,821 | 359,504 | 330,426 | 302,902 | |||||||||||||||
Depreciation and amortization expense | 53,318 | 52,690 | 50,509 | 48,014 | 46,849 | |||||||||||||||
Transaction costs (d) | 9,605 | 2,398 | — | — | — | |||||||||||||||
Restructuring costs (e) | 1,790 | 8,830 | — | — | — | |||||||||||||||
Impairment loss (non-cash) (e) | — | 11,987 | — | — | — | |||||||||||||||
Operating income | 13,555 | 4,623 | 33,560 | 58,325 | 54,865 | |||||||||||||||
Interest expense, net | 3,464 | 1,872 | 210 | 385 | 4,871 | |||||||||||||||
Earnings before taxes | 10,091 | 2,751 | 33,350 | 57,940 | 49,994 | |||||||||||||||
Income taxes | 4,730 | 2,667 | 14,218 | 22,834 | 19,820 | |||||||||||||||
Net income | $ | 5,361 | $ | 84 | $ | 19,132 | $ | 35,106 | $ | 30,174 | ||||||||||
Earnings per common share (f): | ||||||||||||||||||||
Basic | $ | 0.12 | $ | — | $ | 0.33 | $ | 0.88 | $ | 0.78 | ||||||||||
Diluted | $ | 0.11 | $ | — | $ | 0.33 | $ | 0.88 | $ | 0.78 | ||||||||||
Weighted average common shares (thousands)(f): | ||||||||||||||||||||
Basic | 46,317 | 46,238 | 38,452 | 37,270 | 36,812 | |||||||||||||||
Diluted | 46,763 | 46,479 | 38,493 | 37,275 | 36,812 | |||||||||||||||
Fiscal Year (a) | ||||||||||||||||||||
(In thousands of dollars, except for share and per share amounts) | 2017 | 2016 | 2015 | 2014 | 2013 | |||||||||||||||
OTHER OPERATING DATA: | ||||||||||||||||||||
Adjusted EBITDA (non-GAAP) (g) | $ | 78,268 | $ | 80,528 | $ | 84,069 | $ | 106,339 | $ | 101,714 | ||||||||||
Adjusted Earnings (non-GAAP) (g) | $ | 12,347 | $ | 15,462 | $ | 19,132 | $ | 35,106 | $ | 30,174 | ||||||||||
Capital expenditures | $ | 34,670 | $ | 50,790 | $ | 48,452 | $ | 38,253 | $ | 38,760 | ||||||||||
OTHER OPERATING DATA - BNC: | ||||||||||||||||||||
Comparable store sales (decrease) increase (h) | (3.0 | )% | (1.9 | )% | 0.1 | % | (2.7 | )% | (1.2 | )% | ||||||||||
Number of stores at period end | 769 | 751 | 724 | 700 | 686 | |||||||||||||||
33
Fiscal Year (a) | ||||||||||||||||||||
(In thousands of dollars, except for share and per share amounts) | 2017 | 2016 | 2015 | 2014 | 2013 | |||||||||||||||
BALANCE SHEET DATA (at period end): | ||||||||||||||||||||
Total assets | $ | 1,299,832 | $ | 1,071,683 | $ | 1,090,668 | $ | 1,109,919 | $ | 1,006,237 | ||||||||||
Total liabilities | $ | 586,124 | $ | 363,297 | $ | 363,999 | $ | 360,282 | $ | 358,208 | ||||||||||
Short-term debt (i) | $ | 100,000 | $ | — | $ | — | $ | — | $ | — | ||||||||||
Long-term debt (i) | $ | 59,600 | $ | — | $ | — | $ | — | $ | — | ||||||||||
Preferred membership interests | $ | — | $ | — | $ | — | $ | 383,397 | $ | 381,627 | ||||||||||
Parent company equity | $ | — | $ | — | $ | 726,669 | $ | 366,240 | $ | 266,402 | ||||||||||
Total stockholders' equity | $ | 713,708 | $ | 708,386 | $ | — | $ | — | $ | — | ||||||||||
(a) | Our fiscal year is comprised of 52 or 53 weeks, ending on the Saturday closest to the last day of April. “Fiscal 2017” means the 52 weeks ended April 29, 2017, “Fiscal 2016” means the 52 weeks ended April 30, 2016, “Fiscal 2015” means the 52 weeks ended May 2, 2015, “Fiscal 2014” means the 53 weeks ended May 3, 2014, and “Fiscal 2013” means the 52 weeks ended April 27, 2013. |
(b) | Product sales and other revenue include sales of new and used physical and digital textbooks, emblematic apparel and gifts, trade books, computer products, school and dorm supplies, convenience and café items, and graduation products. |
(c) | Rental income includes the rental of physical and digital textbooks. |
(d) | Transaction costs are costs incurred for business development and acquisitions. |
(e) | In Fiscal 2016, we implemented a plan to restructure our digital operations. As a result of this restructuring, we recorded a non-cash impairment loss of $12.0 million related to all of the capitalized content costs for the Yuzu® eTextbook platform ($9 million), and recorded a non-recurring other than temporary loss related to an investment held at cost ($3 million). Additionally, we announced a reduction in staff and closure of the facilities in Mountain View, California, and Redmond, Washington that support the Yuzu® eTextbook platform. The cost of severance, retention, and other restructuring costs (i.e. facility exit costs) was $8.8 million and $1.8 million in Fiscal 2016 and Fiscal 2017, respectively. The restructuring was completed in the first quarter of Fiscal 2017. |
(f) | For periods prior to the Spin-Off from Barnes & Noble, Inc. on August 2, 2015, basic earnings per share and weighted-average basic shares outstanding are based on the number of shares of Barnes & Noble, Inc. common stock outstanding as of the end of the period, adjusted for the distribution ratio of 0.632 shares of our Common Stock for every one share of Barnes & Noble, Inc. common stock held on the record date for the Spin-Off. Additionally, for period prior to the Spin-Off, diluted earnings per share and weighted-average diluted shares outstanding reflect potential common shares from Barnes & Noble, Inc. equity plans in which our employees participated. Certain of our employees held restricted stock units and stock options granted by Barnes & Noble, Inc. which were considered participating securities. |
(g) | To supplement our results prepared in accordance with GAAP, we use the measure of Adjusted EBITDA and Adjusted Earnings, which are non-GAAP financial measures as defined by the Securities and Exchange Commission (the “SEC”). See Item 7. Management's Discussion and Analysis of Financial Condition and Results of Operations - Adjusted EBITDA (non-GAAP) and - Adjusted Earnings (non-GAAP). |
(h) | Effective Fiscal 2017, comparable store sales includes sales from stores that have been open for an entire fiscal year period, does not include sales from closed stores for all periods presented, and digital agency sales are included on a gross basis. We believe the current comparable store sales calculation method better reflects the manner in which management views comparable store sales, as well as the seasonal nature of our business. |
For Fiscal 2015 through Fiscal 2016, comparable store sales included sales from stores that were open for at least 15 months, excluded sales from closed stores for all periods presented, and included digital agency sales on a net basis.
For Fiscal 2012 through Fiscal 2014, as we developed our textbook rental business, comparable store sales reflected the retail selling price of a new or used textbook when rented, rather than solely the rental fees received, to provide a more representative comparable store sales figure. Beginning with the 26 weeks ended November 1, 2014, as a result of the significant expansion of the textbook rental business as compared to prior periods, our comparable store sales were determined based upon the actual revenue received from textbook rentals and were no longer adjusted to reflect the equivalent textbook retail selling price.
(i) | Prior to or at the time of the Spin-Off, we were party to an amended and restated credit facility with Barnes & Noble, Inc. All outstanding debt under this Credit Facility was recorded on Barnes & Noble, Inc.’s balance sheet. On August 3, 2015, we entered into a credit agreement under which the lenders committed to provide us with a five-year asset-backed revolving credit facility in an aggregate committed principal amount of $400 million. On February 27, 2017, we amended the credit agreement to add a new $100 million incremental first in, last out seasonal loan facility. |
34
Item 7. | MANAGMENT'S DISCUSSION AND ANALYSIS OF FINANCIAL CONDITION AND RESULTS OF OPERATIONS |
Unless the context otherwise indicates, references to “we,” “us,” “our” and “the Company” refer to Barnes & Noble Education, Inc., a Delaware corporation. References to “Barnes & Noble College” refer to our college bookstore business operated through our subsidiary Barnes & Noble College Booksellers, LLC. References to “MBS” refer to our virtual bookstore and wholesale textbook distribution business operated through our subsidiary MBS Textbook Exchange, LLC, a Delaware corporation.
Our fiscal year is comprised of 52 or 53 weeks, ending on the Saturday closest to the last day of April. “Fiscal 2017” means the 52 weeks ended April 29,2017, “Fiscal 2016” means the 52 weeks ended April 30, 2016, and “Fiscal 2015” means the 52 weeks ended May 2, 2015.
Overview
Description of business
Barnes & Noble Education, Inc. (“BNED”) is one of the largest contract operators of physical and virtual bookstores for college and university campuses, and private/parochial K-12 schools, across the United States, and a leading provider of digital education services. Through our Barnes & Noble College (“BNC”) and MBS Textbook Exchange (“MBS”) subsidiaries, we operate 1,481 physical and virtual bookstores and serve more than 6 million students enrolled in higher education institutions and K-12 schools.
Effective with the acquisition of MBS on February 27, 2017, we have determined that we operate two reportable segments: BNC and MBS. See the BNC and MBS segment discussions below.
BNC operates 769 physical campus bookstores, the majority of which also have school-branded e-commerce sites operated by BNC, and BNC also includes our digital operations. Our campus stores are a social and academic hub through which students can access affordable course materials and affinity products, including new and used print and digital textbooks, which are available for sale or rent; emblematic apparel and gifts; trade books; computer products; school and dorm supplies; café offerings; convenience food and beverages; and graduation products. BNC product offerings also include a suite of digital content, software, and services through our LoudCloud platform, such as predictive analytics, a variety of courseware built on a foundation of open educational resources ("OER"), and competency-based learning solutions.
Our MBS subsidiary operates two highly integrated businesses. The MBS Direct business is the largest contract operator of virtual bookstores for college and university campuses, and private/parochial K-12 schools. MBS Direct operates 712 virtual bookstores, offering new and used print and digital textbooks, which are available for sale or rent. Additionally, MBS Direct sells textbooks directly to students through textbooks.comSM, one of the largest e-commerce sites for new and used textbooks. MBS Wholesale is one of the largest textbook wholesalers in the country, providing a comprehensive selection of new and used textbooks at a low cost of supply to more than 3,700 physical bookstores, including BNC’s 769 campus bookstores.
Educational institutions increasingly are outsourcing bookstore operations, investing in data-driven analytical tools, and offering students more affordable options for textbooks and other learning tools. Given these continuing trends, we are well-positioned to capture new market share and partner with an increasing number of schools across the country. As demand for new, improved, and more affordable products and services increase in the rapidly changing education landscape, we are working to evolve our business model and enhance our solutions. We aim to be an even stronger partner for schools and meet customer needs by expanding our physical and virtual bookstore service capabilities, courseware offerings and digital platform services. We believe that our recent strategic actions, including the acquisition of LoudCloud, Promoversity and MBS, and development of courseware, have substantially enhanced our competitive position. We continue to aggressively innovate and collaborate with our partners to provide solutions that extend well beyond course materials sourcing and sales to include new digital services that support successful student outcomes.
For additional information related to our segments, customers, distribution network, and business conditions, see Part I - Item 1. Business.
Fiscal Year 2017 Summary
At the beginning of Fiscal 2017, BNC operated 751 physical bookstores nationwide through our BNC subsidiary, which reached 26% of the total number of students enrolled at colleges and universities in the United States. During Fiscal 2017, BNC opened 38 stores with estimated first year annual sales of $118 million, and closed 20 stores, primarily comprised of satellite store locations that we elected to close and we continue to operate the main contract, contracts with low sales volume, as well as those contracts that may have been lost in a competitive bid process. As of June 16, 2017, BNC has signed additional contracts for 23 new physical stores with estimated first year annual sales of $50 million, which we expect to open during Fiscal 2018.
35
In June 2016, we enhanced our general merchandise offering through the acquisition of Promoversity, a custom merchandise supplier and e-commerce storefront solution serving the collegiate bookstore business and its customers. This acquisition enables us to broaden our selection and customize our e-commerce offerings to drive on-campus and online apparel sales with faculty, alumni, parents and students.
In February 2017, we acquired MBS, the largest contract operator of virtual bookstores for college and university campuses, and private/parochial K-12 schools, and one of the largest textbook wholesalers in the United States. This acquisition significantly enhances our competitive positioning, increasing our addressable market to include K-12 schools and higher education institutions that need virtual bookstore solutions as an alternative to, or in addition to, a physical store on campus. The acquisition also increases our addressable market for our digital courseware and analytics solutions (discussed below), and enables us to generate more value from the textbook marketplace through inventory and procurement synergies. We are leveraging our newly-expanded customer base and distribution channels, which broadens our reach and deepens our institutional partnerships through our ability to provide unmatched access to affordable solutions.
During Fiscal 2017, we focused on our ability to leverage our digital technology LoudCloud platform to provide product and service offerings designed to address the most pressing issues in higher education, such as affordable and accessible course materials, retention solutions driven by our analytics platform, and products designed to drive and improve student outcomes. Through our LoudCloud platform, we address the growing demand for alternative forms of educational materials and learning tools. The implementation of our digital strategy relies on leveraging our core bookstore relationships, both physical and virtual, to help accelerate the adoption of our new digital products and services and to minimize the amount of selling and marketing expenses we otherwise would incur to promote these new offerings.
By focusing on advanced OER courseware, we plan to continue to enhance and grow our digital content and services in an efficient, low-cost/high-value manner to complement our printed textbook business. In August 2016, we extended our relationship with OpenStax, a nonprofit organization whose mission is to improve student access to education. In October 2016, we launched Barnes & Noble Education Courseware. We received positive feedback from faculty after launching pilot programs at a mix of dynamic colleges and universities, including the Pennsylvania State University, Cuyahoga Community College and West Liberty State College, and expect to continue to gain adoptions at colleges and universities nationwide.
Additionally, we believe that our predictive analytics solution has strong benefits for higher education institutions, and therefore potentially strong demand characteristics in this emerging space. Our partnership with Unizin, Ltd. ("Unizin") underscores the value proposition of our predictive analytics solutions in helping client institutions improve student success rates and retention. In May 2017, we entered into an agreement with Unizin to provide its 22 member universities with LoudCloud's predictive analytics solution, LoudSight. As a result, faculty and advisors will have access to a customized solution that helps educators identify, monitor, and support at-risk students, with the goal of improving student success rates and retention. For additional information related to our Strategies, see Part I - Item 1. Business - Overview.
Segments
Effective with the acquisition of MBS on February 27, 2017, we have determined that we operate two reportable segments: BNC and MBS. We identified our segments based on the way our business is managed (focusing on the financial information distributed) and the manner in which our chief operating decision maker allocates resources and assesses financial performance. Prior to the acquisition of MBS, BNC was previously our only reportable segment.
Seasonality
Our fiscal year is comprised of 52 or 53 weeks, ending on the Saturday closest to the last day of April. Our retail business (BNC and MBS Direct) is highly seasonal, with sales generally highest in the second and third fiscal quarters, when college students generally purchase textbooks for the upcoming semesters, and lowest in the first and fourth fiscal quarters. Sales attributable to our MBS wholesale business are generally highest in our first, second and third quarter, as it sells textbooks for retail distribution, which somewhat offsets the decreased first quarter sales attributable to our retail business.
Trends and Other Factors Affecting Our Business
For a discussion of our trends and other factors affecting our business, see Part I - Item 1. Business - Overview - Trends and Other Factors Affecting Our Business.
36
Results of Operations
Elements of Results of Operations
Our consolidated financial statements reflect our consolidated financial position, results of operations and cash flows in conformity with accounting principles generally accepted in the United States (“GAAP”).
Our sales are primarily derived from the sale of course materials (which include new and used textbooks and digital textbooks). Our rental income is primarily derived from the rental of physical and digital textbooks. At college and university bookstores which we operate, we sell emblematic apparel and gifts, trade books, computer products, school and dorm supplies, convenience and café items and graduation products. We also derive revenue from sales related to inventory management, hardware and point-of-sale software.
Our cost of sales primarily include costs such as merchandise costs, textbook rental amortization, payroll costs, as well as warehouse costs related to inventory management and order fulfillment, and management service agreement costs, including rent expense, related to our college and university contracts and other facility related expenses.
Our selling and administrative expenses consist primarily of store payroll and store operating expenses. Selling and administrative expenses also include stock-based compensation and general office expenses, such as executive oversight, merchandising, procurement, field support, finance, human resources, benefits, training, legal, and information technology, as well as our investments in our digital platform.
Basis of Consolidation
Stand-alone financial statements (Prior to the Spin-Off)
On August 2, 2015, we completed the legal separation ("Spin-Off") from Barnes & Noble, Inc., at which time we began to operate as an independent publicly-traded company.
For the results of operations for the 13 weeks ended August 1, 2015 (first quarter of Fiscal 2016) and Fiscal 2015 (periods presented prior to the Spin-Off), (collectively referred to as the "stand-alone periods"), our consolidated financial statements are presented on a stand-alone basis since we were still part of Barnes & Noble, Inc. Our consolidated financial statements were derived from the consolidated financial statements and accounting records of Barnes & Noble, Inc.. Our consolidated financial statements include certain assets and liabilities that have historically been held at the Barnes & Noble, Inc. corporate level but are specifically identifiable or otherwise attributable to us. For additional information, see Part II - Item 8. Financial Statements and Supplementary Data - Note 10. Barnes & Noble, Inc. Transactions.
Consolidated financial statements (Subsequent to the Spin-Off)
The Spin-Off from Barnes & Noble, Inc. occurred on August 2, 2015 and therefore, the results of operations are presented on a consolidated basis for the 39 weeks ended April 30, 2016 (i.e. second, third and fourth quarter of Fiscal 2016) which includes direct costs incurred with Barnes & Noble, Inc. under various agreements. Certain corporate and shared service functions historically provided by Barnes & Noble, Inc. (as described above) will continue to be provided by Barnes & Noble, Inc. under the Transition Services Agreement. For additional information, see Part II - Item 8. Financial Statements and Supplementary Data - Note 10. Barnes & Noble, Inc. Transactions.
For our Fiscal 2017 (52 weeks ended April 29, 2017), the results of operations for the entire 52 weeks ended April 29, 2017 reflected in our consolidated financial statements are presented on a consolidated basis.
On February 27, 2017, we acquired MBS Textbook Exchange, LLC ("MBS"). The consolidated financial statements for the 52 weeks ended April 29, 2017 include the financial results of MBS from the acquisition date, February 27, 2017, to April 29, 2017. Subsequent to the acquisition, the consolidated financial statements include the accounts of MBS and all material intercompany accounts and transactions have been eliminated in consolidation. For additional information, see Part II - Item 8. Financial Statements and Supplementary Data - Note 4. Acquisitions and Strategic Agreements.
37
Results of Operations - Summary
Fiscal Year | ||||||||||||
Dollars in thousands | 2017 | 2016 | 2015 | |||||||||
Sales: | ||||||||||||
Product sales and other | $ | 1,638,934 | $ | 1,579,617 | $ | 1,544,975 | ||||||
Rental income | 235,428 | 228,412 | 228,023 | |||||||||
Total sales | $ | 1,874,362 | $ | 1,808,029 | $ | 1,772,998 | ||||||
Net Income | $ | 5,361 | $ | 84 | $ | 19,132 | ||||||
Adjusted Earnings (non-GAAP) (a) | $ | 12,347 | $ | 15,462 | $ | 19,132 | ||||||
Adjusted EBITDA (non-GAAP) (a) | ||||||||||||
BNC | $ | 82,474 | $ | 80,528 | $ | 84,069 | ||||||
MBS | (3,569 | ) | — | — | ||||||||
Elimination | (637 | ) | — | — | ||||||||
Total Adjusted EBITDA (non-GAAP) | $ | 78,268 | $ | 80,528 | $ | 84,069 | ||||||
BNC Comparable store sales (decrease) increase (b) | (3.0 | )% | (1.9 | )% | 0.1 | % | ||||||
BNC Stores opened | 38 | 39 | 48 | |||||||||
BNC Stores closed | 20 | 12 | 24 | |||||||||
BNC Number of stores open at end of period | 769 | 751 | 724 | |||||||||
(a) | Adjusted Earnings and Adjusted EBITDA are a non-GAAP financial measures. See Adjusted Earnings (non-GAAP) and Adjusted EBITDA (non-GAAP) discussion below. |
(b) | Effective Fiscal 2017, BNC comparable store sales includes sales from stores that have been open for an entire fiscal year period, does not include sales from closed stores for all periods presented, and digital agency sales are included on a gross basis. We believe the current comparable store sales calculation method better reflects the manner in which management views comparable sales, as well as the seasonal nature of our business. For Fiscal 2015 through Fiscal 2016, BNC comparable store sales included sales from stores that were open for at least 15 months, excluded sales from closed stores for all periods presented, and included digital agency sales on a net basis. |
The following table sets forth, for the periods indicated, the percentage relationship that certain items bear to total sales:
Fiscal 2017 | Fiscal 2016 | Fiscal 2015 | |||||||
Sales: | |||||||||
Product sales and other | 87.4 | % | 87.4 | % | 87.1 | % | |||
Rental income | 12.6 | 12.6 | 12.9 | ||||||
Total sales | 100.0 | 100.0 | 100.0 | ||||||
Cost of sales: | |||||||||
Product and other cost of sales (a) | 78.1 | 77.5 | 77.6 | ||||||
Rental cost of sales (a) | 58.0 | 56.8 | 57.5 | ||||||
Total cost of sales | 75.6 | 74.9 | 75.0 | ||||||
Gross margin | 24.4 | 25.1 | 25.0 | ||||||
Selling and administrative expenses | 20.2 | 20.6 | 20.3 | ||||||
Depreciation and amortization expense | 2.8 | 2.9 | 2.8 | ||||||
Transactions costs | 0.5 | 0.1 | — | ||||||
Restructuring costs | 0.1 | 0.5 | — | ||||||
Impairment loss | — | 0.7 | — | ||||||
Operating income | 0.7 | % | 0.2 | % | 1.9 | % | |||
(a) Represents the percentage these costs bear to the related sales, instead of total sales.
38
Results of Operations - 52 weeks ended April 29, 2017 compared with the 52 weeks ended April 30, 2016
52 weeks ended, April 29, 2017 | |||||||||||||||||||
52 weeks ended, April 29, 2017 | Acquisition Period (Feb. 27 - Apr. 29, 2017) | 52 weeks ended | 52 weeks ended | ||||||||||||||||
Dollars in thousands | BNC | MBS (a) | Eliminations | April 29, 2017 (a) | April 30, 2016 | ||||||||||||||
Sales: | |||||||||||||||||||
Product sales and other | $ | 1,611,055 | $ | 33,169 | $ | (5,290 | ) | $ | 1,638,934 | $ | 1,579,617 | ||||||||
Rental income | 234,506 | 922 | — | 235,428 | 228,412 | ||||||||||||||
Total sales | 1,845,561 | 34,091 | (5,290 | ) | 1,874,362 | 1,808,029 | |||||||||||||
Cost of sales: | |||||||||||||||||||
Product and other cost of sales | 1,256,004 | 29,023 | (4,653 | ) | 1,280,374 | 1,224,955 | |||||||||||||
Rental cost of sales | 136,305 | 320 | — | 136,625 | 129,725 | ||||||||||||||
Total cost of sales | 1,392,309 | 29,343 | (4,653 | ) | 1,416,999 | 1,354,680 | |||||||||||||
Gross profit | 453,252 | 4,748 | (637 | ) | 457,363 | 453,349 | |||||||||||||
Selling and administrative expenses | 370,778 | 8,317 | — | 379,095 | 372,821 | ||||||||||||||
Depreciation and amortization expense | 52,259 | 1,059 | — | 53,318 | 52,690 | ||||||||||||||
Transaction costs | 9,605 | — | — | 9,605 | 2,398 | ||||||||||||||
Restructuring costs | 1,790 | — | — | 1,790 | 8,830 | ||||||||||||||
Impairment loss (non-cash) | — | — | — | — | 11,987 | ||||||||||||||
Operating income | $ | 18,820 | $ | (4,628 | ) | $ | (637 | ) | $ | 13,555 | $ | 4,623 | |||||||
(a) | On February 27, 2017, we acquired MBS. The consolidated financial statements for the 52 weeks ended April 29, 2017 include the financial results of MBS from the acquisition date, February 27, 2017, to April 29, 2017. For additional information related to the intercompany activities and eliminations, see Part II - Item 8. Financial Statements and Supplementary Data - Note 4. Acquisitions and Strategic Agreements and Note 5. Segment Reporting. |
Sales
The following table summarizes our sales for the 52 weeks ended April 29, 2017 and April 30, 2016:
52 weeks ended | ||||||||||
Dollars in thousands | April 29, 2017 | April 30, 2016 | % | |||||||
Product sales and other | $ | 1,638,934 | $ | 1,579,617 | 3.8% | |||||
Rental income | 235,428 | 228,412 | 3.1% | |||||||
Total Sales | $ | 1,874,362 | $ | 1,808,029 | 3.7% | |||||
Our total sales increased $66.3 million, or 3.7%, to $1,874.4 million during the 52 weeks ended April 29, 2017 from $1,808.0 million during the 52 weeks ended April 30, 2016.
39
The components of the variances are reflected in the table below.
Sales variances | ||||
Dollars in millions | 52 weeks ended | |||
MBS Sales (a) | ||||
Wholesale | $ | 14.1 | ||
Direct | 20.0 | |||
MBS Sales subtotal: | $ | 34.1 | ||
BNC Sales | ||||
New stores | $ | 109.5 | ||
Closed stores | (23.8 | ) | ||
Comparable stores | (50.6 | ) | ||
Textbook rental deferral | 0.6 | |||
Service revenue (b) | 5.8 | |||
Other (c) | (4.0 | ) | ||
BNC Sales subtotal: | $ | 37.5 | ||
Eliminations (d) | $ | (5.3 | ) | |
Total sales variance | $ | 66.3 | ||
(a) | Represents sales for MBS from the acquisition date, February 27, 2017, to April 29, 2017. MBS’s business is highly seasonal. For MBS’s retail operations (virtual bookstores), a major portion of sales and operating profit are realized during the second and third quarters, when students generally purchase and rent textbooks for the upcoming semesters. For MBS’s wholesale business, a major portion of sales and operating profit is realized during the first, second and third fiscal quarters, as it sells textbooks for retail distribution, which somewhat offsets the decreased first quarter sales attributable to our retail business. MBS has significantly lower operating profit or operating loss realized during the fourth quarter. |
(b) | Service revenue includes Promoversity, LoudCloud, brand partnerships, shipping and handling and revenue from other programs. |
(c) | Other includes certain adjusting items related to return reserves and other deferred items. |
(d) | Eliminates MBS sales to BNC and BNC commissions earned from MBS. See Part II - Item 8. Financial Statements and Supplementary Data - Note 5. Segment Reporting for a discussion of intercompany activities and eliminations. |
Rental income for BNC for the 52 weeks ended April 29, 2017 increased $6.1 million, or 2.7%. The increase in rental income for the 52 weeks ended April 29, 2017 was primarily due to increased rental activity, offset by a decrease in the recognition of our previously deferred rental revenue of $0.6 million. Excluding the impact of the deferred revenue, rental income increased $5.5 million, or 2.4%.
BNC added 38 new stores and closed 20 stores during the 52 weeks ended April 29, 2017, ending the period with a total of 769 stores.
Comparable store sales variances for BNC by category for the 52 week periods are as follows:
Comparable Store Sales variances for BNC | 52 weeks ended | ||||||
Dollars in millions | April 29, 2017 | ||||||
Textbooks | $ | (46.1 | ) | (4.0 | )% | ||
General Merchandise | (0.7 | ) | (0.1 | )% | |||
Trade Books | (3.2 | ) | (5.8 | )% | |||
Other | (0.6 | ) | (88.9 | )% | |||
Total Comparable Store Sales | $ | (50.6 | ) | (3.0 | )% | ||
Comparable store sales for BNC decreased for the 52 weeks ended April 29, 2017 and were negatively impacted primarily by lower student enrollment, specifically in two-year community colleges, increased consumer purchases directly from publishers and other online providers, and other recent negative retail trends. The components of the variances are reflected in the table above.
40
New and used textbook revenue for BNC for the 52 weeks ended April 29, 2017 decreased primarily due to lower new and used textbook sales, while eTextbook revenue increased due to expanded eTextbook title offerings. General merchandise sales for BNC decreased for the 52 weeks ended April 29, 2017 primarily due to lower computer product, school supplies and convenience sales, partially offset by higher emblematic apparel sales.
Cost of Sales and Gross Margin
Our cost of sales increased as a percentage of sales to 75.6% during the 52 weeks ended April 29, 2017 compared to 74.9% during the 52 weeks ended April 30, 2016. Our gross margin increased $4.0 million, or 0.9%, to $457.4 million, or 24.4% of sales, during the 52 weeks ended April 29, 2017 from $453.3 million, or 25.1% of sales, during the 52 weeks ended April 30, 2016. The cost of sales eliminations of $0.6 million represents the elimination of intercompany profit in ending inventory.
The cost of sales and gross margin for MBS was $29.4 million or 86.1% and $4.7 million or 13.9%, respectively, from the acquisition date, February 27, 2017, to April 29, 2017. The MBS gross margin as a percentage of sales is impacted by significantly lower sales for MBS realized during the fourth quarter (generally February through April) as the majority of the quarter is focused on purchasing inventory for the upcoming Fall semester, fixed warehouse facility and operation costs, as well as the incremental cost of sales related to recording MBS inventory at fair value as of the acquisition date.
The following table summarizes the BNC cost of sales for the 52 weeks ended April 29, 2017 and April 30, 2016:
52 weeks ended | 52 weeks ended | |||||||||||
Dollars in thousands | April 29, 2017 | % of Related Sales | April 30, 2016 | % of Related Sales | ||||||||
Product and other cost of sales | $ | 1,256,004 | 78.0% | $ | 1,224,955 | 77.5% | ||||||
Rental cost of sales | 136,305 | 58.1% | 129,725 | 56.8% | ||||||||
Total Cost of Sales | $ | 1,392,309 | 75.4% | $ | 1,354,680 | 74.9% | ||||||
The following table summarizes the BNC gross margin for the 52 weeks ended April 29, 2017 and April 30, 2016:
52 weeks ended | 52 weeks ended | |||||||||||
Dollars in thousands | April 29, 2017 | % of Related Sales | April 30, 2016 | % of Related Sales | ||||||||
Product and other gross margin | $ | 355,051 | 22.0% | $ | 354,662 | 22.5% | ||||||
Rental gross margin | 98,201 | 41.9% | 98,687 | 43.2% | ||||||||
Gross Margin | $ | 453,252 | 24.6% | $ | 453,349 | 25.1% | ||||||
For the 52 weeks ended April 29, 2017, the BNC gross margin as a percentage of sales decreased due to lower margin rate and higher costs related to our college and university contracts resulting from contract renewals and new store contracts, partially offset by a favorable sales mix as discussed below:
• | Product and other gross margin decreased (50 basis points), driven primarily by lower margin rates (50 basis points), primarily related to increased markdowns on textbooks, including the impact of our price-matching program (15 basis points), and increased costs related to our college and university contracts (25 basis points) resulting from contract renewals and new store contracts. These decreases were partially offset by improved shrink results (20 basis points) and a favorable sales mix (15 basis points) resulting from an increase in sales of higher margin general merchandise. |
• | Rental gross margin decreased (135 basis points), driven primarily by lower rental margin rates (120 basis points), including the impact of our price-matching program (40 basis points) and increased costs related to our college and university contracts (20 basis points) resulting from contract renewals and new store contracts. This decrease was partially offset by a favorable rental mix (5 basis points). |
Selling and Administrative Expenses
52 weeks ended | 52 weeks ended | |||||||||||
Dollars in thousands | April 29, 2017 | % of Sales | April 30, 2016 | % of Sales | ||||||||
Selling and Administrative Expenses | $ | 379,095 | 20.2% | $ | 372,821 | 20.6% | ||||||
During the 52 weeks ended April 29, 2017, selling and administrative expenses increased $6.3 million, or 1.7%, to $379.1 million from $372.8 million during the 52 weeks ended April 30, 2016. The increase was primarily due to the selling and administrative expenses for MBS of $8.3 from the acquisition date, February 27, 2017, to April 29, 2017.
41
BNC's selling and administrative expenses decreased by $2.0 million, or 0.5%, to $370.8 million from $372.8 million during the 52 weeks ended April 30, 2016. The decrease was due primarily to an $11.2 million net decrease in digital expenses related to the restructuring of our digital operations (as discussed below), net of increased costs related to our LoudCloud digital operations, and a $6.4 million decrease in comparable store payroll and operating expenses. These decreases were partially offset by a $14.6 million increase in new store payroll and operating expenses (net of closed stores), as a result of a $85.7 million increase in new store sales (net of closed stores), and a $0.9 million increase in corporate payroll and infrastructure costs, including increased costs associated with an acquired business.
Depreciation and Amortization Expense
52 weeks ended | 52 weeks ended | |||||||||||
Dollars in thousands | April 29, 2017 | % of Sales | April 30, 2016 | % of Sales | ||||||||
Depreciation and Amortization Expense | $ | 53,318 | 2.8% | $ | 52,690 | 2.9% | ||||||
Depreciation and amortization expense increased $0.6 million, or 1.2%, to $53.3 million during the 52 weeks ended April 29, 2017 from $52.7 million during the 52 weeks ended April 30, 2016. This increase was primarily attributable to incremental depreciation resulting from recording MBS property and equipment and identified intangibles at fair value as of the acquisition date and additional capital expenditures for BNC.
Transaction Costs
Transaction costs were $9.6 million during the 52 weeks ended April 29, 2017 compared to $2.4 million during the 52 weeks ended April 30, 2016. We incur transaction costs for business development and acquisitions. For additional information related to our recent acquisitions, see Part II - Item 8. Financial Statements and Supplementary Data - Note 4. Acquisitions and Strategic Agreements.
Impairment Loss (non-cash) and Restructuring Costs
In Fiscal 2016, we implemented a plan to restructure our digital operations in our BNC segment. As a result of this restructuring, we recorded a non-cash impairment loss of $12.0 million related to all of the capitalized content costs for the Yuzu® eTextbook platform ($9 million), and recorded a non-recurring other than temporary loss related to an investment held at cost ($3 million).
Additionally, in our BNC segment, we announced a reduction in staff and closure of the facilities in Mountain View, California, and Redmond, Washington that supported the Yuzu® eTextbook platform. The cost of severance, retention, and other restructuring costs (i.e. facility exit costs) was $8.8 million and $1.8 million in Fiscal 2016 and Fiscal 2017, respectively. The restructuring was completed during Fiscal 2017.
Operating Income
52 weeks ended | 52 weeks ended | |||||||||||
Dollars in thousands | April 29, 2017 | % of Sales | April 30, 2016 | % of Sales | ||||||||
Operating Income | $ | 13,555 | 0.7% | $ | 4,623 | 0.2% | ||||||
In Fiscal 2017, our operating income was $13.6 million during the 52 weeks ended April 29, 2017. The increase compared to Fiscal 2016 was due to the matters discussed above. In Fiscal 2017, operating income, excluding eliminations of $(0.6) million, for BNC and MBS was $18.8 million and $(4.6) million, respectively, during the 52 weeks ended April 29, 2017. MBS results are consolidated from the acquisition date, February 27, 2017, to April 29, 2017. MBS has significantly lower sales realized during the fourth quarter (generally February through April) as the majority of the quarter is focused on purchasing inventory for the upcoming Fall semester. Excluding the transaction costs of $9.6 million and restructuring costs of $1.8 million, operating income for BNC was $30.2 million (or 1.6% of total sales) during the 52 weeks ended April 29, 2017.
In Fiscal 2016, our operating income was $4.6 million due to the matters discussed above. Excluding the impairment loss of $12.0 million, restructuring costs of $8.8 million, and transaction costs of $2.4 million, we reported operating income of $27.8 million (or 1.5% of sales) during the 52 weeks ended April 30, 2016.
Interest Expense, Net
52 weeks ended | ||||||||
Dollars in thousands | April 29, 2017 | April 30, 2016 | ||||||
Interest Expense, Net | $ | 3,464 | $ | 1,872 | ||||
Net interest expense increased by $1.6 million to $3.5 million during the 52 weeks ended April 29, 2017 from $1.9 million during the 52 weeks ended April 30, 2016 primarily due to increased borrowings under the Credit Facility and FILO Facility entered into during Fiscal 2017. On February 27, 2017, in connection with the acquisition of MBS, we amended our existing credit
42
agreement to add a new $100 million incremental first in, last out seasonal loan facility, and borrowed approximately $55 million under the credit facility to fund the acquisition at February 27, 2017.
Income Tax Expense
52 weeks ended | 52 weeks ended | |||||||||||
Dollars in thousands | April 29, 2017 | Effective Rate | April 30, 2016 | Effective Rate | ||||||||
Income Tax Expense | $ | 4,730 | 46.9% | $ | 2,667 | 96.9% | ||||||
We recorded an income tax expense of $4.7 million on pre-tax income of $10.1 million during the 52 weeks ended April 29, 2017, which represented an effective income tax rate of 46.9% and an income tax expense of $2.7 million on pre-tax income of $2.8 million during the 52 weeks ended April 30, 2016, which represented an effective income tax rate of 96.9%.
The income tax provision for the 52 weeks ended April 29, 2017 reflects the impact of nondeductible expenses, principally nondeductible compensation expense, partially offset by state net operating losses benefiting the Company as a result of the Spin-Off, as well as certain income tax credits. As compared to the 52 weeks ended April 29, 2017, the income tax provision for the 52 weeks ended April 30, 2016 also reflected the non-deductibility of certain impairment amounts referred to in Part II - Item 8. Financial Statements and Supplementary Data - Note 9. Supplementary Information - Impairment Loss (non-cash) and Restructuring Costs. Nondeductible compensation expense for the current fiscal year will be significantly higher than in previous years because of limitations on deductibility of certain elements of our compensation program imposed by Section 162(m) of the Internal Revenue Code. Management expects that nondeductible compensation in future fiscal years will be lower than the current fiscal year as certain components of our executive compensation program are intended to qualify for deduction under Section 162(m) going forward.
Net Income
52 weeks ended | ||||||||
Dollars in thousands | April 29, 2017 | April 30, 2016 | ||||||
Net Income | $ | 5,361 | $ | 84 | ||||
As a result of the factors discussed above, we reported net income of $5.4 million during the 52 weeks ended April 29, 2017, compared with net income of $0.1 million during the 52 weeks ended April 30, 2016. Adjusted Earnings (non-GAAP) is $12.3 million during the 52 weeks ended April 29, 2017, compared with $15.5 million during the 52 weeks ended April 30, 2016. See Adjusted Earnings (non-GAAP) discussion below.
Results of Operations - 52 weeks ended April 30, 2016 compared with the 52 weeks ended May 2, 2015
The discussion below for the results of operations for the 52 weeks ended April 30, 2016 compared with the 52 weeks ended May 2, 2015 includes only BNC, as MBS was acquired on February 27, 2017 (Fiscal 2017).
52 weeks ended | 52 weeks ended | |||||||
Dollars in thousands | April 30, 2016 | May 2, 2015 | ||||||
Sales: | ||||||||
Product sales and other | $ | 1,579,617 | $ | 1,544,975 | ||||
Rental income | 228,412 | 228,023 | ||||||
Total Sales | 1,808,029 | 1,772,998 | ||||||
Cost of sales: | ||||||||
Product and other cost of sales | 1,224,955 | 1,198,300 | ||||||
Rental cost of sales | 129,725 | 131,125 | ||||||
Total cost of sales | 1,354,680 | 1,329,425 | ||||||
Gross profit | 453,349 | 443,573 | ||||||
Selling and administrative expenses | 372,821 | 359,504 | ||||||
Depreciation and amortization expense | 52,690 | 50,509 | ||||||
Transaction costs | 2,398 | — | ||||||
Restructuring costs | 8,830 | — | ||||||
Impairment loss (non-cash) | 11,987 | — | ||||||
Operating Income | $ | 4,623 | $ | 33,560 | ||||
43
Sales
The following table summarizes our sales for the 52 weeks ended April 30, 2016 and May 2, 2015:
52 weeks ended | ||||||||||
Dollars in thousands | April 30, 2016 | May 2, 2015 | % | |||||||
Product sales and other | $ | 1,579,617 | $ | 1,544,975 | 2.2% | |||||
Rental income | 228,412 | 228,023 | 0.2% | |||||||
Total Sales | $ | 1,808,029 | $ | 1,772,998 | 2.0% | |||||
Our total sales increased $35.0 million, or 2.0%, to $1,808.0 million during the 52 weeks ended April 30, 2016 from $1,773.0 million during the 52 weeks ended May 2, 2015. The components of the variances are reflected in the table below.
Sales variances | ||||
Dollars in millions | 52 weeks ended | |||
Sales | ||||
New stores | $ | 77.2 | ||
Closed stores | (9.4 | ) | ||
Comparable stores | (31.7 | ) | ||
Textbook rental deferral | (1.7 | ) | ||
Service revenue (a) | 2.8 | |||
Other (b) | (2.2 | ) | ||
Total sales variance | $ | 35.0 | ||
(a) | Service revenue includes Promoversity, LoudCloud, brand partnerships, shipping and handling and revenue from other programs. |
(b) | Other includes certain adjusting items related to return reserves and other deferred items. |
Rental income for the 52 weeks ended April 30, 2016 increased $0.4 million, or 0.2%. Rental income for the 52 weeks ended April 30, 2016 was impacted by an increase in the recognition of our previously deferred rental revenue of $1.7 million. Excluding the impact of the deferred revenue, rental income increased $2.1 million, or 0.9%.
We added 39 new stores and closed 12 stores during the 52 weeks ended April 30, 2016, ending the period with a total of 751 stores.
Comparable store sales variances by category for the 52 week periods are as follows:
Comparable Store Sales variances | 52 weeks ended | ||||||
Dollars in millions | April 30, 2016 | ||||||
Textbooks | $ | (43.9 | ) | (3.8 | )% | ||
General Merchandise | 13.3 | 2.6 | % | ||||
Trade Books | 1.0 | 1.8 | % | ||||
Other | (2.1 | ) | (73.2 | )% | |||
Total Comparable Store Sales | $ | (31.7 | ) | (1.9 | )% | ||
Comparable store sales decreased for the 52 weeks ended April 30, 2016 and were negatively impacted by student enrollment, specifically in two-year community colleges. The components of the variances are reflected in the table above.
Textbook revenue for the 52 weeks ended April 30, 2016 decreased primarily due to lower new and used textbook sales. This decrease was partially offset by increased general merchandise sales, primarily due to higher emblematic apparel, gift and graduation product sales, which were partially offset by lower technology product sales.
44
Cost of Sales and Gross Margin
The following table summarizes our cost of sales for the 52 weeks ended April 30, 2016 and May 2, 2015:
52 weeks ended | 52 weeks ended | |||||||||||
Dollars in thousands | April 30, 2016 | % of Related Sales | May 2, 2015 | % of Related Sales | ||||||||
Product and other cost of sales | $ | 1,224,955 | 77.5% | $ | 1,198,300 | 77.6% | ||||||
Rental cost of sales | 129,725 | 56.8% | 131,125 | 57.5% | ||||||||
Total Cost of Sales | $ | 1,354,680 | 74.9% | $ | 1,329,425 | 75.0% | ||||||
The following table summarizes our gross margin for the 52 weeks ended April 30, 2016 and May 2, 2015:
52 weeks ended | 52 weeks ended | |||||||||||
Dollars in thousands | April 30, 2016 | % of Related Sales | May 2, 2015 | % of Related Sales | ||||||||
Product and other gross margin | $ | 354,662 | 22.5% | $ | 346,675 | 22.4% | ||||||
Rental gross margin | 98,687 | 43.2% | 96,898 | 42.5% | ||||||||
Gross Margin | $ | 453,349 | 25.1% | $ | 443,573 | 25.0% | ||||||
Our cost of sales decreased as a percentage of sales to 74.9% during the 52 weeks ended April 30, 2016 compared to 75.0% during the 52 weeks ended May 2, 2015. The decrease was due to the matters discussed below.
Our gross margin increased $9.8 million, or 2.2%, to $453.3 million, or 25.1% of sales, during the 52 weeks ended April 30, 2016 from $443.6 million, or 25.0% of sales, during the 52 weeks ended May 2, 2015. Gross margin as a percentage of sales increased due to margin improvements and a favorable sales mix, partially offset by higher costs related to our college and university contracts resulting from contract renewals and new store contracts as discussed below:
• | Product and other gross margin increased (10 basis points), driven primarily by margin improvements (20 basis points), predominately as a result of improved inventory management strategies for textbooks, and a favorable sales mix (20 basis points) resulting from an increase in higher margin general merchandise as a percentage of sales, partially offset by increased costs related to our college and university contracts (30 basis points) resulting from contract renewals and new store contracts. |
• | Rental gross margin increased (70 basis points), driven primarily by margin improvements (150 basis points) and a favorable rental mix (10 basis points), partially offset by increased costs related to our college and university contracts (90 basis points) resulting from contract renewals and new store contracts. |
Selling and Administrative Expenses
52 weeks ended | 52 weeks ended | |||||||||||
Dollars in thousands | April 30, 2016 | % of Sales | May 2, 2015 | % of Sales | ||||||||
Selling and Administrative Expenses | $ | 372,821 | 20.6% | $ | 359,504 | 20.3% | ||||||
During the 52 weeks ended April 30, 2016, selling and administrative expenses increased $13.3 million, or 3.7%, to $372.8 million from $359.5 million during the 52 weeks ended May 2, 2015. The increase was due primarily to an $8.8 million increase in new store payroll and operating expenses (net of closed stores) as a result of a $67.8 million increase in new store sales (net of closed stores). Also contributing to the increase was a $5.0 million increase in corporate payroll and infrastructure costs to support business growth including incremental costs associated with our separation from Barnes & Noble, Inc., and a $2.1 million increase in comparable store payroll and operating expenses (including a $1.9 million increase in employee benefit costs primarily due to higher medical claims costs). These increases were partially offset by a $2.4 million decrease in digital expenses related to Yuzu® and LoudCloud. See Impairment Loss (Non-cash) and Restructuring Costs discussion below.
Depreciation and Amortization Expense
52 weeks ended | 52 weeks ended | |||||||||||
Dollars in thousands | April 30, 2016 | % of Sales | May 2, 2015 | % of Sales | ||||||||
Depreciation and Amortization Expense | $ | 52,690 | 2.9% | $ | 50,509 | 2.8% | ||||||
45
Depreciation and amortization expense increased $2.2 million, or 4.3%, to $52.7 million during the 52 weeks ended April 30, 2016 from $50.5 million during the 52 weeks ended May 2, 2015. This increase was primarily attributable to additional capital expenditures.
Transaction Costs
Transaction costs were $2.4 million during the 52 weeks ended April 30, 2016. We incur transaction costs for business development and acquisitions. For additional information related to our recent acquisitions, see Part II - Item 8. Financial Statements and Supplementary Data - Note 4. Acquisitions and Strategic Agreements.
Impairment Loss (non-cash) and Restructuring Costs
In Fiscal 2016, we implemented a plan to restructure our digital operations. As a result of this restructuring, we recorded a non-cash impairment loss of $12.0 million related to all of the capitalized content costs for the Yuzu® eTextbook platform ($9 million), and recorded a non-recurring other than temporary loss related to an investment held at cost ($3 million).
Additionally, we announced a reduction in staff and closure of the facilities in Mountain View, California, and Redmond, Washington that support the Yuzu® eTextbook platform. The cost of severance, retention, and other restructuring costs (i.e. facility exit costs) is $8.8 million in Fiscal 2016. The restructuring was completed in Fiscal 2017.
Operating Income
52 weeks ended | 52 weeks ended | |||||||||||
Dollars in thousands | April 30, 2016 | % of Sales | May 2, 2015 | % of Sales | ||||||||
Operating Income | $ | 4,623 | 0.2% | $ | 33,560 | 1.9% | ||||||
Our operating income was $4.6 million during the 52 weeks ended April 30, 2016 compared to $33.6 million during the 52 weeks ended May 2, 2015. This decrease was due to the matters discussed above. Excluding the impairment loss of $12.0 million, restructuring costs of $8.8 million, and transaction costs (included in selling and administrative expenses) of $2.4 million, we reported operating income of $27.8 million (or 1.5% of sales) during the 52 weeks ended April 30, 2016, compared with operating income of $33.6 million (1.9% of sales) during the 52 weeks ended May 2, 2015.
Interest Expense, Net
52 weeks ended | ||||||||
Dollars in thousands | April 30, 2016 | May 2, 2015 | ||||||
Interest Expense, Net | $ | 1,872 | $ | 210 | ||||
Net interest expense increased $1.7 million to $1.9 million during the 52 weeks ended April 30, 2016 from $0.2 million during the 52 weeks ended May 2, 2015 primarily due to increased borrowings under the Credit Facility entered into during Fiscal 2016.
Income Tax Expense
52 weeks ended | 52 weeks ended | |||||||||||
Dollars in thousands | April 30, 2016 | Effective Rate | May 2, 2015 | Effective Rate | ||||||||
Income Tax Expense | $ | 2,667 | 96.9% | $ | 14,218 | 42.6% | ||||||
We recorded an income tax expense of $2.7 million on pre-tax income of $2.8 million during the 52 weeks ended April 30, 2016, which represented an effective income tax rate of 96.9% and an income tax expense of $14.2 million on pre-tax income of $33.4 million during the 52 weeks ended May 2, 2015, which represented an effective income tax rate of 42.6%.
The income tax provision for the 52 weeks ended April 30, 2016 reflects the impact of nondeductible expenses, including certain restructuring costs, partially offset by beneficial rate changes and income tax credits.
Net Income
52 weeks ended | ||||||||
Dollars in thousands | April 30, 2016 | May 2, 2015 | ||||||
Net Income | $ | 84 | $ | 19,132 | ||||
As a result of the factors discussed above, we reported net income of $0.1 million during the 52 weeks ended April 30, 2016, compared with net income of $19.1 million during the 52 weeks ended May 2, 2015. Adjusted Earnings (non-GAAP) is $15.5 million during the 52 weeks ended April 30, 2016, compared with $19.1 million during the 52 weeks ended May 2, 2015. See Adjusted Earnings (non-GAAP) discussion below.
46
Adjusted Earnings (non-GAAP)
To supplement our results prepared in accordance with GAAP, we use the measure of Adjusted Earnings, which is a non-GAAP financial measure under Securities and Exchange Commission (the “SEC”) regulations. We define Adjusted Earnings as net income as adjusted for additional items and subtracted from or added to net income.
To properly and prudently evaluate our business, we encourage you to review our consolidated financial statements included elsewhere in this Form 10-K and the reconciliation from Adjusted Earnings to net income, the most directly comparable financial measure presented in accordance with GAAP, set forth in the table below. All of the items included in the reconciliation from Adjusted Earnings to net income are either (i) non-cash items or (ii) items that management does not consider in assessing our on-going operating performance.
This non-GAAP financial measure is not intended as a substitute for and should not be considered superior to measures of financial performance prepared in accordance with GAAP. In addition, our use of this non-GAAP financial measure may be different from an Adjusted Earnings measure used by other companies, limiting its usefulness for comparison purposes. Adjusted Earnings should not be considered as an alternative to net income as an indicator of our performance or any other measures of performance derived in accordance with GAAP. As noted above, Adjusted Earnings has limitations as an analytical tool and should not be considered in isolation or as a substitute for analysis of our results reported under GAAP. The limitations of Adjusted Earnings include: (i) it does not reflect our cash expenditures or future requirements for capital expenditures or contractual commitments; (ii) it does not reflect changes in, or cash requirements for, our working capital needs; and (iii) it does not reflect income tax payments we may be required to make.
We believe that Adjusted Earnings is a useful performance measure, and it is used by us to facilitate a comparison of our operating performance on a consistent basis from period-to-period and to provide for a more complete understanding of factors and trends affecting our business than measures under GAAP can provide alone. Our Board of Directors and management also use Adjusted Earnings as one of the primary methods for planning and forecasting overall expected performance and for evaluating on a quarterly and annual basis actual results against such expectations. We review this non-GAAP measure internally to evaluate our performance and manage our operations. We believe that the inclusion of Adjusted Earnings results provides investors useful and important information regarding our operating results.
Dollars in thousands | Fiscal 2017 | Fiscal 2016 | Fiscal 2015 | |||||||||
Net income | $ | 5,361 | $ | 84 | $ | 19,132 | ||||||
Reconciling items, after-tax (below) | 6,986 | 15,378 | — | |||||||||
Adjusted Earnings (non-GAAP) | $ | 12,347 | $ | 15,462 | $ | 19,132 | ||||||
Reconciling items, pre-tax | ||||||||||||
Transaction costs (a) | $ | 9,605 | $ | 2,398 | $ | — | ||||||
Restructuring costs (a) | 1,790 | 8,830 | — | |||||||||
Impairment loss (non-cash) (a) | — | 11,987 | — | |||||||||
Reconciling items, pre-tax | 11,395 | 23,215 | — | |||||||||
Less: Pro forma income tax impact (b) | 4,409 | 7,837 | — | |||||||||
Reconciling items, after-tax | $ | 6,986 | $ | 15,378 | $ | — | ||||||
(a) | See Management Discussion and Analysis - Results of Operations discussion above. |
(b) | Represents the income tax effects of the non-GAAP items. |
47
Adjusted EBITDA (non-GAAP)
To supplement our results prepared in accordance with GAAP, we use the measure of Adjusted EBITDA, which is a non-GAAP financial measure under SEC regulations. We define Adjusted EBITDA as net income plus (1) depreciation and amortization; (2) interest expense and (3) income taxes, (4) as adjusted for additional items and subtracted from or added to net income.
To properly and prudently evaluate our business, we encourage you to review our consolidated financial statements included elsewhere in this Form 10-K and the reconciliation from Adjusted EBITDA to net income, the most directly comparable financial measure presented in accordance with GAAP, set forth in the table below. All of the items included in the reconciliation from Adjusted EBITDA to net income are either (i) non-cash items or (ii) items that management does not consider in assessing our on-going operating performance.
This non-GAAP financial measure is not intended as a substitute for and should not be considered superior to measures of financial performance prepared in accordance with GAAP. In addition, our use of this non-GAAP financial measure may be different from an Adjusted EBITDA measure used by other companies, limiting its usefulness for comparison purposes. Adjusted EBITDA should not be considered as an alternative to net income as an indicator of our performance or any other measures of performance derived in accordance with GAAP. As noted above, Adjusted EBITDA has limitations as an analytical tool and should not be considered in isolation or as a substitute for analysis of our results reported under GAAP. The limitations of Adjusted EBITDA include: (i) it does not reflect our cash expenditures or future requirements for capital expenditures or contractual commitments; (ii) it does not reflect changes in, or cash requirements for, our working capital needs; (iii) it does not reflect income tax payments we may be required to make; and (iv) although depreciation and amortization are non-cash charges, the assets being depreciated and amortized often will have to be replaced in the future, and Adjusted EBITDA does not reflect any requirements for such replacements.
We believe that Adjusted EBITDA is a useful performance measure, and it is used by us to facilitate a comparison of our operating performance on a consistent basis from period-to-period and to provide for a more complete understanding of factors and trends affecting our business than measures under GAAP can provide alone. Our Board of Directors and management also use Adjusted EBITDA as one of the primary methods for planning and forecasting overall expected performance and for evaluating on a quarterly and annual basis actual results against such expectations. We review this non-GAAP measure internally to evaluate our performance and manage the operations of our segments, and for purposes of performance-based compensation. We believe that the inclusion of Adjusted EBITDA results provides investors useful and important information regarding our operating results.
Adjusted EBITDA | ||||||||||||
Dollars in thousands | Fiscal 2017 | Fiscal 2016 | Fiscal 2015 | |||||||||
Net income | $ | 5,361 | $ | 84 | $ | 19,132 | ||||||
Add: | ||||||||||||
Depreciation and amortization expense | 53,318 | 52,690 | 50,509 | |||||||||
Interest expense, net | 3,464 | 1,872 | 210 | |||||||||
Income tax expense | 4,730 | 2,667 | 14,218 | |||||||||
Transaction costs (a) | 9,605 | 2,398 | — | |||||||||
Restructuring costs (a) | 1,790 | 8,830 | — | |||||||||
Impairment loss (non-cash) (a) | — | 11,987 | — | |||||||||
Adjusted EBITDA (non-GAAP) | $ | 78,268 | $ | 80,528 | $ | 84,069 | ||||||
(a) See Management Discussion and Analysis - Results of Operations discussion above.
The following is Adjusted EBITDA by segment for Fiscal 2017. Prior to the acquisition of MBS on February 27, 2017, we had only one reportable segment. MBS’s business is highly seasonal. For MBS’s retail operations (virtual bookstores), a major portion of sales and operating profit are realized during the second and third quarters, when students generally purchase and rent textbooks for the upcoming semesters. For MBS’s wholesale business, a major portion of sales and operating profit is realized during the first, second and third fiscal quarters, as it sells textbooks for retail distribution, which somewhat offsets the decreased first quarter sales attributable to our retail business. MBS has significantly lower operating profit or operating loss realized during the fourth quarter (generally February through April).
48
Adjusted EBITDA | ||||||||||||||||
Dollars in thousands | BNC | MBS | Elimination (a) | Total Fiscal 2017 | ||||||||||||
Sales | $ | 1,845,561 | $ | 34,091 | $ | (5,290 | ) | $ | 1,874,362 | |||||||
Cost of sales | 1,392,309 | 29,343 | (4,653 | ) | 1,416,999 | |||||||||||
Gross profit | 453,252 | 4,748 | (637 | ) | 457,363 | |||||||||||
Selling and administrative expenses | 370,778 | 8,317 | — | 379,095 | ||||||||||||
Adjusted EBITDA (non-GAAP) | $ | 82,474 | $ | (3,569 | ) | $ | (637 | ) | $ | 78,268 | ||||||
(a) See Management Discussion and Analysis - Results of Operations discussion above.
Liquidity and Capital Resources
Our primary sources of cash are net cash flows from operating activities, funds available under a credit agreement and short-term vendor financing. As of April 29, 2017, we had a total of $159.6 million of outstanding borrowings under the BNED Credit Facility and FILO Facility. See Financing Arrangements discussion below.
Share Repurchases
On December 14, 2015, our Board of Directors authorized a stock repurchase program of up to $50 million, in the aggregate, of our outstanding common stock. The stock repurchase program is carried out at the direction of management (which includes a plan under Rule 10b5-1 of the Securities Exchange Act of 1934). The stock repurchase program may be suspended, terminated, or modified at any time. Any repurchased shares will be held as treasury stock and will be available for general corporate purposes. During Fiscal 2016, we repurchased 1,715,269 shares for approximately $16.6 million at a weighted average cost per share of $9.95. During Fiscal 2017, we repurchased 688,948 shares for approximately $6.7 million at a weighted average cost per share of $10.10. As of April 29, 2017, approximately $26.7 million remains available under the stock repurchase program.
During Fiscal 2017 and Fiscal 2016, we also repurchased 276,292 shares and 174,511 shares of our common stock, respectively, in connection with employee tax withholding obligations for vested stock awards.
Sources and Uses of Cash Flow
Dollars in thousands | Fiscal 2017 | Fiscal 2016 | Fiscal 2015 | |||||||||
Cash, cash equivalents, and restricted cash at beginning of period | $ | 30,866 | $ | 44,816 | $ | 132,117 | ||||||
Net cash flows provided by operating activities | 67,986 | 83,083 | 17,725 | |||||||||
Net cash flows used in investing activities | (224,438 | ) | (68,744 | ) | (58,185 | ) | ||||||
Net cash flows provided by (used in) financing activities | 147,283 | (28,289 | ) | (46,841 | ) | |||||||
Cash, cash equivalents, and restricted cash at end of period | $ | 21,697 | $ | 30,866 | $ | 44,816 | ||||||
During the fourth quarter of Fiscal 2017, we adopted ASU No. 2016-18, Statement of Cash Flows ("ASU 2016-18") which requires that restricted cash and restricted cash equivalents be included with cash and cash equivalents when reconciling the beginning-of-period and end-of-period total amounts shown on the statement of cash flows. We adopted ASU 2016-18 retrospectively for all periods presented and have included restricted cash of $2.3 million and $0 in the end-of-period cash balances for Fiscal 2016 and Fiscal 2015, respectively. The offset to the $2.3 million restricted cash reclassification is reflected as an increase to changes in other operating assets and liabilities of $0.3 million and an increase in other noncurrent assets of $2.0 million in our consolidated statement of cash flows for Fiscal 2016.
Cash Flow from Operating Activities
Our business is highly seasonal. For our retail operations (BNC and MBS Direct), cash flows from operating activities are typically a source of cash in the second and third fiscal quarters, when students generally purchase and rent textbooks for the upcoming semesters. For MBS Wholesale, cash flows from operating activities are typically a source of cash in the second and fourth fiscal quarters, as payments are received from the summer and winter selling season when they sell textbooks for retail distribution. For both BNC and MBS, cash flows from operating activities are typically a use of cash in the fourth fiscal quarter, when sales volumes are materially lower than the other quarters. Our quarterly cash flows also may fluctuate depending on the timing of the start of the various school’s semesters, as well as shifts in fiscal calendar dates. These shifts in timing may affect the comparability of our results across periods.
49
Cash flows provided by operating activities during Fiscal 2017 were $68.0 million compared to $83.1 million during Fiscal 2016. This decrease of $15.1 million was primarily due to the inclusion of MBS operating activities from the date of acquisition, February 27, 2017, to April 29, 2017, changes in working capital and changes in deferred tax balances.
Cash flows provided by operating activities during Fiscal 2016 were $83.1 million compared to $17.7 million during Fiscal 2015. This net change of $65.4 million was primarily due changes in working capital, including receipts of a $38.2 million receivable from Barnes & Noble, Inc., which was paid at the time of the Spin-Off, and changes in deferred taxes.
Cash Flow from Investing Activities
Our investing activities consist principally of capital expenditures for contractual capital investments associated with renewing existing contracts, new store construction, digital initiatives and enhancements to internal systems and our website.
Cash flows used in investing activities during Fiscal 2017 were $(224.4) million compared to $(68.7) million during Fiscal 2016. The increase is primarily due to cash consideration for the acquisition of MBS of $187.0 million, net of cash and restricted cash acquired of $1.2 million, in Fiscal 2017, and lower capital expenditures primarily for contractual capital investments associated with renewing existing contracts, and new store construction. Capital expenditures totaled $34.7 million and $50.8 million during Fiscal 2017 and Fiscal 2016, respectively.
Cash flows used in investing activities during Fiscal 2016 were $(68.7) million compared to $(58.2) million during Fiscal 2015. The increase is primarily due to the acquisition of LoudCloud Systems, Inc. for $17.9 million in Fiscal 2016. Capital expenditures totaled $50.8 million and $48.5 million during Fiscal 2016 and Fiscal 2015, respectively.
Cash Flow from Financing Activities
Cash flows provided by financing activities during Fiscal 2017 were $147.3 million compared to cash flows used in financing activities of $28.3 million during Fiscal 2016. This net change of $119.0 is primarily due to increased net borrowings under the credit agreement of $159.6 million, the net change in the Barnes & Noble, Inc. investment of $6.4 million, and decreased payments for common stock repurchased of $9.2 million in Fiscal 2017.
Cash flows used in financing activities during Fiscal 2016 decreased by $28.3 million compared to Fiscal 2015 primarily due to the acquisition of Preferred Membership Interests of $76.2 million in the prior year, offset by the net change in the Barnes & Noble, Inc. investment of $35.8 million, and increased payments for common stock repurchased of $18.6 million and deferred financing costs of $3.3 million.
Financing Arrangements
Until August 3, 2015, we were party to the B&N Credit Facility. All outstanding debt under the B&N Credit Facility was recorded on Barnes & Noble, Inc.’s balance sheet prior to the Spin-Off on August 2, 2015.
On August 3, 2015, we, and certain of our subsidiaries from time to time party thereto, entered into a credit agreement with Bank of America, N.A., as administrative agent, collateral agent and swing line lender, and other lenders from time to time party thereto, under which the lenders committed to provide us with a five-year asset-backed revolving credit facility in an aggregate committed principal amount of $400 million (the "BNED Credit Facility"). Proceeds from the Credit Facility are used for general corporate purposes, including seasonal working capital needs. Bank of America Merrill Lynch, J.P. Morgan Securities LLC, Wells Fargo Bank, N.A. and SunTrust Robinson Humphrey, Inc. are the joint lead arrangers for the BNED Credit Facility.
The Company and certain of its subsidiaries (collectively, the “Loan Parties”) will be permitted to borrow under the BNED Credit Facility. The BNED Credit Facility is secured by substantially all of the inventory, accounts receivable and related assets of the borrowers under the BNED Credit Facility, but excluding the equity interests in the Company and its subsidiaries, intellectual property, equipment and certain other property. The Company has the option to request an increase in commitments under the BNED Credit Facility of up to $100 million, subject to certain restrictions.
On February 27, 2017, in connection with the acquisition of MBS, we amended our existing credit agreement to add a new $100 million incremental first in, last out seasonal loan facility (the “FILO Facility”), and borrowed approximately $55 million under the BNED Credit Facility to fund the acquisition at February 27, 2017.
During the 52 weeks ended April 29, 2017, we had borrowed $312.7 million and repaid $153.1 million under the BNED Credit Facility and FILO Facility, for a net total of $159.6 million of outstanding borrowings as of April 29, 2017. As of April 29, 2017, we have issued $3.6 million in letters of credit under the facility. During Fiscal 2016, we borrowed and repaid $60.6 million under the BNED Credit Facility.
During Fiscal 2017, we incurred debt issuance costs totaling $2.9 million related to the FILO Facility. During Fiscal 2016, we incurred debt issuance costs totaling $3.3 million related to the BNED Credit Facility. The debt issuance costs have been deferred and are presented as an asset which is subsequently amortized ratably over the term of the credit agreement.
50
Interest under the BNED Credit Facility accrues, at the election of the Company, at a LIBOR or alternate base rate, plus, in each case, an applicable interest rate margin, which is determined by reference to the level of excess availability under the BNED Credit Facility. Loans will initially bear interest at LIBOR plus 2.000% per annum, in the case of LIBOR borrowings, or at the alternate base rate plus 1.000% per annum, in the alternative, and thereafter the interest rate will fluctuate between LIBOR plus 2.000% per annum and LIBOR plus 1.750% per annum (or between the alternate base rate plus 1.000% per annum and the alternate base rate plus 0.750% per annum), based upon the excess availability under the BNED Credit Facility at such time.
Loans under the FILO Facility will bear interest at a rate equal to the LIBOR rate, plus 3.000%. The FILO Facility will be available solely during the draw period each year, from April 1 through July 31. We are required to borrow 100% of the aggregate commitments under the FILO Facility on April 1 of each year, and the loans must be repaid in full (including interest and fees) on July 31 of each year. The Commitments under the FILO Facility will decrease from $100 million to $75 million on August 1, 2018, from $75 million to $50 million on August 1, 2019 and from $50 million to $25 million on August 1, 2020. We will pay a commitment fee of 0.375% on the daily unused portion of the FILO Facility.
The Credit Agreement contains customary negative covenants, which limit the Company’s ability to incur additional indebtedness, create liens, make investments, make restricted payments or specified payments and merge or acquire assets, among other things. In addition, if excess availability under the BNED Credit Facility were to fall below certain specified levels, certain additional covenants (including fixed charge coverage ratio requirements) would be triggered, and the lenders would have the right to assume dominion and control over the Loan Parties’ cash.
The Credit Agreement contains customary events of default, including payment defaults, material breaches of representations and warranties, covenant defaults, default on other material indebtedness, customary ERISA events of default, bankruptcy and insolvency, material judgments, invalidity of liens on collateral, change of control or cessation of business. The Credit Agreement also contains customary affirmative covenants and representations and warranties. We are in compliance with all covenants, representations and warranties under the Credit Agreement as of April 29, 2017.
We believe that our future cash from operations, access to borrowings under the BNED Credit Facility, FILO Facility and short-term vendor financing will provide adequate resources to fund our operating and financing needs for the foreseeable future. Our access to, and the availability of, financing in the future will be impacted by many factors, including the liquidity of the overall capital markets and the current state of the economy. There can be no assurances that we will have access to capital markets on acceptable terms.
Income Tax Implications on Liquidity
As of April 29, 2017, other long-term liabilities includes $77.1 million related to the long-term tax payable associated with the LIFO reserve. The LIFO reserve is impacted by changes in the consumer price index ("CPI") and inventory levels. Management believes it is remote that the long-term tax payable associated with the LIFO reserve will be payable or will result in a cash tax payment in the foreseeable future, assuming that the historical CPI and inventory trends continue and LIFO will continue to be an acceptable inventory method for tax purposes.
Contractual Obligations
The following table sets forth our contractual obligations as of April 29, 2017 (in millions):
Payments Due by Period | ||||||||||||||||||||
Total | Less Than 1 Year | 1-3 Years | 3-5 Years | More Than 5 Years | ||||||||||||||||
Credit Facility (a) | $ | 59.6 | $ | 59.6 | $ | — | $ | — | $ | — | ||||||||||
FILO Facility (a) | 250.0 | 100.0 | 125.0 | 25.0 | — | |||||||||||||||
School management contract and other lease obligations (b) | 826.2 | 140.5 | 257.3 | 220.6 | 207.8 | |||||||||||||||
Purchase obligations (c) | 6.3 | 3.1 | 3.0 | 0.2 | — | |||||||||||||||
Other long-term liabilities reflected on the balance sheet under GAAP (d) (e) | — | — | — | — | — | |||||||||||||||
Total | $ | 1,142.1 | $ | 303.2 | $ | 385.3 | $ | 245.8 | $ | 207.8 | ||||||||||
(a) | As of April 29, 2017, we had a total of $159.6 million of outstanding borrowings under the BNED Credit Facility and FILO Facility. Excludes interest which is generally at a base rate of LIBOR, plus a variable rate. See Financing Arrangements discussion above for information about future borrowings and payments under the BNED FILO Credit Facility. |
(b) | Our contracts with colleges and universities are typically five years with renewal options, but can range from one to 15 years, and are typically cancelable by either party without penalty with 90 to120 days' notice. Annual projections are based on current minimum guarantee amounts. In approximately 65% of our contracts with colleges and universities that include minimum |
51
guarantees, the minimum guaranteed amounts adjust annually to equal less than the prior year's commission earned. Excludes obligations under store leases for property insurance and real estate taxes, which totaled approximately 2.1% of the minimum rent payments under those leases.
(c) | Includes information technology contracts. |
(d) | Other long-term liabilities excludes $77.1 million of tax liabilities related to the long-term tax payable associated with the LIFO reserve and $0.09 million of unrecognized tax benefits, for which we cannot make a reasonably reliable estimate of the amount and period of payment. The LIFO reserve is impacted by changes in the CPI and inventory levels. Management believes it is remote that the long-term tax payable associated with the LIFO reserve will be payable or will result in a cash tax payment in the foreseeable future, assuming that the historical CPI and inventory trends continue and LIFO will continue to be an acceptable inventory method for tax purposes. See Part II - Item 8. Financial Statements and Supplementary Data - Note 2. Summary of Significant Policies and Note 14. Income Taxes. |
(e) | Other long-term liabilities excludes expected payments related to employee benefit plans. See Item 8. Financial Statements and Supplementary Data — Note 12. Employee Benefit Plans. |
Off-Balance Sheet Arrangements
As of April 29, 2017, we have no off-balance sheet arrangements as defined in Item 303 of Regulation S-K.
Certain Relationships and Related Party Transactions
See Part II - Item 8. Financial Statements and Supplementary Data — Note 10. Barnes & Noble, Inc. Transactions and Note 11. Related Party Transactions.
Critical Accounting Policies and Estimates
In preparing our consolidated financial statements in accordance with GAAP, we are required to use judgment in making estimates and assumptions that affect the amounts reported in our consolidated financial statements and related notes. In preparing these financial statements, management has made its best estimates and judgments with respect to certain amounts included in the financial statements, giving due consideration to materiality. We do not believe there is a great likelihood that materially different amounts would be reported related to the accounting policies described below. However, application of these accounting policies involves the exercise of judgment and use of assumptions as to future uncertainties and, as a result, actual results could differ from these estimates.
Revenue Recognition and Deferred Revenue
Revenue from sales of our products at physical locations is recognized at the time of sale. Revenue from sales of products ordered through our websites is recognized upon delivery and receipt of the shipment by our customers.
Revenue from the sale of traditional textbooks from our wholesale and virtual bookstores is recognized at the time of shipment. Additional revenue is recognized for shipping charges billed to customers.
We rent both physical and digital textbooks. Revenue from the rental of physical textbooks is deferred and recognized over the rental period commencing at point of sale. We offer a buyout option to allow the purchase of a rented physical textbook at the end of the rental period. We record the buyout purchase when the customer exercises and pays the buyout option price. In these instances, we would accelerate any remaining deferred rental revenue at the point of sale.
Revenue from the rental of digital textbooks is recognized at time of sale. A software feature is embedded within the content of our digital textbooks, such that upon expiration of the rental term the customer is no longer able to access the content. While the digital rental allows the customer to access digital content for a fixed period of time, once the digital content is delivered to the customer our performance obligation is complete. We primarily record digital textbook rental sales on a net basis in accordance with ASC 605-45-45, Reporting Revenue Gross as a Principal versus Net as an Agent.
Sales taxes collected from our customers are excluded from reported revenues. All of our sales are recognized as revenue on a “net” basis, including sales in connection with any periodic promotions offered to customers. We do not treat any promotional offers as expenses.
Merchandise Inventories
Merchandise inventories, which consist of purchased finished goods, are stated at the lower of cost or market. Market value of our inventory, which is all purchased finished goods, is determined based on its estimated net realizable value, which is generally the selling price less normally predictable costs of disposal and transportation. Reserves for non-returnable inventory are based on our history of liquidating non-returnable inventory.
Cost is determined primarily by the retail inventory method for our BNC segment and last-in first out, or “LIFO”, method for our MBS segment. Our textbook inventories, for BNC and MBS, and trade book inventories are valued using the LIFO method
52
and the related reserve was not material to the recorded amount of our inventories. There were no LIFO adjustments in Fiscal 2017, Fiscal 2016 and Fiscal 2015.
Reserves for non-returnable inventory are based on our history of liquidating non-returnable inventory. We do not believe there is a reasonable likelihood that there will be a material change in the future estimates or assumptions used to calculate the non-returnable inventory reserve. However, if assumptions based on our history of liquidating non-returnable inventory are incorrect, we may be exposed to losses or gains that could be material. A 10% change in actual non-returnable inventory would have affected pre-tax earnings by approximately $7.0 million in Fiscal 2017.
We also estimate and accrue shortage for the period between the last physical count of inventory and the balance sheet date. Shortage rates are estimated and accrued based on historical rates and can be affected by changes in merchandise mix and changes in actual shortage trends. We do not believe there is a reasonable likelihood that there will be a material change in the future estimates or assumptions used to calculate shortage rates. However, if our estimates regarding shortage rates are incorrect, we may be exposed to losses or gains that could be material. A 10 basis point change in actual shortage rates would have affected pre-tax earnings by approximately $0.8 million in Fiscal 2017.
Textbook Rental Inventories
Physical textbooks out on rent are categorized as textbook rental inventories. At the time a rental transaction is consummated, the book is removed from merchandise inventories and moved to textbook rental inventories at cost. The cost of the book is amortized down to its estimated residual value over the rental period. The related amortization expense is included in cost of goods sold. At the end of the rental period, upon return, the book is removed from textbook rental inventories and recorded in merchandise inventories at its amortized cost. We do not believe there is a reasonable likelihood that there will be a material change in the future estimates or assumptions used to calculate rental cost of goods sold. However, if our estimates regarding residual value are incorrect, we may be exposed to losses or gains that could be material. A 1% change in rental cost of goods sold would have affected pre-tax earnings by approximately $0.7 million in Fiscal 2017.
Purchase Accounting
We assign values to identified tangible and intangible assets acquired and liabilities assumed based on their estimated fair values at the dates of acquisition, with any residual amounts recorded as goodwill. The fair value estimates used reflect our best estimates for the highest and best use by market participants. These estimates are subject to uncertainties and contingencies. For example, we used the discounted cash flow method to estimate the value of many of our assets, which entailed developing projections of future cash flows. If the cash flows from the acquired net assets differ significantly from our estimates, the amounts recorded could be subject to impairments. Furthermore, to the extent we change our initial estimates of the remaining useful life of the assets or liabilities, future depreciation and amortization expense could be impacted.
Stock-Based Compensation
The assumptions used in calculating the fair value of stock-based payment awards represent management’s best estimates, but these estimates involve inherent uncertainties and the application of management’s judgment. See Part II - Item 8. Financial Statements and Supplementary Data — Note 13. Stock-Based Compensation for a further discussion of our stock-based incentive plan. We are required to estimate the expected forfeiture rate, and only recognize expense for those shares expected to vest. If their actual forfeiture rate is materially different from their estimate, our stock-based compensation expense could be significantly different from what we recorded in the current period. We do not believe there is a reasonable likelihood that there will be a material change in the future estimates or assumptions used to determine stock-based compensation expense. If actual results are not consistent with the assumptions used, the stock-based compensation expense reported in our financial statements may not be representative of the actual economic cost of the stock-based compensation. A 10% change in our stock-based compensation expense would have affected pre-tax earnings by approximately $0.9 million in Fiscal 2017.
Evaluation of Other Long-Lived Assets Impairment
Our other long-lived assets include property and equipment and amortizable intangibles. As of April 29, 2017, we had $116.6 million and $209.9 million of property and equipment and amortizable intangible assets, net of depreciation and amortization, respectively, on our consolidated balance sheet.
We review our long-lived assets for impairment whenever events or changes in circumstances indicate that the carrying amount of an asset may not be recoverable and consider market participants in accordance with ASC 360-10, Accounting for the Impairment or Disposal of Long-Lived Assets. We evaluate long-lived assets for impairment at the school contract combined store level, which is the lowest level at which individual cash flows can be identified. When evaluating long-lived assets for potential impairment, we first compare the carrying amount of the assets to the school contract combined store level’s estimated future undiscounted cash flows. If the estimated future cash flows are less than the carrying amount of the assets, an impairment loss calculation is prepared. The impairment loss calculation compares the carrying amount of the assets to the school contract combined store level’s fair value based on its estimated discounted future cash flows. If required, an impairment loss is recorded for that portion of the
53
asset’s carrying value in excess of fair value. Impairment losses related to school contracts are included in selling and administrative expenses totaled $0.02 million, $0.06 million, and $0.01 million during Fiscal 2017, Fiscal 2016 and Fiscal 2015, respectively. We do not believe there is a reasonable likelihood that there will be a material change in the estimates or assumptions used to calculate long-lived asset impairment losses. However, if actual results are not consistent with estimates and assumptions used in estimating future cash flows and asset fair values, we may be exposed to losses that could be material. A 10% decrease in our estimated discounted cash flows would not have materially affected the results of our operations in Fiscal 2017.
In Fiscal 2016, we implemented a plan to restructure our digital operations. As a result of this restructuring, we recorded a non-cash impairment loss of $12 million. For additional information, see Item 8. Financial Statements and Supplementary Data — Note 9. Supplementary Information.
Evaluation of Goodwill Impairment
As of April 29, 2017, we had $329.5 million of goodwill on our consolidated balance sheet. Goodwill is tested for impairment at least annually or earlier if there are impairment indicators. We perform a two-step process for impairment testing of goodwill as required by ASC 350-30, Goodwill and Other Intangible Assets. The first step of this test, used to identify potential impairment, compares the fair value of a reporting unit with its carrying amount. The second step (if necessary) measures the amount of the impairment.
Application of the goodwill impairment test requires judgment, including: the identification of reporting units; assignment of assets and liabilities to reporting units; assignment of goodwill to reporting units; and the determination of the fair value of each reporting unit. At the time of our last annual impairment test, November 1, 2016, we had one single reporting unit.
We estimate the fair value of our reporting unit using an income approach based on the present value of estimated future cash flows. Inherent in our preparation of cash flow projections are assumptions and estimates derived from a review of our operating results, business plans, expected growth rates, cost of capital and tax rates. We also make certain forecasts about future economic conditions, interest rates and other market data. Many of the factors used in assessing fair value are outside the control of management, and these assumptions and estimates may change in future periods. Changes in assumptions or estimates could materially affect the estimate of the fair value, and therefore could affect the likelihood and amount of potential impairment. The following assumptions are significant to our income approach:
Business Projections- We make assumptions about the level of revenues, gross profit, operating expenses, as well as capital expenditures and net working capital requirements. These assumptions drive our planning assumptions and represent key inputs for developing our cash flow projections. These projections are developed using our internal business plans over a five-year planning period that are updated at least annually;
Long-term Growth Rates- We also utilize an assumed long-term growth rate representing the expected rate at which our cash flow stream is projected to grow. These rates are used to calculate the terminal value and are added to the cash flows projected during our five-year planning period; and
Discount Rates- The estimated future cash flows are then discounted at a rate that is consistent with a weighted-average cost of capital that is likely to be expected by market participants. The weighted-average cost of capital is an estimate of the overall after-tax rate of return required by equity and debt holders of a business enterprise.
Based on the results of the step one testing, fair value of the Company exceeded its carrying value by approximately 5% as of the annual testing date.
Given the margin by which the estimated fair value exceeded its carrying amount, we also performed a sensitivity analysis related to the long-term growth rate and discount rate used in the November 1, 2016 test. Specifically, the estimated fair value would exceed its carrying amount if we independently either reduced the long-term growth rate by 50 basis points or increased the discount rate by 25 basis points. Under the following scenarios, step two testing would have been required to determine the potential goodwill impairment. The fair value would not exceed its carrying value if we:
•independently reduced the long-term growth rate by 100 basis points;
•independently increased the discount rate by 50 basis points;
• | simultaneously reduced the long-term growth rate by 50 basis points, while also increasing the discount rate by 25 basis points. |
The November 1, 2016 impairment test assumed earnings growth, primarily from our digital revenues. Should this growth not occur, if the reporting unit otherwise fails to meet its current financial plans, or if there were changes to any other key assumption used in the test, the reporting unit could fail step one of the goodwill impairment test in a future period. We will continue to monitor the reporting unit for impairment.
54
Income Taxes
Deferred income tax balances reflect the effects of temporary differences between the carrying amounts of assets and liabilities and their tax basis and are stated at enacted tax rates expected to be in effect when taxes are actually paid or recovered. FASB guidance on accounting for income taxes requires that deferred tax assets be evaluated for future realization and reduced by a valuation allowance to the extent we believe a portion will not be realized. We consider many factors when assessing the likelihood of future realization of our deferred tax assets, including our recent earnings experience and expectations of future taxable income by taxing jurisdiction, the carryforward periods available to us for tax reporting purposes and other relevant factors. The actual realization of deferred tax assets may differ significantly from the amounts we have recorded.
During the ordinary course of business, there are many transactions and calculations for which the ultimate tax determination is uncertain. Accounting for income taxes requires a two-step approach to recognizing and measuring uncertain tax positions. The first step is to evaluate the tax position for recognition by determining if available evidence indicates it is more likely than not that the tax position will be fully sustained upon review by taxing authorities, including resolution of related appeals or litigation processes, if any. The second step is to measure the tax benefit as the largest amount with a greater than 50 percent likelihood of being realized upon ultimate settlement. For tax positions that are 50 percent or less likely of being sustained upon audit, we do not recognize any portion of that benefit in the financial statements. We consider many factors when evaluating and estimating our tax positions and tax benefits, which may require periodic adjustments and which may not accurately anticipate actual outcomes. Our actual results could differ materially from our current estimates.
Recent Accounting Pronouncements
See Item 8. Financial Statements and Supplementary Data — Note 3. Recent Accounting Pronouncements for information related to new accounting pronouncements.
Item 7A. QUANTITATIVE AND QUALITATIVE DISCLOSURES ABOUT MARKET RISK
Quantitative and Qualitative Disclosures About Market Risk
Interest Rate Risk
We limit our interest rate risk by investing certain of our excess cash balances in short-term, highly-liquid instruments with an original maturity of one year or less. We do not expect any material losses from our invested cash balances and we believe that our interest rate exposure is modest. As of April 29, 2017, our cash and cash equivalents totaled approximately $19.0 million. A 25 basis point increase in interest rates or 25 basis point decrease in interest rates would not have materially affected interest income in Fiscal 2017.
We may from time to time borrow money under the BNED Credit Facility and FILO Facility at various interest rate options based on LIBOR or alternate base rate (each term as defined therein) depending upon certain financial tests. Accordingly, we may be exposed to interest rate risk on borrowings under the BNED Credit Facility and FILO Facility. We had $159.6 million borrowings under BNED Credit Facility and FILO Facility at April 29, 2017. A 25 basis point increase in interest rates or 25 basis point decrease in interest rates would affect interest expense by approximately $0.6 million in Fiscal 2017.
Foreign Currency Risk
We do not have any material foreign currency exposure as nearly all of our business is transacted in United States currency.
55
Item 8. FINANCIAL STATEMENTS AND SUPPLEMENTARY DATA
FINANCIAL STATEMENT INDEX | |||
Page No. | |||
56
REPORT OF INDEPENDENT REGISTERED PUBLIC ACCOUNTING FIRM
To the Board of Directors and Shareholders of Barnes & Noble Education, Inc. and subsidiaries
We have audited the accompanying consolidated balance sheets of Barnes & Noble Education, Inc. and subsidiaries as of April 29, 2017 and April 30, 2016, and the related consolidated statements of operations and comprehensive income, equity and cash flows for each of the three years in the period ended April 29, 2017. Our audits also included the financial statement schedule listed in the Index at Item 15(a)(2). These financial statements and schedule are the responsibility of the Company’s management. Our responsibility is to express an opinion on these financial statements and schedule based on our audits.
We conducted our audits in accordance with the standards of the Public Company Accounting Oversight Board (United States). Those standards require that we plan and perform the audit to obtain reasonable assurance about whether the financial statements are free of material misstatement. An audit includes examining, on a test basis, evidence supporting the amounts and disclosures in the financial statements. An audit also includes assessing the accounting principles used and significant estimates made by management, as well as evaluating the overall financial statement presentation. We believe that our audits provide a reasonable basis for our opinion.
In our opinion, the financial statements referred to above present fairly, in all material respects, the consolidated financial position of Barnes & Noble Education, Inc. and subsidiaries at April 29, 2017 and April 30, 2016, and the consolidated results of its operations and its cash flows for each of the three years in the period ended April 29, 2017, in conformity with U.S. generally accepted accounting principles. Also, in our opinion, the related financial statement schedule, when considered in relation to the basic financial statements taken as a whole, presents fairly in all material respects, the information set forth therein.
We also have audited, in accordance with the standards of the Public Company Accounting Oversight Board (United States), Barnes & Noble Education, Inc.’s internal control over financial reporting as of April 29, 2017, based on criteria established in Internal Control-Integrated Framework issued by the Committee of Sponsoring Organizations of the Treadway Commission (2013 framework) and our report dated July 12, 2017 expressed an unqualified opinion thereon.
/s/ Ernst & Young LLP
Iselin, New Jersey
July 12, 2017
57
BARNES & NOBLE EDUCATION, INC. AND SUBSIDIARIES
Consolidated Statements of Operations
(In thousands, except per share data)
52 weeks ended | 52 weeks ended | 52 weeks ended | ||||||||||
April 29, 2017 | April 30, 2016 | May 2, 2015 | ||||||||||
Sales: | ||||||||||||
Product sales and other | $ | 1,638,934 | $ | 1,579,617 | $ | 1,544,975 | ||||||
Rental income | 235,428 | 228,412 | 228,023 | |||||||||
Total sales | 1,874,362 | 1,808,029 | 1,772,998 | |||||||||
Cost of sales: | ||||||||||||
Product and other cost of sales | 1,280,374 | 1,224,955 | 1,198,300 | |||||||||
Rental cost of sales | 136,625 | 129,725 | 131,125 | |||||||||
Total cost of sales | 1,416,999 | 1,354,680 | 1,329,425 | |||||||||
Gross profit | 457,363 | 453,349 | 443,573 | |||||||||
Selling and administrative expenses | 379,095 | 372,821 | 359,504 | |||||||||
Depreciation and amortization expense | 53,318 | 52,690 | 50,509 | |||||||||
Transaction costs | 9,605 | 2,398 | — | |||||||||
Restructuring costs | 1,790 | 8,830 | — | |||||||||
Impairment loss (non-cash) | — | 11,987 | — | |||||||||
Operating income | 13,555 | 4,623 | 33,560 | |||||||||
Interest expense, net | 3,464 | 1,872 | 210 | |||||||||
Income before income taxes | 10,091 | 2,751 | 33,350 | |||||||||
Income tax expense | 4,730 | 2,667 | 14,218 | |||||||||
Net income | $ | 5,361 | $ | 84 | $ | 19,132 | ||||||
Earnings per share of Common Stock: | ||||||||||||
Basic | $ | 0.12 | $ | — | $ | 0.33 | ||||||
Diluted | $ | 0.11 | $ | — | $ | 0.33 | ||||||
Weighted average shares of Common Stock outstanding: | ||||||||||||
Basic | 46,317 | 46,238 | 38,452 | |||||||||
Diluted | 46,763 | 46,479 | 38,493 | |||||||||
See accompanying notes to consolidated financial statements.
58
BARNES & NOBLE EDUCATION, INC. AND SUBSIDIARIES
Consolidated Balance Sheets
(In thousands, except per share data)
As of | ||||||||
April 29, 2017 | April 30, 2016 | |||||||
ASSETS | ||||||||
Current assets: | ||||||||
Cash and cash equivalents | $ | 19,003 | $ | 28,568 | ||||
Receivables, net | 86,040 | 50,924 | ||||||
Merchandise inventories, net | 434,064 | 312,747 | ||||||
Textbook rental inventories | 52,826 | 47,760 | ||||||
Prepaid expenses and other current assets | 10,698 | 6,453 | ||||||
Total current assets | 602,631 | 446,452 | ||||||
Property and equipment, net | 116,613 | 111,185 | ||||||
Intangible assets, net | 209,885 | 199,663 | ||||||
Goodwill | 329,467 | 280,911 | ||||||
Other noncurrent assets | 41,236 | 33,472 | ||||||
Total assets | $ | 1,299,832 | $ | 1,071,683 | ||||
LIABILITIES AND STOCKHOLDERS' EQUITY | ||||||||
Current liabilities: | ||||||||
Accounts payable | $ | 192,742 | $ | 152,175 | ||||
Accrued liabilities | 120,478 | 105,877 | ||||||
Short-term borrowings | 100,000 | — | ||||||
Total current liabilities | 413,220 | 258,052 | ||||||
Long-term deferred taxes, net | 16,871 | 29,865 | ||||||
Other long-term liabilities | 96,433 | 75,380 | ||||||
Long-term borrowings | 59,600 | — | ||||||
Total liabilities | 586,124 | 363,297 | ||||||
Commitments and contingencies | — | |||||||
Stockholders' equity: | ||||||||
Parent company investment | — | — | ||||||
Preferred stock, $0.01 par value; authorized, 5,000 shares; issued and outstanding, none | — | — | ||||||
Common stock, $0.01 par value; authorized, 200,000 shares; issued, 49,372 and 48,645 shares, respectively; outstanding, 46,517 and 46,755 shares, respectively | 494 | 486 | ||||||
Additional paid-in capital | 708,871 | 699,513 | ||||||
Retained earnings | 32,363 | 27,002 | ||||||
Treasury stock, at cost | (28,020 | ) | (18,615 | ) | ||||
Total stockholders' equity | 713,708 | 708,386 | ||||||
Total liabilities and stockholders' equity | $ | 1,299,832 | $ | 1,071,683 | ||||
See accompanying notes to consolidated financial statements.
59
BARNES & NOBLE EDUCATION, INC. AND SUBSIDIARIES
Consolidated Statements of Cash Flows
(In thousands)
52 weeks ended | 52 weeks ended | 52 weeks ended | ||||||||||
April 29, 2017 | April 30, 2016 | May 2, 2015 | ||||||||||
Cash flows from operating activities: | ||||||||||||
Net income | $ | 5,361 | $ | 84 | $ | 19,132 | ||||||
Adjustments to reconcile net income to net cash flows from operating activities: | ||||||||||||
Depreciation and amortization expense | 53,318 | 52,690 | 50,509 | |||||||||
Amortization of deferred financing costs | 792 | 488 | — | |||||||||
Impairment loss (non-cash) | — | 11,987 | — | |||||||||
Deferred taxes | (11,961 | ) | (11,868 | ) | (11,332 | ) | ||||||
Stock-based compensation expense | 9,366 | 6,670 | 4,741 | |||||||||
Increase in other long-term liabilities and other | 14,235 | 5,892 | 8,335 | |||||||||
Changes in other operating assets and liabilities, net | (3,125 | ) | 17,140 | (53,660 | ) | |||||||
Net cash flows provided by operating activities | 67,986 | 83,083 | 17,725 | |||||||||
Cash flows from investing activities: | ||||||||||||
Purchases of property and equipment | (34,670 | ) | (50,790 | ) | (48,452 | ) | ||||||
Acquisition of business, net of cash and restricted cash acquired | (186,720 | ) | (17,843 | ) | — | |||||||
Net increase in other noncurrent assets and other | (3,048 | ) | (111 | ) | (9,733 | ) | ||||||
Net cash flows used in investing activities | (224,438 | ) | (68,744 | ) | (58,185 | ) | ||||||
Cash flows from financing activities: | ||||||||||||
Net changes in Barnes & Noble, Inc. Investment | — | (6,423 | ) | 29,334 | ||||||||
Acquisition of Preferred Membership Interests | — | — | (76,175 | ) | ||||||||
Proceeds from borrowings under Credit Agreement | 312,700 | 60,600 | — | |||||||||
Repayments of borrowings under Credit Agreement | (153,100 | ) | (60,600 | ) | — | |||||||
Payment of deferred financing costs | (2,912 | ) | (3,251 | ) | — | |||||||
Purchase of treasury shares | (9,405 | ) | (18,615 | ) | — | |||||||
Net cash flows provided by (used in) financing activities | 147,283 | (28,289 | ) | (46,841 | ) | |||||||
Net decrease in cash, cash equivalents, and restricted cash | (9,169 | ) | (13,950 | ) | (87,301 | ) | ||||||
Cash, cash equivalents, and restricted cash at beginning of period | 30,866 | 44,816 | 132,117 | |||||||||
Cash, cash equivalents, and restricted cash at end of period | $ | 21,697 | $ | 30,866 | $ | 44,816 | ||||||
Changes in other operating assets and liabilities, net: | ||||||||||||
Receivables, net | $ | (6,407 | ) | $ | 25,732 | $ | (37,550 | ) | ||||
Merchandise inventories | 6,197 | (15,323 | ) | (22,078 | ) | |||||||
Textbook rental inventories | (4,150 | ) | (210 | ) | (487 | ) | ||||||
Prepaid expenses and other current assets | (2,093 | ) | (2,206 | ) | (504 | ) | ||||||
Accounts payable and accrued liabilities | 3,328 | 9,147 | 6,959 | |||||||||
Changes in other operating assets and liabilities, net | $ | (3,125 | ) | $ | 17,140 | $ | (53,660 | ) | ||||
Supplemental cash flow information: | ||||||||||||
Cash paid during the period for: | ||||||||||||
Interest paid | $ | 2,082 | $ | 1,145 | $ | 210 | ||||||
Income taxes paid (net of refunds) | $ | 1,473 | $ | 13,934 | $ | 25,171 | ||||||
Non-cash financing activities: | ||||||||||||
Acquisition of Preferred Membership Interests for 2,737,290 shares of common stock of Barnes & Noble, Inc. | $ | — | $ | — | $ | 76,175 | ||||||
See accompanying notes to consolidated financial statements.
60
BARNES & NOBLE EDUCATION, INC. AND SUBSIDIARIES
Consolidated Statements of Equity
(In thousands)
Additional | Parent | |||||||||||||||||||||||||||
Common Stock | Paid-In | Retained | Company | Treasury Stock | Total | |||||||||||||||||||||||
Shares | Amount | Capital | Earnings | Investment | Shares | Amount | Equity | |||||||||||||||||||||
Balance at May 2, 2015 | — | $ | — | $ | — | $ | — | $ | 726,669 | — | $ | — | $ | 726,669 | ||||||||||||||
Net loss | (26,918 | ) | (26,918 | ) | ||||||||||||||||||||||||
Stock-based compensation expense | 953 | 953 | ||||||||||||||||||||||||||
Net change in Barnes & Noble, Inc. Investment | (28,868 | ) | (28,868 | ) | ||||||||||||||||||||||||
Balance at August 2, 2015 (Spin-Off) | — | — | — | — | 671,836 | — | — | 671,836 | ||||||||||||||||||||
Net change in Barnes & Noble, Inc. Investment | 22,445 | 22,445 | ||||||||||||||||||||||||||
Capitalization at Spin-Off | 48,187 | 482 | 693,799 | (694,281 | ) | — | ||||||||||||||||||||||
Stock-based compensation expense | 5,718 | 5,718 | ||||||||||||||||||||||||||
Vested equity awards | 458 | 4 | (4 | ) | — | |||||||||||||||||||||||
Common stock repurchased | 1,715 | (16,612 | ) | (16,612 | ) | |||||||||||||||||||||||
Shares repurchased for tax withholdings for vested stock awards | 175 | (2,003 | ) | (2,003 | ) | |||||||||||||||||||||||
Net income | 27,002 | 27,002 | ||||||||||||||||||||||||||
Balance at April 30, 2016 | 48,645 | $ | 486 | $ | 699,513 | $ | 27,002 | $ | — | 1,890 | $ | (18,615 | ) | $ | 708,386 | |||||||||||||
Stock-based compensation expense | 9,366 | 9,366 | ||||||||||||||||||||||||||
Vested equity awards | 727 | 8 | (8 | ) | — | |||||||||||||||||||||||
Common stock repurchased | 689 | (6,718 | ) | (6,718 | ) | |||||||||||||||||||||||
Shares repurchased for tax withholdings for vested stock awards | 276 | (2,687 | ) | (2,687 | ) | |||||||||||||||||||||||
Net income | 5,361 | 5,361 | ||||||||||||||||||||||||||
Balance at April 29, 2017 | 49,372 | $ | 494 | $ | 708,871 | $ | 32,363 | $ | — | 2,855 | $ | (28,020 | ) | $ | 713,708 | |||||||||||||
See accompanying notes to consolidated financial statements.
61
BARNES & NOBLE EDUCATION, INC. AND SUBSIDIARIES
Notes to Consolidated Financial Statements
(Thousands of dollars, except share and per share data)
Unless the context otherwise indicates, references in these Notes to the accompanying consolidated financial statements to “we,” “us,” “our” and “the Company” refer to Barnes & Noble Education, Inc., a Delaware corporation. References to “Barnes & Noble College” refer to our college bookstore business operated through our subsidiary Barnes & Noble College Booksellers, LLC. References to “MBS” refer to our virtual bookstore and wholesale textbook distribution business operated through our subsidiary MBS Textbook Exchange, LLC, a Delaware corporation.
Note 1. Organization
Description of Business
Barnes & Noble Education, Inc. (“BNED”) is one of the largest contract operators of physical and virtual bookstores for college and university campuses, and private/parochial K-12 schools, across the United States, and a leading provider of digital education services. Through our Barnes & Noble College (“BNC”) and MBS Textbook Exchange (“MBS”) subsidiaries, we operate 1,481 physical and virtual bookstores and serve more than 6 million students enrolled in higher education institutions and K-12 schools.
BNC operates 769 physical campus bookstores, the majority of which also have school-branded e-commerce sites operated by BNC, and BNC also includes our digital operations. Our campus stores are a social and academic hub through which students can access affordable course materials and affinity products, including new and used print and digital textbooks, which are available for sale or rent; emblematic apparel and gifts; trade books; computer products; school and dorm supplies; café offerings; convenience food and beverages; and graduation products. BNC product offerings also include a suite of digital content, software, and services through our LoudCloud platform, such as predictive analytics, a variety of courseware built on a foundation of open educational resources ("OER"), and competency-based learning solutions.
Our MBS subsidiary operates two highly integrated businesses. The MBS Direct business is the largest contract operator of virtual bookstores for college and university campuses, and private/parochial K-12 schools. MBS Direct operates 712 virtual bookstores, offering new and used print and digital textbooks, which are available for sale or rent. Additionally, MBS Direct sells textbooks directly to students through textbooks.comSM, one of the largest e-commerce sites for new and used textbooks. MBS Wholesale is one of the largest textbook wholesalers in the country, providing a comprehensive selection of new and used textbooks at a low cost of supply to more than 3,700 physical bookstores, including BNC’s 769 campus bookstores.
Educational institutions increasingly are outsourcing bookstore operations, investing in data-driven analytical tools, and offering students more affordable options for textbooks and other learning tools. Given these continuing trends, we are well-positioned to capture new market share and partner with an increasing number of schools across the country. As demand for new, improved, and more affordable products and services increase in the rapidly changing education landscape, we are working to evolve our business model and enhance our solutions. We aim to be an even stronger partner for schools and meet customer needs by expanding our physical and virtual bookstore service capabilities, courseware offerings and digital platform services. We believe that our recent strategic actions, including the acquisition of LoudCloud, Promoversity and MBS, and development of courseware, have substantially enhanced our competitive position. We continue to aggressively innovate and collaborate with our partners to provide solutions that extend well beyond course materials sourcing and sales to include new digital services that support successful student outcomes.
For additional information related to our Strategies, see Part I - Item 1. Business - Overview - Growth Drivers.
Note 2. Summary of Significant Accounting Policies
Basis of Presentation
Our consolidated financial statements reflect our consolidated financial position, results of operations and cash flows in conformity with accounting principles generally accepted in the United States (“GAAP”). In the opinion of the Company’s management, the accompanying consolidated financial statements of the Company contain all adjustments (consisting of only normal recurring adjustments) necessary to present fairly its consolidated financial position and the results of its operations and cash flows for the periods reported.
Our fiscal year is comprised of 52 or 53 weeks, ending on the Saturday closest to the last day of April. The fiscal year periods for each of the last three fiscal years consisted of the 52 weeks ended April 29, 2017 (Fiscal 2017), 52 weeks ended April 30, 2016 (Fiscal 2016), and 52 weeks ended May 2, 2015 (Fiscal 2015).
Our retail business (BNC and MBS Direct) is seasonal, with sales generally highest in the second and third fiscal quarters, when college students generally purchase textbooks for the upcoming semesters, and lowest in the first and fourth fiscal quarters. Sales attributable to the MBS wholesale business are generally highest in our first, second and third quarter as it sells
62
BARNES & NOBLE EDUCATION, INC. AND SUBSIDIARIES
Notes to Consolidated Financial Statements - Continued
(Thousands of dollars, except share and per share data)
textbooks for retail distribution, which somewhat offsets the decreased first quarter sales attributable to our retail business. MBS has significantly lower operating profit or operating loss realized during the fourth quarter (generally February through April).
Stand-alone basis financial statements (Prior to the Spin-Off)
On August 2, 2015, we completed the legal separation ("Spin-Off") from Barnes & Noble, Inc., at which time we began to operate as an independent publicly-traded company.
For the first quarter of Fiscal 2016 and Fiscal 2015 (periods presented prior to the Spin-Off), (collectively referred to as the "stand-alone periods"), our consolidated financial statements are presented on a stand-alone basis since we were still part of Barnes & Noble, Inc. Our consolidated financial statements were derived from the consolidated financial statements and accounting records of Barnes & Noble, Inc.. Our consolidated financial statements include certain assets and liabilities that have historically been held at the Barnes & Noble, Inc. corporate level but are specifically identifiable or otherwise attributable to us. For additional information, see Note 10. Barnes & Noble, Inc. Transactions.
Consolidated basis financial statements (Subsequent to the Spin-Off)
The Spin-Off from Barnes & Noble, Inc. occurred on August 2, 2015 and therefore, the results of operations are presented on a consolidated basis for the 39 weeks ended April 30, 2016 (i.e. second, third and fourth quarter of Fiscal 2016) which includes direct costs incurred with Barnes & Noble, Inc. under various agreements. Certain corporate and shared service functions historically provided by Barnes & Noble, Inc. (as described above) will continue to be provided by Barnes & Noble, Inc. under the Transition Services Agreement. For additional information, see Note 10. Barnes & Noble, Inc. Transactions.
For our Fiscal 2017, the results of operations for the entire 52 weeks ended April 29, 2017, our consolidated financial statements are presented on a consolidated basis.
On February 27, 2017, we acquired MBS Textbook Exchange, LLC ("MBS"). The consolidated financial statements for the 52 weeks ended April 29, 2017 include the financial results of MBS from the acquisition date, February 27, 2017, to April 29, 2017. Subsequent to the acquisition, the consolidated financial statements include the accounts of MBS and all material intercompany accounts and transactions have been eliminated in consolidation. For additional information, see Note 4. Acquisitions and Strategic Agreements.
Use of Estimates
In preparing financial statements in conformity with GAAP, we are required to make estimates and assumptions that affect the reported amounts in the consolidated financial statements and accompanying notes. Actual results could differ from those estimates.
Cash and Cash Equivalents
We consider all short-term, highly liquid instruments purchased with an original maturity of three months or less to be cash equivalents.
Restricted Cash
Restricted cash of $1,996 and $698 is included in prepaid and other current assets and other noncurrent assets, respectively, in the consolidated balance sheet as of April 29, 2017. Restricted cash of $301 and$1,996 is included in prepaid and other current assets and other noncurrent assets, respectively, in the consolidated balance sheet as of April 30, 2016. We generally do not control these accounts and these funds are amounts held for future scheduled distributions related to acquisitions. Such funds are invested principally in money market funds.
Accounts Receivable
Receivables represent customer, private and public institutional and government billings (colleges, universities and other financial aid providers), credit/debit card receivables, advances for book buybacks, advertising and other receivables due within one year.
63
BARNES & NOBLE EDUCATION, INC. AND SUBSIDIARIES
Notes to Consolidated Financial Statements - Continued
(Thousands of dollars, except share and per share data)
Components of accounts receivables are as follows:
As of | ||||||||
April 29, 2017 | April 30, 2016 | |||||||
Trade accounts | $ | 58,460 | $ | 35,578 | ||||
Advances for book buybacks | 12,779 | — | ||||||
Credit/debit card receivables | 3,737 | 3,253 | ||||||
Other receivables | 11,064 | 12,093 | ||||||
Total receivables, net | $ | 86,040 | $ | 50,924 | ||||
Accounts receivable are presented on our consolidated balance sheets net of allowances. An allowance for doubtful accounts is determined through an analysis of the aging of accounts receivable and assessments of collectability based on historical trends, the financial condition of our customers and an evaluation of economic conditions. We write-off uncollectible trade receivables once collection efforts have been exhausted and record bad debt expenses related to textbook rentals that are not returned and we are unable to successfully charge the customer. Allowance for doubtful accounts were $2,259, and $2,320 for Fiscal 2017 and Fiscal 2016, respectively.
Merchandise Inventories
Merchandise inventories, which consist of finished goods, are stated at the lower of cost or market. Market value of our inventory, which is all purchased finished goods, is determined based on its estimated net realizable value, which is generally the selling price less normally predictable costs of disposal and transportation. Reserves for non-returnable inventory are based on our history of liquidating non-returnable inventory.
Cost is determined primarily by the retail inventory method for our BNC segment and last-in first out, or “LIFO”, method for our MBS segment. Our textbook inventories, for BNC and MBS, and trade book inventories are valued using the LIFO method and the related reserve was not material to the recorded amount of our inventories. There were no LIFO adjustments in Fiscal 2017, Fiscal 2016 and Fiscal 2015.
We also estimate and accrue shortage for the period between the last physical count of inventory and the balance sheet date. Shortage rates are estimated and accrued based on historical rates and can be affected by changes in merchandise mix and changes in actual shortage trends.
The products that we sell originate from a wide variety of domestic and international vendors. BNC's four largest suppliers, excluding MBS, accounted for approximately 40.4% of our merchandise purchased during the twelve month period ended April 29, 2017. For MBS, the four largest suppliers, excluding BNC, accounted for approximately 36.8% of merchandise purchases during the twelve month period ended April 29, 2017.
Textbook Rental Inventories
Physical textbooks out on rent are categorized as textbook rental inventories. At the time a rental transaction is consummated, the book is removed from merchandise inventories and moved to textbook rental inventories at cost. The cost of the book is amortized down to its estimated residual value over the rental period. The related amortization expense is included in cost of goods sold. At the end of the rental period, upon return, the book is removed from textbook rental inventories and recorded in merchandise inventories at its amortized cost.
Property and Equipment
Property and equipment are carried at cost, less accumulated depreciation. Depreciation is computed using the straight-line method over estimated useful lives. Maintenance and repairs are expensed as incurred, however major maintenance and remodeling costs are capitalized if they extend the useful life of the asset. We had $41,224, $42,213, and$40,257 of depreciation expense for Fiscal 2017 and Fiscal 2016 and Fiscal 2015, respectively.
64
BARNES & NOBLE EDUCATION, INC. AND SUBSIDIARIES
Notes to Consolidated Financial Statements - Continued
(Thousands of dollars, except share and per share data)
Components of property and equipment are as follows:
As of | ||||||||||
Useful Life | April 29, 2017 | April 30, 2016 | ||||||||
Property and equipment: | ||||||||||
Leasehold improvements | (a) | $ | 144,260 | $ | 142,595 | |||||
Machinery, equipment and display fixtures | 3 - 5 | 235,153 | 219,289 | |||||||
Computer hardware and capitalized software costs | (b) | 100,749 | 88,937 | |||||||
Office furniture and other | 2 - 7 | 52,339 | 46,856 | |||||||
Construction in progress | 18,551 | 17,302 | ||||||||
Total property and equipment | 551,052 | 514,979 | ||||||||
Less accumulated depreciation and amortization | 434,439 | 403,794 | ||||||||
Total property and equipment, net | $ | 116,613 | $ | 111,185 | ||||||
(a) | Leasehold improvements are capitalized and depreciated over the shorter of lease term or the useful life of the improvements, ranging from one to 15 years. |
(b) | System costs are capitalized and amortized over their estimated useful lives, from the date the systems become operational. Purchased software is generally amortized over a period of between 2-5 years. |
Other Long-Lived Assets
Our other long-lived assets include property and equipment and amortizable intangibles. We had $209,885 and $199,663 of amortizable intangible assets, net of amortization, as of April 29, 2017 and April 30, 2016, respectively. These amortizable intangible assets relate primarily to our customer and bookstore relationships with our colleges and university clients, and technology acquired. For additional information related to amortizable intangibles, see Note 9. Supplementary Information - Intangible Assets.
We review our long-lived assets for impairment whenever events or changes in circumstances indicate that the carrying amount of an asset may not be recoverable and consider market participants in accordance with Accounting Standards Codification ("ASC") 360-10, Accounting for the Impairment or Disposal of Long-Lived Assets. We evaluate long-lived assets for impairment at the school contract combined store level, which is the lowest level at which individual cash flows can be identified. When evaluating long-lived assets for potential impairment, we first compare the carrying amount of the assets to the school contract combined store level’s estimated future undiscounted cash flows. If the estimated future cash flows are less than the carrying amount of the assets, an impairment loss calculation is prepared. The impairment loss calculation compares the carrying amount of the assets to the school contract combined store level’s fair value based on its estimated discounted future cash flows. If required, an impairment loss is recorded for that portion of the asset’s carrying value in excess of fair value. Impairment losses related to school contracts included in selling and administrative expenses totaled $23, $59, and $7 during Fiscal 2017, Fiscal 2016 and Fiscal 2015, respectively.
In Fiscal 2016, we implemented a plan to restructure our digital operations. As a result of this restructuring, we recorded a non-cash impairment loss of $11,987. For additional information, see Note 9. Supplementary Information - Impairment Loss (non-cash) and Restructuring Costs.
Goodwill
The costs in excess of net assets of businesses acquired are carried as goodwill in the accompanying consolidated balance sheets. As of April 29, 2017 and April 30, 2016, we had $329,467 and $280,911 of goodwill, respectively. For additional information, see Note 9. Supplementary Information - Goodwill.
ASC No. 350-30, Goodwill and Other Intangible Assets ("ASC 350-30"), requires that goodwill be tested for impairment at least annually or earlier if there are impairment indicators. We perform a two-step process for impairment testing of goodwill as required by ASC 350-30. The first step of this test, used to identify potential impairment, compares the fair value of a reporting unit with its carrying amount. The second step (if necessary) measures the amount of the impairment.
We completed our annual goodwill impairment test as of the first day of the third quarter of Fiscal 2017. In performing the valuation, we used cash flows that reflected management’s forecasts and discount rates that included risk adjustments consistent with the current market conditions. Based on the results of the step one testing, fair value of the one reporting unit exceeded its carrying value; therefore, the second step of the impairment test was not required to be performed and no goodwill impairment was recognized.
65
BARNES & NOBLE EDUCATION, INC. AND SUBSIDIARIES
Notes to Consolidated Financial Statements - Continued
(Thousands of dollars, except share and per share data)
As of the date of our annual goodwill impairment test, the excess fair value over carrying value was approximately 5%. Goodwill is subject to further risk of impairment if comparable store sales decline, store closings accelerate or digital projections fall short of expectations. Additionally, changes in the structure of our business as a result of future reorganizations, acquisitions or divestitures of assets or businesses could result in future impairments of goodwill. Refer to Item 7. Management's Discussion and Analysis of Financial Condition and Results of Operations - Critical Accounting Policies and Estimates for a discussion of key assumptions used in our testing.
Revenue Recognition and Deferred Revenue
Revenue from sales of our products at physical locations is recognized at the time of sale. Revenue from sales of products ordered through our websites is recognized upon receipt of our products by our customers. Revenue from the sale of traditional textbooks from our wholesale and virtual bookstores is recognized at the time of shipment. Additional revenue is recognized for shipping charges billed to customers.
We rent both physical and digital textbooks. Revenue from the rental of physical textbooks is deferred and recognized over the rental period commencing at point of sale. We offer a buyout option to allow the purchase of a rented physical textbook at the end of the rental period. We record the buyout purchase when the customer exercises and pays the buyout option price. In these instances, we would accelerate any remaining deferred rental revenue at the point of sale.
Revenue from the rental of digital textbooks is recognized at time of sale. A software feature is embedded within the content of our digital textbooks, such that upon expiration of the rental term the customer is no longer able to access the content. While the digital rental allows the customer to access digital content for a fixed period of time, once the digital content is delivered to the customer our performance obligation is complete. We primarily record digital textbook rental sales on a net basis in accordance with ASC 605-45-45, Reporting Revenue Gross as a Principal versus Net as an Agent.
Sales taxes collected from our customers are excluded from reported revenues. All of our sales are recognized as revenue on a “net” basis, including sales in connection with any periodic promotions offered to customers. We do not treat any promotional offers as expenses.
Cost of Sales
Our cost of sales primarily include costs such as merchandise costs, textbook rental amortization, warehouse costs related to inventory management and order fulfillment, certain payroll costs, and management service agreement costs, including rent expense, related to our college and university contracts and other facility related expenses.
Selling and Administrative Expenses
Our selling and administrative expenses consist primarily of store payroll and store operating expenses. Selling and administrative expenses also include stock-based compensation and general office expenses, such as executive oversight, merchandising, field support, finance, human resources, benefits, training, legal, and information technology, as well as our investments in our digital platform.
Stock-Based Compensation
During the second quarter of Fiscal 2016 and Fiscal 2017, we granted awards in accordance with the Barnes & Noble Education Inc. Equity Incentive Plan (the "Equity Incentive Plan"). Types of equity awards that can be granted under the Equity Incentive Plan include options, restricted stock ("RS"), restricted stock units ("RSU") and performance-based awards. We have not granted options under the Equity Incentive Plan. See Note 13. Stock-Based Compensation for a further discussion of our stock-based incentive plan.
We recognize compensation expense for awards ratably over the requisite service period of the award, which is generally three years. We recognize compensation expense based on the number of awards expected to vest using an estimated average forfeiture rate. We calculate the fair value of stock-based awards based on the closing price on the date the award was granted.
Advertising Costs
The costs of advertising are expensed as incurred during the year pursuant to ASC No. 720-35, Advertising Costs. Advertising costs charged to selling and administrative expenses were $7,437, $8,193, and $8,614 during Fiscal 2017, Fiscal 2016 and Fiscal 2015, respectively.
66
BARNES & NOBLE EDUCATION, INC. AND SUBSIDIARIES
Notes to Consolidated Financial Statements - Continued
(Thousands of dollars, except share and per share data)
Income Taxes
The provision for income taxes includes federal, state and local income taxes currently payable and those deferred because of temporary differences between the financial statement and tax basis of assets and liabilities. The deferred tax assets and liabilities are measured using the enacted tax rates and laws that are expected to be in effect when the differences reverse. We regularly review deferred tax assets for recoverability and establish a valuation allowance, if determined to be necessary. For additional information, see Note 14. Income Taxes.
As of April 29, 2017, other long-term liabilities includes $77,141 related to the long-term tax payable associated with the LIFO reserve. The LIFO reserve is impacted by changes in the CPI and inventory levels. Management believes it is remote that the long-term tax payable associated with the LIFO reserve will be payable or will result in a cash tax payment in the foreseeable future, assuming that the historical CPI and inventory trends continue and LIFO will continue to be an acceptable inventory method for tax purposes.
Earnings Per Common Share
Basic earnings per share represent net earnings to common stockholders divided by the weighted-average number of common shares outstanding for the period. Diluted earnings per share reflect, in periods in which they have a dilutive effect, the impact of our stock based compensation. See Note 6. Equity and Earnings Per Share for further information regarding the calculation of basic and diluted earnings per common share.
Note 3. Recent Accounting Pronouncements
Pronouncements Adopted in Fiscal 2017
In January 2017, the Financial Accounting Standards Board (“FASB”) issued Accounting Standard Update (“ASU”) No. 2017-04, Intangibles - Goodwill and Other (Topic 350) to simplify the test for Goodwill Impairment. The revised guidance eliminates the existing Step 2 of the goodwill impairment test which required an entity to compute the implied fair value of its goodwill at the testing date in order to measure the amount of the impairment charge when the fair value of the reporting unit failed Step 1 of the goodwill impairment test. Under the revised guidance, an entity would recognize an impairment charge for the amount by which the carrying amount of the reporting unit exceeds its fair value; however, the loss recognized would not exceed the total amount of goodwill allocated to the reporting unit. The guidance will be applied on a prospective basis. We are required to adopt this standard in the first quarter of Fiscal 2021 and early adoption is permitted for interim or annual goodwill impairment tests performed on testing dates after January 1, 2017. We plan to early adopt this standard for our next goodwill testing date.
In January 2017, the FASB issued ASU No. 2017-01, Business Combinations (Topic 805) to clarify the definition of a business. The revised guidance creates a more robust framework to use in determining whether a set of assets and activities is a business. The guidance will be applied on a prospective basis on or after the effective date. We are required to adopt this standard in the first quarter of Fiscal 2019 and early adoption is permitted. We have elected to early adopt this new guidance as of the third quarter of Fiscal 2017. There has been no impact on our consolidated financial statements from adoption of this new guidance.
In November 2016, the FASB issued ASU No. 2016-18, Statement of Cash Flows (Topic 230) to reduce diversity in practice related to the classification and presentation of changes in restricted cash on the statement of cash flows under Topic 230, Statement of Cash Flows. The revised guidance is to be applied on a retrospective basis and requires that amounts generally described as restricted cash and restricted cash equivalents be included with cash and cash equivalents when reconciling the beginning-of-period and end-of-period total amounts shown on the statement of cash flows. We are required to adopt this standard in the first quarter of Fiscal 2019, however, we have elected to early adopt this new guidance, as permitted, as of the fourth quarter of Fiscal 2017. We have included restricted cash of $2,297 and $0 in the end-of-period cash balances for Fiscal 2016 and Fiscal 2015, respectively. The offset to the $2,297 restricted cash reclassification is reflected as an increase to changes in other operating assets and liabilities of $301 and an increase in other noncurrent assets of $1,996 in our consolidated statement of cash flows for Fiscal 2016.
In August 2016, the FASB issued ASU No. 2016-15, Statement of Cash Flow (Topic 230) ("ASU 2016-15") to reduce diversity in practice over the presentation and classification of certain types of cash receipts and cash payments. The revised guidance seeks to achieve this objective by providing specific guidance over eight identified cash flow issues. We are required to adopt this standard in the first quarter of Fiscal 2019 and early adoption is permitted. The guidance will be applied on a retrospective basis beginning with the earliest period presented. We have evaluated the guidance of this new standard to determine the impact of adoption on our consolidated financial statements and concluded that there is no impact. We elected to early adopt this guidance in the first quarter of Fiscal 2017.
67
BARNES & NOBLE EDUCATION, INC. AND SUBSIDIARIES
Notes to Consolidated Financial Statements - Continued
(Thousands of dollars, except share and per share data)
Pronouncements Pending Adoption
In February 2016, the FASB issued ASU No. 2016-02, Leases (Topic 842) ("ASU 2016-01") to increase transparency and comparability by providing additional information to users of financial statements regarding an entity's leasing activities. The revised guidance seeks to achieve this objective by requiring reporting entities to recognize lease assets and lease liabilities on the balance sheet for substantially all lease arrangements. We are required to adopt this standard in the first quarter of Fiscal 2020 and early adoption is permitted. The guidance will be applied on a modified retrospective basis beginning with the earliest period presented. We are currently evaluating this standard to determine the impact of adoption on our consolidated financial statements.
In May 2014, the FASB issued ASU No. 2014-09, Revenue from Contracts with Customers (“ASU 2014-09”). The standard provides companies with a single model for use in accounting for revenue arising from contracts with customers and supersedes current revenue recognition guidance, including industry-specific revenue guidance. The core principle of the guidance is that an entity should recognize revenue to depict the transfer of promised goods or services to customers in an amount that reflects the consideration to which the entity expects to be entitled in exchange for those goods or services. New disclosures about the nature, amount, timing and uncertainty of revenue and cash flows arising from contracts with customers are also required. In 2016, the FASB issued final amendments to clarify the implementation guidance for principal versus agent considerations, identifying performance obligations and the accounting for licenses of intellectual property. In August 2015, FASB issued ASU No. 2015-14, Revenue from Contracts with Customers (Topic 606): Deferral of the Effective Date, which effectively delayed the adoption date by one year. We are required to adopt ASU 2014-09 in the first quarter of Fiscal 2019 and early adoption is permitted. The new standard is required to be applied retrospectively to each prior reporting period (full retrospective method) or retrospectively with the cumulative effect of initially applying the standard recognized as an adjustment to opening retained earnings at the date of initial adoption (modified retrospective method).
We are in the process of analyzing the impacts of the guidance across all of our revenue streams. This includes reviewing current accounting policies and practices to identify potential differences that would result from applying the guidance. The majority of our revenue is generated from sales of finished products, which will continue to be recognized when control is transferred to the customer. Our assessment includes an evaluation of the impact that the guidance will have on our accounting for marketing revenue and other income streams. We are evaluating the guidance for our software license revenue, which is currently not material and is recognized over time, but may be recognized at a point in time under the new guidance. We are continuing to evaluate our revenue streams related to our digital product offerings. We do not have loyalty programs or gift cards. While our assessment of the impacts of the guidance is still in process, we believe the adoption of the guidance is not expected to have a material impact on our consolidated financial statements, other than the additional disclosure requirements. We plan to adopt the standard in the first quarter of Fiscal 2019 using the modified retrospective method.
Note 4. Acquisitions and Strategic Agreements
Acquisitions
MBS
On February 27, 2017, we completed the purchase of all issued and outstanding units of MBS Textbook Exchange, LLC. MBS operates two highly integrated businesses. The MBS Direct business is the largest contract operator of virtual bookstores for college and university campuses, and private/parochial K-12 schools. MBS Direct operates 712 virtual bookstores, offering new and used print and digital textbooks, which are available for sale or rent. Additionally, MBS Direct sells textbooks directly to students through textbooks.comSM, one of the largest e-commerce sites for new and used textbooks. MBS Wholesale is one of the largest textbook wholesalers in the country, providing a comprehensive selection of new and used textbooks at a low cost of supply to more than 3,700 physical bookstores, including BNC’s 769 campus bookstores. Refer to Item 1. Business - Overview - MBS, Note 5. Segment Reporting and Note 11. Related Party Transactions for further discussion of the acquired business.
We acquired 100% of the equity interests of MBS for cash consideration of $186,974, including cash and restricted cash acquired of $1,171, and was financed with cash from operations as well as proceeds from our existing credit facility. The preliminary allocation of the purchase price was based upon a preliminary valuation and our estimates and assumptions are subject to change within the purchase price allocation period (generally one year from the acquisition date). We are still in the process of valuing the assets acquired and liabilities to be assumed; thus, allocation of the acquisition consideration is subject to change.
68
BARNES & NOBLE EDUCATION, INC. AND SUBSIDIARIES
Notes to Consolidated Financial Statements - Continued
(Thousands of dollars, except share and per share data)
The following is a summary of consideration paid for the acquisition:
Cash paid to Seller or escrow | $ | 165,499 | ||
Consideration to Seller for pre-closing costs | 4,657 | |||
Cash paid for Seller closing costs | 4,044 | |||
Contract purchase price | $ | 174,200 | ||
Consideration for payment to settle Seller's outstanding short-term borrowings | 24,437 | |||
Consideration for reimbursement of pre-acquisition tax liability to Seller | 14,668 | |||
Less: Consideration to Seller for pre-closing costs | (4,657 | ) | ||
Less: Consideration for settlement of pre-existing payable to Seller | (21,674 | ) | ||
Total value of consideration transferred | $ | 186,974 | ||
The following is a summary of the preliminary estimated fair values of the net assets acquired:
Total estimated consideration transferred | $ | 186,974 | ||
Cash and cash equivalents | $ | 472 | ||
Accounts receivable, net | 28,177 | |||
Merchandise inventory | 128,431 | |||
Property and equipment | 12,403 | |||
Intangible assets | 21,576 | |||
Prepaid and other assets | 4,748 | |||
Total assets | $ | 195,807 | ||
Accounts payable | $ | 35,383 | ||
Accrued expenses | 8,799 | |||
Other long-term liabilities | 12,769 | |||
Total liabilities | $ | 56,951 | ||
Net assets to be acquired | $ | 138,856 | ||
Goodwill | $ | 48,118 | ||
Identified intangible assets include the following:
Type of Intangible | Amount | Estimated Useful Life | ||||
Favorable Lease | $ | 1,076 | 6.5 | |||
Trade Name | 3,500 | 10 | ||||
Technology | 1,500 | 3 | ||||
Book Store Relationship | 13,000 | 13 | ||||
Direct Customer Relationship | 2,000 | 15 | ||||
Non-Compete Agreements | 500 | 3 | ||||
Total Intangibles: | $ | 21,576 | ||||
69
BARNES & NOBLE EDUCATION, INC. AND SUBSIDIARIES
Notes to Consolidated Financial Statements - Continued
(Thousands of dollars, except share and per share data)
The consolidated financial statements for the 52 weeks ended April 29, 2017 include the financial results of MBS from the acquisition date, February 27, 2017, to April 29, 2017, including sales of $34,091 and net loss of $(2,630). As the acquisition was material to our consolidated financial statements, the following represents the pro forma consolidated income statement as if MBS had been included in the consolidated results for the entire fiscal year for Fiscal 2017 and Fiscal 2016:
Pro forma consolidated income statement | |||||||
52 weeks ended | |||||||
April 29, 2017 | April 30, 2016 | ||||||
Sales | $ | 2,247,825 | $ | 2,216,628 | |||
Net income | $ | 32,055 | $ | 25,022 | |||
These amounts have been calculated after applying our accounting policies and adjusting the results of MBS to reflect the additional depreciation and amortization that would have been charged assuming the fair value adjustments to property, plant and equipment and intangible assets had been applied on May 3, 2015, and includes the elimination of all significant intercompany accounts and transactions, together with the consequential tax effects.
Promoversity
In June 2016, we completed the purchase of substantially all of the assets of Promoversity, a custom merchandise supplier and e-commerce storefront solution serving the collegiate bookstore business and its customers. The acquisition enables us to customize our e-commerce offerings and drive on-campus apparel sales. The acquisition purchase price was $1,417, including working capital, and was financed with cash from operations. The purchase price was allocated primarily as follows: $741 intangible assets (with a 5 year amortization period), $441 goodwill, $221 net current assets, and $500 future performance-based obligations. This acquisition is not material to our consolidated financial statements and therefore, disclosure of pro forma financial information has not been presented. The results of operations reflect the period of ownership of the acquired business.
LoudCloud Systems, Inc.
In March 2016, we completed the purchase of substantially all of the assets of LoudCloud Systems, Inc. (“LoudCloud”). LoudCloud will be a foundational asset for our digital and learning services. LoudCloud is a sophisticated digital platform and analytics provider with a proven product and existing clients in higher education, the for-profit sector and K-12 markets. LoudCloud currently has product capabilities that include a competency based courseware platform, a learning analytics platform and services, an eReading product, and a learning management system ("LMS"). Its software captures and analyzes key behavioral and performance metrics from students, allowing educators to monitor and improve student success.
The acquisition of LoudCloud closed on March 4, 2016 for a purchase price of $17,843, including working capital, and was financed completely with cash from operations. The purchase price was allocated primarily as follows: $10,600 intellectual property, $1,300 other intangible assets, $1,003 deferred revenue and $6,838 goodwill. This acquisition is not material to our consolidated financial statements and therefore, disclosure of pro forma financial information has not been presented. The results of operations reflect the period of ownership of the acquired business.
Strategic Agreements
Unizin
In May 2017, we entered into an agreement with Unizin, Ltd. ("Unizin"). See Note 18. Subsequent Events.
OpenStax
In August 2016, we extended our current relationship with OpenStax, a Rice University-based nonprofit that makes college more accessible for students, to provide greater access to quality, cost-effective course materials and advanced digital solutions. OpenStax is a leader in the Open Educational Resources ("OER") movement and our relationship with OpenStax allows us to facilitate greater access to high-quality, proven OER content that complements our integrated offering of printed textbooks and digital solutions. OpenStax content is made available through our learning analytics platform, LoudCloud, making the content not only cost-efficient, but also measurable. By tracking the effectiveness and use of OpenStax materials via the LoudCloud platform to measure learning outcomes, colleges and universities will gain affordable day-one solutions and analytical insights that help to increase student success.
70
BARNES & NOBLE EDUCATION, INC. AND SUBSIDIARIES
Notes to Consolidated Financial Statements - Continued
(Thousands of dollars, except share and per share data)
Vital Source Technologies, Inc.
In March 2016, we entered into a strategic commercial agreement with Vital Source Technologies, Inc. ("VitalSource"), a part of the Ingram Content Group, and effectively outsourced the Yuzu® eTextbook reading platform. VitalSource has existing relationships with publishers and a very competitive product from a feature and technology perspective. VitalSource will continue to provide an eTextbook experience for Yuzu® users leveraging and utilizing a broad digital library and the product is branded and marketed to the students and universities as Yuzu®. The transition from Yuzu® to the VitalSource platform was seamless for students and faculty.
Note 5. Segment Reporting
Effective with the acquisition of MBS on February 27, 2017, we have determined that we operate two reportable segments: BNC and MBS. The consolidated financial statements for the 52 weeks ended April 29, 2017 include the financial results of MBS from the acquisition date, February 27, 2017, to April 29, 2017.
We identified our segments based on the way our business is managed (focusing on the financial information distributed) and the manner in which our chief operating decision maker allocates resources and assesses financial performance. Prior to the acquisition of MBS, BNC was previously our only reportable segment. Our international operations are not material and the majority of the revenue and total assets are within the United States.
Subsequent to the acquisition, the consolidated financial statements include the accounts of MBS and all material intercompany accounts and transactions have been eliminated in consolidation. The eliminations are primarily related to the the following intercompany activities:
• | BNC purchases new and used textbooks from MBS for distribution at BNC's physical college bookstores. We eliminate intercompany profit in ending inventory, and |
• | BNC sells certain textbooks to MBS that they cannot return to suppliers or use in their stores. MBS pays BNC commissions based on the volume of these textbooks sold to MBS and with respect to the textbook requirements of certain distance learning programs that MBS fulfills on BNC's behalf. |
BNC
BNC operates 769 physical campus bookstores, the majority of which also have school-branded e-commerce sites operated by BNC, and BNC also includes our digital operations. Our campus stores are a social and academic hub through which students can access affordable course materials and affinity products, including new and used print and digital textbooks, which are available for sale or rent; emblematic apparel and gifts; trade books; computer products; school and dorm supplies; café offerings; convenience food and beverages; and graduation products. BNC product offerings also include a suite of digital content, software, and services through our LoudCloud platform, such as predictive analytics, a variety of courseware built on a foundation of open educational resources ("OER"), and competency-based learning solutions. For additional information about this segments operations, see Part I - Item 1. Business - Barnes & Nobe College.
MBS
Our MBS subsidiary operates two highly integrated businesses. The MBS Direct business is the largest contract operator of virtual bookstores for college and university campuses, and private/parochial K-12 schools. MBS Direct operates 712 virtual bookstores, offering new and used print and digital textbooks, which are available for sale or rent. Additionally, MBS Direct sells textbooks directly to students through textbooks.comSM, one of the largest e-commerce sites for new and used textbooks. MBS Wholesale is one of the largest textbook wholesalers in the country, providing a comprehensive selection of new and used textbooks at a low cost of supply to more than 3,700 physical bookstores, including BNC’s 769 campus bookstores. For additional information about this segments operations, see Part I - Item 1. Business - MBS Textbook Exchange.
The consolidated financial statements for the 52 weeks ended April 29, 2017 include the financial results of MBS from the acquisition date, February 27, 2017, to April 29, 2017.
71
BARNES & NOBLE EDUCATION, INC. AND SUBSIDIARIES
Notes to Consolidated Financial Statements - Continued
(Thousands of dollars, except share and per share data)
Summarized financial information for our reportable segments is reported below:
52 weeks ended | 52 weeks ended | 52 weeks ended | ||||||||||
April 29, 2017 | April 30, 2016 | May 2, 2015 | ||||||||||
Sales: | ||||||||||||
BNC | $ | 1,845,561 | $ | 1,808,029 | $ | 1,772,998 | ||||||
MBS (February 27, 2017, to April 29, 2017) | 34,091 | — | — | |||||||||
Elimination (February 27, 2017, to April 29, 2017) | (5,290 | ) | — | — | ||||||||
Total Sales | $ | 1,874,362 | $ | 1,808,029 | $ | 1,772,998 | ||||||
Gross Profit | ||||||||||||
BNC | $ | 453,252 | $ | 453,349 | $ | 443,573 | ||||||
MBS (February 27, 2017, to April 29, 2017) | 4,748 | — | — | |||||||||
Elimination (February 27, 2017, to April 29, 2017) | (637 | ) | — | — | ||||||||
Total Gross Profit | $ | 457,363 | $ | 453,349 | $ | 443,573 | ||||||
Depreciation and Amortization | ||||||||||||
BNC | $ | 52,259 | $ | 52,690 | $ | 50,509 | ||||||
MBS (February 27, 2017, to April 29, 2017) | 1,059 | — | — | |||||||||
Total Depreciation and Amortization | $ | 53,318 | $ | 52,690 | $ | 50,509 | ||||||
Operating Income | ||||||||||||
BNC | $ | 18,820 | $ | 4,623 | $ | 33,560 | ||||||
MBS (February 27, 2017, to April 29, 2017) | (4,628 | ) | — | — | ||||||||
Elimination (February 27, 2017, to April 29, 2017) | (637 | ) | — | — | ||||||||
Total Operating Income | $ | 13,555 | $ | 4,623 | $ | 33,560 | ||||||
The following is a reconciliation of segment Operating Income to consolidated Income Before Income Taxes | ||||||||||||
Total Operating Profit | $ | 13,555 | $ | 4,623 | $ | 33,560 | ||||||
Interest Expense, net | (3,464 | ) | (1,872 | ) | (210 | ) | ||||||
Total Income Before Income Taxes | $ | 10,091 | $ | 2,751 | $ | 33,350 | ||||||
As of | ||||||||
April 29, 2017 | April 30, 2016 | |||||||
Total Assets | ||||||||
BNC (includes goodwill of $281,349 and $280,911, respectively) | $ | 1,049,441 | $ | 1,071,683 | ||||
MBS (includes goodwill of $48,118 and $0, respectively) | 250,391 | — | ||||||
Total Assets | $ | 1,299,832 | $ | 1,071,683 | ||||
52 weeks ended | 52 weeks ended | 52 weeks ended | ||||||||||
April 29, 2017 | April 30, 2016 | May 2, 2015 | ||||||||||
Capital Expenditures | ||||||||||||
BNC | $ | 34,452 | $ | 50,790 | $ | 48,452 | ||||||
MBS (February 27, 2017, to April 29, 2017) | 218 | — | — | |||||||||
Total Capital Expenditures | $ | 34,670 | $ | 50,790 | $ | 48,452 | ||||||
72
BARNES & NOBLE EDUCATION, INC. AND SUBSIDIARIES
Notes to Consolidated Financial Statements - Continued
(Thousands of dollars, except share and per share data)
Note 6. Equity and Earnings Per Share
Equity
On February 26, 2015, Barnes & Noble, Inc. announced plans to Spin-Off its 100% equity interest in our Company by distributing all of its equity interest in us, consisting of all of the outstanding shares of our Common Stock, to Barnes & Noble, Inc.’s stockholders on a pro rata basis (the “Distribution”).
On July 14, 2015, Barnes & Noble, Inc. approved the final distribution ratio and declared a pro rata dividend of the outstanding shares of our common stock to Barnes & Noble, Inc.’s existing stockholders. The pro-rata dividend was made on August 2, 2015 to the Barnes & Noble, Inc. stockholders of record (as of July 27, 2015). Each Barnes & Noble, Inc. stockholder of record received a distribution of 0.632 shares of our common stock for each share of Barnes & Noble, Inc. common stock held on the record date. On August 2, 2015, we completed the legal separation from Barnes & Noble, Inc. at which time we began to operate as an independent publicly-traded company. Following the Spin-Off, Barnes & Noble, Inc. does not own any equity interest in us.
Following the Spin-Off on August 2, 2015, our authorized capital stock consisted of 200,000,000 shares of common stock, par value $0.01 per share, and 5,000,000 shares of preferred stock, par value $0.01 per share. As of August 3, 2015, 48,186,900 shares of our Common Stock and 0 shares of our preferred stock were issued and outstanding. Our Common Stock began to trade on a “when-issued” basis on the NYSE under the symbol “BNED WI” beginning on July 23, 2015. On August 3, 2015, when-issued trading of our Common Stock ended, and our Common Stock began “regular-way” trading under the symbol “BNED.”
The holders of our Common Stock are entitled to one vote for each share held of record on all matters submitted to a vote of the stockholders. Holders of shares of our Common Stock do not have cumulative voting rights in the election of directors. The holders of our Common Stock will be entitled to share ratably in our assets legally available for distribution to our stockholders, subject to the prior distribution rights of preferred stock, if any, then outstanding. The holders of our Common Stock do not have preemptive rights or preferential rights to subscribe for shares of our capital stock.
When initially adopted in Fiscal 2016, 2,409,345 shares of Common Stock were reserved for future grants, in accordance with the Barnes & Noble Education Inc. Equity Incentive Plan (the "Equity Incentive Plan"). During the second quarter of Fiscal 2017, shareholders approved an amendment to the Equity Incentive Plan to increase the number of shares available for issuance by an additional 4,000,000 shares of our Common Stock, for an aggregate total of 6,409,345 shares. See Note 13. Stock-Based Compensation.
Share Repurchases
On December 14, 2015, our Board of Directors authorized a stock repurchase program of up to $50,000, in the aggregate, of our outstanding Common Stock. The stock repurchase program is carried out at the direction of management (which includes a plan under Rule 10b5-1 of the Securities Exchange Act of 1934). The stock repurchase program may be suspended, terminated, or modified at any time. Any repurchased shares will be held as treasury stock and will be available for general corporate purposes. During the 52 weeks ended April 29, 2017, we repurchased 688,948 shares for approximately $6,718 at a weighted average cost per share of $10.10. During the 52 weeks ended April 30, 2016, we repurchased 1,715,269 shares for approximately $16,612 at a weighted average cost per share of $9.95. As of April 29, 2017, approximately $26,669 remains available under the stock repurchase program.
During the 52 weeks ended April 29, 2017 and April 30, 2016, we also repurchased 276,292 shares and 174,511 shares of our Common Stock in connection with employee tax withholding obligations for vested stock awards, respectively.
Dividends
We paid no dividends to common stockholders during Fiscal 2017, Fiscal 2016 and Fiscal 2015. We do not intend to pay dividends on our Common Stock in the foreseeable future.
Earnings Per Share
For periods prior to the Spin-Off from Barnes & Noble, Inc. on August 2, 2015, basic earnings per share and weighted-average basic shares outstanding are based on the number of shares of Barnes & Noble, Inc. common stock outstanding as of the end of the period, adjusted for the distribution ratio of 0.632 shares of our Common Stock for every one share of Barnes & Noble, Inc. common stock held on the record date for the Spin-Off.
73
BARNES & NOBLE EDUCATION, INC. AND SUBSIDIARIES
Notes to Consolidated Financial Statements - Continued
(Thousands of dollars, except share and per share data)
For periods prior to the Spin-Off, diluted earnings per share and weighted-average diluted shares outstanding reflect potential common shares from Barnes & Noble, Inc. equity plans in which our employees participated. Certain of our employees held restricted stock units and stock options granted by Barnes & Noble, Inc. which were considered participating securities.
Basic EPS is computed based upon the weighted average number of common shares outstanding for the year. Diluted EPS is computed based upon the weighted average number of common shares outstanding for the year plus the dilutive effect of common stock equivalents using the treasury stock method and the average market price of our common stock for the year. We include participating securities (unvested share-based payment awards that contain non-forfeitable rights to dividends or dividend equivalents) in the computation of EPS pursuant to the two-class method. Our participating securities consist solely of unvested restricted stock awards, which have contractual participation rights equivalent to those of stockholders of unrestricted common stock. The two-class method of computing earnings per share is an allocation method that calculates earnings per share for common stock and participating securities. During periods of net loss, no effect is given to the participating securities because they do not share in the losses of the Company. During the Fiscal 2017, Fiscal 2016 and Fiscal 2015, no shares were excluded from the diluted earnings per share calculation using the two-class method as they were not antidilutive.
The following is a reconciliation of the basic and diluted earnings per share calculation:
Fiscal 2017 | Fiscal 2016 | Fiscal 2015 | |||||||||
Numerator for basic earnings per share: | |||||||||||
Net income | $ | 5,361 | $ | 84 | $ | 19,132 | |||||
Accretion of dividends on preferred stock | — | — | (6,076 | ) | |||||||
Less allocation of earnings to participating securities | (3 | ) | — | (313 | ) | ||||||
Net income available to common shareholders | $ | 5,358 | $ | 84 | $ | 12,743 | |||||
Numerator for diluted earnings per share: | |||||||||||
Net income available to common shareholders | $ | 5,358 | $ | 84 | $ | 12,743 | |||||
Accretion of dividends on preferred stock (a) | — | — | — | ||||||||
Allocation of earnings to participating securities | 3 | — | 313 | ||||||||
Less diluted allocation of earnings to participating securities | (3 | ) | — | (313 | ) | ||||||
Net income available to common shareholders | $ | 5,358 | $ | 84 | $ | 12,743 | |||||
Denominator for basic earnings per share: (b) | |||||||||||
Basic weighted average shares of Common Stock | 46,317 | 46,238 | 38,452 | ||||||||
Denominator for diluted earnings per share: (c) | |||||||||||
Basic weighted average shares of Common Stock | 46,317 | 46,238 | 38,452 | ||||||||
Average dilutive restricted stock units | 389 | 227 | — | ||||||||
Average dilutive performance shares | 40 | — | — | ||||||||
Average dilutive restricted shares | 17 | — | — | ||||||||
Average dilutive options | — | 14 | 41 | ||||||||
Diluted weighted average shares of Common Stock | 46,763 | 46,479 | 38,493 | ||||||||
Earnings per share of Common Stock: | |||||||||||
Basic | $ | 0.12 | $ | — | $ | 0.33 | |||||
Diluted | $ | 0.11 | $ | — | $ | 0.33 | |||||
(a) | Although the Company was in a net income position during Fiscal 2016 and Fiscal 2015, the dilutive effect of the accretion of preferred membership interests were excluded from the calculation of income per share using the two-class method because the effect would be antidilutive. |
(b) | For periods prior to the Spin-Off from Barnes & Noble, Inc. on August 2, 2015, basic earnings per share and weighted-average basic shares outstanding are based on the number of shares of Barnes & Noble, Inc. common stock outstanding as of the end |
74
BARNES & NOBLE EDUCATION, INC. AND SUBSIDIARIES
Notes to Consolidated Financial Statements - Continued
(Thousands of dollars, except share and per share data)
of the period, adjusted for the distribution ratio of 0.632 shares of our Common Stock for every one share of Barnes & Noble, Inc. common stock held on the record date for the Spin-Off.
(c) | For periods prior to the Spin-Off, diluted earnings per share and weighted-average diluted shares outstanding reflect potential common shares from Barnes & Noble, Inc. equity plans in which our employees participated. Certain of our employees held restricted stock units and stock options granted by Barnes & Noble, Inc. which were considered participating securities. |
Note 7. Fair Values of Financial Instruments
In accordance with ASC No. 820, Fair Value Measurements and Disclosures, the fair value of an asset is considered to be the price at which the asset could be sold in an orderly transaction between unrelated knowledgeable and willing parties. A liability’s fair value is defined as the amount that would be paid to transfer the liability to a new obligor, not the amount that would be paid to settle the liability with the creditor. Assets and liabilities recorded at fair value are measured using a three-tier fair value hierarchy, which prioritizes the inputs used in measuring fair value. These tiers include:
Level 1—Observable inputs that reflect quoted prices in active markets
Level 2—Inputs other than quoted prices in active markets that are either directly or indirectly observable
Level 3—Unobservable inputs in which little or no market data exists, therefore requiring us to develop our own assumptions
Our financial instruments include cash and cash equivalents, receivables, accrued liabilities and accounts payable. The fair values of cash and cash equivalents, receivables, accrued liabilities and accounts payable approximates their carrying values because of the short-term nature of these instruments, which are all considered Level 1. The fair value of short-term and long-term debt approximates its carrying value.
Note 8. Credit Facility
Until August 3, 2015, we were party to an amended and restated credit facility with Barnes & Noble, Inc., as the lead borrower, and Bank of America, N.A., as administrative agent, collateral agent and swing line lender, and other lenders, dated as of April 29, 2011 (as amended and modified to date, the “B&N Credit Facility”). All outstanding debt under the B&N Credit Facility was recorded on Barnes & Noble, Inc.'s balance sheet as of August 1, 2015.
On August 3, 2015, we and certain of our subsidiaries, from time to time party thereto, entered into a credit agreement (the “Credit Agreement”) with Bank of America, N.A., as administrative agent, collateral agent and swing line lender, and other lenders, from time to time party thereto, under which the lenders committed to provide us with a five-year asset-backed revolving credit facility in an aggregate committed principal amount of $400,000 (the “BNED Credit Facility”). Proceeds from the BNED Credit Facility are used for general corporate purposes, including seasonal working capital needs. Bank of America Merrill Lynch, J.P. Morgan Securities LLC, Wells Fargo Bank, N.A. and SunTrust Robinson Humphrey, Inc. are the joint lead arrangers for the BNED Credit Facility.
We and certain of our subsidiaries (collectively, the “Loan Parties”) will be permitted to borrow under the BNED Credit Facility. The BNED Credit Facility is secured by substantially all of the inventory, accounts receivable and related assets of the borrowers under the BNED Credit Facility, but excluding the equity interests in us and our subsidiaries, intellectual property, equipment and certain other property. We have the option to request an increase in commitments under the BNED Credit Facility of up to $100,000, subject to certain restrictions.
On February 27, 2017, in connection with the acquisition of MBS, we amended the Credit Agreement with our current lenders to add a new $100,000 incremental first in, last out seasonal loan facility (the “FILO Facility”) increasing the maximum availability under the Credit Agreement to $500,000.
As of April 29, 2017 we had outstanding borrowings of $59,600 and $100,000 under the BNED Credit Facility and FILO Facility, respectively. There were no outstanding borrowings under the BNED Credit Facility as of April 30, 2016.
During the 52 weeks ended April 29, 2017, we borrowed $312,700 and repaid $153,100 under the BNED Credit Facility and FILO Facility, for a net total of $159,600 of outstanding borrowings as of April 29, 2017. As of April 29, 2017 and April 30, 2016, we issued $4,298 and $3,567 in letters of credit under the BNED Credit Facility, respectively. During Fiscal 2016, we borrowed and repaid $60,600 under the BNED Credit Facility.
During Fiscal 2017 we incurred debt issuance costs totaling $2,912 related to the FILO Facility. During Fiscal 2016, we incurred debt issuance costs totaling $3,251 related to the BNED Credit Facility. The debt issuance costs have been deferred and are presented as an asset which is subsequently amortized ratably over the term of the credit agreement.
75
BARNES & NOBLE EDUCATION, INC. AND SUBSIDIARIES
Notes to Consolidated Financial Statements - Continued
(Thousands of dollars, except share and per share data)
Interest under the BNED Credit Facility accrues, at our election, at a LIBOR or alternate base rate, plus, in each case, an applicable interest rate margin, which is determined by reference to the level of excess availability under the BNED Credit Facility. Loans will initially bear interest at LIBOR plus 2.000% per annum, in the case of LIBOR borrowings, or at the alternate base rate plus 1.000% per annum, in the alternative, and thereafter the interest rate will fluctuate between LIBOR plus 2.000% per annum and LIBOR plus 1.750% per annum (or between the alternate base rate plus 1.000% per annum and the alternate base rate plus 0.750% per annum), based upon the excess availability under the BNED Credit Facility at such time.
Loans under the FILO Facility will bear interest at a rate equal to the LIBOR rate, plus 3.000%. The FILO Facility will be available solely during the draw period each year, from April 1 through July 31. We are required to borrow 100% of the aggregate commitments under the FILO Facility on April 1 of each year, and the loans must be repaid in full (including interest and fees) on July 31 of each year. The Commitments under the FILO Facility will decrease from $100,000 to $75,000 on August 1, 2018, from $75,000 to $50,000 on August 1, 2019 and from $50,000 to $25,000 on August 1, 2020. We will pay a commitment fee of 0.375% on the daily unused portion of the FILO Facility.
The Credit Agreement contains customary negative covenants, which limit our ability to incur additional indebtedness, create liens, make investments, make restricted payments or specified payments and merge or acquire assets, among other things. In addition, if excess availability under the BNED Credit Facility were to fall below certain specified levels, certain additional covenants (including fixed charge coverage ratio requirements) would be triggered, and the lenders would have the right to assume dominion and control over the Loan Parties’ cash.
The Credit Agreement contains customary events of default, including payment defaults, material breaches of representations and warranties, covenant defaults, default on other material indebtedness, customary ERISA events of default, bankruptcy and insolvency, material judgments, invalidity of liens on collateral, change of control or cessation of business. The Credit Agreement also contains customary affirmative covenants and representations and warranties. We are in compliance with all covenants, representations and warranties under the Credit Agreement as of April 29, 2017.
We believe that our future cash from operations, access to borrowings under the BNED Credit Facility, the FILO Facility and short-term vendor financing will provide adequate resources to fund our operating and financing needs for the foreseeable future. Our access to, and the availability of, financing in the future will be impacted by many factors, including our credit rating, the liquidity of the overall capital markets and the current state of the economy. There can be no assurances that we will have access to capital markets on acceptable terms.
Note 9. Supplementary Information
Impairment Loss (non-cash) and Restructuring Costs
In Fiscal 2016, we implemented a plan to restructure our digital operations. As a result of this restructuring, we recorded a non-cash impairment loss of $11,987 related to all of the capitalized content costs for the Yuzu® eTextbook platform ($8,987) based on the probability of recoverability of the capitalized content costs, and recorded a non-recurring other than temporary loss related to an investment held at cost ($3,000), whose fair value has been reduced to $0 based on the financial projections of the investment.
Additionally, we announced a reduction in staff and closure of the facilities in Mountain View, California, and Redmond, Washington that support the Yuzu® eTextbook platform. We recorded restructuring costs of $8,830 in Fiscal 2016 comprised of $3,216 in employee related costs (including severance and retention), facility exit costs of $5,046 and $568 related to specific contracts. We recorded restructuring costs of $1,790 in Fiscal 2017 primarily comprised of employee related costs (including severance and retention). We completed the restructuring in Fiscal 2017.
76
BARNES & NOBLE EDUCATION, INC. AND SUBSIDIARIES
Notes to Consolidated Financial Statements - Continued
(Thousands of dollars, except share and per share data)
Intangible Assets
For information about additions to the gross carrying amounts of intangible assets, see Note 4. Acquisitions and Strategic Relationships. Amortizable intangible assets as of April 29, 2017 and April 30, 2016 are as follows:
As of April 29, 2017 | ||||||||||||||
Amortizable intangible assets | Remaining Life | Gross Carrying Amount | Accumulated Amortization | Total | ||||||||||
Customer relationships | 4 - 17 | $ | 270,619 | $ | (77,640 | ) | $ | 192,979 | ||||||
Technology | 3 - 9 | 12,100 | (1,320 | ) | 10,780 | |||||||||
Other(a) | 1 - 10 | 6,853 | (727 | ) | 6,126 | |||||||||
$ | 289,572 | $ | (79,687 | ) | $ | 209,885 | ||||||||
a) | Other consists of recognized intangibles for non-compete agreements, trade names and favorable leasehold interests. |
As of April 30, 2016 | ||||||||||||||
Amortizable intangible assets | Remaining Life | Gross Carrying Amount | Accumulated Amortization | Total | ||||||||||
Customer relationships | 10 - 18 | $ | 255,050 | $ | (67,151 | ) | $ | 187,899 | ||||||
Technology | 10 | 10,600 | (177 | ) | 10,423 | |||||||||
Other(a) | 1 - 9 | 1,605 | (264 | ) | 1,341 | |||||||||
$ | 267,255 | $ | (67,592 | ) | $ | 199,663 | ||||||||
a) | Other consists of recognized intangibles for non-compete agreements and trade names. |
All amortizable intangible assets are being amortized over their useful life on a straight-line basis.
Aggregate Amortization Expense: | |||
For the 52 weeks ended April 29, 2017 | $ | 12,095 | |
For the 52 weeks ended April 30, 2016 | $ | 10,477 | |
For the 52 weeks ended May 2, 2015 | $ | 10,252 | |
Estimated Amortization Expense: (Fiscal Year) | |||
2018 | $ | 14,005 | |
2019 | $ | 13,998 | |
2020 | $ | 13,859 | |
2021 | $ | 13,265 | |
2022 | $ | 12,949 | |
After 2022 | $ | 141,809 | |
Goodwill
The following table details the changes in carrying value of goodwill (including foreign currency translation):
Balance at May 2, 2015 | $ | 274,070 | ||
Goodwill related to acquisitions | 6,841 | |||
Balance at April 30, 2016 | $ | 280,911 | ||
Goodwill related to acquisitions | 48,556 | |||
Balance at April 29, 2017 | $ | 329,467 | ||
For additional information of goodwill by acquisition, see Note 4. Acquisitions and Strategic Agreements. As of April 29, 2017, goodwill of approximately $54,063 was deductible for federal income tax purposes.
77
BARNES & NOBLE EDUCATION, INC. AND SUBSIDIARIES
Notes to Consolidated Financial Statements - Continued
(Thousands of dollars, except share and per share data)
Note 10. Barnes & Noble, Inc. Transactions
Our History with Barnes & Noble, Inc.
We completed the Spin-Off from Barnes & Noble, Inc. on August 2, 2015, at which time Barnes & Noble distributed all of its equity interest in us, consisting of all of the outstanding shares of our Common Stock, to Barnes & Noble’s stockholders on a pro rata basis (the “Distribution”). Following the Spin-Off, Barnes & Noble does not own any equity interest in us. On August 2, 2015, we completed the legal separation from Barnes & Noble, at which time we began to operate as an independent publicly-traded company.
Allocation of General Corporate Expenses from Barnes & Noble, Inc. (Prior to Spin-Off)
The results of operations for the 13 weeks ended August 1, 2015 and Fiscal 2015 (periods presented prior to the Spin-Off collectively referred to as the "stand-alone periods") reflected in our consolidated financial statements are presented on a stand-alone basis since we were still part of Barnes & Noble, Inc.
Our consolidated financial statements were derived from the consolidated financial statements and accounting records of Barnes & Noble. Our consolidated financial statements include certain assets and liabilities that have historically been held at the Barnes & Noble corporate level but are specifically identifiable or otherwise attributable to us.
All intercompany transactions between us and Barnes & Noble have been included in our consolidated financial statements and are considered to be effectively settled for cash in our consolidated financial statements at the time the Spin-Off became effective. The total net effect of the settlement of these intercompany transactions was reflected in our consolidated statements of cash flow as a financing activity and in our consolidated balance sheets as “Parent company investment.”
The consolidated financial statements for the stand-alone periods include an allocation for certain corporate and shared service functions historically provided by Barnes & Noble, including, but not limited to, executive oversight, accounting, treasury, tax, legal, human resources, procurement, information technology and other shared services. These expenses have been allocated to us on the basis of direct usage when identifiable, with the remainder allocated on a pro rata basis of consolidated sales, headcount, tangible assets or other measures considered to be a reasonable reflection of the historical utilization levels of these services. Following the Spin-Off on August 2, 2015, we began to perform these functions using our own resources or contracted services, certain of which may be provided by Barnes & Noble, Inc. during a transitional period pursuant to the Transition Services Agreement.
Direct Costs Incurred Related to On-going Agreements with Barnes & Noble (Subsequent to the Spin-Off)
The Spin-Off from Barnes & Noble, Inc. occurred on August 2, 2015 and therefore, the results of operations are presented on a consolidated basis for the 52 weeks ended April 29, 2017 and the 39 weeks ended April 30, 2016 (i.e. first, second, third and fourth quarter of Fiscal 2017 and the second, third and fourth quarter of Fiscal 2016, periods after the Spin-Off) which includes direct costs incurred with Barnes & Noble, Inc. under various agreements.
In connection with the separation from Barnes & Noble, we entered into a Separation and Distribution Agreement with Barnes & Noble on July 14, 2015 and several other ancillary agreements on August 2, 2015. These agreements govern the relationship between the parties after the separation and allocate between the parties various assets, liabilities, rights and obligations following the separation, including inventory purchases, employee benefits, intellectual property, information technology, insurance and tax-related assets and liabilities. The agreements also describe Barnes & Noble’s future commitments to provide us with certain transition services following the Spin-Off. These agreements include the following:
• | a Separation and Distribution Agreement that set forth Barnes & Noble’s and our agreements regarding the principal actions that both parties took in connection with the Spin-Off and aspects of our relationship following the Spin-Off. The term of the agreement is perpetual after the Distribution date; |
• | a Transition Services Agreement pursuant to which Barnes & Noble agreed to provide us with specified services for a limited time to help ensure an orderly transition following the Distribution. The Transition Services Agreement specifies the calculation of our costs for these services. The agreement will expire and services under it will cease no later than two years following the Distribution date or sooner in the event we no longer require such services; |
• | a Tax Matters Agreement governs the respective rights, responsibilities and obligations of Barnes & Noble and us after the Spin-Off with respect to all tax matters (including tax liabilities, tax attributes, tax returns and tax contests). The agreement will expire after two years following the Distribution date; |
78
BARNES & NOBLE EDUCATION, INC. AND SUBSIDIARIES
Notes to Consolidated Financial Statements - Continued
(Thousands of dollars, except share and per share data)
• | an Employee Matters Agreement with Barnes & Noble addressing employment, compensation and benefits matters including the allocation and treatment of assets and liabilities arising out of employee compensation and benefits programs in which our employees participated prior to the Spin-Off. The agreement will expire and services under it will cease when we no longer require such services; and |
• | a Trademark License Agreement pursuant to which Barnes & Noble grants us an exclusive license in certain licensed trademarks and a non-exclusive license in other licensed trademarks. The term of the agreement is perpetual after the Distribution date. |
A description of the material terms and conditions of these agreements can be found in the Prospectus dated July 15, 2015 and filed with the SEC on that date. The descriptions of the Transition Services Agreement, Tax Matters Agreement, Employee Matters Agreement and Trademark License Agreement are qualified in their entirety by reference to the full text of the Transition Services Agreement, Tax Matters Agreement, Employee Matters Agreement and Trademark License Agreement, which are attached as Exhibits 10.1, 10.2, 10.3 and 10.4, respectively, to the Current Report on Form 8-K dated August 2, 2015 and filed with the SEC on August 3, 2015. The description of the Separation and Distribution Agreement is qualified in its entirety by reference to the full text of the Separation and Distribution Agreement, which is attached as Exhibit 2.1 to the Quarterly Report on Form 10-Q dated August 1, 2015 and filed with the SEC on September 10, 2015.
Summary of Transactions with Barnes & Noble
During the 52 weeks ended April 29, 2017 and the 39 weeks ended April 30, 2016 (i.e. first, second, third and fourth quarter of Fiscal 2017 and the second, third and fourth quarter of Fiscal 2016, periods after the Spin-Off), we were billed $29,173 and $22,673, respectively, for purchases of inventory and direct costs incurred under the agreements discussed above which are included as cost of sales and selling, general and administrative expense in the consolidated statements of operations.
During the 13 weeks ended August 1, 2015 and Fiscal 2015 (periods presented prior to the Spin-Off), we were allocated $13,321 and $43,523, respectively, of general corporate expenses incurred by Barnes & Noble, Inc. and purchases of inventory which are included as cost of sales and selling, general and administrative expense in the consolidated statements of operations. For information related to allocated stock-based compensation expense, see Note 13. Stock-Based Compensation.
As of April 29, 2017 and April 30, 2016, amounts due to Barnes & Noble, Inc. for book purchases and direct costs incurred under the agreements discussed above were $8,041 and $5,246 and is included in accounts payable and accrued liabilities in the consolidated balance sheets, respectively.
All intercompany transactions between us and Barnes & Noble have been included in our consolidated financial statements and are considered to be effectively settled for cash in our consolidated financial statements at the time the Spin-Off is recorded. The total net effect of the settlement of these intercompany transactions is reflected in our consolidated statements of cash flow as a financing activity and in the consolidated balance sheets as “Parent company investment.”
Note 11. Related Party Transactions
MBS Textbook Exchange, LLC
Prior to the acquisition of MBS on February 27, 2017, MBS was considered a related-party as they were majority-owned by Leonard Riggio, who is a principal owner holding substantial shares of our common stock, and other members of the Riggio family. See Note 4. Acquisitions and Strategic Agreements.
Prior to the acquisition, we had a long-term supply agreement (“Supply Agreement”) with MBS, under which and subject to availability and competitive terms and conditions, we purchased new and used printed textbooks for a given academic term from MBS prior to buying them from other suppliers, other than in connection with student buy-back programs. Prior to the acquisition on February 27, 2017, total purchases from MBS were $92,956 (amount prior to returns which occurred subsequent to the February 27, 2017 acquisition date), $57,981, and $54,353 for Fiscal 2017, Fiscal 2016 and Fiscal 2015, respectively. Additionally, the Supply Agreement provided that we may sell to MBS certain textbooks that we cannot return to suppliers or use in our stores. MBS paid us commissions based on the volume of these textbooks sold to MBS each year and with respect to the textbook requirements of certain distance learning programs that MBS fulfills on our behalf. Prior to the acquisition on February 27, 2017, MBS paid us $7,376, $5,009, and $5,512 related to these commissions in Fiscal 2017, Fiscal 2016 and Fiscal 2015, respectively. In addition, the Supply Agreement contains restrictive covenants that limited our ability to become a used textbook wholesaler and that place certain limitations on MBS’s business activities. We also previously entered into an agreement with MBS pursuant to which MBS purchased books from us, which have no resale value for a flat rate per box. Prior to the acquisition on February 27, 2017, total sales to MBS under this program were $339, $574, and $419 for Fiscal 2017, Fiscal 2016 and Fiscal 2015, respectively.
79
BARNES & NOBLE EDUCATION, INC. AND SUBSIDIARIES
Notes to Consolidated Financial Statements - Continued
(Thousands of dollars, except share and per share data)
Total outstanding amounts payable to MBS for all arrangements net of any amounts due were $0 and $21,543 as of April 29, 2017 and April 30, 2016, respectively.
Subsequent to the acquisition, the consolidated financial statements include the accounts of MBS and all material intercompany accounts and transactions have been eliminated in consolidation.
MBS leases its main warehouse and distribution facility located in Columbia, Missouri from MBS Realty Partners L.P. which is majority-owned by Leonard Riggio, with the remaining ownership by other sellers of MBS. The lease was originally entered into in 1991 and included a renewal option which extended the lease through September 1, 2023. Based upon a valuation performed as of the acquisition date, the lease was determined to be favorable from a lessee perspective with below market rent. Rent payments to MBS Realty Partners L.P. were approximately $230 from the acquisition date, February 27, 2017, to April 29, 2017. See Note 4. Acquisitions and Strategic Agreements.
Note 12. Employee Benefit Plans
BNC
Prior to the Spin-Off on August 2, 2015, Barnes & Noble, Inc. sponsored the defined contribution plan (the “Savings Plan”) for the benefit of substantially all of the employees of BNC. Total contributions charged to employee benefit expenses for the Savings Plan prior to the Spin-Off were based on amounts allocated to us on the basis of direct usage. See Note 10. Barnes & Noble, Inc. Transactions. Subsequent to the Spin-Off, we established a 401(k) plan and Barnes & Noble, Inc. transferred to it the 401(k) plan assets relating to the account balances of our employees. Additionally, we are responsible for employer contributions to the Savings Plan and fund the contributions directly. Total contributions charged to employee benefit expenses for the Savings Plan were $4,293, $4,375, and $3,907 during Fiscal 2017, Fiscal 2016 and Fiscal 2015, respectively.
MBS
MBS maintains a profit sharing plan ("Profit Sharing Plan") covering substantially all full-time employees of MBS. MBS transfers employee contributions to the account balances of their employees and is responsible to fund the employer contributions directly. Total employee benefit expenses for the Profit Sharing Plan was $535 from the acquisition date, February 27, 2017, to April 29, 2017.
Note 13. Stock-Based Compensation
Barnes & Noble’s Equity Plans Prior to Spin-Off
Prior to the Spin-Off, certain of our employees were eligible to participate in Barnes & Noble, Inc. equity plans pursuant to which they were granted awards of Barnes & Noble, Inc. common stock. Under these equity plans, our employees were granted restricted stock units, restricted stock and stock options.
Barnes & Noble, Inc. recognized stock-based compensation costs, net of estimated forfeitures, for only those shares expected to vest on a straight-line basis over the requisite service period of the award. Barnes & Noble, Inc. estimated the forfeiture rates based on its historical experience. The fair market value of restricted stock was determined based on the closing price of Barnes & Noble, Inc.’s common stock on the grant date. Barnes & Noble, Inc. used the Black-Scholes option-pricing model to value Barnes & Noble, Inc.’s stock options for each stock option award.
The equity-based payments recorded by us prior to the Spin-Off included the expense associated with our employees.
Current Equity Plans
During the second quarter of Fiscal 2016, post Spin-Off, we reserved 2,409,345 shares of our Common Stock for future grants in accordance with the Barnes & Noble Education Inc. Equity Incentive Plan (the "Equity Incentive Plan"). Additionally, during the second quarter of Fiscal 2017 shareholders approved an amendment to the Equity Incentive Plan to increase the number of shares available for issuance by an additional 4,000,000 shares of our Common Stock, for an aggregate total of 6,409,345 shares.
Types of equity awards that can be granted under the Equity Incentive Plan include options, restricted stock ("RS"), restricted stock units ("RSU") and performance shares ("PS"). We have not granted options under the Equity Incentive Plan.
A restricted stock award is an award of common stock that is subject to certain restrictions during a specified period. Restricted stock awards are generally subject to forfeiture if employment terminates prior to the release of the restrictions. The grantee cannot transfer the shares before the restricted shares vest. Shares of unvested restricted stock have the same voting rights as common stock, are entitled to receive dividends and other distributions thereon and are considered to be currently issued and outstanding. Restricted stock awards vest over a period of one year.
80
BARNES & NOBLE EDUCATION, INC. AND SUBSIDIARIES
Notes to Consolidated Financial Statements - Continued
(Thousands of dollars, except share and per share data)
A restricted stock unit is a grant valued in terms of our common stock, but no stock is issued at the time of grant. Each restricted stock unit may be redeemed for one share of our common stock once vested. Restricted stock units are generally subject to forfeiture if employment terminates prior to the release of the restrictions. The grantee cannot transfer the units except in very limited circumstances and with the consent of the compensation committee. Shares of unvested restricted stock units have no voting rights but are entitled to receive dividends and other distributions thereon. Restricted stock units vest over a period of three years.
We recognize compensation expense for awards ratably over the requisite service period of the award, which is generally three years. We recognize compensation expense based on the number of awards expected to vest using an estimated average forfeiture rate. We calculate the fair value of stock-based awards based on the closing price on the date the award was granted.
Stock-Based Compensation Activity
During Fiscal 2017 we granted the following awards:
• | 406,078 PS awards were granted to employees that will only vest based upon the achievement of pre-established performance goals related to Adjusted EBITDA and new business achieved measured over a period of time. The PS will vest based on company performance during Fiscal 2017 - Fiscal 2018 with one additional year of time-based vesting. The number of PS awards that will vest range from 0%-150% of the target award based on actual performance. |
• | 1,157,586 RSU awards were granted to employees with a three year vesting period in accordance with Equity Incentive Plan; |
• | 49,484 RSU awards and 12,371 RS awards were granted to the current Board of Directors ("BOD") members for annual compensation with a one year vesting period in accordance with Equity Incentive Plan. |
The following table presents a summary of restricted stock awards and restricted stock units activity related to our current Equity Incentive Plan:
Restricted Stock Awards | Restricted Stock Units | Performance Shares | |||||||||||||||||||
Number of Shares | Weighted Average Grant Date Fair Value | Number of Shares | Weighted Average Grant Date Fair Value | Number of Shares | Weighted Average Grant Date Fair Value | ||||||||||||||||
Balance, August 2, 2015 | — | $ | — | — | $ | — | — | $ | — | ||||||||||||
Granted (a) | 73,352 | $ | 13.08 | 1,681,552 | $ | 10.12 | — | $ | — | ||||||||||||
Vested | (27,272 | ) | $ | 13.19 | (431,106 | ) | $ | 7.29 | — | $ | — | ||||||||||
Forfeited | — | $ | — | (8,979 | ) | $ | 9.92 | — | $ | — | |||||||||||
Balance, April 30, 2016 | 46,080 | $ | 13.02 | 1,241,467 | $ | 11.10 | — | $ | — | ||||||||||||
Granted | 12,371 | $ | 9.70 | 1,207,070 | $ | 9.70 | 406,078 | $ | 9.52 | ||||||||||||
Vested | (46,080 | ) | $ | 13.02 | (680,489 | ) | $ | 9.72 | — | $ | — | ||||||||||
Forfeited | — | $ | — | (36,425 | ) | $ | 9.69 | — | $ | — | |||||||||||
Balance, April 29, 2017 | 12,371 | $ | 9.70 | 1,731,623 | $ | 10.70 | 406,078 | $ | 9.52 | ||||||||||||
(a) | Restricted Stock Units include the 877,426 converted RSU shares issued during Fiscal 2016 related to our spin-off from Barnes & Noble, Inc. |
Total fair value of shares of restricted stock awards and restricted stock units that vested since the inception of Equity Incentive Plan was $960 and $9,759, respectively.
81
BARNES & NOBLE EDUCATION, INC. AND SUBSIDIARIES
Notes to Consolidated Financial Statements - Continued
(Thousands of dollars, except share and per share data)
Stock-Based Compensation Expense
We recognized stock-based compensation expense for equity-based awards in selling and administrative expenses as follows:
Fiscal 2017 | Fiscal 2016 | Fiscal 2015 | |||||||||
Restricted Stock Expense | $ | 280 | $ | 840 | $ | 306 | |||||
Restricted Stock Units Expense | 8,431 | 5,710 | 3,757 | ||||||||
Performance Shares Expense | 655 | — | — | ||||||||
Stock Option Expense | — | 120 | 678 | ||||||||
Stock-Based Compensation Expense | $ | 9,366 | $ | 6,670 | $ | 4,741 | |||||
In the 13 weeks ended August 1, 2015 and for Fiscal 2015 (periods presented prior to the Spin-Off), Barnes & Noble allocated stock compensation expense to us, which includes stock compensation expense related to our employees, as well as an allocation from Barnes & Noble for our pro-rated share of corporate employees.
Total unrecognized compensation cost related to unvested awards as of April 29, 2017 was $14,933 and is expected to be recognized over a weighted-average period of 2 years.
Note 14. Income Taxes
Our operating results have been included in the consolidated U.S. federal and state income tax returns of Barnes & Noble for all periods ending on or before the consummation of the Spin-Off on August 2, 2015. Amounts presented in these consolidated financial statements related to income taxes have been determined on a separate tax return basis as it relates to those periods. Amounts presented in these consolidated financial statements related to income taxes for periods ending after the consummation of the Spin-Off are presented on a consolidated basis as we became a separate consolidated entity
For Fiscal 2017, Fiscal 2016 and Fiscal 2015, we had no material revenue or expense in jurisdictions outside the United States.
Income tax provisions (benefits) for Fiscal 2017, Fiscal 2016 and Fiscal 2015 are as follows:
Fiscal 2017 | Fiscal 2016 | Fiscal 2015 | ||||||||||
Current: | ||||||||||||
Federal | $ | 14,872 | $ | 13,019 | $ | 22,061 | ||||||
State | 1,819 | 1,783 | 3,489 | |||||||||
Total current | 16,691 | 14,802 | 25,550 | |||||||||
Deferred: | ||||||||||||
Federal | (9,238 | ) | (9,922 | ) | (10,247 | ) | ||||||
State | (2,723 | ) | (2,213 | ) | (1,085 | ) | ||||||
Total deferred | (11,961 | ) | (12,135 | ) | (11,332 | ) | ||||||
Total | $ | 4,730 | $ | 2,667 | $ | 14,218 | ||||||
Reconciliation between the effective income tax rate and the federal statutory income tax rate is as follows:
Fiscal 2017 | Fiscal 2016 | Fiscal 2015 | |||||||
Federal statutory income tax rate | 35.0 | % | 35.0 | % | 35.0 | % | |||
State income taxes, net of federal income tax benefit | (5.8 | ) | (15.2 | ) | 4.7 | ||||
Valuation allowances | — | 50.6 | — | ||||||
Permanent book / tax differences | 25.5 | 31.1 | 3.1 | ||||||
Credits | (5.5 | ) | (5.4 | ) | (0.2 | ) | |||
Other, net | (2.3 | ) | 0.8 | — | |||||
Effective income tax rate | 46.9 | % | 96.9 | % | 42.6 | % | |||
82
BARNES & NOBLE EDUCATION, INC. AND SUBSIDIARIES
Notes to Consolidated Financial Statements - Continued
(Thousands of dollars, except share and per share data)
One percentage point on our effective tax rate is approximately $100. The net benefit for state income taxes is principally driven by certain net operating losses that the Company is entitled to claim as a result of the Spin-Off. The permanent book / tax differences are principally comprised of non-deductible compensation, non-deductible meals and entertainment costs, and federal income tax credits.
In March 2016, the FASB issued ASU No. 2016-09 to provide guidance that changes the accounting for certain aspects of share-based payments to employees. The guidance requires, among other things, the recognition of the income tax effects of awards in the income statement when the awards vest or are settled, thus eliminating additional paid-in capital pools. We are required to adopt this standard in the first quarter of Fiscal 2018, but have early adopted this standard during the fourth quarter of Fiscal 2016 as permitted. Prior to Fiscal 2016, we had no windfall benefits. There was no material impact upon adoption of this guidance since the recognition of income tax effects of awards was not materially different than amounts that had previously been recorded in our financial statements.
We account for income taxes using the asset and liability method. Deferred taxes are recorded based on differences between the financial statement basis and tax basis of assets and liabilities and available tax loss and credit carryforwards.
The significant components of our deferred taxes consisted of the following:
As of | ||||||||
April 29, 2017 | April 30, 2016 | |||||||
Deferred tax assets: | ||||||||
Estimated accrued liabilities | $ | 13,047 | $ | 13,859 | ||||
Inventory | 16,969 | 12,926 | ||||||
Stock-based compensation | 1,780 | 1,648 | ||||||
Insurance liability | 881 | 1,050 | ||||||
Lease transactions | 1,826 | 2,138 | ||||||
Property and equipment | 8,728 | 6,802 | ||||||
Tax credits | 206 | 112 | ||||||
Net operating losses | 4,916 | 3,477 | ||||||
Other | 5,106 | 1,499 | ||||||
Gross deferred tax assets | 53,459 | 43,511 | ||||||
Valuation allowance | (1,392 | ) | (1,394 | ) | ||||
Net deferred tax assets | 52,067 | 42,117 | ||||||
Deferred tax liabilities: | ||||||||
Intangible asset amortization | (68,938 | ) | (71,982 | ) | ||||
Gross deferred tax liabilities | (68,938 | ) | (71,982 | ) | ||||
Net deferred tax liabilities | $ | (16,871 | ) | $ | (29,865 | ) | ||
83
BARNES & NOBLE EDUCATION, INC. AND SUBSIDIARIES
Notes to Consolidated Financial Statements - Continued
(Thousands of dollars, except share and per share data)
As of April 29, 2017, we had $86 of unrecognized tax benefits, all of which, if recognized, would affect our effective tax rate. A reconciliation of the beginning and ending amount of unrecognized tax benefits is as follows:
Balance at May 3, 2014 | $ | 180 | |
Additions for tax positions of the current period | 35 | ||
Additions for tax positions of prior periods | — | ||
Reductions due to settlements | — | ||
Other reductions for tax positions of prior periods | — | ||
Balance at May 2, 2015 | $ | 215 | |
Additions for tax positions of the current period | 21 | ||
Additions for tax positions of prior periods | — | ||
Reductions due to settlements | — | ||
Other reductions for tax positions of prior periods | (215 | ) | |
Balance at April 30, 2016 | $ | 21 | |
Additions for tax positions of the current period | 40 | ||
Additions for tax positions of prior periods | 25 | ||
Reductions due to settlements | — | ||
Other reductions for tax positions of prior periods | — | ||
Balance at April 29, 2017 | $ | 86 | |
We do not believe that it is reasonably possible that these unrecognized tax benefits will decrease in the next twelve months.
Our policy is to recognize interest and penalties related to income tax matters in income tax expense. As of April 29, 2017 and April 30, 2016, we had accrued $3 and $1, respectively, for net interest and penalties. The change in the amount accrued for net interest and penalties includes $2 in additions for net interest and penalties recognized in income tax expense in our Fiscal 2017 consolidated statement of operations.
In assessing the realizability of the deferred tax assets, management considered whether it is more likely than not that some or all of the deferred tax assets would be realized. In evaluating the Company’s ability to utilize its deferred tax assets, it considered all available evidence, both positive and negative, in determining future taxable income on a jurisdiction by jurisdiction basis. The Company has recorded a valuation allowance of $1,392 and $1,394 for both April 29, 2017 and April 30, 2016. The valuation allowance remained unchanged during Fiscal 2017 principally due to costs incurred in connection with restructuring during Fiscal 2016 that are not more likely than not to be deductible for tax purposes.
At April 29, 2017, and based on its tax year ended January 2017, the Company had state net operating loss carryforwards (NOLs) of approximately $108,038 that are available to offset taxable income in its respective taxing jurisdiction beginning in the current period and that expire beginning in 2030. The Company had net state tax credit carryforwards totaling $317, which expire beginning in 2021.
As of April 29, 2017, the Company has not provided for deferred taxes on the excess of financial reporting over the tax basis of investments in certain foreign subsidiaries because, as of Fiscal 2017, any such amounts are immaterial. If these earnings were repatriated in the future, additional income and withholding tax expense would be incurred.
We are subject to U.S. federal income tax as well as income tax in jurisdictions of each state having an income tax. The tax years that remain subject to examination are primarily from Fiscal 2013 and forward. Some earlier years remain open for a small minority of states. Pursuant to the Tax Matters Agreements referenced in Note 10. Barnes & Noble, Inc. Transactions, we retain income tax liability for periods prior to the Spin-Off only for returns filed on a stand-alone basis.
Note 15. Legal Proceedings
We are involved in a variety of claims, suits, investigations and proceedings that arise from time to time in the ordinary course of our business, including actions with respect to contracts, intellectual property, taxation, employment, benefits, personal injuries and other matters. The results of these proceedings in the ordinary course of business are not expected to have a material adverse effect on our consolidated financial position, results of operations, or cash flows.
84
BARNES & NOBLE EDUCATION, INC. AND SUBSIDIARIES
Notes to Consolidated Financial Statements - Continued
(Thousands of dollars, except share and per share data)
Note 16. Commitments and Contingencies
We generally operate our stores pursuant to multi-year school management contracts under which a school designates us to operate the official school bookstore on campus and we provide the school with regular payments that represent a percentage of store sales and, in some cases, include a minimum fixed guaranteed payment. We account for these service agreements under lease accounting. We provide for minimum contract expense over the contract terms on a straight-line basis. The excess of such minimum contract expense over actual contract payments (net of school allowances) is reflected in other long-term liabilities and accrued liabilities in the consolidated balance sheets. The expense related to our college and university contracts, including rent expense, and other facility costs in the consolidated statements of operations are as follows:
Fiscal 2017 | Fiscal 2016 | Fiscal 2015 | ||||||||||
Minimum contract expense | $ | 165,980 | $ | 140,743 | $ | 125,388 | ||||||
Percentage contract expense | 87,843 | 101,552 | 106,011 | |||||||||
$ | 253,823 | $ | 242,295 | $ | 231,399 | |||||||
Our contracts with colleges and universities are typically five years with renewal options, but can range from one to 15 years, and are typically cancelable by either party without penalty with 90 to120 days' notice. Annual projections below are based on current minimum guarantee amounts. In approximately 65% of our contracts with colleges and universities that include minimum guarantees, the minimum guaranteed amounts adjust annually to equal less than the prior year's commission earned.
As of April 29, 2017, future minimum annual obligations required under our contracts with colleges and universities and other facility costs are as follows:
Fiscal Year | |||
2018 | $ | 140,417 | |
2019 | 133,514 | ||
2020 | 123,811 | ||
2021 | 116,153 | ||
2022 | 104,486 | ||
After 2022 | 207,807 | ||
$ | 826,188 | ||
Purchase obligations, which includes information technology contracts and inventory purchase commitments, as of April 29, 2017 are as follows:
Less Than 1 Year | $ | 3,124 | |
1-3 Years | 3,000 | ||
3-5 Years | 175 | ||
Total | $ | 6,299 | |
Note 17. Selected Quarterly Financial Information (Unaudited)
A summary of quarterly financial information for Fiscal 2017 and Fiscal 2016 is as follows:
Fiscal 2017 Quarterly Period Ended | July 30, 2016 | October 29, 2016 | January 28, 2017 | April 29, 2017 | Fiscal Year 2017 | |||||||||||||||
Sales | $ | 239,237 | $ | 770,671 | $ | 521,624 | $ | 342,830 | $ | 1,874,362 | ||||||||||
Gross profit | $ | 47,413 | $ | 171,514 | $ | 115,925 | $ | 122,511 | $ | 457,363 | ||||||||||
Net (loss) income | $ | (27,916 | ) | $ | 29,289 | $ | 3,761 | $ | 227 | $ | 5,361 | |||||||||
Basic (loss) earnings per common share: | ||||||||||||||||||||
Net (loss) income | $ | (0.60 | ) | $ | 0.63 | $ | 0.08 | $ | — | $ | 0.12 | |||||||||
Diluted (loss) earnings per common share: | ||||||||||||||||||||
Net (loss) income | $ | (0.60 | ) | $ | 0.63 | $ | 0.08 | $ | — | $ | 0.11 | |||||||||
85
BARNES & NOBLE EDUCATION, INC. AND SUBSIDIARIES
Notes to Consolidated Financial Statements - Continued
(Thousands of dollars, except share and per share data)
Fiscal 2016 Quarterly Period Ended | August 1, 2015 (a)(b) | October 31, 2015 | January 30, 2016 | April 30, 2016 | Fiscal Year 2016 | |||||||||||||||
Sales | $ | 238,983 | $ | 755,864 | $ | 518,423 | $ | 294,759 | $ | 1,808,029 | ||||||||||
Gross profit | $ | 51,544 | $ | 175,121 | $ | 120,640 | $ | 106,044 | $ | 453,349 | ||||||||||
Net (loss) income | $ | (26,918 | ) | $ | 33,401 | $ | (3,603 | ) | $ | (2,796 | ) | $ | 84 | |||||||
Basic (loss) earnings per common share: | ||||||||||||||||||||
Net (loss) income | $ | (0.65 | ) | $ | 0.69 | $ | (0.07 | ) | $ | (0.06 | ) | $ | — | |||||||
Diluted (loss) earnings per common share: | ||||||||||||||||||||
Net (loss) income | $ | (0.65 | ) | $ | 0.69 | $ | (0.07 | ) | $ | (0.06 | ) | $ | — | |||||||
(a) | Basic earnings per share and weighted-average basic shares outstanding are based on the number of shares of Barnes & Noble, Inc. common stock outstanding on May 2, 2015, adjusted for an assumed distribution ratio of 0.632 shares of our Common Stock for every one share of Barnes & Noble, Inc. common stock held on the record date for the Spin-Off. |
(b) | Diluted earnings per share and weighted-average diluted shares outstanding reflect potential common shares from Barnes & Noble, Inc. equity plans in which our employees participate based on the distribution ratio. While the actual future impact will depend on various factors, including employees who may change employment from one company to another, we believe the estimate yields a reasonable approximation of the future dilutive impact of our equity plans. |
Note 18. Subsequent Event
In May 2017, we entered into an agreement with Unizin, Ltd. ("Unizin") to provide its 22 member universities with LoudCloud's predictive analytics solution, LoudSight. As a result, faculty and advisors will have access to a customized solution that helps educators identify, monitor, and support at-risk students, with the goal of improving student success rates and retention. For additional information related to our Strategies, see Part I - Item 1. Business - Overview - Barnes & Noble College.
86
Schedule II—Valuation and Qualifying Accounts
Barnes & Noble Education, Inc.
Receivables Valuation and Qualifying Accounts
(In thousands)
For the 52 week periods ended April 29, 2017, April 30, 2016, and May 2, 2015:
Balance at beginning of period | Charge (recovery) to costs and expenses | Write-offs | Balance at end of period | |||||||||||||
Allowance for Doubtful Accounts | ||||||||||||||||
April 29, 2017 | $ | 2,320 | $ | 3,459 | $ | (3,520 | ) | $ | 2,259 | |||||||
April 30, 2016 | $ | 2,313 | $ | 4,000 | $ | (3,993 | ) | $ | 2,320 | |||||||
May 2, 2015 | $ | 2,233 | $ | 3,544 | $ | (3,464 | ) | $ | 2,313 | |||||||
Balance at beginning of period | Addition Charged to Costs | Deductions | Balance at end of period | |||||||||||||
Sales Returns Reserves | ||||||||||||||||
April 29, 2017 | $ | 757 | $ | 155,486 | $ | (149,426 | ) | $ | 6,817 | |||||||
April 30, 2016 | $ | 679 | $ | 130,421 | $ | (130,343 | ) | $ | 757 | |||||||
May 2, 2015 | $ | 608 | $ | 123,828 | $ | (123,757 | ) | $ | 679 | |||||||
All other schedules are omitted because the conditions requiring their filing do not exist, or because the required information is provided in the consolidated financial statements, including the notes thereto.
87
Item 9. | CHANGES IN AND DISAGREEMENTS WITH ACCOUNTANTS ON ACCOUNTING AND FINANCIAL DISCLOSURE |
There were no disagreements with accountants on accounting and financial disclosure.
Item 9A. CONTROLS AND PROCEDURES
(a) Evaluation of Disclosure Controls and Procedures
Management of the Company established and maintains disclosure controls and procedures that are designed to ensure that material information relating to the Company and its subsidiaries required to be disclosed in the reports that are filed or submitted under the Exchange Act are recorded, processed, summarized, and reported within the time periods specified in the SEC’s rules and forms, and that such information is accumulated and communicated to management, including the Company’s Chief Executive Officer and Chief Financial Officer, as appropriate to allow timely decisions regarding required disclosure. As of the end of the period covered by this report, the Company’s management conducted an evaluation (as required under Rules 13a-15(b) and 15d-15(b) under the Exchange Act), excluding MBS Textbook Exchange, LLC ("MBS") as noted below, under the supervision and with the participation of the principal executive officer and principal financial officer, of the Company’s “disclosure controls and procedures” (as such term is defined in Rules 13a-15(e) and 15d-15(e) under the Exchange Act). A control system, no matter how well designed and operated, can provide only reasonable, not absolute, assurance that it will detect or uncover failures within the Company to disclose material information otherwise required to be set forth in the Company’s periodic reports. Based on management’s evaluation, and considering the items noted below, the principal executive officer and principal financial officer concluded that, as of the end of the period covered by this report, the Company’s disclosure controls and procedures are effective at the reasonable assurance level.
(b) Management’s Annual Report on Internal Control over Financial Reporting
Management is responsible for establishing and maintaining adequate internal control over financial reporting. As defined in Exchange Act Rule 13a-15(f), internal control over financial reporting is a process designed by, or under the supervision of, the principal executive and principal financial officer and effected by the board of directors, management and other personnel, to provide reasonable assurance regarding the reliability of financial reporting and the preparation of financial statements for external purposes in accordance with generally accepted accounting principles and includes those policies and procedures that: (i) pertain to the maintenance of records that in reasonable detail accurately and fairly reflect the transactions and dispositions of the assets of the Company; (ii) provide reasonable assurance that transactions are recorded as necessary to permit preparation of financial statements in accordance with generally accepted accounting principles, and that receipts and expenditures of the Company are being made only in accordance with authorizations of management and directors of the Company; and (iii) provide reasonable assurance regarding prevention or timely detection of unauthorized acquisition, use or disposition of the Company’s assets that could have a material effect on the financial statements.
On February 27, 2017, the Company completed its acquisition of MBS, which represents a material change in the Company's internal control over financial reporting since management’s last assessment of effectiveness. Management is in the process of evaluating the existing controls and procedures of MBS, and integrating MBS into the Company's internal control over financial reporting. In accordance with SEC staff guidance permitting a company to exclude an acquired business from management’s assessment of the effectiveness of internal control over financial reporting for the year in which the acquisition is completed, management has excluded MBS from its assessment of the effectiveness of internal control over financial reporting as of April 29, 2017. MBS represented 19.3% of the Company’s total assets as of April 29, 2017 and 1.8% of the Company’s total revenues for the 52 weeks ended April 29, 2017.
Under the supervision and with the participation of management, including the Chief Executive Officer and Chief Financial Officer, the Company conducted an evaluation of the effectiveness of the Company’s internal control over financial reporting based on the framework in Internal Control - Integrated Framework issued by the Committee of Sponsoring Organizations of the Treadway Commission (COSO 2013 framework). Based upon the Company’s evaluation under this framework, management concluded that the Company’s internal control over financial reporting was effective as of April 29, 2017.
The effectiveness of internal control over financial reporting was audited by Ernst & Young LLP, an independent registered public accounting firm, as stated in their report included on page 90.
(c) Changes in Internal Control over Financial Reporting
Other than the changes with regard to MBS as discussed above, there have been no changes in the Company’s internal control over financial reporting during the most recent quarter ended April 29, 2017 that have materially affected, or are reasonably likely to materially affect, the Company's internal control over financial reporting.
88
MANAGEMENT’S RESPONSIBILITY FOR CONSOLIDATED FINANCIAL STATEMENTS
The management of Barnes & Noble Education, Inc. is responsible for the contents of the Consolidated Financial Statements, which are prepared in conformity with accounting principles generally accepted in the United States of America. The Consolidated Financial Statements necessarily include amounts based on judgments and estimates. Financial information elsewhere in the Annual Report is consistent with that in the Consolidated Financial Statements.
The Company maintains a comprehensive accounting system, which includes controls designed to provide reasonable assurance as to the integrity and reliability of the financial records and the protection of assets. An internal audit staff is employed to regularly test and evaluate both internal accounting controls and operating procedures, including compliance with the Company’s Code of Business Conduct and Ethics. The Audit Committee of the Board of Directors composed of directors who are not members of management, meets regularly with management, the independent registered public accountants and the internal auditors to ensure that their respective responsibilities are properly discharged.
On February 27, 2017, the Company completed its acquisition of MBS Textbook Exchange, LLC ("MBS"). Management is in the process of evaluating the existing controls and procedures of MBS and integrating MBS into the Company’s internal control over financial reporting. In accordance with SEC guidance permitting a company to exclude an acquired business from management’s assessment of the effectiveness of internal control over financial reporting for the year in which the acquisition is completed, management has excluded MBS from its assessment of the effectiveness of internal control over financial reporting as of April 29, 2017. The scope of management’s assessment of the effectiveness of the design and operation of the Company’s disclosure controls and procedures as of April 29, 2017 includes all of the Company’s consolidated operations except for those disclosure controls and procedures of MBS that are subsumed by internal control over financial reporting.
Ernst & Young LLP and the internal auditors have full and free independent access to the Audit Committee. The role of Ernst & Young LLP, an independent registered public accounting firm, is to provide an objective examination of the Consolidated Financial Statements and the underlying transactions in accordance with the standards of the Public Company Accounting Oversight Board. The report of Ernst & Young LLP appears on page 90 of this report on Form 10-K for the year ended April 29, 2017.
OTHER INFORMATION
The Company has included the Section 302 certifications of the Chief Executive Officer and the Chief Financial Officer of the Company as Exhibits 31.1 and 31.2 to its Annual Report on Form 10-K for Fiscal 2017 filed with the Securities and Exchange Commission, and the Company will submit to the New York Stock Exchange a certificate of the Chief Executive Officer of the Company certifying that he is not aware of any violation by the Company of New York Stock Exchange corporate governance listing standards.
89
REPORT OF INDEPENDENT REGISTERED PUBLIC ACCOUNTING FIRM
To the Board of Directors and Shareholders of Barnes & Noble Education, Inc. and subsidiaries
We have audited Barnes & Noble Education, Inc. and subsidiaries' internal control over financial reporting as of April 29, 2017, based on criteria established in Internal Control-Integrated Framework issued by the Committee of Sponsoring Organizations of the Treadway Commission (2013 framework) (the COSO criteria). Barnes & Noble Education, Inc. and subsidiaries' management is responsible for maintaining effective internal control over financial reporting, and for its assessment of the effectiveness of internal control over financial reporting included in the accompanying Management’s Annual Report on Internal Control over Financial Reporting. Our responsibility is to express an opinion on the company’s internal control over financial reporting based on our audit.
We conducted our audit in accordance with the standards of the Public Company Accounting Oversight Board (United States). Those standards require that we plan and perform the audit to obtain reasonable assurance about whether effective internal control over financial reporting was maintained in all material respects. Our audit included obtaining an understanding of internal control over financial reporting, assessing the risk that a material weakness exists, testing and evaluating the design and operating effectiveness of internal control based on the assessed risk, and performing such other procedures as we considered necessary in the circumstances. We believe that our audit provides a reasonable basis for our opinion.
A company’s internal control over financial reporting is a process designed to provide reasonable assurance regarding the reliability of financial reporting and the preparation of financial statements for external purposes in accordance with generally accepted accounting principles. A company’s internal control over financial reporting includes those policies and procedures that (1) pertain to the maintenance of records that, in reasonable detail, accurately and fairly reflect the transactions and dispositions of the assets of the company; (2) provide reasonable assurance that transactions are recorded as necessary to permit preparation of financial statements in accordance with generally accepted accounting principles, and that receipts and expenditures of the company are being made only in accordance with authorizations of management and directors of the company; and (3) provide reasonable assurance regarding prevention or timely detection of unauthorized acquisition, use, or disposition of the company’s assets that could have a material effect on the financial statements.
Because of its inherent limitations, internal control over financial reporting may not prevent or detect misstatements. Also, projections of any evaluation of effectiveness to future periods are subject to the risk that controls may become inadequate because of changes in conditions, or that the degree of compliance with the policies or procedures may deteriorate.
As indicated in the accompanying Management's Annual Report on Internal Control over Financial Reporting, management's assessment of and conclusion on the effectiveness of internal control over financial reporting did not include the internal controls of MBS Textbook Exchange, LLC (MBS), which is included in the fiscal 2017 consolidated financial statements of Barnes & Noble Education, Inc. and subsidiaries and constituted 19.3% and 1.8% of total assets and revenues, respectively, as of April 29, 2017 and for the year then ended. Our audit of internal control over financial reporting of Barnes & Noble Education, Inc. also did not include an evaluation of the internal control over financial reporting of MBS.
In our opinion, Barnes & Noble Education, Inc. and subsidiaries maintained, in all material respects, effective internal control over financial reporting as of April 29, 2017, based on the COSO criteria.
We also have audited, in accordance with the standards of the Public Company Accounting Oversight Board (United States), the consolidated balance sheets of Barnes & Noble Education, Inc. and subsidiaries as of April 29, 2017 and April 30, 2016, and the related consolidated statements of operations and comprehensive income, equity and cash flows for each of the three years in the period ended April 29, 2017 and our report dated July 12, 2017 expressed an unqualified opinion thereon.
/s/ Ernst & Young LLP
Iselin, New Jersey
July 12, 2017
90
Item 9B. OTHER INFORMATION
None.
PART III
Item 10. DIRECTORS, EXECUTIVE OFFICERS AND CORPORATE GOVERNANCE
Information regarding our executive officers is incorporated by reference herein from the discussion under Item 1. Business — Executive Officers of this Annual Report on Form 10-K. The remaining information with respect to directors, executive officers, the code of ethics and corporate governance of the Company is incorporated herein by reference to the Company’s definitive Proxy Statement relating to the Company’s 2017 Annual Meeting of Stockholders to be filed with the SEC within 120 days of the Company’s fiscal year ended April 29, 2017 (the "Proxy Statement").
The information with respect to compliance with Section 16(a) of the Exchange Act is incorporated herein by reference to the Proxy Statement.
Item 11. EXECUTIVE COMPENSATION
The information with respect to executive compensation is incorporated herein by reference to the Proxy Statement.
The information with respect to compensation of directors is incorporated herein by reference to the Proxy Statement.
Item 12. SECURITY OWNERSHIP OF CERTAIN BENEFICIAL OWNERS AND MANAGEMENT AND RELATED STOCKHOLDER MATTERS
Equity Compensation Plan Information
The following table sets forth equity compensation plan information as of April 29, 2017:
Plan Category | Number of securities to be issued upon exercise of outstanding options, warrants and rights | Weighted-average exercise price of outstanding options, warrants and rights | Number of securities remaining available for future issuance under equity compensation plans (excluding securities in column (a)) | |||||||
(a) | (b) | (c) | ||||||||
Equity compensation plans approved by security holders | 2,150,072 | $ | 10.47 | 2,150,072 | ||||||
Equity compensation plans not approved by security holders | N/A | N/A | N/A | |||||||
Total | 2,150,072 | $ | 10.47 | 2,150,072 | ||||||
The information with respect to security ownership of certain beneficial owners and management is incorporated herein by reference to the Proxy Statement.
Item 13. CERTAIN RELATIONSHIPS AND RELATED TRANSACTIONS, AND DIRECTOR INDEPENDENCE
The information with respect to certain relationships and related transactions and director independence is incorporated herein by reference to the Proxy Statement.
Item 14. PRINCIPAL ACCOUNTING FEES AND SERVICES
The information with respect to principal accountant fees and services is incorporated herein by reference to the Proxy Statement.
91
PART IV
Item 15. EXHIBITS, FINANCIAL STATEMENT SCHEDULES
(a) Documents filed as part of this report:
1. | Consolidated Financial Statements of Barnes & Noble Education, Inc.: |
Included in Part II of this Report:
Consolidated Statements of Operations for the years ended April 29, 2017, April 30, 2016, and May 2, 2015
Consolidated Balance Sheets as of April 29, 2017 and April 30, 2016
Consolidated Statements of Cash Flows for the years ended April 29, 2017, April 30, 2016, and May 2, 2015
Consolidated Statements of Equity for the years ended April 29, 2017 and April 30, 2016
Notes to Consolidated Financial Statements, for the years ended April 29, 2017, April 30, 2016, and May 2, 2015
Report of Ernst & Young LLP, Independent Registered Public Accounting Firm, on the consolidated financial statements of Barnes & Noble Education, Inc. for the years ended April 29, 2017, April 30, 2016, and May 2, 2015
2. | Financial Statement Schedules of Barnes & Noble Education, Inc.: |
Included in Part II of this report: Schedule II - Valuation and Qualifying Accounts
All other schedules are omitted because they are not applicable, not significant or not required, or because the required information is included in the financial statement notes thereto.
3. | Exhibits: |
EXHIBIT INDEX
Exhibit Number | Exhibit Description | |
Plan of acquisition, reorganization, arrangement, liquidation or succession. | ||
2.1 | Separation and Distribution Agreement, dated as of July 14, 2015, between Barnes & Noble, Inc. and Barnes & Noble Education, Inc., filed as Exhibit 2.1 to Report on Form 10-Q filed with the SEC on September 10, 2015, and incorporated herein by reference. | |
2.2 | Purchase Agreement, dated as of February 27, 2017, by and among Barnes & Noble Education, Inc., Ellar LLC, Leonard Riggio and the other unitholders party thereto, and Ellar LLC, as the Designated Representative, filed as Exhibit 2.1 to Report on Form 8-K filed with the SEC on February 28, 2017, and incorporated herein by reference. | |
Articles of Incorporation and By-Laws. | ||
3.1 | Amended and Restated Certificate of Incorporation of Barnes & Noble Education, Inc., filed as Exhibit 3.1 to the Report on Form 8-K filed with the SEC on August 3, 2015, and incorporated herein by reference. | |
3.2 | Amended and Restated By-Laws of Barnes & Noble Education, Inc., filed as Exhibit 3.2 to the Report on Form 8-K filed with the SEC on August 3, 2015, and incorporated herein by reference. | |
Material contracts. | ||
10.1 | Credit Agreement, dated as of August 3, 2015, by and among Barnes & Noble Education, Inc., as borrower, the lenders party thereto, Bank of America, N.A., as administrative agent, and the other agents party thereto, filed as Exhibit 10.4 to Report on Form 8-K filed with the SEC on August 3, 2015, and incorporated herein by reference. | |
10.2 | First Amendment to Credit Agreement, dated as of February 27, 2017, by and among the Company, the Lenders and the Agent, filed as Exhibit 10.1 to Report on Form 8-K filed with the SEC on February 28, 2017, and incorporated herein by reference. | |
10.3 | Transition Services Agreement, dated as of August 2, 2015, between Barnes & Noble Education, Inc. and Barnes & Noble, Inc., filed as Exhibit 10.1 to Report on Form 8-K filed with the SEC on August 3, 2015, and incorporated herein by reference. | |
10.4 | Tax Matters Agreement, dated as of August 2, 2015, between Barnes & Noble Education, Inc. and Barnes & Noble, Inc., filed as Exhibit 10.2 to Report on Form 8-K filed with the SEC on August 3, 2015, and incorporated herein by reference. | |
92
10.5 | Employee Matters Agreement, dated as of August 2, 2015, between Barnes & Noble Education, Inc. and Barnes & Noble, Inc., filed as Exhibit 10.3 to Report on Form 8-K filed with the SEC on August 3, 2015, and incorporated herein by reference. | |
10.6 | Trademark License Agreement, dated as of August 2, 2015, between Barnes & Noble Education, Inc. and Barnes & Noble, Inc., filed as Exhibit 10.4 to Report on Form 8-K filed with the SEC on August 3, 2015, and incorporated herein by reference. | |
10.7 | Barnes & Noble Education, Inc. Equity Incentive Plan, as amended September 16, 2017, filed as Appendix A to the Proxy Statement for Annual Meeting filed with the SEC on August 17, 2016, and incorporated herein by reference. | |
10.8 | Barnes & Noble Education, Inc. Form of Performance Unit Award Agreement, filed as Exhibit 10.5 to Report on Form S-1/A filed with the SEC on June 29, 2015, and incorporated herein by reference. | |
10.9 | Barnes & Noble Education, Inc. Form of Performance-Based Stock Unit Award Agreement, filed as Exhibit 10.6 to Report on Form S-1/A filed with the SEC on June 29, 2015, and incorporated herein by reference. | |
10.10 | Barnes & Noble Education, Inc. Form of Restricted Stock Unit Award Agreement, filed as Exhibit 10.7 to Report on Form S-1/A filed with the SEC on June 29, 2015, and incorporated herein by reference. | |
10.11 | Barnes & Noble Education, Inc. Form of Restricted Stock Award Agreement, filed as Exhibit 10.8 to Report on Form S-1/A filed with the SEC on June 29, 2015, and incorporated herein by reference. | |
10.12 | Barnes & Noble Education, Inc. Performance Share Award Agreement, filed as Exhibit Form 10.1 to Report on Form 10-Q filed with the SEC on September 8, 2017, and incorporated herein by reference. | |
10.13 | Amended and Restated Employment Agreement, dated June 25, 2015, between Barnes & Noble Education, Inc. and Max J. Roberts filed as Exhibit 10.9 to Report on Form S-1/A filed with the SEC on July 13, 2015, and incorporated herein by reference. | |
10.14 | Amended and Restated Employment Agreement, dated June 24, 2015, between Barnes & Noble Education, Inc. and Barry Brover filed as Exhibit 10.10 to Report on Form S-1/A filed with the SEC on July 13, 2015, and incorporated herein by reference. | |
10.15 | Amended and Restated Employment Agreement, dated June 24, 2015, between Barnes & Noble Education, Inc. and Patrick Maloney filed as Exhibit 10.11 to Report on Form S-1/A filed with the SEC on July 13, 2015, and incorporated herein by reference. | |
10.16 | Amended and Restated Employment Agreement, dated June 24, 2015, between Barnes & Noble Education, Inc. and William Maloney filed as Exhibit 10.12 to Report on Form S-1/A filed with the SEC on July 13, 2015, and incorporated herein by reference. | |
10.17 | Employment Agreement, dated June 26, 2015, between Barnes & Noble Education, Inc. and Michael P. Huseby filed as Exhibit 10.13 to Report on Form S-1/A filed with the SEC on July 13, 2015, and incorporated herein by reference. | |
10.18 | Form of Director Indemnification Agreement | |
10.19 | Retention Bonus Agreement, dated February 7, 2014, between Barnes & Noble Education, Inc. and Barry Brover | |
10.20 | Retention Bonus Agreement, dated February 7, 2014, between Barnes & Noble Education, Inc. and Patrick Maloney | |
10.21 | Retention Bonus Agreement, dated February 7, 2014, between Barnes & Noble Education, Inc. and Joel Friedman | |
Other. | ||
21.1 | List of subsidiaries of Barnes & Noble Education, Inc. | |
23.1 | Consent of Ernst & Young LLP | |
31.1 | Certification by the Chief Executive Officer pursuant to Rule 13a-14(a)/15(d)-14(a) under the Securities Exchange Act of 1934, as adopted pursuant to Section 302 of the Sarbanes-Oxley Act of 2002. | |
31.2 | Certification by the Chief Financial Officer pursuant to Rule 13a-14(a)/15(d)-14(a) under the Securities Exchange Act of 1934, as adopted pursuant to Section 302 of the Sarbanes-Oxley Act of 2002. | |
32.1 | Certification of Chief Executive Officer pursuant to Rule 13a-14(b) under the Securities Exchange Act of 1934 and 18 U.S.C. Section 1350, as adopted pursuant to Section 906 of the Sarbanes-Oxley Act of 2002. | |
93
32.2 | Certification of Chief Financial Officer pursuant to Rule 13a-14(b) under the Securities Exchange Act of 1934 and 18 U.S.C. Section 1350, as adopted pursuant to Section 906 of the Sarbanes-Oxley Act of 2002. | |
101.INS | XBRL Instance Document | |
101.SCH | XBRL Taxonomy Extension Schema Document | |
101.CAL | XBRL Taxonomy Extension Calculation Linkbase Document | |
101.DEF | XBRL Taxonomy Extension Definition Linkbase Document | |
101.LAB | XBRL Taxonomy Extension Label Linkbase Document | |
101.PRE | XBRL Taxonomy Extension Presentation Linkbase Document | |
94
SIGNATURES
Pursuant to the requirements of Section 13 or 15(d) of the Securities Exchange Act of 1934, Barnes & Noble Education, Inc. has duly caused this report to be signed on its behalf by the undersigned, thereunto duly authorized.
BARNES & NOBLE EDUCATION, INC. | ||
(Registrant) | ||
By: | /s/ Max J. Roberts | |
Max J. Roberts | ||
Chief Executive Officer | ||
Date: July 12, 2017 | ||
Pursuant to the requirements of the Securities Exchange Act of 1934, this report has been signed below by the following persons on behalf of the registrant and in the capacities and on the dates indicated.
Name | Title | Date | ||
/s/ Michael P. Huseby Michael P. Huseby | Executive Chairman and Director | July 12, 2017 | ||
/s/ Max J. Roberts Max J. Roberts | Chief Executive Officer and Director (Principal Executive Officer) | July 12, 2017 | ||
/s/ Barry Brover Barry Brover | Chief Financial Officer (Principal Financial Officer) | July 12, 2017 | ||
/s/ Seema C. Paul Seema C. Paul | Chief Accounting Officer (Principal Accounting Officer) | July 12, 2017 | ||
/s/ Daniel A. DeMatteo Daniel A. DeMatteo | Director | July 12, 2017 | ||
/s/ David G. Golden David G. Golden | Director | July 12, 2017 | ||
/s/ John R. Ryan John R. Ryan | Director | July 12, 2017 | ||
/s/ Jerry Sue Thornton Jerry Sue Thornton | Director | July 12, 2017 | ||
/s/ David A. Wilson David A. Wilson | Director | July 12, 2017 | ||
95