Attached files
| file | filename |
|---|---|
| EX-23.3 - EXHIBIT 23.3 - CANTALOUPE, INC. | ex23_3.htm |
| EX-23.1 - EXHIBIT 23.1 - CANTALOUPE, INC. | ex23_1.htm |
As filed with the Securities and Exchange Commission on July 7, 2017
REGISTRATION NO. 333-
UNITED STATES
SECURITIES AND EXCHANGE COMMISSION
Washington, D.C. 20549
FORM S-1
REGISTRATION STATEMENT UNDER THE SECURITIES ACT OF 1933
USA TECHNOLOGIES, INC.
(Exact name of registrant as specified in its charter)
|
Pennsylvania
|
7359
|
23-2679963
|
|
(State or other jurisdiction of incorporation or organization)
|
(Primary Standard Industrial Classification Code Number)
|
(I.R.S. Employer Identification No.)
|
100 Deerfield Lane, Suite 300
Malvern, Pennsylvania 19355
(610) 989-0340
(Address, including zip code, and telephone number,
including area code, of registrant’s principal executive officers)
Stephen P. Herbert
Chief Executive Officer
USA Technologies, Inc.
100 Deerfield Lane, Suite 300
Malvern, Pennsylvania 19355
(610) 989-0340
(Name, address, including zip code, and telephone number,
including area code, of agent for service)
Copies to:
|
Douglas M. Lurio, Esquire
Shaila Prabhakar, Esquire
Lurio & Associates, P.C.
2005 Market Street, Suite 3120
Philadelphia, PA 19103-7015
(215) 665-9300
|
Justin P. Klein, Esquire
Gerald J. Guarcini, Esquire
Ballard Spahr LLP
1735 Market Street, 51st Floor
Philadelphia, PA 19103
(215) 665-8500
|
Michael D. Maline, Esquire
Goodwin Procter LLP
620 Eighth Avenue
New York, NY 10018
(212) 813-8966
|
Approximate date of commencement of proposed sale to the public: As soon as practicable after the effective date of this registration statement.
If any of the securities being registered on this Form are to be offered on a delayed or continuous basis pursuant to Rule 415 under the Securities Act, check the following box. ☐
If this Form is filed to register additional securities for an offering pursuant to Rule 462(b) under the Securities Act, please check the following box and list the Securities Act registration statement number of the earlier effective registration statement for the same offering. ☐
If this Form is a post-effective amendment filed pursuant to Rule 462(c) under the Securities Act, check the following box and list the Securities Act registration statement number of the earlier effective registration statement for the same offering. ☐
If this Form is a post-effective amendment filed pursuant to Rule 462(d) under the Securities Act, check the following box and list the Securities Act registration statement number of the earlier effective registration statement for the same offering. ☐
Indicate by check mark whether the registrant is a large accelerated filer, an accelerated filer, a non-accelerated filer, a smaller reporting company or an emerging growth company. See the definitions of “large accelerated filer,” “accelerated filer,” “smaller reporting company” and "emerging growth company" in Rule 12b-2 of the Exchange Act.
|
Large accelerated filer ☐
|
Accelerated filer ☒
|
|
Non-accelerated filer ☐
|
Smaller reporting company☐
|
|
(Do not check if a smaller reporting company)
|
|
|
Emerging growth company ☐
|
If an emerging growth company, indicate by check mark if the registrant has elected not to use the extended transition period for complying with any new or revised financial accounting standards provided to Section 7(a)(2)(B) of the Securities Act. ☐
CALCULATION OF REGISTRATION FEE
|
Title of each class of Securities to be Registered
|
Proposed Maximum
Aggregate Offering
Price (1)(2)
|
Amount of
Registration Fee
|
||||||
|
Common stock, no par value
|
$
|
40,000,000
|
$
|
$4,636.00
|
||||
| (1) |
Pursuant to Rule 416 under the Securities Act, the securities registered hereunder include such indeterminate number of securities as may be issuable with respect to the securities being registered hereunder as a result of stock splits, stock dividends or similar transactions. Includes shares of common stock which may be issued upon exercise of a 30-day option granted to the underwriters to cover overallotments, if any.
|
| (2) |
Estimated solely for the purpose of calculating the registration fee in accordance with Rule 457(o) under the Securities Act of 1933, as amended.
|
The registrant hereby amends this registration statement on such date or dates as may be necessary to delay its effective date until the registrant shall file a further amendment which specifically states that this registration statement shall thereafter become effective in accordance with Section 8(a) of the Securities Act of 1933, as amended, or until the registration statement shall become effective on such date as the Securities and Exchange Commission, acting pursuant to said Section 8(a), may determine.
The information in this preliminary prospectus is not complete and may be changed. We may not sell these securities nor may offers to buy these securities be accepted until the registration statement filed with the Securities and Exchange Commission becomes effective. This preliminary prospectus is not an offer to sell these securities and it is not soliciting an offer to buy these securities in any jurisdiction where the offer or sale is not permitted.
Subject To Completion
Preliminary Prospectus Dated July 7, 2017
PROSPECTUS
Shares of Common Stock

USA TECHNOLOGIES, INC.
We are offering shares of our common stock. Our common stock is quoted on The NASDAQ Global Market under the symbol “USAT.” On July 6, 2017, the last reported sale price of our common stock was $5.10 per share.
Investing in our common stock involves risks. You should read the section entitled “Risk Factors,” beginning on page 8 of this prospectus, and all other information included in this prospectus in connection with an investment in our common stock.
Neither the Securities and Exchange Commission nor any state securities commission has approved or disapproved of these securities or passed upon the adequacy or accuracy of this prospectus. Any representation to the contrary is a criminal offense.
|
Per Share
|
Total
|
|||||||
|
Public offering price
|
$ | $ | ||||||
|
Underwriting discounts and commissions (1)
|
$ | $ | ||||||
|
Proceeds to us, before expenses
|
$ | $ | ||||||
| (1) |
See the section entitled "Underwriting," beginning on page 82 of this prospectus, for additional information regarding underwriting compensation.
|
We have granted the underwriters an option to buy up to an additional shares of common stock to cover over-allotments. The underwriters may exercise this option at any time during the 30-day period from the date of this prospectus.
The underwriters are offering the shares of common stock for sale on a firm commitment basis. The underwriters expect to deliver the shares of common stock to the purchasers on or about , 2017.
William Blair
The date of this prospectus is , 2017
| 2 | |
| 8 | |
| 18 | |
| 19 | |
| 20 | |
| Dividend Policy | 21 |
| 22 | |
| 24 | |
| 26 | |
| 28 | |
| 49 | |
| 60 | |
| 63 | |
| 76 | |
| Certain Relationships and Related Transactions | 79 |
| 80 | |
| 82 | |
| 85 | |
| 85 | |
| 85 | |
| F-1 |
You should rely only on the information contained in this prospectus and any free writing prospectus prepared by or on behalf of us or to which we have referred you. We have not, and the underwriters have not, authorized anyone to provide you with information that is different. We are offering to sell shares of our common stock, and seeking offers to buy shares of our common stock, only in jurisdictions where offers and sales are permitted. The information in this prospectus is complete and accurate only as of the date on the front cover of this prospectus, regardless of the time of delivery of this prospectus or any sale of shares of our common stock.
This prospectus and any related free writing prospectus, if any, do not constitute an offer to sell or the solicitation of an offer to buy any securities other than the registered securities to which they relate, nor do this prospectus or any related free writing prospectus, if any, constitute an offer to sell or the solicitation of an offer to buy securities in any jurisdiction to any person to whom it is unlawful to make such offer or solicitation in such jurisdiction. You should not assume that the information contained in this prospectus, or any related free writing prospectus is accurate on any date subsequent to the date set forth on the front of the document, even though this prospectus or any related free writing prospectus is delivered or the applicable securities are sold on a later date.
Except as otherwise indicated herein or as the context otherwise requires, references in this prospectus to “USA Technologies,” “USAT,” the “Company,” “we,” “us,” “our” and similar references refer to USA Technologies, Inc. USA Technologies® and our other logos and trademarks are the property of USA Technologies, Inc. All other trademarks, registered marks and trade names appearing in this prospectus are the property of their respective holders. Our use or display of other parties’ trademarks, trade dress or products in this prospectus does not imply that we have a relationship with, or the endorsement or sponsorship of, the trademark or trade dress owners.
This prospectus summary contains basic information about us and this offering. Because it is a summary, it does not contain all of the information that you should consider before deciding whether or not you should purchase shares of our common stock. Therefore, you should read the entire prospectus carefully, especially the sections entitled “Risk Factors,” “Selected Consolidated Financial Data and Other Data” and “Management’s Discussion and Analysis of Financial Condition and Results of Operations,” and our financial statements and the related notes appearing at the end of this prospectus, before deciding to invest in our common stock. The following summary is qualified in its entirety by reference to the detailed information appearing elsewhere in this registration statement.
Our Company
USA Technologies, Inc. (the “Company,” “we,” “USAT,” or “our”) provides wireless networking, cashless transactions, asset monitoring, and other value-added services principally to the small ticket, unattended Point of Sale (“POS”) market. Our ePort technology can be installed and/or embedded into everyday devices such as vending machines, a variety of kiosks, amusement games, and commercial laundry via either our ePort hardware or our Quick Connect solution. Our associated service, ePort Connect, is a Payment Card Industry Data Security Standard (PCI DSS)-compliant, comprehensive service that includes simplified credit card processing and support, consumer engagement services as well as telemetry, Internet of Things (“IoT”) and machine-to-machine (“M2M”) services, including the ability to remotely monitor, control, and report on the results of distributed assets containing our electronic payment solutions.
We are a leading provider in the small ticket, beverage and food vending industry and are expanding our solutions and services to other unattended market segments, such as amusement, commercial laundry, kiosk and others. Historically, these distributed assets have relied on cash for payment in the form of coins or bills, whereas, our systems allow them to accept cashless payments through the use of credit or debit cards or other emerging contactless forms, such as mobile payment.
We generate revenue from the sale of equipment and from license and transaction fees. During the fiscal year ended June 30, 2016, we derived 73.0% of our revenues from recurring license and transaction fees related to our ePort Connect service and 27.0% of our revenue from equipment sales. Connections to our service stem from the sale or lease of our POS electronic payment devices or certified payment software or the servicing of similar third-party installed POS terminals. Connections to the ePort Connect service are the most significant driver of the our revenues, particularly the recurring revenues from license and transaction fees. We believe that our service-approach business model, including our value added services, could create a high-margin stream of recurring revenues that could create a foundation for long-term value and continued growth.
Our Industry
We operate primarily in the unattended POS market. Our solutions and services facilitate electronic payments in industries that have traditionally relied on cash transactions. We believe the following industry trends are driving growth in demand for electronic payment systems in general and more specifically within the markets we serve:
Shift toward electronic payment transactions and away from cash and checks. There has been an ongoing shift away from paper-based methods of payment, including cash and checks, towards electronic-based methods of payment. According to The Nilson Report, December 2015, paper-based methods of payment continued to decline in 2014, representing 28.07% of transaction dollars measured compared to 30.61% in 2013. The four card-based systems—credit, debit, prepaid, and electronic benefits transfer—generated $5.29 trillion in the United States in 2014, 57.34% of transaction dollars measured, compared to 42.3% in 2006. The Nilson Report projects that, by 2019, spending at merchants in the U.S. from the four card-based systems will grow to 67.03% of total transaction dollars measured.
Increase in Consumer Demand for Electronic Payments. The unattended, vending and kiosk POS market has historically been dominated by cash purchases. We believe electronic payment system providers such us that can meet consumers’ demand within the unattended market will be able to offer retailers, card associations, card issuers and payment processors and business owners an expanding value proposition at the POS.
Increase in Merchant/Operator Demand for Electronic Payments. We believe that, increasingly, merchants and operators of unattended payment locations (e.g., vending machines, laundry, tabletop games, etc.) are utilizing electronic payment alternatives as a means to improve business results. We work with our customers to help them drive increased revenue of their distributed assets through this expanded market opportunity. In addition, electronic payment systems can provide merchants and operators real-time sales and inventory data utilized for back-office reporting and forecasting, like our solutions and services, helping them to manage their business more efficiently.
Increase in Demand for Integrated Payment Solutions. We believe that merchant have come to value payment solutions that are integrated or bundled with other solutions and software. Offering an integrated solution allows us to provide a single source solution for our products and results in better customer retention, less focus on price and a better overall experience for our customers. We also view our integrated solutions as a significant competitive advantage as competitors will need fully integrated solutions to compete.
Increase in Demand for Networked Assets. Machine-to-machine (“M2M”) technology includes capturing value from wireless modules and electronic devices to improve business productivity and customer service. In addition, networked assets can provide valuable information regarding consumers’ purchasing patterns and payment preferences, allowing operators to more effectively tailor their offerings to consumers. Gartner, Inc. forecasts that 6.4 billion connected things will be in use worldwide in 2016, with 5.5 million new things getting connected every day, and will reach 20.8 billion by 2020.
POS Technology and NFC Equipped Mobile Phone Payment Improvements. Near Field Communication (“NFC”) is a short range wireless connectivity technology that uses electromagnetic radio fields to enable communication between devices when there is a physical touch, or when they are within close proximity to one another. We believe that POS contactless terminals that are enabled to accept NFC payments and digital wallet applications, such as Google Wallet, Chase Pay, Apple Pay, the recently introduced Android Pay, and others, stand to benefit from these evolving trends in mobile payment. Digital wallet is essentially a digital service, accessed via the web or a mobile phone application that serves as a substitute for the traditional credit or debit card. Providers can also market directly to targeted consumers with coupons and loyalty programs. With over 70% of our connections contactless enabled to accept NFC payments (in addition to magnetic stripe cards) as of June 30, 2016, we believe that we are well-positioned to benefit from this emerging space.
Our Connection Base
As of June 30, 2016 and March 31, 2017, we had 429,000 and 504,000 connections, respectively, to our ePort Connect service. These connections represented a 29% and 25.7% increase from connections as of June 30, 2015 and March 31, 2016, respectively. During the fiscal year ended June 30, 2016, we processed approximately 316 million cashless transactions totaling approximately $584 million in transaction dollars, representing a 46% increase in transaction volume and a 50% increase in dollars processed during the previous fiscal year ended June 30, 2015.
As of March 31, 2017, we had approximately 12,400 customers. Our customers range from global food service organizations to small businesses that operate primarily in the self-serve, small ticket retail markets including beverage and food vending, amusement and arcade machines, smartphones via our ePort Online solution, commercial laundry, tolls, and various other self-serve kiosk applications as well as equipment developers or manufacturers who incorporate our ePort Connect service into their product offerings.
Our customers can obtain POS electronic payment devices from us in the following ways:
| · |
Purchasing devices directly from our or one of our authorized resellers;
|
| · |
Financing devices under the Company’s QuickStart Program, which are non-cancellable sixty month sales-type leases, through an unrelated equipment financing company, if available, or directly from the Company; and
|
| · |
Renting devices under our JumpStart Program, which are cancellable month-to-month operating leases.
|
Our Solutions
Our solutions and services have been designed to simplify the transition to cashless for traditionally cash-only based businesses. As such, they are turn-key and include our comprehensive ePort Connect service and POS electronic payment devices or certified payment software, which are able to process traditional magnetic stripe credit and debit cards, contactless credit and debit cards and mobile payments. Standard services through ePort Connect are maintained on our proprietary operating systems and include merchant account setup on behalf of the customer, automatic processing and settlement, sales reporting and 24x7 customer support. Other value-added services that customers can choose from include things such as cashless deployment planning, cashless performance review and loyalty products and services. Our solutions also provide flexibility to execute a variety of payment applications on a single system, transaction security, connectivity options, compliance with certification standards, and centralized, accurate, real-time sales and inventory data to manage distributed assets (wireless telemetry and M2M).
Our ePort® Interactive is a cloud-based interactive media and content delivery management system that provides enhanced vendor management system (VMS) integration and consumer product information, including nutritional data. The technology is NFC enabled and compatible with mobile wallets including Apple Pay and Android Pay, and supports instant refunds, couponing, advertising and real-time consumer feedback to the owner and operator.
Our Competitive Strengths
We believe that we benefit from a number of advantages gained through our nearly twenty-five year history in our industry. They include:
| · |
One-Stop Shop, End-to-End Solution. We offer our customers one point of contact through a bundled cashless payment solution.
|
| · |
Trusted Brand Name. Our ePort Connect solution has a strong national reputation for quality, reliability, and innovation.
|
| · |
Market Leadership. With 504,000 connections to our network, we believe we have the largest installed base of unattended POS electronic payment systems in the unattended small ticket retail market for food and beverage and we are continuing to expand to other adjacent markets.
|
| · |
Attractive Value Proposition for Our Customers. We believe that our solutions provide our customers an attractive value proposition by reducing costs, improve operating efficiencies, and increasing the purchases of their consumers machines.
|
| · |
Increasing Scale and Financial Stability. During the 2016 fiscal year, 73% of our revenues came from licensing and processing fees which are recurring in nature.
|
| · |
Customer-Focused Research and Development. We have generated considerable intellectual property and know-how with 73 patents (US and International) as of June 30, 2017.
|
Our Growth Opportunity
Our primary objective is to continue to enhance our position as a leading provider of technology that enables electronic payment transactions and value-added services. We plan to execute this growth strategy organically and through strategic acquisitions. Key elements of our strategy are to:
| · |
Leverage and further penetrate our existing customers/partners
|
| · |
Expand distribution and sales reach
|
| · |
Further penetrate attractive adjacent markets
|
| · |
Capitalize on opportunities in international markets
|
| · |
Capitalize on the emerging NFC and growing mobile payments trends
|
| · |
Continuously enhance our solutions and services through innovation
|
| · |
Provide comprehensive service and support
|
| · |
Leverage intellectual property consisting of 73 U.S. and foreign patents
|
Our Acquisition Strategy
We have historically, and expect to continue to, drive growth in connections and expand the value of our services through strategic acquisitions of businesses, products, or technologies. We intend to pursue acquisitions of businesses that are accretive and complementary to our current product and service offerings by broadening our customer base, expanding our geographic footprint, and acquiring strategic technologies or otherwise complementing our current or future business.
Risk Factors Associated with our Business
Our business is subject to numerous risks and uncertainties, including those highlighted in the section captioned “Risk Factors” immediately following this prospectus summary. These risks include, among others, the following:
| · |
We have a history of losses since inception and if we continue to incur losses, the price of our shares can be expected to fall.
|
| · |
Our products may fail to gain substantial increased market acceptance. As a result, we may not generate sufficient revenues or profit margins to achieve our financial objectives or growth plans.
|
| · |
The loss of one or more of our key customers could significantly reduce our revenues, results of operations, and net income.
|
| · |
Competition from others could prevent us from increasing revenue and achieving our growth plans.
|
| · |
Substantially all of the network service contracts with our customers are terminable for any or no reason upon thirty to sixty days’ advance notice.
|
| · |
Our products and services may be vulnerable to security breach.
|
| · |
Failure to maintain effective systems of internal control over financial reporting and disclosure controls and procedures could cause a loss of confidence in our financial reporting and adversely affect the trading price of our common stock.
|
Corporate Information
We were incorporated in the Commonwealth of Pennsylvania in 1992. Our principal executive offices are located at 100 Deerfield Lane, Suite 300, Malvern, Pennsylvania 19355, and our phone number is (610) 989-0340. Additional information regarding our company, including our audited financial statements and description of our business, is contained in this prospectus. See “Where You Can Find More Information.” Our web site is www.usatech.com. Information on our website is not incorporated in this prospectus and is not a part of this prospectus.
|
Summary of This Offering
|
|
|
Securities Offered
|
shares of common stock (or shares of common stock if the underwriters exercise their over-allotment option in full).
|
|
Over-allotment option
|
The underwriters have an option for a period of 30 days after the date of this prospectus to purchase up to an additional shares of common stock, on the same terms and conditions as set forth above, to cover any over-allotments.
|
|
Shares Outstanding after
Completion of this
Offering
|
shares of our common stock will be outstanding ( shares if the underwriters exercise their option to purchase additional shares in full). These amounts exclude series A convertible preferred stock and outstanding options and warrants convertible into or exercisable for shares of common stock. |
|
Use of Proceeds
|
The proceeds from this offering, less fees and expenses incurred by us in connection with the offering, are intended to be used for general corporate purposes and working capital to support anticipated growth. These purposes may include, among other things, future acquisitions of businesses, products and technologies, or establishing strategic alliances that we believe will complement our current or future business. See “Use of Proceeds” for a more complete description of the intended use of proceeds from this offering.
|
|
Risk Factors
|
You should read the “Risk Factors” section beginning on page 8 and other information included in this prospectus for a discussion of factors you should carefully consider before investing in our securities.
|
|
Trading Symbol
|
Our common stock is quoted on The NASDAQ Global Market under the symbol “USAT.”
|
The number of shares of common stock to be outstanding after this offering is based on 40,331,645 shares of common stock outstanding as of June 30, 2017, and excludes, in each case as of such date:
| · |
23,978 shares of common stock underlying warrants issued by the Company to our bank lender at an exercise price of $5.00 per share in connection with the loan agreement;
|
| · |
(i) 198,000 shares of common stock issuable upon the exercise of outstanding stock options issued under the 2015 Equity Incentive Plan, and (ii) 715,220 shares of common stock issuable upon the exercise of outstanding stock options issued under the 2014 Stock Option Incentive Plan;
|
| · |
(i) 1,052,000 shares of common stock reserved for issuance under the 2015 Equity Incentive Plan, (ii) 1,447 shares of common stock underlying stock options reserved for issuance under the 2014 Stock Option Incentive Plan, and (iii) 9,004 shares of common stock reserved for issuance under the Company’s 2013 Stock Incentive Plan;
|
| · |
100,333 shares issuable upon the conversion of outstanding preferred stock and cumulative preferred stock dividends; and
|
| · |
140,000 shares issuable to our former chief executive officer upon the occurrence of certain fundamental transactions involving the Company.
|
Summary Financial Data and Other Data
The following tables summarize our financial data and should be read together with the sections in this prospectus entitled “Selected Consolidated Financial Data and Other Data” and “Management’s Discussion and Analysis of Financial Condition and Results of Operations” and our consolidated financial statements and related notes included elsewhere in this prospectus.
We have derived the summary condensed consolidated statement of operations data for the years ended June 30, 2016 and 2015 from our audited consolidated financial statements included elsewhere in this prospectus. We have derived the summary consolidated statement of operations data for the nine months ended March 31, 2017 and the summary condensed consolidated balance sheet data as of March 31, 2017 from our unaudited interim consolidated financial statements included elsewhere in this prospectus.
We have prepared the unaudited interim consolidated financial statements on the same basis as the audited consolidated financial statements and have included, in our opinion, all adjustments, consisting only of normal recurring adjustments, that we consider necessary for a fair statement of the financial information set forth in those statements. Our historical results are not necessarily indicative of the results that should be expected in the future, and interim results are not necessarily indicative of the results that should be expected for the full year or any other period.
|
Nine Months
Ended
March 31,
2017
|
As of and for the
Year ended June 30,
|
|||||||||||
|
($ in thousands, except per share data and as otherwise noted)
|
2016
|
2015
|
||||||||||
|
OPERATIONS DATA:
|
||||||||||||
|
Revenues
|
$
|
69,804
|
$
|
77,408
|
$
|
58,077
|
||||||
|
Operating income (loss)
|
$
|
(297
|
)
|
$
|
(1,467
|
)
|
$
|
(240
|
)
|
|||
|
Net Income (loss)
|
$
|
(2,095
|
)
|
$
|
(6,806
|
)
|
$
|
(1,089
|
)
|
|||
|
Cumulative preferred dividends
|
(668
|
)
|
(668
|
)
|
(668
|
)
|
||||||
|
Net income (loss) applicable to common shares
|
$
|
(2,763
|
)
|
$
|
(7,474
|
)
|
$
|
(1,757
|
)
|
|||
|
Net earnings (loss) per common share - basic and diluted (1)
|
$
|
(0.07
|
)
|
$
|
(0.21
|
)
|
$
|
(0.05
|
)
|
|||
|
Cash dividends per common share
|
-
|
-
|
-
|
|||||||||
|
BALANCE SHEET DATA:
|
||||||||||||
|
Total assets
|
$
|
88,992
|
$
|
84,833
|
$
|
75,134
|
||||||
|
Long-term debt
|
$
|
1,239
|
$
|
1,576
|
$
|
1,854
|
||||||
|
Shareholders’ equity
|
$
|
64,999
|
$
|
55,025
|
$
|
53,311
|
||||||
|
CASH FLOW DATA:
|
||||||||||||
|
Net cash provided by (used in) operating activities
|
$
|
(4,295
|
)
|
$
|
6,468
|
$
|
(1,698
|
)
|
||||
|
Net cash provided by (used in) investing activities
|
(2,713
|
)
|
(5,772
|
)
|
3,354
|
|||||||
|
Net cash provided by (used in) financing activities
|
5,516
|
7,202
|
646
|
|||||||||
|
Net increase (decrease) in cash and cash equivalents
|
(1,492
|
)
|
7,898
|
2,302
|
||||||||
|
Cash and cash equivalents at beginning of period
|
19,272
|
11,374
|
9,072
|
|||||||||
|
Cash and cash equivalents at end of period
|
$
|
17,780
|
$
|
19,272
|
$
|
11,374
|
||||||
|
CONNECTIONS AND TRANSACTION DATA (UNAUDITED):
|
||||||||||||
|
Net New Connections #
|
75,000
|
96,000
|
67,000
|
|||||||||
|
Total Connections #
|
504,000
|
429,000
|
333,000
|
|||||||||
|
New Customers Added #
|
1,350
|
1,450
|
2,300
|
|||||||||
|
Total Customers #
|
12,400
|
11,050
|
9,600
|
|||||||||
|
Total Number of Transactions (millions)
|
300.2
|
315.8
|
216.6
|
|||||||||
|
Transaction Volume (millions) #
|
577.3
|
584.4
|
388.9
|
|||||||||
|
(1)
|
See note 2 to our consolidated financial statements appearing elsewhere in this prospectus for a description of the method used to calculate basic and diluted net income (loss) per share of common stock.
|
Investing in our common stock involves risks. Before making an investment decision, please carefully review the risks described below, together with all other information in this prospectus, and in any free writing prospectus that we have authorized for use in connection with this offering. The occurrence of any of those risks could materially and adversely affect our business, prospects, financial condition, results of operations or cash flow. Other risks and uncertainties that we do not now consider to be material or of which we are not now aware may become important factors that affect us in the future. Any of these risks could cause the trading price of our common stock to decline, resulting in a loss of all or part of your investment. Please also read carefully the section entitled “Special Note Regarding Forward-Looking Statements.”
Risks Relating to Our Business
We have a history of losses since inception and if we continue to incur losses, the price of our shares can be expected to fall.
We experienced losses from inception through June 30, 2012, with net income for the years ended June 30, 2013 and June 30, 2014. However, we experienced losses for the fiscal years 2015 and 2016, and continued profitability is not assured. From our inception through June 30, 2016, our cumulative losses from operations are approximately $181 million. Until the Company’s products and services can generate sufficient annual revenues, the Company will be required to use its cash and cash equivalents on hand, its line of credit, and may raise capital to meet its cash flow requirements including the issuance of common stock or debt financing. For the years ended June 30, 2016 and 2015, we incurred a net loss of $6.8 million and $1.1 million, respectively. If we continue to incur losses in the future, the price of our common stock can be expected to fall.
The occurrence of material unanticipated expenses may require us to divert our cash resources from achieving our business plan, adversely affecting our financial performance and resulting in the decline of our stock price.
In the event we incur any material unanticipated expenses, we may be required to divert our cash resources from our operating activities in order to fund any such expenses. Any such occurrence may cause our anticipated connections, revenues, gross profits, and other financial metrics for the 2017 fiscal year and beyond to be materially adversely affected. In such event, the price of our common stock could be expected to fall.
The inability of our customers to utilize third party leasing companies under our QuickStart program would materially adversely affect our cash generated from operating activities and/or attaining our business plan.
The use of third party leasing companies by our customers under our QuickStart program positively affects our net cash provided by operating activities because we receive the purchase price from the leasing company at the time of the sale. There can be no assurance that we will be able to obtain such third party leasing companies. To the extent that third party leasing companies would not be available, we would lease the equipment directly to our customers. In such event, our net cash from operating activities would be adversely affected and we may be required to incur additional equity or debt financing to fund operations. In the alternative, we would not be able to attain our business plan, including anticipated connections and revenues.
We may require additional financing or find it necessary to raise capital to sustain our operations and without it we may not be able to achieve our business plan.
At March 31, 2017, we had net working capital of $11.9 million. We had net cash provided by operating activities of $6.5 million, $(1.7) million and $7.1 million for the fiscal years ended June 30, 2016, 2015 and 2014, respectively. Although we believe that we have adequate existing resources to provide for our funding requirements over the next 12 months, there can be no assurances that we will be able to continue to generate sufficient funds thereafter. Unless we maintain or grow our current level of operations, we may need additional funds to continue these operations. We may also need additional capital to update our technology or respond to unusual or unanticipated non-operational events. Should the financing that we require to sustain our working capital needs be unavailable or prohibitively expensive when we require it, the consequences could have a material adverse effect on our business, operating results, financial condition and prospects.
Our future operating results may fluctuate.
Our future operating results will depend significantly on our ability to continue to drive revenues from license and transaction fees and our ability to develop and commercialize new products and services. Our operating results may fluctuate based upon many factors, including:
| ● |
fluctuations in revenue generated by our business;
|
| ● |
fluctuations in operating expenses;
|
| ● |
our ability to establish or maintain effective relationships with significant partners and suppliers on acceptable terms;
|
| ● |
the amount of debit or credit card interchange rates that are charged by Visa and MasterCard;
|
| ● |
the fees that we charge our customers for processing services;
|
| ● |
the successful operation of our network;
|
| ● |
the commercial success of our customers, which could be affected by such factors as general economic conditions;
|
| ● |
the level of product and price competition;
|
| ● |
the timing and cost of, and our ability to develop and successfully commercialize, new or enhanced products and services;
|
| ● |
activities of, and acquisitions or announcements by, competitors;
|
| ● |
the impact from any impairment of inventory, goodwill, fixed assets or intangibles;
|
| ● |
the impact of any changes of valuation allowance on deferred tax assets;
|
| ● |
the ability to increase the number of customer connections to our network;
|
| ● |
marketing programs which delay realization by us of monthly service fees on our new connections;
|
| ● |
the material breach of security of any of the Company’s systems or third party systems utilized by the Company; and
|
| ● |
the anticipation of and response to technological changes.
|
Our products may fail to gain substantial increased market acceptance. As a result, we may not generate sufficient revenues or profit margins to achieve our financial objectives or growth plans.
There can be no assurances that demand for our products will be sufficient to enable us to generate sufficient revenue or become profitable on a sustainable basis. Likewise, no assurance can be given that we will be able to have a sufficient number of ePorts® connected to our network or sell or lease equipment utilizing our network to enough locations to achieve significant revenues. Alternatively, the locations which utilize the network may not be successful locations and our revenues would be adversely affected. We may lose locations utilizing our products to competitors, or may not be able to install our products at competitors’ locations, or may not obtain future locations which would be obtained by our competitors. In addition, there can be no assurance that our products could evolve or be improved to meet the future needs of the marketplace. In any such event, we may not be able to achieve our growth plans, including anticipated connections and revenue growth.
We may be required to incur further debt to meet future capital requirements of our business. Should we be required to incur additional debt, the restrictions imposed by the terms of such debt could adversely affect our financial condition and our ability to respond to changes in our business.
If we incur additional debt, we may be subject to the following risks:
| ● |
our vulnerability to adverse economic conditions and competitive pressures may be heightened;
|
| ● |
our flexibility in planning for, or reacting to, changes in our business and industry may be limited;
|
| ● |
our debt covenants may affect our flexibility in planning for, and reacting to, changes in the economy and in our industry;
|
| ● |
a high level of debt may place us at a competitive disadvantage compared to our competitors that are less leveraged and therefore, may be able to take advantage of opportunities that our indebtedness would prevent us from pursuing;
|
| ● |
the covenants contained in the agreements governing our outstanding indebtedness may limit our ability to borrow additional funds, dispose of assets and make certain investments;
|
|
●
|
a significant portion of our cash flows could be used to service our indebtedness;
|
| ● |
we may be sensitive to fluctuations in interest rates if any of our debt obligations are subject to variable interest rates; and
|
| ● |
our ability to obtain additional financing in the future for working capital, capital expenditures, acquisitions, general corporate purposes or other purposes may be impaired.
|
We cannot assure you that our leverage and such restrictions will not materially and adversely affect our ability to finance our future operations or capital needs or to engage in other business activities. In addition, we cannot assure you that additional financing will be available when required or, if available, will be on terms satisfactory to us.
Our bank borrowing agreement contains restrictions which may limit our flexibility in operating and growing our business.
Our bank borrowing agreement contains covenants regarding our maintenance of a minimum quarterly adjusted EBITDA as defined in our loan agreement and certain numbers of connections. Our loan agreement also includes covenants that limit our ability to engage in specified types of transactions, including among other things:
| · |
incur additional indebtedness or issue equity;
|
| · |
pay dividends on, repurchase or make distributions in respect of our common stock;
|
| · |
make certain investments (including acquisitions) and distributions;
|
| · |
sell certain assets;
|
| · |
create liens;
|
| · |
consolidate, merge, sell or otherwise dispose of all or substantially all of our assets;
|
| · |
enter into certain transactions with respect to our affiliates;
|
| · |
ability to enter into business combinations; and
|
| · |
certain other financial and non-financial covenants.
|
We were in compliance with these covenants as of March 31, 2017. Failure to be in compliance with these covenants could result in an event of default which, if not cured or waived, could result in the acceleration of all or a portion of our outstanding indebtedness, which would have a material adverse effect on our business, financial condition and results of operations.
The loss of one or more of our key customers could significantly reduce our revenues, results of operations, and net income.
We have derived, and believe we may continue to derive, a significant portion of our revenues from one large customer or a limited number of large customers. Customer concentrations for the years ended June 30, 2016, 2015 and 2014 were as follows:
|
2016
|
2015
|
2014
|
||||||||||
|
Trade account and finance receivables - one customer
|
18
|
%
|
35
|
%
|
22
|
%
|
||||||
|
License and transaction processing revenues - one customer
|
16
|
%
|
21
|
%
|
26
|
%
|
||||||
|
Equipment sales revenue - one customer
|
28
|
%
|
17
|
%
|
< 10
|
% | ||||||
Our customers may buy less of our products or services depending on their own technological developments, end-user demand for our products and internal budget cycles. A major customer in one year may not purchase any of our products or services in another year, which may negatively affect our financial performance. We have offered, and may in the future offer, discounts to our large customers to incentivize them to continue to utilize our products and services. If we are required to sell products to any of our large customers at reduced prices or unfavorable terms, our results of operations and revenue could be materially adversely affected. Further, there is no assurance that our customers will continue to utilize our transaction processing and related services as our customer agreements are generally cancelable by the customer on thirty to sixty days’ notice.
We depend on our key personnel and, if they leave us, our business could be adversely affected.
We are dependent on key management personnel, particularly the Chairman and Chief Executive Officer, Stephen P. Herbert. The loss of services of Mr. Herbert or other officers could dramatically affect our business prospects. Our executive officers and certain of our officers and employees are particularly valuable to us because:
| ● |
they have specialized knowledge about our company and operations;
|
| ● |
they have specialized skills that are important to our operations; or
|
| ● |
they would be particularly difficult to replace.
|
We have entered into an employment agreement with Mr. Herbert, which contains confidentiality and non-compete provisions. The agreement provided for an initial term continuing through January 1, 2013, which is automatically renewed for consecutive one year periods unless terminated by either Mr. Herbert or the Company upon at least 90 days’ notice prior to the end of the initial term or any one-year extension thereof.
We also may be unable to retain other existing senior management, sales personnel, and development and engineering personnel critical to our ability to execute our business plan, which could result in harm to key customer relationships, loss of key information, expertise or know-how and unanticipated recruitment and training costs.
Our dependence on proprietary technology and limited ability to protect our intellectual property may adversely affect our ability to compete.
Challenge to our ownership of our intellectual property could materially damage our business prospects. Our technology may infringe upon the proprietary rights of others. Our ability to execute our business plan is dependent, in part, on our ability to obtain patent protection for our proprietary products, maintain trade secret protection and operate without infringing the proprietary rights of others.
Through June 30, 2017, we had 14 pending United States and foreign patent applications, and will consider filing applications for additional patents covering aspects of our future developments, although there can be no assurance that we will do so. In addition, there can be no assurance that we will maintain or prosecute these applications. The United States Government and other countries have granted us 95 patents as of June 30, 2017. There can be no assurance that:
| ● |
any of the remaining patent applications will be granted to us;
|
| ● |
we will develop additional products that are patentable or do not infringe the patents of others;
|
| ● |
any patents issued to us will provide us with any competitive advantages or adequate protection for our products;
|
| ● |
any patents issued to us will not be challenged, invalidated or circumvented by others; or
|
| ● |
any of our products would not infringe the patents of others.
|
If any of our products or services is found to have infringed any patent, there can be no assurance that we will be able to obtain licenses to continue to manufacture, use, sell, and license such product or service or that we will not have to pay damages and/or be enjoined as a result of such infringement. Even if a patent application is granted for any of our products, there can be no assurance that the patented technology will be a commercial success or result in any profits to us.
If we are unable to adequately protect our proprietary technology or fail to enforce or prosecute our patents against others, third parties may be able to compete more effectively against us, which could result in the loss of customers and our business being adversely affected. Patent and proprietary rights litigation entails substantial legal and other costs, and diverts Company resources as well as the attention of our management. There can be no assurance we will have the necessary financial resources to appropriately defend or prosecute our intellectual property rights in connection with any such litigation.
Competition from others could prevent the Company from increasing revenue and achieving its growth plans.
While we are a leading provider and believe we have the largest installed base of unattended POS electronic payment systems in the small ticket, beverage and food vending industry, our competitors are increasingly and actively marketing products and services that compete with our products and services in this vending space. The competition includes manufacturers who may include in their new vending machines their own (or another third party’s) cashless payment systems and services other than our systems and services. While we believe our products and services are superior to our competitors, many of our competitors are much larger enterprises and have substantially greater revenues. In addition to these competitors, there are also numerous credit card processors that offer card processing services to traditional retail establishments that could decide to offer similar services to the industries that we serve. Competition from other companies, including those that are well established and have substantially greater resources, may reduce our profitability or reduce our business opportunities. Competition may result in lower profit margins on our products or may reduce potential profits or result in a loss of some or all of our customer base. To the extent that our competitors are able to offer more attractive technology, our ability to compete could be adversely affected.
The termination of any of our relationships with third parties upon whom we rely for supplies and services that are critical to our products could adversely affect our business and delay achievement of our business plan.
We depend on arrangements with third parties for a variety of component parts used in our products. We have contracted with various suppliers to assist us to develop and manufacture our ePort® products. For other components, we do not have supply contracts with any of our third-party suppliers and we purchase components as needed from time to time. We have contracted with a third-party data system recovery vendor to host our network in a secure, 24/7 environment to ensure the reliability of our network services. We also have contracted with multiple land-based telecommunications providers to ensure the reliability of our land-based network. If these business relationships are terminated, the implementation of our business plan may be delayed until an alternative supplier or service provider can be retained. If we are unable to find another source or one that is comparable, the content and quality of our products could suffer and our business, operating results and financial condition could be harmed.
A disruption in the manufacturing capabilities of our third-party manufacturers, suppliers or distributors would negatively impact our ability to meet customer requirements.
We depend upon third-party manufacturers, suppliers and distributors to deliver components free from defects, competitive in functionality and cost, and in compliance with our specifications and delivery schedules. Since we generally do not maintain large inventories of our products or components, any termination of, or significant disruption in, our manufacturing capability or our relationship with our third-party manufacturers or suppliers may prevent us from filling customer orders in a timely manner.
We have occasionally experienced, and may in the future experience, delays in delivery of products and delivery of products of inferior quality from third-party manufacturers. Although alternate manufacturers and suppliers are generally available to produce our products and product components, the number of manufacturers or suppliers of some of our products and components is limited, and a qualified replacement manufacturer or supplier could take several months. In addition, our use of third-party manufacturers reduces our direct control over product quality, manufacturing timing, yields and costs. Disruption of the manufacture or supply of our products and components, or a third-party manufacturer’s or supplier’s failure to remain competitive in functionality, quality or price, could delay or interrupt our ability to manufacture or deliver our products to customers on a timely basis, which would have a material adverse effect on our business and financial performance.
Substantially all of the network service contracts with our customers are terminable for any or no reason upon thirty to sixty days’ advance notice.
Substantially all of our customers may terminate their network service contracts with us for any or no reason upon providing us with thirty or sixty days’ advance notice. Accordingly, consistent demand for and satisfaction with our products by our customers is critical to our financial condition and future success. Problems, defects, or dissatisfaction with our products or services or competition in the marketplace could cause us to lose a substantial number of our customers with minimal notice. If a substantial number of our customers were to exercise their termination rights, it would result in a material adverse effect to our business, operating results, and financial condition.
Our reliance on our wireless telecommunication service provider exposes us to a number of risks over which we have no control, including risks with respect to increased prices and termination of essential services.
The operation of our wireless networked devices depends upon the capacity, reliability and security of services provided to us by our wireless telecommunication services providers, AT&T Mobility and Verizon Wireless. We have no control over the operation, quality or maintenance of these services or whether the vendor will improve or reduce its services or continue to provide services that are essential to our business. In addition, subject to our existing contracts with them, our wireless telecommunication services providers may increase their prices, which would increase our costs. If our wireless telecommunication services providers were to cease to provide essential services or to significantly increase prices, we could be required to find alternative vendors for these services. With a limited number of vendors, we could experience significant delays in obtaining new or replacement services, which could lead to slowdowns or failures of our network. In addition, we may have to replace our existing ePort® devices that are already installed in the marketplace and which are utilizing the existing vendor’s services. This could significantly harm our reputation and could cause us to lose customers and revenues.
We may not be able to adapt to changing technology and our customers’ technology needs.
We face rapidly changing technology and frequent new service offerings that can render existing services obsolete or unmarketable. Our future depends, in part, on our ability to enhance existing services and to develop, introduce and market, on a timely and cost effective basis, new services that keep pace with technological developments and customer requirements. Developing new products and technologies is a complex, uncertain process requiring innovation and accurate anticipation of technological and market trends. When changes to the product line are announced, we will be challenged to manage possible shortened life cycles for existing products and continue to sell existing products. Our inability to respond effectively to any of these challenges may have a material adverse effect on our business and financial success.
Security is vital to our customers and therefore breaches in the security of transactions involving our products or services could adversely affect our reputation and results of operations.
Protection against fraud is of key importance to purchasers and end-users of our products. We incorporate security features, such as encryption software and secure hardware, into our products to protect against fraud in electronic payment transactions and to ensure the privacy and integrity of consumer data. We design and test our products to industry security standards and our products and methodologies are under periodic review and improvement. Our products and services and third party products and services that are utilized by us may be vulnerable to breaches in security due to defects in our security mechanisms, the operating system and applications in our hardware platform. Security vulnerabilities could jeopardize the security of information transmitted or stored using our products. If the security of the information in our products is compromised, our reputation and marketplace acceptance of our products will be adversely affected, which would adversely affect our results of operations, and subject us to potential liability. If our security applications are breached and sensitive data is lost or stolen, we could incur significant costs to not only assess and repair any damage to our systems, but also to reimburse customers for losses that occur from the fraudulent use of the data. We may also be subject to fines and penalties from the credit card associations in the event of the loss of confidential card information.
Our products and services may be vulnerable to security breach.
Credit card issuers have promulgated credit card security guidelines as part of their ongoing efforts to battle identity theft and credit card fraud. We continue to work with credit card issuers to assure that our products and services comply with these rules. There can be no assurances, however, that our products and services or third party products and services utilized by us are invulnerable to unauthorized access or hacking. When there is unauthorized access to credit card data that results in financial loss, there is the potential that parties could seek damages from us, and our business reputation and results of operations would be materially adversely affected.
If we fail to adhere to the standards of the Visa and MasterCard credit card associations, our registrations with these associations could be terminated and we could be required to stop providing payment processing services for Visa and MasterCard.
Substantially all of the transactions handled by our network involve Visa or MasterCard. If we fail to comply with the applicable requirements of the Visa and MasterCard credit card associations, Visa or MasterCard could suspend or terminate our registration with them. The termination of our registration with them or any changes in the Visa or MasterCard rules that would impair our registration with them could require us to stop providing payment processing services through our network. In such event, our business plan and/or competitive advantages in the market place would be materially adversely affected.
We rely on other card payment processors; if they fail or no longer agree to provide their services, our customer relationships could be adversely affected and we could lose business.
We rely on agreements with other large payment processing organizations, primarily Chase Paymentech, to enable us to provide card authorization, data capture, settlement and merchant accounting services and access to various reporting tools for the customers we serve. The termination by our card processing providers of their arrangements with us or their failure to perform their services efficiently and effectively may adversely affect our relationships with the customers whose accounts we serve and may cause those customers to terminate their processing agreements with us.
We are subject to laws and regulations that affect the products, services and markets in which we operate. Failure by us to comply with these laws or regulations would have an adverse effect on our business, financial condition, or results of operations.
We are, among other things, subject to banking regulations and credit card association regulations. Failure to comply with these regulations may result in the suspension of our business, the limitation, suspension or termination of service, and/or the imposition of fines that could have an adverse effect on our financial condition. Additionally, changes to legal rules and regulations, or interpretation or enforcement thereof, could have a negative financial effect on us or our product offerings. To the extent this occurs, we could be subject to additional technical, contractual or other requirements as a condition of our continuing to conduct our payment processing business. These requirements could cause us to incur additional costs, which could be significant, or to lose revenues to the extent we do not comply with these requirements.
New legislation could be enacted regulating the basis upon which interchange rates are charged for debit or credit card transactions, which could increase the debit or credit card interchange fees charged by bankcard networks. An example of such legislation is the so-called “Durbin Amendment,” to the Dodd Frank Wall Street Reform and Consumer Protection Act of 2010. The Durbin Amendment regulates the basis upon which interchange rates for debit card transactions are made to ensure that interchange rates are “reasonable and proportionate to costs.” Pursuant to regulations that were promulgated by the Federal Reserve, Visa and MasterCard have significantly increased their interchange fees for small ticket debit card transactions.
As of November 14, 2014, we entered into a three-year agreement with Visa U.S.A. Inc. (“Visa”), pursuant to which Visa has agreed to continue to make available to the Company certain promotional interchange reimbursement fees for small ticket debit and credit card transactions. Similarly, MasterCard International Incorporated ("MasterCard") has agreed to make available to us reduced interchange rates for small ticket debit card transactions pursuant to a three-year MasterCard Acceptance Agreement dated January 12, 2015, as amended by a First Amendment thereto dated April 27, 2015. If the foregoing agreements with Visa and MasterCard are not extended, our financial results would be materially adversely affected unless we are able to pass these significant additional charges to our customers.
Increases in card association and debit network interchange fees could increase our operating costs or otherwise adversely affect our operations. If we do not pass along to our customers any future increases in credit or debit card interchange fees, assessments and transaction fees, our gross profits would be reduced.
We are obligated to pay interchange fees and other network fees set by the bankcard networks to the card issuing bank and the bankcard networks for each transaction we process through our network. From time to time, card associations and debit networks increase the organization and/or processing fees, known as interchange fees that they charge. Under our processing agreements with our customers, we are permitted to pass along these fee increases to our customers through corresponding increases in our processing fees. Passing along such increases could result in some of our customers canceling their contracts with us. Consequently, it is possible that competitive pressures will result in our Company absorbing some or all of the increases in the future, which would increase our operating costs, reduce our gross profit and adversely affect our business.
During the term of the Visa Agreement, the Company does not anticipate accepting any debit cards with interchange fees that are higher than the rates provided under the Visa Agreement. The Company will continue to accept Visa- and MasterCard- branded debit cards in addition to all major credit cards, including Visa, MasterCard, Discover and American Express at its current processing rates. If the Visa or MasterCard Agreements are not extended, our financial results would be materially adversely affected unless we are able to pass these significant additional charges to our customers.
The ability to recruit, retain and develop qualified personnel is critical to the Company’s success and growth.
For the Company to successfully compete and grow, it must retain, recruit and develop the necessary personnel who can provide the needed expertise required in its business. In addition, the Company must develop its personnel to provide succession plans capable of maintaining continuity in the midst of the inevitable unpredictability of human capital. However, the market for qualified personnel is competitive and the Company may not succeed in recruiting additional personnel or may fail to effectively replace current personnel who depart with qualified or effective successors. The Company’s effort to retain and develop personnel may also result in significant additional expenses. The Company cannot assure that key personnel, including executive officers, will continue to be employed or that it will be able to attract and retain qualified personnel in the future. Failure to retain or attract key personnel could have a material adverse effect on the Company.
We incur chargeback liability when our customers refuse or cannot reimburse chargebacks resolved in favor of consumers. Any increase in chargebacks not paid by our customers may adversely affect our results of operations, financial condition and cash flows.
In the event a dispute between a cardholder and a customer is not resolved in favor of the customer, the transaction is normally charged back to the customer and the purchase price is credited or otherwise refunded to the cardholder. If we are unable to collect such amounts from the customer's account, or if the customer refuses or is unable, due to closure, bankruptcy or other reasons, to reimburse us for a chargeback, we bear the loss for the amount of the refund paid to the cardholder. We may experience significant losses from chargebacks in the future. Any increase in chargebacks not paid by our customers could have a material adverse effect on our business, financial condition, results of operations and cash flows. We have policies to manage customer-related credit risk and attempt to mitigate such risk by monitoring transaction activity. Notwithstanding our programs and policies for managing credit risk, it is possible that a default on such obligations by one or more of our customers could have a material adverse effect on our business.
Failure to maintain effective systems of internal control over financial reporting and disclosure controls and procedures could cause a loss of confidence in our financial reporting and adversely affect the trading price of our common stock.
Effective internal control over financial reporting is necessary for us to provide accurate financial information. Section 404 of the Sarbanes-Oxley Act requires us to evaluate the effectiveness of our internal control over financial reporting as of the end of each fiscal year and to include a management report assessing the effectiveness of our internal control over financial reporting in our Annual Report on Form 10-K. We identified a material weakness in our internal controls over financial reporting as of June 30, 2016 and June 30, 2015. There can be no assurance that the remediation of the control deficiencies that gave rise to the material weakness will be effective or successful. If we fail to maintain the adequacy of our internal control, we may not be able to conclude and report that we have effective internal control over financial reporting. If we are unable to adequately maintain our internal control over financial reporting, we may not be able to accurately report our financial results, which could cause investors to lose confidence in our reported financial information, negatively affecting the trading price of our common stock, or our ability to access the capital markets.
Risks Relating to Our Common Stock
We do not expect to pay cash dividends in the foreseeable future and therefore investors should not anticipate cash dividends on their investment.
The holders of our common stock and series A convertible preferred stock are entitled to receive dividends when, and if, declared by our board of directors. Our Board of Directors does not intend to pay cash dividends in the foreseeable future, but instead intends to retain any and all earnings to finance the growth of the business. To date, we have not paid any cash dividends on our common stock or our series A convertible preferred stock and there can be no assurance that cash dividends will ever be paid on our common stock.
Our articles of incorporation prohibit the declaration of any dividends on our common stock unless and until all unpaid and accumulated dividends on the series A convertible preferred stock have been declared and paid. In addition, our loan agreement with our bank prohibits us from paying dividends without the prior consent of our bank. Through July 5, 2017, the unpaid and cumulative dividends on the series A convertible preferred stock are $14.03 million. As of July 5, 2017, each share of series A convertible preferred stock was convertible into 0.1940 of a share of common stock at the option of the holder and is subject to further adjustment as provided in our articles of incorporation. The unpaid and cumulative dividends on the series A convertible preferred stock are convertible into shares of our common stock at the rate of $1,000 per share at the option of the holder. During the year ended June 30, 2016, none of our series A convertible preferred stock and no cumulative preferred dividends were converted into shares of common stock.
Our articles of incorporation also provide that the preferred stock has a liquidation preference over the common stock in the amount of $10 per share plus accrued and unpaid dividends. As of March 31, 2017, the liquidation preference was $18.78 million.
Upon certain fundamental transactions involving the Company, such as a merger or sale of substantially all of our assets, we may be required to distribute the liquidation preference then due to the holders of our series A preferred stock which would reduce the amount of the distributions otherwise to be made to the holders of our common stock in connection with such transactions.
Our articles of incorporation provide that upon a merger or sale of substantially all of our assets or upon the disposition of more than 50% of our voting power, the holders of at least 60% of the preferred stock may elect to have such transaction treated as a liquidation and be entitled to receive their liquidation preference. Upon our liquidation, the holders of our preferred stock are entitled to receive a liquidation preference prior to any distribution to the holders of common stock which as of March 31, 2017 is equal to $18.78 million.
Our stock price may be volatile.
The trading price of our common stock is expected to be subject to significant fluctuations in response to various factors including, but not limited to, the following:
| ● |
variations in operating results and achievement of key business metrics;
|
| ● |
changes in earnings estimates by securities analysts, if any;
|
| ● |
any differences between reported results and securities analysts’ published or unpublished expectations;
|
|
●
|
announcements of new contracts, service offerings or technological innovations by us or our competitors;
|
|
●
|
market reaction to any acquisitions, joint ventures or strategic investments announced by us or our competitors;
|
| ● |
demand for our services and products;
|
| ● |
shares of common stock being sold pursuant to Rule 144 or upon exercise of warrants;
|
| ● |
regulatory matters;
|
| ● |
concerns about our financial position, operating results, litigation, government regulation, developments or disputes relating to agreements, patents or proprietary rights;
|
| ● |
potential dilutive effects of future sales of shares of common stock by shareholders and by the Company;
|
| ● |
the amount of average daily trading volume in our common stock;
|
| ● |
our ability to obtain working capital financing; and
|
| ● |
general economic or stock market conditions unrelated to our operating performance.
|
The securities market in recent years has from time to time experienced significant price and volume fluctuations that are unrelated to the operating performance of particular companies. These market fluctuations, as well as general economic conditions, may also materially and adversely affect the market price of our common stock.
Director and officer liability is limited.
As permitted by Pennsylvania law, our by-laws limit the liability of our directors for monetary damages for breach of a director’s fiduciary duty except for liability in certain instances. As a result of our by-law provisions and Pennsylvania law, shareholders may have limited rights to recover against directors for breach of fiduciary duty. In addition, our by-laws and indemnification agreements entered into by the Company with each of the officers and directors provide that we shall indemnify our directors and officers to the fullest extent permitted by law.
Our publicly-filed reports are reviewed by the SEC from time to time and any significant changes required as a result of any such review may result in material liability to us, and have a material adverse impact on the trading price of our common stock.
The reports of publicly-traded companies are subject to review by the SEC from time to time for the purpose of assisting companies in complying and to assess their compliance with applicable disclosure requirements and to enhance the overall effectiveness of companies’ public filings, and comprehensive reviews of such reports are now required at least every three years under the Sarbanes-Oxley Act of 2002. SEC reviews may be initiated at any time. While we believe that our previously filed SEC reports comply, and we intend that all future reports will comply in all material respects with the published SEC rules and regulations, we could be required to modify or reformulate information contained in prior filings as a result of an SEC review. Any modification or reformulation of information contained in such reports could be significant and result in material liability to us and have a material adverse impact on the trading price of our common stock.
Risks Relating to the Offering
Management will have broad discretion as to the use of the proceeds from this offering, and we may not use the proceeds effectively.
Our management will have broad discretion in the application of the net proceeds from this offering and could spend the proceeds in ways that do not improve our results of operations or enhance the value of our common stock. Our failure to apply these funds effectively could have a material adverse effect on our business, delay the growth of our business, and cause the price of our common stock to decline.
You will experience immediate and substantial dilution in the net tangible book value per share of the common stock you purchase.
Since the price per share of our common stock being offered is substantially higher than the net tangible book value per share of our common stock, you will suffer immediate and substantial dilution in the net tangible book value of the common stock you purchase in this offering. Based on an assumed public offering price of $ per share, which is the last reported sale price of our common stock on The NASDAQ Global Market on July , 2017, after deducting underwriting discounts and commissions and estimated offering expenses payable by us, and based on a net tangible book value of our common stock of $1.32 per share as of March 31, 2017, if you purchase shares of common stock in this offering, you will suffer immediate and substantial dilution of $ per share in the net tangible book value of common stock.
You may experience future dilution as a result of future equity offerings.
In order to raise additional capital, we may in the future offer additional shares of our common stock or other securities convertible into or exchangeable for our common stock at prices that may not be the same as the price per share in this offering. We cannot assure you that we will be able to sell shares or other securities in any other offering at a price per share that is equal to or greater than the price per share paid by investors in this offering, and investors purchasing shares or other securities in the future could have rights superior to existing shareholders, including investors who purchase shares of common stock in this offering. The price per share at which we sell additional shares of our common stock or securities convertible into common stock in future transactions may be higher or lower than the price per share in this offering.
If securities and/or industry analysts fail to continue publishing research about our business, if they change their recommendations adversely, or if our results of operations do not meet their expectations, our stock price and trading volume could decline.
The trading market for our common stock will be influenced by the research and reports that industry or securities analysts publish about us or our business. If one or more of these analysts cease coverage of our company or fail to publish reports on us regularly, we could lose visibility in the financial markets, which in turn could cause our stock price or trading volume to decline. In addition, it is likely that, in some future period, our operating results will be below the expectations of securities analysts or investors. If one or more of the analysts who cover us downgrade our stock, or if our results of operations do not meet their expectations, our stock price could decline.
Because we do not intend to declare cash dividends on our shares of common stock in the foreseeable future, shareholders must rely on appreciation of the value of our common stock for any return on their investment.
We have never declared or paid cash dividends on our common stock. We currently anticipate that we will retain future earnings for the development, operation and expansion of our business and do not anticipate declaring or paying any cash dividends in the foreseeable future. In addition, the terms of our existing debt agreements preclude and future debt agreements may preclude us from paying dividends, and our articles of incorporation prohibit the declaration of any dividends on our common stock unless and until all unpaid and accumulated dividends on the series A convertible preferred stock have been declared and paid. Through July 2, 2017, the unpaid and cumulative dividends on the series A convertible preferred stock are $14.03 million. As a result, we expect that only an appreciation of the price of our common stock, if any, will provide a return to investors in this offering for the foreseeable future.
This prospectus contains certain forward-looking statements regarding, among other things, the anticipated financial and operating results of our company. For this purpose, forward-looking statements are any statements contained herein that are not statements of historical fact and include, but are not limited to, those preceded by or that include the words, “estimate,” “could,” “should,” “would,” “likely,” “may,” “will,” “plan,” “intend,” “believes,” “expects,” “anticipates,” “projected,” or similar expressions. Those statements are subject to known and unknown risks, uncertainties and other factors that could cause the actual results to differ materially from those contemplated by the statements. The forward-looking information is based on various factors and was derived using numerous assumptions. Important factors that could cause the Company’s actual results to differ materially from those projected, include, for example:
| · |
general economic, market or business conditions unrelated to our operating performance;
|
| · |
the ability of the Company to raise funds in the future through sales of securities or debt financing in order to sustain its operations if an unexpected or unusual event would occur;
|
| · |
the ability of the Company to compete with its competitors to obtain market share;
|
| · |
whether the Company’s current or future customers purchase, lease, rent or utilize ePort devices or our other products in the future at levels currently anticipated by our Company;
|
| · |
whether the Company’s customers continue to utilize the Company’s transaction processing and related services, as our customer agreements are generally cancelable by the customer on thirty to sixty days’ notice;
|
| · |
the ability of the Company to maintain or increase the margins realized by the Company in connection with its services or products;
|
| · |
the ability of the Company to sell to third party lenders all or a portion of our finance receivables;
|
| · |
the ability of a sufficient number of our customers to utilize third party financing companies under our QuickStart program in order to improve our net cash used by operating activities;
|
| · |
the incurrence by us of any unanticipated or unusual non-operating expenses which would require us to divert our cash resources from achieving our business plan;
|
| · |
the ability of the Company to predict or estimate its future quarterly or annual revenues and expenses given the developing and unpredictable market for its products;
|
| · |
the ability of the Company to retain key customers from whom a significant portion of its revenues is derived;
|
| · |
the ability of a key customer to reduce or delay purchasing products from the Company;
|
| · |
the ability of the Company to obtain widespread commercial acceptance of its products and service offerings such as ePort QuickConnect, mobile payment and loyalty programs;
|
| · |
whether any patents issued to the Company will provide the Company with any competitive advantages or adequate protection for its products, or would be challenged, invalidated, infringed or circumvented by others;
|
| · |
the ability of the Company to operate without infringing the intellectual property rights of others;
|
| · |
the ability of our products and services to avoid unauthorized hacking or credit card fraud;
|
| · |
whether our remediation of the control deficiencies that gave rise to the material weakness that we identified in our internal controls over financial reporting, and which was reflected in our annual report on Form 10-K for the fiscal year ended June 30, 2016, will be effective or successful;
|
| · |
whether we experience additional material weaknesses in our internal controls over financial reporting in the future, and are not able to accurately or timely report our financial condition or results of operations;
|
| · |
whether our suppliers would increase their prices, reduce their output or change their terms of sale; and
|
| · |
our ability to obtain additional financing in the future for working capital, capital expenditures, acquisitions, general corporate purposes or other purposes may be impaired.
|
Although we believe that the expectations reflected in the forward-looking statements are reasonable, we cannot guarantee future results, levels of activity, performance, or achievements. Actual results or business conditions may differ materially from those projected or suggested in forward-looking statements as a result of various factors including, but not limited to, those described above. We cannot assure you that we have identified all the factors that create uncertainties. Moreover, new risks emerge from time to time and it is not possible for our management to predict all risks, nor can we assess the impact of all risks on our business or the extent to which any risk, or combination of risks, may cause actual results to differ from those contained in any forward-looking statements. Readers should not place undue reliance on forward-looking statements.
Any forward-looking statement made by us in this prospectus speaks only as of the date of such document. Unless required by law, we undertake no obligation to publicly revise any forward-looking statement to reflect circumstances or events after the date of this prospectus or to reflect the occurrence of unanticipated events.
We estimate that our net proceeds from the sale of our shares of common stock offered hereby, after deducting the underwriting discounts and commissions and estimated expenses payable by us, will be approximately $ million, or approximately $ million if the underwriters exercise their over allotment option in full.
We intend to use the net proceeds received from the offering for general corporate purposes and working capital to support anticipated growth. These purposes may include, among other things, future acquisitions of businesses, products and technologies, or establishing strategic alliances, that we believe will complement our current or future business. We evaluate these opportunities from time to time, and engage in discussions in connection with potential opportunities. While we have no existing agreements, commitments or understandings for any specific future acquisitions or strategic alliances at this time, we may use a portion of the net proceeds for these purposes.
We will retain broad discretion in the allocation of the net proceeds of this offering. Pending the uses described above, we intend to invest the net proceeds of this offering in short-term interest-bearing securities.
Our common stock is traded on The NASDAQ Global Market under the symbol “USAT.”
The high and low sales prices on The NASDAQ Global Market for the common stock were as follows:
|
Year ended June 30, 2017
|
High
|
Low
|
||||||
|
First Quarter (through September 30, 2016)
|
$
|
5.81
|
$
|
4.05
|
||||
|
Second Quarter (through December 31, 2016)
|
$
|
5.77
|
$
|
3.55
|
||||
|
Third Quarter (through March 31, 2017)
|
$
|
4.85
|
$
|
3.80
|
||||
|
Fourth Quarter (through June 30, 2017)
|
$
|
5.60
|
$
|
3.95
|
||||
|
Year ended June 30, 2016
|
High
|
Low
|
||||||
|
First Quarter (through September 30, 2015)
|
$
|
3.52
|
$
|
1.70
|
||||
|
Second Quarter (through December 31, 2015)
|
$
|
3.40
|
$
|
2.18
|
||||
|
Third Quarter (through March 31, 2016)
|
$
|
4.54
|
$
|
2.69
|
||||
|
Fourth Quarter (through June 30, 2016)
|
$
|
4.73
|
$
|
3.50
|
||||
As of July 6, 2017, the closing price of our common stock was $5.10. As of June 30, 2017, there were approximately 576 holders of record of our common stock. This number does not include stockholders for whom shares were held in a “nominee” or “street” name.
The holders of our common stock are entitled to receive such dividends as our Board of Directors may from time to time declare out of funds legally available for payment of dividends. We have never declared or paid dividends on our common stock and do not contemplate paying any such cash dividend in the foreseeable future. No dividend may be paid on the common stock until all accumulated and unpaid dividends on the preferred stock have been paid. As of the date of this prospectus, such accumulated unpaid dividends amounted to $14.03 million. In addition, our loan agreement with our bank prohibits us from paying dividends without the prior consent of our bank.
We currently intend to retain available cash for use in our business to finance ongoing operations and the potential growth of our business. Payments of future dividends, if any, will be at the discretion of our Board of Directors after taking into account various factors, including our financial condition, operating results, current and anticipated cash needs and plans for expansion and any other factors the Board of Directors may deem relevant, and subject to any restrictions contained in our financing and bank agreements.
The following table sets forth our capitalization, cash and cash equivalents:
| · |
on an actual basis as of March 31, 2017; and
|
| · |
on an as adjusted basis to give effect to the sale of shares in this offering, assuming an offering price of $ per share, which is the last reported sale price of our common stock on The NASDAQ Global Market on July , 2017, our receipt of the net proceeds from that sale after deducting estimated offering expenses payable by us and the application of the net proceeds from this offering as described in “Use of proceeds.”
|
You should consider this table in conjunction with our consolidated financial statements and the notes to those consolidated financial statements included elsewhere in this prospectus.
($ in thousands)
|
At March 31, 2017
|
||||||||
|
Actual
|
As Adjusted
(1)
|
|||||||
|
($ in thousands)
|
(Unaudited)
|
|||||||
|
Cash and Cash Equivalents
|
$
|
17,780
|
$
|
|||||
| Total Liabilities | $ | 23,993 | $ | |||||
|
Shareholders’ equity:
|
||||||||
|
Preferred stock, no par value:
|
||||||||
|
Authorized shares- 1,800,000; Series A convertible preferred- Authorized shares- 900,000; Issued and outstanding shares- 445,063, actual and as adjusted, with liquidation preference of $18,775
|
$
|
3,138
|
||||||
|
Common stock, no par value:
|
||||||||
|
Authorized shares- 640,000,000, Issued and outstanding shares- 40,327,675, actual; shares issued and outstanding, as adjusted
|
$
|
245,463
|
||||||
|
Accumulated deficit
|
$
|
(183,602
|
)
|
|||||
|
Total shareholders’ equity
|
$
|
64,999
|
$
|
|||||
|
Total capitalization
|
$
|
88,992
|
$
|
|||||
| (1) |
The as adjusted information set forth above is illustrative only and will change based on the actual public offering price and other terms of this offering determined at pricing. Each $1.00 increase or decrease in the assumed public offering price of $ per share, which is the last reported sale price of our common stock on The NASDAQ Global Market on July , 2017, would increase or decrease as adjusted cash and cash equivalents, total shareholders’ equity, and total capitalization by approximately $ million, assuming that the number of shares of common stock offered by us, as set forth on the cover page of this prospectus, remains the same, and after deducting underwriting discounts and commissions payable by us. We may also increase or decrease the number of shares of common stock we are offering. A 1,000,000 share increase or decrease in the number of shares of common stock offered by us would increase or decrease as adjusted cash and cash equivalents, total shareholders’ equity, and total capitalization by approximately $ million, assuming that the assumed public offering price remains the same, and after deducting underwriting discounts and commissions payable by us.
|
The number of shares of common stock to be outstanding after this offering is based on 40,327,675 shares of common stock outstanding as of March 31, 2017, and excludes, in each case as of March 31, 2017:
| · |
23,978 shares of common stock underlying warrants issued by the Company to our bank lender at an exercise price of $5.00 per share in connection with the loan agreement;
|
| · |
(i) 20,000 shares of common stock issuable upon the exercise of outstanding stock options issued under the 2015 Equity Incentive Plan, and (ii) 715,220 shares of common stock issuable upon the exercise of outstanding stock options issued under the 2014 Stock Option Incentive Plan;
|
| · |
(i) 1,230,000 shares of common stock reserved for issuance under the 2015 Equity Incentive Plan, (ii) 1,447 shares of common stock underlying stock options reserved for issuance under the 2014 Stock Option Incentive Plan, and (iii) 9,004 shares of common stock reserved for issuance under the Company’s 2013 Stock Incentive Plan;
|
| · |
100,333 shares issuable upon the conversion of outstanding preferred stock and cumulative preferred stock dividends; and
|
| · |
140,000 shares issuable to our former chief executive officer upon the occurrence of certain fundamental transactions involving the Company.
|
You should read the following selected consolidated financial data together with the section of this prospectus entitled “Management’s Discussion and Analysis of Financial Condition and Results of Operations” and our consolidated financial statements and the related notes included in this prospectus. We have derived the condensed consolidated statement of operations data for the years ended June 30, 2016, 2015 and 2014 and the selected condensed consolidated balance sheet data as of June 30, 2016 and 2015 from our audited consolidated financial statements included elsewhere in this prospectus. The condensed consolidated statement of operations data for the years ended June 30, 2013 and 2012 have been derived from our audited consolidated financial information that have not been included in this prospectus. We have derived the selected unaudited consolidated statement of operations data for the nine months ended March 31, 2017 and 2016 and the selected condensed consolidated balance sheet data as of March 31, 2017, from our unaudited interim consolidated financial statements included elsewhere in this prospectus. We have prepared the unaudited interim consolidated financial statements on the same basis as the audited financial statements and have included, in our opinion, all adjustments, consisting only of normal recurring adjustments that we consider necessary for a fair statement of the financial information set forth in those statements. Our historical results are not necessarily indicative of the results that should be expected in the future, and interim results are not necessarily indicative of the results that should be expected for the full year or any other period.
|
As of and for the Year ended June 30
|
||||||||||||||||||||
|
($ in thousands, except per share data and as otherwise noted)
|
2016
|
2015
|
2014
|
2013
|
2012
|
|||||||||||||||
|
OPERATIONS DATA:
|
||||||||||||||||||||
|
Revenues
|
$
|
77,408
|
$
|
58,077
|
$
|
42,345
|
$
|
35,940
|
$
|
29,017
|
||||||||||
|
Operating income (loss)
|
$
|
(1,467
|
)
|
$
|
(240
|
)
|
$
|
437
|
$
|
714
|
$
|
(7,000
|
)
|
|||||||
|
Net Income (loss) (1)
|
$
|
(6,806
|
)
|
$
|
(1,089
|
)
|
$
|
27,531
|
$
|
854
|
$
|
(5,211
|
)
|
|||||||
|
Cumulative preferred dividends
|
(668
|
)
|
(668
|
)
|
(668
|
)
|
(668
|
)
|
(668
|
)
|
||||||||||
|
Net income (loss) applicable to common shares
|
$
|
(7,474
|
)
|
$
|
(1,757
|
)
|
$
|
26,863
|
$
|
186
|
$
|
(5,879
|
)
|
|||||||
|
Net earnings (loss) per common share - basic and diluted (2)
|
$
|
(0.21
|
)
|
$
|
(0.05
|
)
|
$
|
0.77
|
$
|
0.01
|
$
|
(0.18
|
)
|
|||||||
|
Cash dividends per common share
|
-
|
-
|
-
|
-
|
-
|
|||||||||||||||
|
BALANCE SHEET DATA:
|
||||||||||||||||||||
|
Total assets
|
$
|
84,833
|
$
|
75,134
|
$
|
70,717
|
$
|
36,576
|
$
|
33,220
|
||||||||||
|
Long-term debt
|
$
|
1,576
|
$
|
1,854
|
$
|
423
|
$
|
370
|
$
|
728
|
||||||||||
|
Shareholders’ equity
|
$
|
55,025
|
$
|
53,311
|
$
|
53,736
|
$
|
23,378
|
$
|
21,655
|
||||||||||
|
CASH FLOW DATA:
|
||||||||||||||||||||
|
Net cash provided by (used in) operating activities
|
$
|
6,468
|
$
|
(1,698
|
)
|
$
|
7,085
|
$
|
6,039
|
$
|
78
|
|||||||||
|
Net cash provided by (used in) investing activities
|
(5,772
|
)
|
3,354
|
(7,917
|
)
|
(9,181
|
)
|
(6,233
|
)
|
|||||||||||
|
Net cash provided by (used in) financing activities
|
7,202
|
646
|
3,923
|
2,696
|
(410
|
)
|
||||||||||||||
|
Net increase (decrease) in cash and cash equivalents
|
7,898
|
2,302
|
3,091
|
(446
|
)
|
(6,565
|
)
|
|||||||||||||
|
Cash and cash equivalents at beginning of period
|
11,374
|
9,072
|
5,981
|
6,427
|
12,992
|
|||||||||||||||
|
Cash and cash equivalents at end of period
|
$
|
19,272
|
$
|
11,374
|
$
|
9,072
|
$
|
5,981
|
$
|
6,427
|
||||||||||
|
CONNECTIONS AND TRANSACTION DATA (UNAUDITED):
|
||||||||||||||||||||
|
Net New Connections #
|
96,000
|
67,000
|
52,000
|
50,000
|
45,000
|
|||||||||||||||
|
Total Connections #
|
429,000
|
333,000
|
266,000
|
214,000
|
164,000
|
|||||||||||||||
|
New Customers Added #
|
1,450
|
2,300
|
2,250
|
1,750
|
1,350
|
|||||||||||||||
|
Total Customers #
|
11,050
|
9,600
|
7,300
|
5,050
|
3,300
|
|||||||||||||||
|
Total Number of Transactions (millions)
|
315.8
|
216.6
|
168.5
|
129.1
|
102.7
|
|||||||||||||||
|
Transaction Volume ($millions) #
|
$
|
584.4
|
$
|
388.9
|
$
|
293.8
|
$
|
219.0
|
$
|
171.3
|
||||||||||
|
(1)
|
Net income for the year ended June 30, 2014 includes an income tax benefit of $27.3 million for the reduction of tax valuation allowance.
|
|
(2)
|
See note 2 to our consolidated financial statements appearing elsewhere in this prospectus for a description of the method used to calculate basic and diluted net income (loss) per share of common stock.
|
|
Nine Months Ended March 31,
|
||||||||
|
($ in thousands, except per share data and as otherwise noted)
|
2017
|
2016
|
||||||
|
OPERATIONS DATA:
|
||||||||
|
Revenues
|
$
|
69,804
|
$
|
55,464
|
||||
|
Operating income (loss)
|
$
|
(297
|
)
|
$
|
111
|
|||
|
Net Income (loss)
|
$
|
(2,095
|
)
|
$
|
(5,934
|
)
|
||
|
Cumulative preferred dividends
|
(668
|
)
|
(668
|
)
|
||||
|
Net income (loss) applicable to common shares
|
$
|
(2,763
|
)
|
$
|
(6,602
|
)
|
||
|
Net earnings (loss) per common share - basic and diluted (1)
|
$
|
(0.07
|
)
|
$
|
(0.18
|
)
|
||
|
Cash dividends per common share
|
-
|
-
|
||||||
|
BALANCE SHEET DATA:
|
||||||||
|
Total assets
|
$
|
88,992
|
$
|
82,240
|
||||
|
Long-term debt
|
$
|
1,239
|
$
|
1,742
|
||||
|
Shareholders’ equity
|
$
|
64,999
|
$
|
50,427
|
||||
|
CASH FLOW DATA:
|
||||||||
|
Net cash provided by (used in) operating activities
|
$
|
(4,295
|
)
|
$
|
5,197
|
|||
|
Net cash provided by (used in) investing activities
|
(2,713
|
)
|
(5,832
|
)
|
||||
|
Net cash provided by (used in) financing activities
|
5,516
|
4,162
|
||||||
|
Net increase (decrease) in cash and cash equivalents
|
(1,492
|
)
|
3,527
|
|||||
|
Cash and cash equivalents at beginning of period
|
19,272
|
11,374
|
||||||
|
Cash and cash equivalents at end of period
|
$
|
17,780
|
$
|
14,901
|
||||
|
CONNECTIONS AND TRANSACTION DATA (UNAUDITED):
|
||||||||
|
Net New Connections #
|
75,000
|
68,000
|
||||||
|
Total Connections #
|
504,000
|
401,000
|
||||||
|
New Customers Added #
|
1,350
|
1,150
|
||||||
|
Total Customers #
|
12,400
|
10,750
|
||||||
|
Total Number of Transactions (millions)
|
300.2
|
227.2
|
||||||
|
Transaction Volume ($millions) #
|
$
|
577.3
|
$
|
415.7
|
||||
|
(1)
|
See note 2 to our consolidated financial statements appearing elsewhere in this prospectus for a description of the method used to calculate basic and diluted net income (loss) per share of common stock.
|
The following unaudited quarterly financial operations data for the years ended June 30, 2016 and June 30, 2015, and for the nine months ended March 31, 2017 is derived from the audited consolidated financial statements of USA Technologies, Inc. and its interim reports for the quarters therein. The data should be read in conjunction with the consolidated financial statements, related notes, and other financial information.
|
($ in thousands, except per share data)
|
||||||||||||
|
NINE MONTHS ENDED MARCH 31, 2017
|
First Quarter
(unaudited)
|
Second Quarter
(unaudited)
|
Third Quarter
(unaudited)
|
|||||||||
|
Revenues
|
$
|
21,588
|
$
|
21,756
|
$
|
26,460
|
||||||
|
Gross profit
|
$
|
6,167
|
$
|
6,334
|
$
|
6,625
|
||||||
|
Operating income (loss)
|
$
|
(950
|
)
|
$
|
234
|
$
|
419
|
|||||
|
Net income (loss)
|
$
|
(2,464
|
)
|
$
|
233
|
$
|
136
|
|||||
|
Cumulative preferred dividends
|
$
|
(334
|
)
|
$
|
--
|
$
|
(334
|
)
|
||||
|
Net income (loss) applicable to common shares
|
$
|
(2,798
|
)
|
$
|
233
|
$
|
(198
|
)
|
||||
|
Net earnings (loss) per common share:
|
||||||||||||
|
Basic (1)
|
$
|
(0.07
|
)
|
$
|
0.01
|
$
|
(0.00
|
)
|
||||
|
Diluted (1)
|
$
|
(0.07
|
)
|
$
|
0.01
|
$
|
(0.00
|
)
|
||||
|
Weighted average number of common shares outstanding:
|
||||||||||||
|
Basic (1)
|
38,488,005
|
40,308,934
|
40,327,697
|
|||||||||
|
Diluted (1)
|
38,488,005
|
40,730,712
|
40,327,697
|
|||||||||
|
(1)
|
See note 2 to our consolidated financial statements appearing elsewhere in this prospectus for a description of the method used to calculate basic and diluted net income (loss) per share of common stock.
|
|
($ in thousands, except per share data)
|
UNAUDITED
|
|||||||||||||||||||
|
YEAR ENDED JUNE 30, 2016
|
First Quarter
|
Second Quarter
|
Third Quarter
|
Fourth Quarter
|
Year
(audited)
|
|||||||||||||||
|
Revenues
|
$
|
16,600
|
$
|
18,503
|
$
|
20,361
|
$
|
21,944
|
$
|
77,408
|
||||||||||
|
Gross profit
|
$
|
5,047
|
$
|
5,483
|
$
|
5,672
|
$
|
5,783
|
$
|
21,985
|
||||||||||
|
Operating income (loss)
|
$
|
112
|
$
|
594
|
$
|
(595
|
)
|
$
|
(1,578
|
)
|
$
|
(1,467
|
)
|
|||||||
|
Net income (loss)
|
$
|
360
|
$
|
(874
|
)
|
$
|
(5,420
|
)
|
$
|
(872
|
)
|
$
|
(6,806
|
)
|
||||||
|
Cumulative preferred dividends
|
$
|
(334
|
)
|
$
|
-
|
$
|
(334
|
)
|
$
|
-
|
$
|
(668
|
)
|
|||||||
|
Net income (loss) applicable to common shares
|
$
|
26
|
$
|
(874
|
)
|
$
|
(5,754
|
)
|
$
|
(872
|
)
|
$
|
(7,474
|
)
|
||||||
|
Net earnings (loss) per common share:
|
||||||||||||||||||||
|
Basic (1)
|
$
|
0.00
|
$
|
(0.02
|
)
|
$
|
(0.16
|
)
|
$
|
(0.02
|
)
|
$
|
(0.21
|
)
|
||||||
|
Diluted (1)
|
$
|
0.00
|
$
|
(0.02
|
)
|
$
|
(0.16
|
)
|
$
|
(0.02
|
)
|
$
|
(0.21
|
)
|
||||||
|
Weighted average number of common shares outstanding:
|
||||||||||||||||||||
|
Basic (1)
|
35,848,395
|
35,909,933
|
36,161,626
|
37,325,681
|
36,309,047
|
|||||||||||||||
|
Diluted (1)
|
36,487,879
|
35,909,933
|
36,161,626
|
37,325,681
|
36,309,047
|
|||||||||||||||
|
(1)
|
See note 2 to our consolidated financial statements appearing elsewhere in this prospectus for a description of the method used to calculate basic and diluted net income (loss) per share of common stock.
|
|
($ in thousands, except per share data)
|
UNAUDITED
|
|||||||||||||||||||
|
YEAR ENDED JUNE 30, 2015
|
First Quarter
|
Second Quarter
|
Third Quarter
|
Fourth Quarter
|
Year
(audited)
|
|||||||||||||||
|
Revenues
|
$
|
12,253
|
$
|
12,821
|
$
|
15,358
|
$
|
17,645
|
$
|
58,077
|
||||||||||
|
Gross profit
|
$
|
3,135
|
$
|
3,733
|
$
|
5,146
|
$
|
4,809
|
$
|
16,823
|
||||||||||
|
Operating income (loss)
|
$
|
(667
|
)
|
$
|
51
|
$
|
731
|
$
|
(355
|
)
|
$
|
(240
|
)
|
|||||||
|
Net income (loss)
|
$
|
(61
|
)
|
$
|
(261
|
)
|
$
|
(567
|
)
|
$
|
(200
|
)
|
$
|
(1,089
|
)
|
|||||
|
Cumulative preferred dividends
|
$
|
(334
|
)
|
$
|
-
|
$
|
(334
|
)
|
$
|
-
|
$
|
(668
|
)
|
|||||||
|
Net income (loss) applicable to common shares
|
$
|
(395
|
)
|
$
|
(261
|
)
|
$
|
(901
|
)
|
$
|
(200
|
)
|
$
|
(1,757
|
)
|
|||||
|
Net earnings (loss) per common share
|
||||||||||||||||||||
|
Basic (1)
|
$
|
(0.01
|
)
|
$
|
(0.01
|
)
|
$
|
(0.03
|
)
|
$
|
(0.01
|
)
|
$
|
(0.05
|
)
|
|||||
|
Diluted (1)
|
$
|
(0.01
|
)
|
$
|
(0.01
|
)
|
$
|
(0.03
|
)
|
$
|
(0.01
|
)
|
$
|
(0.05
|
)
|
|||||
|
Weighted average number of common shares outstanding:
|
||||||||||||||||||||
|
Basic (1)
|
35,651,732
|
35,716,848
|
35,747,979
|
35,761,370
|
35,719,211
|
|||||||||||||||
|
Diluted (1)
|
35,651,732
|
35,716,848
|
35,747,979
|
36,206,934
|
35,719,211
|
|||||||||||||||
|
(1)
|
See note 2 to our consolidated financial statements appearing elsewhere in this prospectus for a description of the method used to calculate basic and diluted net income (loss) per share of common stock.
|
We provide wireless networking, cashless transactions, asset monitoring, and other value-added services principally to the small ticket, unattended Point of Sale (“POS”) market. Our ePort® technology can be installed and/or embedded into everyday devices such as vending machines, a variety of kiosks, amusement games, and commercial laundry via either our ePort hardware or our Quick Connect solution. Our associated service, ePort Connect®, is a PCI-compliant, comprehensive service that includes simplified credit/debit card processing and support, consumer engagement services as well as telemetry, Internet of Things (“IoT”), and machine-to-machine (“M2M”) services, including the ability to remotely monitor, control and report on the results of distributed assets containing our electronic payment solutions.
We generate revenue in multiple ways. During fiscal year 2016, we derived approximately 73% of our revenues from recurring license and transaction fees related to our ePort Connect service and approximately 27% of our revenue from equipment sales. Connections to our service stem from the sale or lease of our POS electronic payment devices or certified payment software or the servicing of similar third-party installed POS terminals. Connections to the ePort Connect service are the most significant driver of our revenues, particularly the recurring revenues from license and transaction fees. Customers can obtain POS electronic payment devices from us in the following ways:
| · |
Purchasing devices directly from us or one of our authorized resellers;
|
| · |
Leasing devices under our QuickStart Program, which are non-cancellable sixty month sales-type leases, through an unrelated equipment leasing company or directly from us; and
|
| · |
Renting devices under our JumpStart Program, which are cancellable month-to-month operating leases.
|
OTHER METRICS
We monitor the following unaudited key metrics and non-GAAP financial measures to help us evaluate our business, identify trends affecting our business, formulate business plans and make strategic decisions.
|
($'s in thousands,
transactions in millions)
|
As of and for the
nine months
ended
March 31, 2017
|
Fiscal Year Ended
|
||||||||||
|
2016
|
2015
|
|||||||||||
|
Net New Connections
|
75,000
|
96,000
|
67,000
|
|||||||||
|
Total Connections (at period end)
|
504,000
|
429,000
|
333,000
|
|||||||||
|
Total Number of Transactions
|
300.2
|
315.8
|
216.6
|
|||||||||
|
Transaction Volume
|
$
|
577.3
|
$
|
584.4
|
$
|
388.9
|
||||||
|
Adjusted EBITDA
|
$
|
4,297
|
$
|
5,983
|
$
|
6,259
|
||||||
|
Non-GAAP net (loss) income
|
$
|
(369
|
)
|
$
|
(713
|
)
|
$
|
(470
|
)
|
|||
|
Total Customers
|
12,400
|
11,050
|
9,600
|
|||||||||
For purposes of this discussion, each of the above unaudited key metrics and non-GAAP financial measures represents the following:
| · |
net new connections is the number of customer connections added to our service less the number of any customer connections that have been deactivated or removed from our service during the applicable period.
|
| · |
total connections is the number of customer connections to our service as of the applicable date.
|
| · |
total number of transactions is the number of cashless payment transactions that have been processed through our service during the applicable period.
|
| · |
transaction volume is the dollar amount of cashless payment transactions that have been processed through our service during the applicable period.
|
| · |
Adjusted EBITDA is net income (loss) before interest income, interest expense, income taxes, depreciation, amortization, non-recurring fees and charges that were incurred in connection with the integration of the VendScreen business, change in fair value of warrant liabilities and stock-based compensation expense. We have excluded the non-operating item, change in fair value of warrant liabilities, because it represents a non-cash gain or charge that is not related to our operations. We have excluded the non-cash expense, stock-based compensation, as it does not reflect our cash-based operations. We have excluded the non-recurring costs and expenses incurred in connection with the VendScreen transaction in order to allow more accurate comparison of the financial results to historical operations. Adjusted EBITDA is a non-GAAP financial measure which is not required by or defined under GAAP (Generally Accepted Accounting Principles). We use these non-GAAP financial measures for financial and operational decision-making purposes and as a means to evaluate period-to-period comparisons. We believe that these non-GAAP financial measures provide useful information about our operating results, enhance the overall understanding of past financial performance and future prospects and allow for greater transparency with respect to metrics used by our management in its financial and operational decision making. The presentation of this financial measure is not intended to be considered in isolation or as a substitute for the financial measures prepared and presented in accordance with GAAP, including our net income or net loss or net cash used in operating activities. Management recognizes that non-GAAP financial measures have limitations in that they do not reflect all of the items associated with our net income or net loss as determined in accordance with GAAP, and are not a substitute for or a measure of our profitability or net earnings. Adjusted EBITDA is presented because we believe it is useful to investors as a measure of comparative operating performance. Additionally, we utilize Adjusted EBTIDA as a metric in our executive officer and management incentive compensation plans.
|
| · |
non-GAAP net income (loss) is GAAP net income (loss) excluding costs or benefits relating to any adjustment for fair value of warrant liabilities and non-cash portions of our income tax benefit (provision), non-recurring fees and charges that were incurred in connection with the integration of the VendScreen business, and professional fees incurred in connection with the class action litigation and the SLC Investigation. Non-GAAP net earnings (loss) per common share - diluted is calculated by dividing non-GAAP net income (loss) applicable to common shares by the number of diluted weighted average shares outstanding. Management believes that non-GAAP net income (loss) is an important measure of our business. Non-GAAP net income (loss) is a non-GAAP financial measure which is not required by or defined under GAAP. The presentation of this financial measure is not intended to be considered in isolation or as a substitute for the financial measures prepared and presented in accordance with GAAP, including our net income or net loss or net cash used in operating activities. Management recognizes that non-GAAP financial measures have limitations in that they do not reflect all of the items associated with our net income or net loss as determined in accordance with GAAP, and are not a substitute for or a measure of our profitability or net earnings. Management believes that non-GAAP net income (loss) and non-GAAP net earnings (loss) per share are important measures of our business. Management uses the aforementioned non-GAAP measures to monitor and evaluate ongoing operating results and trends and to gain an understanding of our comparative operating performance. We believe that this non-GAAP financial measure serves as a useful metric for our management and investors because they enable a better understanding of the long-term performance of our core business and facilitate comparisons of our operating results over multiple periods, and when taken together with the corresponding GAAP financial measures and our reconciliations, enhance investors’ overall understanding of our current and future financial performance. Additionally, we utilize non-GAAP net income (loss) as a metric in its executive officer and management incentive compensation plans.
|
| · |
total customers is the number of our customers as of the applicable date with whom we have entered into a processing and service agreement relating to that customer’s connections to our service.
|
Reconciliation of Net Income (Loss) to Adjusted EBITDA for the nine months ended March 31, 2017 and fiscal years ended June 30, 2016 and 2015
|
Fiscal Years Ended
|
||||||||||||
|
($ in thousands)
|
Nine Months
Ended
March 31, 2017 |
June 30, 2016
|
June 30, 2015
|
|||||||||
|
Net income (loss)
|
$
|
(2,095
|
)
|
$
|
(6,806
|
)
|
$
|
(1,089
|
)
|
|||
|
Less interest income
|
(387
|
)
|
(320
|
)
|
(83
|
)
|
||||||
|
Plus interest expenses
|
601
|
600
|
302
|
|||||||||
|
Plus income tax provision / (Less income tax benefit)
|
94
|
(615
|
)
|
289
|
||||||||
|
Plus depreciation expense
|
3,642
|
5,135
|
5,731
|
|||||||||
|
Plus amortization expense
|
132
|
87
|
-
|
|||||||||
|
EBITDA
|
1,987
|
(1,919
|
)
|
5,150
|
||||||||
|
Plus loss on fair value of warrant liabilities / (Less gain on fair value of warrant liabilities)
|
1,490
|
5,674
|
393
|
|||||||||
|
Plus stock-based compensation
|
678
|
849
|
716
|
|||||||||
|
Plus intangible asset impairment
|
-
|
432
|
-
|
|||||||||
|
Plus VendScreen non-recurring charges
|
109
|
842
|
-
|
|||||||||
|
Plus litigation related professional fees
|
33
|
105
|
-
|
|||||||||
|
Adjustments to EBITDA
|
2,310
|
7,901
|
1,109
|
|||||||||
|
Adjusted EBITDA
|
$
|
4,297
|
$
|
5,983
|
$
|
6,259
|
||||||
Reconciliation of Net Income (Loss) to Non-GAAP net income (loss) for the nine months ended March 31, 2017 and fiscal years ended June 30, 2016 and 2015
|
Fiscal Years Ended
|
||||||||||||
|
($ in thousands)
|
Nine Months
Ended
March 31, 2017
|
June 30,
2016
|
June 30,
2015
|
|||||||||
|
Net income (loss)
|
$
|
(2,095
|
)
|
$
|
(6,806
|
)
|
$
|
(1,089
|
)
|
|||
|
Non-GAAP adjustments:
|
||||||||||||
|
Non-cash portion of income tax provision
|
94
|
(579
|
)
|
226
|
||||||||
|
Fair value of warrant adjustment
|
1,490
|
5,674
|
393
|
|||||||||
|
VendScreen non-recurring charges
|
109
|
842
|
-
|
|||||||||
|
Litigation related professional fees
|
33
|
156
|
-
|
|||||||||
|
Non-GAAP net income (loss)
|
$
|
(369
|
)
|
$
|
(713
|
)
|
$
|
(470
|
)
|
|||
CRITICAL ACCOUNTING POLICIES
Our consolidated financial statements are prepared applying certain critical accounting policies. The SEC defines “critical accounting policies” as those that require application of management’s most difficult, subjective, or complex judgments. Critical accounting policies require numerous estimates and strategic or economic assumptions that may prove inaccurate or subject to variations and may significantly affect our reported results and financial position for the period or in future periods. Changes in underlying factors, assumptions, or estimates in any of these areas could have a material impact on our future financial condition and results of operations. Our financial statements are prepared in accordance with U.S. GAAP, and they conform to general practices in our industry. We apply critical accounting policies consistently from period to period and intend that any change in methodology occur in an appropriate manner. Accounting policies currently deemed critical are listed below:
REVENUE RECOGNITION
Revenue from the sale or QuickStart lease of equipment is recognized on the terms of freight-on-board shipping point. Activation fee revenue is recognized when our cashless payment device is initially activated for use on our network. Transaction processing revenue is recognized upon the usage of our cashless payment and control network. License fees for access to our devices and network services are recognized on a monthly basis. In all cases, revenue is only recognized when persuasive evidence of an arrangement exists, delivery has occurred or services have been rendered, the price is fixed and determinable, and collection of the resulting receivable is reasonably assured. We estimate an allowance for product returns at the date of sale and estimates license and transaction fee refunds on a monthly basis.
ePort hardware is available to customers under the QuickStart program pursuant to which the customer would enter into a five-year non-cancelable lease with either us or a third-party leasing company for the devices. At the end of the lease period, the customer would have the option to purchase the device for a nominal fee.
LONG LIVED ASSETS
In accordance with ASC 360, “Impairment or Disposal of Long-Lived Assets”, we review our definite lived long-lived assets whenever events or changes in circumstances indicate that the carrying amount of such assets may not be recoverable. If the carrying amount of an asset or group of assets exceeds its net realizable value, the asset will be written down to its fair value. In the period when the plan of sale criteria of ASC 360 are met, definite lived long-lived assets are reported as held for sale, depreciation and amortization cease, and the assets are reported at the lower of carrying value or fair value less costs to sell.
GOODWILL AND INTANGIBLE ASSETS
Goodwill represents the excess of cost over fair value of the net assets purchased in acquisitions. We account for goodwill in accordance with ASC 350, “Intangibles – Goodwill and Other”. Under ASC 350, goodwill is not amortized to earnings, but instead is subject to periodic testing for impairment. Testing for impairment is to be done at least annually and at other times if events or circumstances arise that indicate that impairment may have occurred. We have selected April 1 as our annual test date.
Our trademarks with an indefinite economic life are not being amortized. The trademarks, not subject to amortization, are related to the EnergyMiser asset group and consist of four trademarks. We test indefinite-lived intangible assets for impairment using a two-step process. The first step screens for potential impairment, while the second step measures the amount of impairment. We use a relief from royalty analysis to complete the first step in this process. Testing for impairment is to be done at least annually and at other times if events or circumstances arise that indicate that impairment may have occurred. We have selected April 1 as our annual test date for our indefinite-lived intangible assets. We concluded there was an impairment of our indefinite-lived trademarks as a result of our testing in fiscal year 2016, and we have recorded a $432 thousand impairment expense in the fourth quarter of the fiscal year ended June 30, 2016. This impairment expense reduced the carrying value of the trademarks to zero at June 30, 2016. There was no impairment expense recorded during the fiscal years ended June 30, 2015 and 2014.
Patents, non-compete agreements, brand, developed technology and customer relationships, with an estimated economic life, are carried at cost less accumulated amortization, which is calculated on a straight-line basis over their estimated economic life. We review intangibles, subject to amortization, for impairment whenever events or changes in circumstances indicate that the carrying amount may not be recoverable.
ALLOWANCE FOR DOUBTFUL ACCOUNTS
We maintain an allowance for doubtful accounts for estimated losses resulting from the inability of our customers to make required payments, including from a shortfall in the customer transaction fund flow from which we would normally collect amounts due.
The allowance is determined through an analysis of various factors including the aging of accounts receivable, the strength of the relationship with the customer, the capacity of the customer transaction fund flow to satisfy the amount due from the customer, an assessment of collection costs and other factors. The allowance for uncollectible accounts receivable is management’s best estimate as of the respective reporting period. If the factors described above were to deteriorate, additional amounts may need to be added to the allowance.
RESULTS OF OPERATIONS
TRENDING QUARTERLY FINANCIAL DATA
The following table shows certain financial and non-financial data over a five-quarter period that management believes give investors insight into certain trends and relationships about our financial performance.
Five Quarter Connections & Other Data
|
As of and for the three months ended
|
||||||||||||||||||||
|
March 31,
2017 |
December 31,
2016 |
September 30,
2016 |
June 30,
2016 |
March 31,
2016 |
||||||||||||||||
|
Connections:
|
||||||||||||||||||||
|
Gross New Connections
|
40,000
|
25,000
|
22,000
|
33,000
|
34,000
|
|||||||||||||||
|
% from Existing Customer Base
|
88
|
%
|
80
|
%
|
86
|
%
|
83
|
%
|
91
|
%
|
||||||||||
|
Net New Connections
|
35,000
|
21,000
|
19,000
|
28,000
|
32,000
|
|||||||||||||||
|
Total Connections
|
504,000
|
469,000
|
448,000
|
429,000
|
401,000
|
|||||||||||||||
|
Customers:
|
||||||||||||||||||||
|
New Customers Added
|
500
|
500
|
350
|
300
|
125
|
|||||||||||||||
|
Total Customers
|
12,400
|
11,900
|
11,400
|
11,050
|
10,750
|
|||||||||||||||
|
Volumes:
|
||||||||||||||||||||
|
Total Number of Transactions (millions)
|
104.9
|
100.1
|
95.1
|
89.3
|
82.1
|
|||||||||||||||
|
Transaction Volume (millions)
|
$
|
202.5
|
$
|
191.5
|
$
|
183.4
|
$
|
169.0
|
$
|
151.0
|
||||||||||
|
Financing Structure of Connections:
|
||||||||||||||||||||
|
JumpStart
|
8.6
|
%
|
6.8
|
%
|
7.7
|
%
|
6.5
|
%
|
7.4
|
%
|
||||||||||
|
QuickStart & All Others *
|
91.4
|
%
|
93.2
|
%
|
92.3
|
%
|
93.5
|
%
|
92.6
|
%
|
||||||||||
|
Total
|
100.0
|
%
|
100.0
|
%
|
100.0
|
%
|
100.0
|
%
|
100.0
|
%
|
||||||||||
|
*
|
Includes credit sales with standard trade receivable terms
|
Highlights of our connections for the three months ended March 31, 2017 include:
| · |
35,000 net new connections to our ePort Connect service in the quarter; and
|
| · |
504,000 total connections to the ePort Connect service compared to the same quarter last year of approximately 401,000 total connections, an increase of 103,000 connections, or 25.7%.
|
Comparison of Three Months Ended March 31, 2017 and March 31, 2016
The following table sets forth our results of operations for the periods presented and as a percentage of our total revenues for those periods. The period-to-period comparison of our historical results is not necessarily indicative of the results that may be expected in the future.
|
For the three months ended March 31,
|
||||||||||||||||||||||||
|
($ in thousands, except shares and per share data)
|
2017
|
% of Revenue
|
2016
|
% of Revenue
|
Change
|
% Change
|
||||||||||||||||||
|
Revenues:
|
||||||||||||||||||||||||
|
License and transaction fees
|
$
|
17,459
|
66.0
|
%
|
$
|
14,727
|
72.3
|
%
|
$
|
2,732
|
18.6
|
%
|
||||||||||||
|
Equipment sales
|
9,001
|
34.0
|
%
|
5,634
|
27.7
|
%
|
3,367
|
59.8
|
%
|
|||||||||||||||
|
Total revenues
|
26,460
|
100.0
|
%
|
20,361
|
100.0
|
%
|
6,099
|
30.0
|
%
|
|||||||||||||||
|
Costs of sales/revenues:
|
||||||||||||||||||||||||
|
Cost of services
|
11,876
|
68.0
|
%
|
9,703
|
65.9
|
%
|
2,173
|
22.4
|
%
|
|||||||||||||||
|
Cost of equipment
|
7,959
|
88.4
|
%
|
4,986
|
88.5
|
%
|
2,973
|
59.6
|
%
|
|||||||||||||||
|
Total costs of sales/revenues
|
19,835
|
75.0
|
%
|
14,689
|
72.1
|
%
|
5,146
|
35.0
|
%
|
|||||||||||||||
|
Gross profit
|
6,625
|
25.0
|
%
|
5,672
|
27.9
|
%
|
953
|
16.8
|
%
|
|||||||||||||||
|
Operating expenses:
|
||||||||||||||||||||||||
|
Selling, general and administrative
|
5,947
|
22.5
|
%
|
6,094
|
29.9
|
%
|
(147
|
)
|
(2.4
|
%)
|
||||||||||||||
|
Depreciation and amortization
|
259
|
1.0
|
%
|
173
|
0.8
|
%
|
86
|
49.7
|
%
|
|||||||||||||||
|
Total operating expenses
|
6,206
|
23.5
|
%
|
6,267
|
30.8
|
%
|
(61
|
)
|
(1.0
|
%)
|
||||||||||||||
|
Operating income (loss)
|
419
|
1.6
|
%
|
(595
|
)
|
(2.9
|
%)
|
1,014
|
(170.4
|
%)
|
||||||||||||||
|
Other income (expense):
|
||||||||||||||||||||||||
|
Interest income
|
114
|
0.4
|
%
|
67
|
0.3
|
%
|
47
|
70.1
|
%
|
|||||||||||||||
|
Interest expense
|
(188
|
)
|
(0.7
|
%)
|
(180
|
)
|
(0.9
|
%)
|
(8
|
)
|
(4.4
|
%)
|
||||||||||||
|
Change in fair value of warrant liabilities
|
—
|
0.0
|
%
|
(4,805
|
)
|
(23.6
|
%)
|
4,805
|
100.0
|
%
|
||||||||||||||
|
Total other expense, net
|
(74
|
)
|
(0.3
|
%)
|
(4,918
|
)
|
(24.2
|
%)
|
4,844
|
(98.5
|
%)
|
|||||||||||||
|
Income (loss) before income taxes
|
345
|
1.3
|
%
|
(5,513
|
)
|
(27.1
|
%)
|
5,858
|
106.3
|
%
|
||||||||||||||
|
(Provision) benefit for income taxes
|
(209
|
)
|
(0.8
|
%)
|
93
|
0.5
|
%
|
(302
|
)
|
324.7
|
%
|
|||||||||||||
|
Net income (loss)
|
136
|
0.5
|
%
|
(5,420
|
)
|
(26.6
|
%)
|
5,556
|
102.5
|
%
|
||||||||||||||
|
Cumulative preferred dividends
|
(334
|
)
|
(1.3
|
%)
|
(334
|
)
|
(1.6
|
%)
|
—
|
0.0
|
%
|
|||||||||||||
|
Net loss applicable to common shares
|
$
|
(198
|
)
|
(0.7
|
%)
|
$
|
(5,754
|
)
|
(28.3
|
%)
|
$
|
5,556
|
96.6
|
%
|
||||||||||
|
Net loss per common share - basic and diluted
|
$
|
(0.00
|
)
|
$
|
(0.16
|
)
|
$
|
0.16
|
100.0
|
%
|
||||||||||||||
|
Basic and diluted weighted average number of common shares outstanding
|
40,327,697
|
36,161,626
|
4,166,071
|
11.5
|
%
|
|||||||||||||||||||
Revenue. The increase in revenue was driven by approximately 35,000 net new connections for the three months ended March 31, 2017 compared to approximately 32,000 in the same period last year represents an increase of 9.4%. Our total connections have grown to 504,000 at March 31, 2017 compared to 401,000 at March 31, 2016, or a 25.7% increase year-over-year. The increase in total connections is driving the growth in license and transaction fees of 18.6% period-over-period. The increase in equipment revenue is due to more units sold during the three-month period ended March 31, 2017 compared to the same period last year.
Gross Profit. Gross profit for the three months ended March 31, 2017 was $6.6 million compared to gross profit of $5.6 million for the three months ended March 31, 2016, an increase of $1.0 million, or 17%, of which $0.6 million is attributable to license and transactions fees gross profit and $0.4 million of equipment sales gross profit.
Gross Margin. License and transaction fees gross margin for the three-month period ended March 31, 2017 decreased to 32.0% from the gross margin of 34.1% during the three-month period ended March 31, 2016. The decrease in license and transaction gross margin is attributable to, among other things, reduced fees periodically extended to customers who offer strategic and/or large market opportunities.
Equipment gross margins increased from 11.5% for the three-month period ended March 31, 2016 to 11.6% for the three-month period ended March 31, 2017. The increase in equipment gross margin is primarily attributable to cost reductions with respect to our products during the three-month period ended March 31, 2017 as compared to the quarter end March 31, 2016.
Operating Expenses. Operating expenses decreased $61 thousand or 1.0% for the three-month period ended March 31, 2017 compared to the prior period in 2016, representing 23.5% and 30.8% of sales, respectively. The $86 thousand increase in depreciation and amortization is primarily due to the assets acquired in the VendScreen acquisition. Our SG&A expense for the March 31, 2017 quarter was approximately $0.1 million less than our SG&A expense for the March 31, 2016 quarter, representing 22.5% and 29.9% of sales, respectively.
Total Other Income (Expense). Total Other Income (Expense) includes interest expense, other income, and the change in the fair value of warrants. The primary driver for volatility in Other Income / (Expense) has been non-cash changes to the fair value of the warrant liabilities which are based on our stock price. Using the Black-Scholes model, we adjust the warrant liability for fair value through the income statement quarterly. For the three-month period ended March 31, 2017, we did not record any expense for the change in the fair value of warrant liabilities compared to recording an expense of $4.8 million for the three months ended March 31, 2016. As the warrants giving rise to the warrant liability were exercised in September 2016, there was no such liability recorded in the March 31, 2017 quarter.
Net Income (Loss). Net income (loss) is a function of the items described above. Net income for the quarter end March 31, 2017 was $0.1 million compared to net loss of $5.4 million for the comparable period a year ago. The primary reason for the difference in net income (loss) was the warrant liability charge taken during the quarter ended March 31, 2016. We earned ($0.00) per share during the quarter as compared to a loss of ($0.16) per share during the prior corresponding quarter.
Adjusted EBITDA. For the three months ended March 31, 2017, adjusted EBITDA increased to $1.9 million from $1.3 million for the quarter ended March 31, 2016. The increase was primarily due to the net income earned during the quarter ended March 31, 2017 as compared to the net loss incurred during the prior corresponding quarter adjusted for the fair value of the warrant liabilities.
Non-GAAP Net Income (Loss). Non-GAAP net income increased to $0.3 million for the three months ended March 31, 2017 compared to a Non-GAAP net loss of $0.1 million for the quarter ended March 31, 2016. The increase was primarily due to the net income earned during the quarter ended March 31, 2017 as compared to the net loss incurred during the prior corresponding quarter adjusted for the fair value of the warrant liabilities an increase in gross profit.
Weighted Average Shares Outstanding. The increase in the weighted average number of common shares was due to exercises of warrants and to stock issued pursuant to our stock compensation programs.
Reconciliation of Net Income (Loss) to Adjusted EBITDA for the three months ended March 31, 2017 and 2016
|
Three months ended
March 31, |
||||||||
|
($ in thousands)
|
2017
|
2016
|
||||||
|
Net income (loss)
|
$
|
136
|
$
|
(5,420
|
)
|
|||
|
Less interest income
|
(114
|
)
|
(67
|
)
|
||||
|
Plus interest expenses
|
188
|
180
|
||||||
|
Plus income tax provision / (Less income tax benefit)
|
209
|
(93
|
)
|
|||||
|
Plus depreciation expense
|
1,165
|
1,190
|
||||||
|
Plus amortization expense
|
45
|
44
|
||||||
|
EBITDA
|
1,629
|
(4,166
|
)
|
|||||
|
Plus loss on fair value of warrant liabilities / (Less gain on fair value of warrant liabilities)
|
—
|
4,805
|
||||||
|
Plus stock-based compensation
|
233
|
142
|
||||||
|
Plus VendScreen non-recurring charges
|
—
|
461
|
||||||
|
Plus Litigation related professional fees
|
—
|
105
|
||||||
|
Adjustments to EBITDA
|
233
|
5,513
|
||||||
|
Adjusted EBITDA
|
$
|
1,862
|
$
|
1,347
|
||||
Reconciliation of Net Income (Loss) to Non-GAAP Net Income (Loss) for the three months ended March 31, 2017 and 2016
|
Three months ended
March 31, |
||||||||
|
($ in thousands, except per share data)
|
2017
|
2016
|
||||||
|
Net income (loss)
|
$
|
136
|
$
|
(5,420
|
)
|
|||
|
Non-GAAP adjustments:
|
||||||||
|
Non-cash portion of income tax provision
|
209
|
(38
|
)
|
|||||
|
Fair value of warrant adjustment
|
—
|
4,805
|
||||||
|
VendScreen non-recurring charges
|
—
|
461
|
||||||
|
Litigation related professional fees
|
—
|
105
|
||||||
|
Non-GAAP net income (loss)
|
$
|
345
|
$
|
(87
|
)
|
|||
|
Net income (loss)
|
$
|
136
|
$
|
(5,420
|
)
|
|||
|
Cumulative preferred dividends
|
(334
|
)
|
(334
|
)
|
||||
|
Net income (loss) applicable to common shares
|
$
|
(198
|
)
|
$
|
(5,754
|
)
|
||
|
Non-GAAP net income (loss)
|
$
|
345
|
$
|
(87
|
)
|
|||
|
Cumulative preferred dividends
|
(334
|
)
|
(334
|
)
|
||||
|
Non-GAAP net income (loss) applicable to common shares
|
$
|
11
|
$
|
(421
|
)
|
|||
|
Net income (loss) per common share - basic and diluted
|
$
|
(0.00
|
)
|
$
|
(0.16
|
)
|
||
|
Non-GAAP net income (loss) per common share - basic and diluted
|
$
|
0.00
|
$
|
(0.01
|
)
|
|||
|
Basic and diluted weighted average number of common shares outstanding
|
40,327,697
|
36,161,626
|
||||||
Comparison of Nine Months Ended March 31, 2017 and March 31, 2016
The following table sets forth our results of operations for the periods presented and as a percentage of our total revenues for those periods. The period-to-period comparison of our historical results is not necessarily indicative of the results that may be expected in the future.
|
For the nine months ended March 31,
|
||||||||||||||||||||||||
|
($ in thousands, except shares and per share data)
|
2017
|
% of Revenue
|
2016
|
% of Revenue
|
Change
|
% Change
|
||||||||||||||||||
|
Revenues:
|
||||||||||||||||||||||||
|
License and transaction fees
|
$
|
50,463
|
72.3
|
%
|
$
|
41,326
|
74.5
|
%
|
$
|
9,137
|
22.1
|
%
|
||||||||||||
|
Equipment sales
|
19,341
|
27.7
|
%
|
14,138
|
25.5
|
%
|
5,203
|
36.8
|
%
|
|||||||||||||||
|
Total revenues
|
69,804
|
100.0
|
%
|
55,464
|
100.0
|
%
|
14,340
|
25.9
|
%
|
|||||||||||||||
|
Costs of sales/revenues:
|
||||||||||||||||||||||||
|
Cost of services
|
$
|
34,508
|
68.4
|
%
|
$
|
27,475
|
66.5
|
%
|
7,033
|
25.6
|
%
|
|||||||||||||
|
Cost of equipment
|
16,170
|
83.6
|
%
|
11,787
|
83.4
|
%
|
4,383
|
37.2
|
%
|
|||||||||||||||
|
Total costs of sales/revenues
|
50,678
|
72.6
|
%
|
39,262
|
70.8
|
%
|
11,416
|
29.1
|
%
|
|||||||||||||||
|
Gross profit
|
19,126
|
27.4
|
%
|
16,202
|
29.2
|
%
|
2,924
|
18.0
|
%
|
|||||||||||||||
|
Operating expenses:
|
||||||||||||||||||||||||
|
Selling, general and administrative
|
18,649
|
26.7
|
%
|
15,652
|
28.2
|
%
|
2,997
|
19.1
|
%
|
|||||||||||||||
|
Depreciation and amortization
|
774
|
1.1
|
%
|
439
|
0.8
|
%
|
335
|
76.3
|
%
|
|||||||||||||||
|
Total operating expenses
|
19,423
|
27.8
|
%
|
16,091
|
29.0
|
%
|
3,332
|
20.7
|
%
|
|||||||||||||||
|
Operating (loss) income
|
(297
|
)
|
(0.4
|
%)
|
111
|
0.2
|
%
|
(408
|
)
|
(367.6
|
%)
|
|||||||||||||
|
Other income (expense):
|
||||||||||||||||||||||||
|
Interest income
|
387
|
0.6
|
%
|
138
|
0.2
|
%
|
249
|
180.4
|
%
|
|||||||||||||||
|
Interest expense
|
(601
|
)
|
(0.9
|
%)
|
(403
|
)
|
(0.7
|
%)
|
(198
|
)
|
(49.1
|
%)
|
||||||||||||
|
Change in fair value of warrant liabilities
|
(1,490
|
)
|
(2.1
|
%)
|
(5,692
|
)
|
(10.3
|
%)
|
4,202
|
73.8
|
%
|
|||||||||||||
|
Total other expense, net
|
(1,704
|
)
|
(2.4
|
%)
|
(5,957
|
)
|
(10.7
|
%)
|
4,253
|
71.4
|
%
|
|||||||||||||
|
(Loss) before income taxes
|
(2,001
|
)
|
(2.9
|
%)
|
(5,846
|
)
|
(10.5
|
%)
|
3,845
|
65.8
|
%
|
|||||||||||||
|
Provision for income taxes
|
(94
|
)
|
(0.1
|
%)
|
(88
|
)
|
(0.2
|
%)
|
(6
|
)
|
(6.8
|
%)
|
||||||||||||
|
Net loss
|
(2,095
|
)
|
(3.0
|
%)
|
(5,934
|
)
|
(10.7
|
%)
|
3,839
|
64.7
|
%
|
|||||||||||||
|
Cumulative preferred dividends
|
(668
|
)
|
(1.0
|
%)
|
(668
|
)
|
(1.2
|
%)
|
—
|
0.0
|
%
|
|||||||||||||
|
Net loss applicable to common shares
|
(2,763
|
)
|
(4.0
|
%)
|
(6,602
|
)
|
(11.9
|
%)
|
$
|
3,839
|
58.1
|
%
|
||||||||||||
|
Net loss per common share - basic and diluted
|
(0.07
|
)
|
(0.18
|
)
|
$
|
0.11
|
61.1
|
%
|
||||||||||||||||
|
Basic and diluted weighted average number of common shares outstanding
|
39,703,690
|
35,972,633
|
3,731,057
|
10.4
|
%
|
|||||||||||||||||||
Revenue. The Company’s total connections have grown to 504,000 at March 31, 2017 compared to 401,000 at March 31, 2016, or a 25.7% increase period-over-period. The increase in total connections is driving the growth in license and transaction fees of 22.1% year over year.
Gross Profit. Gross profit for the nine months ended March 31, 2017 was $19.1 million compared to gross profit of $16.2 million for the nine months ended March 31, 2016, an increase of $2.9 million, or 18%, of which $2.1 million is attributable to license and transactions fees gross profit and $0.8 million of equipment sales gross profit.
Gross Margin. License and transaction fees gross margin for the nine months ended March 31, 2017 decreased to 31.6% from the gross margin of 33.5% during the nine months ended March 31, 2016. The decrease in license and transaction gross margin is attributable to, among other things, reduced fees periodically extended to customers who offer strategic and/or large market opportunities.
Equipment gross margin decreased slightly from 16.6% for the nine-month period ended March 31, 2016 to 16.4% for the nine-month period ended March 31, 2017. The decrease in gross margin on a year-to-date basis is primarily attributable to reduced pricing periodically extended to customers who offer strategic and/or large market opportunities.
Operating Expenses. Operating expenses increased $3.3 million or 20.7% for the nine-month period ended March 31, 2017 compared to the prior period in fiscal year 2016. The $2.4 million increase of professional services is attributable to SOX 404 compliance, internal audit, and audit of our financial statements driven primarily by our status as a first-time accelerated filer which required an audit of our annual SOX 404 assessment. The $0.8 million increase in salaries and benefits increase is due to employee compensation, headcount and employee related medical benefits. The $0.3 million increase in premises, equipment and insurance costs is due to increasing rent expense for leased properties and employer business insurance. The $0.4 million increase in marketing related expenses is due to marketing and customer promotions.
Total operating expenses as a percentage of sales decreased for the nine months ended March 31, 2017 to 27.8% compared to 29.0% for the nine months ended March 31, 2016.
Total Other Income (Expense). Total Other Income (Expense) includes interest expense, other income, and the change in the fair value of warrants. The primary driver for volatility in Other Income / (Expense) has been non-cash changes to the fair value of the warrant liabilities which are based on the Company’s stock price. Using the Black-Scholes model, the Company adjusts the warrant liability for fair value through the income statement quarterly. For the nine months ended March 31, 2017, the Company recorded a $1.5 million expense for the change in the fair value of warrant liabilities (all attributable to the quarter ended September 30, 2016) compared to the $5.7 million expense for the nine months ended March 31, 2016. As the warrants associated with the liability were exercised in September 2016, there will be no fair value expense recorded in subsequent periods.
Net Loss. Net loss is a function of the items described above. Net loss for the nine months ended March 31, 2017 was $2.1 million compared to a net loss of $5.9 million for the comparable period a year ago. The Company lost ($0.07) per share during the nine-month period as compared to a loss of ($0.18) per share during the prior corresponding nine-month period.
Adjusted EBITDA. For the nine months ended March 31, 2017, adjusted EBITDA decreased to $4.3 million from $5.4 million for the nine months ended March 31, 2016 or 19.8%. The decrease was primarily due to increased adjustments made for VendScreen non-recurring charges and litigation related professional fees during the prior corresponding nine-month period as well as favorable comparable operating results for the prior corresponding nine-month period after adjustment for the warrant liabilities.
Non-GAAP Net Income (Loss). Non-GAAP net loss decreased to ($0.4) million for the nine months ended March 31, 2017 compared to non-GAAP net income for the nine months ended March 31, 2016 of $0.7 million. The decrease was primarily due to increased adjustments made for VendScreen non-recurring charges and litigation related professional fees during the prior corresponding nine-month period as well as favorable comparable operating results for the prior corresponding nine-month period after adjustment for the warrant liabilities.
Weighted Average Shares Outstanding. The increase in the weighted average number of common shares was due to exercises of warrants and to stock issued pursuant to the Company’s stock compensation programs.
Reconciliation of Net Income (Loss) to Adjusted EBITDA for the nine months ended March 31, 2017 and 2016
|
Nine months ended
March 31, |
||||||||
|
($ in thousands)
|
2017
|
2016
|
||||||
|
Net income (loss)
|
$
|
(2,095
|
)
|
$
|
(5,934
|
)
|
||
|
Less interest income
|
(387
|
)
|
(138
|
)
|
||||
|
Plus interest expenses
|
601
|
403
|
||||||
|
Plus income tax provision / (Less income tax benefit)
|
94
|
88
|
||||||
|
Plus depreciation expense
|
3,642
|
3,863
|
||||||
|
Plus amortization expense
|
132
|
44
|
||||||
|
EBITDA
|
1,987
|
(1,674
|
)
|
|||||
|
Plus loss on fair value of warrant liabilities / (Less gain on fair value of warrant liabilities)
|
1,490
|
5,692
|
||||||
|
Plus stock-based compensation
|
678
|
651
|
||||||
|
Plus VendScreen non-recurring charges
|
109
|
584
|
||||||
|
Plus Litigation related professional fees
|
33
|
105
|
||||||
|
Adjustments to EBITDA
|
2,310
|
7,032
|
||||||
|
Adjusted EBITDA
|
$
|
4,297
|
$
|
5,358
|
||||
Reconciliation of Net Income (Loss) to Non-GAAP Net Income (Loss) for the nine months ended March 31, 2017 and 2016
|
Nine months ended
March 31, |
||||||||
|
($ in thousands, except per share data)
|
2017
|
2016
|
||||||
|
Net income (loss)
|
$
|
(2,095
|
)
|
$
|
(5,934
|
)
|
||
|
Non-GAAP adjustments:
|
||||||||
|
Non-cash portion of income tax provision
|
94
|
213
|
||||||
|
Fair value of warrant adjustment
|
1,490
|
5,692
|
||||||
|
VendScreen non-recurring charges
|
109
|
584
|
||||||
|
Litigation related professional fees
|
33
|
105
|
||||||
|
Non-GAAP net income (loss)
|
$
|
(369
|
)
|
$
|
660
|
|||
|
Net income (loss)
|
$
|
(2,095
|
)
|
$
|
(5,934
|
)
|
||
|
Cumulative preferred dividends
|
(668
|
)
|
(668
|
)
|
||||
|
Net income (loss) applicable to common shares
|
$
|
(2,763
|
)
|
$
|
(6,602
|
)
|
||
|
Non-GAAP net income (loss)
|
$
|
(369
|
)
|
$
|
660
|
|||
|
Cumulative preferred dividends
|
(668
|
)
|
(668
|
)
|
||||
|
Non-GAAP net income (loss) applicable to common shares
|
$
|
(1,037
|
)
|
$
|
(8
|
)
|
||
|
Net income (loss) per common share - basic and diluted
|
$
|
(0.07
|
)
|
$
|
(0.18
|
)
|
||
|
Non-GAAP net income (loss) per common share - basic and diluted
|
$
|
(0.03
|
)
|
$
|
(0.00
|
)
|
||
|
Basic and diluted weighted average number of common shares outstanding
|
39,703,690
|
35,972,633
|
||||||
Selling General & Administrative (SG&A) Expenses
|
Three months ended
|
||||||||||||||||
|
($ in thousands)
|
March 31,
2017 |
% of
SG&A |
March 31,
2016 |
% of
SG&A |
||||||||||||
|
Salaries and benefit costs
|
$
|
3,060
|
51.5
|
%
|
$
|
2,760
|
45.4
|
%
|
||||||||
|
Marketing related expenses
|
569
|
9.6
|
%
|
362
|
5.9
|
%
|
||||||||||
|
Professional services
|
1,472
|
24.8
|
%
|
1,152
|
18.9
|
%
|
||||||||||
|
Bad debt expense
|
127
|
2.0
|
%
|
505
|
8.3
|
%
|
||||||||||
|
Premises, equipment and insurance costs
|
482
|
8.1
|
%
|
460
|
7.5
|
%
|
||||||||||
|
Research and development expenses
|
95
|
1.6
|
%
|
131
|
2.1
|
%
|
||||||||||
|
VendScreen non-recurring charges
|
—
|
0.0
|
%
|
461
|
7.6
|
%
|
||||||||||
|
Litigation related professional fees
|
—
|
0.0
|
%
|
105
|
1.7
|
%
|
||||||||||
|
Other expenses
|
142
|
2.4
|
%
|
158
|
2.6
|
%
|
||||||||||
|
Total SG&A expenses
|
$
|
5,947
|
100
|
%
|
$
|
6,094
|
100
|
%
|
||||||||
|
Total Revenue
|
$
|
26,460
|
$
|
20,361
|
||||||||||||
|
SG&A expenses as a percentage of revenue
|
22.5
|
%
|
29.9
|
%
|
||||||||||||
Salaries and Benefit Costs. Includes employee compensation and benefits, directors’ fees, cash incentive bonus plans, and stock-based compensation. The increase in cost for the three months ended March 31, 2017 compared to three months ended March 31, 2016, related to an increase in employee headcount as we continue to expand our operations.
Marketing Related expenses. Marketing related costs include marketing activities and customer promotions.
Professional Services. Includes information technology, legal, public relations, auditing, SOX 404 and other consulting work. Professional service expense during the March 31, 2017 quarter increased by approximately $0.3 million from the professional service expense during the March 31, 2016 quarter, reflecting increases in SOX 404 compliance costs.
Bad Debt expense. Provision for bad debt reflects the most current assessment of reserves required.
Premises, equipment and insurance costs. Includes facilities, supplies, printing and postage, sales and use taxes, and workers’ compensation.
Research and development expenses. Includes product development costs that cannot be capitalized, including materials and contractors. Research and development costs decreased for the three-month period ended March 31, 2017 compared to the three-month period ended March 31, 2016 due to an increase in our capitalized production costs.
VendScreen Non-recurring charges. Reflects professional fees incurred in connection with the VendScreen integration.
Litigation related professional fees. Includes legal and other professional fees incurred in connection with the class action litigation as well as the investigation conducted by the Special Litigation Committee of the Board of Directors described in the section entitled “Business-Legal Proceedings” (the “SLC Investigation”).
Other expenses. Includes bank fees, recruiting expenses, non-inventory supplies, subscriptions, and the gain or loss on the disposal of assets.
|
Nine months ended
|
||||||||||||||||
|
($ in thousands)
|
March 31,
2017 |
% of
SG&A |
March 31,
2016 |
% of
SG&A |
||||||||||||
|
Salaries and benefit costs
|
$
|
9,038
|
48.5
|
%
|
$
|
8,231
|
52.6
|
%
|
||||||||
|
Marketing related expenses
|
1,476
|
7.9
|
%
|
1,030
|
6.6
|
%
|
||||||||||
|
Professional services
|
5,205
|
27.9
|
%
|
2,773
|
17.7
|
%
|
||||||||||
|
Bad debt expense
|
576
|
3.1
|
%
|
980
|
6.3
|
%
|
||||||||||
|
Premises, equipment and insurance costs
|
1,479
|
7.9
|
%
|
1,206
|
7.7
|
%
|
||||||||||
|
Research and development expenses
|
392
|
2.1
|
%
|
359
|
2.3
|
%
|
||||||||||
|
VendScreen non-recurring charges
|
109
|
0.6
|
%
|
584
|
3.7
|
%
|
||||||||||
|
Litigation related professional fees
|
33
|
0.2
|
%
|
105
|
0.7
|
%
|
||||||||||
|
Other expenses
|
341
|
1.8
|
%
|
384
|
2.4
|
%
|
||||||||||
|
Total SG&A expenses
|
$
|
18,649
|
100.0
|
%
|
$
|
15,652
|
100.0
|
%
|
||||||||
|
Total Revenue
|
$
|
69,804
|
$
|
55,464
|
||||||||||||
|
SG&A expenses as a percentage of revenue
|
26.7
|
%
|
28.2
|
%
|
||||||||||||
Salaries and Benefit Costs. Includes employee compensation and benefits, directors’ fees, incentives, and stock-based compensation. The increase in cost for the nine months ended March 31, 2017, related to increases in employee compensation, headcount (primarily due to the VendScreen acquisition), and employee health benefits.
Marketing Related expenses. Marketing related costs increased due to marketing activities and customer promotions.
Professional Services. Includes information technology, legal, public relations, auditing, SOX 404 and other consulting work. The increase for the nine months ended March 31, 2017 is related to SOX 404 compliance, internal audit, and audit of our financial statements driven primarily by our status as a first time accelerated filer which required an audit of our annual SOX 404 assessment.
Bad Debt expense. Provision for bad debt reflects the most current assessment of reserves required.
Premises, equipment and insurance costs. Includes facilities, supplies, printing and postage, sales and use taxes, and workers’ compensation. The increase for the nine months ended March 31, 2017 compared to the same period in 2016 is primarily attributable to increases in rent expense reflecting the addition of the Portland, Oregon office in January 2016 and the new lease agreement for the Malvern, Pennsylvania office.
Research and development expenses. Includes product development costs that cannot be capitalized, including materials and contractors.
Vendscreen Non-recurring charges. Reflects professional fees incurred in connection with the VendScreen integration.
Litigation related professional fees. Includes legal and other professional fees incurred in connection with the class action litigation as well as the SLC Investigation.
Other expenses. Includes bank fees, recruiting expenses, non-inventory supplies, and subscriptions.
FISCAL YEAR ENDED JUNE 30, 2016 COMPARED TO FISCAL YEAR ENDED JUNE 30, 2015
The following table sets forth our results of operations for the periods presented and as a percentage of our total revenues for those periods. The period-to-period comparison of our historical results is not necessarily indicative of the results that may be expected in the future.
|
For the years ended June 30,
|
||||||||||||||||||||||||
|
($ in thousands, except shares and per share data)
|
2016
|
% of Revenue
|
2015
|
% of Revenue
|
Change
|
% Change
|
||||||||||||||||||
|
Revenues:
|
||||||||||||||||||||||||
|
License and transaction fees
|
$
|
56,589
|
73.1
|
%
|
$
|
43,633
|
75.1
|
%
|
$
|
12,956
|
29.7
|
%
|
||||||||||||
|
Equipment sales
|
20,819
|
26.9
|
%
|
14,444
|
24.9
|
%
|
6,375
|
44.1
|
%
|
|||||||||||||||
|
Total revenues
|
77,408
|
100.0
|
%
|
58,077
|
100.0
|
%
|
19,331
|
33.3
|
%
|
|||||||||||||||
|
Costs of sales/revenues:
|
||||||||||||||||||||||||
|
Cost of services
|
38,089
|
49.2
|
%
|
29,429
|
50.7
|
%
|
8,660
|
29.4
|
%
|
|||||||||||||||
|
Cost of equipment
|
17,334
|
22.4
|
%
|
11,825
|
20.4
|
%
|
5,509
|
46.6
|
%
|
|||||||||||||||
|
Total costs of sales/revenues
|
55,423
|
71.6
|
%
|
41,254
|
71.0
|
%
|
14,169
|
34.3
|
%
|
|||||||||||||||
|
Gross profit
|
21,985
|
28.4
|
%
|
16,823
|
29.0
|
%
|
5,162
|
30.7
|
%
|
|||||||||||||||
|
Operating expenses:
|
||||||||||||||||||||||||
|
Selling, general and administrative
|
22,373
|
28.9
|
%
|
16,451
|
28.3
|
%
|
5,922
|
36.0
|
%
|
|||||||||||||||
|
Depreciation and amortization
|
647
|
0.8
|
%
|
612
|
1.1
|
%
|
35
|
5.7
|
%
|
|||||||||||||||
|
Impairment of intangible asset
|
432
|
0.6
|
%
|
-
|
0.0
|
%
|
432
|
100.0
|
%
|
|||||||||||||||
|
Total operating expenses
|
23,452
|
30.3
|
%
|
17,063
|
29.4
|
%
|
6,389
|
37.4
|
%
|
|||||||||||||||
|
Operating income (loss)
|
(1,467
|
)
|
(1.9
|
%)
|
(240
|
)
|
(0.4
|
%)
|
(1,227
|
)
|
511.3
|
%
|
||||||||||||
|
Other income (expense):
|
||||||||||||||||||||||||
|
Interest income
|
320
|
0.4
|
%
|
83
|
0.1
|
%
|
237
|
285.5
|
%
|
|||||||||||||||
|
Other income
|
-
|
52
|
0.1
|
%
|
(52
|
)
|
(100.0
|
%)
|
||||||||||||||||
|
Interest expense
|
(600
|
)
|
(0.8
|
%)
|
(302
|
)
|
(0.5
|
%)
|
(298
|
)
|
98.7
|
%
|
||||||||||||
|
Change in fair value of warrant liabilities
|
(5,674
|
)
|
(7.3
|
%)
|
(393
|
)
|
(0.7
|
%)
|
(5,281
|
)
|
1,343.8
|
%
|
||||||||||||
|
Total other expense, net
|
(5,954
|
)
|
(7.7
|
%)
|
(560
|
)
|
(1.0
|
%)
|
(5,394
|
)
|
963.2
|
%
|
||||||||||||
|
Income (loss) before income taxes
|
(7,421
|
)
|
(9.6
|
%)
|
(800
|
)
|
(1.4
|
%)
|
(6,621
|
)
|
827.6
|
%
|
||||||||||||
|
(Provision) benefit for income taxes
|
615
|
0.8
|
%
|
(289
|
)
|
(0.5
|
%)
|
904
|
(312.8
|
%)
|
||||||||||||||
|
Net income (loss)
|
(6,806
|
)
|
(8.8
|
%)
|
(1,089
|
)
|
(1.9
|
%)
|
(5,717
|
)
|
525.0
|
%
|
||||||||||||
|
Cumulative preferred dividends
|
(668
|
)
|
(0.9
|
%)
|
(668
|
)
|
(1.2
|
%)
|
--
|
0.0
|
%
|
|||||||||||||
|
Net loss applicable to common shares
|
$
|
(7,421
|
)
|
(9.7
|
%)
|
$
|
(1,757
|
)
|
(3.0
|
%)
|
$
|
(5,717
|
)
|
325.4
|
%
|
|||||||||
|
Net loss per common share - basic and diluted
|
$
|
(0.21
|
)
|
$
|
(0.05
|
)
|
$
|
(0.16
|
)
|
320.0
|
%
|
|||||||||||||
|
Basic and diluted weighted average number of common shares outstanding
|
36,309,047
|
35,719,211
|
589,836
|
1.7
|
%
|
|||||||||||||||||||
Revenues for the fiscal year ended June 30, 2016 were $77.4 million, consisting of $56.6 million of license and transactions fees and $20.8 million of equipment sales, compared to $58.0 million for the fiscal year ended June 30, 2015, consisting of $43.6 million of license and transaction fees and $14.4 million of equipment sales. The increase in total revenue from the prior year of $19.3 million, or 33%, was attributable to the 44% increase in equipment sales of $6.4 million and the 30% the increase in license and transaction fees of $13.0 million.
Revenue. Revenue from license and transaction fees, which represented 73% of total revenue for fiscal year 2016, is primarily attributable to monthly ePort Connect® service fees and transaction processing fees. Highlights for fiscal year 2016 include:
| ● |
Adding 96,000 net connections to our service, consisting of 110,000 new gross connections to our ePort Connect service in fiscal year 2016, offset by 11,000 deactivations from business churn and 3,000 attributable to a former customer against whom we have commenced litigation in order to seek to recover the amounts due to us from the former customer. The 96,000 net connections added compares to 67,000 net connections added in fiscal year 2015;
|
| ● |
As of June 30, 2016, we had approximately 429,000 connections to the ePort Connect service compared to approximately 333,000 connections to the ePort Connect service as of June 30, 2015, an increase of 96,000 net connections or 29%;
|
| ● |
Increases in the number of small-ticket, credit/debit transactions and dollars handled for fiscal year 2016 of 46% and 50%, respectively, compared to the same period a year ago; and
|
| ● |
ePort Connect customer base grew 15% from June 30, 2015.
|
The increase in license and transaction fees was due to the growth in ePort Connect service fees and transaction dollars that stems from the increased number of connections to our ePort Connect service.
Pursuant to our agreements with customers, in addition to ePort Connect service fees, we earn transaction processing fees equal to a percentage of the dollar volume processed by us. During the fiscal year ended June 30, 2016, we processed approximately 315.8 million transactions totaling approximately $584.4 million compared to approximately 216.6 million transactions totaling approximately $388.9 million during the fiscal year ended June 30, 2015, an increase of approximately 46% in the number of transactions and approximately 50% in the value of transactions processed.
New customers added to our ePort® Connect service during the fiscal year ended June 30, 2016 totaled 1,450, bringing the total number of customers to approximately 11,050 as of June 30, 2016. We added approximately 2,300 new customers in the year ended June 30, 2015. We had approximately 9,600 customers as of June 30, 2015, representing a 15% increase during the past twelve months. We view the total installed base of machines managed by our customers that have yet to transition to cashless payment as a key strategic opportunity for future growth in connections. We count a customer as a new customer upon the signing of their ePort Connect service agreement. When a reseller sells our ePort, we count a customer as a new customer upon the signing of the applicable services agreement with the customer.
The $6.4 million increase in equipment sales was primarily attributable to selling more units, versus renting units via the JumpStart program, during the current fiscal year due to the reintroduction of the QuickStart program in September 2014.
Cost of sales consisted of cost of services for license and transaction fees of $38.1 million and $29.4 million and equipment costs of $17.3 million and $11.8 million for the fiscal years ended June 30, 2016 and 2015, respectively. The increase in total cost of sales of $14.2 million, or 34%, was partially due to an increase in cost of equipment sales of $5.5 million primarily due to selling more units during the period under the QuickStart program. There was also an increase in cost of services of $8.7 million that stemmed from the increase in transaction dollars processed by the greater number of connections to our ePort Connect service.
Gross Profit. Gross profit for the fiscal year ended June 30, 2016 was $22.0 million compared to gross profit of $16.9 million for the previous fiscal year, an increase of $5.1 million, or 30%, of which $4.3 million is attributable to license and transaction fees gross profit and $0.9 million of equipment sales gross profit.
Gross Margin. Overall gross margins declined from 29.0% in the 2015 fiscal year to 28.4% in the fiscal year ended June 30, 2016, composed of an increase in license and transaction fees’ margin to 32.7% from 32.6% in the prior fiscal year, and a decrease in equipment sales margin from 18.1% in the prior fiscal year to 16.7% in the fiscal year ended June 30, 2016.
Selling, general and administrative (“SG&A”) expenses of $22.4 million for the fiscal year ended June 30, 2016, increased by $5.9 million or 36%, from the prior fiscal year. SG&A expenses for the 2016 fiscal year reflects the following: $1.6 million of costs incurred in connection with the VendScreen acquisition and integration as well as operating expenses of the VendScreen business; bad debt expense of $1.5 million; $0.7 million of professional fees and expenses incurred in connection with management’s annual assessment of internal controls over financial reporting required under SOX 404; and $0.3 million of professional fees incurred in connection with the class action litigation and SLC investigation.
Other income and expense for the fiscal year ended June 30, 2016, primarily consisted of a $5.7 million non-cash charge for the change in the fair value of our warrant liabilities. The primary factor affecting the change in fair value is the increase in the Black-Scholes value of the warrants from June 30, 2015 to June 30, 2016, which factored in the increase in our stock price as well as a decrease in its volatility used for this calculation during that period.
The fiscal year ended June 30, 2016 resulted in net loss of $6.8 million compared to a net loss of $1.1 million for the fiscal year ended June 30, 2015. The net loss for the fiscal year reflected the $5.7 million non-cash charge for the change in the fair value of warrant liability described in the prior paragraph after preferred dividends of $0.7 million for each fiscal year, net loss applicable to common shareholders was $7.5 million and $1.8 million for the fiscal years ended 2016 and 2015, respectively. For the fiscal year ended June 30, 2016, net loss per common share (basic and diluted) was $0.21, compared to net loss per common share (basic and diluted) of $0.05 for the fiscal year ended June 30, 2015.
Non-GAAP net loss was $0.7 million for the fiscal year ended June 30, 2016 compared to non-GAAP net loss of $.5 million for fiscal year ended June 30, 2015.
A reconciliation of net loss to Non-GAAP net loss for the fiscal years ended June 30, 2016 and 2015 is as follows:
|
Year ended
|
||||||||
|
($ in thousands)
|
June 30,
2016 |
June 30,
2015 |
||||||
|
Net loss
|
$
|
(6,806
|
)
|
$
|
(1,089
|
)
|
||
|
Non-GAAP adjustments:
|
||||||||
|
Non-cash portion of income tax provision
|
(579
|
)
|
226
|
|||||
|
Fair value of warrant adjustment
|
5,674
|
393
|
||||||
|
VendScreen non-recurring charges
|
842
|
-
|
||||||
|
Litigation related professional fees
|
156
|
-
|
||||||
|
Non-GAAP net loss
|
$
|
(713
|
)
|
$
|
(470
|
)
|
||
|
Net loss
|
$
|
(6,806
|
)
|
$
|
(1,089
|
)
|
||
|
Cumulative preferred dividends
|
(668
|
)
|
(668
|
)
|
||||
|
Net loss applicable to common shares
|
$
|
(7,474
|
)
|
$
|
(1,757
|
)
|
||
|
Non-GAAP net loss
|
$
|
(713
|
)
|
$
|
(470
|
)
|
||
|
Cumulative preferred dividends
|
(668
|
)
|
(668
|
)
|
||||
|
Non-GAAP net loss applicable to common shares
|
$
|
(1,381
|
)
|
$
|
(1,138
|
)
|
||
|
Net loss per common share - basic and diluted
|
$
|
(0.21
|
)
|
$
|
(0.05
|
)
|
||
|
Non-GAAP net loss per common share - basic and diluted
|
$
|
(0.04
|
)
|
$
|
(0.03
|
)
|
||
|
Basic and diluted weighted average number of common shares outstanding
|
36,309,047
|
35,719,211
|
||||||
For the fiscal year ended June 30, 2016, we had Adjusted EBITDA of $6.0 million. Reconciliation of net income (loss) to Adjusted EBITDA for the fiscal years ended June 30, 2016 and 2015 is as follows:
|
Year ended
|
||||||||
|
($ in thousands)
|
June 30,
2016 |
June 30,
2015 |
||||||
|
Net loss
|
$
|
(6,806
|
)
|
$
|
(1,089
|
)
|
||
|
Less interest income
|
(320
|
)
|
(83
|
)
|
||||
|
Plus interest expenses
|
600
|
302
|
||||||
|
(Less) plus income tax provision
|
(615
|
)
|
289
|
|||||
|
Plus depreciation expense
|
5,135
|
5,731
|
||||||
|
Plus amortization expense
|
87
|
-
|
||||||
|
EBITDA
|
(1,919
|
)
|
5,150
|
|||||
|
Plus change in fair value of warrant liabilities
|
5,674
|
393
|
||||||
|
Plus stock-based compensation
|
849
|
716
|
||||||
|
Plus intangible asset impairment
|
432
|
-
|
||||||
|
Plus VendScreen non-recurring charges
|
842
|
-
|
||||||
|
Plus Litigation related professional fees
|
105
|
-
|
||||||
|
Adjustments to EBITDA
|
7,901
|
1,109
|
||||||
|
Adjusted EBITDA
|
$
|
5,983
|
$
|
6,259
|
||||
FISCAL YEAR ENDED JUNE 30, 2015 COMPARED TO FISCAL YEAR ENDED JUNE 30, 2014
The following table sets forth our results of operations for the periods presented and as a percentage of our total revenues for those periods. The period-to-period comparison of our historical results is not necessarily indicative of the results that may be expected in the future.
|
For the years ended June 30,
|
||||||||||||||||||||||||
|
($ in thousands, except shares and per share data)
|
2015
|
% of Revenue
|
2014
|
% of Revenue
|
Change
|
% Change
|
||||||||||||||||||
|
Revenues:
|
||||||||||||||||||||||||
|
License and transaction fees
|
$
|
43,633
|
75.1
|
%
|
$
|
35,638
|
84.2
|
%
|
$
|
7,995
|
22.4
|
%
|
||||||||||||
|
Equipment sales
|
14,444
|
24.9
|
%
|
6,707
|
15.8
|
%
|
7,737
|
115.4
|
%
|
|||||||||||||||
|
Total revenues
|
58,077
|
100.0
|
%
|
42,345
|
100.0
|
%
|
15,732
|
37.2
|
%
|
|||||||||||||||
|
Costs of sales/revenues:
|
||||||||||||||||||||||||
|
Cost of services
|
29,429
|
50.7
|
%
|
23,018
|
54.4
|
%
|
6,411
|
27.9
|
%
|
|||||||||||||||
|
Cost of equipment
|
11,825
|
20.4
|
%
|
4,254
|
10.0
|
%
|
7,571
|
178.0
|
%
|
|||||||||||||||
|
Total costs of sales/revenues
|
41,254
|
71.0
|
%
|
27,272
|
64.4
|
%
|
13,982
|
51.3
|
%
|
|||||||||||||||
|
Gross profit
|
16,823
|
29.0
|
%
|
15,073
|
35.6
|
%
|
1,750
|
11.6
|
%
|
|||||||||||||||
|
Operating expenses:
|
||||||||||||||||||||||||
|
Selling, general and administrative
|
16,451
|
28.3
|
%
|
14,036
|
33.1
|
%
|
2,415
|
17.2
|
%
|
|||||||||||||||
|
Depreciation and amortization
|
612
|
1.1
|
%
|
600
|
1.4
|
%
|
12
|
2.0
|
%
|
|||||||||||||||
|
Total operating expenses
|
17,063
|
29.4
|
%
|
14,636
|
34.6
|
%
|
2,427
|
16.6
|
%
|
|||||||||||||||
|
Operating income (loss)
|
(240
|
)
|
(0.4
|
%)
|
437
|
1.0
|
%
|
(677
|
)
|
(154.9
|
%)
|
|||||||||||||
|
Other income (expense):
|
||||||||||||||||||||||||
|
Interest income
|
83
|
0.1
|
%
|
30
|
0.1
|
%
|
53
|
176.7
|
%
|
|||||||||||||||
|
Other income
|
52
|
0.1
|
%
|
-
|
0.0
|
%
|
52
|
100.0
|
%
|
|||||||||||||||
|
Interest expense
|
(302
|
)
|
(0.5
|
%)
|
(257
|
)
|
(0.6
|
%)
|
(45
|
)
|
17.5
|
%
|
||||||||||||
|
Change in fair value of warrant liabilities
|
(393
|
)
|
(0.7
|
%)
|
66
|
0.2
|
%
|
(459
|
)
|
(695.5
|
%)
|
|||||||||||||
|
Total other expense, net
|
(560
|
)
|
(1.0
|
%)
|
(161
|
)
|
(0.4
|
%)
|
(399
|
)
|
247.8
|
%
|
||||||||||||
|
Income (loss) before income taxes
|
(800
|
)
|
(1.4
|
%)
|
276
|
0.7
|
%
|
(1,076
|
)
|
(389.9
|
%)
|
|||||||||||||
|
(Provision) benefit for income taxes
|
(289
|
)
|
(0.5
|
%)
|
27,255
|
64.4
|
%
|
(27,544
|
)
|
(101.1
|
%)
|
|||||||||||||
|
Net income (loss)
|
(1,089
|
)
|
(1.9
|
%)
|
27,531
|
65.0
|
%
|
(28,620
|
)
|
(104.0
|
%)
|
|||||||||||||
|
Cumulative preferred dividends
|
(668
|
)
|
(1.2
|
%)
|
(668
|
)
|
(1.6
|
%)
|
-
|
0.0
|
%
|
|||||||||||||
|
Net loss applicable to common shares
|
$
|
(1,757
|
)
|
(3.0
|
%)
|
$
|
26,863
|
63.4
|
%
|
$
|
(28,620
|
)
|
(106.5
|
%)
|
||||||||||
|
Net loss per common share - basic
|
$
|
(0.05
|
)
|
$
|
0.77
|
$
|
(0.82
|
)
|
(106.5
|
%)
|
||||||||||||||
|
Net loss per common share - diluted
|
$
|
(0.05
|
)
|
$
|
0.77
|
$
|
(0.82
|
)
|
(106.5
|
%)
|
||||||||||||||
|
Basic weighted average number of common shares outstanding
|
35,719,211
|
34,667,769
|
1,051,442
|
3.0
|
%
|
|||||||||||||||||||
|
Diluted weighted average number of common shares outstanding
|
35,719,211
|
35,009,559
|
709,652
|
2.0
|
%
|
|||||||||||||||||||
Revenues for the fiscal year ended June 30, 2015 were $58.1 million, consisting of $43.6 million of license and transactions fees and $14.4 million of equipment sales, compared to $42.3 million for the fiscal year ended June 30, 2014, consisting of $35.6 million of license and transaction fees and $6.7 million of equipment sales. The increase in total revenue of $15.7 million, or 37%, was equally attributable to the increase in equipment sales of $7.7 million or 115% and the increase in license and transaction fees of $8.0 million, or 22%, from the prior year.
Revenue from license and transaction fees, which represented 75% of total revenue for fiscal 2015, is primarily attributable to monthly ePort Connect® service fees and transaction processing fees. Highlights for fiscal 2015 include:
| ● |
Adding 67,000 net connections to our service, consisting of 82,000 new connections to our ePort Connect service in fiscal 2015, offset by 15,000 deactivations, compared to 52,000 net connections added in fiscal 2014;
|
| ● |
As of June 30, 2015, we had approximately 333,000 connections to the ePort Connect service compared to approximately 266,000 connections to the ePort Connect service as of June 30, 2014, an increase of 67,000 net connections or 25%;
|
| ● |
Increases in the number of small-ticket, credit/debit transactions and dollars handled for fiscal 2015 of 29% and 32%, respectively, compared to the same period a year ago; and
|
| ● |
ePort Connect customer base grew 32% from June 30, 2014.
|
The increase in license and transaction fees was due to the growth in ePort Connect service fees and transaction dollars that stems from the increased number of connections to our ePort Connect service.
Pursuant to its agreements with customers, in addition to ePort Connect service fees, we earn transaction processing fees equal to a percentage of the dollar volume processed by us. During the year ended June 30, 2015, we processed approximately 216.6 million transactions totaling approximately $388.9 million compared to approximately 168.5 million transactions totaling approximately $293.8 million during the year ended June 30, 2014, an increase of approximately 29% in the number of transactions and approximately 32% in the value of transactions processed.
New customers added to our ePort® Connect service during the fiscal year ended June 30, 2015 totaled 2,300, bringing the total number of customers to approximately 9,600 as of June 30, 2015. We added approximately 2,250 new customers in the year ended June 30, 2014. By comparison, we had approximately 7,300 customers as of June 30, 2014, representing a 32% increase during the past twelve months. We view the total installed base of machines managed by our customers that have yet to transition to cashless payment, as a key strategic opportunity for future growth in connections. We count a customer as a new customer upon the signing of their ePort Connect service agreement. When a reseller sells our ePort, we count a customer as a new customer upon the signing of the applicable services agreement with the customer.
The $7.7 million increase in equipment sales was a result of an increase of approximately $8.1 million related to ePort® products, offset by decreases of approximately $0.4 million in Energy Miser products. The increase in ePort products is directly attributable to selling more units, versus renting units via the JumpStart program, during the current fiscal year due to the reintroduction of the QuickStart program in September 2014. The decrease in Energy Miser products is directly attributable to selling fewer units during the current fiscal year.
Cost of sales consisted of cost of services for license and transaction fees of $29.4 million and $23.0 million and equipment costs of $11.8 million and $4.3 million, for the years ended June 30, 2015 and 2014, respectively. The increase in total cost of sales of $14.0 million, or 51%, was due to an increase in cost of equipment sales of $7.6 million due to selling more units during the period under the QuickStart program. In fiscal 2014, the JumpStart program accounted for a significant percentage of our net new connections. Under this program, the cost of the device is depreciated to cost of services for license and transaction fees over the expected rental period. There was also an increase in cost of services of $6.4 million that stemmed from the greater number of connections to our ePort Connect service and increases in transaction dollars processed by those connections.
Gross profit for the year ended June 30, 2015 was $16.8 million compared to gross profit of $15.1 million for the previous fiscal year, an increase of $1.7 million, or 12%, of which $14.2 million is attributable to license and transaction fees gross profit and $2.6 million of equipment sales gross profit. Overall gross profit margins decreased from 36% to 29% due to a decrease in license and transaction fees margins to 33%, from 35% in the prior fiscal year and by a decrease in equipment sales margins to 18%, from 37% in the prior fiscal year.
License and transaction fees margins decreased due to the impact of certain JumpStart connections added during the third and fourth quarters of 2014 fiscal year with fee grace periods extending into fiscal year 2015 under sales incentives, as well as approximately $1.7 million of net rent expense during the year ended June 30, 2015 related to the Sale Leaseback transactions, which is approximately $0.5 million higher than the depreciation we would have recorded on the ePorts during the same period had the Sale Leaseback transactions not occurred. Also contributing to the decrease of license and transaction fee margins was a charge of approximately $0.4 million in connection with a customer billing dispute.
The decrease in equipment revenue margins is attributable to sales under the QuickStart program, which has generally lower margins than what is recognized under a rental, or JumpStart. In addition, there were approximately $0.9 million less in activation fees recorded during fiscal 2015 versus fiscal 2014, which are a higher margin revenue source, and to date have not been part of the QuickStart program.
The $0.2 million increase in equipment sales gross profit includes one-time recoveries of $0.7 million and $0.2 million in the years ended June 30, 2015 and 2014, respectively. The $0.7 million relates to recoveries arising from a customer agreement; and, the $0.2 million was a reversal of a prior charge for equipment rebates. Excluding these one-time items, equipment sales gross profit decreased $0.4 million from the prior year, which was mostly attributable to having $0.9 million less gross profit from ePort activation fees, which are a higher margin revenue source and which to date are not part of the QuickStart Program and $0.2 million less gross profit related to fewer energy miser offset by a higher dollar volume of gross profit from the large increase in equipment revenue dollars as compared to a year ago.
Selling, general and administrative (“SG&A”) expenses of $16.5 million for the fiscal year ended June 30, 2015, increased by $2.4 million or 17%, from the prior fiscal year. Approximately $1.1 million, or 47% of the increase, were non-cash expenses. The overall increase in SG&A is attributable to increases of approximately $1.1 million in bad debt estimates, $0.6 million in employee and director compensation and benefits expenses, $0.6 million in consulting and professional services, and by a net increase of $0.2 million for various other expenses.
Other income and expense for the year ended June 30, 2015, primarily consisted of a $0.4 million non-cash charge for the change in the fair value of our warrant liabilities. The primary factor affecting the change in fair value is the increase in the Black-Scholes value of the warrants from June 30, 2014 to June 30, 2015, which factored in the increase in our stock price as well as a decrease in its volatility used for this calculation during that period.
The fiscal year ended June 30, 2015 resulted in net loss of $1.1 million compared to net income of $27.5 million for the fiscal year ended June 30, 2014. Included in net income for the fiscal year ended June 30, 2014 is a benefit from a reduction in income tax valuation allowances of $26.7 million. After preferred dividends of $0.7 million for each fiscal year, net (loss)/income applicable to common shareholders was ($1.8 million) and $26.9 million for the fiscal years ended 2015 and 2014, respectively. For the fiscal year ended June 30, 2015, net loss per common share (basic and diluted) was $0.05, compared to net earnings per common share (basic and diluted) of $0.78.
Non-GAAP net loss was $0.5 million for the year ended June 30, 2015, compared to non-GAAP net income of $0.2 million for the year ended June 30, 2014. Management believes that non-GAAP net income is an important measure of USAT’s business. Management uses the aforementioned non-GAAP measures to monitor and evaluate ongoing operating results and trends and to gain an understanding of our comparative operating performance. We believe that non-GAAP financial measures serve as useful metrics for our management and investors because they enable a better understanding of the long-term performance of our core business and facilitate comparisons of our operating results over multiple periods, and when taken together with the corresponding GAAP (United States’ Generally Accepted Accounting Principles) financial measures and our reconciliations, enhance investors’ overall understanding of our current and future financial performance.
A reconciliation of net income to Non-GAAP net income for the years ended June 30, 2015 and 2014 is as follows:
Reconciliation of Net Income (Loss) to Non-GAAP Net Income (Loss) and Net Earnings (Loss) Per Common
Share - Basic and Diluted to Non-GAAP Net Earnings (Loss) Per Common Share - Basic and Diluted
|
Year ended
|
||||||||
|
($ in thousands)
|
June 30,
2015 |
June 30,
2014 (1) |
||||||
|
Net income (loss)
|
$
|
(1,089
|
)
|
$
|
27,531
|
|||
|
Non-GAAP adjustments:
|
||||||||
|
Non-cash portion of income tax provision
|
226
|
(27,277
|
)
|
|||||
|
Fair value of warrant adjustment
|
393
|
(66
|
)
|
|||||
|
Non-GAAP net income (loss)
|
$
|
(470
|
)
|
$
|
188
|
|||
|
Net income (loss)
|
$
|
(1,089
|
)
|
$
|
27,531
|
|||
|
Cumulative preferred dividends
|
(668
|
)
|
(668
|
)
|
||||
|
Net loss applicable to common shares
|
$
|
(1,757
|
)
|
$
|
26,863
|
|||
|
Non-GAAP net income (loss)
|
$
|
(470
|
)
|
$
|
188
|
|||
|
Cumulative preferred dividends
|
(668
|
)
|
(668
|
)
|
||||
|
Non-GAAP net income (loss) applicable to common shares
|
$
|
(1,138
|
)
|
$
|
(480
|
)
|
||
|
Net earnings (loss) per common share - basic
|
$
|
(0.05
|
)
|
$
|
0.77
|
|||
|
Net earnings (loss) per common share - diluted
|
$
|
(0.05
|
)
|
$
|
0.77
|
|||
|
Non-GAAP net earnings (loss) per common share - basic
|
$
|
(0.03
|
)
|
$
|
(0.01
|
)
|
||
|
Non-GAAP net earnings (loss) per common share - diluted
|
$
|
(0.03
|
)
|
$
|
(0.01
|
)
|
||
|
Basic weighted average number of common shares outstanding
|
35,719,211
|
34,667,769
|
||||||
|
Diluted weighted average number of common shares outstanding
|
35,719,211
|
35,009,559
|
||||||
| (1) |
Net income for the year ended June 30, 2014 includes an income tax benefit of $27.3 million for the reduction on tax valuation allowances.
|
For the fiscal year ended June 30, 2015, we had Adjusted EBITDA of $6.3 million. Reconciliation of net income (loss) to Adjusted EBITDA for the years ended June 30, 2015 and 2014 is as follows:
|
For year ended
|
||||||||
|
($ in thousands)
|
June 30,
2015 |
June 30,
2014 |
||||||
|
Net loss
|
$
|
(1,089
|
)
|
$
|
27,531
|
|||
|
Less interest income
|
(83
|
)
|
(30
|
)
|
||||
|
Plus interest expenses
|
302
|
257
|
||||||
|
(Less) plus income tax provision
|
289
|
(27,255
|
)
|
|||||
|
Plus depreciation expense
|
5,731
|
5,464
|
||||||
|
Plus amortization expense
|
-
|
22
|
||||||
|
EBITDA
|
5,150
|
5,989
|
||||||
|
Less change in fair value of warrant liabilities
|
393
|
(66
|
)
|
|||||
|
Plus stock-based compensation
|
716
|
529
|
||||||
|
Adjustments to EBITDA
|
1,109
|
463
|
||||||
|
Adjusted EBITDA
|
$
|
6,259
|
$
|
6,452
|
||||
LIQUIDITY AND CAPITAL RESOURCES
To date, we have financed our operations primarily through cash from operating activities, borrowings under our bank line of credit, along with equity issuances. Our principal source of liquidity is cash totaling $19.27 million and $17.78 million as of June 30, 2016 and March 31, 2017, respectively.
We have incurred cumulative losses of $181 million from our operations through June 30, 2016 and expect to incur additional losses in the future. We believe that our existing sources of liquidity will be sufficient to fund our operations for at least the next 12 months. However, our future capital requirements will depend on many factors, including our rate of revenue growth, the expansion of our sales and marketing activities and the timing and extent of our spending to support our research and development efforts. To the extent that existing cash and cash from operations are insufficient to fund our future activities, we may need to raise additional funds through public or private equity or debt financing. In the event that additional financing is required from outside sources, we may be unable to raise the funds on acceptable terms, if at all. If we are unable to raise additional capital when desired, our business, operating results and financial condition could be adversely affected.
Cash Flows
The following table shows a summary of our cash flows for the fiscal years ended June 30, 2016, 2015 and 2014 and for the nine months ended March 31, 2016 and 2017:
|
Year Ended June 30,
|
Nine Months Ended
March 31, |
|||||||||||||||||||
|
2016
(in thousands) |
2015
(in thousands) |
2014
(in thousands) |
2017
(unaudited) |
2016
(unaudited) |
||||||||||||||||
|
Cash at beginning of period
|
$
|
11,374
|
$
|
9,072
|
$
|
5,981
|
$
|
19,272
|
$
|
11,374
|
||||||||||
|
Net cash provided by (used in) operating activities
|
6,468
|
(1,698
|
)
|
7,085
|
(4,295
|
)
|
5,197
|
|||||||||||||
|
Net cash used in investing activities
|
(5,772
|
)
|
3,354
|
(7,917
|
)
|
(2,713
|
)
|
(5,832
|
)
|
|||||||||||
|
Net cash provided by (used in) financing activities
|
7,202
|
646
|
3,923
|
5,516
|
4,162
|
|||||||||||||||
|
Effects of exchange rates on cash
|
--
|
--
|
--
|
--
|
--
|
|||||||||||||||
|
Cash at end of period
|
$
|
19,272
|
$
|
11,374
|
$
|
9,072
|
$
|
17,780
|
$
|
14,901
|
||||||||||
Fiscal Year Ended June 30, 2016
Operating Activities
For the year ended June 30, 2016, net cash provided by operating activities was $6.5 million. The foregoing reflects a net benefit for non-cash operating activities of $12.0 million, and net cash provided by the change in various operating assets and liabilities of $1.3 million. Of the $12.0 million of non-cash activities, $5.1 million related to depreciation expense, of which, $4.5 million related to depreciation on JumpStart equipment allocated to cost of services. In addition to depreciation expense, other major non-cash charges included $1.5 million of bad debt expense and $5.7 million expense due to the increase in the fair value of warrant liabilities.
During the fiscal year ended June 30, 2015, we reintroduced QuickStart, a program whereby our customers are able to purchase our ePort hardware via a five-year, non-cancellable lease. From its introduction in September 2014 and through approximately mid-March 2015, we wer entering into these leases directly with our customers. We recorded a long-term and short-term receivable for the five-year leases. In the third and fourth quarters of fiscal 2015, we signed vendor agreements with two leasing companies, whereby our customers would enter into leases directly with the leasing companies. We invoice the leasing company for the equipment leased by our customer, and record an accounts receivable for the balances due from the leasing companies. Unlike its finance receivables, where the cash would be collected over a five-year period, the accounts receivable due from the leasing company is typically collected within 30 days. QuickStart through third-party leasing companies increases cash flow needed for investing activities and improves cash flows from operations. We previously financed our customer's acquisition of ePort equipment primarily though the JumpStart program. Under JumpStart, we record an investing capital expenditure cash outflow for the equipment provided and fixed assets on the balance sheet, and then receive rental income from a month-to-month lease. During the fiscal year ended June 30, 2016, the majority of QuickStart sales consummated were with the customer entering into the lease directly with a third party leasing company. During the 2016 fiscal year, 91% of our gross connections consisted of QuickStart and sales under normal receivable terms and 9% of our gross connections consisted of JumpStart units.
By contrast, during the 2014 fiscal year, JumpStart units accounted for 60% of our gross connections. The increased use by our customers of the QuickStart program, with third party leasing, significantly improves cash flows from operating activities. We believe we will continue to be able to utilize third party leasing companies in our QuickStart program, which will increase our cash flow. However, some customers may be unable to secure third party leasing, and in those cases we would enter into a lease directly with the customer which would result in an increase in finance receivables. Accordingly, with the continued success of the QuickStart third-party leasing program, we should continue to generate positive cash flow from operations.
Investing Activities
During the fiscal year ended June 30, 2016, $5.8 million of cash was used by investing activities of which $5.6 million was the cash paid for the assets acquired from VendScreen during the third quarter.
Financing Activities
Net cash provided by financing activities was $7.2 million, generated predominantly by $4.9 million from the exercise of common stock warrants and $2.5 million net borrowings under the line of credit. During the fiscal year, we increased the aggregate amount available to us under our working capital line of credit from $7.5 million to $12 million.
During the 2016 and 2015 fiscal years, our net increase in cash was $7.9 million and $2.3 million, respectively. We have the following primary sources of capital available: (1) cash and cash equivalents on hand of $19.3 million as of June 30, 2016; (2) the anticipated cash to be provided by operating activities including our QuickStart program; (3) $4.8 million available as of June 30, 2016 under the line of credit provided we continue to satisfy the various covenants set forth in the loan agreement, including the requirement to meet minimum quarterly adjusted EBITDA, as defined in the loan agreement; (4) proceeds of $6.2 million from the potential exercise of warrants outstanding as of June 30, 2016 which expire on September 18, 2016; and (5) sales to a third party lender of all or a portion of our finance receivables.
Fiscal Quarter and Nine Months Ended March 31, 2017
Operating Activities
Operating cash flow of $0.8 million for the quarter ended March 31, 2017 decreased $3.5 million from the quarter ended March 31, 2016. Reasons for this included:
| · |
We secured late in the March 31, 2017 quarter a large contract which was the primary cause of the finance receivables cash effect of ($3.9) million;
|
| · |
Accounts receivable cash effect of $1.6 million primarily due to a decrease in net amounts due from customers for ePort Connect service; and
|
| · |
Accounts payable and accrued expenses cash effect of ($2.7) million primarily due to the timing of payments;
|
Investing Activities
For the same quarter to quarter period, net cash used by investing activities decreased $4.9 million, primarily due to the $5.6 million cash outlay for the purchase of Vendscreen in January 2016 offset by a cash outlay of $0.7 million during the March 31, 2017 quarter for property for rental program.
Financing Activities
For the same quarter to quarter period, net cash from financing activities decreased $1.8 million, primarily due to a decrease in proceeds from the exercise of warrants of $1.7 million.
Operating Activities
Operating cash flow for the nine months ended March 31, 2017 decreased $9.5 million from the nine month period ended March 31, 2016. Primary components which contributed were:
| · |
Finance receivable cash effect of $(1.4) million primarily due to a current quarter large contract offset by increased fundings;
|
| · |
Accounts payable and accrued expenses cash effect of ($3.9) million primarily due to timing of payments; and
|
| · |
Inventory cash effect of $(3.2) million primarily due to inventory growth to meet expected demand;
|
Investing Activities
For the same nine month periods, net cash used by investing activities decreased $3.1 million, primarily due to the $5.6 million cash outlay for the purchase of VendScreen in January 2016, offset by a $2.0 million increase in purchase of property for the rental program and a $0.5 million increase in the purchase and additions of property and equipment.
Financing Activities
For the same nine month periods, net cash provided by financing activities increased $1.4 million, primarily due to an increase in proceeds from the exercise of warrants of $4.5 million offset by a decrease in proceeds from the line of credit of $3.0 million.
In September 2014, we reintroduced QuickStart, a program whereby our customers are able to purchase our ePort hardware via a five-year, non-cancellable finance agreement. Under the QuickStart program, we sell the equipment to customers and create a long-term and current finance receivable for five-year agreements. In the third and fourth quarters of fiscal 2015, we signed vendor agreements with two finance companies, whereby our customers would enter into agreements directly with the finance companies as part of our QuickStart program. We invoice the finance company for the equipment financed by our customer, and typically receive full payment within thirty days. Prior to the reintroduction of QuickStart, we had financed our customers’ acquisition of ePort equipment primarily through the JumpStart rental program. Under Jumpstart, we record an investing capital expenditure cash outflow for the equipment provided and fixed assets on the balance sheet, and then receive rental income from a month-to-month lease. Customers who utilize third party finance companies in connection with the QuickStart program improve our cash flow from operations, and our QuickStart program reduces cash flow needed for investing activities otherwise incurred by us for our JumpStart program.
Since entering into vendor agreements with two third-party finance companies, the majority of QuickStart sales consummated have been with customers entering into agreements directly with the finance companies. Our customers have shifted from acquiring our products via JumpStart, which accounted for 65% of our gross connections in fiscal year 2014, to QuickStart and sales under normal trade receivable terms, which accounted for 89% and 91% of our gross connections in fiscal year 2015 and 2016, respectively. JumpStart was approximately 8.6% of gross connections in the three months ending March 31, 2017.
We are seeking to expand our outside financing partners in order to accommodate expected growth.
Sources of Cash
Our net working capital, which is defined as current assets less current liabilities, was $11.9 million, $14.8 million, $14.0 million, $4.9 million, and ($0.2) million over the last five quarter-end reporting dates beginning March 31, 2017 and ending March 31, 2016. As of March 31, 2017, our primary sources of cash include:
| · |
Cash on hand of approximately $17.8 million;
|
| · |
$5.0 million available under the line of credit provided we continue to satisfy the various covenants set forth in the loan agreement, including the requirement to meet minimum quarterly adjusted EBITDA, as defined in the loan agreement;
|
| · |
Sales to third party lenders of all or a portion of our finance receivables which may occur in future quarters; and
|
| · |
Anticipated cash which may be provided by operating activities in future quarters.
|
We believe our existing cash and available cash resources described above, would provide sufficient capital resources to operate our anticipated business over the next twelve months.
CONTRACTUAL OBLIGATIONS
As of June 30, 2016, we had certain contractual obligations due over a period of time as summarized in the following table:
|
Payments due by period
|
||||||||||||||||||||
|
Contractual Obligations
|
Total
|
Less Than
1 year |
1-3 years
|
3-5 years
|
More than
5 years
|
|||||||||||||||
|
Long-Term Debt Obligations
|
$
|
1,906
|
$
|
509
|
$
|
1,392
|
$
|
5
|
$
|
-
|
||||||||||
|
Capital Lease Obligations
|
677
|
299
|
378
|
-
|
-
|
|||||||||||||||
|
Operating Lease Obligations, other
|
3,443
|
552
|
1,460
|
1,431
|
-
|
|||||||||||||||
|
Operating Lease Obligations under Sale Leaseback
|
2,779
|
2,641
|
138
|
-
|
-
|
|||||||||||||||
|
Total
|
$
|
8,805
|
$
|
4,001
|
$
|
3,368
|
$
|
1,436
|
$
|
-
|
||||||||||
Quantitative and Qualitative Disclosures About Market Risk.
We have limited exposure to market risks from instruments that may impact our Balance Sheets, Statements of Operations, or Statements of Cash Flows. Our exposure to market risks for interest rate changes is not significant because interest rates on its long-term debt are generally fixed. We have no exposure to market risks related to available-for-sale securities. Additionally, market risks related to fluctuations of foreign currency exchange rates are not significant and we have no derivative instruments.
Changes in and Disagreements with Accountants on Accounting and Financial Disclosure.
None.
OVERVIEW
USA Technologies, Inc. (the “Company”, “we”, “USAT”, or “our”) was incorporated in the Commonwealth of Pennsylvania in January 1992. We are a provider of technology-enabled solutions and value-added services that facilitate electronic payment transactions primarily within the unattended Point of Sale (“POS”) market. We are a leading provider in the small ticket, beverage and food vending industry and are expanding our solutions and services to other unattended market segments, such as amusement, commercial laundry, kiosk and others. Since our founding, we have designed and marketed systems and solutions that facilitate electronic payment options, as well as telemetry and machine-to-machine (“M2M”) services, which include the ability to remotely monitor, control, and report on the results of distributed assets containing our electronic payment solutions. Historically, these distributed assets have relied on cash for payment in the form of coins or bills, whereas, our systems allow them to accept cashless payments such as through the use of credit or debit cards or other emerging contactless forms, such as mobile payment.
We derive the majority of our revenues from license and transaction fees resulting from connections to, as well as services provided by, our ePort Connect service. Connections to our service stem from the sale or lease of our POS electronic payment devices or certified payment software or the servicing of similar third-party installed POS terminals. The majority of ePort Connect customers pay a monthly fee plus a blended transaction rate on the transaction dollar volume processed by the Company. Connections to the ePort Connect service, therefore, are the most significant driver of the Company’s revenues, particularly revenues from license and transaction fees.
As of June 30, 2016, the Company had approximately 429,000 connections to its ePort Connect service, compared to approximately 333,000 connections as of June 30, 2015, representing a 29% increase. During the fiscal year ended June 30, 2016, the Company processed approximately 316 million cashless transactions totaling approximately $584 million in transaction dollars, representing a 46% increase in transaction volume and a 50% increase in dollars processed from the 217 million cashless transactions totaling approximately $389 million during the previous fiscal year ended June 30, 2015.
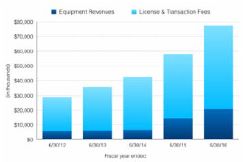 |
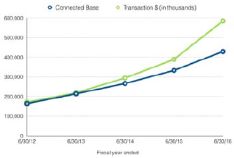 |
The above charts show the increases over the last five fiscal years in the number of connections, revenues and the dollar value of transactions handled by us. The vertical bars depict total revenues, segmented by license and transaction fees and equipment revenues. The solid lines depict the number of connections to our ePort Connect service and the dollar value of transactions handled by us, as of the end of each of the last five fiscal years.
Our solutions and services have been designed to simplify the transition to cashless for traditionally cash-only based businesses. As such, they are turn-key and include our comprehensive ePort Connect service and POS electronic payment devices or certified payment software, which are able to process traditional magnetic stripe credit and debit cards, contactless credit and debit cards and mobile payments. Standard services through ePort Connect are maintained on our proprietary operating systems and include merchant account setup on behalf of the customer, automatic processing and settlement, sales reporting and 24x7 customer support. Other value-added services that customers can choose from include things such as cashless deployment planning, cashless performance review and loyalty products and services. Our solutions also provide flexibility to execute a variety of payment applications on a single system, transaction security, connectivity options, compliance with certification standards, and centralized, accurate, real-time sales and inventory data to manage distributed assets (wireless telemetry and M2M). The ePort® Interactive, which was unveiled in April 2016, is a cloud-based interactive media and content delivery management system and enables delivery of nutritional information, remote refunds, loyalty programs, and multimedia-marketing campaigns for the unattended and self-serve retail markets.
Our customers range from global food service organizations to small businesses that operate primarily in the self-serve, small ticket retail markets including beverage and food vending, amusement and arcade machines, smartphones via our ePort Online solution, commercial laundry, tolls, and various other self-serve kiosk applications as well as equipment developers or manufacturers who incorporate our ePort Connect service into their product offerings.
We believe that we have a history of being a market leader in cashless payments with a recognized brand name, a value-added proposition for our customers and a reputation of innovation in our product and services. We believe that these attributes position us to capitalize on industry trends.
In January 2016, the Company acquired the cloud-based content delivery platform, device platform and products, customer base, and intellectual property of VendScreen, Inc. of Portland, Oregon. In addition to new technology and services, the acquisition has added a West Coast operational footprint for the Company, providing greater efficiencies in operational performance, expanded customer services, sales and technical support to the Company’s customer base. As a result of the acquisition, the Company has added to its product line an interactive media, content delivery system, including a vending application that provides enhanced vendor management system (VMS) integration and consumer product information, including nutritional data. The technology is NFC enabled and compatible with mobile wallets including Apple Pay and Android Pay, and supports instant refunds, couponing, advertising and real-time consumer feedback to the owner and operator.
THE INDUSTRY
We operate primarily in the small ticket electronic payments industry and, more specifically, the unattended POS market. We also have the ability to accept cashless payment “on the go” through mobile-based payment services, which are generally higher ticket transactions. Our solutions and services facilitate electronic payments in industries that have traditionally relied on cash transactions. We believe the following industry trends are driving growth in demand for electronic payment systems in general and more specifically within the markets we serve:
| ■ |
Ongoing shift toward electronic payment transactions and away from cash and checks;
|
| ■ |
Increasing demand for electronic transaction functionality from both consumers and merchant/operators; and
|
| ■ |
Improving POS technology and NFC equipped mobile phone payment technology.
|
Shift toward electronic payment transactions and away from cash and checks
There has been an ongoing shift away from paper-based methods of payment, including cash and checks, towards electronic-based methods of payment. According to The Nilson Report, December 2015, paper-based methods of payment continued to decline in 2014, representing 28.07% of transaction dollars measured compared to 30.61% in 2013. The four card-based systems—credit, debit, prepaid, and electronic benefits transfer—generated $5.29 trillion in the United States in 2014, 57.34% of transaction dollars measured, compared to 42.3% in 2006. The Nilson Report projects that, by 2019, spending at merchants in the U.S. from the four card-based systems will grow to 67.03% of total transaction dollars measured.
Increase in Consumer and Merchant/Operator Demand for Electronic Payments
Increase in Consumer Demand. The unattended, vending and kiosk POS market has historically been dominated by cash purchases. However, oftentimes, cash purchases at unattended POS locations represent a cumbersome transaction for the consumer because they do not have the correct monetary value (paper or coin), or the consumer does not have the ability to convert their bills into coins. We believe electronic payment system providers such as the Company that can meet consumers’ demand within the unattended market will be able to offer retailers, card associations, card issuers and payment processors and business owners an expanding value proposition at the POS.
Increase in Merchant/Operator Demand. We believe that, increasingly, merchants and operators of unattended payment locations (e.g., vending machines, laundry, tabletop games, etc.) are utilizing electronic payment alternatives as a means to improve business results. The Company works with its customers to help them drive increased revenue of their distributed assets through this expanded market opportunity. In addition, electronic payment systems can provide merchants and operators real-time sales and inventory data utilized for back-office reporting and forecasting, like the Company’s solutions and services, helping them to manage their business more efficiently.
Increase in Demand for Networked Assets. M2M (machine-to-machine) technology includes capturing value from wireless modules and electronic devices to improve business productivity and customer service. The term M2M describes any kind of 2-way communication system between geographically distributed devices through a centrally managed software application without human intervention and as such, the Company’s integrated POS and ePort Connect remote data management capabilities fall into this category of solution. In addition, networked assets can provide valuable information regarding consumers’ purchasing patterns and payment preferences, allowing operators to more effectively tailor their offerings to consumers. Gartner, Inc. forecasted that 6.4 billion connected things would be in use worldwide in 2016, with 5.5 million new things getting connected every day, and will reach 20.8 billion by 2020. The Company believes that its expertise in integrating cashless payments, its scalable network data capacity, its proven ability to handle high transaction volume, and its high quality and reliable data management capabilities make it well suited for the growing opportunities in the M2M market.
POS Technology and NFC Equipped Mobile Phone Payment Improvements
Consumer Interest in Mobile Payment. NFC, or Near Field Communication, is a short range wireless connectivity technology that uses electromagnetic radio fields to enable communication between devices when there is a physical touch, or when they are within close proximity to one another. We believe that POS contactless terminals that are enabled to accept NFC payments and digital wallet applications, such as Google Wallet, Chase Pay, Apple Pay, the recently introduced Android Pay, and others, stand to benefit from these evolving trends in mobile payment. Digital wallet is essentially a digital service, accessed via the web or a mobile phone application that serves as a substitute for the traditional credit or debit card. Providers can also market directly to targeted consumers with coupons and loyalty programs.
With over 70% of the Company’s connections contactless enabled to accept NFC payments (in addition to magnetic stripe cards) as of June 30, 2016, we believe that we are well-positioned to benefit from this emerging space.
OUR TECHNOLOGY-BASED SOLUTION
Our solutions have been designed to be turn-key and include the ePort Connect service, POS electronic payment devices, certified payment software able to process traditional magnetic stripe credit and debit cards, contactless credit and debit cards, and NFC equipped mobile phones that allow consumers to make payments with their cell phones. We believe that our ability to bundle our products and services, as well as the ability to tailor and customize them to individual customer needs, makes it easy and efficient for our customers to adopt and deploy our technology, and results in a service unmatched in the small-ticket, unattended retail market today.
The Product. The Company offers its customers several different devices or software to connect their distributed assets. These range from our QuickConnect™ Web service, more fully described below under the section “OUR PRODUCTS”, and encrypted magnetic stripe card readers to our ePort® hardware that can be attached to the door of a stand-alone terminal.
The Network. Our network is designed to transmit payment information from our customers’ terminals for processing and sales and diagnostic data for storage and reporting to our customers. Also, the network, through server-based software applications, provides remote management information, and enables control of the networked device’s functionality. Through our network we have the ability to upload software and update devices remotely enabling us to manage the devices easily and efficiently (e.g., change protocol functionality, provide software upgrades, and change terminal display messages).
The Connectivity Mediums. The client devices (described above) are interconnected for the transfer of our customers’ data through our ePort Connect network that provides multiple connectivity options such as phone line, ethernet, and wireless. Increased wireless connectivity options, coverage and reliability have allowed us to service a greater number of geographically dispersed customer locations. Additionally, we make it easy for our customers to deploy wireless solutions by acting as a single point of contact. We have contracted with Verizon Wireless in order to supply our customers with wireless network coverage.
Data Security. We are listed on the VISA Global Registry of Service Providers, meaning that VISA has reviewed and accepted the Report on Compliance (RoC) from our authorized Payment Card Industry (“PCI”) assessor as a PCI DSS Service Provider. Our entry on this registry is renewed annually, and our current entry is valid through January 31, 2018. The VISA listing can be found online at http://www.visa.com/splisting/searchGrsp.do.
OUR SERVICES
For the fiscal year ended June 30, 2016, license and transaction fees generated by our ePort Connect service represented 73% of the Company’s revenues. Our ePort Connect solution provides customers with all of the following services, under one cohesive service umbrella:
| ● |
Diverse POS options. Ability to connect to a broad product line of cashless acceptance devices or software.
|
| ● |
Card Processing Services. Through our existing relationships with card processors and card associations, we provide merchant account and terminal ID set up, pre-negotiated discounted fees on small ticket purchases, and direct electronic funds transfers (EFTs) to our customers’ bank accounts for all settled card transactions as well as ensure compliance with current processing guidelines.
|
| ● |
Wireless Connectivity. We manage wireless account activations, distributions, and relationships with wireless providers for our customers, if needed.
|
| ● |
Customer/Consumer Services. We support our installed base by providing 24-hour help desk support, repairs, and replacement of impaired system solutions. In addition, all inbound billing inquiries are handled through a 24-hour help desk, thereby eliminating the need for our customers to deal with consumer billing inquiries and potential chargebacks.
|
| ● |
Online Sales Reporting. Via the USALive online reporting system, we provide customers with a host of sales and operational data, including information regarding their credit and cash transactions, user configuration, reporting by machine and region, by date range and transaction type, data reports for operations and finance, graphical reporting of sales, and condition monitoring for equipment service, as well as activation of new devices and redeployments.
|
| ● |
M2M Telemetry and DEX data transfer. DEX, an acronym for digital exchange, is the Vending Industry’s standard way to communicate information such as sales, cash in bill validators, coins in coin boxes, sales of units by selection, pricing, door openings, and much more. The Company is able to remotely transfer and push DEX data to customers’ route management systems through its DEX partner program. The Company operates within the VDI (Vending Data Interchange) standards established by NAMA (National Automatic Merchandising Association) and sends DEX files compatible with most major remote management software systems.
|
| ● |
Over-the-Air Update Capabilities. Automatic over-the-air updates to software, settings, and features from our network to our ePort card reader keep our customers’ hardware up-to-date and enable customers to benefit from any advancement made after their hardware or software purchase.
|
| ● |
Value-added Services. Access to additional services such as MORE, our loyalty program, two-tier pricing, special promotions such as our nationwide Apple Pay mobile payment for vending customers, as well as a menu of hardware purchasing options including JumpStart, our terminal-included service option and hardware leasing options through third parties.
|
| ● |
Deployment Planning. Access to services to help operators successfully deploy cashless payment systems and integrated solutions that is based on our extensive market and customer experience data.
|
| ● |
Premium Services. USAT offers Premium Services to support our customers that fully leverages the Company’s industry expertise and access to data. These services include planning, project management, installation support, marketing and performance evaluation.
|
We enter into an ePort Connect Services Agreement, our processing and licensing agreement, with our customers pursuant to which we act as a provider of cashless financial services for the customer’s distributed assets, and the customer agrees to pay us an activation fee, monthly service fees, and transaction processing fees. Our agreements are generally cancelable by the customer upon thirty to sixty days’ notice to us from the time of shipment. It typically takes thirty to sixty days for a new connection to begin contributing to the Company’s license and transaction fee revenues.
The Company counts its ePort connections upon shipment of an active terminal to a customer under contract, at which time activation on its network is performed by the Company, and the terminal is capable of conducting business via the Company’s network and related services. An ePort connection does not necessarily mean that the unit is actually installed by the customer on a machine, or that the unit has begun processing transactions, or that the Company has begun receiving monthly service fees in connection with the unit. Rather, at the time of shipment of the ePort, the customer becomes obligated to pay the one-time activation fee (if applicable), and is obligated to pay monthly service fees and lease payments (if applicable) in accordance with the terms of the customer’s contract with the Company.
OUR PRODUCTS
ePort is the Company’s core device, which is currently being utilized in self-service, unattended markets such as vending, amusement and arcade, and various other kiosk applications. Our ePort product facilitates cashless payments by capturing payment information and transmitting it to our network for authorization with the payment system (e.g., credit card processors). Additional capabilities of our ePort consist of control/access management by authorized users, collection of audit information (e.g., date and time of sale and sales amount), diagnostic information of the host equipment, and transmission of this data back to our network for web-based reporting, or to a compatible remote management system. Our ePort products are available in several distinctive modular configurations, and as hardware, software or as an API Web service, offering our customers flexibility to install a POS solution that best fits their needs and consumer demands.
| ● |
ePort Edge™ is a one-piece design and is intended for those customers who require a magnetic swipe-only cashless system with basic features at a lower price point.
|
| ● |
ePort G-8 is a two-piece design that supports traditional magnetic stripe credit/debit cards and contactless cards. The ePort G8 telemeter is also available as a stand-alone DEX telemetry solution.
|
| ● |
ePort G-9 has been designed to offer all the features of the G-8 plus additional new features that support expanded acceptance options, consumer engagement offerings and advanced diagnostics.
|
| ● |
ePort Interactive is a cloud-based interactive media and content delivery management system, enabling delivery of nutritional information, remote refunds, loyalty programs, and multimedia-marketing for the unattended and self-serve retail markets.
|
| ● |
QuickConnect is a Web service that allows a client application to securely interface with the Company’s ePort Connect service. QuickConnect essentially replaces ePort SDK (software development kit), which captured our ePort technology in software form for PC-based devices such as kiosks.
|
Other forms of our ePort technology include:
| ● |
eSuds, our solution developed for the commercial laundry industry that enables laundry operators to provide customers cashless transactions via the use of their credit cards, debit cards and other payment mediums such as student IDs. Effective with the April 2013 mutually exclusive agreement with Setomatic Systems, we are no longer selling the entire eSuds solution to new customers, but we continue to provide processing services for laundry machines equipped with cashless hardware supplied by Setomatic Systems.
|
| ● |
ePort Online, enables customers to use USALive to securely process cards typically held on on file for the purpose of online billing and recurring charges. ePort Online Online helps USAT’s customers reduce paper invoicing and collections.
|
SPECIFIC MARKETS WE SERVE
Our current customers are primarily in the self-serve, small ticket retail markets including beverage and food vending and kiosk, commercial laundry, car wash, tolls, amusement and gaming, and office coffee. While these industry sectors represent only a small fraction of our total market potential, as described below, these are the areas where we have gained the most traction to date. In addition to being our current primary markets, we believe these sectors serve as a proof-of-concept for other unattended POS industry applications.
Vending. According to Vending Times’ 2014 Census of the Industry, annual U.S. sales in the vending industry sector were estimated to be approximately $43 billion in 2013 transacted by approximately 4.5 million machines. The Company believes these machines represent a significant market opportunity for electronic payment conversion when compared to the Company’s existing ePort Connect service base and the overall low rate of industry adoption to date. For example, in another study conducted by Automatic Merchandiser (State of the Vending Industry, June 2015) that included a representative 5.1 million machines, cashless adoption was estimated at only 11% in 2014, up from 7% in 2012. With the continued shift to electronic payments and the advancement in mobile and POS technology, we believe that the traditional beverage and food vending industry will continue to look to cashless payments and telemetry systems to improve their business results.
Kiosk. According to IHL Consulting Group’s August 2012 North American Self-Service Kiosks Market Study, which defines, for purposes of their study, a kiosk as a self-standing, technology-based, unmanned device deployed across six retail and hospitality environments, approximately $926 billion was going to be transacted through self-service kiosks in 2013, with compound annual growth for the subsequent three years of seven percent (7%). We believe that kiosks are becoming increasingly popular as credit, debit or contactless payment options enable kiosks to sell an increased variety of items. In addition, the study points to the increasing trend toward self-sufficiency, where time is the most important commodity of the consumer. As merchants continue to seek new ways to reach their customers through kiosk applications, we believe the need for a reliable cashless payment provider experienced with machine integration, PCI compliance and cashless payment services designed specifically for the unattended market will be of increasing value in this market. Our existing kiosk customers integrate with our cashless payment services via our QuickConnect Web service using one of our encrypted readers or ePort POS technologies.
Laundry. Our primary targets in laundry consist of the coin-operated commercial laundry and multi-housing laundry markets. According to the Coin Laundry Association, the U.S. commercial laundry industry was comprised of about 35,000 coin laundries in the U.S. in 2015 that our partner, Setomatic Systems, estimated translates to roughly 2.5 million commercial washers and dryers. The Coin Laundry Association estimated gross annual revenue in the laundromat market at nearly $5 billion annually.
Mobile Merchant. New mobile-based payment acceptance technology has made a transformational impact on an entire base of merchants that previously had almost no access to electronic-based payments. Goldman Sachs (Equity Research Report, June 19, 2012) sees the arrival of mobile technology at the micro/small merchant level addressing an estimated 13 million U.S.-based micro merchants that are likely to benefit from the ability to accept electronic payment from mobile devices. The Company believes that its mobile-based acceptance product and existing turn-key service platform align well with the market’s need for integrated, mobile payment solutions.
OUR COMPETITIVE STRENGTHS
We believe that we benefit from a number of advantages gained through our nearly twenty-five year history in our industry. They include:
| 1. |
One-Stop Shop, End-to-End Solution. We believe that our ability to offer our customers one point of contact through a bundled cashless payment solution makes it easy and efficient for our customers to adopt and deploy our electronic payment solutions and results in a service that is unmatched in the small ticket, self-service retail market today. To our knowledge, other cashless payment solutions available in the market today require the operator to set up their own accounts for cashless processing and manage multiple service providers (i.e., hardware terminal manufacturer, wireless network provider, and/or credit card processor). We interface directly with our card processor and wireless service provider, and, with our hardware solutions, are able to offer a bundled solution to our customers.
|
| 2. |
Trusted Brand Name. We believe that the ePort has a strong national reputation for quality, reliability, and innovation. We believe that card associations, payment processors, and merchants/operators trust our system solutions and services to handle financial transactions in a secure operating environment. Our trusted brand name is best exemplified by our high level of customer retention, numerous exclusive three-year agreements with customers for use of our ePort Connect service. We have agreements with partners like Visa, MasterCard, Chase Paymentech and Verizon Wireless as well as several one-way exclusive relationships which we have solidified with leading organizations within the unattended POS industry, including Setomatic Systems, AMI Entertainment Network, Inc., Innovative Foto, and Air-Serv.
|
| 3. |
Market Leadership. We believe we have one of the largest installed bases of Unattended POS electronic payment systems in the unattended small ticket retail market for food and beverage and we are continuing to expand to other adjacent markets such as laundry, amusement, and gaming and kiosks. As of June 30, 2016, we had approximately 429,000 connections to our network. Our installed base supports our sales and marketing initiatives by enhancing our ability to establish or expand our market position. In addition, this data in combination with our industry experts and analysis enables us to offer Premium Services to our customers to help them deploy and better leverage our technology in their locations. We believe our installed base also provides multiple opportunities for referrals for new business, either from the merchant or operator of the deployed asset or through one of our several strategic partnerships.
|
| 4. |
Attractive Value Proposition for Our Customers. We believe that our solutions provide our customers an attractive value proposition. Our solutions and services make possible increased purchases by consumers who in the past were limited to the physical cash on hand while making a purchase at an unattended terminal, thereby increasing the universe of potential customers and the size of the purchases of those customers. In addition, value-added offerings and services such as Two-Tier Pricing, which allows the operator to charge different amounts for the same product depending upon whether the consumer chooses to pay by cash or credit/debit, and M2M telemetry provide operators with the ability to pursue additional opportunities to reduce costs and improve operating efficiencies. Lastly, new consumer engagement services further extend the potential for customers to build new revenue opportunities, customer loyalty and brand distinction. One of such services is provided through the ePort Interactive platform, our cloud-based interactive media and content delivery management system, which enables delivery of nutritional information, remote refunds, loyalty programs, and multimedia-marketing campaigns for the unattended and self-serve retail markets.
|
| 5. |
Increasing Scale and Financial Stability. Due to the continued growth in connections to the Company’s ePort Connect service, during the 2016 fiscal year, 73% of the Company’s revenues were from licensing and processing fees which are recurring in nature. We believe that this growing scale provides us improved financial stability and the footprint to market and distribute our products and services more effectively and in more markets than most of our competitors.
|
| 6. |
Customer-Focused Research and Development. Our research and development initiatives focus primarily on adding features and functionality to our electronic payment solutions based on customer input and emerging market trends. As of June 30, 2017, we had 73 patents (US and International) in force, and 3 United States and 11 international patent applications pending. We have generated considerable intellectual property and know-how associated with creating a seamless, end-to-end experience for our customers.
|
OUR GROWTH OPPORTUNITY
Our primary objective is to continue to enhance our position as a leading provider of technology that enables electronic payment transactions and value-added services primarily at small-ticket, self-service retail locations such as vending, kiosks, commercial laundry, and other similar markets. We plan to execute our growth strategy organically and through strategic acquisitions. The Company believes its service-approach business model can create a high-margin stream of recurring revenues that could create a foundation for long-term value and continued growth. Key elements of our strategy are to:
Drive Growth in Connections
Leverage Existing Customers/Partners. We have a solid base of key customers across multiple markets, particularly in vending, that have currently deployed our solutions and services to just a small portion of their deployed base. As a result, they are a key component of our plan to drive future sales. We have worked to build these relationships, drive future deployments, and develop customized network interfaces. Our customers have seen the benefits of our products and services first-hand and we believe they represent the largest opportunity to scale connections to our service.
Expand Distribution and Sales Reach. We are intently focused on driving profitable growth through efficient sales channels. Our sales resources and new distribution relationships have led to approximately 1,450 new ePort Connect customers as well as increased penetration in markets such as amusement and arcade, and commercial laundry in fiscal year 2016.
Further Penetrate Attractive Adjacent Markets. We plan to continue to introduce our turn-key solutions and services to various adjacent markets such as the broad-based kiosk market and other similar markets by leveraging our expertise in cashless payment integration combined with the capacity and uniqueness of our ePort Connect solution.
Capitalize on Opportunities in International Markets. We are currently focused on the U.S. and Canadian markets for our ePort devices and related ePort Connect service but may seek to establish a presence in electronic payment markets in Europe, Asia, and Latin America. In order to do so, however, we would have to invest in additional sales and marketing and research and development resources targeted towards these regions. At this time, the Company believes the most efficient route to these markets will be achieved by optimizing and coordinating opportunities with its global partners and customers. Our energy management devices have been shipped to customers located in North America, Europe, and Asia.
Expanding the Value of our Service
Capitalize on the emerging NFC and growing mobile payments trends. With approximately 78% of our connected base contactless enabled to accept NFC payments (including mobile wallets), the Company believes that continued increases in consumer preferences towards contactless payments, including mobile wallets like Apple Pay and Android Pay, represent a significant opportunity for the Company to further drive adoption. According to a market research study conducted in June 2015, almost one in six US consumers (15%) had used a mobile wallet in the past six months, up from 9% in the same period in 2013, and an additional 22% are likely to adopt mobile wallet functionality in the coming six months (The Future of the Mobile Wallet - Chadwick Martin Bailey). As consumers continue to adopt these new methods of cashless payments, it is our belief that adoption will continue to accelerate at a rapid pace and result in more rapid adoption of cashless solutions like the Company’s ePort in the markets that we serve.
Continuous Innovation. We are continuously enhancing our solutions and services in order to satisfy our customers and the end-consumers relying on our products at the POS locations. Our product innovation team is always working to enhance the design, size, and speed of data transmission, as well as security and compatibility with other electronic payment solution providers’ technologies. We believe our continued innovation will lead to further adoption of USAT’s solutions and services in the unattended POS payments market.
Comprehensive Service and Support. In addition to its industry-leading ePort cashless payments system, the Company seeks to provide its customers with a comprehensive, value-added ePort Connect service that is designed to encourage optimal ROI through business planning and performance optimization; business metrics through the Company’s KnowledgeBase of data; a loyalty and rewards program for consumer engagement; marketing strategy and executional support; sales data and machine alerts; DEX data transmission; and the ability to extend cashless payments capabilities and the full suite of services across multiple aspects of an operator’s business including micro-markets contract food industry, online payments and mobile payments.
Leverage Intellectual Property. Through June 30, 2017, we have 73 U.S. and foreign patents in force that contain various claims, including claims relating to payment processing, networking and energy management devices. In addition, we own numerous trademarks, copyrights, and trade secrets. We will continue to explore ways to leverage this intellectual property in order to add value for our customers, attain an increased share of the market, and generate licensing revenues.
SALES AND MARKETING
The Company’s sales strategy includes both direct sales and channel development, depending on the particular dynamics of each of our markets. Our marketing strategy is diversified and includes media relations, direct mail, conferences, and client referrals. As of June 30, 2017, the Company was marketing and selling its products through its full and part-time sales staff consisting of 15 people.
Direct Sales
Our direct sales efforts are currently primarily focused on the beverage and food vending industry, although we continue to further develop our presence in our ancillary market segments.
Indirect Sales/ Distribution
As part of our strategy to expand our sales reach while optimizing resources, we also have agreements with select resellers in the car wash, amusement and arcade, and vending markets. We also have a strategic marketing relationship in the commercial laundry market that makes the Company the exclusive service provider to Setomatic Systems’ POS offering, SpyderWash. We have also entered into agreements with resellers and distributors in connection with our energy management products.
Marketing
Our marketing strategy includes advertising and outreach initiatives designed to build brand awareness, make clear USAT’s competitive strengths, and prove the value of our services to our target markets-both for existing and prospective customers. Activities include creating company and product presence on the web including www.usatech.com and www.energymisers.com, digital advertising, SEO (Search Engine Optimization), and social media; the use of direct mail and email campaigns; educational and instructional online training sessions; advertising in vertically-oriented trade publications; participating in industry tradeshows and events; and working closely with customers and key strategic partners on co-marketing opportunities and new, innovative solutions that drive customer and consumer adoption of our services.
IMPORTANT RELATIONSHIPS
Verizon Wireless
In April 2011, we signed an agreement with Verizon for access to their digital wireless wide area network for the transport of data, including credit card transactions and inventory management data. The initial term of the agreement was three years, which was extended until April 2016. At the end of the term, the agreement automatically renews for successive one month periods unless terminated by either party upon thirty days’ notice.
On September 21, 2011, the Company and Verizon entered into a Joint Marketing Addendum (the “Verizon Agreement”) which amended the agreement described above. Pursuant to the Verizon Agreement, the Company and Verizon would work together to help identify business opportunities for the Company’s products and services. Verizon may introduce the Company to existing or potential Verizon customers that Verizon believes are potential purchasers of the Company’s products or services, and may attend sales calls with the Company made to these customers. The Company and Verizon would collaborate on marketing and communications materials that would be used by each of them to educate and inform customers regarding their joint marketing work. Verizon has the right to list the Company’s products and services in its Data Solutions Guide for use by its sales and marketing employees and in its external website. The Company has agreed to pay to Verizon a one-time referral fee for each customer introduced to the Company by Verizon that becomes a customer of the Company. The Verizon Marketing Agreement is terminable by either party upon 45 days’ notice.
VISA
As of November 14, 2014, we entered into a three-year agreement with Visa U.S.A. Inc. (“Visa”), pursuant to which Visa has agreed to continue to make available to the Company certain promotional interchange reimbursement fees for small ticket debit and credit card transactions. As previously reported, following implementation of the Durbin Amendment, Visa had significantly increased its interchange fees for small ticket regulated debit card transactions effective October 1, 2011. The promotional interchange reimbursement fees provided by the aforementioned agreement will continue until October 31, 2017.
MasterCard
On January 12, 2015, we entered into a three-year MasterCard Acceptance Agreement (“MasterCard Agreement”) with MasterCard International Incorporated ("MasterCard"), pursuant to which MasterCard has agreed to make available to us reduced interchange rates for small ticket debit card transactions in certain merchant category codes. As previously reported, MasterCard had significantly increased its interchange rates for small ticket regulated debit card transactions effective October 1, 2011, and as a result, the Company ceased accepting MasterCard debit card products in mid-November 2011. Pursuant to the MasterCard Agreement, however, the Company is currently accepting MasterCard debit card products for small ticket debit card transactions in the unattended beverage and food vending merchant category code. The Company and MasterCard entered into a first amendment on April 27, 2015, pursuant to which the conditions under, or the transactions to, which the MasterCard custom pricing would be available, was amended. The reduced interchange rates became effective on April 20, 2015.
Chase Paymentech
The Company has entered into a five-year Third Party Payment Processor Agreement, dated April 24, 2015 with Paymentech, LLC, through its member, JPMorgan Chase Bank, N.A. (“Chase Paymentech”), pursuant to which Chase Paymentech will act as the provider of credit and debit card transaction processing services (including authorization, conveyance and settlement of transactions) to the Company and its customers. The Agreement provides that Chase Paymentech will act as the exclusive provider of transaction processing services to the Company and its customers for at least 250,000,000 transactions per year. The Agreement provides that Chase Paymentech may modify the pricing for its services upon 30-days’ notice, and in connection with certain such increases, the Company has the right to terminate the Agreement upon 120-days’ notice.
Compass/Foodbuy
On June 30, 2009, we entered into a Master Purchase Agreement (“MPA”) with Foodbuy, LLC (“Foodbuy”), the procurement company for Compass Group USA, Inc. (“Compass”) and other customers. The MPA provides, among other things that, for a period of thirty-six months, Foodbuy, on behalf of Compass, shall utilize USAT as the sole credit or debit card vending system hardware and related software and connect services provider for not less than seventy-five percent of the vending machines of Compass utilizing cashless payments solutions. The MPA also provides that, for a period of thirty-six months from the effective date of the agreement, USAT shall be a preferred supplier and provider to Foodbuy and its customers, including Compass, of USAT’s products and services. The MPA automatically renews for successive one-year periods unless terminated by either party upon sixty days’ notice prior to the end of any such one year renewal period. In addition, on July 1, 2009, USAT and Compass, in conjunction with the MPA described above, also entered into a three-year ePort Connect Services Agreement pursuant to which USAT will provide Compass with all card processing, data, network, communications and financial services, and DEX telemetry data services required in connection with all Compass vending machines utilizing ePorts. The agreement automatically renews for successive one-year periods unless terminated by either party upon sixty days’ notice prior to the end of any such one-year renewal period. During the fiscal year ended June 30, 2016, Compass represented approximately 20% of our total revenues.
AMI Entertainment
On August 22, 2011, we entered into an exclusive three-year agreement with AMI Entertainment (“AMI”) as their exclusive processor of credit and debit cards and other electronic payments in connection with equipment operated on AMI’s network in the U.S. and Canada. The agreement is subject to renewal for one-year periods thereafter, subject to notice of non-renewal by either party. The agreement renewed for one year in August 2016. AMI manufactures various types of amusement, entertainment and music equipment for sale to third party users.
Setomatic Systems
In April 2013, we entered into an three-year exclusive agreement with Setomatic Systems (“Setomatic”), a privately owned and operated developer and manufacturer of both open and closed loop card payment systems, drop coin meters and electronic timers for the commercial laundry industry. Under the terms of the agreement, the Company, through our ePort Connect® service, will act as the exclusive service provider for all credit/debit card processing for all new customers of Setomatic’s SpyderWash, a credit/debit card acceptance product. Similarly, the Company will market its ePort Connect service in the United States laundry market exclusively through Setomatic. The agreement is subject to renewal for one- year periods after the initial three-year term, subject to notice of non-renewal by either party.
QUICK START PROGRAM
In order to reduce customers’ upfront capital costs associated with the ePort hardware, the Company makes available to its customers the Quick Start program, pursuant to which the customer would enter into a five-year non-cancelable lease with either the Company or a third-party leasing company for the devices. At the end of the lease period, the customer would have the option to purchase the device for a nominal fee.
From its introduction in September 2014 and through approximately mid-March 2015, the Company entered into these leases directly with its customers. In the third and fourth quarter of fiscal year 2015, however, the Company signed vendor agreements with two leasing companies, whereby our customers could enter into leases directly with the leasing companies.
There has been a shift by our customers from acquiring our product via JumpStart, which accounted for 11% of our gross connections in fiscal year 2015, and for 9% of our gross connections in fiscal year 2016, to QuickStart or a straight purchase, which accounted for approximately 91% of gross connections in fiscal year 2016. The shift to a straight purchase, along with our ability to increase cash collections under QuickStart sales by utilizing leasing companies, has improved cash provided by operating activities.
Due to the success of the QuickStart program as measured by customer utilization of the program and the positive impact on the Company’s cash flows from operating activities when a leasing company is utilized, the Company intends to expand this program by entering into additional vendor agreements with leasing companies and/or expanding its relationship with the two incumbent leasing companies.
JUMP START PROGRAM
Pursuant to the JumpStart Program, customers acquire the ePort cashless device at no upfront cost by paying a higher monthly service fee, avoiding the need to make a major upfront capital investment. The Company would continue to own the ePort device utilized by its customer. At the time of the shipment of the ePort device, the customer is obligated to pay to the Company a one-time activation fee, and is later obligated to pay monthly ePort Connect service fees in accordance with the terms of the customer’s contract with the Company, in addition to transaction processing fees generated from the device. In fiscal year 2016, the Company added approximately 9% of its gross connections through JumpStart.
MANUFACTURING
The Company utilizes independent third party companies for the manufacturing of its products. Our internal manufacturing process mainly consists of quality assurance of materials and testing of finished goods received from our contract manufacturers. We have not entered into a long-term contract with our contract manufacturers, nor have we agreed to commit to purchase certain quantities of materials or finished goods from our manufacturers beyond those submitted under routine purchase orders, typically covering short-term forecasts.
COMPETITION
We are a leading provider of cashless payments systems for the small-ticket, unattended market and believe we have the largest installed base of unattended POS electronic payment systems in the beverage and food vending industry. Factors that we consider to be our competitive advantages are described above under “OUR COMPETITIVE STRENGTHS.” Our competitors are increasingly and actively marketing products and services that compete with our products and services in the vending space including manufacturers who may include in their new vending machines their own (or another third party’s) cashless payment systems and services. These major competitors include Crane Payment Innovations and Cantaloupe Systems, Inc. While we believe our products and services are superior to our competitors’, many of our competitors are much larger enterprises and have substantially greater revenues. In addition to these competitors, there are also numerous credit card processors that offer card processing services to traditional retail establishments that could decide to offer similar services to the industries that we serve.
In the cashless laundry market, our joint solution with Setomatic Systems competes with hardware manufacturers, who provide joint solutions to their customers in partnership with payment processors, and with at least one competitor who provides an integrated hardware and payment processing solution.
TRADEMARKS, PROPRIETARY INFORMATION, AND PATENTS
The Company owns US federal registrations for the following trademarks and service marks: Blue Light Sequence®, Business Express®, CM2iQ®, Creating Value Through Innovation®, EnergyMiser®, ePort®, ePort Connect®, ePort Edge®, ePort GO®, ePort Mobile®, eSuds®, Intelligent Vending®, Public PC®, SnackMiser®, TransAct®, USA Technologies® USALive®, VendingMiser®, PC EXPRESS®, VENDSCREEN® and VM2iQ®. The Company owns pending applications for US federal registration of the following trademarks and service marks: Horizontal Blue Light Sequence™, and MORE.
Much of the technology developed or to be developed by the Company is subject to trade secret protection. To reduce the risk of loss of trade secret protection through disclosure, the Company has entered into confidentiality agreements with its key employees. There can be no assurance that the Company will be successful in maintaining such trade secret protection, that they will be recognized as trade secrets by a court of law, or that others will not capitalize on certain aspects of the Company’s technology.
Through June 30, 2017, 95 patents have been granted to the Company, including 81 United States patents and 14 foreign patents, and 3 United States and 11 international patent applications are pending. Of the 95 patents, 73 are still in force. Our patents expire between 2017 and 2035.
RESEARCH AND DEVELOPMENT
Research and development expenses, which are included in selling, general and administrative expense in the Consolidated Statements of Operations, were approximately $1.4 million, $1.5 million and $1.0 million for the years ended June 30, 2016, 2015 and 2014, respectively.
EMPLOYEES
As of June 30, 2017, the Company had 90 full-time employees and 4 part-time employees.
PROPERTIES
The Company leases approximately 17,689 square feet of space located in Malvern, Pennsylvania, for its principal executive office and for general administrative functions, sales activities, product development, and customer support. The Company’s monthly base rent for the premises is approximately $36 thousand, and will increase each year up to a maximum monthly base rent of approximately $41 thousand. The lease expires on November 30, 2023.
The Company also leases 11,250 square feet of space in Malvern, Pennsylvania for its product warehousing and shipping under a lease agreement which expires on February 28, 2019. As of June 30, 2016, the Company’s rent payment was approximately $5,000 per month.
The Company has also entered into a lease agreement for its operations in Portland, Oregon, which commenced October 1, 2016. The location consists of 5,362 square feet and will expire in December 2019. The lease includes monthly rental payments of $11 thousand.
LEGAL PROCEEDINGS
On October 1, 2015, a purported class action was filed in the United States District Court for the Eastern District of Pennsylvania against the Company and its executive officers alleging violations under the Securities Exchange Act of 1934. The complaint alleges, among other things, that the defendants failed to disclose that there were significant deficiencies in the design and operating effectiveness of the Company’s internal control over financial reporting, which, when aggregated, represented a material weakness in internal control, and, as a result, the Company’s public statements were materially false and misleading. The complaint seeks certification as a class action, unspecified compensatory damages plus interest, attorneys’ fees and other costs. On February 1, 2016, the Company filed a motion to dismiss the complaint. On April 14, 2016, the Court issued an order granting the Company’s motion to dismiss the complaint. On May 13, 2016, the plaintiff appealed the Court’s order to the United States Court of Appeals for the Third Circuit. On August 16, 2016, the plaintiff filed a motion for relief from final judgment with the District Court seeking an order modifying the District Court’s previous order dismissing the complaint, and permitting the plaintiff to now file an amended complaint. On September 19, 2016, the District Court issued an order denying the plaintiff’s motion for relief from final judgment, and on October 4, 2016, the plaintiff filed an appeal of this order with the Court of Appeals. On October 6, 2016, the Court of Appeals consolidated the two appeals of plaintiff for all purposes. On March 28, 2017, oral argument was held before the Court of Appeals, and as of the date hereof, the Court of Appeals has not rendered a decision.
By letter dated December 7, 2015, a purported shareholder of the Company demanded that the Board of Directors investigate, remedy and commence proceedings against certain of the Company’s current and former officers and directors for breach of fiduciary duties in connection with the material weakness in its internal controls over financial reporting which were more fully described in the Company’s Form 10-K for the fiscal year ended June 30, 2015 (the “2015 Form 10-K”). In response to the demand letter, the Board of Directors formed a special litigation committee (the “SLC”) in order to investigate and evaluate the demand letter. On June 1, 2016, and before the SLC had concluded its investigation, the purported shareholder filed a purported derivative action on behalf of the Company in the Chester County, Pennsylvania, Court of Common Pleas, against certain current and former officers and directors. The complaint alleges that the defendants breached their fiduciary duties relating to the material weakness in internal controls reported in the 2015 Form 10-K. The complaint seeks unspecified damages against the defendants and certain equitable relief. On July 15, 2016 the SLC issued its report (the “SLC Report”) which, among other things, concluded that none of the current or former officers or directors had breached their fiduciary duties, that it was not in the best interests of the Company to pursue the pending shareholder derivative action, and that the Company request the Court to dismiss the action in its entirety. On August 1, 2016, the Board of Directors of the Company adopted all of the conclusions and recommendations set forth in the SLC Report. On August 17, 2016, the Company filed with the Court a motion to dismiss the shareholder complaint. On March 8, 2017, the Court entered an order granting the Company’s motion to dismiss the complaint. On April 6, 2017, the plaintiff appealed the order to the Superior Court of Pennsylvania. As of the date hereof, the Superior Court has not rendered a decision.
DIRECTORS AND EXECUTIVE OFFICERS
Our directors and executive officers, as of the date of this prospectus, together with their ages and business backgrounds were as follows:
|
Name
|
Age
|
Position(s) Held
|
||
|
Steven D. Barnhart (1)(2)
|
55
|
Director
|
||
|
Joel Brooks
|
58
|
Director
|
||
|
Stephen P. Herbert
|
54
|
Chief Executive Officer, Chairman of the Board of Directors
|
||
|
Michael K. Lawlor
|
56
|
Chief Services Officer
|
||
|
Priyanka Singh
|
37
|
Chief Financial Officer
|
||
|
Robert L. Metzger (1)
|
49
|
Director
|
||
|
Albin F. Moschner (3)
|
64
|
Director
|
||
|
William J. Reilly, Jr. (3)(4)
|
68
|
Director
|
||
|
William J. Schoch (1)(4)
|
52
|
Director
|
| (1) |
Member of Audit Committee
|
| (2) |
Lead independent director
|
| (3) |
Member of Compensation Committee
|
| (4) |
Member of Nominating and Corporate Governance Committee
|
Each member of the Board of Directors will hold office until the 2018 annual shareholders’ meeting and until his successor has been elected and qualified.
Steven D. Barnhart was appointed to the Board of Directors in October 2009. Mr. Barnhart is the Company’s lead independent director, has been a member of our Audit Committee since December 2016, and served as a member of our Compensation Committee until December 2016. Since September 2014, Mr. Barnhart has served as the Senior Vice President and Chief Financial Officer for Bankrate, Inc. From August 2012 to June 2014, Mr. Barnhart served as the Senior Vice President and Chief Financial Officer of Sears Hometown and Outlet Stores, Inc. From January 2010 to June 2012, Mr. Barnhart served as the Senior Vice President and Chief Financial Officer of Bally Total Fitness. Mr. Barnhart was Chief Executive Officer and President of Orbitz Worldwide from 2007 to January 2009, after holding other executive positions since 2003, when he joined the company. Prior to Orbitz Worldwide, he worked for PepsiCo and the Pepsi Bottling Group from 1990 to 2003, where he was Finance Director for the Southeast Business Unit of the Pepsi Bottling Group, and held various finance and strategy roles at PepsiCo. Mr. Barnhart received a Bachelor of Arts degree in Economics in 1984 from the College of the University of Chicago and a Masters in Business Administration in 1988 from the University of Chicago-Booth School of Business. Mr. Barnhart served on the Board of Directors of Orbitz Worldwide from 2007 to January 2009. We believe Mr. Barnhart’s extensive executive experience and leadership skills, and prior public board experience provide the requisite qualifications, skills, perspectives, and experiences to serve on our Board of Directors.
Joel Brooks joined the Board of Directors of the Company in March 2007. Mr. Brooks served on our Audit Committee from March 2007 until December 2016, and served as Chair since October 2009. Since May 2015, Mr. Brooks has served as the Vice President, Finance, for MeiraGTx Limited. From December 2000 until May 2015, Mr. Brooks served as the Chief Financial Officer, Treasurer and Secretary of Sevion Therapeutics, Inc. (formerly Senesco Technologies, Inc.), a biotechnology company whose shares are traded on the OTCQB. From September 1998 until November 2000, Mr. Brooks was the Chief Financial Officer of Blades Board and Skate, LLC, a retail establishment specializing in the action sports industry. Mr. Brooks was Chief Financial Officer from 1997 until 1998 and Controller from 1994 until 1997 of Cable and Company Worldwide, Inc. He also held the position of Controller at USA Detergents, Inc. from 1992 until 1994, and held various positions at several public accounting firms from 1983 through 1992. Mr. Brooks received his Bachelor of Science degree in Commerce with a major in Accounting from Rider University in February 1983. We believe Mr. Brooks’ extensive accounting and finance background, and his executive experience at Sevion Therapeutics, Inc. provide the requisite qualifications, skills, perspectives, and experiences to serve on our Board of Directors.
Stephen P. Herbert has been our Chief Executive Officer and Chairman since November 30, 2011. He was elected a director in April 1996, and joined the Company on a full-time basis on May 6, 1996 as Executive Vice President. During August 1999, Mr. Herbert was appointed President and Chief Operating Officer of the Company. On October 5, 2011, Mr. Herbert was appointed as interim Chief Executive Officer and Chairman, and on November 30, 2011, he was appointed as the Chairman of the Board of Directors and Chief Executive Officer of the Company. Prior to joining us and since 1986, Mr. Herbert had been employed by Pepsi-Cola, the beverage division of PepsiCo, Inc. From 1994 to April 1996, Mr. Herbert was a Manager of Market Strategy. In such position he was responsible for directing development of market strategy for the vending channel and subsequently the supermarket channel for Pepsi-Cola in North America. Prior thereto, Mr. Herbert held various sales and management positions with Pepsi-Cola. Mr. Herbert graduated with a Bachelor of Science degree from Louisiana State University. We believe Mr. Herbert’s position as the President and Chief Operating Officer of our Company until October 5, 2011 and as Chairman and Chief Executive Officer of the Company thereafter, his intimate knowledge and experience with all aspects of our Company, and his extensive vending experience at PepsiCo before joining our Company provide the requisite qualifications, skills, perspectives, and experiences to serve on our Board of Directors.
Michael K. Lawlor has been our Chief Services Officer since March 8, 2016, in which role he oversees the Company’s ePort Connect Service, including delivery to customers of the ePort Connect suite of cashless payment, consumer engagement, loyalty and telemetry services, customer service and support, premium support services, Knowledge Base, and strategic partner development. Prior to his role as CSO, Mr. Lawlor was senior vice president of sales and business development at the Company. Since joining the Company in 1996, Mr. Lawlor has provided senior leadership driving innovative sales programs, national strategic partnerships and the development of an expanded suite of electronic payment services. Prior to joining the Company, he worked for Pepsi-Cola Co., a division of PepsiCo, managing the retail, restaurant and vending business sectors with regional and national positions that spanned several functions including sales, operations, and sales management in the Dallas and Houston, Texas, markets. He was also a national accounts sales manager on the Pepsi-Cola national food service team, responsible for corporate and franchise relationships, with multiple national restaurant chains. Mr. Lawlor graduated with a Bachelor of Business Administration degree from the University of Texas, Arlington, in 1986.
Priyanka Singh has been our Chief Financial Officer since March 31, 2017. Prior to that, Ms. Singh served as the Vice President of Product Strategy and Innovation, and as Division CFO for Heartland Commerce at Global Payments, Inc. since April 2016. Prior to the acquisition of Heartland Payment Systems by Global Payments in April 2016, she had served in various capacities since December 2011 with that company, including as Divisional CFO of the Heartland Commerce units, as Vice President, Finance, and as Director, Financial Planning and Analysis. Prior thereto and since 2005, she had been employed by General Electric in various roles at both GE Capital and GE Healthcare, focusing on financial planning and analysis, accounting, controllership, internal auditing and SOX compliance. Ms. Singh is a Certified Public Accountant and a member of the American Institute of Certified Public Accountants. She received a Bachelor of Commerce (Honors) degree in Finance and Accounting from University of Rajasthan, India.
Robert L. Metzger joined the Board of Directors of the Company in March 2016. Mr. Metzger has been the Chair of our Audit Committee since December 2016, and a member of the Audit Committee since June 2016. He has served as the Director of the Investment Banking Academy at the University of Illinois at Urbana-Champaign College of Business since August 2015, and as a lecturer in the Department of Finance since August 2015. He has served as a member of the Audit Committee and the Board of Directors of WageWorks, Inc. since February 2016. Mr. Metzger was a Partner at William Blair & Company, L.L.C. from January 2005 to December 2015 after joining the firm in 1999, and since January 2016, he has been employed as a Senior Director at the firm. He served as the head of the Technology group between January 2011 and January 2015 and of the Financial Services Investment Banking Group between April 2007 and December 2015. He also acted as Chairman of the firm’s Audit Committee from January 2013 to December 2015. Prior to joining William Blair & Company, L.L.C., he worked in the Investment Banking Division of ABN AMRO Incorporated from 1997 to 1999, in the Financial Institutions Group at A.T. Kearney, Inc. from 1995 to 1997, and in Audit and Audit Advisory Services at Price Waterhouse from 1990 to 1994. Mr. Metzger graduated with a Masters in Business Administration with concentrations in finance and strategy in 1995 from Northwestern University’s Kellogg School of Management and a Bachelor of Science degree in Accountancy in 1989 from the University of Illinois at Urbana-Champaign. We believe that Mr. Metzger’s finance and accounting background, his experience with public companies and capital markets, and experience in the financial technology and payments space provide the requisite qualifications, skills, perspectives, and experiences to serve on our Board of Directors.
Albin F. Moschner joined the Board of Directors of the Company in April 2012. He is the Chair of our Compensation Committee, and was a member of our Audit Committee from June 2014 until June 2016. Mr. Moschner has been serving on the Board of The Nuveen Funds since July 2016. He also served on the Board of Wintrust Financial Corporation from 1994 until June 2016. Previously, he served at Leap Wireless International, Inc. as the Chief Operating Officer from July 2008 to February 2011 and as Chief Marketing Officer from August 2004 to June 2008. Prior to joining Leap Wireless, Mr. Moschner served as President of the Verizon Card Services division of Verizon Communications, Inc. From January 1999 to December 2000, Mr. Moschner was President of One Point Services at One Point Communications. Mr. Moschner served at Zenith Electronics Corporation as President and Chief Executive Officer from 1995 to 1996 and as President, Chief Operating Officer and Director from 1994 to 1995. Mr. Moschner has also served in various managerial capacities at Tricord Systems, Inc. and International Business Machines Corp. Mr. Moschner holds a Bachelor of Engineering in Electrical Engineering from The City College of New York, awarded in 1974, and a masters degree in Electrical Engineering awarded by Syracuse University in 1979. We believe that Mr. Moschner’s marketing, manufacturing and wireless industry experience and long standing prior public board experience provide the requisite qualifications, skills, perspectives, and experiences to serve on our Board of Directors.
William J. Reilly, Jr., joined the Board of Directors of the Company in July 2012. He is a member of our Nominating and Corporate Governance Committee, has been a member of our Compensation Committee since December 2016, and was a member of our Audit Committee from July 2012 until December 2016. He has been an independent consultant since January 2011. From September 2004 to November 2010, Mr. Reilly was President and Chief Executive Officer of Realtime Media, Inc., an interactive promotional marketing firm serving the pharmaceutical and consumer packaged goods markets. Following the sale of Realtime Media, Inc. in November 2010, Mr. Reilly was retained as a consultant until January 2011. From September 2002 to September 2004, Mr. Reilly was a principal at Chesterbrook Growth Partners, independent consultants to the private equity community. Between 1989 and 2002, Mr. Reilly served at various positions at Checkpoint Systems Inc., a multinational manufacturer and marketer of products and services for automatic identification, retail security, pricing and brand promotion, including as Chief Operating Officer, Executive Vice President, Senior Vice President of the Americas and Pacific Rim and Vice President of Sales. Prior to that, Mr. Reilly held national and sales management positions at companies in the medical electronics and telecommunications industries, including Minolta Corporation, Megatech Pty. Ltd. and Multitone Electronics PLC. He has also served on the Board of Veramark Technologies, Inc., a telecommunications software firm, from June 1997 to May 2008. Mr. Reilly graduated from Mount St. Mary’s University with a Bachelor of Science degree in Psychology in 1970. We believe that Mr. Reilly’s executive, business development and international experience provide the requisite qualifications, skills, perspectives and experiences to serve on our Board of Directors.
William J. Schoch, joined the Board of Directors of the Company in July 2012. He is the Chair of our Nominating and Corporate Governance Committee and has been a member of our Audit Committee since December 2016. Mr. Schoch is the President and Chief Executive Officer of Western Payments Alliance, a non-profit payments association and has served in that capacity since March 2008. He serves on the Boards of Western Payments Alliance and WesPay Advisors, a payments consultancy and subsidiary of Western Payments Alliance. He is a past director of NACHA – The Electronic Payments Association and continues to serve on the Steering committee of NACHA's Payments Innovation Alliance. From 1997 to 2008, Mr. Schoch worked at Visa International where, as the Vice President of Emerging Market Initiatives, he was responsible for the global development of the Visa Money Transfer Platform. Prior to that, Mr. Schoch served as a Vice President at Citibank, N.A. from 1989 to 1997 and as an Associate Director at NACHA from 1986 to 1989. Mr. Schoch obtained a Bachelor of Arts degree in 1986 from Indiana University of Pennsylvania with a major in Public Policy and a minor in Economics. We believe that Mr. Schoch’s experience and familiarity with the electronic payments industry and his leadership experience provide the requisite qualifications, skills, perspectives and experiences to serve on our Board of Directors.
DIRECTOR INDEPENDENCE
The Board of Directors has determined that Steven D. Barnhart, Joel Brooks, Robert L. Metzger, Albin F. Moschner, William J. Reilly, Jr., and William J. Schoch, which members constitute all of the currently serving Board of Directors other than Mr. Herbert, are independent in accordance with the applicable listing standards of The NASDAQ Stock Market LLC.
The Board of Directors has a standing Audit Committee, Nominating and Corporate Governance Committee, and Compensation Committee.
The Audit Committee of the Board of Directors presently consists of Mr. Metzger (Chair), Mr. Barnhart and Mr. Schoch. The Audit Committee recommends the engagement of the Company’s independent accountants and is primarily responsible for approving the services performed by the Company’s independent accountants, for reviewing and evaluating the Company’s accounting principles, reviewing the independence of independent auditors, and for discussing with management and the independent auditor any major issues as to the adequacy of the Company’s internal controls and any special steps adopted in light of material control deficiencies. The Audit Committee operates pursuant to a charter that was last amended and restated by the Board of Directors on April 11, 2006, a copy of which is accessible on the Company’s website, www.usatech.com.
The Compensation Committee of the Board of Directors presently consists of Mr. Moschner (Chair) and Mr. Reilly. The Board of Directors has determined that each of the current members of the Compensation Committee is independent in accordance with the applicable listing standards of The Nasdaq Stock Market LLC. The Committee reviews and recommends compensation and compensation changes for the executive officers of the Company and administers the Company’s stock option and restricted stock grant plans. The Compensation Committee operates pursuant to a charter that was adopted by the Board of Directors in September 2007 and amended in May 2013, a copy of which is accessible on the Company’s website, www.usatech.com.
The Nominating and Corporate Governance Committee of the Board of Directors presently consists of Mr. Schoch (Chair) and Mr. Reilly. The Board of Directors has determined that each of the current members of the Nominating and Corporate Governance Committee is independent in accordance with the applicable listing standards of The Nasdaq Stock Market LLC. The Committee recommends to the entire Board of Directors for selection any nominees for director. The Nominating and Corporate Committee operates pursuant to a charter that was adopted by the Board of Directors on October 26, 2012, a copy of which is accessible on the Company’s website, www.usatech.com.
COMPENSATION DISCUSSION AND ANALYSIS
During the 2016 fiscal year, our named executive officers (collectively, the “named executive officers”) were as follows: Stephen P. Herbert - current Chairman and Chief Executive Officer; Leland P. Maxwell – former interim Chief Financial Officer, who became our Senior Vice President of Finance on March 31, 2017; Michael Lawlor - current Chief Services Officer; Maeve Duska - current Senior Vice President of Marketing; George Harrum – current Senior Vice President of Operations; David M. DeMedio - former Chief Financial Officer and Chief Services Officer who resigned his employment with the Company in October 2015; and J. Duncan Smith - former Chief Financial Officer who resigned his employment with the Company in January 2016.
Fiscal Year 2016 Business Highlights
The Compensation Committee has developed a compensation policy that is designed to attract and retain key executives responsible for the Company’s success and motivate management to enhance long-term shareholder value.
Fiscal year 2016 financial highlights, compared to the prior year, included:
| · |
33% increase in total revenues to $77.4 million;
|
| · |
30% increase in license and transaction fee revenues to $56.6 million;
|
| · |
44% increase in equipment sale revenues to $20.8 million primarily attributable to the QuickStart program which was reintroduced in September 2014;
|
| · |
Total connections to the Company’s cashless payment and telemetry service, ePort Connect®, grew by 29% to 429,000; and
|
| · |
Year-end cash position of $19.3 million as compared to $11.4 million as of the end of the prior fiscal year.
|
Notwithstanding the substantial progress made by the Company during the 2016 fiscal year, the Company did not achieve all of the target goals established by the Compensation Committee for compensation of our executive officers under the Fiscal Year 2016 Short-Term Incentive Plan (“2016 STI Plan”) and Fiscal Year 2016 Long-Term Incentive Performance Share Plan (“2016 LTI Stock Plan”). When the target goals were established, the Committee believed that the attainment of the target goals would represent a significant achievement for management and were designed to stretch individual and corporate performance.
Our 2016 Compensation Goals and Objectives
The Compensation Committee is responsible for annually reviewing and recommending to the Board for approval the corporate goals and objectives relevant to the compensation of the executive officers of the Company, evaluating the executive officers’ performance in light of those goals and objectives, and recommending for approval to the Board the executive officers’ compensation levels based on this evaluation. The Chief Executive Officer assisted the Compensation Committee in establishing the compensation of our other executive officers, Leland Maxwell and Michael Lawlor. The compensation of Mr. Harrum and Ms. Duska was determined by our Chief Executive Officer. Our Chief Executive Officer regularly provides information to the Compensation Committee. The Chief Executive Officer is not present during voting or deliberations on his compensation. The Compensation Committee has, from time to time, retained an independent compensation consultant, Buck Consultants, LLC, as deemed necessary to assist the Committee in making appropriate recommendations regarding our executive officers’ compensation.
Mr. Lawlor’s compensation for the first half of the fiscal year was established by our Chief Executive Officer, and for the second half of the fiscal year was recommended by the Committee to the Board. Mr. Lawlor participated in each of the fiscal year 2016 management incentive plan, the 2016 STI Plan and the 2016 LTI Stock Plan during the entire 2016 fiscal year, provided that his awards for each plan were reduced by fifty percent (50%).
We have developed a compensation policy that is designed to attract and retain key executives responsible for our success and motivate management to enhance long-term shareholder value. The Compensation Committee believes that compensation of the Company’s executive officers should encourage creation of shareholder value and achievement of strategic corporate objectives, and the Committee seeks to align the interests of the Company’s shareholders and management by integrating compensation with the Company’s annual and long-term corporate and financial objectives. The Compensation Committee also ties a significant portion of each executive officer’s compensation to key operational and financial goals and performance.
We have also designed and implemented our compensation package in order to be competitive with other companies in our peer group, as compiled by our compensation consultant, and to motivate and retain our executive officers. Our compensation package also takes into account individual responsibilities and performance.
Certain elements of our compensation reflect different compensation objectives. For example, as base salaries are generally fixed in advance of the year in which the compensation will be earned, the Committee believes that it is appropriate to determine base salaries with a focus on similarly situated officers at comparable peer group companies while also having them reflect the officer’s performance. On the other hand, annual bonuses and long-term incentives are better able to reflect the Company’s performance as measured by total number of connections, total revenues, non-GAAP net income, adjusted EBIDTA, and cash generated from operations. In addition, annual bonuses and long-term incentive awards, including the performance goals they are based on, help us achieve our goal of retaining executives, and motivating executive officers to increase shareholder value. The other elements of compensation reflect the Committee’s and Board’s philosophy that personal benefits, including retirement and health benefits, should be available to all employees on a non-discriminatory basis.
Our Executive Compensation Practices
Our compensation program for our executive officers features many commonly used “best practices” including:
| · |
Pay-for-performance. A substantial part of our executive officer’s pay is, in our view, performance based. For the 2016 fiscal year, our Chief Executive Officer had approximately 62% of his total target compensation tied to performance, while our interim Chief Financial Officer and current Chief Services Officer had approximately 43% and 60%, respectively, of their total target compensation tied to performance.
|
| · |
Stretch performance goals. Our performance target goals under our 2016 STI Plan and 2016 LTI Stock Plan are designed to stretch individual and organizational performance in order to receive target payouts.
|
| · |
Capped payouts under incentive plans. Both our long-term and short-term bonus programs have maximum payout amounts in order to discourage excessive risk taking.
|
| · |
Stock ownership guidelines. We have significant ownership guidelines. Our Chief Executive Officer is required to hold Common Stock with a value equal to a multiple of three times his base salary and our Chief Financial Officer and other executive officers are required to hold Common Stock with a value equal to one time his base salary.
|
| · |
No Tax Gross-Up Provisions. Our compensation program does not include any excise tax gross-up provisions with respect to payments contingent upon a change of control.
|
| · |
Limited perquisites for our executives. Perquisites are not a significant portion of our executive officers’ compensation, representing 1% of Mr. Herbert’s, 0% of Mr. Maxwell’s, and 2% of Mr. Lawlor’s total target compensation.
|
| · |
Independent compensation consultant. The Committee has from time to time retained an independent compensation consultant, Buck Consultants, LLC, to review the executive compensation programs and practices.
|
| · |
No payment on change of control without a “double trigger”. Payments under our employment agreements require two events for vesting – both the change of control and a “good reason” for termination of employment.
|
| · |
No repricing of underwater options. Our stock option incentive plan does not permit repricing or the exchange of underwater stock options without shareholder approval.
|
Pay-for-Performance Review
Pay-for-performance is an important component of our compensation philosophy and is evident in the structure of our compensation program. Our compensation approach is designed to motivate our executive officers to substantially contribute to the Company’s long-term sustainable growth. Our pay-for-performance approach provides that a large portion of our executive officers’ total compensation should be in the form of short-term and long-term incentive awards with performance hurdles designed to stretch individual and organizational performance.
Reinforcing pay-for-performance is a significant underpinning of our compensation program. During the 2016 fiscal year, a total of 62% of Mr. Herbert’s, 43% of Mr. Maxwell’s and 60% of Mr. Lawlor’s total target compensation was in the form of performance-based variable compensation designed to motivate them to deliver strong business performance and create shareholder value. These compensation elements were dependent upon the Company’s achievement of pre-established financial and other business goals recommended by the Committee as well as individual goals established by the Committee or consisted of stock option awards which are inherently performance based as they only deliver value if the stock price increases. All stock options awarded by the Committee are exercisable at the closing share price on the date of the grant. Based on actual results, the annual variable compensation amount and the ultimate value of the equity compensation awards could have been significantly reduced if the Company or management did not perform.
For fiscal year 2016, the targeted aggregate compensation of our current named executive officers consisted of the following components expressed as a percentage of total compensation:
|
Named Executive Officer
|
Base
Salary
|
Award
Bonus
|
Long-Term
Incentive
Compensation
|
Perquisites &
Other Benefits
|
Total
Compensation
|
|||||||||||||||
|
Stephen P. Herbert
|
37
|
%
|
19
|
%
|
43
|
%
|
1
|
%
|
100
|
%
|
||||||||||
|
Leland P. Maxwell
|
57
|
%
|
43
|
%
|
0
|
%
|
0
|
%
|
100
|
%
|
||||||||||
|
Michael Lawlor
|
38
|
%
|
24
|
%
|
36
|
%
|
2
|
%
|
100
|
%
|
||||||||||
|
Maeve Duska
|
53
|
%
|
47
|
%
|
0
|
%
|
0
|
%
|
100
|
%
|
||||||||||
|
George Harrum
|
64
|
%
|
33
|
%
|
0
|
%
|
3
|
%
|
100
|
%
|
||||||||||
The long-term incentive compensation in the above table and in the table set forth below each reflect the awards to Mr. Herbert of incentive stock options to purchase up to 29,585 shares and to Mr. Lawlor of incentive stock options to purchase up to 75,000 shares.
For fiscal year 2016, the aggregate compensation actually paid or awarded to our named executive officers consisted of the following components expressed as a percentage of total compensation:
|
Named Executive Officer
|
Base
Salary
|
Award
Bonus
|
Long-
Term
Incentive
Compensation
|
Other
Perquisites &
Other
Benefits
|
Total
Compensation
|
|||||||||||||||
|
Stephen P. Herbert
|
44
|
%
|
16
|
%
|
39
|
%
|
1
|
%
|
100
|
%
|
||||||||||
|
Leland P. Maxwell
|
69
|
%
|
31
|
%
|
0
|
%
|
0
|
%
|
100
|
%
|
||||||||||
|
Michael Lawlor
|
45
|
%
|
15
|
%
|
39
|
%
|
1
|
%
|
100
|
%
|
||||||||||
|
Maeve Duska
|
67
|
%
|
33
|
%
|
0
|
%
|
0
|
%
|
100
|
%
|
||||||||||
|
George Harrum
|
76
|
%
|
21
|
%
|
0
|
%
|
3
|
%
|
100
|
%
|
||||||||||
Peer Group Analysis
In July 2014, the Company obtained an updated analysis from Buck Consultants, LLC which contained a new peer group and updated the compensation analysis that had been previously performed. Buck Consultants, LLC assembled a peer group of 15 companies that it deemed comparable to the Company on the basis of size, market capitalization, industry, or financial performance. The peer group consisted of:
|
o Clearfield, Inc.
|
o Netsol Technologies, Inc.
|
o Procera Networks, Inc.
|
|
o Immersion Corp.
|
o Local Corp.
|
o Tangoe, Inc.
|
|
o Digimarc Corp.
|
o Numerex Corp.
|
o Transact Technologies, Inc.
|
|
o Jive Software, Inc.
|
o Onvia, Inc.
|
o Westell Technologies, Inc.
|
|
o LGL Group, Inc.
|
o Planar Systems, Inc.
|
o Planet Payment, Inc.
|
When making compensation decisions, the Committee reviews the aggregate target compensation paid to an executive officer relative to the compensation paid to similarly situated executives, to the extent available, at our peer companies. For fiscal year 2016, the Committee recommended a compensation program for our executive officers consisting of target level compensation approximately equal to the 50th percentile for similarly situated officers at the peer group companies compiled by Buck Consultants, LLC.
During August 2016, the Committee obtained an updated analysis from Buck Consultants, LLC, which contained a new peer group and updated the compensation analysis that had been previously performed. The Committee utilized this new analysis in connection with its compensation recommendations for the 2017 fiscal year.
Elements of Compensation
This section describes the various elements of our compensation program for our named executive officers during the 2016 fiscal year. The components of compensation reflected in our named executive officers’ compensation program are set forth in the following table:
|
Element
|
Key Characteristics
|
Why We Pay
this Element
|
How We Determine
the Amount
|
|||
|
Base Salary
|
Fixed compensation component payable in cash. Reviewed annually and adjusted when appropriate.
|
Provide a base level of competitive cash compensation for executive talent.
|
Experience, job scope, peer group, and individual performance.
|
|||
|
Annual Bonus
|
Variable compensation component payable in cash or stock based on performance as compared to annually-established company and/or individual performance goals.
|
Motivate and reward executives for performance on key operational, financial and personal measures during the year.
|
Organizational and individual performance, with actual payouts based on the extent to which performance goals are satisfied.
|
|||
|
Long Term Incentives
|
Variable compensation component payable in restricted stock or stock options.
|
Alignment of long term interests of management and shareholders. Retention of executive talent.
|
Organizational and individual performance, with actual awards based on the extent to which goals are satisfied.
|
|||
|
Perquisites and Other Personal Benefits
|
Fixed compensation component to provide basic competitive benefits.
|
Provide a base level of competitive compensation for executive talent.
|
Periodic review of benefits provided generally to all employees.
|
Base Salary
Base salary is the fixed component of our named executive officers’ annual cash compensation and is set with the goal of attracting talented executives and adequately compensating and rewarding them for services rendered during the fiscal year. The Compensation Committee reviews our executive officers’ base salary on an annual basis.
The base salaries of each of our executive officers reflect the individual’s level of responsibility and performance. In recommending base salaries of our executive officers to the Board of Directors, the Compensation Committee also considers changes in duties and responsibilities, our business and financial results, and its knowledge of base salaries paid to executive officers of our peer group. The base salaries of each of Ms. Duska and Mr. Harrum were established by our Chief Executive Officer after discussions with each employee.
Effective July 24, 2015, we increased Mr. Herbert’s base salary by approximately 6% to $360,000, and effective January 1, 2016 we increased Mr. Lawlor’s base salary by 15% to $235,000. Prior to January 1, 2016, Mr. Lawlor’s base salary was established by our Chief Executive Officer after discussion with Mr. Lawlor.
Annual Bonus
Performance-based annual bonuses are based on each named executive officer’s achievement of performance goals. Annual bonuses are intended to provide officers with an opportunity to receive additional cash compensation based on their individual performance and Company results, including the achievement of pre-determined Company and/or individual performance goals. Performance-based bonuses are included in the compensation package because they incentivize our named executive officers, in any particular year, to pursue particular objectives that are consistent with the overall goals and strategic direction that the Board has set for the Company for that year.
The Committee believes that the annual performance-based bonus reinforces the pay-for-performance nature of our compensation program.
Fiscal Year 2016 Short-Term Incentive Plan
At the recommendation of the Compensation Committee, the Board of Directors adopted the 2016 STI Plan covering our executive officers. Pursuant to the 2016 STI Plan, each executive officer would earn a cash bonus in the event that the Company achieved during the 2016 fiscal year certain annual financial goals (80% weighting) and certain annual specific performance goals relating to the executive officer which were established by the Compensation Committee (20% weighting). The annual financial goals are total revenues (30% weighting), cash generated from operations (30% weighting), and non-GAAP net income (40% weighting). Assuming the minimum threshold target goal would be achieved for a particular metric, the amount of the cash bonus to be earned would be determined on a pro rata basis, provided that the bonus would not exceed the maximum distinguished award for that metric.
The individual performance goals established by the Compensation Committee for Mr. Herbert included clearly communicating the Company's strategy, goals and objectives to the investment community, developing senior management leadership necessary to support the future growth of the Company, and leading the effort to identify strategic alternatives for the Company.
The Compensation Committee set the cash bonus opportunity for each current executive officer as a percentage of his respective annual base salary as set forth in the following table.
|
Named Executive Officer
|
Threshold Performance
|
Target Performance
|
Distinguished Performance
|
|||||||||
|
Stephen P. Herbert
|
-
|
50
|
%
|
75
|
%
|
|||||||
|
Michael Lawlor
|
-
|
10
|
%
|
15
|
%
|
|||||||
Below were the threshold, target and distinguished cash bonus award target opportunities for our current executive officers:
|
Named Executive Officer
|
Threshold Performance
|
Target Performance
|
Target Performance
|
|||||||||
|
Stephen P. Herbert
|
$
|
-
|
$
|
180,000
|
$
|
270,000
|
||||||
|
Michael Lawlor
|
$
|
-
|
$
|
23,500
|
$
|
35,250
|
||||||
Mr. Herbert earned a cash bonus of $134,227, representing 37% of his base salary, and Mr. Lawlor earned a cash bonus of $16,349 representing 7% of his base salary, under the 2016 STI Plan. The Compensation Committee determined that Mr. Herbert had achieved 125% of his individual performance target goals, and Mr. Lawlor had achieved 100% of his individual performance target goals. Based on the actual performance of the Company during the 2016 fiscal year, the minimum threshold performance target was not met for non-GAAP net income, revenues for the fiscal year were in excess of the maximum distinguished target goal, and cash generated from operations was in excess of the minimum threshold target but less than the target goal. In determining the award under the 2016 STI Plan, the Compensation Committee further increased the cash generated from operations by certain non-recurring charges incurred by the Company during the fiscal year in connection with the VendScreen acquisition and business integration. Following the adjustment, cash generated from operations was still less than the target goal under the plan.
Other Named Executive Officers’ Cash Bonus
For the fiscal year ended June 30, 2016, the cash bonuses earned by Mr. Maxwell, Mr. Harrum, Mr. Lawlor and Ms. Duska under the fiscal year 2016 management incentive plan were based upon the attainment of financial target goals by the Company relating to connections (25% weighting), revenues (15% weighting), non-GAAP net income (20% weighting), adjusted EBITDA (25% weighting), and cash generated from operations (15% weighting). Based on the actual performance of the Company during the 2016 fiscal year, the minimum threshold performance targets were not met for non-GAAP net income and adjusted EBITDA, connections were in excess of the target goal but less than the distinguished target goal, revenues were in excess of the target goal but less than the maximum distinguished target goal, and cash generated from operations was greater than the minimum threshold target goal but less than the target goal. In determining the awards under the plan, adjusted EBITDA was further increased by management for certain charges resulting in this metric exceeding the minimum threshold target but less than the target goal, and cash generated from operations was further increased by management for certain charges resulting in an increase to this metric which was still less than the target goal.
Long-Term Incentive Compensation
As described above, the Compensation Committee believes that a substantial portion of each executive officer’s compensation should be in the form of long-term incentive compensation in order to further align the interests of our executive officers and shareholders.
Fiscal Year 2016 Long-Term Incentive Performance Share Plan
At the recommendation of the Compensation Committee, the Board of Directors adopted the 2016 LTI Stock Plan covering our executive officers. Under the 2016 LTI Stock Plan, each executive officer would be awarded shares of Common Stock in the event that certain metrics relating to the Company’s 2016 fiscal year would result in specified ranges of year-over-year percentage growth. The metrics are total number of connections as of June 30, 2016 as compared to total number of connections as of June 30, 2015 (50% weighting), and adjusted EBITDA earned during the 2016 fiscal year as compared to adjusted EBITDA earned during the 2015 fiscal year (50% weighting). The shares awarded under the 2016 LTI Stock Plan would vest as follows: one-third on the date of issuance; one-third on June 30, 2017; and one-third on June 30, 2018.
At the time of the establishment of the 2016 LTI Stock Plan, the Compensation Committee believed that the attainment of the target goals under the 2016 LTI Stock Plan would represent a significant achievement for management, and were designed to stretch the Company’s and management’s performance during the fiscal year.
The Compensation Committee established target long-term award levels for each current executive officer as a percentage of his respective annual base salary as indicated in the table set forth below.
|
Named Executive Officer
|
Threshold Performance
|
Target Performance
|
Distinguished Performance
|
|||||||||
|
Stephen P. Herbert
|
-
|
100
|
%
|
150
|
%
|
|||||||
|
Michael Lawlor
|
-
|
37.5
|
%
|
56.25
|
%
|
|||||||
The table set forth below lists the value of the shares that would have been awarded to the current executive officers under the 2016 LTI Stock Plan if all of the minimum threshold performance goals had been achieved, if all of the target performance goals had been achieved, and if all of the distinguished performance goals had been achieved. Assuming the minimum threshold target goal was achieved for a particular metric, the number of shares to be awarded for that metric was required to be determined on a pro-rata basis, provided that the award could not exceed the maximum distinguished award for that metric.
|
Named Executive Officer
|
Threshold Performance
|
Target Performance
|
Distinguished Performance
|
|||||||||
|
Stephen P. Herbert
|
$
|
-
|
$
|
360,000
|
$
|
540,000
|
||||||
|
Michael Lawlor
|
$
|
-
|
$
|
88,125
|
$
|
132,188
|
||||||
Based on the actual performance of the Company during the 2016 fiscal year, the minimum threshold performance target established under the 2016 LTI Stock Plan was not met for adjusted EBITDA. Connections for the fiscal year were in excess of the maximum distinguished target goal. Consequently, the stock award to each executive officer under the 2016 LTI Stock Plan was as follows:
|
Named Executive
Officer
|
Number of
shares
|
Value of Shares as of
June 30, 2016
|
||||||
|
Stephen P. Herbert
|
63,232
|
$
|
270,000
|
|||||
|
Michael Lawlor
|
15,479
|
$
|
66,094
|
|||||
The shares awarded to Mr. Herbert had a value equal to 75% of his annual base salary, and the shares awarded to Mr. Lawlor had a value equal to 28% of his annual base salary.
Stock Option Awards
During July 2015, Mr. Herbert was awarded incentive stock options intended to qualify under Section 422 of the Internal Revenue Code of 1986, as amended (the “Code”), to purchase up to 29,585 shares at an exercise price of $3.38 per share. The options vested on August 1, 2016, and expire if not exercised prior to August 1, 2022.
During January 2016, Mr. Lawlor was awarded incentive stock options intended to qualify under Section 422 of the Code to purchase up to 75,000 shares at an exercise price of $2.94 per share. The options vest as follows: one-third on January 12, 2017; one-third on January 12, 2018; and one-third on January 12, 2019. The options expire if not exercised prior to January 12, 2023.
Perquisites and Other Benefits
Our named executive officers were entitled to the health care coverage, group insurance and other employee benefits provided to all of our other employees.
Post-Termination Compensation
As set forth in his employment agreement, upon the termination of Mr. Herbert’s employment under certain circumstances, including termination by the Company without cause or by a notice of non-renewal of the employment agreement, or under certain circumstances following a change of control of the Company, the Company has agreed to pay Mr. Herbert a lump sum amount equal to two times his annual base salary and all restricted stock awards or stock options would become vested as of the date of termination.
We believe that these provisions are an important component of Mr. Herbert's employment arrangement and will help to secure his continued employment and dedication, notwithstanding any concern that he might have at such time regarding his own continued employment, prior to or following a change of control.
The Committee notes that there would be no payments to our executive officers upon a change of control without a “double trigger”. Payments under our employment agreements require two events for vesting – both the change of control and a “good reason” for termination of employment.
Additional information regarding what would have been received by Mr. Herbert had termination occurred on June 30, 2016 is found under the heading “Potential Payments upon Termination or Change of Control” on page 74 of this prospectus.
Stock Ownership Policy
We believe that providing our executive officers who have responsibility for the Company’s management and growth with an opportunity to increase their ownership of Company shares aligns the interests of the executive officers with those of the shareholders. Our Stock Ownership Guidelines provide that the Chief Executive Officer should own shares with a value of at least three times his annual base salary, and the Chief Financial Officer and other executive officers should own shares with a value of at least one times his annual base salary. Each executive officer has five years to obtain such ownership from the commencement of serving as an executive officer. As of the date hereof, each executive officer is in compliance with the policy.
Our Stock Ownership Guidelines provide that each non-employee director should own shares of Common Stock with a value of at least five times his or her annual cash retainer. For this purpose, the annual retainer shall include the annual retainer for service on the Board as well as the annual retainer for serving on one (but not more than one) Committee of the Board. Each director has five years to obtain such ownership from commencement of service as a director. As of the date hereof, each of the directors is in compliance with the policy.
For purposes of these guidelines, “shares” include shares owned by the executive officer or director or by such person’s immediate family members residing in the same household and include non-vested restricted stock awards held by the executive officer or non-employee director.
Effect Of 2016 Say-On-Pay Vote
At the 2016 Annual Meeting of Shareholders, over 86% of the votes cast on the advisory vote on the compensation of our named executive officers were in favor of the Company’s executive compensation disclosed in the proxy statement. The Compensation Committee considered the vote, and even though the results convey strong shareholder support for the Company’s executive compensation programs and the Compensation Committee’s decisions, the Committee determined that it was in the best interest of the Company and its shareholders to continue to evaluate our executive compensation programs and, if appropriate, to strengthen certain aspects of these programs.
Impact of Taxation and Accounting Considerations on Executive Compensation
The Compensation Committee and the Board of Directors take into account tax and accounting consequences of the compensation program and weigh these factors when setting total compensation and determining the individual elements of any named executive officer’s compensation package.
The stock and option awards to our named executive officers under our equity incentive plans provide that the officer is responsible for any withholding or payroll tax obligations incurred by the Company in connection with the award, and that the officer may satisfy any such obligations by, among other things, either the delivery to the Company of a cash payment equal to the obligations, or the assignment or transfer to the Company of shares having a value equal to the obligations, or such other method that shall be satisfactory to the Company.
Summary Compensation Table
The following table sets forth certain information with respect to compensation paid or accrued by the Company during the fiscal years ended June 30, 2016, 2015, and 2014 to each of our named executive officers:
|
Name and Principal Position
|
Fiscal
Year
|
Salary
|
Bonus (1)
|
Stock
Awards (2)
|
Option
Awards (3)
|
All Other
Compensation (4)
|
Total
|
|||||||||||||||||||
|
Stephen P. Herbert
|
2016
|
$
|
358,194
|
$
|
134,227
|
$
|
360,000
|
$
|
48,225
|
$
|
10,600
|
$
|
911,246
|
|||||||||||||
|
Chief Executive Officer, President
|
2015
|
$
|
341,227
|
$
|
101,732
|
$
|
341,227
|
$
|
261,055
|
$
|
10,400
|
$
|
1,055,641
|
|||||||||||||
|
& Chairman of the Board
|
2014
|
$
|
341,227
|
$
|
29,673
|
$
|
341,227
|
$
|
-
|
$
|
10,000
|
$
|
722,127
|
|||||||||||||
|
Leland P. Maxwell
|
2016
|
$
|
92,000
|
$
|
42,331
|
$
|
-
|
$
|
-
|
$
|
-
|
$
|
134,331
|
|||||||||||||
|
Former Interim Chief Financial Officer
|
||||||||||||||||||||||||||
|
David M. DeMedio
|
2016
|
$
|
96,680
|
$
|
-
|
$
|
227,425
|
$
|
-
|
$
|
226,694
|
$
|
550,799
|
|||||||||||||
|
Former Chief Financial Officer and
|
2015
|
$
|
239,537
|
$
|
31,242
|
$
|
178,406
|
$
|
156,633
|
$
|
2,562
|
$
|
608,380
|
|||||||||||||
|
Chief Services Officer
|
2014
|
$
|
237,875
|
$
|
17,238
|
$
|
213,709
|
$
|
-
|
$
|
-
|
$
|
468,822
|
|||||||||||||
|
J. Duncan Smith
|
2016
|
$
|
129,103
|
$
|
-
|
$
|
198,750
|
$
|
162,900
|
$
|
-
|
$
|
490,753
|
|||||||||||||
|
Former Chief Financial Officer
|
||||||||||||||||||||||||||
|
Michael Lawlor
|
2016
|
$
|
203,246
|
$
|
68,977
|
$
|
88,125
|
$
|
107,250
|
$
|
9,990
|
$
|
477,588
|
|||||||||||||
|
Chief Services Officer
|
2015
|
$
|
179,800
|
$
|
44,186
|
$
|
-
|
$
|
50,283
|
$
|
7,830
|
$
|
282,099
|
|||||||||||||
|
2014
|
$
|
179,800
|
$
|
15,953
|
$
|
-
|
$
|
-
|
$
|
8,670
|
$
|
204,423
|
||||||||||||||
|
Maeve Duska
|
2016
|
$
|
181,738
|
$
|
88,137
|
$
|
-
|
$
|
-
|
$
|
-
|
$
|
269,875
|
|||||||||||||
|
Sr. VP of Sales and Marketing
|
2015
|
$
|
179,800
|
$
|
36,512
|
$
|
50,000
|
$
|
28,773
|
$
|
-
|
$
|
295,085
|
|||||||||||||
|
2014
|
$
|
155,708
|
$
|
9,572
|
$
|
-
|
$
|
-
|
$
|
-
|
$
|
165,280
|
||||||||||||||
|
George Harrum
|
2016
|
$
|
180,508
|
$
|
50,786
|
$
|
-
|
$
|
-
|
$
|
7,899
|
$
|
239,193
|
|||||||||||||
|
Sr. VP of Operations
|
2015
|
$
|
179,800
|
$
|
17,674
|
$
|
-
|
$
|
28,555
|
$
|
7,362
|
$
|
233,391
|
|||||||||||||
|
2014
|
$
|
179,800
|
$
|
4,254
|
$
|
-
|
$
|
-
|
$
|
8,761
|
$
|
192,815
|
||||||||||||||
|
(1)
|
Represents cash bonuses earned upon such person’s performance during the fiscal year or upon the attainment by the Company of certain target goals. For fiscal year 2016, represents Mr. Herbert’s award under the 2016 STI Plan, Mr. Maxwell’s award under the fiscal year 2016 management incentive plan (the “2016 MIP”) and an incentive bonus of $11,429; Ms. Duska’s award under the 2016 MIP, Mr. Harrum’s award under the 2016 MIP, and Mr. Lawlor’s award under each of the 2016 MIP and the 2016 STI Plan. Neither Mr. DeMedio nor Mr. Smith received a cash bonus under the 2016 LTI Stock Plan.
|
|
(2)
|
In accordance with FASB ASC Topic 718, the price of our common stock on the grant date equals the grant date fair value of these stock awards. For fiscal year 2016, represents (i) 106,509 shares with a value of $360,000 that would have been earned by Mr. Herbert under the 2016 LTI Stock Plan if all of the target goals had been achieved, (ii) 59,763 shares with a value of $202,500 that would have been earned by Mr. DeMedio under the 2016 LTI Stock Plan if all of the target goals had been achieved, (iii) 22,890 shares with a value of $88,125 that would have been earned by Mr. Lawlor under the 2016 LTI Stock Plan if all of the target goals had been achieved, and (iv) 59,864 shares with a value of $198,750 that would have been earned by Mr. Smith under the 2016 LTI Plan if all the target goals had been achieved, and (v) 7,396 shares awarded to Mr. DeMedio as bonus on July 24, 2015, with a grant date value $25,000. Based on the actual financial results for the fiscal year, Mr. Herbert was awarded shares with a value of $270,000 and Mr. Lawlor was awarded shares with a value of $66,094. Messrs. DeMedio and Smith did not receive any awards under the 2016 LTI Plan. If all of the maximum target levels had been achieved under the 2016 Plan, Mr. Herbert would have earned shares with a value of $540,000, Mr. Lawlor would have earned shares with a value of $132,188, Mr. DeMedio would have earned shares with a value of $303,750, and Mr. Smith would have earned shares with a value of $298,125. The shares earned under the 2016 LTI Stock Plan vest as follows: one-third on the date of issuance; one-third on June 1, 2017; and one-third on June 1, 2018.
|
|
(3)
|
In accordance with FASB ASC Topic 718, the Black-Scholes value on the grant date equals the grant date fair value of these option awards. For fiscal year 2016, represents (i) 29,585 incentive stock options awarded to Mr. Herbert on July 24, 2015, which vested on August 1, 2016, (ii) 90,000 non-qualified stock options, awarded to Mr. Smith on July 24, 2015 which were forfeited upon Mr. Smith’s resignation from the Company in January 2016; and (iii) 75,000 incentive stock options, awarded to Mr. Lawlor on January 12, 2016 and which vest one-third on January 12, 2017; one-third on January 12, 2018; and one-third on January 12, 2019.
|
|
(4)
|
During the 2016 fiscal year, represents matching 401(k) plan contributions for Messrs. Herbert, Harrum and Lawlor. For Mr. DeMedio, represents a $3,175 matching 401(k) plan contribution, as well as the following amounts paid under his separation agreement: $199,904 of consulting fees; $15,577 in unused time off; and $8,038 in health insurance benefits.
|
Grants Of Plan-Based Awards Table
The table below summarizes the amounts of awards granted to our named executive officers during the fiscal year ended June 30, 2016:
|
Estimated Future Payouts Under Non-
Equity Incentive Plan Awards (1)
|
Estimated Future Payouts Under
Equity Incentive Plan Awards (2)
|
All Other
Stock Awards:
Number of
Shares of
Stock or Units
(3)
|
All Other Option
Awards: Number
of Securities
Underlying
Options (4)
|
Exercise or Base
Price of Option
Awards
|
Grant Date Fair
Value of Stock
and Option
Awards (5)
|
|||||||||||||||||||||||||||||||||||||
|
Name
|
Grant Date
|
Threshold ($)
|
Target ($)
|
Maximum ($)
|
Threshold (#)
|
Target (#)
|
Maximum (#)
|
Units (#)
|
Units (#)
|
$/Sh
|
Awards ($)
|
|||||||||||||||||||||||||||||||
|
Stephen P. Herbert
|
-
|
$
|
180,000
|
$
|
270,000
|
-
|
-
|
-
|
-
|
-
|
-
|
-
|
||||||||||||||||||||||||||||||
|
7/24/2015
|
-
|
-
|
-
|
-
|
106,509
|
159,763
|
-
|
-
|
-
|
$
|
360,000
|
|||||||||||||||||||||||||||||||
|
7/24/2015
|
-
|
-
|
-
|
-
|
-
|
-
|
-
|
29,585
|
$
|
3.38
|
$
|
48,225
|
||||||||||||||||||||||||||||||
|
David M. DeMedio
|
-
|
$
|
81,000
|
$
|
121,500
|
-
|
-
|
-
|
-
|
-
|
-
|
-
|
||||||||||||||||||||||||||||||
|
7/24/2015
|
-
|
-
|
-
|
-
|
59,763
|
89,645
|
-
|
-
|
-
|
$
|
202,500
|
|||||||||||||||||||||||||||||||
|
8/1/2015
|
-
|
-
|
-
|
-
|
-
|
-
|
7,396
|
-
|
-
|
$
|
25,000
|
|||||||||||||||||||||||||||||||
|
Maeve Duska
|
-
|
$
|
164,000
|
$
|
205,000
|
-
|
-
|
-
|
-
|
-
|
-
|
-
|
||||||||||||||||||||||||||||||
|
Michael Lawlor
|
1/12/2016
|
-
|
-
|
-
|
-
|
-
|
-
|
-
|
75,000
|
$
|
2.94
|
$
|
107,250
|
|||||||||||||||||||||||||||||
|
-
|
$
|
23,500
|
$
|
35,250
|
-
|
-
|
-
|
-
|
-
|
-
|
-
|
|||||||||||||||||||||||||||||||
|
3/8/2016
|
-
|
-
|
-
|
-
|
22,890
|
34,335
|
-
|
-
|
-
|
$
|
88,125
|
|||||||||||||||||||||||||||||||
|
-
|
$
|
102,500
|
$
|
128,125
|
||||||||||||||||||||||||||||||||||||||
|
Leland P. Maxwell
|
-
|
$
|
57,500
|
$
|
71,875
|
-
|
-
|
-
|
-
|
-
|
-
|
-
|
||||||||||||||||||||||||||||||
|
J. Duncan Smith
|
-
|
$
|
66,250
|
$
|
99,375
|
-
|
-
|
-
|
-
|
-
|
-
|
-
|
||||||||||||||||||||||||||||||
|
7/24/2015
|
-
|
-
|
-
|
-
|
59,864
|
89,797
|
-
|
-
|
-
|
$
|
198,750
|
|||||||||||||||||||||||||||||||
|
7/24/2015
|
-
|
-
|
-
|
-
|
-
|
-
|
-
|
90,000
|
$
|
3.38
|
$
|
162,900
|
||||||||||||||||||||||||||||||
|
George Harrum
|
-
|
$
|
94,500
|
$
|
118,125
|
-
|
-
|
-
|
-
|
-
|
-
|
-
|
||||||||||||||||||||||||||||||
| (1) |
Represents target and maximum awards for Messrs. Herbert, DeMedio, Lawlor, and Smith under the 2016 STI Plan. Mr. Herbert was awarded $134,227 and Mr. Lawlor was awarded $16,349 under the 2016 STI Plan. Neither Mr. DeMedio nor Mr. Smith received an award under the 2016 STI Plan.
|
Represents target and maximum awards for Ms. Duska and Messrs. Maxwell, Lawlor and Harrum under the 2016 MIP. Mr. Maxwell was awarded $30,902, Mr. Lawlor was awarded $52,628, Ms. Duska was awarded $88,137, and Mr. Harrum was awarded $50,786, under the 2016 MIP.
Mr. Lawlor’s employment agreement provides that during the 2016 fiscal year, Mr. Lawlor will participate in the 2016 MIP, the 2016 STI Plan and the 2016 LTI Stock Plan, provided that any award thereunder otherwise earned by Mr. Lawlor would be reduced by 50%.
| (2) |
Represents number of shares under the target and maximum awards for Messrs. Herbert, DeMedio, Lawlor, and Smith under the 2016 LTI Stock Plan. The number of shares in the table above represents the total dollar value of the award divided by the grant date value of the shares. Based upon the financial results for the 2016 fiscal year, Mr. Herbert was awarded 63,232 shares under the plan, of which one-third vested upon issuance, one-third vested on June 30, 2017, and one-third will vest on June 30, 2018; and Mr. Lawlor was awarded 15,479 shares under the plan, of which one-third vested upon issuance, one-third vested on June 30, 2017, and one-third will vest on June 30, 2018. Neither Mr. DeMedio nor Mr. Smith received an award under the 2016 LTI Stock Plan.
|
| (3) |
Represents a stock award of 7,396 shares granted to Mr. DeMedio and which vested immediately.
|
| (4) |
Represents awards granted to Messrs. Herbert, Smith and Lawlor as follows: Mr. Herbert - 29,585 incentive stock options; Mr. Smith - 90,000 non-qualified stock options; and Mr. Lawlor - 75,000 incentive stock options. The incentive stock options awarded to Mr. Herbert vested on August 1, 2016. The non-qualified stock options awarded to Mr. Smith were forfeited upon Mr. Smith’s resignation from employment in January 2016. The incentive stock options awarded to Mr. Lawlor vest as follows: one-third on January 12, 2017; one-third on January 12, 2018; and one-third on January 12, 2019.
|
|
(5)
|
Represents the grant date fair value of the target award under the 2016 LTI Stock Plan or the option award, as the case may be, as determined in accordance with FASB ASC Topic 718.
|
Outstanding Equity Awards At Fiscal Year-End
The following table shows information regarding unexercised stock options and unvested equity awards granted to the named executive officers as of the fiscal year ended June 30, 2016:
|
Option Awards
|
Stock Awards
|
|||||||||||||||||||||||
|
Name
|
Number of
Securities
Underlying
Unexercised
Options (#)
Exercisable
|
Number of
Securities
Underlying
Unexercised
Options (#)
Unexercisable
(1)
|
Option
Exercise
Price ($)
|
Option
Expiration
Date
|
Number of
Shares or
Units of
Stock That
Have Not
Vested (#)
|
Market
Value of
Shares or
Units of
Stock That
Have Not
Vested ($)
|
||||||||||||||||||
|
Stephen P. Herbert
|
105,555
|
129,585
|
$
|
1.80
|
9/1/2021
|
14,226
|
(2)
|
$
|
60,745
|
|||||||||||||||
|
David M. DeMedio
|
90,000
|
-
|
$
|
1.80
|
9/1/2021
|
-
|
-
|
|||||||||||||||||
|
J. Duncan Smith
|
-
|
-
|
$
|
-
|
-
|
-
|
-
|
|||||||||||||||||
|
Maeve Duska
|
8,333
|
16,667
|
$
|
1.62
|
1/2/2022
|
-
|
-
|
|||||||||||||||||
|
Michael Lawlor
|
8,333
|
16,667
|
$
|
2.75
|
4/8/2022
|
-
|
-
|
|||||||||||||||||
|
-
|
75,000
|
$
|
2.94
|
1/12/2023
|
-
|
-
|
||||||||||||||||||
|
Leland P. Maxwell
|
-
|
-
|
$
|
-
|
-
|
-
|
-
|
|||||||||||||||||
|
George Harrum
|
8,334
|
16,666
|
$
|
1.68
|
1/2/2022
|
-
|
-
|
|||||||||||||||||
| (1) |
Options vest as follows: Mr. Herbert – 29,585 options on August 1, 2016, 50,000 on September 1, 2016 and 50,000 on September 1, 2017; Ms. Duska – 8,333 on January 2, 2017 and 8,333 on January 2, 2018; Mr. Lawlor – 25,000 on January 12, 2017, 8,333 on April 8, 2017, 25,000 on January 12, 2018, 8,333 on April 8, 2018 and 25,000 on January 12, 2019; and Mr. Harrum – 8,333 on January 2, 2017, and 8,333 on January 2, 2018.
|
| (2) |
Reflects shares awarded under the 2015 LTI Stock Plan. Shares vested on June 30, 2017. The closing market price on June 30, 2016, or $4.27 per share, was used in the calculation of market value.
|
Option Exercises And Stock Vested
The following table sets forth information regarding options exercised and shares of common stock acquired upon vesting by our named executive officers during the fiscal year ended June 30, 2016:
| Option Awards |
Stock Awards
|
|||||||||||||||
|
Name
|
Number of
Shares
Acquired on
Exercise (#)
|
Value
Realized on
Exercise ($)
|
Number of
Shares
Acquired on
Vesting (#)
|
Value
Realized on
Vesting ($)
|
||||||||||||
|
Stephen P. Herbert
|
-
|
$
|
-
|
26,442
|
$
|
112,907
|
||||||||||
|
David M. DeMedio
|
33,333
|
$
|
37,333
|
28,659
|
$
|
81,105
|
||||||||||
|
Maeve Duska
|
-
|
$
|
-
|
-
|
$
|
-
|
||||||||||
|
Michael Lawlor
|
-
|
$
|
-
|
-
|
$
|
-
|
||||||||||
|
George Harrum
|
-
|
$
|
-
|
-
|
$
|
-
|
||||||||||
|
J. Duncan Smith
|
-
|
$
|
-
|
-
|
$
|
-
|
||||||||||
|
Leland P. Maxwell
|
-
|
$
|
-
|
-
|
$
|
-
|
||||||||||
EXECUTIVE EMPLOYMENT AGREEMENTS
Additional information regarding each named executive officer’s employment or separation agreement with the Company is set forth below.
Stephen P. Herbert
Mr. Herbert’s employment agreement provides that he has been appointed Chairman and is employed as the Chief Executive Officer. The agreement provided for an initial term continuing through January 1, 2013, which is automatically renewed for consecutive one year periods unless terminated by either Mr. Herbert or the Company upon at least 90 days’ notice prior to the end of the initial term or any one year extension thereof.
Leland P. Maxwell
Pursuant to a letter agreement between the Company and Mr. Maxwell dated January 27, 2016, and an extension effective as of October 1, 2016, Mr. Maxwell served as the Company’s interim Chief Financial Officer from January 28, 2016 through March 31, 2017. As interim Chief Financial Officer, he was eligible to participate in the 2016 MIP, and to receive a cash bonus equal to 50% of the compensation received by him from the Company during the fiscal year if the Company achieved certain annual financial goals during and for the entire 2017 fiscal year. Effective March 31, 2017, Mr. Maxwell became the Senior Vice President of Finance.
Michael Lawlor
Mr. Lawlor’s employment agreement provides that he is employed as Chief Services Officer effective March 8, 2016, and as Senior Vice President of Sales and Business Development prior thereto. Mr. Lawlor’s employment agreement with the Company provides for an initial term through June 30, 2017, and will automatically continue for consecutive one-year periods unless terminated by either party upon notice of at least 60 days prior to the end of the original term or any one year renewal period.
During the 2016 fiscal year of the Company, Mr. Lawlor shall participate in the 2016 MIP as well as in the 2016 STI Plan and in the 2016 LTI Stock Plan. Notwithstanding the terms and conditions of any such plans, the amount of any award otherwise earned by Mr. Lawlor under the 2016 MIP, the 2016 STI Plan, or the 2016 LTI Stock Plan shall be reduced by an amount equal to fifty percent (50%) of the award otherwise earned by Mr. Lawlor under any such plans.
Mr. Lawlor is also entitled to be covered by all standard fringe and employee benefits made available to other employees of the Company, including medical and dental insurance, paid vacation and holidays, a 401(k) plan and a long-term disability plan.
Maeve Duska
Ms. Duska is employed as Senior Vice President of Sales and Marketing. Ms. Duska is covered by all standard fringe and employee benefits made available to other employees of the Company, including medical and dental insurance, paid vacation and holidays, a 401(k) plan and a long-term disability plan.
George Harrum
Mr. Harrum’s employment agreement provides that he is employed as Senior Vice President of Operations. Mr. Harrum’s employment agreement with the Company provides for a term through June 30, 2017, and will automatically continue for consecutive one-year periods unless terminated by either party upon notice of at least 60 days prior to the end of the original term or any one year renewal period. The employment agreement provides that Mr. Harrum is eligible to earn an annual discretionary bonus under the management incentive plan in the maximum amount of 50% of his annual base salary based upon the Company’s and/or his performance. Mr. Harrum is also entitled to be covered by all standard fringe and employee benefits made available to other employees of the Company, including medical and dental insurance, paid vacation and holidays, a 401(k) plan and a long-term disability plan.
David M. DeMedio
The Company and Mr. DeMedio entered into a Separation Agreement pursuant to which, among other things, Mr. DeMedio resigned his employment with the Company effective October 14, 2015, and except for certain provisions relating to confidentiality and non-competition, his employment agreement with the Company was terminated. Prior thereto, Mr. DeMedio’s employment agreement provided that he was employed as the Chief Services Officer of the Company effective August 31, 2015, and as Chief Financial Officer prior thereto.
Pursuant to the Separation Agreement, the Company agreed to provide to Mr. DeMedio: (i) an amount of $270,000, payable in twenty-six equal consecutive payments to $10,384.62 on a bi-weekly basis; (ii) an amount of $67,500, payable in four equal quarterly payments of $16,875; (iii) a lump sum payment of the amount attributable to Mr. DeMedio unused paid time off; (iv) group medical and dental insurance coverage for one year to Mr. DeMedio and his eligible dependents at no cost to Mr. DeMedio other than the employee contribution; (v) 28,659 shares of Common Stock which were previously awarded to Mr. DeMedio, and which had not vested as of the date of his resignation; and (vi) 60,000 non-qualified stock options, exercisable at $1.80 per share, which were previously awarded to Mr. DeMedio, and which had not vested as of the date of his resignation.
J. Duncan Smith
On July 22, 2015, the Company and Mr. Smith entered into a letter agreement pursuant to which Mr. Smith was employed as the Company’s Chief Financial Officer commencing August 31, 2015. Effective January 22, 2016, Mr. Smith resigned from his employment with the Company. On account of such resignation, Mr. Smith forfeited non-qualified stock options to purchase up to 90,000 shares at an exercise price of $3.38 per share, which were awarded to him earlier but had not vested as of the date of his resignation.
POTENTIAL PAYMENTS UPON TERMINATION OR CHANGE OF CONTROL
The employment agreement of Mr. Herbert includes provisions for the Company to make a payment and certain benefits to him upon termination of employment under certain conditions or if a successor to the Company’s business or assets does not agree to assume and perform his employment agreement as a condition to the consummation of a USA Transaction.
Mr. Herbert’s employment agreement provides that if Mr. Herbert would terminate his employment with the Company for good reason, or if the Company would terminate his employment without cause, or if the Company would provide Mr. Herbert with a notice of non-renewal of his employment agreement, then the Company would pay to him a lump sum equal to two times his base salary on or before the termination of his employment and all restricted stock awards and stock options would become vested as of the date of termination.
The term “good reason,” as defined in the agreement, includes: (A) a material breach of the terms of the agreement by the Company; (B) the assignment by the Company to Mr. Herbert of duties in any way materially inconsistent with his authorities, duties, or responsibilities, or a material reduction or alteration in the nature or status of his authority, duties, or responsibilities as the Chief Executive Officer of the Company; (C) the Company reduces Mr. Herbert’s annual base salary; or (D) a material reduction by the Company in the kind or level of employee benefits to which Mr. Herbert is entitled immediately prior to such reduction with the result that his overall benefit package is significantly reduced unless such failure to continue a plan, policy, practice or arrangement pertains to all plan participants generally. As a condition to Mr. Herbert receiving any payments or benefits upon the termination of his employment for good reason, Mr. Herbert shall have executed and delivered (and not revoked) a release of any and all claims, suits, or causes of action against the Company and its affiliates in form reasonably acceptable to the Company.
The agreement also provides that, as a condition of the consummation of a USA Transaction, the successor to the Company’s business or assets would agree to assume and perform Mr. Herbert’s employment agreement. If any such successor would not do so, Mr. Herbert’s employment would terminate on the date of consummation of the USA Transaction, and the Company would pay to Mr. Herbert a lump sum equal to two times his base salary on or before the termination of his employment and all restricted stock awards and stock options would become vested as of the date of termination.
The term “USA Transaction” means: (i) the acquisition of fifty-one percent or more of the then outstanding voting securities entitled to vote generally in the election of directors of the Company by any person, entity or group, or (ii) the approval by the shareholders of the Company of a liquidation or dissolution, or certain reorganizations, mergers, or consolidations of the Company, or certain sales, transfers, leases or other dispositions of all or substantially all of the assets of the Company, or (iii) a change in the composition of the Board of Directors of the Company over a period of twelve (12) months or less such that the continuing directors fail to constitute a majority of the Board.
If Mr. Herbert’s employment had been terminated as of June 30, 2016 (when the closing price per share was $4.27) (i) by him for good reason, or (ii) by the Company without cause, or (iii) if a successor to the Company’s business or assets had not agreed to assume and perform his employment agreement as a condition to the consummation of a USA Transaction, then Mr. Herbert would have been entitled to receive: (a) an aggregate cash payment of twice his annual base salary or $720 thousand; (b) an aggregate of 63,232 shares granted to him under the 2016 LTI Stock Plan, which would become automatically vested as of the date of termination, with a value of $270 thousand; (c) 14,226 shares previously granted to him under the 2015 LTI Stock Plan, which would automatically become vested as of the date of termination, with a value of $61 thousand; (d) options exercisable for 100,000 shares at $1.80 per share would automatically become vested as of the date of termination with a value of $124 thousand; and (e) options exercisable for 29,585 shares at $3.38 per share would automatically become vested as of the date of termination with a value of $26 thousand.
COMPENSATION COMMITTEE INTERLOCKS AND INSIDER PARTICIPATION
During the fiscal year 2016, Albin F. Moschner and Steven D. Barnhart served as members of the Compensation Committee of our Board of Directors. No member of the Compensation Committee was, during fiscal year 2016, an officer or employee of the Company or any of our subsidiaries, or was formerly an officer of the Company or any of our subsidiaries, or had any relationships requiring disclosure by us under Item 404 of Regulation S-K of the General Rules and Regulations of the Securities and Exchange Commission.
During the last fiscal year, none of our executive officers served as: (i) a member of the compensation committee (or other committee of the board of directors performing equivalent functions or, in the absence of any such committee, the entire board of directors) of another entity, one of whose executive officers served on our Compensation Committee; (ii) a director of another entity, one of whose executive officers served on our Compensation Committee; or (iii) a member of the compensation committee (or other committee of the board of directors performing equivalent functions or, in the absence of any such committee, the entire board of directors) of another entity, one of whose executive officers served as a director on our board of directors.
Compensation of Non-Employee Directors
Members of the Board of Directors who are not employees of the Company receive cash and equity compensation for serving on the Board of Directors, as determined from time to time by the Compensation Committee with subsequent approval thereof by the Board of Directors. Each member of the Board has the option, in his or her discretion, to receive cash or stock, or some combination thereof, in payment of the compensation due for his or her service on the Board.
Director Compensation Table
The table below summarizes the compensation of the non-employee directors for the fiscal year ended June 30, 2016.
|
Name
|
Fees Earned
or Paid in
Cash($)(1)
|
Stock
Awards ($)(2)
|
Option
Awards ($)
|
Total($)
|
||||||||||||
|
Steven D. Barnhart
|
$
|
72,500
|
$
|
40,000
|
$
|
-
|
$
|
112,500
|
||||||||
|
Joel Brooks
|
$
|
40,000
|
$
|
40,000
|
$
|
-
|
$
|
80,000
|
||||||||
|
Robert L. Metzger
|
$
|
7,204
|
$
|
-
|
$
|
-
|
$
|
7,204
|
||||||||
|
Albin F. Moschner
|
$
|
47,000
|
$
|
40,000
|
$
|
-
|
$
|
87,000
|
||||||||
|
William J. Reilly, Jr.
|
$
|
40,000
|
$
|
40,000
|
$
|
-
|
$
|
80,000
|
||||||||
|
William J. Schoch
|
$
|
40,000
|
$
|
40,000
|
$
|
-
|
$
|
80,000
|
||||||||
| (1) |
During fiscal year ended June 30, 2016, we paid the following fees:
|
| ● |
Director: each director received $25,000, except for Mr. Metzger who received $6,704.
|
| ● |
Lead Independent Director: Mr. Barnhart received $40,000.
|
| ● |
Audit Committee: Mr. Brooks received $15,000 as Committee Chair, Mr. Reilly received $7,500, Mr. Moschner received $7,000, and Mr. Metzger received $500.
|
| ● |
Compensation Committee: Mr. Moschner received $15,000 as Committee Chair and Mr. Barnhart received $7,500.
|
| ● |
Nominating and Corporate Governance Committee: Mr. Schoch received $15,000 as Committee Chair, and Mr. Reilly received $7,500.
|
During the fiscal year ended June 30, 2016, the following directors elected to receive their fees, or a portion thereof, in the Company’s common stock in lieu of cash:
| ● |
Mr. Barnhart elected to receive 13,164 shares for $36,000 of fees; Mr. Metzger elected to receive 1,570 shares for $7,000 of fees; Mr. Reilly elected to receive 5,589 shares for $20,000 of fees; and Mr. Schoch elected to receive 13,154 shares for $40,000 of fees.
|
| (2) |
Amounts represent the grant date fair value of the common stock, computed in accordance with FASB ASC Topic 718. One-third of the shares vested on August 1, 2016; one-third will vest on August 1, 2017; and one-third will vest on August 1, 2018.
|
The following table sets forth, as of June 15, 2017, the beneficial ownership of the common stock of each of the Company’s directors, each of the named executive officers included in the Summary Compensation Table set forth above, and by the Company’s current directors and executive officers as a group. The Company is not aware of any beneficial owner of more than five percent of the Common Stock. Except as indicated below, the Company believes that the beneficial owners of the Common Stock listed below, based on information furnished by such owners, have sole investment and voting power with respect to such shares, subject to community property laws where applicable.
|
Name of Beneficial Owner (1)
|
Number of Shares
of Common Stock (2)
|
Percent
of
Class
|
||||||
|
Steven D. Barnhart
|
329,305
|
(3)
|
*
|
|||||
|
Joel Brooks
|
76,313
|
(4)
|
*
|
|||||
|
David M. DeMedio
|
176,330
|
(5)
|
*
|
|||||
|
Stephen P. Herbert
|
595,978
|
(6)
|
1.47
|
%
|
||||
|
Michael K. Lawlor
|
92,698
|
(7)
|
*
|
|||||
|
Leland P. Maxwell
|
0
|
(8)
|
*
|
|||||
|
Robert L. Metzger
|
13,216
|
*
|
||||||
|
Albin F. Moschner
|
446,120
|
(9)
|
1.11
|
%
|
||||
|
William J. Reilly, Jr.
|
106,720
|
(10)
|
*
|
|||||
|
William J. Schoch
|
118,944
|
(11)
|
*
|
|||||
|
J. Duncan Smith
|
0
|
(12) |
*
|
|||||
|
Maeve Duska
|
16,867
|
(13)
|
*
|
|||||
|
George Harrum
|
21,667
|
(14)
|
*
|
|||||
|
All Current Directors and Executive Officers As a Group (9 persons)
|
1,779,294
|
4.38
|
%
|
|||||
|
*
|
Less than one percent (1%)
|
| (1) |
Beneficial ownership is determined in accordance with the rules of the Securities and Exchange Commission and derives from either voting or investment power with respect to securities. Shares of Common Stock issuable upon conversion of the Series A Preferred Stock, or shares of Common Stock issuable upon exercise of options currently exercisable, or exercisable within 60 days of June 15, 2017, are deemed to be beneficially owned for purposes hereof.
|
| (2) |
The percentage of Common Stock beneficially owned is based on 40,331,645 shares outstanding as of June 15, 2017.
|
| (3) |
Includes 20,000 shares of common stock issuable upon exercise of stock options granted to Mr. Barnhart that are exercisable within 60 days of June 15, 2017, and 17,368 shares which vest within 60 days of June 15, 2017 and over which Mr. Barnhart has sole voting power but no dispositive power.
|
| (4) |
Includes 20,000 shares of common stock issuable upon exercise of stock options granted to Mr. Brooks that are exercisable within 60 days of June 15, 2017, and 17,368 shares which have not yet vested, and over which Mr. Brooks has sole voting power but no dispositive power.
|
| (5) |
Includes 90,000 shares of common stock issuable upon exercise of stock options granted to Mr. DeMedio that are exercisable within 60 days of June 15, 2017. Mr. DeMedio resigned his employment with the Company effective as of October 14, 2015.
|
| (6) |
Includes 62,010 shares of Common Stock beneficially owned by Mr. Herbert’s child and 27,440 shares of Common Stock beneficially owned by his spouse. Includes 185,140 shares of common stock issuable upon exercise of stock options granted to Mr. Herbert that are exercisable within 60 days of June 15, 2017, and 56,380 shares which have not yet vested, and over which Mr. Herbert has sole voting power but no dispositive power.
|
| (7) |
Includes 41,667 shares of common stock issuable upon exercise of stock options granted to Mr. Lawlor that are exercisable within 60 days of June 15, 2017, and 10,319 shares which have not yet vested, and over which Mr. Lawlor has sole voting power but no dispositive power.
|
| (8) |
Mr. Maxwell served as the Company’s interim Chief Financial Officer from January 28, 2016 until March 31, 2017, when he became the Senior Vice President of Finance.
|
| (9) |
Includes 1,358 shares of common stock issuable upon conversion of 7,000 shares of series A preferred stock. Also includes 20,000 shares of common stock issuable upon exercise of stock options granted to Mr. Moschner that are exercisable within 60 days of June 15, 2017, and which are owned by Moschner Family LLC, a Delaware limited liability company, of which Mr. Moschner is the manager, and 17,368 shares which have not yet vested, and over which Mr. Moschner has sole voting power but no dispositive power.
|
| (10) |
Includes 100 shares of Common Stock beneficially owned by Mr. Reilly’s child. Also includes 97 shares of common stock issuable upon conversion of 500 shares of series A preferred stock and 20,000 shares of common stock issuable upon exercise of stock options granted to Mr. Reilly that are exercisable within 60 days of June 15, 2017, and 17,368 shares which have not yet vested, and over which Mr. Reilly has sole voting power but no dispositive power.
|
| (11) |
Includes 20,000 shares of common stock issuable upon exercise of stock options granted to Mr. Schoch that are exercisable within 60 days of June 15, 2017, and 17,368 shares which have not yet vested, and over which Mr. Schoch has sole voting power but no dispositive power.
|
| (12) |
Mr. Smith resigned his employment with the Company as Chief Financial Officer effective as of January 22, 2016.
|
| (13) |
Includes 16,667 shares of common stock issuable upon exercise of stock options granted to Ms. Duska that are exercisable within 60 days of June 15, 2017.
|
| (14) |
Includes 16,667 shares of common stock issuable upon exercise of stock options granted to Mr. Harrum that are exercisable within 60 days of June 15, 2017.
|
Series A Preferred Stock
The following table sets forth, as of June 15, 2017, the beneficial ownership of the series A preferred stock by the Company’s directors, by the named executive officers included in the Summary Compensation Table set forth above, by the Company’s current directors and executive officers as a group, and by the beneficial owner of more than 5% of the series A preferred stock. Other than the shares of series A preferred stock beneficially owned by Messrs. Moschner and Reilly, there were no shares of series A preferred stock beneficially owned as of June 15, 2017 by the Company’s directors, by the named executive officers included in the Summary Compensation Table set forth above, or by the current directors and executive officers as a group. Except as indicated below, the Company believes that the beneficial owners of the series A preferred stock listed below, based on information furnished by such owners, have sole investment and voting power with respect to such shares, subject to community property laws where applicable.
|
Name of Beneficial Owner
|
Number of Shares
of Series A Preferred Stock (1)
|
Percent
of Class
|
||||||
|
Albin F. Moschner
|
7,000
|
1.57
|
%
|
|||||
|
William J. Reilly, Jr.
|
500
|
*
|
||||||
|
Legion Partners Asset Management, LLC
|
44,250
|
(2)
|
9.94
|
%
|
||||
|
All Current Directors and Executive Officers As a Group (9 persons)
|
7,500
|
1.69
|
%
|
|||||
|
*
|
Less than one percent (1%)
|
| (1) |
Beneficial ownership is determined in accordance with the rules of the Securities and Exchange Commission and derives from either voting or investment power with respect to securities. The percentage of Series A Preferred Stock beneficially owned is based on 445,063 shares outstanding as of June 15, 2017.
|
|
(2)
|
Based upon a Schedule 13D/A filed on November 4, 2016 with the Securities and Exchange Commission, each of the following persons has shared voting and dispositive power over 44,250 shares of Series A Preferred Stock, or 9.94% of the 445,063 shares of Series A Preferred Stock outstanding as of June 15, 2017: Legion Partners Asset Management, LLC, Legion Partners, LLC, Legion Partners Holdings, LLC, Christopher S. Kiper, Bradley S. Vizi and Raymond White. Of the aforementioned 44,250 shares, Legion Partners, L.P. I has shared voting and dispositive power over 37,054 shares, or 8.33% of the shares of Series A Preferred Stock outstanding as of June 15, 2017, and Legion Partners, L.P. II has shared voting and dispositive power over 7,196 shares, or 1.62% of the shares of Series A Preferred Stock outstanding as of June 15, 2017. The business address of each of the foregoing persons is 9401 Wilshire Boulevard, Suite 705, Beverly Hills, California 90212.
|
RELATED PERSON TRANSACTIONS
There were no related person transactions during the fiscal years ended June 30, 2016, 2015 and 2014.
REVIEW OR APPROVAL OF TRANSACTIONS WITH RELATED PERSONS
We have adopted a formal written policy which is set forth in our Audit Committee Charter, that our executive officers, directors, holders of more than 5% of any class of our voting securities, and any member of the immediate family of and any entity affiliated with any of the foregoing persons, are not permitted to enter into a related person transaction with us without the prior consent of our Audit Committee. Any request for us to enter into a transaction with an executive officer, director, principal shareholder, or any of their immediate family members or affiliates, in which the amount involved exceeds $120,000 must first be presented to our Audit Committee for review, consideration and approval. In approving or rejecting any such proposal, our Audit Committee is to consider the relevant facts and circumstances available and deemed relevant to the Audit Committee, including, but not limited to, whether the transaction is on terms no less favorable than terms generally available to an unaffiliated third party under the same or similar circumstances and the extent of the related person’s interest in the transaction.
In addition, under our Code of Business Conduct and Ethics, our executive officers and directors have a responsibility to disclose any transaction or relationship that reasonably could be expected to interfere with their exercise of independent judgment or materially impair the performance of their responsibilities to our Board of Directors, which shall be responsible for reviewing such transaction or relationship and determining whether any action needs to be taken.
General
We are authorized to issue up to 640,000,000 shares of common stock, no par value, and 1,800,000 shares of undesignated preferred stock. As of the date hereof, 900,000 preferred shares have been designated as series A convertible preferred stock, no par value. As of July 5, 2017, there were 40,331,645 shares of common stock issued and outstanding and 445,063 shares of series A convertible preferred stock issued and outstanding which are convertible into 4,450 shares of common stock.
Common Stock
The holder of each share of common stock:
| • |
is entitled to one vote on all matters submitted to a vote of the shareholders, including the election of directors. There is no cumulative voting for directors;
|
| • |
does not have any preemptive rights to subscribe for or purchase shares, obligations, warrants, or other securities; and
|
| • |
is entitled to receive such dividends as the board of directors may from time to time declare out of funds legally available for payment of dividends.
|
No dividend may be paid on the common stock until all accumulated and unpaid dividends on the series A convertible preferred stock have been paid. Upon any liquidation, dissolution or winding up of the Company, holders of shares of common stock are entitled to receive pro rata all of the assets of the Company available for distribution, subject to the liquidation preference of the series A convertible preferred stock of $10 per share, and any unpaid and accumulated dividends on the series A convertible preferred stock which, as of July 5, 2017, was in the amount of $18.78 per share, or a total of $14.03 million.
Series A Convertible Preferred Stock
The holders of shares of series A convertible preferred stock:
| • |
have the number of votes per share equal to the number of shares of common stock into which each such share is convertible (i.e., each share of series A convertible preferred stock equals 0.1940 of a vote);
|
| • |
are entitled to vote on all matters submitted to the vote of the shareholders of the Company, including the election of directors; and
|
| • |
are entitled to an annual cumulative cash dividend of $1.50 per annum, payable when, as and if declared by the Board of Directors.
|
The record dates for payment of dividends on the series A convertible preferred stock are February 1 ($0.75) and August 1 ($0.75) of each year. Any and all accumulated and unpaid cash dividends on the series A convertible preferred stock must be declared and paid prior to the declaration and payment of any dividends on the common stock. Any unpaid and accumulated dividends will not bear interest. As of July 5, 2017, such accumulated unpaid dividends amounted to $14.03 million.
Each share of series A convertible preferred stock is convertible at any time into 0.1940 of a share of fully issued and non-assessable common stock. Accrued and unpaid dividends earned on shares of series A convertible preferred stock being converted into common stock are also convertible into common stock at the rate $1,000 per share of common stock at the time of conversion, and whether or not such dividends have then been declared by the Company. Upon any liquidation, dissolution, or winding-up of the Company, or upon certain changes of control involving the Company as more fully described in our Articles of Incorporation, the holders of series A convertible preferred stock are entitled to receive a distribution in preference to the common stock in the amount of $10 per share plus any accumulated and unpaid dividends. We have the right, at any time, to redeem all or any part of the issued and outstanding series A convertible preferred stock for the sum of $11 per share plus any and all unpaid and accumulated dividends thereon. Upon notice by the Company of such call, the holders of the series A convertible preferred stock so called will have the opportunity to convert their shares and any unpaid and accumulated dividends thereon into shares of common stock.
Listing
Our common stock is listed on The NASDAQ Global Market under the symbol “USAT.”
Transfer Agent and Registrar
The transfer agent and registrar for our common stock is American Stock Transfer and Trust Company, LLC. The transfer agent’s address is 6201 15th Avenue, 3rd Floor, Brooklyn, New York 11219.
William Blair & Company, L.L.C. is acting as representative of each of the underwriters named below and as book-running manager for this offering. Subject to the terms and conditions set forth in the underwriting agreement among us and the underwriters, we have agreed to sell to the underwriters, and each of the underwriters has agreed, severally and not jointly, to purchase from us, the number of shares of common stock set forth opposite its name below.
|
Underwriter
|
Number of
Shares
|
|
|
William Blair & Company, L.L.C.
|
||
|
Total
|
Subject to the terms and conditions set forth in the underwriting agreement, the underwriters have agreed, severally and not jointly, to purchase all of the shares sold under the underwriting agreement if any of the shares are purchased. If an underwriter defaults, the underwriting agreement provides that the purchase commitments of the non-defaulting underwriters may be increased or the underwriting agreement may be terminated.
We have agreed to indemnify the underwriters against certain liabilities, including liabilities under the Securities Act of 1933, as amended, or the Securities Act, or to contribute to payments the underwriters may be required to make in respect of those liabilities.
The underwriters are offering the shares, subject to prior sale, when, as and if issued to and accepted by them, subject to approval of legal matters by their counsel, including the validity of the shares, and other conditions contained in the underwriting agreement, such as the receipt by the underwriters of officers’ certificates and legal opinions. The underwriters reserve the right to withdraw, cancel or modify offers to the public and to reject orders in whole or in part.
Commissions and Discounts
The representative has advised us that the underwriters propose initially to offer the shares to the public at the public offering price set forth on the cover page of this prospectus and to dealers at that price less a concession not in excess of $ per share. After the initial offering of the shares, the public offering price, concession or any other term of the offering may be changed by the representative.
The following table shows the public offering price, underwriting discounts and commissions and proceeds before expenses to us. The information assumes either no exercise or full exercise by the underwriters of their option to purchase additional shares of our common stock.
|
Total
|
||||||||||||
|
Per Share
|
Without
Option
|
With
Option
|
||||||||||
|
Public offering price
|
$
|
$ |
$
|
|||||||||
|
Underwriting discounts and commissions
|
$
|
$ |
$
|
|||||||||
|
Proceeds, before expenses, to us
|
$
|
$ |
$
|
|||||||||
We estimate expenses payable by us in connection with this offering, other than the underwriting discounts and commissions referred to above, will be approximately $ . We also have agreed to reimburse the underwriters for up to $ for their FINRA counsel fee. In accordance with FINRA Rule 5110, this reimbursed fee is deemed underwriting compensation for this offering.
Option to Purchase Additional Shares
We have granted an option to the underwriters, exercisable for 30 days after the date of this prospectus, to purchase up to additional shares at the public offering price, less the underwriting discounts and commissions. If the underwriters exercise this option, each underwriter will be obligated, subject to conditions contained in the underwriting agreement, to purchase a number of additional shares proportionate to that underwriter’s initial amount reflected in the above table.
No Sales of Similar Securities
We and our executive officers and directors have agreed not to sell or transfer any shares of common stock or securities convertible into or exchangeable or exercisable for shares of common stock, for 90 days after the date of this prospectus without first obtaining the written consent of William Blair & Company, L.L.C., on behalf of the underwriters. Specifically, we and these other persons have agreed, with certain exceptions, not to directly or indirectly:
| · |
offer, pledge, sell or contract to sell any shares of common stock;
|
| · |
sell any option or contract to purchase any shares of common stock;
|
| · |
purchase any option or contract to sell any shares of common stock;
|
| · |
otherwise dispose of or transfer any shares of common stock;
|
| · |
request or demand that we file a registration statement related to the shares of common stock;
|
| · |
enter into any swap or other agreement or any transaction that transfers, in whole or in part, the economic consequence of ownership of any shares of common stock, whether any such swap, agreement or transaction is to be settled by delivery of shares or other securities, in cash or otherwise; or
|
| · |
publicly announce any of the foregoing.
|
This lock-up provision applies to shares of common stock and to securities convertible into or exchangeable or exercisable for shares of common stock.
NASDAQ Global Market Listing
Our common stock is listed on The NASDAQ Global Market under the symbol “USAT.”
Price Stabilization, Short Positions and Penalty Bids
Until the distribution of the shares is completed, SEC rules may limit underwriters and selling group members from bidding for and purchasing our common stock. However, the representative may engage in transactions that stabilize the price of our common stock, such as bids or purchases to peg, fix or maintain that price.
In connection with this offering, the underwriters may purchase and sell our common stock in the open market. These transactions may include short sales, purchases on the open market to cover positions created by short sales and stabilizing transactions. Short sales involve the sale by the underwriters of a greater number of shares than they are required to purchase in the offering. “Covered” short sales are sales made in an amount not greater than the underwriters’ option described above. The underwriters may close out any covered short position by either exercising their option or purchasing shares in the open market. In determining the source of shares to close out the covered short position, the underwriters will consider, among other things, the price of shares available for purchase in the open market as compared to the price at which they may purchase shares through the option granted to them. “Naked” short sales are sales in excess of such option. The underwriters must close out any naked short position by purchasing shares in the open market. A naked short position is more likely to be created if the underwriters are concerned that there may be downward pressure on the price of our common stock in the open market after pricing that could adversely affect investors who purchase in the offering. Stabilizing transactions consist of various bids for or purchases of shares of common stock made by the underwriters in the open market prior to the closing of the offering.
The underwriters may also impose a penalty bid. This occurs when a particular underwriter repays to the underwriters a portion of the underwriting discount received by it because the representative has repurchased shares sold by or for the account of such underwriter in stabilizing or short covering transactions.
Similar to other purchase transactions, the underwriters’ purchases to cover the syndicate short sales may have the effect of raising or maintaining the market price of our common stock or preventing or retarding a decline in the market price of our common stock. As a result, the price of our common stock may be higher than the price that might otherwise exist in the open market. The underwriters may conduct these transactions on The NASDAQ Global Market, in the over-the-counter market or otherwise.
Neither we nor any of the underwriters make any representation or prediction as to the direction or magnitude of any effect that the transactions described above may have on the price of our common stock. In addition, neither we nor any of the underwriters make any representation that the representative will engage in these transactions or that these transactions, once commenced, will not be discontinued without notice.
The underwriters may also engage in passive market making transactions in our common stock on The NASDAQ Global Market in accordance with Rule 103 of Regulation M during a period before the commencement of offers or sales of shares of our common stock in this offering and extending through the completion of distribution. A passive market maker must display its bid at a price not in excess of the highest independent bid of that security. However, if all independent bids are lowered below the passive market maker’s bid, that bid must then be lowered when specified purchase limits are exceeded.
Electronic Distribution
In connection with this offering, certain of the underwriters or securities dealers may distribute prospectuses by electronic means, such as e-mail.
Other Relationships
The underwriters and certain of their affiliates are full service financial institutions engaged in various activities, which may include securities trading, commercial and investment banking, financial advisory, investment management, investment research, principal investment, hedging, financing and brokerage activities. One of our directors, Robert L. Metzger, has been employed as a Senior Director at William Blair & Company, L.L.C. since January 2016. Some of the underwriters and certain of their affiliates may in the future engage in investment banking and other commercial dealings in the ordinary course of business with us and our affiliates, for which they may in the future receive customary fees, commissions and expenses.
In addition, in the ordinary course of their business activities, the underwriters and their affiliates may make or hold a broad array of investments and actively trade debt and equity securities (or related derivative securities) and financial instruments (including bank loans) for their own account and for the accounts of their customers. Such investments and securities activities may involve securities and/or instruments of ours or our affiliates. The underwriters and their affiliates are currently providing investment banking advice to us and may also make investment recommendations and/or publish or express independent research views in respect of such securities or financial instruments and may hold, or recommend to clients that they acquire, long or short positions in such securities and instruments.
Selling Restrictions
Notice to Prospective Investors in the European Economic Area
In relation to each Member State of the European Economic Area (each, a “Relevant Member State”), no offer of shares may be made to the public in that Relevant Member State other than:
| A. |
to any legal entity which is a qualified investor as defined in the Prospectus Directive;
|
| B. |
to fewer than 100 or, if the Relevant Member State has implemented the relevant provision of the 2010 PD Amending Directive, 150, natural or legal persons (other than qualified investors as defined in the Prospectus Directive), as permitted under the Prospectus Directive, subject to obtaining the prior consent of the representative; or
|
| C. |
in any other circumstances falling within Article 3(2) of the Prospectus Directive, provided that no such offer of shares shall require the Company or the representative to publish a prospectus pursuant to Article 3 of the Prospectus Directive or supplement a prospectus pursuant to Article 16 of the Prospectus Directive.
|
Each person in a Relevant Member State who initially acquires any shares or to whom any offer is made will be deemed to have represented, acknowledged and agreed that it is a “qualified investor” within the meaning of the law in that Relevant Member State implementing Article 2(1)(e) of the Prospectus Directive. In the case of any shares being offered to a financial intermediary as that term is used in Article 3(2) of the Prospectus Directive, each such financial intermediary will be deemed to have represented, acknowledged and agreed that the shares acquired by it in the offer have not been acquired on a non-discretionary basis on behalf of, nor have they been acquired with a view to their offer or resale to, persons in circumstances which may give rise to an offer of any shares to the public other than their offer or resale in a Relevant Member State to qualified investors, as so defined or in circumstances in which the prior consent of the representative has been obtained to each such proposed offer or resale.
We, the representative and each of our affiliates will rely upon the truth and accuracy of the foregoing representations, acknowledgements and agreements.
This prospectus has been prepared on the basis that any offer of shares in any Relevant Member State will be made pursuant to an exemption under the Prospectus Directive from the requirement to publish a prospectus for offers of shares. Accordingly, any person making or intending to make an offer in that Relevant Member State of shares which are the subject of the offering contemplated in this prospectus may only do so in circumstances in which no obligation arises for the Company or any of the underwriters to publish a prospectus pursuant to Article 3 of the Prospectus Directive in relation to such offer. Neither the Company nor the underwriters have authorized, nor do they authorize, the making of any offer of shares in circumstances in which an obligation arises for the Company or the underwriters to publish a prospectus for such offer.
For the purpose of the above provisions, the expression “an offer to the public” in relation to any shares in any Relevant Member State means the communication in any form and by any means of sufficient information on the terms of the offer and the shares to be offered so as to enable an investor to decide to purchase or subscribe the shares, as the same may be varied in the Relevant Member State by any measure implementing the Prospectus Directive in the Relevant Member State, and the expression “Prospectus Directive” means Directive 2003/71/EC (including the 2010 PD Amending Directive, to the extent implemented in the Relevant Member States) and includes any relevant implementing measure in the Relevant Member State, and the expression “2010 PD Amending Directive” means Directive 2010/73/EU.
The validity of the common stock offered hereby will be passed upon for us by Lurio & Associates, P.C., Philadelphia, Pennsylvania. Douglas M. Lurio, a principal of that law firm, is the beneficial owner of 189,070 shares of common stock. Certain other legal matters in connection with this offering will be passed upon for the Company by Ballard Spahr LLP, Philadelphia, Pennsylvania. Certain legal matters in connection with this offering will be passed upon for the underwriters by Goodwin Procter LLP, New York, New York.
The consolidated financial statements of USA Technologies, Inc. as of June 30, 2015 and June 30, 2016, and for each of the years in the three-year period ended June 30, 2016 have been included herein in reliance upon the reports of RSM US LLP, an independent registered public accounting firm, appearing elsewhere herein, and upon the authority of said firm as experts in accounting and auditing.
We have filed a registration statement on Form S-1 under the Securities Act of 1933, as amended, relating to the shares of common stock being offered by this prospectus, and reference is made to such registration statement. This prospectus constitutes the prospectus of USA Technologies, Inc. filed as part of the registration statement, and it does not contain all information in the registration statement, as certain portions have been omitted in accordance with the rules and regulations of the Securities and Exchange Commission.
We are subject to the informational requirements of the Securities Exchange Act of 1934 which requires us to file reports, proxy statements and other information with the Securities and Exchange Commission. Such reports, proxy statements and other information may be inspected at public reference facilities of the SEC at 100 F Street, N.E., Washington D.C. 20549 on official business days during the hours of 10:00 am to 3:00 pm. The public may obtain information on the operation of the Public Reference Room by calling the Commission at 1-800-SEC-0330. Copies of such material can be obtained from the Public Reference Section of the SEC at 100 F Street, N.E., Washington, D.C. 20549 at prescribed rates. Because we file documents electronically with the SEC, you may also obtain this information by visiting the SEC’s Internet website at http://www.sec.gov.
USA TECHNOLOGIES, INC.
|
Annual Consolidated Financial Statements
|
|
|
Report of Independent Registered Public Accounting Firm
|
F-2
|
|
Report of Independent Registered Public Accounting Firm on Internal Control over Financial Reporting
|
F-3
|
|
Consolidated Balance Sheets
|
F-4
|
|
Consolidated Statements of Operations
|
F-5
|
|
Consolidated Statements of Shareholders’ Equity
|
F-6
|
|
Consolidated Statements of Cash Flows
|
F-7
|
|
Notes to Consolidated Financial Statements
|
F-8
|
|
Unaudited Consolidated Financial Statements
|
|
|
Consolidated Balance Sheets (unaudited) - March 31, 2017 and December 31, 2016
|
F-38
|
|
Consolidated Statements of Operations (unaudited) - Three and Nine Months Ended March 31, 2017 and 2016
|
F-39
|
|
Consolidated Statement of Shareholders’ Equity (unaudited) - Nine Months Ended March 31, 2017 and 2016
|
F-40
|
|
Consolidated Statements of Cash Flows (unaudited) - Three and Nine Months Ended March 31, 2017 and 2016
|
F-41
|
|
Notes to Consolidated Financial Statements (unaudited)
|
F-42
|
Report of Independent Registered Public Accounting Firm
To the Board of Directors and Shareholders
USA Technologies, Inc.
We have audited the accompanying consolidated balance sheets of USA Technologies, Inc. and subsidiaries as of June 30, 2016 and 2015, and the related consolidated statements of operations, stockholders' equity and cash flows for each of the three years in the period ended June 30, 2016. Our audits also included the financial statement schedule of USA Technologies, Inc. and subsidiaries listed in Item 15(a). These financial statements and financial statement schedule are the responsibility of the Company's management. Our responsibility is to express an opinion on these financial statements and schedule based on our audits.
We conducted our audits in accordance with the standards of the Public Company Accounting Oversight Board (United States). Those standards require that we plan and perform the audit to obtain reasonable assurance about whether the financial statements are free of material misstatement. An audit includes examining, on a test basis, evidence supporting the amounts and disclosures in the financial statements. An audit also includes assessing the accounting principles used and significant estimates made by management, as well as evaluating the overall financial statement presentation. We believe that our audits provide a reasonable basis for our opinion.
In our opinion, the consolidated financial statements referred to above present fairly, in all material respects, the financial position of USA Technologies, Inc. and subsidiaries as of June 30, 2016 and 2015, and the results of their operations and their cash flows for each of the three years in the period ended June 30, 2016, in conformity with U.S. generally accepted accounting principles. Also, in our opinion, the related financial statement schedule, when considered in relation to the basic consolidated financial statements taken as a whole, present fairly, in all material respects, the information set forth therein.
We have also audited, in accordance with the standards of the Public Company Accounting Oversight Board (United States), USA Technologies, Inc. and subsidiaries’ internal control over financial reporting as of June 30, 2016, based on criteria established in Internal Control — Integrated Framework issued by the Committee of Sponsoring Organizations of the Treadway Commission in 2013. Our report dated September 13, 2016, expressed an opinion that USA Technologies, Inc. and subsidiaries had not maintained effective internal control over financial reporting as of June 30, 2016, based on criteria established in Internal Control — Integrated Framework issued by the Committee of Sponsoring Organizations of the Treadway Commission in 2013.
/s/ RSM US LLP
New York, NY
September 13, 2016
REPORT OF INDEPENDENT REGISTERED PUBLIC ACCOUNTING FIRM
To the Board of Directors and Shareholders
USA Technologies, Inc.
We have audited USA Technologies, Inc. and subsidiaries' internal control over financial reporting as of June 30, 2016, based on criteria established in Internal Control — Integrated Framework issued by the Committee of Sponsoring Organizations of the Treadway Commission in 2013. USA Technologies, Inc. and subsidiaries’ management is responsible for maintaining effective internal control over financial reporting and for its assessment of the effectiveness of internal control over financial reporting included in the accompanying Management Assessment of Internal Control over Financial Reporting. Our responsibility is to express an opinion on the company's internal control over financial reporting based on our audit.
We conducted our audit in accordance with the standards of the Public Company Accounting Oversight Board (United States). Those standards require that we plan and perform the audit to obtain reasonable assurance about whether effective internal control over financial reporting was maintained in all material respects. Our audit included obtaining an understanding of internal control over financial reporting, assessing the risk that a material weakness exists, and testing and evaluating the design and operating effectiveness of internal control based on the assessed risk. Our audit also included performing such other procedures as we considered necessary in the circumstances. We believe that our audit provides a reasonable basis for our opinion.
A company's internal control over financial reporting is a process designed to provide reasonable assurance regarding the reliability of financial reporting and the preparation of financial statements for external purposes in accordance with generally accepted accounting principles. A company's internal control over financial reporting includes those policies and procedures that (a) pertain to the maintenance of records that, in reasonable detail, accurately and fairly reflect the transactions and dispositions of the assets of the company; (b) provide reasonable assurance that transactions are recorded as necessary to permit preparation of financial statements in accordance with generally accepted accounting principles, and that receipts and expenditures of the company are being made only in accordance with authorizations of management and directors of the company; and (c) provide reasonable assurance regarding prevention or timely detection of unauthorized acquisition, use, or disposition of the company's assets that could have a material effect on the financial statements.
Because of its inherent limitations, internal control over financial reporting may not prevent or detect misstatements. Also, projections of any evaluation of effectiveness to future periods are subject to the risk that controls may become inadequate because of changes in conditions, or that the degree of compliance with the policies or procedures may deteriorate.
A material weakness is a deficiency, or a combination of deficiencies, in internal control over financial reporting, such that there is a reasonable possibility that a material misstatement of the company's annual or interim financial statements will not be prevented or detected on a timely basis. The following material weakness has been identified and included in management's assessment. Management identified control deficiencias, including significant deficiencies, in the design or operating effectiveness of the Company’s internal control over financial reporting, which when aggregated, represent a material weakness in internal control. The significant deficiencies included that the operation of an existing control did not result in timely resolution of account receivable aging issues; the design of certain internal controls allowed for errors or omissions in the accrual process; and one operational control that did not identify certain merchant receivables as one of the critical accounts to be audited on a monthly basis. This material weakness was considered in determining the nature, timing, and extent of audit tests applied in our audit of the 2016 financial statements, and this report does not affect our report dated September 13, 2016 on those financial statements.
In our opinion, because of the effect of the material weakness described above on the achievement of the objectives of the control criteria, USA Technologies, Inc. and subsidiaries has not maintained effective internal control over financial reporting as of June 30, 2016, based on criteria established in Internal Control — Integrated Framework issued by the Committee of Sponsoring Organizations of the Treadway Commission in 2013.
We have also audited, in accordance with the standards of the Public Company Accounting Oversight Board (United States), the consolidated balance sheets of USA Technologies, Inc. and subsidiaries as of June 30, 2016 and 2015, and the related consolidated statements of operations, stockholders' equity and cash flows for each of the three years in the period ended June 30, 2016 and our report dated September 13, 2016 expressed an unqualified opinion.
/s/ RSM US LLP
New York, NY
USA Technologies, Inc.
Consolidated Balance Sheets
|
($ in thousands, except shares)
|
June 30,
2016 |
June 30,
2015 |
||||||
|
Assets
|
||||||||
|
Current assets:
|
||||||||
|
Cash
|
$
|
19,272
|
$
|
11,374
|
||||
|
Accounts receivable, less allowance for doubtful accounts of $2,814 and $1,309, respectively
|
4,899
|
5,971
|
||||||
|
Finance receivables
|
3,588
|
941
|
||||||
|
Inventory, net
|
2,031
|
4,216
|
||||||
|
Prepaid expenses and other current assets
|
987
|
574
|
||||||
|
Deferred income taxes
|
2,271
|
1,258
|
||||||
|
Total current assets
|
33,048
|
24,334
|
||||||
|
Finance receivables, less current portion
|
3,718
|
3,698
|
||||||
|
Other assets
|
348
|
350
|
||||||
|
Property and equipment, net
|
9,765
|
12,869
|
||||||
|
Deferred income taxes
|
25,453
|
25,788
|
||||||
|
Intangibles, net
|
798
|
432
|
||||||
|
Goodwill
|
11,703
|
7,663
|
||||||
|
Total assets
|
$
|
84,833
|
$
|
75,134
|
||||
|
Liabilities and shareholders’ equity
|
||||||||
|
Current liabilities:
|
||||||||
|
Accounts payable
|
$
|
12,354
|
$
|
10,542
|
||||
|
Accrued expenses
|
3,458
|
2,108
|
||||||
|
Line of credit, net
|
7,119
|
4,000
|
||||||
|
Current obligations under long-term debt
|
629
|
478
|
||||||
|
Income taxes payable
|
18
|
54
|
||||||
|
Warrant liabilities
|
3,739
|
-
|
||||||
|
Deferred gain from sale-leaseback transactions
|
860
|
860
|
||||||
|
Total current liabilities
|
28,177
|
18,042
|
||||||
|
Long-term liabilities:
|
||||||||
|
Long-term debt, less current portion
|
1,576
|
1,854
|
||||||
|
Accrued expenses, less current portion
|
15
|
49
|
||||||
|
Warrant liabilities, less current portion
|
-
|
978
|
||||||
|
Deferred gain from sale-leaseback transactions, less current portion
|
40
|
900
|
||||||
|
Total long-term liabilities
|
1,631
|
3,781
|
||||||
|
Total liabilities
|
29,808
|
21,823
|
||||||
|
Commitments and contingencies (Note 18)
|
||||||||
|
Shareholders’ equity:
|
||||||||
|
Preferred stock, no par value:
|
||||||||
|
Authorized shares- 1,800,000 Series A convertible preferred- Authorized shares- 900,000
|
||||||||
|
Issued and outstanding shares- 445,063 with liquidation preference of $18,108 and $17,440, respectively
|
3,138
|
3,138
|
||||||
|
Common stock, no par value: Authorized shares- 640,000,000 Issued and outstanding shares- 37,783,444 and 35,763,663, respectively
|
233,394
|
224,874
|
||||||
|
Accumulated deficit
|
(181,507
|
)
|
(174,701
|
)
|
||||
|
Total shareholders’ equity
|
55,025
|
53,311
|
||||||
|
Total liabilities and shareholders’ equity
|
$
|
84,833
|
$
|
75,134
|
||||
USA Technologies, Inc.
Consolidated Statements of Operations
|
Year ended June 30,
|
||||||||||||
|
($ in thousands, except shares and per share data)
|
2016
|
2015
|
2014
|
|||||||||
|
Revenues:
|
||||||||||||
|
License and transaction fees
|
$
|
56,589
|
$
|
43,633
|
$
|
35,638
|
||||||
|
Equipment sales
|
20,819
|
14,444
|
6,707
|
|||||||||
|
Total revenues
|
77,408
|
58,077
|
42,345
|
|||||||||
|
Cost of services
|
38,089
|
29,429
|
23,018
|
|||||||||
|
Cost of equipment
|
17,334
|
11,825
|
4,254
|
|||||||||
|
Total cost of sales
|
55,423
|
41,254
|
27,272
|
|||||||||
|
Gross profit
|
21,985
|
16,823
|
15,073
|
|||||||||
|
Operating expenses:
|
||||||||||||
|
Selling, general and administrative
|
22,373
|
16,451
|
14,036
|
|||||||||
|
Depreciation and amortization
|
647
|
612
|
600
|
|||||||||
|
Impairment of intangible asset
|
432
|
-
|
-
|
|||||||||
|
Total operating expenses
|
23,452
|
17,063
|
14,636
|
|||||||||
|
Operating income (loss)
|
(1,467
|
)
|
(240
|
)
|
437
|
|||||||
|
Other income (expense):
|
||||||||||||
|
Interest income
|
320
|
83
|
30
|
|||||||||
|
Other income
|
-
|
52
|
-
|
|||||||||
|
Interest expense
|
(600
|
)
|
(302
|
)
|
(257
|
)
|
||||||
|
Change in fair value of warrant liabilities
|
(5,674
|
)
|
(393
|
)
|
66
|
|||||||
|
Total other income (expense), net
|
(5,954
|
)
|
(560
|
)
|
(161
|
)
|
||||||
|
Income (loss) before benefit (provision) for income taxes
|
(7,421
|
)
|
(800
|
)
|
276
|
|||||||
|
Benefit (provision) for income taxes
|
615
|
(289
|
)
|
27,255
|
||||||||
|
Net income (loss)
|
(6,806
|
)
|
(1,089
|
)
|
27,531
|
|||||||
|
Cumulative preferred dividends
|
(668
|
)
|
(668
|
)
|
(668
|
)
|
||||||
|
Net income (loss) applicable to common shares
|
$
|
(7,474
|
)
|
$
|
(1,757
|
)
|
$
|
26,863
|
||||
|
Net earnings (loss) per common share - basic
|
$
|
(0.21
|
)
|
$
|
(0.05
|
)
|
$
|
0.77
|
||||
|
Net earnings (loss) per common share - diluted
|
$
|
(0.21
|
)
|
$
|
(0.05
|
)
|
$
|
0.77
|
||||
|
Basic weighted average number of common shares outstanding
|
36,309,047
|
35,719,211
|
34,667,769
|
|||||||||
|
Diluted weighted average number of common shares outstanding
|
36,309,047
|
35,719,211
|
35,009,559
|
|||||||||
See accompanying notes.
USA Technologies, Inc.
Consolidated Statements of Shareholders’ Equity
|
Series A
Convertible
Preferred Stock
|
Common Stock
|
Accumulated
|
||||||||||||||||||||||
|
($ in thousands, except shares)
|
Shares
|
Amount
|
Shares
|
Amount
|
Deficit
|
Total
|
||||||||||||||||||
|
Balance, June 30, 2013 As Reported
|
442,968
|
$
|
3,138
|
33,284,232
|
$
|
221,383
|
$
|
(201,143
|
)
|
$
|
23,378
|
|||||||||||||
|
Cumulative impact of prior period revisions (See Note 19 of the Notes to Consolidated Financial Statements)
|
2,095
|
-
|
62,661
|
-
|
-
|
-
|
||||||||||||||||||
|
Balance, June 30, 2013
|
445,063
|
$
|
3,138
|
33,346,893
|
$
|
221,383
|
$
|
(201,143
|
)
|
$
|
23,378
|
|||||||||||||
|
Exercise of warrants
|
-
|
-
|
2,090,226
|
2,362
|
-
|
2,362
|
||||||||||||||||||
|
Stock based compensation
|
||||||||||||||||||||||||
|
2010 Stock Incentive Plan
|
-
|
-
|
3,334
|
6
|
-
|
6
|
||||||||||||||||||
|
2011 Stock Incentive Plan
|
-
|
-
|
-
|
17
|
-
|
17
|
||||||||||||||||||
|
2012 Stock Incentive Plan
|
-
|
-
|
158,505
|
279
|
-
|
279
|
||||||||||||||||||
|
2013 Stock Incentive Plan
|
-
|
-
|
55,810
|
227
|
-
|
227
|
||||||||||||||||||
|
Retirement of common stock
|
-
|
-
|
(52,645
|
)
|
(89
|
)
|
-
|
(89
|
)
|
|||||||||||||||
|
Excess tax benefits from share-based compensation
|
-
|
-
|
-
|
25
|
-
|
25
|
||||||||||||||||||
|
Net income
|
-
|
-
|
-
|
-
|
27,531
|
27,531
|
||||||||||||||||||
|
Balance, June 30, 2014
|
445,063
|
3,138
|
35,602,123
|
224,210
|
(173,612
|
)
|
53,736
|
|||||||||||||||||
|
Stock based compensation
|
||||||||||||||||||||||||
|
2011 Stock Incentive Plan
|
-
|
-
|
-
|
1
|
-
|
1
|
||||||||||||||||||
|
2012 Stock Incentive Plan
|
-
|
-
|
33,698
|
52
|
-
|
52
|
||||||||||||||||||
|
2013 Stock Incentive Plan
|
-
|
-
|
159,741
|
293
|
-
|
293
|
||||||||||||||||||
|
2014 Stock Option Incentive Plan
|
-
|
-
|
-
|
370
|
-
|
370
|
||||||||||||||||||
|
Retirement of common stock
|
-
|
-
|
(31,899
|
)
|
(62
|
)
|
-
|
(62
|
)
|
|||||||||||||||
|
Excess tax benefits from share-based compensation
|
-
|
-
|
-
|
10
|
-
|
10
|
||||||||||||||||||
|
Net loss
|
-
|
-
|
-
|
-
|
(1,089
|
)
|
(1,089
|
)
|
||||||||||||||||
|
Balance, June 30, 2015
|
445,063
|
3,138
|
35,763,663
|
224,874
|
(174,701
|
)
|
53,311
|
|||||||||||||||||
|
Warrants issued in conjunction with Line of Credit Agreement
|
-
|
-
|
-
|
52
|
-
|
52
|
||||||||||||||||||
|
Reclass of fair value of warranty liability upon exercise of warrants
|
-
|
2,914
|
2,914
|
|||||||||||||||||||||
|
Exercise of warrants
|
-
|
-
|
1,887,325
|
4,918
|
-
|
4,918
|
||||||||||||||||||
|
Stock based compensation
|
||||||||||||||||||||||||
|
2013 Stock Incentive Plan
|
-
|
-
|
172,207
|
513
|
-
|
513
|
||||||||||||||||||
|
2014 Stock Option Incentive Plan
|
-
|
-
|
12,785
|
336
|
-
|
336
|
||||||||||||||||||
|
Retirement of common stock
|
-
|
-
|
(52,536
|
)
|
(213
|
)
|
-
|
(213
|
)
|
|||||||||||||||
|
Net loss
|
-
|
-
|
-
|
-
|
(6,806
|
)
|
(6,806
|
)
|
||||||||||||||||
|
-
|
||||||||||||||||||||||||
|
Balance, June 30, 2016
|
445,063
|
$
|
3,138
|
37,783,444
|
$
|
233,394
|
$
|
(181,507
|
)
|
$
|
55,025
|
|||||||||||||
See accompanying notes.
USA Technologies, Inc.
Consolidated Statements of Cash Flows
|
($ in thousands, except shares)
|
Year ended June 30,
|
|||||||||||
|
2016
|
2015
|
2014
|
||||||||||
|
OPERATING ACTIVITIES:
|
||||||||||||
|
Net income (loss)
|
$
|
(6,806
|
)
|
$
|
(1,089
|
)
|
$
|
27,531
|
||||
|
Adjustments to reconcile net income (loss) to net cash provided by (used in) operating activities:
|
||||||||||||
|
Charges incurred in connection with the vesting and issuance of common stock for employee and director compensation
|
849
|
716
|
529
|
|||||||||
|
(Gain) loss on disposal of property and equipment
|
(167
|
)
|
(17
|
)
|
4
|
|||||||
|
Non-cash interest and amortization of debt discount
|
13
|
-
|
2
|
|||||||||
|
Bad debt expense
|
1,450
|
1,098
|
134
|
|||||||||
|
Depreciation
|
5,135
|
5,731
|
5,464
|
|||||||||
|
Amortization
|
87
|
-
|
22
|
|||||||||
|
Impairment of intangible asset
|
432
|
-
|
-
|
|||||||||
|
Change in fair value of warrant liabilities
|
5,674
|
393
|
(66
|
)
|
||||||||
|
Deferred income taxes, net
|
(660
|
)
|
215
|
(27,301
|
)
|
|||||||
|
Gain on sale of finance receivables
|
-
|
(52
|
)
|
-
|
||||||||
|
Recognition of deferred gain from sale-leaseback transactions
|
(860
|
)
|
(834
|
)
|
(10
|
)
|
||||||
|
Changes in operating assets and liabilities:
|
||||||||||||
|
Accounts receivable
|
(375
|
)
|
(2,539
|
)
|
(204
|
)
|
||||||
|
Finance receivables
|
(2,040
|
)
|
(4,114
|
)
|
53
|
|||||||
|
Inventory
|
1,036
|
(1,931
|
)
|
370
|
||||||||
|
Prepaid expenses and other current assets
|
(763
|
)
|
(304
|
)
|
(191
|
)
|
||||||
|
Accounts payable
|
1,814
|
941
|
460
|
|||||||||
|
Accrued expenses
|
1,266
|
55
|
267
|
|||||||||
|
Income taxes payable
|
383
|
33
|
21
|
|||||||||
|
Net cash provided by (used in) operating activities
|
6,468
|
(1,698
|
)
|
7,085
|
||||||||
|
INVESTING ACTIVITIES:
|
||||||||||||
|
Purchase and additions of property and equipment
|
(536
|
)
|
(60
|
)
|
(111
|
)
|
||||||
|
Purchase of property for rental program
|
-
|
(1,642
|
)
|
(10,883
|
)
|
|||||||
|
Proceeds from sale of rental equipment under sale-leaseback transactions
|
-
|
4,994
|
2,995
|
|||||||||
|
Proceeds from sale of property and equipment
|
389
|
62
|
82
|
|||||||||
|
Cash paid for assets acquired from VendScreen
|
(5,625
|
)
|
-
|
-
|
||||||||
|
Net cash provided by (used in) investing activities
|
(5,772
|
)
|
3,354
|
(7,917
|
)
|
|||||||
|
FINANCING ACTIVITIES:
|
||||||||||||
|
Cash used in retirement of common stock
|
(213
|
)
|
(62
|
)
|
(89
|
)
|
||||||
|
Proceeds from exercise of common stock warrants
|
4,918
|
-
|
2,362
|
|||||||||
|
Proceeds from line of credit
|
7,163
|
-
|
2,000
|
|||||||||
|
Repayment of line of credit
|
(3,992
|
)
|
(1,000
|
)
|
-
|
|||||||
|
Repayment of long-term debt
|
(674
|
)
|
(359
|
)
|
(375
|
)
|
||||||
|
Proceeds from long-term debt
|
-
|
2,057
|
-
|
|||||||||
|
Excess tax benefits from share-based compensation
|
-
|
10
|
25
|
|||||||||
|
Net cash provided by financing activities
|
7,202
|
646
|
3,923
|
|||||||||
|
Net increase in cash
|
7,898
|
2,302
|
3,091
|
|||||||||
|
Cash and cash equivalents at beginning of year
|
11,374
|
9,072
|
5,981
|
|||||||||
|
Cash at end of year
|
$
|
19,272
|
$
|
11,374
|
$
|
9,072
|
||||||
|
Supplemental disclosures of cash flow information:
|
||||||||||||
|
Interest paid in cash
|
$
|
551
|
$
|
306
|
$
|
260
|
||||||
|
Income taxes paid in cash
|
$
|
501
|
$
|
31
|
$
|
-
|
||||||
|
Depreciation expense allocated to cost of services
|
$
|
4,575
|
$
|
5,120
|
$
|
4,881
|
||||||
|
Reclass of rental program property to inventory, net
|
$
|
1,150
|
$
|
674
|
$
|
33
|
||||||
|
Prepaid items financed with debt
|
$
|
103
|
$
|
103
|
$
|
102
|
||||||
|
Warrant issuance for debt discount
|
$
|
52
|
$
|
-
|
$
|
-
|
||||||
|
Debt financing costs financed with debt
|
$
|
79
|
$
|
-
|
$
|
-
|
||||||
|
Equipment and software acquired under capital lease
|
$
|
444
|
$
|
108
|
$
|
325
|
||||||
|
Disposal of property and equipment
|
$
|
1,081
|
$
|
842
|
$
|
710
|
||||||
|
Disposal of property and equipment under sale-leaseback transactions
|
$
|
-
|
$
|
3,873
|
$
|
1,919
|
||||||
USA Technologies, Inc.
Notes to Consolidated Financial Statements
1. BUSINESS
USA Technologies, Inc. (the “Company”, “We”, “USAT”, or “Our”) was incorporated in the Commonwealth of Pennsylvania in January 1992. We are a provider of technology-enabled solutions and value-added services that facilitate electronic payment transactions primarily within the unattended Point of Sale (“POS”) market. We are a leading provider in the small ticket, beverage and food vending industry and are expanding our solutions and services to other unattended market segments, such as amusement, commercial laundry, kiosk and others. Since our founding, we have designed and marketed systems and solutions that facilitate electronic payment options, as well as telemetry Internet of Things (“IoT”) and machine-to-machine (“M2M”) services, which include the ability to remotely monitor, control, and report on the results of distributed assets containing our electronic payment solutions. Historically, these distributed assets have relied on cash for payment in the form of coins or bills, whereas, our systems allow them to accept cashless payments such as through the use of credit or debit cards or other emerging contactless forms, such as mobile payment. All of our customers are located in North America.
2. ACCOUNTING POLICIES
CONSOLIDATION
The accompanying consolidated financial statements include the accounts of the Company and its wholly-owned subsidiaries. All significant intercompany accounts and transactions have been eliminated in consolidation.
USE OF ESTIMATES
The preparation of the consolidated financial statements in conformity with U.S. generally accepted accounting principles requires management to make estimates and assumptions that affect the amounts reported in the consolidated financial statements and accompanying notes. Actual results could differ from those estimates.
CASH
The Company maintains its cash in bank deposit accounts, which may exceed federally insured limits at times.
ACCOUNTS RECEIVABLE AND ALLOWANCE FOR DOUBTFUL ACCOUNTS
Accounts receivable include amounts due to the Company for sales of equipment, other amounts due from customers, merchant service receivables, and unbilled amounts due from customers, net of the allowance for uncollectible accounts.
The Company maintains an allowance for doubtful accounts for estimated losses resulting from the inability of its customers to make required payments, including from a shortfall in the customer transaction fund flow from which the Company would normally collect amounts due.
The allowance is determined through an analysis of various factors including the aging of the accounts receivable, the strength of the relationship with the customer, the capacity of the customer transaction fund flow to satisfy the amount due from the customer, an assessment of collection costs and other factors. The allowance for doubtful accounts receivable is management’s best estimate as of the respective reporting date. The Company writes off accounts receivable against the allowance when management determines the balance is uncollectible and the Company ceases collection efforts. Management believes that the allowance recorded is adequate to provide for its estimated credit losses.
USA Technologies, Inc.
Notes to Consolidated Financial Statements
2. ACCOUNTING POLICIES (CONTINUED)
FINANCE RECEIVABLES
The Company offers extended payment terms to certain customers for equipment sales under its Quick Start Program. In accordance with the Financial Accounting Standards Board Accounting Standards Codification® (“ASC”) Topic 840, “Leases”, agreements under the Quick Start Program qualify for sales-type lease accounting. Accordingly, the future minimum lease payments are classified as finance receivables in the Company’s consolidated balance sheets. Finance receivables or Quick Start leases are generally for a sixty month term. Finance receivables are carried at their contractual amount and charged off against the allowance for credit losses when management determines that recovery is unlikely and the Company ceases collection efforts. The Company recognizes a portion of the note or lease payments as interest income in the accompanying consolidated financial statements based on the effective interest rate method.
INVENTORY, Net
Inventory consists of finished goods and packaging materials. The Company’s inventory is stated at the lower of cost (average cost basis) or market.
PROPERTY AND EQUIPMENT, Net
Property and equipment are recorded at cost. Property and equipment are depreciated on the straight-line basis over the estimated useful lives of the related assets. Leasehold improvements are amortized on the straight-line basis over the lesser of the estimated useful life of the asset or the respective lease term.
GOODWILL AND INTANGIBLE ASSETS
The Company’s intangible assets include goodwill, trademarks, non-compete agreements, brand, developed technology and customer relationships.
The Company’s trademarks with an indefinite economic life are not being amortized. The trademarks, not subject to amortization, are related to the EnergyMiser asset group and consist of four trademarks. The Company tests indefinite-life intangible assets for impairment using a two-step process. The first step screens for potential impairment, while the second step measures the amount of impairment. The Company uses a relief from royalty analysis to complete the first step in this process. Testing for impairment is to be done at least annually and at other times if events or circumstances arise that indicate that impairment may have occurred. The Company has selected April 1 as its annual test date for its indefinite-lived intangible assets. The Company concluded there was no impairment of trademarks during the fiscal years ended June 30, 2015 and 2014, respectively. During the fourth quarter of the fiscal year ended June 30, 2016, the fair value of the trademarks were determined to have inconsequential value based on the “relief from royalty” methodology. This assessment resulted in an impairment write-down during the fourth fiscal quarter of $432 thousand, which is included in “Impairment of intangible asset” in the Consolidated Statement of Operations for the fiscal year ended June 30, 2016. (See Note 7 Goodwill and Intangible Assets for details.)
USA Technologies, Inc.
Notes to Consolidated Financial Statements
2. ACCOUNTING POLICIES (CONTINUED)
Goodwill represents the excess of cost over fair value of the net assets purchased in acquisitions. The Company accounts for goodwill in accordance with ASC 350, “Intangibles – Goodwill and Other”. Under ASC 350, goodwill is not amortized to earnings, but instead is subject to periodic testing for impairment. Testing for impairment is to be done at least annually and at other times if events or circumstances arise that indicate that impairment may have occurred. The Company has selected April 1 as its annual test date. The Company has concluded there has been no impairment of goodwill during the fiscal years ended June 30, 2016, 2015 and 2014, respectively.
LONG-LIVED ASSETS
In accordance with ASC 360, “Impairment or Disposal of Long-Lived Assets”, the Company reviews its definite lived long-lived assets whenever events or changes in circumstances indicate that the carrying amount of such assets may not be recoverable. If the carrying amount of an asset or group of assets exceeds its net realizable value, the asset will be written down to its fair value. In the period when the plan of sale criteria of ASC 360 are met, definite lived long-lived assets are reported as held for sale, depreciation and amortization cease, and the assets are reported at the lower of carrying value or fair value less costs to sell. The Company has concluded that the carrying amount of definite lived long-lived assets is recoverable as of June 30, 2016 and 2015.
FAIR VALUE OF FINANCIAL INSTRUMENTS
The Financial Accounting Standards Board (“FASB”) issued Accounting Standards Update (“ASU”) 2010-06, “Fair Value Measurements and Disclosures (“Topic 820”): Improving Disclosures about Fair Value Measurements.” ASU 2010-06 amends certain disclosure requirements of Subtopic 820-10. This ASU provides additional disclosures for transfers in and out of Levels 1 and 2 and for activity in Level 3. This ASU also clarifies certain other existing disclosure requirements including level of desegregation and disclosures around inputs and valuation techniques.
The Company’s financial assets and liabilities are accounted for in accordance with ASC 820 “Fair Value Measurement.” Under ASC 820 the Company uses inputs from the three levels of the fair value hierarchy to measure its financial assets and liabilities. The three levels are as follows:
Level 1- Inputs are unadjusted quoted prices in active markets for identical assets or liabilities that the Company has the ability to access at the measurement date.
Level 2- Inputs are other than quoted prices included within Level 1 that are observable for the asset or liability, either directly or indirectly. Level 2 inputs include quoted prices for similar assets and liabilities in active markets, quoted prices for identical or similar assets or liabilities in markets that are not active, inputs other than quoted prices that are observable for the asset or liability (i.e., interest rates, yield curves, etc.), and inputs that are derived principally from or corroborated by observable market data by correlation or other means (market corroborated inputs).
Level 3- Inputs are unobservable and reflect the Company’s assumptions that market participants would use in pricing the asset or liability. The Company develops these inputs based on the best information available.
The Company’s financial instruments, principally accounts receivable, short-term finance receivables, prepaid expenses and other assets, accounts payable and accrued expenses, are carried at cost which approximates fair value due to the short-term maturity of these instruments. The fair value of the Company’s obligations under its long-term debt agreements and the long-term portion of its finance receivables approximate their carrying value as such instruments are at market rates currently available to the Company.
CONCENTRATION OF RISKS
Financial instruments that subject the Company to a concentration of credit risk consist principally of cash and accounts and finance receivables. The Company maintains cash with various financial institutions where accounts may exceed federally insured limits at times. Approximately 18%, 35% and 22% of the Company’s trade accounts and finance receivables at June 30, 2016, 2015 and 2014, respectively, were concentrated with one customer.
USA Technologies, Inc.
Notes to Consolidated Financial Statements
2. ACCOUNTING POLICIES (CONTINUED)
Concentration of revenues with customers subject the Company to operating risks. Approximately 16%, 21% and 26% of the Company’s license and transaction processing revenues for the years ended June 30, 2016, 2015 and 2014, respectively, were concentrated with one customer. Approximately 28% and 17% of the Company’s equipment sales revenue were concentrated with one customer for the years ended June 30, 2016 and 2015, respectively, with no concentrations for the year ended June 30, 2014. The Company’s customers are principally located in the United States.
REVENUE RECOGNITION
Revenue from the sale or QuickStart lease of equipment is recognized on the terms of free-on-board shipping point. Activation fee revenue, if applicable, is recognized when the Company’s cashless payment device is initially activated for use on the Company network. Transaction processing revenue is recognized upon the usage of the Company’s cashless payment and control network. License fees for access to the Company’s devices and network services are recognized on a monthly basis. In all cases, revenue is only recognized when persuasive evidence of an arrangement exists, delivery has occurred or services have been rendered, the price is fixed and determinable, and collection of the resulting receivable is reasonably assured. The Company estimates an allowance for product returns at the date of sale and license and transaction fee refunds on a monthly basis.
ePort hardware is available to customers under the QuickStart program pursuant to which the customer would enter into a five-year non-cancelable lease with either the Company or a third-party leasing company for the devices. The Company qualifies for sales type lease accounting. Accordingly, the company recognizes a portion of lease payments as interest income. At the end of the lease period, the customer would have the option to purchase the device at its residual value.
EQUIPMENT RENTAL
The Company offers its customers a rental program for its ePort devices, the JumpStart program (“JumpStart”). JumpStart terms are typically 36 months and are cancellable with thirty to sixty days’ written notice. In accordance with ASC 840, “Leases”, the Company classifies the rental agreements as operating leases, with service fee revenue related to the leases included in license and transaction fees in the Consolidated Statements of Operations. Cost for the JumpStart revenues, which consists of depreciation expense on the JumpStart equipment, is included in cost of services in the Consolidated Statements of Operations. ePort equipment utilized by the JumpStart program is included in property and equipment, net on the Consolidated Balance Sheet.
WARRANTY COSTS
The Company generally warrants its products for one to three years. Warranty costs are estimated and recorded at the time of sale based on historical warranty experience, if available. These costs are reviewed and adjusted, if necessary, periodically throughout the year.
SHIPPING AND HANDLING
Shipping and handling fees billed to our customers in connection with sales are recorded as revenue. The costs incurred for shipping and handling of our product are recorded as cost of equipment.
ADVERTISING
Advertising costs are expensed as incurred. Advertising expense was $0.3 million, $0.2 million, and $0.2 million in the fiscal years ended June 30, 2016, 2015, and 2014, respectively.
RESEARCH AND DEVELOPMENT EXPENSES
Research and development expenses are expensed as incurred. Research and development expenses, which are included in selling, general and administrative expenses in the Consolidated Statements of Operations, were approximately $1.4 million, $1.5 million and $1.0 million, for the years ended June 30, 2016, 2015, and 2014, respectively. Our research and development initiatives focus on adding features and functionality to our system solutions through the development and utilization of our processing and reporting network and new technology.
USA Technologies, Inc.
Notes to Consolidated Financial Statements
2. ACCOUNTING POLICIES (CONTINUED)
ACCOUNTING FOR EQUITY AWARDS
In accordance with ASC 718 the cost of employee services received in exchange for an award of equity instruments is based on the grant-date fair value of the award and allocated over the requisite service period of the award.
Litigation Costs
From time to time, we are involved in litigation, claims, contingencies and other legal matters. We record a charge equal to at least the minimum estimated liability for a loss contingency when both of the following conditions are met: (i) information available prior to issuance of the financial statements indicates that it is probable that an asset had been impaired or a liability had been incurred at the date of the financial statement and (ii) the range of the loss can be reasonably estimated. We expense legal costs, including those legal costs expected to be incurred in connection with a loss contingency, as incurred.
INCOME TAXES
The Company follows the provisions of FASB ASC 740, Accounting for Uncertainty in Income Taxes, which provides detailed guidance for the financial statement recognition, measurement and disclosure of uncertain tax positions recognized in the financial statements. Tax positions must meet a “more-likely-than-not” recognition threshold at the effective date to be recognized upon the adoption of ASC 740 and in subsequent periods.
Income taxes are computed using the asset and liability method of accounting. Under the asset and liability method, a deferred tax asset or liability is recognized for estimated future tax effects attributable to temporary differences and carryforwards. The measurement of deferred income tax assets is adjusted by a valuation allowance, if necessary, to recognize future tax benefits only to the extent, based on available evidence, it is more likely than not such benefits will be realized. The Company recognizes interest and penalties, if any, related to uncertain tax positions in selling, general and administrative expenses. No interest or penalties related to uncertain tax positions were accrued or incurred during the years ended June 30, 2016, 2015, and 2014.
The Company files income tax returns in the United States federal jurisdiction and various state jurisdictions. The tax years ended June 30, 2013 through June 30, 2016 remain open to examination by taxing jurisdictions to which the Company is subject. As of June 30, 2016, the Company did not have any income tax examinations in process.
EARNINGS (LOSS) PER COMMON SHARE
Basic earnings (loss) per share are calculated by dividing net income (loss) applicable to common shares by the weighted average common shares outstanding for the period. Diluted earnings (loss) per share are calculated by dividing net income (loss) applicable to common shares by the weighted average common shares outstanding for the period plus the dilutive effects of common stock equivalents unless the effects of such common stock equivalents are anti-dilutive. For the years ended June 30, 2016, 2015 and 2014 no effect for common stock equivalents was considered in the calculation of diluted earnings (loss) per share because their effect was anti-dilutive.
The consolidated financial statements included in this Form 10-K reflect additional shares of common stock and preferred stock that had been issued and outstanding in prior periods but were not reflected as such in previous consolidated financial statements as explained in Note 19. The basic and diluted weighted average number of common shares outstanding for the years ended June 30, 2015 and 2014 have been adjusted to reflect the additional number of shares pertaining to each of those years. The foregoing adjustments in basic and diluted weighted common shares outstanding did not affect the previously reported net loss per common share-basic or diluted for the year ended June 30, 2015. The previously reported net income per common share-basic and diluted for the year ended June 30, 2014 was decreased from $.78 to $.77 as a result of the foregoing adjustments.
SOFTWARE DEVELOPMENT COSTS
Costs incurred during the preliminary project along with post-implementation stages of internal use computer software development and costs incurred to maintain existing product offerings are expensed as incurred. The capitalization and ongoing assessment of recoverability of development costs require considerable judgment by management with respect to certain external factors, including, but not limited to, technological and economic feasibility and estimated economic life. At June 30, 2016, the Company had $137 thousand in capitalized software development which is being amortized over a period of three years.
USA Technologies, Inc.
Notes to Consolidated Financial Statements
2. ACCOUNTING POLICIES (CONTINUED)
OTHER COMPREHENSIVE INCOME
ASC 220, “Comprehensive Income”, prescribes the reporting required for comprehensive income and items of other comprehensive income. Entities having no items of other comprehensive income are not required to report on comprehensive income. The Company has no items of other comprehensive income for its years ended June 30, 2016, 2015 or 2014.
RECENT ACCOUNTING PRONOUCEMENTS
The Company is evaluating whether the effects of the following recent accounting pronouncements or any other recently issued, but not yet effective accounting standards, will have a material effect on the Company’s consolidated financial position, results of operations or cash flows.
In May 2014, the Financial Accounting Standards Board issued ASU 2014-09, Revenue from Contracts with Customers (Topic 606). This ASU was amended by ASU No. 2015-14, issued in August 2015, which deferred the original effective date by one year. The new guidance provides a single model for entities to use in accounting for revenue arising from contracts with customers and will supersede most current revenue recognition guidance. The new standard also requires expanded qualitative and quantitative disclosures about the nature, timing and uncertainty of revenue and cash flows rising from contracts with customers. The ASU is now effective for fiscal years, and interim reporting periods within those years, beginning with the year ending June 30, 2019.
In June 2014, the Financial Accounting Standards Board issued ASU 2014-12 Compensation - Stock Compensation (Topic 718); Accounting for share-based payments when the terms of the award provide that a performance target could be achieved after the requisite service period. Under the new guidance an entity will not record compensation expense related to an award until it becomes probable that the performance target will be met. This pronouncement will be effective for the Company beginning with the year ending June 30, 2017.
In April 2015, the Financial Accounting Standards Board issued ASU 2015-03 Interest - Imputation of Interest (Subtopic 835-30): Simplifying the presentation of debt issuance costs. This standard is part of FASB’s simplification initiative which has as its objective to identify, evaluate, and improve areas where cost and complexity can be reduced while maintaining or improving the usefulness of the information for users. The Company adopted this pronouncement for the year ended June 30, 2016.
In July 2015, the Financial Accounting Standards Board issued ASU 2015-11 Inventory (Topic 330): Simplifying the measurement of inventory. This standard is part of FASB’s simplification initiative which has as its objective to identify, evaluate, and improve areas where cost and complexity can be reduced while maintaining or improving the usefulness of the information for users. This pronouncement will be effective for the Company beginning with the year ending June 30, 2018.
In September 2015, the Financial Accounting Standards Board issued ASU 2015-16, "Simplifying the Accounting for Measurement-Period Adjustments". ASU 2015-16 eliminates the requirement for an acquirer in a business combination to account for measurement-period adjustments retrospectively. ASU 2015-16 will be effective for the Company beginning with the quarter ending September 30, 2016. Since this standard is prospective, the impact of ASU 2015-16 on the Company's financial condition, results of operations and cash flows will depend upon the nature of any measurement period adjustments identified in future periods.
In November 2015, the Financial Accounting Standards Board issued ASU 2015-17, "Balance Sheet Classification of Deferred Taxes" ("ASU 2015-17"), which will require entities to present all deferred tax liabilities and assets as noncurrent on the balance sheet instead of separating deferred taxes into current and noncurrent amounts. The standard will be effective for the Company beginning with the quarter ending September 30, 2017. Early application is permitted. The standard can be applied either prospectively to all deferred tax liabilities and assets or retrospectively to all periods presented.
In February 2016, the Financial Accounting Standards Board issued ASU 2016-02 “Leases” (Topic 842). Under the new guidance, those leases classified as operating leases under previous GAAP, will be recognized on our consolidated balance sheet as liabilities with corresponding right-of-use assets. This pronouncement will be effective for the Company beginning with the year ending June 30, 2018.
USA Technologies, Inc.
Notes to Consolidated Financial Statements
2. ACCOUNTING POLICIES (CONTINUED)
In March 2016, the Financial Accounting Standards Board issued ASU 2016-09 Compensation – Stock Compensation (Topic 718): Improvements to Employee Share-Based Payment Accounting. The new guidance simplifies several aspects of accounting and presentation for share-bases compensation. This pronouncement will be effective for the Company beginning with the year ending June 30, 2018.
In August 2016, the Financial Accounting Standards Board issued ASU 2016-15 Statement of Cash Flows Classification of Certain Cash Receipts and Cash Payments (Topic 230). This update addresses eight specific cash flow issues with the objective of reducing the existing diversity in practice. This pronouncement will be effective for the Company beginning with the year ending June 30, 2018.
There are three amendments to ASU 2014-09 issued in 2016. They are ASU 2016-08, issued in March 2016 Revenue from Contracts with Customers (Topic 606) Principal versus Agent Considerations which clarifies those relationships with the customer, ASU 2016-10, issued in April 2016 Revenue from Contracts with Customers (Topic 606), Identifying Performance Obligations and Licensing, what is the entity’s obligations to its customer and what is the customer’s entitlement in the license agreements and ASU 2016-12, issued in April 2016 Revenue from Contracts with Customers (Topic 606), Narrow Scope Improvements and Practical Expedients, guidance on assessing collectability, presentation of sales taxes, noncash consideration, and completed contract modifications at transition. These amendments to ASU 2014-09 are now effective for fiscal years, and interim reporting periods within those years, beginning with the year ending June 30, 2019.
RECLASSIFICATION
As reported in the Company’s Form 10-Q for the quarter ended September 30, 2015, commencing with the September 30, 2015 financial statements, the Company changed the manner in which it presents certain uncollected customer accounts receivable and the related allowance in its consolidated balance sheets and the related statements of cash flows. These accounts receivable represent a large number of small balance amounts due from customers for processing and service fees which had not been billed to customers, and as to which, there had been no customer transaction proceeds from which the Company could collect the amounts due in accordance with its normal procedures. The previous accounting classification recorded these amounts as a reduction of its accounts payable in the consolidated balance sheets and the related statements of cash flows. The new accounting classification moves these amounts to accounts receivable and allowance for bad debt.
USA Technologies, Inc.
Notes to Consolidated Financial Statements
2. ACCOUNTING POLICIES (CONTINUED)
|
($ in thousands)
|
June 30, 2015 Balances
|
|||||||||||
|
Consolidated Balance Sheet Line Items
|
As previously
reported
|
Reclassification
|
As reclassified
|
|||||||||
|
Accounts Receivable, net of allowance for doubtful accounts:
|
||||||||||||
|
Reclassification of balances included in accounts payable to accounts receivable
|
$
|
2,114
|
||||||||||
|
Reclassification of the allowance for doubtful accounts in accounts payable
|
(815
|
)
|
||||||||||
|
$
|
4,672
|
$
|
1,299
|
$
|
5,971
|
|||||||
|
Allowance for Doubtful Accounts:
|
||||||||||||
|
Reclassification of the allowance for doubtful accounts in accounts payable
|
$
|
(494
|
)
|
$
|
(815
|
)
|
$
|
(1,309
|
)
|
|||
|
Accounts Payable:
|
||||||||||||
|
Reclassification of balances included in accounts payable to accounts receivable
|
$
|
2,114
|
||||||||||
|
Reclassification of the allowance for doubtful accounts in accounts payable
|
(815
|
)
|
||||||||||
|
$
|
9,243
|
$
|
1,299
|
$
|
10,542
|
|||||||
Accordingly, the respective balances for all prior periods presented in these financial statements were reclassified in order to be consistent with and comparable to the accounting classification of these items in our June 30, 2015 financial statements. The new accounting classification as well as the reclassification for prior periods had no effect on the consolidated statements of operations or the consolidated statements of shareholders’ equity. The details of the reclassification of the consolidated balance sheets were disclosed in the Company’s Form 10-Q for the quarter ended September 30, 2015. The consolidated statements of cash flows amounts are presented in the table below:
|
($ in thousands)
|
For the fiscal year ended June 30, 2015
|
|||||||||||
|
Consolidated Statement of Cash Flow Line Items
|
As previously
reported
|
Reclassification
|
As reclassified
|
|||||||||
|
Accounts Receivable
|
||||||||||||
|
Reclassification of cash provided by and included in accounts payable to accounts receivable
|
$
|
(2,517
|
)
|
$
|
(22
|
)
|
$
|
(2,539
|
)
|
|||
|
Accounts Payable:
|
||||||||||||
|
Reclassification of cash used in and included in accounts payable to accounts receivable
|
$
|
919
|
$
|
22
|
$
|
941
|
||||||
USA Technologies, Inc.
Notes to Consolidated Financial Statements
2. ACCOUNTING POLICIES (CONTINUED)
|
($ in thousands)
|
For the fiscal year ended June 30, 2014
|
|||||||||||
|
Consolidated Statement of Cash Flow Line Items
|
As previously
reported
|
Reclassification
|
As reclassified
|
|||||||||
|
Accounts Receivable
|
||||||||||||
|
Reclassification of cash provided by and included in accounts payable to accounts receivable
|
$
|
(157
|
)
|
$
|
(47
|
)
|
$
|
(204
|
)
|
|||
|
Accounts Payable:
|
||||||||||||
|
Reclassification of cash used in and included in accounts payable to accounts receivable
|
$
|
413
|
$
|
47
|
$
|
460
|
||||||
USA Technologies, Inc.
Notes to Consolidated Financial Statements
3. ACQUISITION
VENDSCREEN, INC.
On January 15, 2016, the Company executed an Asset Purchase Agreement with VendScreen, Inc. (“VendScreen”), a Portland, Oregon based developer of vending industry cashless payment technology, by which it acquired substantially all of VendScreen’s assets and assumed specified liabilities, for a cash payment of $5.625 million. The purchase price was funded using $2.625 million in cash, and the balance of $3.0 million from a term loan which was converted from a line of credit.
This acquisition expands the Company’s capability with interactive media (touchscreen) and content delivery through VendScreen’s cloud-based content delivery platform, device platform and products, customer base, vendor management system (VMS) integration, and consumer product information including nutritional data. In addition to new technology and services, the acquisition adds a West Coast operational footprint, with former VendScreen employees able to offer expanded customer services, sales and technical support. On the date of the acquisition, VendScreen had approximately 150 customers with approximately 6,000 connections. Of those 150 customers approximately 50% are new customers of USAT.
The following table summarizes the preliminary purchase price allocation to reflect the fair values of the assets acquired and liabilities assumed at the date of acquisition.
USA Technologies, Inc.
Notes to Consolidated Financial Statements
3. ACQUISITION (CONTINUED)
|
($ in thousands)
|
||||
|
Consideration:Fair value of total consideration paid in cash
|
$
|
5,625
|
||
|
Acquisition / non-recurring acquisition expenses:
|
$
|
842
|
||
|
Recognized amounts of identifiable assets acquired and liabilities assumed:
|
||||
|
Financial Assets:
|
||||
|
Accounts receivable
|
$
|
3
|
||
|
Finance receivables
|
628
|
|||
|
Other current assets
|
20
|
|||
|
Deferred income taxes
|
18
|
|||
|
669
|
||||
|
Property, plant & equipment
|
81
|
|||
|
Identifiable intangible assets:
|
||||
|
Developed technology
|
639
|
|||
|
Customer relationships
|
149
|
|||
|
Brand
|
95
|
|||
|
Noncompete agreements
|
2
|
|||
|
Fair value of intangible assets
|
885
|
|||
|
Financial liabilities
|
||||
|
Accrued liabilities
|
(50
|
)
|
||
|
Total identifiable net assets
|
1,585
|
|||
|
Goodwill
|
4,040
|
|||
|
Total Fair Value
|
$
|
5,625
|
||
Of the $885 thousand of acquired intangible assets, $639 thousand was assigned to Developed Technology that is subject to amortization over 5 years, $149 thousand was assigned to Customer Relationships which are subject to amortization over 10 years; $2 thousand was assigned to a non-compete agreement that is subject to amortization over 2 years, and $95 thousand was assigned to the Brand that is subject to amortization over 3 years. All of the intangible assets are amortizable for income tax purposes.
VendScreen has been included in the accompanying consolidated financial statements of the Company since the date of acquisition. The $842 thousand of acquisition / non-recurring expenses consists of non-recurring expenses incurred in connection with the acquisition and integration of the VendScreen business and were included in SG&A expenses during the 1 year ended June 30, 2016.
The acquired business contributed net revenues of $1.2 million during the fiscal year ended June 30, 2016. ASC No. 2010-29 requires the disclosure of additional information including the amounts of earnings of the acquiree since the acquisition date included in the consolidated income statement, and the revenue and earnings of the combined entity as though the business combination that occurred during the current year had occurred at the beginning of the prior annual reporting period (supplemental pro forma information). The disclosure of such information was impractical and is not provided as (1) the acquiree had been integrated into the Company’s operation such that discreet financial information of the acquiree could not be determined, and (2) the financial records of the acquiree were not adequate to allow the preparation of supplemental pro forma information.
USA Technologies, Inc.
Notes to Consolidated Financial Statements
4. EARNINGS PER SHARE CALCULATION
The calculation of basic earnings per share (“eps”) and diluted earnings per share is presented below:
|
Year Ended June 30
|
||||||||||||
|
($ in thousands, except per share data)
|
2016
|
2015
|
2014
|
|||||||||
|
Numerator for basic and diluted earnings per share
|
||||||||||||
|
Net income (loss)
|
$
|
(6,806
|
)
|
$
|
(1,089
|
)
|
$
|
27,531
|
||||
|
Preferred dividends
|
(668
|
)
|
(668
|
)
|
(668
|
)
|
||||||
|
Net income (loss) available to common shareholders
|
$
|
(7,474
|
)
|
$
|
(1,757
|
)
|
$
|
26,863
|
||||
|
Denominator for basic earnings per share - Weighted average shares outstanding
|
36,309,047
|
35,719,211
|
34,667,769
|
|||||||||
|
Effect of dilutive potential common shares
|
-
|
-
|
341,790
|
|||||||||
|
Denominator for diluted earnings per share - Adjusted weighted average shares outstanding
|
36,309,047
|
35,719,211
|
#
|
35,009,559
|
||||||||
|
Basic earnings (loss) per share
|
$
|
(0.21
|
)
|
$
|
(0.05
|
)
|
$
|
0.77
|
||||
|
Diluted earnings (loss) per share
|
$
|
(0.21
|
)
|
$
|
(0.05
|
)
|
$
|
0.77
|
||||
Antidilutive shares excluded from the calculation of diluted earnings per share were 1,168,689, 252,827 and 98,497 for the years ended June 30, 2016, 2015 and 2014, respectively.
5. FINANCE RECEIVABLES
Finance receivables consist of the following:
|
($ in thousands)
|
June 30,
2016 |
June 30,
2015 |
||||||
|
Total finance receivables
|
$
|
7,306
|
$
|
4,639
|
||||
|
Less current portion
|
3,588
|
941
|
||||||
|
Non-current portion of finance receivables
|
$
|
3,718
|
$
|
3,698
|
||||
Credit quality indicators consist of the following:
Credit Quality Indicators
|
June 30,
2016 |
June 30,
2015 |
|||||||
|
($ in thousands)
|
||||||||
|
Performing
|
$
|
7,174
|
$
|
4,619
|
||||
|
Nonperforming
|
132
|
20
|
||||||
|
Total
|
$
|
7,306
|
$
|
4,639
|
||||
USA Technologies, Inc.
Notes to Consolidated Financial Statements
5. FINANCE RECEIVABLES (CONTINUED)
Age Analysis of Past Due Finance Receivables
As of June 30, 2016
|
($ in thousands)
|
31 – 60
Days PastDue
|
61 – 90
Days PastDue
|
Greater than
90 Days PastDue
|
Total Past
Due
|
Current
|
Total
FinanceReceivables
|
||||||||||||||||||
|
QuickStart Leases
|
$
|
98
|
$
|
31
|
$
|
3
|
$
|
132
|
$
|
7,174
|
$
|
7,306
|
||||||||||||
Age Analysis of Past Due Finance Receivables
As of June 30, 2015
|
($ in thousands)
|
Days Past
31 – 60
Due |
61 – 90
Days PastDue
|
Greater than
90 Days PastDue
|
Total Past
Due
|
Current
|
Total
FinanceReceivables
|
||||||||||||||||||
|
QuickStart Leases
|
$
|
-
|
$
|
16
|
$
|
5
|
$
|
21
|
$
|
4,618
|
$
|
4,639
|
||||||||||||
Finance receivables due for each of the fiscal years following June 30, 2016 are as follows:
|
($ in thousands)
|
||||
|
2017
|
$
|
3,588
|
||
|
2018
|
1,246
|
|||
|
2019
|
1,246
|
|||
|
2020
|
944
|
|||
|
2021 and beyond
|
282
|
|||
|
$
|
7,306
|
|||
6. PROPERTY AND EQUIPMENT, net
Property and equipment, at cost, consist of the following:
|
Useful
|
June 30, 2016
|
|||||||||||||
|
($ in thousands)
|
Lives
|
Cost
|
Accumulated
Depreciation
|
Net
|
||||||||||
|
Computer equipment and software
|
3-7 years
|
$
|
5,506
|
$
|
(4,374
|
)
|
$
|
1,132
|
||||||
|
Property and equipment used for rental program
|
5 years
|
26,648
|
(18,246
|
)
|
8,402
|
|||||||||
|
Furniture and equipment
|
3-7 years
|
874
|
(654
|
)
|
220
|
|||||||||
|
Leasehold improvements
|
Lesser of life or lease term
|
575
|
(564
|
)
|
11
|
|||||||||
|
$
|
33,603
|
$
|
(23,838
|
)
|
$
|
9,765
|
||||||||
|
Useful
|
June 30, 2015
|
|||||||||||||
|
($ in thousands)
|
Lives
|
Cost
|
Accumulated
Depreciation
|
Net
|
||||||||||
|
Computer equipment and purchased software
|
3-7 years
|
$
|
4,670
|
$
|
(4,017
|
)
|
$
|
653
|
||||||
|
Property and equipment used for rental program
|
5 years
|
26,469
|
(14,476
|
)
|
11,993
|
|||||||||
|
Furniture and equipment
|
3-7 years
|
723
|
(572
|
)
|
151
|
|||||||||
|
Leasehold improvements
|
Lesser of life or lease term
|
575
|
(503
|
)
|
72
|
|||||||||
|
$
|
32,437
|
$
|
(19,568
|
)
|
$
|
12,869
|
||||||||
USA Technologies, Inc.
Notes to Consolidated Financial Statements
6. PROPERTY AND EQUIPMENT, net (CONTINUED)
Assets under capital leases totaled approximately $2.6 million and $2.1 million as of June 30, 2016 and 2015, respectively. Capital lease amortization of approximately $271 thousand, $349 thousand and $305 thousand, is included in depreciation expense for the years ended June 30, 2016, 2015, and 2014, respectively.
7. GOODWILL AND INTANGIBLE ASSETS
Amortization expense relating to all acquired intangible assets was approximately $87 thousand, $0 and $22 thousand during each of the years ended June 30, 2016, 2015 and 2014, respectively. Intangible asset balances consisted of the following:
|
Beginning
|
Year ended June 30, 2016
|
Ending
|
|||||||||||||||
|
($ in thousands)
|
Balance
|
Additions/
|
Balance
|
Amortization
|
|||||||||||||
|
July 1, 2015
|
Adjustments
|
Amortization
|
June 30, 2016
|
Period
|
|||||||||||||
|
Intangible Assets:
|
|||||||||||||||||
|
Trademarks - Indefinite
|
$
|
432
|
$
|
(432
|
)(1)
|
$
|
-
|
$
|
-
|
Indefinite
|
|||||||
|
Non-compete agreements
|
-
|
2
|
(1
|
)
|
1
|
2 years
|
|||||||||||
|
Brand
|
-
|
95
|
(16
|
)
|
79
|
3 years
|
|||||||||||
|
Developed technology
|
-
|
639
|
(63
|
)
|
576
|
5 years
|
|||||||||||
|
Customer relationships
|
-
|
149
|
(7
|
)
|
142
|
10 years
|
|||||||||||
|
Total Intangible Assets
|
$
|
432
|
$
|
453
|
$
|
(87
|
)
|
$
|
798
|
||||||||
|
Goodwill
|
7,663
|
4,040
|
-
|
11,703
|
Indefinite
|
||||||||||||
|
Total Intangible Assets & Goodwill
|
$
|
8,095
|
$
|
4,493
|
$
|
(87
|
)
|
$
|
12,501
|
||||||||
|
Beginning
|
Year ended June 30, 2015
|
Ending
|
|||||||||||||||
|
($ in thousands)
|
Balance
|
Additions/
|
Balance
|
Amortization
|
|||||||||||||
|
July 1, 2014
|
Adjustments
|
Amortization
|
June 30, 2015
|
Period
|
|||||||||||||
|
Intangible assets:
|
|||||||||||||||||
|
Trademarks - Indefinite
|
$
|
432
|
-
|
-
|
$
|
432
|
Indefinite
|
||||||||||
|
Total Intangible Assets
|
$
|
432
|
$
|
-
|
$
|
-
|
$
|
432
|
|||||||||
|
Goodwill
|
7,663
|
-
|
-
|
7,663
|
Indefinite
|
||||||||||||
|
Total
|
$
|
8,095
|
$
|
-
|
$
|
-
|
$
|
8,095
|
|||||||||
| (1) |
The Company’s test for impairment of its indefinite-lived trademarks consists of the trademarks: 1) VendingMiser, 2) CoolerMiser, 3) PlugMiser and 4) SnackMiser. As a result of its testing in fiscal years ended June 30, 2015 and 2014 the Company determined that no impairment had occurred. In the testing in fiscal year 2016, the Company determined that the sum of the expected discounted cash flows attributable to the trademarks was less than its carrying value of $432 thousand, and that an impairment write-down was required. The fair value of the trademarks was determined by a method known as “relief from royalty”, in which the fair value is determined by reference to the amount of royalty income the intangible would generate if it were licensed in an arm’s-length transaction. The essential assumptions in a valuation via an income approach are as follows:
|
USA Technologies, Inc.
Notes to Consolidated Financial Statements
7. GOODWILL AND INTANGIBLE ASSETS (CONTINUED)
| · |
The related dollar sales volume;
|
| · |
The percentage royalty on sales;
|
| · |
The adjustment for taxes;
|
| · |
The remaining useful economic life;
|
| · |
The percentage return on investment; and,
|
| · |
The tax amortization benefit.
|
During the fourth quarter of the fiscal year ended June 30, 2016, the fair value of the trademarks was determined to have inconsequential value based on the “relief from royalty” methodology. This assessment resulted in an impairment write-down during the fourth fiscal quarter of $432 thousand, which is included in “Impairment of intangible asset” in the Consolidated Statement of Operations for the fiscal year ended June 30, 2016.
|
At June 30, 2016, amortizable intangible asset balances were:
|
||||||||||||
|
($ in thousands)
|
Cost
|
Accumulated
Amortization
|
Net Book Value
|
|||||||||
|
Non-compete agreements
|
$
|
2
|
$
|
(1
|
)
|
$
|
1
|
|||||
|
Brand
|
95
|
(16
|
)
|
$
|
79
|
|||||||
|
Developed Technology
|
639
|
(63
|
)
|
$
|
576
|
|||||||
|
Customer Relationships
|
149
|
(7
|
)
|
$
|
142
|
|||||||
|
$
|
885
|
$
|
(87
|
)
|
$
|
798
|
||||||
There were no amortizable intangible assets at June 30, 2015.
Estimated annual amortization expense for amortizable intangible assets is as follows:
|
2017
|
$
|
175
|
||
|
2018
|
175
|
|||
|
2019
|
159
|
|||
|
2020
|
143
|
|||
|
2021
|
79
|
|||
|
Thereafter
|
67
|
|||
|
$
|
798
|
USA Technologies, Inc.
Notes to Consolidated Financial Statements
8. ACCRUED EXPENSES
Accrued expenses consist of the following:
|
($ in thousands)
|
June 30,
2016 |
June 30,
2015 |
||||||
|
Accrued compensation and related sales commissions
|
$
|
1,268
|
$
|
673
|
||||
|
Accrued professional fees
|
809
|
301
|
||||||
|
Accrued taxes and filing fees
|
795
|
505
|
||||||
|
Advanced customer billings
|
236
|
390
|
||||||
|
Accrued rent
|
2
|
75
|
||||||
|
Accrued other
|
363
|
213
|
||||||
|
3,473
|
2,157
|
|||||||
|
Less current portion
|
(3,458
|
)
|
(2,108
|
)
|
||||
|
$
|
15
|
$
|
49
|
|||||
9. LINE OF CREDIT
On January 15, 2016, the Company and Avidbank Corporate Finance, a division of Avidbank (“Avidbank”) entered into a Fifteenth Amendment (the “Amendment”) to the Loan and Security Agreement (as amended, the “Avidbank Loan Agreement”) previously entered into between them. The Avidbank Loan Agreement provided for a secured asset-based revolving line of credit facility (the “Avidbank Line of Credit”) of up to $7.0 million. The outstanding balance of the amounts advanced under the Avidbank Line of Credit bear interest at 2% above the prime rate as published in The Wall Street Journal or five percent (5%), whichever is higher. Avidbank also made a three-year term loan to the Company in the principal amount of $3.0 million (the “Term Loan”). The Term Loan was used by the Company to repay to Avidbank an advance that had been made to the Company under the Avidbank Line of Credit in December 2015, and which had been used by the Company to pay for the VendScreen business. The Term Loan provides that interest only is payable monthly during year one, interest and principal is payable monthly during years two and three, and all outstanding principal and accrued interest is due and payable on the third anniversary of the Term Loan. The Term Loan bears interest at an annual rate equal to 1.75% above the prime rate as published from time to time by The Wall Street Journal, or five percent (5%), whichever is higher. The Amendment increased the amount available under the Avidbank Line of Credit to $7.5 million less the amount then outstanding under the Term Loan.
On March 29, 2016, the Company entered into a Loan and Security Agreement and other ancillary documents (the “Heritage Loan Documents”) with Heritage Bank of Commerce (“Heritage Bank”), providing for a secured asset-based revolving line of credit in an amount of up to $12.0 million (the “Heritage Line of Credit”).
The Company utilized approximately $7.0 million under the Heritage Line of Credit to satisfy the existing Avidbank Line of Credit and related Term Loan, and approximately $80 thousand under the Heritage Line of Credit to pay closing fees, recorded as a debt discount, of Heritage Bank. The amount of advances remaining available to the Company under the Heritage Line of Credit as of June 30, 2016 was approximately $4.8 million.
The Heritage Loan Documents provide that the aggregate amount of advances under the Heritage Line of Credit shall not exceed the lesser of (i) $12.0 million, or (ii) eighty-five percent (85%) of license and transaction fee revenue (as is reflected as such in the Company’s consolidated statement of operations) for the preceding three (3) calendar months.
USA Technologies, Inc.
Notes to Consolidated Financial Statements
9. LINE OF CREDIT (CONTINUED)
The outstanding daily balance of the amounts advanced under the Heritage Line of Credit will bear interest at 2.25% above the prime rate as published from time to time in The Wall Street Journal. At June 30, 2016, this prime rate was 3.50%. Interest is payable by the Company to Heritage Bank on a monthly basis.
The Heritage Line of Credit and the Company’s obligations under the Heritage Loan Documents are secured by substantially all of the Company’s assets, including its intellectual property.
The maturity date of the Heritage Line of Credit is March 29, 2017. At the time of maturity, all outstanding advances under the Heritage Line of Credit as well as any unpaid interest are due and payable. Prior to maturity of the Heritage Line of Credit, the Company may prepay amounts due under the Heritage Line of Credit without penalty, and subject to the terms of the Heritage Loan Documents, may re-borrow any such amounts.
The Heritage Loan Documents contain customary representations and warranties and affirmative and negative covenants applicable to the Company. The Heritage Loan Documents also require the Company to achieve a minimum Adjusted EBITDA, as defined in the Heritage Loan Documents, measured on a quarterly basis. The Heritage Loan Documents also require that the number of the Company’s connections as of the end of each fiscal quarter shall not decrease by more than five percent as compared to the number of the Company’s connections as of the end of the immediately prior fiscal quarter. As of June 30, 2016, the Company was not in compliance with the minimum Adjusted EBITDA provision of the debt covenant. The Company received a waiver from its bank for the covenant default.
The Heritage Loan Documents also contain customary events of default, including, among other things, payment defaults, breaches of covenants, and bankruptcy and insolvency events, subject to grace periods in certain instances. Upon an event of default, Heritage Bank may declare all of the outstanding obligations of the Company under the Heritage Line of Credit and Heritage Loan Documents to be immediately due and payable, and exercise any other rights provided for under the Heritage Loan Documents, including foreclosing on the collateral securing the Heritage Loan Documents. In connection with the Heritage Loan Documents, the Company issued to Heritage Bank warrants to purchase up to 23,978 shares of common stock of the Company at an exercise price of $5.00 per share. The warrants are exercisable at any time through March 29, 2021 subject to earlier termination in the event of a business combination (as defined in the Heritage Loan Documents).
The fair value of the warrants of $52 thousand was charged against the current obligation under the line of credit and amortized as interest expense on a straight-line basis over 12 months. The Black-Sholes method was used to calculate fair value of the warrants.
The balance due on the Heritage line of credit was $7.2 million at June 30, 2016 and the balance due on the Avidbank line of credit was $4.0 million at June 30, 2015. As of June 30, 2016, $4.8 million was available under our line of credit.
|
($ in thousands)
|
For year ended
June 30, |
|||||||
|
2016
|
2015
|
|||||||
|
Principal balance at period-end
|
$
|
7,217
|
$
|
4,000
|
||||
|
Unamortized discount
|
(98
|
)
|
-
|
|||||
|
Line of credit, net
|
$
|
7,119
|
$
|
4,000
|
||||
|
Maximum amount outstanding at any month end
|
$
|
7,217
|
$
|
5,000
|
||||
|
Average balance outstanding during the period
|
$
|
4,959
|
$
|
4,100
|
||||
|
Weighted-average interest rate:
|
||||||||
|
As of the period-end
|
5.8
|
%
|
5.3
|
%
|
||||
|
Paid during the period
|
5.5
|
%
|
5.3
|
%
|
||||
Interest expense on the Line of Credit was approximately $260 thousand, $211 thousand and $221 thousand during each of the years ended June 30, 2016, 2015 and 2014 respectively.
USA Technologies, Inc.
Notes to Consolidated Financial Statements
10. LONG-TERM DEBT
ASSIGNMENT OF QUICKSTART LEASES
In February and May 2015, the Company assigned its interest in certain finance receivables (various 60 month QuickStart leases) to third-party finance companies in exchange for cash and the assumption of financing obligations in the aggregate of $1.8 million and $304 thousand, respectively. These assignment transactions contain recourse provisions for the Company which requires the proceeds from the assignment to be treated as long-term debt. The financing obligations range in rate from 9.4% to 9.5%.
CAPITAL LEASE OBLIGATIONS
The Company periodically enters into capital lease obligations to finance certain office and network equipment for use in its daily operations. During the year periods ended June 30, 2016, 2015 and 2014, the Company entered into capital lease obligations of $444 thousand, $108 thousand and $325 thousand, respectively. The interest rates on these obligations ranged from approximately 5.6% to 9.0%. The lease terms range from 2 to 5 years. The value of the acquired equipment is included in property and equipment and depreciated over the applicable estimated useful lives accordingly.
The balance of long-term debt as of June 30, 2016 and June 30, 2015 are shown in the table below.
|
($ in thousands)
|
June 30,
2016 |
June 30,
2015 |
||||||
|
Assignment of QuickStart Leases
|
$
|
1,600
|
$
|
1,994
|
||||
|
Capital lease obligations
|
605
|
338
|
||||||
|
$
|
2,205
|
$
|
2,332
|
|||||
|
Less current portion
|
629
|
478
|
||||||
|
$
|
1,576
|
$
|
1,854
|
|||||
The maturities of long-term debt for each of the fiscal years following June 30, 2016 are as follows:
|
($ in thousands)
|
||||
|
2017
|
$
|
629
|
||
|
2018
|
625
|
|||
|
2019
|
588
|
|||
|
2020
|
358
|
|||
|
2021
|
5
|
|||
|
$
|
2,205
|
|||
USA Technologies, Inc.
Notes to Consolidated Financial Statements
11. FAIR VALUE OF FINANCIAL INSTRUMENTS
In accordance with the fair value hierarchy described in Note 2, the following table shows the fair value of the Company’s financial instruments that are required to be measured at fair value as of June 30, 2016 and 2015:
|
($ in thousands)
June 30, 2016 |
Level 1
|
Level 2
|
Level 3
|
Total
|
||||||||||||
|
Common stock warrant liability, 2.2 million warrants exercisable at $2.6058 from September 17, 2011 through September 17, 2016
|
$
|
-
|
$
|
-
|
$
|
3,739
|
$
|
3,739
|
||||||||
|
June 30, 2015
|
Level 1
|
Level 2
|
Level 3
|
Total
|
||||||||||||
|
Common stock warrant liability, 3.9 million warrants exercisable at $2.6058 from September 17, 2011 through September 17, 2016
|
$
|
-
|
$
|
-
|
$
|
978
|
$
|
978
|
||||||||
As of June 30, 2016 and June 30, 2015, the Company held no Level 1 or Level 2 financial instruments.
As of June 30, 2016 and 2015 fair values of the Company’s Level 3 financial instrument totaled $3,739 million and $978 thousand for 2.2 million and 3.9 million warrants, respectively. The level 3 financial instrument consists of common stock warrants issued by the company in March 2011, which include features requiring liability treatment of the warrants. The fair value of warrants issued March 2011 to purchase shares of the Company's common stock is based on valuations performed by an independent third party valuation firm. The fair value was determined using proprietary valuation models using the quality of the underlying securities of the warrants, restrictions on the warrants and security underlying the warrants, time restrictions and precedent sale transactions completed on the secondary market or in other private transactions. There were no transfer of assets or liabilities between level 1, level 2, or level 3 during the years ended June 30, 2016 and 2015.
|
($ in thousands)
|
For Year Ended
June 30, |
|||||||
|
2016
|
2015
|
|||||||
|
Beginning balance
|
$
|
(978
|
)
|
$
|
(585
|
)
|
||
|
Increase due to change in fair value of warrant liabilities
|
(5,674
|
)
|
(393
|
)
|
||||
|
Reduction due to warrant exercises
|
2,913
|
-
|
||||||
|
Ending balance
|
$
|
(3,739
|
)
|
$
|
(978
|
)
|
||
12. WARRANTS
All warrants outstanding as of June 30, 2016 were exercisable. The following table shows exercise prices and expiration dates for warrants outstanding as of June 30, 2016:
|
Warrants
Outstanding |
Exercise
Price |
Expiration
Date |
||||
|
2,376,675
|
$
|
2.61
|
September 18, 2016
|
|||
|
45,000
|
$
|
2.10
|
December 31, 2017
|
|||
|
23,978
|
$
|
5.00
|
March 29, 2021
|
|||
|
2,445,653
|
||||||
USA Technologies, Inc.
Notes to Consolidated Financial Statements
12. WARRANTS (CONTINUED)
Warrant activity for the years ended June 30, 2016, 2015, and 2014 was as follows:
|
Warrants
|
||||
|
Outstanding at June 30, 2013
|
7,361,708
|
|||
|
Issued
|
-
|
|||
|
Exercised
|
(2,090,226
|
)
|
||
|
Expired
|
(962,482
|
)
|
||
|
Outstanding at June 30, 2014
|
4,309,000
|
|||
|
Issued
|
-
|
|||
|
Exercised
|
-
|
|||
|
Expired
|
-
|
|||
|
Outstanding at June 30, 2015
|
4,309,000
|
|||
|
Issued
|
23,978
|
|||
|
Exercised
|
(1,887,325
|
)
|
||
|
Expired
|
-
|
|||
|
Outstanding at June 30, 2016
|
2,445,653
|
|||
On May 12, 2010, in conjunction with a public offering, the Company issued warrants to purchase 2.8 million shares of Common Stock, exercisable at $1.13 per share at any time prior to December 31, 2013. During the year ended June 30, 2014, 2.1 million of these warrants were exercised at $1.13 per share for cash proceeds of $2.4 million. Warrants to purchase 59 thousand shares of Common Stock expired unexercised on December 31, 2013.
In conjunction with this public offering, the Company also issued to the placement agent warrants to purchase 165,207 and 15,717 shares of Common Stock, exercisable at $1.13 per share at any time prior to May 12, and July 7, 2013, respectively. During the year ended June 30, 2013 the placement agent elected cashless exercises of 36,186 warrants resulting in the issuance of 17,094 shares of Common Stock and exercised warrants to purchase 13,216 shares of Common Stock at $1.13 per share for cash proceeds of $14,934. Warrants to purchase 1,258 shares of Common Stock expired unexercised in May 2013.
On March 17, 2011, in conjunction with a private placement offering the Company issued warrants to purchase up to 4.3 million shares of Common Stock, exercisable at $2.6058 per share. The 4.3 million warrants are exercisable from September 18, 2011 through September 17, 2016. During the year ended June 30, 2016, approximately 1.9 million warrants were exercised under this offering for cash proceeds of approximately $4.92 million. The balance of exercisable warrants as of June 30, 2016 is 2.4 million.
3.9 million of the warrants issued under this private placement offering contain a provision that if a Fundamental Transaction occurs, notably a change in control, the warrant holder may require the Company to pay the Black-Scholes calculated value of the then unexercised warrant to the warrant holder in cash. As such the Company has recorded a liability of $3.7 million and $978 thousand at June 30, 2016 and 2015, respectively, for the estimated fair value of the warrants in its Consolidated Balance Sheet (see Note 11-Fair Value of Financial Instruments). Period to period changes in the fair value of these warrants are reflected through income.
In conjunction with the Loan and Security agreement (Note 9 – Line of Credit) and as a condition of the Bank entering into the First Amendment, the Company issued to the Bank warrants to purchase up to 45 thousand shares of Common Stock of the Company. The warrants are exercisable at any time prior to December 31, 2017 at an exercise price of $2.10 per share. Upon issuance, the fair value of the warrants was $55 thousand using a Black Scholes model, which was recorded as prepaid interest and included in other assets on the Consolidated Balance Sheet, and was amortized as non-cash interest expense over the remaining term of the Line of Credit as amended in January 2013. Non-cash interest of $2 thousand was recognized for the year ended June 30, 2014 relating to these warrants. As of June 30, 2016 none of these warrants have been exercised.
On March 29, 2016, the Company entered into a Loan and Security Agreement with a secondary bank (Note 9 – Line of Credit), providing a secured asset-based revolving line of credit in an amount of up to $12 million. In conjunction with the Loan and Security Agreement the company issued to the bank warrants to purchase up to 24 thousand shares of Common Stock of the Company. The warrants are exercisable at any time prior to March 29, 2021 at an exercise price of $5.00 per share. At the time of issuance the fair value of the warrants was estimated at $52 thousand using a Black Scholes model. This was recorded as a contra -debt item and is included in the line of credit on the Consolidated Balance Sheet, and is being amortized as a non-cash interest expense over the remaining term of the Line of Credit. Non-cash interest expense of $13 thousand has been recognized for the year ending June 30, 2016 related to this warrant.
USA Technologies, Inc.
Notes to Consolidated Financial Statements
13. INCOME TAXES
The Company has significant deferred tax assets, a substantial amount of which result from operating loss carryforwards. The Company routinely evaluates its ability to realize the benefits of these assets to determine whether it is more likely than not that such benefit will be realized. In periods prior to the year ended June 30, 2014, the Company’s evaluation of its ability to realize the benefit from its deferred tax assets resulted in a full valuation allowance against such assets. Based upon earnings performance that the Company had achieved along with the belief that such performance will continue into future years, the Company determined during the year ended June 30, 2014 that it was more likely than not that a substantial portion of its deferred tax assets would be realized with approximately $64 million of its operating loss carryforwards being utilized to offset corresponding future years’ taxable income resulting in a reduction in its valuation allowances recorded in prior years.
In addition to considering recent periods’ performance, the evaluation of the amount of deferred tax assets expected to be realized involves forecasting the amount of taxable income that will be generated in future years. The number of connections added in a service year is a key metric which, in the Company’s recurring revenue service model, becomes an important ingredient in driving future growth and earnings. The Company has forecasted future results using estimates that management believes to be achievable. With respect to its forecasts, the Company also has taken into account several industry analysts who have projected that demand for technology and services similar to the Company’s will continue to grow in the markets the Company serves.
If in future periods the Company demonstrates its ability to grow taxable income in excess of the forecasts it has used, it will re-evaluate the need to keep some, or all, of the remaining valuation allowances of approximately $23 million on its deferred tax assets.
The benefit (provision) for income taxes for the years ended June 30, 2016, 2015 and 2014 is comprised of the following:
|
($ in thousands)
|
2016
|
2015
|
2014
|
|||||||||
|
Current:
|
||||||||||||
|
Federal
|
$
|
(7
|
)
|
$
|
(58
|
)
|
$
|
(21
|
)
|
|||
|
State
|
(38
|
)
|
(6
|
)
|
-
|
|||||||
|
(45
|
)
|
(64
|
)
|
(21
|
)
|
|||||||
|
Deferred:
|
||||||||||||
|
Federal
|
407
|
365
|
20,970
|
|||||||||
|
State
|
253
|
(590
|
)
|
6,306
|
||||||||
|
660
|
(225
|
)
|
27,276
|
|||||||||
|
$
|
615
|
$
|
(289
|
)
|
$
|
27,255
|
||||||
The provision for income taxes for the year ended June 30, 2015 includes $396 thousand for the state and federal income tax effects of a decrease in the applicable state tax rate used to tax effect deferred tax assets caused by a state income tax law change.
A reconciliation of the benefit (provision) for income taxes for the years ended June 30, 2016, 2015 and 2014 to the indicated benefit (provision) based on income (loss) before benefit (provision) for income taxes at the federal statutory rate of 34% is as follows:
|
($ in thousands)
|
2016
|
2015
|
2014
|
|||||||||
|
Indicated benefit (provision) at federal statutory rate of 34%
|
$
|
2,523
|
$
|
272
|
$
|
(94
|
)
|
|||||
|
Effects of permanent differences
|
(2,040
|
(A)
|
(215
|
)
|
(8
|
)
|
||||||
|
State income taxes, net of federal benefit
|
199
|
(410
|
)
|
(18
|
)
|
|||||||
|
Income tax credits
|
70
|
40
|
-
|
|||||||||
|
Changes related to prior years
|
-
|
187
|
-
|
|||||||||
|
Changes in valuation allowances
|
(137
|
(163
|
)
|
27,375
|
||||||||
|
$
|
615
|
$
|
(289
|
)
|
$
|
27,255
|
||||||
| (A) |
Increase in the effects of permanent differences due to the tax effect of the change in fair value of warrant liabilities in 2016
|
USA Technologies, Inc.
Notes to Consolidated Financial Statements
13. INCOME TAXES (CONTINUED)
At June 30, 2016 the Company had federal operating loss carryforwards of approximately $162 million to offset future taxable income expiring through approximately 2036. The timing and extent to which the Company can utilize operating loss carryforwards in any year may be limited by provisions of the Internal Revenue Code regarding changes in ownership of corporations (i.e. IRS Code Section 382). The changes in ownership limitations under IRS Code Section 382 have had the effect of limiting the maximum amount of operating loss carryforwards as of June 30, 2016 available for use to offset future years’ taxable income to approximately $124 million. Those operating loss carryforwards start to expire June 30, 2022.
The net deferred tax assets arose primarily from net operating loss carryforwards, as well as the use of different accounting methods for financial statement and income tax reporting purposes as follows:
|
June 30,
|
||||||||
|
($ in thousands)
|
2016
|
2015
|
||||||
|
Deferred tax assets:
|
||||||||
|
Net operating loss carryforwards
|
$
|
46,691
|
$
|
46,919
|
||||
|
Asset reserves
|
1,713
|
792
|
||||||
|
Deferred research and development costs
|
1,356
|
1,009
|
||||||
|
Intangibles
|
539
|
606
|
||||||
|
Deferred gain on assets under sale-leaseback transaction
|
331
|
632
|
||||||
|
Stock-based compensation
|
377
|
224
|
||||||
|
Other
|
379
|
437
|
||||||
|
51,386
|
50,619
|
|||||||
|
Deferred tax liabilities:
|
||||||||
|
Fixed assets
|
(528
|
)
|
(492
|
)
|
||||
|
Intangibles and goodwill
|
-
|
(84
|
)
|
|||||
|
Deferred tax assets, net
|
50,858
|
50,043
|
||||||
|
Valuation allowance
|
(23,134
|
)
|
(22,997
|
)
|
||||
|
Deferred tax assets (liabilties), net of allowance
|
27,724
|
27,046
|
||||||
|
Less current portion
|
2,271
|
1,258
|
||||||
|
Deferred tax assets (liabilties), non-current
|
$
|
25,453
|
$
|
25,788
|
||||
14. STOCK BASED COMPENSATION PLANS
The Company has three active stock based compensation plans at June 30, 2016 as shown in the table below:
|
Date Approved
|
Name of Plan
|
Type of Plan
|
Authorized
Shares
|
|||||
|
June 2013
|
2013 Stock Incentive Plan
|
Stock
|
500,000
|
|||||
|
June 2014
|
2014 Stock Option Incentive Plan
|
Stock Options
|
750,000
|
|||||
|
June 2015
|
2015 Equity Incentive Plan
|
Stock & Stock Options
|
1,250,000
|
|||||
|
2,500,000
|
||||||||
USA Technologies, Inc.
Notes to Consolidated Financial Statements
14. STOCK BASED COMPENSATION PLANS (CONTINUED)
As of June 30, 2016, the Company had reserved shares of Common Stock for future issuance for the following:
|
Exercise of Common Stock Warrants
|
2,445,653
|
|||
|
Conversions of Preferred Stock and cumulative Preferred Stock dividends
|
99,999
|
|||
|
Issuance under 2013 Stock Incentive Plan
|
162,330
|
|||
|
Issuance under 2014 Stock Option Incentive Plan
|
737,215
|
|||
|
Issuance under 2015 Stock Incentive Plan
|
1,250,000
|
|||
|
Issuance to former Chief Executive Officer upon the occurrence of a USA Transaction
|
140,000
|
|||
|
Total shares reserved for future issuance
|
4,835,197
|
STOCK OPTIONS
The Company estimates the grant date fair value of the stock options it grants using a Black-Scholes valuation model. The Company’s assumption for expected volatility is based on its historical volatility data related to market trading of its own common stock. The Company bases its assumptions for expected life of the new stock option grants on the life of the option granted, and if relevant, its analysis of the historical exercise patterns of its stock options. The dividend yield assumption is based on dividends expected to be paid over the expected life of the stock option. The risk-free interest rate assumption is determined by using the U.S. Treasury rates of the same period as the expected option term of each stock option.
|
Year Ended
June 30, 2016 |
Year ended
June 30, 2015 |
Year ended
June 30, 2014 |
||||||||||
|
Expected volatility
|
59-66
|
%
|
78-79
|
%
|
79
|
%
|
||||||
|
Expected life
|
4.5 years
|
7 years
|
7 years
|
|||||||||
|
Expected dividends
|
0.00
|
%
|
0.00
|
%
|
0.00
|
%
|
||||||
|
Risk-free interest rate
|
1.46-1.49
|
%
|
1.59-2.04
|
%
|
2.22
|
%
|
||||||
The 2014 Stock Option Incentive Plan was approved in June 2014 therefore there was no stock based compensation expense related to stock options for the years ended June 30, 2014. Stock based compensation related to stock options for the years ended June 30, 2016 and June 30, 2015 was $338 and $370 thousand respectively. Unrecognized compensation related to stock option grants as of June 30, 2016 and June 30, 2015 was $167 thousand and $297 thousand respectively.
The following table provides information about outstanding options:
|
For the Twelve Months Ended June 30,
|
||||||||||||||||||||||||
|
2016
|
2015
|
2014
|
||||||||||||||||||||||
|
Shares
|
Weighted
Average Grant
Date Fair Value
|
Shares
|
Weighted
Average Grant
Date Fair Value
|
Shares
|
Weighted
Average Grant
Date Fair Value
|
|||||||||||||||||||
|
Outstanding options, beginning of period
|
538,888
|
$
|
1.32
|
120,000
|
$
|
1.49
|
-
|
-
|
||||||||||||||||
|
Granted
|
199,586
|
$
|
1.63
|
438,888
|
$
|
1.30
|
120,000
|
$
|
1.49
|
|||||||||||||||
|
Forfeited
|
(95,000
|
)
|
$
|
1.80
|
(20,000
|
)
|
$
|
1.49
|
-
|
-
|
||||||||||||||
|
Excercised
|
(33,333
|
)
|
$
|
1.27
|
||||||||||||||||||||
|
Outstanding options, end of period
|
610,141
|
$
|
1.35
|
538,888
|
$
|
1.33
|
120,000
|
$
|
1.49
|
|||||||||||||||
The following table provides information related to options as of June 30, 2016:
|
Options Outstanding
|
Options Exercisable
|
|||||||||||||||||||||
|
Range of Exercise Prices
|
Options Outstanding
|
Remaining Contractual
Life
|
Shares Exercisable
|
Remaining Contractual
Life
|
Weighted Average
Exercise Price
|
|||||||||||||||||
|
$
|
1.62 to $1.68
|
75,000
|
5.51
|
25,002
|
5.51
|
1.65
|
||||||||||||||||
|
$
|
1.80
|
295,555
|
5.16
|
195,555
|
5.16
|
1.8
|
||||||||||||||||
|
$
|
2.05
|
100,000
|
4.97
|
66,670
|
4.97
|
2.05
|
||||||||||||||||
|
$
|
2.09
|
10,000
|
5.58
|
3,333
|
5.58
|
2.09
|
||||||||||||||||
|
$
|
2.75
|
25,000
|
5.77
|
8,333
|
5.77
|
2.75
|
||||||||||||||||
|
$
|
2.94
|
75,000
|
6.53
|
-
|
-
|
-
|
||||||||||||||||
|
$
|
3.38
|
29,586
|
6.06
|
-
|
-
|
-
|
||||||||||||||||
|
610,141
|
5.42
|
298,893
|
5.17
|
1.87
|
||||||||||||||||||
USA Technologies, Inc.
Notes to Consolidated Financial Statements
14. STOCK BASED COMPENSATION PLANS (CONTINUED)
The following table provides information about unvested options:
|
For the Twelve Months Ended June 30,
|
||||||||||||||||||||||||
|
2016
|
2015
|
2014
|
||||||||||||||||||||||
|
Shares
|
Weighted
Average Grant
Date Fair Value
|
Shares
|
Weighted
Average Grant
Date Fair Value
|
Shares
|
Weighted
Average Grant
Date Fair Value
|
|||||||||||||||||||
|
Unvested options, beginning of period
|
505,553
|
$
|
1.32
|
120,000
|
$
|
1.49
|
-
|
-
|
||||||||||||||||
|
Granted
|
199,586
|
$
|
1.63
|
438,888
|
$
|
1.30
|
120,000
|
$
|
1.49
|
|||||||||||||||
|
Vested
|
(298,891
|
)
|
$
|
1.31
|
(33,335
|
)
|
$
|
1.49
|
-
|
-
|
||||||||||||||
|
Forfeited
|
(95,000
|
)
|
$
|
1.80
|
(20,000
|
)
|
$
|
1.49
|
-
|
-
|
||||||||||||||
|
Unvested options, end of period
|
311,248
|
$
|
1.39
|
505,553
|
$
|
1.32
|
120,000
|
$
|
1.49
|
|||||||||||||||
The following table provides information about options outstanding and exercisable options:
|
As of June 30,
|
||||||||||||||||||||||||
|
2016
|
2015
|
2014
|
||||||||||||||||||||||
|
Options
Outstanding
|
Exercisable
Options
|
Options
Outstanding
|
Exercisable
Options
|
Options
Outstanding
|
Exercisable
Options
|
|||||||||||||||||||
|
Number
|
610,141
|
298,893
|
538,888
|
33,335
|
120,000
|
-
|
||||||||||||||||||
|
Weighted average exercise price
|
$
|
2.07
|
$
|
1.87
|
$
|
1.86
|
$
|
2.05
|
$
|
2.05
|
-
|
|||||||||||||
|
Aggregate intrinsic value
|
$
|
1,341,828
|
$
|
717,343
|
$
|
451,177
|
$
|
21,668
|
$
|
7,200
|
-
|
|||||||||||||
|
Weighted average contractual term
|
$
|
5.42
|
5.17
|
6.21
|
5.97
|
6.97
|
-
|
|||||||||||||||||
|
Share price as of June 30
|
$
|
4.27
|
$
|
4.27
|
$
|
2.70
|
$
|
2.70
|
$
|
2.11
|
$
|
2.11
|
||||||||||||
STOCK GRANTS
A summary of the status of the Company’s nonvested common shares as of June 30, 2016, 2015, and 2014, and changes during the years then ended is presented below:
|
Shares
|
Weighted-Average
Grant-Date |
|||||||
|
Nonvested at June 30, 2013
|
97,146
|
$
|
1.52
|
|||||
|
Granted
|
10,000
|
2.17
|
||||||
|
Vested
|
(55,001
|
)
|
1.62
|
|||||
|
Forfeited, Director changes
|
(3,334
|
)
|
0.94
|
|||||
|
Forfeited, Employee shares not earned
|
(5,000
|
)
|
1.52
|
|||||
|
Nonvested at June 30, 2014
|
43,811
|
$
|
1.59
|
|||||
|
Granted
|
155,927
|
2.00
|
||||||
|
Vested
|
(181,134
|
)
|
1.89
|
|||||
|
Nonvested at June 30, 2015
|
18,604
|
$
|
1.88
|
|||||
|
Granted
|
131,558
|
3.04
|
||||||
|
Vested
|
(21,664
|
)
|
2.70
|
|||||
|
Nonvested at June 30, 2016
|
128,498
|
$
|
2.97
|
|||||
USA Technologies, Inc.
Notes to Consolidated Financial Statements
15. PREFERRED STOCK
The authorized Preferred Stock may be issued from time to time in one or more series, each series with such rights, preferences or restrictions as determined by the Board of Directors. As of June 30, 2016 each share of Series A Preferred Stock is convertible into 0.194 of a share of Common Stock and each share of Series A Preferred Stock is entitled to 0.194 of a vote on all matters on which the holders of Common Stock are entitled to vote. Series A Preferred Stock provides for an annual cumulative dividend of $1.50 per share, payable when, and if declared by the Board of Directors, to the shareholders of record in equal parts on February 1 and August 1 of each year. Any and all accumulated and unpaid cash dividends on the Series A Preferred Stock must be declared and paid prior to the declaration and payment of any dividends on the Common Stock.
The Series A Preferred Stock may be called for redemption at the option of the Board of Directors for a price of $11.00 per share plus payment of all accrued and unpaid dividends. No such redemption has occurred as of June 30, 2016. In the event of any liquidation as defined in the Company’s Articles of Incorporation, the holders of shares of Series A Preferred Stock issued shall be entitled to receive $10.00 for each outstanding share plus all cumulative unpaid dividends. If funds are insufficient for this distribution, the assets available will be distributed ratably among the preferred shareholders. The Series A Preferred Stock liquidation preference as of June 30, 2016 and 2015 is as follows:
|
($ in thousands)
|
June 30,
2016 |
June 30,
2015 |
||||||
|
For Shares outstanding at $10.00 per share
|
$
|
4,451
|
$
|
4,451
|
||||
|
Cumulative unpaid dividends
|
13,657
|
12,989
|
||||||
|
$
|
18,108
|
$
|
17,440
|
|||||
Cumulative unpaid dividends are convertible into common shares at $1,000 per common share at the option of the shareholder. During the years ended June 30, 2016, 2015 and 2014, no shares of Preferred Stock nor cumulative preferred dividends were converted into shares of common stock.
16. RETIREMENT PLAN
The Company’s 401(k) Plan (the “Retirement Plan”) allows employees who have completed six months of service to make voluntary contributions up to a maximum of 100% of their annual compensation, as defined in the Retirement Plan. The Company may, in its discretion, make a matching contribution, a profit sharing contribution, a qualified non-elective contribution, and/or a safe harbor 401(k) contribution to the Retirement Plan. The Company must make an annual election, at the beginning of the plan year, as to whether it will make a safe harbor contribution to the plan. In fiscal years 2016, 2015 and 2014, the Company elected and made a safe harbor matching contributions of 100% of the participant’s first 3% and 50% of the next 2% of compensation deferred into the Retirement Plan. The Company’s safe harbor contributions for the years ended June 30, 2016, 2015 and 2014 approximated $189 thousand, $192 thousand and $168 thousand, respectively.
17. RELATED PARTY TRANSACTIONS
There were no related party transactions during the years ended June 30, 2016, 2015 and 2014.
18. COMMITMENTS AND CONTINGENCIES
SALE AND LEASEBACK TRANSACTIONS
In June 2014, the Company and a third party finance company, entered into six Sale Leaseback Agreements (the “Sale Leaseback Agreements” or a “Sale Leaseback Agreement”) pursuant to which a third-party finance company purchased ePort equipment owned by the Company and used by the Company in its JumpStart Program. As of June 30, 2014, a third-party finance company completed the purchase from the Company, the ePort equipment under the first two of the Sale Leaseback Agreements.
USA Technologies, Inc.
Notes to Consolidated Financial Statements
18. COMMITMENTS AND CONTINGENCIES (CONTINUED)
In the quarter ended September 2014, a third-party finance company completed the purchase from the Company of the ePort equipment described in the last four of the Sale Leaseback Agreements. Upon the completion of the sale under these agreements, the Company computed a gain on the sale of its ePort equipment, which is deferred and will be amortized in proportion to the related gross rental charged to expense over the lease terms in accordance with the FASB topic ASC 840-40, “Sale Leaseback Transactions”. The computed gain on the sale will be recognized ratably over the 36-month term and charged as a reduction to the Company’s JumpStart rent expense included in costs of services in the Company’s Consolidated Statement of Operations. The Company is accounting for the Sale Leaseback as an operating lease and is obligated to pay to Varilease a base monthly rental for this equipment during the 36-month lease term. The future lease payment obligations under these agreements are included in the table at the bottom of this note.
Upon the completion of the sales, the Company computed gains on the sale of its ePort equipment as follows:
|
($ in thousands)
|
Year ended June 30,
|
|||
|
2015
|
||||
|
Rental equipment sold, cost
|
$
|
3,873
|
||
|
Rental equipment sold, accumulated depreciation upon sale
|
(331
|
)
|
||
|
Rental equipment sold, net book value
|
3,542
|
|||
|
Proceeds from sale
|
4,994
|
|||
|
Gain on sale of rental equipment
|
$
|
1,452
|
||
In accordance with the FASB topic ASC 840-40, “Sale Leaseback Transactions”, any gain shall be deferred and shall be amortized in proportion to the related gross rental charged to expense over the lease term. The computed gain on the sale will be recognized ratably over the 36 month term and charged as a reduction to the Company’s JumpStart rent expense included in costs of services in the Company’s Consolidated Statement of Operations. For the years ended June 30, 2016 and 2015 the Company recognized gains as follows:
|
($ in thousands)
|
Year ended June 30,
|
|||||||
|
2016
|
2015
|
|||||||
|
Beginning balance
|
$
|
1,760
|
$
|
1,142
|
||||
|
Gain on sale of rental equipment
|
-
|
1,452
|
||||||
|
Recognition of deferred gain
|
(860
|
)
|
(834
|
)
|
||||
|
Ending balance
|
900
|
1,760
|
||||||
|
Less current portion
|
860
|
860
|
||||||
|
Non-current portion of deferred gain
|
$
|
40
|
$
|
900
|
||||
USA Technologies, Inc.
Notes to Consolidated Financial Statements
18. COMMITMENTS AND CONTINGENCIES (CONTINUED)
OTHER LEASES
Other lease commitments include leases for its operations from various facilities. The Company leases space located in Malvern, Pennsylvania for its principal executive office and used for general administrative functions, sales activities, product development, and customer support. In April 2016, the Company entered into a Third Amendment to Office Space Lease (the “Third Amendment”) which amended certain terms of its existing lease (the “Lease”) for its Malvern, Pennsylvania executive offices consisting of approximately 17,249 square feet located on the first floor of the building (the “Current Premises”). The Third Amendment provides that the Company will relocate from the Current Premises to new offices located on the third floor of the building (the “New Offices”) consisting of approximately 17,689 square feet. Substantially all of the improvements to the New Offices will be constructed by the landlord at the landlord’s cost and expense. When the New Offices are substantially completed, the Company would relocate from the Current Premises to the New Premises (the “New Premises Commencement Date”). The Third Amendment provides that the term of the Lease is extended from the prior expiration date of April 30, 2016 until seven years following July 1, 2016 (the” New Premises Commencement Date”). The Company’s monthly base rent for the premises will increase from approximately $32 thousand to $36 thousand on the New Premises Commencement Date, and will increase each year thereafter up to a maximum monthly base rent of approximately $41 thousand. The Third Amendment also grants to the Company the option to extend the term of the Lease for an additional five year period with a minimum of one year advance notice prior to the expiration of the initial term, and provides certain rights of first offer on additional space located on the third floor of the building. The straight-line rent expense for this office is approximately $38 thousand per month for the duration of the lease.
The Company leases space in Malvern, Pennsylvania for its product warehousing and shipping support. In March 2016, the Company extended its lease from March 1, 2016 through February 29, 2019. The lease includes monthly rental payments of $5 thousand. Beginning in March 2016 the straight-line rent expense for this operations site is approximately $5 thousand per month for the duration of the lease period.
The Company leases space in Portland, Oregon related to its VendScreen acquisition. The current lease consists of approximately 9,319 square feet. The lease includes monthly rental payments of $20 thousand and will terminate on September 30, 2016. The Company is currently negotiating a new lease for space related to this facility.
Rent expense under operating leases was approximately $479 thousand, $354 thousand and $372 thousand during the years ended June 30, 2016, 2015, and 2014, respectively.
SUMMARY OF LEASE OBLIGATIONS
Future minimum lease payments for fiscal years subsequent to June 30, 2016 under non-cancellable operating leases and capital leases are as follows:
|
($ in thousands)
|
Operating Leases
from Sale Leaseback |
Other Operating
Leases |
Total Operating
Leases |
Capital
Leases |
||||||||||||
|
2017
|
$
|
2,641
|
$
|
552
|
$
|
3,193
|
$
|
299
|
||||||||
|
2018
|
138
|
503
|
641
|
236
|
||||||||||||
|
2019
|
-
|
498
|
498
|
142
|
||||||||||||
|
2020
|
-
|
459
|
459
|
-
|
||||||||||||
|
2021
|
-
|
468
|
468
|
-
|
||||||||||||
|
Thereafter
|
-
|
963
|
963
|
-
|
||||||||||||
|
Total minimum lease payments
|
$
|
2,779
|
$
|
3,443
|
$
|
6,222
|
$
|
677
|
||||||||
|
Less Amount Representing interest
|
72
|
|||||||||||||||
|
Present Value of net minimum lease payments
|
605
|
|||||||||||||||
|
Less Current obligations under capital leases
|
255
|
|||||||||||||||
|
Obligations under capital leases, less current portion
|
$
|
350
|
||||||||||||||
USA Technologies, Inc.
Notes to Consolidated Financial Statements
18. COMMITMENTS AND CONTINGENCIES (CONTINUED)
LITIGATION
As previously reported, on October 1, 2015, a purported class action was filed in the United States District Court for the Eastern District of Pennsylvania against the Company and its executive officers alleging violations under the Securities Exchange Act of 1934. On December 15, 2015, the court appointed a lead plaintiff, and on January 18, 2016, the plaintiff filed an amended complaint that set forth the same causes of action and requested substantially the same relief as the original complaint. On February 1, 2016, the Company filed a motion to dismiss the amended complaint. On April 11, 2016, the Court held oral argument on the Company’s motion, and on April 14, 2016, the Court issued an order granting the Company’s motion to dismiss the amended complaint without leave to amend. On May 13, 2016, the plaintiff appealed the Court’s order to the United States Court of Appeals for the Third Circuit.
On August 16, 2016, the plaintiff filed a Motion For Relief From Final Judgment with the District Court seeking an order modifying the District Court’s April 14, 2016 order dismissing the complaint, and permitting the plaintiff to now file an amended complaint due to alleged newly discovered evidence. By Order dated September 6, 2016, the District Court found that the Motion raised a substantial issue, and directed the plaintiff to notify the Court of Appeals thereof. On September 7, 2016, the plaintiff so notified the Court of Appeals. It is anticipated that the Court of Appeals will remand the case to the District Court pending the District Court’s ruling on the Motion. The Company’s response to the Motion is due by no later than September 15, 2016. The Company believes that the Motion has no merit and intends to vigorously oppose the Motion.
By letter dated December 7, 2015, a purported shareholder of the Company demanded that the Board of Directors investigate, remedy and commence proceedings against certain of the Company’s current and former officers and directors for breach of fiduciary duties in connection with the material weakness in its internal controls over financial reporting which were more fully described in the Company’s Form 10-K for the fiscal year ended June 30, 2015 (the “2015 Form 10-K”). In response to the demand letter, the Board of Directors formed a special litigation committee (the “SLC”) consisting of Joel Brooks and William Reilly, Jr., in order to investigate and evaluate the demand letter. On June 1, 2016, and before the SLC had concluded its investigation, the purported shareholder filed a purported derivative action on behalf of the Company in the Chester County, Pennsylvania, Court of Common Pleas, against certain current and former officers and directors. The complaint alleges that the defendants breached their fiduciary duties relating to the material weakness in internal controls reported in the 2015 Form 10-K. The complaint seeks unspecified damages against the defendants and certain equitable relief. On July 15, 2016 the SLC issued its report (the “SLC Report”) which, among other things, concluded that the none of the current or former officers or Directors had breached their fiduciary duties, that it was not in the best interests of the Company to pursue the pending shareholder derivative action, and that the Company request the Court to dismiss the action in its entirety. On August 1, 2016, the Board of Directors of the Company adopted all of the conclusions and recommendations set forth in the SLC Report. On August 16, 2016, the Company filed with the Court a Motion to Dismiss the shareholder derivative complaint. As of the date hereof, the court has not ruled on the Motion to Dismiss.
The ultimate outcome of these matters cannot be determined at this time. The Company believes that it has meritorious defenses to such claims and is defending them vigorously, and has not recorded a provision for the ultimate outcome of these matters in its financial statements.
USA Technologies, Inc.
Notes to Consolidated Financial Statements
19. REVISIONS OF PREVIOUSLY REPORTED CONSOLIDATED FINANCIAL STATEMENTS
The consolidated financial statements included in this Form 10-K reflect additional shares of common stock and preferred stock that had been issued and outstanding in prior periods but were not reflected as such in previous consolidated financial statements. The additional shares primarily consisted of unvested shares of common stock awarded to officers and directors pursuant to the Company’s equity compensation plans.
The Consolidated Statement of Shareholders’ Equity has been adjusted to reflect these additional common and preferred shares as of June 30, 2013. The June 30, 2015 Consolidated Balance Sheet has also been adjusted to reflect these additional shares; and the liquidation preference of preferred stock as of such date has been increased by $85 thousand.
The cumulative preferred dividends and the basic and diluted weighted average number of common shares outstanding in the Consolidated Statements of Operations for the fiscal years ended June 30, 2015 and 2014 have also been adjusted. The foregoing adjustments in basic and diluted weighted common shares outstanding did not affect the previously reported net income (loss) per common share-basic or diluted for the fiscal year ended June 30, 2015. For the fiscal year ended June 30, 2014 net income per common share-basic and diluted decreased from $.78 to $.77.
Revised Consolidated Statements of Operations
|
($ in thousands)
|
Year ended June 30, 2014
|
|||||||||||
|
As previously
reported
|
Adjustment
|
As Revised
|
||||||||||
|
Cumulative preferred dividends
|
$
|
(664
|
)
|
$
|
(4
|
)
|
$
|
(668
|
)
|
|||
|
Net income (loss) applicable to common shares
|
$
|
26,867
|
$
|
(4
|
)
|
$
|
26,863
|
|||||
|
Net earnings (loss) per common share basic
|
$
|
0.78
|
$
|
(0.01
|
)
|
$
|
0.77
|
|||||
|
Net earnings (loss) per common share diluted
|
$
|
0.78
|
$
|
(0.01
|
)
|
$
|
0.77
|
|||||
|
Basic weighted average number of common shares outstanding
|
34,613,497
|
54,272
|
34,667,769
|
|||||||||
|
Diluted weighted average number of common shares outstanding
|
34,613,497
|
396,062
|
35,009,559
|
|||||||||
|
($ in thousands)
|
Year ended June 30, 2015
|
|||||||||||
|
As previously
reported
|
Adjustment
|
As Revised
|
||||||||||
|
Cumulative preferred dividends
|
$
|
(664
|
)
|
$
|
(4
|
)
|
$
|
(668
|
)
|
|||
|
Net income (loss) applicable to common shares
|
$
|
(1,753
|
)
|
$
|
(4
|
)
|
$
|
(1,757
|
)
|
|||
|
Basic and diluted weighted average number of common shares outstanding
|
35,663,386
|
55,825
|
35,719,211
|
|||||||||
Revised Consolidated Statements of Equity
|
($ in thousands)
|
Year ended June 30, 2014
|
|||||||||||
|
Common Shares
|
As previously
reported
|
Adjustment
|
As Revised
|
|||||||||
|
Stock based compensation
|
||||||||||||
|
2010 Stock Incentive Plan
|
6,668
|
(3,334
|
)
|
3,334
|
||||||||
|
2011 Stock Incentive Plan
|
51,667
|
(51,667
|
)
|
-
|
||||||||
|
2012 Stock Incentive Plan
|
-
|
158,505
|
158,505
|
|||||||||
|
2013 Stock Incentive Plan
|
131,203
|
(75,393
|
)
|
55,810
|
||||||||
|
Retirement of common stock
|
(49,311
|
)
|
(3,334
|
)
|
(52,645
|
)
|
||||||
|
Balance June 30, 2014
|
35,514,685
|
87,438
|
35,602,123
|
|||||||||
|
Year ended June 30, 2015
|
||||||||||||
|
Common Shares
|
As previously
reported
|
Adjustment
|
As Revised
|
|||||||||
|
Stock based compensation
|
||||||||||||
|
2011 Stock Incentive Plan
|
10,002
|
(10,002
|
)
|
-
|
||||||||
|
2012 Stock Incentive Plan
|
88,991
|
(55,293
|
)
|
33,698
|
||||||||
|
2013 Stock Incentive Plan
|
165,463
|
(5,722
|
)
|
159,741
|
||||||||
|
2014 Stock Incentive Plan
|
-
|
-
|
-
|
|||||||||
|
Retirement of common stock
|
(31,899
|
)
|
-
|
(31,899
|
)
|
|||||||
|
Balance June 30, 2015
|
35,747,242
|
16,421
|
35,763,663
|
|||||||||
USA Technologies, Inc.
Notes to Consolidated Financial Statements
20. UNAUDITED QUARTERLY DATA
|
UNAUDITED
|
||||||||||||||||||||
|
YEAR ENDED JUNE 30, 2016
|
First Quarter
|
Second Quarter
|
Third Quarter
|
Fourth Quarter
|
Year
|
|||||||||||||||
|
Revenues
|
$
|
16,600
|
$
|
18,503
|
$
|
20,361
|
$
|
21,944
|
$
|
77,408
|
||||||||||
|
Gross profit
|
$
|
5,047
|
$
|
5,483
|
$
|
5,672
|
$
|
5,783
|
$
|
21,985
|
||||||||||
|
Operating income (loss)
|
$
|
112
|
$
|
594
|
$
|
(595
|
)
|
$
|
(1,578
|
)
|
$
|
(1,467
|
)
|
|||||||
|
Net income (loss)
|
$
|
360
|
$
|
(874
|
)
|
$
|
(5,420
|
)
|
$
|
(872
|
)
|
$
|
(6,806
|
)
|
||||||
|
Cumulative preferred dividends
|
$
|
(334
|
)
|
$
|
-
|
$
|
(334
|
)
|
$
|
-
|
$
|
(668
|
)
|
|||||||
|
Net income (loss) applicable to common shares
|
$
|
26
|
$
|
(874
|
)
|
$
|
(5,754
|
)
|
$
|
(872
|
)
|
$
|
(7,474
|
)
|
||||||
|
Net earnings (loss) per common share:
|
||||||||||||||||||||
|
Basic
|
$
|
0.00
|
$
|
(0.02
|
)
|
$
|
(0.16
|
)
|
$
|
(0.02
|
)
|
$
|
(0.21
|
)
|
||||||
|
Diluted
|
$
|
0.00
|
$
|
(0.02
|
)
|
$
|
(0.16
|
)
|
$
|
(0.02
|
)
|
$
|
(0.21
|
)
|
||||||
|
Weighted average number of common shares outstanding:
|
||||||||||||||||||||
|
Basic
|
35,848,395
|
35,909,933
|
36,161,626
|
37,325,681
|
36,309,047
|
|||||||||||||||
|
Diluted
|
36,487,879
|
35,909,933
|
36,161,626
|
37,325,681
|
36,309,047
|
|||||||||||||||
|
UNAUDITED
|
||||||||||||||||||||
|
YEAR ENDED JUNE 30, 2015
|
First Quarter
|
Second Quarter
|
Third Quarter
|
Fourth Quarter
|
Year
|
|||||||||||||||
|
Revenues
|
$
|
12,253
|
$
|
12,821
|
$
|
15,358
|
$
|
17,645
|
$
|
58,077
|
||||||||||
|
Gross profit
|
$
|
3,135
|
$
|
3,733
|
$
|
5,146
|
$
|
4,809
|
$
|
16,823
|
||||||||||
|
Operating income (loss)
|
$
|
(667
|
)
|
$
|
51
|
$
|
731
|
$
|
(355
|
)
|
$
|
(240
|
)
|
|||||||
|
Net income (loss)
|
$
|
(61
|
)
|
$
|
(261
|
)
|
$
|
(567
|
)
|
$
|
(200
|
)
|
$
|
(1,089
|
)
|
|||||
|
Cumulative preferred dividends
|
$
|
(334
|
)
|
$
|
-
|
$
|
(334
|
)
|
$
|
-
|
$
|
(668
|
)
|
|||||||
|
Net income (loss) applicable to common shares
|
$
|
(395
|
)
|
$
|
(261
|
)
|
$
|
(901
|
)
|
$
|
(200
|
)
|
$
|
(1,757
|
)
|
|||||
|
Net earnings (loss) per common share
|
||||||||||||||||||||
|
Basic
|
$
|
(0.01
|
)
|
$
|
(0.01
|
)
|
$
|
(0.03
|
)
|
$
|
(0.01
|
)
|
$
|
(0.05
|
)
|
|||||
|
Diluted
|
$
|
(0.01
|
)
|
$
|
(0.01
|
)
|
$
|
(0.03
|
)
|
$
|
(0.01
|
)
|
$
|
(0.05
|
)
|
|||||
|
Weighted average number of common shares outstanding:
|
||||||||||||||||||||
|
Basic
|
35,651,732
|
35,716,848
|
35,747,979
|
35,761,370
|
35,719,211
|
|||||||||||||||
|
Diluted
|
35,651,732
|
35,716,848
|
35,747,979
|
36,206,934
|
35,719,211
|
|||||||||||||||
USA Technologies, Inc.
Consolidated Balance Sheets
|
($ in thousands, except shares)
|
March 31,
2017 |
June 30,
2016 |
||||||
|
(unaudited)
|
(audited)
|
|||||||
|
Assets
|
||||||||
|
Current assets:
|
||||||||
|
Cash and Cash Equivalents
|
$
|
17,780
|
$
|
19,272
|
||||
|
Accounts receivable, less allowance for doubtful accounts of $2,851 and $2,814, respectively
|
6,734
|
4,899
|
||||||
|
Finance receivables, less allowance for credit losses of $25 and $0, respectively
|
2,057
|
3,588
|
||||||
|
Inventory, net
|
4,147
|
2,031
|
||||||
|
Prepaid expenses and other current assets
|
1,628
|
987
|
||||||
|
Deferred income taxes
|
2,271
|
2,271
|
||||||
|
Total current assets
|
34,617
|
33,048
|
||||||
|
Finance receivables, less current portion
|
7,548
|
3,718
|
||||||
|
Other assets
|
137
|
348
|
||||||
|
Property and equipment, net
|
9,173
|
9,765
|
||||||
|
Deferred income taxes
|
25,359
|
25,453
|
||||||
|
Intangibles, net
|
666
|
798
|
||||||
|
Goodwill
|
11,492
|
11,703
|
||||||
|
Total assets
|
$
|
88,992
|
$
|
84,833
|
||||
|
Liabilities and shareholders’ equity
|
||||||||
|
Current liabilities:
|
||||||||
|
Accounts payable
|
$
|
11,529
|
$
|
12,354
|
||||
|
Accrued expenses
|
3,111
|
3,458
|
||||||
|
Line of credit, net
|
7,021
|
7,119
|
||||||
|
Current obligations under long-term debt
|
786
|
629
|
||||||
|
Income taxes payable
|
—
|
18
|
||||||
|
Warrant liabilities
|
—
|
3,739
|
||||||
|
Deferred gain from sale-leaseback transactions
|
255
|
860
|
||||||
|
Total current liabilities
|
22,702
|
28,177
|
||||||
|
Long-term liabilities:
|
||||||||
|
Long-term debt, less current portion
|
1,239
|
1,576
|
||||||
|
Accrued expenses, less current portion
|
52
|
15
|
||||||
|
Deferred gain from sale-leaseback transactions, less current portion
|
—
|
40
|
||||||
|
Total long-term liabilities
|
1,291
|
1,631
|
||||||
|
Total liabilities
|
23,993
|
29,808
|
||||||
|
Commitments and contingencies (Note 10)
|
||||||||
|
Shareholders’ equity:
|
||||||||
|
Preferred stock, no par value:
|
||||||||
|
Authorized shares- 1,800,000 Series A convertible preferred- Authorized shares- 900,000 Issued and outstanding shares- 445,063 with liquidation preference of $18,775 and $18,108, respectively
|
3,138
|
3,138
|
||||||
|
Common stock, no par value: Authorized shares- 640,000,000 Issued and outstanding shares- 40,327,675 and 37,783,444, respectively
|
245,463
|
233,394
|
||||||
|
Accumulated deficit
|
(183,602
|
)
|
(181,507
|
)
|
||||
|
Total shareholders’ equity
|
64,999
|
55,025
|
||||||
|
Total liabilities and shareholders’ equity
|
$
|
88,992
|
$
|
84,833
|
||||
See accompanying notes.
USA Technologies, Inc.
Consolidated Statements of Operations
(Unaudited)
|
Three months ended
March 31, |
Nine months ended
March 31, |
|||||||||||||||
|
($ in thousands, except shares and per share data)
|
2017
|
2016
|
2017
|
2016
|
||||||||||||
|
Revenues:
|
||||||||||||||||
|
License and transaction fees
|
$
|
17,459
|
$
|
14,727
|
$
|
50,463
|
$
|
41,326
|
||||||||
|
Equipment sales
|
9,001
|
5,634
|
19,341
|
14,138
|
||||||||||||
|
Total revenues
|
26,460
|
20,361
|
69,804
|
55,464
|
||||||||||||
|
Costs of sales/revenues:
|
||||||||||||||||
|
Cost of services
|
11,876
|
9,703
|
34,508
|
27,475
|
||||||||||||
|
Cost of equipment
|
7,959
|
4,986
|
16,170
|
11,787
|
||||||||||||
|
Total costs of sales/revenues
|
19,835
|
14,689
|
50,678
|
39,262
|
||||||||||||
|
Gross profit
|
6,625
|
5,672
|
19,126
|
16,202
|
||||||||||||
|
Operating expenses:
|
||||||||||||||||
|
Selling, general and administrative
|
5,947
|
6,094
|
18,649
|
15,652
|
||||||||||||
|
Depreciation and amortization
|
259
|
173
|
774
|
439
|
||||||||||||
|
Total operating expenses
|
6,206
|
6,267
|
19,423
|
16,091
|
||||||||||||
|
Operating income (loss)
|
419
|
(595
|
)
|
(297
|
)
|
111
|
||||||||||
|
Other income (expense):
|
||||||||||||||||
|
Interest income
|
114
|
67
|
387
|
138
|
||||||||||||
|
Interest expense
|
(188
|
)
|
(180
|
)
|
(601
|
)
|
(403
|
)
|
||||||||
|
Change in fair value of warrant liabilities
|
-
|
(4,805
|
)
|
(1,490
|
)
|
(5,692
|
)
|
|||||||||
|
Total other expense, net
|
(74
|
)
|
(4,918
|
)
|
(1,704
|
)
|
(5,957
|
)
|
||||||||
|
Income (loss) before income taxes
|
345
|
(5,513
|
)
|
(2,001
|
)
|
(5,846
|
)
|
|||||||||
|
(Provision) benefit for income taxes
|
(209
|
)
|
93
|
(94
|
)
|
(88
|
)
|
|||||||||
|
Net income (loss)
|
136
|
(5,420
|
)
|
(2,095
|
)
|
(5,934
|
)
|
|||||||||
|
Cumulative preferred dividends
|
(334
|
)
|
(334
|
)
|
(668
|
)
|
(668
|
)
|
||||||||
|
Net loss applicable to common shares
|
$
|
(198
|
)
|
$
|
(5,754
|
)
|
$
|
(2,763
|
)
|
$
|
(6,602
|
)
|
||||
|
Net loss per common share - basic and diluted
|
$
|
(0.00
|
)
|
$
|
(0.16
|
)
|
$
|
(0.07
|
)
|
$
|
(0.18
|
)
|
||||
|
Basic and diluted weighted average number of common shares outstanding
|
40,327,697
|
36,161,626
|
39,703,690
|
35,972,633
|
||||||||||||
See accompanying notes.
USA Technologies, Inc.
Consolidated Statement of Shareholders’ Equity
(Unaudited)
|
Series A
Convertible
Preferred Stock
|
Common Stock
|
Accumulated
|
||||||||||||||||||||||
|
($ in thousands, except shares)
|
Shares
|
Amount
|
Shares
|
Amount
|
Deficit
|
Total
|
||||||||||||||||||
|
Balance, June 30, 2016
|
445,063
|
$
|
3,138
|
37,783,444
|
$
|
233,394
|
$
|
(181,507
|
)
|
$
|
55,025
|
|||||||||||||
|
Reclass of fair value of warrant liability upon exercise of warrants
|
5,229
|
5,229
|
||||||||||||||||||||||
|
Exercise of warrants
|
2,401,408
|
6,193
|
6,193
|
|||||||||||||||||||||
|
Stock based compensation
|
||||||||||||||||||||||||
|
2013 Stock Incentive Plan
|
149,356
|
288
|
288
|
|||||||||||||||||||||
|
2014 Stock Option Incentive Plan
|
155
|
155
|
||||||||||||||||||||||
|
2015 Equity Incentive Plan
|
235
|
235
|
||||||||||||||||||||||
|
Retirement of common stock
|
(6,533
|
)
|
(31
|
)
|
(31
|
)
|
||||||||||||||||||
|
Net loss
|
(2,095
|
)
|
(2,095
|
)
|
||||||||||||||||||||
|
Balance, March 31, 2017
|
445,063
|
$
|
3,138
|
40,327,675
|
$
|
245,463
|
$
|
(183,602
|
)
|
$
|
64,999
|
|||||||||||||
See accompanying notes.
USA Technologies, Inc.
Consolidated Statements of Cash Flows
(Unaudited)
|
|
Three months ended
March 31, |
Nine months ended
March 31, |
||||||||||||||
|
($ in thousands)
|
2017
|
2016
|
2017
|
2016
|
||||||||||||
|
OPERATING ACTIVITIES:
|
||||||||||||||||
|
Net income (loss)
|
$
|
136
|
$
|
(5,420
|
)
|
$
|
(2,095
|
)
|
$
|
(5,934
|
)
|
|||||
|
Adjustments to reconcile net income (loss) to net cash provided/(used) by operating activities:
|
||||||||||||||||
|
Charges incurred in connection with the vesting and issuance of common stock and common stock options for employee and director compensation
|
233
|
142
|
678
|
651
|
||||||||||||
|
Gain on disposal of property and equipment
|
(28
|
)
|
(15
|
)
|
(59
|
)
|
(57
|
)
|
||||||||
|
Amortization of deferred financing fees
|
72
|
-
|
98
|
-
|
||||||||||||
|
Bad debt expense
|
127
|
506
|
577
|
980
|
||||||||||||
|
Depreciation
|
1,165
|
1,190
|
3,642
|
3,863
|
||||||||||||
|
Amortization of intangible assets
|
45
|
44
|
132
|
44
|
||||||||||||
|
Change in fair value of warrant liabilities
|
-
|
4,805
|
1,490
|
5,692
|
||||||||||||
|
Deferred income taxes, net
|
209
|
(93
|
)
|
94
|
88
|
|||||||||||
|
Recognition of deferred gain from sale-leaseback transactions
|
(216
|
)
|
(215
|
)
|
(646
|
)
|
(645
|
)
|
||||||||
|
Changes in operating assets and liabilities:
|
||||||||||||||||
|
Accounts receivable
|
(41
|
)
|
(1,660
|
)
|
(2,388
|
)
|
(2,070
|
)
|
||||||||
|
Finance receivables
|
(4,232
|
)
|
(366
|
)
|
(2,113
|
)
|
(735
|
)
|
||||||||
|
Inventory
|
647
|
250
|
(2,042
|
)
|
1,118
|
|||||||||||
|
Prepaid expenses and other assets
|
136
|
(160
|
)
|
(406
|
)
|
(366
|
)
|
|||||||||
|
Accounts payable
|
2,441
|
4,154
|
(825
|
)
|
1,487
|
|||||||||||
|
Accrued expenses
|
160
|
1,166
|
(414
|
)
|
1,151
|
|||||||||||
|
Income taxes payable
|
(6
|
)
|
-
|
(18
|
)
|
(70
|
)
|
|||||||||
|
Net cash provided/(used) by operating activities
|
848
|
4,328
|
(4,295
|
)
|
5,197
|
|||||||||||
|
|
||||||||||||||||
|
INVESTING ACTIVITIES:
|
||||||||||||||||
|
Purchase and additions of property and equipment
|
(183
|
)
|
(164
|
)
|
(792
|
)
|
(331
|
)
|
||||||||
|
Purchase of property for rental program
|
(691
|
)
|
-
|
(2,026
|
)
|
-
|
||||||||||
|
Proceeds from sale of property and equipment
|
44
|
19
|
105
|
124
|
||||||||||||
|
Cash paid for assets acquired from VendScreen
|
-
|
(5,625
|
)
|
-
|
(5,625
|
)
|
||||||||||
|
Net cash used by investing activities
|
(830
|
)
|
(5,770
|
)
|
(2,713
|
)
|
(5,832
|
)
|
||||||||
|
|
||||||||||||||||
|
FINANCING ACTIVITIES:
|
||||||||||||||||
|
Cash used for the retirement of common stock
|
-
|
-
|
(31
|
)
|
(40
|
)
|
||||||||||
|
Payment of deferred financing costs
|
(90
|
)
|
-
|
(90
|
)
|
-
|
||||||||||
|
Proceeds from exercise of common stock warrants
|
-
|
1,652
|
6,193
|
1,681
|
||||||||||||
|
Proceeds (payments) from line of credit, net
|
-
|
33
|
-
|
3,033
|
||||||||||||
|
Repayment of long-term debt
|
(182
|
)
|
(151
|
)
|
(556
|
)
|
(512
|
)
|
||||||||
|
Net cash (used)/provided by financing activities
|
(272
|
)
|
1,534
|
5,516
|
4,162
|
|||||||||||
|
|
||||||||||||||||
|
Net (decrease) increase in cash
|
(254
|
)
|
92
|
(1,492
|
)
|
3,527
|
||||||||||
|
Cash at beginning of period
|
18,034
|
14,809
|
19,272
|
11,374
|
||||||||||||
|
Cash at end of period
|
$
|
17,780
|
$
|
14,901
|
$
|
17,780
|
$
|
14,901
|
||||||||
|
|
||||||||||||||||
|
Supplemental disclosures of cash flow information:
|
||||||||||||||||
|
Interest paid in cash
|
$
|
59
|
$
|
191
|
$
|
528
|
$
|
404
|
||||||||
|
Depreciation expense allocated to cost of services
|
$
|
950
|
$
|
1,051
|
$
|
3,000
|
$
|
3,436
|
||||||||
|
Reclass of rental program property to inventory, net
|
$
|
8
|
$
|
347
|
$
|
74
|
$
|
845
|
||||||||
|
Prepaid items financed with debt
|
$
|
-
|
$
|
-
|
$
|
54
|
$
|
103
|
||||||||
|
Equipment and property acquired under capital lease
|
$
|
54
|
$
|
409
|
$
|
326
|
$
|
444
|
||||||||
|
Disposal of property and equipment
|
$
|
87
|
$
|
189
|
$
|
748
|
$
|
526
|
||||||||
|
Fair value of common stock warrants at issuance recorded as a debt discount
|
$
|
-
|
$
|
52
|
$
|
-
|
$
|
52
|
||||||||
|
Debt financing cost financed with debt
|
$
|
-
|
$
|
79
|
$
|
-
|
$
|
79
|
||||||||
USA Technologies, Inc.
Notes to Consolidated Financial Statements
(Unaudited)
1. BUSINESS
USA Technologies, Inc. (the “Company”, “We”, “USAT”, or “Our”) was incorporated in the Commonwealth of Pennsylvania in January 1992. We are a provider of technology-enabled solutions and value-added services that facilitate electronic payment transactions primarily within the unattended Point of Sale (“POS”) market. We are a leading provider in the small ticket, beverage and food vending industry and are expanding our solutions and services to other unattended market segments, such as amusement, commercial laundry, kiosk and others. Since our founding, we have designed and marketed systems and solutions that facilitate electronic payment options, as well as telemetry Internet of Things (“IoT”) and machine-to-machine (“M2M”) services, which include the ability to remotely monitor, control, and report on the results of distributed assets containing our electronic payment solutions. Historically, these distributed assets have relied on cash for payment in the form of coins or bills, whereas, our systems allow them to accept cashless payments such as through the use of credit or debit cards or other emerging contactless forms, such as mobile payment. All of our customers are located in North America.
2. ACCOUNTING POLICIES
CONSOLIDATION
The accompanying consolidated financial statements include the accounts of the Company and its wholly-owned subsidiaries. All significant intercompany accounts and transactions have been eliminated in consolidation.
USE OF ESTIMATES
The preparation of the consolidated financial statements in conformity with U.S. generally accepted accounting principles requires management to make estimates and assumptions that affect the amounts reported in the consolidated financial statements and accompanying notes. Actual results could differ from those estimates.
CASH
The Company maintains its cash in bank deposit accounts, which may exceed federally insured limits at times.
ACCOUNTS RECEIVABLE AND ALLOWANCE FOR DOUBTFUL ACCOUNTS
Accounts receivable include amounts due to the Company for sales of equipment, other amounts due from customers, merchant service receivables, and unbilled amounts due from customers, net of the allowance for uncollectible accounts.
The Company maintains an allowance for doubtful accounts for estimated losses resulting from the inability of its customers to make required payments, including from a shortfall in the customer transaction fund flow from which the Company would normally collect amounts due.
The allowance is determined through an analysis of various factors including the aging of the accounts receivable, the strength of the relationship with the customer, the capacity of the customer transaction fund flow to satisfy the amount due from the customer, an assessment of collection costs and other factors. The allowance for doubtful accounts receivable is management’s best estimate as of the respective reporting date. The Company writes off accounts receivable against the allowance when management determines the balance is uncollectible and the Company ceases collection efforts. Management believes that the allowance recorded is adequate to provide for its estimated credit losses.
FINANCE RECEIVABLES
The Company offers extended payment terms to certain customers for equipment sales under its Quick Start Program. In accordance with the Financial Accounting Standards Board Accounting Standards Codification® (“ASC”) Topic 840, “Leases”, agreements under the Quick Start Program qualify for sales-type lease accounting. Accordingly, the future minimum lease payments are classified as finance receivables in the Company’s consolidated balance sheets. Finance receivables or Quick Start leases are generally for a sixty month term. Finance receivables are carried at their contractual amount and charged off against the allowance for credit losses when management determines that recovery is unlikely and the Company ceases collection efforts. The Company recognizes a portion of the note or lease payments as interest income in the accompanying consolidated financial statements based on the effective interest rate method.
INVENTORY, Net
Inventory consists of finished goods and packaging materials. The Company’s inventory is stated at the lower of cost (average cost basis) or market.
PROPERTY AND EQUIPMENT, Net
Property and equipment are recorded at cost. Property and equipment are depreciated on the straight-line basis over the estimated useful lives of the related assets. Leasehold improvements are amortized on the straight-line basis over the lesser of the estimated useful life of the asset or the respective lease term.
GOODWILL AND INTANGIBLE ASSETS
The Company’s intangible assets include goodwill, trademarks, non-compete agreements, brand, developed technology and customer relationships.
Goodwill represents the excess of cost over fair value of the net assets purchased in acquisitions. The Company accounts for goodwill in accordance with ASC 350, “Intangibles – Goodwill and Other”. Under ASC 350, goodwill is not amortized to earnings, but instead is subject to periodic testing for impairment. Testing for impairment is to be done at least annually and at other times if events or circumstances arise that indicate that impairment may have occurred. The Company has selected April 1 as its annual test date.
FAIR VALUE OF FINANCIAL INSTRUMENTS
The Financial Accounting Standards Board (“FASB”) issued Accounting Standards Update (“ASU”) 2010-06, “Fair Value Measurements and Disclosures (“Topic 820”): Improving Disclosures about Fair Value Measurements.” ASU 2010-06 amends certain disclosure requirements of Subtopic 820-10. This ASU provides additional disclosures for transfers in and out of Levels 1 and 2 and for activity in Level 3. This ASU also clarifies certain other existing disclosure requirements including level of desegregation and disclosures around inputs and valuation techniques.
The Company’s financial assets and liabilities are accounted for in accordance with ASC 820 “Fair Value Measurement.” Under ASC 820 the Company uses inputs from the three levels of the fair value hierarchy to measure its financial assets and liabilities. The three levels are as follows:
Level 1- Inputs are unadjusted quoted prices in active markets for identical assets or liabilities that the Company has the ability to access at the measurement date.
Level 2- Inputs are other than quoted prices included within Level 1 that are observable for the asset or liability, either directly or indirectly. Level 2 inputs include quoted prices for similar assets and liabilities in active markets, quoted prices for identical or similar assets or liabilities in markets that are not active, inputs other than quoted prices that are observable for the asset or liability (i.e., interest rates, yield curves, etc.), and inputs that are derived principally from or corroborated by observable market data by correlation or other means (market corroborated inputs).
Level 3- Inputs are unobservable and reflect the Company’s assumptions that market participants would use in pricing the asset or liability. The Company develops these inputs based on the best information available.
The Company’s financial instruments, principally accounts receivable, short-term finance receivables, prepaid expenses and other assets, accounts payable and accrued expenses, are carried at cost which approximates fair value due to the short-term maturity of these instruments. The fair value of the Company’s obligations under its long-term debt agreements and the long-term portion of its finance receivables approximate their carrying value as such instruments are at market rates currently available to the Company.
REVENUE RECOGNITION
Revenue from the sale or QuickStart lease of equipment is recognized on the terms of freight-on-board shipping point. Activation fee revenue, if applicable, is recognized when the Company’s cashless payment device is initially activated for use on the Company network. Transaction processing revenue is recognized upon the usage of the Company’s cashless payment and control network. License fees for access to the Company’s devices and network services are recognized on a monthly basis. In all cases, revenue is only recognized when persuasive evidence of an arrangement exists, delivery has occurred or services have been rendered, the price is fixed and determinable, and collection of the resulting receivable is reasonably assured. The Company estimates an allowance for product returns at the date of sale and license and transaction fee refunds on a monthly basis. The company makes an adjustment for rebates and product returns.
ePort hardware is available to customers under the QuickStart program pursuant to which the customer would enter into a five-year non-cancelable lease with either the Company or a third-party financing company for the devices. The Company utilizes its best estimate of selling price when calculating the revenue to be recorded under these leases. The leases qualify for sales type lease accounting. Accordingly, the Company recognizes a portion of lease payments as interest income for leases not placed with a third-party financing company. At the end of the lease period, the customer would have the option to purchase the device at its residual value.
PREFERRED STOCK
The Company adopted the provisions of ASU 2014-16 in determining whether the Company’s Series A Convertible Preferred Stock (“preferred stock”) is more equity-like or debt-like, and whether derivatives embedded in the preferred stock, if any, must be bifurcated and accounted for separately from its host contract. Based upon management’s review of the preferred stock features, management has determined that the preferred stock is more equity-like and that the embedded derivatives do not require bifurcation. As such, the adoption of this standard did not have a material impact on the company's financial statements.
ACCOUNTING FOR EQUITY AWARDS
In accordance with the ASC Topic 718, the cost of employee services received in exchange for an award of equity instruments is based on the grant-date fair value of the award and allocated over the vesting period of the award.
INCOME TAXES
The Company follows the ASC Topic 740, “Accounting for Uncertainty in Income Taxes”, which provides detailed guidance for the financial statement recognition, measurement and disclosure of uncertain tax positions recognized in the consolidated financial statements. Accordingly, tax positions must meet a “more-likely-than-not” recognition threshold at the effective date to be recognized upon the adoption of ASC Topic 740 and in subsequent periods.
Income taxes are computed using the asset and liability method of accounting. Under the asset and liability method, a deferred tax asset or liability is recognized for estimated future tax effects attributable to temporary differences and carryforwards. The measurement of deferred income tax assets is adjusted by a valuation allowance, if necessary, to recognize future tax benefits only to the extent that, based on available evidence, it is more likely than not such benefits will be realized. The Company recognizes interest and penalties, if any, related to uncertain tax positions in selling, general and administrative expenses. No interest or penalties related to uncertain tax positions were accrued or incurred during the three and nine months ended March 31, 2017 and 2016.
EARNINGS (LOSS) PER COMMON SHARE
Basic earnings (loss) per share are calculated by dividing income (loss) applicable to common shares by the weighted average common shares outstanding for the period. Diluted earnings per share are calculated by dividing income (loss) applicable to common shares by the weighted average common shares outstanding for the period plus the effect of potential common shares unless such effect is anti-dilutive.
SOFTWARE DEVELOPMENT COSTS
The Company follows the ASC Topic 350-40, “Accounting for the Cost of Computer Software Developed or obtained for Internal Use”, which provides for guidance for what costs can be capitalized for internal use.
Capitalized costs for internal-use software are included in fixed assets in the consolidated balance sheet and are amortized over three years. Costs incurred during the preliminary project along with post-implementation stages of internal use computer software development and costs incurred to maintain existing product offerings are expensed as incurred. The capitalization and ongoing assessment of recoverability of development costs require considerable judgment by management with respect to certain external factors, including, but not limited to, technological and economic feasibility and estimated economic life.
RECENT ACCOUNTING PRONOUNCEMENTS
The Company is evaluating whether the effects of the following recent accounting will have a material effect on the Company’s consolidated financial position, results of operations or cash flows.
In January 2017, the FASB issued ASU 2017-04 – “Intangibles-Goodwill and Other (Topic 350): Simplifying the test for Goodwill Impairment.”
RECLASSIFICATION
Commencing with the June 30, 2016 financial statements, the Company changed the manner in which it presents certain unfunded finance receivables in its consolidated balance sheets and the related statements of cash flows. These finance receivables have yet to be and are expected to be funded by a third-party funding source. The previous accounting classification recorded these amounts as accounts receivable in the consolidated balance sheets and the related statements of cash flows. The impact of this change on the Statement of Cash Flows is as follows:
|
|
Three months ended
March 31, 2016 |
Nine months ended
March 31, 2016 |
||||||||||||||
|
|
Accounts
Receivable |
Finance
Receivables |
Accounts
Receivable |
Finance
Receivables |
||||||||||||
|
Per Original Statement of Cash Flows
|
$
|
(1,872
|
)
|
$
|
(154
|
)
|
$
|
(3,352
|
)
|
$
|
547
|
|||||
|
Reclass of Unfunded Leases, beginning of period (starting BS)
|
(2,096
|
)
|
2,096
|
(1,026
|
)
|
1,026
|
||||||||||
|
Reclass of Finance Receivables, end of period
|
2,308
|
(2,308
|
)
|
2,308
|
(2,308
|
)
|
||||||||||
|
Impact from the reclassification
|
212
|
(212
|
)
|
1,282
|
(1,282
|
)
|
||||||||||
|
Adjusted Statement of Cash Flows
|
$
|
(1,660
|
)
|
$
|
(366
|
)
|
$
|
(2,070
|
)
|
$
|
(735
|
)
|
||||
3. FINANCE RECEIVABLES
Finance receivables consist of the following:
|
($ in thousands)
|
|
March 31,
2017
|
June 30,
2016 |
|||||
|
|
(unaudited)
|
|||||||
|
Total finance receivables
|
$
|
9,605
|
$
|
7,306
|
||||
|
Less current portion
|
2,057
|
3,588
|
||||||
|
Non-current portion of finance receivables
|
$
|
7,548
|
$
|
3,718
|
||||
The Company collects monthly payments of its finance receivables from the customers’ transaction fund flow. Accordingly, as the fund flow from these customers’ transactions is generally sufficient to satisfy the amount due to the Company, the risk of loss is considered low and the Company has provided for an allowance for credit losses for finance receivables of $25 thousand and zero as of March 31, 2017 and June 30, 2016, respectively. The number of Finance Receivables that are in a loss position is nine and zero as of March 31, 2017 and June 30, 2016 respectively.
Credit Quality Indicators
|
Credit risk profile based on payment activity:
($ in thousands) |
|
March 31,
2017 |
June 30,
2016 |
|||||
|
|
(unaudited)
|
|||||||
|
Performing
|
$
|
9,527
|
$
|
7,174
|
||||
|
Nonperforming
|
78
|
132
|
||||||
|
Total
|
$
|
9,605
|
$
|
7,306
|
||||
Age Analysis of Past Due Finance Receivables
As of March 31, 2017
|
($ in thousands)
|
31 – 60
Days Past |
61 – 90
Days Past |
Greater than
90 Days Past |
Total Past
Due |
Current
|
Total
Finance |
||||||||||||||||||
|
QuickStart Leases
|
$
|
31
|
$
|
1
|
$
|
21
|
$
|
53
|
$
|
9,552
|
$
|
9,605
|
||||||||||||
Age Analysis of Past Due Finance Receivables
As of June 30, 2016
|
($ in thousands)
|
31 – 60
Days Past |
61 – 90
Days Past |
Greater than
90 Days Past |
Total Past
Due |
Current
|
Total
Finance |
||||||||||||||||||
|
QuickStart Leases
|
$
|
98
|
$
|
31
|
$
|
3
|
$
|
132
|
$
|
7,174
|
$
|
7,306
|
||||||||||||
4. GOODWILL AND INTANGIBLES
On January 15, 2016, the Company executed an Asset Purchase Agreement with VendScreen, Inc (“VendScreen”) a Portland, Oregon based developer of vending industry cashless payment technology, by which it acquired substantially all of VendScreen’s assets and assumed specified liabilities, for a cash payment of $5.62 million and the corresponding goodwill recorded was $4.0 million. In December 2016, the company finalized the opening balance sheet of VendScreen and recorded a reduction of goodwill for $211 thousand and increased finance receivables for the same amount. The final goodwill amount related to VendScreen opening balance sheet is $3.8 million.
The following table summarizes the final purchase price allocation to reflect the fair values of the assets acquired and liabilities assumed at the date of acquisition.
|
Consideration:
|
||||
|
Fair value of total consideration paid in cash
|
$
|
5,625
|
||
|
|
||||
|
Acquisition related costs:
|
$
|
842
|
||
|
|
||||
|
Recognized amounts of identifiable assets acquired and liabilities assumed:
|
||||
|
|
||||
|
Financial Assets:
|
||||
|
Accounts Receivable
|
3
|
|||
|
Finance Receivables
|
839
|
|||
|
Other Current Assets
|
20
|
|||
|
Deferred Income Taxes
|
18
|
|||
|
|
880
|
|||
|
|
||||
|
Property, Plant & Equipment
|
81
|
|||
|
|
||||
|
Identifiable Intangible Assets:
|
||||
|
Developed Technology
|
639
|
|||
|
Customer Relationships
|
149
|
|||
|
Brand
|
95
|
|||
|
Noncompete Agreement
|
2
|
|||
|
Fair Value of Intangible Assets
|
885
|
|||
|
|
||||
|
Financial Liabilities
|
||||
|
Accrued Liabilities
|
$
|
(50
|
)
|
|
|
|
||||
|
Total identifiable net assets
|
$
|
1,796
|
||
|
|
||||
|
Goodwill
|
$
|
3,829
|
||
|
|
||||
|
Total Fair Value
|
$
|
5,625
|
||
During the three and nine months ending March 31, 2017, there was $45 thousand and $132 thousand, respectively, of amortization expense relating to acquired intangible assets. There was $44 thousand amortization expense relating to acquired intangible assets during the three and nine months ended March 31, 2016. Intangible asset balances consisted of the following:
|
($ in thousands)
|
Balance
June 30, 2016 |
Additions/
Adjustments |
Amortization
|
Balance
March 31, 2017 |
Amortization
Period |
||||||||||||
|
Intangible Assets:
|
|
||||||||||||||||
|
Non-compete agreements
|
$
|
1
|
$
|
—
|
$
|
(1
|
)
|
$
|
—
|
2 years
|
|||||||
|
Brand
|
79
|
—
|
(24
|
)
|
55
|
3 years
|
|||||||||||
|
Developed technology
|
576
|
—
|
(96
|
)
|
480
|
5 years
|
|||||||||||
|
Customer relationships
|
142
|
—
|
(11
|
)
|
131
|
10 years
|
|||||||||||
|
Total Intangible Assets
|
$
|
798
|
$
|
—
|
$
|
(132
|
)
|
$
|
666
|
|
|||||||
|
|
|
||||||||||||||||
|
Goodwill
|
$
|
11,703
|
$
|
(211
|
)
|
$
|
—
|
$
|
11,492
|
Indefinite
|
|||||||
5. LINE OF CREDIT
During the fiscal year ended June 30, 2016, the Company entered into a Loan and Security Agreement and other ancillary documents (as amended, the “Heritage Loan Documents”) with Heritage Bank of Commerce (“Heritage Bank”), providing for a secured asset-based revolving line of credit in an amount of up to $12.0 million (the “Heritage Line of Credit”) at an interest rate calculated based on the Federal Reserves’ Prime, which was 3.75% at March 31, 2017, plus 2.25%. The Heritage Line of Credit and the Company’s obligations under the Heritage Loan Documents are secured by substantially all of the Company’s assets, including its intellectual property.
During March 2017, the Company entered into the third amendment with Heritage Bank that extended the maturity date of the Heritage Line of Credit from March 29, 2017 to September 30, 2018. The Company paid a toal of $90 thousand in deferred financing costs.
At the time of maturity, all outstanding advances under the Heritage Line of Credit as well as any unpaid interest are due and payable. Prior to maturity of the Heritage Line of Credit, the Company may prepay amounts due under the Heritage Line of Credit without penalty, and subject to the terms of the Heritage Loan Documents, may re-borrow any such amounts.
The Heritage Loan Documents contain customary representations and warranties and affirmative and negative covenants applicable to the Company. The Heritage Loan Documents also require the Company to achieve a minimum Adjusted EBITDA, as defined in the Heritage Loan Documents, measured on a quarterly basis; that the number of the Company’s connections as of the end of each fiscal quarter shall not decrease below a specified number or by more than five percent as compared to the number of the Company’s connections as of the end of the immediately prior fiscal quarter; and that the Company shall maintain a minimum balance of unrestricted cash at Heritage Bank.
The balance due on the Heritage Line of Credit was $7.0 million at March 31, 2017 and $7.1 million at June 30, 2016. Included in the Heritage Line of Credit balance is $90 thousand of unamortized debt issuance costs, which is reflected in our net liability of $7.0 million for the quarter ending March 31, 2017. As of March 31, 2017, $5.0 million was available under our line of credit. Interest expense on the line of credit was approximately $100 thousand and $300 thousand for the three and nine months ended March 31, 2017, respectively.
6. LONG-TERM DEBT
The Company periodically enters into capital lease obligations to finance certain office, network equipment and related support for use in its daily operations. During the nine-month period ended March 31, 2017, the Company commenced capital lease obligations of $380 thousand. The obligations are due in two to five years in monthly or quarterly installments of $1 thousand to $21 thousand. The value of the acquired equipment is included in property and equipment and amortized accordingly.
7. FAIR VALUE OF FINANCIAL INSTRUMENTS
As of June 30, 2016, the fair values of the Company’s Level 3 financial instrument totaled $3.7 million for 2.2 million warrants. The Level 3 financial instrument consist of common stock warrants issued by the Company in March 2011, which include features requiring liability treatment of the warrants. The fair value of warrants issued in March 2011 to purchase shares of the Company’s common stock is based on valuations performed by an independent third-party valuation firm. The fair value was determined using proprietary valuation models using the quality of the underlying securities of the warrants, restrictions on the warrants and security underlying the warrants, time restrictions and precedent sale transactions completed in the secondary market or in other private transactions. During the nine months ended March 31, 2017 all of the aforementioned warrants were exercised and the then-fair value warrant liability was reclassified as Common Stock.
The following table summarizes the changes in the Company’s Level 3 financial instruments for the three and nine months ended March 31, 2017 and 2016.
|
|
Three months ended
March 31,
|
Nine months ended
March 31, |
||||||||||||||
|
($ in thousands)
|
2017 |
2016
|
2017
|
2016
|
||||||||||||
|
Beginning balance
|
$
|
—
|
$
|
(1,865
|
)
|
$
|
(3,739
|
)
|
$
|
(978
|
)
|
|||||
|
Increase due to change in fair value of warrant liabilities
|
—
|
(4,805
|
)
|
(1,490
|
)
|
(5,692
|
)
|
|||||||||
|
Reclass of fair value of warranty liability to common stock upon exercise of warrants
|
—
|
706
|
5,229
|
706
|
||||||||||||
|
Ending balance
|
$
|
—
|
$
|
(5,964
|
)
|
$
|
—
|
$
|
(5,964
|
)
|
||||||
There were no transfers of assets or liabilities between level 1, level 2, or level 3 during the three and nine months ended March 31, 2017 and March 31, 2016. As of March 31, 2017 and June 30, 2016, the Company held no Level 1 or Level 2 financial instruments.
8. INCOME TAXES
For the three and nine months ended March 31, 2017, income tax expense of $209 thousand and $94 thousand, respectively, (substantially all deferred income taxes) were recorded. The expense are based upon income before income taxes using an estimated annual effective income tax rate of 31% for the fiscal year ending June 30, 2017. The provision for the nine months ended March 31, 2017 consists of a charge for the tax effect of the change in the fair value of warrant liabilities which was treated discretely offset by a tax benefit based upon income before benefit for income taxes using the estimated annual effective income tax rate of 23% for the fiscal year ending June 30, 2017. All of those warrants were exercised as of September 30, 2016.
For the three and nine months ended March 31, 2016, an income tax benefit/(provision) of $93 thousand and $(88) thousand respectively, (substantially all deferred income taxes) were recorded. The benefit (provision) consist of a charge for the tax effect of the change in the fair value of warrant liabilities which was treated discretely offset by a tax benefit based upon loss before benefit (provision) for income taxes using an estimated annual effective income tax rate of 33% for the fiscal year ended June 30, 2016.
9. EQUITY
WARRANTS
During the three months ended March 31, 2017 and 2016, there were 0 and 634,100 warrants exercised. During the nine months ended March 31, 2017, 2,376,675 warrants were exercised at $2.6058 per share yielding proceeds of $6.2 million, and 24,733 warrants were exercised at $2.10 per share in a cashless exercise. The following table summarizes warrant activity for the three and nine months ended March 31, 2017 and 2016:
|
Three months ended
March 31, |
Nine months ended
March 31, |
|||||||||||||||
|
2017
|
2016
|
2017
|
2016
|
|||||||||||||
|
Beginning balance
|
23,978
|
4,298,000
|
2,445,653
|
4,309,000
|
||||||||||||
|
Issued
|
—
|
23,978
|
—
|
23,978
|
||||||||||||
|
Exercised
|
—
|
(634,100
|
)
|
(2,401,408
|
)
|
(645,100
|
)
|
|||||||||
|
Expired
|
—
|
—
|
—
|
—
|
||||||||||||
|
Cancelled
|
—
|
—
|
(20,267
|
)
|
—
|
|||||||||||
|
Ending balance
|
23,978
|
3,687,878
|
23,978
|
3,687,878
|
||||||||||||
STOCK OPTIONS
The Company estimates the grant date fair value of the stock options it grants using a Black-Scholes valuation model. The Company’s assumption for expected volatility is based on its historical volatility data related to market trading of its own common stock. The Company bases its assumptions for expected life of the new stock option grants on the life of the option granted, and if relevant, its analysis of the historical exercise patterns of its stock options. The dividend yield assumption is based on dividends expected to be paid over the expected life of the stock option. The risk-free interest rate assumption is determined by using the U.S. Treasury rates of the same period as the expected option term of each stock option.
In August 2016 stock options were awarded to purchase up to 20,080 shares of common stock at an exercise price of $4.98 per share. The options vest on August 31, 2017, and expire if not exercised prior to August 31, 2023. The options are intended to qualify as incentive stock options under Section 422 of the Internal Revenue Code of 1986, as amended. During the quarter ending March 31, 2017, three employees were issued the option to purchase 105,000 shares of common stock, of which 75,000 are classified as non-qualified stock options, exercisable at $4.00 per share, and the remaining 30,000 are intended to qualify as incentive stock options, exercisable at $4.05 per share. Of the 105,000 shares of common stock issued for the option to purchase, 95,000 shares expire on March 31, 2024 and 10,000 expire on February 6, 2024. The fair value of options granted during the nine months ended March 31, 2017 and 2016 was estimated using the following weighted average assumptions:
|
Nine months ended
March 31, |
||||||||
|
2017
|
2016
|
|||||||
|
Expected volatility
|
49 - 50
|
%
|
59 - 66
|
%
|
||||
|
Expected life
|
3 - 4 years
|
4 - 4.5 years
|
||||||
|
Expected dividends
|
—
|
%
|
—
|
%
|
||||
|
Risk-free interest rate
|
1.06 - 1.90
|
%
|
1.34 - 1.49
|
%
|
||||
|
Number of options granted
|
125,080
|
194,586
|
||||||
|
Weighted average exercise price
|
$
|
4.17
|
$
|
3.21
|
||||
|
Weighted average grant date fair value
|
$
|
1.68
|
$
|
1.64
|
||||
Stock based compensation related to stock options for the three months ended March 31, 2017 and 2016 was $61 thousand and $67 thousand, respectively and $155 thousand and $274 thousand, respectively for the nine months ended March 31, 2017 and 2016.
COMMON STOCK
On July 1, 2016 $40 thousand of stock grants were awarded to each non-employee director based on the prior 30-day average closing price of the Company’s Common Stock, for a total of 56,784 shares. The shares vest as follows: 18,960 on July 1, 2017, 18,960 on July 1, 2018 and 18,954 on July 1, 2019. The total expense recognized for these grants during the three and nine months ended March 31, 2017 was $37 thousand and $110 thousand.
During the nine months ended March 31, 2017, the Company awarded an aggregate of 78,711 shares to its Chief Executive Officer and Chief Services Officer under its fiscal year 2016 long term stock incentive plan and an aggregate of 13,771 shares to three non-employee directors in satisfaction of board fees. During the nine-month period, the Chief Executive Officer cancelled 6,533 shares of Common Stock awarded to him under the 2016 fiscal year long term stock incentive plan in satisfaction of $31 thousand of related payroll obligations.
During the nine months ended March 31, 2017, the Company issued an aggregate of 2,401,408 shares upon the exercise of outstanding warrants.
LTI PLANS
The Board approved the Fiscal Year 2017 Long-Term Stock Incentive Plan (the “2017 LTI Stock Plan”) which provides that executive officers would be awarded shares of common stock of the Company in the event that certain metrics relating to the Company’s 2017 fiscal year would result in specified ranges of year-over-year percentage growth. The metrics are total number of connections as of June 30, 2017 as compared to total number of connections as of June 30, 2016 (50% weighting) and adjusted EBITDA earned during the 2017 fiscal year as compared to the adjusted EBITDA earned during the 2016 fiscal year (50% weighting).
If none of the minimum threshold year-over-year percentage target goals are achieved, the executive officers would not be awarded any shares. If all of the year-over-year percentage target goals are achieved, the executive officers would be awarded shares having the following value: Chief Executive Officer (“CEO”) - $675,000 (150% of base salary), Chief Services Officer (“CSO”) - $250,000 (100% of base salary), and Chief Financial Officer (“CFO”) - $103,125 (75% of base salary less proration for the current fiscal year). If all of the maximum distinguished year-over-year percentage target goals are achieved, the executive officers would be awarded shares having the following value: CEO - $1,012,500 (225% of base salary), CSO - $375,000 (150% of base salary), and CFO - $154,688 (112.50% of base salary less prorated for the current fiscal year). Assuming the minimum threshold year-over-year percentage target goal would be achieved for a particular metric, the number of shares to be awarded for that metric would be determined on a pro rata basis, provided that the award would not exceed the maximum distinguished award for that metric. The shares awarded under the 2017 LTI Stock Plan would vest as follows: one-third at the time of issuance; one-third on June 30, 2018; and one-third on June 30, 2019.
The Company had long-term stock incentive plans (“LTI”) in prior fiscal years for its then executive officers. Stock based compensation related to the LTI plans was as follows in the three and nine months ended March 31, 2017 and 2016:
|
Three months ended
March 31, |
Nine months ended
March 31, |
|||||||||||||||
|
($ in thousands, except per share data)
|
2017
|
2016
|
2017
|
2016
|
||||||||||||
|
FY17 LTI Plan
|
$
|
81
|
$
|
—
|
$
|
236
|
$
|
—
|
||||||||
|
FY16 LTI Plan
|
23
|
24
|
73
|
134
|
||||||||||||
|
FY15 LTI Plan
|
3
|
8
|
6
|
48
|
||||||||||||
|
FY14 LTI Plan
|
—
|
2
|
—
|
10
|
||||||||||||
|
Total
|
$
|
107
|
$
|
34
|
$
|
315
|
$
|
192
|
||||||||
10. COMMITMENTS AND CONTINGENCIES
During the nine months ended March 31, 2017 the Company entered into a lease agreement for its operations in Portland, Oregon, which commenced October 1, 2016. The new location consists of 5,362 square feet and will expire in December 2019. The lease includes monthly rental payments of $11 thousand. The straight-line rent expense for this lease is $11 thousand per month.
From time to time, the Company is involved in various legal proceedings arising during the normal course of business which, in the opinion of the management of the Company, will not have a material adverse effect on the Company’s financial position, results of operations or cash flows.

USA TECHNOLOGIES, INC.
Shares of Common Stock
PROSPECTUS
William Blair
, 2017
Through and including (25 days after the commencement of this offering), all dealers that buy, sell or trade shares of our common stock, whether or not participating in this offering, may be required to deliver a prospectus. This delivery requirement is in addition to the dealers’ obligation to deliver a prospectus when acting as underwriters and with respect to their unsold allotments or subscriptions.
PART II
INFORMATION NOT REQUIRED IN PROSPECTUS
| ITEM 13. |
OTHER EXPENSES OF ISSUANCE AND DISTRIBUTION.
|
The following is an itemized statement of the estimated amounts of all expenses payable by the Registrant in connection with the registration of the common stock.
|
SEC Registration Fee
|
$
|
4,636
|
||
|
FINRA filing fee
|
$
|
6,500
|
||
|
Printing and Mailing Expenses
|
$
|
*
|
||
|
Accounting Fees and Expenses
|
$
|
*
|
||
|
Legal Fees and Expenses
|
$
|
*
|
||
|
Other
|
$
|
*
|
||
|
Total
|
$
|
*
|
|
*
|
To be completed by amendment.
|
| ITEM 14. |
INDEMNIFICATION OF OFFICERS AND DIRECTORS.
|
Section 1746 of the Pennsylvania Business Corporation Law of 1988, as amended (“BCL”), authorizes a Pennsylvania corporation to indemnify its officers, directors, employees and agents under certain circumstances against expenses and liabilities incurred in legal proceedings involving such persons because of their holding or having held such positions with the corporation and to purchase and maintain insurance of such indemnification. Our By-laws substantively provide that we will indemnify our officers, directors, employees and agents to the fullest extent provided by Section 1746 of the BCL.
Section 1713 of the BCL permits a Pennsylvania corporation, by so providing in its By-laws, to eliminate the personal liability of a director for monetary damages for any action taken unless the director has breached or failed to perform the duties of his office and the breach or failure constitutes self-dealing, willful misconduct or recklessness. In addition, no such limitation of liability is available with respect to the responsibility or liability of a director pursuant to any criminal statute or for the payment of taxes pursuant to Federal, state or local law. Our By-laws eliminate the personal liability of the directors to the fullest extent permitted by Section 1713 of the BCL.
As permitted by the BCL, our By-laws provide that directors will not be personally liable, as such, for monetary damages for any action taken unless the director has breached or failed to perform the duties of a director under the BCL and the breach or failure to perform constitutes self-dealing, willful misconduct or recklessness. This limitation of personal liability does not apply to any responsibility or liability pursuant to any criminal statute, or any liability for the payment of taxes pursuant to Federal, state or local law. The By-laws also include provisions for indemnification of our directors and officers to the fullest extent permitted by the BCL. In addition, the Company has entered into separate indemnification agreements with its directors and officers which require the Company to indemnify each of such officers and directors to the fullest extent permitted by the law of the Commonwealth of Pennsylvania against certain liabilities which may arise by reason of their status as directors and officers. The indemnification agreements also provide that the Company must advance all expenses incurred by the indemnified person in connection with any proceeding, provided the indemnified person undertakes to repay the advanced amounts if it is determined ultimately that the indemnified person is not entitled to be indemnified. Insofar as indemnification for liabilities arising under the Securities Act may be permitted to directors, officers and controlling persons of the Company pursuant to the foregoing provisions, or otherwise, we have been advised that in the opinion of the SEC such indemnification is against public policy as expressed in the Act and is, therefore, unenforceable.
| ITEM 15. |
RECENT SALES OF UNREGISTERED SECURITIES.
|
During the three years immediately preceding the date of the filing of this registration statement, the following securities were issued by the Company without registration under the Securities Act:
On March 29, 2016, the Company entered into a Loan and Security Agreement and other ancillary documents (the “Heritage Loan Documents”) with Heritage Bank of Commerce (“Heritage Bank”), providing for a secured asset-based revolving line of credit in an amount of up to $12.0 million (the “Heritage Line of Credit”). In connection with the Heritage Loan Documents, the Company issued to Heritage Bank warrants to purchase up to 23,978 shares of common stock of the Company at an exercise price of $5.00 per share. The warrants are exercisable at any time through March 29, 2021 subject to earlier termination in the event of a business combination (as defined in the warrants). The warrants were issued by the Company pursuant to the exemption from registration set forth in Section 4(a)(2) of the Securities Act.
| ITEM 16. |
EXHIBITS AND FINANCIAL STATEMENT SCHEDULES.
|
The following exhibits are included herein or incorporated herein by reference:
|
Exhibit
Number
|
Description
|
|
1.1**
|
Form of Underwriting Agreement by and between the Company and William Blair & Company, L.L.C.
|
|
3.1
|
Amended and Restated Articles of Incorporation of the Company filed January 26, 2004 (Incorporated by reference to Exhibit 3.1.20 to Form 10-QSB filed on February 12, 2004).
|
|
3.1.1
|
First Amendment to Amended and Restated Articles of Incorporation of the Company filed on March 17, 2005 (Incorporated by reference to Exhibit 3.1.1 to Form S-1 Registration Statement No. 333-124078).
|
|
3.1.2
|
Second Amendment to Amended and Restated Articles of Incorporation of the Company filed on December 13, 2005 (Incorporated by reference to Exhibit 3.1.2 to Form S-1 Registration Statement No. 333-130992).
|
|
3.1.3
|
Third Amendment to Amended and Restated Articles of Incorporation of the Company filed on February 7, 2006 (Incorporated by reference to Exhibit 3.1.3 to Form 10-K filed on September 30, 2013).
|
|
3.1.4
|
Fourth Amendment to Amended and Restated Articles of Incorporation of the Company filed on July 25, 2007 (Incorporated by reference to Exhibit 3.1.3 to Form 10-K filed September 23, 2008).
|
|
3.1.5
|
Fifth Amendment to Amended and Restated Articles of Incorporation of the Company filed on March 6, 2008 (Incorporated by reference to Exhibit 3.1.4 to Form 10-K filed September 23, 2008).
|
|
3.2
|
Amended and Restated By-Laws of the Company dated as of April 24, 2014 (Incorporated by reference to Exhibit 3(i) to Form 8-K filed on April 30, 2014).
|
|
4.1
|
Warrant dated March 29, 2016 in favor of Heritage Bank of Commerce (Incorporated by reference to Exhibit 4.2 to Form 10-K filed on September 13, 2016).
|
|
5.1**
|
Opinion of Lurio & Associates, P.C.
|
|
10.1
|
Form of Indemnification Agreement between the Company and each of its officers and directors (Incorporated by reference to Exhibit 10.1 to Form 10-Q filed May 14, 2007).
|
|
10.2
|
USA Technologies, Inc. 2013 Stock Incentive Plan (Incorporated by reference to Appendix A to the Company’s Definitive Proxy Statement filed on May 20, 2013).
|
|
10.3
|
USA Technologies, Inc. 2014 Stock Option Incentive Plan (Incorporated by reference to Appendix A to the Company’s Definitive Proxy Statement filed on May 15, 2014).
|
|
10.4
|
USA Technologies, Inc. 2015 Equity Incentive Plan (Incorporated by reference to Appendix A to the Company’s Definitive Proxy Statement filed on May 15, 2015).
|
|
10.5
|
Amended and Restated Employment and Non-Competition Agreement between the Company and Stephen P. Herbert dated November 30, 2011. (Incorporated by reference to Exhibit 10.1 to Form 8-K filed December 5, 2011).
|
|
10.6
|
Employment and Non-Competition Agreement dated June 7, 2010 between the Company and Michael Lawlor (Incorporated by reference to Exhibit 10.22 to Form 10-K filed on September 30, 2013).
|
|
10.7
|
First Amendment to Employment and Non-Competition Agreement dated April 27, 2012 between the Company and Michael Lawlor (Incorporated by reference to Exhibit 10.23 to Form 10-K filed on September 30, 2013).
|
|
10.8
|
Employment and Non-Competition Agreement between the Company and David M. DeMedio dated April 12, 2005 (Incorporated by reference to Exhibit 10.22 to Form S-1 Registration Statement No. 333-124078).
|
|
10.9
|
First Amendment to Employment and Non-Competition Agreement between the Company and David M. DeMedio dated May 11, 2006 (Incorporated by reference to Exhibit 10.3 to Form 10-Q filed on May 15, 2006).
|
|
10.10
|
Second Amendment to Employment and Non-Competition Agreement dated March 13, 2007, between the Company and David M. DeMedio (Incorporated by reference to Exhibit 10.34 to Form S-1 filed April 12, 2007).
|
|
10.11
|
Third Amendment to Employment and Non-Competition Agreement between the Company and David M. DeMedio dated September 22, 2008 (Incorporated by reference to Exhibit 10.29 to Form 10-K filed September 24, 2008).
|
|
10.12
|
Letter from the Company to David M. DeMedio dated September 24, 2009 (Incorporated by reference to Exhibit 10.32 to Form 10-K filed September 25, 2009).
|
|
10.13
|
Fifth Amendment to Employment and Non-Competition Agreement dated as of July 1, 2011 between the Company and David M. DeMedio (Incorporated by reference to Exhibit 10.31 to Form 10-K filed September 27, 2011).
|
|
10.14
|
Sixth Amendment to Employment and Non-Competition Agreement dated September 27, 2011 between the Company and David M. DeMedio (Incorporated by reference to Exhibit 10.32 to Form 10-K filed September 27, 2011).
|
|
10.15
|
Seventh Amendment to Employment and Non-Competition Agreement dated as of November 7, 2013 between the Company and David M. DeMedio (Incorporated by reference to Exhibit 10.1 to Form 10-Q filed November 13, 2013).
|
|
10.16
|
Separation Agreement and Release dated as of October 19, 2015 by and between the Company and David M. DeMedio (Incorporated by reference to Exhibit 10.1 to Form 8-K filed October 20, 2015).
|
|
10.17
|
Letter Agreement dated July 22, 2015, by and between the Company and J. Duncan Smith (Incorporated by reference to Exhibit 10.1 to Form 8-K filed August 4, 2015).
|
|
10.18
|
Separation Agreement and Release dated as of January 22, 2016 by and between the Company and J. Duncan Smith (Incorporated by reference to Exhibit 10.1 to Form 8-K filed January 28, 2016).
|
|
10.19
|
Letter agreement dated January 27, 2016, by and between the Company and Leland P. Maxwell (Incorporated by reference to Exhibit 10.2 to Form 8-K filed January 28, 2016).
|
|
10.20
|
Letter agreement dated September 28, 2016, by and between the Company and Leland P. Maxwell (Incorporated by reference to Exhibit 10.1 to Form 8-K filed October 4, 2016).
|
|
10.21
|
Employment Offer Letter dated as of March 10, 2017, by and between the Company and Priyanka Singh (Incorporated by reference to Exhibit 10.1 to Form 8-K filed March 28, 2017).
|
|
10.22
|
Second Amendment Employment and Non-Competition Agreement dated as of April 29, 2016 by and between the Company and Michael K. Lawlor (Incorporated by reference to Exhibit 10.19 to Form 10-K filed on September 13, 2016).
|
|
10.23
|
Visa Incentive Agreement between the Company and Visa U.S.A. Inc., dated as of November 14, 2014 (Incorporated by reference to Exhibit 10.1 to Form 10-Q filed February 17, 2015) (Portions of this exhibit were redacted pursuant to a confidential treatment request).
|
|
10.24
|
Mastercard Acceptance Agreement by and between the Company and Mastercard International Incorporated (Incorporated by reference to Exhibit 10.2 to Form 10-Q filed May 15, 2015) (Portions of this exhibit were redacted pursuant to a confidential treatment request).
|
|
10.25
|
First Amendment to Mastercard Acceptance Agreement by and between the Company and Mastercard International Incorporated dated April 27, 2015 (Incorporated by reference to Exhibit 10.45 to Form 10-K filed September 30, 2015) (Portions of this exhibit were redacted pursuant to a confidential treatment request).
|
|
10.26
|
Third Party Payment Processor Agreement dated April 24, 2015 by and among the Company, JPMorgan Chase Bank, N.A. and Paymentech, LLC (Incorporated by reference to Exhibit 10.46 to Form 10-K filed September 30, 2015) (Portions of this exhibit were redacted pursuant to a confidential treatment request).
|
|
10.27
|
Loan and Security Agreement dated March 29, 2016 by and between the Company and Heritage Bank of Commerce (Incorporated by reference to Exhibit 10.1 to Form 10-Q/A filed February 24, 2017) (Portions of this exhibit were redacted pursuant to a confidential treatment request).
|
|
10.28
|
Intellectual Property Security Agreement dated March 29, 2016 by and between the Company and Heritage Bank of Commerce (Incorporated by reference to Exhibit 10.2 to Form 10-Q filed May 12, 2016) (Portions of this exhibit were redacted pursuant to a confidential treatment request).
|
|
10.29
|
Second Amendment to Loan and Security Agreement dated as of September 30, 2016 by and between the Company and Heritage Bank of Commerce (Incorporated by reference to Exhibit 10.1 to Form 10-Q filed February 8, 2017) (Portions of this exhibit were redacted pursuant to a confidentiality treatment request).
|
|
10.30
|
Third Amendment to Loan and Security Agreement dated as of March 24, 2017 by and between the Company and Heritage Bank of Commerce (Incorporated by reference to Exhibit 10.1 to Form 10-Q filed May 10, 2017) (Portions of this exhibit were redacted pursuant to a confidentiality treatment request).
|
|
10.31
|
Asset Purchase Agreement dated January 15, 2016 by and between the Company and VendScreen, Inc. (Incorporated by reference to Exhibit 2.1 to Form 10-Q filed May 12, 2016) (Portions of this exhibit were redacted pursuant to a confidential treatment request).
|
|
21
|
List of significant subsidiaries of the Company (Incorporated by reference to Exhibit 21 to Form S-1 filed on March 16, 2010).
|
|
23.1*
|
Consent of RSM US LLP, Independent Registered Public Accounting Firm.
|
|
23.2**
|
Consent of Lurio & Associates, P.C. (to be included in Exhibit 5.1).
|
|
23.3*
|
Consent of Ballard Spahr LLP
|
|
24.1*
|
Power of Attorney (included on signature page hereof).
|
|
*
|
Filed herewith.
|
||
|
**
|
To be filed by amendment
|
||
| ITEM 17. |
UNDERTAKINGS.
|
The undersigned registrant hereby undertakes:
(1) For purposes of determining any liability under the Securities Act of 1933, the information omitted from the form of prospectus filed as part of this registration statement in reliance upon Rule 430A and contained in a form of prospectus filed by the registrant pursuant to Rule 424(b) (1) or (4) or 497(h) under the Securities Act shall be deemed to be part of this registration statement as of the time it was declared effective.
(2) For the purpose of determining any liability under the Securities Act of 1933, each post-effective amendment that contains a form of prospectus shall be deemed to be a new registration statement relating to the securities offered therein, and the offering of such securities at that time shall be deemed to be the initial bona fide offering thereof.
Insofar as indemnification for liabilities arising under the Securities Act of 1933 may be permitted to directors, officers and controlling persons of the registrant pursuant to the foregoing provisions, or otherwise, the registrant has been advised that, in the opinion of the Securities and Exchange Commission, such indemnification is against public policy as expressed in the Act and is, therefore, unenforceable. In the event that a claim for indemnification against such liabilities (other than the payment by the registrant of expenses incurred or paid by a director, officer or controlling person of the registrant in the successful defense of any action, suit or proceeding) is asserted by such director, officer or controlling person in connection with the securities being registered, the registrant will, unless in the opinion of its counsel the matter has been settled by controlling precedent, submit to a court of appropriate jurisdiction the question whether such indemnification by it is against public policy as expressed in the Act and will be governed by the final adjudication of such issue.
SIGNATURES
Pursuant to the requirements of the Securities Act of 1933, as amended, the Registrant has duly caused this Registration Statement on Form S-1 to be signed on its behalf by the undersigned, thereunto duly authorized, in Malvern, Pennsylvania, on July 7, 2017.
|
USA TECHNOLOGIES, INC.
|
||
|
By:
|
/s/ Stephen P. Herbert
|
|
|
Stephen P. Herbert, Chairman and Chief Executive Officer
|
POWER OF ATTORNEY
KNOW ALL PERSONS BY THESE PRESENTS, that each person whose signature appears below constitutes and appoints each of Stephen P. Herbert and Douglas M. Lurio as true and lawful attorney-in-fact and agent, with full power of substitution and re-substitution, for them and in their name, place and stead, in any and all capacities, to sign any and all amendments (including pre-effective and post-effective amendments) to this registration statement and any additional registration statements filed pursuant to Rule 462, and to file the same, with all exhibits thereto, and other documents in connection therewith, with the Securities and Exchange Commission (the SEC), and generally to do all such things in their names and behalf in their capacities as officers and directors to enable the Company to comply with the provisions of the Securities Act of 1933 and all requirements of the SEC, granting unto each said attorney-in-fact and agent full power and authority to do and perform each and every act and thing requisite and necessary to be done in connection therewith, as fully to all intents and purposes as he or she might or could do in person, ratifying and confirming all that said attorney-in-fact and agent, or their or his or her substitutes or substitute, may lawfully do or cause to be done by virtue hereof.
Pursuant to the requirements of the Securities Act of 1933, as amended, this Registration Statement on Form S-1 has been duly signed below by the following persons in the capacities and dates indicated.
|
SIGNATURES
|
TITLE
|
DATE
|
||
| /s/ Stephen P. Herbert |
Chairman of the Board of Directors
|
July 7, 2017
|
||
|
Stephen P. Herbert
|
and Chief Executive Officer
|
|||
|
(Principal Executive Officer)
|
||||
| /s/ Priyanka Singh, CPA |
Chief Financial Officer
|
July 7, 2017
|
||
|
Priyanka Singh, CPA
|
(Principal Accounting Officer)
|
|||
| /s/ Steven D. Barnhart |
Director
|
July 7, 2017
|
||
|
Steven D. Barnhart
|
||||
| /s/ Joel Brooks |
Director
|
July 7, 2017
|
||
|
Joel Brooks
|
||||
| /s/ Robert L. Metzger |
Director
|
July 7, 2017
|
||
|
Robert L. Metzger
|
||||
| /s/ Albin F. Moschner |
Director
|
July 7, 2017
|
||
|
Albin F. Moschner
|
||||
| /s/ William J. Reilly, Jr. |
Director
|
July 7, 2017
|
||
|
William J. Reilly, Jr.
|
||||
| /s/ William J. Schoch |
Director
|
July 7, 2017
|
||
|
William J. Schoch
|
EXHIBIT INDEX
|
Exhibit
Number
|
Description
|
|
|
1.1**
|
Form of Underwriting Agreement by and between the Company and William Blair & Company, L.L.C.
|
|
|
3.1
|
Amended and Restated Articles of Incorporation of the Company filed January 26, 2004 (Incorporated by reference to Exhibit 3.1.20 to Form 10-QSB filed on February 12, 2004).
|
|
|
3.1.1
|
First Amendment to Amended and Restated Articles of Incorporation of the Company filed on March 17, 2005 (Incorporated by reference to Exhibit 3.1.1 to Form S-1 Registration Statement No. 333-124078).
|
|
|
3.1.2
|
Second Amendment to Amended and Restated Articles of Incorporation of the Company filed on December 13, 2005 (Incorporated by reference to Exhibit 3.1.2 to Form S-1 Registration Statement No. 333-130992).
|
|
|
3.1.3
|
Third Amendment to Amended and Restated Articles of Incorporation of the Company filed on February 7, 2006 (Incorporated by reference to Exhibit 3.1.3 to Form 10-K filed on September 30, 2013).
|
|
|
3.1.4
|
Fourth Amendment to Amended and Restated Articles of Incorporation of the Company filed on July 25, 2007 (Incorporated by reference to Exhibit 3.1.3 to Form 10-K filed September 23, 2008).
|
|
|
3.1.5
|
Fifth Amendment to Amended and Restated Articles of Incorporation of the Company filed on March 6, 2008 (Incorporated by reference to Exhibit 3.1.4 to Form 10-K filed September 23, 2008).
|
|
|
3.2
|
Amended and Restated By-Laws of the Company dated as of April 24, 2014 (Incorporated by reference to Exhibit 3(i) to Form 8-K filed on April 30, 2014).
|
|
|
4.1
|
Warrant dated March 29, 2016 in favor of Heritage Bank of Commerce (Incorporated by reference to Exhibit 4.2 to Form 10-K filed on September 13, 2016).
|
|
|
5.1**
|
Opinion of Lurio & Associates, P.C.
|
|
|
10.1
|
Form of Indemnification Agreement between the Company and each of its officers and directors (Incorporated by reference to Exhibit 10.1 to Form 10-Q filed May 14, 2007).
|
|
| 10.2 |
USA Technologies, Inc. 2013 Stock Incentive Plan (Incorporated by reference to Appendix A to the Company’s Definitive Proxy Statement filed on May 20, 2013).
|
|
|
10.3
|
USA Technologies, Inc. 2014 Stock Option Incentive Plan (Incorporated by reference to Appendix A to the Company’s Definitive Proxy Statement filed on May 15, 2014).
|
|
| 10.4 |
USA Technologies, Inc. 2015 Equity Incentive Plan (Incorporated by reference to Appendix A to the Company’s Definitive Proxy Statement filed on May 15, 2015).
|
|
|
10.5
|
Amended and Restated Employment and Non-Competition Agreement between the Company and Stephen P. Herbert dated November 30, 2011. (Incorporated by reference to Exhibit 10.1 to Form 8-K filed December 5, 2011).
|
|
|
10.6
|
Employment and Non-Competition Agreement dated June 7, 2010 between the Company and Michael Lawlor (Incorporated by reference to Exhibit 10.22 to Form 10-K filed on September 30, 2013).
|
|
|
10.7
|
First Amendment to Employment and Non-Competition Agreement dated April 27, 2012 between the Company and Michael Lawlor (Incorporated by reference to Exhibit 10.23 to Form 10-K filed on September 30, 2013).
|
|
|
10.8
|
Employment and Non-Competition Agreement between the Company and David M. DeMedio dated April 12, 2005 (Incorporated by reference to Exhibit 10.22 to Form S-1 Registration Statement No. 333-124078).
|
|
|
10.9
|
First Amendment to Employment and Non-Competition Agreement between the Company and David M. DeMedio dated May 11, 2006 (Incorporated by reference to Exhibit 10.3 to Form 10-Q filed on May 15, 2006).
|
|
|
10.10
|
Second Amendment to Employment and Non-Competition Agreement dated March 13, 2007, between the Company and David M. DeMedio (Incorporated by reference to Exhibit 10.34 to Form S-1 filed April 12, 2007).
|
|
|
10.11
|
Third Amendment to Employment and Non-Competition Agreement between the Company and David M. DeMedio dated September 22, 2008 (Incorporated by reference to Exhibit 10.29 to Form 10-K filed September 24, 2008).
|
|
|
10.12
|
Letter from the Company to David M. DeMedio dated September 24, 2009 (Incorporated by reference to Exhibit 10.32 to Form 10-K filed September 25, 2009).
|
|
|
10.13
|
Fifth Amendment to Employment and Non-Competition Agreement dated as of July 1, 2011 between the Company and David M. DeMedio (Incorporated by reference to Exhibit 10.31 to Form 10-K filed September 27, 2011).
|
|
|
10.14
|
Sixth Amendment to Employment and Non-Competition Agreement dated September 27, 2011 between the Company and David M. DeMedio (Incorporated by reference to Exhibit 10.32 to Form 10-K filed September 27, 2011).
|
|
|
10.15
|
Seventh Amendment to Employment and Non-Competition Agreement dated as of November 7, 2013 between the Company and David M. DeMedio (Incorporated by reference to Exhibit 10.1 to Form 10-Q filed November 13, 2013).
|
|
|
10.16
|
Separation Agreement and Release dated as of October 19, 2015 by and between the Company and David M. DeMedio (Incorporated by reference to Exhibit 10.1 to Form 8-K filed October 20, 2015).
|
|
|
10.17
|
Letter Agreement dated July 22, 2015, by and between the Company and J. Duncan Smith (Incorporated by reference to Exhibit 10.1 to Form 8-K filed August 4, 2015).
|
|
|
10.18
|
Separation Agreement and Release dated as of January 22, 2016 by and between the Company and J. Duncan Smith (Incorporated by reference to Exhibit 10.1 to Form 8-K filed January 28, 2016).
|
|
|
10.19
|
Letter agreement dated January 27, 2016, by and between the Company and Leland P. Maxwell (Incorporated by reference to Exhibit 10.2 to Form 8-K filed January 28, 2016).
|
|
|
10.20
|
Letter agreement dated September 28, 2016, by and between the Company and Leland P. Maxwell (Incorporated by reference to Exhibit 10.1 to Form 8-K filed October 4, 2016).
|
|
|
10.21
|
Employment Offer Letter dated as of March 10, 2017, by and between the Company and Priyanka Singh (Incorporated by reference to Exhibit 10.1 to Form 8-K filed March 28, 2017).
|
|
|
10.22
|
Second Amendment Employment and Non-Competition Agreement dated as of April 29, 2016 by and between the Company and Michael K. Lawlor (Incorporated by reference to Exhibit 10.19 to Form 10-K filed on September 13, 2016).
|
|
|
10.23
|
Visa Incentive Agreement between the Company and Visa U.S.A. Inc., dated as of November 14, 2014 (Incorporated by reference to Exhibit 10.1 to Form 10-Q filed February 17, 2015) (Portions of this exhibit were redacted pursuant to a confidential treatment request).
|
|
|
10.24
|
Mastercard Acceptance Agreement by and between the Company and Mastercard International Incorporated (Incorporated by reference to Exhibit 10.2 to Form 10-Q filed May 15, 2015) (Portions of this exhibit were redacted pursuant to a confidential treatment request).
|
|
|
10.25
|
First Amendment to Mastercard Acceptance Agreement by and between the Company and Mastercard International Incorporated dated April 27, 2015 (Incorporated by reference to Exhibit 10.45 to Form 10-K filed September 30, 2015) (Portions of this exhibit were redacted pursuant to a confidential treatment request).
|
|
|
10.26
|
Third Party Payment Processor Agreement dated April 24, 2015 by and among the Company, JPMorgan Chase Bank, N.A. and Paymentech, LLC (Incorporated by reference to Exhibit 10.46 to Form 10-K filed September 30, 2015) (Portions of this exhibit were redacted pursuant to a confidential treatment request).
|
|
|
10.27
|
Loan and Security Agreement dated March 29, 2016 by and between the Company and Heritage Bank of Commerce (Incorporated by reference to Exhibit 10.1 to Form 10-Q/A filed February 24, 2017) (Portions of this exhibit were redacted pursuant to a confidential treatment request).
|
|
|
10.28
|
Intellectual Property Security Agreement dated March 29, 2016 by and between the Company and Heritage Bank of Commerce (Incorporated by reference to Exhibit 10.2 to Form 10-Q filed May 12, 2016) (Portions of this exhibit were redacted pursuant to a confidential treatment request).
|
|
|
10.29
|
Second Amendment to Loan and Security Agreement dated as of September 30, 2016 by and between the Company and Heritage Bank of Commerce (Incorporated by reference to Exhibit 10.1 to Form 10-Q filed February 8, 2017) (Portions of this exhibit were redacted pursuant to a confidentiality treatment request).
|
|
|
10.30
|
Third Amendment to Loan and Security Agreement dated as of March 24, 2017 by and between the Company and Heritage Bank of Commerce (Incorporated by reference to Exhibit 10.1 to Form 10-Q filed May 10, 2017) (Portions of this exhibit were redacted pursuant to a confidentiality treatment request).
|
|
|
10.31
|
Asset Purchase Agreement dated January 15, 2016 by and between the Company and VendScreen, Inc. (Incorporated by reference to Exhibit 2.1 to Form 10-Q filed May 12, 2016) (Portions of this exhibit were redacted pursuant to a confidential treatment request).
|
|
|
21
|
List of significant subsidiaries of the Company (Incorporated by reference to Exhibit 21 to Form S-1 filed on March 16, 2010).
|
|
|
Consent of RSM US LLP, Independent Registered Public Accounting Firm.
|
||
|
23.2**
|
Consent of Lurio & Associates, P.C. (to be included in Exhibit 5.1).
|
|
|
Consent of Ballard Spahr LLP
|
||
|
24.1*
|
Power of Attorney (included on signature page hereof).
|
|
|
*
|
Filed herewith
|
|
|
**
|
To be filed by amendment
|
|