Attached files
| file | filename |
|---|---|
| EX-99.2 - PRESS RELEASE - DELTA AIR LINES, INC. | delta_8k-ex9902.htm |
| 8-K - FORM 8-K - DELTA AIR LINES, INC. | delta_8k.htm |
Exhibit 99.1
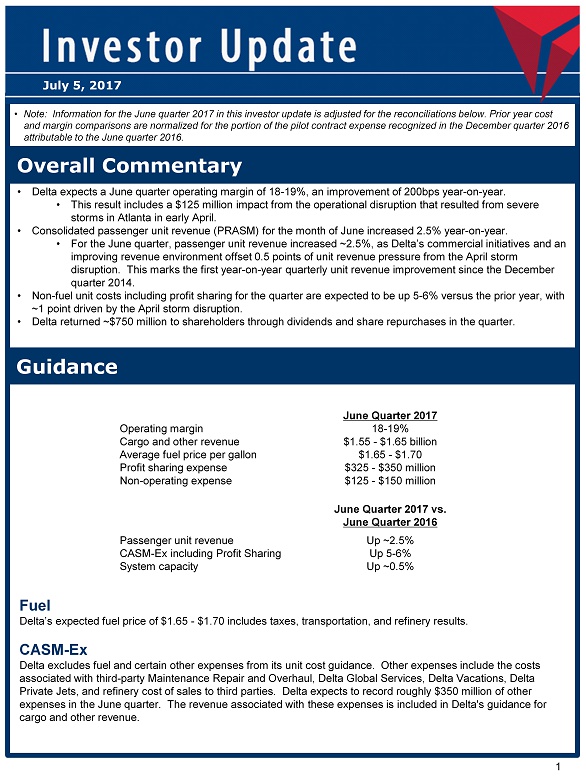
1 Overall Commentary • Delta expects a June quarter operating margin of 18 - 19%, an improvement of 200bps year - on - year. • This result includes a $125 million impact from the operational disruption that resulted from severe storms in Atlanta in early April. • Consolidated passenger unit revenue (PRASM) for the month of June increased 2.5% year - on - year. • For the June quarter, passenger unit revenue increased ~2.5%, as Delta’s commercial initiatives and an improving revenue environment offset 0.5 points of unit revenue pressure from the April storm disruption. This marks the first year - on - year quarterly unit revenue improvement since the December quarter 2014. • Non - fuel unit costs including profit sharing for the quarter are expected to be up 5 - 6% versus the prior year, with ~1 point driven by the April storm disruption. • Delta returned ~$750 million to shareholders through dividends and share repurchases in the quarter. June Quarter 2017 Operating margin 18 - 19% Cargo and other revenue $1.55 - $1.65 billion Average fuel price per gallon $1.65 - $1.70 Profit sharing expense $325 - $350 million Non - operating expense $125 - $150 million June Quarter 2017 vs. June Quarter 2016 Passenger unit revenue Up ~2.5% CASM - Ex including Profit Sharing Up 5 - 6% System capacity Up ~0.5% July 5, 2017 • Note: Information for the June quarter 2017 in this investor update is adjusted for the reconciliations below. Prior year co st and margin comparisons are normalized for the portion of the pilot contract expense recognized in the December quarter 2016 attributable to the June quarter 2016. Fuel Delta’s expected fuel price of $1.65 - $1.70 includes taxes, transportation, and refinery results. CASM - Ex Delta excludes fuel and certain other expenses from its unit cost guidance. Other expenses include the costs associated with third - party Maintenance Repair and Overhaul, Delta Global Services, Delta Vacations, Delta Private Jets, and refinery cost of sales to third parties. Delta expects to record roughly $350 million of other expenses in the June quarter. The revenue associated with these expenses is included in Delta's guidance for cargo and other revenue. Guidance
2 Forward Looking Statements Profit Sharing Delta’s employee profit sharing program for its ground and flight attendant employees pays 10% of the company’s adjusted annual pre - tax profit up to the prior year’s adjusted annual pre - tax profit and 20% above that amount (adjusted pretax profit for 2016 was $7.2 billion). Delta’s employee profit sharing program for its pilots pays 10% up to $2.5 billion in adjusted annual pre - tax profit and 20% above that amount. Profit sharing expense is accrued at a blended rate based on the company’s estimated profitability for the full year. Taxes Our June 2017 quarter results will reflect a ~35% tax rate. There will be no material impact to cash as Delta’s net operating loss carryforwards will largely offset cash taxes. Share count Delta expects approximately 731 million diluted and approximately 728 million basic weighted average shares outstanding. Statements in this investor update that are not historical facts, including statements regarding our estimates, expectations, beliefs, intentions, projections or strategies for the future, may be "forward - looking statements" as defined in the Private Securities Litigation Reform Act of 1995. All forward - looking statements involve a number of risks and uncertainties that could cause actual results to differ materially from the estimates, expectations, beliefs, intentions, projections and strategies reflected in or suggested by the forward - looking statements. These risks and uncertainties include, but are not limited to, the effects of terrorist attacks or geopolitical conflict; the cost of aircraft fuel; the impact of fuel hedging activity includi ng rebalancing our hedge portfolio, recording mark - to - market adjustments or posting collateral in connection with our fuel hedge contracts; the availability of aircraft fuel; the performance of our significant investments in airlines in other parts of th e w orld; the possible effects of accidents involving our aircraft; the restrictions that financial covenants in our financing agreemen ts could have on our financial and business operations; labor issues; interruptions or disruptions in service at one of our hub, gateway, or key airports; breaches or security lapses in our information technology systems; disruptions in our information technology infrastructure; our dependence on technology in our operations; the effects of weather, natural disasters and seasonality on our business; the effects of an extended disruption in services provided by third party regional carriers; fai lur e or inability of insurance to cover a significant liability at Monroe’s Trainer refinery; the impact of environmental regulati on on the Trainer refinery, including costs related to renewable fuel standard regulations; our ability to retain management and ke y employees; competitive conditions in the airline industry; the effects of extensive government regulation on our business; th e sensitivity of the airline industry to prolonged periods of stagnant or weak economic conditions; uncertainty in economic conditions and regulatory environment in the United Kingdom leading up to and following the exit of the United Kingdom from the European Union; and the effects of the rapid spread of contagious illnesses. Additional information concerning risks and uncertainties that could cause differences between actual results and forward - looking statements is contained in our Securities and Exchange Commission filings, including our Annual Report on Form 10 - K for the fiscal year ended Dec. 31, 2016. Caution should be taken not to place undue reliance on our forward - looking statements, which represent our views only as of July 5, 2017, and which we have no current intention to update. Non - GAAP Financial Measures Delta sometimes uses information ("non - GAAP financial measures") that is derived from the Consolidated Financial Statements, but that is not presented in accordance with accounting principles generally accepted in the U.S. (“GAAP”). Under the U.S. Securities and Exchange Commission rules, non - GAAP financial measures may be considered in addition to results prepared in accordance with GAAP, but should not be considered a substitute for or superior to GAAP results. The tables below show reconciliations of non - GAAP financial measures used in this update to the most directly comparable GAAP financial measures. Non - GAAP Reconciliations
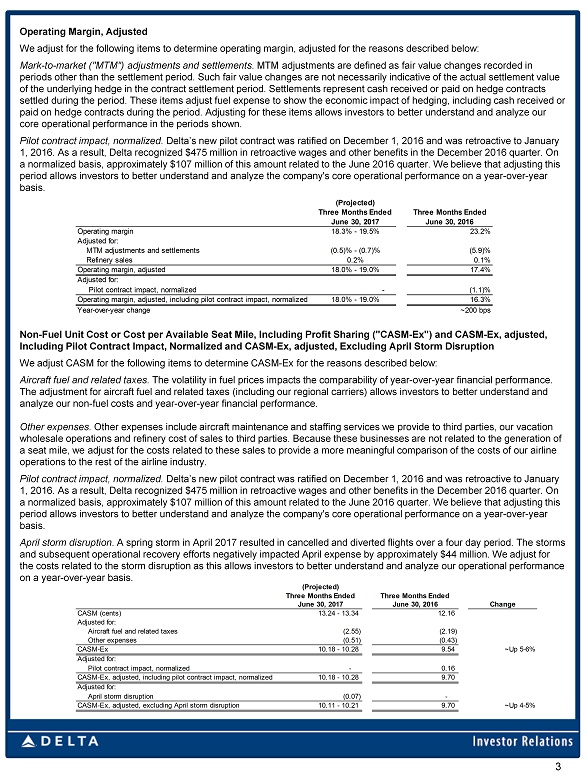
3 Operating Margin, Adjusted We adjust for the following items to determine operating margin, adjusted for the reasons described below: Mark - to - market ("MTM") adjustments and settlements. MTM adjustments are defined as fair value changes recorded in periods other than the settlement period. Such fair value changes are not necessarily indicative of the actual settlement val ue of the underlying hedge in the contract settlement period. Settlements represent cash received or paid on hedge contracts settled during the period. These items adjust fuel expense to show the economic impact of hedging, including cash received or paid on hedge contracts during the period. Adjusting for these items allows investors to better understand and analyze our core operational performance in the periods shown. Pilot contract impact, normalized . Delta’s new pilot contract was ratified on December 1, 2016 and was retroactive to January 1, 2016. As a result, Delta recognized $475 million in retroactive wages and other benefits in the December 2016 quarter. On a normalized basis, approximately $107 million of this amount related to the June 2016 quarter. We believe that adjusting thi s period allows investors to better understand and analyze the company's core operational performance on a year - over - year basis. Non - Fuel Unit Cost or Cost per Available Seat Mile, Including Profit Sharing ("CASM - Ex") and CASM - Ex, adjusted, Including Pilot Contract Impact, Normalized and CASM - Ex, adjusted, Excluding April Storm Disruption We adjust CASM for the following items to determine CASM - Ex for the reasons described below: Aircraft fuel and related taxes. The volatility in fuel prices impacts the comparability of year - over - year financial performance. The adjustment for aircraft fuel and related taxes (including our regional carriers) allows investors to better understand an d analyze our non - fuel costs and year - over - year financial performance. Other expenses. Other expenses include aircraft maintenance and staffing services we provide to third parties, our vacation wholesale operations and refinery cost of sales to third parties. Because these businesses are not related to the generation of a seat mile, we adjust for the costs related to these sales to provide a more meaningful comparison of the costs of our airli ne operations to the rest of the airline industry. Pilot contract impact, normalized. Delta’s new pilot contract was ratified on December 1, 2016 and was retroactive to January 1, 2016. As a result, Delta recognized $475 million in retroactive wages and other benefits in the December 2016 quarter. On a normalized basis, approximately $107 million of this amount related to the June 2016 quarter. We believe that adjusting thi s period allows investors to better understand and analyze the company's core operational performance on a year - over - year basis. April storm disruption . A spring storm in April 2017 resulted in cancelled and diverted flights over a four day period. The storms and subsequent operational recovery efforts negatively impacted April expense by approximately $44 million. We adjust for the costs related to the storm disruption as this allows investors to better understand and analyze our operational performan ce on a year - over - year basis. (Projected) Three Months Ended Three Months Ended June 30, 2017 June 30, 2016 Operating margin 18.3% - 19.5% 23.2% Adjusted for: MTM adjustments and settlements (0.5)% - (0.7)% (5.9)% Refinery sales 0.2% 0.1% Operating margin, adjusted 18.0% - 19.0% 17.4% - (1.1)% 18.0% - 19.0% 16.3% Year-over-year change ~200 bps Adjusted for: Pilot contract impact, normalized Operating margin, adjusted, including pilot contract impact, normalized (Projected) Three Months Ended Three Months Ended June 30, 2017 June 30, 2016 Change 13.24 - 13.34 12.16 (2.55) (2.19) (0.51) (0.43) 10.18 - 10.28 9.54 ~Up 5-6% - 0.16 10.18 - 10.28 9.70 (0.07) - 10.11 - 10.21 9.70 ~Up 4-5% Adjusted for: Pilot contract impact, normalized CASM-Ex, adjusted, including pilot contract impact, normalized Adjusted for: April storm disruption CASM-Ex, adjusted, excluding April storm disruption CASM (cents) Adjusted for: Aircraft fuel and related taxes Other expenses CASM-Ex
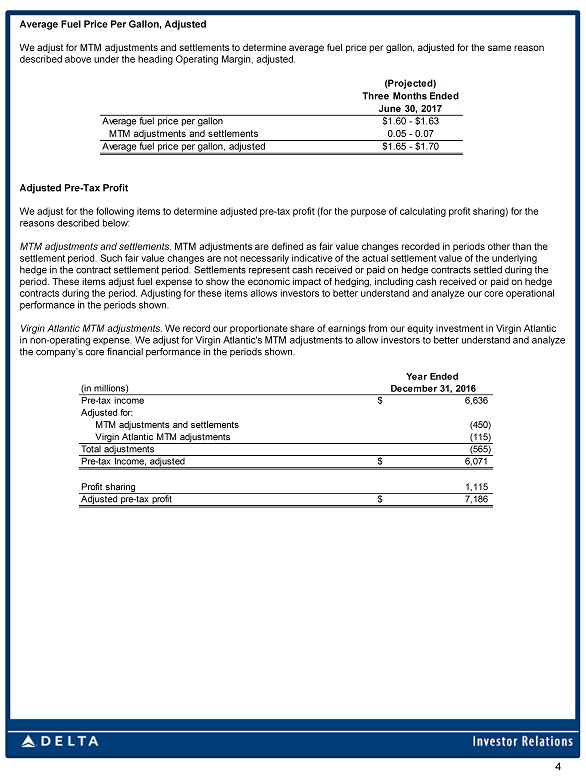
Average Fuel Price Per Gallon, Adjusted We adjust for MTM adjustments and settlements to determine average fuel price per gallon, adjusted for the same reason described above under the heading Operating Margin, adjusted. Adjusted Pre - Tax Profit We adjust for the following items to determine adjusted pre - tax profit (for the purpose of calculating profit sharing) for the reasons described below: MTM adjustments and settlements . MTM adjustments are defined as fair value changes recorded in periods other than the settlement period. Such fair value changes are not necessarily indicative of the actual settlement value of the underlying hedge in the contract settlement period. Settlements represent cash received or paid on hedge contracts settled during the period. These items adjust fuel expense to show the economic impact of hedging, including cash received or paid on hedge contracts during the period. Adjusting for these items allows investors to better understand and analyze our core operational performance in the periods shown. Virgin Atlantic MTM adjustments . We record our proportionate share of earnings from our equity investment in Virgin Atlantic in non - operating expense. We adjust for Virgin Atlantic's MTM adjustments to allow investors to better understand and analyze the company’s core financial performance in the periods shown. 4 Year Ended (in millions) December 31, 2016 Pre-tax income 6,636$ Adjusted for: MTM adjustments and settlements (450) Virgin Atlantic MTM adjustments (115) Total adjustments (565) Pre-tax Income, adjusted 6,071$ Profit sharing 1,115 Adjusted pre-tax profit 7,186$ (Projected) Three Months Ended June 30, 2017 Average fuel price per gallon $1.60 - $1.63 MTM adjustments and settlements 0.05 - 0.07 Average fuel price per gallon, adjusted $1.65 - $1.70