Attached files
| file | filename |
|---|---|
| EX-23.1 - EX-23.1 - Tintri, Inc. | d120560dex231.htm |
| EX-10.13 - EX-10.13 - Tintri, Inc. | d120560dex1013.htm |
| EX-10.12 - EX-10.12 - Tintri, Inc. | d120560dex1012.htm |
Table of Contents
As filed with the Securities and Exchange Commission on June 27, 2017
Registration No. 333-218429
UNITED STATES
SECURITIES AND EXCHANGE COMMISSION
Washington, D.C. 20549
AMENDMENT NO. 3
TO
FORM S-1
REGISTRATION STATEMENT
Under
The Securities Act of 1933
TINTRI, INC.
(Exact name of Registrant as specified in its charter)
| Delaware | 3572 | 26-2906978 | ||
| (State or other jurisdiction of incorporation or organization) |
(Primary Standard Industrial Classification Code Number) |
(I.R.S. Employer Identification Number) |
303 Ravendale Drive
Mountain View, CA 94043
(650) 810-8200
(Address, including zip code, and telephone number, including area code, of Registrant’s principal executive offices)
Ken Klein
Chairman and Chief Executive Officer
Tintri, Inc.
303 Ravendale Drive
Mountain View, CA 94043
(650) 810-8200
(Name, address, including zip code, and telephone number, including area code, of agent for service)
Copies to:
| Tony Jeffries Michael Coke Ben Hance Wilson Sonsini Goodrich & Rosati, P.C. 650 Page Mill Road Palo Alto, CA 94304 (650) 493-9300 |
Ian Halifax Chief Financial Officer Mike Coleman Vice President Legal 303 Ravendale Drive Mountain View, CA 94043 (650) 810-8200 |
Richard A. Kline An-Yen E. Hu Goodwin Procter LLP 135 Commonwealth Drive Menlo Park, CA 94025 (650) 752-3100 |
Approximate date of commencement of proposed sale to the public: As soon as practicable after this registration statement becomes effective.
If any of the securities being registered on this Form are to be offered on a delayed or continuous basis pursuant to Rule 415 under the Securities Act, check the following box: ☐
If this Form is filed to register additional securities for an offering pursuant to Rule 462(b) under the Securities Act, please check the following box and list the Securities Act registration statement number of the earlier effective registration statement for the same offering. ☐
If this Form is a post-effective amendment filed pursuant to Rule 462(c) under the Securities Act, check the following box and list the Securities Act registration statement number of the earlier effective registration statement for the same offering. ☐
If this Form is a post-effective amendment filed pursuant to Rule 462(d) under the Securities Act, check the following box and list the Securities Act registration statement number of the earlier effective registration statement for the same offering. ☐
Indicate by check mark whether the registrant is a large accelerated filer, an accelerated filer, a non-accelerated filer, a smaller reporting company or an emerging growth company. See the definitions of “large accelerated filer,” “accelerated filer,” “smaller reporting company” and “emerging growth company” in Rule 12b-2 of the Exchange Act. (Check one):
| Large accelerated filer | ☐ | Accelerated filer | ☐ | |||
| Non-accelerated filer | ☐ (Do not check if a smaller reporting company) | Smaller reporting company | ☐ | |||
| Emerging growth company | ☒ |
If an emerging growth company, indicate by check mark if the registrant has elected not to use the extended transition period for complying with any new or revised financial accounting standards provided pursuant to Section 7(a)(2)(B) of the Securities Act. ☒
CALCULATION OF REGISTRATION FEE
|
| ||||
| Title of Each Class of Securities to be Registered |
Proposed Offering Price(1)(2) |
Amount of Registration Fee | ||
| Common Stock, $.00005 par value per share |
$125,062,500 | $14,495(3) | ||
|
| ||||
|
| ||||
| (1) | Estimated solely for the purpose of computing the amount of the registration fee pursuant to Rule 457(o) under the Securities Act of 1933, as amended. |
| (2) | Includes the aggregate offering price of additional shares that the underwriters have the option to purchase to cover over-allotments, if any. |
| (3) | The Registrant previously paid the entirety of this amount in connection with previous filings of this Registration Statement. |
The Registrant hereby amends this Registration Statement on such date or dates as may be necessary to delay its effective date until the Registrant shall file a further amendment which specifically states that this Registration Statement shall thereafter become effective in accordance with Section 8(a) of the Securities Act of 1933 or until the Registration Statement shall become effective on such date as the Commission, acting pursuant to said Section 8(a), may determine.
Table of Contents
The information in this prospectus is not complete and may be changed. We may not sell these securities until the registration statement filed with the Securities and Exchange Commission is effective. This prospectus is not an offer to sell these securities and we are not soliciting offers to buy these securities in any jurisdiction where the offer or sale is not permitted.
PROSPECTUS (Subject to Completion)
Issued June 27, 2017
8,700,000 Shares

COMMON STOCK
Tintri, Inc. is offering 8,700,000 shares of its common stock. This is our initial public offering and no public market currently exists for our shares of common stock. We anticipate that the initial public offering price will be between $10.50 and $12.50 per share.
Our common stock has been approved for listing on The NASDAQ Global Market under the symbol “TNTR.”
We are an “emerging growth company” as defined under the federal securities laws. Investing in our common stock involves risks. See “Risk Factors” beginning on page 16.
PRICE $ A SHARE
| Price
to |
Underwriting |
Proceeds
to |
||||||||||
| Per Share |
$ | $ | $ | |||||||||
| Total |
$ | $ | $ | |||||||||
| (1) | See “Underwriters” for a description of the compensation payable to the underwriters. |
Certain of our existing stockholders, including entities affiliated with Lightspeed Venture Partners, New Enterprise Associates and Silverlake Kraftwerk, who are affiliated with members of our board of directors, and entities affiliated with Insight Venture Partners and Menlo Ventures, have indicated an interest in purchasing up to an aggregate of approximately $23.0 million in shares of our common stock in this offering at the initial public offering price. However, because indications of interest are not binding agreements or commitments to purchase, the underwriters may determine to sell more, less or no shares in this offering to any of these stockholders, or any of these stockholders may determine to purchase more, less or no shares in this offering. The underwriters will receive the same underwriting discounts and commissions on any shares purchased by these stockholders as they will on any other shares sold to the public in this offering.
We have granted the underwriters the right to purchase up to an additional 1,305,000 shares of common stock to cover over-allotments.
The Securities and Exchange Commission and state regulators have not approved or disapproved of these securities, or determined if this prospectus is truthful or complete. Any representation to the contrary is a criminal offense.
The underwriters expect to deliver the shares of common stock to purchasers on , 2017.
| MORGAN STANLEY | BofA MERRILL LYNCH | PACIFIC CREST SECURITIES a division of KeyBanc Capital Markets |
| NEEDHAM & COMPANY | PIPER JAFFRAY | RAYMOND JAMES | WILLIAM BLAIR |
, 2017
Table of Contents
Public cloud agility
in your data center
Table of Contents
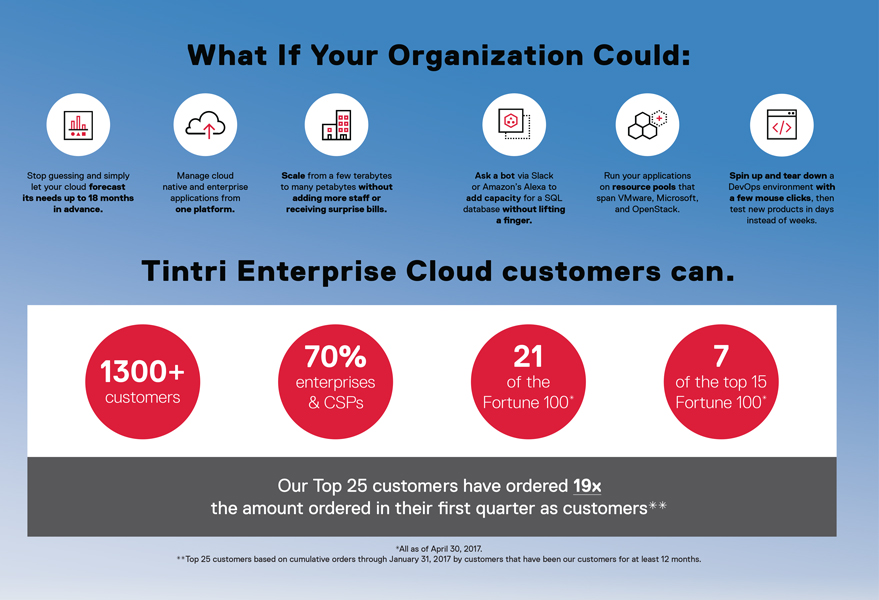
What If Your Organization Could:Stop guessing and simply Manage cloud Scale from a few terabytes Ask a bot via Slack Run your applications Spin up and tear down a let your cloud forecast native and enterprise to many petabytes without or Amazon’s Alexa to on resource pools that DevOps environment with its needs up to 18 months applications from adding more staff or add capacity for a SQL span VMware, Microsoft, a few mouse clicks, then in advance. one platform. receiving surprise bills. database without lifting and OpenStack. test new products in days a finger. instead of weeks. Tintri Enterprise Cloud customers can. Ou Top 25 customers have ordered 19x the amount ordered in their first quarter as customers** *All as of April 30, 2017. **Top 25 customers based on cumulative orders through January 31, 2017 by customers that have been our customers for at least 12 months.
Table of Contents
Unless the context otherwise requires, the terms “Tintri,” “Tintri, Inc.,” “the company,” “we,” “us” and “our” in this prospectus refer to Tintri, Inc. and its subsidiaries. Neither we nor the underwriters have authorized anyone to provide you with any information or make any representations other than those contained in this prospectus or in any free writing prospectus prepared by or on behalf of us or to which we have referred you. We take no responsibility for, and can provide no assurance as to the reliability of, any other information that others may give you. We are offering to sell, and seeking offers to buy, shares of common stock only in jurisdictions where offers and sales are permitted. The information contained in this prospectus is accurate only as of the date of this prospectus, regardless of the time of delivery of this prospectus or of any sale of the common stock. Our business, financial condition, operating results and prospects may have changed since that date.
Through and including , 2017 (the 25th day after the date of this prospectus), all dealers effecting transactions in these securities, whether or not participating in this offering, may be required to deliver a prospectus. This is in addition to a dealer’s obligation to deliver a prospectus when acting as an underwriter and with respect to an unsold allotment or subscription.
For investors outside of the United States: Neither we nor the underwriters have done anything that would permit this offering or possession or distribution of this prospectus in any jurisdiction where action for that purpose is required, other than in the United States. You are required to inform yourselves about and to observe any restrictions relating to this offering and the distribution of this prospectus outside of the United States.
i
Table of Contents
This summary highlights selected information contained elsewhere in this prospectus. This summary does not contain all the information that you should consider before deciding to invest in our common stock. You should read the entire prospectus carefully, including “Risk Factors,” “Management’s Discussion and Analysis of Financial Condition and Results of Operations” and our consolidated financial statements and notes to those consolidated financial statements before making an investment decision. Some of the statements in this prospectus constitute forward-looking statements. For more information, see “Special Note Regarding Forward-Looking Statements.”
TINTRI, INC.
Company Overview
Our mission is to provide large organizations and cloud service providers with an enterprise cloud platform that offers public cloud capabilities inside their own data centers and that can also connect to public cloud services.
Our highly-differentiated and extensible enterprise cloud platform combines cloud management software, web services and a range of all-flash storage systems. Our enterprise cloud platform not only delivers many of the benefits of public cloud infrastructure, but also gives organizations the control and functionality they need to run both enterprise and cloud-native applications in their own private cloud. Organizations use our platform as a foundation for their own private clouds—to build agile development environments and run mission-critical enterprise applications. We enable users to guarantee the performance of their organization’s applications, automate common IT tasks to reduce operating expenses, troubleshoot across compute, storage and network, predict their organization’s needs to scale and provide needed elasticity on demand. Our enterprise cloud platform enables organizations to easily scale to support tens of thousands of virtual machines on a single system across multiple hypervisors and containers. Our solution helps our customers optimize infrastructure by significantly simplifying deployment and operations, which can lead to substantial reductions in capital expenditures and operating expenses.
Our enterprise cloud platform is based on the Tintri CONNECT web services architecture, which has similar design characteristics as public cloud architecture—using web services that are easy to assemble, integrate, tear down, reconfigure, and connect to other services. Our CONNECT architecture uses a building-block approach that is predicated on REST application programming interfaces, or APIs, and virtual machine, or VM, and container level abstraction. REST APIs are needed to write automation scripts and connect to other elements of infrastructure, and make it possible for web services to be combined and to communicate with other services effectively. Through a comprehensive set of proprietary software tool kits and plugins, we enable users to develop customized workflows and to automate their operations. Our CONNECT architecture is based on our virtualization-aware file system that allows an organization to view, manage and analyze application performance and quality of service, or QoS. CONNECT integrates with all major virtualization architectures, including those offered by VMware, Microsoft, Citrix, Red Hat and OpenStack, and can connect with public cloud service providers. Our platform addresses a large variety of use cases, including server virtualization, virtual desktop infrastructure, or VDI, disaster recovery and data protection, and development operations, or DevOps.
We were founded in June 2008 and introduced our first products in March 2011. We focus on large private and public sector organizations and cloud service providers, or CSPs. We had more than 1,300 customers, including seven of the top 15 Fortune 100 companies and 21 of the Fortune 100 companies, which span a diverse set of industry verticals, such as education, financial services and insurance, healthcare, manufacturing and technology, all as of April 30, 2017. Many of our customers continue to purchase from us on an ongoing basis.
1
Table of Contents
We define our customers as the end-users who have purchased one or more of our products. Our top 25 customers (as measured by their cumulative orders through January 31, 2017) that have been our customers for at least twelve months have on average cumulatively ordered more than 19x the amount they ordered from us in their first quarter as a customer. We plan to continue to focus on acquiring customers and maximizing their lifetime value through our demonstrated land-and-expand strategy.
We have experienced significant revenue growth, with revenue increasing from $49.8 million in fiscal 2015 to $86.0 million in fiscal 2016 and to $125.1 million in fiscal 2017, representing year-over-year growth of 73% and 45%, respectively, for our two most recent fiscal years. Our revenue increased from $22.9 million in the three months ended April 30, 2016 to $30.4 million in the three months ended April 30, 2017, representing period-over-period growth of 33%. Our net loss was $69.7 million, $101.0 million, and $105.8 million in fiscal 2015, 2016, and 2017, respectively, and $30.8 million and $30.7 million in the three months ended April 30, 2016 and 2017, respectively. We have funded our activities primarily through debt and equity financings. As of April 30, 2017, we had an accumulated deficit of $376.0 million.
Industry Background
Cloud technologies are changing how organizations deploy, manage and support the applications that are critical to running their businesses.
Adoption of Private and Public Cloud Solutions to Address Diverse Application Requirements
The conventional IT model, which has been constrained by siloed, costly and inflexible infrastructure, is giving way to cloud architectures that are designed to serve business applications with increased agility, productivity and cost-efficiency. Enterprises are seeking to deploy cloud technologies through either public clouds or private clouds, which includes both on-premise and hosted options.
Many organizations also have realized that while public cloud delivers many benefits, it is not the right solution for all problems. Moving applications to public cloud platforms can result in significant migration cost and effort, requiring applications to be recoded, reconfigured, refactored, and reintegrated. In addition, while public cloud infrastructure is able to scale applications with fluctuating demand, the unexpected cost from unpredictable data growth or the cost of a large scale cloud deployment can quickly get out of control. Private clouds provide many of the benefits of public clouds, such as resource pooling, rapid scaling, automation and self-service, but with superior security, control and flexibility for the organization’s applications. Private clouds give organizations more control over access and usage of their applications, making private clouds ideal for larger businesses or those with strict data, regulatory and governance obligations. Unlike public-cloud solutions, private clouds can satisfy the needs of both enterprise and cloud-native applications. Many companies now utilize a combination of public clouds and private clouds.
In recent years, businesses have significantly increased their use of virtualization and containers to achieve greater infrastructure cost-efficiencies and scale. IDC estimates that by the end of 2020, virtualized instances would represent over 90% of the instances deployed globally. IDC’s CloudView Survey respondents expect their IT budget for the private cloud to grow 51.5% from 2016 to 2018. Many companies now utilize a combination of public clouds and private clouds. A recent IDC report predicted that more than 85% of enterprise IT organizations will commit to multicloud architectures encompassing a mix of public cloud services, private clouds and hosted clouds by 2018.
Emergence of Enterprise Cloud
The compelling benefits of private cloud and the desire to have access to public cloud give rise to what is generally referred to as an enterprise cloud, which is a cloud infrastructure deployed in an organization’s own
2
Table of Contents
data center with connections to public cloud services. An enterprise cloud possesses many of the same benefits and capabilities as public cloud, including autonomous services, automation, self-service and analytics, with added control, security, and support for enterprise applications that only a private cloud can provide. The National Institute of Standards and Technology definition lists five essential characteristics of cloud computing—on-demand self-service, broad network access, resource pooling, rapid elasticity or expansion and measured services, which are the key attributes of the functionality offered by enterprise cloud. With this functionality, an enterprise cloud solution can deliver many of the benefits of public cloud and can achieve the desired functionality, scalability and efficiency that organizations need.
Limitations of Conventional Data Center Infrastructure
While private cloud can deliver many of the benefits of public cloud, we believe that organizations have difficulty deploying an enterprise cloud platform built using conventional architectures. While many infrastructure components, including server, network and security, have evolved to support virtualized infrastructure and migration to the cloud, innovation in storage has lagged and lacked granular level operation at the VM and container level. As a result, organizations that have deployed next-generation servers, networking and security infrastructure have found it significantly more time-consuming and complex to manage, diagnose and fix performance issues with their conventional storage.
The industry has attempted to bridge the gap between conventional and cloud architecture through hyperconverged infrastructure, or HCI. We believe enterprise customers require the ability to support tens of thousands of VMs, which HCI solutions struggle to achieve. Additionally, it can be harder to independently scale resources with HCI systems. Because of these limitations, HCI systems do not meet many of the requirements of an enterprise cloud platform.
Requirements of an Enterprise Cloud Platform
An enterprise cloud platform combines cloud management with storage to simplify the management and operation of enterprise or cloud-native applications. We believe the requirements of an enterprise cloud platform are:
| • | consistent and autonomous QoS; |
| • | application level insight; |
| • | comprehensive automation capabilities; |
| • | ease of deployment and highly scalable; |
| • | simple self-service models; |
| • | private and public cloud integration; and |
| • | software-based services with ability to mix and match services. |
Our Solution
Our highly differentiated and extensible enterprise cloud platform combines cloud management software and a range of all-flash storage systems. Organizations use our platform as a foundation for their own private clouds—to build and run agile development environments for cloud-native applications and mission-critical enterprise applications.
Our enterprise cloud platform is based on the Tintri CONNECT web services architecture, which is designed using a building-block approach predicated on REST APIs and VM and container level abstraction.
3
Table of Contents
Through a comprehensive set of proprietary software tool kits and plugins, we enable customers to develop customized workflows and to automate their operations. Our platform addresses a large variety of use cases, including DevOps, disaster recovery and data protection, server virtualization and desktop virtualization.
Tintri’s enterprise cloud platform addresses the requirements of the modern data center, especially in large and complex environments across multiple hypervisors. By creating an architecture fully aligned with virtualized applications, our enterprise cloud solutions provide the following benefits to our customers.
| • | Autonomous Operation—Deliver Consistent Application Performance. Our CONNECT architecture provides automated QoS to help ensure that every application performs as desired. By contrast, traditional storage requires users to manually intervene to manage performance levels. |
| • | Analytics—Improve Decisions with Real-time and Predictive Analysis. Our solution allows for deeper visibility into every application, identifies underperforming applications and addresses the root cause of latency with minimal time and effort. By contrast, conventional storage and software products aggregate and average metrics over hundreds of virtualized applications. |
| • | Automation—Simplify Deployment and Management at Scale. Our solution is easy to install, configure and manage. Most installations of our systems take less than 60 minutes and can be deployed entirely by the customer at a greatly reduced cost without our field engineers and support staff. By contrast, conventional storage generally requires specialized storage expertise or third-party software to manage and operate which increases cost, complexity and potential for error. |
| • | Self-service—Remove Dependencies on IT to Accelerate Business. Using our self-service tools, IT generalists in the data center, or non-IT staff members in a business unit, can administer our platform to simplify tasks such as requesting capacity, performance, policies and other actions. |
| • | Support and Manage Complex Environments Using an Open and Versatile Architecture. Our open architecture natively supports all major virtualization architectures and can connect with public cloud service providers, making it an ideal solution for complex enterprise and cloud environments. |
| • | Provide Customers with Software-Based Choice. Our software allows organizations to choose the specific features such as replication, encryption, cloning, snapshots and predictive analytics based on relevance to their unique deployments. We are thus able to configure software solutions to meet the specific needs of various customers. |
We believe that our highly differentiated solution delivers compelling value for virtualized organizations over conventional data center architectures.
Market Opportunity
Our enterprise cloud platform solution and software products address the key enterprise cloud requirements, and deliver them through a mix of on-premises storage hardware, value-added storage software and SaaS-based software services for virtualized environments. We participate in the global virtualized x86 storage systems market, which according to IDC is expected to grow from $25.7 billion in 2017 to $27.0 billion in 2018, and the virtualized x86 storage software market, which according to IDC is expected to grow from $9.5 billion in 2017 to $10.4 billion in 2018.
To address the global virtualized x86 storage systems and software market opportunity, which according to IDC is expected to be $37.4 billion in 2018, Tintri taps into the following demand drivers:
| • | Adoption of Virtualization-Centric Storage Systems. IDC expects the subset of the storage segment for virtualized x86 server environments which are based on IP protocols, which we define as NAS and iSCSI combined, to grow from $7.1 billion in 2017 to $7.4 billion in 2018. |
4
Table of Contents
| • | Move to Flash-Based Storage. IDC expects the all-flash array storage market to grow from $5.8 billion in 2017 to $6.8 billion in 2018. |
| • | Use of Primary Storage Platforms for Data Protection and Recovery. IDC forecasts that the market for disk-based data protection and recovery will grow from $15.5 billion in 2017 to $16.1 billion in 2018. |
Our enterprise cloud solutions allow us to capture spend from the following markets (some of which may overlap with the above listed storage systems and software market segments), which have an estimated combined spend of $27.2 billion in 2018, according to IDC:
| • | The spend on storage hardware deployed in private clouds, which is expected to be $7.8 billion; |
| • | The spend on storage software deployed on-premise, which is expected to be $15.5 billion; and |
| • | The spend on cloud systems management software deployed on-premise, which is expected to be $3.9 billion. |
Our Competitive Strengths
We believe we have competitive strengths that will enable us to maintain and expand our position in the enterprise cloud market, including:
| • | Our Solution Is Purpose-Built for Enterprise Cloud. Our solution’s ability to monitor and manage at the individual virtual machine and container level is central to our ability to deliver differentiated value to customers. Since 2008, we have spent over 400 person years to develop solutions purpose-built for enterprise cloud environments. We believe that our competitors would need to materially re-architect their products’ hardware and software to provide similar functionality. |
| • | Our Value Stems from Highly Differentiated Software. Tintri CONNECT operates at the individual virtual machine and container level, which unlocks the potential of our software and makes it possible for customers to, for example, guarantee application performance by automatically optimizing system resources; move and protect data and troubleshoot at VM and container level; predict future performance and capacity growth; and provide VM and container level visibility across the entire infrastructure. |
| • | Our Customers Purchase Our Software Products Incrementally. Our customers may buy software products incrementally or as part of a suite on an as-needed basis and tailor their solutions to their specific enterprise environment requirements. We believe that by offering our customers this flexibility, we provide them with differentiated value, thereby enabling us to drive incremental product sales. |
| • | We Offer Our Customers the Ability to Balance Private Cloud and Public Cloud Deployments. We enable organizations to achieve the right mix of private and public cloud deployments to meet their objectives. Our architecture offers the benefits of public clouds to those workloads that best reside in the enterprise data center. We have developed connector software that is designed to connect the private cloud with public clouds. Competitive alternatives do not offer comprehensive APIs that enable full automation, serve as a building block, or simplify connections to public clouds. |
| • | We Successfully Sell Enterprise Cloud to Large Organizations and CSPs. We sell to a growing list of large organizations and CSP customers. Our value proposition to these customers is particularly compelling given that these organizations have large data centers with complex requirements and can benefit the most from self-service, automated workflows, predictive analytics and guaranteed application performance through autonomous operation. |
5
Table of Contents
| • | Our Partners Build Added Value Solutions and Services. Our partners help bring value to our platform by offering differentiated solutions and services that are tightly integrated with our architecture and software solutions. Our partners leverage our platform to build cloud services, delivering our value proposition to DevOps and lines of business that typically engage less with infrastructure buying decisions. Our partners also use our APIs to offer customers differentiated automation and orchestration services. This allows us to position our partners as strategic advisors for our customers. |
Our Growth Strategy
We intend to extend our position as a leader in providing enterprise cloud solutions to large organizations and CSPs. Key elements of our growth strategy include:
| • | Extend Our Differentiation in Enterprise Cloud through Continued Software Innovation. We plan to continue to invest in enhancing our CONNECT architecture and our enterprise cloud platform, and extending our portfolio of software products, thereby driving cross-selling and attach rates. |
| • | Pursue Additional Large Organizations and CSPs. We intend to continue our sales efforts to further penetrate the Global 2000 enterprises and CSPs with the most demanding workloads and complex cloud requirements. |
| • | Leverage Line of Business Buyers to Accelerate Adoption. We intend to continue to focus on selling to line of business buyers, who generally have their own IT budgets, and leverage those relationships to sell more broadly within their organizations. |
| • | Increase Sales to Installed Base. We intend to continue expanding our footprint with our existing customers by supporting additional use cases and selling additional software products. These additional use cases include data protection and disaster recovery, to expand our total addressable market. |
| • | Expand Sales and Marketing Presence in New and Existing Markets. We plan to expand our presence in both existing and new markets, including territories in the Middle East, Asia and Europe. |
| • | Support Value-Add Channel Partners. We expect to focus our efforts on supporting those partners offering cloud services, including infrastructure “stacks” that include our solutions. |
| • | Expand and Deepen Technology Partnerships and Integrations. We intend to expand and deepen our relationships with leading technology companies. We expect to continue to work closely with our partners to achieve certifications and integrations as well as to seek additional partnerships that will allow us to address new customer use cases and deployments. |
Risks Associated with Our Business
Our business is subject to numerous risks and uncertainties, including those highlighted in “Risk Factors” immediately following this Prospectus Summary. These risks include, but are not limited to, the following:
| • | we have a history of losses and may not be able to achieve or maintain profitability; |
| • | we have a limited operating history, which makes our future operating results difficult to predict and exposes our business to a number of risks and uncertainties; |
| • | our revenue growth rate in recent periods may not be indicative of our future performance; |
| • | our operating results may fluctuate significantly on a quarterly basis, which could make our future results difficult to predict and could cause our operating results to fall below expectations; |
| • | we face intense competition from numerous established companies and new entrants; |
6
Table of Contents
| • | we have experienced rapid growth in recent periods, and if we do not effectively manage any future growth or are unable to improve our systems, processes and controls, our business may be adversely affected; |
| • | if the enterprise cloud market does not evolve as we anticipate or our target customers do not adopt our enterprise cloud solutions, we may not be able to compete effectively, and our ability to generate revenue will suffer; |
| • | our growth depends in part on our ability to attract new customers and sell additional solutions and renewals to existing customers; |
| • | if our third-party channel partners fail to perform, our ability to sell and distribute our solutions will be limited, and our operating results will be adversely affected; |
| • | reliance on shipments at the end of the quarter could cause our revenue for the applicable period to fall below expected levels; |
| • | the markets for enterprise cloud systems and storage solutions are rapidly evolving and, if we fail to correctly anticipate and respond to developing industry trends, demand for our solutions may decline; |
| • | if we fail to develop or introduce new or enhanced solutions on a timely basis, our ability to attract and retain customers could be impaired and our competitive position could be adversely affected; |
| • | our solutions must interoperate with third-party hypervisors and operating systems, software applications and hardware, and if we fail to maintain the compatibility of our solutions with such software and hardware, we may lose or fail to increase our market share and may experience reduced demand for our solutions; and |
| • | if we are not able to successfully increase sales of our solutions to large organizations and CSPs, our operating results may suffer. |
Corporate Information
We were incorporated in Delaware in June 2008. Our principal executive offices are located at 303 Ravendale Drive, Mountain View, CA 94043. Our telephone number at that location is (650) 810-8200. Our website address is www.tintri.com. Information on our website is not part of this prospectus and should not be relied upon in determining whether to make an investment decision.
The Tintri design logo and the marks “Tintri,” “VMstore,” “Tintri OS,” “Tintri Global Center,” “ReplicateVM,” “SecureVM,” “SyncVM” and “VM Scale-out” are the property of Tintri. This prospectus contains additional trade names, trademarks and service marks of other companies. We do not intend our use or display of other companies’ trade names, trademarks or service marks to imply a relationship with, or endorsement or sponsorship of us by, these other companies.
Emerging Growth Company Status
We are an “emerging growth company,” as defined in the Jumpstart Our Business Startups Act of 2012, or the JOBS Act. As such, we are eligible to take advantage of certain exemptions from various reporting requirements that are applicable to other public companies including, but not limited to:
| • | reduced disclosure of financial information in this prospectus, including two years of audited financial information and two years of selected financial information; |
| • | not being required to comply with the auditor attestation requirements of Section 404 of the Sarbanes-Oxley Act of 2002, or the Sarbanes-Oxley Act; |
| • | reduced disclosure obligations regarding executive compensation; |
7
Table of Contents
| • | exemptions from the requirements of holding a non-binding advisory vote on executive compensation and golden parachute arrangements; and |
| • | delayed adoption of new or revised accounting standards issued subsequent to the enactment of the JOBS Act until such time as those standards apply to private companies. |
We have elected to include reduced disclosure of financial information and reduced disclosure regarding executive compensation in this prospectus. In addition, we have irrevocably elected not to avail ourselves of the exemption allowing for delayed adoption of new or revised accounting standards and, therefore, will be subject to the same new or revised accounting standards as other public companies that are not emerging growth companies. Other than with respect to our election regarding the timing of the adoption of the new accounting standards, we may choose to take advantage of one or more of these exemptions in the future.
We will remain an emerging growth company until the earliest to occur of: the last day of the fiscal year in which we have more than $1.07 billion in annual revenue; the date we qualify as a “large accelerated filer,” with at least $700 million of equity securities held by non-affiliates; the issuance, in any three-year period, by us of more than $1.0 billion in non-convertible debt securities; and the last day of the fiscal year ending after the fifth anniversary of our initial public offering.
8
Table of Contents
THE OFFERING
| Common stock offered by us |
8,700,000 shares | |
| Option to purchase additional shares being offered by us |
We have granted the underwriters a 30-day option to purchase up to 1,305,000 additional shares of common stock at the public offering price less underwriting discounts and commissions. | |
| Common stock to be outstanding after this offering |
31,038,806 shares (32,343,806 shares, if the underwriters exercise their option to purchase additional shares in full). | |
| Use of proceeds |
We estimate that the net proceeds from our sale of shares of common stock in this offering at an assumed initial public offering price of $11.50 per share, the midpoint of the price range reflected on the cover page of this prospectus, after deducting estimated underwriting discounts and commissions and estimated offering expenses payable by us, will be approximately $87.5 million, or $101.5 million if the underwriters’ option to purchase additional shares is exercised in full. | |
| We intend to use the net proceeds from this offering for general corporate purposes, including working capital, sales and marketing activities, engineering initiatives, including enhancement of our solution and investment in technology and development, general and administrative expenses and capital expenditures. We also may use a portion of the net proceeds from this offering to acquire or invest in businesses, products, services or technologies that complement our business, although we have no present commitments to complete any such transactions. | ||
| Proposed purchases by current stockholders |
Certain of our existing stockholders, including entities affiliated with Lightspeed Venture Partners, New Enterprise Associates and Silverlake Kraftwerk, who are affiliated with members of our board of directors, and entities affiliated with Insight Venture Partners and Menlo Ventures, have indicated an interest in purchasing up to an aggregate of approximately $23.0 million in shares of our common stock in this offering at the initial public offering price. However, because indications of interest are not binding agreements or commitments to purchase, the underwriters may determine to sell more, less or no shares in this offering to any of these stockholders, or any of these stockholders may determine to purchase more, less or no shares in this offering. The underwriters will receive the same underwriting | |
9
Table of Contents
| discounts and commissions on any shares purchased by these stockholders as they will on any other shares sold to the public in this offering. Any shares purchased by such existing stockholders will be subject to the lock-up restrictions described in “Shares Eligible for Future Sale.” | ||
| Concentration of Ownership |
Upon the completion of this offering, our executive officers and directors and stockholders holding more than 5% of our outstanding shares, and their affiliates, will beneficially own, in the aggregate, approximately 62.8% of our outstanding shares as of May 31, 2017. This excludes shares that could be purchased in this offering by stockholders holding more than 5% of our outstanding shares and their affiliates. See “Principal Stockholders” for additional information. | |
| NASDAQ trading symbol |
“TNTR” | |
The number of shares of our common stock to be outstanding after this offering is based on 22,338,806 shares of our common stock (reflecting the amendment to our amended and restated certificate of incorporation on June 1, 2017) outstanding as of April 30, 2017, and excludes:
| • | 635,643 shares of common stock issuable upon the exercise of options with an exercise price of less than $13.68 outstanding as of April 30, 2017, with a weighted-average exercise price of $6.36 per share; |
| • | 3,344,525 shares of common stock issuable upon the exercise of options with an exercise price of $13.68 or more outstanding as of April 30, 2017, with a weighted-average exercise price of $13.86 per share; |
| • | 1,165,328 shares of common stock issuable upon the exercise of options granted after April 30, 2017 with a weighted-average exercise price of $13.68 per share; |
| • | 230,897 (reflecting the amendment to our amended and restated certificate of incorporation on June 1, 2017) shares of common stock issuable upon the exercise of warrants outstanding as of April 30, 2017, with a weighted-average exercise price of $13.83 per share; |
| • | 1,666,665 shares of common stock issuable upon the exercise of warrants issued after April 30, 2017, with an exercise price of $16.44 per share; |
| • | 1,020,230 shares of common stock issuable upon the vesting of RSUs outstanding as of April 30, 2017; |
| • | 1,443,116 shares of common stock issuable upon the vesting of RSUs granted or approved after April 30, 2017; |
| • | 589,624 shares of common stock which were repurchased by us on June 1, 2017; and |
| • | 5,444,402 shares of common stock reserved for future issuance under our stock-based compensation plans, consisting of (i) 402 shares of common stock reserved for future issuance under our 2008 Stock Plan, (ii) 4,537,000 shares of common stock reserved for future issuance under our 2017 Equity Incentive Plan which will become effective one business day prior to the effectiveness of the registration statement of which this prospectus is made a part, and (iii) 907,000 shares of common stock reserved for future issuance under our 2017 Employee Stock Purchase Plan, which will become effective on the day of its adoption by our board of directors. In addition, the shares of common stock that are available under our 2017 Equity Incentive Plan and 2017 Employee Stock Purchase Plan may |
10
Table of Contents
| be increased pursuant to provisions thereof that automatically increase the share reserves under the plans each year, as more fully described in “Executive Compensation—Employee Benefit and Stock Plans.” |
Except as otherwise indicated, all information in this prospectus assumes:
| • | a one-for-six reverse split of our common stock to be effected prior to the completion of this offering; |
| • | the effectiveness of our amended and restated certificate of incorporation immediately prior to the completion of this offering; |
| • | the automatic conversion and reclassification of all outstanding shares of our convertible preferred stock into an aggregate of 17,992,973 shares of our common stock (reflecting the amendment to our amended and restated certificate of incorporation on June 1, 2017), which will occur immediately prior to the completion of this offering; |
| • | the conversion of all outstanding warrants to purchase convertible preferred stock into warrants to purchase shares of common stock at the then-applicable conversion rate; |
| • | no exercise of outstanding options or warrants subsequent to April 30, 2017; |
| • | the repricing of stock options described in “Executive Compensation—Fiscal 2018 Option Repricing”; and |
| • | no exercise of the underwriters’ option to purchase additional shares. |
11
Table of Contents
SUMMARY CONSOLIDATED FINANCIAL DATA
The following table summarizes our consolidated financial data. The summary consolidated statements of operations data presented below for fiscal 2015, 2016 and 2017 are derived from our audited consolidated financial statements that are included elsewhere in this prospectus. The following summary consolidated financial data should be read together with our consolidated financial statements and the related notes, as well as “Management’s Discussion and Analysis of Financial Condition and Results of Operations” included elsewhere in this prospectus. The summary consolidated statement of operations data presented below for the three months ended April 30, 2016 and 2017, and the consolidated balance sheet as of April 30, 2017 are derived from our unaudited interim consolidated financial statements appearing elsewhere in this prospectus. Our historical results are not necessarily indicative of our results in any future period.
| Fiscal Year Ended January 31, | Three Months Ended April 30, |
|||||||||||||||||||
| 2015 | 2016 | 2017 | 2016 | 2017 | ||||||||||||||||
| (in thousands, except |
(unaudited) | |||||||||||||||||||
| Consolidated Statement of Operations Data: |
||||||||||||||||||||
| Revenue: |
||||||||||||||||||||
| Product |
$ | 41,420 | $ | 68,652 | $ | 97,330 | $ | 16,677 | $ | 22,387 | ||||||||||
| Support and maintenance |
8,379 | 17,360 | 27,775 | 6,199 | 7,968 | |||||||||||||||
|
|
|
|
|
|
|
|
|
|
|
|||||||||||
| Total revenue |
49,799 | 86,012 | 125,105 | 22,876 | 30,355 | |||||||||||||||
|
|
|
|
|
|
|
|
|
|
|
|||||||||||
| Cost of revenue: |
||||||||||||||||||||
| Product(1) |
17,144 | 25,138 | 34,738 | 5,936 | 8,909 | |||||||||||||||
| Support and maintenance(1) |
4,565 | 7,110 | 9,437 | 2,072 | 3,039 | |||||||||||||||
|
|
|
|
|
|
|
|
|
|
|
|||||||||||
| Total cost of revenue |
21,709 | 32,248 | 44,175 | 8,008 | 11,948 | |||||||||||||||
|
|
|
|
|
|
|
|
|
|
|
|||||||||||
| Gross profit: |
||||||||||||||||||||
| Product |
24,276 | 43,514 | 62,592 | 10,741 | 13,478 | |||||||||||||||
| Support and maintenance |
3,814 | 10,250 | 18,338 | 4,127 | 4,929 | |||||||||||||||
|
|
|
|
|
|
|
|
|
|
|
|||||||||||
| Total gross profit |
28,090 | 53,764 | 80,930 | 14,868 | 18,407 | |||||||||||||||
|
|
|
|
|
|
|
|
|
|
|
|||||||||||
| Operating expenses: |
||||||||||||||||||||
| Research and development(1) |
28,155 | 43,179 | 53,445 | 13,659 | 14,923 | |||||||||||||||
| Sales and marketing(1) |
55,060 | 87,993 | 108,903 | 24,996 | 27,442 | |||||||||||||||
| General and administrative(1) |
13,941 | 18,773 | 19,364 | 5,675 | 5,332 | |||||||||||||||
|
|
|
|
|
|
|
|
|
|
|
|||||||||||
| Total operating expenses |
97,156 | 149,945 | 181,712 | 44,330 | 47,697 | |||||||||||||||
|
|
|
|
|
|
|
|
|
|
|
|||||||||||
| Loss from operations |
(69,066 | ) | (96,181 | ) | (100,782 | ) | (29,462 | ) | (29,290 | ) | ||||||||||
| Other expense, net: |
||||||||||||||||||||
| Interest expense |
(279 | ) | (4,407 | ) | (5,231 | ) | (1,437 | ) | (1,274 | ) | ||||||||||
| Other income (expense), net |
(119 | ) | 254 | 677 | 286 | 42 | ||||||||||||||
|
|
|
|
|
|
|
|
|
|
|
|||||||||||
| Total other expense, net |
(398 | ) | (4,153 | ) | (4,554 | ) | (1,151 | ) | (1,232 | ) | ||||||||||
|
|
|
|
|
|
|
|
|
|
|
|||||||||||
| Loss before provision for income taxes |
(69,464 | ) | (100,334 | ) | (105,336 | ) | (30,613 | ) | (30,522 | ) | ||||||||||
| Provision for income taxes |
222 | 634 | 465 | 198 | 158 | |||||||||||||||
|
|
|
|
|
|
|
|
|
|
|
|||||||||||
| Net loss |
$ | (69,686 | ) | $ | (100,968 | ) | $ | (105,801 | ) | $ | (30,811 | ) | $ | (30,680 | ) | |||||
|
|
|
|
|
|
|
|
|
|
|
|||||||||||
| Deemed dividend to Series E and E-1 Convertible Preferred Stock (unaudited) |
— | — | — | — | (6,588 | ) | ||||||||||||||
|
|
|
|
|
|
|
|
|
|
|
|||||||||||
| Net loss attributable to common stockholders |
$ | (69,686 | ) | $ | (100,968 | ) | $ | (105,801 | ) | $ | (30,811 | ) | $ | (37,268 | ) | |||||
|
|
|
|
|
|
|
|
|
|
|
|||||||||||
| Net loss per share attributable to common stockholders, basic and diluted(2) |
$ | (25.34 | ) | $ | (32.15 | ) | $ | (30.73 | ) | $ | (9.15 | ) | $ | (10.35 | ) | |||||
|
|
|
|
|
|
|
|
|
|
|
|||||||||||
| Weighted-average shares used to compute net loss per share attributable to common stockholders, basic and diluted(2) |
2,750,413 | 3,140,947 | 3,442,549 | 3,368,159 | 3,602,380 | |||||||||||||||
|
|
|
|
|
|
|
|
|
|
|
|||||||||||
| Pro forma net loss per share attributable to common stockholders, basic and diluted—unaudited(2) |
$ | (4.93 | ) | $ | (1.43 | ) | ||||||||||||||
|
|
|
|
|
|||||||||||||||||
| Pro forma weighted-average shares used in computing pro forma net loss per share attributable to common stockholders, basic and diluted—unaudited(2) |
21,435,522 | 21,595,353 | ||||||||||||||||||
|
|
|
|
|
|||||||||||||||||
12
Table of Contents
| (1) | Includes stock-based compensation expense as follows: |
| Fiscal Year Ended January 31, | Three Months Ended April 30, |
|||||||||||||||||||
| 2015 | 2016 | 2017 | 2016 | 2017 | ||||||||||||||||
| (in thousands) |
(unaudited) | |||||||||||||||||||
| Cost of product revenue |
$ | 82 | $ | 181 | $ | 264 | $ | 62 | $ | 71 | ||||||||||
| Cost of support and maintenance revenue |
92 | 176 | 323 | |
76 |
|
115 | |||||||||||||
| Research and development |
1,762 | 2,906 | 5,227 | 1,476 | 1,276 | |||||||||||||||
| Sales and marketing |
1,658 | 3,073 | 4,115 | 1,223 | 1,044 | |||||||||||||||
| General and administrative |
1,600 | 3,419 | 3,905 | 961 | 959 | |||||||||||||||
|
|
|
|
|
|
|
|
|
|
|
|||||||||||
| Total stock-based compensation expense |
$ | 5,194 | $ | 9,755 | $ | 13,834 | $ | 3,798 | $ | 3,465 | ||||||||||
|
|
|
|
|
|
|
|
|
|
|
|||||||||||
| (2) | See Note 12 to our consolidated financial statements that are included elsewhere in this prospectus for an explanation of the calculations of our basic and diluted net loss per share attributable to common stockholders, and unaudited pro forma net loss per share attributable to common stockholders calculations. |
| As of April 30, 2017 | ||||||||||||
| Actual | Pro Forma(1) | Pro Forma as Adjusted(2)(3) |
||||||||||
| (unaudited) |
||||||||||||
| (in thousands) |
||||||||||||
| Consolidated Balance Sheet Data: |
||||||||||||
| Cash and cash equivalents |
$ | 48,692 | $ | 48,692 | $ | 136,239 | ||||||
| Working capital |
21,554 | 21,554 | 109,101 | |||||||||
| Total assets |
97,095 | 97,095 | 184,642 | |||||||||
| Deferred revenue, current and non-current |
60,030 | 60,030 | 60,030 | |||||||||
| Long-term debt, current and non-current |
68,404 | 68,404 | 68,404 | |||||||||
| Convertible preferred stock |
263,729 | — | — | |||||||||
| Total stockholders’ equity/(deficit) |
(332,215 | ) | (67,797 | ) | 19,750 | |||||||
| (1) | The pro forma column reflects the conversion of all outstanding shares of convertible preferred stock into 17,992,973 shares of common stock (reflecting the amendment to our amended and restated certificate of incorporation on June 1, 2017) immediately upon the closing of this offering. |
| (2) | The pro forma as adjusted column further reflects the receipt of $87.5 million in net proceeds from our sale of 8.7 million shares of common stock in this offering at the initial public offering price of $11.50 per share, the midpoint of the range on the cover page of this prospectus, after deducting underwriting discounts and commissions and estimated offering expenses payable by us. |
| (3) | Each $1.00 increase or decrease in the assumed initial public offering price of $11.50 per share, the midpoint of the offering price range set forth on the cover of this prospectus, would increase or decrease, respectively, the amount of cash and cash equivalents, working capital, total assets and total stockholders’ equity/(deficit) equity by $8.1 million, assuming the number of shares offered by us, as set forth on the cover page of this prospectus, remains the same and after deducting underwriting discounts and commissions. We may also increase or decrease the number of shares we are offering. An increase or decrease of 1.0 million in the number of shares we are offering would increase or decrease, respectively, the amount of cash and cash equivalents, working capital, total assets and total stockholders’ equity/(deficit) by approximately $10.7 million, assuming the assumed initial public offering price per share, as set forth on the cover page of this prospectus, remains the same after deducting underwriting discounts and commissions. The pro forma as adjusted information is illustrative only, and we will adjust this information based on the actual initial public offering price and other terms of this offering determined at pricing. |
13
Table of Contents
Key Financial and Operational Metrics
We monitor the following key financial and operational metrics:
| As of or for the Fiscal Year Ended January 31, |
As of or for the Three Months Ended April 30, |
|||||||||||||||||||
| 2015 | 2016 | 2017 | 2016 | 2017 | ||||||||||||||||
| (unaudited) | ||||||||||||||||||||
| (dollars in thousands) | ||||||||||||||||||||
| Total revenue |
$ | 49,799 | $ | 86,012 | $ | 125,105 | $ | 22,876 | $ | 30,355 | ||||||||||
| Period-over-period percentage increase |
92 | % | 73 | % | 45 | % | 47 | % | 33 | % | ||||||||||
| Gross margin |
56 | % | 63 | % | 65 | % | 65 | % | 61 | % | ||||||||||
| Deferred revenue, current and non-current |
$ | 23,022 | $ | 41,864 | $ | 56,445 | $ | 41,136 | $ | 60,030 | ||||||||||
| Net cash used in operating activities |
$ | (51,098 | ) | $ | (62,109 | ) | $ | (70,366 | ) | $ | (19,696 | ) | $ | (18,975 | ) | |||||
| Net cash provided by (used in) investing activities |
$ | (26,437 | ) | $ | (56,409 | ) | $ | 58,334 | $ | 23,593 | $ | (676 | ) | |||||||
| Net cash provided by (used in) financing activities |
$ | (958 | ) | $ | 161,597 | $ | 9,425 | $ | 485 | $ | 20,305 | |||||||||
| Free cash flow as a percentage of total revenue |
(120 | )% | (85 | )% | (60 | )% | (88 | )% | (65 | )% | ||||||||||
| Total customers |
573 | 928 | 1,273 | 1,009 | 1,338 | |||||||||||||||
Deferred Revenue
Our deferred revenue consists of amounts that have been invoiced but that have not yet been recognized as revenue as of the period end. The majority of our deferred revenue balance consists of support and maintenance revenue that is recognized ratably over the contractual service period. These service periods range from one to five years and, as of April 30, 2017, averaged approximately two years.
Free Cash Flow as a Percentage of Total Revenue
Free cash flow as a percentage of total revenue is a non-GAAP financial measure we calculate by dividing free cash flow by total revenue. We define free cash flow, a non-GAAP financial measure, as cash used in operating activities less purchase of property and equipment. We have included free cash flow as a percentage of total revenue in this prospectus because it is a key measure used by our management and board of directors to understand and evaluate our free cash flow in relation to our revenue growth. In addition, we consider free cash flow to be a liquidity measure that provides useful information to management and investors about the amount of cash generated by the business that, after the purchases of property, equipment, can be used for strategic opportunities, including investing in our business, making strategic acquisitions, and strengthening the balance sheet. See “Selected Consolidated Financial and Other Data—Certain Key Financial and Operational Metrics” for information regarding the limitations of using free cash flow as a financial measure. A reconciliation of free cash flow to cash flow provided by operating activities, the most directly comparable financial measure calculated and presented in accordance with GAAP, is provided below:
| Fiscal Year Ended January 31, |
Three Months Ended April 30, |
|||||||||||||||||||
| 2015 | 2016 | 2017 | 2016 | 2017 | ||||||||||||||||
| (unaudited) | ||||||||||||||||||||
| (in thousands, except percentages) |
||||||||||||||||||||
| Net cash used in operating activities |
$ | (51,098 | ) | $ | (62,109 | ) | $ | (70,366 | ) | $ | (19,696 | ) | $ | (18,975 | ) | |||||
| Less: Purchase of property and equipment |
(8,668 | ) | (10,914 | ) | (4,337 | ) | (372 | ) | (676 | ) | ||||||||||
|
|
|
|
|
|
|
|
|
|
|
|||||||||||
| Free cash flow |
$ | (59,766 | ) | $ | (73,023 | ) | $ | (74,703 | ) | $ | (20,068 | ) | $ | (19,651 | ) | |||||
|
|
|
|
|
|
|
|
|
|
|
|||||||||||
| Total revenue |
$ | 49,799 | $ | 86,012 | $ | 125,105 | $ | 22,876 | $ | 30,355 | ||||||||||
| Free cash flow as a percentage of total revenue |
(120 | )% | (85 | )% | (60 | )% | (88 | )% | (65 | )% | ||||||||||
| Net cash provided by (used in) investing activities |
$ | (26,437 | ) | $ | (56,409 | ) | $ | 58,334 | $ | 23,593 | $ | (676 | ) | |||||||
| Net cash provided by (used in) financing activities |
$ | (958 | ) | $ | 161,597 | $ | 9,425 | $ | 485 | $ | 20,305 | |||||||||
14
Table of Contents
Total Customers
We define a customer as an end user that purchases our products and services either from one of our channel partners or from us directly. In situations where there are multiple purchases by multiple subsidiaries or divisions, universities, or governmental organizations affiliated with a single entity, each separate buying unit within an organization is counted as representing a separate customer. We do not include our channel partners or distributors in our definition of a customer.
15
Table of Contents
Investing in our common stock involves a high degree of risk. You should carefully consider the risks and uncertainties described below, together with all of the other information contained in this prospectus, including our consolidated financial statements and the related notes thereto, before making a decision to invest in our common stock. The risks and uncertainties described below are not the only ones we face. Additional risks and uncertainties that we are unaware of, or that we currently believe are not material, may also become important factors that affect us. If any of the following risks occur, our business, financial condition, operating results and prospects could be materially and adversely affected. In that event, the price of our common stock could decline, and you could lose part or all of your investment.
Risks Related to Our Business
We have a history of losses and may not be able to achieve or maintain profitability.
We have incurred losses in all fiscal years since our inception, and we expect that we will continue to incur net losses for the foreseeable future. We experienced net losses of $69.7 million, $101.0 million and $105.8 million for fiscal 2015, 2016 and 2017, respectively. As of April 30, 2017, we had an accumulated deficit of $376.0 million. We anticipate that our operating expenses will increase substantially in the foreseeable future as we continue to hire additional employees, develop our technology and enhance our product and service offerings, expand our sales and marketing teams, make investments in our distribution channels, expand our operations and prepare to become a public reporting company. These efforts may prove more expensive than we currently anticipate, and we may not succeed in increasing our revenue sufficiently to offset these higher expenses, or at all. Revenue growth may slow or revenue may decline for a number of possible reasons, including slowing demand for our products or services, increasing competition, a decrease in the growth of our overall market or a failure to capitalize on growth opportunities. Any failure to increase our revenue as we grow our business could prevent us from achieving or maintaining profitability or positive free cash flow.
We have a limited operating history, which makes our future operating results difficult to predict and exposes our business to a number of risks and uncertainties.
We were founded in June 2008 and began selling our solution and generating revenue in 2011. We have a limited operating history in an industry characterized by rapid technological change, changing customer needs, intense competition, evolving industry standards and frequent introductions of new products and services. Our limited operating history makes it difficult to evaluate our current business and our future prospects, including our ability to plan for and model future growth. All of these factors, as well as the other risks described in this prospectus, make our future operating results difficult to predict, which may impair our ability to manage our business and reduce your ability to assess our prospects.
We have encountered, and will continue to encounter, risks and uncertainties frequently experienced by growing companies in rapidly changing industries. Our limited operating history makes it more difficult for us to predict these risks and uncertainties. If our assumptions regarding these risks and uncertainties (which we use to plan our business) are incorrect or change, or if we do not address these risks and uncertainties successfully, our operating and financial results could differ from our expectations, and our business and prospects could suffer.
Our revenue growth rate in recent periods may not be indicative of our future performance.
We have experienced significant growth in recent periods, with revenue growing from $86.0 million in fiscal 2016 to $125.1 million in fiscal 2017, representing year-over-year growth of 45% for our most recent fiscal year. If we are able to achieve greater revenue scale, we may not be able to maintain revenue growth rates consistent with this historical growth rate. You should not rely on our revenue for any prior quarterly or annual periods as any indication of our revenue or revenue growth for any future period.
16
Table of Contents
Our operating results may fluctuate significantly on a quarterly basis, which could make our future results difficult to predict and could cause our operating results to fall below expectations.
Our operating results may fluctuate on a quarterly basis due to a variety of factors, many of which are outside of our control. As a result, comparing our operating results on a period-to-period basis may not be meaningful. If our revenue or operating results in any particular period fall below investor expectations, the price of our common stock would likely decline. Factors that are difficult to predict and that could cause our quarterly operating results to fluctuate include:
| • | the timing and magnitude of orders and shipments of our products in any quarter; |
| • | our ability to attract new and retain existing customers; |
| • | our ability to increase and maintain sales coverage and effectiveness; |
| • | our ability to sell additional products to our existing customers; |
| • | disruptions in our sales channels or termination of our relationship with important distributors, channel partners, OEMs, contract manufacturers and suppliers; |
| • | our seasonal sales cycles; |
| • | reductions in customers’ budgets for information technology purchases; |
| • | fluctuations in demand for our solution; |
| • | the mix of solutions sold and the mix between product revenue and support and maintenance revenue; |
| • | the timing of introductions of plans of new products and our ability to manufacture and sell new products; |
| • | the amount and timing of expenses to grow our business; |
| • | the timing of revenue recognition for our sales; |
| • | regulatory, tax, accounting and other changes in requirements or policies applicable to us; |
| • | volatility in our share price, which may lead to higher stock-based compensation expense; and |
| • | general socioeconomic and political conditions in the countries where we operate or where our solution is sold or used. |
Any one of the factors above or the cumulative effect of the factors above may result in significant fluctuations in our operating results from period to period. This variability and unpredictability could result in our failure to meet our internal operating plan or the expectations of securities analysts or investors for any period. If we fail to meet such expectations, the market price of our common stock could decline and we could face costly lawsuits, including securities class action litigation.
We face intense competition from numerous established companies and new entrants.
We face intense competition from numerous established companies that sell competitive enterprise cloud infrastructure systems or storage solutions. These competitors include large system vendors, consisting primarily of EMC and NetApp, and also Dell Technologies, Hitachi Data Systems, HP Enterprise, IBM and VMware, that offer a broad range of data center systems targeting various use cases and end markets. We also face competition from other companies, including companies that offer solutions powered entirely or partially by flash memory technology, such as Nimble Storage, a Hewlett Packard Enterprise company, Nutanix and Pure Storage. These competitors, as well as other potential competitors, where compared to us may have:
| • | greater name recognition and longer operating histories; |
| • | larger sales and marketing and customer support budgets and resources; |
17
Table of Contents
| • | the ability to bundle enterprise cloud infrastructure systems or storage solutions with other products and services to address customers’ needs; |
| • | more comprehensive enterprise cloud infrastructure systems or storage solutions; |
| • | greater resources to make acquisitions and develop new solutions; |
| • | infrastructure solutions that are, or that are perceived to be, simpler and faster to deploy, or able to store and process data more effectively; |
| • | infrastructure solutions that store and process both physical and virtualized workloads; |
| • | larger and more mature intellectual property portfolios; and |
| • | substantially greater financial, technical and other resources. |
Furthermore, many of our competitors benefit from established brand awareness and long-standing relationships with key decision makers at many of our current and prospective customers. We expect that our competitors will seek to leverage these existing relationships to discourage customers from purchasing our solution. If we are unsuccessful in establishing or maintaining relationships with customers, or if customers are reluctant or unwilling to try our solution, our ability to compete in the marketplace or to grow our revenue could be impaired.
Our competitors utilize a broad range of competitive strategies. For example, some of our competitors have offered bundled products and services in order to reduce the initial cost of their storage solutions. Our competitors may also compete on purchase price and total cost of ownership, and may choose to adopt more aggressive pricing policies than we choose to adopt in the future.
Certain of our competitors may have developed, claim to have developed or have indicated that they intend to develop enterprise cloud technologies that may compete with our solution. We expect our competitors to continue to improve the performance of their solutions, reduce their prices and introduce new services and technologies that may, or that they may claim to, offer greater performance and improved total cost of ownership as compared to our solution. These and other competitive pressures may prevent us from competing successfully against current or future competitors. If we are unable to acquire customers, or if we are forced to reduce prices in order to do so, our business, operating results and financial condition may be adversely affected.
We have experienced rapid growth in recent periods, and if we do not effectively manage any future growth or are unable to improve our systems, processes and controls, our business may be adversely affected.
We have experienced rapid growth and increased demand for our solution over the last several years. Our employee headcount and number of customers have increased significantly, and we expect to continue to grow our headcount and customer base significantly in the future.
Furthermore, we have increasingly managed more complex deployments of our products and services with larger customers. The growth of our business and our offerings creates an ongoing strain on our management, operational and financial resources. To manage our growth effectively, we must continue to improve and expand our information technology and financial infrastructure, our operating and administrative systems and our ability to manage headcount, capital and processes in an efficient manner. The increased operational complexity and higher costs of international product deployments and infrastructure expansion makes managing our growth outside of the United States uniquely challenging. Our failure to scale or manage improvements in these functions, processes and controls could disrupt existing customer relationships, limit the deployments of our solution, reduce the quality of our products and services, increase our technical support costs and impair our ability to operate our business and protect our assets. Failure to manage any future growth effectively could result in increased costs and harm our business, operating results and financial condition.
18
Table of Contents
If the enterprise cloud market does not evolve as we anticipate or our target customers do not adopt our enterprise cloud solutions, we may not be able to compete effectively, and our ability to generate revenue will suffer.
We compete in the new enterprise cloud category with our Tintri VMstore solutions, and the market for enterprise cloud solutions is still in an early stage. Our success depends upon our ability to provide enterprise cloud infrastructure solutions that address the needs of customers more effectively and economically than those of other competitors or existing technologies.
Many of our target customers have never purchased enterprise cloud infrastructure solutions and may not have the desire or available budget to invest in new technologies such as ours. Market awareness of our value proposition will be essential to our continued growth and our success, particularly for the enterprise and CSP markets. It is difficult to predict with any precision customer adoption rates, customer demand for our solution or the future growth rate and size of our market.
Changes or advances in alternative technologies or adoption of alternative enterprise cloud infrastructure offerings could adversely affect the demand for our solution. If the enterprise cloud infrastructure market does not develop in the way we anticipate, if our solution does not offer benefits compared to competing solutions or if customers do not recognize the benefits that our solution provides, then our business, operating results and financial condition could be adversely affected.
Our growth depends in part on our ability to attract new customers and sell additional solutions and renewals to existing customers.
Our future success depends in part on our ability to increase sales of our solution to new customers domestically and internationally, as well as to increase sales of additional solutions and renewals to our existing customers. The rate at which new and existing customers purchase solutions depends on a number of factors, including customers’ perceived need for enterprise cloud infrastructure solutions, general economic conditions and our ability to compete effectively with our competitors. We may also be forced to engage in sophisticated and costly sales efforts, which may not result in additional sales.
Furthermore, the rate at which our customers purchase additional enterprise cloud infrastructure solutions is subject to a number of risks, including the nature and extent of their IT infrastructure needs, their level of satisfaction with our prices and features relative to competitive offerings, their spending levels on IT infrastructure solutions and other factors outside of our control.
We provide our support services under limited term contracts, which range from one to five years. Our customers’ renewal rates may decline or fluctuate as a result of a number of factors, including their level of satisfaction with our solution, our customer support and increased competition and the pricing of our, or competing, services. Even if our customers choose to renew their support contracts, they may renew for shorter contract periods or on other terms that are less beneficial to us. We have limited historical data with respect to rates of customer renewals, so we may not accurately predict future renewal trends.
We cannot ensure that our customers will purchase our solution or will renew their support contracts, and their failure to make such purchases or renewals may adversely affect our business, operating results and financial condition.
If our third-party channel partners fail to perform, our ability to sell and distribute our solution will be limited, and our operating results will be adversely affected.
We depend on channel partners and distributors for a substantial majority of our sales. Approximately 89% and 85% of our revenue was derived from sales to our channel partners and distributors in fiscal 2016 and fiscal
19
Table of Contents
2017, respectively. We also depend upon our channel partners to manage the customer sales process and to generate sales opportunities. To the extent our channel partners are unsuccessful in fulfilling our sales, managing the sales process or selling our solution, or we are unable to enter into arrangements with, and retain a sufficient number of high-quality, motivated partners in each of our sales regions, our ability to sell our solution will be adversely affected.
Our contracts with channel partners are typically terminable without cause by either party after an initial term of one year. Our channel partner agreements do not prohibit them from offering competitive products or services and do not contain any purchase commitments. Many of our channel partners also sell our competitors’ solutions. If our channel partners give higher priority to our competitors’ storage solutions, we may be unable to grow our revenue and our net loss could increase. Further, in order to develop and expand our channels, we must continue to scale and improve our processes and procedures that support our channel partners, including investments in systems and training, and those processes and procedures may become increasingly complex and difficult to manage. If we fail to maintain existing channel partners or develop relationships with new channel partners, our business, operating results and financial condition may be adversely affected.
Reliance on shipments at the end of the quarter could cause our revenue for the applicable period to fall below expected levels.
As a result of customer buying patterns and related sales efforts, we have historically received a substantial portion of sales orders and generated a substantial portion of revenue during the last few weeks of each fiscal quarter. If expected revenue at the end of any fiscal quarter is delayed for any reason, including any failure of anticipated sales transactions to materialize, any inability on our part to ship products prior to fiscal quarter-end to fulfill sales orders received near the end of the fiscal quarter, any failure on our part to manage inventory to meet demand, any inability on our part to release new solutions on schedule, any failure of our systems related to order review and processing and other terms that may delay the recognition of revenue or any unexpected sales cancellations, our revenue for that quarter could fall below our expectations and the estimates of analysts, which could adversely impact our business, operating results and financial condition.
The markets for enterprise cloud systems and storage solutions are rapidly evolving and, if we fail to correctly anticipate and respond to developing industry trends, demand for our solution may decline.
The IT infrastructure and storage industries are characterized by rapidly evolving technology, customer needs and industry standards. To remain competitive, we must correctly anticipate and invest in the adoption of new and emerging technologies, and continue to innovate our solution to provide superior benefits to our customers. The process of developing or adapting our solution to new technologies is complex and uncertain, and our product development efforts may fail to successfully address our customers’ changing needs. We must commit significant resources to developing new products and product enhancements before knowing whether our investments will result in products the market will accept. If we fail to implement or respond to a technology that gains widespread market acceptance, demand for our solution may decline. Conversely, if we adopt a technology for which market demand fails to materialize, then we may incur significant development and marketing expense for which we fail to realize an adequate return. In addition, one or more new technologies could be introduced that compete favorably with our products or that cause our solution to no longer be able to compete successfully.
The success of our products also depends in large part on our ability to successfully adapt our solution to emerging industry standards. The servers, network, software and other components and systems within a datacenter must comply with industry standards in order to interoperate and function efficiently together. If larger companies that are more influential in driving industry standards do not support the same standards we use, market acceptance of our solution could be adversely affected, or we may be required to spend significant time and resources duplicating efforts to adapt to different standards.
Our failure to successfully identify new product opportunities, develop and bring new products to market in a timely manner or respond to changing industry standards would result in a lower revenue growth rate or
20
Table of Contents
decreased revenue, either of which would negatively impact our business, operating results and financial condition.
If we fail to develop or introduce new or enhanced solutions on a timely basis, our ability to attract and retain customers could be impaired and our competitive position could be adversely affected.
We operate in a dynamic environment characterized by rapidly changing technologies and industry standards and technological obsolescence. We will need to continue to create valuable software and hardware solutions to be integrated with our enterprise cloud platform. To compete successfully, we must design, develop, market and sell new or enhanced solutions that provide increasingly higher levels of performance, capacity, scalability, security and reliability and meet the cost expectations of our customers. Any failure to anticipate or develop new or enhanced solutions or technologies in a timely manner in response to technological shifts could result in decreased revenue and harm to our business, operating results and financial condition. Any new feature or application that we develop or acquire may not be introduced in a timely or cost-effective manner and may not achieve broad market acceptance. If we fail to introduce new or enhanced solutions that meet the needs of our customers or penetrate new markets in a timely fashion, we will lose market share and our business, operating results and financial condition will be adversely affected.
Our solution must interoperate with third-party hypervisors and operating systems, software applications and hardware, and if we fail to maintain the compatibility of our solution with such software and hardware, we may lose or fail to increase our market share and may experience reduced demand for our solution.
Our solution must interoperate with our customers’ existing infrastructure, specifically their hypervisors, networks, servers, and other software, which are provided by a wide variety of vendors. For example, our VMstore solutions support hypervisors marketed by Citrix, Microsoft, Open Stack, Red Hat and VMware. When new or updated versions of these hypervisors or software applications are introduced, we must sometimes develop updated versions of our software so that our solution will interoperate properly. These efforts require capital investment and engineering resources and we may not be able to deliver or maintain interoperability quickly, cost-effectively or at all. If we fail to maintain compatibility of our solution with these infrastructure components, our customers may not be able to fully utilize our solution, and we may, among other consequences, lose or fail to increase our market share and experience reduced demand for our solution, which may harm our business, operating results and financial condition.
If we are not able to successfully increase sales of our solution to large organizations and CSPs, our operating results may suffer.
Our growth strategy is dependent in large part upon increasing sales of our solution to large organizations and CSPs. Sales to these customers involve risks that may not be present (or that are present to a lesser extent) with sales to smaller customers. These risks include:
| • | competition from companies that traditionally target larger organizations and CSPs and that may have pre-existing relationships or purchase commitments from such customers; |
| • | increased purchasing power and leverage held by large customers in negotiating contractual arrangements with us; |
| • | more stringent requirements in our support and maintenance contracts, including demand for faster support response times and penalties for any failure to meet support requirements; and |
| • | longer sales cycles and the associated risk that substantial time and resources may be spent on a potential customer that elects not to purchase our solution. |
In addition, large organizations, including government entities, typically have longer implementation cycles, require greater solutions functionality and scalability, require a broader range of services, demand that vendors
21
Table of Contents
take on a larger share of risks, require acceptance provisions that can lead to a delay in revenue recognition and expect greater payment flexibility. If we fail to realize an expected sale from a large customer in a particular quarter or at all, our business, operating results and financial condition could be adversely affected.
Our sales cycles can be long and unpredictable, and may require considerable time and expense, which may cause our operating results to fluctuate significantly.
The timing of customer sales commitments and our recognition of revenue is difficult to predict because of the length and unpredictability of our solutions’ sales cycles. A sales cycle is the period between initial contact with a prospective customer and any sale of our solution. Our sales cycles typically range from three to six months. Customers, especially large enterprises, CSPs and government entities, often view the purchase of our solution as a significant and strategic decision and require considerable time to evaluate, test and qualify our solution prior to making a purchase decision and placing an order. During our sales cycle, we expend significant time and money on sales and marketing activities, and sometimes make investments in evaluation equipment, all of which lower our operating margins, particularly if no sale occurs.
Even if a customer decides to purchase our solution, there are many factors that affect the timing of the customer’s purchase and our recognition of revenue, including the strategic importance of a particular project to a customer, budgetary constraints and changes in their personnel. Even after a customer makes a purchase, there may be circumstances or terms relating to the purchase that delay our ability to recognize revenue from that purchase. For all of these reasons, it is difficult to predict whether a sale will be completed, the particular period in which a sale will be completed or the period in which revenue from a sale will be recognized. If our sales cycles lengthen, our revenue could be lower than expected, which would have an adverse effect on our business, operating results and financial condition.
If we are unable to attract and retain qualified personnel, our business and operating results could suffer.
Our future success also depends on our ability to continue to attract, integrate and retain highly skilled personnel, especially skilled sales and engineering employees. Competition for highly skilled personnel is frequently intense, especially in the San Francisco Bay Area where we are headquartered. We compete with many larger and better funded organizations both inside and outside of the storage industry for skilled personnel, and we may be unable to compete with the compensation and other benefits that these organizations offer to attract candidates and retain existing personnel.
Volatility or declines in our stock price may also affect our ability to attract and retain key employees. Also, many of our employees have become, or will soon become, vested in a substantial amount of equity awards which equates to a substantial amount of personal wealth. This may make it more difficult for us to retain and motivate these employees, and this wealth could affect their decision about whether or not they continue to work for us.
We cannot assure you that we will be able to successfully attract or retain qualified personnel. Any failure to successfully attract, integrate or retain qualified personnel to fulfill our current or future needs may negatively impact our growth and adversely affect our business, operating results and financial condition.
We derive substantially all of our revenue from a single family of products, and a decline in demand for our solution would cause our revenue to grow more slowly or to decline.
Our enterprise cloud platform, which includes our proprietary Tintri OS and our stand-alone software products, accounts for all of our revenue and will continue to comprise a significant portion of our revenue for the foreseeable future. As a result, any of the following events or developments could have a comparatively greater impact on our business than they would if we offered a broader range of solutions:
| • | the failure of our current solutions to achieve broad market acceptance; |
22
Table of Contents
| • | any decline or fluctuation in demand for our current solutions, whether as a result of customer budgetary constraints, introduction of competing products or technologies or other factors; and |
| • | our inability to release enhanced versions of our current solutions, including any related software, on a timely basis. |
If the market for enterprise cloud infrastructure solutions grows more slowly than anticipated, if demand for our solution declines, or if we fail to deliver new solutions, new features, or new releases that meet customer demand, our business, operating results and financial condition will be adversely affected.
We recognize revenue from support agreements over the term of the relevant support period, and as a result downturns or upturns in sales are not immediately reflected in full in our operating results.
Support and maintenance revenue was 20.2% and 22.2% of our revenue in fiscal 2016 and fiscal 2017, respectively. We recognize support and maintenance revenue ratably over the term of the relevant support period, which ranges from one to five years. As a result, much of the support and maintenance revenue we report each quarter is derived from support agreements that we sold in prior quarters. Consequently, a decline in new or renewed support agreements, or decreases in the relative pricing of new support agreements, in any one quarter will not be fully reflected in revenue in that quarter but will negatively affect our revenue in future quarters. Accordingly, the effect of significant downturns in sales of support and maintenance is not reflected in full in our operating results until future periods. In addition, because revenue from renewals must be recognized ratably over the applicable service period, it may be difficult for us to rapidly increase our support and maintenance revenue through additional sales in any period. The percentage of our total revenue that we derive from support and maintenance agreements may vary over time if we change the relative pricing of our products or support agreements. Our revenue from support agreements as a percentage of total revenue may decline as a result of changes in the relative pricing of our products and support. Changes in the mix of our product revenue and support and maintenance revenue may adversely affect our business, operating results and the trading price of our common stock.
The sales prices of our products and services may decrease, which would reduce our gross profit and adversely impact our financial condition.
The sales prices for our products or support and maintenance services may decline for a variety of reasons, including competitive pricing pressures, a change in our mix of products and services and the introduction of competing products or services or promotional programs. Competition continues to increase in the markets in which we participate, and we expect competition to further increase in the future, which may lead to increased pricing pressures. Larger competitors with more diverse product and service offerings may reduce the price of products or services that compete with ours or may bundle them with other products and services. Our sales prices could also decline due to pricing pressure caused by several factors, including overcapacity in the worldwide supply of competitive storage solutions, increased manufacturing efficiencies and implementation of new manufacturing processes. In addition, although we price our products and services predominantly in U.S. dollars, currency fluctuations in certain countries and regions may negatively impact actual prices that partners and customers are willing to pay in those countries and regions. To the extent we introduce new solutions, we anticipate that the sales prices for our existing solutions will decrease. We cannot assure you that we will be successful in developing and introducing new offerings with enhanced functionality on a timely basis, or that our new product and services offerings, if introduced, will enable us to maintain or improve our gross margins and achieve profitability.
Our ability to successfully market and sell our solution is dependent in part on the quality of our customer support, and any failure to offer high-quality technical support could harm our business.
Once our solution is deployed within our customers’ datacenters, customers depend on our support organization to resolve technical issues relating to our solution. Our ability to provide effective support is largely
23
Table of Contents
dependent on our ability to attract, train and retain qualified personnel, as well as to engage with qualified support partners that provide a similar level of customer support. Furthermore, as we continue to expand our international operations, our support organization will face additional challenges, including those associated with delivering support, training and documentation in languages other than English and provisioning and staffing our international customer support field offices. In addition, our sales process is highly dependent on our solution and business reputation and on recommendations from our existing customers. Any failure to maintain, or a market perception that we do not maintain, high-quality technical support, including installation, could harm our reputation and our ability to sell our solution to existing and prospective customers.
We are exposed to the credit risk of some of our channel partners, distributors and direct customers, which could result in losses and negatively impact our operating results.
Some of our channel partners, distributors and direct customers have experienced financial difficulties in the past. A channel partner, distributor or direct customer experiencing such difficulties will generally not purchase or sell as many of our systems as it may have done under normal circumstances and may cancel orders. Our typical payment terms are 30 days from invoice but payment terms may be longer in particular circumstances and markets. In addition, a channel partner, distributor or direct customer experiencing financial difficulties generally increases our exposure to uncollectible receivables. Any concentration of our accounts receivable in one or a limited number of our channel partners, distributors and direct customers may increase our credit risk with respect to those channel partners, distributors and direct customers. If any of our channel partners, distributors or direct customers that represent a significant portion of our revenue becomes insolvent or suffers deterioration in its financial or business condition and is unable to pay for our solution, our business, operating results and financial condition could be adversely affected.
If we do not effectively expand and train our sales force, we may be unable to increase our revenue and our business will be adversely affected.
Although we have a channel sales model, our sales representatives typically engage in direct interaction with our prospective customers. Therefore, we continue to be substantially dependent on our sales force to obtain new customers and sell additional solutions to our existing customers. As such, we have invested and will continue to invest substantially in our sales organization. Competition for sales personnel with the skills and technical knowledge that we require is intense and our ability to achieve significant revenue growth will depend, in large part, on our success in recruiting, training and retaining sufficient numbers of sales personnel to support our growth.
As a result of our recent growth, a large percentage of our sales force is new to our company and therefore less effective than our more seasoned sales personnel. New hires require significant training and may take significant time before they achieve full productivity; we estimate based on past experience that sales team members typically do not fully ramp and are not fully productive during the first several quarters of employment with us. Our recent hires and planned hires may not become productive as quickly as we expect. Furthermore, hiring sales personnel in new countries requires additional set up and upfront costs that we may not recover if the sales personnel fail to achieve full productivity. If we are unable to hire and train sufficient numbers of effective sales personnel, or the sales personnel are not successful in obtaining new customers or increasing sales to our existing customer base, our business, operating results and financial condition will be adversely affected.
Seasonality may cause fluctuations in our revenue and operating results.
In general, our sales are subject to seasonal trends. Our fourth fiscal quarter, ending January 31, typically has the highest revenue of any of our fiscal quarters, and our first fiscal quarter, ending April 30, typically has the lowest revenue of any of our fiscal quarters. We believe that this seasonality results from a number of factors, including the budgeting, procurement and deployment cycles of many of our customers. Our rapid historical
24
Table of Contents
growth may have reduced the impact of seasonal or cyclical factors that might have influenced our business to date. To the extent our revenue growth slows, seasonal or cyclical variations in our operations may become more pronounced and may affect our business, operating results and financial condition.
Sales to U.S. federal, state and local governments are subject to numerous challenges and risks that may adversely impact our business.
Although sales to U.S. federal, state and local government agencies accounted for less than 10% of our revenue in each of fiscal 2016 and fiscal 2017, we anticipate that our sales to government agencies may increase in the future. Sales to such government entities are subject to a number of risks, including the following:
| • | selling to government agencies can be extensively regulated, highly competitive and time consuming, often requiring significant upfront time and expense without any assurance that such efforts will generate a sale; |
| • | government certification requirements applicable to our solution may change and in doing so restrict our ability to sell into the U.S. federal government sector until we have attained the revised certification; |
| • | government demand and payment for our products and services may be impacted by public sector budgetary cycles, changes in administration and funding authorizations, with funding reductions or delays adversely affecting public sector demand for our products and services; |
| • | government agencies may have statutory, contractual or other legal rights to terminate our sales contracts for convenience or due to a default, and any such termination may adversely impact our future operating results; |
| • | governments routinely investigate and audit government contractors’ administrative processes, and any unfavorable audit could result in the government refusing to continue buying our solution, which would adversely impact our revenue and operating results, or result in fines, civil or criminal liability or repayment of any overcharges, if any such audit uncovers improper or illegal activities; and |
| • | government agencies may require certain products to be manufactured in the United States and other relatively high-cost manufacturing locations, which may require costly changes to our manufacturing practices or otherwise adversely affect our ability to sell these products to such agencies. |
If any of the above risks are realized, our business, operating results and financial condition may be adversely affected.
Our solution is highly technical and may contain undetected defects, which could cause data unavailability, loss or corruption that might, in turn, result in liability to our customers and harm to our reputation and business.
Our solution is highly technical and complex and are often used to store information critical to our customers’ business operations. Our solution may contain undetected errors, defects or security vulnerabilities that could result in data unavailability, loss, corruption or other harm to our customers. Some errors in our solution may only be discovered after they have been installed and used by customers. Our solution has experienced temporary outages after they have been deployed. Any outages, errors, defects or security vulnerabilities discovered in our solution after commercial release could result in a loss of revenue, injury to our reputation, a loss of customers or increased service and warranty costs, any of which could adversely affect our business and operating results. In addition, errors or failures in the solutions of third-party technology vendors may be attributed to us and may harm our reputation.
If our solution fails, we could face claims for product liability, tort or breach of warranty. Although our customers are generally required to enter into our standard “click wrap” terms of service, which includes provisions relating to warranty disclaimers and liability limitations, these terms may be difficult to enforce.
25
Table of Contents
Defending a lawsuit, regardless of its merit, would be costly and might divert management’s attention and adversely affect the market’s perception of us and our solution. Our business liability insurance coverage could prove inadequate with respect to a claim and future coverage may be unavailable on acceptable terms or at all. These product-related issues could result in claims against us, and negatively impact our business, operating results and financial condition.
Our international operations expose us to additional risks, and failure to manage those risks could adversely affect our business, operating results and cash flows.
Increasingly, we derive a significant portion of our revenue from channel partners outside the United States. Revenue generated from customers outside of the United States was 29.9% and 30.0% of our total revenue for fiscal 2016 and fiscal 2017, respectively. We are continuing to adapt to and develop strategies to address international markets but there is no guarantee that such efforts will be successful. As of April 30, 2017, 14% of our full-time employees were located outside of the United States. We expect that our international activities will continue to grow over the foreseeable future as we continue to pursue opportunities in international markets, which will require significant management attention and financial resources. We are subject to risks associated with having significant worldwide operations, including:
| • | increased complexity and costs of managing international operations; |
| • | geopolitical and economic instability and military conflicts; |
| • | limited protection of our intellectual property and other assets; |
| • | compliance with local laws and regulations and unanticipated changes in local laws and regulations, including tax laws and regulations; |
| • | trade and foreign exchange restrictions and higher tariffs; |
| • | travel restrictions; |
| • | timing and availability of import and export licenses and other government approvals, permits and licenses, including export classification requirements; |
| • | foreign currency exchange fluctuations relating to our international operating activities; |
| • | restrictions imposed by the U.S. government on our ability to do business with certain companies or in certain countries as a result of international political conflicts; |
| • | transportation delays and other consequences of limited local infrastructure and disruptions, such as large scale outages or interruptions of service from utilities or telecommunications providers; |
| • | reliance upon third parties to provide solution support services outside of the Unites States; |
| • | difficulties in staffing international operations and increased compliance costs and potential liabilities associated with employment laws and practices outside of the United States; |
| • | increased costs and risk of loss associated with provisioning local field offices to provide solution support services; |
| • | heightened risk of terrorist acts; |
| • | local business and cultural factors that differ from our normal standards and practices; |
| • | differing employment practices and labor relations; |
| • | regional health issues and natural disasters that are endemic to regions which we operate and sell or manufacture our solution; |
| • | difficulties in enforcing contracts generally; and |
| • | work stoppages. |
26
Table of Contents
As we continue to expand our business globally, our success will depend, in large part, on our ability to anticipate and effectively manage these risks. These factors and other factors could harm our ability to gain future international revenue and, consequently, impact our business, operating results and financial condition.
We rely on a single contract manufacturer to manufacture our products, and any failure to forecast demand for our products or manage our relationship with our contract manufacturer, or if that manufacturer’s business were to become impaired in the future, our ability to sell our products could be impacted.
We contract with an offshore subsidiary of Flex to manufacture all of our products. Our reliance on Flex reduces our control over the assembly process, exposing us to risks, including reduced control over quality assurance, production costs and product supply. If we fail to manage our relationship with Flex effectively, or if Flex experiences delays, disruptions, capacity constraints or quality control problems in their operations, our ability to ship products to our customers could be impaired and our competitive position and reputation could be adversely affected. In addition, any adverse change in Flex’s financial or business condition could disrupt our ability to supply quality products to our customers. If we are required to change our contract manufacturer or assume internal manufacturing operations, we may lose revenue, incur increased costs and damage our customer relationships. In addition, qualifying a new contract manufacturer and commencing production can be an expensive and lengthy process. If we experience increased demand that Flex is unable to fulfill, or if Flex is unable to provide us with adequate supplies of high-quality products for any other reason, we could experience a delay in our order fulfillment, and our business, operating results and financial condition would be adversely affected.
Our agreement with Flex is terminable at any time by us with 90 days’ notice or by Flex with 120 days’ notice and Flex has no obligation to provide services transitioning our manufacturing processes to another manufacturer. Our agreement with Flex does not provide for any specific volume purchase commitments, though we are required to submit a nine month forecast for orders (the first three months of which are binding) and orders are placed on a purchase order basis. Furthermore, because we contract with a subsidiary of Flex, we have limited recourse to assets held by other members of the Flex group of companies in the event of manufacturing problems or other claims. If we are required to change to a new contract manufacturer, qualify an additional contract manufacturer or assume internal manufacturing operations for any reason, including financial problems of our contract manufacturer, reduction of manufacturing output made available to us, or the termination of our contract, we may lose revenue, incur increased costs and damage our customer relationships.
We intend to introduce new products and product enhancements, which could require us to coordinate with Flex and component suppliers in order to achieve volume production rapidly. We may need to increase our component purchases, contract manufacturing capacity and internal test and quality functions if we experience increased demand for our products. Our orders may represent a relatively small percentage of the overall orders received by Flex from its customers. As a result, fulfilling our orders may not be considered a priority in the event Flex is constrained in its ability to fulfill all of its customer obligations in a timely manner. If Flex is unable to provide us with adequate supplies of high-quality products, or if we are, or Flex is unable to obtain adequate quantities of components, it could cause a delay in our order fulfillment, in which case our business, operating results and financial condition could be adversely affected.
We rely on a limited number of suppliers, and in some cases single-source suppliers, and any disruption or termination of these supply arrangements could delay shipments of our products and could harm our relationships with current and prospective customers.
We rely on a limited number of suppliers, and in some cases single-source suppliers, for several key hardware components of our solution. These components are generally purchased on a purchase order basis through Flex, and we generally do not have long-term supply contracts with our suppliers. For example, the chassis used in our hybrid-flash systems is obtained on a purchase order-basis under an agreement with a single-source component supplier that has no fixed term. In addition, the chassis used in our all-flash systems is
27
Table of Contents
obtained under an agreement with a single-source component supplier having an initial term through October 2017, at which point it will automatically renew for successive one-year periods unless either party provides notice of non-renewal.
Our current purchase volumes may be too low for us to be considered a priority customer by certain of our suppliers. Any of the sole-source and limited source suppliers we rely on could stop producing our components, cease operations or be acquired by, or enter into exclusive arrangements with, our competitors. Our reliance on key suppliers exposes us to risks, including:
| • | the inability to obtain an adequate supply of key components; |
| • | delays or disruptions of shipments of our products or their components; |
| • | price volatility for the components of our products; |
| • | failure of a supplier to meet our quality or production requirements; |
| • | failure of a supplier of key components to remain in business or adjust to market conditions; and |
| • | consolidation among suppliers, resulting in some suppliers exiting the industry or discontinuing the manufacture of components. |
As a result of these risks, we cannot assure you that we will be able to obtain enough key components in the future or that the cost of these components will not increase. We generally order our components on a “build to order” basis, and do not maintain any significant inventory of the components used in our products. The technology industry has experienced component shortages and delivery delays in the past, and we may experience shortages or delays of critical components in the future as a result of strong demand in the industry or other factors. If our supply of components is disrupted or delayed, or if we need to replace our existing suppliers, there can be no assurance that additional components will be available when required or on terms that are favorable to us, which could extend our lead times and increase the costs of our components. Switching suppliers may require that we redesign our VMstore products to accommodate new components and to re-qualify our solution, which would be costly and time-consuming.
Any interruption in the supply of our components may adversely affect our ability to meet scheduled product deliveries to our customers and could result in lost revenue or higher expenses, any of which would harm our business, operating results and financial condition.
Insufficient supply and inventory of our products and their components may result in lost sales opportunities or delayed revenue, while excess inventory will harm our gross margins.
Our third-party manufacturer procures components and builds our products based on our forecasts, and we generally do not hold inventory for a prolonged period of time. These forecasts are based on estimates of future demand for our products, which are in turn based on historical trends and analyses from our sales and marketing organizations, adjusted for overall market conditions. In order to reduce manufacturing lead times and plan for adequate component supply, from time to time we may issue forecasts for components and products that are non-cancelable and non-returnable. Our inventory management systems and related supply chain visibility tools may be inadequate to enable us to make accurate forecasts and effectively manage the supply of our products and components. We have, in the past, had to write off inventory in connection with transitions to new product models. If we ultimately determine that we have excess supply, we may have to reduce our prices and write down or write off excess or obsolete inventory, which in turn could result in lower gross margins. Alternatively, insufficient supply levels may lead to shortages that result in delayed revenue or loss of sales opportunities altogether as potential customers turn to competitors’ products that may be more readily available. If we are unable to effectively manage our supply and inventory, our business, operating results and financial condition could be adversely affected.
28
Table of Contents
Industry consolidation may lead to increased competition, which could harm our business.
Consolidation among IT infrastructure providers has been common. Some of our competitors have made acquisitions or entered into partnerships or other strategic relationships to offer a more comprehensive solution than they had offered individually. For example, in February 2016, NetApp acquired SolidFire, a developer of all-flash storage systems, in September 2016, Dell acquired EMC, in February 2017, HP Enterprise acquired SimpliVity, a developer of hyperconverged systems, and in April 2017, HP Enterprise acquired Nimble Storage, a storage solutions provider. We expect this trend to continue as companies attempt to strengthen or maintain their market positions through strategic acquisitions.
Consolidation in our industry may result in stronger competitors that may create more compelling offerings, offer greater pricing flexibility and be better able to compete as their customers’ sole-source vendors. Any of these developments would make it more difficult for us to compete effectively, including on the basis of price, sales and marketing programs and breadth of technology offerings. In addition, companies with which we have strategic partnerships may acquire or form alliances with our competitors, causing them to reduce their business with us. Continued industry consolidation may adversely affect customers’ and potential customers’ perceptions of the viability of less mature technology companies such as us and, consequently, their willingness to purchase from us. Any such competitive forces resulting from consolidation in our industry could adversely impact our business, operating results and financial condition.
Our research and development efforts may not produce successful solutions that result in significant revenue in the near future, if at all.
Developing new solutions and related enhancements is expensive and time consuming. Our investments in research and development may result in solutions that do not achieve market adoption, are more expensive to develop than anticipated, take longer to generate revenue or generate less revenue than we anticipate. Our future plans include significant investments in research and development for new solutions and related opportunities. We believe that we must continue to dedicate significant resources to our research and development efforts to maintain or expand our competitive position. However, these efforts may not result in significant revenue in the near future, if at all, which could adversely affect our business, operating results and financial condition.
The success of our business depends in part on our ability to protect and enforce our intellectual property rights.
Our success depends to a significant degree on our ability to protect our core technology and intellectual property. We rely on a combination of patent, copyright, service mark, trademark and trade secret laws, as well as confidentiality procedures and contractual restrictions, to establish and protect our technology, intellectual property and proprietary rights, all of which provide only limited protection. We cannot assure you that any patents or trademarks will be issued with respect to our currently pending patent and trademark applications in a manner that gives us adequate defensive protection or competitive advantages, if at all, or that any patents or trademarks issued to us or our other intellectual property rights will not be challenged, invalidated or circumvented. We have filed for patents and trademarks in the United States and in certain international jurisdictions, but such protections may not be available in all countries in which we operate or in which we seek to enforce our intellectual property rights, or may be difficult to enforce in practice. Our currently issued patents and trademarks and any patents or trademarks that may be issued in the future with respect to pending or future applications may not provide sufficiently broad protection or they may not prove to be enforceable in actions against alleged infringers. We cannot be certain that the steps we have taken will prevent unauthorized use or reverse engineering of our technology. Moreover, others may independently develop technologies that are competitive to ours or infringe our intellectual property rights.
Protecting against the unauthorized use of our intellectual property and technology, and infringement or misappropriation of our intellectual property rights is expensive and difficult, particularly internationally.
29
Table of Contents
Litigation may be necessary in the future to enforce or defend our intellectual property rights or to determine the validity and scope of the intellectual property rights of others. Such litigation could result in substantial costs and diversion of management resources, either of which could harm our business, operating results and financial condition. If we fail to protect our intellectual property rights adequately, our competitors could offer similar solutions, potentially harming our business. Further, many of our current and potential competitors have the ability to dedicate substantially greater resources to defending intellectual property rights infringement claims and to enforcing their intellectual property rights than we have. Attempts to enforce our rights against third parties could also provoke these third parties to assert their own intellectual property rights or other rights against us, or result in a holding that invalidates or narrows the scope of our intellectual property rights, in whole or in part. If we are unable to adequately protect and enforce our intellectual property, technology and our intellectual property rights, the value of our intellectual property, technology and intellectual property rights, and our business, operating results and financial condition could be adversely affected.
Third-party claims that we are infringing intellectual property rights, whether successful or not, could subject us to costly and time-consuming litigation or expensive licenses, and our business could be adversely affected.
A number of companies, both within and outside of the IT infrastructure industry, hold a large number of patents covering aspects of storage, servers and virtualization solutions. In addition to these patents, participants in this industry typically also protect their technology through copyrights and trade secrets. As a result, there is frequent litigation based on allegations of infringement, misappropriation or other violations of intellectual property rights. We have in the past, and may in the future, receive inquiries from other intellectual property rights holders seeking to profit from royalties in connection with grants of licenses and may in the future become subject to claims that we infringe their intellectual property rights, particularly as we expand our presence in the market and face increasing competition. We have in the past and may in the future be required to enter into agreements with such intellectual property rights holders involving the payment of royalties or other fees, or granting a limited license of our intellectual property rights, in order to resolve such inquiries and settle such claims. We cannot assure you that our business or products or services do not violate such rights of such third-party claimants. Regardless of the merit of any such claim, responding to such claims can be time consuming, divert management’s attention and resources and may cause us to incur significant expenses. In addition, parties may claim that the names and branding of our solution infringe their trademark rights in certain countries or territories. If such a claim were to prevail we may have to change the names and branding of our solution in the affected territories and incur other costs.
We currently have a number of agreements in effect pursuant to which we have agreed to defend, indemnify and hold harmless our customers, suppliers and channel and other partners from damages and costs which may arise from the infringement by our solution of third-party intellectual property rights, which may include patents, copyrights, trademarks or trade secrets. The scope of these indemnity obligations varies, but may, in some instances, include indemnification for damages and expenses, including attorneys’ fees. Our insurance may not cover all intellectual property rights infringement claims. A claim that our solution infringes a third party’s intellectual property rights, even if untrue, could harm our relationships with our customers, may deter future customers from purchasing our solution and could expose us to costly litigation and settlement expenses. Even if we are not a party to any litigation between a customer and a third party relating to infringement by our solution, an adverse outcome in any such litigation could make it more difficult for us to defend our solution against intellectual property rights infringement claims in any subsequent litigation in which we are a named party. Any of these results could harm our brand and operating results.
Our defense of intellectual property rights claims brought against us or our customers, suppliers and channel partners, with or without merit, could be time-consuming, expensive to litigate or settle, divert management resources and attention and force us to acquire or license intellectual property rights, which may involve substantial royalty or other payments. Further, a party making such a claim, if successful, could secure a judgment that requires us to pay substantial damages. We cannot assure you that we would be successful in defending against any such claims. In addition, patent applications in the United States and most other countries
30
Table of Contents
are confidential for a period of time before being published, so we cannot be certain that we were the first to conceive the inventions covered by our patents or patent applications. An adverse determination also could invalidate our intellectual property rights and prevent us from offering our solution to our customers and may require that we procure or develop substitute solutions that do not infringe, which could require significant effort and expense. We may be unable to replace those technologies with technologies that have the same features or functionality and that are of equal quality and performance standards on commercially reasonable terms, or at all. We may have to seek a license for the technology, which may not be available on acceptable terms or at all, and as a result may significantly increase our operating expenses or require us to restrict our business activities in one or more respects. Any of these events could adversely affect our business, operating results and financial condition.
System security risks, data protection breaches and cyber-attacks on our systems or solutions could compromise our proprietary information (or information of our customers), disrupt our internal operations and harm public perception of our solution, which could cause our business and reputation to suffer, create additional liabilities and adversely affect our financial conditions and stock price.
In the ordinary course of business, we store sensitive data on our internal systems, networks and servers, which may include intellectual property, our proprietary business information and that of our customers, suppliers and business partners and sales data, which may include personally identifiable information. In addition, we design and sell solutions that our customers use to store their data. The security of our own networks and the intrusion protection features of our solution are both critical to our operations and business strategy.
We devote significant resources to network security, data encryption and other security measures to protect our systems and data, but these security measures are subject to third-party security breaches, employee error, malfeasance, faulty password management or other irregularities and cannot provide absolute security. Any destructive or intrusive breach of our internal systems could result in the information stored on our networks being accessed, publicly disclosed, lost or stolen. In addition, an effective attack on our solution could disrupt the proper functioning of our solution, allow unauthorized access to sensitive, proprietary or confidential information of ours or our customers, disrupt or temporarily interrupt customers’ operations or cause other destructive outcomes, including the theft of information sufficient to engage in fraudulent transactions. The risk that these types of events could seriously harm our business is likely to increase as we expand our network of channel partners, resellers and authorized service providers and as we operate in more countries. The economic costs to us to eliminate or alleviate cyber or other security problems, viruses, worms, malicious software systems and security vulnerabilities could be significant and may be difficult to anticipate or measure because the damage may differ based on the identity and motive of the programmer or hacker, which is often difficult to identify. If any of these types of security breaches, actual or perceived, were to occur and we were to be unable to protect sensitive data, our relationships with our business partners and customers could be damaged, our reputation and brand could be harmed, use of our solution could decrease and we could be exposed to a risk of loss or litigation and possible liability.
If we are unable to successfully manage our use of “open source” software, our ability to sell our products and services could be harmed, which could result in competitive disadvantages, and subject us to possible litigation.
We incorporate open source software in our products and services. Use of open source software can lead to greater risks than the use of proprietary or third-party commercial software since open source licensors generally do not provide warranties or controls with respect to origin, functionality or other features of the software. Some open source software licenses require users who distribute open source software as part of their solutions to publicly disclose all or part of the source code in their software and make any derivative works of the open source software generally available in source code form for limited fees or at no cost. Although we monitor our use of open source software, open source license terms may be ambiguous, and many of the risks associated with the use of open source software cannot be eliminated. If we were found to have inappropriately used open source
31
Table of Contents
software in our solution, we may be required to release our proprietary source code, re-engineer our software, discontinue the sale of certain solutions in the event re-engineering cannot be accomplished on a timely basis, or take other remedial action. Furthermore, if we fail to comply with applicable open source licenses, we may be subject to costly claims of intellectual property rights infringement or demands for the public release of proprietary source code. Any of the foregoing could harm our business, operating results and financial condition.
We may become subject to claims that our employees have wrongfully disclosed or that we have wrongfully used proprietary information of their former employers, which could adversely affect our business.
Many of our employees were previously employed at current or potential competitors. Although we require our employees to not use the proprietary information or know-how of others in their work for us and we are not currently subject to any claims that they have done so, we have in the past received inquiries from former employers of our employees and we may in the future become subject to claims that these employees have divulged, or we have used, proprietary information of these employees’ former employers. Litigation may be necessary to defend against these claims. If we are unable to successfully defend any such claims, we may be required to pay monetary damages and to discontinue our commercialization of certain solutions. In addition, we may lose valuable intellectual property rights or personnel. A loss of key research personnel or their work product could hamper our ability to develop new solutions and features for our existing solutions, which could severely harm our business. Even if we are successful in defending against these claims, litigation efforts are costly, time-consuming and a significant distraction to management.
We are exposed to fluctuations in currency exchange rates, which could negatively affect our operating results.
Our sales contracts are denominated in U.S. dollars. As a result, a strengthening of the U.S. dollar could increase the real cost of our solution to our customers outside of the United States, which could adversely affect our international sales. In addition, an increasing portion of our operating expenses is incurred outside the United States, denominated in foreign currencies and subject to fluctuations in foreign currency exchange rates. If we become more exposed to currency fluctuations and are not able to successfully hedge against the risks associated with currency fluctuations, our business, operating results and financial condition could be adversely affected.
We rely on our key technical, sales and management personnel to grow our business, and the loss of one or more key employees could harm our business.
Our success and future growth depends to a significant degree on the skills and continued services of our key technical, sales and management personnel. In particular, we are highly dependent on the services of Ken Klein, our Chairman and Chief Executive Officer, and Kieran Harty, our co-founder and Chief Technical Officer, who are critical to the development of our technology, future vision and strategic direction. We rely on our leadership team in the areas of operations, security, marketing, sales, support and general and administrative functions, and on individual contributors on our research and development team. All of our employees are employed by us on an at-will basis, and we could experience difficulty in retaining members of our senior management team or other key personnel. We do not have “key person” life insurance policies that cover any of our officers or other key employees. The loss of the services of any of our key employees could disrupt our operations, delay the development and introduction of our solution and negatively impact our business, operating results and financial condition.
Our company culture has contributed to our success, and if we cannot maintain this culture as we grow, we could lose the innovation, creativity and teamwork fostered by our culture, and our business may be harmed.
We believe that a critical contributor to our success has been our company culture, which we believe fosters innovation, creativity, teamwork, passion for customers and focus on execution, as well as facilitating critical
32
Table of Contents
knowledge transfer and knowledge sharing. As we grow and change, we may find it difficult to maintain these important aspects of our company culture, which could limit our ability to innovate and operate effectively. Any failure to preserve our culture could also negatively affect our ability to retain and recruit personnel, continue to perform at current levels or execute on our business strategy.
Our ability to hire and retain employees may be negatively impacted by changes in immigration laws, regulations and procedures.
Foreign nationals who are not U.S. citizens or permanent residents constitute an important part of our U.S. workforce, particularly in the areas of engineering and product development. Our ability to hire and retain these workers and their ability to remain and work in the United States are impacted by laws and regulations, as well as by procedures and enforcement practices of various government agencies. Changes in immigration laws, regulations or procedures, including those that may be enacted by the new U.S. presidential administration, may adversely affect our ability to hire or retain such workers, increase our operating expenses and negatively impact our ability to deliver our products and services.
We may further expand through acquisitions of, or investments in, other companies, each of which may divert our management’s attention, resulting in additional dilution to our stockholders and consumption of resources that are necessary to sustain and grow our business.
While we have not consummated any acquisitions to date, we may evaluate and consider potential strategic transactions, including acquisitions of, or investments in, complementary businesses, technologies, services, products and other assets in the future. We also may enter into relationships with other businesses in order to expand our solution, which could involve preferred or exclusive licenses, additional channels of distribution or discount pricing or investments in other companies. Negotiating these transactions can be time-consuming, difficult and expensive, and our ability to close these transactions may be subject to third-party approvals, such as government regulatory approvals, which are beyond our control. Consequently, we can make no assurance that these transactions, once undertaken and announced, will close.
These kinds of acquisitions or investments may result in unforeseen operating difficulties and expenditures. In particular, we may encounter difficulties assimilating or integrating the businesses, technologies, products, personnel or operations of the acquired companies, particularly if the key personnel of the acquired business choose not to work for us. We may have difficulty retaining the customers of any acquired business or the acquired technologies or research and development expectations may prove unsuccessful. Acquisitions may also disrupt our ongoing business, divert our resources and require significant management attention that would otherwise be available for development of our business. Any acquisition or investment could expose us to unknown liabilities. Moreover, we cannot assure you that the anticipated benefits of any acquisition or investment would be realized or that we would not be exposed to unknown liabilities. In connection with these types of transactions, we may issue additional equity securities that would dilute our stockholders, use cash that we may need in the future to operate our business, incur debt on terms unfavorable to us or that we are unable to repay, incur large charges or substantial liabilities, encounter difficulties integrating diverse business cultures and become subject to adverse tax consequences, substantial depreciation or deferred compensation charges. These challenges related to acquisitions or investments could adversely affect our business, operating results and financial condition.
Failure to comply with laws and regulations applicable to our business could subject us to fines and penalties and could also negatively impact our ability to attract and retain customers.
Our business is subject to regulation by various federal, state, local and foreign government agencies, including agencies responsible for monitoring and enforcing employment and labor laws, workplace safety, product safety, environmental laws, consumer protection laws, anti-bribery laws, import/export controls, federal securities laws and tax laws and regulations. In certain jurisdictions, these regulatory requirements may be more
33
Table of Contents
stringent than in the United States. Noncompliance with applicable regulations or requirements could subject us to investigations, sanctions, mandatory product recalls, enforcement actions, disgorgement of profits, fines, damages and civil and criminal penalties or injunctions. If any government sanctions are imposed, or if we do not prevail in any possible civil or criminal litigation, our business, operating results and financial condition could be adversely affected. In addition, responding to any action will likely result in a significant diversion of management’s attention and resources and an increase in professional fees. Enforcement actions and sanctions could harm our business, operating results and financial condition.
In addition, we must comply with laws and regulations relating to the formation, administration and performance of contracts with the public sector, including U.S. federal, state and local government organizations, which affect how we and our channel partners do business with government agencies. Selling our solution to the U.S. government, whether directly or through channel partners, also subjects us to certain regulatory and contractual requirements. Failure to comply with these requirements by either us or our channel partners could subject us to investigations, fines and other penalties, which could have an adverse effect on our business, operating results and financial condition. As an example, the U.S. Department of Justice, or DOJ, and the General Services Administration, or GSA, have in the past pursued claims against and financial settlements with IT vendors under the False Claims Act and other statutes related to pricing and discount practices and compliance with certain provisions of GSA contracts for sales to the federal government. The DOJ and GSA continue to actively pursue such claims. Violations of certain regulatory and contractual requirements could also result in us being suspended or barred from future government contracting. Any of these outcomes could have an adverse effect on our business, operating results and financial condition.
These laws and regulations impose added costs on our business, and failure to comply with these or other applicable regulations and requirements, including non-compliance in the past, could lead to claims for damages from our channel partners, penalties, termination of contracts, loss of exclusive rights in our intellectual property, and temporary suspension or permanent debarment from government contracting. Any such damages, penalties, disruptions or limitations in our ability to do business with certain customers could have an adverse effect on our business, operating results and financial condition.
We are subject to government export and import controls that could impair our ability to compete in international markets or subject us to liability if we violate the controls.
Our solution is subject to U.S. export controls, including the Export Administration Regulations and economic sanctions administered by the Office of Foreign Assets Control, or OFAC, and we incorporate encryption technology into our solution. These encryption products and the underlying technology may be exported outside of the United States only with the required export authorizations, including by license, a license exception or other appropriate government authorizations, including the filing of an encryption registration.
Furthermore, our activities are subject to the U.S. economic sanctions laws and regulations that prohibit the export, re-export and transfer of certain products and services without the required export authorizations, including to countries, governments and persons targeted by U.S. embargoes or sanctions. Obtaining the necessary export license or other authorization for a particular sale may be time-consuming and may result in the delay or loss of sales opportunities even if the export license ultimately may be granted. While we take precautions to prevent our solution from being exported in violation of these laws, including obtaining authorizations for our encryption products and screening exports against U.S. government and international lists of restricted and prohibited persons, we cannot guarantee that the precautions we take will prevent violations of export control and sanctions laws. Violations of U.S. sanctions or export control laws can result in significant fines or penalties, denial of export privileges, and possible incarceration for responsible employees and managers could be imposed for criminal violations of these laws.
We also note that if our channel partners fail to obtain appropriate import, export or re-export licenses or permits, we may also be adversely affected, through reputational harm as well as other negative consequences,
34
Table of Contents
including government investigations and penalties. No assurance can be given that our channel partners will comply with export requirements.
Also, various countries, in addition to the United States, regulate the import and export of certain encryption and other technology, including through import and export licensing requirements, and have enacted laws that could limit our ability to distribute our solution or could limit our customers’ ability to implement our solution in those countries. Changes in our solution or future changes in export and import regulations may create delays in the introduction of our solution in international markets, prevent our customers with international operations from deploying our solution globally or, in some cases, prevent the export or import of our solution to certain countries, governments, or persons altogether. From time to time, various government agencies have proposed additional regulation of encryption technology. Any change in export or import regulations, economic sanctions or related legislation, or change in the countries, governments, persons or technologies targeted by such regulations, could result in decreased use of our solution by, or in our decreased ability to export or sell our solution to, existing or potential customers with international operations. Any decreased use of our solution or limitation on our ability to export or sell our solution would adversely affect our business, operating results and financial condition.
We are subject to government regulation and other legal obligations related to privacy, data protection and information security, and our actual or perceived failure to comply with such obligations could adversely affect our business and operating results. Compliance with such laws could also impair our efforts to maintain and expand our customer base and thereby decrease our revenue.
The United States and other jurisdictions where we offer our solution have laws, regulations and standards governing the protection of information privacy, data protection and information security. Our handling of data is subject to a variety of laws and regulations, including regulation by various government agencies, including the U.S. Federal Trade Commission, or FTC, and various state, local and foreign bodies and agencies. In addition, agreements with our customers and business partners may contain contractual provisions related to the protection of information privacy, data protection and information security.
The U.S. federal and various state and foreign governments have adopted or proposed limitations on the collection, distribution, use and storage of personal information of individuals, including customers and employees. In the United States, the FTC and many state attorneys general are applying federal and state consumer protection laws to the online collection, use and dissemination of data. In addition, many foreign countries and government bodies, including in Australia, the European Union, Japan and numerous other jurisdictions in which we operate or conduct our business, have laws and regulations concerning the collection and use of personally identifiable information obtained from their residents or by businesses operating within their jurisdiction. These laws and regulations often are more restrictive than those in the United States. Such laws and regulations may require companies to implement privacy and security policies, permit customers to access, correct and delete personal information stored or maintained by such companies, inform individuals of security breaches that affect their personal information, and, in some cases, obtain individuals’ consent to use personally identifiable information for certain purposes. In addition, a foreign government could require that any personally identifiable information collected in a country not be disseminated outside of that country, and we are not currently equipped to comply with such a requirement. We also may find it necessary or desirable to join industry or other self-regulatory bodies or other information security- or data protection-related organizations that require compliance with their rules pertaining to information security and data protection. We also may be bound by additional, more stringent contractual obligations relating to our collection, use and disclosure of personal, financial and other data.
We also expect that there will continue to be new proposed laws, regulations and industry standards concerning privacy, data protection and information security in the United States, the European Union and other jurisdictions, and we cannot yet determine the impact such future laws, regulations and standards may have on our business. In addition, we expect that existing laws, regulations and standards may be interpreted in new
35
Table of Contents
manners in the future. For example, an October 2015 decision by the Court of Justice for the European Union invalidated the U.S.-EU Safe Harbor Framework, which facilitated personal data transfers to the U.S. in compliance with applicable EU data protection laws. While we did not rely upon the U.S.-EU Safe Harbor Framework for our transfer of EU personal data to the United States, and do not rely upon its replacement framework, the U.S.-EU Privacy Shield, there remains some regulatory uncertainty surrounding the future of data transfers from the European Union to the United States. In addition, European legislators have adopted a general data protection regulation that will, when effective in May 2018, supersede current EU data protection legislation, impose more stringent EU data protection requirements and provide for greater penalties for noncompliance. Future laws, regulations, standards and other obligations, and changes in the interpretation of existing laws, regulations, standards and other obligations could impair our or our customers’ ability to collect, use or disclose information relating to individuals, which could decrease demand for our solution, require us to restrict our business operations, increase our costs and impair our ability to maintain and grow our customer base and increase our revenue.
Although we are working to comply with those federal, state and foreign laws and regulations, industry standards, contractual obligations and other legal obligations that apply to us, those laws, regulations, standards and obligations are evolving and may be modified, interpreted and applied in an inconsistent manner from one jurisdiction to another, and may conflict with one another, other requirements or legal obligations, our practices or the features of our solution. As such, we cannot assure ongoing compliance with all such laws or regulations, industry standards, contractual obligations and other legal obligations. Any failure or perceived failure by us to comply with federal, state or foreign laws or regulations, industry standards, contractual obligations or other legal obligations, or any actual or suspected security incident, whether or not resulting in unauthorized access to, or acquisition, release or transfer of personally identifiable information or other data, may result in government enforcement actions and prosecutions, private litigation, fines and penalties or adverse publicity and could cause our customers to lose trust in us, which could have an adverse effect on our reputation and business. Any inability to adequately address privacy and security concerns, even if unfounded, or comply with applicable laws, regulations, policies, industry standards, contractual obligations or other legal obligations could result in additional cost and liability to us, damage our reputation, inhibit sales, and adversely affect our business, operating results and financial condition.
Changes to laws or regulations affecting privacy could impose additional costs and liabilities on us and could limit our use of such information to add value for customers. If we were required to change our business activities or revise or eliminate services, or to implement burdensome compliance measures, our business and operating results could be harmed. In addition, we may be subject to fines, penalties, and potential litigation if we fail to comply with applicable privacy and/or data security laws, regulations, standards and other requirements. The costs of compliance with and other burdens imposed by privacy-related laws, regulations and standards may limit the use and adoption of our product solutions and reduce overall demand.
Furthermore, concerns regarding data privacy may cause our customers’ customers to resist providing the data and information necessary to allow our customers to use our product solutions effectively. Even the perception that the privacy and/or security of personal information is not satisfactorily protected or does not meet applicable legal, regulatory and other requirements could inhibit sales of our products or services, and could limit adoption of our solution.
Failure to comply with anticorruption and anti-money laundering laws, including the U.S. Foreign Corrupt Practices Act of 1977, as amended, or the FCPA, and similar laws associated with our activities outside of the United States could subject us to penalties and other adverse consequences.
We are subject to the FCPA, the U.S. domestic bribery statute contained in 18 U.S.C. § 201, the U.S. Travel Act, the USA PATRIOT Act, the United Kingdom Bribery Act of 2010 and other anti-bribery and anti-money laundering laws in countries in which we conduct activities. We face significant risks if we fail to comply with the FCPA and other anticorruption laws that prohibit companies and their employees and third-party
36
Table of Contents
intermediaries from authorizing, offering or providing, directly or indirectly, improper payments or benefits to foreign government officials, political parties and private-sector recipients for the purpose of obtaining or retaining business, directing business to any person or securing any advantage. In addition, we use various third parties to sell our solution and conduct our business abroad. We, our channel partners, and our other third-party intermediaries may have direct or indirect interactions with officials and employees of government agencies or state-owned or affiliated entities and we can be held liable for the corrupt or other illegal activities of these third-party intermediaries, our employees, representatives, contractors, partners, and agents, even if we do not explicitly authorize such activities. We continue to implement our FCPA/anti-corruption compliance program and cannot assure you that all of our employees and agents, as well as those companies to which we outsource certain of our business operations, will not take actions in violation of our policies and applicable law, for which we may be ultimately held responsible.
Any violation of the FCPA, other applicable anticorruption laws, and anti-money laundering laws could result in whistleblower complaints, adverse media coverage, investigations, severe criminal or civil sanctions and, in the case of the FCPA, suspension or debarment from U.S. government contracts, which could have a material and adverse effect on our reputation, business, operating results and financial condition. In addition, responding to any enforcement action may result in a significant diversion of management’s attention and resources and significant defense costs and other professional fees.
We are a multinational organization faced with increasingly complex tax issues in many jurisdictions, and changes in our effective tax rate or changes in tax laws or their application to the operation of our business could adversely impact our operating results and our business.
We conduct operations in multiple jurisdictions, and we are subject to certain taxes, including income, sales and use, value added and other taxes, in the United States and other jurisdictions in which we do business. A change in the tax laws in the jurisdictions in which we do business, including an increase in tax rates or an adverse change in the treatment of an item of income or expense, possibly with retroactive effect, could result in a material increase in the amount of taxes we incur. Recent changes to U.S. tax laws that limit the ability of taxpayers to claim and utilize foreign tax credits and require the deferral of certain tax deductions until earnings outside of the United States are repatriated to the United States, as well as changes to U.S. tax laws that may be enacted in the future, could affect the tax treatment of our foreign earnings, as well as cash and cash equivalent balances we currently maintain outside of the United States In addition, the Organization for Economic Co-operation and Development has initiated a base erosion and profit shifting project which seeks to establish certain international standards for taxing the worldwide income of multinational companies. As a result of these developments, the tax laws of certain countries in which we and our affiliates do business could change on a prospective or retroactive basis, and any such changes could increase our liabilities for taxes, interest and penalties, and therefore could harm our cash flows, operating results and financial position. Finally, the amount of taxes we pay in different jurisdictions depends on our ability to operate our business in a manner consistent with our corporate structure and transfer pricing arrangements, as well as any future intercompany transactions we may undertake.
We are subject to periodic audits or other reviews by tax authorities in the jurisdictions in which we do business, and these tax authorities may disagree with our interpretations of applicable tax law or our determinations as to the income and expenses attributable to specific jurisdictions or may challenge our methodologies for pricing intercompany transactions. In addition, authorities in jurisdictions in which we do not file tax returns could assert that we are subject to tax in such jurisdiction. In either case, such authorities could impose additional taxes, interest and penalties, claim that various withholding requirements apply to us or our subsidiaries or assert that benefits of tax treaties are not available to us or our subsidiaries. Any such audit, examination or review requires management’s time, diverts internal resources and, in the event of an unfavorable outcome, may result in additional tax liabilities or other adjustments to our historical results.
We do not collect sales and use, value added or similar taxes in all jurisdictions in which we have sales. We have previously filed voluntary disclosure agreements with several U.S. states related to past due sales and use
37
Table of Contents
taxes. While we believe that we have properly accrued for sales and use taxes in accordance with GAAP, taxing authorities may assert that we owe additional taxes, interest or penalties, which may impact our historical and future results.
Because we conduct operations in multiple jurisdictions, our effective tax rate is influenced by the amounts of income and expense attributed to each jurisdiction. If such amounts were to change so as to increase the amounts of our net income subject to taxation in higher-tax jurisdictions, or if we were to commence operations in jurisdictions assessing relatively higher tax rates, our effective tax rate could be adversely affected. In addition, we may determine that it is advisable from time to time to repatriate earnings from subsidiaries under circumstances that could give rise to imposition of potentially significant tax liabilities, including withholding taxes by the jurisdictions in which such amounts were earned, without our receiving the benefit of any offsetting tax credits, which could also adversely impact our effective tax rate and operating results.
Our ability to use net operating losses to offset future taxable income may be subject to certain limitations.
As of January 31, 2017, we had $257.9 million of federal and $121.9 million of state net operating loss carryforwards available to reduce future taxable income. These net operating loss carryforwards begin to expire in 2028 for U.S. federal and state income tax purposes. U.S. federal and state income tax laws limit the amount of these carryforwards we can utilize in any given year to offset our taxable income following an “ownership change” (generally defined as a greater than 50% cumulative shift of the stock ownership of certain stockholders over a rolling three-year period), including ownership changes due to the issuance of additional shares of our common stock, or securities convertible into our common stock. Some of our existing carryforwards may be subject to limitations arising from previous ownership changes, and we may experience subsequent ownership changes (including in connection with this offering). Accordingly, there is a risk that our ability to use our existing carryforwards in the future could be limited and that existing carryforwards would be unavailable to offset future income tax liabilities. Furthermore, our ability to utilize the net operating loss carryforwards of companies that we may acquire in the future may be subject to limitations. Limitations imposed on our ability to utilize our net operating loss carryforwards could cause U.S. federal and state income taxes to be paid earlier than would be paid if such limitations were not in effect and could cause such net operating loss carryforwards to expire unused, in each case reducing or eliminating the benefit of such net operating loss carryforwards. Furthermore, we may not be able to generate sufficient taxable income to utilize our net operating loss carryforwards before they expire. Furthermore, our existing net operating loss carryforwards could be limited by legislative or regulatory changes, such as suspensions on the use of net operating carryforwards. If any of these events occur, we may not derive some or all of the expected benefits from our net operating loss carryforwards, which could potentially result in increased future tax liability to us and could adversely affect our business, operating results and financial condition.
Our reported financial results may be adversely affected by changes in accounting principles applicable to us.
Generally accepted accounting principles in the United States are subject to interpretation by the Financial Accounting Standards Board, or FASB, the Securities and Exchange Commission, or the SEC, and other bodies formed to promulgate and interpret appropriate accounting principles. A change in these principles or interpretations could have a significant effect on our reported financial results, and could affect the reporting of transactions completed before the announcement of a change. In addition, the SEC has announced a multi-year plan that could ultimately lead to the use of International Financial Reporting Standards by U.S. issuers in their SEC filings. Any such change could have a significant effect on our reported financial results. Additionally, the adoption of new or revised accounting principles may require that we make significant changes to our systems, processes and controls.
38
Table of Contents
We have incurred indebtedness, which could adversely affect our ability to adjust our business to respond to competitive pressures and to obtain sufficient funds to satisfy our future research and development needs, to protect and enforce our intellectual property and to meet other needs.
We have entered into a $20.0 million revolving line of credit with SVB and a $60.0 million credit facility with TriplePoint Capital LLC, or TriplePoint. These facilities are secured by substantially all of our assets and intellectual property rights. As of April 30, 2017, we had $19.0 million of principal indebtedness outstanding under the SVB line of credit and $50.0 million under the TriplePoint credit facility. These facilities contain various covenants and specify various events of default, including a “cross default” provision that provides that, if there is an event of default that has not been cured or waived within any applicable grace period under one lender’s debt facility, there is an event of default under the other lender’s debt facility, upon which, at each lender’s option, all amounts outstanding under each lender’s applicable facility would become immediately due and payable and further advances under the facility would not be available to us. Our revolving line of credit with SVB expires in May 2018. $35.0 million of borrowings under the TriplePoint credit facility will become due in August 2018, and $15.0 million of borrowings will become due in February 2019. In June 2017, we entered into an agreement with TriplePoint to extend the maturity date of $35.0 million of borrowings from August 2018 to February 2019 if our common stock is listed and is actively trading on the NASDAQ Stock Market on or prior to July 30, 2017, at which point the remaining balance of up to approximately $30.0 million of borrowings will amortize over the following 18 months, subject to certain conditions, including the completion of this offering. Any required repayment of our existing indebtedness as a result of an event of default would reduce our cash on hand such that we would not have those funds available for use in our business, which could have a material adverse effect on our business, operating results and financial condition.
Regulations related to conflict minerals may cause us to incur additional expenses and could limit the supply and increase the costs of certain metals used in the manufacturing of our platforms.
As a public company, we will be subject to the requirements under the Dodd-Frank Wall Street Reform and Consumer Protection Act of 2010, or the Dodd-Frank Act, that will require us to investigate, disclose and report whether the hardware components that house our solution contain conflict minerals. The implementation of these requirements could adversely affect the sourcing, availability and pricing of the materials used in the manufacture of components used in our solution. In addition, we will incur additional costs to comply with the disclosure requirements, including costs related to conducting diligence procedures to determine the sources of conflict minerals that may be used in or necessary to the production of our hardware components and, if applicable, potential changes to components, processes or sources of supply as a consequence of such verification activities. It is also possible that we may face reputational harm if we determine that certain of our hardware components contain minerals not determined to be conflict-free or if we are unable to alter our solution, processes or sources of supply to avoid use of such materials.
If we fail to comply with environmental requirements, our business, operating results and reputation could be adversely affected.
We are subject to various environmental laws and regulations including laws governing the hazardous material content of our products and laws relating to the collection of and recycling of electrical and electronic equipment. Examples of these laws and regulations include the EU Restrictions of Hazardous Substances Directive, or RoHS, and the EU Waste Electrical and Electronic Equipment Directive, or WEEE, as well as the implementing legislation of the EU member states. Similar laws and regulations have been passed or are pending in China, South Korea, Norway and Japan and may be enacted in other regions, including in the United States, and we are, or may in the future be, subject to these laws and regulations.
The EU RoHS and the similar laws of other jurisdictions ban the use of certain hazardous materials such as lead, mercury and cadmium in the manufacture of electrical equipment, including our products. Currently, the manufacturer of the hardware components that house our solution and our major component part suppliers comply with the EU RoHS requirements. However, if there are changes to this or other laws (or their
39
Table of Contents
interpretation) or if new similar laws are passed in other jurisdictions, we may be required to reengineer our products to use components compatible with these regulations. This reengineering and component substitution could result in additional costs to us or disrupt our operations or logistics.
The WEEE Directive requires electronic goods producers to be responsible for the collection, recycling and treatment of such products. Changes in interpretation of the directive or with any similar laws adopted in other jurisdictions may cause us to incur additional costs or have additional regulatory requirements to meet in the future in order to comply.
Our failure to comply with past, present and future similar laws could result in reduced sales of our products, substantial product inventory write-offs, reputational damage, penalties and other sanctions, any of which could harm our business and operating results. We also expect that our products will be affected by new environmental laws and regulations on an ongoing basis. To date, our expenditures for environmental compliance have not had a material impact on our operating results or cash flows, and although we cannot predict the future impact of such laws or regulations, they will likely result in additional costs and may increase penalties associated with violations or require us to change the content of our products or how they are manufactured, which could have an adverse effect on our business, operating results and financial condition.
Our business is subject to the risks of earthquakes, fire, power outages, floods, and other catastrophic events, and to interruption by man-made problems such as terrorism.
A significant natural disaster, such as an earthquake, fire, flood or significant power outage, could have a material adverse impact on our business and operating results. Our corporate headquarters and the location where our products are manufactured are located in a region known for seismic activity. In addition, natural disasters could affect our supply chain, manufacturing vendors, or logistics providers’ ability to provide materials and perform services such as manufacturing products or assisting with shipments on a timely basis. In the event we or our service providers are hindered by any of the events discussed above, shipments could be delayed, resulting in missed financial targets, such as revenue and shipment targets, for a particular quarter. In addition, acts of terrorism and other geo-political unrest could cause disruptions in our business or the businesses of our supply chain, manufacturer, logistics providers, partners or customers, or the economy as a whole. Any disruption in the business of our supply chain, manufacturer, logistics providers, partners or customers that impacts sales at the end of a fiscal quarter could have a significant adverse impact on our quarterly results. All of the aforementioned risks may be further increased if we do not implement a disaster recovery plan or our suppliers’ disaster recovery plans prove to be inadequate. To the extent that any of the above should result in delays or cancellations of customer orders, or delays in the manufacture, deployment or shipment of our products, our business, operating results and financial condition would be adversely affected.
Risks Related to Our Common Stock
An active trading market for our common stock may never develop or be sustained, which may make it difficult for you to sell your shares at an attractive price, if at all.
There has been no public market for our common stock prior to this offering. The initial public offering price for our common stock will be determined through negotiations between the underwriters and us and may vary from the market price of our common stock following this offering. If you purchase shares of our common stock in this offering, you may not be able to resell those shares at or above the initial public offering price. An active or liquid market in our common stock may not develop upon the closing of this offering or, if it does develop, it may not be sustainable, which could adversely affect your ability to sell your shares and could depress the market price of our common stock.
40
Table of Contents
Our share price may be volatile, and you may be unable to sell your shares at or above the offering price.
The trading prices of the securities of technology companies, including enterprise cloud companies, have been highly volatile. The market price of our common stock may fluctuate significantly in response to numerous factors, many of which are beyond our control, including:
| • | actual or anticipated fluctuations in our revenue and other operating results; |
| • | announcements by us or our competitors of significant technical innovations, acquisitions, partnerships, joint ventures or capital commitments; |
| • | the financial projections we may provide to the public, any changes in these projections or our failure to meet these projections; |
| • | failure of securities analysts to initiate or maintain coverage of us, changes in ratings and financial estimates by any securities analysts who follow our company, or our failure to meet these estimates or the expectations of investors; |
| • | changes in operating performance and stock market valuations of other technology or comparable companies, or those in our industry in particular; |
| • | price and volume fluctuations in the trading of our common stock and in the overall stock market, including as a result of trends in the economy as a whole; |
| • | developments or disputes concerning our intellectual property or other proprietary rights; |
| • | changes in accounting standards, policies, guidelines, interpretations or principles; |
| • | new laws or regulations or new interpretations of existing laws or regulations applicable to our business or our industry; |
| • | lawsuits threatened or filed against us; |
| • | future sales of shares of our common stock by us or our stockholders; |
| • | rumors and market speculation involving us or other companies in our industry; |
| • | actual or anticipated developments in our business, our competitors’ businesses, or the competitive landscape generally; |
| • | changes in key personnel; and |
| • | other events or factors, including those resulting from war, incidents of terrorism or responses to these events. |
Stock prices of many technology companies have fluctuated in a manner unrelated or disproportionate to the operating performance of those companies. In the past, stockholders have instituted securities class action litigation following periods of market volatility. If we were to become involved in securities litigation, it could subject us to substantial costs and divert resources and the attention of management from our business and adversely affect our business, operating results and financial condition.
Sales of outstanding shares of our common stock into the market in the future could cause the market price of our common stock to drop significantly.
The market price for our common stock could decline as a result of the sale of substantial amounts of our common stock, particularly sales by our directors, executive officers and significant stockholders, a large number of shares of our common stock becoming available for sale or the perception in the market that holders of a large number of shares intend to sell their shares. Based on shares outstanding as of April 30, 2017, upon completion of this offering, we will have outstanding approximately 31.0 million shares of common stock, approximately 21.2 million, excluding shares that could be purchased in this offering by stockholders holding more than 5% of our outstanding shares and their affiliates, of which are subject to the 180-day contractual lock-up more fully
41
Table of Contents
described in “Underwriters.” Morgan Stanley & Co. LLC, on behalf of the underwriters, will have the discretion to permit our officers, directors, employees and stockholders to sell shares prior to the expiration of the lock-up agreements.
After this offering, holders of an aggregate of 19,790,382 shares of our common stock as of April 30, 2017, will have rights, subject to some conditions, to require us to file registration statements covering their shares or to include their shares in registration statements that we may file for ourselves or our other stockholders. Substantially all of these shares are subject to the 180-day contractual lock-up referred to above.
In addition, the shares of common stock subject to outstanding options and RSUs under our equity incentive plans and the shares reserved for future issuance under our equity incentive plans will become eligible for sale in the public market in the future, subject to certain legal and contractual limitations. See “Shares Eligible for Future Sale” for a more detailed description of sales that may occur in the future.
If a substantial number of shares are sold, or if it is perceived that they will be sold, in the public market, before or after the expiration of the 180-day contractual lock-up period, the trading price of our common stock could decline.
If you purchase shares of our common stock in this offering, you will experience substantial and immediate dilution.
If you purchase shares of our common stock in this offering, you will incur immediate dilution of $10.86 per share, based on an assumed initial public offering price of $11.50 per share, the midpoint of the estimated offering price range set forth on the cover page of this prospectus, and based on our pro forma as adjusted net tangible book value as of April 30, 2017, because the price that you pay will be substantially greater than the pro forma net tangible book value per share of the common stock that you acquire. This dilution is due in large part to the fact that our earlier investors paid substantially less than the initial public offering price when they purchased their shares of our capital stock. You will experience additional dilution upon exercise of any warrant, upon exercise of options to purchase common stock under our equity incentive plans, if we issue restricted stock to our employees under our equity incentive plans, upon the settlement of any vested RSUs or if we otherwise issue additional shares of our common stock at a price per share below the initial public offering price per share. For a further description of the dilution that you will experience immediately after this offering, see “Dilution.”
If securities analysts do not publish research or reports about our business, or if they downgrade our common stock, the price of our common stock could decline.
The trading market for our common stock depends in part on the research and reports that securities or industry analysts publish about us or our business, our market and our competitors. If no or few securities or industry analysts cover our company, the trading price for our common stock would be negatively impacted. If one or more of the analysts who covers us downgrades our common stock or publishes incorrect or unfavorable research about our business, our stock price would likely decline. If one or more of these analysts ceases coverage of our company or fails to publish reports on us regularly, demand for our common stock could decrease, which could cause our stock price or trading volume to decline.
The concentration of ownership among our existing directors, executive officers and principal stockholders will provide them, collectively, with substantial control over us after this offering, which could limit your ability to influence the outcome of key transactions, including a change of control.
We anticipate that our executive officers, directors, current 5% or greater stockholders and affiliated entities will together beneficially own approximately 62.8% of our common stock outstanding after this offering based on shares outstanding as of May 31, 2017, excluding shares that could be purchased in this offering by stockholders holding more than 5% of our outstanding shares and their affiliates. As a result, these stockholders, acting together, will have significant influence over all matters that require approval by our stockholders,
42
Table of Contents
including the election of directors and approval of significant corporate transactions. Corporate action might be taken even if other stockholders, including those who purchase shares in this offering, oppose them. This concentration of ownership might also have the effect of delaying or preventing a change of control of our company that other stockholders may view as beneficial.
Certain of our existing stockholders, including entities affiliated with Lightspeed Venture Partners, New Enterprise Associates, Silverlake Kraftwerk, Insight Venture Partners and Menlo Ventures, have indicated an interest in purchasing up to an aggregate of approximately $23.0 million in shares of our common stock in this offering at the initial public offering price. The previously discussed ownership percentage upon completion of this offering does not reflect the potential purchase of any shares in this offering by such stockholders. If these stockholders purchase an aggregate of $23.0 million in shares of our common stock in this offering at $11.50 per share (the mid-point of the price range set forth on the cover page of this prospectus), upon completion of this offering, our executive officers, directors, current 5% or greater stockholders and affiliated entities will hold up to approximately 68.8% of our outstanding common stock based on shares outstanding as of May 31, 2017.
Participation in this offering by existing stockholders could reduce the public float for our shares.
Certain of our existing stockholders, including entities affiliated with Lightspeed Venture Partners, New Enterprise Associates, Silverlake Kraftwerk, Insight Venture Partners and Menlo Ventures, have indicated an interest in purchasing up to $23.0 million in shares of our common stock in this offering at the initial public offering price. Because this indication of interest is not a binding agreement or commitment to purchase, such entities could determine to purchase more, less or no shares in this offering or the underwriters could determine to sell more, less or no shares such entities. If such entities are allocated all or a portion of the shares in which they have indicated an interest in this offering or more, and purchase any such shares, such purchase could reduce the available public float for our shares.
We have broad discretion in the use of the net proceeds that we receive in this offering.
We expect to use the net proceeds from this offering for working capital and other general corporate purposes. In addition, we may use a portion of the net proceeds to acquire or invest in complementary businesses or solutions or to obtain the right to use complementary technologies. We have not reserved or allocated specific amounts for these purposes, and we cannot specify with certainty how we will use the net proceeds. Accordingly, management will have considerable discretion in the application of the net proceeds, and you will not have the opportunity, as part of your investment decision, to assess whether the proceeds are being used appropriately. The net proceeds may be used for corporate purposes that do not increase our operating results or market value. Until the net proceeds are used, they may be placed in investments that do not produce income or that lose value.
Our future capital needs are uncertain, and we may need to raise additional funds in the future. In the event we require additional funds in the future, those funds may not be available on acceptable terms, or at all.
Our business and operations may consume resources faster than we anticipate. In the future, we may need to raise additional funds to invest in future growth opportunities. Additional financing may not be available on favorable terms, if at all. If adequate funds are not available on acceptable terms, we may be unable to invest in future growth opportunities, which could seriously harm our business and operating results. Moreover, attempting to secure additional financing may divert our management from our day-to-day activities, which may adversely affect our ability to develop new and enhanced solutions. Our existing and any future debt holders would have rights senior to common stockholders to make claims on our assets, and the terms of any debt could restrict our operations, including our ability to pay dividends on our common stock. Furthermore, if we issue additional equity securities, stockholders will experience dilution, and the new equity securities could have rights senior to those of our common stock. Because our decision to issue securities in any future offering will depend on market conditions and other factors beyond our control, we cannot predict or estimate the amount, timing or nature of our future offerings. As a result, our stockholders bear the risk of any future securities offerings by us reducing the market price of our common stock and diluting their interest.
43
Table of Contents
We are an “emerging growth company,” and the reduced disclosure requirements applicable to emerging growth companies might make our common stock less attractive to investors, which would in turn decrease the value of our stock.
We are an “emerging growth company,” as defined in the JOBS Act, and we may take advantage of certain exemptions from various reporting requirements that are applicable to other public companies that are not “emerging growth companies” including, but not limited to, not being required to comply with the auditor attestation requirements of Section 404 of the Sarbanes-Oxley Act of 2002, or the Sarbanes-Oxley Act, reduced financial disclosure obligations, reduced disclosure obligations regarding executive compensation in our periodic reports and proxy statements, and exemptions from the requirements of holding a nonbinding advisory vote on executive compensation and any golden parachute payments not previously approved. We may take advantage of these provisions for up to five years or such earlier time that we are no longer an “emerging growth company.” We would cease to be an “emerging growth company” upon the earliest to occur of: the last day of the fiscal year in which we have more than $1.07 billion in annual revenue; the date we qualify as a “large accelerated filer,” with at least $700 million of equity securities held by non-affiliates; the issuance, in any three-year period, by us of more than $1.0 billion in non-convertible debt securities; and the last day of the fiscal year ending after the fifth anniversary of our initial public offering. We may choose to take advantage of some but not all of these reduced reporting burdens. If we take advantage of any of these reduced reporting burdens in future filings, the information that we provide our security holders may be different than the information you might get from other public companies in which you hold equity interests. We cannot predict if investors will find our common stock less attractive because we may rely on these exemptions. If some investors find our common stock less attractive as a result, there may be a less active trading market for our common stock and our stock price may be more volatile.
In addition, Section 107 of the JOBS Act provides that an “emerging growth company” can take advantage of the extended transition period provided in Section 7(a)(2)(B) of the Securities Act of 1933, as amended, or the Securities Act, for complying with new or revised accounting standards. In other words, an “emerging growth company” can delay the adoption of certain accounting standards until those standards would otherwise apply to private companies. However, we have chosen to “opt out” of such extended transition period, and as a result, we will comply with new or revised accounting standards on the relevant dates on which adoption of such standards is required for non-emerging growth companies. Section 107 of the JOBS Act provides that our decision to opt out of the extended transition period for complying with new or revised accounting standards is irrevocable.
The requirements of being a public company will subject us to increased costs and may strain our resources and divert management’s attention.
As a public company, we will be subject to the reporting requirements of the Securities Exchange Act of 1934, as amended, or the Exchange Act, the Sarbanes-Oxley Act, the Dodd-Frank Act, and the rules and regulations of the NASDAQ Stock Market. The requirements of these rules and regulations will increase our legal, accounting and financial compliance costs, will make some activities more difficult, time-consuming and costly and may also place undue strain on our personnel, systems and resources.
The Exchange Act requires, among other things, that we file annual, quarterly and current reports with respect to our business and operating results. The Sarbanes-Oxley Act requires, among other things, that we maintain effective disclosure controls and procedures and internal control over financial reporting. We are continuing the costly process of implementing and testing our systems to report our results as a public company, to continue to manage our growth and to implement internal controls. We will be required to implement and maintain various other control and business systems related to our equity, finance, treasury, information technology, other recordkeeping systems and other operations. As a result of this implementation and maintenance, management’s attention may be diverted from other business concerns, which could adversely affect our business. Furthermore, we rely on third-party software and system providers for ensuring our reporting obligations and effective internal controls, and to the extent these third parties fail to provide adequate service
44
Table of Contents
including as a result of any inability to scale to handle our growth and the imposition of these increased reporting and internal controls and procedures, we could incur material costs for upgrading or switching systems and our business could be affected.
In addition, changing laws, regulations and standards relating to corporate governance and public disclosure are creating uncertainty for public companies, increasing legal and financial compliance costs and making some activities more time-consuming. These laws, regulations and standards are subject to varying interpretations, in many cases due to their lack of specificity and, as a result, their application in practice may evolve over time as new guidance is provided by regulatory and governing bodies. This could result in continuing uncertainty regarding compliance matters and higher costs necessitated by ongoing revisions to disclosure and governance practices. We intend to invest resources to comply with evolving laws, regulations and standards, and this investment may result in increased general and administrative expenses and a diversion of management’s time and attention from revenue-generating activities to compliance activities. If our efforts to comply with new laws, regulations and standards differ from the activities intended by regulatory or governing bodies due to ambiguities related to their application and practice, regulatory authorities may initiate legal proceedings against us and our business may be adversely affected.
In addition, we expect these laws, rules and regulations to make it more difficult and more expensive for us to obtain director and officer liability insurance, and we may be required to incur substantial costs to maintain appropriate levels of coverage. These factors could also make it more difficult for us to attract and retain qualified members of our board of directors, particularly to serve on our audit committee, and qualified executive officers.
As a result of disclosure of information in this prospectus and in filings required of a public company, our business and financial condition will become more visible, which we believe may result in threatened or actual litigation, including by competitors and other third parties. If such claims are successful, our business and operating results could be adversely affected, and even if the claims do not result in litigation or are resolved in our favor, these claims, and the time and resources necessary to resolve them, could divert the time and resources of our management and adversely affect our business, operating results and financial condition.
As a result of becoming a public company, we will be obligated to further develop and maintain proper and effective internal control over financial reporting. We may not complete our analysis of our internal control over financial reporting in a timely manner, or these internal controls may not be determined to be effective, which may adversely affect investor confidence in our company and, as a result, the value of our common stock.
We will be required, pursuant to Section 404 of the Sarbanes-Oxley Act, to furnish a report by management on, among other things, the effectiveness of our internal control over financial reporting commencing with our annual report covering the fiscal year ending January 31, 2019. This assessment will need to include disclosure of any material weaknesses identified by our management in our internal control over financial reporting. Prior to this offering, we have never been required to test our internal controls within a specified period, and, as a result, we may experience difficulty in meeting these reporting requirements in a timely manner. In addition, as a result of our testing of internal controls, we may identify control deficiencies which could result in a material weakness or significant deficiency. For example, in connection with the audit of our financial statements for fiscal 2017, we identified a significant deficiency with respect to our control processes in relation to the approval of non-standard contract terms. In addition, in connection with the audit of our financial statements for fiscal 2016, we identified a significant deficiency related to accounting for the cash flow impact of transferring certain evaluation units from customer evaluation inventory to sales demonstration equipment. Our independent registered public accounting firm will not be required to formally attest to the effectiveness of our internal control over financial reporting pursuant to Section 404 of the Sarbanes-Oxley Act until the later of the year following our first annual report required to be filed with the SEC or the date we are no longer an “emerging growth company” as defined in the JOBS Act. If we are unable to comply with the requirements of Section 404 of the Sarbanes-Oxley Act in a
45
Table of Contents
timely manner, the market price of our stock could decline and we could be subject to sanctions or investigations by the stock exchange on which our common stock is listed, the SEC or other regulatory authorities, which would require additional financial and management resources.
Any failure to develop or maintain effective controls, or any difficulties encountered in their implementation or improvement, could harm our operating results or cause us to fail to meet our reporting obligations. Any failure to implement and maintain effective internal controls also could adversely affect the results of periodic management evaluations regarding the effectiveness of our internal control over financial reporting. Ineffective disclosure controls and procedures or internal control over financial reporting could also cause investors to lose confidence in our reported financial and other information, which would likely have a negative effect on the trading price of our common stock.
Implementing any appropriate changes to our internal controls may require specific compliance training of our directors, officers and employees, entail substantial costs in order to modify our existing accounting systems, and take a significant period of time to complete. Such changes may not, however, be effective in maintaining the adequacy of our internal controls, and any failure to maintain that adequacy, or consequent inability to produce accurate financial statements on a timely basis, could increase our operating costs and could impair our ability to operate our business. In the event that we are not able to demonstrate compliance with Section 404 of the Sarbanes-Oxley Act in a timely manner, that our internal controls are perceived as inadequate or that we are unable to produce timely or accurate financial statements, investors may lose confidence in our operating results and our stock price could decline.
We do not intend to pay dividends following the completion of this offering.
We have never declared or paid any cash dividends on our common stock and do not currently intend to do so for the foreseeable future. In addition, our loan and security agreements with SVB and TriplePoint prohibit us from paying dividends, and future financing or credit agreements that we enter into may contain similar restrictions. We currently intend to invest our future earnings, if any, to fund our growth. Therefore, you are not likely to receive any dividends on your common stock for the foreseeable future and the success of an investment in shares of our common stock will depend upon any future appreciation in its value. Consequently, investors may need to sell all or part of their holdings of our common stock after price appreciation, which may never occur, as the only way to realize any future gains on their investment. There is no guarantee that shares of our common stock will appreciate in value or even maintain the price at which our stockholders have purchased their shares. Investors seeking cash dividends should not purchase our common stock.
Anti-takeover provisions in our certificate of incorporation and bylaws as well as provisions of Delaware law might discourage, delay or prevent a change of control of our company or changes in our management and, therefore, depress the trading price of our common stock.
Our amended and restated certificate of incorporation, amended and restated bylaws and Delaware law contain provisions that may have the effect of delaying or preventing a change in control of us or changes in our management. Our amended and restated certificate of incorporation and amended and restated bylaws, which will become effective immediately prior to the completion of this offering, include provisions that:
| • | create a classified board of directors whose members serve staggered three-year terms; |
| • | authorize “blank check” preferred stock, which could be issued by our board of directors without stockholder approval and may contain voting, liquidation, dividend, and other rights superior to our common stock; |
| • | specify that special meetings of our stockholders can be called only by our board of directors, the chairperson of the board, the chief executive officer or the president and that limit the ability of our stockholders to act by written consent; |
46
Table of Contents
| • | establish an advance notice procedure for stockholder approvals to be brought before an annual meeting of our stockholders, including proposed nominations of persons for election to our board of directors; |
| • | limit the liability of, and provide indemnification to, our directors; |
| • | provide that our directors may be removed only for cause; |
| • | provide that vacancies on our board of directors may be filled only by a majority of directors then in office, even though less than a quorum, or by a sole remaining director; |
| • | do not provide for cumulative voting for members of our board of directors; |
| • | authorize our board of directors to modify, alter or repeal our amended and restated bylaws; and |
| • | require supermajority votes of the holders of our common stock to amend specified provisions of our charter documents. |
These provisions, alone or together, could delay or prevent hostile takeovers and changes in control or changes in our management.
In addition, because we are incorporated in Delaware, we are governed by the provisions of Section 203 of the Delaware General Corporation Law, which limits the ability of stockholders owning in excess of 15% of our outstanding voting stock to merge or combine with us in certain circumstances.
Any provision of our amended and restated certificate of incorporation or amended and restated bylaws or Delaware law that has the effect of delaying or deterring a change in control could limit the opportunity for our stockholders to receive a premium for their shares of our common stock, and could also affect the price that some investors are willing to pay for our common stock.
Our amended and restated bylaws provide that the Court of Chancery of the State of Delaware and the federal district courts of the United States of America will be the exclusive forums for substantially all disputes between us and our stockholders, which could limit our stockholders’ ability to obtain a favorable judicial forum for disputes with us or our directors, officers, or employees.
Our amended and restated bylaws, which will become effective immediately prior to the completion of this offering, provides that the Court of Chancery of the State of Delaware is the exclusive forum for:
| • | any derivative action or proceeding brought on our behalf; |
| • | any action asserting a breach of fiduciary duty; |
| • | any action asserting a claim against us arising under the Delaware General Corporation Law, our amended and restated certificate of incorporation, or our amended and restated bylaws; |
| • | any action to interpret, apply, enforce or determine the validity of our amended and restated certificate of incorporation or our amended and restated bylaws; and |
| • | any action asserting a claim against us that is governed by the internal-affairs doctrine. |
Our amended and restated bylaws further provides that the federal district courts of the United States of America will be the exclusive forum for resolving any complaint asserting a cause of action arising under the Securities Act.
These exclusive-forum provisions may limit a stockholder’s ability to bring a claim in a judicial forum that it finds favorable for disputes with us or our directors, officers, or other employees, which may discourage lawsuits against us and our directors, officers, and other employees. If a court were to find either exclusive-forum provision in our amended and restated bylaws to be inapplicable or unenforceable in an action, we may incur additional costs associated with resolving the dispute in other jurisdictions, which could seriously harm our business.
47
Table of Contents
SPECIAL NOTE REGARDING FORWARD-LOOKING STATEMENTS
This prospectus, including the sections “Prospectus Summary,” “Risk Factors,” “Use of Proceeds,” “Management’s Discussion and Analysis of Financial Condition and Results of Operations” and “Business,” contains forward-looking statements. The words “believe,” “may,” “will,” “potentially,” “estimate,” “continue,” “anticipate,” “intend,” “could,” “would,” “project,” “plan,” “expect” and similar expressions that convey uncertainty of future events or outcomes are intended to identify forward-looking statements. These forward-looking statements include, but are not limited to, statements concerning the following:
| • | our future financial performance, including our expectations regarding our revenue, cost of revenue, gross profit or gross margin, operating expenses including changes in research and development, sales and marketing and general and administrative expenses, and our ability to achieve, and maintain, future profitability; |
| • | our business plan and our ability to effectively manage our growth and associated investments; |
| • | the anticipated benefits associated with the use of our solution; |
| • | anticipated trends, growth rates and challenges in our business and in the markets in which we operate; |
| • | market acceptance of our enterprise cloud solution; |
| • | adoption of and developments in the technologies that are integral to our value proposition, including virtualized applications and hybrid cloud data centers; |
| • | beliefs and objectives for future operations, including our plans to introduce new products; |
| • | our ability to increase sales of our solutions to our existing customers; |
| • | our ability to attract and retain customers; |
| • | our ability to maintain and expand our customer base and our relationships with our channel partners; |
| • | our ability to timely and effectively scale and adapt our existing solutions; |
| • | anticipated changes in the price of our solution and our pricing model; |
| • | our ability to develop new solutions and bring them to market in a timely manner; |
| • | our ability to maintain, protect and enhance our brand and intellectual property; |
| • | our ability to continue to expand internationally; |
| • | the effects of increased competition in our markets and our ability to compete effectively; |
| • | consolidation in our industry; |
| • | sufficiency of cash to meet cash needs for at least the next twelve months; |
| • | future acquisitions or investments; |
| • | our ability to stay in compliance with laws and regulations that currently apply or become applicable to our business both in the United States and internationally; |
| • | our compliance with tax laws and the adequacy of our accrual for potential tax liabilities; |
| • | economic and industry trends or trend analysis; |
| • | the attraction and retention of qualified employees and key personnel; |
| • | the estimates and estimate methodologies used in preparing our consolidated financial statements and determining option exercise prices; and |
| • | the future trading prices of our common stock. |
48
Table of Contents
We caution you that the foregoing list may not contain all of the forward-looking statements made in this prospectus.
We discuss many of these risks in this prospectus in greater detail in “Risk Factors.” Also, these forward-looking statements represent our estimates and assumptions only as of the date of this prospectus. Unless required by federal securities laws, we do not intend to update any of these forward-looking statements to reflect circumstances or events that occur after the statements are made. Given these uncertainties, you should not place undue reliance on these forward-looking statements.
You should read this prospectus and the documents that we reference in this prospectus and have filed as exhibits to the registration statement, of which this prospectus is a part, completely and with the understanding that our actual future results may be materially different from what we expect. We qualify all of our forward-looking statements by these cautionary statements.
In addition, statements that “we believe” and similar statements reflect our beliefs and opinions on the relevant subject. These statements are based upon information available to us as of the date of this prospectus, and while we believe such information forms a reasonable basis for such statements, such information may be limited or incomplete, and our statements should not be read to indicate that we have conducted an exhaustive inquiry into, or review of, all potentially available relevant information. These statements are inherently uncertain and investors are cautioned not to unduly rely upon these statements.
49
Table of Contents
Unless otherwise indicated, information contained in this prospectus concerning our industry and the markets in which we operate, including our general expectations and market position, market opportunity, and market size, is based on information from various sources, including International Data Corporation, or IDC, on assumptions that we have made that are based on those data and other similar sources and on our knowledge of the markets for our solution and services. This information involves a number of assumptions and limitations, and you are cautioned not to give undue weight to such estimates. While we believe the market position, market opportunity and market size information included in this prospectus is generally reliable, such information is inherently imprecise. In addition, projections, assumptions and estimates of our future performance and the future performance of the industry in which we operate is necessarily subject to a high degree of uncertainty and risk due to a variety of factors, including those described in “Risk Factors” and elsewhere in this prospectus. These and other factors could cause results to differ materially from those expressed in the estimates made by the independent parties and by us.
The IDC Reports described herein represent data, research opinion or viewpoints published as part of a syndicated subscription service, by IDC, and are not representations of fact. The IDC Reports speak as of their original publication dates (and not as of the date of this prospectus) and the opinions expressed in the IDC Reports are subject to change without notice. The IDC Reports consist of:
| • | IDC Survey Spotlight: Based on the Worldwide CloudView Survey, How Will IT Budgets Change Over Time?, January 2016. |
| • | IDC Special Study: Market Trends in Virtualization Infrastructure and Software 2016 – Market Share and Forecast Report, December 2016. |
| • | IDC FutureScape: Worldwide Cloud 2017 Predictions, November 2016. |
| • | IDC Market Forecast: Worldwide Storage for Virtual x86 Environments Forecast, 2016-2020, September 2016. |
| • | IDC Market Forecast: Worldwide and U.S. Enterprise Storage Systems Forecast Update, 2016-2020, October 2016. |
| • | IDC Market Forecast: Worldwide Disk-Based Data Protection and Recovery Forecast, 2015-2019: Blame the Cloud?, December 2015. |
| • | IDC Market Forecast: Worldwide Cloud Systems Management Software Forecast, 2017-2021, February 2017. |
| • | IDC Market Forecast: Worldwide Storage for Public and Private Cloud Forecast, 2016-2020, December 2016. |
| • | IDC Market Forecast: Worldwide Software Storage Forecast, 2016-2020, June 2016. |
50
Table of Contents
We estimate that the net proceeds we receive from this offering will be approximately $87.5 million based upon the assumed initial public offering price of $11.50 per share, the midpoint of the estimated offering price range set forth on the cover page of this prospectus, and after deducting estimated underwriting discounts and commissions and estimated offering expenses payable by us. If the underwriters’ exercise their option to purchase additional shares in full, our estimated net proceeds will be approximately $101.5 million after deducting estimated underwriting discounts and commissions and estimated offering expenses payable by us.
Each $1.00 increase or decrease in the assumed initial public offering price of $11.50 per share, the midpoint of the offering price range set forth on the cover page of this prospectus, would increase or decrease, as applicable, the net proceeds that we receive from this offering by approximately $8.1 million, assuming the number of shares offered by us as set forth on the cover page of this prospectus remains the same and after deducting estimated underwriting discounts and commissions. Similarly, each increase or decrease of 1.0 million in the number of shares of our common stock offered by us would increase or decrease, as applicable, the net proceeds that we receive from this offering by approximately $10.7 million, assuming the assumed initial public offering price remains the same and after deducting estimated underwriting discounts and commissions.
We intend to use the net proceeds from this offering for general corporate purposes, including working capital, sales and marketing activities, engineering initiatives, including enhancement of our solution and investment in technology and development, general and administrative expenses and capital expenditures. We also may use a portion of the net proceeds from this offering to acquire or invest in businesses, products, services or technologies that complement our business, as well as to advance various of the strategic initiatives described in “Business—Our Strategy,” although we have no present commitments to complete any such transactions. Furthermore, we may use a portion of the net proceeds from this offering to repay outstanding indebtedness, including indebtedness under our loan and security agreements with SVB and TriplePoint.
We have never declared or paid cash dividends on our common stock. We currently intend to retain all available funds and any future earnings for use in the operation of our business and do not anticipate paying any dividends on our common stock in the foreseeable future. Any future determination to declare dividends will be made at the discretion of our board of directors and will depend on our financial condition, operating results, capital requirements, general business conditions and other factors that our board of directors may deem relevant. In addition, our ability to pay dividends on our capital stock is subject to restrictions under the terms of our loan and security agreements with SVB and TriplePoint. See “Management’s Discussion and Analysis of Financial Condition and Results of Operations” for additional information regarding our financial condition.
51
Table of Contents
The following table sets forth our cash and cash equivalents and capitalization as of April 30, 2017 on:
| • | an actual basis; |
| • | a pro forma basis, giving effect to the following events, which will occur immediately prior to the completion of this offering: (i) the automatic conversion of all outstanding shares of our convertible preferred stock into an aggregate of 17,992,973 shares of common stock (reflecting the amendment to our amended and restated certificate of incorporation on June 1, 2017) and the effectiveness of our amended and restated certificate of incorporation; and (ii) the conversion of all warrants to purchase shares of convertible preferred stock into warrants to purchase an aggregate of 205,897 shares of common stock (reflecting the amendment to our amended and restated certificate of incorporation on June 1, 2017), as if such conversions had occurred immediately prior to the offering, and the resulting reclassification of the convertible preferred stock warrant liability to additional paid-in capital; and |
| • | a pro forma as adjusted basis, giving effect to the pro forma adjustments and the sale of 8,700,000 shares of common stock by us in this offering, based on an assumed initial public offering price of $11.50 per share, the midpoint of the price range reflected on the cover page of this prospectus, after deducting the estimated underwriting discounts and commissions. |
The pro forma as adjusted information set forth in the table below is illustrative only and will be adjusted based on the actual initial public offering price and other terms of this offering determined at pricing.
52
Table of Contents
You should read this table together with “Management’s Discussion and Analysis of Financial Condition and Results of Operations” and our audited and unaudited consolidated financial statements and related notes included elsewhere in this prospectus.
| April 30, 2017 | ||||||||||||
| (unaudited) |
||||||||||||
| (in thousands, except share and per share data) | ||||||||||||
| Actual | Pro forma | Pro Forma as Adjusted(1) |
||||||||||
| Cash and cash equivalents |
$ | 48,692 | $ | 48,692 | $ | 136,239 | ||||||
|
|
|
|
|
|
|
|||||||
| Long-term debt, current and non-current |
$ | 68,404 | $ | 68,404 | $ | 68,404 | ||||||
| Convertible preferred stock, $0.00005 par value; 10,679,599 shares authorized, 10,610,966 issued and outstanding, actual; no shares authorized, issued and outstanding, pro forma and pro forma as adjusted |
263,729 | — | — | |||||||||
|
|
|
|
|
|
|
|||||||
| Stockholders’ equity (deficit): |
||||||||||||
| Preferred stock, par value $0.00005; no shares authorized, issued and outstanding, actual; 100,000,000 shares authorized, no shares issued and outstanding, pro forma and pro forma as adjusted |
— | — | — | |||||||||
| Common stock, $0.00005 par value; 21,333,333 shares authorized, 3,657,844(2) shares issued and outstanding, actual; 1,000,000,000 shares authorized, 21,650,817 shares issued and outstanding, pro forma; 1,000,000,000 shares authorized, 31,038,806 shares issued and outstanding, pro forma as adjusted |
1 | 2 | 2 | |||||||||
| Additional paid-in capital |
45,783 | 310,200 | 397,747 | |||||||||
| Notes receivables from stockholders |
(1,691 | ) | (1,691 | ) | (1,691 | ) | ||||||
| Accumulated other comprehensive loss |
(323 | ) | (323 | ) | (323 | ) | ||||||
| Accumulated deficit |
(375,985 | ) | (375,985 | ) | (375,985 | ) | ||||||
|
|
|
|
|
|
|
|||||||
| Total stockholders’ equity (deficit) |
(332,215 | ) | (67,797 | ) | 19,750 | |||||||
|
|
|
|
|
|
|
|||||||
| Total capitalization |
$ | (82) | $ | 607 | $ | 88,154 | ||||||
|
|
|
|
|
|
|
|||||||
| (1) | Each $1.00 increase (decrease) in the assumed initial public offering price of $11.50 per share, the midpoint of the offering price range set forth on the cover page of this prospectus, would increase (decrease) our pro forma as adjusted cash and cash equivalents, additional paid-in capital, total stockholders’ equity (deficit), and total capitalization by approximately $8.1 million, assuming that the number of shares offered by us, as set forth on the cover page of this prospectus, remains the same and after deducting the estimated underwriting discounts and commissions. Similarly, each increase or decrease of 1.0 million in the number of shares of common stock offered by us would increase or decrease, as applicable, cash and cash equivalents, additional paid-in capital, total stockholders’ equity (deficit), and total capitalization by approximately $10.7 million, assuming the assumed initial public offering price remains the same and after deducting estimated underwriting discounts and commissions. |
| (2) | Excludes 687,989 shares issued upon an option exercise in which, in lieu of cash payment, a partial recourse promissory note was issued. |
53
Table of Contents
The number of shares of our common stock to be outstanding after this offering is based on 22,338,806 shares of our common stock (reflecting the amendment to our amended and restated certificate of incorporation on June 1, 2017) outstanding as of April 30, 2017, and excludes:
| • | 635,643 shares of common stock issuable upon the exercise of options with an exercise price of less than $13.68 outstanding as of April 30, 2017, with a weighted-average exercise price of $6.36 per share; |
| • | 3,344,525 shares of common stock issuable upon the exercise of options with an exercise price of $13.68 or more outstanding as of April 30, 2017, with a weighted average exercise price of $13.68 per shares; |
| • | 1,165,328 shares of common stock issuable upon the exercise of options granted after April 30, 2017 with a weighted-average exercise price of $13.68 per share; |
| • | 230,897 shares of common stock (reflecting the amendment to our amended and restated certificate of incorporation on June 1, 2017) issuable upon the exercise of warrants outstanding as of April 30, 2017, with a weighted-average exercise price of $13.83 per share; |
| • | 1,666,665 shares of common stock issuable upon the exercise of warrants issued after April 30, 2017 with an exercise price of $16.44 per share; |
| • | 1,020,230 shares of common stock issuable upon the vesting of RSUs outstanding as of April 30, 2017; |
| • | 1,443,116 shares of common stock issuable upon the vesting of RSUs granted or approved after April 30, 2017; |
| • | 589,624 shares of common stock which were repurchased by us on June 1, 2017; and |
| • | 5,444,402 shares of common stock reserved for future issuance under our stock-based compensation plans, consisting of (i) 402 shares of common stock reserved for future issuance under our 2008 Stock Plan, (ii) 4,537,000 shares of common stock reserved for future issuance under our 2017 Equity Incentive Plan, which will become effective one business day prior to the effectiveness of the registration statement of which this prospectus is made a part, and (iii) 907,000 shares of common stock reserved for future issuance under our 2017 Employee Stock Purchase Plan, which will become effective on the day of its adoption by our board of directors. In addition, the shares of common stock that are available under our 2017 Equity Incentive Plan and 2017 Employee Stock Purchase Plan may be increased pursuant to provisions thereof that automatically increase the share reserves under the plans each year, as more fully described in “Executive Compensation—Employee Benefit and Stock Plans.” |
54
Table of Contents
If you invest in our common stock, your interest will be diluted to the extent of the difference between the amount per share paid by purchasers of shares of common stock in this offering and the pro forma as adjusted net tangible book value per share of common stock immediately after the completion of this offering. Net tangible book value dilution per share to new investors represents the difference between the amount per share paid by purchasers of shares of common stock in this offering and the pro forma net tangible book value per share of common stock immediately after the completion of this offering.
As of April 30, 2017, our pro forma net tangible book value was approximately $(67.8) million, or $(3.03) per share of common stock. Our pro forma net tangible book value per share represents the amount of our total tangible assets reduced by the amount of our total liabilities and divided by the total number of shares of our common stock outstanding as of April 30, 2017, after giving effect to the pro forma adjustments referenced under “Capitalization,” which will occur immediately prior to the completion of this offering.
After giving effect to our sale in this offering of 8,700,000 shares of our common stock at an assumed initial public offering price of $11.50 per share, the midpoint of the estimated offering price range reflected on the cover page of this prospectus, and after deducting estimated underwriting discounts and commissions and estimated offering expenses payable by us, our pro forma as adjusted net tangible book value as of April 30, 2017 would have been approximately $19.8 million, or $0.64 per share of our common stock. This represents an immediate increase in pro forma as adjusted net tangible book value of $3.67 per share to our existing stockholders and an immediate dilution of $10.86 per share to investors purchasing shares in this offering.
The following table illustrates this per share dilution in net tangible book value to new investors after giving effect to this offering:
| Assumed initial public offering price per share |
$ | 11.50 | ||||||
| Pro forma net tangible book value per share as of April 30, 2017 |
$ | (3.03 | ) | |||||
| Increase in pro forma net tangible book value per share attributable to new investors |
3.67 | |||||||
|
|
|
|||||||
| Pro forma as adjusted net tangible book value per share immediately after this offering |
0.64 | |||||||
|
|
|
|||||||
| Dilution per share to new investors in this offering |
$ | 10.86 | ||||||
|
|
|
A $1.00 increase (decrease) in the assumed initial public offering price of $11.50 per share, the midpoint of the estimated offering price range set forth on the cover page of this prospectus, would increase (decrease) our pro forma as adjusted net tangible book value by $8.1 million, the pro forma as adjusted net tangible book value per share after this offering by $0.26, and the dilution per share to new investors by $0.74, assuming the number of shares offered by us, as set forth on the cover page of this prospectus, remains the same, and after deducting estimated underwriting discounts and commissions.
The following table summarizes, on a pro forma as adjusted basis as of April 30, 2017 after giving effect to: (i) the automatic conversion of all outstanding shares of our convertible preferred stock into an aggregate of 17,992,973 shares of common stock (reflecting the amendment to our amended and restated certificate of incorporation on June 1, 2017) and the effectiveness of our amended and restated certificate of incorporation (each of which will occur immediately prior to the completion of this offering); (ii) the conversion of all warrants to purchase shares of convertible preferred stock into warrants to purchase an aggregate of 205,897 shares of common stock (reflecting the amendment to our amended and restated certificate of incorporation on June 1, 2017), as if such conversions had occurred immediately prior to the completion of this offering, and the resulting reclassification of the convertible preferred stock warrant liability to additional paid-in capital; and (iii) the completion of this offering at the initial public offering price of $11.50 per share, the midpoint of the estimated
55
Table of Contents
offering range set forth on the cover page of this prospectus, the difference between existing stockholders and new investors with respect to the number of shares of common stock purchased from us, the total consideration paid to us and the average price per share paid, before deducting underwriting discounts and commissions and estimated offering expenses payable by us:
| Shares Purchased | Total Consideration | Average Price Per Share |
||||||||||||||||||
| Number | Percent | Amount | Percent | |||||||||||||||||
| (in thousands, except percentages and per share data) | ||||||||||||||||||||
| Existing stockholders |
22,339 | 72.0 | % | $ | 280,953 | 73.7 | % | $ | 12.58 | |||||||||||
| New public investors |
8,700 | 28.0 | 100,050 | 26.3 | 11.50 | |||||||||||||||
|
|
|
|
|
|
|
|
|
|||||||||||||
| Total |
31,039 | 100.0 | % | $ | 381,003 | 100.0 | % | |||||||||||||
|
|
|
|
|
|
|
|
|
|||||||||||||
To the extent that the outstanding warrants are exercised, any of our outstanding options are exercised or any outstanding RSUs are settled, investors will experience further dilution.
Except as otherwise indicated, the above discussion and tables assumes no exercise by the underwriters of their option to purchase additional shares. If the underwriters exercise their option to purchase additional shares in full, our existing stockholders would own 69.1% and our new investors would own 30.9% of the total number of shares of our common stock outstanding upon the completion of this offering.
The number of shares of our common stock to be outstanding after this offering is based on 22,338,806 shares of our common stock (reflecting the amendment to our amended and restated certificate of incorporation on June 1, 2017) outstanding as of April 30, 2017, and excludes:
| • | 635,643 shares of common stock issuable upon the exercise of options with an exercise price of less than $13.68 outstanding as of April 30, 2017, with a weighted-average exercise price of $6.36 per share; |
| • | 3,344,525 shares of common stock issuable upon the exercise of options with an exercise price of $13.68 or more outstanding as of April 30, 2017, with a weighted average exercise price of $13.86 per share; |
| • | 1,165,328 shares of common stock issuable upon the exercise of options granted after April 30, 2017 with a weighted-average exercise price of $13.68 per share; |
| • | 230,897 shares of common stock (reflecting the amendment to our amended and restated certificate of incorporation on June 1, 2017) issuable upon the exercise of warrants outstanding as of April 30, 2017, with a weighted-average exercise price of $13.83 per share; |
| • | 1,666,665 shares of common stock issuable upon the exercise of warrants issued after April 30, 2017 with an exercise price of $16.44 per share; |
| • | 1,020,230 shares of common stock issuable upon the vesting of RSUs outstanding as of April 30, 2017; |
| • | 1,443,116 shares of common stock issuable upon the vesting of RSUs granted or approved after April 30, 2017; |
| • | 589,624 shares of common stock which were repurchased by us on June 1, 2017; and |
| • | 5,444,402 shares of common stock reserved for future issuance under our stock-based compensation plans, consisting of (i) 402 shares of common stock reserved for future issuance under our 2008 Stock Plan, which shares will be added to the shares to be reserved under our 2017 Equity Incentive Plan, which will become effective one business day prior to the effectiveness of the registration statement of which this prospectus is made a part, (ii) 4,537,000 shares of common stock reserved for future |
56
Table of Contents
| issuance under our 2017 Equity Incentive Plan, and (iii) 907,000 shares of common stock reserved for future issuance under our 2017 Employee Stock Purchase Plan, which will become effective on the day of its adoption by our board of directors. In addition, the shares of common stock that are available under our 2017 Equity Incentive Plan and 2017 Employee Stock Purchase Plan may be increased pursuant to provisions thereof that automatically increase the share reserves under the plans each year, as more fully described in “Executive Compensation—Employee Benefit and Stock Plans.” |
Certain of our existing stockholders, including entities affiliated with Lightspeed Venture Partners, New Enterprise Associates, Silverlake Kraftwerk, Insight Venture Partners and Menlo Ventures, have indicated an interest in purchasing up to an aggregate of approximately $23.0 million in shares of our common stock in this offering at the initial public offering price. The foregoing discussion does not reflect the potential purchase of any shares in this offering by these existing stockholders.
57
Table of Contents
SELECTED CONSOLIDATED FINANCIAL AND OTHER DATA
The following selected consolidated financial and other data should be read together with our consolidated financial statements and accompanying notes and “Management’s Discussion and Analysis of Financial Condition and Results of Operations” included elsewhere in this prospectus. The selected consolidated financial and other data in this section is not intended to replace our consolidated financial statements and the related notes. We derived the selected consolidated statements of operations data for fiscal 2015, 2016 and 2017 and the consolidated balance sheet data as of January 31, 2016 and 2017 from our audited consolidated financial statements included elsewhere in this prospectus. The consolidated statement of operations data for the three months ended April 30, 2016 and 2017, and the consolidated balance sheet as of April 30, 2017 are derived from our unaudited interim consolidated financial statements appearing elsewhere in this prospectus. Our historical results presented below are not necessarily indicative of financial results to be achieved in future periods.
| Fiscal Year Ended January 31, |
Three Months Ended April 30, |
|||||||||||||||||||
| 2015 | 2016 | 2017 | 2016 | 2017 | ||||||||||||||||
| (in thousands, except share and per share data) | (unaudited) | |||||||||||||||||||
| Consolidated Statement of Operations Data: |
||||||||||||||||||||
| Revenue: |
||||||||||||||||||||
| Product |
$ | 41,420 | $ | 68,652 | $ | 97,330 | $ | 16,677 | $ | 22,387 | ||||||||||
| Support and maintenance |
8,379 | 17,360 | 27,775 | 6,199 | 7,968 | |||||||||||||||
|
|
|
|
|
|
|
|
|
|
|
|||||||||||
| Total revenue |
49,799 | 86,012 | 125,105 | 22,876 | 30,355 | |||||||||||||||
|
|
|
|
|
|
|
|
|
|
|
|||||||||||
| Cost of revenue: |
||||||||||||||||||||
| Product(1) |
17,144 | 25,138 | 34,738 | 5,936 | 8,909 | |||||||||||||||
| Support and maintenance(1) |
4,565 | 7,110 | 9,437 | 2,072 | 3,039 | |||||||||||||||
|
|
|
|
|
|
|
|
|
|
|
|||||||||||
| Total cost of revenue |
21,709 | 32,248 | 44,175 | 8,008 | 11,948 | |||||||||||||||
|
|
|
|
|
|
|
|
|
|
|
|||||||||||
| Gross profit: |
||||||||||||||||||||
| Product |
24,276 | 43,514 | 62,592 | 10,741 | 13,478 | |||||||||||||||
| Support and maintenance |
3,814 | 10,250 | 18,338 | 4,127 | 4,929 | |||||||||||||||
|
|
|
|
|
|
|
|
|
|
|
|||||||||||
| Total gross profit |
28,090 | 53,764 | 80,930 | 14,868 | 18,407 | |||||||||||||||
|
|
|
|
|
|
|
|
|
|
|
|||||||||||
| Operating expenses: |
||||||||||||||||||||
| Research and development(1) |
28,155 | 43,179 | 53,445 | 13,659 | 14,923 | |||||||||||||||
| Sales and marketing(1) |
55,060 | 87,993 | 108,903 | 24,996 | 27,442 | |||||||||||||||
| General and administrative(1) |
13,941 | 18,773 | 19,364 | 5,675 | 5,332 | |||||||||||||||
|
|
|
|
|
|
|
|
|
|
|
|||||||||||
| Total operating expenses |
97,156 | 149,945 | 181,712 | 44,330 | 47,697 | |||||||||||||||
|
|
|
|
|
|
|
|
|
|
|
|||||||||||
| Loss from operations |
(69,066 | ) | (96,181 | ) | (100,782 | ) | (29,462 | ) | (29,290 | ) | ||||||||||
| Other expense, net: |
||||||||||||||||||||
| Interest expense |
(279 | ) | (4,407 | ) | (5,231 | ) | (1,437 | ) | (1,274 | ) | ||||||||||
| Other income (expense), net |
(119 | ) | 254 | 677 | 286 | 42 | ||||||||||||||
|
|
|
|
|
|
|
|
|
|
|
|||||||||||
| Total other expense, net |
(398 | ) | (4,153 | ) | (4,554 | ) | (1,151 | ) | (1,232 | ) | ||||||||||
|
|
|
|
|
|
|
|
|
|
|
|||||||||||
| Loss before provision for income taxes |
(69,464 | ) | (100,334 | ) | (105,336 | ) | (30,613 | ) | (30,522 | ) | ||||||||||
| Provision for income taxes |
222 | 634 | 465 | 198 | 158 | |||||||||||||||
|
|
|
|
|
|
|
|
|
|
|
|||||||||||
| Net loss |
$ | (69,686 | ) | $ | (100,968 | ) | $ | (105,801 | ) | $ | (30,811 | ) | $ | (30,680 | ) | |||||
|
|
|
|
|
|
|
|
|
|
|
|||||||||||
| Deemed dividend to Series E and E-1 Convertible Preferred Stock (unaudited) |
— | — | — | — | (6,588 | ) | ||||||||||||||
|
|
|
|
|
|
|
|
|
|
|
|||||||||||
| Net loss attributable to common stockholders |
$ | (69,686 | ) | $ | (100,968 | ) | $ | (105,801 | ) | $ | (30,811 | ) | $ | (37,268 | ) | |||||
|
|
|
|
|
|
|
|
|
|
|
|||||||||||
| Net loss per share attributable to common stockholders, basic and diluted(2) |
$ | (25.34 | ) | $ | (32.15 | ) | $ | (30.73 | ) | $ | (9.15 | ) | $ | (10.35 | ) | |||||
|
|
|
|
|
|
|
|
|
|
|
|||||||||||
| Weighted-average shares used to compute net loss per share attributable to common stockholders, basic and diluted(2) |
2,750,413 | 3,140,947 | 3,442,549 | 3,368,159 | 3,602,380 | |||||||||||||||
|
|
|
|
|
|
|
|
|
|
|
|||||||||||
| Pro forma net loss per share attributable to common stockholders, basic and diluted—unaudited(2) |
$ | (4.93 | ) | $ | (1.43 | ) | ||||||||||||||
|
|
|
|
|
|||||||||||||||||
| Pro forma weighted-average shares used in computing pro forma net loss per share attributable to common stockholders, basic and diluted—unaudited(2) |
21,435,522 | 21,595,353 | ||||||||||||||||||
|
|
|
|
|
|||||||||||||||||
58
Table of Contents
| (1) | Includes stock-based compensation expense as follows: |
| Fiscal Year Ended January 31, |
Three Months Ended April 30, |
|||||||||||||||||||
| 2015 | 2016 | 2017 | 2016 | 2017 | ||||||||||||||||
| (unaudited) | ||||||||||||||||||||
| (in thousands) |
||||||||||||||||||||
| Cost of product revenue |
$ | 82 | $ | 181 | $ | 264 | $ | 62 | $ | 71 | ||||||||||
| Cost of support and maintenance revenue |
92 | 176 | 323 | 76 | 115 | |||||||||||||||
| Research and development |
1,762 | 2,906 | 5,227 | 1,476 | 1,276 | |||||||||||||||
| Sales and marketing |
1,658 | 3,073 | 4,115 | 1,223 | 1,044 | |||||||||||||||
| General and administrative |
1,600 | 3,419 | 3,905 | 961 | 959 | |||||||||||||||
|
|
|
|
|
|
|
|
|
|
|
|||||||||||
| Total stock-based compensation expense |
$ | 5,194 | $ | 9,755 | $ | 13,834 | $ | 3,798 | $ | 3,465 | ||||||||||
|
|
|
|
|
|
|
|
|
|
|
|||||||||||
| (2) | See Note 12 to our audited consolidated financial statements that are included elsewhere in this prospectus for an explanation of the calculations of our basic and diluted net loss per share attributable to common stockholders, and unaudited pro forma net loss per share attributable to common stockholders calculations. |
| January 31, | April 30, | |||||||||||||||
| 2015 | 2016 | 2017 | 2017 | |||||||||||||
| (unaudited) | ||||||||||||||||
| (in thousands) | ||||||||||||||||
| Consolidated Balance Sheet Data: |
||||||||||||||||
| Cash and cash equivalents |
$ | 7,639 | $ | 50,716 | $ | 48,048 | $ | 48,692 | ||||||||
| Working capital |
9,128 | 89,683 | 27,110 | 21,554 | ||||||||||||
| Total assets |
65,924 | 158,157 | 104,902 | 97,095 | ||||||||||||
| Deferred revenue, current and non-current |
23,022 | 41,864 | 56,445 | 60,030 | ||||||||||||
| Long-term debt, current and non-current |
6,000 | 41,906 | 48,914 | 68,404 | ||||||||||||
| Convertible preferred stock |
134,371 | 257,141 | 257,141 | 263,729 | ||||||||||||
| Total stockholders’ deficit |
(121,400 | ) | (209,557 | ) | (298,981 | ) | (332,215 | ) | ||||||||
59
Table of Contents
MANAGEMENT’S DISCUSSION AND ANALYSIS
OF FINANCIAL CONDITION AND RESULTS OF OPERATIONS
You should read the following discussion and analysis of our financial condition and operating results together with the consolidated financial statements and related notes that are included elsewhere in this prospectus. The last day of our fiscal year is January 31. Our fiscal quarters end on April 30, July 31, October 31 and January 31. Fiscal 2018, our current fiscal year, ends on January 31, 2018. This discussion contains forward-looking statements based upon current expectations that involve risks and uncertainties. Our actual results may differ materially from those anticipated in these forward-looking statements as a result of various factors, including those set forth under “Risk Factors” and elsewhere in this prospectus.
Overview
Our mission is to provide large organizations and cloud service providers with an enterprise cloud platform that offers public cloud capabilities inside their own data centers and that can also connect to public cloud services.
Our highly-differentiated and extensible enterprise cloud platform combines cloud management, web services software and a range of all-flash storage systems. Organizations use our platform as a foundation for their own private clouds—to build agile development environments, run mission-critical enterprise applications and connect with public cloud services. We enable users to guarantee the performance of their organizations’ applications, automate common IT tasks to reduce operating expenses, troubleshoot across compute, storage and network, predict their organization’s needs to scale, and provide needed elasticity on demand. Our enterprise cloud platform enables organizations to easily scale to support tens of thousands of virtual machines on a single system across multiple hypervisors and containers and to connect to public cloud environments.
Our solution helps our customers optimize infrastructure by significantly simplifying deployment and operations, which can lead to substantial reductions in capital expenditures and operating expenses. We sell many of our software products separately from our core enterprise cloud solution, enabling our customers to tailor their enterprise cloud infrastructure to their specific needs. Our platform addresses a large variety of use cases, including development operations, disaster recovery and data protection, server virtualization and desktop virtualization. Following our first product launch in March 2011, we continue to be a leader in providing enterprise cloud solutions for virtualized and cloud environments.
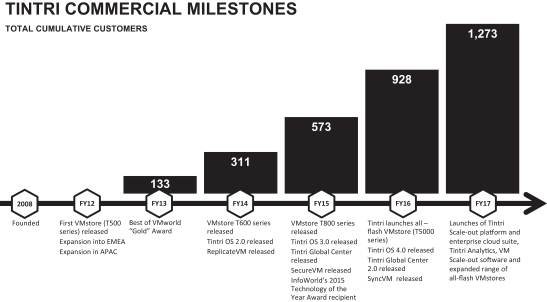
60
Table of Contents
We have experienced rapid revenue growth resulting from the sales of our products and related support and maintenance offerings. Our product revenue is derived from sales of our enterprise cloud platform products, which consists of our VMstore systems, and stand-alone software licenses, and is generally recognized upon shipment. When customers purchase our products, they also purchase support. While purchasing support is not mandatory, substantially all products shipped have been purchased together with a support contract, which includes software patches, bug fixes, updates, upgrades, hardware repair and replacement parts, and technical support. Support and maintenance revenue is recognized over the term of the support contracts. We believe that, to date, substantially all of our customers have either renewed their support and maintenance subscriptions or have purchased new support and maintenance subscriptions together with replacement products. The average length of our support and maintenance contracts is approximately two years.
We sell our products predominantly through the joint sales efforts of our global sales force and channel partners. Our channel partners are further supported by our distributors, who work together on a non-exclusive basis to market our products, identify and close sales opportunities and provide pre-sales and post-sales services to our customers. Our joint sales approach with our channel partners provides us with expanded and efficient reach. Our channel partners typically place orders with us upon receiving an order from a customer and do not stock inventory. Our typical fulfillment time on an order is approximately three days, and consequently we do not have a meaningful backlog at any point in time. We intend to continue to expand our partner relationships to further extend our distribution coverage and to invest in education, training and programs to increase the ability of our channel partners to sell our products independently.
Since our first product launch in March 2011, our customer base has grown to 1,338 customers as of April 30, 2017. Our customers span a diverse set of industry verticals, such as education, financial services and insurance, healthcare, manufacturing and automotive and technology, and include seven of the top 15 Fortune 100 companies and 21 of the Fortune 100 companies, all as of April 30, 2017. We focus on selling to large organizations and CSPs. Two distributors each represented more than 10% of our revenue, for the three months ended April 30, 2017.
We continue to invest in growing our business. Our headcount increased from 177 as of January 31, 2014 to 561 as of April 30, 2017. We intend to continue to invest in our research and development organization in order to extend our technology leadership, enhance the functionality of our existing VMstores and introduce new products. We also plan to continue to invest and expand our sales and marketing functions and channel programs, including expanding our global network of channel partners and carrying out associated marketing activities in key geographies. In addition, we intend to further expand our international operations. Revenue generated from customers outside of the United States was 30.0% and 25.3% of our total revenue for fiscal 2017 and for the three months ended April 30, 2017, respectively, with all our sales contracts denominated in U.S. dollars. As we continue to invest in growth, we expect to continue to incur operating losses and negative cash flows from operations for at least the near future.
We have experienced significant revenue growth, with revenue increasing from $49.8 million in fiscal 2015 to $86.0 million in fiscal 2016 and to $125.1 million in fiscal 2017, representing year-over-year growth of 73% and 45%, respectively, for our two most recent fiscal years. Our revenue increased from $22.9 million in the three months ended April 30, 2016 to $30.4 million in the three months ended April 30, 2017, representing period-over-period growth of 33%. Our net loss was $69.7 million, $101.0 million, and $105.8 million in fiscal 2015, 2016, and 2017, respectively, and $30.8 million and $30.7 million in the three months ended April 30, 2016 and 2017, respectively. We have funded our activities primarily through debt and equity financings. As of April 30, 2017, we had an accumulated deficit of $376.0 million.
Our Business Model
We focus on acquiring large organizations and CSPs as customers and maximizing the lifetime value of a customer through a land-and-expand strategy. Our solution is designed to integrate easily into a customer’s
61
Table of Contents
existing infrastructure, which facilitates easier and faster adoption. Once our products have been deployed in a given environment, we are generally able to expand our footprint quickly through sales of additional systems and stand-alone software products. We typically provide our prospective customers with a VMstore for test and evaluation purposes. We have experienced strong success rates converting these prospective customers into customers after they receive a trial VMstore.
We believe our business model supports a financial model that is characterized by the following attributes:
| • | Strong Revenue Growth. Our revenue has grown from $49.8 million in fiscal 2015 to $86.0 million in fiscal 2016 and to $125.1 million in fiscal 2017, representing year-over-year growth of 73% and 45%, respectively, for our two most recent fiscal years and $22.9 million in the three months ended April 30, 2016 to $30.4 million in the three months ended April 30, 2017, representing period-over-period growth of 33%. We believe our strong revenue growth has resulted primarily from: |
| – | Market Adoption of Our Solution. We have invested considerable resources in promoting market awareness of our solution and we believe these efforts have contributed to the adoption of our solution by large organizations and CSPs. |
| – | New Stand-Alone Software Additions. We continue to expand our product suite, and our stand-alone software product portfolio in particular has experienced rapid adoption by customers. Our stand-alone software product attach rate, which is stand-alone software license revenue as a percentage of product revenue, increased from 9.9% in fiscal 2016 to 14.7% in fiscal 2017, and from 11.1% in the three months ended April 30, 2016 to 17.4% in the three months ended April 30, 2017. |
| – | Increased Sales Coverage and Effectiveness. Our sales teams have become more productive. Our ramped teams, which we define as sales teams who have been in their role for more than 180 days, have increased from 34 as of January 31, 2015 to 52 as of January 31, 2016 to 54 as of January 31, 2017 to 56 as of April 30, 2017. Our average productivity per ramped team, which we define as bookings per ramped team for a particular period, increased from $633,000 for the quarter ended January 31, 2015 to $694,000 for the quarter ended January 31, 2016 to $839,000 for the quarter ended January 31, 2017, representing year-over-year increase in productivity of 10% and 21% in our two most recent fiscal years. Our average productivity per ramped team increased from $399,000 for the quarter ended April 30, 2016 to $566,000 for the quarter ended April 30, 2017, representing period-over-period increase of 42%. We define bookings as non-cancellable orders received during the fiscal period. 37% and 34% of our ramped teams achieved bookings over $875,000 in the quarter ended January 31, 2017 and April 30, 2017, respectively. As our sales coverage and effectiveness has increased, our global customer base has grown rapidly from 573 as of January 31, 2015 to 928 as of January 31, 2016 and to 1,273 as of January 31, 2017, representing year-over-year growth of 62% and 37% for our two most recent fiscal years, and from 1,009 as of April 30, 2016 to 1,338 as of April 30, 2017, representing period-over-period growth of 33%. |
| – | Increased Transaction Value. As our customer base has grown, we have also experienced an increase in high value transactions. The number of orders valued at greater than $1 million increased from three in fiscal 2015 to five in fiscal 2016 to 13 in fiscal 2017. Our average order size has grown from $111,000 for the year ended January 31, 2015 to $142,000 for the year ended January 30, 2016 to $160,000 for the year ended January 31, 2017. Our average order size has grown from $111,000 for the three months ended April 30, 2015 to $124,000 for the three months ended April 30, 2016 to $138,000 for the three months ended April 30, 2017. |
| • | Expansion Among Existing Customers. Many of our customers purchase from us on a quarterly basis and increase their spend with us over time. For example, our top 25 customers (as measured by their cumulative orders through January 31, 2017) that have been customers for at least twelve months have on average cumulatively ordered more than 19x the amount they ordered from us in their first quarter |
62
Table of Contents
| as a customer. For all customers that have been customers for twelve months or more, this metric is 3x. These metrics are inclusive of amounts contracted for support and maintenance revenue and cumulative order metrics are inclusive of amounts ordered in the applicable customers’ first quarter as customers. |
| • | Gross Margin Expansion. Our gross margin has expanded to 65% in fiscal 2017. We believe this expansion is due to the following factors: |
| – | Component Cost Reduction. The cost of hardware components, such as flash memory and solid-state drives, has generally decreased over time. |
| – | Greater Scale. As we grow, we achieve greater economies of scale. Our revenue growth has exceeded the growth of our fixed and variable costs of revenue. As we continue to grow, we expect to continue to achieve greater economies of scale. We expect this trend to be particularly applicable to the gross margin for our support and maintenance business where revenue volume is driven by new customers and renewals of existing customers, accompanied by generally slower-growing fixed costs and minimal variable costs of revenue. |
| – | Growing Stand-Alone Software Sales. We sell Tintri Global Center and our portfolio of stand-alone software products separately from Tintri OS. The attach rates for our portfolio of stand-alone software products, such as ReplicateVM, SecureVM and SyncVM, have increased over time. |
| – | Introduction of New Offerings. We continue to introduce new VMstore offerings, which has allowed us to introduce new, higher price points for our products. |
| – | Repeat Purchases from Existing Customers. After their initial purchase, our customers tend to increase their subsequent purchase orders with more systems and higher-margin stand-alone software products. |
| • | Operating Leverage. We have experienced improving operating leverage due to our focus on growing revenue significantly faster than our operating expenses. For fiscal 2016, our revenue grew 73% and our operating expenses grew 54% compared to fiscal 2015. For fiscal 2017, our revenue grew 45% and our operating expenses grew 21% compared to fiscal 2016. For the three months ended April 30, 2017, our revenue grew 33% and our operating expenses grew 8% compared to the three months ended April 30, 2016. |
Key Financial and Operational Metrics
| As of or for the Fiscal Year Ended January 31, |
As of or for the Three Months Ended April 30, |
|||||||||||||||||||
| 2015 | 2016 | 2017 | 2016 | 2017 | ||||||||||||||||
| (unaudited) | ||||||||||||||||||||
| (dollars in thousands) | ||||||||||||||||||||
| Total revenue |
$ | 49,799 | $ | 86,012 | $ | 125,105 | $ | 22,876 | $ | 30,355 | ||||||||||
| Period-over-period percentage increase |
92 | % | 73 | % | 45 | % | 47 | % | 33 | % | ||||||||||
| Gross margin |
56 | % | 63 | % | 65 | % | 65 | % | 61 | % | ||||||||||
| Deferred revenue, current and non-current |
$ | 23,022 | $ | 41,864 | $ | 56,445 | $ | 44,136 | $ | 60,030 | ||||||||||
| Net cash used in operating activities |
$ | (51,098 | ) | $ | (62,109 | ) | $ | (70,366 | ) | $ | (19,696 | ) | $ | (18,975 | ) | |||||
| Net cash provided by (used in) investing activities |
$ | (26,437 | ) | $ | (56,409 | ) | $ | 58,334 | $ | 23,593 | $ | (676 | ) | |||||||
| Net cash provided by (used in) financing activities |
$ | (958 | ) | $ | 161,597 | $ | 9,425 | $ | 485 | $ | 20,305 | |||||||||
| Free cash flow as a percentage of total revenue |
(120 | )% | (85 | )% | (60 | )% | (88 | )% | (65 | )% | ||||||||||
| Total customers |
573 | 928 | 1,273 | 1,009 | 1,338 | |||||||||||||||
The above key financial and operational metrics:
| • | help us evaluate our growth and operational efficiencies, measure our performance and identify trends in our sales activity; |
63
Table of Contents
| • | provide a useful measure for period-to-period comparisons of our core business; |
| • | are often used by investors and other parties in understanding and evaluating companies in our industry as a measure of financial performance; and |
| • | are used by management to prepare and approve our annual budget and to develop short-term and long-term operational and compensation plans, as well as to assess the extent of achievement of goals. |
Deferred Revenue
Our deferred revenue consists of amounts that have been invoiced but that have not yet been recognized as revenue as of the period end. The majority of our deferred revenue balance consists of support and maintenance revenue that is recognized ratably over the contractual service period. These service periods range from one to five years and, as of April 30, 2017, averaged approximately two years.
Free Cash Flow as a Percentage of Total Revenue
Free cash flow as a percentage of total revenue is a non-GAAP financial measure we calculate by dividing free cash flow by total revenue. We define free cash flow, a non-GAAP financial measure, as cash used in operating activities less purchase of property and equipment. We have included free cash flow as a percentage of total revenue in this prospectus because it is a key measure used by our management and board of directors to understand and evaluate our free cash flow in relation to our revenue growth. In addition, we consider free cash flow to be a liquidity measure that provides useful information to management and investors about the amount of cash generated by the business that, after the purchases of property and equipment, can be used for investing in our business, making strategic acquisitions and strengthening the balance sheet. A limitation of the utility of free cash flow as a measure of our financial performance and liquidity is that it does not represent the total increase or decrease in our cash balance for the period. In addition, other companies, including companies in our industry, may not use free cash flow, may calculate free cash flow in a different manner than we do, or may use other financial measures to evaluate their performance, all of which could reduce the usefulness of free cash flow as a comparative measure. A reconciliation of free cash flow to cash flow used in operating activities, the most directly comparable financial measure calculated and presented in accordance with GAAP, is provided below:
| Fiscal Year Ended January 31, |
Three Months Ended April 30, |
|||||||||||||||||||
| 2015 | 2016 | 2017 | 2016 | 2017 | ||||||||||||||||
| (unaudited) | ||||||||||||||||||||
| (in thousands, except percentages) | ||||||||||||||||||||
| Net cash used in operating activities |
$ | (51,098 | ) | $ | (62,109 | ) | $ | (70,366 | ) | $ | (19,696 | ) | $ | (18,975 | ) | |||||
| Less: Purchase of property and equipment |
(8,668 | ) | (10,914 | ) | (4,337 | ) | (372 | ) | (676 | ) | ||||||||||
|
|
|
|
|
|
|
|
|
|
|
|||||||||||
| Free cash flow |
$ | (59,766 | ) | $ | (73,023 | ) | $ | (74,703 | ) | $ | (20,068 | ) | $ | (19,651 | ) | |||||
|
|
|
|
|
|
|
|
|
|
|
|||||||||||
| Total revenue |
$ | 49,799 | $ | 86,012 | $ | 125,105 | $ | 22,876 | $ | 30,355 | ||||||||||
| Free cash flow as a percentage of total revenue |
(120 | )% | (85 | )% | (60 | )% | (88 | )% | (65 | )% | ||||||||||
| Net cash provided by (used in) investing activities |
$ | (26,437 | ) | $ | (56,409 | ) | $ | 58,334 | $ | 23,593 | $ | (676 | ) | |||||||
| Net cash provided by (used in) financing activities |
$ | (958 | ) | $ | 161,597 | $ | 9,425 | $ | 485 | $ | 20,305 | |||||||||
Total Customers
We define a customer as an end-user that has purchased one or more of our products either from one of our channel partners or from us directly. In situations where there are purchases by multiple subsidiaries or divisions, universities or governmental organizations affiliated with a single entity, each separate buying unit within an enterprise is counted as representing a separate customer. We do not include our channel partners or distributors in our definition of a customer.
64
Table of Contents
Components of Our Operating Results
Revenue
Product Revenue. We generate product revenue from sales of enterprise cloud platform products, which consists of our VMstore systems, and stand-alone software licenses. Provided that all other revenue recognition criteria have been met, we typically recognize revenue for VMstores and perpetual software licenses upon shipment, as title and risk of loss are transferred to our channel partners or customers at that time, and revenue from time-based licenses ratably over their term. Sales of our VMstore systems represented over half of our revenue for fiscal 2017. Revenue from stand-alone software licenses represents an increasingly significant part of our business. Our product revenue may vary from period to period based on, among other things, the timing, size and mix of orders and the impact of significant transactions.
Support and Maintenance Revenue. We generate our support and maintenance revenue from support contracts related to our product sales as well as renewals of support contracts, and, to a small extent, from installation services and training. Substantially all of our product sales include support contracts. The length of these contracts ranges from one to five years, and as of April 30, 2017, averaged approximately two years. We recognize revenue from support contracts over the contractual service period. We also recognize revenue related to installation services and training upon delivery or completion of performance, although this revenue has been, and is expected to remain, insignificant. Over time, our revenue from support agreements as a percentage of total revenue may decline as a result of changes in the relative pricing of our products and support. For additional information, please see “Critical Accounting Policies and Estimates—Revenue Recognition.”
Cost of Revenue
Cost of Product Revenue. Cost of product revenue primarily includes costs paid to our third-party contract manufacturer for components, assembly and testing, as well as personnel costs in our operations organization. Personnel costs consist of salaries, benefits, bonuses and stock-based compensation. Our cost of product revenue also includes other inventory related expenses such as inventory write-offs, purchase price variances, standard cost updates, freight and overhead costs. Overhead costs consist of certain facilities, depreciation and IT costs. We expect our cost of product revenue to increase on an absolute basis as our product revenue increases.
Cost of Support and Maintenance Revenue. Cost of support and maintenance revenue primarily includes personnel costs associated with our global customer support organization, overhead costs, operation and administration of our third-party service inventory depots, which are physical warehouse locations that hold service inventory in support of our customer support agreements, and costs to fulfill our service inventory obligations. We expect our cost of support and maintenance revenue to increase on an absolute basis as our installed customer base grows.
Gross Margin
Gross margin is gross profit as a percentage of revenue, and gross profit is revenue less cost of revenue. Gross margin has been and will continue to be affected by a variety of factors, including the average sales price of our products, manufacturing and inventory-related costs, the mix of products sold and the mix of revenue between products and support and maintenance. Our gross margins may fluctuate over time depending on the factors described above. At the beginning of fiscal 2016, we substantially ceased our customer evaluation inventory program and initiated our sales demonstration equipment program. As a result, inventory charges related to customer evaluation inventory, such as write-downs due to excess and obsolete inventory and standard cost changes, began to decrease in fiscal 2016, which has had and may continue to have a positive impact on our gross margin.
65
Table of Contents
Operating Expenses
Research and Development. Research and development expense consists primarily of personnel costs, as well as other direct and overhead costs. We have devoted our product development efforts primarily to enhancing the functionality and expanding the capabilities of our products. To date, we have expensed all research and development costs as incurred. We expect our research and development expense to continue to increase on an absolute basis as we continue to invest heavily in our research and product development efforts to expand the capabilities of our products and introduce new products and features. We expect our research and development expense to decline as a percentage of revenue over time as our revenue grows.
Sales and Marketing. Sales and marketing expense consists primarily of personnel costs. Sales and marketing expense also includes sales commission costs, costs for promotional activities and other marketing costs, travel costs and overhead costs. We expense sales commission costs as incurred. We expect our sales and marketing expense to continue to increase on an absolute basis as we continue to expand our sales and marketing efforts worldwide and expand our relationships with current and future channel partners and customers. We expect our sales and marketing expenses to decline as a percentage of revenue over time as our revenue grows. At the beginning of fiscal 2016, we substantially ceased our customer evaluation inventory program and initiated our sales demonstration equipment program. As a result, we have incurred and expect to continue to incur additional sales and marketing expense related to depreciation of equipment used in this program.
General and Administrative. General and administrative expense consists primarily of personnel costs. The general and administrative function includes our executive, finance, human resources, IT, facilities and legal organizations. General and administrative expense also includes outside professional services, which consists primarily of accounting, legal, IT, other consulting costs and overhead costs. We expect our general and administrative expense to continue to increase on an absolute basis to support our growing infrastructure needs and as we assume the reporting requirements and compliance obligations associated with being a public company. We expect our general and administrative expense to decline as a percentage of revenue over time as our revenue grows.
Other Expense, Net
Other expense, net consists of interest expense and other income (expense), net.
Interest expense is associated with interest on our debt obligations, as well as amortization of deferred credit facility fees, debt issuance costs and debt discounts in relation to our credit facility and loan obligation. Other income (expense), net consists primarily of interest income from our cash and cash equivalents, gain (loss) from remeasurement of foreign currency-denominated balances, and gain (loss) on revaluation of convertible preferred stock warrants.
Provision for Income Taxes
Provision for income taxes consists primarily of income taxes in certain foreign jurisdictions in which we conduct business, and state income taxes in the United States. We provide a full valuation allowance for U.S. deferred tax assets, which resulted from net operating loss, carryforwards and tax credits related primarily to research and development. We expect to maintain this full valuation allowance for the foreseeable future as it is more likely than not that the assets will not be realized based on our history of losses.
66
Table of Contents
Results of Operations
The following tables summarize our consolidated results of operations for the periods presented and as a percentage of our total revenue for those periods. The period-to-period comparison of results is not necessarily indicative of results for future periods.
| Fiscal Year Ended January 31, | Three Months Ended April 30, |
|||||||||||||||||||
| 2015 | 2016 | 2017 | 2016 | 2017 | ||||||||||||||||
| (unaudited) | ||||||||||||||||||||
| (in thousands) | ||||||||||||||||||||
| Consolidated Statements of Operations Data: |
||||||||||||||||||||
| Revenue: |
||||||||||||||||||||
| Product |
$ | 41,420 | $ | 68,652 | $ | 97,330 | $ | 16,677 | $ | 22,387 | ||||||||||
| Support and maintenance |
8,379 | 17,360 | 27,775 | 6,199 | 7,968 | |||||||||||||||
|
|
|
|
|
|
|
|
|
|
|
|||||||||||
| Total revenue |
49,799 | 86,012 | 125,105 | 22,876 | 30,355 | |||||||||||||||
|
|
|
|
|
|
|
|
|
|
|
|||||||||||
| Cost of revenue: |
||||||||||||||||||||
| Product(1) |
17,144 | 25,138 | 34,738 | 5,936 | 8,909 | |||||||||||||||
| Support and maintenance(1) |
4,565 | 7,110 | 9,437 | 2,072 | 3,039 | |||||||||||||||
|
|
|
|
|
|
|
|
|
|
|
|||||||||||
| Total cost of revenue |
21,709 | 32,248 | 44,175 | 8,008 | 11,948 | |||||||||||||||
|
|
|
|
|
|
|
|
|
|
|
|||||||||||
| Gross profit: |
||||||||||||||||||||
| Product |
24,276 | 43,514 | 62,592 | 10,741 | 13,478 | |||||||||||||||
| Support and maintenance |
3,814 | 10,250 | 18,338 | 4,127 | 4,929 | |||||||||||||||
|
|
|
|
|
|
|
|
|
|
|
|||||||||||
| Total gross profit |
28,090 | 53,764 | 80,930 | 14,868 | 18,407 | |||||||||||||||
|
|
|
|
|
|
|
|
|
|
|
|||||||||||
| Operating expenses: |
||||||||||||||||||||
| Research and development(1) |
28,155 | 43,179 | 53,445 | 13,659 | 14,923 | |||||||||||||||
| Sales and marketing(1) |
55,060 | 87,993 | 108,903 | 24,996 | 27,442 | |||||||||||||||
| General and administrative(1) |
13,941 | 18,773 | 19,364 | 5,675 | 5,332 | |||||||||||||||
|
|
|
|
|
|
|
|
|
|
|
|||||||||||
| Total operating expenses |
97,156 | 149,945 | 181,712 | 44,330 | 47,697 | |||||||||||||||
|
|
|
|
|
|
|
|
|
|
|
|||||||||||
| Loss from operations |
(69,066 | ) | (96,181 | ) | (100,782 | ) | (29,462 | ) | (29,290 | ) | ||||||||||
| Other expense, net: |
||||||||||||||||||||
| Interest expense |
(279 | ) | (4,407 | ) | (5,231 | ) | (1,437 | ) | (1,274 | ) | ||||||||||
| Other income (expense), net |
(119 | ) | 254 | 677 | 286 | 42 | ||||||||||||||
|
|
|
|
|
|
|
|
|
|
|
|||||||||||
| Total other expense, net |
(398 | ) | (4,153 | ) | (4,554 | ) | (1,151 | ) | (1,232 | ) | ||||||||||
|
|
|
|
|
|
|
|
|
|
|
|||||||||||
| Loss before provision for income taxes |
(69,464 | ) | (100,334 | ) | (105,336 | ) | (30,613 | ) | (30,522 | ) | ||||||||||
| Provision for income taxes |
222 | 634 | 465 | 198 | 158 | |||||||||||||||
|
|
|
|
|
|
|
|
|
|
|
|||||||||||
| Net loss |
$ | (69,686 | ) | $ | (100,968 | ) | $ | (105,801 | ) | $ | (30,811 | ) | $ | (30,680 | ) | |||||
|
|
|
|
|
|
|
|
|
|
|
|||||||||||
| (1) | Includes stock-based compensation expense as follows: |
| Fiscal Year Ended January 31, | Three Months Ended April 30, |
|||||||||||||||||||
| 2015 | 2016 | 2017 | 2016 | 2017 | ||||||||||||||||
| (unaudited) | ||||||||||||||||||||
| (in thousands) | ||||||||||||||||||||
| Cost of product revenue |
$ | 82 | $ | 181 | $ | 264 | $ | 62 | $ | 71 | ||||||||||
| Cost of support and maintenance revenue |
92 | 176 | 323 | 76 | 115 | |||||||||||||||
| Research and development |
1,762 | 2,906 | 5,227 | 1,476 | 1,276 | |||||||||||||||
| Sales and marketing |
1,658 | 3,073 | 4,115 | 1,223 | 1,044 | |||||||||||||||
| General and administrative |
1,600 | 3,419 | 3,905 | 961 | 959 | |||||||||||||||
|
|
|
|
|
|
|
|
|
|
|
|||||||||||
| Total stock-based compensation expense |
$ | 5,194 | $ | 9,755 | $ | 13,834 | $ | 3,798 | $ | 3,465 | ||||||||||
|
|
|
|
|
|
|
|
|
|
|
|||||||||||
67
Table of Contents
| Fiscal Year Ended January 31, | Three Months Ended April 30, |
|||||||||||||||||||
| 2015 | 2016 | 2017 | 2016 | 2017 | ||||||||||||||||
| (unaudited) | ||||||||||||||||||||
| Percentage of Revenue Data: |
||||||||||||||||||||
| Revenue: |
||||||||||||||||||||
| Product |
83 | % | 80 | % | 78 | % | 73 | % | 74 | % | ||||||||||
| Support and maintenance |
17 | 20 | 22 | 27 | 26 | |||||||||||||||
|
|
|
|
|
|
|
|
|
|
|
|||||||||||
| Total revenue |
100 | 100 | 100 | 100 | 100 | |||||||||||||||
|
|
|
|
|
|
|
|
|
|
|
|||||||||||
| Total cost of revenue |
44 | 37 | 35 | 35 | 39 | |||||||||||||||
|
|
|
|
|
|
|
|
|
|
|
|||||||||||
| Total gross profit |
56 | 63 | 65 | 65 | 61 | |||||||||||||||
|
|
|
|
|
|
|
|
|
|
|
|||||||||||
| Operating expenses: |
||||||||||||||||||||
| Research and development |
57 | 50 | 43 | 60 | 49 | |||||||||||||||
| Sales and marketing |
111 | 102 | 87 | 109 | 90 | |||||||||||||||
| General and administrative |
28 | 22 | 16 | 25 | 18 | |||||||||||||||
|
|
|
|
|
|
|
|
|
|
|
|||||||||||
| Total operating expenses |
196 | 174 | 146 | 194 | 157 | |||||||||||||||
|
|
|
|
|
|
|
|
|
|
|
|||||||||||
| Loss from operations |
(140 | ) | (111 | ) | (81 | ) | (129 | ) | (96 | ) | ||||||||||
| Other expense, net: |
||||||||||||||||||||
| Interest expense |
(1 | ) | (5 | ) | (4 | ) | (6 | ) | (4 | ) | ||||||||||
| Other income (expense), net |
— | — | 1 | 1 | — | |||||||||||||||
|
|
|
|
|
|
|
|
|
|
|
|||||||||||
| Total other expense, net |
(1 | ) | (5 | ) | (3 | ) | (5 | ) | (4 | ) | ||||||||||
|
|
|
|
|
|
|
|
|
|
|
|||||||||||
| Loss before provision for income taxes |
(141 | ) | (116 | ) | (84 | ) | (134 | ) | (100 | ) | ||||||||||
| Provision for income taxes |
— | 1 | 1 | 1 | 1 | |||||||||||||||
|
|
|
|
|
|
|
|
|
|
|
|||||||||||
| Net loss |
(141 | )% | (117 | )% | (85 | )% | (135 | )% | (101 | )% | ||||||||||
|
|
|
|
|
|
|
|
|
|
|
|||||||||||
Revenue by Geographic Region
| Fiscal Year Ended January 31, | Three Months Ended April 30, |
|||||||||||||||||||
| 2015 | 2016 | 2017 | 2016 | 2017 | ||||||||||||||||
| (unaudited) | ||||||||||||||||||||
| (in thousands) | ||||||||||||||||||||
| United States |
$ | 34,862 | $ | 60,300 | $ | 87,519 | $ | 14,585 | $ | 22,663 | ||||||||||
| EMEA |
9,907 | 13,712 | 18,207 | 3,765 | 3,732 | |||||||||||||||
| Rest of the World |
5,030 | 12,000 | 19,379 | 4,526 | 3,960 | |||||||||||||||
|
|
|
|
|
|
|
|
|
|
|
|||||||||||
| Total |
$ | 49,799 | $ | 86,012 | $ | 125,105 | $ | 22,876 | $ | 30,355 | ||||||||||
|
|
|
|
|
|
|
|
|
|
|
|||||||||||
Comparison of the Three Months Ended April 30, 2016 and 2017
Revenue
| Three Months Ended | ||||||||||||||||
| April 30, | Change | |||||||||||||||
| 2016 | 2017 | $ | % | |||||||||||||
| (unaudited) | ||||||||||||||||
| (in thousands, except percentages) | ||||||||||||||||
| Revenue: |
||||||||||||||||
| Product |
$ | 16,677 | $ | 22,387 | $ | 5,710 | 34 | % | ||||||||
| Support and maintenance |
6,199 | 7,968 | 1,769 | 29 | % | |||||||||||
|
|
|
|
|
|
|
|||||||||||
| Total |
$ | 22,876 | $ | 30,355 | $ | 7,479 | 33 | % | ||||||||
|
|
|
|
|
|
|
|||||||||||
68
Table of Contents
Total revenue increased by $7.5 million, or 33%, from $22.9 million in the three months ended April 30, 2016 to $30.4 million in in the three months ended April 30, 2017.
Product revenue increased by $5.7 million, or 34%, from $16.7 million in the three months ended April 30, 2016 to $22.4 million in the three months ended April 30, 2017. The increase in product revenue was primarily driven by higher volume of sales of our products. Our customer count grew from 1,009 as of April 30, 2016 to 1,338 as of April 30, 2017. We sold 22% more VMstores during the three months ended April 30, 2017 as compared to the three months ended April 30, 2016. Our stand-alone software license revenue increased by $2.0 million, or 111%, from $1.9 million in the three months ended April 30, 2016 to $3.9 million in the three months ended April 30, 2017.
Support and maintenance revenue increased by $1.8 million, or 29%, from $6.2 million in the three months ended April 30, 2016 to $8.0 million in the three months ended April 30, 2017. The increase in support and maintenance revenue was driven primarily by an increase in support contracts sold with increased product sales, as well as continuing recognition of deferred support revenue related to product sales made in prior periods.
Cost of Revenue and Gross Margin
| Three Months Ended | ||||||||||||||||
| April 30, | Change | |||||||||||||||
| 2016 | 2017 | $ | % | |||||||||||||
| (unaudited) | ||||||||||||||||
| (in thousands, except percentages) | ||||||||||||||||
| Cost of Revenue: |
||||||||||||||||
| Product |
$ | 5,936 | $ | 8,909 | $ | 2,973 | 50 | % | ||||||||
| Support and maintenance |
2,072 | 3,039 | 967 | 47 | % | |||||||||||
|
|
|
|
|
|
|
|||||||||||
| Total |
$ | 8,008 | $ | 11,948 | $ | 3,940 | 49 | % | ||||||||
|
|
|
|
|
|
|
|||||||||||
| Gross margin |
65 | % | 61 | % | ||||||||||||
| Gross margin, product |
64 | % | 60 | % | ||||||||||||
| Gross margin, support and maintenance |
67 | % | 62 | % | ||||||||||||
Total cost of revenue increased by $3.9 million, or 49%, from $8.0 million in the three months ended April 30, 2016 to $11.9 million in the three months ended April 30, 2017.
Cost of product revenue increased by $3.0 million, or 50%, from $5.9 million in the three months ended April 30, 2016 to $8.9 million in the three months ended April 30, 2017. The increase in cost of product revenue was driven by higher unit volumes period over period.
Cost of support and maintenance revenue increased by $0.9 million, or 47%, from $2.1 million in the three months ended April 30, 2016 to $3.0 million in the three months ended April 30, 2017. The increase in cost of support and maintenance revenue was primarily driven by higher costs in our global customer support organization related to an increase of $0.4 million in personnel costs due to a 23% increase in our headcount and a $0.1 million bonus accrual related to our corporate incentive plan. The corporate incentive plan bonus, adopted beginning fiscal 2018, impacts operating expenses for product, support and maintenance, research and development, general and administrative, and to a lesser extent sales and marketing. In addition, overhead costs and costs to administer and operate our third-party service inventory depots increased by $0.2 million, and other costs in support of our customer support agreements increased by $0.2 million as a result of the increase in our customer base.
Gross margin decreased from 65% in the three months ended April 30, 2016 to 61% in the three months ended April 30, 2017.
Product gross margin decreased from 64% in the three months ended April 30, 2016 to 60% in the three months ended April 30, 2017. The decrease in product gross margin was primarily a result of a shift in our
69
Table of Contents
product mix towards a greater proportion of all-flash systems, together with an increase in component cost for all-flash systems.
Support and maintenance gross margin decreased from 67% in the three months ended April 30, 2016 to 62% in the three months ended April 30, 2017, as we invested in scaling our global customer support organization through headcount increases.
Operating Expenses
Research and Development
| Three Months Ended | ||||||||||||||||
| April 30, | Change | |||||||||||||||
| 2016 | 2017 | $ | % | |||||||||||||
| (unaudited) | ||||||||||||||||
| (in thousands, except percentages) | ||||||||||||||||
| Research and Development |
$ | 13,659 | $ | 14,923 | $ | 1,264 | 9 | % | ||||||||
Research and development expense increased by $1.2 million, or 9%, from $13.7 million in the three months ended April 30, 2016 to $14.9 million in the three months ended April 30, 2017. The increase in research and development expense was partly due to a corporate incentive plan bonus accrual of $0.7 million, and an increase in outside professional services of $0.5 million. The increase was partially offset by a $0.2 million decrease in allocated costs.
Sales and Marketing
| Three Months Ended | ||||||||||||||||
| April 30, | Change | |||||||||||||||
| 2016 | 2017 | $ | % | |||||||||||||
| (unaudited) | ||||||||||||||||
| (in thousands, except percentages) | ||||||||||||||||
| Sales and marketing |
$ | 24,996 | $ | 27,442 | $ | 2,446 | 10 | % | ||||||||
Sales and marketing expense increased by $2.5 million, or 10%, from $25.0 million in the three months ended April 30, 2016 to $27.5 million in the three months ended April 30, 2017. The increase in sales and marketing expense was primarily due to increased sales commission and travel expenses of $1.4 million as a result of increased sales and expanded sales and marketing activities. In addition, as part of our efforts to penetrate and expand in global markets, the cost of our marketing activities, including field events, advertising, tradeshows, brand awareness, demand generation and other expenses, collectively accounted for $0.8 million of the increase.
General and Administrative
| Three Months Ended | ||||||||||||||||
| April 30, | Change | |||||||||||||||
| 2016 | 2017 | $ | % | |||||||||||||
| (unaudited) | ||||||||||||||||
| (in thousands, except percentages) | ||||||||||||||||
| General and administrative |
$ | 5,675 | $ | 5,332 | $ | (343 | ) | (6 | )% | |||||||
General and administrative expense decreased by $0.4 million, or 6%, from $5.7 million in the three months ended April 30, 2016 to $5.3 million in the three months ended April 30, 2017. The decrease in general and administrative expense was primarily due to a $0.4 million decrease in allocated overhead costs and a $0.2 million decrease in outside professional services, partially offset by a corporate incentive plan bonus accrual of $0.2 million.
70
Table of Contents
Other Expense, Net
| Three Months Ended | ||||||||||||||||
| April 30, | Change | |||||||||||||||
| 2016 | 2017 | $ | % | |||||||||||||
| (unaudited) | ||||||||||||||||
| (in thousands, except percentages) | ||||||||||||||||
| Other expense, net: |
||||||||||||||||
| Interest expense |
$ | (1,437 | ) | $ | (1,274 | ) | $ | 163 | (11 | )% | ||||||
| Other income (expense), net |
286 | 42 | (244 | ) | (85 | )% | ||||||||||
Interest expense decreased by $0.1 million, from $1.4 million in the three months ended April 30, 2016 to $1.3 million in the three months ended April 30, 2017. The change in interest expense was due to a decrease in amortization of deferred credit facility fees, debt issuance cost and debt discounts in relation to our loan obligations offset by higher interest expense due to increased borrowings under our credit facilities during the three months ended April 30, 2017 as compared to the three months ended April 30, 2016. Other income (expense), net decreased by $0.2 million, from $0.3 million in income in the three months ended April 30, 2016 to $0.1 million in income in the three months ended April 30, 2017. The change in other income (expense), net was primarily due to a $0.3 million decrease in investment income, partially offset by a $0.1 million decrease in the fair value of our convertible preferred stock warrant liability.
Provision for Income Taxes
| Three Months Ended | ||||||||||||||||
| April 30, | Change | |||||||||||||||
| 2016 | 2017 | $ | % | |||||||||||||
| (unaudited) | ||||||||||||||||
| (in thousands, except percentages) | ||||||||||||||||
| Provision for income tax |
$ | 198 | $ | 158 | $ | (40 | ) | (20 | )% | |||||||
Provision for income taxes was $0.2 million in the three months ended April 30, 2016 and remained substantially unchanged in the three months ended April 30, 2017.
Comparison of the Fiscal Years Ended January 31, 2016 and 2017
Revenue
| Fiscal Year Ended January 31, |
Change | |||||||||||||||
| 2016 | 2017 | $ | % | |||||||||||||
| (in thousands, except percentages) | ||||||||||||||||
| Revenue: |
||||||||||||||||
| Product |
$ | 68,652 | $ | 97,330 | $ | 28,678 | 42 | % | ||||||||
| Support and maintenance |
17,360 | 27,775 | 10,415 | 60 | % | |||||||||||
|
|
|
|
|
|
|
|||||||||||
| Total revenue |
$ | 86,012 | $ | 125,105 | $ | 39,093 | 45 | % | ||||||||
|
|
|
|
|
|
|
|||||||||||
Total revenue increased by $39.1 million, or 45%, from $86.0 million fiscal 2016 to $125.1 million in fiscal 2017.
Product revenue increased by $28.6 million, or 42%, from $68.7 million in fiscal 2016 to $97.3 million in fiscal 2017. The increase in product revenue was primarily driven by higher volume of sales of our products. Our customer count grew from 928 as of January 31, 2016 to 1,273 as of January 31, 2017. We sold 23% more VMstores during fiscal 2017 as compared to fiscal 2016. Our stand-alone software license revenue increased by $7.5 million, or 110%, from $6.8 million in fiscal 2016 to $14.3 million in fiscal 2017.
71
Table of Contents
Support and maintenance revenue increased by $10.4 million, or 60%, from $17.4 million in fiscal 2016 to $27.8 million in fiscal 2017. The increase in support and maintenance revenue was driven primarily by an increase in support contracts sold with increased product sales, as well as continuing recognition of deferred support revenue related to product sales made in prior periods.
Cost of Revenue and Gross Margin
| Fiscal Year Ended January 31, |
Change | |||||||||||||||
| 2016 | 2017 | $ | % | |||||||||||||
| (in thousands, except percentages) | ||||||||||||||||
| Cost of revenue: |
||||||||||||||||
| Product |
$ | 25,138 | $ | 34,738 | $ | 9,600 | 38 | % | ||||||||
| Support and maintenance |
7,110 | 9,437 | 2,327 | 33 | % | |||||||||||
|
|
|
|
|
|
|
|||||||||||
| Total cost of revenue |
$ | 32,248 | $ | 44,175 | $ | 11,927 | 37 | % | ||||||||
|
|
|
|
|
|
|
|||||||||||
| Gross margin |
63 | % | 65 | % | ||||||||||||
| Gross margin, product |
63 | % | 64 | % | ||||||||||||
| Gross margin, support and maintenance |
59 | % | 66 | % | ||||||||||||
Total cost of revenue increased by $12.0 million, or 37%, from $32.2 million in fiscal 2016 to $44.2 million in fiscal 2017.
Cost of product revenue increased by $9.6 million, or 38%, from $25.1 million in fiscal 2016 to $34.7 million in fiscal 2017. Approximately $8.7 million of the increase in cost of product revenue was driven by higher unit volumes. The increase in cost of product revenue was also partially driven by $0.9 million higher costs in our operations organization, primarily related to a $0.7 million increase in personnel costs driven by an 18% average headcount increase.
Cost of support and maintenance revenue increased by $2.3 million, or 33%, from $7.1 million in fiscal 2016 to $9.4 million in fiscal 2017. The increase in cost of support and maintenance revenue was primarily driven by higher costs in our global customer support organization related to an increase of $1.6 million in personnel costs due to a 22% increase in our average headcount in fiscal 2017 as compared to our average headcount in fiscal 2016, a $0.2 million increase to overhead costs and costs to administer and operate our third-party service inventory depots, and a $0.3 million increase in other costs in support of our customer support agreements. These increases were a result of the increase in our customer base.
Gross margin increased from 63% in fiscal 2016 to 65% in fiscal 2017.
Product gross margin increased from 63% in fiscal 2016 to 64% in fiscal 2017. Improvement in our product gross margin was related to favorable product mix, higher stand-alone software sales, and lower inventory charges due to decreases in writedowns of our customer evaluation inventory. The improvement was partially offset by higher costs in our operations organization as we invested in scaling our operations organization through headcount increases.
Support and maintenance gross margin increased from 59% in fiscal 2016 to 66% in fiscal 2017, as we gained leverage in our customer support organization.
72
Table of Contents
Operating Expenses
Research and Development
| Fiscal Year Ended January 31, |
Change | |||||||||||||||
| 2016 | 2017 | $ | % | |||||||||||||
| (in thousands, except percentages) | ||||||||||||||||
| Research and development |
$ | 43,179 | $ | 53,445 | $ | 10,266 | 24 | % | ||||||||
Research and development expense increased by $10.3 million, or 24%, from $43.2 million in fiscal 2016 to $53.5 million in fiscal 2017. The increase in research and development expense was driven primarily by higher personnel costs of $7.9 million due to a 15% increase in our average headcount for the comparable periods as we hired additional personnel to continue to develop new and enhanced product offerings, and a $1.0 million increase in overhead costs. In addition, prototype expense increased by $1.2 million as we continued to expand our research and development efforts.
Sales and Marketing
| Fiscal Year Ended January 31, |
Change | |||||||||||||||
| 2016 | 2017 | $ | % | |||||||||||||
| (in thousands, except percentages) | ||||||||||||||||
| Sales and marketing |
$ | 87,993 | $ | 108,903 | $ | 20,910 | 24 | % | ||||||||
Sales and marketing expense increased by $20.9 million, or 24%, from $88.0 million in fiscal 2016 to $108.9 million in fiscal 2017. The increase in sales and marketing expense was primarily driven by higher personnel costs of $8.5 million due to a 16% average headcount increase. Sales commission and travel expenses increased by $4.8 million due to increased sales, expanded sales and marketing activities, and overhead costs increased by $3.0 million. In addition, as part of our efforts to penetrate and expand in global markets, the cost of our marketing activities, including field events, advertising, tradeshows, brand awareness, demand generation and other expenses, collectively accounted for $3.7 million of the increase.
General and Administrative
| Fiscal Year Ended January 31, |
Change | |||||||||||||||
| 2016 | 2017 | $ | % | |||||||||||||
| (in thousands, except percentages) | ||||||||||||||||
| General and administrative |
$ | 18,773 | $ | 19,364 | $ | 591 | 3 | % | ||||||||
General and administrative expense increased by $0.6 million, or 3%, from $18.8 million in fiscal 2016 to $19.4 million in fiscal 2017. The increase in general and administrative expense was primarily due to a $1.8 million increase in personnel costs, driven by a 14% increase in average headcount to support our growing operations and a $0.4 million increase in outside professional services. The increase was offset by a $1.6 million decrease in allocated overhead costs.
Other Expense, Net
| Fiscal Year Ended January 31, |
Change | |||||||||||||||
| 2016 | 2017 | $ | % | |||||||||||||
| (in thousands, except percentages) | ||||||||||||||||
| Other expense, net: |
||||||||||||||||
| Interest expense |
$ | (4,407 | ) | $ | (5,231 | ) | $ | (824 | ) | 19 | % | |||||
| Other income (expense), net |
254 | 677 | 423 | 167 | % | |||||||||||
73
Table of Contents
Interest expense increased by $0.8 million, from $4.4 million in fiscal 2016 to $5.2 million in fiscal 2017. The increase in interest expense was primarily due to increased borrowings under our credit facilities during fiscal 2017 as compared to fiscal 2016, partially offset by a decrease in amortization of deferred credit facility fees, debt issuance cost and debt discounts in relation to our loan obligations. Other income (expense), net increased by $0.4 million, from $0.3 million in income in fiscal 2016 to $0.7 million in income in fiscal 2017. The change in other income (expense), net was primarily due to an increase of $0.3 million in investment income together with a $0.1 million gain as a result of favorable changes in foreign exchange rates.
Provision for Income Taxes
| Fiscal Year Ended January 31, |
Change | |||||||||||||||
| 2016 | 2017 | $ | % | |||||||||||||
| (in thousands, except percentages) | ||||||||||||||||
| Provision for income taxes |
$ | 634 | $ | 465 | $ | (169 | ) | (27 | )% | |||||||
Provision for income taxes decreased by $0.1 million, or 27%, from $0.6 million in fiscal 2016 to $0.5 million in fiscal 2017. The decrease in provision for income taxes was primarily due to higher tax deductions driven by increased stock option exercises in one of our subsidiaries, in addition to lower corporate tax rates for certain of our subsidiaries.
Comparison of the Fiscal Years Ended January 31, 2015 and 2016
Revenue
| Fiscal Year Ended January 31, |
Change | |||||||||||||||
| 2015 | 2016 | $ | % | |||||||||||||
| (in thousands, except percentages) | ||||||||||||||||
| Revenue: |
||||||||||||||||
| Product |
$ | 41,420 | $ | 68,652 | $ | 27,232 | 66 | % | ||||||||
| Support and maintenance |
8,379 | 17,360 | 8,981 | 107 | % | |||||||||||
|
|
|
|
|
|
|
|||||||||||
| Total revenue |
$ | 49,799 | $ | 86,012 | $ | 36,213 | 73 | % | ||||||||
|
|
|
|
|
|
|
|||||||||||
Total revenue increased by $36.2 million, or 73%, from $49.8 million in fiscal 2015 to $86.0 million in fiscal 2016.
Product revenue increased by $27.2 million, or 66%, from $41.4 million in fiscal 2015 to $68.7 million in fiscal 2016. The increase in product revenue was primarily driven by higher volume of sales of our products. Our number of customers grew from 573 as of January 31, 2015 to 928 as of January 31, 2016. We sold 42% more VMstores during fiscal 2016 as compared to fiscal 2015. Our stand-alone software license revenue increased by $3.6 million, or 114%, from $3.2 million in fiscal 2015 to $6.8 million in fiscal 2016.
Support and maintenance revenue increased by $9.0 million, or 107%, from $8.4 million in fiscal 2015 to $17.4 million in fiscal 2016. The increase in support and maintenance revenue was driven primarily by an increase in support contracts sold with increased product sales, as well as continuing recognition of deferred support revenue related to product sales made in prior periods.
74
Table of Contents
Cost of Revenue and Gross Margin
| Fiscal Year Ended January 31, |
Change | |||||||||||||||
| 2015 | 2016 | $ | % | |||||||||||||
| (in thousands, except percentages) | ||||||||||||||||
| Cost of revenue: |
||||||||||||||||
| Product |
$ | 17,144 | $ | 25,138 | $ | 7,994 | 47 | % | ||||||||
| Support and maintenance |
4,565 | 7,110 | 2,545 | 56 | % | |||||||||||
|
|
|
|
|
|
|
|||||||||||
| Total cost of revenue |
$ | 21,709 | $ | 32,248 | $ | 10,539 | 49 | % | ||||||||
|
|
|
|
|
|
|
|||||||||||
| Gross margin |
56 | % | 63 | % | ||||||||||||
| Gross margin, product |
59 | % | 63 | % | ||||||||||||
| Gross margin, support and maintenance |
46 | % | 59 | % | ||||||||||||
Total cost of revenue increased by $10.5 million, or 49%, from $21.7 million in fiscal 2015 to $32.2 million in fiscal 2016.
Cost of product revenue increased by $8.0 million, or 47%, from $17.1 million in fiscal 2015 to $25.1 million in fiscal 2016. Approximately $6.2 million of the increase in cost of product revenue was driven by higher unit volumes. The increase in cost of product revenue was also partially driven by $1.4 million higher costs in our operations organization, primarily related to a $1.0 million increase in personnel costs driven by a 33% headcount increase, as well as increases to overhead costs and other inventory charges and increases related to standard cost changes. At the beginning of fiscal 2016, we substantially replaced our customer evaluation inventory program with a sales demonstration equipment program. As a result, customer evaluation inventory write-downs due to excess and obsolete inventory began to decrease in fiscal 2016.
Cost of support and maintenance revenue increased by $2.5 million, or 56%, from $4.6 million in fiscal 2015 to $7.1 million in fiscal 2016. The increase in cost of support and maintenance revenue was primarily driven by $1.9 million higher costs in our global customer support organization, related to an increase of $1.2 million in personnel costs due to a 47% headcount increase, as well as increases to overhead costs and cost to administer and operate our third-party service inventory depots. The increase in cost of support and maintenance revenue was also driven by a $0.4 million increase in costs related to our third-party service inventory depots. This increase was as a result of an increase in our customer base.
Gross margin increased from 56% in fiscal 2015 to 63% in fiscal 2016.
Product gross margin increased from 59% in fiscal 2015 to 63% in fiscal 2016. Improvement in our product gross margin was related to a favorable product mix and higher stand-alone software sales, and was offset primarily by higher costs in our operations organization and other inventory charges.
Support and maintenance gross margin increased from 46% in fiscal 2015 to 59% in fiscal 2016, as we gained leverage in our customer support organization.
Operating Expenses
Research and Development
| Fiscal Year Ended January 31, |
Change | |||||||||||||||
| 2015 | 2016 | $ | % | |||||||||||||
| (in thousands, except percentages) | ||||||||||||||||
| Research and development |
$ | 28,155 | $ | 43,179 | $ | 15,024 | 53 | % | ||||||||
75
Table of Contents
Research and development expense increased by $15.0 million, or 53%, from $28.2 million in fiscal 2015 to $43.2 million in fiscal 2016. The increase in research and development expense was driven primarily by higher personnel costs of $10.6 million due to a 52% increase in our research and development headcount as we hired additional personnel to continue to develop new and enhanced product offerings, and a $2.5 million increase in overhead costs. In addition, prototype expense increased by $0.8 million as we continued to expand our research and development efforts.
Sales and Marketing
| Fiscal Year Ended January 31, |
Change | |||||||||||||||
| 2015 | 2016 | $ | % | |||||||||||||
| (in thousands, except percentages) | ||||||||||||||||
| Sales and marketing |
$ | 55,060 | $ | 87,993 | $ | 32,933 | 60 | % | ||||||||
Sales and marketing expense increased by $32.9 million, or 60%, from $55.1 million in fiscal 2015 to $88.0 million in fiscal 2016. The increase in sales and marketing expense was primarily driven by higher personnel costs of $11.1 million due to a 39% headcount increase. Sales commission and travel expenses increased by $10.0 million due to increased sales, higher sales and marketing activities, and overhead costs increased by $4.7 million, primarily driven by depreciation of equipment in our sales demonstration program that we initiated at the start of fiscal 2016. In addition, as part of our efforts to penetrate and expand in global markets, the cost of our marketing activities, generally including field events, advertising, tradeshows, brand awareness, demand generation and other expenses, collectively accounted for $6.3 million of the increase.
General and Administrative
| Fiscal Year Ended January 31, |
Change | |||||||||||||||
| 2015 | 2016 | $ | % | |||||||||||||
| (in thousands, except percentages) | ||||||||||||||||
| General and administrative |
$ | 13,941 | $ | 18,773 | $ | 4,832 | 35 | % | ||||||||
General and administrative expense increased by $4.8 million, or 35%, from $13.9 million in fiscal 2015 to $18.8 million in fiscal 2016. The increase in general and administrative expense was primarily due to a $4.2 million increase in personnel costs, driven primarily by both a 57% increase in headcount to support our growing operations and a $0.6 million increase in stock-based compensation representing a cumulative difference adjustment resulting from our adoption of equity administration software and its approach to applying the estimated forfeiture rate to stock-based compensation. Outside professional fees also increased by $1.7 million. These increases were partially offset by a $1.2 million charge recorded in fiscal 2015, representing our estimate of the cumulative liability related to delinquent state sales taxes as of January 31, 2015, as well as related interest and penalty accruals. There was no such charge in fiscal 2016.
Other Expense, Net
| Fiscal Year Ended January 31, |
Change | |||||||||||||||
| 2015 | 2016 | $ | % | |||||||||||||
| (in thousands, except percentages) | ||||||||||||||||
| Other expense, net: |
||||||||||||||||
| Interest expense |
$ | (279 | ) | $ | (4,407 | ) | $ | (4,128 | ) | NM | ||||||
| Other income (expense), net |
(119 | ) | 254 | 373 | NM | |||||||||||
76
Table of Contents
Interest expense increased by $4.1 million, from $0.3 million in fiscal 2015 to $4.4 million in fiscal 2016. The increase in interest expense was primarily due to our increased borrowings under our credit facilities during fiscal 2016, as well as amortization of deferred credit facility fees, note issuance costs and debt discounts in relation to our credit facility and loan obligation.
Other income (expense), net changed by $0.4 million, from $0.1 million in expense in fiscal 2015 to $0.3 million in income in fiscal 2016. The change in other income (expense), net was primarily due to an increase of $0.2 million in interest income driven by higher average balances in our cash and cash equivalents, coupled with a $0.4 million loss from debt extinguishment in fiscal 2015, which was partially offset by increases in the fair value of our convertible preferred stock warrant liability in fiscal 2016.
Provision for Income Taxes
| Fiscal Year Ended January 31, |
Change | |||||||||||||||
| 2015 | 2016 | $ | % | |||||||||||||
| (in thousands, except percentages) | ||||||||||||||||
| Provision for income taxes |
$ | 222 | $ | 634 | $ | 412 | 186 | % | ||||||||
Provision for income taxes increased by $0.4 million, or 186%, from $0.2 million in fiscal 2015 to $0.6 million in fiscal 2016. The increase in the provision for income taxes was primarily due to an increase in foreign taxes as we continue to expand globally.
Quarterly Results of Operations
The following table sets forth our unaudited interim consolidated statement of operations data for each of the nine quarters in the period ended April 30, 2017, as well as the percentage that each line item represents of total revenue. The unaudited interim consolidated statement of operations data set forth below have been prepared on the same basis as our audited consolidated financial statements and, in the opinion of management, reflect all adjustments, consisting only of normal recurring adjustments, that are necessary for the fair presentation of such data. Our historical results are not necessarily indicative of the results that may be expected in the future and the results for any quarter are not necessarily indicative of results to be expected for a full year or any other period. The following quarterly financial data should be read in conjunction with our consolidated financial statements and the related notes included elsewhere in this prospectus.
77
Table of Contents
| Three Months Ended | ||||||||||||||||||||||||||||||||||||
| Apr. 30, 2015 |
Jul. 31, 2015 |
Oct. 31, 2015 |
Jan. 31, 2016 |
Apr. 30, 2016 |
Jul. 31, 2016 |
Oct. 31, 2016 |
Jan 31, 2017 |
Apr. 30, 2017 |
||||||||||||||||||||||||||||
| (unaudited) | ||||||||||||||||||||||||||||||||||||
| (in thousands) | ||||||||||||||||||||||||||||||||||||
| Consolidated Statement of Operations Data: |
||||||||||||||||||||||||||||||||||||
| Revenue: |
||||||||||||||||||||||||||||||||||||
| Product |
$ | 12,307 | $ | 15,878 | $ | 19,705 | $ | 20,762 | $ | 16,677 | $ | 20,768 | $ | 26,871 | $ | 33,014 | $ | 22,387 | ||||||||||||||||||
| Support and maintenance |
3,261 | 3,943 | 4,670 | 5,486 | 6,199 | 6,788 | 7,046 | 7,742 | 7,968 | |||||||||||||||||||||||||||
|
|
|
|
|
|
|
|
|
|
|
|
|
|
|
|
|
|
|
|||||||||||||||||||
| Total revenue |
15,568 | 19,821 | 24,375 | 26,248 | 22,876 | 27,556 | 33,917 | 40,756 | 30,355 | |||||||||||||||||||||||||||
|
|
|
|
|
|
|
|
|
|
|
|
|
|
|
|
|
|
|
|||||||||||||||||||
| Cost of revenue: |
||||||||||||||||||||||||||||||||||||
| Product(1) |
5,236 | 6,084 | 6,483 | 7,335 | 5,936 | 7,160 | 8,953 | 12,689 | 8,909 | |||||||||||||||||||||||||||
| Support and maintenance(1) |
1,578 | 1,615 | 1,887 | 2,030 | 2,072 | 2,568 | 2,424 | 2,373 | 3,039 | |||||||||||||||||||||||||||
|
|
|
|
|
|
|
|
|
|
|
|
|
|
|
|
|
|
|
|||||||||||||||||||
| Total cost of revenue |
6,814 | 7,699 | 8,370 | 9,365 | 8,008 | 9,728 | 11,377 | 15,062 | 11,948 | |||||||||||||||||||||||||||
|
|
|
|
|
|
|
|
|
|
|
|
|
|
|
|
|
|
|
|||||||||||||||||||
| Gross profit: |
||||||||||||||||||||||||||||||||||||
| Product |
7,071 | 9,794 | 13,222 | 13,427 | 10,741 | 13,608 | 17,918 | 20,325 | 13,478 | |||||||||||||||||||||||||||
| Support and maintenance |
1,683 | 2,328 | 2,783 | 3,456 | 4,127 | 4,220 | 4,622 | 5,369 | 4,929 | |||||||||||||||||||||||||||
|
|
|
|
|
|
|
|
|
|
|
|
|
|
|
|
|
|
|
|||||||||||||||||||
| Total gross profit |
8,754 | 12,122 | 16,005 | 16,883 | 14,868 | 17,828 | 22,540 | 25,694 | 18,407 | |||||||||||||||||||||||||||
|
|
|
|
|
|
|
|
|
|
|
|
|
|
|
|
|
|
|
|||||||||||||||||||
| Operating expenses: |
||||||||||||||||||||||||||||||||||||
| Research and development(1) |
9,897 | 10,248 | 11,641 | 11,393 | 13,659 | 12,989 | 13,227 | 13,570 | 14,923 | |||||||||||||||||||||||||||
| Sales and marketing(1) |
17,181 | 20,302 | 24,157 | 26,353 | 24,996 | 24,466 | 27,862 | 31,579 | 27,442 | |||||||||||||||||||||||||||
| General and administrative(1) |
4,432 | 4,453 | 4,594 | 5,294 | 5,675 | 4,911 | 3,955 | 4,823 | 5,332 | |||||||||||||||||||||||||||
|
|
|
|
|
|
|
|
|
|
|
|
|
|
|
|
|
|
|
|||||||||||||||||||
| Total operating expenses |
31,510 | 35,003 | 40,392 | 43,040 | 44,330 | 42,366 | 45,044 | 49,972 | 47,697 | |||||||||||||||||||||||||||
|
|
|
|
|
|
|
|
|
|
|
|
|
|
|
|
|
|
|
|||||||||||||||||||
| Loss from operations |
(22,756 | ) | (22,881 | ) | (24,387 | ) | (26,157 | ) | (29,462 | ) | (24,538 | ) | (22,504 | ) | (24,278 | ) | (29,290 | ) | ||||||||||||||||||
| Other expense, net: |
||||||||||||||||||||||||||||||||||||
| Interest expense |
(725 | ) | (1,039 | ) | (1,248 | ) | (1,395 | ) | (1,437 | ) | (1,376 | ) | (1,231 | ) | (1,187 | ) | (1,274 | ) | ||||||||||||||||||
| Other income (expense), net |
(45 | ) | (79 | ) | (16 | ) | 394 | 286 | 395 | 54 | (58 | ) | 42 | |||||||||||||||||||||||
|
|
|
|
|
|
|
|
|
|
|
|
|
|
|
|
|
|
|
|||||||||||||||||||
| Total other expense, net |
(770 | ) | (1,118 | ) | (1,264 | ) | (1,001 | ) | (1,151 | ) | (981 | ) | (1,177 | ) | (1,245 | ) | (1,232 | ) | ||||||||||||||||||
|
|
|
|
|
|
|
|
|
|
|
|
|
|
|
|
|
|
|
|||||||||||||||||||
| Loss before provision for income taxes |
(23,526 | ) | (23,999 | ) | (25,651 | ) | (27,158 | ) | (30,613 | ) | (25,519 | ) | (23,681 | ) | (25,523 | ) | (30,522 | ) | ||||||||||||||||||
| Provision for income taxes |
72 | 143 | 134 | 285 | 198 | 153 | 89 | 25 | 158 | |||||||||||||||||||||||||||
|
|
|
|
|
|
|
|
|
|
|
|
|
|
|
|
|
|
|
|||||||||||||||||||
| Net loss |
$ | (23,598 | ) | $ | (24,142 | ) | $ | (25,785 | ) | $ | (27,443 | ) | $ | (30,811 | ) | $ | (25,672 | ) | $ | (23,770 | ) | $ | (25,548 | ) | $ | (30,680 | ) | |||||||||
|
|
|
|
|
|
|
|
|
|
|
|
|
|
|
|
|
|
|
|||||||||||||||||||
| (1) | Includes stock-based compensation expense as follows: |
| Three Months Ended | ||||||||||||||||||||||||||||||||||||
| Apr. 30, 2015 |
Jul. 31, 2015 |
Oct. 31, 2015 |
Jan. 31, 2016 |
Apr. 30, 2016 |
Jul. 31, 2016 |
Oct. 31, 2016 |
Jan. 31, 2017 |
Apr. 30, 2017 |
||||||||||||||||||||||||||||
| (unaudited) | ||||||||||||||||||||||||||||||||||||
| (in thousands) | ||||||||||||||||||||||||||||||||||||
| Cost of product revenue |
$ | 39 | $ | 48 | $ | 46 | $ | 48 | $ | 62 | $ | 67 | $ | 68 | $ | 67 | $ | 71 | ||||||||||||||||||
| Cost of support and maintenance revenue |
37 | 38 | 43 | 58 | 76 | 96 | 71 | 80 | 115 | |||||||||||||||||||||||||||
| Research and development |
585 | 700 | 827 | 794 | 1,476 | 1,384 | 1,230 | 1,137 | 1,276 | |||||||||||||||||||||||||||
| Sales and marketing |
798 | 678 | 712 | 885 | 1,223 | 1,027 | 959 | 906 | 1,044 | |||||||||||||||||||||||||||
| General and administrative |
1,103 | 770 | 778 | 768 | 961 | 1,069 | 973 | 902 | 959 | |||||||||||||||||||||||||||
|
|
|
|
|
|
|
|
|
|
|
|
|
|
|
|
|
|
|
|||||||||||||||||||
| Total stock-based compensation expense |
$ | 2,562 | $ | 2,234 | $ | 2,406 | $ | 2,553 | $ | 3,798 | $ | 3,643 | $ | 3,301 | $ | 3,092 | $ | 3,465 | ||||||||||||||||||
|
|
|
|
|
|
|
|
|
|
|
|
|
|
|
|
|
|
|
|||||||||||||||||||
78
Table of Contents
| Three Months Ended | ||||||||||||||||||||||||||||||||||||
| Apr. 30, 2015 |
Jul. 31, 2015 |
Oct. 31, 2015 |
Jan. 31, 2016 |
Apr. 30, 2016 |
Jul. 31, 2016 |
Oct. 31, 2016 |
Jan. 31, 2017 |
Apr. 30, 2017 |
||||||||||||||||||||||||||||
| (unaudited) | ||||||||||||||||||||||||||||||||||||
| Percentage of Revenue Data: |
||||||||||||||||||||||||||||||||||||
| Revenue: |
||||||||||||||||||||||||||||||||||||
| Product |
79 | % | 80 | % | 81 | % | 79 | % | 73 | % | 75 | % | 79 | % | 81 | % | 74 | % | ||||||||||||||||||
| Support and maintenance |
21 | 20 | 19 | 21 | 27 | 25 | 21 | 19 | 26 | |||||||||||||||||||||||||||
|
|
|
|
|
|
|
|
|
|
|
|
|
|
|
|
|
|
|
|||||||||||||||||||
| Total revenue |
100 | 100 | 100 | 100 | 100 | 100 | 100 | 100 | 100 | |||||||||||||||||||||||||||
| Total cost of revenue |
44 | 39 | 35 | 36 | 35 | 35 | 34 | 37 | 39 | |||||||||||||||||||||||||||
|
|
|
|
|
|
|
|
|
|
|
|
|
|
|
|
|
|
|
|||||||||||||||||||
| Total gross profit |
56 | 61 | 65 | 64 | 65 | 65 | 66 | 63 | 61 | |||||||||||||||||||||||||||
|
|
|
|
|
|
|
|
|
|
|
|
|
|
|
|
|
|
|
|||||||||||||||||||
| Operating expenses: |
||||||||||||||||||||||||||||||||||||
| Research and development |
64 | 52 | 48 | 43 | 60 | 47 | 39 | 33 | 49 | |||||||||||||||||||||||||||
| Sales and marketing |
110 | 102 | 99 | 100 | 109 | 89 | 82 | 77 | 90 | |||||||||||||||||||||||||||
| General and administrative |
29 | 23 | 19 | 20 | 25 | 18 | 12 | 12 | 18 | |||||||||||||||||||||||||||
|
|
|
|
|
|
|
|
|
|
|
|
|
|
|
|
|
|
|
|||||||||||||||||||
| Total operating expenses |
203 | 177 | 166 | 163 | 194 | 154 | 133 | 122 | 157 | |||||||||||||||||||||||||||
|
|
|
|
|
|
|
|
|
|
|
|
|
|
|
|
|
|
|
|||||||||||||||||||
| Loss from operations |
(147 | ) | (116 | ) | (101 | ) | (99 | ) | (129 | ) | (89 | ) | (67 | ) | (59 | ) | (96 | ) | ||||||||||||||||||
| Other expense, net: |
||||||||||||||||||||||||||||||||||||
| Interest expense |
(5 | ) | (5 | ) | (5 | ) | (5 | ) | (6 | ) | (5 | ) | (4 | ) | (3 | ) | (4 | ) | ||||||||||||||||||
| Other income (expense), net |
— | — | — | 2 | 1 | 1 | — | — | — | |||||||||||||||||||||||||||
|
|
|
|
|
|
|
|
|
|
|
|
|
|
|
|
|
|
|
|||||||||||||||||||
| Total other expense, net |
(5 | ) | (5 | ) | (5 | ) | (3 | ) | (5 | ) | (4 | ) | (4 | ) | (3 | ) | (4 | ) | ||||||||||||||||||
|
|
|
|
|
|
|
|
|
|
|
|
|
|
|
|
|
|
|
|||||||||||||||||||
| Loss before provision for income taxes |
(152 | ) | (121 | ) | (106 | ) | (102 | ) | (134 | ) | (93 | ) | (71 | ) | (62 | ) | (100 | ) | ||||||||||||||||||
| Provision for income taxes |
— | 1 | 1 | 1 | 1 | 1 | — | — | 1 | |||||||||||||||||||||||||||
|
|
|
|
|
|
|
|
|
|
|
|
|
|
|
|
|
|
|
|||||||||||||||||||
| Net loss |
(152 | )% | (122 | )% | (107 | )% | (103 | )% | (135 | )% | (94 | )% | (71 | )% | (62 | )% | (101 | )% | ||||||||||||||||||
|
|
|
|
|
|
|
|
|
|
|
|
|
|
|
|
|
|
|
|||||||||||||||||||
Quarterly Revenue Trends
Our quarterly revenue increased sequentially over the periods presented within each fiscal year due to increases in sales of our products and support and maintenance to new and existing customers. Increases in revenue are generally attributable to an increase in the size of our customer base and mix, an increase in the number of our VMstore products and stand-alone software licenses sold and, to a lesser extent, an increase in the average sales price for certain of our products.
In general, our sales are subject to seasonal trends. Our fourth fiscal quarter, ending January 31, typically has the highest revenue in our fiscal year, and our first fiscal quarter, ending April 30, typically has the lowest revenue in our fiscal year. We believe that our year-over-year growth has reduced the impact of these seasonal trends, and that seasonal variations in our business may become more pronounced over time. Historical patterns in our business may not be a reliable indicator of our future sales activity or performance.
Quarterly Gross Margin Trends
Our total quarterly gross margins ranged from 56% to 66% during the periods presented. Gross margin has been and will continue to be affected by a variety of factors, including the average sales price of our products, manufacturing and inventory-related costs, the mix of products sold and the mix of product revenue and support and maintenance revenue.
79
Table of Contents
Quarterly Expense Trends
Sales and marketing, research and development and general and administrative expenses generally grew significantly over the quarterly periods presented, primarily due to increases in headcount in connection with the expansion of our business.
Key Financial and Operational Metrics
The following table presents certain key metrics for each of the nine quarters in the period ended April 30, 2017. In addition to our results determined in accordance with GAAP, we believe the following non-GAAP measures are useful in evaluating our operating performance.
| Three Months Ended | ||||||||||||||||||||||||||||||||||||
| Apr. 30, 2015 |
Jul. 31, 2015 |
Oct. 31, 2015 |
Jan. 31, 2016 |
Apr. 30, 2016 |
Jul. 31, 2016 |
Oct. 31, 2016 |
Jan. 31, 2017 |
Apr. 30, 2017 |
||||||||||||||||||||||||||||
| (unaudited) | ||||||||||||||||||||||||||||||||||||
| Free cash flow as a percentage of total revenue |
(125 | )% | (104 | )% | (68 | )% | (62 | )% | (88 | )% | (79 | )% | (58 | )% |
|
(32 |
)% |
(65 | )% | |||||||||||||||||
A reconciliation of free cash flow to cash flow used in operating activities, the most directly comparable financial measure calculated and presented in accordance with GAAP, is provided below:
| Three Months Ended | ||||||||||||||||||||||||||||||||||||
| Apr. 30, 2015 |
Jul. 31, 2015 |
Oct. 31, 2015 |
Jan. 31, 2016 |
Apr. 30, 2016 |
Jul. 31, 2016 |
Oct. 31, 2016 |
Jan. 31, 2017 |
Apr. 30, 2017 |
||||||||||||||||||||||||||||
| (unaudited) | ||||||||||||||||||||||||||||||||||||
| (in thousands, except percentages) | ||||||||||||||||||||||||||||||||||||
| Cash flow used in operating activities |
$ | (15,385 | ) | $ | (16,608 | ) | $ | (14,064 | ) | $ | (16,052 | ) | $ | (19,696 | ) | $ | (19,816 | ) | $ | (18,692 | ) | $ | (12,162 | ) | $ | (18,975 | ) | |||||||||
| Less: purchase of property and equipment |
(4,124 | ) | (3,941 | ) | (2,557 | ) | (292 | ) | (372 | ) | (1,959 | ) | (1,100 | ) | (906 | ) | (676 | ) | ||||||||||||||||||
|
|
|
|
|
|
|
|
|
|
|
|
|
|
|
|
|
|
|
|||||||||||||||||||
| Free cash flow |
$ | (19,509 | ) | $ | (20,549 | ) | $ | (16,621 | ) | $ | (16,344 | ) | $ | (20,068 | ) | $ | (21,775 | ) | $ | (19,792 | ) | $ | (13,068 | ) | $ | (19,651 | ) | |||||||||
|
|
|
|
|
|
|
|
|
|
|
|
|
|
|
|
|
|
|
|||||||||||||||||||
| Total revenue |
15,568 | 19,821 | 24,375 | 26,248 | 22,876 | 27,556 | 33,917 | 40,756 | 30,355 | |||||||||||||||||||||||||||
| Free cash flow as a percentage of total revenue |
(125 | )% | (104 | )% | (68 | )% | (62 | )% | (88 | )% | (79 | )% | (58 | )% | (32 | )% | (65 | )% | ||||||||||||||||||
| Net cash provided by (used in) investing activities |
|
(307 |
) |
9,004 | (2,557 | ) | (62,549 | ) | 23,593 | 6,463 | 19,398 | 8,880 | (676 | ) | ||||||||||||||||||||||
| Net cash provided by (used in) financing activities |
14,960 | 147,296 | (1,230 | ) | 571 | 485 | 7,128 | 731 | 1,081 | 20,305 | ||||||||||||||||||||||||||
Liquidity and Capital Resources
As of April 30, 2017, we had cash and cash equivalents of $48.7 million. Our cash and cash equivalents primarily consist of bank deposits and money market funds. We have generated significant operating losses and negative cash flows from operations as reflected in our accumulated deficit of $376.0 million as of April 30, 2017.
We have experienced negative cash flows from operations since inception and expect negative cash flows from operations to continue for the foreseeable future. Net losses incurred during the past three fiscal years ended January 31, 2015, 2016 and 2017 amounted to $69.7 million, $101.0 million and $105.8 million, respectively. Unless and until we are able to generate sufficient revenue from sales of our products and services to generate positive cash flows from operations, we expect such losses to continue. We are also subject to certain financial covenants related to our debt facilities that, if breached, could result in the debt becoming immediately due and
80
Table of Contents
payable in the event the lenders choose to declare an event of default. We may not have sufficient liquidity to repay amounts outstanding under our debt facilities should they become immediately due and payable. As of January 31, 2017 and April 30, 2017, we were in compliance with all of the covenants contained in our credit facility with TriplePoint and our credit facility with SVB.
Historically, we have funded a significant portion of our operations through the issuance of equity and debt. In fiscal 2016, we raised $124.6 million in gross proceeds related to the sale of convertible preferred stock. In fiscal 2018, we also entered into various amendments to our existing debt agreements and entered into a convertible note facility that increased our committed borrowing capacity by $50.0 million. We expect that this additional financing, combined with our plans for continued revenue growth and our existing cash and cash equivalents, will provide sufficient liquidity for us to meet our obligations and debt financial covenants through at least June 7, 2018.
Until we can generate positive cash flows from operations, we expect to continue to finance our operations with additional debt or equity financing and/or work with our lenders to amend certain financial covenants. Our ability to raise additional liquidity is subject to a number of uncertainties, including, but not limited to, the market demand for our common or preferred stock, the market demand for our products and services, negative economic developments, adverse market conditions, significant delays in the launch of new products and lack of market acceptance of new products. If we are not able to raise additional capital or access our debt facilities in sufficient amounts to fund our operations, it would have a material adverse effect on our business, operating results and financial condition.
Cash Flows
The following table summarizes our cash flows for the periods presented:
| Fiscal Year Ended January 31, | Three Months Ended April 30, |
|||||||||||||||||||
| 2015 | 2016 | 2017 | 2016 | 2017 | ||||||||||||||||
| (unaudited) | ||||||||||||||||||||
| (in thousands) | ||||||||||||||||||||
| Cash used in operating activities |
$ | (51,098 | ) | $ | (62,109 | ) | $ | (70,366 | ) | $ | (19,696 | ) | $ | (18,975 | ) | |||||
| Cash provided by (used in) investing activities |
(26,437 | ) | (56,409 | ) | 58,334 | 23,593 | (676 | ) | ||||||||||||
| Cash provided by (used in) financing activities |
(958 | ) | 161,597 | 9,425 | 485 | 20,305 | ||||||||||||||
| Foreign exchange impact on cash and cash equivalents |
64 | (2 | ) | (61 | ) | (41 | ) | (10 | ) | |||||||||||
|
|
|
|
|
|
|
|
|
|
|
|||||||||||
| Net increase (decrease) in cash and cash equivalents |
$ | (78,429 | ) | $ | 43,077 | $ | (2,668 | ) | $ | 4,341 | $ | 644 | ||||||||
|
|
|
|
|
|
|
|
|
|
|
|||||||||||
Cash Flows Used In Operating Activities
In the three months ended April 30, 2017, cash used in operating activities was $19.0 million. The primary factors affecting our cash used in operating activities during this period were our net cash flows of $6.3 million provided by changes in our operating assets and liabilities and our net loss of $30.7 million, partially offset by non-cash charges of $3.5 million for stock-based compensation, $1.9 million for depreciation and amortization of our property and equipment. The primary driver of the changes in operating assets and liabilities was a $10.1 million decrease in accounts receivable. The decrease in accounts receivable was primarily affected by seasonal trends which results in our first fiscal quarter, ending April 30, having the lowest revenue and our fourth fiscal quarter, ending January 31, having the highest revenue in our fiscal year. We expect operating cash flows to continue to be affected by timing of sales and timing of collections. Changes in our operating assets and liabilities were also significantly affected by a $3.6 million increase in deferred revenue, and a $0.2 million increase in inventories, offset by a $5.3 million decrease in accounts payable and accrued liabilities, and $2.3 million decrease in prepaid expenses and other assets. The increase in deferred revenue was due to a greater number of support and maintenance contracts related to the growth in our product sales and increased renewal of
81
Table of Contents
existing support and maintenance contracts associated with our larger installed customer base. The decrease in accounts payable and accrued liabilities is primarily affected by lower operating expenses together with timing of payments. The increase in inventories was primarily attributable to incremental service inventory acquired to support our customer support agreements associated with our larger installed customer base.
In the three months ended April 30, 2016, cash used in operating activities was $19.7 million. The primary factors affecting our cash used in operating activities during this period were our net loss of $30.8 million, partially offset by non-cash charges of $3.8 million for stock-based compensation, $2.3 million for depreciation and amortization of our property and equipment, $0.3 million for accretion of balloon payment and amortization of debt issuance cost, credit facility fees and discount on debt, and net cash flows of $4.7 million provided by changes in our operating assets and liabilities. The primary driver of the changes in operating assets and liabilities was a $4.8 million decrease in accounts receivable. The decrease in accounts receivable was primarily affected by seasonal trends which results in our first fiscal quarter, ending April 30, having the lowest revenue and our fourth fiscal quarter, ending January 31, having the highest revenue in our fiscal year. We expect operating cash flows to continue to be affected by timing of sales and timing of collections. Changes in our operating assets and liabilities were also significantly affected by a $3.2 million increase in accounts payable and accrued liabilities, and a $2.3 million increase in deferred revenue, offset by a $5.1 million decrease in prepaid expenses and other assets, and a $0.4 million decrease in inventories. The decrease in accounts payable and accrued liabilities is primarily affected lower operating expenses together with the timing of payments. The increase in deferred revenue was due to a greater number of support and maintenance contracts related to the growth in our product sales and increased renewal of existing support and maintenance contracts associated with our larger installed customer base.
In fiscal 2017, cash used in operating activities was $70.4 million. The primary factors affecting our cash used in operating activities during this period were our net loss of $105.8 million, partially offset by non-cash charges of $13.8 million for stock-based compensation, $9.3 million for depreciation and amortization of our property and equipment, $0.8 million for accretion of balloon payment and amortization of debt issuance cost, credit facility fees and discount on debt, and net cash flows of $11.5 million provided by changes in our operating assets and liabilities. The primary driver of the changes in operating assets and liabilities was a $14.6 million increase in deferred revenue. The increase in deferred revenue was due to a greater number of support and maintenance contracts related to the growth in our product sales and increased renewal of existing support and maintenance contracts associated with our larger installed customer base. Changes in our operating assets and liabilities were also significantly affected by a $13.7 million increase in accounts payable and accrued liabilities, offset by a $10.0 million increase in accounts receivable, $3.7 million in prepaid expenses and other assets, and a $3.1 million increase in inventories. The increase in accounts payable and accrued liabilities was primarily attributable to increased activities to support overall business growth. The increase in accounts receivable was primarily due to revenue growth. We expect operating cash flows to continue to be affected by timing of sales and timing of collections. The increase in inventories was primarily attributable to incremental service inventory acquired to support our customer support agreements associated with our larger installed customer base.
In fiscal 2016, cash used in operating activities was $62.1 million. The primary factors affecting our cash used in operating activities during this period were our net loss of $101.0 million, partially offset by non-cash charges of $9.8 million for stock-based compensation, $7.8 million for depreciation and amortization of our property and equipment, $1.6 million for accretion of balloon payment and amortization of debt issuance cost, credit facility fees and discount on debt, and net cash flows of $19.8 million provided by changes in our operating assets and liabilities. The primary driver of the changes in operating assets and liabilities was a $18.8 million increase in deferred revenue. The increase in deferred revenue was due to a greater number of support and maintenance contracts related to the growth in our product sales and increased renewal of existing support and maintenance contracts associated with our larger installed customer base. Changes in our operating assets and liabilities were also significantly affected by a $3.8 million increase in accounts payable and accrued liabilities, and a $1.8 million decrease in inventories, partially offset by a $4.1 million increase in accounts
82
Table of Contents
receivable. The increase in accounts payable and accrued liabilities was primarily attributable to increased activities to support overall business growth. The increase in accounts receivable was primarily due to revenue growth. The decrease in inventories was primarily attributable to our transition away from our customer evaluation inventory program.
In fiscal 2015, cash used in operating activities was $51.1 million. The primary factors affecting our cash used in operating activities during this period were our net loss of $69.7 million, partially offset by non-cash charges of $5.2 million for stock-based compensation and $3.5 million for depreciation and amortization of our property and equipment, and net cash flows of $9.8 million provided by changes in our operating assets and liabilities. The primary driver of the changes in operating assets and liabilities was a $13.8 million increase in deferred revenue. The increase in deferred revenue was due to a greater number of support and maintenance contracts related to the growth in our product sales and increased renewal of existing support and maintenance contracts associated with our larger installed customer base. Changes in our operating assets and liabilities were also significantly affected by a $14.4 million increase in accounts payable and accrued liabilities, offset by a $12.6 million increase in accounts receivable, a $2.9 million increase in prepaid expenses and other assets, and a $3.0 million increase in inventories. The increase in accounts payable and accrued liabilities was primarily attributable to increased activities to support overall business growth. The increases in accounts receivable was primarily due to revenue growth. The increase in inventories, prepaid expenses and other assets, accounts payable and accrued liabilities was primarily attributed to increased activities to support overall business growth.
Cash Flows from Investing Activities
In the three months ended April 30, 2017, net cash used in investing activities consisted of purchases of property and equipment for $0.7 million.
In the three months ended April 30, 2016, net cash provided by investing activities was $23.6 million, which consisted of $24.0 million from maturities of investments, partially offset by $0.4 million of purchases of property and equipment.
In fiscal 2017, net cash provided by investing activities was $58.3 million, which consisted of $76.4 million from maturities of our investments, partially offset by $13.8 million from purchases of investments and $4.3 million of purchases of property and equipment.
In fiscal 2016, net cash used in investing activities was $56.4 million, which consisted of $70.4 million from purchases of investments and $10.9 million of purchases of property and equipment as we continue to invest in the longer term growth of our business, partially offset by $24.9 million from maturities and sales of our investments.
In fiscal 2015, net cash used in investing activities was $26.4 million, which consisted of $37.0 million used in purchases of investments and $8.7 million used in purchases of property and equipment, partially offset by $19.2 million from maturities and sales of our investments.
Cash Flows from Financing Activities
In the three months ended April 30, 2017, net cash provided by financing activities was $20.3 million, which consisted primarily of $15.0 million from the draw-down from our credit facility, $5.0 million from the draw-down of our revolving line of credit and $0.4 million of proceeds from exercises of stock options, partially offset by $0.1 million of capital lease financing payments.
In the three months ended April 30, 2016, net cash provided by financing activities was $0.5 million, which consisted primarily of proceeds from exercises of stock options.
83
Table of Contents
In fiscal 2017, net cash provided by financing activities was $9.4 million, which consisted primarily of $7.0 million from the draw-down of our revolving line of credit and $2.3 million of proceeds from exercises of stock options.
In fiscal 2016, net cash provided by financing activities was $161.6 million, which consisted primarily of $122.8 million of net proceeds from the sale of our Series F convertible preferred stock, $35.0 million from the draw-down from our credit facility, $7.0 million from the draw-down of our revolving line of credit and $3.1 million of proceeds from exercises of stock options, partially offset by $6.0 million of repayment of our revolving line of credit.
In fiscal 2015, net cash used by financing activities was $1.0 million, which consisted primarily of a $10.9 million repayment of our revolving line of credit and an $8.0 million repayment of our credit facility, partially offset by proceeds of $14.0 million from the draw-down of our revolving line of credit, $3.0 million from the draw-down of our credit facility and $1.1 million of proceeds from exercises of stock options.
Debt Obligations
We have a credit facility with TriplePoint which, as of April 30, 2017, provided up to $50.0 million of available funds. This credit facility is secured by a security interest, junior to the SVB facility described below, on substantially all of our assets, including our intellectual property, and contains certain customary non-financial restrictive covenants. As of April 30, 2017, we had $50.0 million outstanding under this facility, of which $35.0 million bears interest at 10% per year and becomes due in August 2018, and $15.0 million bears interest at 9% per year and becomes due in February 2019.
We have a revolving line of credit with SVB, from which an amount based on a percentage of qualifying accounts receivable is available for us to borrow, up to a total of $20.0 million. This facility is secured by a security interest, senior to the TriplePoint facility described above, on substantially all of our assets, including our intellectual property, and is subject to certain financial covenant. This facility is scheduled to expire in May 2018. As of April 30, 2017, we had $19.0 million outstanding under this facility, which bears weighted average interest of 4.59% per year.
Subsequent to January 31, 2017, we entered into amendments to our New Facility Agreement with TriplePoint. Under these amendments, we borrowed an additional $15.0 million, which will mature in February 2019. In addition, in June 2017, we entered into an agreement with TriplePoint to extend the maturity date of $35.0 million of borrowings from August 2018 to February 2019 if our common stock is listed and is actively trading on the NASDAQ Stock Market on or prior to July 30, 2017, at which point the remaining balance of up to approximately $30.0 million of borrowings will amortize over the following 18 months, subject to certain conditions, including the completion of this offering. In March 2017, we amended our Loan and Security Agreement with SVB, under which we drew down an additional $5.0 million.
As of January 31, 2017 and April 30, 2017, we were in compliance with all of the covenants contained in our credit facility with TriplePoint and our credit facility with SVB.
Contractual Obligations and Commitments
The following table summarizes our contractual obligations as of January 31, 2017:
| Payment Due by Period | ||||||||||||||||||||
| Total | Less Than 1 Year |
1-3 Years | 3-5 Years | More Than 5 Years |
||||||||||||||||
| (in thousands) | ||||||||||||||||||||
| Operating leases |
$ | 39,340 | $ | 7,121 | $ | 14,146 | $ | 14,089 | $ | 3,984 | ||||||||||
| Capital leases |
389 | 216 | 173 | — | — | |||||||||||||||
| Debt obligation* |
48,962 | — | 48,962 | — | — | |||||||||||||||
|
|
|
|
|
|
|
|
|
|
|
|||||||||||
| Total |
$ | 88,691 | $ | 7,337 | $ | 63,281 | $ | 14,089 | $ | 3,984 | ||||||||||
|
|
|
|
|
|
|
|
|
|
|
|||||||||||
84
Table of Contents
| * | Subsequent to January 31, 2017, we entered into amendments to our New Facility Agreement with TriplePoint. Under these amendments, we borrowed an additional $15.0 million, which will mature in February 2019. In March 2017, we amended our Loan and Security Agreement with SVB, under which we drew down an additional $5.0 million. |
We contract with an offshore subsidiary of Flex to manufacture all of our hardware products. Our agreement with Flex does not require us to purchase any minimum volumes of products from Flex, but in the normal course of business we provide rolling nine month forecasts to Flex of our monthly purchase requirements, the first three months of which are purchase commitments that Flex relies upon to procure components used to build finished products. We have commitments to Flex related to inventories on-hand at Flex and non-cancelable purchase orders for our products and related components. We record a charge to cost of product sales for firm, non-cancelable and unconditional purchase commitments with Flex for non-standard components when and if quantities exceed our future demand forecasts. As of January 31, 2016 and 2017, we had $7.2 million and $13.5 million of purchase commitments with Flex, respectively.
Off-Balance Sheet Arrangements
In fiscal years 2015, 2016, and 2017 and for the three months ended April 30, 2017, we did not have any relationships with unconsolidated entities or financial partnerships, such as structured finance or special purpose entities that were established for the purpose of facilitating off-balance sheet arrangements or other purposes.
Quantitative and Qualitative Disclosures about Market Risk
We are exposed to market risk in the ordinary course of our business. Market risk represents the risk of loss that may impact our financial position due to adverse changes in financial market prices and rates. Our market risk exposure is primarily a result of fluctuations in foreign currency exchange rates and interest rates.
Foreign Currency Risk
Our sales contracts are denominated in U.S. dollars, and therefore, substantially all of our revenue is not subject to foreign currency risk. However, a strengthening of the U.S. dollar could increase the real cost of our products to our customers outside of the United States, which could adversely affect our financial condition and operating results. In addition, a portion of our operating expenses is incurred outside the United States, is denominated in foreign currencies such as the Euro, the Pound Sterling, and the Japanese Yen, and is subject to fluctuations due to changes in foreign currency exchange rates. To date, we have not entered into any hedging arrangements with respect to foreign currency risk or other derivative instruments. In the event our foreign sales and expenses increase, our operating results may be more greatly affected by foreign currency exchange rate fluctuations, which can affect our operating income or loss. The effect of a hypothetical 10% change in foreign currency exchanges rates applicable to our business would not have had a material impact on our historical consolidated financial statements. If in the future we become more exposed to currency fluctuations and are not able to successfully hedge against the risks associated with currency fluctuations, our operating results could be adversely affected.
Interest Rate Risk
Our cash and cash equivalents primarily consist of bank deposits and money market funds. The carrying amount of our cash equivalents reasonably approximates fair value, due to the short maturities of these instruments. The primary objectives of our investment activities are the preservation of capital, the fulfillment of liquidity needs and the fiduciary control of cash and investments. We do not enter into investments for trading or speculative purposes. Our investments are exposed to market risk due to a fluctuation in interest rates, which may affect our interest income and the fair market value of our investments. However, due to the short-term nature of our investment portfolio, we do not believe an immediate 10% increase or decrease in interest rates would have a material effect on the fair market value of our portfolio. We therefore do not expect our operating results or cash flows to be materially affected by a sudden change in market interest rates.
85
Table of Contents
Critical Accounting Policies and Estimates
Our consolidated financial statements are prepared in accordance with U.S. generally accepted accounting principles, or GAAP. The preparation of these consolidated financial statements requires our management to make estimates, assumptions and judgments that affect the reported amounts of assets, liabilities, revenue, expenses and related disclosures. We base our estimates, assumptions and judgments on historical experience and on various other factors that we believe to be reasonable under the circumstances. Different assumptions and judgments would change the estimates used in the preparation of our consolidated financial statements, which, in turn, could change the results from those reported. We evaluate our estimates, assumptions and judgments on an ongoing basis.
The critical accounting estimates, assumptions and judgments that we believe have the most significant impact on our consolidated financial statements are described below.
Revenue Recognition
We generate revenue from sales of enterprise cloud platform products and related support and maintenance. We derive revenue primarily from two sources: (i) product revenue, which includes hardware and perpetual software license revenue and (ii) support and maintenance revenue, which includes support, installation services and training. Revenue is recognized when all of the following criteria are met: persuasive evidence of an arrangement exists; the product or service has been delivered; the sales price is fixed or determinable; and collection is reasonably assured.
We define each of the four criteria above as follows:
| • | Persuasive Evidence of an Arrangement Exists. We use stand-alone purchase orders, signed sales quotations or purchase orders pursuant to the terms and conditions of a master sales agreement to support the evidence of an arrangement with channel partners, distributors and customers. |
| • | Delivery Has Occurred. We use shipping documentation to verify delivery of products. We typically recognize product revenue upon transfer of title and risk of loss, which is primarily upon shipment to channel partners, distributors and customers. Support and maintenance revenue is recognized over time as the services are delivered. We generally do not have significant obligations for future performance, such as rights of return or pricing credits, associated with sales of our products. It is our practice to identify an end-user prior to shipment to a channel partner or distributor. |
| • | The Sales Price Is Fixed or Determinable. We assess whether the fee is fixed or determinable based on the payment terms associated with the transaction. If the terms are extended beyond our normal payment terms, we will recognize revenue as the payments become due. Payment from partners is not contingent on partner’s receiving payment from customers. |
| • | Collection Is Reasonably Assured. We assess probability of collection on a customer-by-customer basis. Our channel partners, distributors and customers are subjected to a credit review process that evaluates their financial condition and ability to pay. |
Support and maintenance revenue includes arrangements for software and technical support for our products. While purchasing support and maintenance services is not mandatory, substantially all products shipped have been purchased together with a support contract. Support is offered under renewable, fee based contracts and includes technical support, hardware repair and replacement parts, and software patches, bug fixes, updates, and upgrades. Support and maintenance revenue is initially deferred and recognized ratably over the life of the contract, with the related expenses, including the write down of customer support inventory to its net realizable value, recognized as incurred. Support and maintenance contracts range from one to five years. Unearned support revenue is included in deferred revenue.
Professional service revenue primarily consists of fees we earn related to installation. While installation services are not contractually mandatory, customers occasionally purchase such services. We generally recognize
86
Table of Contents
revenue from installation services upon delivery or completion of performance. Installation services are typically short term in nature. To date, revenue arising from installation services has been insignificant.
We report revenue net of sales taxes. Shipping charges billed to customers are included in product revenue and the related shipping and handling costs are included in cost of product revenue.
Our offering consists of hardware products containing software components that function together to provide the essential functionality of the product. Therefore, our hardware products (inclusive of the core software) are considered non-software deliverables and are not subject to industry-specific software revenue recognition guidance.
Our product revenue also includes revenue from the sale of stand-alone software products. Stand-alone software may operate on our hardware product, but is not considered essential to the functionality of the hardware and is subject to the industry-specific software revenue recognition guidance.
Our typical multiple element arrangement includes hardware product (including the essential software) and support. We may also sell stand-alone software as part of our multiple element arrangements. We consider each of these deliverables to be separate units of accounting based on whether the delivered items have stand-alone value. We have determined that each unit of accounting has stand-alone value because they are sold separately by us or, for hardware products, because the customers can resell them to others on a stand-alone basis.
For certain arrangements with multiple deliverables, we allocate the arrangement fee to the non-software element based upon the relative selling price of such element and, if software and software-related elements such as support for the software element are also included in the arrangement, we allocate the arrangement fee to those software and software-related elements as a group. After such allocations are made, the amount of the arrangement fee allocated to the software and software-related elements is accounted for using the residual method. When applying the relative selling price method, we determine the selling price for each element using vendor-specific objective evidence, or VSOE, of selling price, if it exists, or if not, third-party evidence, or TPE, of selling price, if it exists. If neither VSOE nor TPE of selling price exist for an element, we use our best estimated selling price, or BESP, for that element. The revenue allocated to each element is then recognized when the basic revenue recognition criteria are met for that element.
When an arrangement includes stand-alone software products and related support, under the software revenue recognition guidance, we use the residual method to recognize revenue when a product agreement includes one or more elements to be delivered at a future date and VSOE of the fair value of all undelivered elements exists. In the majority of our contracts, the only element that remains undelivered at the time of delivery of the product is support services. Under the residual method, the VSOE of fair value of the undelivered elements is deferred and the remaining portion of the contract fee is recognized upfront as product revenue. If evidence of the VSOE of fair value of the undelivered elements does not exist, all revenue is deferred and recognized at the earlier of (i) delivery of those elements occurs or (ii) when fair value can be established unless support services is the only undelivered element, in which case, the entire arrangement fee is recognized ratably over the contractual period of the support services.
VSOE of fair value for elements of an arrangement is based upon the normal pricing and discounting practices for those deliverables when sold separately. In determining VSOE, we require that a substantial majority of the selling prices for a deliverable fall within a reasonably narrow pricing range, evidenced by a substantial majority of such historical stand-alone transactions falling within a reasonably narrow range.
We are not able to determine TPE for our products or services. TPE is determined based on competitor prices for similar deliverables when sold separately. Generally, our go-to-market strategy differs from that of our peers and our offerings contain a significant level of differentiation such that the comparable pricing of products with similar functionality cannot be obtained. Furthermore, we are unable to reliably determine what similar competitor products’ selling prices are on a stand-alone basis.
87
Table of Contents
When we are unable to establish the selling price of our deliverables using VSOE or TPE, we use BESP in our allocation of arrangement consideration. The objective of BESP is to determine the price at which we would transact a sale if the product or service were sold on a stand-alone basis. We determine BESP for the purposes of allocating the arrangement by reviewing market factors including, but not limited to, pricing practices including discounting, the geographies in which we offer our products and services, and the type of customer (i.e., channel or end-user). Additionally, we consider historical transactions, including transactions whereby the deliverable was sold on a stand-alone basis.
Deferred revenue consists of billings or payments received in advance of revenue recognition and primarily relate to support and maintenance. Deferred revenue that will be recognized during the twelve-month period following the balance sheet date is recorded as current deferred revenue and the remaining portion is recorded as noncurrent.
Inventories
Inventories consist primarily of raw materials related to component parts and finished goods. Finished goods include both inventory held for sale, service inventory held at third-party service inventory depots in support of customer support agreements, and customer evaluation inventory.
Inventory values are stated at the lower of cost (on a first in, first out method), or market value. A provision is recorded to adjust inventory to its estimated realizable value when inventory is determined to be in excess of anticipated demand or obsolete. Specifically, service inventory is written down to its net realizable value based upon the estimated loss of utility starting from the date the customer support inventory is placed in the third-party service inventory depots; and customer evaluation inventory is reviewed and reserved for excess and obsolescence.
We use significant judgment in establishing our forecasts of future demand within a specific time horizon and obsolete material exposures. These estimates depend on our assessment of current and expected purchases from our customers, product lifecycle and development plans and current sales levels. If actual market conditions are less favorable than those projected by management, which may be caused by factors within and outside of our control, we may be required to increase our inventory write-downs, which could have an adverse impact on our gross margins and profitability.
Income Taxes
Income tax expense is an estimate of current income taxes payable in the current fiscal year based on reported income before income taxes. Deferred income taxes reflect the effect of temporary differences and carryforwards that we recognize for financial reporting and income tax purposes.
We recognize income taxes under the asset and liability method. We recognize deferred income tax assets and liabilities for the expected future consequences of temporary differences between the financial reporting and tax bases of assets and liabilities. These differences are measured using the enacted statutory tax rates that are expected to apply to taxable income for the years in which differences are expected to reverse. We recognize the effect on deferred income taxes of a change in tax rates in income in the period that includes the enactment date.
We record a valuation allowance to reduce our deferred tax assets to the net amount that we believe is more likely than not to be realized. We consider all available evidence, both positive and negative, including historical levels of income, expectations and risks associated with estimates of future taxable income, and ongoing tax planning strategies in assessing the need for a valuation allowance. Realization of deferred tax assets is dependent upon the generation of future taxable income, if any, the timing and amount of which are uncertain. Due to the history of losses we have generated in the past, we believe that it is more likely than not that the deferred tax assets will not be realized as of January 31, 2017. Accordingly, we have recorded a full valuation allowance on our net deferred tax assets.
88
Table of Contents
We recognize tax benefits from uncertain tax positions only if we believe that it is more likely than not that the tax position will be sustained on examination by the taxing authorities based on the technical merits of the position. We make adjustments to these reserves when facts and circumstances change, such as the closing of a tax audit or the refinement of an estimate. The provision for income taxes includes the effects of any reserves that are considered appropriate, as well as the related net interest and penalties.
We expect to permanently reinvest undistributed earnings in foreign subsidiaries outside of the United States to fund future foreign operations. We project that we will have sufficient cash flow in the United States and will not need to repatriate the foreign earnings to finance our domestic operations. If we were to distribute these earnings to the United States, we would be subject to U.S. income taxes, less any allowable foreign tax credits, and foreign withholding taxes. We have not recorded a deferred tax liability on any portion of our undistributed earnings in foreign subsidiaries. If we were to repatriate these earnings to the United States, any associated income tax liability would be insignificant.
We believe that we have adequately reserved for our uncertain tax positions, although we can provide no assurance that the final tax outcome of these matters will not be materially different. To the extent that the final tax outcome of these matters is different than the amounts recorded, such differences will affect the provision for income taxes in the period in which such determination is made and could have a material impact on our financial condition and operating results. The provision for income taxes includes the effects of any reserves that we believe are appropriate, as well as the related net interest and penalties.
Stock-Based Compensation
Stock Options
Stock-based compensation expense is measured and recognized in the financial statements based on the fair value of the awards granted. The fair value of a stock option is estimated on the grant date using the Black-Scholes option-pricing model. Stock-based compensation expense is recognized, net of estimated and actual forfeitures, over the requisite service period of the awards, which is generally four years.
Our use of the Black-Scholes option-pricing model requires the input of highly subjective assumptions, including the fair value of the underlying common stock, expected term of the option, expected volatility of the price of our common stock, risk-free interest rates, and the expected dividend yield of our common stock. The assumptions used in our option-pricing model represent management’s best estimates. These estimates involve inherent uncertainties and the application of management’s judgment. If factors change and different assumptions are used, our stock-based compensation expense could be materially different in the future.
These assumptions and estimates are as follows:
| • | Fair Value of Common Stock. Because our common stock is not yet publicly traded, we must estimate the fair value of common stock. See further discussion in “Common Stock Valuations” below. |
| • | Expected Term. The expected term of the options is calculated as the midpoint between the average vesting period and the contractual term of the option grants. |
| • | Expected Volatility. Since our common stock is currently not publicly traded, and therefore, no historical data on volatility of our stock is available, the expected volatility is based on an average of the historical volatility of a group of comparable publicly traded companies in similar industries over a period equivalent to the expected term of the options. |
| • | Risk-Free Interest Rate. The risk-free rate that we use is based on U.S. Treasury zero-coupon issues with remaining terms similar to the expected term of the options. |
| • | Dividends. We have never declared or paid any cash dividends and do not plan to pay cash dividends in the foreseeable future and, therefore, we used an expected dividend yield of zero in the valuation model. |
89
Table of Contents
We will continue to use judgment in evaluating the assumptions related to our stock-based compensation on a prospective basis. As we continue to accumulate additional data related to the historic optionee exercise and termination behavior and to our common stock value, we may have refinements to our estimates, which could materially impact our future stock-based compensation expense.
We have granted stock awards with a service condition only, which stock-based compensation expense is recognized using straight-line method over the requisite service period of the awards. As of April 30, 2017, we had a total of approximately $28.6 million of unrecognized stock-based compensation expense related to stock awards with a service condition only, which is expected to be recognized over a weighted-average period of 2.4 years.
In May 2017, we repriced each outstanding and unexercised stock option held by current service providers with an exercise price in excess of $13.68 per share (each, an “Eligible Option”), to a new exercise price of $13.68 per share, which is no less than the fair value of our common stock as determined by our compensation committee on the date of repricing. Eligible Options covering 3,291,783 shares of our common stock with a weighted average exercise price of $24.31 were repriced on May 30, 2017. The incremental stock based compensation expense related to this repricing is $7.3 million, of which $2.6 million is recorded on the date of repricing, and the remaining $4.7 million will be recognized over 2.5 years.
Restricted Stock Units
Stock-based compensation expense is measured and recognized in the financial statements based on the fair value of our common stock on the date of the grant. Stock-based compensation expense is recognized, net of estimated and actual forfeitures, over the requisite service period of the award, and upon performance conditions being met. As of April 30, 2017, we had a total of approximately $32.6 million of unrecognized stock-based compensation expense, which is expected to be recognized upon vesting and continue through the final vesting date.
Common Stock Valuations
The fair value of our common stock underlying our stock options was determined by our board of directors. The valuations of our common stock were determined in accordance with the guidelines outlined in the American Institute of Certified Public Accountants Practice Aid, Valuation of Privately-Held-Company Equity Securities Issued as Compensation. In the absence of a public trading market, our board of directors, with input from management, exercised significant judgment and considered numerous objective and subjective factors to determine the fair value of our common stock as of the date of each option grant, including the following factors:
| • | contemporaneous valuations performed by unrelated third-party valuation firms; |
| • | the prices, rights, preferences and privileges of our convertible preferred stock relative to those of our common stock; |
| • | the lack of marketability of our common stock; |
| • | our actual operating and financial performance; |
| • | current business conditions and projections; |
| • | our hiring key personnel and the experience of our management; |
| • | our history and the timing of the introduction of new products and services; |
| • | our stage of development; |
| • | the likelihood of achieving a liquidity event, such as an initial public offering or a merger or acquisition of our business given prevailing market conditions; |
90
Table of Contents
| • | the illiquidity of stock-based awards involving securities in a private company; |
| • | the market performance of comparable publicly traded companies; |
| • | recent private stock sales transactions; and |
| • | U.S. and global capital market conditions. |
In valuing our common stock, the fair value of our business, or Enterprise Value, was determined using a guideline publicly traded company analysis of the market approach. The Enterprise Value determined was then adjusted to remove our debt obligations and add back cash and cash equivalents as of the valuation date to arrive at an equity value. In general, the resulting equity value was then allocated to our common stock using a combination of the option pricing method and a probability weighted expected return method. After the equity value is determined and allocated to the various classes of shares, a discount for lack of marketability, or DLOM, is applied to arrive at the fair value of the common stock. The DLOM reflects the lower value placed on securities that are not freely transferable, as compared to those that trade frequently in an established market. With respect to the valuation report that we received in May 2017, the resulting equity value was allocated to our common stock using a probability weighted expect return method and not the option pricing method, and no DLOM was applied, due to proximity to this offering, the lower indicated valuation range of our common stock and the relatively large number of shares of common stock issuable upon conversion of our preferred stock in connection with this offering.
Our assessments of the fair value of the common stock for grant dates between the dates of the valuations were based in part on the current available financial and operational information and the common stock value provided in the most recent valuation as compared to the timing of each grant. For financial reporting purposes, we considered the amount of time between the valuation date and the grant date to determine whether to use the latest common stock valuation or a straight-line calculation between the two valuation dates. This determination included an evaluation of whether the subsequent valuation indicated that any significant change in valuation had occurred between the previous valuation and the grant date.
Once we are operating as a public company, we will rely on the closing price of our common stock as reported by The NASDAQ Global Market on the date of grant to determine the fair value of our common stock.
Based on the assumed initial public offering price per share of $11.50, the midpoint of the price range set forth on the cover page of this prospectus, the aggregate intrinsic value of our outstanding stock awards as of April 30, 2017 was $16.5 million, of which $4.5 million related to vested awards and $12.0 million related to unvested awards.
Recent Accounting Pronouncements
In August 2016, the Financial Accounting Standard Board (FASB) issued Accounting Standards Update (ASU) No. 2016-15, Classification of Certain Cash Receipts and Cash Payments. The standard provides new authoritative guidance addressing eight specific cash flow issues with the objective of reducing the existing diversity in practice in how certain transactions are presented and classified in the statement of cash flows. The standard is effective for us in the first quarter of fiscal year 2019. We are still evaluating the impact the adoption of this standard will have on our consolidated financial statements.
In March 2016, FASB issued ASU No. 2016-09, Compensation—Stock Compensation: Improvements to Employee Share-Based Payment Accounting. The standard simplifies several aspects of the accounting for employee share-based payment transactions, including the income tax consequences, accounting for forfeitures, and classification of excess tax benefits on the statement of cash flows. The standard became effective for us in the first quarter of fiscal year 2018. Adoption of this standard did not have a significant impact on our consolidated financial statements.
91
Table of Contents
In February 2016, FASB issued Accounting Standards Update, or ASU, No. 2016-02, Leases. The standard increases transparency and comparability among organizations by requiring companies to recognize leased assets and related liabilities on the balance sheet and disclose key information about leasing arrangements. This standard is effective for us in the first quarter of fiscal year 2020. We are still evaluating the impact the adoption of this standard will have on our consolidated financial statements.
In November 2015, FASB issued ASU 2015-17, Balance Sheet Classification of Deferred Taxes. The standard requires deferred tax liabilities and assets to be classified as non-current in a classified statement of financial position. ASU 2015-17 was early adopted by us prospectively beginning February 1, 2016 and will immaterially change the classification of our deferred tax assets and liabilities in our consolidated financial statements.
In August 2015, FASB issued ASU 2015-15, Presentation and Subsequent Measurement of Debt Issuance Costs Associated with Line-of-Credit Arrangements, which clarifies the treatment of debt issuance costs from line-of-credit arrangements after adoption of ASU 2015-03. ASU 2015-15 clarifies that the SEC staff would not object to an entity deferring and presenting debt issuance costs as an asset and subsequently amortizing the deferred debt issuance costs ratably over the term of the line-of-credit arrangement, regardless of whether there are any outstanding borrowings on the line-of-credit arrangement. We applied the provisions of ASU 2015-15 retrospectively to the capitalized deferred financing costs related to our SVB revolving line of credit. Adoption of this standard did not significantly impact our consolidated financial statements in the current or previous interim and annual reporting periods.
In July 2015, FASB issued ASU No. 2015-11, Simplifying the Subsequent Measurement of Inventory. The standard requires inventory to be measured at the lower of cost and net realizable value but no longer requires entities to consider replacement cost or net realizable value less an approximately normal profit margin when measuring inventory within the scope of the amendments. This standard became effective for us beginning in the first quarter of fiscal 2018. Adoption of this standard did not have a significant impact on our consolidated financial statements.
In April 2015, FASB issued ASU 2015-03, Simplifying the Presentation of Debt Issuance Costs, which requires that deferred financing costs related to a recognized debt liability be presented in the balance sheet as a direct deduction from the carrying amount of that debt liability, consistent with debt discounts or premiums. The amendments in this ASU are effective for fiscal years beginning after December 15, 2015, and interim periods within those fiscal years. We adopted the provisions of ASU 2015-03 beginning with the interim period ended April 30, 2016, and have applied the provisions retrospectively. ASU 2015-03 does not change the recognition and measurement requirements for debt issuance costs. Adoption of this standard did not significantly impact our consolidated financial statements in the current or previous interim and annual reporting periods.
In August 2014, FASB issued ASU 2014-15, Disclosure of Uncertainties about an Entity’s Ability to Continue as a Going Concern, which defines management’s responsibility to assess an entity’s ability to continue as a going concern, and to provide related footnote disclosures if there is substantial doubt about its ability to continue as a going concern. This standard is effective for us for the annual period of fiscal 2017, and for annual periods and interim periods thereafter. Adoption of this standard did not materially impact our consolidated financial statements.
In May 2014, FASB issued ASU, 2014-09, Revenue from Contracts with Customers. The standard is a comprehensive new revenue recognition model that requires revenue to be recognized in a manner to depict the transfer of goods or services to a customer at an amount that reflects the consideration expected to be received in exchange for those goods or services. In August 2015, FASB issued ASU 2015-14, Revenue from Contracts with Customers, to defer the effective date of ASU 2014-09 by one year to annual reporting periods beginning after December 15, 2017, but permits entities to adopt the original effective date if they choose. This standard will be applied using either the full or modified retrospective adoption methods. We do not plan to early adopt, and
92
Table of Contents
accordingly, we will adopt the new standard in our first quarter of fiscal 2019. We will adopt this new standard using the full retrospective adoption method, and believe impacted areas relate to the deferral of costs to obtain a contract, which are primarily commission expense directly incurred as a result of sales of products and related support, and the allocation of revenue from support and maintenance to products for certain arrangements. The deferral of costs to obtain a contract will result in the related expenses to be recognized at the time of shipment for product revenue and over the estimated period of benefit for support and maintenance revenue.
We have engaged third party service providers to assist in our evaluation and system implementation. Furthermore, we have made and will continue to make investments in systems to enable timely and accurate reporting under the new standard. While we continue to assess the potential impact of the new standard, including the areas described above, we have not yet quantified the impact the new standard may have on our consolidated financial statements.
93
Table of Contents
Overview
Our mission is to provide large organizations and cloud service providers with an enterprise cloud platform that offers public cloud capabilities inside their own data centers and that can also connect to public cloud services.
Our highly-differentiated and extensible enterprise cloud platform combines cloud management software, web services and a range of all-flash storage systems. Our enterprise cloud platform not only delivers many of the benefits of public cloud infrastructure, but also gives organizations the control and functionality they need to run both enterprise and cloud-native applications in their own private cloud. Organizations use our platform as a foundation for their own private clouds—to build agile development environments and run mission-critical enterprise applications. We enable users to guarantee the performance of their organization’s applications, automate common IT tasks to reduce operating expenses, troubleshoot across compute, storage and network, predict their organization’s needs to scale and provide needed elasticity on demand. Our enterprise cloud platform enables organizations to easily scale to support tens of thousands of virtual machines on a single system across multiple hypervisors and containers. Our solution helps our customers optimize infrastructure by significantly simplifying deployment and operations, which can lead to substantial reductions in capital expenditures and operating expenses.
Our enterprise cloud platform is based on the Tintri CONNECT web services architecture, which has similar design characteristics as public cloud architecture—using web services that are easy to assemble, integrate, tear down, reconfigure, and connect to other services. Our CONNECT architecture uses a building-block approach that is predicated on our REST APIs and virtual machine, or VM, and container level abstraction. Through a comprehensive set of proprietary software tool kits and plugins, we enable users to develop customized workflows and to automate their operations. Our CONNECT architecture is based on our virtualization-aware file system that allows an organization to view, manage and analyze application performance and quality of service, or QoS. CONNECT integrates with all major virtualization architectures, including those offered by VMware, Microsoft, Citrix, Red Hat and OpenStack, and can connect with public cloud service providers. Our platform addresses a large variety of use cases, including server virtualization, virtual desktop infrastructure, or VDI, disaster recovery and data protection, and development operations, or DevOps.
We were founded in June 2008 and introduced our first products in March 2011. We focus on large private and public sector organizations and cloud service providers, or CSPs. We had more than 1,300 customers, including seven of the top 15 Fortune 100 companies and 21 of the Fortune 100 companies, which span a diverse set of industry verticals, such as education, financial services and insurance, healthcare, manufacturing and technology, all as of April 30, 2017. Many of our customers continue to purchase from us on an ongoing basis. We define our customers as the end-users who have purchased one or more of our products. Our top 25 customers (as measured by their cumulative orders through January 31, 2017) that have been our customers for at least twelve months have on average cumulatively ordered more than 19x the amount they ordered from us in their first quarter as a customer. We plan to continue to focus on acquiring customers and maximizing their lifetime value through our demonstrated land-and-expand strategy.
We have experienced significant revenue growth, with revenue increasing from $49.8 million in fiscal 2015 to $86.0 million in fiscal 2016 and to $125.1 million in fiscal 2017, representing year-over-year growth of 73% and 45%, respectively, for our two most recent fiscal years. Our revenue increased from $22.9 million in the three months ended April 30, 2016 to $30.4 million in the three months ended April 30, 2017, representing period-over-period growth of 33%. Our net loss was $69.7 million, $101.0 million and $105.8 million in fiscal 2015, 2016 and 2017, respectively, and $30.8 million and $30.7 million in the three months ended April 30, 2016 and 2017, respectively. Our accumulated deficit was approximately $376.0 million as of April 30, 2017.
94
Table of Contents
Industry Background
A key strategic priority for many organizations is to use new digital technologies to transform their existing businesses, drive new business growth and stay ahead of the competition. At the center of this digital transformation is cloud technology.
Cloud technologies are changing how organizations deploy, manage and support the applications that are critical to running their businesses. Organizations require a broad range of cloud technologies in order to address a diverse set of application requirements. They must support applications on-premise, such as enterprise resource planning, or ERP, software and databases, that tend to have predictable usage patterns with stability, reliability, and safety as key requirements. Additionally, there is pressure to modernize other applications by making them cloud native—built to support new services that can be tested and deployed in days or even minutes instead of weeks, updated daily, and scaled in real time. The growth of these cloud-native applications has prompted more organizations to adopt agile development methods for applications that reside within the enterprise perimeter.
Adoption of Private and Public Cloud Solutions to Address Diverse Application Requirements
The conventional IT model, which has been constrained by siloed, costly and inflexible infrastructure, is giving way to cloud architectures that are designed to serve business applications with increased agility, productivity and cost-efficiency. IDC’s CloudView Survey respondents expect their budget for traditional IT, which includes both in-house and outsourced deployments, to decline approximately 18.8% from 2016 to 2018. Enterprises are seeking to deploy cloud technologies through either public cloud alternatives or using on-premise, or private cloud, options.
Enterprises look to cloud architectures for highly scalable and automated services to be delivered on-demand. Many organizations are starting to sample public cloud alternatives from vendors such as Amazon Web Services or Microsoft Azure to enjoy the benefits of greater functionality and scalability and lower capital expenditures. IDC’s CloudView Survey respondents expect their IT budget for public clouds to grow 29.5% from 2016 to 2018. Many organizations also have realized that while public clouds deliver many benefits, it is not the right solution for all problems. Moving applications to public cloud platforms can result in significant migration cost and effort, requiring applications to be recoded, reconfigured, refactored, and reintegrated. In addition, while public cloud infrastructure is able to scale applications with fluctuating demand, the unexpected cost from unpredictable data growth or the cost of a large scale cloud deployment can quickly get out of control.
Private clouds provide many of the benefits of public clouds, such as resource pooling, rapid scaling, automation and self-service, but with superior security, control and flexibility for the organization’s applications. Private clouds give organizations more control over access and usage of their applications, making private clouds ideal for larger organizations or those organizations with strict data, regulatory and governance obligations. Unlike public-cloud solutions, which are designed primarily to support cloud-native applications, private clouds can satisfy the needs of both enterprise and cloud-native applications. Another unique benefit of private cloud is the ability to more easily customize the compute, storage and networking components to best suit the specific requirements of an organization. Moreover, in recent years businesses have significantly increased their use of virtualization and containers to achieve greater infrastructure cost-efficiencies and scale. IDC estimates that by the end of 2020, virtualized instances would represent over 90% of the instances deployed globally. IDC’s CloudView Survey respondents expect their IT budget for the private cloud to grow 51.5% from 2016 to 2018.
Many companies now utilize a combination of public clouds and private clouds. A recent IDC report predicted that more than 85% of enterprise IT organizations will commit to multicloud architectures encompassing a mix of public cloud services, private clouds and hosted clouds by 2018.
Emergence of Enterprise Cloud
The compelling benefits of private clouds and the desire to have access to public clouds give rise to what is generally referred to as an enterprise cloud, which is a cloud infrastructure deployed in an organization’s own
95
Table of Contents
data center with connections to public clouds. An enterprise cloud possesses many of the same benefits and capabilities as a public cloud, including autonomous services, automation, self-service, and analytics, with added control, security, and support for enterprise applications that only a private cloud can provide.
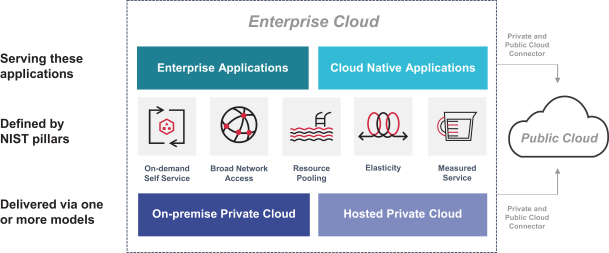
The National Institute of Standards and Technology definition lists five essential characteristics of cloud computing—on-demand self-service, broad network access, resource pooling, rapid elasticity or expansion, and measured services, which are the key attributes of the functionality offered by the enterprise cloud.
| • | On-Demand Self-Service. A consumer of cloud services can automatically provision computing capabilities on an on-demand basis, such as server time and network storage, without requiring IT support. |
| • | Broad Network Access. Capabilities are available over the network and accessed through standard mechanisms that promote use by a wide range of devices, including mobile phones, tablets, laptops, and workstations. |
| • | Resource Pooling. Computing resources are pooled to serve multiple consumers of cloud services using a multi-tenant model, with different physical and virtual resources dynamically assigned and reassigned according to demand. |
| • | Elasticity. Capabilities can be elastically provisioned and released automatically, to scale rapidly outward and inward commensurate with demand. To the consumer of cloud services, the capabilities available for provisioning often appear to be unlimited and can be appropriated in any quantity at any time. |
| • | Measured Service. Cloud systems automatically control and optimize resource use by leveraging a metering capability at the level of abstraction appropriate to the type of service (for example, storage, processing, bandwidth). Resource usage can be monitored, controlled and reported, providing transparency for both the provider and consumer of cloud services. |
With the above functionality, an enterprise cloud can deliver many of the benefits of public clouds and can achieve the desired functionality, scalability and efficiency that organizations need. The enterprise clouds should have the following key characteristics:
| • | Web Services Architecture. An enterprise cloud should be built using building-blocks of interchangeable components that can be easily connected together to create a very large number of useful web services. This design provides a common platform that allows multiple infrastructure components to communicate with each other. Infrastructure systems built this way can be broken down |
96
Table of Contents
| into multiple component web services, so that each of these services can be automated, deployed, modified and then redeployed independently without compromising the operation of the infrastructure. |
| • | Comprehensive Suite of APIs. Enterprise cloud should be based on a comprehensive set of modern, web-based APIs, including REST, that provide developers programmatic access to a wide range of web services and third-party ecosystems. APIs provide the “interface” for information exchange between computer programs. While non-web APIs are structured and rigid, requiring strict programming models, modern APIs designed for cloud are open and flexible. These modern APIs, which are easy to assemble, integrate, tear down, reconfigure, and connect to other services, underpin today’s web services. |
Through APIs, developers can write scripts to automate routine data management tasks and operations. APIs make it possible for web services to be combined and to communicate with one another effectively. APIs break down a large transaction to create a series of small modules. Each module addresses a particular underlying part of the transaction. This modularity provides developers with a high degree of flexibility. Applications constructed using REST APIs are not located on individual storage devices, and therefore infrastructure components can be easily redeployed if something fails and can be scaled to accommodate load changes. This is fundamental to cloud’s on-demand scalability.
| • | Right Level of Abstraction. An enterprise cloud should support VM and container level operations, which provides programmability at the level of individual applications. The VM and container level abstraction allows performance isolation at a granular level. This makes it possible to ensure performance of applications without administrative intervention with automatic, policy-based QoS for performance tiers. The right level of abstraction is a prerequisite to the ability to automate many operational and technical procedures and provide self-service. |
Limitations of Conventional Data Center Infrastructure
While private clouds can deliver many of the benefits of public clouds, we believe that organizations will have difficulty deploying an enterprise cloud platform built using conventional architectures.
Enterprise and cloud-native applications can have widely disparate storage performance requirements, yet conventional storage does not provide performance guarantees for applications. With conventional storage, IT administrators gain little actionable intelligence and find it difficult to preempt issues, optimize VM performance, run health checks and forecast future scale requirements. While many infrastructure components, including server, network and security, have evolved to support virtualized infrastructure and migration to the cloud, innovation in storage has lagged and lacked granular level operation at the VM and container level. As a result, organizations that have deployed next-generation servers, networking and security infrastructure have found it significantly more time-consuming and complex to manage, diagnose and fix performance issues with their conventional storage. Conventional storage architectures use a unique identifier known as a logical unit number, or LUN, to identify and allocate a subset of available physical storage resources. In virtualized environments with conventional storage architectures, multiple VMs are usually mapped to a single storage LUN which are mapped one-to-one to physical hosts running applications. Without VM-level granularity and automatic, policy-based QoS for performance tiers, conventional storage cannot provide each virtualized application its own input and output, or I/O, lane to consistently optimize individual application performance. The reason that conventional storage cannot provide each virtualized application with its own I/O lane is that it is built on an architecture that does not have the granularity to support the one-to-one mapping of VMs to physical infrastructure.
Conventional storage is built using monolithic and inflexible software architectures, grouping applications into LUNs or volumes where they must compete for resources and creating what is referred to as the “noisy neighbor” problem. Change cycles usually end up being tied to one another. Modifications for new features or services require building and testing the existing software code base. Infrastructure development and support
97
Table of Contents
built on this model is slow and cumbersome. Conventional storage LUNs also limit visibility into storage and the applications they serve, and instead aggregate and average metrics over hundreds of virtualized applications. In addition, conventional storage has rudimentary software access that is often limited to basic commands which still dominate conventional data center technologies. As a result, conventional storage is a manual process that is costly and complex to manage. Recent hardware-centric storage products utilizing solid-state devices, or flash, have attempted to address the limitations of conventional storage by simply increasing the speed of the components. However, these products do not solve the fundamental mismatch between conventional and cloud architectures.
The industry has also attempted to bridge the gap between conventional and cloud architecture through hyperconverged infrastructure, or HCI, but that too falls short because HCI systems do not satisfy many cloud requirements. While HCI can support certain applications such as VDI and remote office/branch office, it can struggle to support large scale deployment of enterprise applications. We believe enterprise customers require the ability to support tens of thousands of VMs, which HCI solutions struggle to achieve. Additionally, it can be harder to independently scale resources with HCI systems. This can cause serious problems if future usage growth is unpredictable—if an organization runs out of either compute or storage resources, they would be forced to buy both plus the associated network resources, which adds considerable unnecessary expenses. HCI is also better suited to support a specific application on a system instead of a mix of different applications for which administrators need to create, manage and provision different settings either via manual scripts or with configuration management tools, all complex and time consuming tasks that need to be performed by an IT specialist. Because of these limitations, HCI systems do not meet many of the requirements of an enterprise cloud platform.
Requirements of an Enterprise Cloud Platform
An enterprise cloud platform combines cloud management with storage to simplify the management and operation of enterprise or cloud-native applications. We believe the requirements of an enterprise cloud platform are:
| • | Consistent and Autonomous Quality of Service. Ensures that every enterprise and cloud native application is automatically allocated predetermined levels of storage resources and delivers consistent performance using pre-defined QoS metrics; |
| • | Application Level Insight. Provides actionable, real-time and predictable VM and container level analytics that allow organizations to gain insight into each individual virtualized application’s metrics across storage, network and compute, and troubleshoot underperforming applications; |
| • | Comprehensive Automation Capabilities. Automates the repetitive, routine, and oftentimes error prone steps associated with manually provisioning, configuring, and troubleshooting of ongoing storage management. As an organization scales its infrastructure, automation can help add capacity and performance by automatically optimizing the location of VMs and containers and can ensure desired level of application performance across the infrastructure. The automated workflows significantly reduce the time, cost and manpower associated with ongoing storage management; |
| • | Ease of Deployment and Highly Scalable. Scales easily to 160,000 or more virtual machines to support large virtualized environments, including high-performance enterprise clouds as well as CSPs, all through a single management console that minimizes inefficient and time-consuming manual intervention and simplifies infrastructure scaling; |
| • | Simple Self-service Models. Reduces the need for IT and storage expertise by providing self-service tools and policies that plug into an extensible web services based architecture; |
| • | Private and Public Cloud Integration. Integrates with major virtualization architectures and connects to public clouds; and |
98
Table of Contents
| • | Software-Based Services with Ability to Mix and Match Services. Next-generation architecture that is suitable for multiple underlying hardware configurations, with stand-alone software features tailored to various virtualized environments and their unique requirements. |
Our Solution
Our highly differentiated and extensible enterprise cloud platform combines cloud management software and a range of all-flash storage systems. Organizations use our platform as a foundation for their own private clouds—to build and run agile development environments for cloud-native applications and mission-critical enterprise applications. We enable users to guarantee the performance of their applications, automate common IT tasks to reduce operating expenses, troubleshoot across compute, storage and network, predict an organization’s needs to scale, and provide needed elasticity on-demand. Our enterprise cloud platform enables organizations to easily scale to support tens of thousands of virtual machines on a single system across multiple hypervisors and containers, and to facilitate the migration to public cloud environments. Our solution helps our customers optimize infrastructure by dramatically simplifying deployment and operations, which can lead to significant reductions in capital expenditures and operating expenses.
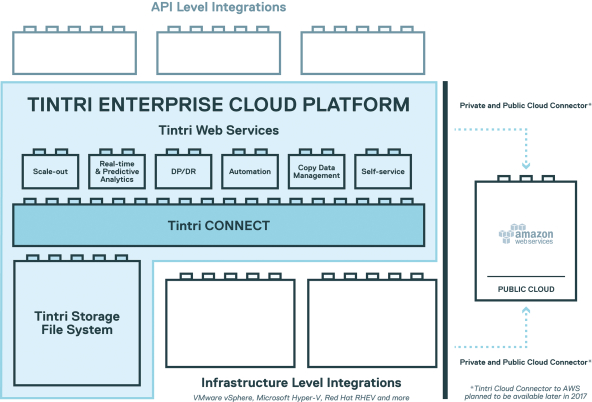
Our enterprise cloud platform is based on the Tintri CONNECT web services architecture, which is designed to work like public cloud architecture—using web services that are easy to assemble, integrate, tear down, reconfigure, and connect to other services. Our CONNECT architecture uses a building-block approach that is predicated on our REST APIs and VM and container level abstraction. Through a comprehensive set of proprietary software tool kits and plugins, we enable customers to develop customized workflows and to automate their operations. Our platform addresses a large variety of use cases, including server virtualization, or VDI, disaster recovery and data protection and DevOps.
99
Table of Contents
The key elements of the Tintri CONNECT architecture are:
| • | Web Services Framework. Most conventional storage does not offer a comprehensive web-services framework. We offer a control pane that supports a set of web services and can connect to existing data center components like compute and network, and that later this year are expected to enable connections to public clouds and other third-party platforms. This approach also allows Tintri to work across multiple hypervisors and beyond hypervisors to containers. Our CONNECT architecture acts as a single, federated and loosely coupled pool of storage resources and intelligently optimizes the location of every application across those pools. This allows organizations to intuitively manage VMs at scale, while providing highly granular control over an entire virtualized environment through a single management console. Our CONNECT architecture is also based on our virtualization-aware file system that allows organization to view, manage and analyze storage performance and quality of service at the application level. |
| • | Comprehensive APIs. Like public cloud services and unlike traditional storage solutions, our solution offers a comprehensive set of APIs, including REST API, PowerShell and Python. APIs are needed to write automation scripts and connect to other elements of infrastructure, and make it possible for web services to be combined and to communicate effectively with other web services. |
| • | Ecosystem Integration. Built-in integration with VMware vCenter and Microsoft Systems Center provides visibility, management and analytics across the entire IT infrastructure, including compute, network and storage. Our solution also supports multiple concurrent hypervisors: VMware vSphere, Microsoft Hyper-V, Citrix XenServer, Red Hat Virtualization and OpenStack. In addition, our solution can be integrated with IBM Cloud Object Storage and Amazon S3. |
Tintri’s enterprise cloud platform addresses the requirements of the modern data center, especially in large and complex environments across multiple hypervisors. By creating an architecture fully aligned with virtualized applications, our enterprise cloud solution provides the following benefits to our customers:
| • | Autonomous Operation—Deliver Consistent Application Performance. Whereas traditional LUN-based storage requires users to manually intervene to manage performance levels, our CONNECT architecture provides automated QoS to help ensure that every application performs as desired. Organizations can set performance minimum and maximum thresholds for individual critical applications to optimize performance, and CSPs can use these capabilities to build and charge for various QoS tiers. |
| • | Analytics—Improve Decisions with Real-time and Predictive Analysis. Our solution allows for deeper visibility into every application, unlike conventional storage that aggregates and averages metrics over hundreds of virtualized applications. With Tintri management software, organizations can see across compute, network and storage and to identify underperforming applications and address the root cause of latency in less time and with less effort. Tintri Analytics uses historical data about application performance to predict an organization’s future needs for capacity and performance for storage and compute. Customers can model “what-if” scenarios to assess the impact of changes before they are implemented. We believe that this degree of accuracy and precision is only possible due to our ability to gather data about individual virtual machines and containers at a granular level. |
| • | Automation—Simplify Development and Management at Scale. Our solution is easy to install, configure and manage. Most installations of our systems take less than 60 minutes and can be deployed entirely by the customer at a greatly reduced cost without our field engineers and support staff. By contrast, conventional storage LUNs generally require specialized storage expertise or third-party software to manage and operate. Our customers automate the provisioning of storage and application of policies, including replication, quality of service, snapshots and more. Our APIs and proprietary toolkits greatly reduce the time and cost of ongoing storage management. As customers’ storage requirements grow, our storage products act as a single, federated and loosely coupled pool of storage capacity, allowing customers to add capacity and performance by automatically optimizing the location |
100
Table of Contents
| of every virtual machine and container across their storage infrastructure. Organizations can manage up to 160,000 virtual machines from one central console. We believe some of our customers can reduce the time spent on storage administration by up to 95% compared to the time required to manage a conventional, LUN-based system meeting the same storage requirements. |
| • | Self-service—Remove Dependencies on IT to Accelerate Business. Using our self-service tools, IT generalists in the data center, or non-IT staff members in a business unit, can administer our platform to simplify tasks such as requesting capacity, performance, policies and other actions. For example, it is possible to integrate our solution with Slack and other messaging tools, as well as Amazon Alexa and other automatic speech recognition and natural language understanding engines allowing IT staff to send chat requests to their Tintri enterprise cloud, including requesting capacity, performance, policies and other actions. Each user can be permissioned to ensure the integrity of the infrastructure and our solution makes decisions that optimize the environment. |
| • | Support and Manage Complex Environments Using an Open and Versatile Architecture. Our solution’s open architecture natively supports all major virtualization architectures and can connect with public cloud service providers, making it an ideal solution for complex enterprise and cloud environments. Moreover, our solution is simple to operate, allowing users to optimize the performance of multiple workloads from a diverse set of applications via a single pane of glass. |
| • | Provide Customers with Software-Based Choice. Our software allows organizations to choose the specific features such as replication, encryption, cloning, snapshots and predictive analytics based on relevance to their unique deployments. For example, enterprises implementing a virtual desktop infrastructure will have different needs than customers deploying software testing and development environments. We are thus able to configure software solutions to meet the specific needs of various customers, as opposed to loading our storage solution with numerous unused features built with the typical use case in mind. |
We believe that our highly differentiated solution delivers compelling value for virtualized organizations over conventional data center architectures.
Market Opportunity
Our enterprise cloud platform solution and software products address the key enterprise cloud requirements, and deliver them through a mix of on-premises storage hardware, value-added storage software and SaaS-based software services for virtualized environments.
We participate in the global virtualized x86 storage systems market, which according to IDC is expected to grow from $25.7 billion in 2017 to $27.0 billion in 2018, and the virtualized x86 storage software market, which according to IDC is expected to grow from $9.5 billion in 2017 to $10.4 billion in 2018.
To address the global virtualized x86 storage systems and software market opportunity, which according to IDC is expected to be $37.4 billion in 2018, Tintri taps into the following demand drivers:
| • | Adoption of Virtualization-Centric Storage Systems. Our solution is purpose-built for virtualized server environments that utilize IP-based protocols, which is a subset of the broader storage segment for virtualized server environments. IDC expects the subset of the storage segment for virtualized x86 server environments which are based on IP protocols, which we define as NAS and iSCSI combined, to grow from $7.1 billion in 2017 to $7.4 billion in 2018. |
| • | Move to Flash-Based Storage. The ongoing adoption of virtualized and cloud environments is increasing demand for higher performance storage hardware, such as the flash-based hardware we utilize in our solution. IDC expects the all-flash array storage market to grow from $5.8 billion in 2017 to $6.8 billion in 2018. |
101
Table of Contents
| • | Use of Primary Storage Platforms for Data Protection and Recovery. Data protection and disaster recovery software for enterprises increasingly leverages primary storage snapshot technology as an important component of data protection, and have also begun using public clouds as back-up storage. IDC forecasts that the market for disk-based data protection and recovery will grow from $15.5 billion in 2017 to $16.1 billion in 2018. |
Our enterprise cloud solutions allow us to capture spend from the following markets (some of which may overlap with the above listed storage systems and software market segments), which have an estimated combined spend of $27.2 billion in 2018, according to IDC:
| • | The spend on storage hardware deployed in private clouds, which is expected to be $7.8 billion; |
| • | The spend on storage software deployed on-premise, which is expected to be $15.5 billion; and |
| • | The spend on cloud systems management software deployed on-premise, which is expected to be $3.9 billion. |
Our Competitive Strengths
We believe we have competitive strengths that will enable us to maintain and expand our position in the enterprise cloud market, including:
| • | Our Solution Is Purpose-Built for Enterprise Cloud. Conventional storage is designed to accommodate both virtualized and physical workloads. As a result, conventional storage architecture continues to be built on LUNs and volumes, outdated technology that serves physical workloads but is poorly suited for virtualized and cloud environment. Our platform, similar to public cloud environments, operates as a set of services that allow our storage solution to integrate and communicate with other infrastructure elements, including public clouds, as building-blocks. Our solutions’ ability to monitor and manage at the individual VM and container level is central to our ability to deliver differentiated value to customers. Since 2008, we have spent over 400 person years to develop solutions purpose-built for enterprise cloud environments. We believe that our competitors would need to materially re-architect their products’ hardware and software to provide similar functionality. |
| • | Our Value Stems from Highly Differentiated Software. For Tintri, hardware is the delivery vehicle for our uniquely designed Tintri CONNECT architecture and value-add software. Tintri CONNECT operates at the individual VM and container level, which unlocks the potential of our software and makes it possible for customers to, for example, guarantee application performance by automatically optimizing system resources; move and protect data, and trouble shoot at VM and container level; predict future performance and capacity growth; and provide VM and container level visibility across the entire infrastructure. We believe we can offer the most differentiated software when it is tightly coupled with Tintri hardware. |
| • | Our Customers Purchase Our Software Products Incrementally. We deliver advanced stand-alone software products that our customers often buy separately or as part of a suite to enhance their deployments. These software products offer advanced storage capabilities, such as data protection, disaster recovery, scale-out, data security, lifecycle management and business analytics, in a simple, easy to deploy method. This results in less time and money being spent on their deployment and operation. Our customers may buy these products incrementally or as part of a suite on an as-needed basis and configure their solutions to their specific enterprise environment requirements. We believe that by offering our customers this flexibility, we provide them with differentiated value, thereby enabling us to drive incremental product sales. |
| • | We Offer Our Customers the Ability to Balance Private Cloud and Public Cloud Deployments. We enable organizations to achieve the right mix of private and public cloud deployments to meet their objectives. These organizations value the promised functionality of public clouds, but not all workloads are suited for public clouds—many enterprise and even cloud native applications will benefit from |
102
Table of Contents
| more predictable costs and performance when run from an enterprise data center or cloud service provider. Our architecture offers the benefits of public clouds to those workloads that best reside in the enterprise data center. Moreover, our REST API-based architecture ensures storage works as a building-block that can integrate and communicate with other infrastructure elements. Later this year, we plan to offer connector software that is designed to connect the private cloud with public clouds. Competitive alternatives do not offer comprehensive APIs that enable full automation, serve as a building-block, or simplify connections to public clouds. In this way, Tintri also helps bridge an organization’s investment in its data center and private cloud, delivering benefits of public cloud storage solutions. |
| • | We Successfully Sell Enterprise Cloud to Large Organizations and CSPs. We sell to a growing list of large organizations and CSP customers. Our continued focus on these types of customers allows us to deliver solutions that simplify these customers’ enterprise cloud deployment to support both cloud native and enterprise applications while significantly reducing their capital expenditure and operating expenses compared to both public cloud and conventional storage solutions. Our value proposition to these customers is particularly compelling given that these organizations have large data centers with complex requirements and can benefit the most from self-service, automated workflows, predictive analytics and guaranteed application performance through autonomous operation. Our enterprise cloud is also connected to public clouds in addition to its deep integration with a diverse set of third party ecosystems. |
| • | Our Partners Offer Value-Added Solutions and Services. Our partners help bring value to our platform by offering differentiated solutions and services that are tightly integrated with our architecture and software solutions. For example, partners leverage our platform to build cloud services, delivering our value proposition to DevOps and lines of business that typically engage less with infrastructure buying decisions. Our partners also use our APIs to offer customers differentiated automation and orchestration services. This allows us to position our partners as strategic advisors for our customers. |
Our Growth Strategy
We intend to extend our position as a leader in providing enterprise cloud solutions to large organizations and CSPs. Key elements of our growth strategy include:
| • | Extend Our Differentiation in Enterprise Cloud through Continued Software Innovation. We provide large organizations and CSPs with an enterprise cloud platform that offers public cloud functionality inside their own data centers. We plan to continue to invest in enhancing our CONNECT architecture and our enterprise cloud platform, and extending our portfolio of software products. Furthermore, we intend to make it even easier to integrate our products with the ecosystem of private and public cloud technologies. Finally, we intend to continue to offer our solution with logical bundles of software and hardware for specific use cases, thereby driving cross-selling and attach rates. |
| • | Pursue Additional Large Organizations and CSPs. Our solution has been deployed by large organizations, including seven of the top 15 Fortune 100 companies and 21 of the Fortune 100 companies, all as of April 30, 2017. In fiscal 2017, approximately 57% of our revenue was derived from sales to enterprise customers, which we define as federal agencies and organizations with more than 1,000 employees, approximately 12% of our revenue was derived from sales to our CSP customers and approximately 31% of our revenue was derived from sales to our other customers. We intend to continue our sales efforts to further penetrate the Global 2000 enterprises and CSPs with the most demanding workloads and complex cloud requirements. We intend to continue to use our differentiated value proposition to sell to senior decision makers responsible for cloud strategy. |
| • | Leverage Line-of-Business Buyers to Accelerate Adoption. Many line-of-business buyers have their own IT budgets and are driven to adopt new technologies quickly in order to accelerate time to market |
103
Table of Contents
| and achieve greater business agility. We have had success in selling our enterprise cloud platform to buyers in line-of-business roles, including those involved in DevOps, test and development, quality assurance, and application development. We intend to continue to focus on selling to line of business buyers and leverage those relationships to sell more broadly within their organizations. |
| • | Increase Sales to Installed Base. We intend to continue expanding our footprint with our existing customers by supporting additional use cases and selling additional software products. Tintri Analytics enables customers to project when they will need to procure additional storage and compute for capacity and performance. On average as of January 31, 2017, customers who have been our customers for at least twelve months have spent over the course of their relationship with us 3x the amount they ordered from us in their first quarter as a customer. Business from our existing customer base has grown from 48% of our revenue in the year ended January 31, 2015 to 51% of our revenue in the year ended January 31, 2016 to 65% of our revenue in the year ended January 31, 2017. Business from our existing customer base was 80% of our revenue in the three months ended April 30, 2017. As of April 30, 2017, more than 39% of our customers subscribed for Tintri Analytics. We also intend to highlight additional uses for our solution, including Data Protection and Disaster Recovery, to expand our total addressable market. |
| • | Expand Sales and Marketing Presence in New and Existing Markets. We intend to add customers in new geographies. In particular, we plan to sell in new and existing markets and that we expect will be interested in our enterprise cloud value proposition, including territories in the Middle East, Asia and Europe. In addition to expanding our sales function and our global network of channel partners, we intend to carry out associated marketing activities in key geographies. |
| • | Support Value-Add Channel Partners. As of April 30, 2017, Tintri had 388 global channel partners and we intend to continue to add to our channel partner network in order to reach additional prospective customers. We expect to focus our efforts on supporting those partners offering cloud services, including infrastructure “stacks” that include our solutions. We believe that close collaboration on automation, orchestration and other services can be leveraged to grow awareness of our offerings and impact in customer organizations. |
| • | Expand and Deepen Technology Partnerships and Integrations. We intend to expand and deepen our relationships with leading technology companies. We expect to continue to work closely with our partners to achieve certifications and integrations that make it easier for customers to deploy our solutions in their IT infrastructures and in concert with public clouds. We intend to seek additional partnerships that will allow us to address new customer use cases and deployments. |
104
Table of Contents
Our Products and Technologies
Tintri Enterprise Cloud Platform
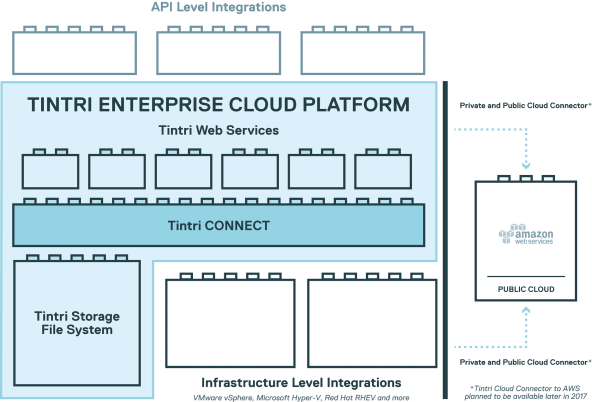
The Tintri enterprise cloud platform consists of our proprietary Tintri CONNECT architecture, Tintri software and Tintri storage systems. Combined with a customers’ choice of server, network hardware and virtualization or cloud infrastructure software, we provide organizations the benefits of public clouds within their own data center.
Tintri CONNECT Architecture
Tintri CONNECT is a proprietary software architecture purpose-built for virtualized and cloud applications. The Tintri CONNECT architecture powers our complete range of Tintri systems and is the platform on which we offer a diverse set of Tintri software solutions. Specifically, Tintri CONNECT architecture is based on web services and uses the virtual machine or the container as the basis for all storage services down to the lowest levels of the hardware. This allows for all storage actions and analytics to operate at the VM and container level, including QoS, replication, cloning, snapshots and other key policies. Each Tintri array appears as a single pool of storage called a datastore, rather than as a collection of LUNs and volumes. Even our largest capacity array appears as a single large datastore to virtualization and cloud management tools, and can support multiple concurrent virtualization or cloud environments without partitioning. Through tight integration between Tintri CONNECT and third party virtualization and cloud management systems, Tintri CONNECT is able to eliminate many of the storage objects used by conventional storage providers to interact with virtualized environments, such as disk constructs, volume sizes, redundant array of independent disks and other storage mechanics. Tintri CONNECT, through its VM and container level visibility, can greatly simplify the interaction between the virtualized infrastructure, the applications running on that infrastructure, and the underlying storage serving that infrastructure.
105
Table of Contents
Tintri CONNECT also incorporates a number of data protection and high availability features, including protection against double-drive failures, failed drive rebuild even under data read-error scenarios and real-time error correction. Tintri CONNECT employs advanced data deduplication and compression to its all-flash capacity to maximize space savings and performance, as well as technologies that ensure long service life to its flash drives. Certain models of our all-flash systems enable the user to install an expansion kit to double their flash capacity with a single click.
Other features of the Tintri CONNECT architecture include:
| • | Performance. Tintri CONNECT assigns each application its own I/O lane using patented algorithms to isolate each application and eliminate the competition for resources. Customers can also set minimum and maximum thresholds to define specific QoS levels either on a per-application basis or on a managed policy basis. |
| • | Analytics. Tintri CONNECT provides detailed real-time analytics on every application, including latency, throughput and input/output operations per second, or IOPS, across compute, network and storage, for a complete view of application performance. |
| • | Automation. Like public cloud services and unlike traditional storage solutions, our solution is built using REST APIs. REST APIs are needed to write automation scripts and connect to other elements of infrastructure, and make it possible for web services to be combined and to communicate with other services effectively. |
| • | Management. Our CONNECT architecture acts as a single, federated and loosely coupled pool of storage resources. Our customers can now grow from 17 terabytes up to 10 petabytes and 160,000 virtual machines without additional IT staff. |
| • | Ecosystem Integration. Tintri CONNECT enables customers to run multiple hypervisors, including those offered by Microsoft, Citrix, Microsoft, Red Hat, VMware, and cloud solutions such as OpenStack and containers, concurrently on a single storage system without partitioning their storage. Tintri CONNECT supports containers that run within virtual machines, or through our support for vSphere Integrated Container, or VIC. |
Tintri Software
Tintri software leverages the level of abstraction provided by the Tintri CONNECT architecture to provide additional, differentiated functionality. Individual Tintri software includes:
Tintri OS
Tintri OS, through its VM-level visibility capabilities, can greatly simplify the interaction between the virtualized infrastructure and the VM running on top of it, and the underlying storage serving that infrastructure. Rather than aggregating virtualized applications with various QoS requirements into a shared LUN, Tintri OS can assign each application its own I/O lane using patented algorithms and eliminate the competition between virtualized applications for resources. A storage administrator can also set minimum and maximum thresholds at the virtualized-application level to define specific QoS levels. Tintri OS incorporates a number of data protection and high availability features, including protection against double-drive failures, failed drive rebuild even under data read-error scenarios and real-time error correction.
Tintri Global Center
Tintri Global Center is an intelligent data and system management product that assists administrators in policing their infrastructure, simplifying capacity planning, visualizing resource utilization, reducing bottlenecks in the IT network outside of the storage system, and simplifying policy management and enforcement. Customers can collect, display and act on real-time analytics across up to 160,000 virtual machines over multiple data center locations.
106
Table of Contents
VM Scale-out
Tintri Global Center Advanced product adds our VM Scale-out software which creates resource pools of Tintri storage systems and intelligently optimizes the location of every application across those pools. The software uses machine learning that factors in the cost of moving applications and their performance requirements in optimizing the Tintri footprint.
Tintri Analytics: Predictive Analytics
In addition to our real-time and historical analytics capabilities, which are integrated into the Tintri CONNECT architecture and available to all customers on-premises, we also offer predictive analytics that uses in-memory big data technologies, such as ElasticSearch, to help customers model their current and future storage requirements.
ReplicateVM: Replication for Data Protection and Disaster Recovery
We offer support for array-level replication, including asynchronous and synchronous modes. Asynchronous replication supports one-to-one, many-to-one and one-to-many with recovery point objectives, or RPO, as low as 15 minutes. Synchronous replication offers zero RPO. Traditional replication operates at the LUN level, leading to “hitchhikers,” which are VMs that are unintentionally replicated because they share a LUN with an application that is targeted for replication, wasting overall storage capacity. ReplicateVM allows our customers to replicate only the intended VMs. ReplicateVM also allows each VM to have a unique replication policy, and customers can set standard policies for VMs that are preserved even when they migrate between VMstores. In addition, by operating at the VM level and offering compression and deduplication of data, ReplicateVM reduces WAN bandwidth and other data transfer requirements.
SyncVM: Copy Data Management
We allow the flexible use of fast and storage-efficient VM snapshots. Storage administration teams can recover point-in-time snapshots of individual VMs and rapidly restore files based on those snapshots. Application development teams can update multiple child-clones of applications from a master application image, reducing time required to set up a new application environment. We also offer advanced snapshot management for copy data management, allowing flexible point-in-time recovery for applications, file level restore from snaps and update of child applications from a master application snapshot for testing and development, or test/dev, and DevOps use cases.
SecureVM: Encryption of data-at-rest
We offer built-in encryption for data-at-rest, and support manual key rotation and SafeNet enterprise key management (a separate product sold by a third-party vendor). With SecureVM, the encryption key can be rotated by the customer, assuring that data on physical drives is unrecoverable if a key or physical drive is compromised. This capability allows many of our customers in finance, health care, government and other industries to meet data protection and regulatory requirements.
Tintri Cloud Connector
Tintri Cloud Connector, which we plan to make generally available later this year, has been designed to allow customers to use either public cloud storage such as Amazon S3 or an on-premises object storage such as IBM Cloud Object Storage (formerly CleverSafe) for storing snapshots to extend retention periods and provide another tier of data protection and locality.
107
Table of Contents
Tintri Software Suite
This suite includes Tintri Global Center Advanced (delivering Tintri VM Scale-out software), ReplicateVM, SyncVM, SecureVM, Tintri Cloud Connector, plus all the tool kits and plug-ins to a diverse set of third-party ecosystems including VMware, Microsoft, RedHat and OpenStack. It also includes Tintri API support for PowerShell, Python and REST API.
Tintri Ecosystem
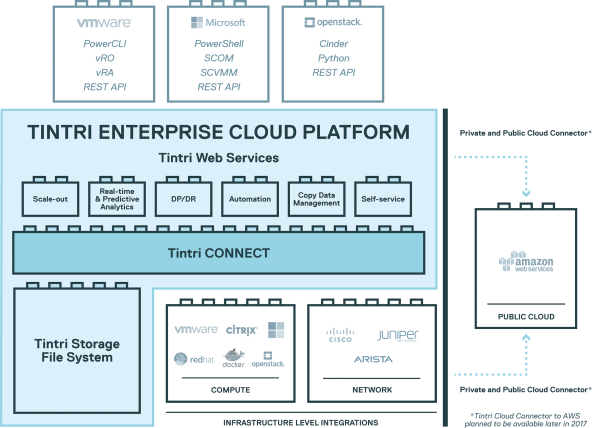
Our ecosystem partners and integration points extend the value of the Tintri enterprise cloud platform for our customers, and include:
| • | VMware. Includes support for vSphere, Horizon with View, PowerCLI, vRealize Orchestrator, vRealize Operations, vRealize Automation, vCloud Director and vSphere Integrated Containers, and deep integration with many other VMware solutions; |
| • | Microsoft. Includes support for Hyper-V, System Center Virtual Machine Manager (SCVMM), System Center Operations Manager (SCOM), PowerShell, Microsoft Applications (Exchange, SQL Server, SharePoint, etc.) and Server Message Block 3 (SMB3); |
| • | Red Hat. Includes support for Red Hat OpenStack and Red Hat Virtualization; |
| • | Citrix. Includes support for XenDesktop, Unidesk and XenServer; |
| • | Cisco. Includes support for UCS Director; and |
| • | OpenStack. Includes support for commercial OpenStack distributions as well as open-source OpenStack beginning with the “Liberty” release. |
108
Table of Contents
Other partners include Arista, Brocade, CommVault, Docker, IBM Cloud Object Storage, Intel, Juniper, Mirantis, Oracle and Veeam. Scripting support includes PowerShell, PowerCLI, Python SDK and APIs.
Tintri Storage Systems
We market a range of enterprise-grade storage systems that run our proprietary Tintri CONNECT architecture. Our Tintri VMstore T5000 all-flash systems provide all-flash capacity in a two rack unit form factor for the most challenging enterprise workloads. Our VMstore T800 hybrid-flash systems serve typical enterprise workloads, while providing performance comparable to all-flash systems with the intelligent use of both all-flash and disk-based storage, delivering on average more than 96% of I/O operations from flash. The deep integration of our Tintri Storage Systems with our Tintri CONNECT architecture is what delivers our essential Tintri enterprise cloud platform capabilities.
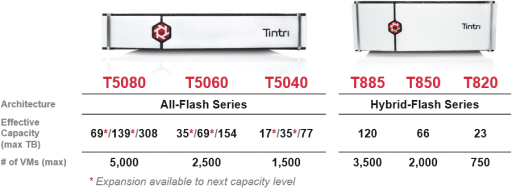
We also offer two bundles of our storage systems for cloud use cases. Tintri Cloud Foundation combines four T5080 with maximum capacity plus the complete Tintri Software Suite to deliver over 1PB of effective capacity in 8U for cloud applications. Tintri Cloud Ultimate combines 32 T5080 with maximum capacity plus Tintri Software Suite to deliver up to 10PB of effective capacity in 64U.
Our Customers
Our customers include leading enterprises across a broad range of industry segments, including education, financial services and insurance, healthcare, manufacturing and automotive and technology, as well as CSPs. Our customer base consisted of more than 1,300 customers, including seven of the top 15 Fortune 100 companies and 21 of the Fortune 100 companies, all as of April 30, 2017.
109
Table of Contents
The following is a list of representative customers organized by industry segment, each of whom has purchased $150,000 or more of our products on a cumulative basis from inception through April 30, 2017:
| Cloud Service Providers Clouditalia Telecomunicazioni Green Cloud Technologies Nexinto NTT Comware |
Education University of Arkansas University of California, Irvine University of Notre Dame University of Southampton | |
| Financial Services and Insurance The Carlyle Group European Investment Bank Mizuho Securities USA Raymond James Financial |
Healthcare Edward Hospital and Health Services Miami Children’s Hospital Orlando Health South Eastern Health & Social Care Trust | |
| Manufacturing and Automotive Flex MillerCoors |
Media and Entertainment ITV Sony Computer Entertainment | |
| Technology Advanced Micro Devices Garmin F5 Networks Ultimate Software Group | ||
Customer Case Studies
The following case studies are representative examples of how our customers have benefited from our solution.
Mentor Graphics, a Siemens Business
Situation: Mentor Graphics, a Siemens Business, is a leading company in electronic design automation. Agile product development cycles that enable rapid and flexible response to change are critical to the company’s success. As Mentor’s development teams increased their use of continuous integration and agile methodologies, their demand on IT to complete testing in a timely manner increased. Mentor moved test processes to a virtualized environment to increase agility, but soon found that traditional storage solutions were unable to meet the demands of this workload. The company tried to divide applications into chunks, but the problems persisted. This caused Mentor to search for a higher performing storage solution that would improve developer productivity.
Solution and Benefit: Mentor Graphics decided to run a competitive proof-of-concept trial, or POC, with several different storage vendors. After the POC, Mentor chose Tintri in 2013 for its performance and ease of management. Since its initial adoption of Tintri systems, Mentor has expanded its Tintri deployment into other environments, replacing conventional storage for many virtualized workloads. Mentor is using Tintri to add scale, agility, and automation to their cloud environment, to change and deploy new workloads several hundred times each week, and to spin up and spin down tens of thousands of VMs each week supporting production servers and systems, regression systems, test flow benchmarking runs and virtual desktops on Tintri systems.
Shire
Situation: Shire, a global biopharmaceutical company focused on rare diseases, has maintained strong growth through acquisition and in-house R&D. The company operates a shared services group that supports various business units with IT infrastructure that is distributed in multiple data centers and remote offices in various cities
110
Table of Contents
worldwide. After deploying a Hyper Converged Infrastructure (HCI) solution, the company briefly contemplated moving to the public cloud. Shire decided against it after an in-depth analysis by a global system integrator showed that it would be more advantageous for the company to build its own enterprise cloud on premise.
Solution and Benefit: A positive experience with Tintri systems by one of the company’s acquired businesses prompted the company’s corporate IT team to evaluate Tintri for broader deployment. After moving a few workloads to Tintri, the corporate IT team saw significant improvements in performance and began deployment of Tintri. Over time, the company standardized on a joint Tintri and Cisco UCS solution as it built out a private cloud environment in its data centers worldwide. Tintri systems are now running the company’s database workloads and email, and are also providing data protection for the company’s primary and secondary datacenters. The combined Tintri and Cisco UCS solution has demonstrated that it is one-third of the cost of HCI, and three-quarters of the cost of public. The company has also improved its speed to market by reducing time to stand up new capacity and performance from one month to less than a week.
Fortune 500 Construction and Engineering Company
Situation: As one of the largest construction and engineering contractors in the world, the company makes significant investments in new technologies and development work to improve how information is created, shared and used in all areas of the company’s construction operations. The company builds many of its own software solutions and conducts significant software development operations in its datacenters. Silos among multiple teams within the company’s IT organization created problems when business units were not served by IT in a timely manner. To solve this problem and to shorten the service delivery time to the business units, the company set out to build a private cloud onsite and consolidate multiple IT teams dedicated to different infrastructure components into one central cloud team.
Solution and Benefit: With Tintri, IT generalists at the company rather than storage specialists were able to manage the company’s entire infrastructure, including storage and server, freeing up specialized resources to take on new projects. Before deploying Tintri, it took several days for the company to request and establish a new development environment. With Tintri, this type of request can be fulfilled in less than five minutes. As the Tintri deployment grew, the company discovered other benefits, including the ability of the Tintri solution to automatically make adjustments to deliver the needed performance to both production and development environments while closely monitoring the changing needs of workloads. This eliminated the challenges that the company faced with its previous storage solutions that treated production workloads, but not development workloads, as a priority. The company also reduced its storage footprint by a 20:1 ratio, greatly reducing operating expenses and management complexity. To expand its cloud capability, the company is using Tintri’s PowerShell ToolKit to integrate Tintri features into their self-service portal to simplify the process by which developers obtain infrastructure resources.
Fortune 1000 Technology Company
Situation: As a leading provider of software products for industrial and consumer use, the company has been at the forefront of cloud adoption. The company began its private cloud building effort five years ago when they grew frustrated with the performance, cost and management complexity of the aging infrastructure in their datacenter, which hindered the company’s ability to implement a rapid software development cycle. One of the key drivers for the company’s cloud effort is the ability to develop an IT as a service model to provide IT services quickly to the company’s internal business teams.
Solution and Benefit: From the early stage of the deployment, Tintri was able to demonstrate to the company its ability to autonomously deliver consistent performance using pre-defined QoS metrics and support a wide range of the company’s workloads. The company’s deployment of Tintri systems grew steadily, expanding from development and test, to virtualized desktop, to general production workloads, and to data protection. The company’s private cloud implementation also became more sophisticated over time with added automation and
111
Table of Contents
self-service capabilities. With over four petabytes of data on 58 Tintri systems in eight datacenters around the world as of March 31, 2017, the company runs approximately 200,000 VMs in steady state, and creates and tears down over 120,000 virtual machines per month.
Instead of a team of nine to ten full time equivalent storage specialists which, according to industry research is needed to run data of this scale, one IT manager at the company is able to handle the workload in less than four hours per week. The company has also succeeded in cutting software development cycles in half and providing more on demand service delivery to business groups in the company.
Customer Support
We offer product support for all of our customers, including those customers who purchase our products through our channel partners. Customers may choose to purchase support plan upgrades, which provide them with accelerated shipment and installation of replacement parts. We also provide proactive support services that alert customers to potential product failures before they occur. Our support and services contracts are offered for periods of one to five years. We subcontract with third-party service providers to provide onsite hardware repair and replacement for our customers that are located outside of the United States.
Sales and Marketing
Sales. We sell our products predominantly through joint sales efforts made in conjunction with our channel partners. Our sales organization is responsible for large-account acquisition and overall market development, which includes managing our relationships with our channel partners, working with our channel partners in acquiring and supporting customers, and acting as the liaison between our customers and our marketing and product development teams.
As of January 31, 2017, we had direct sales teams located in ten countries. We expect to continue to grow our sales headcount in our existing markets and to expand our presence into countries where we currently have limited or no direct sales presence. Our sales representatives typically become increasingly productive over several quarters as they are trained and learn to sell our products.
Our sales organization is supported by an inside sales team, sales enablement engineers, specialist system architects and technical marketing personnel. These personnel have deep technical expertise and responsibility for pre-sales technical support, solutions engineering for our customers and technical training for our channel partners.
Distribution Channel Partners. We work with channel partners who help us market and sell our products to customers. This joint sales approach provides us with the benefit of direct relationships with substantially all of our customers and expands our reach through the relationships of our channel partners. Our channel partners are further supported by our distributors, who work together on a non-exclusive basis to market our products, identify and close sales opportunities, and provide pre-sales and post-sales services to our customers.
As of April 30, 2017, we had 388 channel partners. This distributed partner community includes both national and regional partners in the Americas and partners in EMEA, Japan and APAC. To promote channel productivity, we operate a formal accreditation program for the sales and technical professionals of our channel partners. Our channel partners include Promark, Arrow, SHI, CDW, CarahSoft, Zycko, Ahead, Champion, Fujitsu and Avnet.
Approximately 89% and 85% of our revenue in fiscal 2016 and 2017, respectively was derived from sales to our channel partners, and no single channel partner represented more than 10% of our revenue in fiscal 2016 and 2017. Approximately 86% of our revenue in fiscal 2015 was derived from sales to our channel partners, and two channel partners each represented more than 10% of our revenue in fiscal 2015.
112
Table of Contents
We intend to continue to expand our partner relationships to further extend our sales coverage and to invest in education, training and programs to increase the ability of our channel partners to sell our products independently.
Marketing. Our marketing is focused on building our brand reputation and market awareness, communicating product and service advantages, driving customer demand and generating leads for our sales force and channel partners. Our marketing team designs and implements a wide range of activities and initiatives, including social media, digital marketing, community events, partner co-marketing and integrated marketing campaigns. In addition, we manage “Tintricity Hub,” an online community of customers that share best practices, trade ideas and provide referrals. Over 50% of our advocates are active in any given month. As of April 30, 2017, we had more than 1,200 Tintricity Hub members from approximately 650 companies.
Technology Partners
As a storage and data management platform company, we work with a rich ecosystem of technology partners to deliver world-class solutions to our mutual customers. Our technology partners include software and infrastructure partners such as Arista Networks, Brocade, Cisco, Citrix, CommVault, Microsoft, Mirantis, Oracle, Red Hat, Veeam Software and VMware. In addition, we work closely with our technology partners through co-marketing and lead-generation activities in an effort to broaden our marketing reach. We also sell our solution under an original equipment manufacturer arrangement with Fujitsu, who distributes our solutions on a non-exclusive basis in Japan.
We have and expect to continue to work closely with many of our technology partners through joint marketing and demand generation activities in an effort to broaden our marketing reach and help us win new and retain existing customers. We also jointly validate solutions, often with the expert help of channel partners, to deliver qualified complete solutions to our customers.
Research and Development
Our research and development efforts are focused primarily on improving existing products and developing new products. Our products integrate both software and hardware innovations, and accordingly, our research and development teams employ both software and hardware engineers in the design, development, testing, certification and support of our products. As of April 30, 2017, we employed 159 software engineers and four hardware engineers with expertise in storage and IT infrastructure. A majority of our research and development team members are based in Mountain View, California. We also design, and certify our products to ensure interoperability with a variety of third-party software, hypervisor and networking components.
We believe that innovation and timely development of new features and products is essential to meeting the needs of our customers and improving our competitive position. We plan to dedicate significant resources to our continued research and development efforts.
Manufacturing
We contract with an offshore subsidiary of Flex to manufacture all of our storage products. Flex purchases components from our approved list of suppliers and builds our hardware appliances according to our specifications. The outsourcing of our hardware manufacturing extends from prototypes to full production and includes activities such as material procurement, software implementation and final assembly and testing. Once the completed products are manufactured and tested, Flex arranges the shipment of our products directly to our customers.
Our contract manufacturer generally manages the procurement of the components and parts used in our products. We also engage in direct sourcing of certain strategic components. While our preference is to select components and materials that are available from multiple sources, we utilize a number of components that are
113
Table of Contents
available from only one source. Generally, neither we nor our contract manufacturer have written agreements with these sole-source component providers to guarantee the supply of the key components used in our hardware products. We generally do not have long-term supply contracts with our suppliers. For example, the chassis used in our hybrid-flash systems is obtained on a purchase order-basis under an agreement with a single-source component supplier that has no fixed term. In addition, the chassis used in our all-flash systems is obtained under an agreement with a single-source component supplier having an initial term through October 2017, at which point it will automatically renew for successive one-year periods unless either party provides notice of non-renewal. We generally order our components on a “build to order” basis, and do not maintain any significant inventory of the components used in our products. However, we regularly monitor the supply of components and the availability of qualified and approved alternative sources. We provide nine month forecasts to Flex (the first three months of which are binding) so that they can purchase key components in advance of their anticipated use, with the objective of maintaining an adequate supply of those components.
Except for the binding portion of forecasts mentioned above, our manufacturing services agreement with Flex does not provide for any specific volume purchase commitments and orders are placed on a purchase order basis. We work closely with Flex to meet our product delivery requirements and to manage the manufacturing process and quality control.
Our agreement with Flex is terminable at any time by us with 90 days’ notice or by Flex with 120 days’ notice and Flex has no obligation to provide services transitioning our manufacturing processes to another manufacturer. Although the contract manufacturing services required to manufacture and assemble our products may be readily available from a number of established manufacturers, it is time consuming and costly to qualify and implement contract manufacturer relationships. As a result, if Flex or our sole-source component suppliers suffer an interruption in their businesses, or experience delays, disruptions or quality control problems in their manufacturing operations, or we have to change or add additional contract manufacturers or suppliers of our sole-sourced components, our ability to ship our products to our customers could be delayed, and our business, operating results and financial condition could be adversely affected.
Competition
We operate in the intensely competitive IT infrastructure market that is characterized by constant change and innovation. Changes in application requirements, IT infrastructure trends and the broader technology landscape result in evolving customer requirements for architecture, performance, manageability and scalability, and organizations may require new features from enterprise cloud platforms and storage systems. Our main competitors fall into two categories:
| • | large IT infrastructure vendors consisting primarily of EMC and NetApp, and also Dell Technologies, Hitachi Data Systems, HP Enterprise, IBM and VMware that offer a broad range of storage systems targeting various use cases and end markets; and |
| • | smaller specialized IT infrastructure companies, including companies that offer solutions powered entirely or partially by flash memory technology, such as Nimble Storage, a Hewlett Packard Enterprise company, Nutanix and Pure Storage. |
As our market grows, we expect that the market will attract new startups and more highly specialized vendors, as well as larger vendors that may continue to acquire or bundle their products more effectively.
We believe the principal competitive factors in the storage market are as follows:
| • | product features, enhancements and capabilities, including ease of use, performance, manageability, reliability and ability to store and process physical and/or virtualized workloads; |
| • | business impact, including application time to market and rapid scalability; |
| • | product economics and value to customer, including cost of acquisition (capital expenses) and ongoing management and maintenance costs (operating expenses); |
114
Table of Contents
| • | customer experience, from marketing and pre-sales through sales engagement, purchase and shipment, support and customer community; |
| • | product interoperability with broader third-party ecosystem, including hypervisor, cloud and networking vendors; and |
| • | global sales and distribution capability. |
We believe we compete favorably with our competitors on the basis of these factors. Our competitive strengths include the simplicity and performance of our advanced stand-alone software products packaged within enterprise-grade hardware, which leads to operating efficiencies and an improved customer experience; our high-quality, referenceable customer base; and our open architecture and ecosystem integration, which provides greater flexibility to operate a variety of storage platforms, form factors and hypervisors.
Intellectual Property
Our success depends in part upon our ability to protect our core technology and intellectual property. To establish and protect our technology, intellectual property and proprietary rights, we rely on a combination of intellectual property rights, including patent, copyright, service mark, trademark and trade secret laws, as well as confidentiality procedures and contractual restrictions.
As of April 30, 2017, we had nine issued patents and 35 pending patent applications in the United States and internationally. Our issued patents have expiration dates ranging from 2030 to 2034.
We generally control access to and use of our proprietary hardware, software and other confidential information through the use of internal and external controls, including contractual protections with employees, contractors, customers and partners, and our software is protected by U.S. and international copyright laws.
The steps we have taken to protect our core technology, intellectual property and intellectual property rights may not be adequate. Any of our issued patents or trademarks or other intellectual property rights may be challenged, invalidated or circumvented, and we may not be able to prevent third parties from infringing them. Despite our efforts to protect our trade secrets and other technology and intellectual property through intellectual property rights, licenses, and confidentiality agreements, unauthorized parties may still copy or otherwise obtain and use our technology and intellectual property, including our software. In addition, we intend to expand our international operations, and effective patent, copyright, trademark, and trade secret protection may not be available or may be limited in foreign countries.
The IT infrastructure industry is characterized by the existence of a large number of patents, trademarks, copyrights and other intellectual property rights, and by frequent litigation based on allegations of infringement or other misappropriation of intellectual property rights. From time to time, third parties, including our competitors and non-practicing entities, have claimed and may in the future claim that our products or technologies may infringe their intellectual property rights and may assert patent, copyright, trade secret and other claims based on intellectual property rights against us and our customers, suppliers and channel partners. We cannot assure you that our products, services or business do not infringe or misappropriate such rights of such third-party claimants. Although we generally attempt to limit our liability to indemnify third parties against intellectual property infringement claims, we are party to a number of agreements pursuant to which we are obligated to indemnify certain third parties. We expect that intellectual property rights infringement or misappropriation claims may increase as the number of products and competitors in our market increase. In addition, to the extent that we gain greater visibility and market exposure as a public company, we face a higher risk of being the subject of intellectual property rights infringement or misappropriation claims from third parties. Any third-party intellectual property rights claims against us could significantly increase our expenses and could have a significant and negative impact on our business, operating results and financial condition. See “Risk Factors” for additional information.
115
Table of Contents
Employees
We believe that the expertise of our people and our corporate culture are important to our success as a technology leader. As of April 30, 2017, we had 561 employees in the United States and internationally, of which 341 employees were based in our corporate headquarters in Mountain View, California. None of our employees is represented by a labor organization or is a party to any collective bargaining agreement and we consider our relationship with our employees to be good.
Facilities
Our corporate headquarters are located in Mountain View, California, where we lease a total of approximately 127,000 square feet, of which approximately 29,000 square feet are currently sublet to a third-party. The lease agreement for our Mountain View, California headquarters expires in 2022. We also lease offices in other locations in the United States and internationally in Australia, England, Germany, Ireland and Japan. We lease all of our facilities and do not own any real property. We intend to further expand our facilities or add new facilities as we add employees and enter new geographic markets, and we believe that suitable additional or alternative space will be available as needed to accommodate ongoing operations and any such growth. However, we expect to incur additional expenses in connection with such new or expanded facilities.
Legal Proceedings
We may, from time to time, be involved in various legal proceedings arising from the normal course of business, and an unfavorable resolution of any of these matters could materially affect our future operating results, cash flows or financial position. Regardless of the outcome, litigation can have an adverse impact on us because of defense and settlement costs, diversion of management resources and other factors. We are currently not aware of any such legal proceedings or claims that we believe will have, individually or in the aggregate, a material adverse effect on our business, operating results or financial condition.
116
Table of Contents
Executive Officers and Directors
The following table provides information regarding our executive officers and directors as of April 30, 2017:
| Name |
Age | Position(s) | ||||
| Executive Officers |
||||||
| Ken Klein |
57 | Chairman and Chief Executive Officer | ||||
| Ian Halifax |
56 | Chief Financial Officer | ||||
| Kieran Harty |
54 | Chief Technology Officer and Director | ||||
| Michael McGuire |
53 | Chief Sales Officer | ||||
| Directors |
||||||
| John Bolger(1) |
70 | Director | ||||
| Charles Giancarlo(3) |
|
59 |
|
Director | ||
| Adam Grosser(1) |
56 | Director | ||||
| Harvey Jones(1) (2) |
64 | Director | ||||
| Christopher Schaepe(2) (3) |
53 | Director | ||||
| Peter Sonsini(2) (3) |
48 | Director | ||||
| (1) | Member of our audit committee. |
| (2) | Member of our compensation committee. |
| (3) | Member of our nominating and corporate governance committee. |
Executive Officers
Ken Klein has served as our Chairman and Chief Executive Officer since October 2013, and as a director since January 2012. Prior to joining our company, Mr. Klein served as President at Wind River Systems, Inc., a software company, from January 2004 to October 2013. Mr. Klein has served on the board of directors of MobileIron, Inc., a mobile enterprise management company, since February 2016. Mr. Klein holds a bachelor of science degree in electrical engineering and biomedical engineering from the University of Southern California.
We believe that Mr. Klein possesses specific attributes that qualify him to serve as a member of our board of directors, including his extensive experience in the software industry and the operational insight and expertise he has accumulated as our Chief Executive Officer.
Ian Halifax has served as our Chief Financial Officer since December 2013. Prior to joining our company, Mr. Halifax served as Chief Financial Officer of Host Analytics, Inc., a SaaS financial software applications company, from August 2013 to December 2013, and as Chief Financial Officer of Grass Valley USA, LLC, a media broadcast equipment and solutions company, from January 2011 to March 2013. From January 2007 to January 2011, Mr. Halifax served as Chief Financial Officer and Senior Vice President of Finance and Administration at Wind River Systems, Inc. Earlier in his career, Mr. Halifax served as Chief Financial Officer at Macrovision, Inc., a digital rights management company, and as Chief Financial Officer at Micromuse, Inc., a network management software company. He has also held senior positions at KPMG LLP, an accounting firm, and Sun Microsystems, Inc., a manufacturer and seller of computers and computer software. Mr. Halifax is a certified public accountant and holds a bachelor of arts degree from the University of York and an MBA from Henley Management College in the United Kingdom.
Kieran Harty has served as our Chief Technology Officer since October 2013 and as a member of our board of directors since August 2008. From June 2008 to October 2013, Dr. Harty served as our Chief Executive Officer and Chairman. Before founding Tintri, he served as Executive Vice President of R&D at VMware, Inc., a virtualization software company, from June 1999 to February 2006. Dr. Harty holds a master’s degree in computer science from Trinity College Dublin and a Ph.D. in electrical engineering from Stanford University.
117
Table of Contents
We believe that Dr. Harty possesses specific attributes that qualify him to serve as a member of our board of directors, including his extensive experience in the software industry, and the operational insight and expertise he has accumulated as a co-founder and our Chief Technology Officer.
Michael McGuire has served as our Chief Sales Officer since March 2015. Prior to joining our company, Mr. McGuire served in various senior roles at Dell, including Vice President of North America Enterprise Solutions Group and Channel Sales and Vice President of Global Storage Sales from July 2012 to February 2015. Prior to Dell, Mr. McGuire served as Chief Commercial Officer at Nexsan Technologies, a data storage corporation, from November 2008 to July 2012. Mr. McGuire holds a bachelor of business administration degree from the Ivey Business School at University of Western Ontario.
Directors
John Bolger has served as a member of our board of directors since December 2015. From May 1989 to April 1992, Mr. Bolger served as Vice President of Finance and Administration and Chief Financial Officer of Cisco Systems, Inc. Mr. Bolger has served on the board of directors of Fulgent Genetics, Inc., a technology company focusing on genetic testing, since September 2016. Mr. Bolger previously served on the boards of twelve public companies, including Mattson Technology, Inc., Cogent, Inc., Wind River Systems, Inc., Mission West Properties, Inc. and Integrated Device Technology, Inc. Mr. Bolger holds a bachelor of arts degree from the University of Massachusetts and an MBA from Harvard University.
We believe Mr. Bolger possesses specific attributes that qualify him to serve as a member of our board of directors, including his financial and accounting expertise and the Board’s determination that he qualifies as an Audit Committee “financial expert.”
Charles Giancarlo has served as a member of our board of directors since September 2016. From January 2008 through December 2013, Mr. Giancarlo served as a managing director of Silver Lake Partners, a private investment firm and served as a senior advisor to the firm from January 2014 to September 2015. From May 1993 to December 2007, Mr. Giancarlo served in various positions with Cisco Systems, Inc., most recently as executive vice president and chief development officer. Mr. Giancarlo also serves on the board of directors of Accenture plc, a management consulting business, since November 2008; Arista Networks, Inc., a provider of cloud networking solutions for large data center storage computing environments, since April 2013; Avaya, Inc., a provider of business collaboration and communications solutions, since June 2008; and ServiceNow, a provider of IT services, since November 2013. Mr. Giancarlo holds a bachelor of science degree in electrical engineering from Brown University, a master of science degree in electrical engineering from the University of California, Berkeley and an MBA from Harvard University.
We believe Mr. Giancarlo possesses specific attributes that qualify him to serve as a member of our board of directors, including his extensive experience advising, investing in and serving on the boards of directors of technology companies.
Adam Grosser has served as a member of our board of directors since July 2015. Since February 2011, Mr. Grosser has served as Group Head and Managing Director at Silver Lake Kraftwerk, a division of global private investment firm Silver Lake. From September 2000 to October 2010, Mr. Grosser served as a General Partner of Foundation Capital, a venture capital firm. From August 1996 to August 1999, he served as President of the Subscriber Networks Division at Excite@Home, an internet service provider. Mr. Grosser currently sits on the boards of multiple private companies and has recently served on the board of Calix, Inc., an NYSE-listed telecommunications provider company. Mr. Grosser holds a bachelor of arts degree, a master of science degree, and an MBA degree from Stanford University.
We believe that Mr. Grosser possesses specific attributes that qualify him to serve as a member of our board of directors, including his extensive experience in advising technology companies as well as counseling boards of directors and senior management regarding corporate governance, compliance and business operations.
118
Table of Contents
Harvey Jones has served as a member of our board of directors since March 2014. Mr. Jones has been the Managing Partner of Square Wave Ventures, a private investment firm, since January 2004. Mr. Jones has served on the board of Nvidia Corporation since November 1993. Mr. Jones holds a bachelor of science degree in mathematics and computer sciences from Georgetown University and an MBA from the Massachusetts Institute of Technology Sloan School of Management.
We believe that Mr. Jones possesses specific attributes that qualify him to serve as a member of our board of directors, including his executive management background and experience in the business of technology licensing. He provides valuable insight into innovation strategies, research and development efforts, as well as management and development of our technical employees.
Christopher Schaepe has served as a member of our board of directors since July 2009. Mr. Schaepe is a Founding Partner of Lightspeed Venture Partners, a venture capital firm, and has served in that capacity since September 2000. Mr. Schaepe currently sits on the board of Aerohive Networks, Inc., a network equipment company. Mr. Schaepe previously served on the boards of Riverbed Technology, Inc., an application performance infrastructure company, Fusion-io, Inc., a storage memory platform company, and eHealth, Inc., an online health insurance provider. Mr. Schaepe holds a bachelor of science and a master of science degree in electrical engineering and computer science from the Massachusetts Institute of Technology and an MBA from the Stanford Graduate School of Business.
We believe that Mr. Schaepe possesses specific attributes that qualify him to serve as a member of our board of directors, including his broad perspective of the technology industry, having guided numerous companies in his role as a venture capital investor and board member over the past two decades, as well as substantive professional experience serving in corporate finance and capital markets roles.
Peter Sonsini has served as a member of our board of directors since 2008. Mr. Sonsini joined New Enterprise Associates, or NEA, a venture capital firm, in 2005 and became a General Partner in 2012. Prior to NEA, from 2001 to 2005, Mr. Sonsini was a Senior Director responsible for OEM Sales and Strategic Alliances at VMware, Inc. From 1998 to 2001, Mr. Sonsini ran product management at Mirapoint, Inc., an appliance-based email provider, and from 1996 to 1998 worked in sales and marketing at Hewlett-Packard Company, an information technology company, including as Worldwide Product Manager for the mid-range server business. Mr. Sonsini holds a bachelor of science degree in political economy from the University of California, Berkeley and an MBA from the Kellogg School of Management at Northwestern University.
We believe Mr. Sonsini possesses specific attributes that qualify him to serve as a member of our board of directors, including his extensive experience in the venture capital industry analyzing, investing in and serving on the boards of directors of technology companies.
Our executive officers are appointed by our board of directors and serve until their successors have been duly elected and qualified. There are no family relationships among any of our directors or executive officers.
Codes of Business Conduct and Ethics
We have adopted a code of business conduct and ethics that applies to all of our employees, officers and directors, including our Chief Executive Officer, Chief Financial Officer and other executive and senior financial officers. Upon the completion of this offering, the full text of our code of business conduct and ethics will be available on our website at www.tintri.com. We intend to post any amendment to our code of business conduct and ethics, and any waivers of such code for directors and executive officers, on the same website. Information on or that can be accessed through our website is not part of this prospectus.
Board Composition
Our board of directors currently consists of eight members.
119
Table of Contents
Following the completion of this offering, our amended and restated certificate of incorporation and amended and restated bylaws will provide for a classified board of directors, with each director serving a staggered, three-year term. The terms of the directors will expire upon the election and qualification of successor directors at the annual meeting of stockholders to be held during 2018 for the Class I directors, 2019 for the Class II directors and 2020 for the Class III directors.
| • | Our Class I directors will be Adam Grosser and Charles Giancarlo, and their terms will expire at the annual meeting of stockholders to be held in 2018; |
| • | Our Class II directors will be Kieran Harty, Harvey Jones and Peter Sonsini, and their terms will expire at the annual meeting of stockholders to be held in 2019; and |
| • | Our Class III directors will be Ken Klein, John Bolger and Christopher Schaepe, and their terms will expire at the annual meeting of stockholders to be held in 2020. |
Upon expiration of the term of a class of directors, directors for that class will be elected for three-year terms at the annual meeting of stockholders in the year in which that term expires. Each director’s term shall continue until the election and qualification of his or her successor, or his or her earlier death, resignation or removal. Any additional directorships resulting from an increase in the number of authorized directors will be distributed among the three classes so that, as nearly as possible, each class will consist of one-third of the directors.
The division of our board of directors into three classes with staggered three-year terms may delay or prevent a change of our management or a change of control. Under Delaware law, our directors may be removed for cause by the affirmative vote of the holders of a majority of our voting stock.
Director Independence
In connection with this offering, our common stock has been approved for listing on The NASDAQ Global Market. Under the rules of the NASDAQ Stock Market, independent directors must comprise a majority of a listed company’s board of directors within a specified period of the completion of this offering. In addition, the rules of the NASDAQ Stock Market require that, subject to specified exceptions, each member of a listed company’s audit, compensation and nominating and corporate governance committees be independent. Under the rules of the NASDAQ Stock Market, a director will only qualify as an “independent director” if, in the opinion of that company’s board of directors, that person does not have a relationship that would interfere with the exercise of independent judgment in carrying out the responsibilities of a director. Audit committee members must also satisfy the independence criteria set forth in Rule 10A-3 under the Exchange Act.
In order to be considered independent for purposes of Rule 10A-3, a member of an audit committee of a listed company may not, other than in his or her capacity as a member of the audit committee, the board of directors or any other board committee accept, directly or indirectly, any consulting, advisory or other compensatory fee from the listed company or any of its subsidiaries or be an affiliated person of the listed company or any of its subsidiaries.
Our board of directors has undertaken a review of the independence of each director and considered whether each director has a material relationship with us that could compromise his ability to exercise independent judgment in carrying out his responsibilities. As a result of this review, our board of directors determined that John Bolger, Charles Giancarlo, Adam Grosser, Harvey Jones, Christopher Schaepe and Peter Sonsini, representing six of our eight directors, were “independent directors” as defined under the applicable rules and regulations of the SEC and the listing requirements and rules of the NASDAQ Stock Market.
120
Table of Contents
Committees of the Board of Directors
Our board of directors has an audit committee, a compensation committee and a nominating and corporate governance committee, each of which will have the composition and responsibilities described below upon completion of this offering. Members serve on these committees until their resignation or until otherwise determined by our board of directors.
Audit Committee
Messrs. Bolger, Grosser and Jones, each of whom is a non-employee member of our board of directors, comprise our audit committee. Mr. Bolger is the chair of our audit committee. Our board of directors has determined that each of the members of our audit committee satisfies the requirements for financial literacy under the rules and regulations of the NASDAQ Stock Market and the SEC. Our board of directors has determined that each of Messrs. Bolger, Grosser and Jones satisfy the requirements for independence under the rules and regulations of the NASDAQ Stock Market and the SEC. Our board of directors has also determined that Mr. Bolger qualifies as an “audit committee financial expert” as defined in the SEC rules and satisfies the financial sophistication requirements of the NASDAQ Stock Market. The audit committee is responsible for, among other things:
| • | selecting a qualified firm to serve as the independent registered public accounting firm to audit our financial statements; |
| • | helping to ensure the independence and performance of the independent registered public accounting firm; |
| • | discussing the scope and results of the audit with the independent registered public accounting firm, and reviewing, with management and the independent registered public accounting firm, our interim and year-end operating results; |
| • | developing procedures for employees to submit concerns anonymously about questionable accounting or audit matters; |
| • | reviewing our policies on and overseeing risk assessment and risk management, including enterprise risk management; |
| • | reviewing related party transactions; and |
| • | approving or, as required, pre-approving, all audit and all permissible non-audit services, other than de minimis non-audit services, to be performed by the independent registered public accounting firm. |
Compensation Committee
Messrs. Jones, Schaepe and Sonsini, each of whom is a non-employee member of our board of directors, comprise our compensation committee. Mr. Jones is the chair of our compensation committee. Our board of directors has determined that each member of our compensation committee meets the requirements for independence under the rules of the NASDAQ Stock Market and the SEC, is a “non-employee director” within the meaning of Rule 16b-3 under the Exchange Act and is an “outside director” within the meaning of Section 162(m) of the Internal Revenue Code of 1986, as amended, or the Internal Revenue Code. The compensation committee is responsible for, among other things:
| • | reviewing, approving and determining the compensation of our executive officers and key employees; |
| • | reviewing, approving and determining compensation and benefits, including equity awards, to directors for service on the board of directors or any committee thereof; |
| • | administering our equity compensation plans; |
| • | reviewing, approving and making recommendations to our board of directors regarding incentive compensation and equity compensation plans; and |
| • | establishing and reviewing general policies relating to compensation and benefits of our employees. |
121
Table of Contents
Nominating and Corporate Governance Committee
Messrs. Schaepe, Giancarlo and Sonsini, each of whom is a non-employee member of our board of directors, comprise our nominating and corporate governance committee. Mr. Schaepe is the chair of our nominating and corporate governance committee. Our board of directors has determined that each member of our nominating and corporate governance committee meets the requirements for independence under the rules of the NASDAQ Stock Market. The nominating and corporate governance committee will be responsible for, among other things:
| • | identifying, evaluating and selecting, or making recommendations to our board of directors regarding, nominees for election to our board of directors and its committees; |
| • | evaluating the performance of our board of directors and of individual directors; |
| • | considering and making recommendations to our board of directors regarding the composition of our board of directors and its committees; |
| • | reviewing developments in corporate governance practices; |
| • | evaluating the adequacy of our corporate governance practices and reporting; and |
| • | developing and making recommendations to our board of directors regarding corporate governance guidelines and matters. |
We intend to post the charters of our audit, compensation and nominating and corporate governance committees, and any amendments thereto that may be adopted from time to time, on our website at www.tintri.com. Information on or that can be accessed through our website is not part of this prospectus. Our board of directors may from time to time establish other committees.
Compensation Committee Interlocks and Insider Participation
None of the members of our compensation committee is or has been an officer or employee of our company. None of our executive officers currently serves, or in the past year has served, as a member of the compensation committee or director (or other board committee performing equivalent functions or, in the absence of any such committee, the entire board of directors) of any entity that has one or more executive officers serving on our compensation committee or our board of directors.
Director Compensation
We do not currently have a formal compensation policy for our directors. During fiscal 2016 and 2017, our directors did not receive any cash compensation for their services as directors or as board committee members. We did not pay or accrue any compensation for Messrs. Grosser, Schaepe or Sonsini for fiscal 2016 and 2017.
122
Table of Contents
The table below shows the equity and other compensation granted to our non-employee directors during fiscal 2017. Ken Klein, our Chairman and Chief Executive Officer, and Kieran Harty, our Chief Technology Officer, were our employees during fiscal 2017, and received no additional compensation for their services as members of our board of directors. The compensation received by Mr. Klein, as a named executive officer, during fiscal 2016 and 2017 is presented in “Executive Compensation—Fiscal 2016 and 2017 Summary Compensation Table.” Mr. Harty is not a named executive officer in fiscal 2017.
| Name |
Fiscal Year |
Stock Awards ($)(1) |
Option Awards ($)(1) |
All Other Compensation ($) |
Total ($) |
|||||||||||||||
| John Bolger |
2017 | 128,000 | — | — | 128,000 | |||||||||||||||
| Charles Giancarlo |
2017 | 128,000 | 470,750 | — | 598,750 | |||||||||||||||
| Harvey Jones |
2017 | 128,000 | — | — | 128,000 | |||||||||||||||
| (1) | The amounts in the Option Awards and Stock Awards columns represent the aggregate grant date fair value of the awards as computed in accordance with FASB Accounting Standards Codification Topic 718. Pursuant to SEC rules, the amounts shown exclude the impact of estimated forfeitures related to service-based vesting conditions. The assumptions used in calculating the aggregate grant date fair value of the awards reported in this column are set forth in the notes to our audited consolidated financial statements included elsewhere in this prospectus. |
The following table lists all outstanding equity awards held by our non-employee directors as of January 31, 2017. Outstanding equity awards held by Mr. Klein are presented in “Executive Compensation—Fiscal 2017 Outstanding Equity Awards at Year-End.”
| Option Awards(1) | Stock Awards(1) | |||||||||||||||||||||||||||
| Name |
Grant Date |
Number of Securities Underlying Unexercised Options Exercisable (#) |
Number of Securities Underlying Unexercised Options Unexercisable (#) |
Option Exercise Price Per Share ($)(8) |
Option Expiration Date |
Number of Shares or Units of Stock That Have Not Vested (#) |
Market Value of Shares or Units of Stock That Have Not Vested ($)(2) |
|||||||||||||||||||||
| John Bolger |
12/7/15 | 7,899 | 21,267 | (3) | 13.68 | 12/7/25 | — | — | ||||||||||||||||||||
| 9/20/16 | — | — | — | — | 4,166 | (4)(5) | 134,728 | |||||||||||||||||||||
| Charles Giancarlo |
9/20/16 | 2,430 | 26,736 | (6) | 13.68 | 9/20/26 | 4,166 | (4)(5) | 134,728 | |||||||||||||||||||
| Harvey Jones |
3/5/14 | 23,611 | 9,722 | (7) | 13.68 | 3/5/24 | — | — | ||||||||||||||||||||
| 9/20/16 | — | — | — | — | 4,166 | (4)(5) | 134,728 | |||||||||||||||||||||
| (1) | Each of the options and stock awards was granted in connection with the non-employee director’s services as a director or board committee member. Each of the awards was granted pursuant to our 2008 Stock Plan. |
| (2) | This amount reflects the fair value of our common stock of $32.34 as of January 31, 2017 (the determination of the fair value by our board of directors as of the most proximate date) multiplied by the amount shown in the column “Stock Awards—Number of Shares or Units of Stock That Have Not Vested.” |
| (3) | 1/48 of the shares subject to this option vest each month following December 7, 2015, subject to continuous service with us. In addition, upon a “change of control” (as defined in the 2008 Stock Plan), the then-outstanding and unvested shares subject to the option will become fully vested and exercisable, subject to continuous service with us. |
| (4) | These are restricted stock units (RSUs) which will vest on the first date upon which two vesting requirements—a time-based component and a performance-based component—are both satisfied. The time-based component will be satisfied as to 12.5% of the RSUs on each of our quarterly RSU vesting dates (described below) following the applicable Vesting Commencement Date, subject to continuous service with us. Upon a “change of control” (as defined in the 2008 Stock Plan), any unvested RSUs for which the time-based component has not yet been satisfied will immediately be satisfied, subject to continuous service with us. Our quarterly RSU vesting dates are March 15, June 15, September 15 and December 15. The performance-based component will be satisfied upon the earlier to occur of (i) a “change of control” or (ii) the first date following the expiration of all lockup and blackout periods following our initial public offering, subject to continuous service with us on such date. |
| (5) | The Vesting Commencement Date of this RSU grant is September 20, 2016. |
| (6) | 1/48 of the shares subject to this option vest each month following September 20, 2016, subject to continuous service with us. In addition, upon a “change of control” (as defined in the 2008 Stock Plan), the then-outstanding and unvested shares subject to the option will become fully vested and exercisable, subject to continuous service with us. |
| (7) | 1/48 of the shares subject to this option vest each month following March 5, 2014, subject to continuous service with us. In addition, upon a “change of control” (as defined in the 2008 Stock Plan), the then-outstanding and unvested shares subject to the option will become fully vested and exercisable, subject to continuous service with us. |
| (8) | This exercise price per share reflects the impact of the repricing described in “Executive Compensation—Fiscal 2018 Option Repricing.” |
123
Table of Contents
Our named executive officers for fiscal 2017, which consist of our Chief Executive Officer and our two most highly compensated executive officers other than our Chief Executive Officer, are:
| • | Ken Klein, our Chairman and Chief Executive Officer; |
| • | Ian Halifax, our Chief Financial Officer; and |
| • | Michael McGuire, our Chief Sales Officer. |
Fiscal 2016 and 2017 Summary Compensation Table
The following table presents information concerning the total compensation of our named executive officers, for services rendered to us in all capacities during fiscal 2016 and 2017:
| Name and Principal |
Fiscal Year |
Salary ($) | Bonus ($) | Stock Awards ($)(1) |
Option Awards ($)(1) |
Non-Equity Incentive Plan Compensation ($) |
All Other Compensation ($)(2) |
Total ($) | ||||||||||||||||||||||||
| Ken Klein |
2017 | 350,000 | 175,000 | (3) | 199,600 | — | — | 473 | 725,073 | |||||||||||||||||||||||
| Chairman and Chief Executive Officer |
2016 | 350,000 | 175,000 | (3) | — | 2,762,531 | — | 260 | 3,287,791 | |||||||||||||||||||||||
| Ian Halifax(4) |
2017 | 275,000 | 55,000 | (3) | 87,325 | — | — | 473 | 417,798 | |||||||||||||||||||||||
| Chief Financial Officer |
||||||||||||||||||||||||||||||||
| Michael McGuire |
2017 | 350,000 | — | — | — | 332,624 | (5) | 473 | 683,097 | |||||||||||||||||||||||
| Chief Sales Officer |
2016 | 320,833 | (6) | — | — | 1,612,682 | 419,054 | (7) | 240 | 2,352,809 | ||||||||||||||||||||||
| (1) | The amounts in this column represent the aggregate grant date fair value of the award as computed in accordance with FASB Accounting Standards Codification Topic 718. Pursuant to SEC rules, the amounts shown exclude the impact of estimated forfeitures related to service-based vesting conditions. The assumptions used in calculating the aggregate grant date fair value of the awards reported in this column are set forth in the notes to our audited consolidated financial statements included elsewhere in this prospectus. |
| (2) | This amount represents life insurance premiums paid by us. |
| (3) | These amounts represent discretionary cash performance bonus payments approved by our board of directors or compensation committee, as applicable. |
| (4) | Mr. Halifax is a named executive officer for fiscal 2017 only. Therefore, information has been omitted for Mr. Halifax for fiscal 2016. |
| (5) | This amount represents cash incentives paid under our FY2017 Sales Plan described below. |
| (6) | Mr. McGuire began employment with us on March 2, 2015, and his $350,000 annual base salary was pro-rated accordingly. |
| (7) | Represents cash incentives earned under our FY2016 Sales Plan described below. |
Fiscal 2016 and 2017 Non-Equity Incentive Plan Compensation
FY2017 Sales Plan
We approved the FY2017 Tintri Sales Incentive Compensation Plan, or the FY2017 Sales Plan, for fiscal 2017 for our sales employees. Participating employees in the FY2017 Sales Plan were eligible to receive pre-determined cash compensation for achieving specified performance goals during fiscal 2017. Mr. McGuire, our Chief Sales Officer, participated in the FY2017 Sales Plan and was eligible under the FY2017 Sales Plan and his individual plan thereunder to earn commissions and bonuses. During fiscal 2017, and in connection with his participation in the FY2017 Sales Plan, Mr. McGuire earned the following commissions and bonuses based on his achievement of the performance goals we established for him. Mr. McGuire earned: (i) commissions and commission draws totaling $303,154 based on his fiscal 2017 bookings; (ii) cash bonuses totaling $26,832 for performance against his quarterly gross margin bonus targets; and (iii) a cash bonus equal to $2,638 related to a multi-year frame agreement.
FY2016 Sales Plan
We approved the FY2016 Tintri Sales Incentive Compensation Plan, or the FY2016 Sales Plan, for fiscal 2016 for our sales employees. Participating employees in the FY2016 Sales Plan were eligible to receive
124
Table of Contents
predetermined cash compensation for achieving specified performance goals during fiscal 2016. Mr. McGuire, our Chief Sales Officer, participated in the FY2016 Sales Plan and was eligible under the FY2016 Sales Plan and his individual plan thereunder to earn commissions and bonuses. During fiscal 2016, and in connection with his participation in the FY2016 Sales Plan, Mr. McGuire earned the following commissions and bonuses based on his achievement of the performance goals we established for him. Mr. McGuire earned: (i) commissions and commission draws totaling $339,399 based on his fiscal 2016 bookings; (ii) cash bonuses totaling $71,555 for performance against his quarterly gross margin bonus targets; and (iii) a cash bonus equal to $8,100 related to a multi-year frame agreement.
The amounts in the Summary Compensation Table under the column “Non-Equity Incentive Plan Compensation” for Mr. McGuire are based on his achievements under the FY2017 Sales Plan and his individual plan thereunder as well as his achievements under the FY2016 Sales Plan and his individual plan thereunder.
Fiscal 2017 Outstanding Equity Awards at Year-End
The following table presents information concerning all outstanding equity awards held by each of our named executive officers as of January 31, 2017.
| Option Awards(1) | Stock Awards(1) | |||||||||||||||||||||||||||
| Name |
Grant Date |
Number of Securities Underlying Unexercised Options Exercisable (#) |
Number of Securities Underlying Unexercised Options Unexercisable (#) |
Option Exercise Price Per Share ($) |
Option Expiration Date |
Number of Shares or Units of Stock That Have Not Vested (#) |
Market Value of Shares or Units of Stock That Have Not Vested ($)(2) |
|||||||||||||||||||||
| Ken Klein |
12/21/11 | 42,833 | — | 3.00 | 12/21/21 | — | — | |||||||||||||||||||||
| 10/8/13 | — | — | — | — | 128,998 | (3) | 4,171,795 | |||||||||||||||||||||
| 3/31/15 | 85,936 | 164,064 | (4) | 13.68 | (11) | 3/31/25 | — | — | ||||||||||||||||||||
| 3/28/16 | — | — | — | — | 6,666 | (5)(6) | 215,578 | |||||||||||||||||||||
| Ian Halifax |
12/2/13 | — | — | — | — | 28,200 | (7) | 911,988 | ||||||||||||||||||||
| 3/31/15 | 24,825 | 29,340 | (8) | 13.68 | (11) | 3/31/25 | — | — | ||||||||||||||||||||
| 3/28/16 | — | — | — | — | 2,916 | (5)(9) | 94,303 | |||||||||||||||||||||
| Michael McGuire |
3/3/15 | 66,458 | 78,542 | (10) | 13.68 | (11) | 3/3/25 | — | — | |||||||||||||||||||
| (1) | Each of the equity awards was granted pursuant to our 2008 Stock Plan. |
| (2) | This amount reflects the fair value of our common stock of $32.34 as of January 31, 2017 (the determination of the fair value by our board of directors as of the most proximate date) multiplied by the amount shown in the column “Stock Awards—Number of Shares or Units of Stock That Have Not Vested.” |
| (3) | On October 8, 2013, Mr. Klein was granted an option to purchase 687,989 shares of our common stock at a per share exercise price of $9.30. Mr. Klein immediately exercised the option as to all 687,989 shares subject to the option before they became vested, and such shares are subject to a repurchase right in favor of us. 1/48 of the shares are released from our repurchase right each month following October 21, 2013, subject to continuous service with us. This award is subject to vesting acceleration on the terms described in “—Executive Employment Arrangements—Ken Klein Employment Agreement.” On June 1, 2017, we repurchased from Mr. Klein 501,104 shares of our common stock subject to this grant on the terms described in “—Loans to Executive Officers.” |
| (4) | Consists of two option grants, each with respect to 125,000 underlying shares. 1/48 of the shares subject to the first option grant vest each month following March 31, 2015, and 1/48 of the shares subject to the second option grant vest each month following February 1, 2016, subject to continuous service with us. Each award is subject to vesting acceleration on the terms described in “—Executive Employment Arrangements—Ken Klein Employment Agreement.” |
| (5) | These are restricted stock units (“RSUs”) which will vest on the first date upon which two vesting requirements—a time-and service-based component and a performance-based component—are both satisfied. The time-based component will be satisfied as to 50% of the RSUs on the first quarterly RSU vesting date (described below) on or following each of the first two anniversaries of the applicable vesting commencement date, subject to continuous service with us. Our quarterly RSU vesting dates are March 15, June 15, September 15 and December 15. The performance-based component will be satisfied upon the earlier to occur of (i) a “change of control” (as defined in the 2008 Stock Plan) or (ii) the first date following the expiration of all lockup and blackout periods following our initial public offering, subject to continuous service with us on such date. |
| (6) | The vesting commencement date of this RSU grant is March 15, 2016. This award is subject to vesting acceleration on the terms described in “—Executive Employment Arrangements—Ken Klein Employment Agreement.” |
125
Table of Contents
| (7) | On December 2, 2013, Mr. Halifax was granted an option to purchase 123,055 shares of our common stock at a per share exercise price of $9.30. Mr. Halifax exercised the option as to all 123,055 shares subject to the option before they became vested, and such shares are subject to a right of repurchase in favor of us. 1/4 of the shares were released from our repurchase right on December 2, 2014 and 1/48 of the shares are released from our repurchase right each month following December 2, 2014, subject to continuous service with us. This award is subject to vesting acceleration on the terms described in “Executive Employment Arrangements—Ian Halifax Offer Letter.” On June 1, 2017, we repurchased from Mr. Halifax 88,520 shares of our common stock subject to this grant on the terms described in “—Loans to Executive Officers.” |
| (8) | Consists of one option grant with respect to 54,166 underlying shares. 1/4 of the shares subject to the option grant vest on March 31, 2016 and 1/48 of the shares subject to the option grant vest each month following March 31, 2016, subject to continuous service with us. This award is subject to vesting acceleration on the terms described in “Executive Employment Arrangements—Ian Halifax Offer Letter.” |
| (9) | The vesting commencement date of this RSU grant is March 15, 2016. This award is subject to vesting acceleration on the terms described in “—Executive Employment Arrangements—Ian Halifax Offer Letter.” |
| (10) | 1/4 of the shares subject to this option vest on the one-year anniversary of March 2, 2015, and 1/48 of the shares subject to this option vest each month thereafter, subject to continuous service with us. This award is subject to vesting acceleration on the terms described in “—Executive Employment Arrangements—Potential Payments upon Termination or Change of Control.” |
| (11) | This exercise price per share reflects the impact of the repricing described in “—Fiscal 2018 Option Repricing.” |
Fiscal 2018 Executive Officer Compensation Decisions
In the first quarter of fiscal 2018, our compensation committee, with input from our chief executive officer (except with respect to his own compensation) and Radford, an Aon Hewitt Company, an independent compensation consultant, increased the base salaries of certain of our executive officers, including certain of our named executive officers, to competitive levels of similarly situated technology companies. The fiscal 2018 base salaries for these named executive officers were increased to the levels described in the “Executive Employment Arrangements” section below. The fiscal 2017 base salaries for our named executive officers are set forth in the “Summary Compensation Table” above.
In addition, our compensation committee, with input from our management and Radford, instituted a fiscal 2018 bonus plan under which our employees who are not on commission plans, including Messrs. Klein and Halifax, are eligible to earn bonuses based on our achievement of revenue and EBIT goals for fiscal 2018. The amount of target bonus under the fiscal 2018 bonus plan for each of Messrs. Klein and Halifax is based on the target amount under his employment arrangement with us, as described in the “Executive Employment Arrangements” section below. Any achieved bonus under the fiscal 2018 bonus plan is payable half in cash (except with respect to our senior executives for whom there is no cash component for bonus payments) and half in stock (through the vesting of performance-based RSUs) as long as the employee satisfies the conditions to payments. Any achieved performance-based RSUs must also satisfy a time-based component (continued service through March 15, 2018) and a performance-based component (which has the same meaning as set forth in footnote 5 to the “Fiscal 2017 Outstanding Equity Awards at Year-End” table above).
In May 2017, we granted Messrs. Klein, Halifax, McGuire and Harty one-time retention grants of: stock options to purchase 72,916 shares, 20,833 shares, 10,416 shares and 83,333 shares, respectively, of our common stock (“Retention Options”) and RSUs with respect to 385,416 shares, 62,500 shares, 31,250 shares and 250,000 shares, respectively, of our common stock (the “Retention RSUs”). In May 2017, we also granted Messrs. Klein and Halifax additional stock options to purchase 501,104 shares and 88,520 shares, respectively, of our common stock (the “Additional Options”). The exercise price of the Retention Options and Additional Options is $13.68 per share, the fair value of the common stock on the date of grant as determined by the compensation committee of our board of directors. The Retention Options vest and become exercisable in equal monthly installments over the two years following the first sale of our common stock on a public securities exchange in connection with our initial public offering (the “IPO Date”), subject to the holder’s continued service through each vesting date and further subject to vesting acceleration on the terms described in “—Executive Employment Arrangements.” The Retention RSUs vest as to 3/8th of the Retention RSUs on March 15, 2018, 1/8th of the Retention RSUs every three months thereafter on the 15th day of the month, subject to the holder’s continued service through each vesting date and further subject to vesting acceleration on the terms described in “—Executive Employment Arrangements.” The Retention Options and Retention RSUs are forfeited
126
Table of Contents
if the IPO Date does not occur by July 30, 2017. The Additional Options are fully vested and exercisable on the date of grant. The equity awards described in this paragraph were granted to provide each of these executive officers with incentives to grow and expand our business. The number of shares subject to each of these awards and the vesting terms applicable thereto was determined by the compensation committee of our board of directors after considering the executive officer’s vested and unvested equity holdings (after taking into account the shares repurchased by us on the terms described in“—Loans to Executive Officers”) as well as the executive officer’s past and expected future contribution to our business, their experience, competencies, and responsibilities, and such other factors our board of directors deemed relevant.
Fiscal 2018 Option Repricing
In May 2017, we repriced each outstanding and unexercised stock option held by current service providers with an exercise price in excess of $13.68 per share (each, an “Eligible Option”), to a new exercise price of $13.68 per share, which is no less than the fair value of our common stock as determined by our compensation committee on the date of repricing. We believe that repricing the Eligible Options is important for the growth and development of our business in order to provide the appropriate retention and motivation incentives our employees and other key service providers holding these stock options. Eligible Options held by non-employee directors and executive officers also were repriced in furtherance of these goals and, in the case of our executive officers, in order to continue to provide a substantial portion of each executive officer’s overall realizable compensation opportunity with us in the form of equity. Eligible Options covering 3,291,783 shares of our common stock with a weighted average exercise price of $24.31 were repriced on May 30, 2017, including options held by Messrs. Klein, Halifax, McGuire and Harty.
Executive Employment Arrangements
Ken Klein Employment Agreement
In 2013, we entered into an employment agreement with Ken Klein, our Chairman and Chief Executive Officer. The employment agreement has no specific term and provides for at-will employment. Mr. Klein’s current annual base salary is $600,000, and he is eligible for target annual discretionary performance bonus equal to 50% of his annual base salary, based on the achievement of performance objectives determined by our board of directors after consultation with Mr. Klein and payable annually.
Under Mr. Klein’s employment agreement, if, on or within the twelve month period following a “change of control” (as defined in Mr. Klein’s employment agreement) (for the purposes of this section “—Ken Klein Employment Agreement,” the “change of control period”), we terminate Mr. Klein’s employment other than for “cause,” or Mr. Klein terminates his employment due to his death or “disability,” or Mr. Klein resigns for “good reason” (such terms are defined in Mr. Klein’s employment agreement), then Mr. Klein will be eligible to receive the following severance benefits (less applicable tax withholdings): (i) a lump sum cash amount equal to two times his then-current annual base salary and target performance bonus opportunity (but if greater, then his highest annual base salary and target performance bonus opportunity in effect during the twelve month period prior to his termination); (ii) all of his then outstanding and unvested equity awards will become fully vested and exercisable, as applicable, and any applicable performance goals will be deemed achieved at 100% of target levels; and (iii) payment of continued health coverage for him and his dependents under COBRA for up to twelve months following his termination date.
If, at any time outside of the change of control period, we terminate Mr. Klein’s employment other than for cause, or Mr. Klein terminates his employment due to his death or disability, or Mr. Klein resigns for good reason, then Mr. Klein will be eligible to receive the following severance benefits (less applicable tax withholdings): (i) continuation of his then-current annual base salary for twelve months following his termination date (but if greater, then his highest annual base salary in effect during the twelve month period prior to his termination); (ii) all of his then outstanding equity awards will become vested and exercisable (as applicable) to the same extent they otherwise would have become vested and exercisable had he remained employed with us for
127
Table of Contents
a period following his termination date equal to six months (and in the case of outstanding performance-based equity awards, applicable performance vesting criteria will be deemed achieved for such six month period at target levels); and (iii) payment of continued health coverage for him and his dependents under COBRA for up to twelve months following his termination date.
To receive any applicable severance benefits upon a qualifying termination, Mr. Klein must sign and not revoke a release of claims in our favor within the timeframe set forth in his employment agreement.
If any severance or other benefits provided for in Mr. Klein’s employment agreement or otherwise payable to him constitute “parachute payments” within the meaning of Section 280G of the Internal Revenue Code and could be subject to the related excise tax under Section 4999 of the Internal Revenue Code, Mr. Klein would be entitled to receive either full payment of benefits or such lesser amount which would result in no portion of the benefits being subject to the excise tax, whichever results in the greater amount of after-tax benefits to Mr. Klein. Mr. Klein’s employment agreement does not require us to provide any tax gross-up payments to him.
Ian Halifax Offer Letter
In 2013, we entered into an offer letter with Ian Halifax, our Chief Financial Officer, and amended the offer letter in August and September of 2016. The offer letter has no specific term and provides for at will employment. Mr. Halifax’s current annual base salary is $385,000, and he is eligible for a target annual performance bonus equal to 50% of his annual base salary, based on the achievement of performance objectives determined by us in our sole discretion.
Under Mr. Halifax’s amended offer letter, if we terminate Mr. Halifax’s employment other than for “cause”, death or “disability” or Mr. Halifax resigns for “good reason” during the period from three months prior to until 12 months following a “change of control” (such terms as defined in Mr. Halifax’s amended offer letter) (such period, the “change of control period”), Mr. Halifax will be eligible to receive the following severance benefits (less applicable tax withholdings): (i) all of his then outstanding and unvested equity awards will become fully vested and exercisable (and any applicable performance goals will be deemed achieved at 100% of target levels); (ii) continuation of his then-current annual base salary for 12 months following the termination date and payment of an amount equal to his then-current annual performance bonus, paid in equal installments over the 12 month period following his termination date; and (iii) reimbursement of continued health coverage for him and his dependents for a period of up to 12 months following his termination date, or taxable monthly payments in lieu of reimbursement, as applicable.
If we terminate Mr. Halifax’s employment other than for cause, or Mr. Halifax resigns for good reason at any time other than during the change of control period, the stock option to purchase shares of company common stock that was granted to Mr. Halifax on December 2, 2013 under our 2008 Stock Plan will become vested to the same extent it otherwise would have become vested had Mr. Halifax remained employed with us for a period following his termination date equal to the greater of six months or 12 months less the number of Mr. Halifax’s full months of continuous employment with us.
If we terminate Mr. Halifax’s employment other than for cause, or Mr. Halifax resigns for good reason because of a material reduction of his base salary or annual performance bonus at any time prior to the earlier of the closing of our initial public offering or the commencement of the change of control period, Mr. Halifax will be eligible to receive the following severance benefits: (i) continuing payments of an aggregate amount equal to the sum of: (A) 100% of his annual base salary and 100% of his target annual performance bonus, each as in effect immediately prior to his employment termination, plus (B) $500,000, paid in equal installments over the 12 month period following his termination date and (ii) reimbursement of continued health coverage for him and his dependents for a period of up to 12 months following his termination date, or taxable monthly payments in lieu of reimbursement, as applicable.
128
Table of Contents
If we terminate Mr. Halifax’s employment other than for cause at any time on or after the earlier of the closing of our initial public offering or the commencement of the change of control period, and other than during the change of control period, or Mr. Halifax resigns for good reason at any time other than during the change of control period (except if Mr. Halifax resigns for good reason because of a material reduction in his annual base salary or target annual performance bonus prior to the earlier of the closing of our initial public offering or the commencement of the change of control period), Mr. Halifax will be eligible to receive the following severance benefits: (i) continuing payments of an aggregate amount equal to the sum of: one-half of his annual base salary and one-half of his target annual performance bonus, each as in effect immediately prior to his employment termination (or 100% of his annual base salary in the event such termination of employment occurs following our initial public offering), paid in equal installments over the six month period following his termination date (following our initial public offering, then 12 months) and (ii) reimbursement of continued health coverage for him and his dependents for a period of up to six months following his termination date (following our initial public offering, then 12 months), or taxable monthly payments in lieu of reimbursement, as applicable.
In order to receive the severance benefits upon a qualifying termination, Mr. Halifax must sign and not revoke a separation agreement and a release of claims in our favor within the timeframe set forth in his amended offer letter.
Michael McGuire Offer Letter
In 2015, we entered into an offer letter with Michael McGuire, our Chief Sales Officer. The offer letter has no specific term and provides for at will employment. Mr. McGuire’s current annual base salary is $350,000, and his current annual on-target incentive compensation opportunity is $350,000. Pursuant to the terms of his offer letter, Mr. McGuire received an option to purchase shares of our common stock, the material terms of which are described in the “Fiscal 2017 Outstanding Equity Awards at Year-End” table. Mr. McGuire agreed to forfeit his rights to the severance and change of control benefits under his offer letter in exchange for the right to receive severance and change of control benefits under our Executive Change of Control and Severance Policy, as more fully described in “Executive Employment Arrangements—Potential Payments upon Termination or Change of Control.”
Potential Payments upon Termination or Change of Control
We adopted an Executive Change of Control and Severance Policy, or the policy, for Mr. McGuire and certain other executive officers (other than Mr. Klein and Mr. Halifax) and key employees, or participants. Under the policy, if we terminate Mr. McGuire other than for “cause,” death or “disability” or he resigns for “good reason”, in each case, during the period from three months prior to until twelve months following a “change of control” (for the purposes of this section “—Potential Payments Upon Termination or Change of Control,” the “change of control period”) (such terms are defined in the policy), he will be eligible to receive the following severance benefits (less applicable tax withholdings): (i) a lump sum cash amount equal to twelve months of his then-current annual base salary (or in the case that he resigns for good reason based on a material reduction in base salary and if greater, the annual base salary in effect prior to such reduction) or if greater, at the level in effect immediately before the change of control; (ii) 100% of his then outstanding and unvested equity awards will become fully vested and exercisable, if applicable, and any applicable performance goals will be deemed achieved at 100% of target levels; (iii) a lump sum cash amount equal to 100% of his target annual bonus opportunity in effect for the fiscal year in which the termination occurs; and (iv) payment or reimbursement of continued health coverage for him and his dependents under COBRA for a period of up to twelve months, or a taxable lump sum payment in lieu of such payment or reimbursement, as applicable.
Further, under the policy, if Mr. McGuire is terminated other than for cause, death or disability any time other than during the change of control period, he will be eligible to receive the following severance benefits (less applicable tax withholding): (i) continuation of his then-current annual base salary for six months following his termination date (increasing to twelve months if the termination date follows the completion of this offering);
129
Table of Contents
and (ii) payment or reimbursement of continued health coverage for him and his dependents for a period of up to six months (increasing to twelve months if his termination date follows the completion of this offering), or a taxable lump sum payment in lieu of such payment or reimbursement, as applicable.
To receive the severance benefits upon a qualifying termination, Mr. McGuire must sign and not revoke our standard separation agreement and release of claims within the timeframe set forth in the policy. If we discover after he receives severance benefits that grounds for terminating him for cause existed, he will not receive any further severance benefits under the policy, and to the extent permitted by law, he will be required to repay to us any severance benefits (or gain from such benefits) he received under the policy.
If any of the payments provided for under the policy or otherwise payable to Mr. McGuire would constitute “parachute payments” within the meaning of Section 280G of the Internal Revenue Code and would be subject to the related excise tax under Section 4999 of the Internal Revenue Code, then he will be entitled to receive either full payment of benefits or such lesser amount which would result in no portion of the benefits being subject to the excise tax, whichever results in the greater amount of after-tax benefits to him. The policy does not require us to provide any tax gross-up payments to Mr. McGuire or any other participant.
Mr. Klein and Mr. Halifax are not eligible to participate in the policy and are only eligible to receive potential termination or change of control payments pursuant to their employment agreement or offer letter, as applicable, as described in “—Executive Employment Arrangements—Ken Klein Employment Agreement” and in “—Executive Employment Arrangements—Ian Halifax Offer Letter.”
Employee Benefit and Stock Plans
2017 Equity Incentive Plan
Our board of directors has adopted, and we expect our stockholders to approve, our 2017 Equity Incentive Plan, or 2017 Plan, prior to the completion of this offering. Subject to stockholder approval, the 2017 Plan will be effective one business day prior to the effectiveness of the registration statement of which this prospectus is made a part and is not expected to be utilized until after the completion of this offering. Our 2017 Plan will provide for the grant of incentive stock options, within the meaning of Section 422 of the Internal Revenue Code, to our employees and any of our parent and subsidiary corporations’ employees, and for the grant of nonstatutory stock options, restricted stock, restricted stock units, stock appreciation rights, performance units and performance shares to our employees, directors and consultants, and our parent and subsidiary corporations’ employees and consultants.
Authorized Shares. A total of 4,537,000 shares of our common stock will be reserved for issuance pursuant to the 2017 Plan. In addition, the shares reserved for issuance under our 2017 Plan also include shares subject to awards granted under our 2008 Plan that, after the termination of our 2008 Plan, expire or otherwise terminate without having been exercised in full or that are forfeited or repurchased by us due to the failure to vest or tendered to or withheld by us for the payment of an award’s exercise price or for tax withholding (provided that the maximum number of shares that may be added to our 2017 Plan pursuant to this provision is 7,580,152 shares). The number of shares available for issuance under the 2017 Plan will also include an annual increase on the first day of each fiscal year beginning in 2019, equal to the least of:
| • | 4,537,000 shares; |
| • | 5.0% of the outstanding shares of common stock as of the last day of our immediately preceding year; or |
| • | a lower number of shares determined by the 2017 Plan’s administrator. |
Plan Administration. Our compensation committee will administer our 2017 Plan. Subject to the provisions of our 2017 Plan, the administrator will have the power to determine the terms of the awards, including the exercise price, the number of shares subject to each such award, the exercisability of the awards, and the form of consideration, if any, payable upon exercise. The administrator also has the authority to amend existing awards to
130
Table of Contents
reduce their exercise price, to allow participants the opportunity to transfer outstanding awards to a financial institution or other person or entity selected by the administrator and to institute an exchange program by which outstanding awards may be surrendered in exchange for awards with a higher or lower exercise price.
Stock Options. Stock options may be granted under our 2017 Plan. The exercise price of options granted under our 2017 Plan must at least be equal to the fair value of our common stock on the date of grant. The term of an incentive stock option may not exceed 10 years, except that with respect to any participant who owns more than 10% of the voting power of all classes of our outstanding stock, the term must not exceed five years and the exercise price must equal at least 110% of the fair value on the grant date. Subject to the provisions of our 2017 Plan, the administrator will determine the term of all other options.
After the termination of service of an employee, director or consultant, he or she may exercise his or her option for the period of time stated in his or her award agreement. Generally, if termination is due to death or disability, the option will remain exercisable for twelve months. In all other cases, the option will generally remain exercisable for three months following the termination of service. However, in no event may an option be exercised later than the expiration of its term.
Stock Appreciation Rights. Stock appreciation rights may be granted under our 2017 Plan. Stock appreciation rights allow the recipient to receive the appreciation in the fair value of our common stock between the exercise date and the date of grant. Subject to the provisions of our 2017 Plan, the administrator will determine the terms of stock appreciation rights, including when such rights become exercisable and whether to pay any increased appreciation in cash or with shares of our common stock, or a combination thereof, except that the per share exercise price for the shares to be issued pursuant to the exercise of a stock appreciation right will be no less than 100% of the fair value per share on the date of grant. After the termination of service of an employee, director or consultant, he or she may exercise his or her stock appreciation right for the period of time stated in his or her award agreement. Generally, stock appreciation rights will be subject to the same post-termination exercise restrictions as options as described above.
Restricted Stock. Restricted stock may be granted under our 2017 Plan. Restricted stock awards are grants of shares of our common stock that vest in accordance with terms and conditions established by the administrator. The administrator will determine the number of shares of restricted stock granted and may impose whatever conditions to vesting it determines to be appropriate (for example, the administrator may set restrictions based on the achievement of specific performance goals or continued service to us). The administrator, in its sole discretion, may accelerate the time at which any restrictions will lapse or be removed. Shares of restricted stock that do not vest are subject to our right of repurchase or forfeiture.
Restricted Stock Units. Restricted stock units may be granted under our 2017 Plan. Restricted stock units are bookkeeping entries representing an amount equal to the fair value of one share of our common stock. The administrator will determine the terms and conditions of restricted stock units, including the number of units granted, the vesting criteria (which may include accomplishing specified performance criteria or continued service to us), and the form and timing of payment. The administrator, in its sole discretion, may accelerate the time at which any restrictions will lapse or be removed.
Performance Units and Performance Shares. Performance units and performance shares may be granted under our 2017 Plan. Performance units and performance shares are awards that will result in a payment to a participant only if performance goals established by the administrator are achieved or the awards otherwise vest. The administrator will establish organizational or individual performance goals in its discretion, which, depending on the extent to which they are met, will determine the number and/or the value of performance units and performance shares to be paid out to participants. After the grant of a performance unit or performance share, the administrator, in its sole discretion, may reduce or waive any performance objectives or other vesting provisions for such performance units or performance shares. The administrator, in its sole discretion, may pay earned performance units or performance shares in the form of cash, in shares, or in some combination thereof.
131
Table of Contents
Non-Employee Directors. Our 2017 Plan will provide that all non-employee directors will be eligible to receive all types of awards (except for incentive stock options) under the 2017 Plan. In order to provide an annual maximum limit on the awards that can be made to our non-employee directors, our 2017 Plan will provide that in any given year a non-employee director will not receive awards having a grant-date fair value greater than $500,000, increased to $1,000,000 in connection with his or her initial service, as determined under GAAP. The maximum limits do not reflect the intended size of any potential grants or a commitment to make grants to our non-employee directors under our 2017 Plan in the future.
Non-Transferability of Awards. Unless the administrator provides otherwise, our 2017 Plan generally will not allow for the transfer of awards, and only the recipient of an award may exercise an award, if applicable, during his or her lifetime.
Certain Adjustments. In the event of certain changes in our capitalization as set forth in our 2017 Plan, to prevent diminution or enlargement of the benefits or potential benefits available under our 2017 Plan, the administrator will adjust the number and class of shares that may be delivered under our 2017 Plan and/or the number, class and price of shares covered by each outstanding award, and the numerical share limits set forth in our 2017 Plan in such a manner as it deems equitable.
Dissolution or Liquidation. In the event of our proposed liquidation or dissolution, the administrator will notify participants that all awards will terminate immediately prior to the consummation of such proposed transaction to the extent not exercised.
Merger or Change in Control. Our 2017 Plan will provide that in the event of a merger or change in control, as defined in the 2017 Plan, each outstanding award will be treated as the administrator determines, except that if a successor corporation or its subsidiary does not continue any outstanding award in accordance with the 2017 Plan, then such award will fully vest, all restrictions will lapse, all performance goals or other vesting criteria will be deemed achieved at 100% of target levels and the award will become fully exercisable, as applicable. If the service of an outside director is terminated on or following a change in control, other than pursuant to a voluntary resignation, his or her options, stock appreciation rights and restricted stock units, if any, will vest and become immediately exercisable, all restrictions on his or her restricted stock will lapse, all performance goals or other vesting requirements for his or her performance shares and units will be deemed achieved at 100% of target levels and all other terms and conditions will be deemed met, as applicable.
Forfeiture and Clawback. All awards granted under our 2017 Plan are subject to recoupment under any clawback policy that we are required to adopt under applicable law. In addition, the administrator may provide in an award agreement that the recipient’s rights, payments, and benefits with respect to such award shall be subject to reduction, cancellation, forfeiture, or recoupment upon the occurrence of specified events. In the event of any accounting restatement, the recipient of an award will be required to repay a portion of the proceeds received in connection with the settlement of an award earned or accrued under certain circumstances.
Amendment; Termination. Our ability to grant incentive stock options under the 2017 Plan and the automatic increase in shares under the 2017 will expire in 2027. The 2017 Plan will not expire until terminated by the administrator, which has the authority to amend, suspend, or terminate our 2017 Plan, provided such action does not materially impair the existing rights of any participant, subject to certain exceptions in accordance with the terms of our 2017 Plan.
132
Table of Contents
2017 Employee Stock Purchase Plan
Our board of directors has adopted, and we expect our stockholders will approve, our 2017 Employee Stock Purchase Plan, or ESPP, prior to the completion of this offering. Subject to stockholder approval, the ESPP will become effective on the date of its adoption by our board of directors. We believe that allowing our employees to participate in the ESPP provides them with a further incentive towards ensuring our success and accomplishing our corporate goals.
Authorized Shares. A total of 907,000 shares of our common stock will be made available for sale under the ESPP. In addition, our ESPP provides for annual increases in the number of shares available for issuance under the plan on the first day of each fiscal year beginning in 2019, equal to the least of:
| • | 907,000 shares; |
| • | 1.0% of the outstanding shares of our common stock on the last day of our immediately preceding year; or |
| • | an amount determined by the ESPP’s administrator. |
Plan Administration. Our compensation committee will administer the ESPP, and will have full and exclusive authority to interpret the terms of the plan and determine eligibility to participate, subject to the conditions of the plan as described below.
Eligibility. Generally, all of our employees will be eligible to participate if they are employed by us, or any designated subsidiary, for at least 20 hours per week and more than five months in any calendar year. However, an employee may not be granted rights to purchase stock under the ESPP if such employee:
| • | immediately after the grant would own stock possessing 5% or more of the total combined voting power or value of all classes of our capital stock; or |
| • | hold rights to purchase stock under all of our employee stock purchase plans that accrue at a rate that exceeds $25,000 worth of stock for each calendar year. |
Offering Periods. Our ESPP includes a component that allows us to make offerings intended to qualify under Section 423 of the Code and a component that allows us to make offerings not intended to qualify under Section 423 of the Code to designated companies, as described in our ESPP. Our ESPP provides for consecutive, overlapping 24-month offering periods. The offering periods are scheduled to start on the first trading day on or after March 20 and September 20 of each year, except for the first offering period, which will commence on the effective date of the registration statement of which this prospectus forms a part and will end on the first trading day on or before September 20, 2019, and the second offering period, which will commence on the first trading day on or after September 20, 2017. Each offering period will include purchase periods, which will commence on or after March 20 and September 20 and end on the first trading date on or after September 20 and March 20, respectively; provided, however, that the first exercise date under the ESPP will be the first trading day on or after March 20, 2018.
Our ESPP will permit participants to purchase shares of common stock through payroll deductions of up to 15.0% of their eligible compensation. A participant may purchase a maximum of 2,000 shares during each purchase period.
Exercise of Purchase Right. Amounts deducted and accumulated by the participant will be used to purchase shares of our common stock at the end of each purchase period. The purchase price of the shares will be 85.0% of the lower of the fair value of our common stock on the first trading day of each offering period or on the purchase date. If the fair value of our common stock on the exercise date is less than the fair value on the first trading day of the offering period, participants will be withdrawn from the current offering period following their purchase of shares of our common stock on the purchase date and will be automatically re-enrolled in a new
133
Table of Contents
offering period. Participants may end their participation at any time during an offering period and will be paid their accrued contributions that have not yet been used to purchase shares of common stock. Participation will end automatically upon termination of employment with us.
Non-Transferability. A participant may not transfer rights granted under the ESPP. If the compensation committee permits the transfer of rights, it may only be done by will, the laws of descent and distribution, or as otherwise provided under the ESPP.
Merger or Change in Control. In the event of our merger or change in control, as defined under the ESPP, a successor corporation may assume or substitute each outstanding purchase right. If the successor corporation refuses to assume or substitute for the outstanding purchase right, the offering period then in progress will be shortened, and a new exercise date will be set. The administrator will notify each participant that the exercise date has been changed and that the participant’s option will be exercised automatically on the new exercise date unless prior to such date the participant has withdrawn from the offering period.
Amendment; Termination. Our ESPP will automatically terminate in 2037, unless we terminate it sooner. Our board of directors will have the authority to amend, suspend, or terminate our ESPP, except that, subject to certain exceptions described in the ESPP, no such action may adversely affect any outstanding rights to purchase stock under our ESPP.
2008 Stock Plan
Our board of directors and our stockholders adopted our 2008 Stock Plan, or 2008 Plan, in August 2008. Our 2008 Plan was most recently amended in May 2017 to increase the shares of common stock reserved for issuance by an additional 2,487,194 shares. Our 2008 Plan will be terminated prior to the effectiveness of our 2017 Plan, and accordingly, no new awards will be granted under our 2008 Plan following its termination. All outstanding awards under our 2008 Plan will continue to be governed by their existing terms. As of April 30, 2017, options to purchase 3,979,170 shares of our common stock remained outstanding under our 2008 Plan at a weighted-average exercise price of approximately $21.46 per share (prior to the repricing of our stock options described below), 1,020,230 RSUs remained outstanding under our 2008 Plan and no shares of restricted stock remained outstanding under our 2008 Plan. In May 2017, we repriced outstanding and unexercised stock options held by current service providers covering a total of 3,291,783 shares of our common stock with a weighted average exercise price of $24.31 per share, to a new exercise price of $13.68 per share, which is no less than the fair value of our common stock as determined by our compensation committee on such date. Except as described in this paragraph below, options, restricted stock and RSUs granted under our 2008 Plan are subject to terms generally similar to those described above with respect to options, restricted stock and RSUs that may be granted under our 2017 Plan. Upon a termination of service, shares underlying an option granted under our 2008 Plan may be subject to a repurchase right by us, and upon a notification to the participant of termination by us for “cause” (as defined in the 2008 Plan), an option will terminate immediately, and the shares acquired under the option will be subject to certain forfeiture rights in favor of us. In addition, for certain participants, upon a termination of service for cause, we will have the right to repurchase the participant’s shares of restricted stock that have previously vested under certain circumstances. In the event of a “corporate transaction” (as defined in the 2008 Plan), the administrator of our 2008 Plan may, in its discretion, (i) provide for the assumption or substitution of, or adjustment to, each outstanding award by the successor corporation or a parent or subsidiary of the successor corporation; (ii) accelerate the vesting and termination of outstanding awards; and/or (iii) provide for termination of awards on such terms and conditions as it deems appropriate, including providing for the cancellation of awards for a cash payment to the award holder. Our 2008 Plan generally does not allow for the transfer of awards and only the recipient of an award may exercise the award during his or her lifetime. Our board of directors may amend our 2008 Plan at any time, provided that such amendment does not materially or adversely affect the rights of any participant under any outstanding award without the participant’s written consent.
134
Table of Contents
Executive Incentive Compensation Plan
Our compensation committee adopted an Executive Incentive Compensation Plan, which we refer to as our Bonus Plan. Our Bonus Plan gives our compensation committee, in its discretion, the ability to grant future incentive awards (payable in cash or grants of equity awards) to selected employees, including our named executive officers, based upon the achievement of performance goals established by our compensation committee. Pursuant to the Bonus Plan, our compensation committee, in its sole discretion, may establish a target award for each participant and a bonus pool, with actual awards payable from such bonus pool, with respect to the applicable performance period. Under the Bonus Plan, our compensation committee, in its sole discretion, determines the performance goals applicable to awards, which goals may include, without limitation: attainment of research and development milestones, sales bookings, business divestitures and acquisitions, cash flow, cash position, earnings (which may include any calculation of earnings, including but not limited to earnings before interest and taxes, earnings before taxes, earnings before interest, taxes, depreciation and amortization and net earnings), earnings per share, net income, net profit, net sales, operating cash flow, operating expenses, operating income, operating margin, overhead or other expense reduction, product defect measures, product release timelines, productivity, profit, return on assets, return on capital, return on equity, return on investment, return on sales, revenue, revenue growth, sales results, sales growth, stock price, time to market, total stockholder return, working capital, and individual objectives such as MBOs, peer reviews or other subjective or objective criteria. As determined by our compensation committee, performance goals that include our financial results may be determined in accordance with GAAP or non-GAAP financial measures and any actual results may be adjusted by our compensation committee for one-time items or unbudgeted or unexpected items and/or payments under the Bonus Plan when determining whether the performance goals have been met. The goals may be on the basis of any factors our compensation committee determines relevant, and may be on an individual, divisional, business unit, or company-wide basis. The performance goals may differ from participant to participant and from award to award.
Our compensation committee may, in its sole discretion and at any time, increase, reduce or eliminate a participant’s actual award or the amount allocated to the bonus pool for a particular performance period. The actual award may be below, at, or above a participant’s target award, in our compensation committee’s discretion. Our compensation committee may determine the amount of any increase, reduction or elimination on the basis of such factors as it deems relevant, and it will not be required to establish any allocation or weighting with respect to the factors it considers.
Actual awards will generally be paid in cash (or its equivalent) in a single lump sum as soon as practicable after the end of the performance period during which they are earned and after they are approved by our compensation committee, but in no event later than the later of March 15th of the following calendar year or the 15th day of the third month of the following fiscal year. Unless otherwise determined by our compensation committee, to earn an actual award, a participant must be employed by us (or an affiliate of ours) through the date the award is paid.
Our board of directors or our compensation committee, in their sole discretion, may alter, suspend, or terminate the Bonus Plan, provided such action does not, without the consent of the participant, alter or impair the rights or obligations under any award already earned by such participant.
401(k) Plan
We maintain a tax-qualified retirement plan, or the 401(k) plan, that provides eligible employees with an opportunity to save for retirement on a tax-advantaged basis. Eligible employees are able to participate in the 401(k) plan as of the first day of the month following the date they meet the 401(k) plan’s eligibility requirements, and participants are able to defer eligible compensation up to applicable annual Internal Revenue Code limits. All participants’ interests in their deferrals are 100% vested when contributed.
135
Table of Contents
The 401(k) plan permits us to make matching contributions and profit sharing contributions to eligible participants, although we have not made any such contributions to date.
Limitation on Liability and Indemnification Matters
Our amended and restated certificate of incorporation and amended and restated bylaws, each to be effective immediately prior to the completion of this offering, will provide that we will indemnify our directors and officers and may indemnify our employees and other agents, to the fullest extent permitted by the Delaware General Corporation Law, which prohibits our amended and restated certificate of incorporation from limiting the liability of our directors for the following:
| • | any breach of the director’s duty of loyalty to us or to our stockholders; |
| • | acts or omissions not in good faith or that involve intentional misconduct or a knowing violation of law; |
| • | unlawful payment of dividends or unlawful stock repurchases or redemptions; and |
| • | any transaction from which the director derived an improper personal benefit. |
If Delaware law is amended to authorize corporate action further eliminating or limiting the personal liability of a director, then the liability of our directors will be eliminated or limited to the fullest extent permitted by Delaware law, as so amended. Our amended and restated certificate of incorporation does not eliminate a director’s duty of care and in appropriate circumstances, equitable remedies, such as injunctive or other forms of non-monetary relief, remain available under Delaware law. This provision also does not affect a director’s responsibilities under any other laws, such as the federal securities laws or other state or federal laws. Under our amended and restated bylaws, we will also be empowered to purchase insurance on behalf of any person whom we are required or permitted to indemnify.
In addition to the indemnification required in our amended and restated certificate of incorporation and amended and restated bylaws, we plan to enter into indemnification agreements with each of our current directors, officers and some employees before the completion of this offering. These agreements will provide indemnification for certain expenses and liabilities incurred in connection with any action, suit, proceeding or alternative dispute resolution mechanism, or hearing, inquiry or investigation that may lead to the foregoing, to which they are a party, or are threatened to be made a party, by reason of the fact that they are or were a director, officer, employee, agent or fiduciary of our company, or any of our subsidiaries, by reason of any action or inaction by them while serving as an officer, director, agent or fiduciary, or by reason of the fact that they were serving at our request as a director, officer, employee, agent or fiduciary of another entity. In the case of an action or proceeding by, or in the right of, our company or any of our subsidiaries, no indemnification will be provided for any claim where a court determines that the indemnified party is prohibited from receiving indemnification. We believe that these bylaw provisions and indemnification agreements are necessary to attract and retain qualified persons as directors and officers. We also maintain directors’ and officers’ liability insurance.
The limitation of liability and indemnification provisions in our amended and restated certificate of incorporation and amended and restated bylaws may discourage stockholders from bringing a lawsuit against directors for breach of their fiduciary duties. They may also reduce the likelihood of derivative litigation against directors and officers, even though an action, if successful, might benefit us and our stockholders. A stockholder’s investment may be harmed to the extent we pay the costs of settlement and damage awards against directors and officers pursuant to these indemnification provisions. Insofar as we may provide indemnification for liabilities arising under the Securities Act to our directors, officers and controlling persons pursuant to the foregoing provisions, or otherwise, we have been advised that, in the opinion of the SEC, such indemnification is against public policy as expressed in the Securities Act and is, therefore, unenforceable. There is no pending litigation or proceeding naming any of our directors or officers as to which indemnification is being sought, nor are we aware of any pending or threatened litigation that may result in claims for indemnification by any director or officer.
136
Table of Contents
CERTAIN RELATIONSHIPS AND RELATED PARTY AND OTHER TRANSACTIONS
The following is a description of certain relationships and transactions since January 1, 2014 involving our directors, executive officers or beneficial holders of more than 5% of our capital stock. Compensation arrangements and indemnification arrangements with our directors and officers are described in “Management— Director Compensation,” “Executive Compensation” and “Management.”
Private Placements
Series F Preferred Stock Financing
In July 2015, we issued and sold an aggregate of 2,828,185 shares of our Series F preferred stock at a purchase price of $44.04 per share, for an aggregate purchase price of approximately $124.6 million. Purchasers of our Series F preferred stock include certain of our named executive officers and venture capital funds that beneficially own 5% or more of our outstanding capital stock and/or were represented on our board of directors. The following table presents the number of shares and the total purchase price paid by only these persons and entities and not the total number of shares and total purchase price paid by all investors in this financing:
| Investor |
Shares of Series F Preferred Stock |
Total Purchase Price |
||||||
| Entities affiliated with Silver Lake(1) |
1,521,343 | $ | 67,000,004 | |||||
| Entities affiliated with Insight Venture Partners(2) |
567,663 | $ | 25,000,004 | |||||
| New Enterprise Associates 12, Limited Partnership(3) |
340,599 | $ | 15,000,002 | |||||
| Lightspeed Venture Partners VIII, L.P.(4) |
113,533 | $ | 5,000,001 | |||||
| H.C. Jones Living Trust(5) |
11,353 | $ | 500,001 | |||||
| Ken Klein |
6,812 | $ | 300,000 | |||||
| Ian Halifax |
4,541 | $ | 200,000 | |||||
| (1) | Entities affiliated with Silver Lake holding our securities whose shares are aggregated for purposes of reporting share ownership information include Silver Lake Kraftwerk Fund, L.P. and Silver Lake Technology Investors Kraftwerk, L.P. Adam Grosser, a member of our board of directors, is affiliated with Silver Lake. |
| (2) | Entities affiliated with Insight Venture Partners holding our securities whose shares are aggregated for purposes of reporting share ownership information include Insight Venture Partners VIII, L.P., Insight Venture Partners (Delaware) VIII, L.P., Insight Venture Partners (Cayman) VIII, L.P., Insight Venture Partners VIII (Co-Investors), L.P. and Star Trinity, L.P. Jeffrey Horing, a former member of our board of directors, is affiliated with Insight Venture Partners and Star Trinity, L.P. |
| (3) | Peter Sonsini, a member of our board of directors, is affiliated with New Enterprise Associates 12, Limited Partnership. |
| (4) | Christopher Schaepe, a member of our board of directors, is affiliated with Lightspeed Venture Partners VIII, L.P. or Lightspeed. |
| (5) | Harvey Jones, a member of our board of directors, is affiliated with the H.C. Jones Living Trust. |
Series E Preferred Stock Financing
In January 2014, we issued and sold an aggregate of 1,641,662 shares of our Series E preferred stock at a purchase price of $43.47828 per share, for an aggregate purchase price of approximately $71.4 million. Purchasers of our Series E preferred stock include venture capital funds that beneficially own 5% or more of our outstanding capital stock and/or were represented on our board of directors. The following table presents the number of shares and the total purchase price paid by only these entities and not the total number of shares and total purchase price paid by all investors in this financing:
| Investor |
Shares of Series E Preferred Stock |
Total Purchase Price |
||||||
| Entities affiliated with Insight Venture Partners(1) |
919,998 | $ | 40,000,003 | |||||
| New Enterprise Associates 12, Limited Partnership(2) |
421,867 | $ | 18,342,081 | |||||
| Lightspeed Venture Partners VIII, L.P.(3) |
208,331 | $ | 9,057,874 | |||||
137
Table of Contents
| (1) | Entities affiliated with Insight Venture Partners holding our securities whose shares are aggregated for purposes of reporting share ownership information include Insight Venture Partners VIII, L.P., Insight Venture Partners (Delaware) VIII, L.P., Insight Venture Partners (Cayman) VIII, L.P. and Insight Venture Partners VIII (Co-Investors), L.P. Jeffrey Horing, a former member of our board of directors, is affiliated with Insight Venture Partners. |
| (2) | Peter Sonsini, a member of our board of directors, is affiliated with New Enterprise Associates 12, Limited Partnership. |
| (3) | Christopher Schaepe, a member of our board of directors, is affiliated with Lightspeed. |
Series E-1 Preferred Stock Financing
In January 2014, we issued and sold an aggregate of 83,333 shares of our Series E-1 preferred stock at a purchase price of $43.47828 per share, for an aggregate purchase price of approximately $3.6 million. The purchaser of our Series E-1 preferred stock is a venture capital fund that beneficially owns 5% or more of our outstanding capital stock and/or was represented on our board of directors. The following table presents the number of shares and the total purchase price paid by only this entity and not the total number of shares and total purchase price paid by all investors in this financing:
| Investor |
Shares of Series E-1 Preferred Stock |
Total Purchase Price |
||||||
| Lightspeed Venture Partners VIII, L.P.(1) |
83,333 | $ | 3,623,190 | |||||
| (1) | Christopher Schaepe, a member of our board of directors, is affiliated with Lightspeed. |
For information on amendments to the common stock conversion ratios applicable to the Series E, E-1 and F preferred stock, see “—Issuance of Common Stock and Warrants.”
Investors’ Rights Agreement
In July 2015, we entered into an amended and restated investors’ rights agreement with the holders of our preferred stock, including Ken Klein, our Chairman and Chief Executive Officer and a member of our board of directors, Ian Halifax, our Chief Financial Officer, and Kieran Harty, our Chief Technology Officer and a member of our board of directors, Cari Harty, Mr. Harty’s spouse, and entities affiliated with each of Insight Venture Partners, Lightspeed, NEA and Silver Lake, each of which beneficially owns 5% or more of our capital stock or with which certain of our directors or former director are affiliated. This agreement provides, among other things, that the holders of our preferred stock have the right to request that we file a registration statement or request that their shares be covered by a registration statement that we are otherwise filing, subject to certain exceptions. For a description of these registration rights, see “Description of Capital Stock—Registration Rights.”
Loans to Executive Officers
We entered into a partially recourse note and security agreement with Ken Klein, our Chairman and Chief Executive Officer and a member of our board of directors, in October 2013. In connection with this promissory note, we loaned Mr. Klein $6,398,302 for the purchase price of 687,989 shares of our common stock issued pursuant to the exercise of stock options held by Mr. Klein. This loan bore interest at the rate of 1.92% per annum. As of April 30, 2017, the outstanding balance of this loan was $6,843,971. On June 1, 2017, Mr. Klein repaid this loan in full through our repurchase of 501,104 shares of his common stock. Such shares were valued at $13.68 per share, which is the fair value of our common stock as determined by the compensation committee of our board of directors on the date of repurchase.
We entered into a full recourse note and security agreement with Ian Halifax, our Chief Financial Officer, in December 2013. In connection with this promissory note, we loaned Mr. Halifax $1,144,412 for the purchase price of 123,055 shares of our common stock issued pursuant to the exercise of a stock option held by
138
Table of Contents
Mr. Halifax. This loan bore interest at the rate of 1.64% per annum. As of April 30, 2017, the outstanding balance of this loan was $1,209,283. On June 1, 2017, Mr. Halifax repaid this loan in full through our repurchase of 88,520 shares of his common stock. Such shares were valued at $13.68 per share, which is the fair value of our common stock as determined by the compensation committee of our board of directors on the date of repurchase.
Note Purchase Agreement
In May 2017, we entered into a Note Purchase Agreement with certain of our preferred stockholders pursuant to which such stockholders have agreed to purchase from us, and we have agreed to sell to such stockholders, one or more subordinated convertible promissory notes, or Notes, having a maximum aggregate principal amount of $25 million. Parties to the Note Purchase Agreement include venture capital funds that beneficially own 5% or more of our outstanding capital stock and/or were represented on our board of directors. Subject to the terms and conditions set forth in the Note Purchase Agreement, the Notes may be issued and sold in one or more tranches in aggregate amounts to be determined by us pursuant to approval of a majority of the members of the our board of directors. Within 30 days of us providing a written notice to the relevant stockholders that we intend to draw funds under a tranche, the stockholders are required to purchase their applicable amount of Notes. The following table presents the aggregate principal amount of Notes that such stockholders have committed to purchase in one or more closings under the Note Purchase Agreement:
| Investor |
Aggregate Principal Amount |
|||
| New Enterprise Associates 12, Limited Partnership(1) |
$ | 9,525,836 | ||
| Lightspeed Venture Partners VIII, L.P.(2) |
$ | 6,280,682 | ||
| Entities affiliated with Silver Lake(3) |
$ | 3,806,865 | ||
| Entities affiliated with Insight Venture Partners(4) |
$ | 3,722,591 | ||
| (1) | Peter Sonsini, a member of our board of directors, is affiliated with New Enterprise Associates 12, Limited Partnership. |
| (2) | Christopher Schaepe, a member of our board of directors, is affiliated with Lightspeed Venture Partners VIII, L.P. |
| (3) | Entities affiliated with Silver Lake holding our securities whose shares are aggregated for purposes of reporting share ownership information include Silver Lake Kraftwerk Fund, L.P. and Silver Lake Technology Investors Kraftwerk, L.P. Adam Grosser, a member of our board of directors, is affiliated with Silver Lake. |
| (4) | Entities affiliated with Insight Venture Partners holding our securities whose shares are aggregated for purposes of reporting share ownership information include Insight Venture Partners VIII, L.P., Insight Venture Partners (Delaware) VIII, L.P., Insight Venture Partners (Cayman) VIII, L.P., Insight Venture Partners VIII (Co-Investors), L.P. and Star Trinity, L.P. Jeffrey Horing, a former member of our board of directors, is affiliated with Insight Venture Partners. |
As of the date hereof, no Notes have been issued and sold under the Note Purchase Agreement. The obligations of us to issue and the stockholders to purchase Notes will expire upon the earliest to occur of (i) April 30, 2018, (ii) the closing of the initial public offering of our common stock, or (iii) our issuance and sale of equity or debt securities for aggregate gross proceeds of at least $25.0 million.
If and when issued, the Notes will have an interest rate of 5.0% per annum and will mature one year from the date of issuance. If we issue and sell shares of preferred stock for aggregate gross proceeds of at least $20 million (a “Qualified Financing”), prior to the maturity of the Notes, the Notes will convert into shares of our preferred stock at a price equal to 90% of the purchase price per share in the Qualified Financing. If we issue and sell shares of preferred stock in a financing that does not constitute a Qualified Financing, then upon the election of the holders of at least 66 and 2/3% of the aggregate principal amount of Notes, the Notes will convert into shares of preferred stock at a price equal to the purchase price per share in such non-Qualified Financing. If we complete the initial public offering of our common stock prior to a financing transaction or the repayment of the Notes, the Notes will convert into shares of our common stock at a price equal to 90% of the offering price per share in such offering.
The Notes may not be prepaid without the written consent of holders of 2/3 of the aggregate outstanding principal amount of Notes. In the event of a change of control of the company, as defined in the Note Purchase
139
Table of Contents
Agreement, the outstanding principal amount of the Notes, plus all accrued and unpaid interest, in each case that has not otherwise been converted into equity securities, will be due and payable immediately prior to the closing of such change of control together with a premium equal to 50% of the outstanding principal amount to be prepaid.
Issuance of Common Stock and Warrants
In June 2017, we amended our certificate of incorporation to eliminate certain variable rate anti-dilution adjustments to the conversion ratios of the Series E, E-1 and F preferred stock that would otherwise result from the issuance of shares in this offering and replace them with certain fixed conversion ratios for purposes of this offering. Pursuant to these fixed conversion ratios, an additional 7,382,007 shares of our common stock will be issued to holders of our Series E, E-1 and F preferred stock, as well as holders of our newly created shares of E-2 and F-2 preferred stock, who we refer to as the Series E-2 and F-2 Holders, upon the conversion of their shares immediately prior to the closing of this offering. We also issued warrants to purchase up to 1,666,665 shares of common stock to the Series E-2 and F-2 Holders. The warrants have a term of ten years from the date of grant and have an exercise price of $16.44 per share, which represents 1.2x the fair value of our common stock as of the date of grant. The warrants may be exercised on a cashless basis. The issuance of additional shares of common stock and the exercisability of the warrants shall occur only in the event that we conduct an IPO on or before July 30, 2017.
Stockholders participating in the foregoing transactions include members of our board of directors and executive officers, as well as venture capital funds that beneficially own 5% or more of our outstanding capital stock and/or were represented on our board of directors. The following table summarizes the issuance of common stock and warrants to purchase common stock to related persons:
| Number of Additional Shares of Common Stock |
Number of Shares Purchasable Upon Exercise of Warrants | |||||||||
| Entities affiliated with Silver Lake Kraftwerk(1) |
3,042,678 | — | ||||||||
| Entities affiliated with Insight Venture Partners(2) |
2,975,316 | — | ||||||||
| New Enterprise Associates 12, Limited Partnership(3) |
520,107 | 971,224 | ||||||||
| Lightspeed Venture Partners VIII, L.P.(4) |
276,399 | 516,137 | ||||||||
| Entities affiliated with Menlo Ventures(5) |
96,108 | 179,304 | ||||||||
| H.C. Jones Living Trust(6) |
22,705 | — | ||||||||
| Ken Klein |
13,623 | — | ||||||||
| Ian Halifax |
9,081 | — | ||||||||
| (1) | Entities affiliated with Silver Lake holding our securities whose shares are aggregated for purposes of reporting share ownership information include Silver Lake Kraftwerk Fund, L.P. and Silver Lake Technology Investors Kraftwerk, L.P. Adam Grosser, a member of our board of directors, is affiliated with Silver Lake. |
| (2) | Entities affiliated with Insight Venture Partners holding our securities whose shares are aggregated for purposes of reporting share ownership information include Insight Venture Partners VIII, L.P., Insight Venture Partners (Delaware) VIII, L.P., Insight Venture Partners (Cayman) VIII, L.P., Insight Venture Partners VIII (Co-Investors), L.P. and Star Trinity, L.P. Jeffrey Horing, a former member of our board of directors, is affiliated with Insight Venture Partners. |
| (3) | Peter Sonsini, a member of our board of directors, is affiliated with New Enterprise Associates 12, Limited Partnership. |
| (4) | Christopher Schaepe, a member of our board of directors, is affiliated with Lightspeed Venture Partners VIII, L.P. |
| (5) | Entities affiliated with Menlo Ventures whose shares are aggregated for purposes of reporting share ownership information include Menlo Ventures XI, L.P. and MMEF XI, L.P. |
| (6) | Harvey Jones, a member of our board of directors, is affiliated with the H.C. Jones Living Trust. |
Participation in this Offering
Certain of our existing stockholders, including entities affiliated with Lightspeed Venture Partners, New Enterprise Associates and Silverlake Kraftwerk, who are affiliated with members of our board of directors, and
140
Table of Contents
entities affiliated with Insight Venture Partners and Menlo Ventures, have indicated an interest in purchasing up to an aggregate of approximately $23.0 million in shares of our common stock in this offering at the initial public offering price. However, because indications of interest are not binding agreements or commitments to purchase, the underwriters may determine to sell more, less or no shares in this offering to any of these stockholders, or any of these stockholders may determine to purchase more, less or no shares in this offering.
Policies and Procedures for Related Party Transactions
Immediately following the completion of this offering, the audit committee will have the primary responsibility for reviewing and approving or disapproving “related party transactions,” which are transactions between us and related persons in which the aggregate amount involved exceeds or may be expected to exceed $120,000 and in which a related person has or will have a direct or indirect material interest. For purposes of this responsibility, a related person will be defined as a director, executive officer, nominee for director or a stockholder who beneficially owns greater than 5% of our outstanding common stock and their affiliates, in each case since the beginning of the most recently completed fiscal year, and their immediate family members. Our audit committee charter will provide that the audit committee shall review and approve or disapprove any related party transactions. As of the date of this prospectus, we have not adopted any formal standards, responsibilities or procedures governing the review and approval of related-party transactions, but we expect that our audit committee will do so in the future.
141
Table of Contents
The following table sets forth certain information with respect to the beneficial ownership of our common stock at May 31, 2017, after giving effect to the automatic conversion of all outstanding shares of our convertible preferred stock into shares of common stock, and as adjusted to reflect the sale of common stock in this offering, for:
| • | each person, or group of affiliated persons, who beneficially owned more than 5% of our common stock; |
| • | each of our directors; |
| • | each of our named executive officers; and |
| • | all of our current directors and executive officers as a group. |
Certain of our existing stockholders, including entities affiliated with Lightspeed Venture Partners, New Enterprise Associates, Silverlake Kraftwerk, Insight Venture Partners and Menlo Ventures, have indicated an interest in purchasing up to an aggregate of approximately $23.0 million in shares of our common stock in this offering at the initial public offering price. The information set forth in the table below does not reflect the potential purchase of any shares in this offering by these stockholders.
We have determined beneficial ownership in accordance with the rules of the SEC, and the information is not necessarily indicative of beneficial ownership for any other purpose. Except as indicated by the footnotes below, we believe, based on information furnished to us, that the persons and entities named in the table below have sole voting and sole investment power with respect to all shares of common stock that they beneficially owned, subject to applicable community property laws.
Applicable percentage ownership prior to this offering is based on 21,750,430 shares of common stock (reflecting the amendment to our amended and restated certificate of incorporation on June 1, 2017) outstanding at May 31, 2017, after giving effect to the conversion of all outstanding shares of convertible preferred stock into shares of common stock, and assumes the repurchase of 589,624 shares of our common stock on June 1, 2017. Applicable percentage ownership of our common stock after this offering is based on 21,750,430 shares of common stock (reflecting the amendment to our amended and restated certificate of incorporation on June 1, 2017) outstanding at May 31, 2017, after giving effect to (i) the conversion of all outstanding shares of convertible preferred stock into shares of common stock, (ii) the repurchase of 589,624 shares of our common stock on June 1, 2017, and (iii) the sale by us of shares of common stock in this offering, assuming that the underwriters do not exercise their option to purchase additional shares. In computing the number of shares of common stock beneficially owned by a person and the percentage ownership of such person, we deemed to be outstanding all shares of common stock subject to equity awards and warrants held by the person that are currently exercisable or exercisable within 60 days of May 31, 2017 assuming any performance condition has been achieved as of such date. We did not deem such shares outstanding, however, for the purpose of computing the percentage ownership of any other person.
142
Table of Contents
Unless otherwise indicated, the address of each beneficial owner listed in the table below is c/o Tintri, Inc., 303 Ravendale Drive, Mountain View, CA 94043.
| Shares Beneficially Owned Prior to the Offering |
Shares Beneficially Owned After the Offering |
|||||||||||||||
| Name of Beneficial Owner |
Number of Shares |
% | Number of Shares |
% | ||||||||||||
| 5% Stockholders: |
||||||||||||||||
| Entities affiliated with New
Enterprise |
5,298,154 | 23.3 | % | 5,298,154 | 16.9 | % | ||||||||||
| Entities affiliated with Silver
Lake |
4,564,021 | 21.0 | % | 4,564,021 | 15.0 | % | ||||||||||
| Entities affiliated with Insight Venture |
4,503,790 | 20.7 | % | 4,503,790 | 14.8 | % | ||||||||||
| Lightspeed Venture Partners VIII, L.P.(4)(14) |
3,302,494 | 14.8 | % | 3,302,494 | 10.7 | % | ||||||||||
| Named Executive Officers and Directors: |
||||||||||||||||
| Ken Klein(5) |
865,839 | 3.9 | % | 865,839 | 2.8 | % | ||||||||||
| Ian Halifax(6) |
167,145 | * | 167,145 | * | ||||||||||||
| Michael McGuire(7) |
84,583 | * | 84,583 | * | ||||||||||||
| John Bolger(8) |
11,545 | * | 11,545 | * | ||||||||||||
| Charles Giancarlo(9) |
6,076 | * | 6,076 | * | ||||||||||||
| Adam Grosser |
— | * | — | * | ||||||||||||
| Kieran Harty(10) |
1,854,270 | 8.5 | % | 1,854,270 | 6.1 | % | ||||||||||
| Harvey Jones(11) |
70,168 | * | 70,168 | * | ||||||||||||
| Christopher Schaepe(12)(14) |
3,302,494 | 14.8 | % | 3,302,494 | 10.7 | % | ||||||||||
| Peter Sonsini |
— | * | — | * | ||||||||||||
| All executive officers and directors as a group (10 persons)(13) |
6,362,120 | 27.2 | % | 6,362,120 | 19.9 | % | ||||||||||
| * | Represents beneficial ownership of less than one percent (1%). |
| (1) | Consists of (i) 3,801,823 shares held of record by New Enterprise Associates 12, Limited Partnership (“NEA 12”), (ii) 5,000 shares held of record by NEA Ventures 2008, Limited Partnership (“Ven 2008”), (iii) 520,107 additional shares of common stock issuable to NEA 12 upon conversion of the preferred stock in connection with this offering and (iv) warrants we have issued to NEA 12 to purchase up to 971,224 shares of common stock that are exercisable within 60 days of May 31, 2017. The shares directly held by NEA 12 are indirectly held by NEA Partners 12, Limited Partnership (“NEA Partners 12”), the sole general partner of NEA 12, NEA 12 GP, LLC (“NEA 12 LLC”), the sole general partner of NEA Partners 12 and each of the individual Managers of NEA 12 LLC. The individual Managers of NEA 12 LLC are M. James Barrett, Peter J. Barris, Forest Baskett, Patrick J. Kerins and Scott D. Sandell. The shares directly held by Ven 2008 are indirectly held by Karen P. Welsh, the general partner of Ven 2008. Messrs. Barrett, Barris, Baskett, Kerins and Sandell, and NEA Partners 12 and NEA 12 LLC share voting and dispositive power with regard to our securities directly held by NEA 12. Karen P. Welsh has voting and dispositive power with regard to our securities held by Ven 2008. The address of each of these entities is 1954 Greenspring Drive, Suite 600, Timonium, MD 21093. |
| (2) | Consists of (i) 1,475,551 shares held of record by Silver Lake Kraftwerk Fund, L.P., (ii) 45,792 shares held of record by Silver Lake Technology Investors Kraftwerk, L.P, (iii) 2,951,095 additional shares of common stock issuable to Silver Lake Kraftwerk Fund, L.P. upon conversion of the preferred stock in connection with this offering and (iv) 91,583 additional shares of common stock issuable to Silver Lake Technology Investors Kraftwerk, L.P. upon conversion of the preferred stock in connection with this offering (collectively, the “Silver Lake Shares”). Silver Lake Group, L.L.C., a Delaware limited liability company (“SLG”), is the managing member of SLTA Kraftwerk (GP), L.L.C., a Delaware limited liability company (“SLTA GP”), which is the general partner of Silver Lake Technology Associates Kraftwerk, L.P., a Delaware limited partnership (“SLTA”), which is the general partner of Silver Lake Kraftwerk Fund, L.P., a Delaware limited partnership (“SLK”). SLTA is also the general partner of Silver Lake Technology Investors Kraftwerk, L.P., a Delaware limited partnership (“SLTI”). As general partner of each of SLK and SLTI, SLTA may be deemed to share voting and dispositive power with respect to Silver Lake Shares. As the general partner of SLTA, SLTA GP and its managing member, SLG, may each be deemed to share voting and dispositive power with respect to the Silver Lake Shares. The address for each of these entities is 2775 Sand Hill Road, Suite 100, Menlo Park, CA 94025. |
| (3) | Consists of (i) 666,661 shares held of record by Insight Venture Partners VIII, L.P., (ii) 211,443 shares held of record by Insight Venture Partners (Delaware) VIII, L.P., (iii) 172,446 shares held of record by Insight Venture Partners (Cayman) VIII, L.P., (iv) 23,792 shares held of record by Insight Venture Partners VIII (Co-Investors), L.P., (v) 454,132 shares held by Star Trinity, L.P., (vi) 1,282,669 additional shares of common stock issuable to Insight Venture Partners VIII, L.P. upon conversion of the preferred stock in connection with this offering, (vii) 406,821 additional shares of common stock issuable to Insight Venture Partners (Delaware) VIII, L.P. upon conversion of |
143
Table of Contents
| the preferred stock in connection with this offering, (viii) 331,789 additional shares of common stock issuable to Insight Venture Partners (Cayman) VIII, L.P. upon conversion of the preferred stock in connection with this offering, (ix) 45,775 additional shares of common stock issuable to Insight Venture Partners VIII (Co-Investors), L.P. upon conversion of the preferred stock in connection with this offering and (x) 908,262 additional shares of common stock issuable to Star Trinity, L.P. upon conversion of the preferred stock in connection with this offering. The general partner of Insight Venture Partners VIII, L.P., Insight Venture Partners (Cayman) VIII, L.P., Insight Venture Partners (Delaware) VIII, L.P., and Insight Venture Partners VIII (Co-Investors), L.P. (collectively, “Fund VIII”) is Insight Venture Associates VIII, L.P. The general partner of Insight Venture Associates VIII, L.P. is Insight Venture Associates VIII, Ltd., the sole shareholder of which is Insight Holdings Group, LLC. The general partner of Star Trinity, L.P. is Star Trinity GP, LLC. The sole member of Star Trinity GP, LLC is Insight Venture Management, LLC, the sole member of which is Insight Holdings Group, LLC. Jeffrey Horing, Deven Parekh, Peter Sobiloff, Michael Triplett and Jeffrey Lieberman are the members of the board of managers of Insight Holdings Group, LLC and may be deemed to hold voting and dispositive power over the shares held by Fund VIII and Star Trinity, L.P. The address for Fund VIII is c/o Insight Venture Partners, 1114 Avenue of the Americas, 36th Floor, New York, NY, 10036. The address for Star Trinity, L.P. is c/o Star Trinity GP, LLC, 1114 Avenue of the Americas, 36th Floor, New York, NY, 10036. The foregoing is not an admission by any of Insight Holdings Group, LLC, Insight Venture Associates VIII, L.P., Insight Venture Associates VIII, Ltd., Star Trinity GP, LLC or Insight Venture Management, LLC that it is the beneficial owner of any of the shares held by Fund VIII or Star Trinity, L.P. |
| (4) | Consists of (i) 2,509,958 shares held of record by Lightspeed Venture Partners VIII, L.P. (“LVP VIII”), (ii) 276,399 additional shares of common stock issuable to LVP VIII upon conversion of the preferred stock in connection with this offering and (iii) warrants we have issued to LVP VIII to purchase up to 516,137 shares of common stock that are exercisable within 60 days of May 31, 2017. Lightspeed Ultimate General Partner VIII, Ltd. (“LUGP”) is the general partner of Lightspeed General Partner VIII, L.P., which is the general partner of LVP VIII. As such, LUGP possesses the power to direct the voting and disposition of the shares owned by LVP VIII and may be deemed to have indirect beneficial ownership of the shares held by LVP VIII. Christopher J. Schaepe, Barry Eggers, Ravi Mhatre and Peter Nieh are the directors of LUGP and possess the power to direct the voting and disposition of the shares owned by LVP VIII and may be deemed to have indirect beneficial ownership of the shares held by LVP VIII. The address for each of these entities is 2200 Sand Hill Road, Menlo Park, CA 94025. |
| (5) | Consists of (i) 193,697 shares held of record by Mr. Klein, (ii) 658,519 shares subject to options exercisable within sixty days of May 31, 2017 and (iii) 13,623 additional shares of common stock issuable to Mr. Klein upon conversion of the preferred stock in connection with this offering. |
| (6) | Consists of (i) 39,076 shares held of record by Mr. Halifax, (ii) 118,988 shares subject to options exercisable within sixty days of May 31, 2017 and (iii) 9,081 additional shares of common stock issuable to Mr. Halifax upon conversion of the preferred stock in connection with this offering. |
| (7) | Consists of 84,583 shares subject to options exercisable within sixty days of May 31, 2017. |
| (8) | Consists of 11,545 shares subject to options exercisable within sixty days of May 31, 2017. |
| (9) | Consists of 6,076 shares subject to options exercisable within 60 days of May 31, 2017. |
| (10) | Consists of (i) 1,659,732 shares held of record by Mr. Harty, (ii) 176,388 shares subject to options exercisable within sixty days of May 31, 2017 and (iii) 18,150 shares held by Cari Harty, Mr. Harty’s spouse. |
| (11) | Consists of (i) 19,686 shares held of record by H.C. Jones Living Trust, for which Mr. Jones serves as a trustee, (ii) 27,777 shares subject to options exercisable within sixty days of May 31, 2017 and (iii) 22,705 additional shares of common stock issuable upon conversion of the preferred stock in connection with this offering. |
| (12) | Consists of the shares listed in footnote (4) above, which are held of record by Lightspeed Venture Partners VIII, L.P. |
| (13) | Consists of (i) 4,440,299 shares beneficially owned by our executive officers and directors, (ii) 1,083,876 shares subject to options exercisable within 60 days of May 31, 2017, (iii) 321,808 additional shares of common stock issuable to our executive officers and directors upon conversion of the preferred stock in connection with this offering and (iv) warrants we have issued to purchase up to 516,137 shares of commons stock that are issuable within 60 days of May 31, 2017. |
| (14) | Certain of our existing stockholders, including entities affiliated with Lightspeed Venture Partners, New Enterprise Associates and Silverlake Kraftwerk, who are affiliated with members of our board of directors, and entities affiliated with Insight Venture Partners and Menlo Ventures have indicated an interest in purchasing up to an aggregate of approximately $23.0 million in shares of our common stock in this offering at the initial public offering price. However, because indications of interest are not binding agreements or commitments to purchase, the underwriters may determine to sell more, less or no shares in this offering to any of these stockholders, or any of these stockholders may determine to purchase more, less or no shares in this offering. Assuming an initial public offering price of $11.50 per share, which is the midpoint of the estimated offering price range set forth on the cover page of this prospectus, if such stockholders were to purchase the entire $23.0 million of our common stock, they would purchase an aggregate of 2,000,000 shares of our common stock in this offering. However, if any shares are purchased by these stockholders, the number of shares of common stock beneficially owned after this offering and the percentage of common stock beneficially owned after this offering will differ from that set forth in the table above. Assuming the purchase of all of these shares by these stockholders and no exercise by the underwriters of their option to purchase additional shares, the percentage of common stock beneficially owned by our executive officers, directors, and stockholders holding more than 5% of our capital stock as of May 31, 2017, and their affiliates after this offering would increase by up to approximately 6.1 percentage points. If such stockholders were to purchase all of these shares, assuming no exercise by the underwriters of their option to purchase additional shares, our executive officers, directors, and stockholders holding more than 5% of our capital stock as of May 31, 2017, and their affiliates would beneficially own, collectively, up to approximately 68.8% of our outstanding common stock after this offering. |
144
Table of Contents
General
The following is a summary of the rights of our common stock and preferred stock and certain provisions of our amended and restated certificate of incorporation and amended and restated bylaws as they will be in effect upon the completion of this offering. This summary does not purport to be complete and is qualified in its entirety by the provisions of our amended and restated certificate of incorporation and amended and restated bylaws, copies of which have been filed as exhibits to the registration statement of which this prospectus is made a part.
Immediately following the completion of this offering, our authorized capital stock will consist of 1,100,000,000 shares, with a par value of $0.00005 per share, of which:
| • | 1,000,000,000 shares are designated as common stock; and |
| • | 100,000,000 shares are designated as preferred stock. |
Our board of directors is authorized, without stockholder approval, except as required by the listing standards of the NASDAQ Stock Market, to issue additional shares of our capital stock.
Common Stock
As of April 30, 2017, we had outstanding 22,338,806 shares of common stock (reflecting the amendment to our amended and restated certificate of incorporation on June 1, 2017), held by approximately 229 stockholders of record, and no shares of preferred stock, assuming the automatic conversion of all outstanding shares of our preferred stock into common stock at the applicable conversion rate effective immediately prior to the completion of this offering.
Pursuant to our amended and restated certificate of incorporation, holders of our common stock will be entitled to one vote on all matters submitted to a vote of stockholders; provided, however, that, except as otherwise required by law, holders of our common stock, as such, shall not be entitled to vote on any amendment to our amended and restated certificate of incorporation that relates solely to the terms of one or more outstanding series of preferred stock if the holders of such affected series are entitled, either separately or together with the holders of one or more other such series, to vote thereon pursuant to our amended and restated certificate of incorporation. Pursuant to our amended and restated certificate of incorporation, holders of our common stock will not be entitled to cumulative voting in the election of directors. This means that the holders of a plurality of the votes cast at a meeting of stockholders will be able to elect all of the directors then standing for election. Subject to the rights, if any, of the holders of any outstanding series of preferred stock, holders of our common stock shall be entitled to receive dividends out of any of our funds legally available when, as and if declared by the board of directors. Upon the dissolution, liquidation or winding up of the company, subject to the rights, if any, of the holders of our preferred stock, the holders of shares of our common stock shall be entitled to receive the assets of the company available for distribution to its stockholders ratably in proportion to the number of shares held by them. Holders of our common stock will not have preemptive or conversion rights or other subscription rights. There are no redemption or sinking fund provisions applicable to our common stock. All outstanding shares of common stock are fully paid and nonassessable, and the shares of common stock to be issued in this offering, when paid for, will also be fully paid and nonassessable.
Preferred Stock
Pursuant to the provisions of our current certificate of incorporation, as will be in effect immediately prior to the closing of the offering, before the effectiveness of our amended and restated certificate of incorporation, all of our outstanding preferred stock will automatically convert into shares of common stock, with such conversion to be effective upon completion of this offering.
145
Table of Contents
After the completion of this offering, no shares of preferred stock will be outstanding. Pursuant to our amended and restated certificate of incorporation, our board of directors will have the authority, without further action by the stockholders, to issue from time to time up to 100,000,000 shares of preferred stock in one or more series. Our board of directors may designate the rights, preferences, privileges and restrictions of the preferred stock, including dividend rights, conversion rights, voting rights, redemption rights, liquidation preference, sinking fund terms and the number of shares constituting any series or the designation of any series. The issuance of preferred stock could have the effect of restricting dividends on the common stock, diluting the voting power of the common stock, impairing the liquidation rights of the common stock or delaying, deterring or preventing a change in control. Such issuance could have the effect of decreasing the market price of the common stock. We currently have no plans to issue any shares of preferred stock.
Warrants
As of April 30, 2017, we had outstanding warrants to purchase an aggregate of 230,897 shares of our common stock (reflecting the amendment to our amended and restated certificate of incorporation on June 1, 2017), with a weighted-average exercise price of $13.83 per share, assuming the conversion of all outstanding warrants to purchase convertible preferred stock into warrants to purchase shares of common stock. These warrants are exercisable at any time on or before their expiration dates which range from December 9, 2021 to February 24, 2024. These warrants contain a net exercise provision, pursuant to which the holder may, in lieu of payment of the exercise price in cash, surrender the warrant and receive a net amount of shares based on the fair value of our common stock, at the time of exercise after deduction of the aggregate exercise price. The warrants also contain provisions for the adjustment of the exercise price and the numbers of shares issuable upon the exercise in the event of certain stock dividends, stock splits, reorganizations, reclassifications and consolidations. The holders of up to 205,897 shares that may be issued upon exercise of our warrants are entitled to registration rights with respect to such shares, as described in “—Registration Rights.”
Subsequent to April 30, 2017, we issued warrants to purchase up to 1,666,665 shares of common stock at an exercise price of $16.44 per share. These Warrants are exercisable only in the event that we conduct an IPO on or before July 30, 2017, and have an expiration date of June 1, 2027. These warrants contain a net exercise provision, pursuant to which the holder may, in lieu of payment of the exercise price in cash, surrender the warrant and receive a net amount of shares based on the fair value of our common stock, at the time of exercise after deduction of the aggregate exercise price. The warrants also contain provisions for the adjustment of the exercise price and the numbers of shares issuable upon the exercise in the event of certain stock dividends, stock splits, reorganizations, reclassifications and consolidations. The holders of up to 1,666,665 shares that may be issued upon exercise of these warrants are entitled to registration rights with respect to such shares, as described in “—Registration Rights.”
Registration Rights
Following the completion of this offering, the holders of shares of our common stock issued upon conversion of our convertible preferred stock and exercise of warrants, as well as certain shares of common stock held by certain of our stockholders, or their permitted transferees are entitled to rights with respect to the registration of these shares under the Securities Act.
These rights are provided under the terms of an investors rights agreement dated July 24, 2015, as amended, or our Rights Agreement, between us and the holders of these shares, which was entered into in connection with our preferred stock financing, and include requested registration rights, piggyback registration rights and Form S-3 registration rights. In any registration made pursuant to such Rights Agreement, all fees, costs and expenses of underwritten registrations, including the reasonable fees of one special counsel for the selling holders selected by them (not to exceed $30,000), will be borne by us and underwriting discounts, selling commissions and stock transfer taxes will be borne by the holders of the shares being registered.
146
Table of Contents
In connection with the completion of this offering, each stockholder that has registration rights agreed not to sell or otherwise dispose of any securities without the prior written consent of the underwriters for a period of 180 days after the date of this prospectus, subject to certain terms and conditions. See “Underwriters” for additional information.
The registration rights provided for in our Rights Agreement will terminate five years following the completion of this offering or, with respect to any particular stockholder, when such stockholder holds less than one percent of our outstanding shares and is able to sell all of its shares pursuant to Rule 144 of the Securities Act in any 90-day period.
Requested Registration Rights
Under the terms of our Rights Agreement, the holders of applicable shares of our common stock, or their permitted transferees, are entitled to requested registration rights. 180 days after the completion of this offering, the holders of at least 66 and 2/3% of the shares entitled to registration rights then outstanding can request that we register the offer and sale of their shares, provided that such registration of shares would result in an anticipated aggregate offering price to the public of at least $10 million, before deducting underwriter’s discounts and commissions related to the issuance. We are required to effect only three registrations pursuant to this provision of our Rights Agreement. Depending on certain conditions, however, we may defer such registration for up to 90 days once in any twelve-month period.
Piggyback Registration Rights
Under the terms of our Rights Agreement, the holders of applicable shares of our common stock, or their permitted transferees, are entitled to piggyback registration rights. If we register any of our securities under the Securities Act, subject to certain exceptions, the holders of these shares will be entitled to notice of the registration and to include their registrable securities in the registration. The underwriters of any underwritten offering have the right to limit the number of shares registered by these holders for marketing reasons, subject to limitations set forth in our Rights Agreement.
S-3 Registration Rights
Under the terms of our Rights Agreement, the holders of applicable shares of our common stock, or their permitted transferees, are also entitled to S-3 registration rights. If we are eligible to file a registration statement on Form S-3, these holders have the right, upon written request from holders of these shares, to have such shares registered by us if the proposed aggregate offering price of the shares to be registered by the holders requesting registration is at least $1.0 million, subject to exceptions set forth in our Rights Agreement. We are required to effect only two registrations on Form S-3 within any twelve-month period. Depending on certain conditions, however, we may defer such registration for up to 90 days in any twelve-month period.
Anti-Takeover Effects of Delaware Law and Our Certificate of Incorporation and Bylaws
Our amended and restated certificate of incorporation and amended and restated bylaws to be effective immediately prior to the completion of this offering will contain provisions that could have the effect of delaying, deferring or discouraging another party from acquiring control of us. These provisions and certain provisions of Delaware law, which are summarized below, could discourage takeovers, coercive or otherwise. These provisions are also designed, in part, to encourage persons seeking to acquire control of us to negotiate first with our board of directors. We believe that the benefits of increased protection of our potential ability to negotiate with an unfriendly or unsolicited acquirer outweigh the disadvantages of discouraging a proposal to acquire us.
Issuance of Undesignated Preferred Stock. As discussed above under “—Preferred Stock,” our board of directors will have the ability to designate and issue preferred stock with voting or other rights or preferences that could deter hostile takeovers or delay changes in our control or management.
147
Table of Contents
Limits on Ability of Stockholders to Act by Written Consent or Call a Special Meeting. Our amended and restated certificate of incorporation will provide that our stockholders may not act by written consent. This limit on the ability of stockholders to act by written consent may lengthen the amount of time required to take stockholder actions. As a result, the holders of a majority of our capital stock would not be able to amend the amended and restated bylaws or remove directors without holding a meeting of stockholders called in accordance with the amended and restated bylaws.
In addition, our amended and restated bylaws will provide that special meetings of the stockholders may be called only by the chairman of the board, the chief executive officer, the president (in the absence of a chief executive officer) or a majority of our board of directors. A stockholder may not call a special meeting, which may delay the ability of our stockholders to force consideration of a proposal or for holders controlling a majority of our capital stock to take any action, including the removal of directors.
Advance Notification of Stockholder Nominations and Proposals. Our amended and restated bylaws will establish advance notice procedures with respect to stockholder proposals and the nomination of candidates for election as directors, other than nominations made by or at the direction of our board of directors or a committee of the board of directors. These advance notice procedures may have the effect of precluding the conduct of certain business at a meeting if the proper procedures are not followed and may also discourage or deter a potential acquirer from conducting a solicitation of proxies to elect its own slate of directors or otherwise attempt to obtain control of our company.
Board Classification. Our amended and restated certificate of incorporation provides that our board of directors will be divided into three classes, one class of which is elected each year by our stockholders. The directors in each class will serve for a three-year term. For more information on the classified board of directors, see “Management—Board Composition.” Our classified board of directors may tend to discourage a third-party from making a tender offer or otherwise attempting to obtain control of us because it generally makes it more difficult for stockholders to replace a majority of the directors.
Election and Removal of Directors. Our amended and restated certificate of incorporation and amended and restated bylaws contain provisions that establish specific procedures for appointing and removing members of our board of directors. Under our amended and restated certificate of incorporation and amended and restated bylaws, vacancies and newly created directorships on our board of directors may be filled only by a majority of the directors then serving on the board of directors. Under our amended and restated certificate of incorporation and amended and restated bylaws, directors may be removed only for cause by the affirmative vote of the holders of a majority of the shares then entitled to vote at an election of directors.
No Cumulative Voting. The Delaware General Corporation Law provides that stockholders are not entitled to the right to cumulate votes in the election of directors unless our restated certificate of incorporation provides otherwise. Our restated certificate of incorporation and amended and restated bylaws do not expressly provide for cumulative voting. Without cumulative voting, a minority stockholder may not be able to gain as many seats on our board of directors as the stockholder would be able to gain if cumulative voting were permitted. The absence of cumulative voting makes it more difficult for a minority stockholder to gain a seat on our board of directors to influence our board of directors’ decision regarding a takeover.
Amendment of Charter Provisions and Bylaws. Any amendment of the above provisions in our amended and restated certificate of incorporation would require approval by holders of at least two-thirds of our then outstanding common stock. In addition, our amended and restated certificate of incorporation authorizes our board of directors to modify, alter or repeal our amended and restated bylaws, including to implement changes with respect to the election of our directors and other procedures related to our company that could have the effect of discouraging a third party from acquiring or attempting to acquire our company.
148
Table of Contents
Delaware Anti-Takeover Statute. We will be subject to the provisions of Section 203 of the Delaware General Corporation Law regulating corporate takeovers. In general, Section 203 prohibits a publicly held Delaware corporation from engaging, under certain circumstances, in a business combination with an interested stockholder for a period of three years following the date the person became an interested stockholder unless:
| • | prior to the date of the transaction, our board of directors approved either the business combination or the transaction that resulted in the stockholder becoming an interested stockholder; |
| • | upon completion of the transaction that resulted in the stockholder becoming an interested stockholder, the interested stockholder owned at least 85% of the voting stock of the corporation outstanding at the time the transaction commenced, excluding for purposes of determining the voting stock outstanding, but not the outstanding voting stock owned by the interested stockholder, (i) shares owned by persons who are directors and also officers and (ii) shares owned by employee stock plans in which employee participants do not have the right to determine confidentially whether shares held subject to the plan will be tendered in a tender or exchange offer; or |
| • | at or subsequent to the date of the transaction, the business combination is approved by our board of directors and authorized at an annual or special meeting of stockholders, and not by written consent, by the affirmative vote of at least two-thirds of the outstanding voting stock that is not owned by the interested stockholder. |
Generally, a business combination includes a merger, asset or stock sale, or other transaction resulting in a financial benefit to the interested stockholder. An interested stockholder is a person who, together with affiliates and associates, owns or, within three years prior to the determination of interested stockholder status, did own 15% or more of a corporation’s outstanding voting stock. We expect the existence of this provision to have an anti-takeover effect with respect to transactions our board of directors does not approve in advance. We also anticipate that Section 203 may discourage attempts that might result in a premium over the market price for the shares of common stock held by stockholders.
The provisions of Delaware law and the provisions of our amended and restated certificate of incorporation and amended and restated bylaws could have the effect of discouraging others from attempting hostile takeovers and as a consequence, they might also inhibit temporary fluctuations in the market price of our common stock that often result from actual or rumored hostile takeover attempts. These provisions might also have the effect of preventing changes in our management. It is also possible that these provisions could make it more difficult to accomplish transactions that stockholders might otherwise deem to be in their best interests.
Choice of Forum. Our amended and restated bylaws provides that the Court of Chancery of the State of Delaware will be the exclusive forum for: (i) any derivative action or proceeding brought on our behalf; (ii) any action asserting a breach of fiduciary duty; (iii) any action asserting a claim against us arising under the Delaware General Corporation Law; (iv) any action regarding our amended and restated certificate of incorporation or our amended and restated bylaws; or (v) any action asserting a claim against us that is governed by the internal affairs doctrine. Our amended and restated bylaws further provides that the federal district courts of the United States of America will be the exclusive forum for resolving any complaint asserting a cause of action arising under the Securities Act.
Transfer Agent and Registrar
Upon the completion of this offering, the transfer agent and registrar for our common stock will be American Stock Transfer & Trust Company LLC. The transfer agent’s address is 6201 15th Avenue, Brooklyn, NY 11219, and its telephone number is (718) 921-8200.
Exchange Listing
Our common stock has been approved for listing on The NASDAQ Global Market under the symbol “TNTR.”
149
Table of Contents
SHARES ELIGIBLE FOR FUTURE SALE
Prior to this offering, there has been no public market for shares of our common stock and we cannot assure you that a liquid trading market for our common stock will develop or be sustained after this offering. Future sales of substantial amounts of shares of common stock, including shares issued upon the exercise of outstanding options, in the public market after this offering, or the possibility of these sales occurring, could adversely affect the prevailing market price for our common stock or impair our ability to raise equity capital in the future.
Based on shares outstanding as of April 30, 2017, upon the completion of this offering, a total of 31,038,806 shares of common stock will be outstanding, assuming the automatic conversion of all outstanding shares of preferred stock into 17,992,973 shares of common stock (reflecting the amendment to our amended and restated certificate of incorporation on June 1, 2017) immediately prior to the completion of this offering and assuming no exercises of outstanding options and warrants that were outstanding as of April 30, 2017. Of these shares, all the shares of common stock sold in this offering by us, plus any shares sold upon exercise of the underwriters’ option to purchase additional shares, will be freely tradable in the public market without restriction or further registration under the Securities Act, unless these shares are held by “affiliates,” as that term is defined in Rule 144 under the Securities Act.
The remaining outstanding shares of our common stock will be deemed “restricted securities” as defined in Rule 144. Restricted securities may be sold in the public market only if they are registered or if they qualify for an exemption from registration under Rule 144 or Rule 701 under the Securities Act, which rules are summarized below. In addition, holders of substantially all of our equity securities are subject to market stand-off agreements or have entered into lock-up agreements with the underwriters under which they have agreed, subject to specific exceptions, not to sell any of our stock for at least 180 days following the date of this prospectus, as described below. If certain of our existing stockholders purchase shares of our common stock in this offering, such shares will be subject to the restrictions set forth in these lock-up agreements with the underwriters, as well. As a result of these agreements and the provisions of our Rights Agreement described in “Description of Capital Stock—Registration Rights,” subject to the provisions of Rule 144 or Rule 701, following the expiration of the lock-up period, all shares subject to such provisions and agreements will be available for sale in the public market only if registered or pursuant to an exemption from registration under Rule 144 or Rule 701 under the Securities Act.
Rule 144
In general, under Rule 144 as currently in effect, once we have been subject to public company reporting requirements for at least 90 days, a person who is not deemed to have been one of our affiliates for purposes of the Securities Act at any time during the 90 days preceding a sale and who has beneficially owned the shares proposed to be sold for at least six months, including the holding period of any prior owner other than our affiliates, is entitled to sell such shares (subject to the requirements of the lock-up agreements, as described below) without complying with the manner of sale, volume limitation or notice provisions of Rule 144, subject to compliance with the public information requirements of Rule 144. If such a person has beneficially owned the shares proposed to be sold for at least one year, including the holding period of any prior owner other than our affiliates, then such person is entitled to sell such shares (subject to the requirements of the lock-up agreements, as described below) without complying with the public information requirements of Rule 144.
In general, under Rule 144, as currently in effect, our affiliates or persons selling shares on behalf of our affiliates are entitled to sell upon expiration of the lock-up agreements described above, within any three-month period beginning 90 days after the date of this prospectus, a number of shares that does not exceed the greater of:
| • | 1% of the number of shares of common stock then outstanding, which will equal approximately 310,388 shares immediately after this offering; or |
| • | the average weekly trading volume of the common stock during the four calendar weeks preceding the filing of a notice on Form 144 with respect to such sale. |
Sales under Rule 144 by our affiliates or persons selling shares on behalf of our affiliates are also subject to certain manner of sale provisions and notice requirements and to the availability of current public information about
150
Table of Contents
us. Notwithstanding the availability of Rule 144, the holders of substantially all of common stock have entered into lock-up agreements as described below, and their restricted securities will become eligible for sale (subject to the above limitations under Rule 144) upon the expiration of the restrictions set forth in those agreements.
Rule 701
Rule 701, as currently in effect, generally allows a stockholder who purchased shares of our common stock pursuant to a written compensatory plan or contract and who is not deemed to have been an affiliate of our company during the immediately preceding 90 days to sell these shares (subject to the requirements of the lock-up agreements, as described below) in reliance upon Rule 144, but without being required to comply with the public information, holding period, volume limitation or notice provisions of Rule 144. Rule 701 also permits affiliates of our company to sell their Rule 701 shares under Rule 144 without complying with the holding period requirements of Rule 144. However, all holders of Rule 701 shares are required to wait until 90 days after the date of this prospectus (or until such later date that is required by the lock-up agreements, as described below) before selling such shares pursuant to Rule 701.
Lock-Up Agreements
We and all directors and officers and the holders of substantially all of our outstanding stock and stock options have agreed or will agree that, without the prior written consent of Morgan Stanley & Co. LLC on behalf of the underwriters, we and they will not, during the period ending 180 days after the date of this prospectus, or the restricted period:
| • | offer, pledge, sell, contract to sell, sell any option or contract to purchase, purchase any option or contract to sell, grant any option, right or warrant to purchase, lend or otherwise transfer or dispose of, directly or indirectly, any shares of common stock beneficially owned, as such term is used in Rule 13d-3 of the Exchange Act, by the locked-up party or any securities convertible into or exercisable or exchangeable for shares of common stock; |
| • | in our case, file any registration statement with the SEC relating to the offering of any shares of common stock or any securities convertible into or exercisable or exchangeable for common stock; or |
| • | enter into any swap or other arrangement that transfers to another, in whole or in part, any of the economic consequences of ownership of the common stock. |
whether any such transaction described above is to be settled by delivery of common stock or such other securities, in cash or otherwise. In addition, we and each such person agrees that, without the prior written consent of Morgan Stanley & Co. LLC on behalf of the underwriters, we or such other person will not, during the restricted period, make any demand for, or exercise any right with respect to, the registration of any shares of common stock or any security convertible into or exercisable or exchangeable for common stock. The restrictions described above are subject to certain exceptions set forth in “Underwriters.”
Registration Rights
The holders of (a) 19,790,382 shares of common stock (reflecting the amendment to our amended and restated certificate of incorporation on June 1, 2017) and (b) up to 1,872,562 shares that may be issued upon exercise of our warrants (reflecting the amendment to our amended and restated certificate of incorporation on June 1, 2017), or their transferees, will be entitled to various rights with respect to the registration of these shares under the Securities Act. Registration of these shares under the Securities Act would result in these shares becoming fully tradable without restriction under the Securities Act immediately upon the effectiveness of the registration, except for shares purchased by affiliates. See “Description of Capital Stock—Registration Rights” for additional information.
151
Table of Contents
Registration Statements on Form S-8
Upon the completion of this offering, we intend to file a registration statement on Form S-8 under the Securities Act to register all of the shares of common stock issued or reserved for issuance under our stock plans. Shares covered by this registration statement will be eligible for sale in the public market, upon the expiration or release from the terms of the lock-up agreements and subject to vesting of such shares.
152
Table of Contents
MATERIAL U.S. FEDERAL INCOME TAX CONSEQUENCES TO NON-U.S. HOLDERS OF OUR COMMON STOCK
The following is a summary of the material U.S. federal income tax consequences to non-U.S. holders (as defined below) of the ownership and disposition of our common stock but does not purport to be a complete analysis of all the potential tax considerations relating thereto. This summary is based upon the provisions of the Internal Revenue Code of 1986, as amended, or the Internal Revenue Code, Treasury regulations promulgated thereunder, administrative rulings and judicial decisions, all as of the date hereof. These authorities may be changed, possibly retroactively, so as to result in U.S. federal income tax consequences different from those set forth below. No ruling on the U.S. federal, state, or local tax considerations relevant to our operations or to the purchase, ownership or disposition of our shares, has been requested from the IRS or other tax authority. No assurance can be given that the IRS would not assert, or that a court would not sustain, a position contrary to any of the tax consequences described below.
This summary also does not address the tax considerations arising under the laws of any non-U.S., state or local jurisdiction, or under U.S. federal gift and estate tax laws, except to the limited extent set forth below. In addition, this discussion does not address tax considerations applicable to an investor’s particular circumstances or to investors that may be subject to special tax rules, including, without limitation:
| • | banks, insurance companies or other financial institutions, regulated investment companies or real estate investment trusts; |
| • | persons subject to the alternative minimum tax or Medicare contribution tax on net investment income; |
| • | tax-exempt organizations or governmental organizations; |
| • | controlled foreign corporations, passive foreign investment companies and corporations that accumulate earnings to avoid U.S. federal income tax; |
| • | brokers or dealers in securities or currencies; |
| • | traders in securities that elect to use a mark-to-market method of accounting for their securities holdings; |
| • | persons that own, or are deemed to own, more than five percent of our capital stock (except to the extent specifically set forth below); |
| • | U.S. expatriates and certain former citizens or long-term residents of the United States; |
| • | partnerships or entities classified as partnerships for U.S. federal income tax purposes or other pass-through entities (and investors therein); |
| • | persons who hold our common stock as a position in a hedging transaction, “straddle,” “conversion transaction” or other risk reduction transaction or integrated investment; |
| • | persons who hold or receive our common stock pursuant to the exercise of any employee stock option or otherwise as compensation; |
| • | persons who do not hold our common stock as a capital asset within the meaning of Section 1221 of the Internal Revenue Code; or |
| • | persons deemed to sell our common stock under the constructive sale provisions of the Internal Revenue Code. |
In addition, if a partnership or entity classified as a partnership for U.S. federal income tax purposes holds our common stock, the tax treatment of a partner generally will depend on the status of the partner and upon the activities of the partnership. Accordingly, partnerships that hold our common stock, and partners in such partnerships, should consult their tax advisors.
153
Table of Contents
You are urged to consult your tax advisor with respect to the application of the U.S. federal income tax laws to your particular situation, as well as any tax consequences of the purchase, ownership and disposition of our common stock arising under the U.S. federal estate or gift tax rules or under the laws of any state, local, non-U.S., or other taxing jurisdiction or under any applicable tax treaty.
Non-U.S. Holder Defined
For purposes of this discussion, you are a non-U.S. holder (other than a partnership) if you are any holder other than:
| • | an individual citizen or resident of the United States (for U.S. federal income tax purposes); |
| • | a corporation or other entity taxable as a corporation created or organized in the United States or under the laws of the United States, any state thereof, or the District of Columbia, or other entity treated as such for U.S. federal income tax purposes; |
| • | an estate whose income is subject to U.S. federal income tax regardless of its source; or |
| • | a trust (x) whose administration is subject to the primary supervision of a U.S. court and which has one or more “U.S. persons” (within the meaning of Section 7701(a)(30) of the Internal Revenue Code) who have the authority to control all substantial decisions of the trust or (y) which has made a valid election to be treated as a U.S. person. |
Distributions
As described in “Dividend Policy,” we have never declared or paid cash dividends on our common stock and do not anticipate paying any dividends on our common stock in the foreseeable future. However, if we do make distributions on our common stock, those payments will constitute dividends for U.S. tax purposes to the extent paid from our current or accumulated earnings and profits, as determined under U.S. federal income tax principles. To the extent those distributions exceed both our current and our accumulated earnings and profits, they will constitute a return of capital and will first reduce your basis in our common stock, but not below zero, and then will be treated as gain from the sale of stock as described below under “—Gain on Disposition of Common Stock.”
Subject to the discussion below on effectively connected income, backup withholding and foreign accounts, any dividend paid to you generally will be subject to U.S. withholding tax either at a rate of 30% of the gross amount of the dividend or such lower rate as may be specified by an applicable income tax treaty. In order to receive a reduced treaty rate, you must provide us with an IRS Form W-8BEN, IRS Form W-8BEN-E or other appropriate version of IRS Form W-8 certifying qualification for the reduced rate. A non-U.S. holder of shares of our common stock eligible for a reduced rate of U.S. withholding tax pursuant to an income tax treaty may obtain a refund of any excess amounts withheld by timely filing an appropriate claim for refund with the IRS. If the non-U.S. holder holds the stock through a financial institution or other agent acting on the non-U.S. holder’s behalf, the non-U.S. holder will be required to provide appropriate documentation to the agent, which then will be required to provide certification to us or our paying agent, either directly or through other intermediaries.
Dividends received by you that are effectively connected with your conduct of a U.S. trade or business (and, if required by an applicable income tax treaty, attributable to a permanent establishment maintained by you in the United States) are generally exempt from such withholding tax. In order to obtain this exemption, you must provide us with an IRS Form W-8ECI or other applicable IRS Form W-8 properly certifying such exemption. Such effectively connected dividends, although not subject to withholding tax, are taxed at the same graduated rates applicable to U.S. persons, net of certain deductions and credits. In addition, if you are a corporate non-U.S. holder, dividends you receive that are effectively connected with your conduct of a U.S. trade or business may also be subject to a branch profits tax at a rate of 30% or such lower rate as may be specified by an applicable income tax treaty. You should consult your tax advisor regarding any applicable tax treaties that may provide for different rules.
154
Table of Contents
Gain on Disposition of Common Stock
Subject to the discussion below regarding backup withholding and foreign accounts, you generally will not be required to pay U.S. federal income tax on any gain realized upon the sale or other disposition of our common stock unless:
| • | the gain is effectively connected with your conduct of a U.S. trade or business (and, if required by an applicable income tax treaty, the gain is attributable to a permanent establishment maintained by you in the United States); |
| • | you are a non-resident alien individual who is present in the United States for a period or periods aggregating 183 days or more during the taxable year in which the sale or disposition occurs and certain other conditions are met; or |
| • | our common stock constitutes a United States real property interest by reason of our status as a “United States real property holding corporation,” or USRPHC, for U.S. federal income tax purposes at any time within the shorter of (i) the five-year period preceding your disposition of our common stock, or (ii) your holding period for our common stock. |
We believe that we are not currently and will not become a USRPHC for U.S. federal income tax purposes, and the remainder of this discussion so assumes. However, because the determination of whether we are a USRPHC depends on the fair market value of our U.S. real property relative to the fair market value of our other business assets, there can be no assurance that we will not become a USRPHC in the future. Even if we become a USRPHC, however, as long as our common stock is regularly traded on an established securities market, such common stock will be treated as U.S. real property interests only if you actually or constructively hold more than five percent of such regularly traded common stock at any time during the shorter of the five-year period preceding your disposition of, or your holding period for, our common stock.
If you are a non-U.S. holder described in the first bullet above, you will be required to pay tax on the net gain derived from the sale under regular graduated U.S. federal income tax rates, and a corporate non-U.S. holder described in the first bullet above also may be subject to the branch profits tax at a 30% rate, or such lower rate as may be specified by an applicable income tax treaty. If you are an individual non-U.S. holder described in the second bullet above, you will be required to pay a flat 30% tax (or such lower rate specified by an applicable income tax treaty) on the gain derived from the sale, which gain may be offset by U.S. source capital losses for the year (provided you have timely filed U.S. federal income tax returns with respect to such losses). You should consult any applicable income tax or other treaties that may provide for different rules.
Federal Estate Tax
Our common stock beneficially owned by an individual who is not a citizen or resident of the United States (as defined for U.S. federal estate tax purposes) at the time of their death will generally be includable in the decedent’s gross estate for U.S. federal estate tax purposes, unless an applicable estate tax treaty provides otherwise. The test for whether an individual is a resident of the United States for U.S. federal estate tax purposes differs from the test used for U.S. federal income tax purposes. Some individuals, therefore, may be non-U.S. holders for U.S. federal income tax purposes, but not for U.S. federal estate tax purposes, and vice versa.
Backup Withholding and Information Reporting
Generally, we must report annually to the IRS the amount of dividends paid to you, your name and address and the amount of tax withheld, if any. A similar report will be sent to you. Pursuant to applicable income tax treaties or other agreements, the IRS may make these reports available to tax authorities in your country of residence.
Payments of dividends or of proceeds on the disposition of stock made to you may be subject to information reporting and backup withholding at a current rate of 28% unless you establish an exemption, for example, by
155
Table of Contents
properly certifying your non-U.S. status on an IRS Form W-8BEN, IRS Form W-8BEN-E or another appropriate version of IRS Form W-8.
Backup withholding is not an additional tax; rather, the U.S. federal income tax liability of persons subject to backup withholding will be reduced by the amount of tax withheld. If withholding results in an overpayment of taxes, a refund or credit may generally be obtained from the IRS, provided that the required information is furnished to the IRS in a timely manner.
Foreign Account Tax Compliance
The Foreign Account Tax Compliance Act, or FATCA, imposes withholding tax at a rate of 30% on dividends on and gross proceeds from the sale or other disposition of our common stock paid to “foreign financial institutions” (as specially defined under these rules), unless such institution enters into an agreement with the U.S. government to withhold on certain payments and to collect and provide to the U.S. tax authorities substantial information regarding the U.S. account holders of such institution (which includes certain equity and debt holders of such institution, as well as certain account holders that are foreign entities with U.S. owners) or otherwise establishes an exemption. FATCA also generally imposes a U.S. federal withholding tax of 30% on dividends on and gross proceeds from the sale or other disposition of our common stock paid to a “non-financial foreign entity” (as specially defined for purposes of these rules) unless such entity provides the withholding agent with a certification identifying certain substantial direct and indirect U.S. owners of the entity, certifies that there are none or otherwise establishes an exemption. The withholding provisions under FATCA generally apply to dividends on our common stock, and under current transition rules, are expected to apply with respect to the gross proceeds from the sale or other disposition of our common stock on or after January 1, 2019. An intergovernmental agreement between the United States and an applicable foreign country may modify the requirements described in this paragraph. Non-U.S. holders should consult their own tax advisors regarding the possible implications of this legislation on their investment in our common stock.
Each prospective investor should consult its own tax advisor regarding the particular U.S. federal, state and local and non-U.S. tax consequences of purchasing, holding and disposing of our common stock, including the consequences of any proposed change in applicable laws.
156
Table of Contents
Under the terms and subject to the conditions to be contained in an underwriting agreement, the underwriters named below, for whom Morgan Stanley & Co. LLC, and Merrill Lynch, Pierce, Fenner & Smith Incorporated are acting as representatives, will severally agree to purchase, and we will agree to sell to them, severally, the number of shares of common stock indicated below:
| Underwriters |
Number of Shares |
|||
| Morgan Stanley & Co. LLC |
||||
| Merrill Lynch, Pierce, Fenner & Smith Incorporated |
||||
| Pacific Crest Securities, a division of KeyBanc Capital Markets Inc. |
||||
| Needham & Company, LLC |
||||
| Piper Jaffray & Co. |
||||
| Raymond James & Associates, Inc. |
||||
| William Blair & Company, L.L.C. |
||||
|
|
|
|||
| Total |
8,700,000 | |||
|
|
|
|||
The underwriters and the representatives are collectively referred to as the “underwriters” and the “representatives,” respectively. The underwriters will offer the shares of common stock subject to their acceptance of the shares from us and subject to prior sale. The underwriting agreement will provide that the obligations of the several underwriters to pay for and accept delivery of the shares of common stock offered by this prospectus are subject to the approval of certain legal matters by their counsel and to certain other conditions. The underwriters will be obligated to take and pay for all of the shares of common stock offered by this prospectus if any such shares are taken. However, the underwriters will not be required to take or pay for the shares covered by the underwriters’ over-allotment option described below.
The underwriters initially propose to offer part of the shares of common stock directly to the public at the offering price listed on the cover page of this prospectus and part to certain dealers. After the initial offering of the shares of common stock, the offering price and other selling terms may from time to time be varied by the representatives.
Certain of our existing stockholders, including entities affiliated with Lightspeed Venture Partners, New Enterprise Associates and Silverlake Kraftwerk, who are affiliated with members of our board of directors, and entities affiliated with Insight Venture Partners and Menlo Ventures, have indicated an interest in purchasing up to an aggregate of approximately $23.0 million in shares of our common stock in this offering at the initial public offering price. However, because indications of interest are not binding agreements or commitments to purchase, the underwriters may determine to sell more, less or no shares in this offering to any of these stockholders, or any of these stockholders may determine to purchase more, less or no shares in this offering. The underwriters will receive the same underwriting discounts and commissions on any shares purchased by these stockholders as they will on any other shares sold to the public in this offering.
We will grant to the underwriters an option, exercisable for 30 days from the date of this prospectus, to purchase up to 1,305,000 additional shares of common stock at the public offering price listed on the cover page of this prospectus, less underwriting discounts and commissions. The underwriters may exercise this option solely for the purpose of covering over-allotments, if any, made in connection with the offering of the shares of common stock offered by this prospectus. To the extent the option is exercised, each underwriter will become obligated, subject to certain conditions, to purchase about the same percentage of the additional shares of common stock as the number listed next to the underwriter’s name in the preceding table bears to the total number of shares of common stock listed next to the names of all underwriters in the preceding table.
157
Table of Contents
The following table shows the per share and total public offering price, underwriting discounts and commissions, and proceeds before expenses to us. These amounts are shown assuming both no exercise and full exercise of the underwriters’ option to purchase up to an additional 1,305,000 shares of common stock.
| Total | ||||||||||||
| Per Share | No Exercise | Full Exercise | ||||||||||
| Public offering price |
$ | $ | $ | |||||||||
| Underwriting discounts and commissions to be paid by us |
$ | $ | $ | |||||||||
| Proceeds, before expenses, to us |
$ | $ | $ | |||||||||
The estimated offering expenses payable by us, exclusive of the underwriting discounts and commissions, are approximately $5,500,000. We have agreed to reimburse the underwriters for expenses relating to clearance of this offering with the Financial Industry Regulatory Authority up to $30,000. The underwriters have agreed to reimburse us for certain expenses incurred by us in connection with this offering.
The underwriters have informed us that they do not intend sales to discretionary accounts to exceed 5% of the total number of shares of common stock offered by them.
Our common stock has been approved for listing on The NASDAQ Global Market under the trading symbol “TNTR.”
We and all directors and officers and the holders of substantially all of our outstanding stock and stock options have agreed or will agree that, without the prior written consent of Morgan Stanley & Co. LLC on behalf of the underwriters, we and they will not, during the period ending 180 days after the date of this prospectus, or the restricted period:
| • | offer, pledge, sell, contract to sell, sell any option or contract to purchase, purchase any option or contract to sell, grant any option, right or warrant to purchase, lend or otherwise transfer or dispose of, directly or indirectly, any shares of common stock beneficially owned, as such term is used in Rule 13d-3 of the Exchange Act, by the locked-up party or any securities convertible into or exercisable or exchangeable for shares of common stock; |
| • | in our case, file any registration statement with the SEC relating to the offering of any shares of common stock or any securities convertible into or exercisable or exchangeable for common stock; or |
| • | enter into any swap or other arrangement that transfers to another, in whole or in part, any of the economic consequences of ownership of the common stock, |
whether any such transaction described above is to be settled by delivery of common stock or such other securities, in cash or otherwise. In addition, we and each such person agrees that, without the prior written consent of Morgan Stanley & Co. LLC on behalf of the underwriters, we or such other person will not, during the restricted period, make any demand for, or exercise any right with respect to, the registration of any shares of common stock or any security convertible into or exercisable or exchangeable for common stock.
The restrictions described in the immediately preceding paragraph do not apply to certain transactions, including:
| • | transactions by any person other than us relating to shares of common stock or other securities acquired in open market transactions after the completion of the offering of the shares; provided that no filing under Section 16(a) of the Exchange Act is required or voluntarily made in connection with subsequent sales of the common stock or other securities acquired in such open market transactions; |
| • | the sale of shares to the underwriters; |
158
Table of Contents
| • | transfers of shares of common stock or any security convertible into or exercisable or exchangeable for common stock (i) as a bona fide gift, or gifts, or for bona fide estate planning purposes, (ii) upon death or by will, testamentary document or intestate succession, (iii) to an immediate family member of the locked-up party or to any trust for the direct or indirect benefit of the locked-up party or one or more immediate family members of the locked-up party, or (iv) if the locked-up party is a trust, to any trustee or beneficiary of the locked-up party or the estate of any such trustee or beneficiary; |
| • | transfers or distributions of shares of common stock or any security convertible into or exercisable or exchangeable for common stock by a stockholder that is a corporation, partnership, limited liability company or other business entity (i) to another corporation, partnership, limited liability company or other business entity that controls, is controlled by or managed by or is under common control with such stockholder or (ii) as part of a transfer or distribution to an equity holder of such stockholder or to the estate of any such equity holder; |
| • | the receipt by the locked-up party from us of shares of common stock upon the exercise or settlement of options or restricted stock units granted under a stock incentive plan or other equity award plan which plan is described in this prospectus or (ii) the transfer of shares of common stock or any securities convertible into common stock to us upon a vesting event of our securities or upon the exercise of options or warrants to purchase our securities granted under a stock incentive plan or other equity award plan which plan is described in this prospectus, in each case on a “cashless” or “net exercise” basis and to the extent permitted by the instruments representing such options or warrants or to cover tax obligations of the locked-up party in connection with such vesting or exercise, so long as such “cashless exercise” or “net exercise” is effected solely by the surrender of outstanding options or warrants (or the common stock issuable upon the exercise thereof) to us and our cancellation of all or a portion thereof to pay the exercise price and/or tax obligations; provided that in the case of (i), the shares received upon such exercise or settlement of the option or restricted stock unit are subject to the restrictions set forth above, and provided further in the cases of (i) or (ii) that no filing under Section 16(a) of the Exchange Act or any other public filing or disclosure of such transfer shall be required or shall be voluntarily made within 60 days after the date of this prospectus, and after such 60th day, if the locked-up party is required to file a report under Section 16(a) of the Exchange Act or any other public filing or disclosure of such transfer during the restricted period, the locked-up party shall include a statement in such report to the effect that, in the case of (i), such transfer relates to the exercise or settlement of options or restricted stock units, the shares of common stock received upon such transfer are subject to the restrictions set forth above and no shares or securities were sold, and in the case of (ii), the purpose of such transfer was to exercise options or warrants to purchase our securities, in each case on a “cashless” or “net exercise” basis or to cover tax withholding obligations of the locked-up party in connection with such vesting or exercise; |
| • | the establishment of a trading plan pursuant to Rule 10b5-1 under the Exchange Act for the transfer of shares of common stock, provided that (i) such plan does not provide for the transfer of common stock during the restricted period and (ii) to the extent a public announcement or filing under the Exchange Act, if any, is required or voluntarily made by or on behalf of the locked-up party or us regarding the establishment of such plan, such announcement or filing shall include a statement to the effect that no transfer of common stock may be made under such plan during the restricted period; |
| • | the transfer of common stock or any security convertible into or exercisable or exchangeable for common stock that occurs by operation of law pursuant to a qualified domestic order in connection with a court order or in connection with a divorce settlement, provided that any filing under Section 16(a) of the Exchange Act or any other public filing or disclosure of such transfer by or on behalf of the locked-up party that is made during the restricted period as a result of such transfer shall include a statement that such transfer has occurred by operation of law; |
| • | any transfer to us of common stock pursuant to arrangements under which we have the option to repurchase such shares or securities or a right of first refusal with respect to transfers of such shares or |
159
Table of Contents
| securities, in each case at the lower of cost or fair value in connection with the termination of employment or service of the locked-up party with us, provided that any filings under Section 16(a) of the Exchange Act, or any other public filing or disclosure of such transfer by or on behalf of the locked-up party, shall state that the transfer is in connection with (i) a repurchase by us at the lower of cost or fair value in connection with the termination of employment or service of the locked-up party with us or (ii) the exercise of our right of first refusal with respect to the transfer of such shares or securities; |
| • | the conversion or reclassification of our outstanding preferred stock or other classes of common stock into shares of common stock in connection with the consummation of this offering, provided that any such shares of common stock received upon such conversion or reclassification shall remain subject to the restrictions set forth above; |
| • | the transfer of shares of our common stock or any security convertible into or exercisable or exchangeable for our common stock after the closing of this offering pursuant to a bona fide third-party tender offer, merger, consolidation or other similar transaction made to all holders of our common stock involving the transfer, whether by tender offer, merger, consolidation or other similar transaction, in one transaction or a series of related transactions, to a person or group of affiliated persons, other than the underwriters pursuant to this offering, of shares of common stock if, after such transfer, such person or group of affiliated persons would hold at least a majority of our outstanding voting securities, or of the surviving entity; provided that such transaction must be approved by our board of directors and, in the event that the tender offer, merger, consolidation or other such transaction is not completed, the common stock owned by the locked-up party shall remain subject to the restrictions set forth above; |
provided that in the case of any transfer or distribution pursuant to the third, fourth and seventh bullet points above, each transferee, donee, or distributee shall sign and deliver a lock-up letter with the same restrictions as set forth above prior to such transfer or distribution;
provided further that in the case of any transfer or distribution pursuant to the third bullet point above, such transfer shall not involve a disposition of value and no filing under Section 16(a) of the Exchange Act, or any other public filing or disclosure of such transfer by or on behalf of the locked-up party, reporting a reduction in beneficial ownership of shares of common stock, shall be required or shall be voluntarily made during the restricted period (other than any required Form 5 filing); and
provided further that in the case of any transfer or distribution pursuant to the fourth bullet point above, such transfer shall not involve a disposition of value and no filing under Section 16(a) of the Exchange Act, or any other public filing or disclosure of such transfer by or on behalf of the locked-up party, reporting a reduction in beneficial ownership of shares of common stock, shall be required or shall be voluntarily made during the restricted period.
Morgan Stanley & Co. LLC, in its sole discretion, may release the common stock and other securities subject to the lock-up agreements described above in whole or in part at any time.
In order to facilitate the offering of the common stock, the underwriters may engage in transactions that stabilize, maintain, or otherwise affect the price of the common stock. Specifically, the underwriters may sell more shares than they are obligated to purchase under the underwriting agreement, creating a short position. A short sale is covered if the short position is no greater than the number of shares available for purchase by the underwriters under the over-allotment option. The underwriters can close out a covered short sale by exercising the over-allotment option or purchasing shares in the open market. In determining the source of shares to close out a covered short sale, the underwriters will consider, among other things, the open market price of shares compared to the price available under the over-allotment option. The underwriters may also sell shares in excess of the over-allotment option, creating a naked short position. The underwriters must close out any naked short position by purchasing shares in the open market. A naked short position is more likely to be created if the
160
Table of Contents
underwriters are concerned that there may be downward pressure on the price of the common stock in the open market after pricing that could adversely affect investors who purchase in this offering. As an additional means of facilitating this offering, the underwriters may bid for, and purchase, shares of common stock in the open market to stabilize the price of the common stock. These activities may raise or maintain the market price of the common stock above independent market levels or prevent or retard a decline in the market price of the common stock. The underwriters are not required to engage in these activities and may end any of these activities at any time. The underwriters may carry out these transactions on the NASDAQ Stock Market, in the over-the-counter market, or otherwise.
We and the underwriters will agree to indemnify each other against certain liabilities, including liabilities under the Securities Act.
A prospectus in electronic format may be made available on websites maintained by one or more underwriters, or selling group members, if any, participating in this offering. The representatives may agree to allocate a number of shares of common stock to underwriters for sale to their online brokerage account holders. Internet distributions will be allocated by the representatives to underwriters that may make Internet distributions on the same basis as other allocations.
The underwriters and their respective affiliates are full service financial institutions engaged in various activities, which may include securities trading, commercial and investment banking, financial advisory, investment management, investment research, principal investment, hedging, financing and brokerage activities. Certain of the underwriters and their respective affiliates have, from time to time, performed, and may in the future perform, various financial advisory and investment banking services for us, for which they received or will receive customary fees and expenses.
In addition, in the ordinary course of their various business activities, the underwriters and their respective affiliates may make or hold a broad array of investments and actively trade debt and equity securities (or related derivative securities) and financial instruments (including bank loans) for their own account and for the accounts of their customers and may at any time hold long and short positions in such securities and instruments. Such investment and securities activities may involve our securities and instruments. The underwriters and their respective affiliates may also make investment recommendations or publish or express independent research views in respect of such securities or instruments and may at any time hold, or recommend to clients that they acquire, long or short positions in such securities and instruments.
Pricing of the Offering
Prior to the completion of this offering, there will be no public market for our common stock. The initial public offering price will be determined by negotiations between us and the representatives. Among the factors we intend to consider in determining the initial public offering price are our future prospects and those of our industry in general, our sales, earnings and certain other financial and operating information in recent periods, and the price-earnings ratios, price-sales ratios, market prices of securities, and certain financial and operating information of companies engaged in activities similar to ours.
Selling Restrictions
European Economic Area
In relation to each Member State of the European Economic Area which has implemented the Prospectus Directive, a Relevant Member State, an offer to the public of any shares of our common stock may not be made in that Relevant Member State, except that an offer to the public in that Relevant Member State of any shares of our common stock may be made at any time under the following exemptions under the Prospectus Directive, if they have been implemented in that Relevant Member State:
(a) to any legal entity which is a qualified investor as defined in the Prospectus Directive;
161
Table of Contents
(b) to fewer than 100 or, if the Relevant Member State has implemented the relevant provision of the 2010 PD Amending Directive, 150, natural or legal persons (other than qualified investors as defined in the Prospectus Directive), as permitted under the Prospectus Directive, subject to obtaining the prior consent of the representatives for any such offer; or
(c) in any other circumstances falling within Article 3(2) of the Prospectus Directive, provided that no such offer of shares of our common stock shall result in a requirement for the publication by us or any underwriter of a prospectus pursuant to Article 3 of the Prospectus Directive.
For the purposes of this provision, the expression an “offer to the public” in relation to any shares of our common stock in any Relevant Member State means the communication in any form and by any means of sufficient information on the terms of the offer and any shares of our common stock to be offered so as to enable an investor to decide to purchase any shares of our common stock, as the same may be varied in that Member State by any measure implementing the Prospectus Directive in that Member State, the expression “Prospectus Directive” means Directive 2003/71/EC (and amendments thereto, including the 2010 PD Amending Directive, to the extent implemented in the Relevant Member State), and includes any relevant implementing measure in the Relevant Member State, and the expression “2010 PD Amending Directive” means Directive 2010/73/EU.
United Kingdom
Each underwriter has represented and agreed that:
(a) it has only communicated or caused to be communicated and will only communicate or cause to be communicated an invitation or inducement to engage in investment activity, within the meaning of Section 21 of the Financial Services and Markets Act 2000, or FSMA, received by it in connection with the issue or sale of the shares of our common stock in circumstances in which Section 21(1) of the FSMA does not apply to us; and
(b) it has complied and will comply with all applicable provisions of the FSMA with respect to anything done by it in relation to the shares of our common stock in, from or otherwise involving the United Kingdom.
Canada
The shares of our common stock may be sold only to purchasers purchasing, or deemed to be purchasing, as principal that are accredited investors, as defined in National Instrument 45-106 Prospectus Exemptions or subsection 73.3(1) of the Securities Act (Ontario), and are permitted clients, as defined in National Instrument 31-103 Registration Requirements, Exemptions and Ongoing Registrant Obligations. Any resale of the shares of our common stock must be made in accordance with an exemption from, or in a transaction not subject to, the prospectus requirements of applicable securities laws.
Securities legislation in certain provinces or territories of Canada may provide a purchaser with remedies for rescission or damages if this prospectus (including any amendment thereto) contains a misrepresentation, provided that the remedies for rescission or damages are exercised by the purchaser within the time limit prescribed by the securities legislation of the purchaser’s province or territory. The purchaser should refer to any applicable provisions of the securities legislation of the purchaser’s province or territory for particulars of these rights or consult with a legal advisor.
Pursuant to section 3A.3 (or, in the case of securities issued or guaranteed by the government of a non-Canadian jurisdiction, section 3A.4) of National Instrument 33-105 Underwriting Conflicts (NI 33-105), the underwriters are not required to comply with the disclosure requirements of NI 33-105 regarding underwriter conflicts of interest in connection with this offering.
162
Table of Contents
Switzerland
The shares of our common stock may not be publicly offered in Switzerland and will not be listed on the SIX Swiss Exchange, or SIX, or on any other stock exchange or regulated trading facility in Switzerland. This prospectus has been prepared without regard to the disclosure standards for issuance prospectuses under art. 652a or art. 1156 of the Swiss Code of Obligations or the disclosure standards for listing prospectuses under art. 27 ff. of the SIX Listing Rules or the listing rules of any other stock exchange or regulated trading facility in Switzerland. Neither this prospectus nor any other offering or marketing material relating to the shares of our common stock or the offering may be publicly distributed or otherwise made publicly available in Switzerland.
Neither this prospectus nor any other offering or marketing material relating to the offering, us or our shares of common stock have been or will be filed with or approved by any Swiss regulatory authority. In particular, this document will not be filed with, and the offer of shares will not be supervised by, the Swiss Financial Market Supervisory Authority FINMA, and the offer of shares has not been and will not be authorized under the Swiss Federal Act on Collective Investment Schemes, or CISA. The investor protection afforded to acquirers of interests in collective investment schemes under the CISA does not extend to acquirers of shares of our common stock.
Dubai International Financial Centre
This prospectus relates to an Exempt Offer in accordance with the Offered Securities Rules of the Dubai Financial Services Authority, or DFSA. This prospectus is intended for distribution only to persons of a type specified in the Offered Securities Rules of the DFSA. It must not be delivered to, or relied on by, any other person. The DFSA has no responsibility for reviewing or verifying any documents in connection with Exempt Offers. The DFSA has not approved this prospectus nor taken steps to verify the information set forth herein and has no responsibility for the prospectus. The shares of our common stock to which this prospectus relates may be illiquid and/or subject to restrictions on their resale. Prospective purchasers of the shares of our common stock offered should conduct their own due diligence on the shares of our common stock. If you do not understand the contents of this prospectus you should consult an authorized financial advisor.
Australia
No placement document, prospectus, product disclosure statement or other disclosure document has been lodged with the Australian Securities and Investments Commission, or ASIC, in relation to the offering. This prospectus does not constitute a prospectus, product disclosure statement or other disclosure document under the Corporations Act 2001, or the Corporations Act, and does not purport to include the information required for a prospectus, product disclosure statement or other disclosure document under the Corporations Act.
Any offer in Australia of the shares may only be made to persons, or the Exempt Investors, who are “sophisticated investors” (within the meaning of section 708(8) of the Corporations Act), “professional investors” (within the meaning of section 708(11) of the Corporations Act) or otherwise pursuant to one or more exemptions contained in section 708 of the Corporations Act so that it is lawful to offer the shares without disclosure to investors under Chapter 6D of the Corporations Act.
The shares applied for by Exempt Investors in Australia must not be offered for sale in Australia in the period of twelve months after the date of allotment under the offering, except in circumstances where disclosure to investors under Chapter 6D of the Corporations Act would not be required pursuant to an exemption under section 708 of the Corporations Act or otherwise or where the offer is pursuant to a disclosure document which complies with Chapter 6D of the Corporations Act. Any person acquiring shares must observe such Australian on-sale restrictions.
This prospectus contains general information only and does not take account of the investment objectives, financial situation or particular needs of any particular person. It does not contain any securities
163
Table of Contents
recommendations or financial product advice. Before making an investment decision, investors need to consider whether the information in this prospectus is appropriate to their needs, objectives and circumstances, and, if necessary, seek expert advice on those matters.
Hong Kong
The shares of our common stock have not been offered or sold and will not be offered or sold in Hong Kong, by means of any document, other than (i) to “professional investors” as defined in the Securities and Futures Ordinance (Cap. 571) of Hong Kong and any rules made under that Ordinance; or (ii) in other circumstances which do not result in the document being a “prospectus” as defined in the Companies Ordinance (Cap. 32) of Hong Kong or which do not constitute an offer to the public within the meaning of that Ordinance. No advertisement, invitation or document relating to the shares of our common stock has been or may be issued or has been or may be in the possession of any person for the purposes of issue, whether in Hong Kong or elsewhere, which is directed at, or the contents of which are likely to be accessed or read by, the public of Hong Kong (except if permitted to do so under the securities laws of Hong Kong) other than with respect to the shares of our common stock which are or are intended to be disposed of only to persons outside Hong Kong or only to “professional investors” as defined in the Securities and Futures Ordinance and any rules made under that Ordinance.
Japan
The shares of our common stock have not been and will not be registered under the Financial Instruments and Exchange Law of Japan (Law No. 25 of 1948, as amended) and, accordingly, will not be offered or sold, directly or indirectly, in Japan, or for the benefit of any Japanese Person or to others for re-offering or resale, directly or indirectly, in Japan or to any Japanese Person, except in compliance with all applicable laws, regulations and ministerial guidelines promulgated by relevant Japanese governmental or regulatory authorities in effect at the relevant time. For the purposes of this paragraph, “Japanese Person” shall mean any person resident in Japan, including any corporation or other entity organized under the laws of Japan.
Singapore
This prospectus has not been registered as a prospectus with the Monetary Authority of Singapore. Accordingly, this prospectus and any other document or material in connection with the offer or sale, or invitation for subscription or purchase, of shares of our common stock may not be circulated or distributed, nor may shares of our common stock be offered or sold, or be made the subject of an invitation for subscription or purchase, whether directly or indirectly, to persons in Singapore other than (i) to an institutional investor under Section 274 of the Securities and Futures Act, Chapter 289 of Singapore, or the SFA, (ii) to a relevant person pursuant to Section 275(1), or any person pursuant to Section 275(1A), and in accordance with the conditions specified in Section 275, of the SFA, or (iii) otherwise pursuant to, and in accordance with the conditions of, any other applicable provision of the SFA.
Where shares of our common stock are subscribed or purchased under Section 275 of the SFA by a relevant person which is:
| (a) | a corporation (which is not an accredited investor (as defined in Section 4A of the SFA)) the sole business of which is to hold investments and the entire share capital of which is owned by one or more individuals, each of whom is an accredited investor; or |
| (b) | a trust (where the trustee is not an accredited investor) whose sole purpose is to hold investments and each beneficiary of the trust is an individual who is an accredited investor, |
164
Table of Contents
securities (as defined in Section 239(1) of the SFA) of that corporation or the beneficiaries’ rights and interest (howsoever described) in that trust shall not be transferred within six months after that corporation or that trust has acquired shares of our common stock pursuant to an offer made under Section 275 of the SFA except:
| (a) | to an institutional investor or to a relevant person defined in Section 275(2) of the SFA, or to any person arising from an offer referred to in Section 275(1A) or Section 276(4)(i)(B) of the SFA; |
| (b) | where no consideration is or will be given for the transfer; |
| (c) | where the transfer is by operation of law; |
| (d) | as specified in Section 276(7) of the SFA; or |
| (e) | as specified in Regulation 32 of the Securities and Futures (Offers of Investments) (Shares and Debentures) Regulations 2005 of Singapore. |
165
Table of Contents
The validity of the shares of common stock offered hereby will be passed upon for us by Wilson Sonsini Goodrich & Rosati, Professional Corporation, Palo Alto, California. Goodwin Procter LLP, Menlo Park, California, is acting as counsel to the underwriters. Certain members of, and investment partnerships comprised of members of, and persons associated with, Wilson Sonsini Goodrich & Rosati, P.C., own common stock representing 0.05% of our outstanding common stock on an as converted basis as of April 30, 2017.
The consolidated financial statements of Tintri, Inc. as of January 31, 2016 and 2017, and for each of the years in the three-year period ended January 31, 2017, have been included herein in reliance upon the report of KPMG LLP, independent registered public accounting firm, appearing elsewhere herein, and upon the authority of said firm as experts in accounting and auditing.
We have filed with the SEC a registration statement on Form S-1 under the Securities Act with respect to the shares of common stock offered by this prospectus. This prospectus, which constitutes a part of the registration statement, does not contain all of the information set forth in the registration statement, some of which is contained in exhibits to the registration statement as permitted by the rules and regulations of the SEC. For further information with respect to us and our common stock, we refer you to the registration statement, including the exhibits filed as a part of the registration statement. Statements contained in this prospectus concerning the contents of any contract or any other document are not necessarily complete. If a contract or document has been filed as an exhibit to the registration statement, please see the copy of the contract or document that has been filed. Each statement is this prospectus relating to a contract or document filed as an exhibit is qualified in all respects by the filed exhibit. You may obtain copies of this information by mail from the Public Reference Section of the SEC, 100 F Street, N.E., Room 1580, Washington, D.C. 20549, at prescribed rates. You may obtain information on the operation of the public reference rooms by calling the SEC at 1-800-SEC-0330. The SEC also maintains an Internet website that contains reports, proxy statements and other information about issuers, like us, that file electronically with the SEC. The address of that website is www.sec.gov.
As a result of this offering, we will become subject to the information and reporting requirements of the Exchange Act and, in accordance with this law will file periodic reports, proxy statements, and other information with the SEC. These periodic reports, proxy statements and other information will be available for inspection and copying at the SEC’s public reference facilities and the website of the SEC referred to above. We also maintain a website at www.tintri.com. Upon completion of this offering, you may access these materials free of charge as soon as reasonably practicable after they are electronically filed with, or furnished to, the SEC. Information contained on or that can be accessed through our website is not a part of this prospectus, and the inclusion of our website address in this prospectus is an inactive textual reference only.
166
Table of Contents
INDEX TO CONSOLIDATED FINANCIAL STATEMENTS
| Page | ||||
| F-2 | ||||
| F-3 | ||||
| F-4 | ||||
| F-5 | ||||
| Consolidated Statements of Convertible Preferred Stock and Stockholders’ Deficit |
F-6 | |||
| F-7 | ||||
| F-8 | ||||
F-1
Table of Contents
When the transaction referred to in note 16(j) of the notes to the consolidated financial statements has been consummated, we will be in a position to render the following report.
/s/ KPMG LLP
REPORT OF INDEPENDENT REGISTERED PUBLIC ACCOUNTING FIRM
The Board of Directors and Stockholders
Tintri, Inc.:
We have audited the accompanying consolidated balance sheets of Tintri, Inc. and subsidiaries (the Company) as of January 31, 2016 and 2017, and the related consolidated statements of operations, comprehensive loss, convertible preferred stock and stockholders’ deficit, and cash flows for each of the years in the three-year period ended January 31, 2017. These consolidated financial statements are the responsibility of the Company’s management. Our responsibility is to express an opinion on these consolidated financial statements based on our audits.
We conducted our audits in accordance with the standards of the Public Company Accounting Oversight Board (United States). Those standards require that we plan and perform the audit to obtain reasonable assurance about whether the financial statements are free of material misstatement. An audit includes examining, on a test basis, evidence supporting the amounts and disclosures in the financial statements. An audit also includes assessing the accounting principles used and significant estimates made by management, as well as evaluating the overall financial statement presentation. We believe that our audits provide a reasonable basis for our opinion.
In our opinion, the consolidated financial statements referred to above present fairly, in all material respects, the financial position of Tintri, Inc. and subsidiaries as of January 31, 2016 and 2017, and the results of their operations and their cash flows for each of the years in the three-year period ended January 31, 2017, in conformity with U.S. generally accepted accounting principles.
San Francisco, California
June 1, 2017 except as to
note 16, which is as of
F-2
Table of Contents
TINTRI, INC.
(in thousands, except share and per share data)
| As of January 31, | As of April 30, 2017 |
Pro forma April 30, 2017 (Note 1) |
||||||||||||||
| 2016 | 2017 | |||||||||||||||
| (unaudited) | ||||||||||||||||
| Assets |
||||||||||||||||
| Current assets: |
||||||||||||||||
| Cash and cash equivalents |
$ | 50,716 | $ | 48,048 | $ | 48,692 | $ | 48,692 | ||||||||
| Short-term investments |
63,239 | — | — | — | ||||||||||||
| Accounts receivable, net |
20,713 | 30,749 | 20,635 | 20,635 | ||||||||||||
| Inventories, net |
3,817 | 6,509 | 6,296 | 6,296 | ||||||||||||
| Prepaid and other current assets |
3,126 | 6,202 | 8,475 | 8,475 | ||||||||||||
|
|
|
|
|
|
|
|
|
|||||||||
| Total current assets |
141,611 | 91,508 | 84,098 | 84,098 | ||||||||||||
| Property and equipment, net |
14,630 | 10,410 | 10,012 | 10,012 | ||||||||||||
| Other long-term assets |
1,916 | 2,984 | 2,985 | 2,985 | ||||||||||||
|
|
|
|
|
|
|
|
|
|||||||||
| Total assets |
$ | 158,157 | $ | 104,902 | $ | 97,095 | $ | 97,095 | ||||||||
|
|
|
|
|
|
|
|
|
|||||||||
| Liabilities, Convertible Preferred Stock and Stockholders’ Deficit |
||||||||||||||||
| Current liabilities: |
||||||||||||||||
| Accounts payable |
$ | 8,328 | $ | 15,674 | $ | 13,861 | $ | 13,861 | ||||||||
| Accrued and other current liabilities |
16,219 | 20,668 | 18,485 | 18,485 | ||||||||||||
| Deferred revenue, current |
20,381 | 28,056 | 30,198 | 30,198 | ||||||||||||
| Long-term debt, current portion |
7,000 | — | — | — | ||||||||||||
|
|
|
|
|
|
|
|
|
|||||||||
| Total current liabilities |
51,928 | 64,398 | 62,544 | 62,544 | ||||||||||||
| Deferred revenue, non-current |
21,483 | 28,389 | 29,832 | 29,832 | ||||||||||||
| Long-term debt |
34,906 | 48,914 | 68,404 | 68,404 | ||||||||||||
| Other long-term liabilities |
2,256 | 5,041 | 4,801 | 4,112 | ||||||||||||
|
|
|
|
|
|
|
|
|
|||||||||
| Total liabilities |
$ | 110,573 | $ | 146,742 | $ | 165,581 | $ | 164,892 | ||||||||
|
|
|
|
|
|
|
|
|
|||||||||
| Commitments and contingencies (Note 8) |
||||||||||||||||
| Convertible preferred stock, par value of $0.00005 per share—10,651,216, 10,651,216, and 10,679,599 shares authorized as of January 31, 2016 and 2017 and April 30, 2017 (unaudited); 10,610,966, 10,610,966 and 10,610,966 shares issued and outstanding as of January 31, 2016 and 2017 and April 30, 2017 (unaudited); aggregate liquidation preference $259,254, $259,254, and $259,254 as of January 31, 2016 and 2017 and April 30, 2017 (unaudited); no shares issued and outstanding as of April 30, 2017, pro forma (unaudited) |
$ | 257,141 | $ | 257,141 | $ | 263,729 | $ | — | ||||||||
| Stockholders’ deficit: |
||||||||||||||||
| Common stock, par value of $0.00005 per share—21,333,333, 21,333,333, and 21,333,333 shares authorized as of January 31, 2016 and 2017 and April 30, 2017 (unaudited); 3,459,368, 3,627,748 and 3,657,844 shares issued and outstanding as of January 31, 2016 and 2017 and April 30, 2017 (unaudited); 21,650,817 shares issued and outstanding as of April 30, 2017, pro forma (unaudited) |
1 | 1 | 1 | 2 | ||||||||||||
| Additional paid-in capital |
24,925 | 41,745 | 45,783 | 310,200 | ||||||||||||
| Notes receivables from stockholders |
(1,361 | ) | (1,544 | ) | (1,691 | ) | (1,691 | ) | ||||||||
| Accumulated other comprehensive loss |
(206 | ) | (466 | ) | (323 | ) | (323 | ) | ||||||||
| Accumulated deficit |
(232,916 | ) | (338,717 | ) | (375,985 | ) | (375,985 | ) | ||||||||
|
|
|
|
|
|
|
|
|
|||||||||
| Total stockholders’ deficit |
(209,557 | ) | (298,981 | ) | (332,215 | ) | (67,797 | ) | ||||||||
|
|
|
|
|
|
|
|
|
|||||||||
| Total liabilities, convertible preferred stock and stockholders’ deficit |
$ | 158,157 | $ | 104,902 | $ | 97,095 | $ | 97,095 | ||||||||
|
|
|
|
|
|
|
|
|
|||||||||
See accompanying notes to consolidated financial statements.
F-3
Table of Contents
TINTRI, INC.
Consolidated Statements of Operations
(in thousands, except share and per share data)
| Fiscal Year Ended January 31, | Three Months Ended April 30 |
|||||||||||||||||||
| 2015 | 2016 | 2017 | 2016 | 2017 | ||||||||||||||||
| (unaudited) | ||||||||||||||||||||
| Revenue: |
||||||||||||||||||||
| Product |
$ | 41,420 | $ | 68,652 | $ | 97,330 | $ | 16,677 | $ | 22,387 | ||||||||||
| Support and maintenance |
8,379 | 17,360 | 27,775 | 6,199 | 7,968 | |||||||||||||||
|
|
|
|
|
|
|
|
|
|
|
|||||||||||
| Total revenue |
49,799 | 86,012 | 125,105 | 22,876 | 30,355 | |||||||||||||||
|
|
|
|
|
|
|
|
|
|
|
|||||||||||
| Cost of revenue: |
||||||||||||||||||||
| Product |
17,144 | 25,138 | 34,738 | 5,936 | 8,909 | |||||||||||||||
| Support and maintenance |
4,565 | 7,110 | 9,437 | 2,072 | 3,039 | |||||||||||||||
|
|
|
|
|
|
|
|
|
|
|
|||||||||||
| Total cost of revenue |
21,709 | 32,248 | 44,175 | 8,008 | 11,948 | |||||||||||||||
|
|
|
|
|
|
|
|
|
|
|
|||||||||||
| Gross Profit: |
||||||||||||||||||||
| Product |
24,276 | 43,514 | 62,592 | 10,741 | 13,478 | |||||||||||||||
| Support and maintenance |
3,814 | 10,250 | 18,338 | 4,127 | 4,929 | |||||||||||||||
|
|
|
|
|
|
|
|
|
|
|
|||||||||||
| Total gross profit |
28,090 | 53,764 | 80,930 | 14,868 | 18,407 | |||||||||||||||
|
|
|
|
|
|
|
|
|
|
|
|||||||||||
| Operating expenses: |
||||||||||||||||||||
| Research and development |
28,155 | 43,179 | 53,445 | 13,659 | 14,923 | |||||||||||||||
| Sales and marketing |
55,060 | 87,993 | 108,903 | 24,996 | 27,442 | |||||||||||||||
| General and administrative |
13,941 | 18,773 | 19,364 | 5,675 | 5,332 | |||||||||||||||
|
|
|
|
|
|
|
|
|
|
|
|||||||||||
| Total operating expenses |
97,156 | 149,945 | 181,712 | 44,330 | 47,697 | |||||||||||||||
|
|
|
|
|
|
|
|
|
|
|
|||||||||||
| Loss from operations |
(69,066 | ) | (96,181 | ) | (100,782 | ) | (29,462 | ) | (29,290 | ) | ||||||||||
| Other expense, net: |
||||||||||||||||||||
| Interest expense |
(279 | ) | (4,407 | ) | (5,231 | ) | (1,437 | ) | (1,274 | ) | ||||||||||
| Other income (expense), net |
(119 | ) | 254 | 677 | 286 | 42 | ||||||||||||||
|
|
|
|
|
|
|
|
|
|
|
|||||||||||
| Total other expense, net |
(398 | ) | (4,153 | ) | (4,554 | ) | (1,151 | ) | (1,232 | ) | ||||||||||
|
|
|
|
|
|
|
|
|
|
|
|||||||||||
| Loss before provision for income taxes |
(69,464 | ) | (100,334 | ) | (105,336 | ) | (30,613 | ) | (30,522 | ) | ||||||||||
| Provision for income taxes |
222 | 634 | 465 | 198 | 158 | |||||||||||||||
|
|
|
|
|
|
|
|
|
|
|
|||||||||||
| Net loss |
$ | (69,686 | ) | $ | (100,968 | ) | $ | (105,801 | ) | $ | (30,811 | ) | $ | (30,680 | ) | |||||
|
|
|
|
|
|
|
|
|
|
|
|||||||||||
| Deemed dividend to Series E and E-1 Convertible Preferred Stock (unaudited) |
$ | — | $ | — | $ | — | $ | — | $ | (6,588 | ) | |||||||||
|
|
|
|
|
|
|
|
|
|
|
|||||||||||
| Net loss attributable to common stockholders |
$ | (69,686 | ) | $ | (100,968 | ) | $ | (105,801 | ) | $ | (30,811 | ) | $ | (37,268 | ) | |||||
|
|
|
|
|
|
|
|
|
|
|
|||||||||||
| Net loss per share attributable to common stockholders—basic and diluted |
$ | (25.34 | ) | $ | (32.15 | ) | $ | (30.73 | ) | $ | (9.15 | ) | $ | (10.35 | ) | |||||
|
|
|
|
|
|
|
|
|
|
|
|||||||||||
| Weighted-average shares used in computing net loss per share attributable to common stockholders—basic and diluted |
2,750,413 | 3,140,947 | 3,442,549 | 3,368,159 | 3,602,380 | |||||||||||||||
|
|
|
|
|
|
|
|
|
|
|
|||||||||||
| Pro forma net loss per share attributable to common stockholders—basic and diluted (unaudited) (Note 12(b)) |
$ | (4.93 | ) | $ | (1.43 | ) | ||||||||||||||
|
|
|
|
|
|||||||||||||||||
| Pro forma weighted-average shares used in computing pro forma net loss per share attributable to common stockholder—basic and diluted (unaudited) (Note 12(b)) |
21,435,522 | 21,595,353 | ||||||||||||||||||
|
|
|
|
|
|||||||||||||||||
See accompanying notes to consolidated financial statements.
F-4
Table of Contents
TINTRI, INC.
Consolidated Statements of Comprehensive Loss
(in thousands)
| Fiscal Year Ended January 31, | Three Months Ended April 30, |
|||||||||||||||||||
| 2015 | 2016 | 2017 | 2016 | 2017 | ||||||||||||||||
| (unaudited) | ||||||||||||||||||||
| Net loss |
$ | (69,686 | ) | $ | (100,968 | ) | $ | (105,801 | ) | $ | (30,811 | ) | $ | (30,680 | ) | |||||
| Other comprehensive income (loss), net of taxes: |
||||||||||||||||||||
| Unrealized gains (losses) on available-for-sale investments |
3 | (27 | ) | 14 | 12 | — | ||||||||||||||
| Foreign currency translation adjustments |
(138 | ) | (28 | ) | (274 | ) | 73 | 143 | ||||||||||||
|
|
|
|
|
|
|
|
|
|
|
|||||||||||
| Comprehensive loss, net of taxes |
$ | (69,821 | ) | $ | (101,023 | ) | $ | (106,061 | ) | $ | (30,726 | ) | $ | (30,537 | ) | |||||
|
|
|
|
|
|
|
|
|
|
|
|||||||||||
See accompanying notes to consolidated financial statements.
F-5
Table of Contents
TINTRI, INC.
Consolidated Statements of Convertible Preferred Stock and Stockholders’ Deficit
(in thousands, except share and per share data)
| Convertible preferred stock |
Common stock | Additional paid-in capital |
Notes receivable from stockholders |
Accumulated other comprehensive loss |
Accumulated deficit |
Total stockholders’ deficit |
||||||||||||||||||||||||||||||
| Shares | Amount | Shares | Amount | |||||||||||||||||||||||||||||||||
| Balance—January 31, 2014 |
7,782,781 | $ | 134,371 | 2,941,706 | $ | 1 | $ | 4,475 | $ | (11 | ) | $ | (16 | ) | $ | (62,262 | ) | $ | (57,813 | ) | ||||||||||||||||
| Issuance of common stock upon exercise of stock options |
— | — | 203,447 | — | 1,103 | — | — | — | 1,103 | |||||||||||||||||||||||||||
| Repurchase of unvested early exercised stock options |
— | — | (13,800 | ) | — | (55 | ) | — | — | — | (55 | ) | ||||||||||||||||||||||||
| Vesting of early exercise of stock options |
— | — | — | — | 29 | — | — | — | 29 | |||||||||||||||||||||||||||
| Vesting of stock options exercised with notes receivable |
— | — | — | — | 718 | (718 | ) | — | — | — | ||||||||||||||||||||||||||
| Accrued interest for notes receivable from stockholders |
— | — | — | — | — | (37 | ) | — | — | (37 | ) | |||||||||||||||||||||||||
| Stock-based compensation |
— | — | — | — | 5,194 | — | — | — | 5,194 | |||||||||||||||||||||||||||
| Other comprehensive loss |
— | — | — | — | — | — | (135 | ) | — | (135 | ) | |||||||||||||||||||||||||
| Net loss |
— | — | — | — | — | — | — | (69,686 | ) | (69,686 | ) | |||||||||||||||||||||||||
|
|
|
|
|
|
|
|
|
|
|
|
|
|
|
|
|
|
|
|||||||||||||||||||
| Balance—January 31, 2015 |
7,782,781 | 134,371 | 3,131,353 | 1 | 11,464 | (766 | ) | (151 | ) | (131,948 | ) | (121,400 | ) | |||||||||||||||||||||||
| Issuance of Series F Convertible Preferred Stock at $44.04 per share for cash, net of issuance costs of $1,784 |
2,828,185 | 122,770 | — | — | — | — | — | — | — | |||||||||||||||||||||||||||
| Issuance of common stock upon exercise of stock options |
— | — | 329,717 | — | 3,132 | — | — | — | 3,132 | |||||||||||||||||||||||||||
| Repurchase of unvested early exercised stock options |
— | — | (1,702 | ) | — | (5 | ) | — | — | — | (5 | ) | ||||||||||||||||||||||||
| Vesting of early exercise of stock options |
— | — | — | — | 23 | — | — | — | 23 | |||||||||||||||||||||||||||
| Vesting of stock options exercised with notes receivable |
— | — | — | — | 556 | (556 | ) | — | — | — | ||||||||||||||||||||||||||
| Accrued interest for notes receivable from stockholders |
— | — | — | — | — | (39 | ) | — | — | (39 | ) | |||||||||||||||||||||||||
| Stock-based compensation |
— | — | — | — | 9,755 | — | — | — | 9,755 | |||||||||||||||||||||||||||
| Other comprehensive loss |
— | — | — | — | — | — | (55 | ) | — | (55 | ) | |||||||||||||||||||||||||
| Net loss |
— | — | — | — | — | — | — | (100,968 | ) | (100,968 | ) | |||||||||||||||||||||||||
|
|
|
|
|
|
|
|
|
|
|
|
|
|
|
|
|
|
|
|||||||||||||||||||
| Balance—January 31, 2016 |
10,610,966 | 257,141 | 3,459,368 | 1 | 24,925 | (1,361 | ) | (206 | ) | (232,916 | ) | (209,557 | ) | |||||||||||||||||||||||
| Issuance of common stock upon exercise of stock options |
— | — | 168,380 | — | 2,292 | — | — | — | 2,292 | |||||||||||||||||||||||||||
| Vesting of early exercise of stock options |
— | — | — | — | 65 | — | — | — | 65 | |||||||||||||||||||||||||||
| Vesting of stock options exercised with notes receivable |
— | — | — | — | 558 | (558 | ) | — | — | — | ||||||||||||||||||||||||||
| Proceeds from repayment of notes receivable from stockholder |
— | — | — | — | — | 411 | — | — | 411 | |||||||||||||||||||||||||||
| Accrued interest for notes receivable from stockholders |
— | — | — | — | — | (36 | ) | — | — | (36 | ) | |||||||||||||||||||||||||
| Stock-based compensation |
— | — | — | — | 13,834 | — | — | — | 13,834 | |||||||||||||||||||||||||||
| Excess tax benefit from stock-based compensation |
— | — | — | — | 71 | — | — | — | 71 | |||||||||||||||||||||||||||
| Other comprehensive loss |
— | — | — | — | — | — | (260 | ) | — | (260 | ) | |||||||||||||||||||||||||
| Net loss |
— | — | — | — | — | — | — | (105,801 | ) | (105,801 | ) | |||||||||||||||||||||||||
|
|
|
|
|
|
|
|
|
|
|
|
|
|
|
|
|
|
|
|||||||||||||||||||
| Balance—January 31, 2017 |
10,610,966 | 257,141 | 3,627,748 | 1 | 41,745 | (1,544 | ) | (466 | ) | (338,717 | ) | (298,981 | ) | |||||||||||||||||||||||
| Issuance of common stock upon exercise of stock |
— | — | 30,096 | — | 418 | — | — | — | 418 | |||||||||||||||||||||||||||
| Vesting of early exercise of stock options (unaudited) |
— | — | — | — | 16 | — | — | — | 16 | |||||||||||||||||||||||||||
| Vesting of stock options exercised with notes |
— | — | — | — | 139 | (139 | ) | — | — | — | ||||||||||||||||||||||||||
| Accrued interest for notes receivable from |
— | — | — | — | — | (8 | ) | — | — | (8 | ) | |||||||||||||||||||||||||
| Stock-based compensation (unaudited) |
— | — | — | — | 3,465 | — | — | — | 3,465 | |||||||||||||||||||||||||||
| Deemed dividend to Series E and E-1 Convertible Preferred Stock (unaudited) |
— | 6,588 | — | — | — | — | — | (6,588 | ) | (6,588 | ) | |||||||||||||||||||||||||
| Other comprehensive loss (unaudited) |
— | — | — | — | — | — | 143 | — | 143 | |||||||||||||||||||||||||||
| Net loss (unaudited) |
— | — | — | — | — | — | — | (30,680 | ) | (30,680 | ) | |||||||||||||||||||||||||
|
|
|
|
|
|
|
|
|
|
|
|
|
|
|
|
|
|
|
|||||||||||||||||||
| Balance—April 30, 2017 (unaudited) |
10,610,966 | $ | 263,729 | 3,657,844 | $ | 1 | $ | 45,783 | $ | (1,691 | ) | $ | (323 | ) | $ | (375,985 | ) | $ | (332,215 | ) | ||||||||||||||||
|
|
|
|
|
|
|
|
|
|
|
|
|
|
|
|
|
|
|
|||||||||||||||||||
See accompanying notes to consolidated financial statements.
F-6
Table of Contents
TINTRI, INC.
Consolidated Statements of Cash Flows
(in thousands)
| Fiscal Year Ended January 31, | Three Months Ended April 30, |
|||||||||||||||||||
| 2015 | 2016 | 2017 | 2016 | 2017 | ||||||||||||||||
| (unaudited) | ||||||||||||||||||||
| Cash flows from operating activities: |
||||||||||||||||||||
| Net loss |
$ | (69,686 | ) | $ | (100,968 | ) | $ | (105,801 | ) | $ | (30,811 | ) | $ | (30,680 | ) | |||||
| Adjustments to reconcile net loss to net cash used in operating activities: |
||||||||||||||||||||
| Depreciation and amortization |
3,526 | 7,753 | 9,270 | 2,287 | 1,910 | |||||||||||||||
| Stock-based compensation expense |
5,194 | 9,755 | 13,834 | 3,798 | 3,465 | |||||||||||||||
| Excess tax benefit from stock-based compensation |
— | — | 71 | — | — | |||||||||||||||
| Accretion of balloon payment |
— | 947 | 603 | 217 | 57 | |||||||||||||||
| Amortization of debt issuance cost, credit facility fees and debt discounts |
116 | 670 | 239 | 136 | 7 | |||||||||||||||
| Other |
(8 | ) | (39 | ) | (36 | ) | (9 | ) | (8 | ) | ||||||||||
| Changes in operating assets and liabilities: |
||||||||||||||||||||
| Accounts receivable |
(12,605 | ) | (4,083 | ) | (10,036 | ) | 4,770 | 10,114 | ||||||||||||
| Inventories |
(2,953 | ) | 1,821 | (3,134 | ) | (401 | ) | 213 | ||||||||||||
| Prepaid expenses and other assets |
(2,875 | ) | (645 | ) | (3,731 | ) | (5,111 | ) | (2,275 | ) | ||||||||||
| Accounts payable |
5,862 | (1,095 | ) | 7,291 | 3,644 | (2,624 | ) | |||||||||||||
| Deferred revenue |
13,795 | 18,842 | 14,581 | 2,272 | 3,585 | |||||||||||||||
| Accrued and other liabilities |
8,536 | 4,933 | 6,483 | (488 | ) | (2,739 | ) | |||||||||||||
|
|
|
|
|
|
|
|
|
|
|
|||||||||||
| Net cash used in operating activities |
(51,098 | ) | (62,109 | ) | (70,366 | ) | (19,696 | ) | (18,975 | ) | ||||||||||
|
|
|
|
|
|
|
|
|
|
|
|||||||||||
| Cash flows from investing activities: |
||||||||||||||||||||
| Purchase of property and equipment |
(8,668 | ) | (10,914 | ) | (4,337 | ) | (372 | ) | (676 | ) | ||||||||||
| Purchase of investments |
(36,995 | ) | (70,419 | ) | (13,807 | ) | — | — | ||||||||||||
| Proceeds from maturities of investments |
6,500 | 6,350 | 76,478 | 23,965 | — | |||||||||||||||
| Proceeds from disposition of investments |
12,726 | 18,574 | — | — | — | |||||||||||||||
|
|
|
|
|
|
|
|
|
|
|
|||||||||||
| Net cash provided by (used in) investing activities |
(26,437 | ) | (56,409 | ) | 58,334 | 23,593 | (676 | ) | ||||||||||||
|
|
|
|
|
|
|
|
|
|
|
|||||||||||
| Cash flows from financing activities: |
||||||||||||||||||||
| Payment on capital lease financing |
(145 | ) | (300 | ) | (240 | ) | (70 | ) | (113 | ) | ||||||||||
| Proceeds from issuance of convertible preferred stock, net of issuance costs |
— | 122,770 | — | — | — | |||||||||||||||
| Proceeds from revolving line of credit |
14,000 | 7,000 | 6,962 | — | 5,000 | |||||||||||||||
| Proceeds from term loan |
3,000 | 35,000 | — | — | 15,000 | |||||||||||||||
| Repayment of revolving line of credit |
(10,861 | ) | (6,000 | ) | — | — | — | |||||||||||||
| Repayment of term loan |
(8,000 | ) | — | — | — | — | ||||||||||||||
| Proceeds from repayment of employee notes receivable |
— | — | 411 | 67 | — | |||||||||||||||
| Proceeds from exercise of stock options |
1,103 | 3,132 | 2,292 | 488 | 418 | |||||||||||||||
| Repurchase of common stock |
(55 | ) | (5 | ) | — | — | — | |||||||||||||
|
|
|
|
|
|
|
|
|
|
|
|||||||||||
| Net cash provided by (used in) financing activities |
(958 | ) | 161,597 | 9,425 | 485 | 20,305 | ||||||||||||||
| Foreign exchange impact on cash and cash equivalents |
64 | (2 | ) | (61 | ) | (41 | ) | (10 | ) | |||||||||||
|
|
|
|
|
|
|
|
|
|
|
|||||||||||
| Net increase (decrease) in cash and cash equivalents |
(78,429 | ) | 43,077 | (2,668 | ) | 4,341 | 644 | |||||||||||||
| Cash and cash equivalents, beginning of year |
86,068 | 7,639 | 50,716 | 50,716 | 48,048 | |||||||||||||||
|
|
|
|
|
|
|
|
|
|
|
|||||||||||
| Cash and cash equivalents, end of year |
$ | 7,639 | $ | 50,716 | $ | 48,048 | $ | 55,057 | $ | 48,692 | ||||||||||
|
|
|
|
|
|
|
|
|
|
|
|||||||||||
| Supplemental disclosures of cash flow information: |
||||||||||||||||||||
| Cash paid for income taxes |
$ | 96 | $ | 361 | $ | 912 | $ | 575 | $ | — | ||||||||||
|
|
|
|
|
|
|
|
|
|
|
|||||||||||
| Cash paid for interest |
$ | 44 | $ | 2,411 | $ | 4,038 | $ | 885 | $ | 1,316 | ||||||||||
|
|
|
|
|
|
|
|
|
|
|
|||||||||||
| Supplemental disclosures of noncash investing and financing activities: |
||||||||||||||||||||
| Convertible preferred stock warrants issued in connection with debt financing |
$ | 231 | $ | 252 | $ | — | $ | — | $ | 277 | ||||||||||
| Vesting of early exercised options |
$ | 29 | $ | 23 | $ | 65 | $ | 16 | $ | 16 | ||||||||||
| Assets acquired in connection with capital lease financing |
$ | 758 | $ | 15 | $ | 243 | $ | — | $ | — | ||||||||||
| Assets acquired through accounts payable |
$ | 2,232 | $ | 402 | $ | 317 | $ | 1,089 | $ | 762 | ||||||||||
| Vesting of stock options exercised with notes receivable |
$ | 718 | $ | 556 | $ | 558 | $ | 139 | $ | 139 | ||||||||||
| Transfer of inventory to sales demonstration equipment |
$ | — | $ | 1,150 | $ | 140 | $ | 113 | $ | 252 | ||||||||||
| Transfer of inventory to internal use equipment |
$ | — | $ | 48 | $ | 301 | $ | 205 | $ | 52 | ||||||||||
| Deemed dividend to series E and E-1 Convertible Preferred Stock |
$ | — | $ | — | $ | — | $ | — | $ | 6,588 | ||||||||||
See accompanying notes to consolidated financial statements.
F-7
Table of Contents
NOTES TO CONSOLIDATED FINANCIAL STATEMENTS
(1) Description of Business and Basis of Presentation
Description of Business
Tintri, Inc. (Tintri or the Company) was incorporated in the state of Delaware in 2008 and is headquartered in Mountain View, California. The Company develops and markets an enterprise cloud platform combining cloud management software technology and a range of all-flash storage systems, for virtualized and cloud environments.
Basis of Presentation and Consolidation
The accompanying consolidated financial statements have been prepared in accordance with U.S. generally accepted accounting principles (GAAP). The accompanying consolidated financial statements include the accounts of the Company and its wholly owned subsidiaries. All intercompany balances and transactions have been eliminated in consolidation.
Unaudited Pro Forma Consolidated Balance Sheet
Upon the completion of the initial public offering (IPO) contemplated by the Company, all of the outstanding shares of Convertible Preferred Stock will automatically convert into 10,610,966 shares of common stock. In addition, an additional 7,382,007 shares of common stock will be issued upon the conversion of certain of the outstanding shares of Convertible Preferred Stock. The Company’s outstanding warrant to purchase Series E Convertible Preferred Stock and Series F Convertible Preferred Stock will also be converted into a warrant to purchase common stock in connection with the Company’s IPO. Upon completion of the IPO, the outstanding convertible preferred stock warrant liability will be reclassified into additional paid-in capital.
Liquidity
The Company has experienced negative cash flows from operations since its inception and expects negative cash flows from operations to continue for the foreseeable future. Net losses incurred during the past three fiscal years ended January 31, 2015, 2016 and 2017 amounted to $69.7 million, $101.0 million and $105.8 million, respectively, and $30.7 million for the three months ended April 30, 2017 (unaudited). Unless and until the Company is able to generate sufficient revenue from sales of its products and services to generate positive cash flows from operations, it expects such losses to continue. The Company is also subject to certain financial covenants related to its debt facilities that, if breached, could result in the debt becoming immediately due and payable in the event the lenders choose to declare an event of default. The Company may not have sufficient liquidity to repay amounts outstanding under its debt facilities should they become immediately due and payable.
Historically, the Company has funded a significant portion of its operations through the issuance of equity and debt. In fiscal 2016, the Company raised $124.6 million in gross proceeds (Note 9) related to the sale of convertible preferred stock. Subsequent to January 31, 2017, the Company also entered into various amendments to its existing debt agreements and entered into a convertible note facility that increased the Company committed borrowing capacity to $50.0 million (Note 6). The Company expects that this additional financing, combined with its plans for continued revenue growth and its existing cash and cash equivalents, will provide sufficient liquidity for the Company to meet its obligations and debt financial covenants through at least June 7, 2018 (unaudited).
Until the Company can generate positive cash flows from operations, it expects to continue to finance its operations with additional debt or equity financing and/or work with its lenders to amend certain financial covenants. The Company’s ability to raise additional liquidity is subject to a number of uncertainties, including, but not limited to, the market demand for the Company’s common or preferred stock, the market demand for the Company’s products and services, negative economic developments, adverse market conditions, significant
F-8
Table of Contents
delays in the launch of new products and lack of market acceptance of new products. If the Company is not able to raise additional capital or access its debt facilities in sufficient amounts to fund its operations, it would have a material adverse effect on the Company’s business, operating results and financial condition.
(2) Summary of Significant Accounting Policies
Use of Estimates
The preparation of the accompanying consolidated financial statements in conformity with GAAP requires management to make estimates and assumptions that affect the amounts reported in the financial statements and accompanying notes. Such estimates include, but are not limited to, the determination of the fair value of deliverables included in multiple element revenue arrangements, valuation of inventories, warranty liability, the useful lives of property and equipment, fair value of the Company’s common stock, value of convertible preferred stock warrant liability, the value of stock options granted, accounting for income taxes, including the valuation reserve on deferred tax assets and accounting for uncertain tax positions, and contingencies. Actual results could differ materially from these estimates. Management evaluates these estimates and assumptions on an ongoing basis using historical experience and other factors and makes adjustments when facts and circumstances dictate. As future events and their effects cannot be determined with precision, actual results could materially differ from those estimates and assumptions.
Concentrations
The Company’s financial instruments that are exposed to concentrations of credit risk are primarily cash and cash equivalents, investments, and accounts receivable. Cash and cash equivalents, and investments are maintained primarily at one financial institution, and deposits will generally exceed the amount of insurance provided on such deposits. Risks associated with cash and cash equivalents, and investments are mitigated by banking with a creditworthy institution. The Company has not experienced any losses on its deposits of cash and cash equivalents or its investments.
The Company sells its products primarily through channel partners and distributors (collectively, Partners), and occasionally directly to customers.
The Company’s accounts receivable are unsecured and represent amounts due to the Company based on contractual obligations of the Company’s Partners and direct customers. The Company mitigates credit risk with respect to accounts receivable by performing ongoing credit evaluations of its Partners and direct customers to assess the probability of collection based on a number of factors, including, but not limited to, past transaction experience with its Partners and direct customers, evaluation of their credit history, limiting the credit extended, and review of the invoicing terms of the contract. The Company generally does not require its Partners and direct customers to provide collateral to support accounts receivable. The Company records an allowance for doubtful accounts for those receivables that are determined not to be collectible.
For each Partner or direct customer greater than 10%, revenue as a percentage of total revenue and accounts receivable as a percentage of total accounts receivable are as follows:
| Revenue for the Fiscal Year Ended January 31, |
Revenue for the Three Months Ended April 30, |
Accounts Receivable as of January 31, |
Accounts Receivable as of April 30, |
|||||||||||||||||||||||||||||
| 2015 | 2016 | 2017 | 2016 | 2017 | 2016 | 2017 | 2017 | |||||||||||||||||||||||||
| (unaudited) | (unaudited) | |||||||||||||||||||||||||||||||
| Partner A |
13 | % | * | * | * | * | * | * | * | |||||||||||||||||||||||
| Partner B |
10 | % | * | * | * | * | * | * | * | |||||||||||||||||||||||
| Partner C |
* | * | * | * | 20 | % | * | 16 | % | 27 | % | |||||||||||||||||||||
| Partner D |
* | * | * | * | 16 | % | * | * | * | |||||||||||||||||||||||
| * | Represents less than 10%. |
F-9
Table of Contents
The Company outsources substantially all of its manufacturing to one independent contract manufacturer. The inability of the manufacturer or supplier to fulfill the Company’s supply or quality requirements or performance failures of the Company’s products could result in lost sales and damage to the Company’s end-customer relationships, which would adversely impact the Company’s business, financial condition and operating results.
Foreign Currency Translation and Transactions
The financial position and operating results of the Company’s international subsidiaries in the United Kingdom (U.K.), Japan, Australia, Ireland and Singapore have been measured using their respective local currency as the functional currency. Assets and liabilities are translated into U.S. dollars at the exchange rate in effect on the respective consolidated balance sheet date. Revenue and expenses are translated into U.S. dollars using average exchange rates for the corresponding period. Translation adjustments are recorded within other comprehensive loss as a separate component of stockholders’ deficit. There is no income tax effect of currency translation adjustments related to foreign subsidiaries as the Company has no present intention of remitting the undistributed earnings of its foreign subsidiaries.
Gains and losses from the remeasurement of foreign currency-denominated balances into the functional currency are included in Other income (expense), net in the Company’s consolidated statements of operations. The Company recorded remeasurement gains of $0.1 million and losses of $0.1 million and $0 for the years ended January 31, 2015, 2016 and 2017, respectively. For the three months ended April 30, 2016 (unaudited) and 2017 (unaudited), the Company recorded remeasurement gains of $0.1 million and $0.1 million, respectively.
Fair Value of Financial Instruments
The carrying value of the Company’s financial instruments, including cash and cash equivalents, accounts receivable, investments, accounts payable and accrued and other current liabilities, approximates fair value due to the short period of time to maturity, receipt or payment. The carrying amount of the Company’s revolving line of credit and term loan approximates its fair value as the stated interest rates approximate market rates currently available to the Company.
Cash and Cash Equivalents
The Company considers all highly liquid investments, such as money market funds, with original maturities of 90 days or less at date of purchase, to be cash equivalents. Cash and cash equivalents consist principally of checking account deposits and money market funds.
Accounts Receivable
Accounts receivable are recorded at the invoiced amounts and do not bear interest. The Company maintains an allowance for doubtful accounts for estimated losses inherent in its accounts receivable portfolio and an allowance for returns. An allowance for doubtful accounts is determined based on the aging of the Company’s trade receivables, historical experience, and management judgment. The Company writes off trade receivables against the allowance when management determines a balance is uncollectible and no longer actively pursues collection of the receivable. An allowance for returns is determined based on historical returns and management judgment. As of January 31, 2016, there was no allowance for doubtful accounts. As of January 31, 2017 and April 30, 2017 (unaudited), allowance for doubtful accounts was $0.1 million and $0, respectively. Allowance for returns was $0.2 million and $0.3 million as of January 31, 2016 and 2017, respectively. Allowance for returns was $0.4 million as of April 30, 2017 (unaudited).
Inventories
Inventories consist primarily of raw materials related to component parts and finished goods. Finished goods include inventory held for sale, service inventory held at third-party service inventory depots in support of customer service agreements, and customer evaluation inventory.
F-10
Table of Contents
The following is a summary of the Company’s inventories by major category (in thousands):
| As of January 31, | As of April 30, 2017 |
|||||||||||
| 2016 | 2017 | |||||||||||
| (unaudited) | ||||||||||||
| Raw materials |
$ | 474 | $ | 264 | $ | 393 | ||||||
| Finished goods |
3,343 | 6,245 | 5,903 | |||||||||
|
|
|
|
|
|
|
|||||||
| $ | 3,817 | $ | 6,509 | $ | 6,296 | |||||||
|
|
|
|
|
|
|
|||||||
Inventory values are stated at the lower of cost (on a first-in, first-out method), or market value. A provision is recorded to adjust inventory to its estimated realizable value when inventory is determined to be in excess of anticipated demand or obsolete. Specifically, customer support inventory is written down to its net realizable value based upon the estimated loss of utility starting from the date the customer support inventory is placed in the third-party service inventory depots through the estimated period of service obligation fulfillment; and customer evaluation inventory is periodically reviewed and reserved for excess and obsolescence.
At the beginning of fiscal 2016, the Company substantially ceased its customer evaluation inventory program and initiated its sales demonstration equipment program. As a result, the amount of customer evaluation inventory subject to reserve for excess and obsolescence decreased subsequently. In addition, the evaluation units in the Company’s sales demonstration equipment program are depreciated over their useful life on a straight line basis. Depreciation of sales demonstration equipment is included in sales and marketing expense in the consolidated statements of operations.
The Company recorded inventory writedowns of $1.5 million, $1.8 million, and $1.2 million for the years ended January 31, 2015, 2016 and 2017, respectively, of which $0.8 million, $0.6 million and $0.2 million, respectively, were recorded in cost of product revenue and $0.7 million, $1.2 million and $1.0 million, respectively, were recorded in cost of support and maintenance revenue in the consolidated statements of operations. Inventory writedowns for the three months ended April 30, 2016 (unaudited) and 2017 (unaudited) were $0.2 million and $0.4 million, respectively, of which $0 and $0.1 million, respectively, were recorded in cost of product revenue and $0.2 million and $0.3 million, respectively, were recorded in cost of support and maintenance revenue in the consolidated statements of operations.
Investments
The Company’s primary objectives of its investment activities are to preserve principal, provide liquidity, and maximize income without significantly increasing risk. Some of the securities the Company invests in are subject to interest risk. To minimize this risk, the Company maintains its portfolio of cash, cash equivalents, short-term and long-term investments in a variety of securities, which may include commercial paper, money market funds, U.S. government and agency securities, and corporate debt securities.
The Company classifies its investments as available-for-sale at the time of purchase since it is intended that these investments are available for current operations, and include these investments on the accompanying consolidated balance sheets as either short-term or long-term investments depending on their maturity. Investments not considered cash equivalents and with maturities of one year or less from the consolidated balance sheet date are classified as short-term investments. Investments with maturities greater than one year from the consolidated balance sheet date are classified as long-term investments.
Investments are reported at fair value and are subject to periodic impairment review. Unrealized gains and losses related to changes in the fair value of these securities are recognized in accumulated other comprehensive loss net of tax, unless they are determined to be other-than-temporary impairments. The ultimate value realized on these securities is subject to market price volatility until they are sold.
Investments are considered impaired when a decline in fair value is judged to be other-than-temporary. The Company consults with investment managers and considers available quantitative and qualitative evidence in evaluating potential impairment of investments on a quarterly basis. If the cost of an individual investment
F-11
Table of Contents
exceeds its fair value, the Company evaluates, among other factors, general market conditions, the duration and extent to which the fair value is less than cost, and the Company’s intent and ability to hold the investment to maturity. Once a decline in fair value is determined to be other-than-temporary, an impairment charge is recorded and a new cost basis in the investment is established.
Property and Equipment, Net
Property and equipment, including leasehold improvements, are stated at cost, less accumulated depreciation and amortization. Depreciation is computed using the straight-line method over the estimated useful lives of the related assets. Depreciation on property and equipment, excluding leasehold improvements and sales demonstration equipment, ranges from 24 to 60 months. Sales demonstration equipment is depreciated over the estimated useful lives of the respective assets, which range up to 24 months.
Leasehold improvements are amortized over the shorter of the estimated useful lives of the respective assets or the remaining property lease terms, which range up to eight years.
Upon the retirement or disposition of property and equipment, the related costs and accumulated depreciation are removed and any related gain or loss is recorded in the consolidated statements of operations as an operating expense.
Impairment of Long-Lived Assets
The Company evaluates events and changes in circumstances that could indicate carrying amounts of long-lived assets, consisting of property and equipment, may not be recoverable. When such events or changes in circumstances occur, the Company assesses the recoverability of long-lived assets by determining whether or not the carrying value of such assets will be recovered through undiscounted expected future cash flows. If the total of the future undiscounted cash flows is less than the carrying amount of an asset, the Company records an impairment charge for the amount by which the carrying amount of the asset exceeds the fair value of the asset. When the Company determines that the useful lives of assets are shorter than was originally estimated, the Company accelerates the rate of depreciation over the assets’ new, shorter useful lives. Through April 30, 2017 (unaudited), the Company did not write down any of its long-lived assets as a result of impairment.
Warranties
The Company provides a one-year warranty for hardware components covering material defects in materials and workmanship. In addition, the Company provides a 90-day warranty on the software in its products for nonconformance with documented specifications.
With respect to the hardware warranty obligation, the Company’s contract manufacturer is generally required to repair or replace defective hardware resulting from defective workmanship within one year of shipment. Furthermore, the Company’s support contracts provide for the same parts replacement that end-users are entitled to under the warranty program, except that replacement parts are delivered according to targeted response times to minimize disruption to the end-users’ critical business applications. Substantially all end-users purchase support contracts.
Given that substantially all products are sold together with support contracts, the Company has limited exposure related to warranty costs and therefore no warranty reserve has been recorded.
Revenue Recognition
The Company generates revenue from sales of enterprise cloud platform solutions and related support and maintenance. The Company derives revenue primarily from two sources: (i) Product revenue, which includes
F-12
Table of Contents
hardware and perpetual software license revenue and (ii) Support and maintenance revenue, which includes support, installation services and training. Revenue is recognized when all of the following criteria are met: persuasive evidence of an arrangement exists; the product or service has been delivered; the sales price is fixed or determinable; and collection is reasonably assured.
We define each of the four criteria above as follows:
| • | Persuasive Evidence of an Arrangement Exists. The Company uses stand-alone purchase orders, signed sales quotations or purchase orders pursuant to the terms and conditions of a master sales agreement to support the evidence of an arrangement with Partners and direct customers. |
| • | Delivery has Occurred. The Company uses shipping documentation to verify delivery of products. Provided that all other revenue recognition criteria have been met, the Company typically recognizes product revenue upon shipment, as title and risk of loss are transferred at that time. Products are typically shipped directly by the Company to Partners and direct customers. Support and maintenance revenue is recognized over time as the services are delivered. The Company generally does not have significant obligations for future performance, such as rights of return or pricing credits, associated with the sales of its products. It is the Company’s practice to identify an end user prior to shipment to a Partner. |
| • | The Sales Price is Fixed or Determinable. The Company assesses whether the fee is fixed or determinable based on the payment terms associated with the transaction. If the terms are extended beyond the Company’s normal payment terms, the Company will recognize revenue as the payments become due. Payments from Partners are not contingent on the Partners’ receiving payment from the end-users. |
| • | Collection is Reasonably Assured. The Company assesses probability of collection on an individual basis. The Company’s Partners or customers are subjected to a credit review process that evaluates their financial condition and ability to pay. |
Support and maintenance revenue includes arrangements for software and technical support for the Company’s products. While purchasing support and maintenance is not mandatory, substantially all products shipped have been purchased together with a support contract. Support is offered under renewable, fee-based contracts and includes technical support, hardware repair and replacement parts, and software patches, bug fixes, updates, and upgrades. Support and maintenance revenue is initially deferred and recognized ratably over the life of the contract, with the related expenses, including the write down of customer support inventory to its net realizable value, recognized as incurred. Support and maintenance contracts range from one to five years. Unearned support revenue is included in deferred revenue.
Professional service revenue primarily consists of fees the Company earns related to installation. While installation services are not contractually mandatory, customers occasionally purchase such services. The Company generally recognizes revenue from installation services upon delivery or completion of performance. Installation services are typically short term in nature. To date, revenue arising from installation service has been insignificant.
The Company reports revenue net of sales taxes. Shipping charges billed to customers are included in product revenue and the related shipping and handling costs are included in cost of product revenue.
Multiple Element Arrangements
The Company’s offering consists of hardware products containing software components that function together to provide the essential functionality of the product. Therefore, the Company’s hardware products (inclusive of the core software) are considered non-software deliverables and are not subject to industry-specific software revenue recognition guidance.
F-13
Table of Contents
The Company’s product revenue also includes revenue from the sale of stand-alone software products. Stand-alone software may operate on the Company’s hardware product, but is not considered essential to the functionality of the hardware and is subject to the industry-specific software revenue recognition guidance.
The Company’s typical multiple element arrangement includes hardware product (including the essential software) and support. The Company may also sell stand-alone software as part of its multiple element arrangements. The Company considers each of these deliverables to be separate units of accounting based on whether the delivered items have stand-alone value. The Company has determined that each unit of accounting has stand-alone value because they are sold separately by the Company or, for hardware products, because the customers can resell them to others on a stand-alone basis.
For certain arrangements with multiple deliverables, the Company allocates the arrangement fee to the non-software element based upon the relative selling price of such element and, if software and software-related elements such as support for the software element are also included in the arrangement, the Company allocates the arrangement fee to those software and software-related elements as a group. After such allocations are made, the amount of the arrangement fee allocated to the software and software-related elements is accounted for using the residual method. When applying the relative selling price method, the Company determines the selling price for each element using vendor-specific objective evidence (VSOE) of selling price, if it exists, or if not, third-party evidence (TPE) of selling price, if it exists. If neither VSOE nor TPE of selling price exist for an element, the Company uses its best estimated selling price (BESP) for that element. The revenue allocated to each element is then recognized when the basic revenue recognition criteria are met for that element.
When an arrangement includes stand-alone software products and related support, consideration is allocated to the software deliverable as described above. The Company uses the residual method to recognize revenue related to this consideration when a product agreement includes one or more elements to be delivered at a future date and VSOE of the fair value of all undelivered elements exists. In the majority of the Company’s contracts, the only element that remains undelivered at the time of delivery of the product is support services. Under the residual method, the VSOE of fair value of the undelivered elements is deferred and the remaining portion of the contract fee is recognized upfront as product revenue. If evidence of the VSOE of fair value of the undelivered elements does not exist, all revenue is deferred and recognized at the earlier of (i) when delivery of those elements occurs or (ii) when fair value can be established unless support services is the only undelivered element, in which case, the entire arrangement fee is recognized ratably over the contractual period of the support services.
VSOE of fair value for elements of an arrangement is based upon the normal pricing and discounting practices for those deliverables when sold separately. In determining VSOE, the Company requires that a substantial majority of the selling prices for a deliverable fall within a reasonably narrow pricing range, evidenced by a substantial majority of such historical stand-alone transactions falling within a reasonably narrow range.
The Company is not able to determine TPE for its products or services. TPE is determined based on competitor prices for similar deliverables when sold separately. Generally, the Company’s go-to-market strategy differs from that of its peers and its offerings contain a significant level of differentiation such that the comparable pricing of products with similar functionality cannot be obtained. Furthermore, the Company is unable to reliably determine what similar competitor products’ selling prices are on a stand-alone basis.
When the Company is unable to establish the selling price of its deliverables using VSOE or TPE, the Company uses BESP in its allocation of arrangement consideration. The objective of BESP is to determine the price at which we would transact a sale if the product or service were sold on a stand-alone basis. The Company determines BESP for the purposes of allocating the arrangement by reviewing market factors including, but not limited to, pricing practices including discounting, the geographies in which the Company offers its products and services, and the type of customer (i.e., Partners or direct customers). Additionally, the Company considers historical transactions, including transactions whereby the deliverable was sold on a stand-alone basis.
F-14
Table of Contents
Deferred revenue consists of billings or payments received in advance of revenue recognition and primarily relates to support and maintenance. Deferred revenue that will be recognized during the twelve-month period following the balance sheet date is recorded as Deferred revenue, current and the remaining portion is recorded as Deferred revenue, non-current.
Research and Development
Research and development expense consists of personnel costs, including stock-based compensation expense, for the Company’s research and development personnel and product development costs, including engineering services, development software and hardware tools, depreciation of capital equipment, facility costs, and information technology spend. Research and development costs are expensed as incurred.
All costs incurred in the research and development of the Company’s software products are expensed as incurred until technological feasibility has been established. As of January 31, 2016 and 2017, there were no capitalized computer software development costs as the time between technological feasibility and general release is short.
Advertising Costs
Advertising costs are expensed as incurred and are included in sales and marketing expense. Advertising costs for the years ended January 31, 2015, 2016 and 2017 were $0.4 million, $1.1 million and $0.8 million, respectively. Advertising costs for the three months ended April 30, 2016 (unaudited) and 2017 (unaudited) were $0.2 million and $1.0 million, respectively.
Commission Costs
Commission costs are expensed as incurred and are included in sales and marketing expense.
Stock-Based Compensation
Stock Options
The Company measures and recognizes compensation expense for all stock-based awards made to employees based on estimated fair values on the date of grant, net of estimated forfeitures. Stock-based awards consist of stock options. The Company uses the Black-Scholes option pricing model to estimate the value of stock-based compensation expense for all stock options. The related stock-based compensation expense is recognized on a straight-line basis, over the period in which an employee is required to provide service in exchange for the stock-based award, which is generally four years.
Restricted Stock Units
Stock-based compensation expense is measured and recognized in the financial statements based on the fair value of the Company’s common stock on the date of grant. Stock-based compensation expense is recognized, net of estimated and actual forfeitures, over the requisite service period, and upon performance conditions being met.
Income Taxes
The Company recognizes income taxes under the asset-and-liability method. The Company recognizes deferred income tax assets and liabilities for the expected future consequences of temporary differences between the financial reporting and tax bases of assets and liabilities. These differences are measured using the enacted statutory tax rates that are expected to apply to taxable income for the years in which differences are expected to reverse. The Company recognizes the effect on deferred income taxes of a change in tax rates in income in the period that includes the enactment date.
F-15
Table of Contents
The Company records a valuation allowance to reduce its deferred tax assets to the net amount that the Company believes is more likely than not to be realized. The Company considers all available evidence, both positive and negative, including historical levels of income, expectations and risks associated with estimates of future taxable income, and ongoing tax planning strategies in assessing the need for a valuation allowance. Realization of deferred tax assets is dependent upon the generation of future taxable income, if any, the timing and amount of which are uncertain. Due to the history of losses the Company has generated in the past, the Company believes that it is not more likely than not that the deferred tax assets will be realized as of April 30, 2017 (unaudited). Accordingly, the Company has recorded a full valuation allowance on its net deferred tax assets.
The Company recognizes tax benefits from uncertain tax positions only if they believe that it is more likely than not that the tax position will be sustained on examination by the taxing authorities based on the technical merits of the position. The Company makes adjustments to these reserves when facts and circumstances change, such as the closing of a tax audit or the refinement of an estimate. The provision for income taxes includes the effects of any reserves that are considered appropriate, as well as the related net interest and penalties.
The Company expects to permanently reinvest undistributed earnings in foreign subsidiaries outside of the United States to fund future foreign operations. We project that we will have sufficient cash flow in the United States and will not need to repatriate the foreign earnings to finance our domestic operations. If we were to distribute these earnings to the United States, we would be subject to U.S. income taxes, less any allowable foreign tax credits, and foreign withholding taxes. We have not recorded a deferred tax liability on any portion of our undistributed earnings in foreign subsidiaries. If we were to repatriate these earnings to the United States, any associated income tax liability would be insignificant.
Recent Accounting Pronouncements
In August 2016, the Financial Accounting Standard Board (FASB) issued Accounting Standards Update (ASU) No. 2016-15, Classification of Certain Cash Receipts and Cash Payments. The standard provides new authoritative guidance addressing eight specific cash flow issues with the objective of reducing the existing diversity in practice in how certain transactions are presented and classified in the statement of cash flows. The standard is effective for the Company in the first quarter of fiscal year 2019. The Company is evaluating the impact the adoption of this standard will have on its consolidated financial statements.
In March 2016, FASB issued ASU No. 2016-09, Compensation—Stock Compensation: Improvements to Employee Share-Based Payment Accounting. The standard simplifies several aspects of the accounting for employee share-based payment transactions, including the income tax consequences, accounting for forfeitures, and classification of excess tax benefits on the statement of cash flows. This standard was effective for the Company in the first quarter of fiscal year 2018. The Company’s adoption of this standard did not have a significant impact on the Company’s consolidated financial statements.
In February 2016, FASB issued ASU No. 2016-02, Leases. The standard increases transparency and comparability among organizations by requiring companies to recognize leased assets and related liabilities on the balance sheet and disclose key information about leasing arrangements. This standard is effective for the Company in the first quarter of fiscal year 2020. The Company is evaluating the impact the adoption of this standard will have on its consolidated financial statements.
In November 2015, FASB issued ASU No. 2015-17, Balance Sheet Classification of Deferred Taxes. The standard requires deferred tax assets and liabilities to be classified as non-current in a classified statement of financial position. The Company has early adopted this standard and has applied the provisions prospectively beginning in the first quarter of fiscal 2017. The adoption did not materially change the classification of the Company’s deferred tax assets and liabilities in its consolidated financial statements.
In August 2015, FASB issued ASU 2015-15, Presentation and Subsequent Measurement of Debt Issuance Costs Associated with Line-of-Credit Arrangements, which clarifies the treatment of debt issuance costs from
F-16
Table of Contents
line-of-credit arrangements after adoption of ASU 2015-03. ASU 2015-15 clarifies that the SEC staff would not object to an entity deferring and presenting debt issuance costs as an asset and subsequently amortizing the deferred debt issuance costs ratably over the term of the line-of-credit arrangement, regardless of whether there are any outstanding borrowings on the line-of-credit arrangement. The Company has retrospectively applied the provisions of ASU 2015-15 to the capitalized deferred financing costs related to its revolving line of credit. Adoption of this standard did not significantly impact the Company’s consolidated financial statements in the current or previous interim and annual reporting periods.
In July 2015, FASB issued ASU No. 2015-11, Simplifying the Subsequent Measurement of Inventory. The standard requires inventory to be measured at the lower of cost and net realizable value but no longer requires entities to consider replacement cost or net realizable value less an approximately normal profit margin when measuring inventory within the scope of the amendments. This standard was effective for the Company beginning in its first quarter of fiscal 2018. The Company’s adoption of this standard did not have a significant impact on the Company’s consolidated financial statements.
In April 2015, FASB issued ASU 2015-03, Simplifying the Presentation of Debt Issuance Costs, which requires that deferred financing costs related to a recognized debt liability be presented in the balance sheet as a direct deduction from the carrying amount of that debt liability, consistent with debt discounts or premiums. The Company has adopted the provisions of ASU 2015-03 beginning in the first quarter of its fiscal 2017, and has applied the provisions retrospectively. ASU 2015-03 does not change the recognition and measurement requirements for debt issuance costs. Adoption of this standard did not significantly impact the Company’s consolidated financial statements in the current or previous interim and annual reporting periods.
In August 2014, FASB issued ASU 2014-15, Disclosure of Uncertainties about an Entity’s Ability to Continue as a Going Concern, which defines management’s responsibility to assess an entity’s ability to continue as a going concern, and to provide related footnote disclosures if there is substantial doubt about its ability to continue as a going concern. This standard was effective for the Company beginning in fiscal 2017 and for the annual periods and interim periods thereafter. The Company’s adoption of this standard did not have a material impact on the Company’s consolidated financial statements.
In May 2014, FASB issued ASU, 2014-09, Revenue from Contracts with Customers. The standard is a comprehensive new revenue recognition model that requires revenue to be recognized in a manner to depict the transfer of goods or services to a customer at an amount that reflects the consideration expected to be received in exchange for those goods or services. In August 2015, FASB issued ASU 2015-14, Revenue from Contracts with Customers, to defer the effective date of ASU 2014-09 by one year to annual reporting periods beginning after December 15, 2017, but permits entities to adopt the original effective date if they choose. This standard will be applied using either the full or modified retrospective adoption methods. The Company does not plan to early adopt, and accordingly, will adopt the new standard in its first quarter of fiscal 2019. The Company will adopt this new standard using the full retrospective adoption method, and believe impacted areas relate to the deferral of costs to obtain a contract, which are primarily commission expense directly incurred as a result of sales of products and related support, and the allocation of revenue from support and maintenance to products for certain arrangements. The deferral of costs to obtain a contract will result in the related expenses to be recognized at the time of shipment for product revenue and over the estimated period of benefit for support and maintenance revenue.
The Company has engaged third party service providers to assist in its evaluation and system implementation. Furthermore, the Company has made and will continue to make investments in systems to enable timely and accurate reporting under the new standard. While the Company continues to assess the potential impact of the new standard, including the areas described above, it has not yet quantified the impact the new standard may have on its consolidated financial statements.
F-17
Table of Contents
(3) Fair Value Measurements
We categorize assets and liabilities recorded at fair value on our consolidated balance sheets based on the accounting guidance framework for measuring fair value on either a recurring or nonrecurring basis, whereby inputs used in valuation techniques are assigned a hierarchical level.
Fair value is defined as the exchange price that would be received for an asset or paid to transfer a liability (an exit price) in the principal or most advantageous market for the asset or liability in an orderly transaction between market participants on the measurement date. Valuation techniques used to measure fair value must maximize the use of observable inputs and minimize the use of unobservable inputs. GAAP describes a fair value hierarchy based on three levels of inputs, of which the first two are considered observable and the last unobservable, to measure the fair value:
| • | Level 1—Inputs are unadjusted quoted prices in active markets for identical assets or liabilities. |
| • | Level 2—Inputs are quoted prices for similar assets and liabilities in active markets; or quoted prices for identical assets or liabilities in less active markets; or benchmark yields, reported trades, broker/dealer quotes or inputs other than quoted prices that are observable for the assets or liabilities, either directly or indirectly through market corroboration, for substantially the full term of the financial instruments. The valuation techniques leverage an independent professional pricing service that uses calculated prices whereby securities with short maturities and infrequent secondary market trades are typically priced via mathematical calculations, cross-market approach, and model valuation methods, which are corroborated by market data. |
| • | Level 3—Inputs are unobservable inputs based on our own assumptions used to measure assets and liabilities at fair value. The inputs require significant management judgment or estimation. |
Fair value estimates are made at a specific point in time based on relevant market information and information about the financial or nonfinancial asset or liability. These estimates are subjective in nature and involve uncertainties or significant judgment and, therefore, cannot be determined with precision. Changes in assumptions could significantly affect the estimates.
F-18
Table of Contents
The following table presents the fair value of the Company’s financial assets and liabilities using the above input categories as of January 31, 2017 and April 30, 2017 (unaudited) (in thousands):
| As of January 31, 2017 |
||||||||||||||||
| Level 1 | Level 2 | Level 3 | Total | |||||||||||||
| Cash equivalents: |
||||||||||||||||
| Money market funds |
$ | 31,468 | $ | — | $ | — | $ | 31,468 | ||||||||
|
|
|
|
|
|
|
|
|
|||||||||
| Total cash equivalents |
31,468 | — | — | 31,468 | ||||||||||||
|
|
|
|
|
|
|
|
|
|||||||||
| Total assets measured at fair value |
$ | 31,468 | — | — | $ | 31,468 | ||||||||||
|
|
|
|
|
|
|
|
|
|||||||||
| Convertible preferred warrants: |
||||||||||||||||
| Series E Convertible Preferred Stock warrants(1) |
$ | — | $ | — | $ | 568 | $ | 568 | ||||||||
|
|
|
|
|
|
|
|
|
|||||||||
| Total convertible preferred stock warrants |
— | — | 568 | 568 | ||||||||||||
|
|
|
|
|
|
|
|
|
|||||||||
| Total liabilities measured at fair value |
$ | — | $ | — | $ | 568 | $ | 568 | ||||||||
|
|
|
|
|
|
|
|
|
|||||||||
| As of April 30, 2017 | ||||||||||||||||
| Level 1 | Level 2 | Level 3 | Total | |||||||||||||
| (unaudited) | ||||||||||||||||
| Cash equivalents: |
||||||||||||||||
| Money market funds |
$ | 25,503 | — | — | $ | 25,503 | ||||||||||
|
|
|
|
|
|
|
|
|
|||||||||
| Total cash equivalents |
25,503 | — | — | 25,503 | ||||||||||||
|
|
|
|
|
|
|
|
|
|||||||||
| Total assets measured at fair value |
$ | 25,503 | — | — | $ | 25,503 | ||||||||||
|
|
|
|
|
|
|
|
|
|||||||||
| Convertible Preferred warrants: |
||||||||||||||||
| Series E Convertible Preferred Stock Warrants(1) |
— | — | $ | 464 | $ | 464 | ||||||||||
| Series F Convertible Preferred Stock Warrants(1) |
— | — | 225 | 225 | ||||||||||||
|
|
|
|
|
|
|
|
|
|||||||||
| Total convertible preferred stock warrants |
— | — | 689 | 689 | ||||||||||||
|
|
|
|
|
|
|
|
|
|||||||||
| Total liabilities measured at fair value |
— | — | $ | 689 | $ | 689 | ||||||||||
|
|
|
|
|
|
|
|
|
|||||||||
| (1) | Series E Convertible Preferred Stock and Series F Convertible Preferred Stock warrant liability is included in Other long-term liabilities in the accompanying consolidated balance sheets. |
A summary of the changes in the fair value of the Company’s convertible preferred stock warrant liability is as follows (in thousands):
| January 31, | April 30, | |||||||||||
| 2016 | 2017 | 2017 | ||||||||||
| (unaudited) | ||||||||||||
| Convertible preferred stock warrant liability—beginning balance |
$ | 231 | $ | 532 | $ | 568 | ||||||
| Change in fair value* |
49 | 36 | (156 | ) | ||||||||
| Issuance of convertible preferred stock warrants |
252 | — | 277 | |||||||||
|
|
|
|
|
|
|
|||||||
| Convertible preferred stock warrant liability—ending balance |
$ | 532 | $ | 568 | $ | 689 | ||||||
|
|
|
|
|
|
|
|||||||
| * | Recorded in the consolidated statements of operations within Other income (expense), net. |
The Company did not have any material financial assets or liabilities for which fair value is determined using Level 3 inputs other than convertible preferred stock warrants and common stock warrants, which are discussed further in note 9 Convertible Preferred Stock and note 10 Common Stock, respectively.
F-19
Table of Contents
(4) Property and Equipment, Net
Property and equipment, net consist of the following (in thousands):
| As of January 31, |
As of April 30, |
|||||||||||
| 2016 | 2017 | 2017 | ||||||||||
| (unaudited) | ||||||||||||
| Computer equipment |
$ | 15,424 | $ | 17,431 | $ | 18,349 | ||||||
| Leasehold improvements |
6,014 | 5,941 | 5,942 | |||||||||
| Sales demonstration equipment |
4,181 | 5,903 | 6,277 | |||||||||
| Beta equipment |
657 | 1,060 | 1,060 | |||||||||
| Furniture and fixtures |
1,365 | 1,550 | 1,626 | |||||||||
| Software |
596 | 649 | 654 | |||||||||
| Construction in progress |
— | 39 | 41 | |||||||||
|
|
|
|
|
|
|
|||||||
| Total property and equipment |
28,237 | 32,573 | 33,949 | |||||||||
| Less accumulated depreciation and amortization |
(13,607 | ) | (22,163 | ) | (23,937 | ) | ||||||
|
|
|
|
|
|
|
|||||||
| Total property and equipment, net |
$ | 14,630 | $ | 10,410 | $ | 10,012 | ||||||
|
|
|
|
|
|
|
|||||||
Depreciation and amortization expense related to property and equipment for the years ended January 31, 2015, 2016 and 2017 was $3.5 million, $7.8 million and $9.3 million, respectively. Depreciation and amortization expense related to property and equipment for the three months ended April 30, 2016 (unaudited) and 2017 (unaudited) was $2.3 million and $1.9 million, respectively.
At the beginning of the year ended January 31, 2016, the Company substantially ceased its customer evaluation inventory program and initiated its sales demonstration equipment program. As a result, evaluation units in the Company’s sales demonstration equipment program are subject to depreciation over their useful life on a straight line basis. For the year ended January 31, 2016 and 2017, depreciation expense for sales demonstration equipment was $2.3 million, and $2.8 million, respectively, and is included in sales and marketing expense in the consolidated statements of operations. For the three months ended April 30, 2016 (unaudited) and 2017 (unaudited), depreciation expense for sales demonstration equipment was $0.8 million and $0.3 million, respectively, and is included in sales and marketing expense in the consolidated financial statements.
(5) Investments
The Company did not have any investments as of January 31, 2017 and April 30, 2017 (unaudited). The carrying amount, total other than temporary impairment (OTTI) recognized in other comprehensive income (OCI), gross unrealized holding gains, gross unrealized holding losses, and fair value of debt securities by major security type classified as available for sale as of January 31, 2016 was as follows (in thousands):
| As of January 31, 2016 | ||||||||||||||||||||
| Carrying amount |
Total OTTI Recognized in OCI |
Unrealized gain |
Unrealized loss |
Aggregate fair value |
||||||||||||||||
| Corporate debt securities |
$ | 57,226 | $ | — | $ | 3 | $ | (27 | ) | $ | 57,202 | |||||||||
| U.S. government and agency securities |
6,036 | — | 1 | — | 6,037 | |||||||||||||||
|
|
|
|
|
|
|
|
|
|
|
|||||||||||
| Total securities |
$ | 63,262 | $ | — | $ | 4 | $ | (27 | ) | $ | 63,239 | |||||||||
|
|
|
|
|
|
|
|
|
|
|
|||||||||||
F-20
Table of Contents
The following table presents the Company’s investments that were in an unrealized loss position as of January 31, 2016 (in thousands):
| As of January 31, 2016 | ||||||||||||||||||||||||
| Less than 12 months | 12 months or greater | Total | ||||||||||||||||||||||
| Fair value |
Unrealized loss |
Fair value | Unrealized loss |
Fair value | Unrealized loss |
|||||||||||||||||||
| Corporate debt securities |
$ | 27,484 | $ | (27 | ) | $ | — | $ | — | $ | 27,484 | $ | (27 | ) | ||||||||||
|
|
|
|
|
|
|
|
|
|
|
|
|
|||||||||||||
Unrealized losses related to these investments are due to market conditions as opposed to credit quality. In addition, the Company does not intend to sell these investments before recovery of their amortized-cost basis, which may be at maturity. As a result, there is no other-than-temporary impairment for these investments at January 31, 2016.
Factors considered in determining whether a loss is temporary include:
| • | The length of time and the extent to which fair value has been below cost; |
| • | The severity of the impairment; |
| • | The cause of the impairment and the financial condition and near-term prospects of the issuer; |
| • | Activity in the market of the issuer, which may indicate adverse credit conditions; and |
| • | The Company’s ability and intent to hold the investment for a period of time sufficient to allow for any anticipated recovery. |
Proceeds from the sale of investment securities was $12.7 million, $18.6 million and $0 for the years ended January 31, 2015, 2016 and 2017, respectively, which approximated the net carrying value. There were no sales of investment securities for the three months ended April 30, 2016 (unaudited) and 2017 (unaudited). Net realized gains from the sale of investment securities was immaterial for the years ended January 31, 2015, 2016 and 2017.
The following table summarizes the fair value of the Company’s available for sale investments as of January 31, 2016 (in thousands):
| As of January 31, 2016 |
||||||||
| Carrying Amount |
Fair Value | |||||||
| Due within one year |
$ | 63,262 | $ | 63,239 | ||||
|
|
|
|
|
|||||
| Total |
$ | 63,262 | $ | 63,239 | ||||
|
|
|
|
|
|||||
(6) Debt Obligations
Debt obligations, net of debt discount and deferred financing costs, consist of the following (in thousands):
| As of January 31, | As of April 30, |
|||||||||||
| 2016 | 2017 | 2017 | ||||||||||
| (unaudited) | ||||||||||||
| Revolving line of credit |
$ | 7,000 | $ | 13,962 | $ | 18,962 | ||||||
| Term loan(1) |
34,906 | 34,952 | 49,442 | |||||||||
|
|
|
|
|
|
|
|||||||
| Total debt |
41,906 | 48,914 | 68,404 | |||||||||
| Less current portion of debt |
(7,000 | ) | — | — | ||||||||
|
|
|
|
|
|
|
|||||||
| Total long-term portion of debt |
$ | 34,906 | $ | 48,914 | $ | 68,404 | ||||||
|
|
|
|
|
|
|
|||||||
F-21
Table of Contents
| (1) | The Company retrospectively adopted ASU 2015-03 requiring deferred financing costs to be presented as a direct deduction from the carrying amount of the related indebtedness. The Company records deferred financing costs for its revolving line of credit in prepaid and other current assets on its consolidated balance sheets, which is in accordance with ASU 2015-15. |
In May 2013, the Company entered into a Loan and Security Agreement with SVB and was provided up to $6.8 million on a revolving line of credit based on a percentage of qualifying accounts receivable. The interest rate on outstanding borrowings varies and resets periodically depending on the current prime rates plus 0.35% when the Company is borrowing base eligible, and the current prime rates plus 1.75% when the Company is not borrowing base eligible. Interest is paid monthly. The interest rate at January 31, 2015 was 3.6%.
In connection with the Loan and Security Agreement, the Company issued immediately exercisable and fully vested warrants to purchase 4,167 shares of common stock. The fair value of the warrant was $27,000 and was recorded in other income (expense), net in the consolidated statements of operations as discussed further in note 10 Common Stock.
In April 2014, the Company amended its existing Loan and Security Agreement to increase the maximum advance threshold from $6.8 million to $15.0 million, $5.0 million of which is available on a non-formula basis upon the occurrence of certain events. The maturity date of the revolving line of credit was extended to May 14, 2016. The interest rate on non-formula borrowings is the current prime rate plus 1.25%. All other terms of the agreement remained substantially the same.
In May 2016, the Company amended its existing Loan and Security Agreement to increase the maximum advance threshold from $15.0 million to $20.0 million, $5.0 million of which is available on a non-formula basis. The maturity date of the revolving line of credit was extended to May 2018. The interest rate on non-formula borrowings is the current prime rate plus 1.25%. The loan amount is subject to a certain financial restrictive covenant. All other terms of the agreement remained substantially the same.
As of January 31, 2015, $6.0 million was outstanding for this revolving line of credit. In April 2015, the Company repaid the $6.0 million revolving line of credit balance outstanding as of January 31, 2015 and accrued interest of $0.1 million. In May 2015, the Company also drew down $7.0 million under its revolving line of credit with an interest rate of prime plus 0.35%. As of January 31, 2016, the Company had a $7.0 million outstanding balance under this revolving line of credit. The interest rate at January 31, 2016 was 3.85%.
In May 2016, the Company drew down an additional $7.0 million under its revolving line of credit. As of January 31, 2017, the Company had a $14.0 million outstanding balance under this revolving line of credit. The weighted average interest rate at January 31, 2017 was 4.42%.
In February and March 2017, the Company amended its Loan and Security Agreement with SVB that increased the non-formula loan availability from $5.0 million to $10.0 million until July 2017. In addition, the Company drew down an additional $5.0 million under the Loan and Security Agreement. As of April 30, 2017 (unaudited), the Company had $19.0 million outstanding under this revolving line of credit. The weighted-average interest rate at April 30, 2017 (unaudited) was 4.59%.
In conjunction with the Loan and Security Agreement in May 2013, the Company also entered into a $5.0 million term loan. In July 2013, the Company drew down the entire amount available under the term loan. The interest rate on the term loan was fixed at 4.5%. Outstanding borrowings are subject to a final payment fee of 4.0% of the original loan amount, which was accrued over the expected term of the loan using the effective-interest method.
Upon drawing down on the term loan, the Company issued SVB a warrant to purchase an additional 20,833 shares of common stock. The fair value of the additional common stock warrants on the date of issuance was $0.1 million, which was recorded as a debt discount in the consolidated balance sheets. The debt discount was amortized to interest expense over the loan term using the effective interest rate which is discussed further in note 10 Common Stock.
F-22
Table of Contents
The entire term loan balance of $5.0 million was repaid during the year ended January 31, 2015. In connection with the repayment, the Company recognized a loss on extinguishment of debt of $0.4 million, the difference between the reacquisition price and the net carrying amount. The $0.4 million loss on extinguishment was recorded to other income (expense), net.
The Company’s obligations under the Loan and Security Agreement are secured by a security interest on substantially all of the Company’s assets, which security interest is senior to the security interest securing the Company’s obligations under the Facility Agreement, described below. The Company is required to comply with a certain financial restrictive covenant relating to the revolving line of credit.
In December 2014, the Company entered into a Plain English Growth Capital Loan and Security Agreement (Facility Agreement) with TriplePoint for a loan facility. Under the terms of the Facility Agreement, the Company may borrow up to $35.0 million within an 18-month period, with a payment term ranging from 12 months to 60 months, and at different interest rates, depending on the option selected under the facility.
In conjunction with the Facility Agreement, the Company issued a warrant which was initially exercisable upon issuance for 20,125 shares of Series E Convertible Preferred Stock at an exercise price of $43.50 per share. The warrant provided that, upon the Company making any borrowings under the Facility Agreement, the warrant would become exercisable for an additional number of shares of Series E Convertible Preferred Stock at the same exercise price of $43.50 per share, with such additional number of shares subject to the warrant being equal to 2.5% of the amount borrowed by the Company under the Facility Agreement divided by the exercise price of $43.50 per share, subject to certain adjustments. The warrant expires in December 2021.
The Company determined the fair value of the non-contingent convertible preferred stock warrants on the date of issuance to be $0.2 million, which was recorded as part of credit facility fees, and a warrant liability which is included in Other long-term liabilities in the accompanying consolidated balance sheets.
The Company’s obligations under the Facility Agreement are secured by a security interest on substantially all of the Company’s assets, which security is junior to the security interest securing the Company’s obligations under the Loan and Security Agreement, described above.
In February 2015, the Company terminated its existing Facility Agreement and replaced it with a new agreement (New Facility Agreement) with substantially the same terms but with a different affiliate of TriplePoint. The non-contingent warrants to purchase 20,125 shares of Series E Convertible Preferred Stock issued under the Facility Agreement were canceled and reissued at the same price of $43.50 per share under the New Facility Agreement.
In February 2015, the Company drew down an amount of $20.0 million under the New Facility Agreement with a twelve month term and an interest rate of prime rate plus 3.75%. Interest was payable for the first twelve months with the principal due at the end of the loan term, as well as a $0.7 million balloon payment. In connection with this draw down, 11,500 contingent Series E Convertible Preferred Stock warrant shares that were previously issued became exercisable. The Company determined the fair value of the convertible preferred stock warrant shares as $0.1 million, which was recorded as a debt discount and a convertible preferred stock warrant liability.
In June 2015, the Company drew down $15.0 million under the New Facility Agreement with an 18-month term and a nominal annual interest rate of 7.75%. Interest is payable for the first 18 months with the principal due at the end of the loan term, as well as a $0.9 million balloon payment. In connection with this draw down, an additional 8,625 contingent Series E Convertible Preferred Stock warrant shares that were previously issued became exercisable. The Company determined the fair value of the convertible preferred stock warrant shares as $0.1 million, which was recorded as a debt discount and a convertible preferred stock warrant liability.
In March 2016, the Company entered into an amendment to the New Facility Agreement extending the term of the loan facility to August 2017. The total debt amount of $35.0 million bears interest from and after March 2016 at a rate equal to 10% per annum, and include an additional end of term payment of $0.4 million.
F-23
Table of Contents
In February and March 2017, the Company entered into amendments to its New Facility Agreement with TriplePoint that increased the facility amount from $35.0 million to $60.0 million in total. Under these amendments, the maturity of the $35.0 million of previously outstanding indebtedness was extended from August 2017 to August 2018. Accordingly, the total amount outstanding of $35.0 million under the New Facility Agreement as of January 31, 2017 was presented in long-term debt in the consolidated balance sheets.
In connection with the February and March 2017 amendments to the New Facility Agreement, the Company issued a warrant which was initially exercisable upon issuance for 17,030 shares of Series F Convertible Preferred Stock at an exercise price of $44.04 per share. The warrant provided that, upon additional loan being made available and drawn, the warrant would become exercisable for an additional 11,353 shares of Series F Convertible Preferred Stock at the same exercise price of $44.04 per share. The warrant expires in February 2024 or 5 years from the effective date of the Company’s IPO, whichever is later.
In February 2017, the Company drew down $15.0 million with a 24-month term and a nominal annual interest rate of 9%. Interest is payable for the first twenty four months with the principal due at the end of the term loan. As of April 30, 2017 (unaudited), an aggregate principal amount of $50.0 million was outstanding under this facility. The remaining $10.0 million under this facility will become available to the Company in July 2017.
In connection with the New Facility Agreement loan facility, the Company recorded $0.7 million of credit facility fees and $39,000 of debt issuance cost as of January 31, 2015. In connection with the two draw-downs, the Company recorded $0.3 million of debt discounts in February and June 2015. In connection with the February 2017 draw down, the Company recorded $0.2 million of credit facility fees. The credit facility fees are amortized to interest expense over the facility term using the effective-interest method. The debt issuance cost and debt discounts are amortized to interest expense over the terms of the loan using the effective interest method. The respective balloon payments are accreted to accrued interest using the effective-interest method from the funding date to the maturity date of the notes.
Amortization of credit facility fees and debt issuance cost to interest expense under the Loan and Security Agreement and the New Facility Agreement was $0.5 million and $0.2 million for the years ended January 31, 2016 and 2017, respectively, and $0.1 million and $0.5 million for the three months ended April 30, 2016 (unaudited) and 2017 (unaudited), respectively. The credit facility balance was $0.2 million and $0 as of January 31, 2016 and 2017, respectively, and $0 as of April 30, 2017 (unaudited). The debt issuance costs and discounts balance was $0.1 million and $0 as of January 31, 2016 and 2017, respectively, and $0.6 million as of April 30, 2017 (unaudited). The accreted balloon payment balance as of January 31, 2016 and 2017 was $0.9 million and $1.4 million, respectively, and as of April 30, 2017 (unaudited) was $1.4 million.
The scheduled principal payments on the outstanding borrowings as of January 31, 2017 and April 30, 2017 (unaudited) are as follows (in thousands):
| Fiscal Year Ended January 31, 2017: |
||||
| Fiscal 2019 |
48,962 | |||
|
|
|
|||
| Total |
48,962 | |||
| Less debt discount |
(48 | ) | ||
| Less current portion |
— | |||
|
|
|
|||
| Non-current portion |
$ | 48,914 | ||
|
|
|
F-24
Table of Contents
| Three Months Ended April 30, 2017 (unaudited): |
||||
| Fiscal 2019 |
$ | 53,962 | ||
| Fiscal 2020 |
15,000 | |||
|
|
|
|||
| Total |
68,962 | |||
| Less debt discount |
(558 | ) | ||
| Less current portion |
— | |||
|
|
|
|||
| Non-current portion |
$ | 68,404 | ||
|
|
|
(7) Accrued and Other Current Liabilities
Accrued and other current liabilities consist of the following (in thousands):
| As of January 31, |
As of April 30, 2017 |
|||||||||||
| 2016 | 2017 | |||||||||||
| (unaudited) | ||||||||||||
| Accrued sales and use taxes payable |
$ | 1,690 | $ | 1,697 | $ | 1,671 | ||||||
| Accrued sales commissions |
3,961 | 4,706 | 1,780 | |||||||||
| Accrued bonus |
872 | 2,427 | 2,431 | |||||||||
| Accrued vacation |
2,823 | 3,561 | 3,893 | |||||||||
| Other accruals |
6,873 | 8,277 | 8,710 | |||||||||
|
|
|
|
|
|
|
|||||||
| Total accrued and other current liabilities |
$ | 16,219 | $ | 20,668 | $ | 18,485 | ||||||
|
|
|
|
|
|
|
|||||||
(8) Commitments and Contingencies
Leases
The Company has entered into various noncancelable operating lease agreements and capital lease agreements for its offices and equipment with lease periods expiring between fiscal 2018 and 2023. Certain of these arrangements have escalating rent payment provisions and optional renewal clauses. The Company is also committed to pay a portion of the actual operating expenses under certain of these operating lease agreements. As of January 31, 2017 and April 30, 2017 (unaudited), future minimum lease payments under noncancelable operating leases were as follows as of January 31, 2017 (in thousands):
| 2018 |
$ | 7,121 | ||
| 2019 |
7,019 | |||
| 2020 |
7,127 | |||
| 2021 |
7,021 | |||
| 2022 |
7,068 | |||
| Thereafter |
3,984 | |||
|
|
|
|||
| Committed gross lease payments |
39,340 | |||
| Less proceeds from sublease rental |
(4,244 | ) | ||
|
|
|
|||
| Net operating lease obligation |
$ | 35,096 | ||
|
|
|
F-25
Table of Contents
| As of April 30, 2017 (unaudited): |
||||
| Remaining Fiscal 2018 |
$ | 5,455 | ||
| 2019 |
7,033 | |||
| 2020 |
7,133 | |||
| 2021 |
7,021 | |||
| 2022 |
7,068 | |||
| Thereafter |
3,985 | |||
|
|
|
|||
| Committed gross lease payment |
37,695 | |||
| Less proceeds from sublease rental |
(3,977 | ) | ||
|
|
|
|||
| Net operating lease obligation |
$ | 33,718 | ||
|
|
|
The Company recognizes rent expense under its operating leases on a straight-line basis. Rent expense totaled $2.7 million, $4.3 million, and $5.3 million for the years ended January 31, 2015, 2016 and 2017, respectively and was $1.2 million and $1.5 million for the three months ended April 30, 2016 (unaudited) and 2017 (unaudited), respectively.
As of January 31, 2017, future minimum lease payments under noncancelable capital leases were as follows as of January 31, 2017 (in thousands):
| 2018 |
$ | 216 | ||
| 2019 |
96 | |||
| 2020 |
77 | |||
|
|
|
|||
| Total |
389 | |||
| Interest |
(20 | ) | ||
|
|
|
|||
| Total |
$ | 369 | ||
|
|
|
| As of April 30, 2017 (unaudited): |
||||
| Remaining fiscal 2018 |
$ | 138 | ||
| 2019 |
96 | |||
| 2020 |
77 | |||
|
|
|
|||
| Total |
311 | |||
| Interest |
(15 | ) | ||
|
|
|
|||
| Total |
$ | 296 | ||
|
|
|
Contingencies
The Company may, from time to time, become a party to various legal proceedings arising in the ordinary course of business. The Company investigates these claims as they arise. The Company does not believe, based on current knowledge, that any of the current claims will have a material adverse effect on its consolidated financial position, results of operations, or cash flows.
Indemnification
Some of the Company’s contracts require the Company to indemnify its customers, distributors, or other business partners against certain risks, including in some cases against any third-party claims asserting infringement of certain intellectual property rights. The Company’s exposure under these indemnification provisions is generally limited to the total amount paid by the customer or business partner under the agreement. However, certain agreements include indemnification provisions that could potentially expose the Company to losses in excess of the amount received under the agreement. In addition, the Company has agreed to indemnify
F-26
Table of Contents
its directors, officers, and certain key employees against any liabilities that they may incur while serving in good faith in their respective capacities. To date, there have been no claims under any indemnification provisions.
Purchase Commitments
During the normal course of business, in order to manage manufacturing lead times and help ensure adequate component supply, the Company provides rolling forecasts to its contract manufacturer of the monthly purchase requirements, a certain amount of which are purchase commitments that the contract manufacturer relies upon to procure components used to build finished products. The Company records a charge to cost of product revenue for firm, non-cancelable and unconditional purchase commitments with its contract manufacturer for non-standard components when and if quantities exceed the Company’s future demand forecasts. As of January 31, 2016 and 2017, the Company had approximately $7.2 million and $13.5 million, respectively, of purchase commitments with its contract manufacturer. As of April 30, 2017 (unaudited) the Company had approximately $17.6 million of purchase commitments with its contract manufacturer.
(9) Convertible Preferred Stock
The Company’s convertible preferred stock is issuable in series. The number of authorized, issued, and outstanding shares of convertible preferred stock, the issuance date, net proceeds and the aggregate liquidation preferences for the convertible preferred stock as of January 31, 2016 and 2017 and April 30, 2017 (unaudited) were as follows (in thousands, except share data):
| Date issued | Number of shares authorized |
Shares issued and outstanding |
Liquidation preference |
|||||||||||||
| A |
August 2008 | 1,533,329 | 1,533,329 | $ | 4,600 | |||||||||||
| B |
July 2009 | 2,119,997 | 2,119,997 | 12,000 | ||||||||||||
| C |
May 2011 | 1,312,311 | 1,312,311 | 18,100 | ||||||||||||
| D |
July 2012 | 1,092,149 | 1,092,149 | 25,000 | ||||||||||||
| E |
January 2014 | 1,681,912 | 1,641,662 | 71,377 | ||||||||||||
| E-1 |
January 2014 | 83,333 | 83,333 | 3,623 | ||||||||||||
| F |
July 2015 | 2,828,185 | 2,828,185 | 124,554 | ||||||||||||
|
|
|
|
|
|
|
|||||||||||
| Total outstanding as of January 31, 2016 and 2017 |
10,651,216 | 10,610,966 | 259,254 | |||||||||||||
|
|
|
|
|
|
|
|||||||||||
| F |
February 2017 | 28,383 | — | — | ||||||||||||
|
|
|
|
|
|
|
|||||||||||
| Total outstanding as of April 30, 2017 (unaudited) |
10,679,599 | 10,610,966 | $ | 259,254 | ||||||||||||
|
|
|
|
|
|
|
|||||||||||
The significant terms applicable to the convertible preferred stock were as follows:
Dividends
The holders of shares of Series F Convertible Preferred Stock, in preference and priority to the holders of other series of convertible preferred stock, are entitled to receive, when and if declared by the Board of Directors (the Board), but only out of funds that are legally available; noncumulative cash dividends at the rate of $3.522 per share, per annum, on each outstanding share of convertible preferred stock. Subsequently, the holders of shares of Series A, B, C, D, E and E-1 Convertible Preferred Stock, in preference and priority to the holders of common stock, are entitled to receive, when and if declared by the Board of Directors (the Board), but only out of funds that are legally available; noncumulative cash dividends at the rate of $0.24, $0.450, $1.104, $1.830, $3.480 and $3.480 per share, per annum, on each outstanding share of convertible preferred stock, respectively. After payment of such dividends, any additional dividends will be distributed among all holders of common stock and convertible preferred stock in proportion to the number of shares of common stock that would be held by each such holder if all shares of convertible preferred stock were converted to common stock at the then-effective conversion rate. As of April 30, 2017 (unaudited), no dividends had been declared.
F-27
Table of Contents
Voting Rights
The holder of each share of convertible preferred stock is entitled to one vote for each share of common stock into which such shares of convertible preferred stock could be converted, except the holders of Series E-1 Convertible Preferred Stock do not have the right to vote on the election of members of the Board.
So long as at least 166,666 shares of such series remain outstanding, the holders of Series A, B, E, and F Convertible Preferred Stock, each voting as separate classes, are entitled to elect two, one, one, and one members of the Board, respectively. The holders of common stock, voting as a separate class, are entitled to elect two members of the Board. The holders of a majority of the outstanding shares of common stock and 66.67% of the outstanding convertible preferred stock (other than Series E-1), voting as separate classes, are entitled to elect one member of the Board. Additional members of the Board shall be elected by the holders of common stock and convertible preferred stock (other than Series E-1), voting together as a single class, on an as-if-converted to common stock basis.
Liquidation
In the event of any liquidation, dissolution, or winding up of the Company, either voluntary or involuntary, the holders of Series F Convertible Preferred Stock are entitled to receive, prior to and in preference to any distribution to holders of other series of convertible preferred stock, a liquidation preference of $44.04 per share. Subsequently, the holders of Series A, B, C, D, E and E-1 Convertible Preferred Stock are entitled to receive, prior to and in preference to any distribution to holders of common stock, a liquidation preference of an amount equal to $3.00, $5.660376, $13.774104, $22.8906, $43.47828 and $43.47828, respectively. If proceeds are insufficient to pay such preferences, the proceeds will be distributed to the holders of convertible preferred stock in proportion to the preferential amount such holders would otherwise be entitled to receive. Thereafter, all remaining amounts will be distributed to the holders of common stock.
Conversion
At any time, at the option of the holder, each share of convertible preferred stock is initially convertible into one share of common stock, subject to automatic conversion requirements and certain antidilution adjustments discussed further below.
The convertible preferred stock will be automatically converted into shares of common stock at the then-effective conversion price immediately upon the earlier of (i) the date specified by vote or written consent of the holders of at least 66.667% of the then-outstanding shares of convertible preferred stock (any such conversion with respect to the Series E and Series E-1 Convertible Preferred Stock requires the vote or written consent of the holders of at least 66.667% of the then-outstanding shares of Series E and Series E-1 Convertible Preferred Stock, voting together as a single class, and any such conversion with respect to the Series F Convertible Preferred Stock requires the vote or written consent of the holders of at least 53% of the then outstanding Series F Convertible Preferred Stock) or (ii) the Company’s sale of its common stock in a firm underwritten public offering pursuant to a registration statement under the Securities Act of 1933, as amended, for which the proceeds are at least $50.0 million in the aggregate (Qualified IPO).
In April 2017, the Company amended its Certificate of Incorporation to modify the automatic conversion terms that would apply to shares of Series E and E-1 Convertible Preferred Stock in the event that the Company completes a Qualified IPO in which the per share public offering price is less than the Series E and E-1 Convertible Preferred Stock purchase price of $43.47828 per share. In lieu of holders of the Series E and E-1 Convertible Preferred Stock having an election to receive cash in such circumstances, under the amended Certificate of Incorporation, the holders of Series E and E-1 Convertible Preferred Stock will have similar rights as the holders of Series F Convertible Preferred Stock if the per share public offering price in a Qualified IPO is less than 1.1x the Series E and E-1 Convertible Preferred purchase price, or $47.826108. As a result of this modification to Series E and E-1 Convertible Preferred Stock, the Company recorded a deemed dividend to Series E and E-1 Convertible Preferred Stock of $6.6 million resulting in a charge to accumulated deficit.
F-28
Table of Contents
With respect to the Series F Convertible Preferred Stock only, a firm underwritten public offering shall only constitute a Qualified IPO if the offering results in the aggregate proceeds to the Company of at least $75.0 million before underwriting discounts, commissions and expenses, and the per share public offering price is at least $48.444 (as adjusted for stock split/changes) or if the per share public offering is less than $48.444 (as adjusted for stock split/changes), the Company delivers a written notice to each holder of Series F Convertible Preferred Stock stating that it has elected to cause the conversion price of the Series F Convertible Preferred Stock to be adjusted, and the effective time of such adjustment (Series F IPO Adjustment Effective Time), which shall be no later than the effective time of the automatic conversion of the Series F Convertible Preferred Stock. At the Series F IPO Adjustment Effective Time, the conversion price of the Series F Convertible Preferred Stock shall automatically be adjusted to a price determined by multiplying such conversion price by a fraction, which is the per share public offering price of Common Stock divided by $48.444 (as adjusted for stock splits/changes).
In June 2017, the Company amended its Certificate of Incorporation to eliminate certain variable rate adjustments to the conversion to common stock ratios of Series E, E-1, and F Convertible Stock. See note 16 Subsequent Events.
Redemption Rights
The Company’s convertible preferred stock is not redeemable.
Convertible Preferred Stock Warrants
In connection with the Facility Agreement with TriplePoint, the Company issued a warrant which was initially exercisable upon issuance for 20,125 shares of Series E Convertible Preferred Stock at an exercise price of $43.50 per share. In connection with the Company entering into the New Facility Agreement in February 2015, this warrant was canceled and a new warrant was issued to an affiliate of the original warrant holder with substantially the same terms. The warrant provided that, upon the Company making any borrowings under the Facility Agreement, the warrant would become exercisable for an additional number of shares of Series E Convertible Preferred Stock at the same exercise price of $43.50 per share, with such additional number of shares subject to the warrant being equal to 2.5% of the amount borrowed by the Company under the Facility Agreement divided by the exercise price of $43.50 per share, subject to certain adjustments. The warrant expires in December 2021.
The Company determined the fair value of the noncontingent convertible preferred stock warrants on the date of issuance to be $0.2 million, which was recorded as a warrant liability included in other long-term liabilities on the consolidated balance sheets. The fair value of the convertible preferred stock warrants was determined using the Noreen-Wolfson option pricing model with the following assumptions: fair value of Series E Convertible Preferred Stock of $45.72, expected volatility of 17.88%, contractual term of 6.86 years, and risk-free interest rate of 1.48%. There was no significant change in value from the measurement date through April 30, 2017 (unaudited).
In February and June 2015, the Company drew down on the Credit Facility such that an additional 11,500 and 8,625 of warrants for Series E Convertible Preferred Stock became exercisable, respectively. The Company determined the fair value of these contingent convertible preferred stock warrants on the date of issuance to be $0.1 million and $0.1 million, respectively. These warrants were recorded as a warrant liability included in other long-term liabilities on the consolidated balance sheets. The fair value of the convertible preferred stock warrants as of January 31, 2016 and 2017 and April 30, 2017 (unaudited) was determined using the Noreen-Wolfson option pricing model with the following assumptions: fair value of Series E Convertible Preferred Stock of $47.46, $48.90, and $46.20, respectively, expected volatility of 21.62%, 23.08%, and 22.46%, respectively, contractual term of 5.86 years, 4.86 years, and 4.61 years, respectively, and risk-free interest rate of 1.47%, 1.87%, and 1.74%, respectively. There was no significant change in value from the measurement date through April 30, 2017 (unaudited).
F-29
Table of Contents
In connection with the February amendments to the New Facility Agreement, the Company issued a warrant, which was initially exercisable upon issuance for 17,030 shares of Series F Convertible Preferred Stock at an exercise price of $44.04 per share. The warrant provided that, upon additional loan being made available and drawn, the warrant would become exercisable for an additional 11,353 shares of Series F Convertible Preferred Stock at the same exercise price of $44.04 per share. The warrant expires in February 2024 or 5 years from the effective date of the Company’s IPO, whichever is later.
The Company determined the fair value of the convertible preferred warrants on the date of issuance to be $0.3 million, which was recorded as a warrant liability included in other long-term liabilities on the consolidated balance sheets. The fair value of the convertible preferred stock warrants was determined using the Noreen-Wolfson option pricing model with the following assumptions: fair value of Series F Convertible Preferred Stock of $50.82, expected volatility of 17.37%, contractual term of 7.07 years, and risk free rate of 2.24%. The fair value of the convertible preferred stock warrants as of April 30, 2017 (unaudited) was determined using the Noreen-Wolfson option pricing model with the following assumptions: fair value of Series F Convertible Preferred Stock of $48.42, expected volatility of 15.62%, contractual term of 6.82 years, and risk free rate of 2.07%. There were no significant changes in value from the measurement date through April 30, 2017 (unaudited).
(10) Common Stock
Shares Reserved for Future Issuance
As of January 31, 2016 and 2017 the Company had reserved the following shares of authorized but unissued common stock:
| As of January 31, | As of April 30, 2017 |
|||||||||||
| 2016 | 2017 | |||||||||||
| (unaudited) | ||||||||||||
| (in shares) | ||||||||||||
| Convertible preferred stock |
10,610,966 | 10,610,966 | 10,610,966 | |||||||||
| Options and RSUs outstanding and shares available for grant |
4,577,452 | 5,814,388 | 5,784,293 | |||||||||
| Convertible preferred stock warrants |
40,250 | 40,250 | 57,280 | |||||||||
| Common stock warrants |
25,000 | 25,000 | 25,000 | |||||||||
|
|
|
|
|
|
|
|||||||
| Total |
15,253,668 | 16,490,604 | 16,477,539 | |||||||||
|
|
|
|
|
|
|
|||||||
Stock Plan
2008 Stock Plan. In 2008, the Company adopted the 2008 Stock Plan (the 2008 Plan). Under the 2008 Plan, as amended, 7,688,078 shares of common stock were reserved for the issuance of incentive stock options (ISOs), nonstatutory stock options (NSOs), and stock purchase rights to employees, directors, and consultants of the Company as of January 31, 2017. Options may be granted with exercise prices at no less than 100% of the fair value of the common stock on the date of grant. ISOs granted under the 2008 Plan generally vest 25% after the completion of one year of service and then vest in equal monthly installments over the next 36 months of service and expire ten years from the date of grant. NSOs vest according to the specific agreement and expire ten years from the date of grant.
Early Exercise of Stock Options. The Company’s 2008 Plan allows select employees to exercise options prior to vesting. The Company has a right to repurchase unvested shares acquired upon early exercise of options at the original exercise price upon termination of employment. The repurchase rights will lapse in accordance with the original vesting schedule of the option. Early exercises of options are not deemed to be substantive exercises for accounting purposes and, accordingly, amounts received for early exercises are recorded as a
F-30
Table of Contents
liability included in other long-term liabilities. These amounts are reclassified to common stock as the underlying options vest. As of January 31, 2016 and 2017, shares held by employees that were subject to repurchase were 118,782 and 49,234, respectively, with an aggregate purchase price of $1.1 million and $0.5 million, respectively. As of April 30, 2017 (unaudited), shares held by employees that were subject to repurchase were 31,846 with an aggregate purchase price of $0.3 million.
Stock-Based Compensation
The following is a summary of shares available for grant under the Company’s stock plans for the year ended January 31, 2017 and the three months ended April 30, 2017 (unaudited):
| Outstanding—January 31, 2016 |
156,417 | |||
| Authorized |
1,405,316 | |||
| Options and RSUs granted |
(1,240,032 | ) | ||
| Common stock repurchased |
— | |||
| Options and RSUs canceled |
738,891 | |||
|
|
|
|||
| Outstanding—January 31, 2017 |
1,060,592 | |||
|
|
|
|||
| Authorized (unaudited) |
— | |||
| Options and RSUs granted (unaudited) |
(1,059,188 | ) | ||
| Common stock repurchased (unaudited) |
— | |||
| Options and RSUs canceled (unaudited) |
94,502 | |||
|
|
|
|||
| Outstanding—April 30, 2017 (unaudited) |
95,906 | |||
|
|
|
The following is a summary of stock option activity under the 2008 Plan for the year ended January 31, 2017 and for the three months ended April 30, 2017 (unaudited):
| Options Outstanding | ||||||||||||||||
| Number of shares underlying outstanding options |
Weighted- average exercise price |
Weighted- average remaining contractual term |
Aggregate Intrinsic Value |
|||||||||||||
| (in years) | (in thousands) | |||||||||||||||
| Outstanding—January 31, 2016 |
4,421,035 | $ | 16.34 | 8.2 | $ | 59,882 | ||||||||||
| Options granted |
920,147 | $ | 30.25 | |||||||||||||
| Options exercised |
(168,380 | ) | $ | 13.63 | ||||||||||||
| Common stock repurchased |
— | |||||||||||||||
| Options canceled |
(704,841 | ) | $ | 19.35 | ||||||||||||
|
|
|
|
|
|||||||||||||
| Outstanding—January 31, 2017 |
4,467,961 | $ | 18.83 | 7.5 | $ | 60,756 | ||||||||||
|
|
|
|
|
|||||||||||||
| Options granted (unaudited) |
307,798 | $ | 32.34 | |||||||||||||
| Options exercised (unaudited) |
(30,096 | ) | $ | 13.89 | ||||||||||||
| Options canceled (unaudited) |
(77,506 | ) | $ | 24.21 | ||||||||||||
|
|
|
|
|
|||||||||||||
| Outstanding—April 30, 2017 (unaudited) |
4,668,157 | $ | 19.67 | 7.6 | $ | 59,851 | ||||||||||
|
|
|
|
|
|||||||||||||
| Vested and exercisable |
||||||||||||||||
| January 31, 2017 |
2,380,167 | $ | 13.55 | 6.8 | $ | 44,719 | ||||||||||
| April 30, 2017 (unaudited) |
2,635,807 | $ | 14.84 | 6.8 | $ | 46,285 | ||||||||||
| Vested and Expected to Vest |
||||||||||||||||
| January 31, 2017(1) |
4,174,361 | $ | 18.54 | 7.5 | $ | 57,552 | ||||||||||
| April 30, 2017 (unaudited) |
4,668,157 | $ | 19.67 | 7.6 | $ | 59,851 | ||||||||||
F-31
Table of Contents
| (1) | The expected to vest options are a result of applying the forfeiture rate assumptions to unvested options outstanding. |
The aggregate intrinsic value is calculated as the difference between the exercise price of the underlying options and the fair value of the common stock for options that had exercise prices that were lower than the fair value per share of the common stock. The aggregate intrinsic value of stock options exercised for the years ended January 31, 2016 and 2017 and for the three months ended April 30, 2017 (unaudited) was $4.5 million, $2.9 million and $0.6 million, respectively.
The weighted-average grant date fair value of options granted during the years ended January 31, 2016 and 2017 and during the three months ended April 30, 2017 (unaudited) was $12.36, $17.34, $17.22 per share, respectively.
The total grant date fair value of options vested for the years ended January 31, 2016 and 2017 and during the three months ended April 30, 2017 (unaudited) was $8.6 million, $11.4 million and $4.8 million, respectively.
The valuation model for stock-based compensation expense requires the Company to make assumptions and judgments about the variables used in the calculation, including the expected term (weighted-average period of time that the options granted are expected to be outstanding), the expected volatility of the Company’s common stock, a risk-free interest rate and expected dividend yield. The weighted-average assumptions used to estimate the fair value of stock options granted in the following periods was:
| Fiscal Year Ended January 31, | Three Months Ended April 30, | |||||||||||||||||||
| 2015 | 2016 | 2017 | 2016 | 2017 | ||||||||||||||||
| (unaudited) | ||||||||||||||||||||
| Risk-free interest rate |
1.85 | % | 1.64 | % | 1.52 | % | 1.54 | % | 2.08 | % | ||||||||||
| Expected term (in years) |
6.08 | 6.08 | 6.04 | 6.08 | 6.01 | |||||||||||||||
| Expected volatility |
62.72 | % | 55.80 | % | 61.68 | % | 62.70 | % | 55.20 | % | ||||||||||
| Dividend yield |
0 | % | 0 | % | 0 | % | 0 | % | 0 | % | ||||||||||
The fair value of each grant of stock options was determined using Black-Scholes and assumptions discussed below. Each of these inputs is subjective and generally requires significant judgment to determine.
Fair Value of Common Stock. Because the Company’s common stock is not yet publicly traded, the Company must estimate the fair value of common stock. The fair values of the common stock underlying the stock-based awards were determined by the Company’s board of directors, which considered numerous objective and subjective factors to determine the fair value of common stock at each grant date. These factors included, but were not limited to, (i) contemporaneous valuations of common stock performed by third-party specialists; (ii) the lack of marketability of the common stock; (iii) developments in the business; (iv) the likelihood of achieving a liquidity event, such as an IPO or sale of the Company given prevailing market conditions; and (v) operating and financial performance.
Expected Term. The expected term of the options is calculated as the midpoint between the vesting date and the end of the contractual term of the option grants.
Expected Volatility. Since the Company’s common stock is currently not publicly traded and, therefore, no historical data on volatility of its stock is available, the expected volatility is based on an average of the historical volatility of a group of comparable publicly traded companies in similar industries over a period equivalent to the expected term of the options.
Risk-Free Interest Rate. The risk-free rate that the Company uses is based on U.S. Treasury zero-coupon issues with remaining terms similar to the expected term of the options.
F-32
Table of Contents
Dividends. The Company has never declared or paid any cash dividends and does not plan to pay cash dividends in the foreseeable future and, therefore, used an expected dividend yield of zero in the valuation model.
All stock-based payment awards are amortized on a straight-line basis over the requisite service periods of the awards, which are generally the vesting periods. Compensation expense related to options granted to non-employees is recognized as the equity instruments vest, and such options are revalued at each reporting date. As a result, compensation expense related to unvested options granted to non-employees fluctuates as the fair value of the Company’s common stock fluctuates.
Restricted Stock Units
The Company grants RSUs to its executives, employees, and members of the Board. The Board determines the vesting conditions for RSUs and the period over which the RSUs will vest and be settled. RSUs convert into common stock upon vesting and settlement.
Performance RSUs. The Company grants RSUs that contain vesting requirements that must be satisfied on or before the expiration date of the RSUs in order for an RSU to vest (in whole or in part): (i) a time and service-based requirement and (ii) performance conditions (altogether, PSUs). The time and service-based requirement is met by the recipient’s continuing employment and service with the Company from grant date through the applicable date. In general, the time and service-based requirement is two years. The performance conditions consist of the occurrence of a liquidity event and, in some instances, individual performance conditions by the recipient. The liquidity event performance condition is not satisfied unless and until the earlier to occur of (i) a change of control or (ii) the first date following the expiration of all lockup and blackout periods following an IPO; in either case, prior to the expiration date of the PSU and subject to the recipient’s continuing employment and service with the Company through the applicable date.
Stock-based compensation expense is measured and recognized in the financial statements based on the fair value of the Company’s common stock on the date of the grant. Stock-based compensation expense is recognized, net of estimated and actual forfeitures, over the requisite service period of the award, and upon performance conditions being met.
A summary of the RSU activity during the year ended January 31, 2017 and during the three months ended April 30, 2017 (unaudited) is presented below:
| Shares | Weighted average grant date fair value per share |
|||||||
| Outstanding January 31, 2016 |
— | — | ||||||
| Awarded |
319,885 | $ | 30.54 | |||||
| Released |
— | — | ||||||
| Forfeited |
(34,050 | ) | 30.06 | |||||
|
|
|
|
|
|||||
| Outstanding January 31, 2017 |
285,835 | 30.60 | ||||||
|
|
|
|
|
|||||
| Awarded (unaudited) |
751,390 | 32.34 | ||||||
| Released (unaudited) |
— | — | ||||||
| Forfeited (unaudited) |
(16,995 | ) | 31.08 | |||||
|
|
|
|
|
|||||
| Outstanding April 30, 2017 (unaudited) |
1,020,230 | $ | 31.86 | |||||
|
|
|
|
|
|||||
F-33
Table of Contents
Stock-Based Compensation Expense
Stock Options
In connection with the 2008 Plan, the Company recognized stock-based compensation as follows (in thousands):
| Fiscal Year Ended January 31, | Three Months Ended April 30, | |||||||||||||||
| 2016 | 2017 | 2016 | 2017 | |||||||||||||
| (unaudited) | ||||||||||||||||
| Stock-based compensation: |
||||||||||||||||
| Cost of product revenue |
$ | 181 | $ | 264 | $ | 62 | $ | 71 | ||||||||
| Cost of support and maintenance revenue |
176 | 323 | 76 | 115 | ||||||||||||
| Research and development |
2,906 | 5,227 | 1,476 | 1,276 | ||||||||||||
| Sales and marketing |
3,073 | 4,115 | 1,223 | 1,044 | ||||||||||||
| General and administrative |
3,419 | 3,905 | 961 | 959 | ||||||||||||
|
|
|
|
|
|
|
|
|
|||||||||
| Total stock-based compensation expense |
$ | 9,755 | $ | 13,834 | $ | 3,798 | $ | 3,465 | ||||||||
|
|
|
|
|
|
|
|
|
|||||||||
As of January 31, 2016 and 2017, the total unrecognized stock-based compensation expense for unvested stock options, net of expected forfeitures, was $26.5 million and $24.1 million, respectively, which is expected to be recognized over a weighted-average period of 3.0 years and 2.4 years, respectively. As of April 30, 2017 (unaudited) the total unrecognized stock-based compensation expense for unvested stock options was $28.6 million, which is expected to be recognized over a weighted-average period of 2.4 years.
Restricted Stock Units
As of April 30, 2017 (unaudited), the Company had not recognized stock-based compensation expense related to the outstanding PSUs as it has determined that it is not probable that either of the liquidity events will occur. As of April 30, 2017 (unaudited), the total unrecognized stock-based compensation expense, net of actual forfeitures, for unvested PSUs was $32.6 million. Expensing for these PSUs would commence upon vesting and continue through the final vesting date.
Common Stock Warrants
In connection with the Loan and Security Agreement with SVB, the Company issued immediately exercisable and fully vested warrants to purchase 4,167 shares of common stock. The fair value of the warrant was $27,000 and was recorded in other income (expense), net in the consolidated statements of operations. In July 2013, upon drawing down on the term loan, the Company issued the lender a warrant to purchase an additional 20,833 shares of common stock. The warrants have an exercise price of $7.80. The warrants expire in May 2023. The Company determined the fair value of the additional common stock warrants on the date of issuance to be $0.1 million, which was recorded as a debt discount. The debt discount was amortized to interest expense over the loan term using the effective-interest rate method. In connection with the total term loan balance being repaid during the year ended January 31, 2015, the unamortized debt discount of $0.1 million was written off.
The fair value of the common stock warrants was determined using a Black-Scholes option pricing model with the following assumptions: fair value of common stock of $9.00 to $9.30, expected volatility of 61.7% to 62.1%, contractual term of 9.9 to 10 years, and risk-free interest rate of 2.0% to 2.6%. The fair value of the common stock warrants were recorded to additional paid-in capital upon issuance. The warrants from this arrangement remain outstanding as of April 30, 2017 (unaudited).
(11) 401(k) Plan
The Company maintains a tax-qualified retirement plan, or the 401(k) plan. Participants are able to defer eligible compensation up to applicable annual Internal Revenue Code limits. All participants’ interests in their
F-34
Table of Contents
deferrals are 100% vested when contributed. The 401(k) plan allows the Company to make matching contributions and profit sharing contributions to eligible participants. No contributions were made for the years ended January 31, 2016 and 2017, and for the three months ended April 30, 2017 (unaudited).
(12) Net Loss and Unaudited Net Loss Per Share Attributable To Common Stockholders
(a) Net Loss Per Share Attributable to Common Stockholders
Basic and diluted net loss per share attributable to common stockholders is presented in conformity with the two-class method required for participating securities. The Company’s convertible preferred stock is considered a participating security. Participating securities do not have a contractual obligation to share in the Company’s losses. As such, for the periods the Company incurs net losses, there is no impact on the calculated net loss per share attributable to common stockholders in applying the two-class method.
Basic net loss per share attributable to common stockholders is computed by dividing the net loss by the weighted-average number of shares of common stock outstanding during the period. The diluted net loss per share attributable to common stockholders is computed by giving effect to all potential dilutive common stock equivalents outstanding for the period. For purposes of this calculation, participating securities, stock options to purchase common stock, RSUs, warrants to purchase common stock and convertible preferred stock are considered to be common stock equivalents and have been excluded from the calculation of diluted net loss per share attributable to common stockholders, as their effect is antidilutive.
The computation of basic and diluted net loss per share is as follows (in thousands, except share and per share data):
| Fiscal Year Ended January 31, | Three Months Ended April 30, |
|||||||||||||||
| 2016 | 2017 | 2016 | 2017 | |||||||||||||
| (unaudited) | ||||||||||||||||
| Numerator: |
||||||||||||||||
| Net loss |
$ | (100,968 | ) | $ | (105,801 | ) | $ | (30,811 | ) | $ | (30,680 | ) | ||||
| Deemed divided to Series E Convertible Preferred Stock |
— | — | — | (6,588 | ) | |||||||||||
|
|
|
|
|
|
|
|
|
|||||||||
| Net loss attributable to common stockholders |
$ | (100,968 | ) | $ | (105,801 | ) | $ | (30,811 | ) | $ | (37,268 | ) | ||||
|
|
|
|
|
|
|
|
|
|||||||||
| Denominator: |
||||||||||||||||
| Weighted-average common shares outstanding |
3,299,908 | 3,523,695 | 3,475,122 | 3,640,122 | ||||||||||||
| Weighted-average unvested common shares subject to repurchase |
(158,961 | ) | (81,146 | ) | (106,963 | ) | (37,742 | ) | ||||||||
|
|
|
|
|
|
|
|
|
|||||||||
| Weighted-average shares—basic and diluted |
3,140,947 | 3,442,549 | 3,368,159 | 3,602,380 | ||||||||||||
|
|
|
|
|
|
|
|
|
|||||||||
| Net loss per share attributable to common stockholders—basic and diluted |
$ | (32.15 | ) | $ | (30.73 | ) | $ | (9.15 | ) | $ | (10.35 | ) | ||||
|
|
|
|
|
|
|
|
|
|||||||||
F-35
Table of Contents
The potential absolute shares of common stock that were excluded from the computation of diluted net loss per share attributable to common stockholders for the periods presented because including them would have been antidilutive are as follows:
| As of January 31, | As of April 30, | |||||||||||
| 2016 | 2017 | 2017 | ||||||||||
| (in shares) | (unaudited) | |||||||||||
| Convertible preferred stock (on an if-converted basis) |
10,610,966 | 10,610,966 | 10,610,966 | |||||||||
| Stock options and RSUs |
4,421,035 | 4,753,796 | 5,688,387 | |||||||||
| Early exercised stock options |
118,781 | 49,233 | 31,846 | |||||||||
| Convertible preferred stock warrants |
40,250 | 40,250 | 57,280 | |||||||||
| Common stock warrants |
25,000 | 25,000 | 25,000 | |||||||||
|
|
|
|
|
|
|
|||||||
| Total |
15,216,032 | 15,479,245 | 16,413,479 | |||||||||
|
|
|
|
|
|
|
|||||||
(b) Unaudited Pro Forma Net Loss Per Share Attributable to Common Stockholders
Pro forma basic and diluted net loss per share have been computed to give effect, even if antidilutive, to the following transactions upon consummation of a Qualified IPO as if they occurred at the beginning of the period presented:
| • | conversion of the Company’s preferred stock into common stock; and |
| • | the issuance of the additional shares of common stock resulting from the amendment to our amended and restated certificate of incorporation, as amended on June 1, 2017. |
The computation of pro forma basic and diluted net loss per share is as follows (in thousands, except share and per share data):
| Fiscal Year Ended January 31, |
Three Months Ended April 30, |
|||||||
| 2017 | 2017 | |||||||
| (unaudited) | (unaudited) | |||||||
| Net loss used to compute pro forma net loss per share attributable to common stockholders: |
||||||||
| Net loss attributable to common stockholders |
$ | (105,801 | ) | $ | (37,268 | ) | ||
| Change in fair value of convertible preferred stock warrant liability |
36 | (156 | ) | |||||
| Deemed dividend to Series E and E-1 Convertible Preferred Stock (unaudited) |
— | 6,588 | ||||||
|
|
|
|
|
|||||
| Pro forma net loss attributable to common stockholders |
$ | (105,765 | ) | $ | (30,836 | ) | ||
|
|
|
|
|
|||||
| Weighted-average shares used to compute pro forma net loss per share attributable to common stockholders: |
||||||||
| Weighted-average shares used to compute net loss per share—basic and diluted |
3,442,549 | 3,602,380 | ||||||
| Pro forma adjustment to reflect assumed conversion of convertible preferred stock (reflecting the amendment to our amended and restated certificate of incorporation, as amended on June 1, 2017) |
17,992,973 | 17,992,973 | ||||||
|
|
|
|
|
|||||
| Pro forma weighted-average shares—basic and diluted |
21,435,522 | 21,595,353 | ||||||
|
|
|
|
|
|||||
| Pro forma net loss per share attributable to common stockholders—basic and diluted |
$ | (4.93 | ) | $ | (1.43 | ) | ||
|
|
|
|
|
|||||
F-36
Table of Contents
The potential absolute shares of common stock that were excluded from the computation of pro forma diluted net loss per share attributable to common stockholders for the periods presented because including them would have been antidilutive are as follows:
| As of January 31, | As of April 30, | |||||||
| 2017 | 2017 | |||||||
| (unaudited) | (unaudited) | |||||||
| Stock options and RSUs |
4,753,796 | 5,688,387 | ||||||
| Early exercised stock options |
49,233 | 31,846 | ||||||
| Convertible preferred stock warrants |
40,250 | 57,280 | ||||||
| Common stock warrants |
25,000 | 25,000 | ||||||
| Common stock warrants issued to the Series E-2 and F-2 Holders (Note 16(g)) |
1,666,665 | 1,666,665 | ||||||
|
|
|
|
|
|||||
| Total |
6,534,944 | 7,469,178 | ||||||
|
|
|
|
|
|||||
(13) Taxes
The provision for income taxes is based upon the income (loss) before income taxes as follows (in thousands):
| Fiscal Year Ended January 31, |
||||||||
| 2016 | 2017 | |||||||
| Domestic |
$ | (101,841 | ) | $ | (106,856 | ) | ||
| Foreign |
1,507 | 1,520 | ||||||
|
|
|
|
|
|||||
| Total loss before provision for income taxes |
$ | (100,334 | ) | $ | (105,336 | ) | ||
|
|
|
|
|
|||||
The provision for income taxes consisted of the following (in thousands):
| Fiscal Year Ended January 31, |
||||||||
| 2016 | 2017 | |||||||
| Current: |
||||||||
| Federal |
$ | — | $ | — | ||||
| State |
36 | 12 | ||||||
| Foreign |
606 | 443 | ||||||
|
|
|
|
|
|||||
| Total current tax provision |
$ | 642 | $ | 455 | ||||
|
|
|
|
|
|||||
| Deferred: |
||||||||
| Federal |
$ | — | $ | (8 | ) | |||
| State |
— | — | ||||||
| Foreign |
(8 | ) | 18 | |||||
|
|
|
|
|
|||||
| Total deferred tax provision |
(8 | ) | 10 | |||||
|
|
|
|
|
|||||
| Provision for income taxes |
$ | 634 | $ | 465 | ||||
|
|
|
|
|
|||||
F-37
Table of Contents
The provision for income taxes differs from the amount computed by applying the federal statutory income tax rate to income before taxes as follows (in thousands):
| Fiscal Year Ended January 31, |
||||||||
| 2016 | 2017 | |||||||
| U.S. federal taxes at statutory tax rate |
$ | (34,114 | ) | $ | (35,816 | ) | ||
| State taxes, net of federal benefit |
31 | 8 | ||||||
| Nondeductible expenses |
288 | 281 | ||||||
| Nondeductible stock-based compensation |
1,997 | 2,894 | ||||||
| Foreign rate differential |
83 | (59 | ) | |||||
| Other |
(1,425 | ) | (618 | ) | ||||
| Change in valuation allowance |
33,774 | 33,775 | ||||||
|
|
|
|
|
|||||
| Provision for income taxes |
$ | 634 | $ | 465 | ||||
|
|
|
|
|
|||||
During the year ended January 31, 2017, the Company’s provision for income taxes was primarily attributable to U.S. state taxes, as well as foreign tax provision in certain foreign jurisdictions in which it conducts business.
Deferred income taxes reflect the tax effects of temporary differences between the carrying amounts of assets and liabilities for financial reporting purposes and the amounts used for income tax purposes. The components of deferred income tax assets and liabilities are as follows (in thousands):
| Fiscal Year Ended January 31, |
||||||||
| 2016 | 2017 | |||||||
| Deferred tax assets: |
||||||||
| Net operating losses |
$ | 65,663 | $ | 93,497 | ||||
| Depreciation and amortization |
1,571 | 2,527 | ||||||
| Accruals and reserves |
9,451 | 14,565 | ||||||
| Stock-based compensation |
1,832 | 3,715 | ||||||
| Tax credits |
3,227 | 4,592 | ||||||
| Other |
8 | 5 | ||||||
|
|
|
|
|
|||||
| Gross deferred tax assets |
$ | 81,752 | $ | 118,901 | ||||
|
|
|
|
|
|||||
| Valuation allowance |
(81,660 | ) | (118,827 | ) | ||||
|
|
|
|
|
|||||
| Net deferred tax assets after valuation allowance |
$ | 92 | $ | 74 | ||||
|
|
|
|
|
|||||
| Deferred tax liabilities |
$ | — | $ | — | ||||
|
|
|
|
|
|||||
| Total net deferred tax assets |
$ | 92 | $ | 74 | ||||
|
|
|
|
|
|||||
The valuation allowance increased by $37.2 million during the year ended January 31, 2017. Management recorded a full valuation allowance against the net federal and state deferred tax assets as it is not more likely than not that the assets will be realized. Realization of deferred tax assets is dependent upon future taxable income, if any, the amount and timing of which are uncertain. At such time, if it is determined that it is more likely than not that the deferred tax assets are realizable, the valuation allowance will be adjusted.
F-38
Table of Contents
As of January 31, 2017, the Company had net operating loss carryforwards and tax credit carryforwards as follows (in thousands):
| Amount | Expiration year | |||||
| Net operating losses, federal |
$ | 257,850 | 2028-2037 | |||
| Net operating losses, California |
47,293 | 2028-2037 | ||||
| Net operating losses, other states |
74,601 | Various | ||||
| Tax credits, federal |
4,916 | 2031-2037 | ||||
| Tax credits, state |
4,119 | Indefinite | ||||
The net operating losses (NOL) include tax benefits related to stock option exercises that, when realized, will be recorded as a credit to additional paid-in capital for federal and state income tax purposes. Federal and California tax laws impose limitations on the utilization of NOL and credit carryforwards in the event of an “ownership change” for tax purposes, as defined in Section 382 of the Internal Revenue Code. Accordingly, the Company’s ability to utilize these carryforwards may be limited as a result of such “ownership change.”
The Company has no present intention of remitting undistributed earnings of foreign subsidiaries and, accordingly, no deferred tax liability has been established relative to these earnings. The tax impact of any repatriation of the Company’s undistributed earnings of foreign subsidiaries is immaterial.
The activity related to the unrecognized tax benefits is as follows:
| Year Ended January 31, | ||||||||
| 2016 | 2017 | |||||||
| (in thousands) | ||||||||
| Gross unrecognized tax benefits—beginning balance |
$ | — | $ | 2,511 | ||||
| Increase related to tax positions taken during current year |
1,087 | 1,087 | ||||||
| Increase related to tax positions taken during prior years |
1,424 | — | ||||||
|
|
|
|
|
|||||
| Gross unrecognized tax benefits—ending balance |
$ | 2,511 | $ | 3,598 | ||||
|
|
|
|
|
|||||
As of January 31, 2016 and 2017, the Company has unrecognized tax benefits of $2.5 million and $3.6 million, respectively, none of which would have an impact on the effective tax rate, if recognized.
The Company recognizes interest and penalties related to uncertain tax positions, if any, as a component of its income tax provision. The Company recognized no interest and penalties related to uncertain tax positions for the years ended January 31, 2016 and 2017 in the consolidated statements of operations or balance sheets. None of the unrecognized tax benefits, if recognized currently, would impact the Company’s effective tax rate. The Company does not expect any material changes to its uncertain tax positions within the next twelve months.
The Company files federal, state, and foreign income tax returns in many jurisdictions in the United States and abroad. For U.S. federal and state income tax purposes, the statute of limitations currently remains open for all years due to the Company’s NOL carryforwards. The Company is not currently under examination in any jurisdiction.
Income tax expense or benefit from continuing operations is generally determined without regard to other categories of earnings, such as discontinued operations and other comprehensive income. An exception is provided in ASC 740 when there is aggregate income from categories other than continuing operations and a loss from continuing operations in the current year. In this case, the tax benefit allocated to continuing operations is the amount by which the loss from continuing operations reduces the tax expenses recorded with respect to the other categories of earnings, even when a valuation allowance has been established against the deferred tax assets. In instances where a valuation allowance is established against current year losses, income from other
F-39
Table of Contents
sources, including unrealized gains from available-for-sale securities recorded as a component of other comprehensive income, is considered when determining whether sufficient future taxable income exists to realize the deferred tax assets.
(14) Segment Information
The Company’s chief operating decision maker is a group which is comprised of its Chief Executive Officer and Chief Financial Officer. This group reviews financial information presented on a consolidated basis for purposes of allocating resources and evaluating financial performance. Accordingly, the Company has a single reportable segment.
The following table sets forth revenue by geographic area by customer location (in thousands):
| Fiscal Year Ended January 31, |
||||||||||||
| 2015 | 2016 | 2017 | ||||||||||
| United States |
$ | 34,862 | $ | 60,300 | $ | 87,519 | ||||||
| EMEA |
9,907 | 13,712 | 18,207 | |||||||||
| Rest of the World |
5,030 | 12,000 | 19,379 | |||||||||
|
|
|
|
|
|
|
|||||||
| Total revenue |
$ | 49,799 | $ | 86,012 | $ | 125,105 | ||||||
|
|
|
|
|
|
|
|||||||
| Three Months Ended April 30, |
||||||||
| 2016 | 2017 | |||||||
| (unaudited) | ||||||||
| United States |
$ | 14,585 | $ | 22,663 | ||||
| EMEA |
3,765 | 3,732 | ||||||
| Rest of the World |
4,526 | 3,960 | ||||||
|
|
|
|
|
|||||
| Total revenue |
$ | 22,876 | $ | 30,355 | ||||
|
|
|
|
|
|||||
As of January 31, 2016 and 2017, $14.4 million and $10.2 million, respectively, of the Company’s long-lived assets were located in the United States.
(15) Related-Party and Other Transactions
In 2013, one executive and one non-executive employee exercised stock options early in exchange for full-recourse promissory notes in an amount of $2.2 million bearing annual interest of 1.62% to 1.64% payable to the Company. These notes are secured by the underlying shares purchased and such unvested shares can be repurchased by the Company upon employee termination at the original issuance price. The promissory notes and accrued interest become due and payable in full beginning in August 2018 and ending in December 2018, but will become due earlier in connection with the Company’s public filing of a registration statement with the Securities and Exchange Commission for an IPO, if the existence of the notes would violate any applicable law, or when the Company has a change in control or the executive terminates services. The Company is recording the notes receivable balance within equity with a corresponding entry to additional paid-in capital upon the vesting of these shares. Employee notes receivable as of January 31, 2016 and 2017 was $1.4 million and $1.5 million, respectively. Employee notes receivable as of April 30, 2017 (unaudited) was $1.7 million. For the year ended January 31, 2017, $0.4 million of principal and interest payment was made by the non-executive employee. No principal and interest payments were made for the three months ended April 30, 2017 (unaudited).
In 2013, one executive employee exercised stock options early in exchange for a promissory note in an amount of $6.6 million bearing interest of 1.92% payable to the Company. This note is secured by the underlying
F-40
Table of Contents
shares purchased and such unvested shares can be repurchased by the Company upon employee termination at the original issuance price. The promissory note and accrued interest become due and payable in full in October 2020, but will become due earlier in connection with the Company’s public filing of a registration statement with the Securities and Exchange Commission for an IPO, if the existence of the note would violate any applicable law, or when the Company has a change in control or the executive terminates services. Because the Company only has partial recourse under the promissory note, the Company deemed the exercise of the stock options to be nonsubstantive. As such, the note receivable is not reflected in these consolidated financial statements and the related stock transaction will be recorded at the time the note receivable is settled in cash. No principal payments were made as of April 30, 2017 (unaudited).
In April 2014, the Company entered into a full-recourse promissory note of $65,000 with an employee which is included in Other long-term assets. The note is secured by 20,000 shares of common stock held by the employee. The note bears interest at the rate of 1.80% per annum and principal and interest is due in April 2019.
In July 2015, certain executives of the Company participated in the Series F financing round, and acquired 11,353 shares of Series F Convertible Preferred Stock with an aggregate value of $0.5 million.
(16) Subsequent Events
The Company has evaluated and recognized subsequent events, as appropriate, through June 1, 2017, the date the consolidated financial statements as of and for the year ended January 31, 2017 were originally issued, and has evaluated for disclosure additional subsequent events occurring after such date through June 26, 2017, which is the date these consolidated financial statements were available for reissuance.
(a) In May 2017, the Board granted PSUs under the 2008 Plan to certain eligible employees covering 12,899 shares that were previously approved by the Board in April 2017. The total grant date fair value for these PSUs is $0.2 million. Expensing for these PSUs will commence upon vesting and continue through the final vesting date.
(b) In May 2017, the Company entered into a Note Purchase Agreement with certain of its stockholders pursuant to which such stockholders have agreed to purchase from the Company, and the Company has agreed to sell to such stockholders, one or more subordinated convertible promissory notes (Convertible Promissory Notes) having a maximum aggregate principal amount of $25.0 million. Subject to the terms and conditions set forth in the Note Purchase Agreement, the Convertible Promissory Notes may be issued and sold in one or more tranches (each a Tranche) in aggregate amounts to be determined by the Company pursuant to approval of a majority of the members of the Company’s board of directors. Within 30 days of the Company providing a written notice to the relevant stockholders that the Company intends to draw funds under a Tranche, the stockholders shall purchase the required Convertible Promissory Notes. The obligations of the Company to issue and the stockholders to purchase Convertible Promissory Notes will expire upon the earliest to occur of (i) April 30, 2018, (ii) the closing of an initial public offering of the Company’s stock, or (iii) the Company’s issuance and sale of equity or debt securities for aggregate gross proceeds of at least $25.0 million.
Convertible Promissory Notes will have an interest rate of 5.0% per annum and will mature one year from the date of issuance. If the Company issues and sells shares of preferred stock for aggregate gross proceeds of at least $20.0 million (a Qualified Financing) prior to the maturity of Convertible Promissory Notes, the Convertible Promissory Notes will convert into shares of the Company’s preferred stock at a price equal to 90% of the purchase price per share in the Qualified Financing. If the Company issues and sells shares of preferred stock in a financing that does not constitute a Qualified Financing, then upon the election of holders of at least 2/3 of the aggregate outstanding principal amount of Convertible Promissory Notes, the Convertible Promissory Notes will convert into shares of preferred stock at a price equal to the purchase price per share in such non-Qualified Financing. If the Company completes an IPO prior to a subsequent financing, the Convertible Promissory Notes will convert into shares of Company common stock at a price equal to 90% of the offering price per share in such IPO.
F-41
Table of Contents
The Convertible Promissory Notes may not be prepaid without the written consent of holders of 2/3 of the aggregate outstanding principal amount of Convertible Promissory Notes. In the event of a change of control of the Company, as defined in the Note Purchase Agreement, the outstanding principal amount of the Convertible Promissory Notes, plus all accrued and unpaid interest, in each case that has not otherwise been converted into equity securities, will be due and payable immediately prior to the closing of such change of control, together with a premium equal to 50% of the outstanding principal amount to be prepaid.
(c) In May 2017, the Company repriced each outstanding and unexercised stock option held by current service providers with an exercise price in excess of $13.68 per share (each, an “Eligible Option”), to a new exercise price of $13.68 per share, which is no less than the fair value of the Company’s common stock as determined by the Company’s compensation committee on the date of repricing. Eligible Options covering 3,291,783 shares of the Company’s common stock with a weighted average exercise price of $24.31 were repriced on May 30, 2017. The consolidated financial statements do not include any adjustments related to unrecognized stock-based compensation expense that result from the option repricing.
Other than the exercise price, no other terms of the Eligible Options were changed as a result of this repricing. The Company will record additional stock-based compensation expense for the excess of fair value of the repriced Eligible Options as compared to their fair value immediately preceding the repricing. The additional stock-based compensation expense related to this repricing is estimated to be $7.3 million, of which $2.6 million is recognized on the date of repricing for Eligible Options that have vested, and the remaining $4.7 million will be recognized over 2.5 years upon vesting.
(d) In May 2017, the Board adopted a 2017 Equity Incentive Plan (the “2017 Plan”) and approved the termination of the 2008 Plan, which are to be effective concurrently upon closing of the IPO. The Board also approved an additional 2,487,195 shares for issuance under the 2008 Plan.
In May 2017, the Board of the Company authorized and approved a 2017 Employee Stock Purchase Plan (the “ESPP”). The Board also adopted and approved the Executive Incentive Compensation Plan.
In May 2017, the Board approved grants of options under the 2008 Plan to certain executives as a one-time retention grant to purchase a total of 187,498 shares (the “Retention Options”), and grants of PSUs under the 2008 Plan covering a total of 729,166 shares (the “Retention RSUs”). The Board also approved grants of options to two executives to purchase an additional 589,624 shares (the “Additional Options”). The exercise price of the Retention Options and Additional Options is $13.68 per share, the fair value of the common stock on the date of grant as determined by the Company’s compensation committee. The total grant date fair value for the Retention Options and Retention RSUs are $1.3 million and $10.0 million, respectively. The Retention Options vest and become exercisable in equal monthly installments over the two years following the closing of the IPO and subject to the holder’s continued service through each vesting date. The Retention RSUs vest as to 3/8th of the Retention RSUs on March 15, 2018, 1/8th of the Retention RSUs every three months thereafter on the 15th day of the month, subject to the holder’s continued service through each vesting date. The Retention Options and Retention RSUs are forfeited if the closing of the IPO does not occur by July 30, 2017. The Additional Options are fully vested and exercisable on the date of grant. See (e) for the accounting treatment, and financial impact of the Additional Options.
(e) In June 2017, two executive employees repaid promissory notes they held with the Company in full through the Company’s repurchase of 501,104 shares and 88,520 shares, respectively, of their common stock. Such shares were valued at $13.68 per share, which is the fair value of the Company’s common stock as determined by the Company’s compensation committee on the date of repurchase. Because the Company has partial recourse under the promissory note issued by a certain executive in lieu of cash payment for the shares issued upon his option exercise (“Partial Recourse Note Options”), the Company deemed the exercise of these stock options to be nonsubstantive. As such, the repayment of the promissory note through the Company’s repurchase of all 501,104 shares purchased under the note, and the issuance of Additional Options for the same
F-42
Table of Contents
number of shares, is treated as a modification of the Partial Recourse Note Options. As a result, the Company will record a stock-based compensation expense for the additional fair value of the Additional Options to the extent it exceeds the fair value of the Partial Recourse Note Options.
The Company will not record any additional stock-based compensation expense in relation to the issuance of 501,104 Additional Options because the fair value of the Partial Recourse Note Options is greater than the fair value of the Additional Options.
The Company has recourse under the promissory note issued by a certain executive in lieu of cash payment for the shares issued upon his option exercise (“Recourse Note Options”). Accordingly, the promissory note and the shares early exercised are considered to be outstanding at the time of the note repayment. As such, the Company deems the issuance of Additional Options of 88,520 shares, and its purchase of the shares of common stock issued pursuant to the note, in lieu of forgiving the executive’s loan altogether, as a stock repurchase. The Company will record additional stock-based compensation expense of $0.5 million, representing the extent that the fair value of the Additional Options and the value of the loan forgiven exceeds the fair value of the 88,520 shares of common stock repurchased.
(f) In June 2017, the Company issued an aggregate of 702,842 shares of its Series E-2 Convertible Preferred Stock to a total of four accredited investors in exchange for 702,842 shares of Series E Convertible Preferred Stock. The Company also issued an aggregate of 522,251 shares of its Series F-2 Convertible Preferred Stock to a total of four accredited investors in exchange for 522,251 shares of Series F Convertible Preferred Stock.
In June 2017, the Company amended its certificate of incorporation to increase the authorized shares of common stock from 21,333,333 to 29,500,000 and the number of authorized shares of preferred stock from 10,679,622 to 11,904,719.
Subsequently, also in June 2017, the Company filed a certificate of retirement and retired 702,842 shares of Series E Convertible Preferred Stock and 522,251 shares of Series F Convertible Preferred Stock, decreasing the number of authorized shares of convertible preferred stock from 11,904,719 to 10,679,622.
(g) In June 2017, the Company amended its certificate of incorporation to eliminate certain variable rate adjustments to the conversion ratios of the Series E, E-1 and F Convertible Preferred Stock and replaced them with certain fixed conversion ratios for purposes of this offering. Pursuant to these fixed conversion ratios, an additional 7,382,007 shares of common stock will be issued to holders of Series E, E-1 and F Convertible Preferred Stock, as well as holders of newly created shares of E-2 and F-2 Convertible Preferred Stock, who are referred to as the Series E-2 and F-2 Holders, upon the conversion of their shares immediately prior to the closing of the IPO. As an integral part of the foregoing transactions, the Company issued warrants to purchase up to 1,666,665 shares of common stock to the Series E-2 and F-2 Holders. The warrants will become exercisable for ten years from the date of grant and have an exercise price of $16.44 per share, which represents 1.2x the fair value of the Company’s common stock as of the date of grant. The warrants may be exercised on a cashless basis. The issuance of additional shares of common stock and the exercisability of the warrants shall occur only in the event that the Company conducts an IPO on or before July 30, 2017 as provided in the certificate of incorporation. These consolidated financial statements do not include any adjustments related to these transactions.
The issuance of additional shares of common stock upon conversion of our Series E, E-1, E-2, F, and F-2 Convertible Preferred Stock and the issuance of the common stock warrants are considered parts of a single, integrated transaction. This transaction will be accounted for as an extinguishment of the originally issued Series E, E-1, and F Convertible Preferred Stock. The resulting gain on extinguishment is estimated at $26.3 million, which includes an estimated amount of $14.6 million attributable to the warrants, and will be recorded as a contribution of capital. This transaction will be recorded in the period in which the IPO closes. This
F-43
Table of Contents
contribution of capital will be presented as a reconciling item between net loss and net loss attributable to common stockholders, and the value of the warrants will be recorded as a permanent equity item.
Stockholders participating in the foregoing transactions include members of the Company’s board of directors and executive officers, as well as venture capital funds that beneficially own 5% or more of the Company’s outstanding capital stock and/or were represented on the Company’s board of directors.
Series E-2 and F-2 Holders are entitled to one vote for each share of common stock into which such shares of Convertible Preferred Stock could be converted. In the event of any liquidation, dissolution, or winding up of the Company, the holders of Series F-2 Convertible Preferred Stock are entitled to receive, prior to and in preference to any distribution to holders of other series of Convertible Preferred Stock, a liquidation preference of $44.04 per share. The holders of Series E-2 Convertible Preferred Stock are entitled to receive, prior to and in preference to any distribution to holders of common stock, a liquidation preference of an amount equal to $43.47828 per share.
(h) In June 2017, the Company approved grants of options under the 2008 Plan to certain eligible employees to purchase a total of 388,206 shares and grants of PSUs under the 2008 Plan to certain eligible employees covering a total of 701,051 shares. The total grant date fair value for these options is $2.1 million and is $9.6 million for these PSUs. Expensing for these PSUs will commence upon vesting and continue through the final vesting date. The options and PSUs are forfeited if the closing of this offering does not occur by July 30, 2017.
(i) In June 2017, the Company entered into an amendment to the New Facility Agreement with TriplePoint. Pursuant to the amendment, once the Company’s common stock has been listed and is actively trading on the NASDAQ Stock Market, on or prior to July 30, 2017 (the Maturity Extension Milestone), the maturity of $35.0 million of previously outstanding indebtedness will be extended from August 2018 to February 2019 and the interest rate on such indebtedness will increase by 1.25% from that date until maturity in February 2019. In addition, following satisfaction of the Maturity Extension Milestone, if the Company prepays $20.0 million or more of its outstanding indebtedness with TriplePoint and pays to TriplePoint a one-time amortization fee equal to 1% of the amount of the outstanding principal balance (giving effect of the prepayment amount) on or before February 2019, the maturity date of the remaining outstanding indebtedness will be extended to August 2020 and the Company will be required to make equal monthly payments of principal and interest on such indebtedness, with the interest rate on such indebtedness increasing by 1.5% from that date until maturity in August 2020 and the end of term payment on such indebtedness increasing by 2%.
(j) In June 2017, the Company authorized a one-for-six reverse split of the Company’s common stock to be effective prior to the completion of this offering. The effects of this reverse split is included in these consolidated financial statements.
F-44
Table of Contents
A building-block design similar to public cloud that
delivers automation, predictive analytics and agility.
Tintri Enterprise Cloud
Table of Contents

Table of Contents
PART II—INFORMATION NOT REQUIRED IN PROSPECTUS
Item 13. Other Expenses of Issuance and Distribution.
The following table sets forth all expenses to be paid by the Registrant, other than underwriting discounts and commissions, upon completion of this offering. All amounts shown are estimates except for the SEC registration fee and the FINRA filing fee.
| SEC registration fee |
$ | 14,495 | ||
| FINRA filing fee |
19,260 | |||
| Exchange listing fee |
25,000 | |||
| Printing and engraving |
900,000 | |||
| Legal fees and expenses |
2,250,000 | |||
| Accounting fees and expenses |
2,150,000 | |||
| Transfer agent and registrar fees |
4,000 | |||
| Miscellaneous |
137,245 | |||
|
|
|
|||
| Total |
$ | 5,500,000 | ||
|
|
|
Item 14. Indemnification of Directors and Officers.
Section 145 of the Delaware General Corporation Law authorizes a corporation’s board of directors to grant, and authorizes a court to award, indemnity to officers, directors and other corporate agents.
On completion of this offering, as permitted by Section 102(b)(7) of the Delaware General Corporation Law, the Registrant’s amended and restated certificate of incorporation will include provisions that eliminate the personal liability of its directors for monetary damages for breach of their fiduciary duty as directors, excluding liability for any breach of the duty of loyalty.
In addition, as permitted by Section 145 of the Delaware General Corporation Law, the amended and restated certificate of incorporation and amended and restated bylaws of the Registrant will provide that:
| • | The Registrant shall indemnify its directors and officers for serving the Registrant in those capacities or for serving other business enterprises at the Registrant’s request, to the fullest extent permitted by Delaware law. Delaware law provides that a corporation may indemnify such person if such person acted in good faith and in a manner such person reasonably believed to be in or not opposed to the best interests of the Registrant and, with respect to any criminal proceeding, had no reasonable cause to believe such person’s conduct was unlawful. |
| • | The Registrant may, in its discretion, indemnify employees and agents in those circumstances where indemnification is permitted by applicable law. |
| • | The Registrant is required to advance expenses, as incurred, to its directors and officers in connection with defending a proceeding, except that such director or officer shall undertake to repay such advances if it is ultimately determined that such person is not entitled to indemnification. |
| • | The Registrant will not be obligated pursuant to the amended and restated bylaws to indemnify a person with respect to proceedings initiated by that person, except with respect to proceedings authorized by the Registrant’s board of directors or brought to enforce a right to indemnification. |
| • | The rights conferred in the amended and restated certificate of incorporation and amended and restated bylaws are not exclusive, and the Registrant is authorized to enter into indemnification agreements with its directors, officers, employees and agents and to obtain insurance to indemnify such persons. |
II-1
Table of Contents
| • | The Registrant may not retroactively amend the bylaw provisions to reduce its indemnification obligations to directors, officers, employees and agents. |
The Registrant’s policy is to enter into separate indemnification agreements with each of its directors and officers that provide the maximum indemnity allowed to directors and executive officers by Section 145 of the Delaware General Corporation Law and also to provide for certain additional procedural protections. The Registrant also maintains directors and officers insurance to insure such persons against certain liabilities.
These indemnification provisions and the indemnification agreements entered into between the Registrant and its officers and directors may be sufficiently broad to permit indemnification of the Registrant’s officers and directors for liabilities (including reimbursement of expenses incurred) arising under the Securities Act.
The underwriting agreement filed as Exhibit 1.1 to this registration statement provides for indemnification by the underwriters of the Registrant and its officers and directors for certain liabilities arising under the Securities Act and otherwise.
Item 15. Recent Sales of Unregistered Securities.
Sales of Preferred Stock
In January 2014, the Registrant sold and issued an aggregate of 1,641,662 shares of its Series E preferred stock to a total of nine accredited investors at a purchase price per unit of $43.47828, for an aggregate purchase price of approximately $71.4 million.
In January 2014, the Registrant sold and issued an aggregate of 83,333 shares of its Series E-1 preferred stock to an accredited investor at a purchase price per unit of $43.47828, for an aggregate purchase price of approximately $3.6 million.
In July 2015, the Registrant sold and issued an aggregate of 2,828,185 shares of its Series F preferred stock to a total of 22 accredited investors at a purchase price per unit of $44.04, for an aggregate purchase price of approximately $124.6 million.
In May 2017, the Registrant issued an aggregate of 702,842 shares of its Series E-2 preferred stock to a total of four accredited investors in exchange for 702,842 shares of Series E preferred stock.
In May 2017, the Registrant issued an aggregate of 522,251 shares of its Series F-2 preferred stock to a total of four accredited investors in exchange for 522,251 shares of Series F preferred stock.
Warrant Issuances
In February and June 2015, the Registrant issued a warrant to purchase up to an aggregate of 120,750 shares of its Series E preferred stock at an exercise price of $14.49 per share to an accredited investor in connection with the entry into a loan and security agreement.
In February 2017, the Registrant issued a warrant to purchase up to an aggregate of 85,147 shares of its Series F preferred stock at an exercise price of $14.68 per share to an accredited investor in connection with the amendment of a loan and security agreement.
In June 2017, the Registrant issued warrants to purchase up to 1,666,665 shares of common stock at an exercise price of $16.44 per share to a total of three accredited investors in exchange for their shares of one subseries of preferred stock for another and related amendments to the Registrant’s certificate of incorporation.
Option Issuances
From June 16, 2014 through June 16, 2017, the Registrant granted its employees, consultants and other service providers options to purchase an aggregate 5,051,250 shares of common stock under its 2008 Stock Plan at exercise prices ranging from $13.68 to $32.34 per share.
II-2
Table of Contents
From June 16, 2014 through June 16, 2017 the Registrant granted to a service provider options to purchase 998 shares of common stock other than pursuant to the 2008 Stock Plan or any other equity plan at an exercise price of $20.04.
RSU Issuances
From June 16, 2014 through June 16, 2017, the Registrant granted or approved 2,514,503 RSUs to certain of its employees, consultants and other service providers under its 2008 Stock Plan.
None of the foregoing transactions involved any underwriters, underwriting discounts or commissions, or any public offering, and the registrant believes the transactions were exempt from the registration requirements of the Securities Act in reliance on Section 4(a)(2) thereof and Rule 701 thereunder as transactions by an issuer not involving a public offering.
Item 16. Exhibits and Financial Statement Schedules.
(a) Exhibits.
The Registrant filed the exhibits listed on the accompanying Exhibit Index of this Registration Statement, which is incorporated by reference herein.
(b) Financial Statement Schedules.
All financial statement schedules are omitted because the information called for is not required or is shown either in the consolidated financial statements or in the notes thereto.
Item 17. Undertakings.
The undersigned Registrant hereby undertakes to provide to the underwriters at the closing specified in the underwriting agreement certificates in such denominations and registered in such names as required by the underwriters to permit prompt delivery to each purchaser.
Insofar as indemnification for liabilities arising under the Securities Act of 1933, as amended, may be permitted to directors, officers, and controlling persons of the Registrant pursuant to the foregoing provisions, or otherwise, the Registrant has been advised that in the opinion of the Securities and Exchange Commission such indemnification is against public policy as expressed in the Act and is, therefore, unenforceable. In the event that a claim for indemnification against such liabilities (other than the payment by the Registrant of expenses incurred or paid by a director, officer, or controlling person of the Registrant in the successful defense of any action, suit, or proceeding) is asserted by such director, officer, or controlling person in connection with the securities being registered, the Registrant will, unless in the opinion of its counsel the matter has been settled by controlling precedent, submit to a court of appropriate jurisdiction the question whether such indemnification by it is against public policy as expressed in the Act and will be governed by the final adjudication of such issue.
The undersigned Registrant hereby undertakes that:
| (1) | For purposes of determining any liability under the Securities Act of 1933, the information omitted from the form of prospectus filed as part of this registration statement in reliance upon Rule 430A and contained in a form of prospectus filed by the Registrant pursuant to Rule 424(b)(1) or (4) or 497(h) under the Securities Act shall be deemed to be part of this registration statement as of the time it was declared effective. |
| (2) | For the purpose of determining any liability under the Securities Act of 1933, each post-effective amendment that contains a form of prospectus shall be deemed to be a new registration statement relating to the securities offered therein, and the offering of such securities at that time shall be deemed to be the initial bona fide offering thereof. |
II-3
Table of Contents
SIGNATURES
Pursuant to the requirements of the Securities Act of 1933, the Registrant has duly caused this registration statement on Form S-1 to be signed on its behalf by the undersigned, thereunto duly authorized, in Mountain View, California, on the 27th day of June 2017.
| TINTRI, INC. | ||
| By: | /S/ KEN KLEIN | |
| Ken Klein | ||
| Chairman and Chief Executive Officer | ||
Pursuant to the requirements of the Securities Act of 1933, this registration statement on Form S-1 has been signed by the following persons in the capacities and on the dates indicated.
| Signature |
Title |
Date | ||
| /S/ KEN KLEIN Ken Klein |
Chairman and Chief Executive Officer (Principal Executive Officer) | June 27, 2017 | ||
| /S/ IAN HALIFAX Ian Halifax |
Chief Financial Officer (Principal Accounting and Financial Officer) | June 27, 2017 | ||
| * John Bolger |
Director | June 27, 2017 | ||
| * Charles Giancarlo |
Director | June 27, 2017 | ||
| * Adam Grosser |
Director | June 27, 2017 | ||
| * Kieran Harty |
Director | June 27, 2017 | ||
| * Harvey Jones |
Director | June 27, 2017 | ||
| * Christopher Schaepe |
Director | June 27, 2017 | ||
| * Peter Sonsini |
Director | June 27, 2017 | ||
| *By: | /S/ KEN KLEIN | |
| Ken Klein | ||
| Attorney-in-Fact | ||
II-4
Table of Contents
EXHIBIT INDEX
| Exhibit Number |
Description | |
| 1.1* | Form of Underwriting Agreement | |
| 3.1* | Amended and Restated Certificate of Incorporation of the Registrant, as currently in effect | |
| 3.2* | Form of Amended and Restated Certificate of Incorporation of the Registrant, to be in effect upon the completion of this offering | |
| 3.3* | Bylaws of the Registrant, as currently in effect | |
| 3.4* | Form of Amended and Restated Bylaws of the Registrant, to be in effect upon the completion of this offering | |
| 4.1* | Amended and Restated Investors’ Rights Agreement dated as of July 24, 2015, between the Registrant and the other parties thereto | |
| 4.2* | Plain English Warrant Agreement between the Registrant and TriplePoint Capital LLC, dated February 6, 2015 | |
| 4.3* | Warrant to purchase common stock issued by the Registrant to Silicon Valley Bank, dated May 14, 2013 | |
| 4.4* | Specimen common stock certificate of the Registrant | |
| 4.5* | Plain English Warrant Agreement between the Registrant and TriplePoint Capital LLC, dated February 24, 2017 | |
| 4.6* | Form of Warrant to purchase common stock issued by the Registrant dated June 1, 2017 | |
| 5.1* | Opinion of Wilson Sonsini Goodrich & Rosati, Professional Corporation | |
| 10.1* | Form of Indemnification Agreement between the Registrant and each of its directors and executive officers, to be in effect upon the completion of this offering | |
| 10.2+* | CEO Employment Agreement between the Registrant and Ken Klein, dated October 4, 2013 | |
| 10.3+* | Offer Letter between the Registrant and Ian Halifax, dated November 25, 2013, as amended | |
| 10.4+* | Offer Letter between the Registrant and Michael McGuire, dated February 26, 2015 | |
| 10.5+* | Executive Change of Control and Severance Policy | |
| 10.6+* | 2017 Equity Incentive Plan and forms of awards agreements thereunder | |
| 10.7+* | 2017 Employee Stock Purchase Plan | |
| 10.8+* | 2008 Stock Plan, as amended, and forms of award agreements thereunder | |
| 10.9+* | Executive Incentive Compensation Plan | |
| 10.10* | Lease Agreement between the Registrant and Ravendale Partners, LLC, dated March 28, 2014, as amended | |
| 10.11†* | Flextronics Infrastructure Manufacturing Services Agreement between the Registrant and Flextronics Telecom Systems Ltd., dated December 22, 2014 | |
| 10.12 | Plain English Growth Capital Loan and Security Agreement between the Registrant and TriplePoint Capital LLC, dated February 6, 2015, as amended | |
| 10.13 | Loan and Security Agreement between the Registrant and Silicon Valley Bank, dated May 14, 2013, as amended | |
| 10.14+* | Confirmatory Employment Letter between the Registrant and Kieran Harty, dated June 14, 2017 | |
| 10.15* | Omnibus Amendment dated June 1, 2017 between the Registrant and the other parties thereto | |
| 21.1* | List of subsidiaries of the Registrant | |
| 23.1 | Consent of KPMG LLP, Independent Registered Public Accounting Firm | |
| 23.2* | Consent of Wilson Sonsini Goodrich & Rosati, P.C. (included in Exhibit 5.1) | |
| 24.1* | Power of Attorney | |
| * | Previously filed. |
| + | Indicates a management contract or compensatory plan or arrangement. |
| † | Confidential treatment has been requested for portions of this exhibit. These portions have been omitted and have been filed separately with the Securities and Exchange Commission. |