Attached files
| file | filename |
|---|---|
| EX-99.1 - EX-99.1 - National Bank Holdings Corp | ex-99d1.htm |
| 8-K - 8-K - National Bank Holdings Corp | f8-k.htm |
Exhibit 99.2
|
|
National Bank Holdings Corporation Acquisition of Peoples, Inc. June 26, 2017 Investor Presentation Tim Laney Chairman & Chief Executive Officer Brian Lilly Chief Financial Officer, Chief of M&A and Strategy |
|
|
This presentation contains “forward-looking statements” within the meaning of the Private Securities Litigation Reform Act of 1995. Forward-looking statements contain words such as “anticipate,” “believe,” “can,” “would,” “should,” “could,” “may,” “predict,” “seek,” “potential,” “will,” “estimate,” “target,” “plan,” “project,” “continuing,” “ongoing,” “expect,” “intend” or similar expressions that relate to the Company’s strategy, plans or intentions. Forward-looking statements involve certain important risks, uncertainties and other factors, any of which could cause actual results to differ materially from those in such statements. Such factors include, without limitation, the “Risk Factors” referenced in our most recent Form 10-K filed with the Securities and Exchange Commission (SEC), other risks and uncertainties listed from time to time in our reports and documents filed with the SEC, and the following factors: ability to obtain regulatory approvals and meet other closing conditions to the merger on the expected terms and schedule; delay in closing the merger; difficulties and delays in integrating the NBHC and Peoples businesses or fully realizing cost savings and other benefits; business disruption following the proposed transaction; ability to execute our business strategy; business and economic conditions; economic, market, operational, liquidity, credit and interest rate risks associated with the Company’s business; effects of any changes in trade, monetary and fiscal policies and laws; changes imposed by regulatory agencies to increase capital standards; effects of inflation, as well as interest rate, securities market and monetary supply fluctuations; changes in the economy or supply-demand imbalances affecting local real estate values; changes in consumer spending, borrowings and savings habits; the Company’s ability to identify potential candidates for, consummate, integrate and realize operating efficiencies from, acquisitions or consolidations; the Company's ability to realize anticipated benefits from enhancements or updates to its core operating systems from time to time without significant change in client service or risk to the Company's control environment; the Company's dependence on information technology and telecommunications systems of third party service providers and the risk of systems failures, interruptions or breaches of security; the Company’s ability to achieve organic loan and deposit growth and the composition of such growth; changes in sources and uses of funds; increased competition in the financial services industry; the effect of changes in accounting policies and practices; the share price of the Company’s stock; the Company's ability to realize deferred tax assets or the need for a valuation allowance; continued consolidation in the financial services industry; ability to maintain or increase market share and control expenses; costs and effects of changes in laws and regulations and of other legal and regulatory developments; technological changes; the timely development and acceptance of new products and services; the Company’s continued ability to attract and maintain qualified personnel; ability to implement and/or improve operational management and other internal risk controls and processes and reporting system and procedures; regulatory limitations on dividends from the Company’s bank subsidiary; changes in estimates of future loan reserve requirements based upon the periodic review thereof under relevant regulatory and accounting requirements; widespread natural and other disasters, dislocations, political instability, acts of war or terrorist activities, cyberattacks or international hostilities; impact of reputational risk; and success at managing the risks involved in the foregoing items. The Company can give no assurance that any goal or plan or expectation set forth in forward-looking statements can be achieved and readers are cautioned not to place undue reliance on such statements. The forward-looking statements are made as of the date of this presentation, and the Company does not intend, and assumes no obligation, to update any forward-looking statement to reflect events or circumstances after the date on which the statement is made or to reflect the occurrence of unanticipated events or circumstances, except as required by applicable law. Forward-Looking Statements |
|
|
About Non-GAAP Financial Measures Certain of the financial measures and ratios we present, including “tangible book value” and “tangible book value per share” metrics, are supplemental measures that are not required by, or are not presented in accordance with, U.S. generally accepted accounting principles (GAAP). We refer to these financial measures and ratios as “non-GAAP financial measures.” We consider the use of select non-GAAP financial measures and ratios to be useful for financial and operational decision making and useful in evaluating period-to-period comparisons. We believe that these non-GAAP financial measures provide meaningful supplemental information regarding our performance by excluding certain expenditures or assets that we believe are not indicative of our primary business operating results or by presenting certain metrics on a fully taxable equivalent basis. We believe that management and investors benefit from referring to these non-GAAP financial measures in assessing our performance and when planning, forecasting, analyzing and comparing past, present and future periods. These non-GAAP financial measures should not be considered a substitute for financial information presented in accordance with GAAP and you should not rely on non-GAAP financial measures alone as measures of our performance. The non-GAAP financial measures we present may differ from non-GAAP financial measures used by our peers or other companies. We compensate for these limitations by providing the equivalent GAAP measures whenever we present the non-GAAP financial measures and by including a reconciliation of the impact of the components adjusted for in the non-GAAP financial measure so that both measures and the individual components may be considered when analyzing our performance. The Company does not provide a reconciliation of forward-looking non-GAAP financial measures to its comparable GAAP financial measures because it could not do so without unreasonable effort due to the unavailability of the information needed to calculate reconciling items and the variability, complexity and limited visibility of the adjusting items that would be excluded from the non-GAAP financial measures in future periods. When planning, forecasting and analyzing future periods, the Company does so primarily on a non-GAAP basis without preparing a GAAP analysis as that would require estimates for various cash and non-cash reconciling items (including items such as expected credit losses, stock-based compensation, acquisition- and disposition-related expenses, and restructuring costs) that would be difficult to predict with reasonable accuracy. For example, future expectations for credit losses depend on a variety of factors including general economic conditions that make estimation on a GAAP basis impractical. Similarly, equity compensation expense would be difficult to estimate because it depends on the Company’s future hiring and retention needs, as well as the future fair market value of the Company’s common stock, all of which are difficult to predict and subject to constant change. It is also difficult to anticipate the need for or magnitude of a presently unforeseen one-time restructuring expenses. As a result, the Company does not believe that a GAAP reconciliation to forward-looking non-GAAP financial measures would provide meaningful supplemental information about the Company’s forward-looking measures. |
|
|
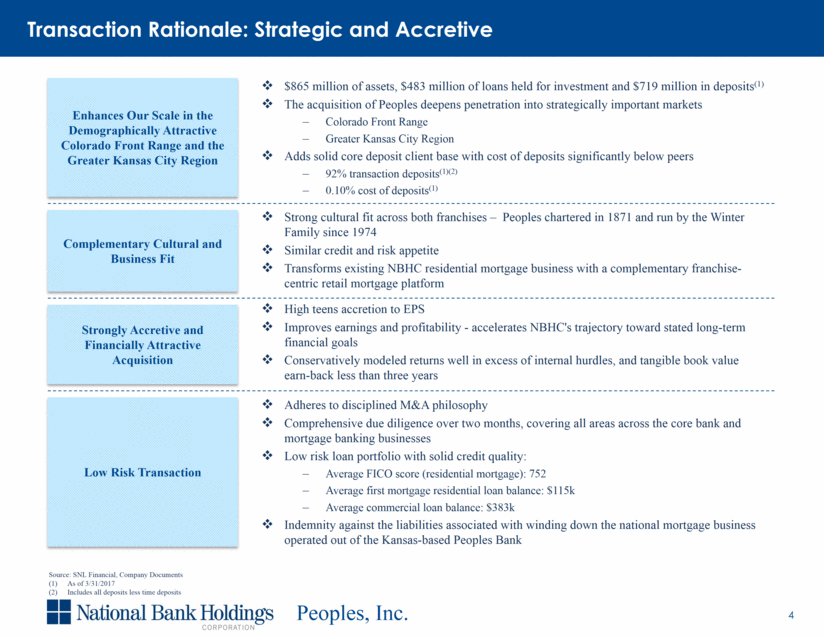
$865 million of assets, $483 million of loans held for investment and $719 million in deposits(1) The acquisition of Peoples deepens penetration into strategically important markets Colorado Front Range Greater Kansas City Region Adds solid core deposit client base with cost of deposits significantly below peers 92% transaction deposits(1)(2) 0.10% cost of deposits(1) Enhances Our Scale in the Demographically Attractive Colorado Front Range and the Greater Kansas City Region Strong cultural fit across both franchises – Peoples chartered in 1871 and run by the Winter Family since 1974 Similar credit and risk appetite Transforms existing NBHC residential mortgage business with a complementary franchise-centric retail mortgage platform Complementary Cultural and Business Fit High teens accretion to EPS Improves earnings and profitability - accelerates NBHC's trajectory toward stated long-term financial goals Conservatively modeled returns well in excess of internal hurdles, and tangible book value earn-back less than three years Strongly Accretive and Financially Attractive Acquisition Adheres to disciplined M&A philosophy Comprehensive due diligence over two months, covering all areas across the core bank and mortgage banking businesses Low risk loan portfolio with solid credit quality: Average FICO score (residential mortgage): 752 Average first mortgage residential loan balance: $115k Average commercial loan balance: $383k Indemnity against the liabilities associated with winding down the national mortgage business operated out of the Kansas-based Peoples Bank Low Risk Transaction Source: SNL Financial, Company Documents As of 3/31/2017 Includes all deposits less time deposits Transaction Rationale: Strategic and Accretive |
|
|
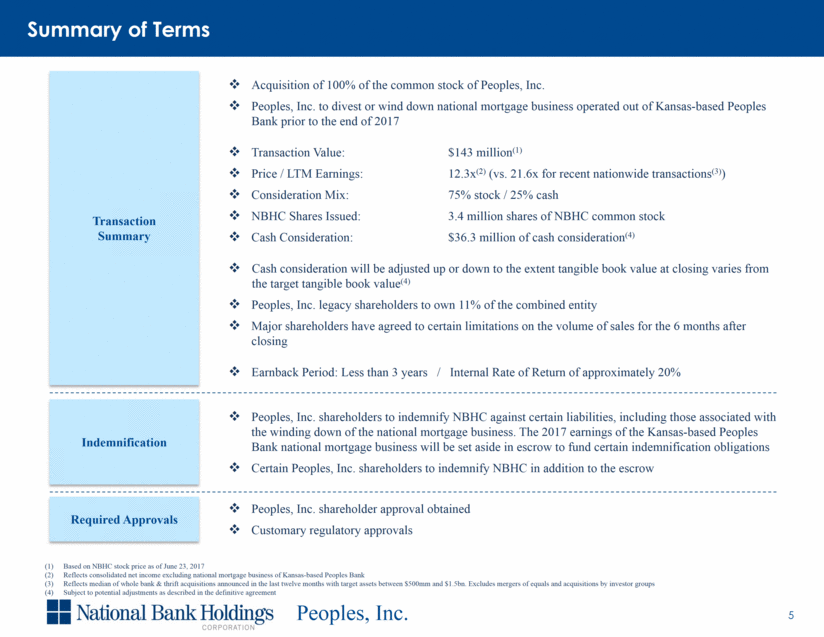
Acquisition of 100% of the common stock of Peoples, Inc. Peoples, Inc. to divest or wind down national mortgage business operated out of Kansas-based Peoples Bank prior to the end of 2017 Transaction Value: $143 million(1) Price / LTM Earnings: 12.3x(2) (vs. 21.6x for recent nationwide transactions(3)) Consideration Mix: 75% stock / 25% cash NBHC Shares Issued: 3.4 million shares of NBHC common stock Cash Consideration: $36.3 million of cash consideration(4) Cash consideration will be adjusted up or down to the extent tangible book value at closing varies from the target tangible book value(4) Peoples, Inc. legacy shareholders to own 11% of the combined entity Major shareholders have agreed to certain limitations on the volume of sales for the 6 months after closing Earnback Period: Less than 3 years / Internal Rate of Return of approximately 20% Peoples, Inc. shareholders to indemnify NBHC against certain liabilities, including those associated with the winding down of the national mortgage business. The 2017 earnings of the Kansas-based Peoples Bank national mortgage business will be set aside in escrow to fund certain indemnification obligations Certain Peoples, Inc. shareholders to indemnify NBHC in addition to the escrow Peoples, Inc. shareholder approval obtained Customary regulatory approvals Transaction Summary Indemnification Required Approvals Summary of Terms Based on NBHC stock price as of June 23, 2017 Reflects consolidated net income excluding national mortgage business of Kansas-based Peoples Bank Reflects median of whole bank & thrift acquisitions announced in the last twelve months with target assets between $500mm and $1.5bn. Excludes mergers of equals and acquisitions by investor groups Subject to potential adjustments as described in the definitive agreement |
|
|
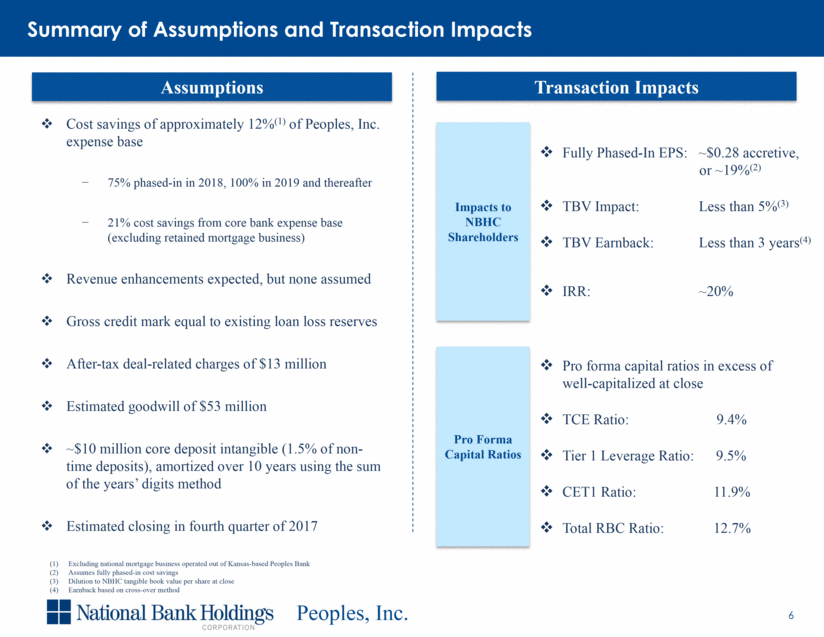
Cost savings of approximately 12%(1) of Peoples, Inc. expense base 75% phased-in in 2018, 100% in 2019 and thereafter 21% cost savings from core bank expense base (excluding retained mortgage business) Revenue enhancements expected, but none assumed Gross credit mark equal to existing loan loss reserves After-tax deal-related charges of $13 million Estimated goodwill of $53 million ~$10 million core deposit intangible (1.5% of non-time deposits), amortized over 10 years using the sum of the years’ digits method Estimated closing in fourth quarter of 2017 Impacts to NBHC Shareholders Pro Forma Capital Ratios Pro forma capital ratios in excess of well-capitalized at close TCE Ratio: 9.4% Tier 1 Leverage Ratio: 9.5% CET1 Ratio: 11.9% Total RBC Ratio: 12.7% Fully Phased-In EPS: ~$0.28 accretive, or ~19%(2) TBV Impact: Less than 5%(3) TBV Earnback: Less than 3 years(4) IRR: ~20% Excluding national mortgage business operated out of Kansas-based Peoples Bank Assumes fully phased-in cost savings Dilution to NBHC tangible book value per share at close Earnback based on cross-over method Summary of Assumptions and Transaction Impacts Assumptions Transaction Impacts |
|
|
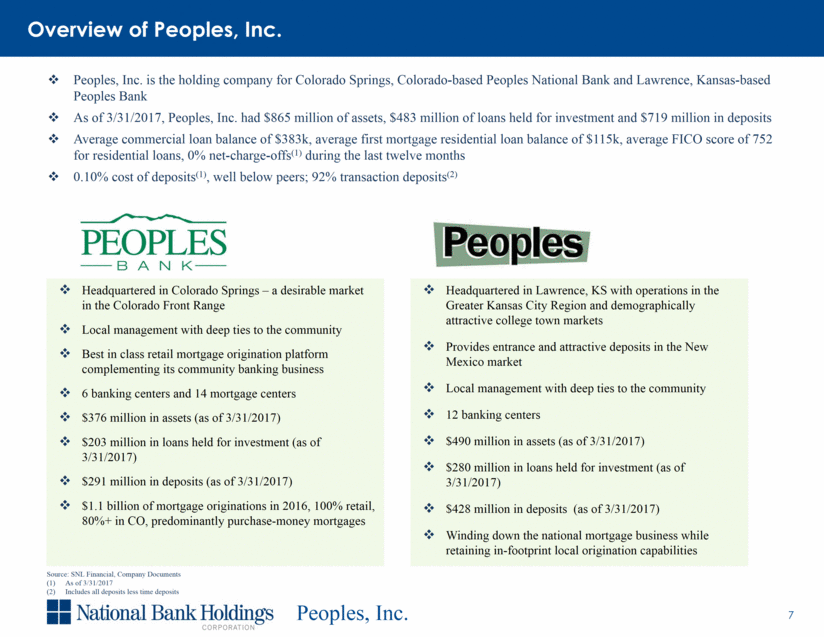
Peoples, Inc. is the holding company for Colorado Springs, Colorado-based Peoples National Bank and Lawrence, Kansas-based Peoples Bank As of 3/31/2017, Peoples, Inc. had $865 million of assets, $483 million of loans held for investment and $719 million in deposits Average commercial loan balance of $383k, average first mortgage residential loan balance of $115k, average FICO score of 752 for residential loans, 0% net-charge-offs(1) during the last twelve months 0.10% cost of deposits(1), well below peers; 92% transaction deposits(2) Headquartered in Lawrence, KS with operations in the Greater Kansas City Region and demographically attractive college town markets Provides entrance and attractive deposits in the New Mexico market Local management with deep ties to the community 12 banking centers $490 million in assets (as of 3/31/2017) $280 million in loans held for investment (as of 3/31/2017) $428 million in deposits (as of 3/31/2017) Winding down the national mortgage business while retaining in-footprint local origination capabilities Headquartered in Colorado Springs – a desirable market in the Colorado Front Range Local management with deep ties to the community Best in class retail mortgage origination platform complementing its community banking business 6 banking centers and 14 mortgage centers $376 million in assets (as of 3/31/2017) $203 million in loans held for investment (as of 3/31/2017) $291 million in deposits (as of 3/31/2017) $1.1 billion of mortgage originations in 2016, 100% retail, 80%+ in CO, predominantly purchase-money mortgages Source: SNL Financial, Company Documents As of 3/31/2017 Includes all deposits less time deposits Overview of Peoples, Inc. |
|
|
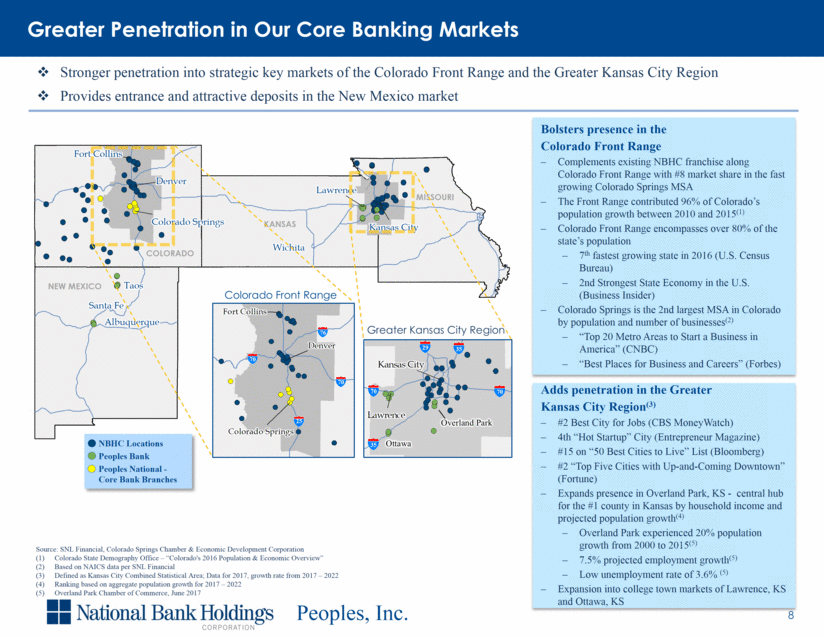
Bolsters presence in the Colorado Front Range Complements existing NBHC franchise along Colorado Front Range with #8 market share in the fast growing Colorado Springs MSA The Front Range contributed 96% of Colorado’s population growth between 2010 and 2015(1) Colorado Front Range encompasses over 80% of the state’s population 7th fastest growing state in 2016 (U.S. Census Bureau) 2nd Strongest State Economy in the U.S. (Business Insider) Colorado Springs is the 2nd largest MSA in Colorado by population and number of businesses(2) “Top 20 Metro Areas to Start a Business in America” (CNBC) “Best Places for Business and Careers” (Forbes) Adds penetration in the Greater Kansas City Region(3) #2 Best City for Jobs (CBS MoneyWatch) 4th “Hot Startup” City (Entrepreneur Magazine) #15 on “50 Best Cities to Live” List (Bloomberg) #2 “Top Five Cities with Up-and-Coming Downtown” (Fortune) Expands presence in Overland Park, KS - central hub for the #1 county in Kansas by household income and projected population growth(4) Overland Park experienced 20% population growth from 2000 to 2015(5) 7.5% projected employment growth(5) Low unemployment rate of 3.6% (5) Expansion into college town markets of Lawrence, KS and Ottawa, KS Greater Penetration in Our Core Banking Markets Stronger penetration into strategic key markets of the Colorado Front Range and the Greater Kansas City Region Provides entrance and attractive deposits in the New Mexico market Source: SNL Financial, Colorado Springs Chamber & Economic Development Corporation Colorado State Demography Office – “Colorado's 2016 Population & Economic Overview” Based on NAICS data per SNL Financial Defined as Kansas City Combined Statistical Area; Data for 2017, growth rate from 2017 – 2022 Ranking based on aggregate population growth for 2017 – 2022 Overland Park Chamber of Commerce, June 2017 70 70 25 40 35 76 44 Denver Colorado Springs Wichita Lawrence Albuquerque Santa Fe Kansas City Fort Collins Taos COLORADO KANSAS MISSOURI NEW MEXICO NBHC Locations Peoples Bank Peoples National - Core Bank Branches 70 35 70 35 29 Colorado Front Range Greater Kansas City Region 70 25 70 76 Ottawa Overland Park |
|
|
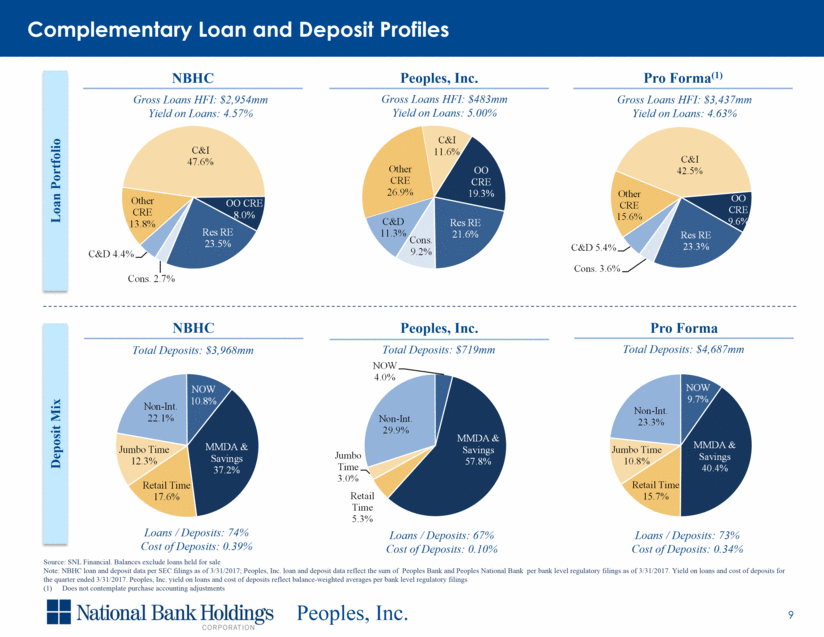
Loan Portfolio Deposit Mix Peoples, Inc. NBHC Pro Forma(1) Peoples, Inc. NBHC Pro Forma Gross Loans HFI: $2,954mm Yield on Loans: 4.57% Total Deposits: $3,968mm Gross Loans HFI: $483mm Yield on Loans: 5.00% Gross Loans HFI: $3,437mm Yield on Loans: 4.63% Total Deposits: $4,687mm Total Deposits: $719mm Source: SNL Financial. Balances exclude loans held for sale Note: NBHC loan and deposit data per SEC filings as of 3/31/2017; Peoples, Inc. loan and deposit data reflect the sum of Peoples Bank and Peoples National Bank per bank level regulatory filings as of 3/31/2017. Yield on loans and cost of deposits for the quarter ended 3/31/2017. Peoples, Inc. yield on loans and cost of deposits reflect balance-weighted averages per bank level regulatory filings Does not contemplate purchase accounting adjustments Loans / Deposits: 74% Cost of Deposits: 0.39% Loans / Deposits: 67% Cost of Deposits: 0.10% Loans / Deposits: 73% Cost of Deposits: 0.34% Complementary Loan and Deposit Profiles Non - Int. 23.3% NOW 9.7% MMDA & Savings 40.4% Retail Time 15.7% Jumbo Time 10.8% C&I 42.5% OO CRE 9.6% Res RE 23.3% Cons. 3.6% C&D 5.4% Other CRE 15.6% C&I 11.6% OO CRE 19.3% Res RE 21.6% Cons. 9.2% C&D 11.3% Other CRE 26.9% Non - Int. 29.9% NOW 4.0% MMDA & Savings 57.8% Retail Time 5.3% Jumbo Time 3.0% C&I 47.6% OO CRE 8.0% Res RE 23.5% Cons. 2.7% C&D 4.4% Other CRE 13.8% Non - Int. 22.1% NOW 10.8% MMDA & Savings 37.2% Retail Time 17.6% Jumbo Time 12.3% |
|
|
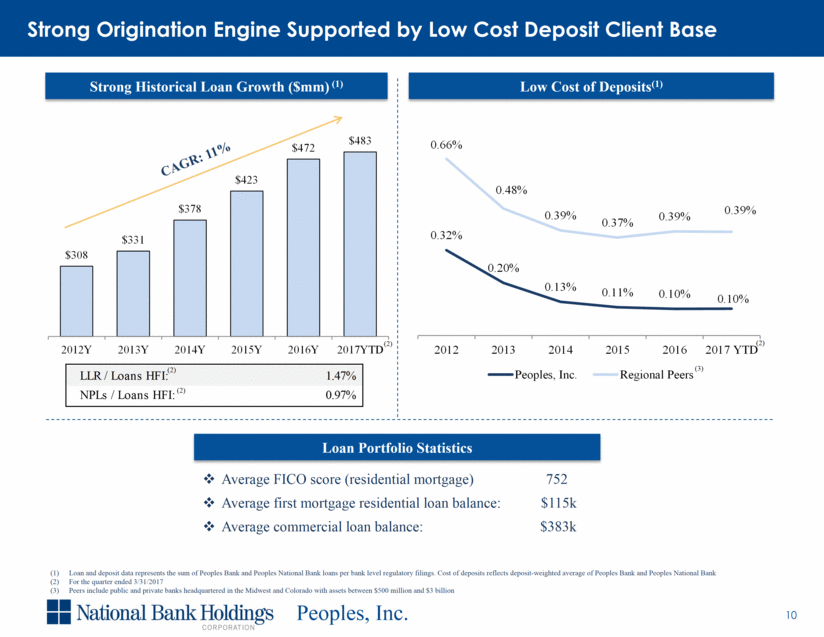
Loan and deposit data represents the sum of Peoples Bank and Peoples National Bank loans per bank level regulatory filings. Cost of deposits reflects deposit-weighted average of Peoples Bank and Peoples National Bank For the quarter ended 3/31/2017 Peers include public and private banks headquartered in the Midwest and Colorado with assets between $500 million and $3 billion CAGR: 11% (3) (2) (2) Average FICO score (residential mortgage) 752 Average first mortgage residential loan balance: $115k Average commercial loan balance: $383k Strong Origination Engine Supported by Low Cost Deposit Client Base Strong Historical Loan Growth ($mm) (1) Low Cost of Deposits(1) Loan Portfolio Statistics (2) (2) 0.32% 0.20% 0.13% 0.11% 0.10% 0.10% 0.66% 0.48% 0.39% 0.37% 0.39% 0.39% 2012 2013 2014 2015 2016 2017 YTD Peoples, Inc. Regional Peers $308 $331 $378 $423 $472 $483 2012Y 2013Y 2014Y 2015Y 2016Y 2017YTD LLR / Loans HFI: 1.47% NPLs / Loans HFI: 0.97% |
|
|
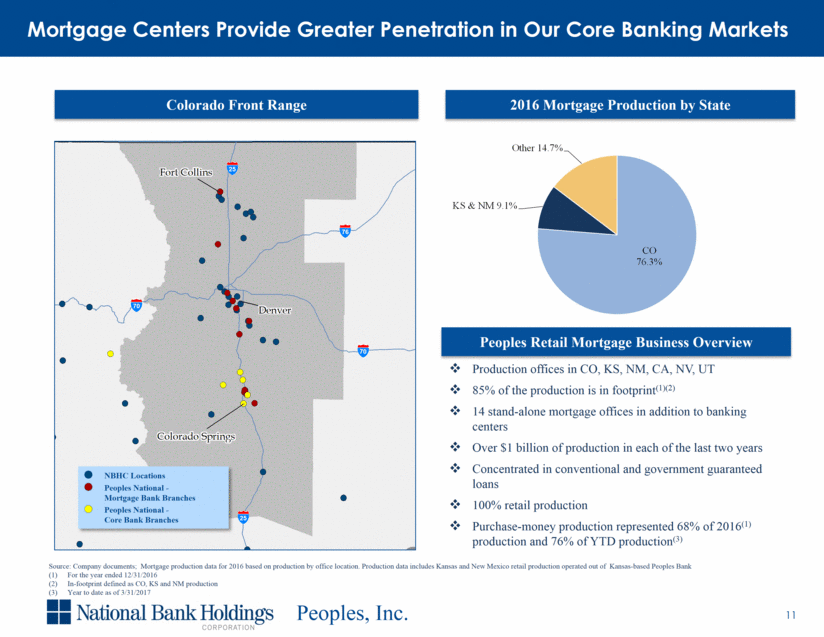
Source: Company documents; Mortgage production data for 2016 based on production by office location. Production data includes Kansas and New Mexico retail production operated out of Kansas-based Peoples Bank For the year ended 12/31/2016 In-footprint defined as CO, KS and NM production Year to date as of 3/31/2017 25 70 70 76 25 NBHC Locations Peoples National - Mortgage Bank Branches Peoples National - Core Bank Branches Mortgage Centers Provide Greater Penetration in Our Core Banking Markets Colorado Front Range 2016 Mortgage Production by State Peoples Retail Mortgage Business Overview Production offices in CO, KS, NM, CA, NV, UT 85% of the production is in footprint(1)(2) 14 stand-alone mortgage offices in addition to banking centers Over $1 billion of production in each of the last two years Concentrated in conventional and government guaranteed loans 100% retail production Purchase-money production represented 68% of 2016(1) production and 76% of YTD production(3) CO Denver Denver Denver Denver Denver Denver Denver Denver Denver Denver Denver Denver Denver Denver Denver Denver Denver Denver Denver Denver Denver Denver Denver Denver Denver Denver Denver Denver Denver Denver Denver Denver Denver Denver Denver Denver Denver Denver Denver Denver Denver Denver Denver Denver Denver Denver Denver Denver Denver Fort Collins Fort Collins Fort Collins Fort Collins Fort Collins Fort Collins Fort Collins Fort Collins Fort Collins Fort Collins Fort Collins Fort Collins Fort Collins Fort Collins Fort Collins Fort Collins Fort Collins Fort Collins Fort Collins Fort Collins Fort Collins Fort Collins Fort Collins Fort Collins Fort Collins Fort Collins Fort Collins Fort Collins Fort Collins Fort Collins Fort Collins Fort Collins Fort Collins Fort Collins Fort Collins Fort Collins Fort Collins Fort Collins Fort Collins Fort Collins Fort Collins Fort Collins Fort Collins Fort Collins Fort Collins Fort Collins Fort Collins Fort Collins Fort Collins Colorado Springs Colorado Springs Colorado Springs Colorado Springs Colorado Springs Colorado Springs Colorado Springs Colorado Springs Colorado Springs Colorado Springs Colorado Springs Colorado Springs Colorado Springs Colorado Springs Colorado Springs Colorado Springs Colorado Springs Colorado Springs Colorado Springs Colorado Springs Colorado Springs Colorado Springs Colorado Springs Colorado Springs Colorado Springs Colorado Springs Colorado Springs Colorado Springs Colorado Springs Colorado Springs Colorado Springs Colorado Springs Colorado Springs Colorado Springs Colorado Springs Colorado Springs Colorado Springs Colorado Springs Colorado Springs Colorado Springs Colorado Springs Colorado Springs Colorado Springs Colorado Springs Colorado Springs Colorado Springs Colorado Springs Colorado Springs Colorado Springs CO 76.3% KS & NM 9.1% Other 14.7% |
|
|
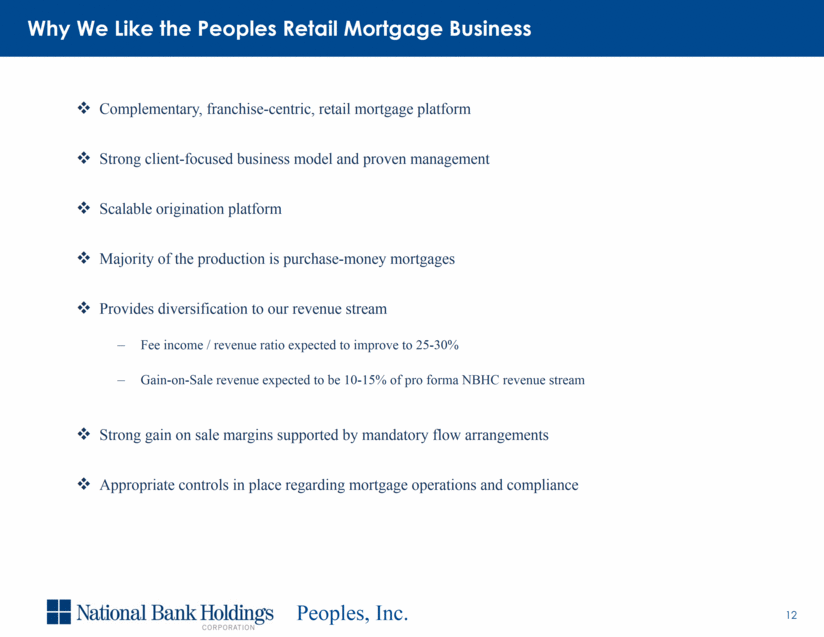
Complementary, franchise-centric, retail mortgage platform Strong client-focused business model and proven management Scalable origination platform Majority of the production is purchase-money mortgages Provides diversification to our revenue stream Fee income / revenue ratio expected to improve to 25-30% Gain-on-Sale revenue expected to be 10-15% of pro forma NBHC revenue stream Strong gain on sale margins supported by mandatory flow arrangements Appropriate controls in place regarding mortgage operations and compliance Why We Like the Peoples Retail Mortgage Business |
|
|
Comprehensive due diligence encompassing all areas of Peoples, Inc. over a two-month period Due diligence covered bank and mortgage risk areas, in addition to business strategies, clients, associates and culture All senior executives from across both organizations involved in the due diligence process Detailed credit due diligence encompassing over 50% of the outstanding commercial portfolio and 100% of all NPAs and OREO Review of Peoples, Inc. mortgage business by Clayton Consulting (an operating unit of Clayton Holdings LLC), with Buckley Sandler providing legal analysis in conjunction with select items Comprehensive Due Diligence Completed |
|
|
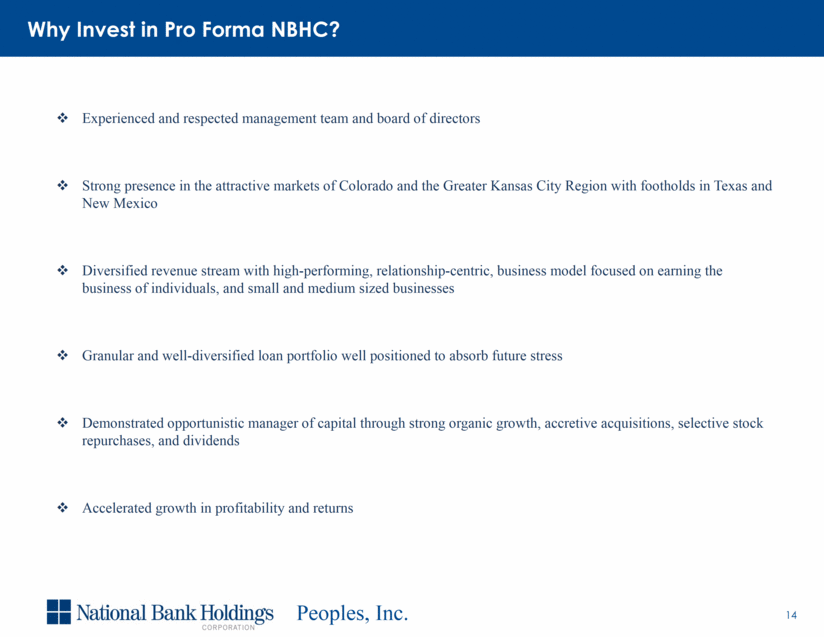
Experienced and respected management team and board of directors Strong presence in the attractive markets of Colorado and the Greater Kansas City Region with footholds in Texas and New Mexico Diversified revenue stream with high-performing, relationship-centric, business model focused on earning the business of individuals, and small and medium sized businesses Granular and well-diversified loan portfolio well positioned to absorb future stress Demonstrated opportunistic manager of capital through strong organic growth, accretive acquisitions, selective stock repurchases, and dividends Accelerated growth in profitability and returns Why Invest in Pro Forma NBHC? |
|
|
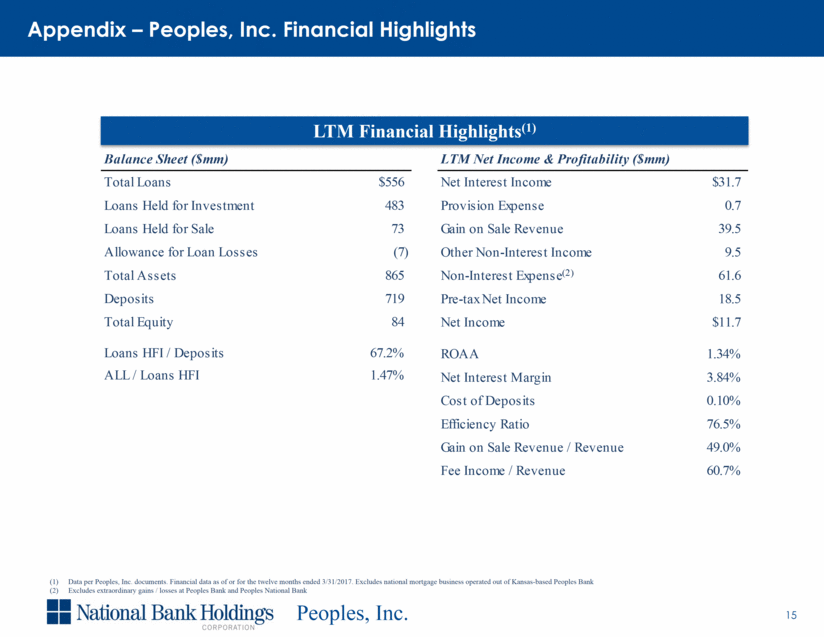
Appendix – Peoples, Inc. Financial Highlights LTM Financial Highlights(1) Data per Peoples, Inc. documents. Financial data as of or for the twelve months ended 3/31/2017. Excludes national mortgage business operated out of Kansas-based Peoples Bank Excludes extraordinary gains / losses at Peoples Bank and Peoples National Bank Balance Sheet ($mm) Total Loans $556 Loans Held for Investment 483 Loans Held for Sale 73 Allowance for Loan Losses (7) Total Assets 865 Deposits 719 Total Equity 84 Loans HFI / Deposits 67.2% ALL / Loans HFI 1.47% LTM Net Income & Profitability ($mm) Net Interest Income $31.7 Provision Expense 0.7 Gain on Sale Revenue 39.5 Other Non-Interest Income 9.5 Non-Interest Expense 61.6 Pre-tax Net Income 18.5 Net Income $11.7 ROAA 1.34% Net Interest Margin 3.84% Cost of Deposits 0.10% Efficiency Ratio 76.5% Gain on Sale Revenue / Revenue 49.0% Fee Income / Revenue 60.7% (2) |

