Attached files
| file | filename |
|---|---|
| 8-K - FORM 8-K - Macquarie Leasing Pty Ltd | d387635d8k.htm |
Exhibit 99.1

|
Australia and New Zealand Banking Group Limited
ABN 11 005 357 522
Half Year
31 March 2017
Consolidated Financial Report
Dividend Announcement
and Appendix 4D
|
|
The Consolidated Financial Report and Dividend Announcement contains information required by Appendix 4D of the Australian Securities Exchange (ASX) Listing Rules. It should be read in conjunction with ANZ’s 2016 Annual Report, and is lodged with the ASX under listing rule 4.2A.
|
| RESULTS FOR ANNOUNCEMENT TO THE MARKET | APPENDIX 4D |
| Name of Company: | Australia and New Zealand Banking Group Limited | |
| ABN 11 005 357 522 |
|
Report for the half year ended 31 March 2017
|
||||||||||
| Operating Results1 | AUD million | |||||||||
| Operating income |
ò | -3% | to | 9,996 | ||||||
| Net statutory profit attributable to shareholders |
ñ | 6% | to | 2,911 | ||||||
| Cash profit2 |
ñ | 23% | to | 3,411 | ||||||
| Dividends3 | Cents
per
share |
Franked
amount4
per share |
||||||||
| Proposed interim dividend |
80 | 100% | ||||||||
| Record date for determining entitlements to the proposed 2017 interim dividend |
9 May 2017 | |||||||||
| Payment date for the proposed 2017 interim dividend
|
|
3 July 2017
|
| |||||||
Dividend Reinvestment Plan and Bonus Option Plan
Australia and New Zealand Banking Group Limited (ANZ) has a Dividend Reinvestment Plan (DRP) and a Bonus Option Plan (BOP) that will operate in respect of the proposed 2017 interim dividend. For the 2017 interim dividend, ANZ intends to neutralise shares issued under the DRP by acquiring an equivalent number of shares on market (as approved by APRA). The ‘Acquisition Price’ to be used in determining the number of shares to be provided under the DRP and BOP will be calculated by reference to the arithmetic average of the daily volume weighted average sale price of all fully paid ANZ ordinary shares sold in the ordinary course of trading on the ASX during the ten trading days commencing on 12 May 2017, and then rounded to the nearest whole cent. Shares provided under the DRP and BOP will rank equally in all respects with existing fully paid ANZ ordinary shares. Election notices from shareholders wanting to commence, cease or vary their participation in the DRP or BOP for the 2017 interim dividend must be received by ANZ’s Share Registrar by 5.00pm (Australian Eastern Standard Time) on 10 May 2017. Subject to receiving effective contrary instructions from the shareholder, dividends payable to shareholders with a registered address in the United Kingdom (including the Channel Islands and the Isle of Man) or New Zealand will be converted to Pounds Sterling or New Zealand Dollars respectively at an exchange rate calculated on 12 May 2017.
| 1 | Unless otherwise noted, all comparisons are to the half year ended 31 March 2016. |
| 2 | Cash profit excludes non-core items included in statutory profit and is provided to assist readers in understanding the result of the ongoing business activities of the Group. The non-core items are calculated consistently period on period so as not to discriminate between positive and negative adjustments and fall into one of the three categories: gains or losses included in earnings arising from changes in tax, legal or accounting legislation or other non-core items not associated with the ongoing operations of the Group; treasury shares, revaluation of policy liabilities, economic hedging and similar accounting items that represent timing differences that will reverse through earnings in the future; and accounting reclassifications between individual line items that do not impact reported results, such as policyholders tax gross up. Cash profit is not a measure of cash flow or profit determined on a cash basis. The net after tax adjustment was an addition to statutory profit of $500 million made up of several items. Refer pages 67 to 71 for further details. |
| 3 | There is no conduit foreign income attributed to the dividends. |
| 4 | It is proposed that the interim dividend will be fully franked for Australian tax purposes (30% tax rate) and carry New Zealand imputation credits of NZD 9 cents per ordinary share. |
2
| AUSTRALIA AND NEW ZEALAND BANKING GROUP LIMITED | ABN 11 005 357 522 |
CONSOLIDATED FINANCIAL REPORT, DIVIDEND ANNOUNCEMENT AND APPENDIX 4D
Half year ended 31 March 2017
|
CONTENTS
|
PAGE | |||
| Disclosure Summary |
5 | |||
| Summary |
7 | |||
| Group Results |
17 | |||
| Divisional Results |
43 | |||
| Profit Reconciliation |
67 | |||
| Condensed Consolidated Financial Statements |
73 | |||
| Supplementary Information |
105 | |||
| Definitions |
117 | |||
| ASX Appendix 4D Cross Reference Index |
120 | |||
| Alphabetical Index |
121 | |||
|
|
||||
This Consolidated Financial Report, Dividend Announcement and Appendix 4D has been prepared for Australia and New Zealand Banking Group Limited (the “Company” or “Parent Entity”) together with its subsidiaries which are variously described as “ANZ”, “Group”, “ANZ Group”, “the consolidated entity”, “the Bank”, “us”, “we” or “our”.
All amounts are in Australian dollars unless otherwise stated. The information on which the Condensed Consolidated Financial Statements are based have been reviewed by the Group’s auditors, KPMG. The Company has a formally constituted Audit Committee of the Board of Directors. The signing of the Condensed Consolidated Financial Statements was approved by resolution of a Committee of the Board of Directors on 1 May 2017.
When used in this Results Announcement the words “estimate”, “project”, “intend”, “anticipate”, “believe”, “expect”, “should” and similar expressions, as they relate to ANZ and its management, are intended to identify forward-looking statements. Readers are cautioned not to place undue reliance on these forward-looking statements, which speak only as of the date hereof. ANZ does not undertake any obligation to publicly release the result of any revisions to these forward-looking statements to reflect events or circumstances after the date hereof or to reflect the occurrence of unanticipated events.
3
| AUSTRALIA AND NEW ZEALAND BANKING GROUP LIMITED | ABN 11 005 357 522 |
This page has been left blank intentionally
4
DISCLOSURE SUMMARY
SUMMARY OF 2017 HALF YEAR RESULTS AND ASSOCIATED DISCLOSURE MATERIALS
The following disclosure items were lodged separately with the ASX and NZX and can be accessed via the ANZ Shareholder Centre on the Group website http://www.shareholder.anz.com/ within the disclosures for 2017 Half Year Financial Results.
| • | Consolidated Financial Report, Dividend Announcement & Appendix 4D |
| • | Results Presentation Pack |
| • | Investor Discussion Pack |
| • | News Release |
| • | APS 330 Pillar III Disclosure at 31 March 2017 |
| • | Key Financial Data Summary |
| • | UK DTR Submission |
5
DISCLOSURE SUMMARY
This page has been left blank intentionally
6
SUMMARY
CONTENTS
Summary
Statutory Profit Results
Cash Profit Results
Key Balance Sheet Metrics
Cash Profit Results – FX Adjusted
Cash Profit Results – Adjusted Pro-forma
Full Time Equivalent Staff
Other Non-financial Information
7
SUMMARY
Statutory Profit Results
| Half Year | Movement | |||||||||||||||||||||||||||
|
Mar 17 $M |
Sep 16 $M |
Mar 16 $M |
Mar 17 v. Sep 16 |
Mar 17 v. Mar 16 |
||||||||||||||||||||||||
| Net interest income |
7,416 | 7,527 | 7,568 | -1% | -2% | |||||||||||||||||||||||
| Other operating income1
|
2,580 | 2,745 | 2,706 | -6% | -5% | |||||||||||||||||||||||
| Operating income |
9,996 | 10,272 | 10,274 | -3% | -3% | |||||||||||||||||||||||
| Operating expenses1
|
(4,731) | (4,951) | (5,488) | -4% | -14% | |||||||||||||||||||||||
| Profit before credit impairment and income tax |
5,265 | 5,321 | 4,786 | -1% | 10% | |||||||||||||||||||||||
| Credit impairment charge
|
(719) | (1,025) | (904) | -30% | -20% | |||||||||||||||||||||||
| Profit before income tax |
4,546 | 4,296 | 3,882 | 6% | 17% | |||||||||||||||||||||||
| Income tax expense |
(1,627) | (1,318) | (1,140) | 23% | 43% | |||||||||||||||||||||||
| Non-controlling interests
|
(8) | (7) | (4) | 14% | 100% | |||||||||||||||||||||||
| Profit attributable to shareholders of the Company
|
2,911 | 2,971 | 2,738 | -2% | 6% | |||||||||||||||||||||||
| Earnings Per Ordinary Share (cents) | Half Year | Movement | ||||||||||||||||||||||||||
|
Reference Page |
Mar 17
|
Sep 16
|
Mar 16
|
Mar 17 v. Sep 16 |
Mar 17 v. Mar 16 |
|||||||||||||||||||||||
| Basic
|
86 | 100.2 | 102.6 | 94.8 | -2% | 6% | ||||||||||||||||||||||
| Diluted
|
86 | 96.7 | 98.3 | 89.7 | -2% | 8% | ||||||||||||||||||||||
| Half Year | ||||||||||||||||||||
| Reference Page |
Mar 17 | Sep 16 | Mar 16 | |||||||||||||||||
| Ordinary Share Dividends (cents) |
||||||||||||||||||||
| Interim - 100% franked2 |
85 | 80 | - | 80 | ||||||||||||||||
| Final - 100% franked2
|
85 | - | 80 | - | ||||||||||||||||
| Total - 100% franked2 |
85 | 80 | 80 | 80 | ||||||||||||||||
| Ordinary share dividend payout ratio3 |
85 | 80.7% | 78.8% | 85.2% | ||||||||||||||||
| Profitability Ratios |
||||||||||||||||||||
| Return on average ordinary shareholders’ equity4 |
10.1% | 10.5% | 9.5% | |||||||||||||||||
| Return on average assets5 |
0.64% | 0.65% | 0.61% | |||||||||||||||||
| Net interest margin5,6
|
20 | 2.00% | 2.06% | 2.07% | ||||||||||||||||
| Efficiency Ratios |
||||||||||||||||||||
| Operating expenses to operating income1 |
47.3% | 48.2% | 53.4% | |||||||||||||||||
| Operating expenses to average assets1,5
|
1.03% | 1.08% | 1.22% | |||||||||||||||||
| Credit Impairment Charge/(Release) |
||||||||||||||||||||
| Individual credit impairment charge ($M) |
786 | 1,034 | 878 | |||||||||||||||||
| Collective credit impairment charge/(release) ($M)
|
(67) | (9) | 26 | |||||||||||||||||
| Total credit impairment charge ($M) |
89 | 719 | 1,025 | 904 | ||||||||||||||||
| Individual credit impairment charge as a % of average gross loans and advances5 |
0.27% | 0.36% | 0.31% | |||||||||||||||||
| Total credit impairment charge as a % of average gross loans and advances5
|
0.25% | 0.36% | 0.31% | |||||||||||||||||
| 1. | In the March 2017 half, a change was made to the classification of certain fees payable. These items have been reclassified from other operating income to other operating expenses to more accurately reflect the nature of these items. Comparatives have been restated accordingly (Sep 16 half: $8 million; Mar 16 half: $9 million). |
| 2. | Fully franked for Australian tax purposes and carry New Zealand imputation credits of NZD 9 cents per ordinary share for the proposed 2017 interim dividend (2016 final dividend: NZD 9 cents; 2016 interim dividend: NZD 10 cents). |
| 3. | Dividend payout ratio is calculated using the proposed 2017 interim, 2016 final, and 2016 interim dividends. |
| 4. | Average ordinary shareholders’ equity excludes non-controlling interests. |
| 5. | Loans and advances and average assets as at 31 March 2017 include assets held for sale. |
| 6. | In the March 2017 half, the Group changed its calculation of net interest margin to net home loan deposit offset balances against total interest earning assets. Refer to page 20 for further details. |
8
SUMMARY
Cash Profit Results1
| Half Year
|
Movement
|
|||||||||||||||||||||||
|
Mar 17 $M |
Sep 16 $M |
Mar 16 $M |
Mar 17 v. Sep 16 |
Mar 17 v. Mar 16 |
||||||||||||||||||||
| Net interest income |
|
7,416 |
|
|
7,527 |
|
|
7,568 |
|
|
|
-1% |
|
|
-2% |
| ||||||||
|
Other operating income2
|
2,887 | 2,742 | 2,757 | 5% | 5% | |||||||||||||||||||
| Operating income2 |
10,303 | 10,269 | 10,325 | 0% | 0% | |||||||||||||||||||
| Operating expenses
|
(4,731) | (4,951) | (5,488) | -4% | -14% | |||||||||||||||||||
| Profit before credit impairment and income tax |
5,572 | 5,318 | 4,837 | 5% | 15% | |||||||||||||||||||
| Credit impairment charge
|
(720) | (1,038) | (918) | -31% | -22% | |||||||||||||||||||
| Profit before income tax |
4,852 | 4,280 | 3,919 | 13% | 24% | |||||||||||||||||||
| Income tax expense |
(1,433) | (1,166) | (1,133) | 23% | 26% | |||||||||||||||||||
| Non-controlling interests
|
(8) | (7) | (4) | 14% | 100% | |||||||||||||||||||
| Cash profit
|
3,411 | 3,107 | 2,782 | 10% | 23% | |||||||||||||||||||
| Earnings Per Ordinary Share (cents) | Half Year
|
Movement
|
||||||||||||||||||||||||
|
Reference Page |
Mar 17 | Sep 16 | Mar 16 | Mar 17 v. Sep 16 |
Mar 17 v. Mar 16 |
|||||||||||||||||||||
| Basic |
33
|
|
116.7
|
|
|
106.7
|
|
|
95.9
|
|
|
9%
|
|
|
22%
|
| ||||||||||
|
Diluted
|
33 | 111.9 | 102.0 | 90.7 | 10% | 23% | ||||||||||||||||||||
| Half Year
|
||||||||||||||
|
Reference Page |
Mar 17 | Sep 16 | Mar 16 | |||||||||||
| Ordinary Share Dividends |
||||||||||||||
| Ordinary share dividend payout ratio3
|
34 | 68.9% | 75.4% | 83.9% | ||||||||||
| Profitability Ratios |
||||||||||||||
| Return on average ordinary shareholders’ equity4 |
11.8% | 10.9% | 9.7% | |||||||||||
| Return on average assets5 |
0.75% | 0.68% | 0.62% | |||||||||||
| Net interest margin5,6
|
20 | 2.00% | 2.06% | 2.07% | ||||||||||
| Efficiency Ratios |
||||||||||||||
| Operating expenses to operating income2 |
45.9% | 48.2% | 53.2% | |||||||||||
| Operating expenses to average assets2,5
|
1.03% | 1.08% | 1.22% | |||||||||||
| Credit Impairment Charge/(Release) |
||||||||||||||
| Individual credit impairment charge ($M) |
27 | 787 | 1,047 | 892 | ||||||||||
| Collective credit impairment charge/(release) ($M)
|
27 | (67) | (9) | 26 | ||||||||||
| Total credit impairment charge ($M) |
27 | 720 | 1,038 | 918 | ||||||||||
| Individual credit impairment charge as a % of average gross loans and advances5 |
0.27% | 0.36% | 0.31% | |||||||||||
| Total credit impairment charge as a % of average gross loans and advances5
|
0.25% | 0.36% | 0.32% | |||||||||||
| Cash Profit/(Loss) By Division | Half Year
|
Movement
|
||||||||||||||||||||||
| Mar 17 $M |
Sep 16 $M |
Mar 16 $M |
Mar 17 v. Sep 16 |
Mar 17 v. Mar 16 |
||||||||||||||||||||
| Australia |
1,798 | 1,778 | 1,769 | 1% | 2% | |||||||||||||||||||
| Institutional |
1,021 | 408 | 633 | large | 61% | |||||||||||||||||||
| New Zealand |
677 | 622 | 646 | 9% | 5% | |||||||||||||||||||
| Wealth Australia |
123 | 157 | 167 | -22% | -26% | |||||||||||||||||||
| Asia Retail & Pacific |
(217) | 99 | 60 | large | large | |||||||||||||||||||
| TSO and Group Centre
|
9 | 43 | (493) | -79% | large | |||||||||||||||||||
| Cash profit by division
|
3,411 | 3,107 | 2,782 | 10% | 23% | |||||||||||||||||||
| 1. | Cash profit excludes non-core items included in statutory profit and is provided to assist readers in understanding the results of the ongoing business activities of the Group. Refer to pages 67 to 71 for the reconciliation between statutory and cash profit. |
| 2. | In the March 2017 half, a change was made to the classification of certain fees payable. These items have been reclassified from other operating income to other operating expenses to more accurately reflect the nature of these items. Comparatives have been restated accordingly (Sep 16 half: $8 million; Mar 16 half: $9 million). |
| 3. | Dividend payout ratio is calculated using the proposed 2017 interim, 2016 final and 2016 interim dividends. |
| 4. | Average ordinary shareholders’ equity excludes non-controlling interests. |
| 5. | Loans and advances and average assets as at 31 March 2017 include assets held for sale. |
| 6. | In the March 2017 half, the Group changed its calculation of net interest margin to net home loan deposit offset balances against total interest earning assets. Refer to page 20 for further details. |
9
SUMMARY
Key Balance Sheet Metrics1
| As at
|
Movement
| |||||||||||||||
|
Reference |
Mar 17 | Sep 16 | Mar 16 | Mar 17 v. Sep 16 |
Mar 17 v. Mar 16 | |||||||||||
| Capital Management |
||||||||||||||||
|
Common Equity Tier 1 |
||||||||||||||||
| - APRA Basel 3 |
38 | 10.1% | 9.6% | 9.8% | ||||||||||||
| - Internationally Comparable Basel 32 |
38 | 15.2% | 14.5% | 14.0% | ||||||||||||
| Credit risk weighted assets ($B)3 |
108 | 341.8 | 352.0 | 334.3 | -3% | 2% | ||||||||||
| Total risk weighted assets ($B)3 |
38 | 397.0 | 408.6 | 388.3 | -3% | 2% | ||||||||||
| Leverage Ratio
|
|
40
|
|
5.3%
|
5.3%
|
5.1%
|
||||||||||
| Balance Sheet: Key Items |
||||||||||||||||
|
Gross loans and advances ($B) |
580.4 | 580.0 | 565.9 | 0% | 3% | |||||||||||
| Net loans and advances ($B) |
576.3 | 575.9 | 561.8 | 0% | 3% | |||||||||||
| Total assets ($B) |
896.5 | 914.9 | 895.3 | -2% | 0% | |||||||||||
| Customer deposits ($B) |
468.2 | 449.6 | 446.8 | 4% | 5% | |||||||||||
| Total equity ($B)
|
57.9
|
57.9
|
56.5
|
0%
|
2%
| |||||||||||
| Half Year Average
|
Movement
| |||||||||||||||
| Liquidity Risk |
Reference |
Mar 17 | Sep 16 | Mar 16 | Mar 17 v. Sep 16 |
Mar 17 v. Mar 16 | ||||||||||
|
Liquidity Coverage Ratio
|
|
36
|
|
135%
|
125%
|
126%
|
10%
|
9%
| ||||||||
| As at
|
Movement
| |||||||||||||||
|
Reference |
Mar 17 | Mar 17 | ||||||||||||||
| Page | Mar 17 | Sep 16 | Mar 16 | v. Sep 16 | v. Mar 16 | |||||||||||
|
Impaired Assets |
||||||||||||||||
|
Gross impaired assets ($M) |
29 | 2,940 | 3,173 | 2,883 | -7% | 2% | ||||||||||
| Gross impaired assets as a % of gross loans and advances |
0.51% | 0.55% | 0.51% | |||||||||||||
| Net impaired assets ($M) |
29 | 1,671 | 1,866 | 1,645 | -10% | 2% | ||||||||||
| Net impaired assets as a % of shareholders’ equity |
2.9% | 3.2% | 2.9% | |||||||||||||
| Individual provision ($M) |
28 | 1,269 | 1,307 | 1,238 | -3% | 3% | ||||||||||
| Individual provision as a % of gross impaired assets |
43.2% | 41.2% | 42.9% | |||||||||||||
| Collective provision ($M) |
28 | 2,785 | 2,876 | 2,862 | -3% | -3% | ||||||||||
| Collective provision as a % of credit risk weighted assets
|
0.81%
|
0.82%
|
0.86%
|
|||||||||||||
| Net Assets |
||||||||||||||||
|
Net tangible assets attributable to ordinary shareholders ($B) |
50.6 | 50.1 | 48.8 | 1% | 4% | |||||||||||
| Net tangible assets per ordinary share ($)
|
17.24
|
17.13
|
16.72
|
1%
|
3%
| |||||||||||
| As at
|
Movement
| |||||||||||
|
Mar 17 |
Sep 16 | Mar 16 | Mar 17 | Mar 17 | ||||||||
| Net Loans And Advances By Division | $B | $B | $B | v. Sep 16 | v. Mar 16 | |||||||
|
Australia |
336.7 | 327.1 | 321.4 | 3% | 5% | |||||||
| Institutional |
120.8 | 125.9 | 125.6 | -4% | -4% | |||||||
| New Zealand |
104.9 | 107.9 | 99.2 | -3% | 6% | |||||||
| Wealth Australia |
1.8 | 2.0 | 1.9 | -10% | -5% | |||||||
| Asia Retail & Pacific |
12.5 | 13.4 | 13.9 | -7% | -10% | |||||||
| TSO and Group Centre
|
(0.4)
|
(0.4)
|
(0.2)
|
0%
|
100%
| |||||||
|
Net loans and advances by division
|
576.3
|
575.9
|
561.8
|
0%
|
3%
| |||||||
| 1. | Balance Sheet amounts and metrics include assets and liabilities held for sale. |
| 2. | See page 38 for further details regarding the differences between APRA Basel 3 and Internationally Comparable Basel 3 standards. |
| 3. | Includes $25.9 billion increase in credit risk weighted assets associated with increased capital requirements for Australian residential mortgages introduced in July 2016. |
10
SUMMARY
Cash Profit Results – FX Adjusted
The following tables present the Group’s cash profit results neutralised for the impact of foreign currency translation. Comparative data has been adjusted to remove the translation impact of foreign exchange movements by retranslating prior period comparatives at current period foreign exchange rates. Refer to page 31 for further details on the impact of exchange rate movements.
Cash Profit - March 2017 Half Year vs March 2016 Half Year
| Half Year | Movement | |||||||||||||||
| Actual | FX unadjusted |
FX impact |
FX adjusted |
FX unadjusted |
FX impact |
FX adjusted | ||||||||||
|
Mar 17 |
Mar 16 | Mar 16 | Mar 16 | Mar 17 | Mar 17 | Mar 17 | ||||||||||
| $M | $M | $M | $M | v. Mar 16 | v. Mar 16 | v. Mar 16 | ||||||||||
|
Net interest income |
7,416 |
7,568 |
(12) |
7,556 |
-2% |
0% |
-2% | |||||||||
| Other operating income
|
2,887 | 2,757 | (35) | 2,722 | 5% | -1% | 6% | |||||||||
| Operating income |
10,303 | 10,325 | (47) | 10,278 | 0% | 0% | 0% | |||||||||
| Operating expenses
|
(4,731) | (5,488) | 45 | (5,443) | -14% | -1% | -13% | |||||||||
| Profit before credit impairment and income tax |
5,572 | 4,837 | (2) | 4,835 | 15% | 0% | 15% | |||||||||
| Credit impairment charge
|
(720) | (918) | 8 | (910) | -22% | -1% | -21% | |||||||||
| Profit before income tax |
4,852 | 3,919 | 6 | 3,925 | 24% | 0% | 24% | |||||||||
| Income tax expense |
(1,433) | (1,133) | (10) | (1,143) | 26% | 1% | 25% | |||||||||
| Non-controlling interests
|
(8) | (4) | 1 | (3) | 100% | large | large | |||||||||
| Cash profit
|
3,411 | 2,782 | (3) | 2,779 | 23% | 0% | 23% | |||||||||
| Cash Profit - March 2017 Half Year vs September 2016 Half Year | ||||||||||||||||
| Half Year | Movement | |||||||||||||||
| Actual | FX unadjusted |
FX impact |
FX adjusted |
FX unadjusted |
FX impact |
FX adjusted | ||||||||||
|
Mar 17 |
Sep 16 | Sep 16 | Sep 16 | Mar 17 | Mar 17 | Mar 17 | ||||||||||
| $M | $M | $M | $M | v. Sep 16 | v. Sep 16 | v. Sep 16 | ||||||||||
|
Net interest income |
7,416 |
7,527 |
- |
7,527 |
-1% |
0% |
-1% | |||||||||
| Other operating income
|
2,887 | 2,742 | 2 | 2,744 | 5% | 0% | 5% | |||||||||
| Operating income |
10,303 | 10,269 | 2 | 10,271 | 0% | 0% | 0% | |||||||||
| Operating expenses
|
(4,731) | (4,951) | 6 | (4,945) | -4% | 0% | -4% | |||||||||
| Profit before credit impairment and income tax |
5,572 | 5,318 | 8 | 5,326 | 5% | 0% | 5% | |||||||||
| Credit impairment charge
|
(720) | (1,038) | 2 | (1,036) | -31% | 0% | -31% | |||||||||
| Profit before income tax |
4,852 | 4,280 | 10 | 4,290 | 13% | 0% | 13% | |||||||||
| Income tax expense |
(1,433) | (1,166) | (5) | (1,171) | 23% | 1% | 22% | |||||||||
| Non-controlling interests
|
(8) | (7) | - | (7) | 14% | 0% | 14% | |||||||||
| Cash profit
|
3,411 | 3,107 | 5 | 3,112 | 10% | 0% | 10% | |||||||||
11
SUMMARY
Cash Profit Results – Adjusted Pro-forma
The Group recognised the impact of a number of items collectively referred to as ‘specified items’ which form part of the Group’s cash profit. The tables on the following pages present the Group’s cash profit adjusted for these items to assist readers to understand the estimated growth rates of the ongoing business performance of the Group. The “Cash Profit Results - Adjusted Pro-forma” is not subject to review or audit by the external auditor. The numbers shown on pages 12 and 13 are on a pre-tax basis.
| • | Asian minority investments adjustments |
Pro-forma
| • | On 30 March 2016, Bank of Tianjin (BoT), an equity accounted investment, completed a capital raising and listing on the Hong Kong Stock Exchange through an Initial Public Offering (IPO). As the Group did not participate in the capital raising, its ownership interest decreased from 14% to 12%. As a consequence, the Group ceased equity accounting for the investment in BoT and commenced accounting for it as an available for sale asset. |
| • | On 3 January 2017, the Group announced that it had agreed to sell its 20% stake in Shanghai Rural Commercial Bank (SRCB) to China COSCO Shipping Corporation Limited and Shanghai Sino-Poland Enterprise Management Development Corporation Limited. The agreement states COSCO and Sino-Poland Enterprise will each acquire 10% of SRCB. The sale is subject to customary closing conditions and regulatory approvals and is expected to be completed in the September 2017 half. As a consequence, the Group ceased equity accounting for the investment in SRCB and commenced accounting for it as an asset held for sale. |
Pro-forma results have been prepared on the assumption that the cessation of equity accounting for the above mentioned Asia minority investments took effect from 1 October 2015, effectively restating the Group’s cash profit for the March 2016, September 2016 and March 2017 half years.
Valuation adjustments
| • | During the March 2016 half year, the Group recognised a $260 million impairment to its equity accounted investment in AMMB Holdings Berhad (AmBank) bringing the carrying value in line with its value-in-use calculation (refer Note 1 (iv) of the Condensed Consolidated Financial Statements). |
| • | On cessation of equity accounting for BoT on 30 March 2016, a net gain of $29 million was recognised in relation to the remeasurement of the investment to fair value and recycling the associated equity accounted reserves. |
| Pro-forma | Valuation adjustments | |||||||||||||
|
BoT |
SRCB | AmBank | BoT | |||||||||||
| $M | $M | Total | $M | $M | Total | |||||||||
|
Mar-16 |
(86) |
(137) |
(223) |
260 |
(29) |
231 | ||||||||
| Sep-16 |
- | (122) | (122) | - | - | - | ||||||||
| Mar-17 |
- | (58) | (58) | - | - | - | ||||||||
| • | Reclassification of Asia Retail and Wealth to held for sale |
On 31 October 2016, the Group announced it had agreed to sell its Retail and Wealth businesses in Singapore, Hong Kong, China, Taiwan and Indonesia to Singapore’s DBS Bank. Subject to regulatory approval, the Group expects the sale to be completed in stages in 2017 and early 2018. As a result of the sale agreement, the Group recognised $324 million of charges to impair software, goodwill and fixed assets as well as providing for redundancies (detailed in Note 11 of the Condensed Consolidated Financial Statements). This business is part of the Asia Retail & Pacific division. There are no pro-forma adjustments as the business was held throughout the March 2017 half.
| • | Software capitalisation changes |
During the March 2016 half, the Group amended the application of the Group’s software capitalisation policy by increasing the threshold for capitalisation of software development costs to $20 million, reflecting the increasingly shorter useful life of smaller items of software, and directly expensing more project related costs. For software assets at 1 October 2015 with an original cost below the revised threshold, the carrying values were expensed through an accelerated amortisation charge of $556 million in the March 2016 half (recognised in TSO and Group Centre). In 2016 reporting, the Group also recognised a $183 million amortisation benefit offset by $370 million of increased operating expenses due to the application of the software capitalisation policy change. These items are not referred to as a specified item in 2017 reporting as they are treated consistently across 2016 and 2017 financial years.
| • | Restructuring |
The Group accelerated the process of reshaping its workforce in 2016 to build a simpler, more agile bank. A restructuring expense of $278 million was recognised as a specified item in the September 2016 full year. Restructuring expenses of $36 million in the half year ended March 2017 have not been classified as a specified item.
12
SUMMARY
| Half Year
| ||||
|
Sep 16 |
Mar 16 | |||
| Restructuring expense by division | $M | $M | ||
| Australia |
45 | 24 | ||
| Institutional |
39 | 53 | ||
| New Zealand |
18 | 3 | ||
| Wealth Australia |
7 | 13 | ||
| Asia Retail & Pacific |
1 | 12 | ||
| TSO and Group Centre
|
30 | 33 | ||
|
Total
|
140 | 138 | ||
| • | Esanda Dealer Finance divestment and pro-forma |
On 1 November 2015, the Group sold the Esanda Dealer Finance portfolio with the majority of the business transferred by 31 December 2015. The gain on sale of the Esanda Dealer divestment was $66 million, which was recognised in the March 2016 half. Pro-forma results have been prepared on the assumption that the sale took effect from 1 October 2015, effectively restating the Group’s cash profit for the March and September 2016 half years.
| • | Derivative CVA methodology change |
In determining the fair value of a derivative, the Group recognises a derivative credit valuation adjustment (CVA) to reflect the probability that the counterparty may default and the Group may not receive the full market value of outstanding transactions. It represents an estimate of the credit adjustment a market participant would include when deriving a purchase price to acquire the exposure. During the September 2016 half, the Group revised its methodology for determining the derivative credit valuation adjustment to make greater use of market information and enhanced modelling, and to align with leading market practice. The impact to cash profit before income tax associated with this methodology change was an incremental derivative credit valuation adjustment charge of $237 million.
13
SUMMARY
Cash Profit Results - Adjusted Pro-forma
| March 2017 Half Year | March 2016 Half Year | Mar 17 v. Mar 16 |
||||||||||||||||||||||||||||||||||||||||||||||||||||||||||||||||||
| Cash profit |
Asian minority pro-forma |
Reclassific- ation of |
Total specified items |
Adjusted pro-forma |
Cash profit |
Software capital- isation changes |
Asian minority pro-forma |
Asian minority valuation adjustments |
Restruct- uring |
Esanda Dealer Finance divestment and pro-forma |
Derivative CVA methodo- logy change |
Total specified items |
Adjusted pro-forma |
Movement | ||||||||||||||||||||||||||||||||||||||||||||||||||||||
| Cash Profit | ||||||||||||||||||||||||||||||||||||||||||||||||||||||||||||||||||||
| Net interest income | 7,416 | - | - | - | 7,416 | 7,568 | - | - | - | - | (31) | - | (31) | 7,537 | -2% | |||||||||||||||||||||||||||||||||||||||||||||||||||||
| Other operating income
|
2,887 | (58) | 324 | 266 | 3,153 | 2,757 | - | (223) | 231 | - | (78) | - | (70) | 2,687 | 17% | |||||||||||||||||||||||||||||||||||||||||||||||||||||
| Operating income | 10,303 | (58) | 324 | 266 | 10,569 | 10,325 | - | (223) | 231 | - | (109) | - | (101) | 10,224 | 3% | |||||||||||||||||||||||||||||||||||||||||||||||||||||
| Operating expenses
|
(4,731) | - | - | - | (4,731) | (5,488) | 556 | - | - | 138 | 11 | - | 705 | (4,783) | -1% | |||||||||||||||||||||||||||||||||||||||||||||||||||||
| Profit before credit impairment and income tax | 5,572 | (58) | 324 | 266 | 5,838 | 4,837 | 556 | (223) | 231 | 138 | (98) | - | 604 | 5,441 | 7% | |||||||||||||||||||||||||||||||||||||||||||||||||||||
| Credit impairment charge
|
(720) | - | - | - | (720) | (918) | - | - | - | - | 13 | - | 13 | (905) | -20% | |||||||||||||||||||||||||||||||||||||||||||||||||||||
| Profit before income tax | 4,852 | (58) | 324 | 266 | 5,118 | 3,919 | 556 | (223) | 231 | 138 | (85) | - | 617 | 4,536 | 13% | |||||||||||||||||||||||||||||||||||||||||||||||||||||
| Income tax expense | (1,433) | - | (40) | (40) | (1,473) | (1,133) | (167) | - | - | (37) | 29 | - | (175) | (1,308) | 13% | |||||||||||||||||||||||||||||||||||||||||||||||||||||
| Non-controlling interests
|
(8) | - | - | - | (8) | (4) | - | - | - | - | - | - | - | (4) | 100% | |||||||||||||||||||||||||||||||||||||||||||||||||||||
|
Cash profit
|
3,411 | (58) | 284 | 226 | 3,637 | 2,782 | 389 | (223) | 231 | 101 | (56) | - | 442 | 3,224 | 13% | |||||||||||||||||||||||||||||||||||||||||||||||||||||
| March 2017 Half Year | March 2016 Half Year | Mar 17 v. Mar 16 |
||||||||||||||||||||||||||||||||||||||||||||||||||||||||||||||||||
| Cash profit |
Asian minority pro-forma |
Reclassific- ation of Asia Retail |
Total specified items |
Adjusted pro-forma |
Cash profit |
Software capital- isation changes |
Asian minority pro-forma |
Asian minority valuation adjustments |
Restruct- uring |
Esanda Dealer Finance divestment and pro-forma |
Derivative CVA methodo- logy change |
Total specified items |
Adjusted pro-forma |
Movement | ||||||||||||||||||||||||||||||||||||||||||||||||||||||
| Profit before income tax by division | ||||||||||||||||||||||||||||||||||||||||||||||||||||||||||||||||||||
| Australia | 2,570 | - | - | - | 2,570 | 2,529 | - | - | - | 24 | (19) | - | 5 | 2,534 | 1% | |||||||||||||||||||||||||||||||||||||||||||||||||||||
| Institutional | 1,441 | - | - | - | 1,441 | 879 | - | - | - | 53 | - | - | 53 | 932 | 55% | |||||||||||||||||||||||||||||||||||||||||||||||||||||
| New Zealand | 940 | - | - | - | 940 | 889 | - | - | - | 3 | - | - | 3 | 892 | 5% | |||||||||||||||||||||||||||||||||||||||||||||||||||||
| Wealth Australia | 174 | - | - | - | 174 | 235 | - | - | - | 13 | - | - | 13 | 248 | -30% | |||||||||||||||||||||||||||||||||||||||||||||||||||||
| Asia Retail & Pacific | (236) | - | 324 | 324 | 88 | 75 | - | - | - | 12 | - | - | 12 | 87 | 1% | |||||||||||||||||||||||||||||||||||||||||||||||||||||
| TSO and Group Centre
|
(37) | (58) | - | (58) | (95) | (688) | 556 | (223) | 231 | 33 | (66) | - | 531 | (157) | -39% | |||||||||||||||||||||||||||||||||||||||||||||||||||||
| Profit before income tax | 4,852 | (58) | 324 | 266 | 5,118 | 3,919 | 556 | (223) | 231 | 138 | (85) | - | 617 | 4,536 | 13% | |||||||||||||||||||||||||||||||||||||||||||||||||||||
| Income tax expense & non-controlling interests
|
(1,441) | - | (40) | (40) | (1,481) | (1,137) | (167) | - | - | (37) | 29 | - | (175) | (1,312) | 13% | |||||||||||||||||||||||||||||||||||||||||||||||||||||
|
Cash profit
|
3,411 | (58) | 284 | 226 | 3,637 | 2,782 | 389 | (223) | 231 | 101 | (56) | - | 442 | 3,224 | 13% | |||||||||||||||||||||||||||||||||||||||||||||||||||||
14
SUMMARY
Cash Profit Results - Adjusted Pro-forma
| March 2017 Half Year | September 2016 Half Year | Mar 17 v. Sep 16 |
||||||||||||||||||||||||||||||||||||||||||||||||||||||||||||||||||
| Cash profit | Asian minority pro-forma |
Reclassific- ation of Asia Retail & Wealth to held for sale |
Total specified items |
Adjusted pro-forma |
Cash profit | Software capital- isation changes |
Asian minority pro-forma |
Asian minority valuation adjustments |
Restruct- uring |
Esanda |
Derivative CVA methodo- logy change |
Total specified items |
Adjusted pro-forma |
Movement | ||||||||||||||||||||||||||||||||||||||||||||||||||||||
| Cash Profit | ||||||||||||||||||||||||||||||||||||||||||||||||||||||||||||||||||||
| Net interest income | 7,416 | - | - | - | 7,416 | 7,527 | - | - | - | - | - | - | - | 7,527 | -1% | |||||||||||||||||||||||||||||||||||||||||||||||||||||
| Other operating income
|
2,887 | (58) | 324 | 266 | 3,153 | 2,742 | - | (122) | - | - | - | 237 | 115 | 2,857 | 10% | |||||||||||||||||||||||||||||||||||||||||||||||||||||
| Operating income | 10,303 | (58) | 324 | 266 | 10,569 | 10,269 | - | (122) | - | - | - | 237 | 115 | 10,384 | 2% | |||||||||||||||||||||||||||||||||||||||||||||||||||||
| Operating expenses
|
(4,731) | - | - | - | (4,731) | (4,951) | - | - | - | 140 | 6 | - | 146 | (4,805) | -2% | |||||||||||||||||||||||||||||||||||||||||||||||||||||
| Profit before credit impairment and income tax | 5,572 | (58) | 324 | 266 | 5,838 | 5,318 | - | (122) | - | 140 | 6 | 237 | 261 | 5,579 | 5% | |||||||||||||||||||||||||||||||||||||||||||||||||||||
| Credit impairment charge
|
(720) | - | - | - | (720) | (1,038) | - | - | - | - | 10 | - | 10 | (1,028) | -30% | |||||||||||||||||||||||||||||||||||||||||||||||||||||
| Profit before income tax | 4,852 | (58) | 324 | 266 | 5,118 | 4,280 | - | (122) | - | 140 | 16 | 237 | 271 | 4,551 | 12% | |||||||||||||||||||||||||||||||||||||||||||||||||||||
| Income tax expense | (1,433) | - | (40) | (40) | (1,473) | (1,166) | - | - | - | (40) | (5) | (69) | (114) | (1,280) | 15% | |||||||||||||||||||||||||||||||||||||||||||||||||||||
| Non-controlling interests
|
(8) | - | - | - | (8) | (7) | - | - | - | - | - | - | - | (7) | 14% | |||||||||||||||||||||||||||||||||||||||||||||||||||||
|
Cash profit
|
3,411 | (58) | 284 | 226 | 3,637 | 3,107 | - | (122) | - | 100 | 11 | 168 | 157 | 3,264 | 11% | |||||||||||||||||||||||||||||||||||||||||||||||||||||
| March 2017 Half Year | September 2016 Half Year | Mar 17 v. Sep 16 |
||||||||||||||||||||||||||||||||||||||||||||||||||||||||||||||||||
| Cash profit | Asian minority pro-forma |
Reclassific- ation of Asia Retail & Wealth to held for sale |
Total specified items |
Adjusted pro-forma |
Cash profit | Software capital- isation changes |
Asian minority pro-forma |
Asian minority valuation adjustments |
Restruct- uring |
Esanda |
Derivative CVA methodo- logy change |
Total specified items |
Adjusted pro-forma |
Movement | ||||||||||||||||||||||||||||||||||||||||||||||||||||||
| Profit before income tax by division | ||||||||||||||||||||||||||||||||||||||||||||||||||||||||||||||||||||
| Australia | 2,570 | - | - | - | 2,570 | 2,533 | - | - | - | 45 | 16 | - | 61 | 2,594 | -1% | |||||||||||||||||||||||||||||||||||||||||||||||||||||
| Institutional | 1,441 | - | - | - | 1,441 | 600 | - | - | - | 39 | - | 237 | 276 | 876 | 64% | |||||||||||||||||||||||||||||||||||||||||||||||||||||
| New Zealand | 940 | - | - | - | 940 | 858 | - | - | - | 18 | - | - | 18 | 876 | 7% | |||||||||||||||||||||||||||||||||||||||||||||||||||||
| Wealth Australia | 174 | - | - | - | 174 | 219 | - | - | - | 7 | - | - | 7 | 226 | -23% | |||||||||||||||||||||||||||||||||||||||||||||||||||||
| Asia Retail & Pacific | (236) | - | 324 | 324 | 88 | 121 | - | - | - | 1 | - | - | 1 | 122 | -28% | |||||||||||||||||||||||||||||||||||||||||||||||||||||
| TSO and Group Centre
|
(37) | (58) | - | (58) | (95) | (51) | - | (122) | - | 30 | - | - | (92) | (143) | -34% | |||||||||||||||||||||||||||||||||||||||||||||||||||||
| Profit before income tax | 4,852 | (58) | 324 | 266 | 5,118 | 4,280 | - | (122) | - | 140 | 16 | 237 | 271 | 4,551 | 12% | |||||||||||||||||||||||||||||||||||||||||||||||||||||
| Income tax expense & non-controlling interests
|
(1,441) | - | (40) | (40) | (1,481) | (1,173) | - | - | - | (40) | (5) | (69) | (114) | (1,287) | 15% | |||||||||||||||||||||||||||||||||||||||||||||||||||||
|
Cash profit
|
3,411 | (58) | 284 | 226 | 3,637 | 3,107 | - | (122) | - | 100 | 11 | 168 | 157 | 3,264 | 11% | |||||||||||||||||||||||||||||||||||||||||||||||||||||
15
SUMMARY
Full time equivalent staff 1
As at 31 March 2017, ANZ employed 46,046 people worldwide (Sep 16: 46,554; Mar 16: 48,896) on a full-time equivalent basis (“FTEs”).
| Division | As at
|
Movement
| ||||||||||||
| Mar 17 | Sep 16 | Mar 16 |
Mar
17 |
Mar 17 v. Mar 16 | ||||||||||
|
Australia |
11,518 | 11,639 | 12,094 | -1% | -5% | |||||||||
| Institutional |
4,899 | 5,112 | 5,601 | -4% | -13% | |||||||||
| New Zealand |
6,250 | 6,317 | 6,401 | -1% | -2% | |||||||||
| Wealth Australia |
2,043 | 2,098 | 2,158 | -3% | -5% | |||||||||
| Asia Retail & Pacific |
4,719 | 4,894 | 5,440 | -4% | -13% | |||||||||
| TSO and Group Centre
|
16,617
|
16,494
|
17,202
|
1%
|
-3%
| |||||||||
|
Total
|
46,046
|
46,554
|
48,896
|
-1%
|
-6%
| |||||||||
|
Average FTE
|
46,462
|
47,489
|
49,777
|
-2%
|
-7%
| |||||||||
| Geography | As at
|
Movement
| ||||||||||||
| Mar 17 | Sep 16 | Mar 16 |
Mar 17 v. Sep 16 |
Mar 17 v. Mar 16 | ||||||||||
|
Australia |
19,722 | 19,957 | 20,808 | -1% | -5% | |||||||||
| Asia Pacific, Europe & America |
18,563 | 18,728 | 20,025 | -1% | -7% | |||||||||
| New Zealand
|
7,761 | 7,869 | 8,063 | -1% | -4% | |||||||||
|
Total
|
46,046
|
46,554
|
48,896
|
-1%
|
-6%
| |||||||||
| 1. | Full time equivalent staff have been restated to reflect organisational changes. The net impact of these organisational changes was a decrease in TSO and Group Centre of 8,012 FTE as at September 2016 (March 16: 8,327 FTE), offset by an FTE increase across other divisions. Nil impact to total Group FTE. Refer to page 44 for further details. |
Other Non-financial Information
| Half Year
|
Movement
| |||||||||||||
| Shareholder value - ordinary shares | Mar 17 | Sep 16 | Mar 16 |
Mar
17 |
Mar 17 v. Mar 16 | |||||||||
|
Share price ($) |
||||||||||||||
| - high |
32.44 | 27.85 | 29.17 | 16% | 11% | |||||||||
| - low |
25.78 | 22.06 | 21.86 | 17% | 18% | |||||||||
| - closing |
31.82 | 27.63 | 23.46 | 15% | 36% | |||||||||
| Closing market capitalisation of ordinary shares ($B) |
93.4 | 80.9 | 68.4 | 15% | 37% | |||||||||
| Total shareholder returns (TSR)
|
22.4%
|
21.6%
|
-10.2%
|
4%
|
large
| |||||||||
| As at Mar 17
| ||||||
|
| ||||||
| Credit Ratings | Short-Term | Long-Term | Outlook | |||
| Moody’s Investor Services |
P-1 | Aa2 | Negative | |||
| Standard & Poor’s |
A-1+ | AA- | Negative | |||
| Fitch Ratings
|
F1+
|
AA-
|
Stable
| |||
16
GROUP RESULTS
CONTENTS
Group Results
Cash Profit
Net interest income
Other operating income
Operating expenses
Technology infrastructure spend
Software capitalisation
Credit risk
Income tax expense
Impact of foreign currency translation
Earnings related hedges
Earnings per share
Dividends
Economic profit
Condensed balance sheet
Liquidity risk
Funding
Capital management
Leverage ratio
Other regulatory developments
17
GROUP RESULTS
Non-IFRS information
The Group provides additional measures of performance in the Consolidated Financial Report & Dividend Announcement which are prepared on a basis other than in accordance with accounting standards. The guidance provided in Australian Securities and Investments Commission (ASIC) Regulatory Guide 230 has been followed when presenting this information.
Cash profit
Cash profit represents ANZ’s preferred measure of the result of the ongoing business activities of the Group, enabling readers to assess Group and Divisional performance against prior periods and against peer institutions. To calculate cash profit, the Group excludes non-core items from statutory profit (refer to Definitions for further details). The adjustments made in arriving at cash profit are included in statutory profit which is subject to review within the context of the external auditor’s review of the Condensed Consolidated Financial Statements. Cash profit is not subject to review or audit by the external auditor. The external auditor has informed the Audit Committee that recurring adjustments have been determined on a consistent basis across each period presented, and the additional adjustment for the reclassification of Shanghai Rural Commercial Bank to held for sale in the March 2017 half is appropriate.
The Group Results section is reported on a cash profit basis.
| Half Year
|
Movement
| |||||||||||||||||||
| Mar 17 | Sep 16 | Mar 16 | Mar 17 | Mar 17 | ||||||||||||||||
| $M | $M | $M | v. Sep 16 | v. Mar 16 | ||||||||||||||||
|
Statutory profit attributable to shareholders of the Company |
|
2,911 |
|
|
2,971 |
|
2,738 |
|
-2% |
|
6% | |||||||||
| Adjustments between statutory profit and cash profit1 |
||||||||||||||||||||
|
Treasury shares adjustment |
76 | 73 | (29) | 4% | large | |||||||||||||||
| Revaluation of policy liabilities |
36 | (40) | (14) | large | large | |||||||||||||||
| Economic hedges |
178 | (26) | 128 | large | 39% | |||||||||||||||
| Revenue hedges |
(105) | 131 | (39) | large | large | |||||||||||||||
| Structured credit intermediation trades |
(1) | (2) | (2) | -50% | -50% | |||||||||||||||
| Reclassification of SRCB to held for sale
|
|
316
|
|
|
-
|
|
-
|
|
n/a
|
|
n/a
| |||||||||
| Total adjustments between statutory profit and cash profit
|
|
500
|
|
|
136
|
|
44
|
|
large
|
|
large
| |||||||||
| Cash Profit
|
|
3,411
|
|
|
3,107
|
|
2,782
|
|
10%
|
|
23%
| |||||||||
|
1. Refer to pages 67 to 71 for analysis of the adjustments between statutory profit and cash profit. |
||||||||||||||||||||
|
Group Performance |
Half Year
|
Movement
| ||||||||||||||||||
| Mar 17 | Sep 16 | Mar 16 | Mar 17 | Mar 17 | ||||||||||||||||
| $M | $M | $M | v. Sep 16 | v. Mar 16 | ||||||||||||||||
|
Net interest income |
7,416 | 7,527 | 7,568 | -1% | -2% | |||||||||||||||
| Other operating income
|
|
2,887
|
|
|
2,742
|
|
2,757
|
|
5%
|
|
5%
| |||||||||
|
Operating income |
10,303 | 10,269 | 10,325 | 0% | 0% | |||||||||||||||
| Operating expenses
|
|
(4,731)
|
|
|
(4,951)
|
|
(5,488)
|
|
-4%
|
|
-14%
| |||||||||
|
Profit before credit impairment and income tax |
5,572 | 5,318 | 4,837 | 5% | 15% | |||||||||||||||
| Credit impairment charge
|
|
(720)
|
|
|
(1,038)
|
|
(918)
|
|
-31%
|
|
-22%
| |||||||||
|
Profit before income tax |
4,852 | 4,280 | 3,919 | 13% | 24% | |||||||||||||||
| Income tax expense |
(1,433) | (1,166) | (1,133) | 23% | 26% | |||||||||||||||
| Non-controlling interests
|
|
(8)
|
|
|
(7)
|
|
(4)
|
|
14%
|
|
100%
| |||||||||
| Cash profit
|
|
3,411
|
|
|
3,107
|
|
2,782
|
|
10%
|
|
23%
| |||||||||
|
Half Year
|
Movement
| |||||||||||||||||||
| Mar 17 | Sep 16 | Mar 16 | Mar 17 | Mar 17 | ||||||||||||||||
| Cash Profit/(Loss) By Division | $M | $M | $M | v. Sep 16 | v. Mar 16 | |||||||||||||||
|
Australia |
1,798 | 1,778 | 1,769 | 1% | 2% | |||||||||||||||
| Institutional |
1,021 | 408 | 633 | large | 61% | |||||||||||||||
| New Zealand |
677 | 622 | 646 | 9% | 5% | |||||||||||||||
| Wealth Australia |
123 | 157 | 167 | -22% | -26% | |||||||||||||||
| Asia Retail & Pacific |
(217) | 99 | 60 | large | large | |||||||||||||||
| TSO and Group Centre
|
|
9
|
|
|
43
|
|
(493)
|
|
-79%
|
|
large
| |||||||||
| Cash profit
|
|
3,411
|
|
|
3,107
|
|
2,782
|
|
10%
|
|
23%
| |||||||||
18
GROUP RESULTS
Group Cash Profit – March 2017 Half Year v March 2016 Half Year
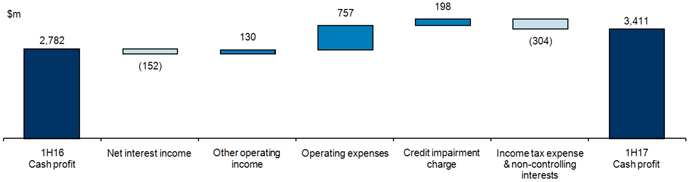
| • | March 2017 v March 2016 |
Cash profit increased 23% partly reflecting a number of specified items taken in the March 2016 half. Excluding specified items, cash profit increased 13%.
| • | Net interest income decreased $152 million (-2%) as the result of a 7 basis point decrease in net interest margin, partially offset by 2% growth in average interest earning assets. The net interest margin decline was due to higher average funding costs, deposit competition, growth in the liquidity portfolio and lower capital earnings due to the lower interest rate environment. These impacts were partially offset by repricing in Home Loans. Average interest earning assets growth reflected ANZ’s strategic focus with growth in Home Loans in Australia and New Zealand, partially offset by a reduction in Institutional lending due to portfolio rebalancing. |
| • | Other operating income increased $130 million (+5%) benefiting from a significant improvement in Markets other operating income of $485 million, the $114 million gain on sale of 100 Queen Street, Melbourne, and the $260 million impairment of the investment in AmBank in the March 2016 half. A number of sales related transactions had an unfavourable impact including a $324 million charge related to the sale of Retail and Wealth businesses in Asia, a $177 million loss of earnings from SRCB, BoT and Esanda Dealer Finance, and the $66 million gain on sale of the Esanda Dealer Finance divestment in the March 2016 half. This was additional to a $103 million reduction in funds management and insurance income in Wealth Australia and a $59 million decrease in net fee and commission income. |
| • | Operating expenses decreased $757 million (-14%), driven by a $556 million charge for software capitalisation policy changes in the March 2016 half, a $153 million (-5%) reduction in personnel expenses reflecting a 7% reduction in average FTE, and a reduction in restructuring expenses of $102 million (-74%). Excluding the impact of software capitalisation policy changes, Technology expenses increased $54 million (+7%) due to higher amortisation from software. |
| • | Credit impairment charges decreased $198 million (-22%). Individual credit impairment charges decreased by $105 million (-12%) primarily due to a reduction in resource related exposures in the Institutional division. Collective impairment charges decreased by $93 million due to an improvement in the Group’s overall risk profile, portfolio rebalancing particularly in Institutional and migration from collective to individual provisions, this was partially offset by a management adjustment for the Queensland cyclone. |
| • | March 2017 v September 2016 |
Cash profit increased 10% compared with the September 2016 half. Excluding specified items, cash profit increased 11%.
| • | Net interest income decreased $111 million (-1%) as the result of a 6 basis point decrease in net interest margin, partially offset by 2% growth in average interest earning assets. The net interest margin decline was due to growth in the liquidity portfolio, lower capital earnings as the result of the lower interest rate environment, higher average funding costs and deposit competition, partially offset by repricing in Home Loans. Average interest earning assets growth was driven by Home Loan growth in Australia and New Zealand. |
| • | Other operating income increased $145 million (+5%) benefiting from a significant improvement in Markets other operating income of $284 million, the $114 million gain on sale of 100 Queen Street, Melbourne, and the $237 million derivative CVA methodology charge recognised in the September 2016 half. Two sales related transactions had an unfavourable impact, the $324 million charge related to the sale of Retail and Wealth businesses in Asia and the $64 million loss of earnings from SRCB. This was additional to a $79 million reduction in funds management and insurance income. |
| • | Operating expenses decreased $220 million (-4%) driven by a $104 million (-74%) reduction in restructuring expenses and a $92 million (-3%) reduction in personnel expenses reflecting a 2% reduction in average FTE. |
| • | Credit impairment charges decreased $318 million (-31%). Individual credit impairment charges decreased by $260 million (-25%) due to a $226 million decrease in the Institutional division. Collective impairment charges decreased $58 million due to an improvement in the Group’s overall risk profile, portfolio rebalancing particularly in Institutional and migration from collective to individual provisions, which was partially offset by a management adjustment for the Queensland cyclone. |
19
GROUP RESULTS
Net interest income
In the March 2017 half, the Group changed its calculation of net interest margin to net home loan deposit offset balances against total interest earning assets. The revised calculation is in line with other major banks. Originally reported net interest margin (Sept 16 half: 2.00%; Mar 16 half: 2.01%) and total average interest earning assets (Sept 16 half: $753,928 million; Mar 16 half: $754,391 million) have been restated accordingly in March 2017 half year reporting.
| Half Year
|
Movement
| |||||||||||||||||
|
Mar 17 |
Sep 16 | Mar 16 | Mar 17 | Mar 17 | ||||||||||||||
| Group | $M | $M | $M | v. Sep 16 | v. Mar 16 | |||||||||||||
|
Cash net interest income1 |
7,416 | 7,527 | 7,568 | -1% | -2% | |||||||||||||
| Average interest earning assets2,3 |
743,906 | 730,275 | 731,395 | 2% | 2% | |||||||||||||
| Average deposits and other borrowings3 |
597,337 | 585,672 | 587,235 | 2% | 2% | |||||||||||||
| Net interest margin (%) - cash2
|
|
2.00
|
|
|
2.06
|
|
2.07
|
-6 bps
|
-7 bps
| |||||||||
| Group (excluding Markets) |
||||||||||||||||||
|
Cash net interest income1 |
6,938 | 7,055 | 7,008 | -2% | -1% | |||||||||||||
| Average interest earning assets2,3 |
538,598 | 533,782 | 533,111 | 1% | 1% | |||||||||||||
| Average deposits and other borrowings3 |
452,671 | 453,424 | 453,136 | 0% | 0% | |||||||||||||
| Net interest margin (%) - cash2
|
|
2.58
|
|
|
2.64
|
|
2.63
|
-6 bps
|
-5 bps
| |||||||||
| Half Year
|
Movement
| |||||||||||||||||
|
Mar 17 |
Sep 16 | Mar 16 | Mar 17 | Mar 17 | ||||||||||||||
| Cash net interest margin by major division | $M | $M | $M | v. Sep 16 | v. Mar 16 | |||||||||||||
|
Australia1 |
||||||||||||||||||
| Net interest margin (%)2 |
2.69 | 2.74 | 2.75 | -5 bps | -6 bps | |||||||||||||
| Average interest earning assets2 |
308,391 | 301,516 | 296,012 | 2% | 4% | |||||||||||||
| Average deposits and other borrowings |
193,671 | 185,274 | 181,118 | 5% | 7% | |||||||||||||
| Institutional |
||||||||||||||||||
| Net interest margin (%) |
1.05 | 1.11 | 1.15 | -6 bps | -10 bps | |||||||||||||
| Average interest earning assets |
302,578 | 297,889 | 313,003 | 2% | -3% | |||||||||||||
| Average deposits and other borrowings |
242,402 | 232,143 | 233,775 | 4% | 4% | |||||||||||||
| New Zealand1 |
||||||||||||||||||
| Net interest margin (%) |
2.30 | 2.35 | 2.40 | -5 bps | -10 bps | |||||||||||||
| Average interest earning assets3 |
109,664 | 105,659 | 100,674 | 4% | 9% | |||||||||||||
| Average deposits and other borrowings3
|
|
79,190
|
|
|
77,661
|
|
73,175
|
2%
|
8%
| |||||||||
| 1. | Cash net interest income includes income relating to assets held for sale and income earned on assets prior to divestment. |
| 2. | In the March 2017 half, the Group changed its calculation of net interest margin to net home loan deposit offset balances against total interest earning assets. Average home loan deposit offset balances for the March 2017 half for the Australia division were $24,979 million (Sep 16 half: $23,653 million; Mar 16 half: $22,996 million). |
| 3. | Balance Sheet amounts as at 31 March 2017 include assets and liabilities held for sale. |
Group net interest margin – March 2017 Half Year v March 2016 Half Year
20
GROUP RESULTS
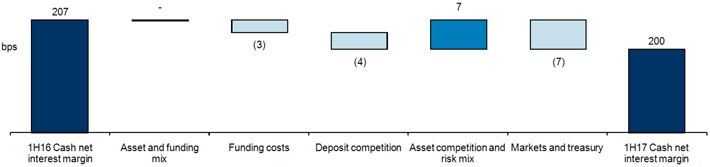
| • | March 2017 v March 2016 |
Net interest margin (-7 bps)
| • | Asset mix and funding mix (0 bps): favourable mix impact from a higher proportion of capital and run-off of lower margin lending products in Institutional, offset by the adverse mix impact from the Esanda Dealer Finance divestment and improved funding mix. |
| • | Funding costs (-3 bps): adverse impact due to increased wholesale funding costs. |
| • | Deposit competition (-4 bps): lower margin from increased competition in Australia and New Zealand, partially offset by improved margins in Asia. |
| • | Asset competition and risk mix (+7 bps): increase driven by Home Loans repricing. |
| • | Markets and treasury (-7 bps): adverse impact to earnings on capital as the result of lower interest rates, growth in the liquidity portfolio and lower earnings from markets activities. |
Average interest earning assets (+$12.5 billion or +2%)
| • | Average gross loans and advances (+$5.2 billion or +1%): increase driven by growth in Home Loans, partially offset by a decline in Institutional lending due to portfolio rebalancing. |
| • | Average trading and available for sale assets (+$5.7 billion or +6%): increase driven by growth in the liquidity portfolio. |
| • | Average cash (+$2.2 billion or +4%): increase as the result of management of liquidity requirements. |
Average deposits and other borrowings (+$10.1 billion or +2%)
| • | Average deposits and other borrowings (+$10.1 billion or +2%): increase driven by growth in customer deposits across Australia, Institutional and New Zealand divisions, offset by a decline in Treasury (commercial paper). |
Group net interest margin – March 2017 Half Year v September 2016 Half Year
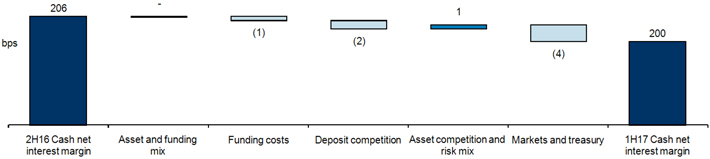
| • | March 2017 v September 2016 |
Net interest margin (-6 bps)
| • | Asset mix and funding mix (0 bps): favourable mix impact from a higher proportion of capital and run-off of lower margin loan products in Institutional, offset by adverse mix impact from lower growth in Cards in the Australia division and improved funding mix. |
| • | Funding costs (-1 bps): adverse impact due to increased wholesale funding costs. |
| • | Deposit competition (-2 bps): lower margin from increased competition in Australia and New Zealand, partially offset by improved margins in Asia. |
| • | Asset competition and risk mix (+1 bps): driven by Home Loan repricing, partially offset by lower Institutional and Commercial lending margins. |
| • | Markets and treasury (-4 bps): adverse impact to earnings on capital as the result of lower interest rates, growth in the liquidity portfolio and lower earnings from markets activities. |
Average interest earning assets (+$13.6 billion or +2%)
| • | Average gross loans and advances (+$4.8 billion or +1%): increase driven by growth in Home Loans, partially offset by a decline in Institutional lending due to portfolio rebalancing. |
| • | Average trading and available for sale assets (+$4.1 billion or +4%): increase driven by growth in the liquidity portfolio. |
| • | Average cash (+7.2 billion or +16%): increase as the result of management of liquidity requirements. |
Average deposits and other borrowings (+$11.7 billion or +2%)
| • | Average deposits and other borrowings (+$11.7 billion or +2%): increase driven by growth in customer deposits across Australia, New Zealand and Institutional divisions, offset by a decline in Treasury (commercial paper). |
21
GROUP RESULTS
Other operating income
| Half Year
|
Movement
| |||||||||||||||||||
|
|
Mar 17 |
|
Sep 16 | Mar 16 | Mar 17 | Mar 17 | ||||||||||||||
| $M | $M | $M | v. Sep 16 | v. Mar 16 | ||||||||||||||||
| Net fee and commission income1 |
1,177 | 1,201 | 1,236 | -2% | -5% | |||||||||||||||
| Net funds management and insurance income1 |
668 | 747 | 771 | -11% | -13% | |||||||||||||||
| Markets other operating income2 |
886 | 365 | 401 | large | large | |||||||||||||||
| Share of associates’ profit1 |
173 | 243 | 301 | -29% | -43% | |||||||||||||||
| Net foreign exchange earnings1 |
157 | 149 | 141 | 5% | 11% | |||||||||||||||
| Other1,3
|
|
(174)
|
|
|
37
|
|
(93)
|
|
large
|
|
-87%
| |||||||||
| Cash other operating income
|
2,887 | 2,742 | 2,757 | 5% | 5% | |||||||||||||||
| Half Year
|
Movement
| |||||||||||||||||||
| Mar 17 | Sep 16 | Mar 16 | Mar 17 | Mar 17 | ||||||||||||||||
| Markets income |
$M | $M | $M | v. Sep 16 | v. Mar 16 | |||||||||||||||
|
Net interest income |
478 | 472 | 560 | 1% | -15% | |||||||||||||||
| Other operating income2
|
|
886
|
|
|
365
|
|
401
|
|
large
|
|
large
| |||||||||
| Cash Markets income
|
1,364 | 837 | 961 | 63% | 42% | |||||||||||||||
| Half Year
|
Movement
| |||||||||||||||||||
| Mar 17 | Sep 16 | Mar 16 | Mar 17 | Mar 17 | ||||||||||||||||
| Other operating income by division |
$M | $M | $M | v. Sep 16 | v. Mar 16 | |||||||||||||||
| Australia |
602 | 597 | 609 | 1% | -1% | |||||||||||||||
| Institutional2 |
1,357 | 817 | 916 | 66% | 48% | |||||||||||||||
| New Zealand |
317 | 329 | 315 | -4% | 1% | |||||||||||||||
| Wealth Australia |
539 | 605 | 639 | -11% | -16% | |||||||||||||||
| Asia Retail & Pacific |
(139) | 235 | 243 | large | large | |||||||||||||||
| TSO and Group Centre3
|
|
211
|
|
|
159
|
|
35
|
|
33%
|
|
large
| |||||||||
| Cash other operating income
|
2,887 | 2,742 | 2,757 | 5% | 5% | |||||||||||||||
| 1. | Excluding Markets. |
| 2. | Markets other operating income for the September 2016 half includes a charge of $237 million related to the derivative CVA methodology change. |
| 3. | Other income for the March 2017 half includes the $324 million charge related to the sale of Retail & Wealth businesses in Asia, and the $114 million gain on sale of 100 Queen Street, Melbourne. The March 2016 half includes the $260 million impairment of the investment in AmBank, the $29 million gain on cessation of equity accounting of BoT, and the $66 million gain on the Esanda Dealer Finance divestment. |
Other operating income – March 2017 Half Year v March 2016 Half Year
22
GROUP RESULTS
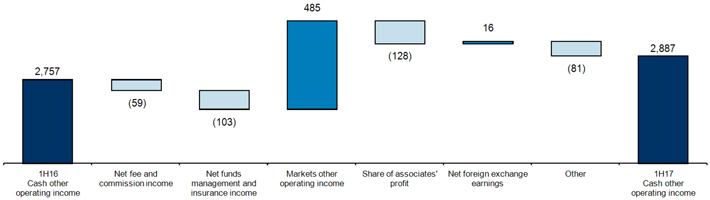
| • | March 2017 v March 2016 |
Other operating income increased by $130 million (+5%). Key drivers:
Net fee and commission income (-$59 million or -5%)
| • | $37 million decrease as the result of lower performance in Asia Retail & Pacific. |
| • | $22 million decrease in Institutional primarily due to portfolio rebalancing. |
Net funds management and insurance income (-$103 million or -13%)
| • | $104 million decrease in Wealth Australia primarily due to adverse disability claims, partially offset by favourable Lenders Mortgage Insurance experience, reduced fee income as expected from ongoing rationalisation of legacy investment platforms to SmartChoice and lower income from invested capital. |
Cash Markets income (+$403 million or +42%)
| • | $258 million increase in Franchise Trading as the result of favourable trading conditions arising from a strengthening USD and rising yield curves. Tighter credit spreads, combined with the impact of foreign exchange and interest rate movements resulted in an increase of $197 million from derivative credit and funding valuation adjustments, net of associated hedges. |
| • | $204 million increase in Balance Sheet Trading reflecting growth in the liquidity portfolio and tighter bond spreads. |
| • | $59 million decrease in Franchise Sales due to reduced client hedging activity as a result of low FX volatility and the low interest rate environment. |
Share of associates’ profit (-$128 million or -43%)
| • | $165 million decrease due to the cessation of equity accounting for BoT from March 2016 and SRCB from January 2017. |
| • | $33 million increase due to P.T. Bank Pan Indonesia. |
Other (-$81 million or -87%)
| • | $324 million decrease as a result of the sale of Retail and Wealth businesses in Asia. |
| • | $66 million decrease due to the Esanda Dealer Finance gain on divestment taken in the March 2016 half. |
| • | $29 million decrease due to a valuation gain on cessation of equity accounting for BoT in the March 2016 half. |
| • | $260 million increase due to the impairment of the investment in AmBank in the March 2016 half. |
| • | $114 million gain on sale of 100 Queen Street, Melbourne. |
| • | March 2017 v September 2016 |
Other operating income increased by $145 million (+5%). Key drivers:
Net fee and commission income (-$24 million or -2%)
| • | $35 million decrease as the result of lower performance in Asia Retail & Pacific. |
Net funds management and insurance income (-$79 million or -11%)
| • | $66 million decrease in Wealth Australia primarily due to adverse disability and lump sum claims, partially offset by favourable Lenders Mortgage Insurance experience, reduced fee income as expected from ongoing rationalisation of legacy investment platforms to SmartChoice and lower returns from the guaranteed business and invested capital. |
Cash Markets income (+$527 million or +63%)
| • | Excluding the $237 million charge relating to the derivative CVA methodology change in the September 2016 half, Markets income increased $290 million. |
| • | $231 million increase in Franchise Trading primarily attributed to valuation adjustments net of associated hedges as a result of tighter credit spreads combined with the impact of foreign exchange and interest rate movements. |
| • | $118 million increase in Balance Sheet Trading due to tighter bond spreads. |
| • | $59 million decrease in Franchise Sales due to lower client flows as a result of reduced volumes of debt issuances in Asia and New Zealand. |
Share of associates’ profit (-$70 million or -29%)
| • | $64 million loss of income due to the cessation of equity accounting for SRCB from January 2017. |
Other (-$211 million)
| • | $324 million charge as the result of the sale of Retail and Wealth businesses in Asia. |
| • | $114 million gain on sale of 100 Queen Street, Melbourne. |
23
GROUP RESULTS
Operating Expenses
| Half Year
|
Movement
| |||||||||||||||||||
| Mar 17 | Sep 16 | Mar 16 | Mar 17 | Mar 17 | ||||||||||||||||
| $M | $M | $M | v. Sep 16 | v. Mar 16 | ||||||||||||||||
| Personnel expenses |
2,648 | 2,740 | 2,801 | -3% | -5% | |||||||||||||||
| Premises expenses |
457 | 470 | 458 | -3% | 0% | |||||||||||||||
| Technology expenses1 |
831 | 834 | 1,333 | 0% | -38% | |||||||||||||||
| Restructuring expenses |
36 | 140 | 138 | -74% | -74% | |||||||||||||||
| Other expenses
|
|
759
|
|
|
767
|
|
758
|
|
-1%
|
|
0%
| |||||||||
| Total cash operating expenses
|
|
4,731
|
|
|
4,951
|
|
5,488
|
|
-4%
|
|
-14%
| |||||||||
| Full time equivalent staff (FTE) |
46,046 | 46,554 | 48,896 | -1% | -6% | |||||||||||||||
| Average full time equivalent staff (FTE)
|
|
46,462
|
|
|
47,489
|
|
49,777
|
|
-2%
|
|
-7%
| |||||||||
| 1. | Technology expenses include a $556 million charge associated with accelerated amortisation from the software capitalisation policy changes in the March 2016 half. Refer to page 12 for further details. |
| Half Year
|
Movement
| |||||||||||||||||||
| Mar 17 | Sep 16 | Mar 16 | Mar 17 | Mar 17 | ||||||||||||||||
| Expenses by division |
$M | $M | $M | v. Sep 16 | v. Mar 16 | |||||||||||||||
| Australia |
1,693 | 1,731 | 1,695 | -2% | 0% | |||||||||||||||
| Institutional |
1,379 | 1,445 | 1,513 | -5% | -9% | |||||||||||||||
| New Zealand |
600 | 635 | 590 | -6% | 2% | |||||||||||||||
| Wealth Australia |
370 | 391 | 410 | -5% | -10% | |||||||||||||||
| Asia Retail & Pacific |
353 | 379 | 429 | -7% | -18% | |||||||||||||||
| TSO and Group Centre
|
|
336
|
|
|
370
|
|
851
|
|
-9%
|
|
-61%
| |||||||||
| Total cash operating expenses
|
|
4,731
|
|
|
4,951
|
|
5,488
|
|
-4%
|
|
-14%
| |||||||||
Operating expenses – March 2017 Half Year v March 2016 Half Year
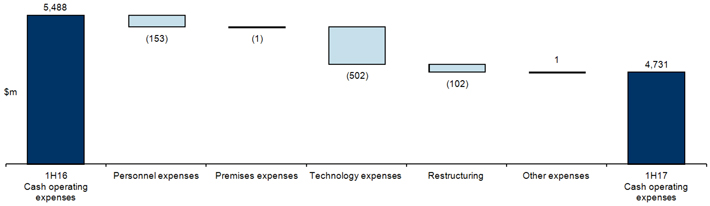
| • | March 2017 v March 2016 |
Operating expenses decreased 14% reflecting a number of specified items taken in the March 2016 half. Excluding specified items, operating expenses were down 1%.
| • | Personnel expenses decreased $153 million (-5%) due to a 7% reduction in average FTE, partially offset by wage inflation. |
| • | Technology expenses decreased $502 million (-38%) primarily as the result of software capitalisation policy charges of $556 million in the March 2016 half. Excluding this, Technology expenses increased $54 million (+7%) due to higher amortisation from software. |
| • | Restructuring expenses decreased $102 million (-74%) with larger investment in 2016 at the reset of the Group’s strategy. |
| • | March 2017 v September 2016 |
Operating expenses decreased 4%. Excluding specified items, operating expenses decreased 2%.
| • | Personnel expenses decreased $92 million (-3%) due to a 2% reduction in average FTE, partially offset by wage inflation. |
| • | Restructuring expenses decreased $104 million (-74%) with larger investment in 2016 at the reset of the Group’s strategy. |
24
GROUP RESULTS
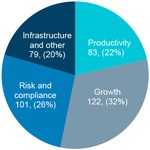
Technology infrastructure spend
Technology infrastructure spend includes expenditure that develops and enhances the Group’s technology infrastructure to meet business and strategic objectives and to improve capability and efficiency. The analysis below aggregates all projects over $1 million. Spend on projects less than $1 million was $84 million in the March 2017 half (Sep 16 half: $92 million; Mar 16 half $83 million).
| Half Year
|
Movement
| |||||||||||||||||||
| Mar 17 | Sep 16 | Mar 16 | Mar 17 | Mar 17 | ||||||||||||||||
| $M | $M | $M | v. Sep 16 | v. Mar 16 | ||||||||||||||||
| Expensed investment spend |
225 | 254 | 272 | -11% | -17% | |||||||||||||||
| Capitalised investment spend |
160 | 203 | 197 | -21% | -19% | |||||||||||||||
| Technology infrastructure spend
|
|
385
|
|
|
457
|
|
469
|
|
-16%
|
|
-18%
| |||||||||
| Comprising | Half Year
|
Movement
| ||||||||||||||||||
| Mar 17 | Sep 16 | Mar 16 | Mar 17 | Mar 17 | ||||||||||||||||
| $M | $M | $M | v. Sep 16 | v. Mar 16 | ||||||||||||||||
| Growth |
122 | 147 | 186 | -17% | -34% | |||||||||||||||
| Productivity |
83 | 84 | 87 | -1% | -5% | |||||||||||||||
| Risk and compliance |
101 | 114 | 115 | -11% | -12% | |||||||||||||||
| Infrastructure and other |
79 | 112 | 81 | -29% | -2% | |||||||||||||||
| Technology infrastructure spend
|
|
385
|
|
|
457
|
|
469
|
|
-16%
|
|
-18%
| |||||||||
| Technology infrastructure spend breakdown: | Mar-17 $M
| |||
| • | March 2017 v March 2016: The reduced investment in the March 2017 half reflects lower investment in Wealth Australia and Institutional as well as productivity initiatives to reduce costs of project delivery. |
| ||
| • | March 2017 v September 2016: The reduced investment in the March 2017 half reflects the recalibration of investment spend for a simpler and less complex organisation. Project delivery initiatives delivered savings across all divisions and expenditure on productivity initiatives was maintained. | |||
| Technology infrastructure spend by division
|
Half Year
|
Movement
| ||||||||||||||||||
| Mar 17 | Sep 16 | Mar 16 | Mar 17 | Mar 17 | ||||||||||||||||
| $M | $M | $M | v. Sep 16 | v. Mar 16 | ||||||||||||||||
| Australia |
130 | 131 | 143 | -1% | -9% | |||||||||||||||
| Institutional |
60 | 79 | 96 | -24% | -38% | |||||||||||||||
| New Zealand |
31 | 38 | 37 | -18% | -16% | |||||||||||||||
| Asia Retail & Pacific |
1 | 3 | 4 | -67% | -75% | |||||||||||||||
| Wealth Australia |
25 | 24 | 45 | 4% | -44% | |||||||||||||||
| TSO and Group Centre |
138 | 182 | 144 | -24% | -4% | |||||||||||||||
| Technology infrastructure spend
|
|
385
|
|
|
457
|
|
469
|
|
-16%
|
|
-18%
| |||||||||
25
GROUP RESULTS
Software capitalisation
As at 31 March 2017, the Group’s intangible assets included $1,922 million of costs incurred to acquire and develop software. Details are set out in the table below:
| Half Year
|
Movement
| |||||||||||||||||||
| Mar 17 | Sep 16 | Mar 16 | Mar 17 | Mar 17 | ||||||||||||||||
| $M | $M | $M | v. Sep 16 | v. Mar 16 | ||||||||||||||||
|
Balance at start of period |
2,202 | 2,249 | 2,893 | -2% | -24% | |||||||||||||||
| Software capitalised during the period |
172 | 222 | 209 | -23% | -18% | |||||||||||||||
| Amortisation during the period |
||||||||||||||||||||
| - Current period amortisation |
(295) | (255) | (245) | 16% | 20% | |||||||||||||||
| - Accelerated amortisation |
- | - | (556) | n/a | -100% | |||||||||||||||
| Software impaired/written-off |
||||||||||||||||||||
| - Reclassification of Asia Retail & Wealth to held for sale1 |
(154) | (3) | (1) | large | large | |||||||||||||||
| - Other |
(1) | (22) | (1) | -95% | 0% | |||||||||||||||
| Foreign exchange differences
|
|
(2)
|
|
|
11
|
|
(50)
|
|
large
|
|
-96%
| |||||||||
| Total capitalised software
|
|
1,922
|
|
|
2,202
|
|
2,249
|
|
-13%
|
|
-15%
| |||||||||
| Net book value by Division | As at
|
Movement
| ||||||||||||||||||
| Mar 17 | Sep 16 | Mar 16 | Mar 17 | Mar 17 | ||||||||||||||||
| $M | $M | $M | v. Sep 16 | v. Mar 16 | ||||||||||||||||
|
Australia |
459 | 488 | 514 | -6% | -11% | |||||||||||||||
| Institutional |
608 | 782 | 853 | -22% | -29% | |||||||||||||||
| New Zealand |
26 | 27 | 24 | -4% | 8% | |||||||||||||||
| Wealth Australia |
19 | 20 | 24 | -5% | -21% | |||||||||||||||
| Asia Retail & Pacific1 |
- | 63 | 67 | -100% | -100% | |||||||||||||||
| TSO and Group Centre
|
|
810
|
|
|
822
|
|
767
|
|
-1%
|
|
6%
| |||||||||
| Total
|
|
1,922
|
|
|
2,202
|
|
2,249
|
|
-13%
|
|
-15%
| |||||||||
| 1. | Reclassification of Asia Retail & Wealth to held for sale includes impairment to software supporting both the Institutional and Asia Retail & Wealth businesses. There has been no impairment to software supporting the Institutional business. These impairment charges are recognised as other operating income in the Condensed Consolidated Income Statement. |
26
GROUP RESULTS
Credit risk
| Half Year
|
Half Year
|
Movement
| ||||||||||||||||||||||||||||||||||||||
| Mar 17 | Mar 16 | Mar 17 v. Mar 16 | ||||||||||||||||||||||||||||||||||||||
| Division |
Individual charge $M |
Collective charge $M |
Total charge $M |
Individual charge $M |
Collective charge $M |
Total charge $M |
Individual charge % |
Collective charge % |
Total charge % | |||||||||||||||||||||||||||||||
| Australia |
430 | 42 | 472 | 429 | 33 | 462 | 0% | 27% | 2% | |||||||||||||||||||||||||||||||
| Institutional |
210 | (85) | 125 | 340 | (16) | 324 | -38% | large | -61% | |||||||||||||||||||||||||||||||
| New Zealand |
61 | (24) | 37 | 43 | (1) | 42 | 42% | large | -12% | |||||||||||||||||||||||||||||||
| Asia Retail & Pacific |
86 | (11) | 75 | 80 | 10 | 90 | 8% | large | -17% | |||||||||||||||||||||||||||||||
| TSO and Group Centre |
- | 11 | 11 | - | - | - | n/a | n/a | n/a | |||||||||||||||||||||||||||||||
|
Total |
787 | (67) | 720 | 892 | 26 | 918 | -12% | large | -22% | |||||||||||||||||||||||||||||||
| Half Year
|
Half Year
|
Movement
| ||||||||||||||||||||||||||||||||||||||
| Mar 17 | Sep 16 | Mar 17 v. Sep 16 | ||||||||||||||||||||||||||||||||||||||
| Division |
Individual charge $M |
Collective charge $M |
Total charge $M |
Individual charge $M |
Collective charge $M |
Total charge $M |
Individual charge % |
Collective charge % |
Total charge % | |||||||||||||||||||||||||||||||
| Australia |
430 | 42 | 472 | 469 | (11) | 458 | -8% | large | 3% | |||||||||||||||||||||||||||||||
| Institutional |
210 | (85) | 125 | 436 | (17) | 419 | -52% | large | -70% | |||||||||||||||||||||||||||||||
| New Zealand |
61 | (24) | 37 | 61 | 17 | 78 | 0% | large | -53% | |||||||||||||||||||||||||||||||
| Asia Retail & Pacific |
86 | (11) | 75 | 81 | 1 | 82 | 6% | large | -9% | |||||||||||||||||||||||||||||||
| TSO and Group Centre |
- | 11 | 11 | - | 1 | 1 | n/a | large | large | |||||||||||||||||||||||||||||||
|
Total |
787 | (67) | 720 | 1,047 | (9) | 1,038 | -25% | large | -31% | |||||||||||||||||||||||||||||||
Individual credit impairment charge
| Half Year
|
Movement
| |||||||||||||||||||
|
Mar 17 $M |
Sep 16 $M |
Mar 16 $M |
Mar 17 v. Sep 16 |
Mar 17 v. Mar 16 | ||||||||||||||||
| New and increased individual credit impairments |
||||||||||||||||||||
| Australia |
617 | 623 | 600 | -1% | 3% | |||||||||||||||
| Institutional |
299 | 491 | 355 | -39% | -16% | |||||||||||||||
| New Zealand |
102 | 106 | 96 | -4% | 6% | |||||||||||||||
| Asia Retail & Pacific |
104 | 101 | 100 | 3% | 4% | |||||||||||||||
|
New and increased individual credit impairments |
1,122 | 1,321 | 1,151 | -15% | -3% | |||||||||||||||
| Recoveries and write-backs |
||||||||||||||||||||
| Australia |
(187) | (154) | (171) | 21% | 9% | |||||||||||||||
| Institutional |
(89) | (55) | (15) | 62% | large | |||||||||||||||
| New Zealand |
(41) | (45) | (53) | -9% | -23% | |||||||||||||||
| Asia Retail & Pacific |
(18) | (20) | (20) | -10% | -10% | |||||||||||||||
|
Recoveries and write-backs |
(335) | (274) | (259) | 22% | 29% | |||||||||||||||
|
Total individual credit impairment charge |
787 | 1,047 | 892 | -25% | -12% | |||||||||||||||
| • | March 2017 v March 2016 |
The individual credit impairment charge decreased $105 million (-$12%) driven by a $76 million (+29%) increase in recoveries and write-backs and a $29 million (-3%) decrease in new and existing provisions. The Institutional division individual credit impairment charge decreased $130 million (-38%) reflecting an overall net reduction in resource and commodity stresses across the portfolio and higher single name customer write-backs in the March 2017 half.
| • | March 2017 v September 2016 |
The individual credit impairment charge decreased $260 million (-25%) driven primarily by a $226 million (-52%) decrease in the Institutional division reflecting the one-off settlement of the Oswal legal dispute in the September 2016 half, and an overall net reduction in resource and commodity stresses across the portfolio in the March 2017 half. A $39 million (-8%) decrease in Australia division individual credit impairment charge is predominantly the result of higher recoveries and write-backs in the Small Business Banking portfolio.
27
GROUP RESULTS
Collective credit impairment charge
| Half Year
|
Movement
| |||||||||||||||||
| Collective credit impairment charge/(release) by source |
Mar 17 $M |
Sep 16 $M |
Mar 16 $M |
Mar 17 v. Sep 16 |
Mar 17 v. Mar 16 | |||||||||||||
| Lending growth |
(30) | (59) | 56 | -49% | large | |||||||||||||
| Risk profile |
(78) | 50 | (30) | large | large | |||||||||||||
| Economic cycle adjustment |
41 | - | - | n/a | n/a | |||||||||||||
|
Total collective credit impairment charge/(release) |
|
(67) |
|
(9) | 26 | large | large | |||||||||||
| • | March 2017 v March 2016 |
The collective credit impairment charge decreased $93 million driven by the Institutional division as the result of customer migration from collective to individual provisioning, and a reduction in lending assets to improve the Institutional risk profile in line with portfolio rebalancing, partially offset by a management adjustment for the Queensland cyclone.
| • | March 2017 v September 2016 |
The collective credit impairment release increased $58 million driven by the Institutional division as the result of customer migration from collective to individual provisioning, and a reduction in lending assets to improve the Institutional risk profile in line with portfolio rebalancing, partially offset by a management adjustment for the Queensland cyclone.
Provision for credit impairment
| As at
|
As at
|
Movement
| ||||||||||||||||||||||||||||||||||||
| Mar 17 | Mar 16 | Mar 17 v Mar 16 | ||||||||||||||||||||||||||||||||||||
| Division |
Individual provision $M |
Collective provision $M1 |
Total provision $M |
Individual provision $M |
Collective provision $M1 |
Total provision $M |
Individual provision % |
Collective provision % |
Total provision % | |||||||||||||||||||||||||||||
| Australia |
647 | 1,230 | 1,877 | 547 | 1,204 | 1,751 | 18% | 2% | 7% | |||||||||||||||||||||||||||||
| Institutional |
470 | 1,024 | 1,494 | 556 | 1,126 | 1,682 | -15% | -9% | -11% | |||||||||||||||||||||||||||||
| New Zealand |
135 | 335 | 470 | 114 | 337 | 451 | 18% | -1% | 4% | |||||||||||||||||||||||||||||
| Asia Retail & Pacific |
17 | 182 | 199 | 21 | 192 | 213 | -19% | -5% | -7% | |||||||||||||||||||||||||||||
| TSO and Group Centre |
- | 14 | 14 | - | 3 | 3 | n/a | large | large | |||||||||||||||||||||||||||||
|
Total |
1,269 | 2,785 | 4,054 | 1,238 | 2,862 | 4,100 | 3% | -3% | -1% | |||||||||||||||||||||||||||||
| As at
|
As at
|
Movement
| ||||||||||||||||||||||||||||||||||||
| Mar 17 | Sep 16 | Mar 17 v. Sep 16 | ||||||||||||||||||||||||||||||||||||
| Division |
Individual provision $M |
Collective provision $M1 |
Total provision $M |
Individual provision $M |
Collective provision $M1 |
Total provision $M |
Individual provision % |
Collective provision % |
Total provision % | |||||||||||||||||||||||||||||
| Australia |
647 | 1,230 | 1,877 | 606 | 1,188 | 1,794 | 7% | 4% | 5% | |||||||||||||||||||||||||||||
| Institutional |
470 | 1,024 | 1,494 | 569 | 1,114 | 1,683 | -17% | -8% | -11% | |||||||||||||||||||||||||||||
| New Zealand |
135 | 335 | 470 | 117 | 374 | 491 | 15% | -10% | -4% | |||||||||||||||||||||||||||||
| Asia Retail & Pacific |
17 | 182 | 199 | 15 | 196 | 211 | 13% | -7% | -6% | |||||||||||||||||||||||||||||
| TSO and Group Centre |
- | 14 | 14 | - | 4 | 4 | n/a | large | large | |||||||||||||||||||||||||||||
|
Total |
1,269 | 2,785 | 4,054 | 1,307 | 2,876 | 4,183 | -3% | -3% | -3% | |||||||||||||||||||||||||||||
| 1. | The collective provision includes amounts for off-balance sheet credit exposures of $574 million as at 31 March 2017 (Sep 2016: $631 million; Mar 2016: $633 million). The impact on the income statement for the half year ended 31 March 2017 was a $46 million release (Sep 2016 half: $35 million release; Mar 2016 half: $3 million charge). |
28
GROUP RESULTS
Gross Impaired Assets
| As at
|
Movement
| |||||||||||||||
|
Mar 17 $M |
Sep 16 $M |
Mar 16 $M |
Mar 17 v. Sep 16 |
Mar 17 v. Mar 16 | ||||||||||||
|
Impaired loans |
2,478 | 2,646 | 2,564 | -6% | -3% | |||||||||||
| Restructured items1 |
367 | 403 | 226 | -9% | 62% | |||||||||||
| Non-performing commitments and contingencies
|
95
|
124
|
93
|
|
-23%
|
|
2%
| |||||||||
|
Gross impaired assets |
2,940 | 3,173 | 2,883 | -7% | 2% | |||||||||||
| Individual provisions |
||||||||||||||||
| Impaired loans |
(1,253) | (1,278) | (1,209) | -2% | 4% | |||||||||||
| Non-performing commitments and contingencies
|
(16)
|
(29)
|
(29)
|
|
-45%
|
|
-45%
| |||||||||
|
Net impaired assets
|
1,671
|
1,866
|
1,645
|
|
-10%
|
|
2%
| |||||||||
| Gross impaired assets by division |
||||||||||||||||
| Australia |
1,227 | 1,170 | 1,093 | 5% | 12% | |||||||||||
| Institutional |
1,061 | 1,405 | 1,282 | -24% | -17% | |||||||||||
| New Zealand |
409 | 346 | 273 | 18% | 50% | |||||||||||
| Asia Retail & Pacific
|
243
|
252
|
235
|
|
-4%
|
|
3%
| |||||||||
|
Gross impaired assets
|
2,940
|
3,173
|
2,883
|
|
-7%
|
|
2%
| |||||||||
| Gross impaired assets by size of exposure |
||||||||||||||||
| Less than $10 million |
1,724 | 1,784 | 1,597 | -3% | 8% | |||||||||||
| $10 million to $100 million |
1,106 | 899 | 970 | 23% | 14% | |||||||||||
| Greater than $100 million
|
110
|
490
|
316
|
|
-78%
|
|
-65%
| |||||||||
|
Gross impaired assets
|
2,940
|
3,173
|
2,883
|
|
-7%
|
|
2%
| |||||||||
| 1. | Restructured items are facilities where the original contractual terms have been modified for reasons related to the financial difficulties of the customer. Restructuring may consist of reduction of interest, principal or other payments legally due, or an extension in maturity materially beyond those typically offered to new facilities with similar risk. |
| • | March 2017 v March 2016 |
Gross impaired assets increased $57 million (+2%) driven by the Australia and New Zealand divisions offset by a decrease in Institutional. The Australia division increase of $134 million (+12%) is due to Home Loans, Small Business Banking and Corporate Banking. The New Zealand division increase of $136 million (+50%) is driven by a small number of large single name exposures in the Commercial and Agri portfolios. The Institutional decrease of $221 million (-17%) is due to higher write-offs and repayments on a small number of large exposures, including the Oswal legal dispute. The Group’s individual provision coverage ratio on impaired assets was 43.2% at 31 March 2017 (42.9% at 31 March 2016).
| • | March 2017 v September 2016 |
Gross impaired assets decreased $233 million (-7%) mainly driven by a decrease in the Institutional division of $344 million (-24%) as the result of higher write-offs and repayments on a small number of large exposures, including the Oswal legal dispute. The Australia division increase of $57 million (+5%) is due to Home Loans, Small Business Banking and Corporate Banking. The New Zealand division increase of $63 million (+18%) is due to a small number of large single name exposures in the Commercial and Agri portfolios. The Group’s individual provision coverage ratio on impaired assets was 43.2% at 31 March 2017 (41.2% at 30 September 2016).
New Impaired Assets
| Half Year
|
Movement
|
|||||||||||||||||
|
Mar 17 $M |
Sep 16 $M |
Mar 16 $M |
Mar 17 v. Sep 16 |
Mar 17 v. Mar 16 |
||||||||||||||
|
Impaired loans |
1,637 | 1,610 | 1,657 | 2% | -1% | |||||||||||||
| Restructured items |
88 | 193 | 81 | -54% | 9% | |||||||||||||
| Non-performing commitments and contingencies
|
62
|
41
|
|
46
|
|
|
51%
|
|
|
35%
|
| |||||||
|
Total new impaired assets
|
1,787
|
1,844
|
|
1,784
|
|
|
-3%
|
|
|
0%
|
| |||||||
| New impaired assets by division |
||||||||||||||||||
| Australia |
816 | 927 | 777 | -12% | 5% | |||||||||||||
| Institutional |
547 | 499 | 652 | 10% | -16% | |||||||||||||
| New Zealand |
296 | 290 | 194 | 2% | 53% | |||||||||||||
| Asia Retail & Pacific
|
128
|
128
|
|
161
|
|
|
0%
|
|
|
-20%
|
| |||||||
|
Total new impaired assets
|
1,787
|
1,844
|
|
1,784
|
|
|
-3%
|
|
|
0%
|
| |||||||
29
GROUP RESULTS
| • | March 2017 v March 2016 |
New impaired assets were broadly flat. The Institutional division decreased as the result of an improved risk profile from portfolio rebalancing. This was partially offset by increases in the New Zealand division as the result of a small number of large single name exposures in the Commercial and Agri portfolios, and an increase in the Australia division due to delinquencies in the Retail portfolio.
| • | March 2017 v September 2016 |
New impaired assets decrease was driven by the Australia division reflecting large single name Asset Finance impairments taken in the September 2016 half, partially offset by an increase in Institutional due to impairments on a small number of single name customer exposures.
Ageing analysis of net loans and advances that are past due but not impaired
| As at
|
Movement
| |||||||||||||
|
Mar 17 $M |
Sep 16 $M |
Mar 16 $M |
Mar 17 v. Sep 16 |
Mar 17 v. Mar 16 | ||||||||||
|
1-29 days |
9,123 | 7,966 | 8,868 | 15% | 3% | |||||||||
| 30-59 days |
2,355 | 1,910 | 2,292 | 23% | 3% | |||||||||
| 60-89 days |
1,148 | 1,070 | 1,193 | 7% | -4% | |||||||||
| >90 days
|
2,771
|
2,703
|
2,573
|
|
3%
|
|
8%
| |||||||
|
Total
|
15,397
|
13,649
|
14,926
|
|
13%
|
|
3%
| |||||||
| • | March 2017 v March 2016 |
The 90 days past due but not impaired increased by $198 million (+8%) due to Home Loans growth and portfolio deterioration predominantly in Western Australia and Queensland. There was also some deterioration in the Regional Business Banking and Small Business Banking portfolios.
| • | March 2017 v September 2016 |
The 90 days past due but not impaired increased by $68 million (+3%) primarily within the Australia division from portfolio deterioration in the Regional Business Banking and Small Business Banking portfolios.
Income tax expense
| Half Year
|
Movement
|
|||||||||||||||||
|
Mar 17 $M |
Sep 16 $M |
Mar 16 $M |
Mar 17 v. Sep 16 |
Mar 17 v. Mar 16 |
||||||||||||||
|
Income tax expense on cash profit |
1,433 | 1,166 | 1,133 | 23% | 26% | |||||||||||||
| Effective tax rate (cash profit)
|
29.5%
|
27.2%
|
|
28.9%
|
|
|
2.3%
|
|
|
0.6%
|
| |||||||
| • | March 2017 v March 2016 |
The effective tax rate increased from 28.9% to 29.5%. The 60 basis point increase was primarily due to reduced offshore earnings which have a lower average tax rate (+60 bps), a reduction in equity accounted earnings (+120 bps) as well as the non-recurrence of a tax provision release from the March 2016 half (+70 bps). This was partially offset by the non-tax deductible impairment of AmBank in the March 2016 half (-200 bps).
| • | March 2017 v September 2016 |
The effective tax rate increased from 27.2% to 29.5%. The 230 basis point increase was primarily due to reduced offshore earnings which have a lower average tax rate (+40 bps), a reduction in equity accounted earnings (+60 bps) as well as the non-recurrence of a tax provision release from the September 2016 half (+100 bps).
30
GROUP RESULTS
Impact of foreign currency translation
The following tables present the Group’s cash profit results and net loans and advances neutralised for the impact of foreign currency translation. Comparative data has been adjusted to remove the translation impact of foreign currency movements by retranslating prior period comparatives at current period foreign exchange rates.
Cash Profit - March 2017 Half Year vs March 2016 Half Year
| Half Year | Movement | |||||||||||||||||||||||||||||
| Actual |
FX unadjusted |
FX impact |
FX adjusted |
FX unadjusted |
FX impact |
FX adjusted |
||||||||||||||||||||||||
|
Mar 17 $M |
Mar 16 $M |
Mar 16 $M |
Mar 16 $M |
Mar 17 v. Mar 16 |
Mar 17 v. Mar 16 |
Mar 17 v. Mar 16 |
||||||||||||||||||||||||
|
Net interest income |
7,416 | 7,568 | (12) | 7,556 | -2% | 0% | -2% | |||||||||||||||||||||||
| Other operating income
|
|
2,887
|
|
|
2,757
|
|
|
(35)
|
|
|
2,722
|
|
|
5%
|
|
|
-1%
|
|
|
6%
|
| |||||||||
|
Operating income |
|
10,303 |
|
|
10,325 |
|
|
(47) |
|
|
10,278 |
|
|
0% |
|
|
0% |
|
|
0% |
| |||||||||
| Operating expenses
|
|
(4,731)
|
|
|
(5,488)
|
|
|
45
|
|
|
(5,443)
|
|
|
-14%
|
|
|
-1%
|
|
|
-13%
|
| |||||||||
|
Profit before credit impairment and income tax |
|
5,572 |
|
|
4,837 |
|
|
(2) |
|
|
4,835 |
|
|
15% |
|
|
0% |
|
|
15% |
| |||||||||
| Credit impairment charge
|
|
(720)
|
|
|
(918)
|
|
|
8
|
|
|
(910)
|
|
|
-22%
|
|
|
-1%
|
|
|
-21%
|
| |||||||||
|
Profit before income tax |
|
4,852 |
|
|
3,919 |
|
|
6 |
|
|
3,925 |
|
|
24% |
|
|
0% |
|
|
24% |
| |||||||||
| Income tax expense |
(1,433) | (1,133) | (10) | (1,143) | 26% | 1% | 25% | |||||||||||||||||||||||
| Non-controlling interests
|
(8) | (4) | 1 | (3) | 100% | large | large | |||||||||||||||||||||||
|
Cash profit
|
|
3,411
|
|
|
2,782
|
|
|
(3)
|
|
|
2,779
|
|
|
23%
|
|
|
0%
|
|
|
23%
|
| |||||||||
|
Cash Profit by Division - March 2017 Half Year vs March 2016 Half Year
|
| |||||||||||||||||||||||||||||
| Half Year | Movement | |||||||||||||||||||||||||||||
| Actual |
FX unadjusted |
FX impact |
FX adjusted |
FX unadjusted |
FX impact |
FX adjusted |
||||||||||||||||||||||||
|
Mar 17 |
Mar 16 $M |
Mar 16 $M |
Mar 16 $M |
Mar 17 v. Mar 16 |
Mar 17 v. Mar 16 |
Mar 17 v. Mar 16 |
||||||||||||||||||||||||
|
Australia |
1,798 | 1,769 | - | 1,769 | 2% | 0% | 2% | |||||||||||||||||||||||
| Institutional |
1,021 | 633 | (9) | 624 | 61% | -3% | 64% | |||||||||||||||||||||||
| New Zealand |
677 | 646 | 15 | 661 | 5% | 3% | 2% | |||||||||||||||||||||||
| Wealth Australia |
123 | 167 | - | 167 | -26% | 0% | -26% | |||||||||||||||||||||||
| Asia Retail & Pacific |
(217) | 60 | (1) | 59 | large | 6% | large | |||||||||||||||||||||||
| TSO and Group Centre
|
|
9
|
|
|
(493)
|
|
|
(8)
|
|
|
(501)
|
|
|
large
|
|
|
0%
|
|
|
large
|
| |||||||||
|
Cash profit by division
|
|
3,411
|
|
|
2,782
|
|
|
(3)
|
|
|
2,779
|
|
|
23%
|
|
|
0%
|
|
|
23%
|
| |||||||||
|
Net loans and advances by Division - March 2017 Half Year vs March 2016 Half Year
|
| |||||||||||||||||||||||||||||
| As at | Movement | |||||||||||||||||||||||||||||
| Actual |
FX unadjusted |
FX impact |
FX adjusted |
FX unadjusted |
FX impact |
FX adjusted |
||||||||||||||||||||||||
|
Mar 17 $B |
Mar 16 $B |
Mar 16 $B |
Mar 16 $B |
Mar 17 v. Mar 16 |
Mar 17 v. Mar 16 |
Mar 17 v. Mar 16 |
||||||||||||||||||||||||
|
Australia |
336.7 | 321.4 | - | 321.4 | 5% | 0% | 5% | |||||||||||||||||||||||
| Institutional |
120.8 | 125.6 | 0.2 | 125.8 | -4% | 0% | -4% | |||||||||||||||||||||||
| New Zealand1 |
104.9 | 99.2 | 1.4 | 100.6 | 6% | 2% | 4% | |||||||||||||||||||||||
| Wealth Australia |
1.8 | 1.9 | - | 1.9 | -5% | 0% | -5% | |||||||||||||||||||||||
| Asia Retail & Pacific1 |
12.5 | 13.9 | 0.1 | 14.0 | -10% | 1% | -11% | |||||||||||||||||||||||
| TSO and Group Centre
|
|
(0.4)
|
|
|
(0.2)
|
|
|
-
|
|
|
(0.2)
|
|
|
100%
|
|
|
0%
|
|
|
100%
|
| |||||||||
|
Net loans and advances by division1
|
|
576.3
|
|
|
561.8
|
|
|
1.7
|
|
|
563.5
|
|
|
3%
|
|
|
1%
|
|
|
2%
|
| |||||||||
| 1. | Net loans and advances as at 31 March 2017 include net loans and advances held for sale. |
31
GROUP RESULTS
Cash Profit - March 2017 Half Year vs September 2016 Half Year
| Half Year | Movement | |||||||||||||||||||||
| Actual |
FX unadjusted |
FX impact |
FX adjusted |
FX unadjusted |
FX impact |
FX adjusted |
||||||||||||||||
|
Mar 17 $M |
Sep 16 $M |
Sep 16 $M |
Sep 16 $M |
Mar 17 v. Sep 16 |
Mar 17 v. Sep 16 |
Mar 17 v. Sep 16 |
||||||||||||||||
|
Net interest income |
7,416 | 7,527 | - | 7,527 | -1% | 0% | -1% | |||||||||||||||
| Other operating income
|
|
2,887
|
|
2,742
|
2
|
|
2,744
|
|
5%
|
0%
|
|
5%
|
| |||||||||
|
Operating income |
|
10,303 |
|
10,269 |
2 |
|
10,271 |
|
0% |
0% |
|
0% |
| |||||||||
| Operating expenses
|
|
(4,731)
|
|
(4,951)
|
6
|
|
(4,945)
|
|
-4%
|
0%
|
|
-4%
|
| |||||||||
|
Profit before credit impairment and income tax |
|
5,572 |
|
5,318 |
8 |
|
5,326 |
|
5% |
0% |
|
5% |
| |||||||||
| Credit impairment charge
|
|
(720)
|
|
(1,038)
|
2
|
|
(1,036)
|
|
-31%
|
0%
|
|
-31%
|
| |||||||||
|
Profit before income tax |
|
4,852 |
|
4,280 |
10 |
|
4,290 |
|
13% |
0% |
|
13% |
| |||||||||
| Income tax expense |
(1,433) | (1,166) | (5) | (1,171) | 23% | 1% | 22% | |||||||||||||||
| Non-controlling interests
|
|
(8)
|
|
(7)
|
-
|
|
(7)
|
|
14%
|
0%
|
|
14%
|
| |||||||||
|
Cash profit
|
|
3,411
|
|
3,107
|
5
|
|
3,112
|
|
10%
|
0%
|
|
10%
|
| |||||||||
|
Cash Profit by Division - March 2017 Half Year vs September 2016 Half Year
|
| |||||||||||||||||||||
| Half Year | Movement | |||||||||||||||||||||
| Actual |
FX unadjusted |
FX impact |
FX |
FX |
FX impact |
FX adjusted |
||||||||||||||||
|
Mar 17 $M |
Sep 16 $M |
Sep 16 $M |
Sep 16 $M |
Mar 17 v. Sep 16 |
Mar 17 v. Sep 16 |
Mar 17 v. Sep 16 |
||||||||||||||||
|
Australia |
1,798 | 1,778 | - | 1,778 | 1% | 0% | 1% | |||||||||||||||
| Institutional |
1,021 | 408 | 2 | 410 | large | 1% | large | |||||||||||||||
| New Zealand |
677 | 622 | 2 | 624 | 9% | 1% | 8% | |||||||||||||||
| Wealth Australia |
123 | 157 | - | 157 | -22% | 0% | -22% | |||||||||||||||
| Asia Retail & Pacific |
(217) | 99 | - | 99 | large | 0% | large | |||||||||||||||
| TSO and Group Centre
|
|
9
|
|
43
|
1
|
|
44
|
|
-79%
|
1%
|
|
-80%
|
| |||||||||
|
Cash profit by division
|
|
3,411
|
|
3,107
|
5
|
|
3,112
|
|
10%
|
0%
|
|
10%
|
| |||||||||
|
Net loans and advances by Division - March 2017 Half Year vs September 2016 Half Year
|
| |||||||||||||||||||||
| As at
|
Movement
|
|||||||||||||||||||||
| Actual |
FX unadjusted |
FX impact |
FX adjusted |
FX unadjusted |
FX impact |
FX adjusted |
||||||||||||||||
|
Mar 17 $B |
Sep 16 $B |
Sep 16 $B |
Sep 16 $B |
Mar 17 v. Sep 16 |
Mar 17 v. Sep 16 |
Mar 17 v. Sep 16 |
||||||||||||||||
|
Australia |
336.7 | 327.1 | - | 327.1 | 3% | 0% | 3% | |||||||||||||||
| Institutional |
120.8 | 125.9 | (0.7) | 125.2 | -4% | 0% | -4% | |||||||||||||||
| New Zealand1 |
104.9 | 107.9 | (4.5) | 103.4 | -3% | -4% | 1% | |||||||||||||||
| Wealth Australia |
1.8 | 2.0 | - | 2.0 | -10% | 0% | -10% | |||||||||||||||
| Asia Retail & Pacific1 |
12.5 | 13.4 | - | 13.4 | -7% | 0% | -7% | |||||||||||||||
| TSO and Group Centre
|
|
(0.4)
|
|
(0.4)
|
-
|
|
(0.4)
|
|
0%
|
0%
|
|
0%
|
| |||||||||
|
Net loans and advances by division1
|
|
576.3
|
|
575.9
|
(5.2)
|
|
570.7
|
|
0%
|
-1%
|
|
1%
|
| |||||||||
| 1. | Net loans and advances as at 31 March 2017 include net loans and advances held for sale. |
32
GROUP RESULTS
Earnings related hedges
The Group has taken out economic hedges against larger foreign exchange denominated revenue streams (primarily New Zealand Dollar, US Dollar and US Dollar correlated). New Zealand Dollar exposure relates to the New Zealand geography and USD exposures relate to APEA. Details of these hedges are set out below.
| Half Year
| ||||||
| NZD Economic hedges |
Mar 17 $M |
Sep 16 $M |
Mar 16 $M | |||
|
Net open NZD position (notional principal)1 |
3,347 | 3,161 | 3,119 | |||
| Amount taken to income (pre-tax statutory basis)2 |
125 | (172) | (2) | |||
| Amount taken to income (pre-tax cash basis)3 |
(19) | (6) | (2) | |||
| USD Economic hedges |
||||||
|
Net open USD position (notional principal)1 |
- | - | 85 | |||
| Amount taken to income (pre-tax statutory basis)2 |
- | (3) | 24 | |||
| Amount taken to income (pre-tax cash basis)3
|
-
|
(24)
|
(34)
| |||
| 1. | Value in AUD at contracted rate. |
| 2. | Unrealised valuation movement plus realised revenue from matured or closed out hedges. |
| 3. | Realised revenue from closed hedges. |
As at 31 March 2017, the following hedges were in place to partially hedge future earnings against adverse movements in exchange rates:
| • | NZD 3.7 billion at a forward rate of approximately NZD 1.09 / AUD. |
There were no USD hedges in place or impacting income for the March 2017 half.
During the March 2017 half:
| • | NZD 0.9 billion of economic hedges matured and a realised loss of $19 million (pre-tax) was recorded in cash profit. |
| • | An unrealised gain of $144 million (pre-tax) on the outstanding NZD economic hedges was recorded in the statutory income statement during the half. This unrealised gain has been treated as an adjustment to statutory profit in calculating cash profit as these are hedges of future NZD revenues. |
Earnings per share
| Half Year
|
Movement
| |||||||||||
| Mar 17 | Sep 16 | Mar 16 |
Mar 17 v. Sep 16 |
Mar 17 v. Mar 16 | ||||||||
|
Cash earnings per share (cents) |
||||||||||||
| Basic |
116.7 | 106.7 | 95.9 | 9% | 22% | |||||||
| Diluted |
111.9 | 102.0 | 90.7 | 10% | 23% | |||||||
| Cash weighted average number of ordinary shares (M)1 |
||||||||||||
| Basic |
2,923.7 | 2,911.6 | 2,901.4 | 0% | 1% | |||||||
| Diluted |
3,180.8 | 3,192.6 | 3,229.5 | 0% | -2% | |||||||
| Cash profit ($M) |
3,411 | 3,107 | 2,782 | 10% | 23% | |||||||
| Cash profit used in calculating diluted cash earnings per share ($M)
|
3,559
|
3,257
|
2,929
|
9%
|
22%
| |||||||
| 1 | Cash weighted average number of ordinary shares included treasury shares held in Wealth Australia as the associated gains and losses were included in cash profit. |
33
GROUP RESULTS
Dividends
| Half Year
|
Movement
| |||||||||||
| Dividend per ordinary share (cents) | Mar 17 | Sep 16 | Mar 16 |
Mar 17 v. Sep 16 |
Mar 17 v. Mar 16 | |||||||
|
Interim (fully franked)1 |
80 | - | 80 | n/a | 0% | |||||||
| Final (fully franked)
|
-
|
80
|
-
|
n/a
|
n/a
| |||||||
|
Total (fully franked) |
80 |
80 |
80 |
0% |
0% | |||||||
| Ordinary share dividends used in payout ratio ($M)2 |
2,349 | 2,342 | 2,334 | 0% | 1% | |||||||
| Cash profit ($M) |
3,411 | 3,107 | 2,782 | 10% | 23% | |||||||
| Ordinary share dividend payout ratio (cash basis)2
|
68.9%
|
75.4%
|
83.9%
|
-8.6%
|
-17.9%
| |||||||
| 1 | Interim dividend for 2017 is proposed. |
| 2 | Dividend payout ratio is calculated using proposed 2017 interim dividend of $2,349 million, which is based on the forecast number of ordinary shares on issue at the dividend record date. Dividend payout ratios for the September and March 2016 half were calculated using actual dividend paid of $2,342 million and $2,334 million respectively. |
The Directors propose that an interim dividend of 80 cents be paid on each eligible fully paid ANZ ordinary share on 3 July 2017. The proposed 2017 interim dividend will be fully franked for Australian tax purposes, and New Zealand imputation credits of NZD 9 cents per ordinary share will also be attached.
Economic profit
| Half Year
|
Movement
| |||||||||||
|
Mar 17 $M |
Sep 16 $M |
Mar 16 $M |
Mar 17 v. Sep 16 |
Mar 17 v. Mar 16 | ||||||||
|
Statutory profit attributable to shareholders of the Company |
2,911 | 2,971 | 2,738 | -2% | 6% | |||||||
| Adjustments between statutory profit and cash profit
|
500
|
136
|
44
|
large
|
large
| |||||||
|
Cash Profit |
3,411 |
3,107 |
2,782 |
10% |
23% | |||||||
| Economic credit cost adjustment |
(211) | 23 | (71) | large | large | |||||||
| Imputation credits
|
721
|
592
|
568
|
22%
|
27%
| |||||||
|
Economic return |
3,921 |
3,722 |
3,279 |
5% |
20% | |||||||
| Cost of capital |
(2,610) | (2,563) | (2,589) | 2% | 1% | |||||||
|
Economic profit
|
1,311
|
1,159
|
690
|
13%
|
90%
| |||||||
Economic profit is a risk adjusted profit measure used to evaluate business unit performance and is considered in determining the variable component of remuneration packages. This is used for internal management purposes and is not subject to audit.
Economic profit is calculated via a series of adjustments to cash profit. The economic credit cost adjustment replaces the actual credit loss charge with internal expected loss based on the average loss per annum on the portfolio over an economic cycle. The benefit of imputation credits is recognised, measured at 70% of Australian tax. The cost of capital is a major component of economic profit. At the ANZ Group level, this is calculated using average ordinary shareholders’ equity (excluding non-controlling interests) multiplied by the cost of capital rate (currently 9% and applied across comparative periods). At a business unit level, capital is allocated based on economic capital, whereby higher risk businesses attract higher levels of capital. This method is designed to help drive appropriate risk management and ensure business returns align with the relevant credit, operational, market and other risks.
Economic profit increased by $621 million (+90%) against the March 2016 half due to a 23% increase in cash profit, partially offset by higher economic credit costs.
Economic profit increased by $152 million (+13%) against the September 2016 half due to a 10% increase in cash profit, partially offset by higher economic credit costs.
34
GROUP RESULTS
Condensed balance sheet
| As at
|
Movement
| |||||||||||
| Assets |
Mar 17 $B |
Sep 16 $B |
Mar 16 $B |
Mar 17 v. Sep 16 |
Mar 17 v. Mar 16 | |||||||
|
Cash / Settlement balances owed to ANZ / Collateral paid |
89.3 | 83.3 | 88.0 | 7% | 1% | |||||||
| Trading and available for sale assets |
108.8 | 110.3 | 100.5 | -1% | 8% | |||||||
| Derivative financial instruments |
63.9 | 87.5 | 88.7 | -27% | -28% | |||||||
| Net loans and advances1 |
564.0 | 575.9 | 561.8 | -2% | 0% | |||||||
| Investment backing policy liabilities |
37.6 | 35.7 | 34.5 | 5% | 9% | |||||||
| Assets held for sale |
14.1 | - | - | n/a | n/a | |||||||
| Other1
|
18.8
|
22.2
|
21.8
|
-15%
|
-14%
| |||||||
|
Total assets
|
896.5
|
914.9
|
895.3
|
-2%
|
0%
| |||||||
|
Liabilities |
||||||||||||
| Settlement balances owed by ANZ / Collateral received |
14.9 | 17.0 | 20.2 | -12% | -26% | |||||||
| Deposits and other borrowings1 |
581.4 | 588.2 | 578.1 | -1% | 1% | |||||||
| Derivative financial instruments |
65.1 | 88.7 | 91.7 | -27% | -29% | |||||||
| Debt issuances |
88.8 | 91.1 | 81.9 | -3% | 8% | |||||||
| Policy liabilities and external unit holder liabilities |
41.3 | 39.5 | 38.4 | 5% | 8% | |||||||
| Liabilities held for sale |
17.2 | - | - | n/a | n/a | |||||||
| Other1 |
29.9 | 32.5 | 28.5 | -8% | 5% | |||||||
|
Total liabilities
|
838.6
|
857.0
|
838.8
|
-2%
|
0%
| |||||||
|
Total equity
|
57.9
|
57.9
|
56.5
|
0%
|
2%
| |||||||
| 1. | Balance as at 31 March 2017 exclude assets and liabilities reclassified to held for sale. |
| • | March 2017 v March 2016 |
| • | Trading and available for sale assets increased $8.3 billion (+8%), primarily driven by increased liquidity portfolio holdings due to balance sheet growth in Markets. |
| • | Derivative financial assets and liabilities decreased $24.8 billion (-28%) and $26.6 billion (-29%) respectively as foreign exchange rate and interest rate movements resulted in lower derivative fair values. |
| • | Net loans and advances increased $2.2 billion (flat). Adjusting for a reclassification of $12.3 billion to assets held for sale, the $14.5 billion increase was primarily driven by home loan growth across Australia (+$15.3 billion) and New Zealand (+$5.7 billion) divisions, partially offset by a $4.8 billion decrease in Institutional division as a result of portfolio rebalancing and a $1.3 billion reduction in Asia Retail & Pacific. |
| • | Settlement balances owed by ANZ / Collateral received decreased by $5.3 billion (-26%), driven by a decrease in settlement balances held by Markets (-$2.6 billion) and Treasury (-$2.6 billion). |
| • | Deposits and other borrowings increased $3.3 billion (+1%). Adjusting for a reclassification of $17.0 billion to liabilities held for sale, the $20.3 billion increase was driven by growth in customer deposits largely across Australia, New Zealand and Institutional (+$21.4 billion), growth in deposits from banks and other borrowings (+$18.1 billion), partially offset by reduction in commercial paper and certificates of deposit (-$19.2 billion). |
| • | Debt issuances increased $6.9 billion (+8%) driven by new issuances. |
| • | March 2017 v September 2016 |
| • | Cash / Settlement balances owed to ANZ / Collateral paid increased by $6.0 billion (+7%), primarily driven by increased cash and settlement balances held by Markets and Treasury. |
| • | Derivative financial assets and liabilities both decreased by $23.6 billion (-27%) as foreign exchange rate and interest rate movements resulted in lower derivative fair values. |
| • | Net loans and advances decreased $11.9 billion (-2%). Adjusting for a reclassification of $12.3 billion to assets held for sale and a significant $5.2 billion decrease due to foreign currency translation, the $5.6 billion increase was primarily driven by home loan growth across Australia (+$9.6 billion) and New Zealand (+$1.5 billion) divisions, partially offset by a $4.4 billion decrease in the Institutional division as a result of portfolio rebalancing and a $0.8 billion decrease in Asia Retail & Pacific. |
| • | Deposits and other borrowings decreased $6.8 billion (-1%). Adjusting for a reclassification of $17.0 billion to liabilities held for sale and a significant $5.7 billion decrease due to foreign currency translation, the $15.9 billion increase was driven by growth in customer deposits largely across Australia, New Zealand and Institutional (+$23.8 billion), growth in deposits from banks and other borrowings (+$5.7 billion), partially offset by reduction in commercial paper and certificates of deposit (-$13.5 billion). |
Assets and liabilities held for sale as at 31 March 2017 reflect the reclassification of Asia Retail and Wealth businesses, UDC Finance and Shanghai Rural Commercial Bank assets and liabilities to held for sale. Refer to Note 11 to the financial statements for further details.
35
GROUP RESULTS
Liquidity risk
Liquidity risk is the risk that the Group is unable to meet its payment obligations as they fall due, including repaying depositors or maturing wholesale debt, or that the Group has insufficient capacity to fund increases in assets. The timing mismatch of cash flows and the related liquidity risk is inherent in all banking operations and is closely monitored by the Group and managed in accordance with the risk appetite set by the Board.
The Group’s approach to liquidity risk management incorporates two key components:
| • | Scenario modelling of funding sources |
ANZ’s liquidity risk appetite is defined by the ability to meet a range of regulatory requirements and internal liquidity metrics mandated by the Board. The metrics cover a range of scenarios of varying duration and level of severity. The objective of this framework is to:
| • | Provide protection against shorter-term extreme market dislocation and stress. |
| • | Maintain structural strength in the balance sheet by ensuring that an appropriate amount of longer-term assets are funded with longer-term funding. |
| • | Ensure that no undue timing concentrations exist in the Group’s funding profile. |
A key component of this framework is the Liquidity Coverage Ratio (LCR), which is a severe short term liquidity stress scenario mandated by banking regulators including APRA. As part of meeting LCR requirements, ANZ has a Committed Liquidity Facility (CLF) with the Reserve Bank of Australia (RBA). The CLF has been established to offset the shortage of available High Quality Liquid Assets (HQLA) in Australia and provides an alternative form of contingent liquidity. The total amount of the CLF available to a qualifying ADI is set annually by APRA.
| • | Liquid assets |
The Group holds a portfolio of high quality unencumbered liquid assets in order to protect the Group’s liquidity position in a severely stressed environment, as well as to meet regulatory requirements. High Quality Liquid Assets comprise three categories, with the definitions consistent with Basel 3 LCR:
| • | Highest-quality liquid assets (HQLA1): Cash, highest credit quality government, central bank or public sector securities eligible for repurchase with central banks to provide same-day liquidity. |
| • | High-quality liquid assets (HQLA2): High credit quality government, central bank or public sector securities, high quality corporate debt securities and high quality covered bonds eligible for repurchase with central banks to provide same-day liquidity. |
| • | Alternative liquid assets (ALA): Assets qualifying as collateral for the CLF and other eligible securities listed by the Reserve Bank of New Zealand (RBNZ). |
The Group monitors and manages the size and composition of its liquid assets portfolio on an ongoing basis in line with regulatory requirements and the risk appetite set by the Board.
| Half Year Average
|
Movement
| |||||||||||||||||||
| Mar 17 $B |
Sep 16 $B |
Mar 16 $B |
Mar 17 v. Sep 16 |
Mar 17 | ||||||||||||||||
| Market Values Post Discount1 |
||||||||||||||||||||
| HQLA12 |
127.1 | 119.7 | 117.2 | 6% | 8% | |||||||||||||||
| HQLA2 |
4.3 | 4.1 | 3.3 | 5% | 30% | |||||||||||||||
| Internal Residential Mortgage Backed Securities (Australia)2 |
33.7 | 35.3 | 35.1 | -5% | -4% | |||||||||||||||
| Internal Residential Mortgage Backed Securities (New Zealand)3 |
0.6 | 1.2 | 1.5 | -50% | -60% | |||||||||||||||
| Other ALA4
|
15.6
|
|
17.7
|
|
|
18.6
|
|
|
-12%
|
|
-16%
| |||||||||
|
Total Liquid Assets
|
181.3
|
|
178.0
|
|
|
175.7
|
|
|
2%
|
|
3%
| |||||||||
| Cash flows modelled under stress scenario |
||||||||||||||||||||
| Cash outflows |
172.7 | 182.9 | 181.0 | -6% | -5% | |||||||||||||||
| Cash inflows |
38.2 | 40.2 | 42.1 | -5% | -9% | |||||||||||||||
|
Net cash outflows
|
134.5
|
|
142.7
|
|
|
138.9
|
|
|
-6%
|
|
-3%
| |||||||||
|
Liquidity Coverage Ratio5
|
135%
|
|
125%
|
|
|
126%
|
|
|
10%
|
|
9%
| |||||||||
| 1. | Half year average basis, calculated as prescribed per APRA Prudential Regulatory Standard (APS 210 Liquidity) and consistent with APS 330 requirements. |
| 2. | RBA open repo arrangement netted down from CLF, with a corresponding increase in HQLA. |
| 3. | New Zealand LCR surplus is excluded from NZ internal RMBS, consistent with APS 330 treatment. |
| 4. | Comprised of assets qualifying as collateral for the CLF, excluding internal RMBS, up to approved facility limit; and any liquid assets contained in the RBNZ’s Liquidity Policy - Annex: Liquidity Assets - Prudential Supervision Department Document BS13A12. |
| 5. | All currency Level 2 LCR. |
36
GROUP RESULTS
Funding
ANZ targets a diversified funding base, avoiding undue concentrations by investor type, maturity, market source and currency.
$15.5 billion of term wholesale debt with a remaining term greater than one year as at 31 March 2017 was issued during the half year ended 31 March 2017. The weighted average tenor of new term debt was 5.1 years.
The following tables show the Group’s total funding composition:
| As at
|
Movement
|
|||||||||||||||||||||||
|
Mar 17 $M |
Sep 16 $M |
Mar 16 $M |
Mar 17 v. Sep 16 |
Mar 17 v. Mar 16 |
||||||||||||||||||||
|
Customer deposits and other liabilities1 |
||||||||||||||||||||||||
|
Australia |
197,632 | 187,667 | 184,226 | 5% | 7% | |||||||||||||||||||
| Institutional |
179,326 | 171,155 | 176,157 | 5% | 2% | |||||||||||||||||||
| New Zealand |
74,266 | 72,818 | 67,951 | 2% | 9% | |||||||||||||||||||
| Wealth Australia |
326 | 343 | 362 | -5% | -10% | |||||||||||||||||||
| Asia Retail & Pacific |
21,867 | 22,782 | 23,496 | -4% | -7% | |||||||||||||||||||
| TSO and Group Centre1
|
|
(5,202)
|
|
|
(5,142)
|
|
|
(5,414)
|
|
|
1%
|
|
|
-4%
|
| |||||||||
|
Customer deposits |
468,215 | 449,623 | 446,778 | 4% | 5% | |||||||||||||||||||
| Other funding liabilities2 |
|
15,362
|
|
|
14,531
|
|
|
16,127
|
|
|
6%
|
|
|
-5%
|
| |||||||||
|
Total customer liabilities (funding)
|
|
483,577
|
|
|
464,154
|
|
|
462,905
|
|
|
4%
|
|
|
4%
|
| |||||||||
| Wholesale funding3 |
||||||||||||||||||||||||
| Debt issuances |
88,778 | 91,080 | 81,947 | -3% | 8% | |||||||||||||||||||
| Subordinated debt |
20,297 | 21,964 | 17,557 | -8% | 16% | |||||||||||||||||||
| Certificates of deposit |
57,428 | 61,429 | 65,077 | -7% | -12% | |||||||||||||||||||
| Commercial paper |
9,482 | 19,349 | 21,065 | -51% | -55% | |||||||||||||||||||
| Other wholesale borrowings4,5
|
|
66,433
|
|
|
65,442
|
|
|
56,391
|
|
|
2%
|
|
|
18%
|
| |||||||||
|
Total wholesale funding
|
|
242,418
|
|
|
259,264
|
|
|
242,037
|
|
|
-6%
|
|
|
0%
|
| |||||||||
|
Shareholders’ equity
|
|
57,908
|
|
|
57,927
|
|
|
56,464
|
|
|
0%
|
|
|
3%
|
| |||||||||
|
Total funding
|
|
783,903
|
|
|
781,345
|
|
|
761,406
|
|
|
0%
|
|
|
3%
|
| |||||||||
| As at
|
Movement
|
|||||||||||||||||||||||
|
Mar 17 $M |
Sep 16 $M |
Mar 16 $M |
Mar 17 v. Sep 16 |
Mar 17 v. Mar 16 |
||||||||||||||||||||
|
Funded assets |
||||||||||||||||||||||||
| Other short term assets & trade finance assets6 |
60,008 | 65,800 | 68,015 | -9% | -12% | |||||||||||||||||||
| Liquids5
|
|
168,030
|
|
|
161,302
|
|
|
147,419
|
|
|
4%
|
|
|
14%
|
| |||||||||
|
Short term funded assets |
228,038 | 227,102 | 215,434 | 0% | 6% | |||||||||||||||||||
| Lending & fixed assets7
|
|
555,865
|
|
|
554,243
|
|
|
545,972
|
|
|
0%
|
|
|
2%
|
| |||||||||
|
Total funded assets
|
|
783,903
|
|
|
781,345
|
|
|
761,406
|
|
|
0%
|
|
|
3%
|
| |||||||||
| Funding liabilities3,5 |
||||||||||||||||||||||||
| Other short term liabilities |
48,022 | 48,806 | 40,360 | -2% | 19% | |||||||||||||||||||
| Short term funding |
53,495 | 69,028 | 73,559 | -23% | -27% | |||||||||||||||||||
| Term funding < 12 months |
20,968 | 23,668 | 22,224 | -11% | -6% | |||||||||||||||||||
| Other customer and central bank deposits1,8
|
|
84,880
|
|
|
79,597
|
|
|
87,632
|
|
|
7%
|
|
|
-3%
|
| |||||||||
|
Total short term funding liabilities
|
|
207,365
|
|
|
221,099
|
|
|
223,775
|
|
|
-6%
|
|
|
-7%
|
| |||||||||
|
Stable customer deposits1,9 |
416,775 | 402,146 | 392,151 | 4% | 6% | |||||||||||||||||||
| Term funding > 12 months |
93,556 | 90,708 | 81,589 | 3% | 15% | |||||||||||||||||||
| Shareholders’ equity and hybrid debt
|
|
66,207
|
|
|
67,392
|
|
|
63,891
|
|
|
-2%
|
|
|
4%
|
| |||||||||
|
Total stable funding
|
|
576,538
|
|
|
560,246
|
|
|
537,631
|
|
|
3%
|
|
|
7%
|
| |||||||||
|
Total funding
|
|
783,903
|
|
|
781,345
|
|
|
761,406
|
|
|
0%
|
|
|
3%
|
| |||||||||
| 1. | Includes term deposits, other deposits and an adjustment recognised in Group Centre to eliminate Wealth Australia investments in ANZ deposit products. |
| 2. | Includes interest accruals, payables and other liabilities, provisions and net tax provisions, excluding other liabilities in Wealth Australia. |
| 3. | Excludes liability for acceptances as they do not provide net funding. |
| 4. | Includes borrowings from banks, net derivative balances, special purpose vehicles and other borrowings. |
| 5. | Includes RBA open-repo arrangement netted down by the exchange settlement account cash balance. |
| 6. | Includes short-dated assets such as trading securities, available for sale securities, trade dated assets and trade finance loans. |
| 7. | Excludes trade finance loans. |
| 8. | Total customer liabilities (funding) plus Central Bank deposits less stable customer deposits. |
| 9. | Stable customer deposits represent operational type deposits or those sourced from retail / business / corporate customers and the stable component of other funding liabilities. |
37
GROUP RESULTS
Capital Management
| As at
|
||||||||||||||||||||||||||||
|
APRA Basel 3
|
Internationally Comparable Basel 31
|
|||||||||||||||||||||||||||
|
Mar 17 |
Sep 16 | Mar 16 | Mar 17 | Sep 16 | Mar 16 | |||||||||||||||||||||||
| Capital Ratios |
||||||||||||||||||||||||||||
|
Common Equity Tier 1 |
10.1% | 9.6% | 9.8% | 15.2% | 14.5% | 14.0% | ||||||||||||||||||||||
| Tier 1 |
12.1% | 11.8% | 11.6% | 18.2% | 17.4% | 16.2% | ||||||||||||||||||||||
| Total capital
|
|
14.5%
|
|
|
14.3%
|
|
|
13.7%
|
|
|
21.3%
|
|
|
20.7%
|
|
|
18.7%
|
| ||||||||||
|
Risk weighted assets ($B)
|
|
397.0
|
|
|
408.6
|
|
|
388.3
|
|
|
309.4
|
|
|
316.4
|
|
|
317.8
|
| ||||||||||
| 1. | Internationally Comparable methodology aligns with APRA’s information paper entitled “International Capital Comparison Study” (13 July 2015). |
APRA Basel 3 Common Equity Tier 1 (CET1) – March 2017 v September 2016
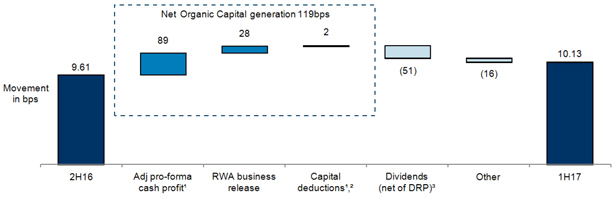
| 1. | Excludes specified items. Refer to page 12 for further details. |
| 2. | Capital deductions represent the movement in retained earnings in deconsolidated entities, capitalised software (excluding accounting changes relating to the capitalisation of internally generated software assets), EL versus EP shortfall and other intangibles in the period. |
| 3. | 8.6 million ordinary shares were issued under the Dividend Reinvestment Plan and Bonus Option Plan for the 2016 final dividend. |
| • | March 2017 v September 2016 |
ANZ’s CET1 ratio increased 52 bps to 10.1% during the March 2017 half. Key drivers of the movement in the CET1 ratio were:
| • | Net organic capital generation was 119 bps or $4.8 billion. This was primarily driven by cash profit (excluding specified items) and a net reduction in underlying RWA (excluding foreign exchange impacts, regulatory changes and other one-offs). The RWA reduction was mainly driven by a $8.7 billion decrease in Institutional Credit RWAs from lower lending, due to portfolio rebalancing. |
| • | Payment of the September 2016 Final Dividend (net of shares issued under the DRP) reduced the CET1 ratio by 51 bps. |
| • | Other items decreased CET1 by 16 bps reflecting net impacts from other RWA measurement changes, movement in non-cash earnings and net foreign currency translation. |
Total Risk Weighted Assets (RWA) – March 2017 v September 2016
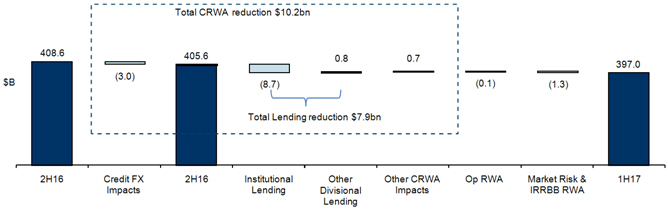
| • | March 2017 v September 2016 |
| • | ANZ’s total RWA decreased by $11.6 billion. Excluding the impact of foreign currency translation, Credit RWAs decreased by $7.2 billion primarily driven by a decline in Institutional lending. Non-credit RWA decreased by $1.4 billion mainly driven by lower risk profile in IRRBB RWA. |
38
GROUP RESULTS
APRA to Internationally Comparable1 Common Equity Tier 1 (CET1) as at 31 March 2017
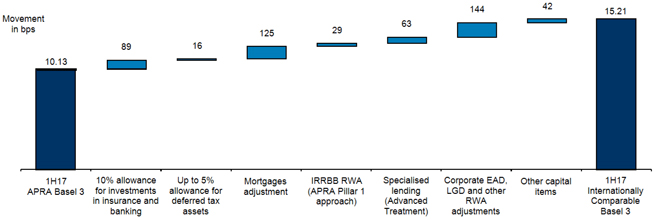
| 1. | ANZ’s interpretation of the regulations documented in the Basel Committee publications; “Basel 3: A global regulatory framework for more resilient banks and banking systems” (June 2011) and “International Convergence of Capital Measurement and Capital Standards” (June 2006). Also includes differences identified in APRA’s information paper entitled “International Capital Comparison Study” (13 July 2015). |
The above provides a reconciliation of the CET1 ratio under APRA’s Basel 3 prudential capital standards to Internationally Comparable Basel 3 standards. APRA views the Basel 3 reforms as a minimum requirement and hence has not incorporated some of the concessions proposed in the Basel 3 rules and has also set higher requirements in other areas. As a result, Australian banks’ Basel 3 reported capital ratios will not be directly comparable with international peers. The International Comparable Basel 3 CET1 ratio incorporates differences between APRA and both the Basel Committee Basel 3 framework (including differences identified in the March 2014 Basel Committee’s Regulatory Consistency Assessment Programme (RCAP) on Basel 3 implementation in Australia) and its application in major offshore jurisdictions.
The material differences between APRA’s Basel 3 and Internationally Comparable Basel 3 ratios include:
Deductions
| • | Investments in insurance and banking associates – APRA requires full deduction against CET1. On an Internationally Comparable basis, these investments are subject to a concessional threshold before a deduction is required. |
| • | Deferred tax assets – A full deduction is required from CET1 for deferred tax assets (DTA) relating to temporary differences. On an Internationally Comparable basis, this is first subject to a concessional threshold before the deduction is required. |
Risk Weighted Assets (RWA)
| • | IRRBB RWA – APRA requires inclusion of Interest Rate Risk in the Banking Book (IRRBB) within the RWA base for the CET1 ratio calculation. This is not required on an Internationally Comparable basis. |
| • | Mortgages RWA – APRA imposes a floor of 20% on the downturn Loss Given Default (LGD) used in credit RWA calculations for residential mortgages. Additionally, from July 2016, APRA also requires a higher correlation factor above the Basel framework 15% requirement in order to raise the average risk weighting of Australian residential mortgages to at least 25%. The Internationally Comparable Basel 3 framework only requires a downturn LGD floor of 10% and a correlation factor of 15%. |
| • | Specialised lending - APRA requires the supervisory slotting approach to be used in determining credit RWA for specialised lending exposures. The Internationally Comparable basis allows for the advanced internal ratings based approach to be used when calculating RWA for these exposures. |
| • | Unsecured Corporate Lending LGD – Adjustment to align ANZ’s unsecured corporate lending LGD to 45% to be consistent with banks in other jurisdictions. The 45% LGD rate is also used in the Foundation Internal Ratings-Based approach (FIRB). |
| • | Undrawn Corporate Lending Exposure at Default (EAD) – To adjust ANZ’s credit conversion factors (CCF) for undrawn corporate loan commitments to 75% (used in FIRB approach) to align with banks in other jurisdictions. |
39
GROUP RESULTS
Leverage Ratio
At 31 March 2017, the Group’s APRA Leverage Ratio was 5.3% which is above the 3% minimum currently proposed by the Basel Committee on Banking Supervision (BCBS). APRA has not finalised a minimum leverage ratio requirement for Australian ADIs. The following table summarises the Group’s Leverage Ratio calculation:
| As at
|
Movement
|
|||||||||||||||||||||||
|
Mar 17 $M |
Sep 16 $M |
Mar 16 $M |
Mar 17 v. Sep 16 |
Mar 17 v. Mar 16 |
||||||||||||||||||||
| Tier 1 Capital (net of capital deductions) |
48,091 | 48,285 | 45,062 | 0% | 7% | |||||||||||||||||||
| On-balance sheet exposures (excluding derivatives and securities financing transaction exposures) |
747,708 | 744,359 | 733,935 | 0% | 2% | |||||||||||||||||||
| Derivative exposures |
30,968 | 30,600 | 30,542 | 1% | 1% | |||||||||||||||||||
| Securities financing transaction (SFT) exposures |
30,286 | 31,417 | 21,420 | -4% | 41% | |||||||||||||||||||
| Other off-balance sheet exposures
|
|
97,492
|
|
|
98,460
|
|
|
102,953
|
|
|
-1%
|
|
|
-5%
|
| |||||||||
|
Total exposure measure
|
|
906,454
|
|
|
904,836
|
|
|
888,850
|
|
|
0%
|
|
|
2%
|
| |||||||||
|
APRA Leverage Ratio1
|
|
5.3%
|
|
|
5.3%
|
|
|
5.1%
|
|
|
0 bps
|
|
|
20 bps
|
| |||||||||
|
Internationally Comparable Leverage Ratio1
|
|
6.0%
|
|
|
6.0%
|
|
|
5.7%
|
|
|
0 bps
|
|
|
30 bps
|
| |||||||||
| 1. | Leverage ratio includes Additional Tier 1 securities subject to Basel 3 transitional relief, net of any transitional adjustments. |
| • | March 2017 v September 2016 |
ANZ’s leverage ratio is broadly flat relative to September 2016 due to capital generation from cash earnings (net of dividend payments) being offset by the buyback and cancellation of remaining CPS2 Additional Tier 1 Capital instruments of $1.1 billion not reinvested in CN4, and increased holdings of High Quality Liquid Assets.
Other regulatory developments
| • | Financial System Inquiry (FSI) |
The Australian Government completed a comprehensive inquiry into Australia’s financial system and the FSI final report was released on 7 December 2014. The contents of the report are wide-ranging and key recommendations that may have an impact on regulatory capital levels include:
| • | Setting capital standards such that Australian Authorised Deposit-taking Institutions’ (ADIs) capital ratios are unquestionably strong; |
| • | Raising the average internal ratings-based (IRB) mortgage risk weight to narrow the difference between average mortgage risk-weight for ADIs using IRB models and those using standardised risk weights; |
| • | Implementing a framework for minimum loss absorbing and recapitalisation capacity in line with emerging international practice; |
| • | Developing a common reporting template that improves the transparency and comparability of capital ratios of Australian ADIs; and |
| • | Introducing a leverage ratio that acts as a backstop to ADIs risk-based capital requirements, in line with the Basel framework. |
APRA supported the FSI’s recommendation that the capital ratios of ADIs should be unquestionably strong and, with effect from July 2016, APRA increased the capital requirements for Australian residential mortgage exposures for ADIs accredited to use the IRB approach to credit risk (including ANZ). APRA has also announced that further guidance regarding unquestionably strong capital requirements will be released in the middle of 2017. Further changes to the unquestionably strong framework may result in higher capital requirements for ADIs. Apart from the above, APRA has not made any announcements regarding the other key FSI recommendations. Therefore, the final outcomes from the FSI, including any impacts and the timing of these impacts on ANZ, remain uncertain.
| • | Net Stable Funding Ratio (NSFR) |
APRA has finalised its NSFR requirements for Australian ADIs and confirmed that the NSFR will become a minimum requirement on 1 January 2018. As part of managing future liquidity requirements, ANZ monitors the NSFR in its internal reporting and believe the Group is well placed to meet this requirement by the implementation date.
| • | Level 3 Conglomerates (Level 3) |
APRA is extending its prudential supervision framework to Conglomerate Groups via the Level 3 framework which will regulate a bancassurance group such as ANZ as a single economic entity with minimum capital requirements and additional monitoring of risk exposure levels.
In August 2016, APRA confirmed the deferral of capital requirements for Conglomerate Groups until 2019 at the earliest, to allow for the final capital requirements arising from FSI recommendations as well as from international initiatives that are in progress.
The non-capital components of the Level 3 framework relating to group governance, risk exposures, intragroup transactions and other risk management and compliance requirements will become effective on 1 July 2017. ANZ is not expecting any material impact on its operations based upon the current version of these standards.
| • | Current Proposals from the Basel Committee on Banking Supervision (BCBS) on RWA |
As part of the BCBS agenda to simplify RWA measurement and reduce their variability amongst banks, the BCBS has issued a number of consultation documents associated with:
| • | Standardised approach to RWA for credit risk; |
| • | Revisions to Standardised Measurement Approach to Operational Risk; |
40
GROUP RESULTS
| • | Fundamental Review of the Trading Book; |
| • | Interest Rate Risk in the Banking Book; |
| • | Framework on the imposition of capital floors based on standardised RWA approaches; and |
| • | Additional constraints on the use of internal models for credit RWA. |
Apart from the review of the Trading Book standard which has been finalised, BCBS is still currently consulting on the other proposals. The impacts of these changes on ANZ are subject to the final form of these BCBS proposals that APRA will implement for Australian ADIs.
41
GROUP RESULTS
This page has been left blank intentionally
42
DIVISIONAL RESULTS
CONTENTS
Divisional Results
Divisional performance
Australia
Institutional
New Zealand
Wealth Australia
Asia Retail & Pacific
Technology, Services & Operations (TSO) and Group Centre
43
DIVISIONAL RESULTS
Divisional Performance
During the March 2017 half, the Group made changes to the Group’s operating model for technology, operations and shared services to accelerate delivery of its technology and digital roadmap, bring operations closer to its customers and continue operational efficiency gains. As a result of these organisational changes, divisional operations from Technology, Services & Operations (“TSO”) and Group Centre have been realigned to divisions. The residual TSO and Group Centre now contains Group Technology, Group Hubs, Enterprise Services and Group Property and the Group Centre. The Group operates on a divisional structure with six divisions: Australia, New Zealand, Institutional, Asia Retail & Pacific, Wealth Australia and Technology, Services & Operations and Group Centre. For further information on the composition of divisions refer to the Definitions on page 119.
Other than the changes described above, there have been no other significant structural changes in the March 2017 half. However, certain prior period comparatives have been restated to align with current period presentation. The divisions reported below are consistent with internal reporting provided to the chief operating decision maker, being the Chief Executive Officer.
The Divisional Results section is reported on a cash profit basis.
| Australia | Institutional | New Zealand | Wealth Australia |
Asia Retail & Pacific |
TSO and Group Centre |
Group | ||||||||||||||||||||||
| March 2017 Half Year | $M | $M | $M | $M | $M | $M | $M | |||||||||||||||||||||
| Net interest income | 4,133 | 1,588 | 1,260 | 5 | 331 | 99 | 7,416 | |||||||||||||||||||||
| Other operating income | 602 | 1,357 | 317 | 539 | (139) | 211 | 2,887 | |||||||||||||||||||||
| Operating income | 4,735 | 2,945 | 1,577 | 544 | 192 | 310 | 10,303 | |||||||||||||||||||||
| Operating expenses | (1,693) | (1,379) | (600) | (370) | (353) | (336) | (4,731) | |||||||||||||||||||||
| Profit before credit impairment and income tax | 3,042 | 1,566 | 977 | 174 | (161) | (26) | 5,572 | |||||||||||||||||||||
| Credit impairment charge | (472) | (125) | (37) | - | (75) | (11) | (720) | |||||||||||||||||||||
| Profit before income tax | 2,570 | 1,441 | 940 | 174 | (236) | (37) | 4,852 | |||||||||||||||||||||
| Income tax expense and non-controlling interests | (772) | (420) | (263) | (51) | 19 | 46 | (1,441) | |||||||||||||||||||||
| Cash profit/(loss) | 1,798 | 1,021 | 677 | 123 | (217) | 9 | 3,411 | |||||||||||||||||||||
| Australia | Institutional | New Zealand | Wealth Australia |
Asia Retail & Pacific |
TSO and Group Centre |
Group | ||||||||||||||||||||||
| March 2016 Half Year | $M | $M | $M | $M | $M | $M | $M | |||||||||||||||||||||
| Net interest income | 4,077 | 1,800 | 1,206 | 6 | 351 | 128 | 7,568 | |||||||||||||||||||||
| Other operating income | 609 | 916 | 315 | 639 | 243 | 35 | 2,757 | |||||||||||||||||||||
| Operating income | 4,686 | 2,716 | 1,521 | 645 | 594 | 163 | 10,325 | |||||||||||||||||||||
| Operating expenses | (1,695) | (1,513) | (590) | (410) | (429) | (851) | (5,488) | |||||||||||||||||||||
| Profit before credit impairment and income tax | 2,991 | 1,203 | 931 | 235 | 165 | (688) | 4,837 | |||||||||||||||||||||
| Credit impairment charge | (462) | (324) | (42) | - | (90) | - | (918) | |||||||||||||||||||||
| Profit before income tax | 2,529 | 879 | 889 | 235 | 75 | (688) | 3,919 | |||||||||||||||||||||
| Income tax expense and non-controlling interests | (760) | (246) | (243) | (68) | (15) | 195 | (1,137) | |||||||||||||||||||||
| Cash profit/(loss) | 1,769 | 633 | 646 | 167 | 60 | (493) | 2,782 | |||||||||||||||||||||
|
March 2017 Half Year vs March 2016 Half Year
|
| |||||||||||||||||||||||||||
| Wealth | Asia Retail | TSO and Group | ||||||||||||||||||||||||||
| Australia | Institutional | New Zealand | Australia | & Pacific | Centre | Group | ||||||||||||||||||||||
| Net interest income | 1% | -12% | 4% | -17% | -6% | -23% | -2% | |||||||||||||||||||||
| Other operating income | -1% | 48% | 1% | -16% | large | large | 5% | |||||||||||||||||||||
| Operating income | 1% | 8% | 4% | -16% | -68% | 90% | 0% | |||||||||||||||||||||
| Operating expenses | 0% | -9% | 2% | -10% | -18% | -61% | -14% | |||||||||||||||||||||
| Profit before credit impairment and income tax | 2% | 30% | 5% | -26% | large | -96% | 15% | |||||||||||||||||||||
| Credit impairment charge | 2% | -61% | -12% | n/a | -17% | n/a | -22% | |||||||||||||||||||||
| Profit before income tax | 2% | 64% | 6% | -26% | large | -95% | 24% | |||||||||||||||||||||
| Income tax expense and non-controlling interests | 2% | 71% | 8% | -25% | large | -76% | 27% | |||||||||||||||||||||
| Cash profit/(loss) | 2% | 61% | 5% | -26% | large | large | 23% | |||||||||||||||||||||
44
DIVISIONAL RESULTS
Cash profit by division – March 2017 Half year v March 2016 Half year
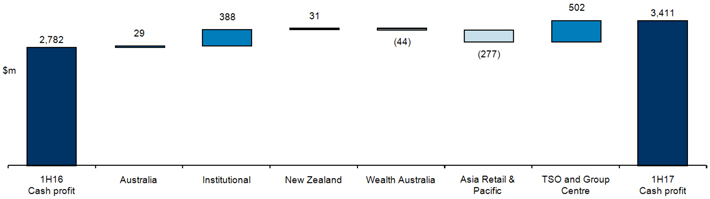
| Australia | Institutional | New Zealand | Wealth Australia |
Asia Retail & Pacific |
TSO and Group Centre |
Group | ||||||||||||||||||||
| March 2017 Half Year | $M | $M | $M | $M | $M | $M | $M | |||||||||||||||||||
| Net interest income |
4,133 | 1,588 | 1,260 | 5 | 331 | 99 | 7,416 | |||||||||||||||||||
| Other operating income
|
|
602
|
|
|
1,357
|
|
|
317
|
|
|
539
|
|
|
(139)
|
|
|
211
|
|
2,887
| |||||||
| Operating income |
4,735 | 2,945 | 1,577 | 544 | 192 | 310 | 10,303 | |||||||||||||||||||
| Operating expenses
|
|
(1,693)
|
|
|
(1,379)
|
|
|
(600)
|
|
|
(370)
|
|
|
(353)
|
|
|
(336)
|
|
(4,731)
| |||||||
| Profit before credit impairment and income tax |
3,042 | 1,566 | 977 | 174 | (161) | (26) | 5,572 | |||||||||||||||||||
| Credit impairment charge
|
|
(472)
|
|
|
(125)
|
|
|
(37)
|
|
|
-
|
|
|
(75)
|
|
|
(11)
|
|
(720)
| |||||||
| Profit before income tax |
2,570 | 1,441 | 940 | 174 | (236) | (37) | 4,852 | |||||||||||||||||||
| Income tax expense and non-controlling interests
|
|
(772)
|
|
|
(420)
|
|
|
(263)
|
|
|
(51)
|
|
|
19
|
|
|
46
|
|
(1,441)
| |||||||
|
Cash profit/(loss)
|
|
1,798
|
|
|
1,021
|
|
|
677
|
|
|
123
|
|
|
(217)
|
|
|
9
|
|
3,411
| |||||||
| Australia | Institutional | New Zealand | Wealth Australia |
Asia Retail & Pacific |
TSO and Group Centre |
Group | ||||||||||||||||||||
| September 2016 Half Year | $M | $M | $M | $M | $M | $M | $M | |||||||||||||||||||
| Net interest income |
4,125 | 1,647 | 1,242 | 5 | 347 | 161 | 7,527 | |||||||||||||||||||
| Other operating income
|
|
597
|
|
|
817
|
|
|
329
|
|
|
605
|
|
|
235
|
|
|
159
|
|
2,742
| |||||||
| Operating income |
4,722 | 2,464 | 1,571 | 610 | 582 | 320 | 10,269 | |||||||||||||||||||
| Operating expenses
|
|
(1,731)
|
|
|
(1,445)
|
|
|
(635)
|
|
|
(391)
|
|
|
(379)
|
|
|
(370)
|
|
(4,951)
| |||||||
| Profit before credit impairment and income tax |
2,991 | 1,019 | 936 | 219 | 203 | (50) | 5,318 | |||||||||||||||||||
| Credit impairment charge
|
|
(458)
|
|
|
(419)
|
|
|
(78)
|
|
|
-
|
|
|
(82)
|
|
|
(1)
|
|
(1,038)
| |||||||
| Profit before income tax |
2,533 | 600 | 858 | 219 | 121 | (51) | 4,280 | |||||||||||||||||||
| Income tax expense and non-controlling interests
|
|
(755)
|
|
|
(192)
|
|
|
(236)
|
|
|
(62)
|
|
|
(22)
|
|
|
94
|
|
(1,173)
| |||||||
|
Cash profit/(loss)
|
|
1,778
|
|
|
408
|
|
|
622
|
|
|
157
|
|
|
99
|
|
|
43
|
|
3,107
| |||||||
|
March 2017 Half Year vs September 2016 Half Year
| ||||||||||||||||||||||||||
| Australia | Institutional | New Zealand | Wealth Australia |
Asia Retail & Pacific |
TSO and Group Centre |
Group | ||||||||||||||||||||
| Net interest income |
0% | -4% | 1% | 0% | -5% | -39% | -1% | |||||||||||||||||||
| Other operating income
|
|
1%
|
|
|
66%
|
|
-4% | -11% | large |
|
33%
|
|
5%
| |||||||||||||
| Operating income |
0% | 20% | 0% | -11% | -67% | -3% | 0% | |||||||||||||||||||
| Operating expenses
|
|
-2%
|
|
|
-5%
|
|
|
-6%
|
|
|
-5%
|
|
|
-7%
|
|
|
-9%
|
|
-4%
| |||||||
| Profit before credit impairment and income tax |
2% | 54% | 4% | -21% | large | -48% | 5% | |||||||||||||||||||
| Credit impairment charge
|
3% | -70% | -53% | n/a | -9% | large | -31%
| |||||||||||||||||||
| Profit before income tax |
1% | large | 10% | -21% | large | -27% | 13% | |||||||||||||||||||
| Income tax expense and non-controlling interests
|
|
2%
|
|
|
large
|
|
|
11%
|
|
|
-18%
|
|
|
large
|
|
|
-51%
|
|
23%
| |||||||
|
Cash profit/(loss)
|
|
1%
|
|
|
large
|
|
|
9%
|
|
|
-22%
|
|
|
large
|
|
|
-79%
|
|
10%
| |||||||
45
DIVISIONAL RESULTS
Australia
Fred Ohlsson
| Half Year | Movement | |||||||||||||||||||||||
| Mar 17 | Sep 16 | Mar 16 | Mar 17 | Mar 17 | ||||||||||||||||||||
| $M | $M | $M | v. Sep 16 | v. Mar 16 | ||||||||||||||||||||
| Net interest income |
4,133 | 4,125 | 4,077 | 0% | 1% | |||||||||||||||||||
| Other operating income |
602 | 597 | 609 | 1% | -1% | |||||||||||||||||||
| Operating income |
4,735 | 4,722 | 4,686 | 0% | 1% | |||||||||||||||||||
| Operating expenses |
(1,693) | (1,731) | (1,695) | -2% | 0% | |||||||||||||||||||
| Profit before credit impairment and income tax |
3,042 | 2,991 | 2,991 | 2% | 2% | |||||||||||||||||||
| Credit impairment charge |
(472) | (458) | (462) | 3% | 2% | |||||||||||||||||||
| Profit before income tax |
2,570 | 2,533 | 2,529 | 1% | 2% | |||||||||||||||||||
| Income tax expense and non-controlling interests |
(772) | (755) | (760) | 2% | 2% | |||||||||||||||||||
| Cash profit |
1,798 | 1,778 | 1,769 | 1% | 2% | |||||||||||||||||||
| Balance Sheet |
||||||||||||||||||||||||
| Net loans and advances |
336,736 | 327,109 | 321,448 | 3% | 5% | |||||||||||||||||||
| Other external assets |
2,952 | 2,921 | 3,026 | 1% | -2% | |||||||||||||||||||
| External assets |
339,688 | 330,030 | 324,474 | 3% | 5% | |||||||||||||||||||
| Customer deposits |
197,632 | 187,667 | 184,226 | 5% | 7% | |||||||||||||||||||
| Other external liabilities |
11,117 | 11,842 | 12,333 | -6% | -10% | |||||||||||||||||||
| External liabilities |
208,749 | 199,509 | 196,559 | 5% | 6% | |||||||||||||||||||
| Risk weighted assets1 |
159,575 | 157,410 | 130,679 | 1% | 22% | |||||||||||||||||||
| Average gross loans and advances |
333,965 | 326,218 | 319,009 | 2% | 5% | |||||||||||||||||||
| Average deposits and other borrowings |
193,671 | 185,274 | 181,118 | 5% | 7% | |||||||||||||||||||
| Ratios |
||||||||||||||||||||||||
| Return on average assets |
1.08% | 1.09% | 1.10% | |||||||||||||||||||||
| Net interest margin2 |
2.69% | 2.74% | 2.75% | |||||||||||||||||||||
| Operating expenses to operating income |
35.8% | 36.7% | 36.2% | |||||||||||||||||||||
| Operating expenses to average assets |
1.01% | 1.06% | 1.06% | |||||||||||||||||||||
| Individual credit impairment charge/(release) |
430 | 469 | 429 | -8% | 0% | |||||||||||||||||||
| Individual credit impairment charge/(release) as a % of average GLA |
0.26% | 0.29% | 0.27% | |||||||||||||||||||||
| Collective credit impairment charge/(release) |
42 | (11) | 33 | large | 27% | |||||||||||||||||||
| Collective credit impairment charge/(release) as a % of average GLA |
0.03% | (0.01%) | 0.02% | |||||||||||||||||||||
| Gross impaired assets |
1,227 | 1,170 | 1,093 | 5% | 12% | |||||||||||||||||||
| Gross impaired assets as a % of GLA |
0.36% | 0.36% | 0.34% | |||||||||||||||||||||
| Total full time equivalent staff (FTE) |
11,518 | 11,639 | 12,094 | -1% | -5% | |||||||||||||||||||
| 1. | Risk weighted assets from 30 September 2016 includes APRA’s revised average mortgage risk weight targets. |
| 2. | In the March 2017 half, the Group changed its calculation of net interest margin to net home loan deposit offset balances against total interest earning assets. Average home loan deposit offset balances for the March 2017 half for the Australia division were $24,979 million (Sep 16 half: $23,653 million; Mar 16 half: $22,996 million). Refer to page 20 for further details. |
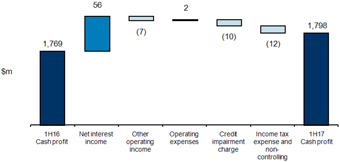
46
DIVISIONAL RESULTS
Australia
Fred Ohlsson
| Individual credit impairment charge/(release)
|
Half Year
|
Movement
| ||||||||||||||||||
|
Mar 17 |
Sep 16 $M |
Mar 16 $M |
Mar 17 v. Sep 16 |
Mar 17 v. Mar 16 | ||||||||||||||||
|
Retail |
238 | 235 | 200 | 1% | 19% | |||||||||||||||
| Home Loans |
38 | 36 | 17 | 6% | large | |||||||||||||||
| Cards and Personal Loans |
187 | 189 | 172 | -1% | 9% | |||||||||||||||
| Deposits and Payments1 |
13 | 10 | 11 | 30% | 18% | |||||||||||||||
| Private Bank |
- | - | - | n/a | n/a | |||||||||||||||
| Corporate & Commercial Banking |
192 | 234 | 229 | -18% | -16% | |||||||||||||||
| Corporate Banking |
18 | 14 | 19 | 29% | -5% | |||||||||||||||
| Asset Finance |
21 | 42 | 44 | -50% | -52% | |||||||||||||||
| Regional Business Banking |
31 | 51 | 53 | -39% | -42% | |||||||||||||||
| Business Banking |
20 | 25 | 20 | -20% | 0% | |||||||||||||||
| Small Business Banking
|
|
102
|
|
|
102
|
|
93
|
|
0%
|
|
10%
| |||||||||
| Individual credit impairment charge/(release)
|
|
430
|
|
|
469
|
|
429
|
|
-8%
|
|
0%
| |||||||||
|
Collective credit impairment charge/(release)
|
Half Year
|
Movement
| ||||||||||||||||||
|
Mar 17 |
Sep 16 $M |
Mar 16 $M |
Mar 17 v. Sep 16 |
Mar 17 v. Mar 16 | ||||||||||||||||
|
Retail |
26 | 6 | 23 | large | 13% | |||||||||||||||
| Home Loans |
8 | 6 | 15 | 33% | -47% | |||||||||||||||
| Cards and Personal Loans |
17 | 3 | 5 | large | large | |||||||||||||||
| Deposits and Payments1 |
1 | (3) | 3 | large | -67% | |||||||||||||||
| Private Bank |
- | - | - | n/a | n/a | |||||||||||||||
| Corporate & Commercial Banking |
16 | (17) | 10 | large | 60% | |||||||||||||||
| Corporate Banking |
7 | 3 | - | large | n/a | |||||||||||||||
| Asset Finance |
4 | 3 | 2 | 33% | 100% | |||||||||||||||
| Regional Business Banking |
3 | (7) | (3) | large | large | |||||||||||||||
| Business Banking |
- | (11) | 3 | -100% | -100% | |||||||||||||||
| Small Business Banking
|
|
2
|
|
|
(5)
|
|
8
|
|
large
|
|
-75%
| |||||||||
| Collective credit impairment charge/(release)
|
|
42
|
|
|
(11)
|
|
33
|
|
large
|
|
27%
| |||||||||
|
Total credit impairment charge/(release)
|
|
472
|
|
|
458
|
|
462
|
|
3%
|
|
2%
| |||||||||
| 1. | Represents credit impairment charge/(release) on overdraft balances. |
47
DIVISIONAL RESULTS
Australia
Fred Ohlsson
| Net loans and advances
|
Half Year
|
Movement
| ||||||||||||||||||
|
Mar 17 $M |
Sep 16 $M |
Mar 16 $M |
Mar 17 v. Sep 16 |
Mar 17 v. Mar 16 | ||||||||||||||||
| Retail |
268,695 | 259,330 | 255,528 | 4% | 5% | |||||||||||||||
| Home Loans |
256,174 | 246,743 | 242,861 | 4% | 5% | |||||||||||||||
| Cards and Personal Loans |
10,918 | 11,021 | 11,163 | -1% | -2% | |||||||||||||||
| Deposits and Payments1 |
90 | 95 | 91 | -5% | -1% | |||||||||||||||
| Private Bank |
1,513 | 1,471 | 1,413 | 3% | 7% | |||||||||||||||
| Corporate & Commercial Banking |
68,041 | 67,779 | 65,920 | 0% | 3% | |||||||||||||||
| Corporate Banking |
14,334 | 14,004 | 12,800 | 2% | 12% | |||||||||||||||
| Asset Finance |
8,592 | 8,384 | 8,802 | 2% | -2% | |||||||||||||||
| Regional Business Banking |
13,905 | 14,284 | 13,879 | -3% | 0% | |||||||||||||||
| Business Banking |
15,495 | 15,536 | 15,375 | 0% | 1% | |||||||||||||||
| Small Business Banking
|
|
15,715
|
|
|
15,571
|
|
15,064
|
|
1%
|
|
4%
| |||||||||
|
Net loans and advances
|
|
336,736
|
|
|
327,109
|
|
321,448
|
|
3%
|
|
5%
| |||||||||
| Customer deposits
|
Half Year
|
Movement
| ||||||||||||||||||
|
Mar 17 $M |
Sep 16 $M |
Mar 16 $M |
Mar 17 v. Sep 16 |
Mar 17 v. Mar 16 | ||||||||||||||||
| Retail |
141,899 | 135,162 | 131,539 | 5% | 8% | |||||||||||||||
| Home Loans2 |
25,593 | 24,131 | 23,619 | 6% | 8% | |||||||||||||||
| Cards and Personal Loans |
266 | 273 | 252 | -3% | 6% | |||||||||||||||
| Deposits and Payments |
106,811 | 102,592 | 99,238 | 4% | 8% | |||||||||||||||
| Private Bank |
9,229 | 8,166 | 8,430 | 13% | 9% | |||||||||||||||
| Corporate & Commercial Banking |
55,733 | 52,505 | 52,687 | 6% | 6% | |||||||||||||||
| Corporate Banking3 |
3,477 | 2,915 | 3,067 | 19% | 13% | |||||||||||||||
| Regional Business Banking |
5,976 | 5,836 | 6,209 | 2% | -4% | |||||||||||||||
| Business Banking |
11,129 | 10,416 | 10,941 | 7% | 2% | |||||||||||||||
| Small Business Banking
|
|
35,151
|
|
|
33,338
|
|
32,470
|
|
5%
|
|
8%
| |||||||||
| Customer deposits
|
|
197,632
|
|
|
187,667
|
|
184,226
|
|
5%
|
|
7%
| |||||||||
| 1. | Net loans and advances for the Deposits and Payments business represent amounts in overdraft. |
| 2. | Customer deposit amounts for the Home Loans business represent balances in offset accounts. |
| 3. | Some Corporate Banking deposits are included in Institutional Division deposits. |
48
DIVISIONAL RESULTS
Australia
Fred Ohlsson
| March 2017 Half Year | Retail $M |
C&CB $M |
Australia $M | |||||||
|
Net interest income |
2,791 | 1,342 | 4,133 | |||||||
|
Other operating income
|
|
392
|
|
|
210
|
|
602
| |||
|
Operating income |
3,183 | 1,552 | 4,735 | |||||||
|
Operating expenses
|
|
(1,167)
|
|
|
(526)
|
|
(1,693)
| |||
|
Profit before credit impairment and income tax |
2,016 | 1,026 | 3,042 | |||||||
| Credit impairment (charge)/release
|
|
(264)
|
|
|
(208)
|
|
(472)
| |||
|
Profit before income tax |
1,752 | 818 | 2,570 | |||||||
| Income tax expense and non-controlling interests
|
|
(526)
|
|
|
(246)
|
|
(772)
| |||
| Cash profit
|
|
1,226
|
|
|
572
|
|
1,798
| |||
| Individual credit impairment charge/(release) |
238 | 192 | 430 | |||||||
| Collective credit impairment charge/(release) |
26 | 16 | 42 | |||||||
| Net loans and advances |
268,695 | 68,041 | 336,736 | |||||||
| Customer deposits |
141,899 | 55,733 | 197,632 | |||||||
| Risk weighted assets1
|
|
95,538
|
|
|
64,037
|
|
159,575
| |||
| March 2016 Half Year | ||||||||||
|
Net interest income |
2,703 | 1,374 | 4,077 | |||||||
| Other operating income
|
|
396
|
|
|
213
|
|
609
| |||
|
Operating income |
3,099 | 1,587 | 4,686 | |||||||
| Operating expenses
|
|
(1,175)
|
|
|
(520)
|
|
(1,695)
| |||
|
Profit before credit impairment and income tax |
1,924 | 1,067 | 2,991 | |||||||
| Credit impairment (charge)/release
|
|
(223)
|
|
|
(239)
|
|
(462)
| |||
|
Profit before income tax |
1,701 | 828 | 2,529 | |||||||
| Income tax expense and non-controlling interests
|
|
(511)
|
|
|
(249)
|
|
(760)
| |||
|
Cash profit
|
|
1,190
|
|
|
579
|
|
1,769
| |||
| Individual credit impairment charge/(release) |
200 | 229 | 429 | |||||||
| Collective credit impairment charge/(release) |
23 | 10 | 33 | |||||||
| Net loans and advances |
255,528 | 65,920 | 321,448 | |||||||
| Customer deposits |
131,539 | 52,687 | 184,226 | |||||||
| Risk weighted assets1
|
|
66,057
|
|
|
64,622
|
|
130,679
| |||
| March 2017 Half Year vs March 2016 Half Year | ||||||||||
|
Net interest income |
3% | -2% | 1% | |||||||
| Other operating income
|
|
-1%
|
|
|
-1%
|
|
-1%
| |||
|
Operating income |
3% | -2% | 1% | |||||||
| Operating expenses
|
|
-1%
|
|
|
1%
|
|
0%
| |||
| Profit before credit impairment and income tax |
5% | -4% | 2% | |||||||
| Credit impairment (charge)/release
|
|
18%
|
|
|
-13%
|
|
2%
| |||
| Profit before income tax |
3% | -1% | 2% | |||||||
| Income tax expense and non-controlling interests
|
|
3%
|
|
|
-1%
|
|
2%
| |||
| Cash profit
|
|
3%
|
|
|
-1%
|
|
2%
| |||
| Individual credit impairment charge/(release) |
19% | -16% | 0% | |||||||
| Collective credit impairment charge/(release) |
13% | 60% | 27% | |||||||
| Net loans and advances |
5% | 3% | 5% | |||||||
| Customer deposits |
8% | 6% | 7% | |||||||
| Risk weighted assets1
|
|
45%
|
|
|
-1%
|
|
22%
| |||
| 1. | Risk weighted assets from 30 September 2016 includes APRA’s revised average mortgage risk weight targets. |
49
DIVISIONAL RESULTS
Australia
Fred Ohlsson
| March 2017 Half Year | Retail $M |
C&CB $M |
Australia Total $M | |||||||
|
Net interest income |
2,791 | 1,342 | 4,133 | |||||||
| Other operating income
|
|
392
|
|
|
210
|
|
602
| |||
| Operating income |
3,183 | 1,552 | 4,735 | |||||||
| Operating expenses
|
|
(1,167)
|
|
|
(526)
|
|
(1,693)
| |||
| Profit before credit impairment and income tax |
2,016 | 1,026 | 3,042 | |||||||
| Credit impairment (charge)/release
|
|
(264)
|
|
|
(208)
|
|
(472)
| |||
| Profit before income tax |
1,752 | 818 | 2,570 | |||||||
| Income tax expense and non-controlling interests
|
|
(526)
|
|
|
(246)
|
|
(772)
| |||
| Cash profit
|
|
1,226
|
|
|
572
|
|
1,798
| |||
| Individual credit impairment charge/(release) |
238 | 192 | 430 | |||||||
| Collective credit impairment charge/(release) |
26 | 16 | 42 | |||||||
| Net loans and advances |
268,695 | 68,041 | 336,736 | |||||||
| Customer deposits |
141,899 | 55,733 | 197,632 | |||||||
| Risk weighted assets1
|
|
95,538
|
|
|
64,037
|
|
159,575
| |||
| September 2016 Half Year |
||||||||||
|
Net interest income |
2,772 | 1,353 | 4,125 | |||||||
| Other operating income
|
|
389
|
|
|
208
|
|
597
| |||
| Operating income |
3,161 | 1,561 | 4,722 | |||||||
| Operating expenses
|
|
(1,189)
|
|
|
(542)
|
|
(1,731)
| |||
| Profit before credit impairment and income tax |
1,972 | 1,019 | 2,991 | |||||||
| Credit impairment (charge)/release
|
|
(241)
|
|
|
(217)
|
|
(458)
| |||
| Profit before income tax |
1,731 | 802 | 2,533 | |||||||
| Income tax expense and non-controlling interests
|
|
(514)
|
|
|
(241)
|
|
(755)
| |||
| Cash profit
|
|
1,217
|
|
|
561
|
|
1,778
| |||
| Individual credit impairment charge/(release) |
235 | 234 | 469 | |||||||
| Collective credit impairment charge/(release) |
6 | (17) | (11) | |||||||
| Net loans and advances |
259,330 | 67,779 | 327,109 | |||||||
| Customer deposits |
135,162 | 52,505 | 187,667 | |||||||
| Risk weighted assets1
|
|
93,308
|
|
|
64,102
|
|
157,410
| |||
| March 2017 Half Year vs September 2016 Half Year |
||||||||||
|
Net interest income |
1% | -1% | 0% | |||||||
| Other operating income
|
|
1%
|
|
|
1%
|
|
1%
| |||
| Operating income |
1% | -1% | 0% | |||||||
| Operating expenses
|
|
-2%
|
|
|
-3%
|
|
-2%
| |||
| Profit before credit impairment and income tax |
2% | 1% | 2% | |||||||
| Credit impairment (charge)/release
|
|
10%
|
|
|
-4%
|
|
3%
| |||
| Profit before income tax |
1% | 2% | 1% | |||||||
| Income tax expense and non-controlling interests
|
|
2%
|
|
|
2%
|
|
2%
| |||
| Cash profit
|
|
1%
|
|
|
2%
|
|
1%
| |||
| Individual credit impairment charge/(release) |
1% | -18% | -8% | |||||||
| Collective credit impairment charge/(release) |
large | large | large | |||||||
| Net loans and advances |
4% | 0% | 3% | |||||||
| Customer deposits |
5% | 6% | 5% | |||||||
| Risk weighted assets1
|
|
2%
|
|
|
0%
|
|
1%
| |||
| 1. | Risk weighted assets from 30 September 2016 includes APRA’s revised average mortgage risk weight targets. |
50
DIVISIONAL RESULTS
Institutional
Mark Whelan
| Half Year | Movement | |||||||||||||||||||||||
| Mar 17 $M |
Sep 16 $M |
Mar 16 $M |
Mar 17 v. Sep 16 |
Mar 17 v. Mar 16 |
||||||||||||||||||||
| Net interest income |
1,588 | 1,647 | 1,800 | -4% | -12% | |||||||||||||||||||
| Other operating income1 |
1,357 | 817 | 916 | 66% | 48% | |||||||||||||||||||
| Operating income |
2,945 | 2,464 | 2,716 | 20% | 8% | |||||||||||||||||||
| Operating expenses1 |
(1,379 | ) | (1,445 | ) | (1,513 | ) | -5% | -9% | ||||||||||||||||
| Profit before credit impairment and income tax |
1,566 | 1,019 | 1,203 | 54% | 30% | |||||||||||||||||||
| Credit impairment charge |
(125 | ) | (419 | ) | (324 | ) | -70% | -61% | ||||||||||||||||
| Profit before income tax |
1,441 | 600 | 879 | large | 64% | |||||||||||||||||||
| Income tax expense and non-controlling interests |
(420 | ) | (192 | ) | (246 | ) | large | 71% | ||||||||||||||||
| Cash profit |
1,021 | 408 | 633 | large | 61% | |||||||||||||||||||
| Balance Sheet |
||||||||||||||||||||||||
| Net loans and advances |
120,791 | 125,955 | 125,639 | -4% | -4% | |||||||||||||||||||
| Other external assets |
258,119 | 281,705 | 275,903 | -8% | -6% | |||||||||||||||||||
| External assets |
378,910 | 407,660 | 401,542 | -7% | -6% | |||||||||||||||||||
| Customer deposits |
179,326 | 171,155 | 176,157 | 5% | 2% | |||||||||||||||||||
| Other deposits and borrowings |
61,207 | 56,341 | 48,992 | 9% | 25% | |||||||||||||||||||
| Deposits and other borrowings |
240,533 | 227,496 | 225,149 | 6% | 7% | |||||||||||||||||||
| Other external liabilities |
94,971 | 121,304 | 121,770 | -22% | -22% | |||||||||||||||||||
| External liabilities |
335,504 | 348,800 | 346,919 | -4% | -3% | |||||||||||||||||||
| Risk weighted assets |
159,230 | 168,428 | 182,051 | -5% | -13% | |||||||||||||||||||
| Average gross loans and advances |
125,645 | 128,501 | 139,006 | -2% | -10% | |||||||||||||||||||
| Average deposits and other borrowings |
242,402 | 232,143 | 233,775 | 4% | 4% | |||||||||||||||||||
| Ratios |
||||||||||||||||||||||||
| Return on average assets |
0.51% | 0.20% | 0.31% | |||||||||||||||||||||
| Net interest margin |
1.05% | 1.11% | 1.15% | |||||||||||||||||||||
| Net interest margin (excluding Markets) |
2.17% | 2.21% | 2.16% | |||||||||||||||||||||
| Operating expenses to operating income |
46.8% | 58.6% | 55.7% | |||||||||||||||||||||
| Operating expenses to average assets |
0.69% | 0.70% | 0.74% | |||||||||||||||||||||
| Individual credit impairment charge/(release) |
210 | 436 | 340 | -52% | -38% | |||||||||||||||||||
| Individual credit impairment charge/(release) as a % of average GLA |
0.34% | 0.68% | 0.49% | |||||||||||||||||||||
| Collective credit impairment charge/(release) |
(85 | ) | (17 | ) | (16 | ) | large | large | ||||||||||||||||
| Collective credit impairment charge/(release) as a % of average GLA |
(0.14% | ) | (0.03% | ) | (0.02% | ) | ||||||||||||||||||
| Gross impaired assets |
1,061 | 1,405 | 1,282 | -24% | -17% | |||||||||||||||||||
| Gross impaired assets as a % of GLA |
0.87% | 1.10% | 1.01% | |||||||||||||||||||||
| Total full time equivalent staff (FTE) |
4,899 | 5,112 | 5,601 | -4% | -13% | |||||||||||||||||||
| 1. | In the March 2017 half, a change was made to the classification of certain fees payable. These items have been reclassified from other operating income to operating expenses to more accurately reflect the nature of these items. Comparatives have been restated (Sep16 half: $8 million; Mar16 half: $9 million). |
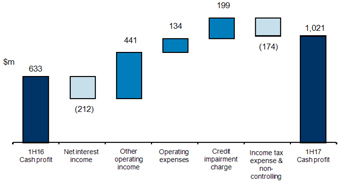
51
DIVISIONAL RESULTS
Institutional
Mark Whelan
Institutional by Geography
| Half Year
|
Movement
|
|||||||||||||||||||||||
| Mar 17 | Sep 16 | Mar 16 | Mar 17 | Mar 17 | ||||||||||||||||||||
| Australia | $M | $M | $M | v. Sep 16 | v. Mar 16 | |||||||||||||||||||
| Net interest income |
865 | 885 | 985 | -2% | -12% | |||||||||||||||||||
| Other operating income1 |
668 | 289 | 317 | large | large | |||||||||||||||||||
| Operating income |
1,533 | 1,174 | 1,302 | 31% | 18% | |||||||||||||||||||
| Operating expenses1 |
(621) | (662) | (677) | -6% | -8% | |||||||||||||||||||
| Profit before credit impairment and income tax |
912 | 512 | 625 | 78% | 46% | |||||||||||||||||||
| Credit impairment (charge)/release |
(119) | (181) | (112) | -34% | 6% | |||||||||||||||||||
| Profit before income tax |
793 | 331 | 513 | large | 55% | |||||||||||||||||||
| Income tax expense and non-controlling interests |
(242) | (99) | (155) | large | 56% | |||||||||||||||||||
| Cash profit |
551 | 232 | 358 | large | 54% | |||||||||||||||||||
| Individual credit impairment charge/(release) |
164 | 206 | 124 | -20% | 32% | |||||||||||||||||||
| Collective credit impairment charge/(release) |
(45) | (25) | (12) | 80% | large | |||||||||||||||||||
| Net loans and advances |
65,175 | 65,938 | 63,867 | -1% | 2% | |||||||||||||||||||
| Customer deposits |
68,910 | 65,361 | 66,627 | 5% | 3% | |||||||||||||||||||
| Risk weighted assets |
78,512 | 80,618 | 87,852 | -3% | -11% | |||||||||||||||||||
| Asia Pacific, Europe, and America |
||||||||||||||||||||||||
| Net interest income |
545 | 574 | 657 | -5% | -17% | |||||||||||||||||||
| Other operating income |
521 | 487 | 543 | 7% | -4% | |||||||||||||||||||
| Operating income |
1,066 | 1,061 | 1,200 | 0% | -11% | |||||||||||||||||||
| Operating expenses |
(674) | (704) | (748) | -4% | -10% | |||||||||||||||||||
| Profit before credit impairment and income tax |
392 | 357 | 452 | 10% | -13% | |||||||||||||||||||
| Credit impairment (charge)/release |
(4) | (224) | (208) | -98% | -98% | |||||||||||||||||||
| Profit before income tax |
388 | 133 | 244 | large | 59% | |||||||||||||||||||
| Income tax expense and non-controlling interests |
(105) | (54) | (57) | 94% | 84% | |||||||||||||||||||
| Cash profit |
283 | 79 | 187 | large | 51% | |||||||||||||||||||
| Individual credit impairment charge/(release) |
41 | 209 | 213 | -80% | -81% | |||||||||||||||||||
| Collective credit impairment charge/(release) |
(37) | 15 | (5) | large | large | |||||||||||||||||||
| Net loans and advances |
48,148 | 53,006 | 55,273 | -9% | -13% | |||||||||||||||||||
| Customer deposits |
96,684 | 91,481 | 96,206 | 6% | 0% | |||||||||||||||||||
| Risk weighted assets |
69,719 | 75,014 | 82,509 | -7% | -16% | |||||||||||||||||||
| New Zealand |
||||||||||||||||||||||||
| Net interest income |
178 | 188 | 158 | -5% | 13% | |||||||||||||||||||
| Other operating income |
168 | 41 | 56 | large | large | |||||||||||||||||||
| Operating income |
346 | 229 | 214 | 51% | 62% | |||||||||||||||||||
| Operating expenses |
(84) | (79) | (88) | 6% | -5% | |||||||||||||||||||
| Profit before credit impairment and income tax |
262 | 150 | 126 | 75% | large | |||||||||||||||||||
| Credit impairment (charge)/release |
(2) | (14) | (4) | -86% | -50% | |||||||||||||||||||
| Profit before income tax |
260 | 136 | 122 | 91% | large | |||||||||||||||||||
| Income tax expense and non-controlling interests |
(73) | (39) | (34) | 87% | large | |||||||||||||||||||
| Cash profit |
187 | 97 | 88 | 93% | large | |||||||||||||||||||
| Individual credit impairment charge/(release) |
5 | 21 | 3 | -76% | 67% | |||||||||||||||||||
| Collective credit impairment charge/(release) |
(3) | (7) | 1 | -57% | large | |||||||||||||||||||
| Net loans and advances |
7,468 | 7,011 | 6,499 | 7% | 15% | |||||||||||||||||||
| Customer deposits |
13,732 | 14,313 | 13,324 | -4% | 3% | |||||||||||||||||||
| Risk weighted assets |
10,999 | 12,796 | 11,690 | -14% | -6% | |||||||||||||||||||
| 1. | In the March 2017 half, a change was made to the classification of certain fees payable. These items have been reclassified from other operating income to operating expenses to more accurately reflect the nature of these items. Comparatives have been restated (Sep16 half: $8 million; Mar16 half: $9 million). |
52
DIVISIONAL RESULTS
Institutional
Mark Whelan
| Individual credit impairment charge/(release) | Half Year
|
Movement
|
||||||||||||||||||||||
| Mar 17 | Sep 16 | Mar 16 | Mar 17 | Mar 17 | ||||||||||||||||||||
| $M | $M | $M | v. Sep 16 | v. Mar 16 | ||||||||||||||||||||
| Transaction Banking |
41 | 75 | 103 | -45% | -60% | |||||||||||||||||||
| Loans & Specialised Finance |
165 | 342 | 223 | -52% | -26% | |||||||||||||||||||
| Markets |
- | 15 | 11 | -100% | -100% | |||||||||||||||||||
| Central Functions |
4 | 4 | 3 | 0% | 33% | |||||||||||||||||||
| Individual credit impairment charge/(release) |
210 | 436 | 340 | -52% | -38% | |||||||||||||||||||
| Collective credit impairment charge/(release)
|
Half Year
|
Movement
|
||||||||||||||||||||||
| Mar 17 | Sep 16 | Mar 16 | Mar 17 | Mar 17 | ||||||||||||||||||||
| $M | $M | $M | v. Sep 16 | v. Mar 16 | ||||||||||||||||||||
| Transaction Banking |
(5) | (7) | 4 | -29% | large | |||||||||||||||||||
| Loans & Specialised Finance |
(80) | (7) | (21) | large | large | |||||||||||||||||||
| Markets |
4 | (3) | 1 | large | large | |||||||||||||||||||
| Central Functions |
(4) | - | - | n/a | n/a | |||||||||||||||||||
| Collective credit impairment charge/(release) |
(85) | (17) | (16) | large | large | |||||||||||||||||||
| Total credit impairment charge/(release) |
125 | 419 | 324 | -70% | -61% | |||||||||||||||||||
| Net loans and advances
|
Half Year
|
Movement
|
||||||||||||||||||||||
| Mar 17 | Sep 16 | Mar 16 | Mar 17 | Mar 17 | ||||||||||||||||||||
| $M | $M | $M | v. Sep 16 | v. Mar 16 | ||||||||||||||||||||
| Transaction Banking |
12,083 | 13,810 | 15,231 | -13% | -21% | |||||||||||||||||||
| Loans & Specialised Finance |
79,895 | 83,537 | 88,653 | -4% | -10% | |||||||||||||||||||
| Markets |
28,591 | 28,380 | 21,489 | 1% | 33% | |||||||||||||||||||
| Central Functions |
222 | 228 | 266 | -3% | -17% | |||||||||||||||||||
| Net loans and advances |
120,791 | 125,955 | 125,639 | -4% | -4% | |||||||||||||||||||
| Customer deposits
|
Half Year
|
Movement
|
||||||||||||||||||||||
| Mar 17 | Sep 16 | Mar 16 | Mar 17 | Mar 17 | ||||||||||||||||||||
| $M | $M | $M | v. Sep 16 | v. Mar 16 | ||||||||||||||||||||
| Transaction Banking |
89,028 | 91,019 | 90,230 | -2% | -1% | |||||||||||||||||||
| Loans & Specialised Finance |
943 | 884 | 975 | 7% | -3% | |||||||||||||||||||
| Markets |
88,947 | 78,871 | 84,541 | 13% | 5% | |||||||||||||||||||
| Central Functions |
408 | 381 | 411 | 7% | -1% | |||||||||||||||||||
| Customer deposits |
179,326 | 171,155 | 176,157 | 5% | 2% | |||||||||||||||||||
53
DIVISIONAL RESULTS
Institutional
Mark Whelan
| Transaction Banking |
Loans & Specialised Finance |
Markets | Central Functions |
Institutional Total |
||||||||||||||||
| March 2017 Half Year | $M | $M | $M | $M | $M | |||||||||||||||
| Net interest income |
432 | 670 | 478 | 8 | 1,588 | |||||||||||||||
| Other operating income |
365 | 84 | 886 | 22 | 1,357 | |||||||||||||||
| Operating income |
797 | 754 | 1,364 | 30 | 2,945 | |||||||||||||||
| Operating expenses |
(447) | (262) | (646) | (24) | (1,379) | |||||||||||||||
| Profit before credit impairment and income tax |
350 | 492 | 718 | 6 | 1,566 | |||||||||||||||
| Credit impairment (charge)/release |
(36) | (85) | (4) | - | (125) | |||||||||||||||
| Profit before income tax |
314 | 407 | 714 | 6 | 1,441 | |||||||||||||||
| Income tax expense and non-controlling interests |
(98) | (110) | (196) | (16) | (420) | |||||||||||||||
| Cash profit |
216 | 297 | 518 | (10) | 1,021 | |||||||||||||||
| Individual credit impairment charge/(release) |
41 | 165 | - | 4 | 210 | |||||||||||||||
| Collective credit impairment charge/(release) |
(5) | (80) | 4 | (4) | (85) | |||||||||||||||
| Net loans and advances |
12,083 | 79,895 | 28,591 | 222 | 120,791 | |||||||||||||||
| Customer deposits |
89,028 | 943 | 88,947 | 408 | 179,326 | |||||||||||||||
| Risk weighted assets |
23,883 | 82,896 | 51,648 | 803 | 159,230 | |||||||||||||||
| March 2016 Half Year |
||||||||||||||||||||
| Net interest income |
444 | 778 | 560 | 18 | 1,800 | |||||||||||||||
| Other operating income1 |
393 | 96 | 401 | 26 | 916 | |||||||||||||||
| Operating income |
837 | 874 | 961 | 44 | 2,716 | |||||||||||||||
| Operating expenses1 |
(475) | (311) | (690) | (37) | (1,513) | |||||||||||||||
| Profit before credit impairment and income tax |
362 | 563 | 271 | 7 | 1,203 | |||||||||||||||
| Credit impairment (charge)/release |
(107) | (202) | (12) | (3) | (324) | |||||||||||||||
| Profit before income tax |
255 | 361 | 259 | 4 | 879 | |||||||||||||||
| Income tax expense and non-controlling interests |
(82) | (98) | (67) | 1 | (246) | |||||||||||||||
| Cash profit |
173 | 263 | 192 | 5 | 633 | |||||||||||||||
| Individual credit impairment charge/(release) |
103 | 223 | 11 | 3 | 340 | |||||||||||||||
| Collective credit impairment charge/(release) |
4 | (21) | 1 | - | (16) | |||||||||||||||
| Net loans and advances |
15,231 | 88,653 | 21,489 | 266 | 125,639 | |||||||||||||||
| Customer deposits |
90,230 | 975 | 84,541 | 411 | 176,157 | |||||||||||||||
| Risk weighted assets |
27,793 | 98,011 | 54,571 | 1,676 | 182,051 | |||||||||||||||
| March 2017 Half Year vs March 2016 Half Year |
||||||||||||||||||||
| Net interest income |
-3% | -14% | -15% | -56% | -12% | |||||||||||||||
| Other operating income |
-7% | -13% | large | -15% | 48% | |||||||||||||||
| Operating income |
-5% | -14% | 42% | -32% | 8% | |||||||||||||||
| Operating expenses |
-6% | -16% | -6% | -35% | -9% | |||||||||||||||
| Profit before credit impairment and income tax |
-3% | -13% | large | -14% | 30% | |||||||||||||||
| Credit impairment (charge)/release |
-66% | -58% | -67% | -100% | -61% | |||||||||||||||
| Profit before income tax |
23% | 13% | large | 50% | 64% | |||||||||||||||
| Income tax expense and non-controlling interests |
20% | 12% | large | large | 71% | |||||||||||||||
| Cash profit |
25% | 13% | large | large | 61% | |||||||||||||||
| Individual credit impairment charge/(release) |
-60% | -26% | -100% | 33% | -38% | |||||||||||||||
| Collective credit impairment charge/(release) |
large | large | large | n/a | large | |||||||||||||||
| Net loans and advances |
-21% | -10% | 33% | -17% | -4% | |||||||||||||||
| Customer deposits |
-1% | -3% | 5% | -1% | 2% | |||||||||||||||
| Risk weighted assets |
-14% | -15% | -5% | -52% | -13% | |||||||||||||||
| 1. | In the March 2017 half, a change was made to the classification of certain fees payable. These items have been reclassified from other operating income to operating expenses to more accurately reflect the nature of these items. Comparatives have been restated (Sep16 half: $8 million; Mar16 half: $9 million). |
54
DIVISIONAL RESULTS
Institutional
Mark Whelan
| Transaction Banking |
Loans & Specialised Finance |
Markets | Central Functions |
Institutional Total |
||||||||||||||||
| March 2017 Half Year | $M | $M | $M | $M | $M | |||||||||||||||
| Net interest income |
432 | 670 | 478 | 8 | 1,588 | |||||||||||||||
| Other operating income |
365 | 84 | 886 | 22 | 1,357 | |||||||||||||||
| Operating income |
797 | 754 | 1,364 | 30 | 2,945 | |||||||||||||||
| Operating expenses |
(447) | (262) | (646) | (24) | (1,379) | |||||||||||||||
| Profit before credit impairment and income tax |
350 | 492 | 718 | 6 | 1,566 | |||||||||||||||
| Credit impairment (charge)/release |
(36) | (85) | (4) | - | (125) | |||||||||||||||
| Profit before income tax |
314 | 407 | 714 | 6 | 1,441 | |||||||||||||||
| Income tax expense and non-controlling interests |
(98) | (110) | (196) | (16) | (420) | |||||||||||||||
| Cash profit |
216 | 297 | 518 | (10) | 1,021 | |||||||||||||||
| Individual credit impairment charge/(release) |
41 | 165 | - | 4 | 210 | |||||||||||||||
| Collective credit impairment charge/(release) |
(5) | (80) | 4 | (4) | (85) | |||||||||||||||
| Net loans and advances |
12,083 | 79,895 | 28,591 | 222 | 120,791 | |||||||||||||||
| Customer deposits |
89,028 | 943 | 88,947 | 408 | 179,326 | |||||||||||||||
| Risk weighted assets |
23,883 | 82,896 | 51,648 | 803 | 159,230 | |||||||||||||||
| September 2016 Half Year |
||||||||||||||||||||
| Net interest income |
436 | 720 | 472 | 19 | 1,647 | |||||||||||||||
| Other operating income1 |
382 | 61 | 365 | 9 | 817 | |||||||||||||||
| Operating income |
818 | 781 | 837 | 28 | 2,464 | |||||||||||||||
| Operating expenses1 |
(446) | (274) | (595) | (130) | (1,445) | |||||||||||||||
| Profit before credit impairment and income tax |
372 | 507 | 242 | (102) | 1,019 | |||||||||||||||
| Credit impairment (charge)/release |
(68) | (335) | (12) | (4) | (419) | |||||||||||||||
| Profit before income tax |
304 | 172 | 230 | (106) | 600 | |||||||||||||||
| Income tax expense and non-controlling interests |
(95) | (53) | (43) | (1) | (192) | |||||||||||||||
| Cash profit |
209 | 119 | 187 | (107) | 408 | |||||||||||||||
| Individual credit impairment charge/(release) |
75 | 342 | 15 | 4 | 436 | |||||||||||||||
| Collective credit impairment charge/(release) |
(7) | (7) | (3) | - | (17) | |||||||||||||||
| Net loans and advances |
13,810 | 83,537 | 28,380 | 228 | 125,955 | |||||||||||||||
| Customer deposits |
91,019 | 884 | 78,871 | 381 | 171,155 | |||||||||||||||
| Risk weighted assets |
24,918 | 89,619 | 52,285 | 1,606 | 168,428 | |||||||||||||||
| March 2017 Half Year vs September 2016 Half Year |
||||||||||||||||||||
| Net interest income |
-1% | -7% | 1% | -58% | -4% | |||||||||||||||
| Other operating income |
-4% | 38% | large | large | 66% | |||||||||||||||
| Operating income |
-3% | -3% | 63% | 7% | 20% | |||||||||||||||
| Operating expenses |
0% | -4% | 9% | -82% | -5% | |||||||||||||||
| Profit before credit impairment and income tax |
-6% | -3% | large | large | 54% | |||||||||||||||
| Credit impairment (charge)/release |
-47% | -75% | -67% | -100% | -70% | |||||||||||||||
| Profit before income tax |
3% | large | large | large | large | |||||||||||||||
| Income tax expense and non-controlling interests |
3% | large | large | large | large | |||||||||||||||
| Cash profit |
3% | large | large | -91% | large | |||||||||||||||
| Individual credit impairment charge/(release) |
-45% | -52% | -100% | 0% | -52% | |||||||||||||||
| Collective credit impairment charge/(release) |
-29% | large | large | n/a | large | |||||||||||||||
| Net loans and advances |
-13% | -4% | 1% | -3% | -4% | |||||||||||||||
| Customer deposits |
-2% | 7% | 13% | 7% | 5% | |||||||||||||||
| Risk weighted assets |
-4% | -8% | -1% | -50% | -5% | |||||||||||||||
| 1. | In the March 2017 half, a change was made to the classification of certain fees payable. These items have been reclassified from other operating income to operating expenses to more accurately reflect the nature of these items. Comparatives have been restated (Sep16 half: $8 million; Mar16 half: $9 million). |
55
DIVISIONAL RESULTS
Institutional
Mark Whelan
Analysis of Markets operating income
| Half Year
|
Movement
|
|||||||||||||||||||||||
| Mar 17 | Sep 16 | Mar 16 | Mar 17 | Mar 17 | ||||||||||||||||||||
| Composition of Markets operating income by business activity1 | $M | $M | $M | v. Sep 16 | v. Mar 16 | |||||||||||||||||||
| Franchise Sales2 |
483 | 542 | 542 | -11% | -11% | |||||||||||||||||||
| Franchise Trading3 |
525 | 294 | 267 | 79% | 97% | |||||||||||||||||||
| Balance Sheet4 |
356 | 238 | 152 | 50% | large | |||||||||||||||||||
| Markets operating income pre-derivative CVA methodology change |
1,364 | 1,074 | 961 | 27% | 42% | |||||||||||||||||||
| Derivative CVA methodology change 5 |
- | (237) | - | -100% | n/a | |||||||||||||||||||
| Markets operating income |
1,364 | 837 | 961 | 63% | 42% | |||||||||||||||||||
| 1. | In deriving the fair value of derivative positions adjustments are made to the risk free value to include factors such as the impact of credit and funding and bid-offer spreads. These adjustments were previously allocated between Franchise Sales, Franchise Trading and Balance Sheet. The impact of these adjustments and where relevant the hedging of the associated exposure are now shown as part of Franchise Trading Income to better align with how these are overseen and risk managed. |
| 2. | Franchise Sales represents direct client flow business on core products such as fixed income, foreign exchange, commodities and capital markets. |
| 3. | Franchise Trading primarily represents management of the Group’s strategic positions and those taken as part of direct client sales flow. Franchise Trading also includes the impact of the derivative valuation adjustments which includes credit and funding adjustments, bid-offer adjustments and associated hedges. During the period, the impact of credit and funding, net of associated hedges, contributed a gain of $162 million (Sep 16 half: loss of $67 million excluding the impact of the Derivative CVA methodology changes; Mar 16 half: loss of $35 million). |
| 4. | Balance Sheet represents hedging of interest rate risk on the Group’s loan and deposit books and the management of the Group’s liquidity portfolio. |
| 5. | Refer to page 13 for further details. |
| Half Year
|
Movement
|
|||||||||||||||||||||||
| Mar 17 | Sep 16 | Mar 16 | Mar 17 | Mar 17 | ||||||||||||||||||||
| Composition of Markets operating income by geography | $M | $M | $M | v. Sep 16 | v. Mar 16 | |||||||||||||||||||
| Australia |
634 | 446 | 368 | 42% | 72% | |||||||||||||||||||
| Asia Pacific, Europe & America |
535 | 504 | 520 | 6% | 3% | |||||||||||||||||||
| New Zealand |
195 | 124 | 73 | 57% | large | |||||||||||||||||||
| Markets operating income pre-derivative CVA methodology change |
1,364 | 1,074 | 961 | 27% | 42% | |||||||||||||||||||
| Derivative CVA methodology change |
- | (237) | - | -100% | n/a | |||||||||||||||||||
| Markets operating income |
1,364 | 837 | 961 | 63% | 42% | |||||||||||||||||||
56
DIVISIONAL RESULTS
Institutional
Mark Whelan
Market risk
Traded market risk
Below are aggregate Value at Risk (VaR) exposures at 99% confidence level covering both physical and derivatives trading positions for the Bank’s principal trading centres. All figures are in AUD.
99% confidence level (1 day holding period)
| As at |
High for |
Low for period |
Avg for period |
As at | High for year |
Low for year |
Avg for year |
|||||||||||||||||||||||||||
|
Mar 17 |
Mar 17 | Mar 17 | Mar 17 | Sep 16 | Sep 16 | Sep 16 | Sep 16 | |||||||||||||||||||||||||||
| $M | $M | $M | $M | $M | $M | $M | $M | |||||||||||||||||||||||||||
|
Value at Risk at 99% confidence |
||||||||||||||||||||||||||||||||||
|
Foreign exchange |
7.9 | 9.2 | 2.6 | 4.8 | 4.0 | 11.4 | 2.2 | 5.2 | ||||||||||||||||||||||||||
|
Interest rate |
7.6 | 21.4 | 5.4 | 8.8 | 4.7 | 20.1 | 4.1 | 9.1 | ||||||||||||||||||||||||||
|
Credit |
3.9 | 4.2 | 2.0 | 3.1 | 3.3 | 4.6 | 2.2 | 3.2 | ||||||||||||||||||||||||||
|
Commodities |
3.1 | 3.9 | 1.5 | 2.2 | 2.5 | 2.8 | 1.1 | 1.7 | ||||||||||||||||||||||||||
|
Equity |
0.2 | 0.5 | 0.2 | 0.3 | 0.5 | 2.0 | 0.1 | 0.2 | ||||||||||||||||||||||||||
|
Diversification benefit |
(7.7) | n/a | n/a | (7.8) | (6.8) | n/a | n/a | (6.2) | ||||||||||||||||||||||||||
|
Total VaR |
15.0 | 25.1 | 7.0 | 11.4 | 8.2 | 25.4 | 6.1 | 13.2 | ||||||||||||||||||||||||||
Non-traded interest rate risk
Non-traded interest rate risk is managed by Markets and relates to the potential adverse impact of changes in market interest rates on future net interest income for the Group. Interest rate risk is reported using various techniques including VaR and scenario analysis based on a 1% shock.
99% confidence level (1 day holding period)
| As at |
High for |
Low for period |
Avg for period |
As at | High for year |
Low for year |
Avg for year |
|||||||||||||||||||||||||||
|
Mar 17 |
Mar 17 | Mar 17 | Mar 17 | Sep 16 | Sep 16 | Sep 16 | Sep 16 | |||||||||||||||||||||||||||
| $M | $M | $M | $M | $M | $M | $M | $M | |||||||||||||||||||||||||||
|
Value at Risk at 99% confidence |
||||||||||||||||||||||||||||||||||
|
Australia |
33.7 | 37.5 | 30.1 | 33.5 | 38.4 | 40.6 | 28.0 | 33.7 | ||||||||||||||||||||||||||
|
New Zealand |
11.4 | 15.1 | 11.1 | 12.2 | 11.4 | 11.4 | 8.8 | 10.0 | ||||||||||||||||||||||||||
|
Asia Pacific, Europe & America |
15.2 | 19.0 | 14.3 | 16.3 | 14.7 | 17.3 | 14.4 | 15.8 | ||||||||||||||||||||||||||
|
Diversification benefit |
(19.8) | n/a | n/a | (20.0) | (24.0) | n/a | n/a | (22.9) | ||||||||||||||||||||||||||
|
Total VaR |
40.5 | 44.0 | 37.6 | 42.0 | 40.5 | 44.7 | 31.3 | 36.6 | ||||||||||||||||||||||||||
Impact of 1% rate shock on the next 12 months’ net interest income margin
| As at | ||||||||
|
Mar 17 |
Sep 16 | |||||||
|
As at period end |
0.30% | 0.37% | ||||||
|
Maximum exposure |
0.47% | 0.48% | ||||||
|
Minimum exposure |
0.04% | 0.00% | ||||||
|
Average exposure (in absolute terms) |
0.22% | 0.21% | ||||||
57
DIVISIONAL RESULTS
New Zealand
David Hisco
Table reflects NZD for New Zealand (AUD results shown on page 62)
| Half Year | Movement | |||||||||||||||||||||
|
Mar 17 |
Sep 16 | Mar 16 | Mar 17 | Mar 17 | ||||||||||||||||||
| NZD M | NZD M | NZD M | v. Sep 16 | v. Mar 16 | ||||||||||||||||||
|
Net interest income |
1,334 | 1,322 | 1,307 | 1% | 2% | |||||||||||||||||
|
Other operating income |
153 | 169 | 168 | -9% | -9% | |||||||||||||||||
|
Net funds management and insurance income |
183 | 181 | 173 | 1% | 6% | |||||||||||||||||
|
Operating income |
1,670 | 1,672 | 1,648 | 0% | 1% | |||||||||||||||||
|
Operating expenses |
(636) | (677) | (639) | -6% | 0% | |||||||||||||||||
|
Profit before credit impairment and income tax |
1,034 | 995 | 1,009 | 4% | 2% | |||||||||||||||||
|
Credit impairment (charge)/release |
(39) | (83) | (46) | -53% | -15% | |||||||||||||||||
|
Profit before income tax |
995 | 912 | 963 | 9% | 3% | |||||||||||||||||
|
Income tax expense and non-controlling interests |
(278) | (251) | (263) | 11% | 6% | |||||||||||||||||
|
Cash profit |
717 | 661 | 700 | 8% | 2% | |||||||||||||||||
|
Balance Sheet1 |
||||||||||||||||||||||
|
Net loans and advances |
114,731 | 113,145 | 110,028 | 1% | 4% | |||||||||||||||||
|
Other external assets |
7,032 | 4,723 | 4,234 | 49% | 66% | |||||||||||||||||
|
External assets |
121,763 | 117,868 | 114,262 | 3% | 7% | |||||||||||||||||
|
Customer deposits |
81,238 | 76,362 | 75,380 | 6% | 8% | |||||||||||||||||
|
Other deposits and borrowings |
2,949 | 5,358 | 5,439 | -45% | -46% | |||||||||||||||||
|
Deposits and other borrowings |
84,187 | 81,720 | 80,819 | 3% | 4% | |||||||||||||||||
|
Other external liabilities |
22,228 | 21,494 | 19,091 | 3% | 16% | |||||||||||||||||
|
External liabilities |
106,415 | 103,214 | 99,910 | 3% | 7% | |||||||||||||||||
|
Risk weighted assets |
62,421 | 62,523 | 61,480 | 0% | 2% | |||||||||||||||||
|
Average gross loans and advances |
114,087 | 112,321 | 108,798 | 2% | 5% | |||||||||||||||||
|
Average deposits and other borrowings |
83,884 | 82,676 | 79,274 | 1% | 6% | |||||||||||||||||
|
Ratios1 |
||||||||||||||||||||||
|
Return on average assets |
1.20% | 1.14% | 1.24% | |||||||||||||||||||
|
Net interest margin |
2.30% | 2.35% | 2.40% | |||||||||||||||||||
|
Operating expenses to operating income |
38.1% | 40.5% | 38.8% | |||||||||||||||||||
|
Operating expenses to average assets |
1.07% | 1.17% | 1.14% | |||||||||||||||||||
|
Individual credit impairment charge/(release) |
64 | 65 | 47 | -2% | 36% | |||||||||||||||||
|
Individual credit impairment charge/(release) as a % of average GLA |
0.11% | 0.12% | 0.09% | |||||||||||||||||||
|
Collective credit impairment charge/(release) |
(25) | 18 | (1) | large | large | |||||||||||||||||
|
Collective credit impairment charge/(release) as a % of average GLA |
(0.04%) | 0.03% | (0.00%) | |||||||||||||||||||
|
Gross impaired assets |
448 | 363 | 302 | 23% | 48% | |||||||||||||||||
|
Gross impaired assets as a % of GLA |
0.39% | 0.32% | 0.27% | |||||||||||||||||||
|
Total full time equivalent staff (FTE) |
6,250 | 6,317 | 6,401 | -1% | -2% | |||||||||||||||||
| 1. | Balance Sheet amounts as at 31 March 2017 include assets and liabilities held for sale. |
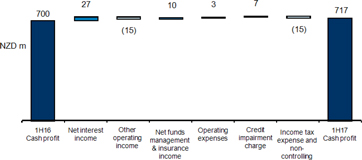
58
DIVISIONAL RESULTS
New Zealand
David Hisco
| Individual credit impairment charge/(release) | Half Year | Movement | ||||||||||||||||||||
|
Mar 17 |
Sep 16 | Mar 16 | Mar 17 | Mar 17 | ||||||||||||||||||
| NZD M | NZD M | NZD M | v. Sep 16 | v. Mar 16 | ||||||||||||||||||
|
Retail |
21 | 26 | 26 | -19% | -19% | |||||||||||||||||
|
Home Loans |
(6) | (2) | (2) | large | large | |||||||||||||||||
|
Other |
27 | 28 | 28 | -4% | -4% | |||||||||||||||||
|
Commercial |
43 | 39 | 21 | 10% | large | |||||||||||||||||
|
Individual credit impairment charge/(release) |
64 | 65 | 47 | -2% | 36% | |||||||||||||||||
| Collective credit impairment charge/(release) | Half Year | Movement | ||||||||||||||||||||
|
Mar 17 |
Sep 16 | Mar 16 | Mar 17 | Mar 17 | ||||||||||||||||||
| NZD M | NZD M | NZD M | v. Sep 16 | v. Mar 16 | ||||||||||||||||||
|
Retail |
(7) | 1 | 2 | large | large | |||||||||||||||||
|
Home Loans |
(3) | 1 | (2) | large | 50% | |||||||||||||||||
|
Other |
(4) | - | 4 | n/a | large | |||||||||||||||||
|
Commercial |
(18) | 17 | (3) | large | large | |||||||||||||||||
|
Collective credit impairment charge/(release) |
(25) | 18 | (1) | large | large | |||||||||||||||||
|
Total credit impairment charge/(release) |
39 | 83 | 46 | -53% | -15% | |||||||||||||||||
| Net loans and advances1 | As at | Movement | ||||||||||||||||||||
|
Mar 17 |
Sep 16 | Mar 16 | Mar 17 | Mar 17 | ||||||||||||||||||
| NZD M | NZD M | NZD M | v. Sep 16 | v. Mar 16 | ||||||||||||||||||
|
Retail |
74,379 | 72,730 | 69,891 | 2% | 6% | |||||||||||||||||
|
Home Loans |
70,439 | 68,706 | 65,855 | 3% | 7% | |||||||||||||||||
|
Other |
3,940 | 4,024 | 4,036 | -2% | -2% | |||||||||||||||||
|
Commercial |
40,352 | 40,415 | 40,137 | 0% | 1% | |||||||||||||||||
|
Net loans and advances |
114,731 | 113,145 | 110,028 | 1% | 4% | |||||||||||||||||
| Customer deposits1 | As at | Movement | ||||||||||||||||||||
|
Mar 17 |
Sep 16 | Mar 16 | Mar 17 | Mar 17 | ||||||||||||||||||
| NZD M | NZD M | NZD M | v. Sep 16 | v. Mar 16 | ||||||||||||||||||
|
Retail |
66,292 | 63,111 | 62,234 | 5% | 7% | |||||||||||||||||
|
Commercial |
14,946 | 13,251 | 13,146 | 13% | 14% | |||||||||||||||||
|
Customer deposits |
81,238 | 76,362 | 75,380 | 6% | 8% | |||||||||||||||||
| 1. | Balance Sheet amounts as at 31 March 2017 include assets and liabilities held for sale. |
Net funds management and insurance income
| Half Year | Movement | |||||||||||||||||||||||
|
Mar 17 |
Sep 16 | Mar 16 | Mar 17 | Mar 17 | ||||||||||||||||||||
| NZD M | NZD M | NZD M | v. Sep 16 | v. Mar 16 | ||||||||||||||||||||
|
Insurance |
85 | 84 | 83 | 1% | 2% | |||||||||||||||||||
|
Insurance income |
91 | 90 | 90 | 1% | 1% | |||||||||||||||||||
|
Insurance volume related expenses |
(6) | (6) | (7) | 0% | -14% | |||||||||||||||||||
|
Funds Management |
98 | 97 | 90 | 1% | 9% | |||||||||||||||||||
|
Funds management income |
109 | 109 | 101 | 0% | 8% | |||||||||||||||||||
|
Funds management volume related expenses |
(11) | (12) | (11) | -8% | 0% | |||||||||||||||||||
|
Total net funds management and insurance income |
183 | 181 | 173 | 1% | 6% | |||||||||||||||||||
|
In-force premiums1 |
192 | 190 | 186 | 1% | 3% | |||||||||||||||||||
|
Funds under management |
27,146 | 26,485 | 24,835 | 2% | 9% | |||||||||||||||||||
|
Average funds under management |
26,383 | 25,751 | 23,808 | 2% | 11% | |||||||||||||||||||
|
Life insurance expenses to Life in-force premiums |
30.1% | 33.4% | 34.2% | |||||||||||||||||||||
|
Retail Insurance lapse rates |
13.8% | 15.4% | 14.9% | |||||||||||||||||||||
|
Funds Management expenses to average FUM2 |
0.32% | 0.44% | 0.27% | |||||||||||||||||||||
| 1. | In-force premiums reflect the disposal of the New Zealand medical business in the March 2016 half. |
| 2. | Funds Management expense and FUM only relates to the Pensions & Investments business. |
59
DIVISIONAL RESULTS
New Zealand
David Hisco
| Central | New Zealand | |||||||||||||||
| Retail | Commercial | Functions | Total | |||||||||||||
| March 2017 Half Year | NZD M | NZD M | NZD M | NZD M | ||||||||||||
|
Net interest income |
877 | 446 | 11 | 1,334 | ||||||||||||
|
Other operating income |
145 | 9 | (1) | 153 | ||||||||||||
|
Net funds management and insurance income |
184 | - | (1) | 183 | ||||||||||||
|
Operating income |
1,206 | 455 | 9 | 1,670 | ||||||||||||
|
Operating expenses |
(498) | (127) | (11) | (636) | ||||||||||||
|
Profit before credit impairment and income tax |
708 | 328 | (2) | 1,034 | ||||||||||||
|
Credit impairment (charge)/release |
(14) | (25) | - | (39) | ||||||||||||
|
Profit before income tax |
694 | 303 | (2) | 995 | ||||||||||||
|
Income tax expense and non-controlling interests |
(195) | (84) | 1 | (278) | ||||||||||||
|
Cash profit |
499 | 219 | (1) | 717 | ||||||||||||
|
Individual credit impairment charge/(release) |
21 | 43 | - | 64 | ||||||||||||
|
Collective credit impairment charge/(release) |
(7) | (18) | - | (25) | ||||||||||||
|
Net loans and advances1 |
74,379 | 40,352 | - | 114,731 | ||||||||||||
|
Customer deposits1 |
66,292 | 14,946 | - | 81,238 | ||||||||||||
|
Risk weighted assets1 |
29,358 | 32,086 | 977 | 62,421 | ||||||||||||
| March 2016 Half Year |
||||||||||||||||
|
Net interest income |
857 | 445 | 5 | 1,307 | ||||||||||||
|
Other operating income |
144 | 10 | 14 | 168 | ||||||||||||
|
Net funds management and insurance income |
173 | 1 | (1) | 173 | ||||||||||||
|
Operating income |
1,174 | 456 | 18 | 1,648 | ||||||||||||
|
Operating expenses |
(511) | (128) | - | (639) | ||||||||||||
|
Profit before credit impairment and income tax |
663 | 328 | 18 | 1,009 | ||||||||||||
|
Credit impairment (charge)/release |
(28) | (18) | - | (46) | ||||||||||||
|
Profit before income tax |
635 | 310 | 18 | 963 | ||||||||||||
|
Income tax expense and non-controlling interests |
(171) | (87) | (5) | (263) | ||||||||||||
|
Cash profit |
464 | 223 | 13 | 700 | ||||||||||||
|
Individual credit impairment charge/(release) |
26 | 21 | - | 47 | ||||||||||||
|
Collective credit impairment charge/(release) |
2 | (3) | - | (1) | ||||||||||||
|
Net loans and advances |
69,891 | 40,137 | - | 110,028 | ||||||||||||
|
Customer deposits |
62,234 | 13,146 | - | 75,380 | ||||||||||||
|
Risk weighted assets |
30,144 | 30,452 | 884 | 61,480 | ||||||||||||
| March 2017 Half Year vs March 2016 Half Year |
||||||||||||||||
|
Net interest income |
2% | 0% | large | 2% | ||||||||||||
|
Other operating income |
1% | -10% | large | -9% | ||||||||||||
|
Net funds management and insurance income |
6% | -100% | 0% | 6% | ||||||||||||
|
Operating income |
3% | 0% | -50% | 1% | ||||||||||||
|
Operating expenses |
-3% | -1% | n/a | 0% | ||||||||||||
|
Profit before credit impairment and income tax |
7% | 0% | large | 2% | ||||||||||||
|
Credit impairment (charge)/release |
-50% | 39% | n/a | -15% | ||||||||||||
|
Profit before income tax |
9% | -2% | large | 3% | ||||||||||||
|
Income tax expense and non-controlling interests |
14% | -3% | large | 6% | ||||||||||||
|
Cash profit |
8% | -2% | large | 2% | ||||||||||||
|
Individual credit impairment charge/(release) |
-19% | large | n/a | 36% | ||||||||||||
|
Collective credit impairment charge/(release) |
large | large | n/a | large | ||||||||||||
|
Net loans and advances |
6% | 1% | n/a | 4% | ||||||||||||
|
Customer deposits |
7% | 14% | n/a | 8% | ||||||||||||
|
Risk weighted assets |
-3% | 5% | 11% | 2% | ||||||||||||
| 1. | Balance Sheet amounts as at 31 March 2017 include assets and liabilities held for sale. |
60
DIVISIONAL RESULTS
New Zealand
David Hisco
| Central | New Zealand | |||||||||||||||
| Retail | Commercial | Functions | Total | |||||||||||||
| March 2017 Half Year | NZD M | NZD M | NZD M | NZD M | ||||||||||||
|
Net interest income |
877 | 446 | 11 | 1,334 | ||||||||||||
|
Other operating income |
145 | 9 | (1) | 153 | ||||||||||||
|
Net funds management and insurance income |
184 | - | (1) | 183 | ||||||||||||
|
Operating income |
1,206 | 455 | 9 | 1,670 | ||||||||||||
|
Operating expenses |
(498) | (127) | (11) | (636) | ||||||||||||
|
Profit before credit impairment and income tax |
708 | 328 | (2) | 1,034 | ||||||||||||
|
Credit impairment (charge)/release |
(14) | (25) | - | (39) | ||||||||||||
|
Profit before income tax |
694 | 303 | (2) | 995 | ||||||||||||
|
Income tax expense and non-controlling interests |
(195) | (84) | 1 | (278) | ||||||||||||
|
Cash profit |
499 | 219 | (1) | 717 | ||||||||||||
|
Individual credit impairment charge/(release) |
21 | 43 | - | 64 | ||||||||||||
|
Collective credit impairment charge/(release) |
(7) | (18) | - | (25) | ||||||||||||
|
Net loans and advances1 |
74,379 | 40,352 | - | 114,731 | ||||||||||||
|
Customer deposits1 |
66,292 | 14,946 | - | 81,238 | ||||||||||||
|
Risk weighted assets1 |
29,358 | 32,086 | 977 | 62,421 | ||||||||||||
| September 2016 Half Year |
||||||||||||||||
|
Net interest income |
873 | 444 | 5 | 1,322 | ||||||||||||
|
Other operating income |
165 | 10 | (6) | 169 | ||||||||||||
|
Net funds management and insurance income |
182 | 1 | (2) | 181 | ||||||||||||
|
Operating income |
1,220 | 455 | (3) | 1,672 | ||||||||||||
|
Operating expenses |
(537) | (129) | (11) | (677) | ||||||||||||
|
Profit before credit impairment and income tax |
683 | 326 | (14) | 995 | ||||||||||||
|
Credit impairment (charge)/release |
(27) | (56) | - | (83) | ||||||||||||
|
Profit before income tax |
656 | 270 | (14) | 912 | ||||||||||||
|
Income tax expense and non-controlling interests |
(179) | (76) | 4 | (251) | ||||||||||||
|
Cash profit |
477 | 194 | (10) | 661 | ||||||||||||
|
Individual credit impairment charge/(release) |
26 | 39 | - | 65 | ||||||||||||
|
Collective credit impairment charge/(release) |
1 | 17 | - | 18 | ||||||||||||
|
Net loans and advances |
72,730 | 40,415 | - | 113,145 | ||||||||||||
|
Customer deposits |
63,111 | 13,251 | - | 76,362 | ||||||||||||
|
Risk weighted assets |
29,580 | 31,950 | 993 | 62,523 | ||||||||||||
| March 2017 Half Year vs September 2016 Half Year |
||||||||||||||||
|
Net interest income |
0% | 0% | large | 1% | ||||||||||||
|
Other operating income |
-12% | -10% | -83% | -9% | ||||||||||||
|
Net funds management and insurance income |
1% | -100% | -50% | 1% | ||||||||||||
|
Operating income |
-1% | 0% | large | 0% | ||||||||||||
|
Operating expenses |
-7% | -2% | 0% | -6% | ||||||||||||
|
Profit before credit impairment and income tax |
4% | 1% | -86% | 4% | ||||||||||||
|
Credit impairment (charge)/release |
-48% | -55% | n/a | -53% | ||||||||||||
|
Profit before income tax |
6% | 12% | -86% | 9% | ||||||||||||
|
Income tax expense and non-controlling interests |
9% | 11% | -75% | 11% | ||||||||||||
|
Cash profit |
5% | 13% | -90% | 8% | ||||||||||||
|
Individual credit impairment charge/(release) |
-19% | 10% | n/a | -2% | ||||||||||||
|
Collective credit impairment charge/(release) |
large | large | n/a | large | ||||||||||||
|
Net loans and advances |
2% | 0% | n/a | 1% | ||||||||||||
|
Customer deposits |
5% | 13% | n/a | 6% | ||||||||||||
|
Risk weighted assets |
-1% | 0% | -2% | 0% | ||||||||||||
| 1. | Balance Sheet amounts as at 31 March 2017 include assets and liabilities held for sale. |
61
DIVISIONAL RESULTS
New Zealand
David Hisco
Table reflects AUD for New Zealand
NZD results shown on page 58
| Half Year | Movement | |||||||||||||||||||||||
|
Mar 17 |
Sep 16 $M |
Mar 16 $M |
Mar 17 v. Sep 16 |
Mar 17 v. Mar 16 |
||||||||||||||||||||
| Net interest income |
1,260 | 1,242 | 1,206 | 1% | 4% | |||||||||||||||||||
| Other operating income |
144 | 159 | 155 | -9% | -7% | |||||||||||||||||||
| Net funds management and insurance income |
173 | 170 | 160 | 2% | 8% | |||||||||||||||||||
| Operating income |
1,577 | 1,571 | 1,521 | 0% | 4% | |||||||||||||||||||
| Operating expenses |
(600) | (635) | (590) | -6% | 2% | |||||||||||||||||||
| Profit before credit impairment and income tax |
977 | 936 | 931 | 4% | 5% | |||||||||||||||||||
| Credit impairment (charge)/release |
(37) | (78) | (42) | -53% | -12% | |||||||||||||||||||
| Profit before income tax |
940 | 858 | 889 | 10% | 6% | |||||||||||||||||||
| Income tax expense and non-controlling interests |
(263) | (236) | (243) | 11% | 8% | |||||||||||||||||||
| Cash profit |
677 | 622 | 646 | 9% | 5% | |||||||||||||||||||
|
Consisting of: |
||||||||||||||||||||||||
|
Retail |
472 | 449 | 428 | 5% | 10% | |||||||||||||||||||
| Commercial |
206 | 183 | 206 | 13% | 0% | |||||||||||||||||||
| Central Functions |
(1) | (10) | 12 | -90% | large | |||||||||||||||||||
| Cash profit |
677 | 622 | 646 | 9% | 5% | |||||||||||||||||||
|
Balance Sheet1 |
||||||||||||||||||||||||
|
Net loans and advances |
104,884 | 107,893 | 99,185 | -3% | 6% | |||||||||||||||||||
| Other external assets |
6,429 | 4,505 | 3,816 | 43% | 68% | |||||||||||||||||||
| External assets |
111,313 | 112,398 | 103,001 | -1% | 8% | |||||||||||||||||||
| Customer deposits |
74,266 | 72,818 | 67,951 | 2% | 9% | |||||||||||||||||||
| Other deposits and borrowings |
2,696 | 5,109 | 4,904 | -47% | -45% | |||||||||||||||||||
| Deposits and other borrowings |
76,962 | 77,927 | 72,855 | -1% | 6% | |||||||||||||||||||
| Other external liabilities |
20,320 | 20,496 | 17,209 | -1% | 18% | |||||||||||||||||||
| External liabilities |
97,282 | 98,423 | 90,064 | -1% | 8% | |||||||||||||||||||
| Risk weighted assets |
57,064 | 59,621 | 55,421 | -4% | 3% | |||||||||||||||||||
| Average gross loans and advances |
107,704 | 105,518 | 100,427 | 2% | 7% | |||||||||||||||||||
| Average deposits and other borrowings |
79,190 | 77,661 | 73,175 | 2% | 8% | |||||||||||||||||||
| In-force premiums2 |
175 | 181 | 167 | -3% | 5% | |||||||||||||||||||
| Funds under management |
24,816 | 25,256 | 22,388 | -2% | 11% | |||||||||||||||||||
| Average funds under management |
24,912 | 24,189 | 21,976 | 3% | 13% | |||||||||||||||||||
|
Ratios1 |
||||||||||||||||||||||||
|
Return on average assets |
1.20% | 1.14% | 1.24% | |||||||||||||||||||||
| Net interest margin |
2.30% | 2.35% | 2.40% | |||||||||||||||||||||
| Operating expenses to operating income |
38.1% | 40.4% | 38.8% | |||||||||||||||||||||
| Operating expenses to average assets |
1.07% | 1.17% | 1.14% | |||||||||||||||||||||
| Individual credit impairment charge/(release) |
61 | 61 | 43 | 0% | 42% | |||||||||||||||||||
| Individual credit impairment charge/(release) as a % of average GLA |
0.11% | 0.11% | 0.09% | |||||||||||||||||||||
| Collective credit impairment charge/(release) |
(24) | 17 | (1) | large | large | |||||||||||||||||||
| Collective credit impairment charge/(release) as a % of average GLA |
(0.04%) | 0.03% | (0.00%) | |||||||||||||||||||||
| Gross impaired assets |
409 | 346 | 273 | 18% | 50% | |||||||||||||||||||
| Gross impaired assets as a % of GLA |
0.39% | 0.32% | 0.27% | |||||||||||||||||||||
| Life insurance expenses to Life in-force premiums |
30.1% | 33.4% | 34.2% | |||||||||||||||||||||
| Retail Insurance lapse rates |
13.8% | 15.4% | 14.9% | |||||||||||||||||||||
| Funds Management expenses to average FUM3 |
0.32% | 0.44% | 0.27% | |||||||||||||||||||||
| Total full time equivalent staff (FTE) |
6,250 | 6,317 | 6,401 | -1% | -2% | |||||||||||||||||||
| 1. | Balance Sheet amounts as at 31 March 2017 include assets and liabilities held for sale. |
| 2. | In-force premiums reflect the disposal of the New Zealand medical business in the March 2016 half. |
| 3. | Funds Management expense and funds under management relates to the Pensions & Investments business. |
62
DIVISIONAL RESULTS
Wealth Australia
Alexis George
| Half Year | Movement | |||||||||||||||||||||||
|
Mar 17 $M |
Sep 16 $M |
Mar 16 $M |
Mar 17 v. Sep 16 |
Mar 17 v. Mar 16 |
||||||||||||||||||||
| Net interest income |
5 | 5 | 6 | 0% | -17% | |||||||||||||||||||
| Other operating income |
46 | 46 | 42 | 0% | 10% | |||||||||||||||||||
| Net funds management and insurance income
|
|
493
|
|
|
559
|
|
|
597
|
|
|
-12%
|
|
|
-17%
|
| |||||||||
| Operating income |
544 | 610 | 645 | -11% | -16% | |||||||||||||||||||
| Operating expenses
|
(370) | (391) | (410) | -5% | -10% | |||||||||||||||||||
| Profit before income tax |
174 | 219 | 235 | -21% | -26% | |||||||||||||||||||
| Income tax expense and non-controlling interests
|
|
(51)
|
|
|
(62)
|
|
|
(68)
|
|
|
-18%
|
|
|
-25%
|
| |||||||||
|
Cash profit
|
|
123
|
|
|
157
|
|
|
167
|
|
|
-22%
|
|
|
-26%
|
| |||||||||
| Consisting of: |
||||||||||||||||||||||||
| Insurance |
102 | 127 | 126 | -20% | -19% | |||||||||||||||||||
| Funds Management |
41 | 48 | 39 | -15% | 5% | |||||||||||||||||||
| Corporate and Other
|
|
(20)
|
|
|
(18)
|
|
|
2
|
|
|
11%
|
|
|
large
|
| |||||||||
|
Total Wealth Australia
|
|
123
|
|
|
157
|
|
|
167
|
|
|
-22%
|
|
|
-26%
|
| |||||||||
| Income from invested capital1
|
|
41
|
|
|
47
|
|
|
63
|
|
|
-13%
|
|
|
-35%
|
| |||||||||
| Key metrics |
||||||||||||||||||||||||
| In-force premiums |
||||||||||||||||||||||||
| Life Insurance |
1,600 | 1,603 | 1,569 | 0% | 2% | |||||||||||||||||||
| General Insurance2 |
226 | 226 | 335 | 0% | -33% | |||||||||||||||||||
| Average in-force premiums |
||||||||||||||||||||||||
| Life Insurance |
1,602 | 1,587 | 1,543 | 1% | 4% | |||||||||||||||||||
| General Insurance2 |
225 | 280 | 422 | -20% | -47% | |||||||||||||||||||
| Funds under management |
49,251 | 48,251 | 46,630 | 2% | 6% | |||||||||||||||||||
| Average funds under management
|
|
48,375
|
|
|
48,060
|
|
|
47,182
|
|
|
1%
|
|
|
3%
|
| |||||||||
| Ratios |
||||||||||||||||||||||||
| Operating expenses to operating income |
68.0% | 64.1% | 63.6% | |||||||||||||||||||||
| Insurance expenses to In-force premiums |
11.9% | 11.6% | 12.2% | |||||||||||||||||||||
| Retail Insurance lapse rates |
13.8% | 15.0% | 13.0% | |||||||||||||||||||||
| Funds Management expenses to average FUM3
|
|
0.50%
|
|
|
0.48%
|
|
|
0.58%
|
|
|||||||||||||||
|
Total full time equivalent staff (FTE)
|
|
2,043
|
|
|
2,098
|
|
|
2,158
|
|
|
-3%
|
|
|
-5%
|
| |||||||||
|
Aligned adviser numbers4
|
|
1,511
|
|
|
1,545
|
|
|
1,618
|
|
|
-2%
|
|
|
-7%
|
| |||||||||
| 1. | Income from invested capital represents after tax revenue generated from investing all Insurance and Funds Management business’s capital balances held for regulatory purposes. The invested capital as at 31 March 2017 was $3.4 billion (Sep 16: $3.4 billion; Mar 16: $3.4 billion), which comprises fixed interest securities of 48% and cash deposits of 52% (Sep 16: 48% fixed interest securities and 52% cash deposits, Mar 16: 45% fixed interest securities and 55% cash deposits). |
| 2. | General insurance in-force premiums reflect the impact of ceasing the underwriting of new home, content, travel and motor insurance in September 2015. |
| 3. | Funds Management expense and funds under management relates to the Pensions & Investments business and excludes ANZ Share Investing. |
| 4. | Includes corporate authorised representatives of dealer groups wholly or partially owned by ANZ Wealth Australia and ANZ employed financial planners. |
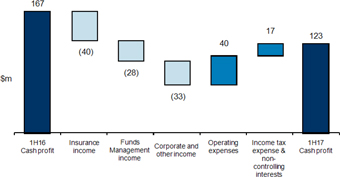
63
DIVISIONAL RESULTS
Wealth Australia
Alexis George
Major business units
| Half Year | Movement | |||||||||||||||||||||||
| Insurance |
Mar 17 |
Sep 16 $M |
Mar 16 $M |
Mar 17 v. Sep 16 |
Mar 17 v. Mar 16 |
|||||||||||||||||||
| Net interest income |
11 | 12 | 11 | -8% | 0% | |||||||||||||||||||
| Insurance income |
354 | 408 | 420 | -13% | -16% | |||||||||||||||||||
| Insurance volume related expenses
|
|
(110)
|
|
|
(134)
|
|
|
(136)
|
|
|
-18%
|
|
|
-19%
|
| |||||||||
| Operating income |
255 | 286 | 295 | -11% | -14% | |||||||||||||||||||
| Operating expenses
|
|
(109)
|
|
|
(106)
|
|
|
(116)
|
|
|
3%
|
|
|
-6%
|
| |||||||||
| Profit before income tax |
146 | 180 | 179 | -19% | -18% | |||||||||||||||||||
| Income tax expense and non-controlling interests |
(44) | (53) | (53) | -17% | -17% | |||||||||||||||||||
|
Cash profit
|
|
102
|
|
|
127
|
|
|
126
|
|
|
-20%
|
|
|
-19%
|
| |||||||||
| Half Year | Movement | |||||||||||||||||||||||
| Funds Management |
Mar 17 $M |
Sep 16 $M |
Mar 16 $M |
Mar 17 v. Sep 16 |
Mar 17 v. Mar 16 |
|||||||||||||||||||
| Net interest income |
14 | 14 | 16 | 0% | -13% | |||||||||||||||||||
| Other operating income |
40 | 36 | 36 | 11% | 11% | |||||||||||||||||||
| Funds management income |
314 | 340 | 352 | -8% | -11% | |||||||||||||||||||
| Funds management volume related expenses
|
|
(161)
|
|
|
(169)
|
|
|
(169)
|
|
|
-5%
|
|
|
-5%
|
| |||||||||
| Operating income |
207 | 221 | 235 | -6% | -12% | |||||||||||||||||||
| Operating expenses
|
|
(151)
|
|
|
(152)
|
|
|
(179)
|
|
|
-1%
|
|
|
-16%
|
| |||||||||
| Profit before income tax |
56 | 69 | 56 | -19% | 0% | |||||||||||||||||||
| Income tax expense and non-controlling interests
|
|
(15)
|
|
|
(21)
|
|
|
(17)
|
|
|
-29%
|
|
|
-12%
|
| |||||||||
|
Cash profit
|
|
41
|
|
|
48
|
|
|
39
|
|
|
-15%
|
|
|
5%
|
| |||||||||
Insurance metrics
| Half Year | Movement | |||||||||||||||||||||||
| Insurance operating margin |
Mar 17 |
Sep 16 $M |
Mar 16 $M |
Mar 17 v. Sep 16 |
Mar 17 v. Mar 16 |
|||||||||||||||||||
| Life Insurance Planned profit margin |
||||||||||||||||||||||||
| Group & Individual |
64 | 79 | 72 | -19% | -11% | |||||||||||||||||||
| Experience profit/(loss)1 |
(26) | (11) | 3 | large | large | |||||||||||||||||||
| General Insurance operating profit margin
|
|
64
|
|
|
59
|
|
|
51
|
|
|
8%
|
|
|
25%
|
| |||||||||
|
Total
|
|
102
|
|
|
127
|
|
|
126
|
|
|
-20%
|
|
|
-19%
|
| |||||||||
| 1. | Experience profit/(loss) variations are gains or losses arising from actual experience differing from plan, predominantly driven by lapses, claims and expenses. |
| As at | Movement | |||||||||||||||||||||||
| Insurance annual in-force premiums |
Mar 17 |
Sep 16 $M |
Mar 16 $M |
Mar 17 v. Sep 16 |
Mar 17 v. Mar 16 |
|||||||||||||||||||
| Group |
427 | 445 | 439 | -4% | -3% | |||||||||||||||||||
| Individual |
1,173 | 1,158 | 1,130 | 1% | 4% | |||||||||||||||||||
| General Insurance
|
|
226
|
|
|
226
|
|
|
335
|
|
|
0%
|
|
|
-33%
|
| |||||||||
|
Total
|
|
1,826
|
|
|
1,829
|
|
|
1,904
|
|
|
0%
|
|
|
-4%
|
| |||||||||
| Insurance in-force book movement | Sep 16 $M |
New |
Lapses $M |
Mar 17 $M |
||||||||||||||||||||
| Group |
445 | 19 | (37) | 427 | ||||||||||||||||||||
| Individual |
1,158 | 65 | (50) | 1,173 | ||||||||||||||||||||
| General Insurance
|
|
226
|
|
|
76
|
|
|
(76)
|
|
|
226
|
| ||||||||||||
|
Total
|
|
1,829
|
|
|
160
|
|
|
(163)
|
|
|
1,826
|
| ||||||||||||
64
DIVISIONAL RESULTS
Wealth Australia
Alexis George
Funds Management metrics
| As at | Movement | |||||||||||||||||||||||||||||
| Funds under management |
Mar 17 $M |
Sep 16 $M |
Mar 16 $M |
Mar 17 v. Sep 16 |
Mar 17 v. Mar 16 |
|||||||||||||||||||||||||
| Australian equities |
15,393 | 15,248 | 14,496 | 1% | 6% | |||||||||||||||||||||||||
| International equities |
12,442 | 11,044 | 10,618 | 13% | 17% | |||||||||||||||||||||||||
| Cash and fixed interest |
17,763 | 18,582 | 18,356 | -4% | -3% | |||||||||||||||||||||||||
| Property and infrastructure
|
|
3,653
|
|
|
3,377
|
|
|
3,160
|
|
|
8%
|
|
16%
|
| ||||||||||||||||
|
Total
|
|
49,251
|
|
|
48,251
|
|
|
46,630
|
|
|
2%
|
|
6%
|
| ||||||||||||||||
| Funds Management cash flows by product | Sep 16 $M |
Inflows $M |
Outflows $M |
Other1 $M |
Mar 17 |
|||||||||||||||||||||||||
| Open solutions |
||||||||||||||||||||||||||||||
| OneAnswer Frontier |
9,958 | 719 | (631) | 454 | 10,500 | |||||||||||||||||||||||||
| ANZ Smart Choice |
11,190 | 1,122 | (629) | 3,099 | 14,782 | |||||||||||||||||||||||||
| Wrap (Voyage and Grow) |
2,160 | 312 | (150) | 635 | 2,957 | |||||||||||||||||||||||||
| Closed solutions |
||||||||||||||||||||||||||||||
| Retail |
19,028 | 281 | (1,432) | (34) | 17,843 | |||||||||||||||||||||||||
| Employer
|
|
5,915
|
|
|
72
|
|
|
(324)
|
|
|
(2,494)
|
|
3,169
|
|||||||||||||||||
|
Total
|
|
48,251
|
|
|
2,506
|
|
|
(3,166)
|
|
|
1,660
|
|
49,251
|
|||||||||||||||||
| 1. | Other includes investment income net of taxes, fees and charges and distributions. It also includes the transition of funds under management from Employer Super to ANZ Smart Choice of approximately $2.5 billion as a result of regulatory changes in the industry. |
| Embedded value and value of new business (insurance and investments only)1 | $M | |
| Embedded value as at September 20162 |
4,536 | |
| Value of new business3 |
50 | |
| Expected return4 |
151 | |
| Experience deviations and assumption changes5
|
(67)
| |
| Embedded value before economic assumption changes and net transfer |
4,670 | |
| Economic assumptions change6 |
(80) | |
| Net transfer7
|
(143)
| |
|
Embedded value as at March 2017
|
4,447
| |
| 1. | The product lines used are on the same basis as prior periods. This is different to the product lines that are subject to a strategic review. |
| 2. | Embedded value represents the present value of future profits and releases of capital arising from the business in-force at the valuation date, and adjusted net assets. It is determined using best estimate assumptions with franking credits included at 70% of face value. Projected cash flows have been discounted using capital asset pricing model risk discount rates of 7.75%-9.25%. ANZ Lenders Mortgage Insurance, ANZ Financial Planning and ANZ Share Investing businesses are not included in the valuation. |
| 3. | Value of new business represents the present value of future profits less the cost of capital arising from new business written over the period. |
| 4. | Expected return represents the expected increase in value over the period. |
| 5. | Experience deviations and assumption changes arise from deviations and changes to best estimate assumptions underlying the prior period embedded value. Unfavourable experience was primarily driven by credit card repricing and retail life claims experience. |
| 6. | Interest rate movements have led to a negative value impact. |
| 7. | Net transfer represents the net capital movements over the period including capital injections, transfer of cash dividends paid and value of franking credits. There was $120 million of cash dividends paid, $6 million of dividends in AT1 preference shares paid and $17 million of franking credits expected to be transferred to the parent entity. |
65
DIVISIONAL RESULTS
Asia Retail & Pacific
David Hisco
| Half Year
|
Movement
|
|||||||||||||||||||||||
|
Mar 17 $M |
Sep 16 $M |
Mar 16 $M |
Mar 17 v. Sep 16 |
Mar 17 v. Mar 16 |
||||||||||||||||||||
| Net interest income |
331 | 347 | 351 | -5% | -6% | |||||||||||||||||||
| Other operating income1
|
|
(139)
|
|
|
235
|
|
|
243
|
|
|
large
|
|
|
large
|
| |||||||||
| Operating income |
192 | 582 | 594 | -67% | -68% | |||||||||||||||||||
| Operating expenses1
|
|
(353)
|
|
|
(379)
|
|
|
(429)
|
|
|
-7%
|
|
|
-18%
|
| |||||||||
| Profit before credit impairment and income tax |
(161) | 203 | 165 | large | large | |||||||||||||||||||
| Credit impairment (charge)/release
|
|
(75)
|
|
|
(82)
|
|
|
(90)
|
|
|
-9%
|
|
|
-17%
|
| |||||||||
| Profit before income tax |
(236) | 121 | 75 | large | large | |||||||||||||||||||
| Income tax expense and non-controlling interests1
|
|
19
|
|
|
(22)
|
|
|
(15)
|
|
|
large
|
|
|
large
|
| |||||||||
|
Cash profit/(loss)1
|
|
(217)
|
|
|
99
|
|
|
60
|
|
|
large
|
|
|
large
|
| |||||||||
| Balance Sheet2 |
||||||||||||||||||||||||
|
Net loans and advances |
12,525 | 13,370 | 13,862 | -6% | -10% | |||||||||||||||||||
| Customer deposits |
21,867 | 22,782 | 23,496 | -4% | -7% | |||||||||||||||||||
| Risk weighted assets
|
|
12,601
|
|
|
13,372
|
|
|
13,183
|
|
|
-6%
|
|
|
-4%
|
| |||||||||
| Ratios2 |
||||||||||||||||||||||||
|
Return on average assets |
-1.89% | 0.82% | 0.48% | |||||||||||||||||||||
| Net interest margin |
3.00% | 3.00% | 2.93% | |||||||||||||||||||||
| Operating expenses to operating income |
183.9% | 65.1% | 72.2% | |||||||||||||||||||||
| Operating expenses to average assets
|
|
3.08%
|
|
|
3.15%
|
|
|
3.46%
|
|
|||||||||||||||
| Individual credit impairment charge/(release) |
86 | 81 | 80 | 6% | 8% | |||||||||||||||||||
| Individual credit impairment charge/(release) as a % of average GLA |
1.31% | 1.16% | 1.09% | |||||||||||||||||||||
| Collective credit impairment charge/(release) |
(11) | 1 | 10 | large | large | |||||||||||||||||||
| Collective credit impairment charge/(release) as a % of average GLA |
-0.17% | 0.01% | 0.14% | |||||||||||||||||||||
| Gross impaired assets |
243 | 252 | 235 | -4% | 3% | |||||||||||||||||||
| Gross impaired assets as a % of GLA
|
|
1.91%
|
|
|
1.86%
|
|
|
1.67%
|
|
|||||||||||||||
|
Total full time equivalent staff (FTE)
|
|
4,719
|
|
|
4,894
|
|
|
5,440
|
|
|
-4%
|
|
|
-13%
|
| |||||||||
| 1. | Includes specified items related to restructuring, and the impact of reclassifying Asia Retail & Wealth businesses to held for sale. For specified items breakdown please refer to pages 12 to 15. |
| 2. | Balance Sheet amounts as at 31 March 2017 include assets and liabilities held for sale. |
Technology, Services & Operations and Group Centre
| Half Year
|
Movement
|
|||||||||||||||||||||||
|
Mar 17 $M |
Sep 16 $M |
Mar 16 $M |
Mar 17 v. Sep 16 |
Mar 17 v. Mar 16 |
||||||||||||||||||||
| Operating income (minority investments in Asia)1 |
170 | 262 | 73 | -35% | large | |||||||||||||||||||
| Operating income (other)2
|
|
140
|
|
|
58
|
|
|
90
|
|
|
large
|
|
|
56%
|
| |||||||||
| Operating income |
310 | 320 | 163 | -3% | 90% | |||||||||||||||||||
| Operating expenses3
|
|
(336)
|
|
|
(370)
|
|
|
(851)
|
|
|
-9%
|
|
|
-61%
|
| |||||||||
| Profit before credit impairment and income tax |
(26) | (50) | (688) | -48% | -96% | |||||||||||||||||||
| Credit impairment (charge)/release
|
|
(11)
|
|
|
(1)
|
|
|
-
|
|
|
large
|
|
|
n/a
|
| |||||||||
| Profit before income tax |
(37) | (51) | (688) | -27% | -95% | |||||||||||||||||||
| Income tax expense and non-controlling interests
|
|
46
|
|
|
94
|
|
|
195
|
|
|
-51%
|
|
|
-76%
|
| |||||||||
|
Cash profit/(loss)
|
|
9
|
|
|
43
|
|
|
(493)
|
|
|
-79%
|
|
|
large
|
| |||||||||
| Risk weighted assets |
7,588 | 8,460 | 5,691 | -10% | 33% | |||||||||||||||||||
| Total full time equivalent staff (FTE) |
16,617 | 16,494 | 17,202 | 1% | -3% | |||||||||||||||||||
| 1. | Includes specified items related to Asian minority investment adjustments. For specified items breakdown please refer to pages 12 to 15. |
| 2. | Includes specified items related to the gain on sale of the Esanda Dealer Finance divestment. For specified items breakdown please refer to pages 12 to 15. The March 2017 half also includes the $114 million gain on sale of 100 Queen Street, Melbourne. |
| 3. | Includes specified items related to software capitalisation and restructuring. For specified items breakdown please refer to pages 12 to 15. |
66
PROFIT RECONCILIATION
CONTENTS
| Profit Reconciliation |
||
| Adjustments between statutory profit and cash profit |
||
| Explanation of adjustments between statutory profit and cash profit |
||
| Other reclassifications between statutory profit and cash profit |
||
| Reconciliation of statutory profit to cash profit |
||
67
PROFIT RECONCILIATION
Non-IFRS information
The Group provides additional measures of performance in the Consolidated Financial Report & Dividend Announcement which are prepared on a basis other than in accordance with accounting standards. The guidance provided in ASIC’s Regulatory Guide 230 has been followed when presenting this information.
Adjustments between statutory profit and cash profit
Cash profit represents ANZ’s preferred measure of the result of the ongoing business activities of the Group, enabling readers to assess Group and Divisional performance against prior periods and against peer institutions. To calculate cash profit, the Group excludes non-core items from statutory profit (refer to Definitions for further details). The adjustments made in arriving at cash profit are included in statutory profit which is subject to review within the context of the external auditor’s review of the Condensed Consolidated Financial Statements. Cash profit is not subject to review or audit by the external auditor. The external auditor has informed the Audit Committee that recurring adjustments have been determined on a consistent basis across each period presented, and the additional adjustment for the reclassification of Shanghai Rural Commercial Bank to held for sale in the March 2017 half is appropriate.
| Half Year
|
Movement
|
|||||||||||||||||||||||
|
Mar 17 |
Sep 16 $M |
Mar 16 $M |
Mar 17 v. Sep 16 |
Mar 17 v. Mar 16 |
||||||||||||||||||||
|
Statutory profit attributable to shareholders of the Company |
2,911 | 2,971 | 2,738 | -2% | 6% | |||||||||||||||||||
| Adjustments between statutory profit and cash profit |
||||||||||||||||||||||||
|
Treasury shares adjustment |
76 | 73 | (29) | 4% | large | |||||||||||||||||||
|
Revaluation of policy liabilities |
36 | (40) | (14) | large | large | |||||||||||||||||||
|
Economic hedges |
178 | (26) | 128 | large | 39% | |||||||||||||||||||
|
Revenue hedges |
(105) | 131 | (39) | large | large | |||||||||||||||||||
|
Structured credit intermediation trades |
(1) | (2) | (2) | -50% | -50% | |||||||||||||||||||
|
Reclassification of SRCB to held for sale
|
|
316
|
|
|
-
|
|
|
-
|
|
|
n/a
|
|
|
n/a
|
| |||||||||
|
Total adjustments between statutory profit and cash profit
|
|
500
|
|
|
136
|
|
|
44
|
|
|
large
|
|
|
large
|
| |||||||||
|
Cash Profit
|
|
3,411
|
|
|
3,107
|
|
|
2,782
|
|
|
10%
|
|
|
23%
|
| |||||||||
Explanation of adjustments between statutory profit and cash profit
| • | Treasury shares adjustment |
ANZ shares held by the Group in Wealth Australia are deemed to be Treasury shares for accounting purposes. Dividends and realised and unrealised gains and losses from these shares are reversed as these are not permitted to be recognised as income for statutory reporting purposes. In deriving cash profit, these earnings are included to ensure there is no asymmetrical impact on the Group’s profits because the Treasury shares are held to support policy liabilities which are revalued through the Income Statement. Accordingly, the half year gain of $76 million after tax ($82 million pre-tax) reversed for statutory accounting purposes has been added back to cash profit.
| • | Revaluation of policy liabilities |
When calculating policy liabilities, the projected future cash flows on insurance contracts are discounted to reflect the present value of the obligation, with the impact of changes in the market discount rate each period being reflected in the income statement. ANZ includes the impact on the re-measurement of the insurance contract attributable to changes in market discount rates as an adjustment to statutory profit to remove the volatility attributable to changes in market interest rates which reverts to zero over the life of the insurance contract.
| • | Economic and revenue hedges |
The Group enters into economic hedges to manage its interest rate and foreign exchange risk which in accordance with accounting standards, result in fair value gains and losses being recognised within the income statement. ANZ removes the fair value adjustments from cash profit since the profit or loss resulting from the hedge transactions will reverse over time to match with the profit or loss from the economically hedged item as part of cash profit. This includes gains and losses arising from approved classes of derivatives not designated in accounting hedge relationships but which are considered to be economic hedges, including hedges of larger foreign exchange denominated revenue and expense streams, primarily NZD and USD (and USD correlated), as well as ineffectiveness from designated accounting hedges.
Economic hedges comprises:
| – | Funding related swaps (primarily cross currency interest rate swaps) used to convert the proceeds of foreign currency debt issuances into floating rate Australian dollar and New Zealand dollar debt. As these swaps do not qualify for hedge accounting, movements in the fair values are recorded in the income statement. The main drivers of these fair values are currency basis spreads and the Australian dollar and New Zealand dollar fluctuations against other major funding currencies. |
| – | Economic hedges of select structured finance and specialised leasing transactions that do not qualify for hedge accounting. The main drivers of these fair value adjustments are movements in the Australian and New Zealand term structure of interest rates. |
| – | Ineffectiveness from designated accounting hedge relationships. |
In the March 2017 half, the majority of the loss in economic hedges related to funding related swaps, principally from tightening basis spreads on currency pairs most notably USD/EUR and from the strengthening of the AUD against a number of major currencies.
Gains on revenue hedges in the March 2017 half are the result of the strengthening of the AUD against the NZD.
68
PROFIT RECONCILIATION
| Half Year | ||||||||||
|
Mar 17 |
Sep 16 | Mar 16 | ||||||||
| Adjustments to the income statement |
$M | $M | $M | |||||||
|
Economic hedges |
254 | (1) | 181 | |||||||
|
Revenue hedges |
|
(148)
|
|
|
148
|
|
(55)
| |||
|
Increase/(decrease) to cash profit before tax
|
106 | 147 | 126 | |||||||
|
Increase/(decrease) to cash profit after tax
|
73 | 105 | 89 | |||||||
| As at | ||||||||||
|
Mar 17 |
Sep 16 | Mar 16 | ||||||||
| Cumulative increase/(decrease) to cash profit before tax |
$M | $M | $M | |||||||
|
Economic hedges |
696 | 442 | 443 | |||||||
|
Revenue hedges
|
|
(23)
|
|
|
125
|
|
(23)
| |||
|
Total
|
673 | 567 | 420 | |||||||
| • | Structured credit intermediation trades |
ANZ entered into a series of structured credit intermediation trades prior to the Global Financial Crisis with eight US financial guarantors. This involved selling credit default swaps (CDSs) as protection over specific debt structures and purchasing CDS protection over the same structures. ANZ has subsequently exited its positions with six US financial guarantors and is monitoring the remaining two portfolios with a view to reducing the exposures when ANZ deems it cost effective relative to the perceived risk associated with a specific trade or counterparty.
The notional value of outstanding bought and sold CDSs at 31 March 2017 amounted to $0.7 billion (Sep 16: $0.7 billion; Mar 16: $0.7 billion). Both the bought and sold CDSs are measured at fair value through profit and loss. However, the associated fair value movements do not fully offset due to the impact of credit risk on the bought CDSs which is driven by market movements in credit spreads and AUD/USD and NZD/USD rates. The fair value (excluding CVA) is $65 million (Sep 16: $67 million; Mar 16: $63 million) with CVA on the bought protection of $9 million (Sep 16: $11 million; Mar 16: $14 million).
The profit and loss associated with the bought and sold protection is included as an adjustment to cash profit as it relates to a legacy business where, unless terminated early, the fair value movements are expected to reverse to zero in future periods. During the period the profit and loss associated with these trades reduced cash profit before tax by $2 million (Sep 16: $3 million; Mar 16: $3 million).
| • | Reclassification of SRCB to held for sale |
On 3 January 2017, the Group announced that it had agreed to sell its 20% stake in Shanghai Rural Commercial Bank (SRCB) to China COSCO Shipping Corporation Limited and Shanghai Sino-Poland Enterprise Management Development Corporation Limited. The agreement will see COSCO and Sino-Poland Enterprise each acquire 10% of SRCB. The sale is subject to customary closing conditions and regulatory approvals and is expected to be completed by mid-2017. This business is part of the Technology, Services & Operations (TSO) and Group Centre division.
In the March 2017 half, the Group recognised a $219 million impairment to the investment, $11 million of foreign exchange losses and $86 million of tax expenses, following the reclassification of the investment to held for sale. This March 2017 half loss will be largely offset by the release of foreign currency translation and available for sale reserves of $289 million on sale completion which is expected to occur in the September 2017 half. In light of the timing difference (and that these amounts largely offset), the impact is excluded from each half yearly cash profit result, however the net impact will be included within cash profit for full year reporting.
Other reclassifications between statutory profit and cash profit
| • | Credit risk on impaired derivatives (nil profit after tax impact) |
The charge to income for derivative credit valuation adjustments of $1 million on defaulted and impaired derivative exposures has been reclassified to cash credit impairment charges in the March 2017 half (Sep 16 half: $13 million charge; Mar 16 half: $14 million charge). The reclassification has been made to reflect the manner in which the defaulted and impaired derivatives are managed.
| • | Policyholders tax gross up (nil profit after tax impact) |
For statutory reporting purposes, policyholders income tax and other related taxes paid on behalf of policyholders are included in both net funds management and insurance income and the Group’s income tax expense. The gross up of $161 million for the March 2017 half (Sep 16 half: $185 million gross up; Mar 16 half: $32 million gross up) has been excluded from the cash results as it does not reflect the underlying performance of the business which is assessed on a net of policyholders tax basis.
69
PROFIT RECONCILIATION
|
Statutory |
Adjustments to statutory profit |
Cash |
||||||||||||||||||||||||||||||||||||||||||
| profit | profit | |||||||||||||||||||||||||||||||||||||||||||
| Treasury shares adjustment |
Policyholders tax gross up |
Revaluation of policy liabilities |
Economic hedges |
Revenue hedges |
Structured credit intermediation trades |
Credit risk on impaired derivatives |
Reclassi- fication of SRCB to held for sale |
Total adjustments to statutory profit |
||||||||||||||||||||||||||||||||||||
| $M | $M | $M | $M | $M | $M | $M | $M | $M | $M | $M | ||||||||||||||||||||||||||||||||||
| March 2017 Half Year |
||||||||||||||||||||||||||||||||||||||||||||
|
Net interest income
|
|
7,416
|
|
|
-
|
|
|
-
|
|
|
-
|
|
|
-
|
|
|
-
|
|
|
-
|
|
|
-
|
|
|
-
|
|
|
-
|
|
|
7,416
|
| |||||||||||
| Net fee and commission income |
1,226 | - | - | - | - | - | - | - | - | - | 1,226 | |||||||||||||||||||||||||||||||||
|
Net foreign exchange earnings
|
654 | - | - | - | 32 | (144) | - | - | 11 | (101) | 553 | |||||||||||||||||||||||||||||||||
| Profit on trading instruments |
342 | - | - | - | 26 | - | (2) | 1 | - | 25 | 367 | |||||||||||||||||||||||||||||||||
|
Net funds management and insurance income |
696 | 82 | (161) | 51 | - | - | - | - | - | (28) | 668 | |||||||||||||||||||||||||||||||||
|
Other |
(338) | - | - | - | 196 | (4) | - | - | 219 | 411 | 73 | |||||||||||||||||||||||||||||||||
|
Other operating income
|
2,580 | 82 | (161) | 51 | 254 | (148) | (2) | 1 | 230 | 307 | 2,887 | |||||||||||||||||||||||||||||||||
| Operating income |
9,996 | 82 | (161) | 51 | 254 | (148) | (2) | 1 | 230 | 307 | 10,303 | |||||||||||||||||||||||||||||||||
|
Operating expenses |
(4,731) | - | - | - | - | - | - | - | - | - | (4,731) | |||||||||||||||||||||||||||||||||
| Profit before credit impairment and tax | 5,265 | 82 | (161) | 51 | 254 | (148) | (2) | 1 | 230 | 307 | 5,572 | |||||||||||||||||||||||||||||||||
|
Credit impairment charge |
(719) | - | - | - | - | - | - | (1) | - | (1) | (720) | |||||||||||||||||||||||||||||||||
| Profit before income tax |
4,546 | 82 | (161) | 51 | 254 | (148) | (2) | - | 230 | 306 | 4,852 | |||||||||||||||||||||||||||||||||
|
Income tax expense |
(1,627) | (6) | 161 | (15) | (76) | 43 | 1 | - | 86 | 194 | (1,433) | |||||||||||||||||||||||||||||||||
|
Non-controlling interests |
(8) | - | - | - | - | - | - | - | - | - | (8) | |||||||||||||||||||||||||||||||||
|
Profit
|
2,911 | 76 | - | 36 | 178 | (105) | (1) | - | 316 | 500 | 3,411 | |||||||||||||||||||||||||||||||||
| September 2016 Half Year |
||||||||||||||||||||||||||||||||||||||||||||
|
Net interest income
|
|
7,527
|
|
|
-
|
|
|
-
|
|
|
-
|
|
|
-
|
|
|
-
|
|
|
-
|
|
|
-
|
|
|
-
|
|
|
-
|
|
|
7,527
|
| |||||||||||
| Net fee and commission income |
1,268 | - | - | - | - | - | - | - | - | - | 1,268 | |||||||||||||||||||||||||||||||||
|
Net foreign exchange earnings |
337 | - | - | - | (1) | 148 | - | - | - | 147 | 484 | |||||||||||||||||||||||||||||||||
|
Profit on trading instruments |
(15) | - | - | - | (20) | - | (3) | 13 | - | (10) | (25) | |||||||||||||||||||||||||||||||||
|
Net funds management and insurance income |
907 | 80 | (185) | (55) | - | - | - | - | - | (160) | 747 | |||||||||||||||||||||||||||||||||
|
Other |
248 | - | - | - | 20 | - | - | - | - | 20 | 268 | |||||||||||||||||||||||||||||||||
|
Other operating income
|
2,745 | 80 | (185) | (55) | (1) | 148 | (3) | 13 | - | (3) | 2,742 | |||||||||||||||||||||||||||||||||
| Operating income |
10,272 | 80 | (185) | (55) | (1) | 148 | (3) | 13 | - | (3) | 10,269 | |||||||||||||||||||||||||||||||||
|
Operating expenses
|
|
(4,951)
|
|
|
-
|
|
|
-
|
|
|
-
|
|
|
-
|
|
|
-
|
|
|
-
|
|
|
-
|
|
|
-
|
|
|
-
|
|
|
(4,951)
|
| |||||||||||
| Profit before credit impairment and tax | 5,321 | 80 | (185) | (55) | (1) | 148 | (3) | 13 | - | (3) | 5,318 | |||||||||||||||||||||||||||||||||
|
Credit impairment charge
|
|
(1,025)
|
|
|
-
|
|
|
-
|
|
|
-
|
|
|
-
|
|
|
-
|
|
|
-
|
|
|
(13)
|
|
|
-
|
|
|
(13)
|
|
|
(1,038)
|
| |||||||||||
| Profit before income tax |
4,296 | 80 | (185) | (55) | (1) | 148 | (3) | - | - | (16) | 4,280 | |||||||||||||||||||||||||||||||||
|
Income tax expense |
(1,318) | (7) | 185 | 15 | (25) | (17) | 1 | - | - | 152 | (1,166) | |||||||||||||||||||||||||||||||||
|
Non-controlling interests |
(7) | - | - | - | - | - | - | - | - | - | (7) | |||||||||||||||||||||||||||||||||
|
Profit
|
2,971 | 73 | - | (40) | (26) | 131 | (2) | - | - | 136 | 3,107 | |||||||||||||||||||||||||||||||||
70
PROFIT RECONCILIATION
|
Statutory |
Adjustments to statutory profit |
Cash |
||||||||||||||||||||||||||||||||||||||||||
| profit | profit | |||||||||||||||||||||||||||||||||||||||||||
| Treasury shares adjustment |
Policyholders tax gross up |
Revaluation of policy liabilities |
Economic hedges |
Revenue hedges |
Structured credit intermediation trades |
Credit risk on impaired derivatives |
Reclassi- fication of SRCB to held for sale |
Total adjustments to statutory profit |
||||||||||||||||||||||||||||||||||||
| $M | $M | $M | $M | $M | $M | $M | $M | $M | $M | $M | ||||||||||||||||||||||||||||||||||
| March 2016 Half Year |
||||||||||||||||||||||||||||||||||||||||||||
|
Net interest income
|
|
7,568
|
|
|
-
|
|
|
-
|
|
|
-
|
|
|
-
|
|
|
-
|
|
|
-
|
|
|
-
|
|
|
-
|
|
|
-
|
|
|
7,568
|
| |||||||||||
| Net fee and commission income | 1,277 | - | - | - | - | - | - | - | - | - | 1,277 | |||||||||||||||||||||||||||||||||
|
Net foreign exchange earnings |
602 | - | - | - | (5) | (55) | - | - | - | (60) | 542 | |||||||||||||||||||||||||||||||||
|
Profit on trading instruments |
(86) | - | - | - | 50 | - | (3) | 14 | - | 61 | (25) | |||||||||||||||||||||||||||||||||
|
Net funds management and insurance income |
857 | (34) | (32) | (20) | - | - | - | - | - | (86) | 771 | |||||||||||||||||||||||||||||||||
|
Other
|
|
56
|
|
|
-
|
|
|
-
|
|
|
-
|
|
|
136
|
|
|
-
|
|
|
-
|
|
|
-
|
|
|
-
|
|
|
136
|
|
|
192
|
| |||||||||||
|
Other operating income
|
2,706 | (34) | (32) | (20) | 181 | (55) | (3) | 14 | - | 51 | 2,757 | |||||||||||||||||||||||||||||||||
| Operating income |
10,274 | (34) | (32) | (20) | 181 | (55) | (3) | 14 | - | 51 | 10,325 | |||||||||||||||||||||||||||||||||
|
Operating expenses
|
|
(5,488)
|
|
|
-
|
|
|
-
|
|
|
-
|
|
|
-
|
|
|
-
|
|
|
-
|
|
|
-
|
|
|
-
|
|
|
-
|
|
|
(5,488)
|
| |||||||||||
| Profit before credit impairment and tax | 4,786 | (34) | (32) | (20) | 181 | (55) | (3) | 14 | - | 51 | 4,837 | |||||||||||||||||||||||||||||||||
|
Credit impairment charge
|
|
(904)
|
|
|
-
|
|
|
-
|
|
|
-
|
|
|
-
|
|
|
-
|
|
|
-
|
|
|
(14)
|
|
|
-
|
|
|
(14)
|
|
|
(918)
|
| |||||||||||
| Profit before income tax |
3,882 | (34) | (32) | (20) | 181 | (55) | (3) | - | - | 37 | 3,919 | |||||||||||||||||||||||||||||||||
|
Income tax expense |
(1,140) | 5 | 32 | 6 | (53) | 16 | 1 | - | - | 7 | (1,133) | |||||||||||||||||||||||||||||||||
|
Non-controlling interests |
(4) | - | - | - | - | - | - | - | - | - | (4) | |||||||||||||||||||||||||||||||||
|
Profit
|
2,738 | (29) | - | (14) | 128 | (39) | (2) | - | - | 44 | 2,782 | |||||||||||||||||||||||||||||||||
71
PROFIT RECONCILIATION
This page has been left blank intentionally
72
CONDENSED CONSOLIDATED FINANCIAL STATEMENTS – TABLE OF CONTENTS
|
CONTENTS
|
PAGE
|
|||
| Directors’ Report |
74 | |||
| Condensed Consolidated Income Statement |
75 | |||
| Condensed Consolidated Statement of Comprehensive Income |
76 | |||
| Condensed Consolidated Balance Sheet |
77 | |||
| Condensed Consolidated Cash Flow Statement |
78 | |||
| Condensed Consolidated Statement of Changes in Equity |
79 | |||
| Notes to Condensed Consolidated Financial Statements |
80 | |||
| Directors’ Declaration |
102 | |||
| Auditor’s Review Report and Independence Declaration |
103 | |||
73
DIRECTORS’ REPORT
The Directors present their report on the Condensed Consolidated Financial Statements for the half year ended 31 March 2017.
Directors
The names of the Directors of the Company who held office during and since the end of the half year are:
| Mr DM Gonski, AC
|
Chairman | |
| Mr SC Elliott
|
Director and Chief Executive Officer | |
| Ms IR Atlas
|
Director | |
| Ms PJ Dwyer
|
Director | |
| Ms SJ Halton, AO, PSM
|
Director, appointed 21 October 2016 | |
| Mr Lee Hsien Yang
|
Director | |
| Mr GR Liebelt
|
Director | |
| Mr IJ Macfarlane, AC
|
Director, retired on 16 December 2016 | |
| Mr JT Macfarlane | Director |
Result
The consolidated profit attributable to shareholders of the Company was $2,911 million. Further details are contained in Group Results on pages 17 to 41 which forms part of this report, and in the Condensed Consolidated Financial Statements.
Review of operations
A review of the operations of the Group during the half year and the results of those operations are contained in the Group Results on pages 17 to 41 which forms part of this report.
Lead auditor’s independence declaration
The lead auditor’s independence declaration given under section 307C of the Corporations Act 2001 (as amended) is set out on page 103 which forms part of this report.
Rounding of amounts
The amounts contained in these Condensed Consolidated Financial Statements have been rounded to the nearest million dollars, except where otherwise indicated, as permitted by ASIC Corporations Instrument 2016/191.
Significant events since balance date
On 21 April 2017, the Group announced it had entered into an agreement to sell its retail business in Vietnam to Shinhan Bank Vietnam. The retail business in Vietnam included approximately $320 million in lending assets and $800 million in deposits as at 31 March 2017. The premium to book value for the sale is not material to the ANZ Group. The transaction is expected to be completed by the end of 2017.
Other than the matter above, there have been no significant events from 31 March 2017 to the date of signing of this report.
Signed in accordance with a resolution of the Directors.
|
|
| |
| David M Gonski, AC | Shayne C Elliott | |
| Chairman | Director | |


1 May 2017
74
CONDENSED CONSOLIDATED INCOME STATEMENT
Australia and New Zealand Banking Group Limited
| Half Year | Movement | |||||||||||||||||||||||||
| Note | Mar 17 $M |
Sep 16 $M |
Mar 16 $M |
Mar 17 v. Sep 16 |
Mar 17 v. Mar 16 |
|||||||||||||||||||||
|
Interest income |
14,426 | 14,861 | 15,090 | -3% | -4% | |||||||||||||||||||||
|
Interest expense
|
|
(7,010)
|
|
|
(7,334)
|
|
|
(7,522)
|
|
|
-4%
|
|
|
-7%
|
| |||||||||||
| Net interest income |
2 | 7,416 | 7,527 | 7,568 | -1% | -2% | ||||||||||||||||||||
|
Other operating income1 |
2 | 1,711 | 1,598 | 1,548 | 7% | 11% | ||||||||||||||||||||
|
Net funds management and insurance income |
2 | 696 | 907 | 857 | -23% | -19% | ||||||||||||||||||||
|
Share of associates’ profit
|
|
2,17
|
|
|
173
|
|
|
240
|
|
|
301
|
|
|
-28%
|
|
|
-43%
|
| ||||||||
|
Operating income |
9,996 | 10,272 | 10,274 | -3% | -3% | |||||||||||||||||||||
|
Operating expenses1
|
|
3
|
|
|
(4,731)
|
|
|
(4,951)
|
|
|
(5,488)
|
|
|
-4%
|
|
|
-14%
|
| ||||||||
|
Profit before credit impairment and income tax |
5,265 | 5,321 | 4,786 | -1% | 10% | |||||||||||||||||||||
|
Credit impairment charge
|
|
9
|
|
|
(719)
|
|
|
(1,025)
|
|
|
(904)
|
|
|
-30%
|
|
|
-20%
|
| ||||||||
|
Profit before income tax |
4,546 | 4,296 | 3,882 | 6% | 17% | |||||||||||||||||||||
|
Income tax expense
|
|
4
|
|
|
(1,627)
|
|
|
(1,318)
|
|
|
(1,140)
|
|
|
23%
|
|
|
43%
|
| ||||||||
|
Profit for the period
|
2,919 | 2,978 | 2,742 | -2% | 6% | |||||||||||||||||||||
| Comprising: |
||||||||||||||||||||||||||
|
Profit attributable to non-controlling interests |
8 | 7 | 4 | 14% | 100% | |||||||||||||||||||||
|
Profit attributable to shareholders of the Company
|
|
2,911
|
|
|
2,971
|
|
|
2,738
|
|
|
-2%
|
|
|
6%
|
| |||||||||||
| Earnings per ordinary share (cents)
|
||||||||||||||||||||||||||
| Basic |
6 | 100.2 | 102.6 | 94.8 | -2% | 6% | ||||||||||||||||||||
|
Diluted |
6 | 96.7 | 98.3 | 89.7 | -2% | 8% | ||||||||||||||||||||
|
Dividend per ordinary share (cents) |
5 | 80 | 80 | 80 | 0% | 0% | ||||||||||||||||||||
| 1. | In the March 2017 half, a change was made to the classification of certain fees payable. These items have been reclassified from other operating income to operating expenses to more accurately reflect the nature of these items. Comparatives have been restated (Sep16 half: $8 million; Mar16 half: $9 million). |
The notes appearing on pages 80 to 101 form an integral part of the Condensed Consolidated Financial Statements.
75
CONDENSED CONSOLIDATED STATEMENT OF COMPREHENSIVE INCOME
Australia and New Zealand Banking Group Limited
| Half Year | Movement | |||||||||||||||||||||
| Mar 17 $M |
Sep 16 $M |
Mar 16 $M |
Mar 17 v. Sep 16 |
Mar 17 v. Mar 16 |
||||||||||||||||||
| Profit for the period |
2,919 | 2,978 | 2,742 | -2% | 6% | |||||||||||||||||
| Other comprehensive income |
||||||||||||||||||||||
| Items that will not be reclassified subsequently to profit or loss |
20 | (73) | 5 | large | large | |||||||||||||||||
| Items that may be reclassified subsequently to profit or loss
|
||||||||||||||||||||||
| Foreign currency translation reserve
|
||||||||||||||||||||||
| Exchange differences taken to equity1
|
(689) | 559 | (1,015) | large | -32% | |||||||||||||||||
| Exchange differences transferred to income statement
|
- | - | (126) | n/a | -100% | |||||||||||||||||
| Other reserve movements |
(263) | 117 | (56) | large | large | |||||||||||||||||
| Share of associates’ other comprehensive income2
|
2 | 10 | (6) | -80% | large | |||||||||||||||||
|
Other comprehensive income net of tax
|
(930) | 613 | (1,198) | large | -22% | |||||||||||||||||
|
Total comprehensive income for the period
|
1,989 | 3,591 | 1,544 | -45% | 29% | |||||||||||||||||
| Comprising total comprehensive income attributable to:
|
||||||||||||||||||||||
| Non-controlling interests
|
9 | 8 | (4) | 13% | large | |||||||||||||||||
| Shareholders of the Company |
1,980 | 3,583 | 1,548 | -45% | 28% | |||||||||||||||||
| 1. | Includes foreign currency translation differences attributable to non-controlling interests of $1 million gain (Sep 16 half: $1 million gain; Mar 16 half: $8 million loss). |
| 2. | Share of associates’ other comprehensive income includes an available for sale revaluation reserve loss of $4 million (Sep 16 half: $21 million gain; Mar 16 half: $11 million loss) and a foreign currency translation reserve gain of $6 million (Sep 16 half: $5 million loss; Mar 16 half: $5 million gain) that may be reclassified subsequently to profit or loss, and the remeasurement of defined benefit plans of $nil (Sep 16 half: $6 million loss; Mar 16 half: nil) that will not be reclassified subsequently to profit or loss. |
The notes appearing on pages 80 to 101 form an integral part of the Condensed Consolidated Financial Statements.
76
CONDENSED CONSOLIDATED BALANCE SHEET
Australia and New Zealand Banking Group Limited
| As at | Movement | |||||||||||||||||||||||||
| Assets | Note | Mar 17 $M |
Sep 16 $M |
Mar 16 $M |
Mar 17 v. Sep 16 |
Mar 17 v. Mar 16 |
||||||||||||||||||||
|
Cash |
56,419 | 48,675 | 49,144 | 16% | 15% | |||||||||||||||||||||
|
Settlement balances owed to ANZ |
21,696 | 21,951 | 26,048 | -1% | -17% | |||||||||||||||||||||
|
Collateral paid |
11,179 | 12,723 | 12,783 | -12% | -13% | |||||||||||||||||||||
|
Trading securities |
44,085 | 47,188 | 50,073 | -7% | -12% | |||||||||||||||||||||
|
Derivative financial instruments |
63,882 | 87,496 | 88,747 | -27% | -28% | |||||||||||||||||||||
|
Available for sale assets |
64,685 | 63,113 | 50,377 | 2% | 28% | |||||||||||||||||||||
|
Net loans and advances |
8 | 564,035 | 575,852 | 561,768 | -2% | 0% | ||||||||||||||||||||
|
Regulatory deposits |
2,154 | 2,296 | 2,135 | -6% | 1% | |||||||||||||||||||||
|
Assets held for sale |
11 | 14,145 | - | - | n/a | n/a | ||||||||||||||||||||
|
Investment in associates |
2,286 | 4,272 | 4,213 | -46% | -46% | |||||||||||||||||||||
|
Current tax assets |
242 | 126 | 289 | 92% | -16% | |||||||||||||||||||||
|
Deferred tax assets |
572 | 623 | 578 | -8% | -1% | |||||||||||||||||||||
|
Goodwill and other intangible assets |
7,053 | 7,672 | 7,585 | -8% | -7% | |||||||||||||||||||||
|
Investments backing policy liabilities |
37,602 | 35,656 | 34,541 | 5% | 9% | |||||||||||||||||||||
|
Premises and equipment |
1,979 | 2,205 | 2,188 | -10% | -10% | |||||||||||||||||||||
|
Other Assets
|
|
4,497
|
|
|
5,021
|
|
|
4,809
|
|
|
-10%
|
|
|
-6%
|
| |||||||||||
|
Total assets
|
|
896,511
|
|
|
914,869
|
|
|
895,278
|
|
|
-2%
|
|
|
0%
|
| |||||||||||
| Liabilities |
||||||||||||||||||||||||||
|
Settlement balances owed by ANZ |
9,736 | 10,625 | 13,626 | -8% | -29% | |||||||||||||||||||||
|
Collateral received |
5,189 | 6,386 | 6,615 | -19% | -22% | |||||||||||||||||||||
|
Deposits and other borrowings |
10 | 581,407 | 588,195 | 578,071 | -1% | 1% | ||||||||||||||||||||
|
Derivative financial instruments |
65,050 | 88,725 | 91,706 | -27% | -29% | |||||||||||||||||||||
|
Current tax liabilities |
185 | 188 | 129 | -2% | 43% | |||||||||||||||||||||
|
Deferred tax liabilities |
224 | 227 | 286 | -1% | -22% | |||||||||||||||||||||
|
Liabilities held for sale |
11 | 17,166 | - | - | n/a | n/a | ||||||||||||||||||||
|
Policy liabilities |
37,111 | 36,145 | 35,159 | 3% | 6% | |||||||||||||||||||||
|
External unit holder liabilities (life insurance funds) |
4,227 | 3,333 | 3,265 | 27% | 29% | |||||||||||||||||||||
|
Provisions |
1,179 | 1,209 | 1,202 | -2% | -2% | |||||||||||||||||||||
|
Payables and other liabilities |
8,054 | 8,865 | 9,251 | -9% | -13% | |||||||||||||||||||||
|
Debt issuances |
88,778 | 91,080 | 81,947 | -3% | 8% | |||||||||||||||||||||
|
Subordinated debt
|
|
12
|
|
|
20,297
|
|
|
21,964
|
|
|
17,557
|
|
|
-8%
|
|
|
16%
|
| ||||||||
|
Total liabilities
|
|
838,603
|
|
|
856,942
|
|
|
838,814
|
|
|
-2%
|
|
|
0%
|
| |||||||||||
|
Net assets
|
|
57,908
|
|
|
57,927
|
|
|
56,464
|
|
|
0%
|
|
|
3%
|
| |||||||||||
| Shareholders’ equity |
||||||||||||||||||||||||||
|
Ordinary share capital |
29,036 | 28,765 | 28,625 | 1% | 1% | |||||||||||||||||||||
|
Reserves |
115 | 1,078 | 377 | -89% | -69% | |||||||||||||||||||||
|
Retained earnings
|
|
28,640
|
|
|
27,975
|
|
|
27,361
|
|
|
2%
|
|
|
5%
|
| |||||||||||
|
Share capital and reserves attributable to shareholders of the Company |
15 | 57,791 | 57,818 | 56,363 | 0% | 3% | ||||||||||||||||||||
|
Non-controlling interests
|
|
15
|
|
|
117
|
|
|
109
|
|
|
101
|
|
|
7%
|
|
|
16%
|
| ||||||||
|
Total shareholders’ equity
|
|
15
|
|
|
57,908
|
|
|
57,927
|
|
|
56,464
|
|
|
0%
|
|
|
3%
|
| ||||||||
The notes appearing on pages 80 to 101 form an integral part of the Condensed Consolidated Financial Statements.
77
CONDENSED CONSOLIDATED CASH FLOW STATEMENT
Australia and New Zealand Banking Group Limited
| Half Year | ||||||||||||
|
Inflows
(Outflows) |
Inflows
(Outflows) |
Inflows
(Outflows) |
||||||||||
| Mar 17 $M |
Sep 16 $M |
Mar 16 $M |
||||||||||
|
Profit after income tax |
2,911 | 2,971 | 2,738 | |||||||||
|
Adjustments to reconcile to net cash provided by/(used in) operating activities |
||||||||||||
| Provision for credit impairment |
719 | 1,025 | 904 | |||||||||
|
Depreciation and amortisation |
504 | 465 | 1,010 | |||||||||
|
(Profit)/loss on sale of premises and equipment |
(114) | 6 | (10) | |||||||||
|
Net derivatives/foreign exchange adjustment |
(1,576) | (1,691) | 257 | |||||||||
|
Impairment of investment in AmBank |
- | - | 260 | |||||||||
|
Profit on Esanda Dealer Finance divestment |
- | - | (66) | |||||||||
|
Reclassification of SRCB to held for sale |
230 | - | - | |||||||||
|
Reclassification of Asia Retail & Wealth to held for sale |
324 | - | - | |||||||||
|
Other non-cash movements |
(85) | (106) | (232) | |||||||||
|
Net (increase)/decrease in operating assets: |
||||||||||||
|
Trading securities |
4,075 | 2,492 | (2,160) | |||||||||
|
Collateral paid |
1,468 | 279 | (3,462) | |||||||||
|
Net loans and advances |
(6,414) | (8,357) | (6,440) | |||||||||
|
Investments backing policy liabilities |
(1,450) | (1,678) | (384) | |||||||||
|
Other assets |
50 | 215 | (656) | |||||||||
|
Net increase/(decrease) in operating liabilities: |
||||||||||||
|
Deposits and other borrowings |
16,089 | 2,845 | 20,283 | |||||||||
|
Settlement balances owed by ANZ |
(831) | (3,106) | 2,517 | |||||||||
|
Collateral received |
(1,174) | (283) | (744) | |||||||||
|
Life insurance contract policy liabilities |
1,436 | 1,566 | 355 | |||||||||
|
Other liabilities
|
(1,002) | 2,763 | (2,735) | |||||||||
|
Total adjustments
|
12,249 | (3,565) | 8,697 | |||||||||
|
Net cash provided by/(used in) operating activities1
|
15,160 | (594) | 11,435 | |||||||||
|
Cash flows from investing activities
|
||||||||||||
| Available for sale assets |
||||||||||||
|
Purchases |
(14,495) | (22,696) | (21,486) | |||||||||
|
Proceeds from sale or maturity |
12,527 | 10,288 | 13,457 | |||||||||
|
Premises and equipment |
||||||||||||
|
Purchases |
(117) | (151) | (186) | |||||||||
|
Proceeds from sale |
271 | (20) | 37 | |||||||||
|
Esanda Dealer Finance divestment |
- | - | 6,682 | |||||||||
|
Other assets |
98 | (640) | 305 | |||||||||
|
Net cash (used in) investing activities
|
(1,716) | (13,219) | (1,191) | |||||||||
|
Cash flows from financing activities |
||||||||||||
|
Debt issuances |
||||||||||||
|
Issue proceeds |
15,371 | 18,593 | 10,611 | |||||||||
|
Redemptions |
(15,045) | (11,143) | (16,816) | |||||||||
|
Subordinated debt |
||||||||||||
|
Issue proceeds |
- | 5,234 | 943 | |||||||||
|
Redemptions |
(1,069) | (900) | - | |||||||||
|
Dividends paid
|
(2,087) | (2,079) | (2,485) | |||||||||
|
Net cash (used in) / provided by financing activities
|
(2,830) | 9,705 | (7,747) | |||||||||
|
Net increase in cash and cash equivalents |
10,614 | (4,108) | 2,497 | |||||||||
|
Cash and cash equivalents at beginning of period |
66,220 | 68,711 | 69,278 | |||||||||
|
Effects of exchange rate changes on cash and cash equivalents
|
(1,649) | 1,617 | (3,064) | |||||||||
|
Cash and cash equivalents at end of period
|
75,185 | 66,220 | 68,711 | |||||||||
|
Cash and cash equivalents is reflected in the related items in the Balance Sheet as follows: |
||||||||||||
|
Cash |
56,419 | 48,675 | 49,144 | |||||||||
|
Settlement balances owed to ANZ |
18,766 | 17,545 | 19,567 | |||||||||
| 1. | Net cash provided by/(used in) operating activities includes income taxes paid of $1,497 million (Sep 16: $1,285 million; Mar 16 $1,555 million). |
The notes appearing on pages 80 to 101 form an integral part of the Condensed Consolidated Financial Statements.
78
CONDENSED CONSOLIDATED STATEMENT OF CHANGES IN EQUITY
Australia and New Zealand Banking Group Limited
| Ordinary share capital $M |
Reserves $M |
Retained earnings $M |
Share capital and $M |
Non-controlling $M |
Total Shareholders’ $M |
|||||||||||||||||||
|
As at 1 October 2015
|
28,367 | 1,571 | 27,309 | 57,247 | 106 | 57,353 | ||||||||||||||||||
| Profit or loss |
- | - | 2,738 | 2,738 | 4 | 2,742 | ||||||||||||||||||
|
Other comprehensive income for the period |
- | (1,195) | 5 | (1,190) | (8) | (1,198) | ||||||||||||||||||
| Total comprehensive income for the period |
- | (1,195) | 2,743 | 1,548 | (4) | 1,544 | ||||||||||||||||||
|
Transactions with equity holders in their capacity as equity holders: |
||||||||||||||||||||||||
|
Dividends paid |
- | - | (2,711) | (2,711) | (1) | (2,712) | ||||||||||||||||||
|
Dividend income on treasury shares held within the Group’s life insurance statutory funds |
- | - | 12 | 12 | - | 12 | ||||||||||||||||||
|
Dividend reinvestment plan |
215 | - | - | 215 | - | 215 | ||||||||||||||||||
|
Other equity movements: |
||||||||||||||||||||||||
|
Treasury shares Wealth adjustment |
(13) | - | - | (13) | - | (13) | ||||||||||||||||||
|
Other items |
56 | 1 | 8 | 65 | - | 65 | ||||||||||||||||||
|
As at 31 March 2016
|
28,625 | 377 | 27,361 | 56,363 | 101 | 56,464 | ||||||||||||||||||
| Profit or loss |
- | - | 2,971 | 2,971 | 7 | 2,978 | ||||||||||||||||||
|
Other comprehensive income for the period |
- | 691 | (79) | 612 | 1 | 613 | ||||||||||||||||||
| Total comprehensive income for the period |
- | 691 | 2,892 | 3,583 | 8 | 3,591 | ||||||||||||||||||
|
Transactions with equity holders in their capacity as equity holders: |
||||||||||||||||||||||||
|
Dividends paid |
- | - | (2,290) | (2,290) | - | (2,290) | ||||||||||||||||||
|
Dividend income on treasury shares held within the Group’s life insurance statutory funds |
- | - | 12 | 12 | - | 12 | ||||||||||||||||||
|
Dividend reinvestment plan |
198 | - | - | 198 | - | 198 | ||||||||||||||||||
|
Other equity movements: |
||||||||||||||||||||||||
|
Treasury shares Wealth adjustment |
(140) | - | - | (140) | - | (140) | ||||||||||||||||||
|
Other items |
82 | 10 | - | 92 | - | 92 | ||||||||||||||||||
|
As at 30 September 2016
|
28,765 | 1,078 | 27,975 | 57,818 | 109 | 57,927 | ||||||||||||||||||
| Profit or loss |
- | - | 2,911 | 2,911 | 8 | 2,919 | ||||||||||||||||||
|
Other comprehensive income for the period |
- | (951) | 20 | (931) | 1 | (930) | ||||||||||||||||||
| Total comprehensive income for the period |
- | (951) | 2,931 | 1,980 | 9 | 1,989 | ||||||||||||||||||
|
Transactions with equity holders in their capacity as equity holders: |
||||||||||||||||||||||||
|
Dividends paid |
- | - | (2,300) | (2,300) | (1) | (2,301) | ||||||||||||||||||
|
Dividend income on treasury shares held within the Group’s life insurance statutory funds |
- | - | 14 | 14 | - | 14 | ||||||||||||||||||
|
Dividend reinvestment plan |
199 | - | - | 199 | - | 199 | ||||||||||||||||||
|
Other equity movements: |
||||||||||||||||||||||||
|
Treasury shares Wealth adjustment |
71 | - | - | 71 | - | 71 | ||||||||||||||||||
|
Other items |
1 | (12) | 20 | 9 | - | 9 | ||||||||||||||||||
|
As at 31 March 2017
|
29,036 | 115 | 28,640 | 57,791 | 117 | 57,908 | ||||||||||||||||||
The notes appearing on pages 80 to 101 form an integral part of the Condensed Consolidated Financial Statements.
79
NOTES TO CONDENSED CONSOLIDATED FINANCIAL STATEMENTS
| 1. | Basis of preparation |
These Condensed Consolidated Financial Statements:
| • | have been prepared in accordance with the recognition and measurement requirements of Australian Accounting Standards (“AASs”); |
| • | should be read in conjunction with ANZ’s Annual Financial Statements for the year ended 30 September 2016 and any public announcements made by the Parent Entity and its controlled entities (the Group) for the half year ended 31 March 2017 in accordance with the continuous disclosure obligations under the Corporations Act 2001 and the ASX Listing Rules; |
| • | do not include all notes of the type normally included in ANZ’s Annual Financial Statements; |
| • | are presented in Australian dollars unless otherwise stated; and |
| • | were approved by the Board of Directors on 1 May 2017. |
| i) | Statement of Compliance |
These Condensed Consolidated Financial Statements have been prepared in accordance with the Corporations Act 2001 and AASB 134 which ensures compliance with IAS 34 Interim Financial Reporting.
| ii) | Accounting policies |
Except as outlined below, these Condensed Consolidated Financial Statements have been prepared on the basis of accounting policies and using methods of computation consistent with those applied in the 2016 ANZ Annual Financial Statements.
Held for Sale
Non-current assets (or disposal groups) are classified as held for sale if their carrying amount will be recovered principally through a sale transaction rather than through continuing use and a sale is considered highly probable. They are measured at the lower of their carrying amount and fair value less costs to sell, except for assets such as deferred tax assets, financial assets and contractual rights under insurance contracts, which are specifically exempt from this requirement.
An impairment loss is recognised for any initial or subsequent write-down of the asset (or disposal group) to fair value less costs to sell. A gain is recognised for any subsequent increases in fair value less costs to sell of an asset (or disposal group), but not in excess of any cumulative impairment loss previously recognised. A gain or loss not previously recognised by the date of the sale of the non-current asset (or disposal group) is recognised at the date of derecognition.
Once classified as held for sale, intangible assets and property, plant and equipment are no longer amortised or depreciated, and any equity-accounted investee is no longer equity accounted.
| iii) | Basis of measurement |
The financial information has been prepared in accordance with the historical cost basis except that the following assets and liabilities are stated at their fair value:
| • | derivative financial instruments as well as, in the case of fair value hedging, the fair value adjustment on the underlying hedged exposure; |
| • | available for sale financial assets; |
| • | financial instruments held for trading; |
| • | assets and liabilities designated at fair value through profit and loss; and |
| • | assets and liabilities held for sale (except those at carrying value as per note (ii)). |
In accordance with AASB 1038 Life Insurance Contracts, life insurance liabilities are measured using the Margin on Services model.
In accordance with AASB 119 Employee Benefits, defined benefit obligations are measured using the Projected Unit Credit method.
| iv) | Use of estimates, assumptions and judgments |
The preparation of these Condensed Consolidated Financial Statements requires the use of management judgement, estimates and assumptions that affect reported amounts and the application of accounting policies. Discussion of the critical accounting estimates and judgements, which include complex or subjective decisions or assessments are covered in Note 2 of the 2016 Annual Financial Statements. Such estimates and judgements are reviewed on an ongoing basis.
At 31 March 2017, the impairment assessment of non-lending assets identified that two of the Group’s associate investments (AMMB Holdings Berhad (AmBank) and PT Bank Pan Indonesia (PT Panin) had indicators of impairment. Although their market value (based on share price) was below their carrying value, no impairment was recognised as the carrying value was supported by their value in use (VIU).
The VIU calculation is sensitive to a number of key assumptions, including discount rate, long term growth rates, future profitability and capital levels. The key assumptions used in the value in use calculations are outlined below:
| As at 31 Mar 17
|
||||||||
| AmBank | PT Panin | |||||||
|
Pre-tax discount rate |
9.5% | 13.4% | ||||||
|
Terminal growth rate |
5.0% | 6.0% | ||||||
|
Expected NPAT growth (compound annual growth rate – 5 years) |
5.3% | 9.6% | ||||||
|
Core equity tier 1 ratio |
10% to 12.6% | 11.3% | ||||||
80
NOTES TO CONDENSED CONSOLIDATED FINANCIAL STATEMENTS
v) Rounding of amounts
The amounts contained in these Condensed Consolidated Financial Statements have been rounded to the nearest million dollars, except where otherwise indicated, as permitted by Australian Securities and Investments Commission Corporations Instrument 2016/191.
vi) New accounting standards not yet effective
The following accounting standards relevant to the Group have been issued but are not yet effective and have not been applied in these Condensed Consolidated Financial Statements:
AASB 9 Financial Instruments (‘AASB 9’)
The Australian Accounting Standards Board (AASB) issued the final version of AASB 9 in December 2014. When operative, this standard will replace AASB 139 Financial Instruments: Recognition and Measurement. AASB 9 addresses recognition and measurement requirements for financial assets and financial liabilities, impairment requirements that introduce an expected credit loss impairment model and general hedge accounting requirements which more closely align with risk management activities undertaken when hedging financial and non-financial risks.
AASB 9 is not mandatorily effective for the Group until 1 October 2018. The Group is in the process of assessing the impact of application of AASB 9 and is not yet able to reasonably estimate the impact on its financial statements.
The Group early adopted, in isolation, the part of AASB 9 relating to gains and losses attributable to changes in own credit risk of financial liabilities designated as fair value through profit or loss effective from 1 October 2013.
AASB 15 Revenue from Contracts with Customers (‘AASB 15’)
The AASB issued the final version of AASB 15 in December 2014. The standard is not mandatorily effective for the Group until 1 October 2018. AASB 15 contains new requirements for the recognition of revenue and additional disclosures about revenue.
While it is expected that a significant proportion of the Group’s revenue will be outside the scope of AASB 15, the Group is in the process of assessing the impact of application of AASB 15 and is not yet able to reasonably estimate the impact on its financial statements.
AASB 16 Leases (‘AASB 16’)
The AASB issued the final version of AASB 16 in February 2016. The standard is not mandatorily effective for the Group until 1 October 2019. AASB 16 introduces a single lessee accounting model and requires a lessee to recognise assets and liabilities for all leases with a term of more than 12 months, unless the underlying asset is of low value. A lessee is required to recognise a right-of-use asset representing its right to use the underlying leased asset and a lease liability representing its obligation to make lease payments. AASB 16 substantially carries forward the lessor accounting requirements in AASB 117 Leases. Accordingly, a lessor continues to classify its leases as operating leases or finance leases, and to account for those two types of leases differently.
The Group is in the process of assessing the impact of AASB 16 and is not yet able to reasonably estimate the impact on its financial statements.
81
NOTES TO CONDENSED CONSOLIDATED FINANCIAL STATEMENTS
| 2. | Income |
| Half Year | Movement | |||||||||||||||||||||
| Mar 17 $M |
Sep 16 $M |
Mar 16 $M |
Mar 17 v. Sep 16 |
Mar 17 v. Mar 16 |
||||||||||||||||||
| Interest income |
14,426 | 14,861 | 15,090 | -3% | -4% | |||||||||||||||||
|
Interest expense
|
(7,010) | (7,334) | (7,522) | -4% | -7% | |||||||||||||||||
|
Net interest income |
7,416 | 7,527 | 7,568 | -1% | -2% | |||||||||||||||||
|
i) Fee and commission income |
||||||||||||||||||||||
|
Lending fees1 |
369 | 388 | 391 | -5% | -6% | |||||||||||||||||
|
Non-lending fees and commissions2
|
1,518 | 1,468 | 1,460 | 3% | 4% | |||||||||||||||||
|
Total fee and commission income |
1,887 | 1,856 | 1,851 | 2% | 2% | |||||||||||||||||
|
Fee and commission expense3
|
(661) | (588) | (574) | 12% | 15% | |||||||||||||||||
|
Net fee and commission income3 |
1,226 | 1,268 | 1,277 | -3% | -4% | |||||||||||||||||
|
ii) Net funds management and insurance income |
||||||||||||||||||||||
|
Funds management income |
472 | 486 | 446 | -3% | 6% | |||||||||||||||||
|
Investment income |
1,608 | 1,880 | 470 | -14% | large | |||||||||||||||||
|
Insurance premium income |
812 | 782 | 780 | 4% | 4% | |||||||||||||||||
|
Commission (expense) |
(260) | (265) | (192) | -2% | 35% | |||||||||||||||||
|
Claims |
(380) | (376) | (358) | 1% | 6% | |||||||||||||||||
|
Changes in policy liabilities4 |
(1,474) | (1,520) | (323) | -3% | large | |||||||||||||||||
|
Elimination of treasury share (gain)/loss
|
(82) | (80) | 34 | 3% | large | |||||||||||||||||
|
Total net funds management and insurance income
|
696 | 907 | 857 | -23% | -19% | |||||||||||||||||
|
iii) Share of associates’ profit
|
173 | 240 | 301 | -28% | -43% | |||||||||||||||||
|
iv) Other income |
||||||||||||||||||||||
|
Net foreign exchange earnings and other financial instruments income |
867 | 502 | 365 | 73% | large | |||||||||||||||||
|
Impairment of AmBank |
- | - | (260) | n/a | -100% | |||||||||||||||||
|
Gain on cessation of equity accounting of investment in Bank of Tianjin (BoT) |
- | - | 29 | n/a | -100% | |||||||||||||||||
|
Gain on the Esanda Dealer Finance divestment |
- | - | 66 | n/a | -100% | |||||||||||||||||
|
Derivative CVA methodology change |
- | (237) | - | -100% | n/a | |||||||||||||||||
|
Reclassification of Asia Retail & Wealth to held for sale |
(324) | - | - | n/a | n/a | |||||||||||||||||
|
Gain on sale of 100 Queen Street, Melbourne |
114 | - | - | n/a | n/a | |||||||||||||||||
|
Reclassification of SRCB to held for sale |
(230) | - | - | n/a | n/a | |||||||||||||||||
|
Other5
|
58 | 65 | 71 | -11% | -18% | |||||||||||||||||
|
Total other income6
|
485 | 330 | 271 | 47% | 79% | |||||||||||||||||
|
Total other operating income7
|
2,580 | 2,745 | 2,706 | -6% | -5% | |||||||||||||||||
|
Total income
|
|
17,006
|
|
|
17,606
|
|
|
17,796
|
|
|
-3%
|
|
|
-4%
|
| |||||||
| 1. | Lending fees exclude fees treated as part of the effective yield calculation in interest income. |
| 2. | In the March 2017 half, a change was made to the classification of certain fees payable. These items have been reclassified from other operating income to operating expenses to more accurately reflect the nature of these items. Comparatives have been restated accordingly (Sep 16 half: $8 million; Mar 16 half: $9 million). |
| 3. | Includes interchange fees paid. |
| 4. | Includes policyholder tax gross up, which represents contribution tax (recovered at 15% on the super contributions made by members) debited to the policyholder account once a year in July when the statement is issued to the members at the end of the 30 June financial year. |
| 5. | Other includes Brokerage income that was presented as a separate category for 2016 financial reporting. |
| 6. | Includes fair value movements (excluding realised and accrued interest) on derivatives not designated as accounting hedges entered into to manage interest rate and foreign exchange risk on funding instruments, ineffective portions of cash flow hedges, and fair value movements in financial assets and liabilities designated at fair value through profit and loss. |
| 7. | Total other operating income includes external dividend income of nil (Sep 16 half: $27.3 million; Mar 16 half: nil). |
82
NOTES TO CONDENSED CONSOLIDATED FINANCIAL STATEMENTS
| 3. | Operating expenses |
| Half Year | Movement | |||||||||||||||||||||||
|
Mar 17 |
Sep 16 $M |
Mar 16 $M |
Mar 17 v. Sep 16 |
Mar 17 v. Mar 16 |
||||||||||||||||||||
|
Personnel |
||||||||||||||||||||||||
| Salaries and related costs |
2,329 | 2,412 | 2,467 | -3% | -6% | |||||||||||||||||||
| Superannuation costs |
163 | 168 | 169 | -3% | -4% | |||||||||||||||||||
| Other
|
|
156
|
|
|
160
|
|
|
165
|
|
|
-3%
|
|
|
-5%
|
| |||||||||
|
Total personnel expenses
|
|
2,648
|
|
|
2,740
|
|
|
2,801
|
|
|
-3%
|
|
|
-5%
|
| |||||||||
| Premises |
||||||||||||||||||||||||
| Rent |
248 | 240 | 245 | 3% | 1% | |||||||||||||||||||
| Other
|
|
209
|
|
|
230
|
|
|
213
|
|
|
-9%
|
|
|
-2%
|
| |||||||||
|
Total premises expenses
|
|
457
|
|
|
470
|
|
|
458
|
|
|
-3%
|
|
|
0%
|
| |||||||||
| Technology |
||||||||||||||||||||||||
| Depreciation and amortisation1 |
376 | 328 | 870 | 15% | -57% | |||||||||||||||||||
| Licences and outsourced services2 |
303 | 330 | 284 | -8% | 7% | |||||||||||||||||||
| Other
|
|
152
|
|
|
176
|
|
|
179
|
|
|
-14%
|
|
|
-15%
|
| |||||||||
|
Total technology expenses
|
|
831
|
|
|
834
|
|
|
1,333
|
|
|
0%
|
|
|
-38%
|
| |||||||||
|
Restructuring
|
|
36
|
|
|
140
|
|
|
138
|
|
|
-74%
|
|
|
-74%
|
| |||||||||
| Other |
||||||||||||||||||||||||
| Advertising and public relations |
123 | 129 | 132 | -5% | -7% | |||||||||||||||||||
| Professional fees |
189 | 227 | 186 | -17% | 2% | |||||||||||||||||||
| Freight, stationery, postage and telephone |
132 | 142 | 135 | -7% | -2% | |||||||||||||||||||
| Other
|
|
315
|
|
|
269
|
|
|
305
|
|
|
17%
|
|
|
3%
|
| |||||||||
|
Total other expenses
|
|
759
|
|
|
767
|
|
|
758
|
|
|
-1%
|
|
|
0%
|
| |||||||||
|
Total operating expenses
|
|
4,731
|
|
|
4,951
|
|
|
5,488
|
|
|
-4%
|
|
|
-14%
|
| |||||||||
| 1. | The March 2016 half includes a $556 million charge for accelerated amortisation associated with software capitalisation policy changes. |
| 2. | In the March 2017 half, a change was made to the classification of certain fees payable. These items have been reclassified from operating income to other operating expenses to more accurately reflect the nature of these items. Comparatives have been restated accordingly (Sep 16 half: $8 million; Mar 16 half: $9 million). |
83
NOTES TO CONDENSED CONSOLIDATED FINANCIAL STATEMENTS
| 4. | Income tax expense |
Reconciliation of the prima facie income tax expense on pre-tax profit with the income tax expense charged in the Income Statement.
| Half Year | Movement | |||||||||||||||||||||||
|
Mar 17 |
Sep 16 $M |
Mar 16 $M |
Mar 17 v. Sep 16 |
Mar 17 v. Mar 16 |
||||||||||||||||||||
|
Profit before income tax |
4,546 | 4,296 | 3,882 | 6% | 17% | |||||||||||||||||||
| Prima facie income tax expense at 30% |
1,364 | 1,288 | 1,165 | 6% | 17% | |||||||||||||||||||
| Tax effect of permanent differences: |
||||||||||||||||||||||||
| Overseas tax rate differential |
(5) | (20) | (25) | -75% | -80% | |||||||||||||||||||
| Share of associates’ profit |
(52) | (72) | (90) | -28% | -42% | |||||||||||||||||||
| Wealth Australia - policyholders income and contributions tax |
113 | 129 | 23 | -12% | large | |||||||||||||||||||
| Write down of investment in AmBank |
- | - | 78 | n/a | -100% | |||||||||||||||||||
| Reclassification of SRCB to held for sale |
156 | - | - | n/a | n/a | |||||||||||||||||||
| Gain on cessation of equity accounting for BoT |
- | - | (9) | n/a | -100% | |||||||||||||||||||
| Tax provisions no longer required |
- | (43) | (28) | -100% | -100% | |||||||||||||||||||
| Interest on Convertible Instruments |
35 | 35 | 35 | 0% | 0% | |||||||||||||||||||
| Other
|
|
17
|
|
|
14
|
|
|
1
|
|
|
21%
|
|
|
large
|
| |||||||||
|
|
1,628 |
|
1,331 | 1,150 | 22% | 42% | ||||||||||||||||||
| Income tax under/(over) provided in previous years
|
|
(1)
|
|
|
(13)
|
|
|
(10)
|
|
|
-92%
|
|
|
-90%
|
| |||||||||
|
Total income tax expense charged in the income statement
|
1,627 | 1,318 | 1,140 | 23% | 43% | |||||||||||||||||||
| Australia
|
|
1,190
|
|
|
953
|
|
|
799
|
|
|
25%
|
|
|
49%
|
| |||||||||
| Overseas
|
|
437
|
|
|
365
|
|
|
341
|
|
|
20%
|
|
|
28%
|
| |||||||||
|
|
1,627
|
|
|
1,318
|
|
|
1,140
|
|
|
23%
|
|
|
43%
|
| ||||||||||
|
Effective Tax Rate - Group
|
|
35.8%
|
|
|
30.7%
|
|
|
29.4%
|
|
|||||||||||||||
84
NOTES TO CONDENSED CONSOLIDATED FINANCIAL STATEMENTS
| 5. | Dividends |
| Half Year | Movement | |||||||||||||||||||||
| Dividend per ordinary share (cents) | Mar 17 | Sep 16 | Mar 16 | Mar 17 v. Sep 16 |
Mar 17 v. Mar 16 |
|||||||||||||||||
|
Interim (fully franked) |
80 | - | 80 | n/a | 0% | |||||||||||||||||
|
Final (fully franked) |
- | 80 | - | n/a | n/a | |||||||||||||||||
|
Total
|
80 | 80 | 80 | 0% | 0% | |||||||||||||||||
| Ordinary share dividend ($M)1 |
||||||||||||||||||||||
|
Interim dividend |
- | 2,334 | - | n/a | n/a | |||||||||||||||||
|
Final dividend |
2,342 | - | 2,758 | n/a | -15% | |||||||||||||||||
|
Bonus option plan adjustment |
(42) | (44) | (47) | -5% | -11% | |||||||||||||||||
|
Total
|
2,300 | 2,290 | 2,711 | 0% | -15% | |||||||||||||||||
|
Ordinary share dividend payout ratio (%)2
|
80.7% | 78.8% | 85.2% | |||||||||||||||||||
| 1. | Dividends paid to ordinary equity holders of the Company. Excludes dividends paid by subsidiaries of the Group to non-controlling equity holders for the March 2017 half of $1.3 million (Sep 16 half: nil; Mar 16 half: $1.4 million). |
| 2. | Dividend payout ratio is calculated using the proposed 2017 interim dividend of $2,349 million (not shown in the above table). The proposed 2017 interim dividend of $2,349 million is based on the forecast number of ordinary shares on issue at the dividend record date. Dividend payout ratios for the September and March 2016 half year are calculated using actual dividends paid of $2,342 million and $2,334 million respectively. |
Ordinary Shares
The Directors propose that an interim dividend of 80 cents be paid on each eligible fully paid ANZ ordinary share on 3 July 2017. The proposed 2017 interim dividend will be fully franked for Australian tax purposes, and New Zealand imputation credits of NZ 9 cents per ordinary share will also be attached.
ANZ has a Dividend Reinvestment Plan (DRP) and a Bonus Option Plan (BOP) that will operate in respect of the proposed 2017 interim dividend. For the 2017 interim dividend, ANZ intends to neutralise shares issued under the DRP by acquiring an equivalent number of shares on market (as approved by APRA). The “Acquisition Price” to be used in determining the number of shares to be provided under the DRP and BOP will be calculated by reference to the arithmetic average of the daily volume weighted average sale price of all fully paid ANZ ordinary shares sold in the ordinary course of trading on the ASX during the ten trading days commencing on 12 May 2017, and then rounded to the nearest whole cent. Shares provided under the DRP and BOP will rank equally in all respects with existing fully paid ANZ ordinary shares. Election notices from shareholders wanting to commence, cease or vary their participation in the DRP or BOP for the 2017 interim dividend must be received by ANZ’s Share Registrar by 5.00pm (Australian Eastern Standard Time) on 10 May 2017.
Subject to receiving effective contrary instructions from the shareholder, dividends payable to shareholders with a registered address in the United Kingdom (including the Channel Islands and the Isle of Man) or New Zealand will be converted to Pounds Sterling or New Zealand Dollars respectively at an exchange rate calculated on 12 May 2017.
85
NOTES TO CONDENSED CONSOLIDATED FINANCIAL STATEMENTS
| 6. | Earnings per share |
| Half Year | Movement | |||||||||||||||||||||
| Mar 17 | Sep 16 | Mar 16 | Mar 17 v. Sep 16 |
Mar 17 v. Mar 16 |
||||||||||||||||||
| Earnings reconciliation |
||||||||||||||||||||||
|
Profit for the period ($M) |
2,919 | 2,978 | 2,742 | -2% | 6% | |||||||||||||||||
|
Less: profit attributable to non-controlling interests ($M) |
8 | 7 | 4 | 14% | 100% | |||||||||||||||||
|
Earnings used in calculating basic earnings per share ($M) |
2,911 | 2,971 | 2,738 | -2% | 6% | |||||||||||||||||
|
Weighted average number of ordinary shares (M)1 |
2,906.6 | 2,894.7 | 2,889.3 | 0% | 1% | |||||||||||||||||
|
Basic earnings per share (cents) |
100.2 | 102.6 | 94.8 | -2% | 6% | |||||||||||||||||
| Earnings reconciliation |
||||||||||||||||||||||
|
Earnings used in calculating basic earnings per share ($M) |
2,911 | 2,971 | 2,738 | -2% | 6% | |||||||||||||||||
|
Add: interest on convertible subordinated debt ($M) |
148 | 150 | 147 | -1% | 1% | |||||||||||||||||
|
Earnings used in calculating diluted earnings per share ($M) |
3,059 | 3,121 | 2,885 | -2% | 6% | |||||||||||||||||
| Weighted average number of shares on issue1 |
||||||||||||||||||||||
|
Shares used in calculating basic earnings per share (M) |
2,906.6 | 2,894.7 | 2,889.3 | 0% | 1% | |||||||||||||||||
|
Add: Weighted average dilutive potential ordinary shares (M) |
||||||||||||||||||||||
|
Convertible subordinated debt (M) |
247.1 | 274.3 | 321.2 | -10% | -23% | |||||||||||||||||
|
Share based payments (options, rights and deferred shares) (M) |
10.0 | 6.7 | 6.9 | 49% | 45% | |||||||||||||||||
|
Adjusted weighted average number of shares - diluted (M)
|
3,163.7 | 3,175.7 | 3,217.4 | 0% | -2% | |||||||||||||||||
|
Diluted earnings per share (cents)
|
96.7 | 98.3 | 89.7 | -2% | 8% | |||||||||||||||||
| 1. | Weighted average number of ordinary shares excludes the weighted average number of treasury shares held in ANZEST and Wealth Australia as summarised in the table below: |
86
NOTES TO CONDENSED CONSOLIDATED FINANCIAL STATEMENTS
| 7. | Segment analysis |
(i) Description of segments
During the March 2017 half, the Group made changes to the Group’s operating model for technology, operations and shared services to accelerate delivery of its technology and digital roadmap, bring operations closer to its customers and continue operational efficiency gains. As a result of these organisational changes, divisional operations from Technology, Services & Operations (“TSO”) and Group Centre have been realigned to divisions. The residual TSO and Group Centre now contains Technology, Group Hubs, Enterprise Services and Group Property, and Group Centre. The Group operates on a divisional structure with six divisions: Australia, New Zealand, Institutional, Asia Retail & Pacific, Wealth Australia and Technology, Services and Operations and Group Centre. For further information on the composition of divisions refer to the Definitions on page 119.
Other than the changes described above, there have been no other significant structural changes in the March 2017 half. However, certain prior period comparatives have been restated to align with current period presentation. The divisions reported below are consistent with internal reporting provided to the chief operating decision maker, being the Chief Executive Officer.
(ii) Operating segments
| Half Year
|
Movement
|
|||||||||||||||||||||
| Operating Income | Mar 17 $M |
Sep 16 $M |
Mar 16 $M |
Mar 17 v. Sep 16 |
Mar 17 v. Mar 16 |
|||||||||||||||||
| Australia |
4,735 | 4,722 | 4,686 | 0% | 1% | |||||||||||||||||
| Institutional |
2,945 | 2,464 | 2,716 | 20% | 8% | |||||||||||||||||
| New Zealand |
1,577 | 1,571 | 1,521 | 0% | 4% | |||||||||||||||||
| Wealth Australia |
544 | 610 | 645 | -11% | -16% | |||||||||||||||||
| Asia Retail & Pacific1 |
192 | 582 | 594 | -67% | -68% | |||||||||||||||||
| TSO and Group Centre2 |
310 | 320 | 163 | -3% | 90% | |||||||||||||||||
| Subtotal |
10,303 | 10,269 | 10,325 | 0% | 0% | |||||||||||||||||
| Other3 |
(307) | 3 | (51) | large | large | |||||||||||||||||
|
Group total |
9,996 | 10,272 | 10,274 | -3% | -3% | |||||||||||||||||
| Half Year
|
Movement
|
|||||||||||||||||||||
| Profit | Mar 17 $M |
Sep 16 $M |
Mar 16 $M |
Mar 17 v. Sep 16 |
Mar 17 v. Mar 16 |
|||||||||||||||||
| Australia |
1,798 | 1,778 | 1,769 | 1% | 2% | |||||||||||||||||
| Institutional |
1,021 | 408 | 633 | large | 61% | |||||||||||||||||
| New Zealand |
677 | 622 | 646 | 9% | 5% | |||||||||||||||||
| Wealth Australia |
123 | 157 | 167 | -22% | -26% | |||||||||||||||||
| Asia Retail & Pacific1 |
(217) | 99 | 60 | large | large | |||||||||||||||||
| TSO and Group Centre2 |
9 | 43 | (493) | -79% | large | |||||||||||||||||
| Subtotal |
3,411 | 3,107 | 2,782 | 10% | 23% | |||||||||||||||||
| Other3 |
(500) | (136) | (44) | large | large | |||||||||||||||||
|
Group total |
2,911 | 2,971 | 2,738 | -2% | 6% | |||||||||||||||||
| 1. | Includes $324 million of charges related to the reclassification of Asia Retail & Wealth businesses to held for sale in the March 2017 half. |
| 2. | Includes a $260 million impairment of the investment in AmBank, a $66 million gain on the Esanda Dealer Finance divestment, and the $29 million gain on cessation of equity accounting of BoT in the March 2016 half. The March 2017 half includes the $114 million gain on sale of 100 Queen Street, Melbourne. |
| 3. | In evaluating the performance of the operating divisions, certain items are removed from the operating division results where they are not considered integral to the ongoing performance of the segment and are evaluated separately. |
(iii) Other items
The table below sets out the profit after tax impact of other items.
| Half Year
|
Movement
|
|||||||||||||||||||||||||
| Item gains/(losses) | Related segment | Mar 17 $M |
Sep 16 $M |
Mar 16 $M |
Mar 17 v. Sep 16 |
Mar 17 v. Mar 16 |
||||||||||||||||||||
| Treasury shares adjustment |
Wealth | (76) | (73) | 29 | 4% | large | ||||||||||||||||||||
| Revaluation of policy liabilities |
Wealth | (36) | 40 | 14 | large | large | ||||||||||||||||||||
| Economic hedges |
Institutional, TSO and Group Centre | (178) | 26 | (128) | large | 39% | ||||||||||||||||||||
| Revenue hedges |
TSO and Group Centre | 105 | (131) | 39 | large | large | ||||||||||||||||||||
| Structured credit intermediation trades |
Institutional | 1 | 2 | 2 | -50% | -50% | ||||||||||||||||||||
| Reclassification of SRCB to held for sale |
TSO and Group Centre | (316) | - | - | n/a | n/a | ||||||||||||||||||||
|
Total profit after tax |
(500) | (136) | (44) | large | large | |||||||||||||||||||||
87
NOTES TO CONDENSED CONSOLIDATED FINANCIAL STATEMENTS
| 8. | Net loans and advances |
| As at
|
Movement
|
|||||||||||||||||||||
| Mar 17 $M |
Sep 16 $M |
Mar 16 $M |
Mar 17 v. Sep 16 |
Mar 17 v. Mar 16 |
||||||||||||||||||
| Australia |
||||||||||||||||||||||
| Overdrafts |
5,786 | 6,248 | 6,175 | -7% | -6% | |||||||||||||||||
| Credit cards outstanding |
8,846 | 8,864 | 8,872 | 0% | 0% | |||||||||||||||||
| Commercial bills outstanding |
9,232 | 9,868 | 10,439 | -6% | -12% | |||||||||||||||||
| Term loans - housing |
255,721 | 246,351 | 242,426 | 4% | 5% | |||||||||||||||||
| Term loans - non-housing |
123,464 | 123,006 | 118,456 | 0% | 4% | |||||||||||||||||
| Lease receivables |
1,084 | 1,158 | 1,255 | -6% | -14% | |||||||||||||||||
| Hire purchase contracts |
641 | 829 | 957 | -23% | -33% | |||||||||||||||||
| Other |
415 | 81 | 255 | large | 63% | |||||||||||||||||
| Total Australia |
405,189 | 396,405 | 388,835 | 2% | 4% | |||||||||||||||||
| Asia Pacific, Europe & America |
||||||||||||||||||||||
| Overdrafts |
743 | 825 | 1,175 | -10% | -37% | |||||||||||||||||
| Credit cards outstanding |
1,351 | 1,396 | 1,446 | -3% | -7% | |||||||||||||||||
| Commercial bills outstanding |
2,065 | 2,724 | 2,692 | -24% | -23% | |||||||||||||||||
| Term loans - housing |
6,501 | 6,866 | 7,226 | -5% | -10% | |||||||||||||||||
| Term loans - non-housing |
50,066 | 54,567 | 56,429 | -8% | -11% | |||||||||||||||||
| Lease receivables |
163 | 232 | 254 | -30% | -36% | |||||||||||||||||
| Other |
320 | 448 | 341 | -29% | -6% | |||||||||||||||||
|
Total Asia Pacific, Europe & America |
61,209 | 67,058 | 69,563 | -9% | -12% | |||||||||||||||||
| New Zealand |
||||||||||||||||||||||
| Overdrafts |
1,158 | 1,080 | 1,017 | 7% | 14% | |||||||||||||||||
| Credit cards outstanding |
1,503 | 1,586 | 1,517 | -5% | -1% | |||||||||||||||||
| Term loans - housing |
68,592 | 69,927 | 63,649 | -2% | 8% | |||||||||||||||||
| Term loans - non-housing |
40,247 | 41,625 | 39,003 | -3% | 3% | |||||||||||||||||
| Lease receivables |
198 | 215 | 206 | -8% | -4% | |||||||||||||||||
| Hire purchase contracts |
1,115 | 1,048 | 901 | 6% | 24% | |||||||||||||||||
|
Total New Zealand |
112,813 | 115,481 | 106,293 | -2% | 6% | |||||||||||||||||
|
Sub-total |
579,211 | 578,944 | 564,691 | 0% | 3% | |||||||||||||||||
| Unearned income |
(458 | ) | (544 | ) | (596 | ) | -16% | -23% | ||||||||||||||
| Capitalised brokerage/mortgage origination fees1 |
1,040 | 1,064 | 1,013 | -2% | 3% | |||||||||||||||||
| Customer liability for acceptances |
565 | 571 | 760 | -1% | -26% | |||||||||||||||||
|
Gross loans and advances (including assets classified as held for sale) |
580,358 | 580,035 | 565,868 | 0% | 3% | |||||||||||||||||
| Provision for credit impairment (refer to Note 9) |
(4,054 | ) | (4,183 | ) | (4,100 | ) | -3% | -1% | ||||||||||||||
|
Net loans and advances (including assets classified as held for sale) |
576,304 | 575,852 | 561,768 | 0% | 3% | |||||||||||||||||
| Net loans and advances held for sale (refer to Note 11) |
(12,269 | ) | - | - | n/a | n/a | ||||||||||||||||
|
Net loans and advances |
564,035 | 575,852 | 561,768 | -2% | 0% | |||||||||||||||||
| 1. | Capitalised brokerage/mortgage origination fees are amortised over the expected life of the loan. |
88
NOTES TO CONDENSED CONSOLIDATED FINANCIAL STATEMENTS
| 9. | Provision for credit impairment |
| Half Year
|
Movement
|
|||||||||||||||||||||
| Mar 17 $M |
Sep 16 $M |
Mar 16 $M |
Mar 17 v. Sep 16 |
Mar 17 v. Mar 16 |
||||||||||||||||||
| Individual provision |
||||||||||||||||||||||
| Balance at start of period |
1,307 | 1,238 | 1,061 | 6% | 23% | |||||||||||||||||
| New and increased provisions |
1,121 | 1,308 | 1,137 | -14% | -1% | |||||||||||||||||
| Write-backs |
(221 | ) | (151 | ) | (160 | ) | 46% | 38% | ||||||||||||||
| Adjustment for exchange rate fluctuations and transfers |
(12 | ) | 17 | (26 | ) | large | -54% | |||||||||||||||
| Discount unwind |
(24 | ) | (39 | ) | (26 | ) | -38% | -8% | ||||||||||||||
| Bad debts written-off |
(902 | ) | (1,066 | ) | (656 | ) | -15% | 38% | ||||||||||||||
| Esanda Dealer Finance divestment |
- | - | (92 | ) | n/a | -100% | ||||||||||||||||
|
Total individual provision2 |
1,269 | 1,307 | 1,238 | -3% | 3% | |||||||||||||||||
| Collective provision |
||||||||||||||||||||||
|
Balance at start of period |
2,876 | 2,862 | 2,956 | 0% | -3% | |||||||||||||||||
| Charge/(release) to income statement |
(67 | ) | (9 | ) | 26 | large | large | |||||||||||||||
| Adjustment for exchange rate fluctuations and transfers |
(24 | ) | 28 | (47 | ) | large | -49% | |||||||||||||||
| Esanda Dealer Finance divestment |
- | (5 | ) | (73 | ) | -100% | -100% | |||||||||||||||
|
Total collective provision1,2 |
2,785 | 2,876 | 2,862 | -3% | -3% | |||||||||||||||||
|
Total provision for credit impairment |
4,054 | 4,183 | 4,100 | -3% | -1% | |||||||||||||||||
| 1. | The collective provision includes amounts for off-balance sheet credit exposures of $574 million as at 31 March 2017 (Sep 2016: $631 million; Mar 2016: $663 million). The impact on the income statement for the half year ended 31 March 2017 was a $46 million release (Sep 2016 half: $35 million release; Mar 2016 half: $3 million charge). |
| 2. | Includes credit impairment provisions related to assets held for sale as at 31 March 2017 (Individual provision $6 million; Collective provision $155 million). |
| Half Year
|
Movement
|
|||||||||||||||||||||||
| Provision movement analysis | Mar 17 $M |
Sep 16 $M |
Mar 16 $M |
Mar 17 v. Sep 16 |
Mar 17 v. Mar 16 |
|||||||||||||||||||
|
New and increased individual provisions |
1,121 | 1,308 | 1,137 | -14% | -1% | |||||||||||||||||||
|
Write-backs |
(221 | ) | (151 | ) | (160 | ) | 46% | 38% | ||||||||||||||||
| 900 | 1,157 | 977 | -22% | -8% | ||||||||||||||||||||
| Recoveries of amounts previously written-off |
(114 | ) | (123 | ) | (99 | ) | -7% | 15% | ||||||||||||||||
|
Individual credit impairment charge |
786 | 1,034 | 878 | -24% | -10% | |||||||||||||||||||
| Collective credit impairment charge/(release) |
(67 | ) | (9 | ) | 26 | large | large | |||||||||||||||||
|
Credit impairment charge |
719 | 1,025 | 904 | -30% | -20% | |||||||||||||||||||
89
NOTES TO CONDENSED CONSOLIDATED FINANCIAL STATEMENTS
| 10. | Deposits and other borrowings |
| As at
|
Movement
|
|||||||||||||||||||||
| Mar 17 $M |
Sep 16 $M |
Mar 16 $M |
Mar 17 v. Sep 16 |
Mar 17 v. Mar 16 |
||||||||||||||||||
| Australia |
||||||||||||||||||||||
| Certificates of deposit |
51,875 | 52,295 | 56,513 | -1% | -8% | |||||||||||||||||
| Term deposits |
72,471 | 69,740 | 68,427 | 4% | 6% | |||||||||||||||||
| On demand and short term deposits |
179,928 | 169,773 | 169,268 | 6% | 6% | |||||||||||||||||
| Deposits not bearing interest |
9,268 | 8,729 | 8,116 | 6% | 14% | |||||||||||||||||
| Deposits from banks |
34,580 | 34,368 | 24,532 | 1% | 41% | |||||||||||||||||
| Commercial paper |
6,786 | 13,842 | 15,106 | -51% | -55% | |||||||||||||||||
| Securities sold under repurchase agreements |
3,244 | 151 | 653 | large | large | |||||||||||||||||
|
Total Australia |
358,152 | 348,898 | 342,615 | 3% | 5% | |||||||||||||||||
| Asia Pacific, Europe & America |
||||||||||||||||||||||
| Certificates of deposit |
4,629 | 7,001 | 6,888 | -34% | -33% | |||||||||||||||||
| Term deposits |
90,449 | 84,583 | 90,112 | 7% | 0% | |||||||||||||||||
| On demand and short term deposits |
23,468 | 24,968 | 25,010 | -6% | -6% | |||||||||||||||||
| Deposits not bearing interest |
4,650 | 4,745 | 4,586 | -2% | 1% | |||||||||||||||||
| Deposits from banks |
24,401 | 22,837 | 19,340 | 7% | 26% | |||||||||||||||||
| Commercial paper |
- | 393 | 1,045 | -100% | -100% | |||||||||||||||||
| Securities sold under repurchase agreements |
364 | 330 | 495 | 10% | -26% | |||||||||||||||||
|
Total Asia Pacific, Europe & America |
147,961 | 144,857 | 147,476 | 2% | 0% | |||||||||||||||||
| New Zealand |
||||||||||||||||||||||
| Certificates of deposit |
924 | 2,133 | 1,675 | -57% | -45% | |||||||||||||||||
| Term deposits |
40,236 | 37,824 | 33,871 | 6% | 19% | |||||||||||||||||
| On demand and short term deposits |
38,762 | 40,360 | 39,276 | -4% | -1% | |||||||||||||||||
| Deposits not bearing interest |
7,832 | 7,418 | 6,552 | 6% | 20% | |||||||||||||||||
| Deposits from banks |
662 | 73 | 127 | large | large | |||||||||||||||||
| Commercial paper |
2,696 | 5,114 | 4,913 | -47% | -45% | |||||||||||||||||
| Borrowing corporation debt |
1,192 | 1,518 | 1,566 | -21% | -24% | |||||||||||||||||
|
Total New Zealand |
92,304 | 94,440 | 87,980 | -2% | 5% | |||||||||||||||||
|
Total deposits and other borrowings (including liabilities classified as held for sale) |
598,417 | 588,195 | 578,071 | 2% | 4% | |||||||||||||||||
| Deposits and other borrowings held for sale (refer to Note 11) |
(17,010 | ) | - | - | n/a | n/a | ||||||||||||||||
|
Total deposits and other borrowings |
581,407 | 588,195 | 578,071 | -1% | 1% | |||||||||||||||||
90
NOTES TO CONDENSED CONSOLIDATED FINANCIAL STATEMENTS
| 11. | Disposal groups held for sale |
The Group announced the following strategic divestments in line with the Group’s strategy to simplify the businesses and improve capital efficiency. Accordingly, they are presented as disposal groups held for sale.
| • | Asia Retail & Wealth Businesses |
On 31 October 2016, the Group announced that it had agreed to sell Retail and Wealth businesses in Singapore, Hong Kong, China, Taiwan and Indonesia to Singapore’s DBS Bank. Subject to regulatory approval, the Group expects the sale to be completed in stages throughout 2017 and early 2018. This business is part of the Asia Retail and Pacific division.
| • | UDC Finance |
On 11 January 2017, the Group announced that it had agreed to sell UDC Finance to HNA Group. Completion is expected late in the second half of the 2017 calendar year. The sale is subject to closing steps and conditions including engaging with investors on the replacement of the Secured Investment program and regulatory approvals. This business is part of the New Zealand division.
| • | Shanghai Rural Commercial Bank |
On 3 January 2017, the Group announced that it had agreed to sell its 20% stake in Shanghai Rural Commercial Bank (SRCB) to China COSCO Shipping Corporation Limited and Shanghai Sino-Poland Enterprise Management Development Corporation Limited. This agreement will see COSCO and Sino-Poland Enterprise each acquire 10% of SRCB. The sale is subject to customary closing conditions and regulatory approvals and is expected to be completed by mid-2017. This business is part of the Technology, Services & Operations (TSO) and Group Centre division.
Impairment losses and other charges relating to the disposal group
During the March 2017 half, the Group recognised the following charges from the reclassification of assets and liabilities to held for sale:
| • | $324 million of charges relating to the sale of Group’s Retail and Wealth businesses in Asia comprising of $225 million of software, goodwill and other assets impairment charges and $99 million of various other charges. |
| • | $316 million of charges relating to the Group’s investment in SRCB comprising of a $219 million impairment to the investment, $11 million of foreign exchange losses, and $86 million of tax expenses. |
The net result of these disposals is included in ‘Other income’ (refer to Note 2 Income).
Assets and liabilities of disposal group held for sale
At 31 March 2017, the disposal groups held for sale comprised of the following assets and liabilities, which are measured at the lower of their carrying amount and fair value less costs to sell, except for assets such as deferred tax assets, financial assets and contractual rights under insurance contracts, which are specifically exempt from this requirement.
| Asia Retail & Wealth Businesses $M |
UDC Finance $M |
Shanghai $M |
Total $M |
|||||||||||||
| Net loans and advances |
9,776 | 2,493 | - | 12,269 | ||||||||||||
| Investment in associates |
- | - | 1,735 | 1,735 | ||||||||||||
| Goodwill and other intangible assets |
- | 118 | - | 118 | ||||||||||||
| Other assets |
- | 23 | - | 23 | ||||||||||||
|
Total assets held for sale |
9,776 | 2,634 | 1,735 | 14,145 | ||||||||||||
| Customer deposits |
15,818 | 1,192 | - | 17,010 | ||||||||||||
| Current tax liabilities |
- | 31 | - | 31 | ||||||||||||
| Payables and other liabilities |
44 | 30 | - | 74 | ||||||||||||
| Provisions |
50 | 1 | - | 51 | ||||||||||||
|
Total liabilities held for sale |
15,912 | 1,254 | - | 17,166 | ||||||||||||
91
NOTES TO CONDENSED CONSOLIDATED FINANCIAL STATEMENTS
| 12. | Subordinated debt |
| Half Year
|
Movement
|
|||||||||||||||||||||||
| |
Mar 17 $M |
|
|
Sep 16 $M |
|
|
Mar 16 $M |
|
|
Mar 17 v. Sep 16 |
|
|
Mar 17 v. Mar 16 |
| ||||||||||
| Additional Tier 1 Capital1 |
||||||||||||||||||||||||
| Convertible Preference Shares (ANZ CPS) |
||||||||||||||||||||||||
| ANZ CPS22 |
- | 1,068 | 1,969 | -100% | -100% | |||||||||||||||||||
| ANZ CPS33 |
1,340 | 1,340 | 1,338 | 0% | 0% | |||||||||||||||||||
| ANZ Capital Notes (ANZ CN) |
||||||||||||||||||||||||
| ANZ CN14 |
1,116 | 1,115 | 1,113 | 0% | 0% | |||||||||||||||||||
| ANZ CN25 |
1,603 | 1,602 | 1,600 | 0% | 0% | |||||||||||||||||||
| ANZ CN36 |
962 | 962 | 961 | 0% | 0% | |||||||||||||||||||
| ANZ CN47 |
1,607 | 1,604 | - | 0% | n/a | |||||||||||||||||||
| ANZ Capital Securities8 |
1,218 | 1,329 | - | -8% | n/a | |||||||||||||||||||
| ANZ NZ Capital Notes9 |
454 | 473 | 446 | -4% | 2% | |||||||||||||||||||
| Tier 2 Capital10 |
||||||||||||||||||||||||
| Perpetual subordinated notes |
1,156 | 1,190 | 1,145 | -3% | 1% | |||||||||||||||||||
| Term subordinated notes |
10,841 | 11,281 | 8,985 | -4% | 21% | |||||||||||||||||||
| Total subordinated debt |
20,297 | 21,964 | 17,557 | -8% | 16% | |||||||||||||||||||
| 1. | ANZ Capital Notes, ANZ Capital Securities and the ANZ NZ Capital Notes are Basel 3 compliant instruments. APRA has granted transitional capital treatment for ANZ CPS3 until 1 September 2019. |
| 2. | On 17 December 2009, ANZ issued convertible preference shares (CPS2). The CPS2, which were not reinvested into CN4, were bought back and cancelled on 15 December 2016. |
| 3. | On 28 September 2011, ANZ issued convertible preference shares (CPS3) which will convert into ANZ ordinary shares on 1 September 2019 at a 1% discount (subject to certain conditions being satisfied). If ANZ’s Common Equity Tier 1 capital ratio is equal to or less than 5.125% then the convertible preference shares will immediately convert into ANZ ordinary shares at a 1% discount subject to a maximum conversion number. Subject to certain conditions, on and from 1 September 2017 the convertible preference shares are redeemable or convertible into ANZ ordinary shares (on similar terms to the mandatory conversion) by ANZ. |
| 4. | On 7 August 2013, ANZ issued capital notes (CN1) which will convert into ANZ ordinary shares on 1 September 2023 at a 1% discount (subject to certain conditions being satisfied). If ANZ’s Common Equity Tier 1 capital ratio is equal to or less than 5.125%, or ANZ receives a notice of non-viability from APRA, then the notes will immediately convert into ANZ ordinary shares at a 1% discount subject to a maximum conversion number. Subject to certain conditions, on 1 September 2021 the notes are redeemable or convertible into ANZ ordinary shares (on similar terms to the mandatory conversion) by ANZ. |
| 5. | On 31 March 2014, ANZ issued capital notes (CN2) which will convert into ANZ ordinary shares on 24 March 2024 at a 1% discount (subject to certain conditions being satisfied). If ANZ’s Common Equity Tier 1 capital ratio is equal to or less than 5.125%, or ANZ receives a notice of non-viability from APRA, then the notes will immediately convert into ANZ ordinary shares at a 1% discount subject to a maximum conversion number. Subject to certain conditions, on 24 March 2022 the notes are redeemable or convertible into ANZ ordinary shares (on similar terms to the mandatory conversion) by ANZ. |
| 6. | On 5 March 2015, ANZ acting through its New Zealand Branch issued capital notes (CN3) which will convert into ANZ ordinary shares on 24 March 2025 at a 1% discount (subject to certain conditions being satisfied). If ANZ’s Common Equity Tier 1 capital ratio is equal to or less than 5.125%, or ANZ receives a notice of non-viability from APRA, then the notes will immediately convert into ANZ ordinary shares at a 1% discount subject to a maximum conversion number. Subject to certain conditions, on 24 March 2023 the notes are redeemable or convertible into ANZ ordinary shares (on similar terms to the mandatory conversion) by ANZ. |
| 7. | On 27 September 2016, ANZ issued capital notes (CN4) which will convert into ANZ ordinary shares on 20 March 2026 at a 1% discount (subject to certain conditions being satisfied). If ANZ’s Common Equity Tier 1 capital ratio is equal to or less than 5.125%, or ANZ receives a notice of non-viability from APRA, then the notes will immediately convert into ANZ ordinary shares at a 1% discount subject to a maximum conversion number. Subject to certain conditions, on 20 March 2024 the notes are redeemable or convertible into ANZ ordinary shares (on similar terms to the mandatory conversion) by ANZ. |
| 8. | On 15 June 2016, ANZ acting through its London branch issued fully-paid perpetual subordinated contingent convertible securities (ANZ Capital Securities). If ANZ’s Common Equity Tier 1 capital ratio is equal to or less than 5.125%, or ANZ receives a notice of non-viability from APRA, then the securities will immediately convert into ANZ ordinary shares at a 1% discount subject to a maximum conversion number. Subject to certain conditions, on the First Reset Date (15 June 2026) and each 5 year anniversary, ANZ has the right to redeem all of the securities at its discretion. |
| 9. | On 31 March 2015, ANZ Bank New Zealand Limited (ANZ Bank NZ) issued convertible notes (ANZ NZ Capital Notes) which will convert into ANZ ordinary shares on 25 May 2022 at a 1% discount (subject to certain conditions being satisfied). If ANZ or ANZ Bank NZ’s Common Equity Tier 1 capital ratio is equal to or less than 5.125%, ANZ receives a notice of non- viability from APRA, ANZ Bank NZ receives a direction from RBNZ or a statutory manager is appointed to ANZ Bank NZ and makes a determination, then the notes will immediately convert into ANZ ordinary shares at a 1% discount subject to a maximum conversion number. Subject to certain conditions, on 25 May 2020 the notes are redeemable or convertible into ANZ ordinary shares (on similar terms to the mandatory conversion) by ANZ Bank NZ. |
| 10. | The convertible dated subordinated notes are Basel 3 compliant instruments. APRA has granted transitional capital treatment for all other outstanding subordinated notes until their first call date or, in the case of the perpetual subordinated notes the earlier of the end of the transitional period (December 2021) and the first call date when a step-up event occurs. If ANZ receives a notice of non-viability from APRA, then the convertible subordinated notes will immediately convert into ANZ ordinary shares at a 1% discount subject to a maximum conversion number. |
92
NOTES TO CONDENSED CONSOLIDATED FINANCIAL STATEMENTS
| 13. | Credit risk |
Financial assets maximum exposure to credit risk
For financial assets recognised on the balance sheet, the maximum exposure to credit risk is the carrying amount. In certain circumstances, there may be differences between the carrying amounts reported on the balance sheet and the amounts reported in the tables below. Principally, these differences arise in respect of financial assets that are subject to risks other than credit risk, such as equity investments which are primarily subject to market risk. For contingent exposures, the maximum exposure to credit risk is the maximum amount the Group would have to pay if the instrument is called upon. For undrawn facilities, the maximum exposure to credit risk is the full amount of the committed facilities.
The following tables present the maximum exposure to credit risk of on-balance sheet and off-balance sheet financial assets before taking account of any collateral held or other credit enhancements.
| As at
|
Movement
|
|||||||||||||||||||||
| Maximum exposure to credit risk | Mar 17 $M |
Sep 16 $M |
Mar 16 $M |
Mar 17 v. Sep 16 |
Mar 17 v. Mar 16 |
|||||||||||||||||
| Net loans and advances1 |
576,304 | 575,852 | 561,768 | 0% | 3% | |||||||||||||||||
| Other financial assets2 |
265,526 | 284,671 | 280,101 | -7% | -5% | |||||||||||||||||
|
On-balance sheet sub total |
841,830 | 860,523 | 841,869 | -2% | 0% | |||||||||||||||||
| Undrawn facilities |
198,368 | 207,410 | 219,086 | -4% | -9% | |||||||||||||||||
| Contingent facilities |
37,686 | 37,779 | 38,750 | 0% | -3% | |||||||||||||||||
|
Off-balance sheet sub total |
236,054 | 245,189 | 257,836 | -4% | -8% | |||||||||||||||||
|
Total exposure to credit risk |
1,077,884 | 1,105,712 | 1,099,705 | -3% | -2% | |||||||||||||||||
| 1. | Net loans and advances includes individual and collective provisions for credit impairment held in respect of credit related commitments. |
| 2. | Certain other financial assets totalling $39.2 billion (Sep 16 half: $38.0 billion; Mar 16 half: $37.1 billion) have been excluded. These are comprised of bank notes and coins within cash, equity instruments within available for sale financial assets and investments relating to the insurance business where the credit risk is passed onto the policy holder. |
Distribution of financial assets by credit quality
| Net loans and advances1
|
Other financial assets
|
Credit related commitments1,2
|
||||||||||||||||||||||||||||||||||||||
|
As at
|
As at
|
As at
|
||||||||||||||||||||||||||||||||||||||
| Mar 17 $M |
Sep 16 $M |
Mar 16 $M |
Mar 17 $M |
Sep 16 $M |
Mar 16 $M |
Mar 17 $M |
Sep 16 $M |
Mar 16 $M |
||||||||||||||||||||||||||||||||
| Neither past due nor impaired |
559,905 | 561,092 | 545,953 | 265,516 | 284,657 | 280,082 | 235,395 | 244,448 | 257,099 | |||||||||||||||||||||||||||||||
| Past due but not impaired |
15,397 | 13,649 | 14,926 | - | - | - | - | - | - | |||||||||||||||||||||||||||||||
| Restructured |
367 | 403 | 226 | - | - | - | - | - | - | |||||||||||||||||||||||||||||||
| Net impaired |
1,225 | 1,368 | 1,355 | 10 | 14 | 19 | 69 | 81 | 45 | |||||||||||||||||||||||||||||||
|
Total |
576,894 | 576,512 | 562,460 | 265,526 | 284,671 | 280,101 | 235,464 | 244,529 | 257,144 | |||||||||||||||||||||||||||||||
| 1. | Individual and collective provisions for credit impairment held in respect of credit related commitments have been reallocated to credit related commitments in this table. |
| 2. | Comprises undrawn commitments and customer contingent liabilities net of collective and individual provisions. |
Credit quality of financial assets neither past due nor impaired
The credit quality of financial assets is managed by the Group using internal customer credit ratings (CCRs) based on their current probability of default. The Group’s masterscales are mapped to external rating agency scales, to enable wider comparisons.
| Net loans and advances
|
Other financial assets
|
Credit related commitments1
|
||||||||||||||||||||||||||||||||||||||||
|
As at
|
As at
|
As at
|
||||||||||||||||||||||||||||||||||||||||
| Mar 17 $M |
Sep 16 $M |
Mar 16 $M |
Mar 17 $M |
Sep 16 $M |
Mar 16 $M |
Mar 17 $M |
Sep 16 $M |
Mar 16 $M |
||||||||||||||||||||||||||||||||||
| Strong credit profile2 |
434,466 | 432,049 | 419,296 | 260,717 | 279,747 | 275,339 | 193,358 | 200,510 | 211,147 | |||||||||||||||||||||||||||||||||
| Satisfactory risk3 |
107,576 | 110,861 | 109,110 | 4,595 | 4,567 | 4,525 | 39,403 | 41,500 | 42,913 | |||||||||||||||||||||||||||||||||
| Sub-standard but not past due or impaired4 |
17,863 | 18,182 | 17,547 | 204 | 343 | 218 | 2,634 | 2,438 | 3,039 | |||||||||||||||||||||||||||||||||
|
Total |
559,905 | 561,092 | 545,953 | 265,516 | 284,657 | 280,082 | 235,395 | 244,448 | 257,099 | |||||||||||||||||||||||||||||||||
| 1. | Comprises undrawn commitments and customer contingent liabilities net of collective provisions. |
| 2. | Customers that have demonstrated superior stability in their operating and financial performance over the long-term, and whose debt servicing capacity is not significantly vulnerable to foreseeable events. This rating broadly corresponds to ratings “Aaa” to “Baa3” and “AAA” to “BBB-” of Moody’s and Standard & Poor’s respectively. |
| 3. | Customers that have consistently demonstrated sound operational and financial stability over the medium to long term, even though some may be susceptible to cyclical trends or variability in earnings. This rating broadly corresponds to ratings “Ba2” to “B1” and “BB” to “B+” of Moody’s and Standard & Poor’s respectively. |
| 4. | Customers that have demonstrated some operational and financial instability, with variability and uncertainty in profitability and liquidity projected to continue over the short and possibly medium term. This rating broadly corresponds to ratings “B2” to “Caa” and “B” to “CCC” of Moody’s and Standard & Poor’s respectively. |
93
NOTES TO CONDENSED CONSOLIDATED FINANCIAL STATEMENTS
| 13. | Credit Risk, cont’d |
Ageing analysis of financial assets that are past due but not impaired
Ageing analysis of past due loans is used by the Group to measure and manage emerging credit risks. Financial assets that are past due but not impaired include those which are assessed, approved and managed on a portfolio basis within a centralised environment (for example credit cards and personal loans) that can be held on a productive basis until they are 180 days past due, as well as those which are managed on an individual basis.
A large portion of retail credit exposures, such as residential mortgages, are generally well secured. That is, the value of supporting collateral is sufficient to cover amounts outstanding.
| As at
|
Movement
|
|||||||||||||||||||||||
| |
Mar 17 $M |
|
|
Sep 16 $M |
|
|
Mar 16 $M |
|
|
Mar 17 v. Sep 16 |
|
|
Mar 17 v. Mar 16 |
| ||||||||||
| 1-29 days |
9,123 | 7,966 | 8,868 | 15% | 3% | |||||||||||||||||||
| 30-59 days |
2,355 | 1,910 | 2,292 | 23% | 3% | |||||||||||||||||||
| 60-89 days |
1,148 | 1,070 | 1,193 | 7% | -4% | |||||||||||||||||||
| >90 days |
2,771 | 2,703 | 2,573 | 3% | 8% | |||||||||||||||||||
| Total |
15,397 | 13,649 | 14,926 | 13% | 3% | |||||||||||||||||||
Financial assets that are individually impaired
ANZ regularly reviews its portfolio and monitors adherence to contractual terms. When doubt arises as to the collectability of a credit facility, the financial instrument (or ‘the facility’) is classified and reported as individually impaired and an individual provision is allocated against it.
As described in the summary of significant accounting policies in the 2016 Annual Financial Statements, impairment provisions are created for financial instruments that are reported on the balance sheet at amortised cost. For instruments reported at fair value, impairment provisions are treated as part of overall change in fair value and directly reduce the reported carrying amounts.
| Impaired instruments
|
Individual provision balances
|
|||||||||||||||||||||||||||
| As at
|
As at
|
|||||||||||||||||||||||||||
| |
Mar 17 $M |
|
|
Sep 16 $M |
|
|
Mar 16 $M |
|
|
Mar 17 $M |
|
|
Sep 16 $M |
|
|
Mar 16 $M |
| |||||||||||
| Derivative financial instruments1 |
10 | 14 | 19 | - | - | - | ||||||||||||||||||||||
| Net loans and advances |
2,478 | 2,646 | 2,564 | 1,253 | 1,278 | 1,209 | ||||||||||||||||||||||
| Credit related commitments2 |
85 | 110 | 74 | 16 | 29 | 29 | ||||||||||||||||||||||
| Total |
2,573 | 2,770 | 2,657 | 1,269 | 1,307 | 1,238 | ||||||||||||||||||||||
| 1. | Derivative financial instruments are net of credit valuation adjustments. |
| 2. | Comprises undrawn commitments and customer contingent liabilities. |
| As at
|
Movement
|
|||||||||||||||||||||||
| |
Mar 17 $M |
|
|
Sep 16 $M |
|
|
Mar 16 $M |
|
|
Mar 17 v. Sep 16 |
|
|
Mar 17 v. Mar 16 |
| ||||||||||
| Less than $10 million |
1,724 | 1,784 | 1,597 | -3% | 8% | |||||||||||||||||||
| $10 million to $100 million |
1,106 | 899 | 970 | 23% | 14% | |||||||||||||||||||
| Greater than $100 million |
110 | 490 | 316 | -78% | -65% | |||||||||||||||||||
| Gross impaired assets1 |
2,940 | 3,173 | 2,883 | -7% | 2% | |||||||||||||||||||
| Less: Individual provision for credit impairment |
(1,269 | ) | (1,307 | ) | (1,238 | ) | -3% | 3% | ||||||||||||||||
| Net impaired assets |
1,671 | 1,866 | 1,645 | -10% | 2% | |||||||||||||||||||
| 1. | Gross impaired assets includes $367 million of restructured items (Sep 16: $403 million; Mar 16: $226 million). |
94
NOTES TO CONDENSED CONSOLIDATED FINANCIAL STATEMENTS
| 14. | Fair Value Measurement |
A significant number of financial instruments are carried on the balance sheet at fair value. The following disclosures set out the classification of financial assets and financial liabilities and assets held for sale measured at fair value less cost to sell and, in respect of the fair value either recognised or disclosed, the various levels within which fair value measurements are categorised, and the valuation methodologies and techniques used. The fair value disclosure does not cover those instruments that are not considered financial instruments from an accounting perspective, such as intangible assets.
(i) Assets and liabilities measured at fair value in the balance sheet
(a) Valuation methodologies
ANZ has an established control framework that ensures fair value is either determined or validated by a function independent of the party that undertakes the transaction. The control framework ensures that all models are calibrated periodically to test that outputs reflect prices from observable current market transactions in the same instrument or other available observable market data.
Where quoted market prices are used, prices are independently verified from other sources. For fair values determined using a valuation model, the control framework may include, as applicable, independent development or validation of valuation models, any inputs to those models, any adjustments required outside the valuation model and, where possible, independent validation of model outputs. In this way, continued appropriateness of the valuations is ensured.
In instances where the Group holds offsetting risk positions, the Group uses the portfolio exemption in AASB 13 – Fair Value Measurement to measure the fair value of such groups of financial assets and financial liabilities on the basis of the price that would be received to sell a net long position (that is, an asset) for a particular risk exposure or to transfer a net short position (that is, a liability) for a particular risk exposure.
The Group categorises its fair value measurements on the basis of inputs used in measuring fair value using the fair value hierarchy below:
| • | Level 1 – Financial instruments that have been valued by reference to unadjusted quoted prices in active markets for identical financial instruments. This category includes financial instruments valued using quoted yields where available for specific debt securities. |
| • | Level 2 – Financial instruments that have been valued through valuation techniques incorporating inputs other than quoted prices within Level 1 that are observable for a similar financial asset or liability, either directly or indirectly. |
| • | Level 3 – Financial instruments that have been valued using valuation techniques which incorporate significant inputs that are not based on observable market data (unobservable inputs). |
(b) Valuation techniques and inputs used
In the event that there is no quoted market price for the instrument, fair value is based on valuation techniques. The valuation models incorporate the impact of bid/ask spreads, counterparty credit spreads, funding costs and other factors that would influence the fair value determined by market participants.
The majority of valuation techniques employ only observable market data. However, for certain financial instruments the valuation technique may employ some data (valuation inputs or components) which is not readily observable in the current market. In these cases valuation inputs (or components of the overall value) are derived and extrapolated from other relevant market data and tested against historic transactions and observed market trends. To the extent that valuation is based on models with inputs that are not observable in the market, the determination of fair value can be more subjective, dependent on the significance of the unobservable input to the overall valuation.
The following valuation techniques have been applied to determine the fair values of financial instruments where there is no quoted price for the instrument:
| • | For instruments classified as Trading security assets and Securities short sold, Derivative financial assets and liabilities, Available for sale debt instruments, and Investments backing policy liabilities, fair value measurements are derived by using modelled valuation techniques (including discounted cash flow models) that incorporate market prices/yields for securities with similar credit risk, maturity and yield characteristics; and/or current market yields for similar instruments. |
| • | For Net loans and advances, Deposits and other borrowings and Debt issuances, discounted cash flow techniques are used where contractual future cash flows of the instrument are discounted using discount rates incorporating wholesale market rates or market borrowing rates of debt with similar maturities or a yield curve appropriate for the remaining term to maturity. |
| • | The fair value of external unit holder liabilities (life insurance funds) represents the external unit holder’s share of the net assets of the consolidated investment funds, which are carried at fair value. The fair value of policy liabilities, being liabilities of the insurance business is directly linked to the performance and value of the assets backing the liabilities. These liabilities are carried at fair value using observable inputs. |
| • | For the non-financial instrument component of assets held for sale, the fair value has been derived from the agreed foreign currency sales price combined with the applicable foreign exchange rate less the costs to sell the Assets. |
Further details of valuation techniques and significant unobservable inputs used in measuring fair values are described in (ii)(a) below.
There have been no substantial changes in the valuation techniques applied to different classes of financial instruments during the current half year period.
(c) Fair value measurements
The following table provides an analysis of financial instruments carried at fair value at reporting date and assets held for sale measured at fair value less cost to sell categorised according to the lowest level input into a valuation model or a valuation component that is significant to the reported fair value. The significance of the input is assessed against the reported fair value. The fair value has been allocated in full to the category in the fair value hierarchy which most appropriately reflects the determination of the fair value.
95
NOTES TO CONDENSED CONSOLIDATED FINANCIAL STATEMENTS
| Fair value measurements
|
||||||||||||||||
| Level 1 | Level 2 | Level 3 | Total | |||||||||||||
| As at March 2017 | $M | $M | $M | $M | ||||||||||||
| Assets |
||||||||||||||||
| Trading securities1 |
40,714 | 3,371 | - | 44,085 | ||||||||||||
| Derivative financial instruments |
378 | 63,407 | 97 | 63,882 | ||||||||||||
| Available for sale assets1 |
58,353 | 6,111 | 221 | 64,685 | ||||||||||||
| Net loans and advances (measured at fair value) |
- | 314 | 18 | 332 | ||||||||||||
| Investments backing policy liabilities1 |
26,640 | 10,603 | 359 | 37,602 | ||||||||||||
| Assets held for sale2 |
- | 1,735 | - | 1,735 | ||||||||||||
| Total |
126,085 | 85,541 | 695 | 212,321 | ||||||||||||
| Liabilities |
||||||||||||||||
| Deposits and other borrowings (designated at fair value) |
- | 2,771 | - | 2,771 | ||||||||||||
| Derivative financial instruments |
600 | 64,352 | 98 | 65,050 | ||||||||||||
| Policy liabilities3 |
- | 36,847 | - | 36,847 | ||||||||||||
| External unit holder liabilities (life insurance funds) |
- | 4,227 | - | 4,227 | ||||||||||||
| Payables and other liabilities4 |
2,001 | 126 | - | 2,127 | ||||||||||||
| Debt issuances (designated at fair value) |
- | 1,786 | - | 1,786 | ||||||||||||
| Total |
2,601 | 110,109 | 98 | 112,808 | ||||||||||||
| As at September 2016 |
||||||||||||||||
| Assets |
||||||||||||||||
| Trading securities |
44,856 | 2,332 | - | 47,188 | ||||||||||||
| Derivative financial instruments |
453 | 86,934 | 109 | 87,496 | ||||||||||||
| Available for sale assets |
55,294 | 7,580 | 239 | 63,113 | ||||||||||||
| Net loans and advances (measured at fair value) |
- | 397 | 15 | 412 | ||||||||||||
| Investments backing policy liabilities |
24,270 | 10,879 | 507 | 35,656 | ||||||||||||
| Total |
124,873 | 108,122 | 870 | 233,865 | ||||||||||||
| Liabilities |
||||||||||||||||
| Deposits and other borrowings (designated at fair value) |
- | 5,193 | - | 5,193 | ||||||||||||
| Derivative financial instruments |
408 | 88,215 | 102 | 88,725 | ||||||||||||
| Policy liabilities3 |
- | 35,955 | - | 35,955 | ||||||||||||
| External unit holder liabilities (life insurance funds) |
- | 3,333 | - | 3,333 | ||||||||||||
| Payables and other liabilities4 |
2,294 | 86 | - | 2,380 | ||||||||||||
| Debt issuances (designated at fair value) |
- | 2,192 | - | 2,192 | ||||||||||||
| Total |
2,702 | 134,974 | 102 | 137,778 | ||||||||||||
| As at March 2016 |
||||||||||||||||
| Assets |
||||||||||||||||
| Trading securities |
46,988 | 3,080 | 5 | 50,073 | ||||||||||||
| Derivative financial instruments |
519 | 88,143 | 85 | 88,747 | ||||||||||||
| Available for sale assets |
43,262 | 6,819 | 296 | 50,377 | ||||||||||||
| Net loans and advances (designated at fair value) |
- | 574 | 14 | 588 | ||||||||||||
| Investments backing policy liabilities |
17,550 | 16,473 | 518 | 34,541 | ||||||||||||
| Total |
108,319 | 115,089 | 918 | 224,326 | ||||||||||||
| Liabilities |
||||||||||||||||
| Deposits and other borrowings (designated at fair value) |
- | 4,986 | - | 4,986 | ||||||||||||
| Derivative financial instruments |
635 | 90,988 | 83 | 91,706 | ||||||||||||
| Policy liabilities3 |
- | 34,854 | - | 34,854 | ||||||||||||
| External unit holder liabilities (life insurance funds) |
- | 3,265 | - | 3,265 | ||||||||||||
| Payables and other liabilities4 |
2,761 | 201 | - | 2,962 | ||||||||||||
| Debt issuances (designated at fair value) |
- | 2,823 | - | 2,823 | ||||||||||||
| Total |
3,396 | 137,117 | 83 | 140,596 | ||||||||||||
| 1. | During the period there were transfers from Level 1 to Level 2 of $621 million (Sep 2016: $50 million; Mar 2016: $599 million) following a reassessment of available pricing information. Of the total transfers $326 million (Sep 2016: $36 million; Mar 2016: $486 million) relates to Available for sale assets, $194 million (Sep 2016: $0 million; Mar 2016: $0 million) relates to Trading Securities and $101 million (Sep 2016: $14 million; Mar 2016: $113 million) relates to Investments backing policy liabilities. During the period there were no transfers from Level 2 to Level 1 and prior period transfers from Level 2 to Level 1 were insignificant. |
| 2. | The amount classified as assets held for sale relate to non-financial instruments required to be measured at fair value less costs to sell in accordance with AASB 5 - Non-current Assets Held for Sale and Discontinued Operations. |
| 3. | Policy liabilities relate to life investment contract liabilities only as these are designated at fair value through profit or loss. |
| 4. | Represents securities short sold. |
96
NOTES TO CONDENSED CONSOLIDATED FINANCIAL STATEMENTS
(ii) Details of fair value measurements that incorporate unobservable market data
(a) Composition of Level 3 fair value measurements
There have been no significant changes in the composition of the balance of Level 3 instruments carried at fair value during the current or prior periods. Financial instruments which incorporate significant unobservable inputs primarily include Structured credit products relating to the structured credit intermediation trades where these trades are valued using complex models with certain inputs relating to the reference assets and derivative counterparties not being observable in the market, including credit spreads and default probabilities; Other derivative financial instruments including reverse mortgage swaps where the mortality rate cannot be observed; Asset backed securities and Illiquid corporate bonds where the effect on the fair value of issuer credit cannot be directly or indirectly observed in the market; and Investments in illiquid or suspended managed funds that are not currently redeemable.
(b) Movements in Level 3 fair value measurements
The movement in the Level 3 balances were not significant during the current or prior periods.
(c) Sensitivity to Level 3 data inputs
Where valuation techniques are employed and assumptions are required due to significant data inputs not being directly observable in the market place (Level 3 inputs), changing these assumptions changes the Group’s estimate of the instrument’s fair value. The majority of transactions in this category are ‘back-to-back’ in nature where the Group either acts as a financial intermediary or hedges the market risks. As a result, changes in the Level 3 inputs generally have a minimal impact on the income statement and net assets of the Group.
(d) Deferred fair value gains and losses
Where the fair value of a financial instrument at initial recognition is determined using unobservable data that is significant to the valuation of the instrument, the difference between the transaction price and the amount determined based on the valuation technique (day one gain or loss) is not immediately recognised in the income statement. Subsequently, the day one gain or loss is recognised in the income statement over the life of the transaction on a straight line basis or over the period until all inputs become observable. The Day 1 gains and losses deferred are not significant and predominately relate to derivative financial instruments. This is consistent with the low level of derivative transactions entered into by the Group which incorporate significant unobservable inputs.
(iii) Financial assets and financial liabilities not measured at fair value
The table below reflects the carrying amounts and the Group’s estimate of fair value of financial instruments not measured at fair value on the Group’s balance sheet where the carrying amount is not considered a close approximation of fair value.
97
NOTES TO CONDENSED CONSOLIDATED FINANCIAL STATEMENTS
| Carrying amount in the balance sheet
|
Fair Value
|
|||||||||||||||
| |
At amortised cost |
|
|
At fair value |
|
Total | ||||||||||
| As at March 2017 |
$M | $M | $M | $M | ||||||||||||
| Financial assets |
||||||||||||||||
| Net loans and advances1, 2 |
575,972 | 332 | 576,304 | 576,650 | ||||||||||||
| Financial liabilities |
||||||||||||||||
| Deposits and other borrowings2 |
595,646 | 2,771 | 598,417 | 598,654 | ||||||||||||
| Debt issuances1 |
86,992 | 1,786 | 88,778 | 89,566 | ||||||||||||
| Subordinated debt1 |
20,297 | - | 20,297 | 20,612 | ||||||||||||
| 702,935 | 4,557 | 707,492 | 708,832 | |||||||||||||
| As at September 2016 |
||||||||||||||||
| Financial assets |
||||||||||||||||
| Net loans and advances1 |
575,440 | 412 | 575,852 | 576,636 | ||||||||||||
| Financial liabilities |
||||||||||||||||
| Deposits and other borrowings |
583,002 | 5,193 | 588,195 | 588,613 | ||||||||||||
| Debt issuances1 |
88,888 | 2,192 | 91,080 | 91,600 | ||||||||||||
| Subordinated debt1 |
21,964 | - | 21,964 | 22,110 | ||||||||||||
| 693,854 | 7,385 | 701,239 | 702,323 | |||||||||||||
| As at March 2016 |
||||||||||||||||
| Financial assets |
||||||||||||||||
| Net loans and advances1 |
561,180 | 588 | 561,768 | 562,545 | ||||||||||||
| Financial liabilities |
||||||||||||||||
| Deposits and other borrowings |
573,085 | 4,986 | 578,071 | 578,432 | ||||||||||||
| Debt issuances1 |
79,124 | 2,823 | 81,947 | 81,842 | ||||||||||||
| Subordinated debt1 |
17,557 | - | 17,557 | 17,545 | ||||||||||||
| 669,766 | 7,809 | 677,575 | 677,819 | |||||||||||||
| 1. | Fair value hedging is applied to certain financial instruments within the amortised cost categories. The resulting fair value adjustments mean that the carrying value differs from the original amortised cost. |
| 2. | Net loans and advances and deposits and other borrowings include amounts reclassified to assets and liabilities held for sale (refer to Note 11). |
98
NOTES TO CONDENSED CONSOLIDATED FINANCIAL STATEMENTS
| 15. | Shareholders’ equity |
| Issued and quoted securities | Half Year
|
|||||||||||
| Ordinary share capital | Mar 17 No. |
Sep 16 No. |
Mar 16 No. |
|||||||||
| Closing balance |
2,936,037,009 | 2,927,476,660 | 2,917,560,098 | |||||||||
| Issued during the period1 |
8,560,349 | 9,916,562 | 14,845,737 | |||||||||
| 1. | The Company issued 8.6 million shares under the Dividend Reinvestment Plan and Bonus Option Plan for the 2016 final dividend (9.7 million shares for the 2016 interim dividend; 9.7 million shares for the 2015 final dividend) and nil shares to satisfy obligations under the Group’s Employee share acquisition plans during the March 2017 half (Sep 16 half: 0.2 million shares; March 16 half: 5.1 million shares). |
| Half Year
|
Movement
|
|||||||||||||||||||||
| Shareholders’ equity | Mar 17 $M |
Sep 16 $M |
Mar 16 $M |
Mar 17 v. Sep 16 |
Mar 17 v. Mar 16 |
|||||||||||||||||
| Ordinary share capital |
29,036 | 28,765 | 28,625 | 1% | 1% | |||||||||||||||||
| Reserves |
||||||||||||||||||||||
| Foreign currency translation reserve |
(140 | ) | 544 | (9 | ) | large | large | |||||||||||||||
| Share option reserve |
67 | 79 | 69 | -15% | -3% | |||||||||||||||||
| Available for sale revaluation reserve |
31 | 149 | 101 | -79% | -69% | |||||||||||||||||
| Cash flow hedge reserve |
180 | 329 | 239 | -45% | -25% | |||||||||||||||||
| Transactions with non-controlling interests reserve |
(23 | ) | (23 | ) | (23 | ) | 0% | 0% | ||||||||||||||
| Total reserves |
115 | 1,078 | 377 | -89% | -69% | |||||||||||||||||
| Retained earnings |
28,640 | 27,975 | 27,361 | 2% | 5% | |||||||||||||||||
| Share capital and reserves attributable to shareholders of the Company |
57,791 | 57,818 | 56,363 | 0% | 3% | |||||||||||||||||
| Non-controlling interests |
117 | 109 | 101 | 7% | 16% | |||||||||||||||||
|
Total shareholders’ equity |
57,908 | 57,927 | 56,464 | 0% | 3% | |||||||||||||||||
99
NOTES TO CONDENSED CONSOLIDATED FINANCIAL STATEMENTS
| 16. | Changes in composition of the Group |
There were no acquisitions or disposals of material controlled entities for the half year ended 31 March 2017.
| 17. | Investments in Associates |
| Half Year
|
Movement
|
|||||||||||||||||||||||
|
Mar 17 |
Sep 16 |
Mar 16 |
Mar 17 |
Mar 17 |
||||||||||||||||||||
| Share of associates’ profit |
173 | 240 | 301 | -28% | -43% | |||||||||||||||||||
| Contributions to profit1 | Contribution to
|
Ownership interest
|
||||||||||||||||||||||||||
| Associates |
Half Year
|
As at
|
||||||||||||||||||||||||||
|
Mar 17 |
Sep 16 |
Mar 16 |
Mar 17 |
Sep 16 |
Mar 16 |
|||||||||||||||||||||||
| P.T. Bank Pan Indonesia |
50 | 47 | 17 | 39 | 39 | 39 | ||||||||||||||||||||||
| AMMB Holdings Berhad |
48 | 51 | 43 | 24 | 24 | 24 | ||||||||||||||||||||||
| Shanghai Rural Commercial Bank2 |
58 | 122 | 137 | 20 | 20 | 20 | ||||||||||||||||||||||
| Bank of Tianjin (up to 30 March 2016)3 |
- | - | 86 | 12 | 12 | 12 | ||||||||||||||||||||||
| Other associates |
17 | 20 | 18 | n/a | n/a | n/a | ||||||||||||||||||||||
| Share of associates’ profit |
173 | 240 | 301 | |||||||||||||||||||||||||
| 1. | Contributions to profit reflect the IFRS equivalent results adjusted to align with the Group’s financial year end which may differ from the published results of these entities. Excludes gains or losses on disposal or valuation adjustments. |
| 2. | On 3 January 2017, the Group announced that it had agreed to sell its 20% stake in Shanghai Rural Commercial Bank (SRCB) to China COSCO Shipping Corporation Limited and Shanghai Sino-Poland Enterprise Management Development Corporation Limited. The agreement states COSCO and Sino-Poland Enterprise will each acquire 10% of SRCB. The sale is subject to customary closing conditions and regulatory approvals and is expected to be completed in the September 2017 half. As a consequence, the Group ceased equity accounting for the investment in SRCB and commenced accounting for it as an asset held for sale. |
| 3. | On 30 March 2016, the Bank of Tianjin (BoT) completed a capital raising and initial public offering (IPO) on the Hong Kong Stock Exchange. As a result, the Group’s equity interest reduced from 14% to 12% and the Group ceased equity accounting the investment due to losing the ability to appoint directors to the Board of BoT at this date. From 31 March 2016, the investment is classified as an available for sale asset. |
| 18. | Related party disclosure |
There have been no transactions with related parties that are significant to understanding the changes in financial position and performance of the Group since 30 September 2016.
| 19. | Contingent liabilities and contingent assets |
There are outstanding court proceedings, claims and possible claims for and against the Group. Where relevant, expert legal advice has been obtained and, in the light of such advice, provisions and/or disclosures as deemed appropriate have been made. In some instances we have not disclosed the estimated financial impact of the individual items either because it is not practicable to do so or because such disclosure may prejudice the interests of the Group.
Refer to Note 41 of the 2016 ANZ Annual Financial Statements for a description of contingent liabilities and contingent assets as at 30 September 2016. A summary of some of those contingent liabilities, and new contingent liabilities that have arisen in the current reporting period, is set out below.
| • | Bank fees litigation |
A litigation funder commenced a class action against ANZ in 2010, followed by a second similar class action in March 2013. The applicants contended that certain exception fees (honour, dishonour and non-payment fees on transaction accounts and late payment and over-limit fees on credit cards) were unenforceable penalties and that various of the fees were also unenforceable under statutory provisions governing unconscionable conduct, unfair contract terms and unjust transactions. A further action, limited to late payment fees only, commenced in August 2014.
The penalty and statutory claims in the March 2013 class action failed and the claims have been dismissed. The August 2014 action was discontinued in October 2016.
The original claims in the 2010 class action have been dismissed. A new claim has been added to the 2010 class action, in relation to ANZ’s entitlement to charge certain periodical payment fees. This new claim is at an early stage.
| • | Benchmark/rate actions |
In March 2016, ASIC commenced court proceedings against ANZ in respect of interbank trading and the bank bill swap rate (BBSW). ASIC is seeking declarations and civil penalties for alleged contraventions including alleged market manipulation, unconscionable conduct, misleading or deceptive conduct, and alleged breaches by ANZ of certain statutory obligations as a financial services licensee. ASIC has subsequently initiated similar proceedings against two other Australian banks. ASIC’s case against ANZ concerns transactions in the Australian interbank BBSW market in the period from March 2010 to May 2012. ANZ is defending the proceedings. The potential civil penalty or other financial impact is uncertain.
In July and August 2016, class action complaints were brought in the United States District Court against local and international banks, including ANZ – one action relating to BBSW, and one action relating to the Singapore Interbank Offered Rate (SIBOR) and the Singapore Swap Offer Rate (SOR). The class actions are expressed to apply to persons and entities that engaged in US-based transactions in financial instruments that were priced,
100
NOTES TO CONDENSED CONSOLIDATED FINANCIAL STATEMENTS
benchmarked, and/or settled based on BBSW, SIBOR, or SOR. The claimants seek damages or compensation in amounts not specified, and allege that the defendant banks, including ANZ, violated US anti-trust laws, anti-racketeering laws, the Commodity Exchange Act, and unjust enrichment principles. ANZ is defending the proceedings. The matters are at an early stage.
In February 2017, the South African Competition Commission commenced proceedings against local and international banks including ANZ alleging breaches of the cartel provisions of the South African Competition Act in respect of trading in the South African rand. The potential civil penalty or other financial impact is uncertain. The matter is at an early stage.
| • | Regulatory reviews and customer exposures |
In recent years there have been significant increases in the nature and scale of regulatory investigations and reviews, enforcement actions (whether by court action or otherwise) and the quantum of fines issued by regulators, particularly against financial institutions both in Australia and globally. The nature of these investigations and reviews can be wide ranging and, for example, currently include a range of matters including responsible lending practices, product suitability, wealth advice, conduct in financial markets and capital market transactions. During the year, ANZ has received various notices and requests for information from its regulators as part of both industry-wide and ANZ-specific reviews. There may be exposures to customers which are additional to any regulatory exposures. These could include class actions, individual claims or customer remediation or compensation activities. The outcomes and total costs associated with such reviews and possible exposures remain uncertain.
| • | Security recovery actions |
Various claims have been made or are anticipated, arising from security recovery actions taken to resolve impaired assets over recent years. ANZ will defend these claims.
| 20. | Subsequent events since balance date |
On 21 April 2017, the Group announced it had entered into an agreement to sell its retail business in Vietnam to Shinhan Bank Vietnam. The retail business in Vietnam included approximately $320 million in lending assets and $800 million in deposits as at 31 March 2017. The premium to book value for the sale is not material to the ANZ Group. The transaction is expected to be completed by the end of 2017.
Other than the matter above, there have been no significant events from 31 March 2017 to the date of signing of this report.
101
DIRECTORS’ DECLARATION
Directors’ Declaration
The Directors of Australia and New Zealand Banking Group Limited declare that:
| 1. | in the Directors’ opinion the Condensed Consolidated Financial Statements and Notes to the Condensed Consolidated Financial Statements are in accordance with the Corporations Act 2001, including: |
| • | section 304, that they comply with the Australian Accounting Standards and any further requirements in the Corporations Regulations 2001; and |
| • | section 305, that they give a true and fair view of the financial position of the Group as at 31 March 2017 and of its performance for the half year ended on that date; and |
| 2. | in the Directors’ opinion as at the date of this declaration there are reasonable grounds to believe that the Company will be able to pay its debts as and when they become due and payable. |
Signed in accordance with a resolution of the Directors.

|

| |
|
David M Gonski, AC |
Shayne C Elliott | |
| Chairman | Director |
1 May 2017
102
AUDITOR’S REVIEW REPORT AND INDEPENDENCE DECLARATION
Independent Auditor’s Review Report to the shareholders of Australia and New Zealand Banking Group Limited

Report on the half year Condensed Consolidated Financial Statements
Conclusion
We have reviewed the accompanying half year Condensed Consolidated Financial Statements of Australia and New Zealand Banking Group Limited (the Group).
Based on our review, which is not an audit, we have not become aware of any matter that makes us believe that the half year Condensed Consolidated Financial Statements of Australia and New Zealand Banking Group Limited are not in accordance with the Corporations Act 2001, including:
| i) | giving a true and fair view of the Group’s financial position as at 31 March 2017 and of its performance for the half year ended on that date; and |
| ii) | complying with Australian Accounting Standard AASB 134 Interim Financial Reporting and the Corporations Regulations 2001. |
The half year Condensed Consolidated Financial Statements comprise:
| • | the condensed consolidated balance sheet as at 31 March 2017; |
| • | the condensed consolidated income statement, condensed consolidated statement of comprehensive income, condensed consolidated statement of changes in equity, and condensed consolidated statement of cash flows for the half-year ended on 31 March 2017; |
| • | Notes 1 to 20 comprising a basis of preparation and other explanatory information; and |
| • | the Directors’ Declaration. |
The Group comprises Australia and New Zealand Banking Group Limited (the Company) and the entities it controlled at the half year’s end or from time to time during the half year.
Responsibilities of the Directors for the half year Condensed Consolidated Financial Statements
The Directors of the Company are responsible for:
| • | the preparation of the half year Condensed Consolidated Financial Statements that give a true and fair view in accordance with Australian Accounting Standards and the Corporations Act 2001; and |
| • | such internal control as the Directors determine is necessary to enable the preparation of the half year Condensed Consolidated Financial Statements that is free from material misstatement, whether due to fraud or error. |
Auditor’s responsibility for the review of the Condensed Consolidated Financial Statements
Our responsibility is to express a conclusion on the half year Condensed Consolidated Financial Statements based on our review. We conducted our review in accordance with Auditing Standard on Review Engagements ASRE 2410 Review of a Financial Report Performed by the Independent Auditor of the Entity, in order to state whether, on the basis of the procedures described, we have become aware of any matter that makes us believe that the half year Condensed Consolidated Financial Statements are not in accordance with the Corporations Act 2001 including: giving a true and fair view of the Group’s financial position as at 31 March 2017 and its performance for the half year ended on that date, and complying with Australian Accounting Standard AASB 134 Interim Financial Reporting and the Corporations Regulations 2001. As auditor of Australia and New Zealand Banking Group Limited, ASRE 2410 requires that we comply with the ethical requirements relevant to the audit of the annual financial report.
A review of half year Condensed Consolidated Financial Statements consists of making enquiries, primarily of persons responsible for financial and accounting matters, and applying analytical and other review procedures. A review is substantially less in scope than an audit conducted in accordance with Australian Auditing Standards and consequently does not enable us to obtain assurance that we would become aware of all significant matters that might be identified in an audit. Accordingly, we do not express an audit opinion.
In conducting our review, we have complied with the independence requirements of the Corporations Act 2001.
|
|
| |
|
KPMG |
Alison Kitchen | |
| Melbourne |
Partner | |
| 1 May 2017 |


Lead Auditor’s Independence Declaration under section 307C of the Corporations Act 2001
To the Directors of Australia and New Zealand Banking Group Limited
I declare that, to the best of my knowledge and belief, in relation to the review of Australia and New Zealand Banking Group Limited for the half-year ended 31 March 2017, there have been:
| (i) | no contraventions of the auditor independence requirements as set out in the Corporations Act 2001 in relation to the review; and |
| (ii) | no contraventions of any applicable code of professional conduct in relation to the review. |
|
|
| |
|
KPMG |
Alison Kitchen | |
| Melbourne |
Partner | |
| 1 May 2017 |


KPMG, an Australian partnership and a member firm of the KPMG network of independent member firms affiliated with KPMG International Cooperative (“KPMG International”), a Swiss entity. Liability limited by a scheme approved under Professional Standards Legislation.
103
AUDITOR’S REVIEW REPORT AND INDEPENDENCE DECLARATION
This page has been left blank intentionally
104
SUPPLEMENTARY INFORMATION
CONTENTS
Supplementary Information
| Capital management |
||||
| Average balance sheet and related interest |
||||
| Funds management and insurance income analysis (Group) |
||||
| Select geographical disclosures |
||||
| Exchange rates |
||||
| Derivative financial instruments |
||||
105
SUPPLEMENTARY INFORMATION
Capital management
ANZ provides information as required under APRA’s prudential standard APS 330: Public Disclosure. This information is located in the Regulatory Disclosures section of ANZ’s website: shareholder.anz.com/pages/regulatory-disclosure.
This information includes disclosures detailed in the following sections of the standard, Attachment A: Capital disclosure template, Attachment B: Main features of Capital instruments, Attachment E: Leverage ratio disclosure requirements and Attachment F: Liquidity Coverage Ratio disclosure template.
| As at
|
Movement
|
|||||||||||||||||||||||
|
Mar 17 |
Sep 16 |
Mar 16 |
Mar 17 |
Mar 17 |
||||||||||||||||||||
| Qualifying Capital
|
$M | $M | $M | v. Sep 16 | v. Mar 16 | |||||||||||||||||||
| Tier 1 |
||||||||||||||||||||||||
| Shareholders’ equity and non-controlling interests |
57,908 | 57,927 | 56,464 | 0% | 3% | |||||||||||||||||||
| Prudential adjustments to shareholders’ equity |
Table 1 | (509) | (481) | (584) | 6% | -13% | ||||||||||||||||||
| Gross Common Equity Tier 1 capital |
57,399 | 57,446 | 55,880 | 0% | 3% | |||||||||||||||||||
| Deductions |
Table 2 | (17,182) | (18,179) | (17,778) | -5% | -3% | ||||||||||||||||||
| Common Equity Tier 1 capital |
40,217 | 39,267 | 38,102 | 2% | 6% | |||||||||||||||||||
| Additional Tier 1 capital |
Table 3 | 7,874 | 9,018 | 6,960 | -13% | 13% | ||||||||||||||||||
| Tier 1 capital |
48,091 | 48,285 | 45,062 | 0% | 7% | |||||||||||||||||||
| Tier 2 capital |
Table 4 | 9,648 | 10,328 | 8,076 | -7% | 19% | ||||||||||||||||||
| Total qualifying capital |
57,739 | 58,613 | 53,138 | -1% | 9% | |||||||||||||||||||
| Capital adequacy ratios
|
||||||||||||||||||||||||
| Common Equity Tier 1 |
10.1% | 9.6% | 9.8% | |||||||||||||||||||||
| Tier 1 |
12.1% | 11.8% | 11.6% | |||||||||||||||||||||
| Tier 2 |
2.4% | 2.5% | 2.1% | |||||||||||||||||||||
| Total |
14.5% | 14.3% | 13.7% | |||||||||||||||||||||
| Risk weighted assets |
Table 5 | 397,040 | 408,582 | 388,335 | -3% | 2% | ||||||||||||||||||
106
SUPPLEMENTARY INFORMATION
Capital management, cont’d
| As at | Movement | |||||||||||||||||||||||
|
Mar 17 $M |
Sep 16 |
Mar 16 $M |
Mar 17 |
Mar 17 |
||||||||||||||||||||
| Table 1: Prudential adjustments to shareholders’ equity |
||||||||||||||||||||||||
| Treasury shares attributable to ANZ Wealth Australia policyholders |
324 | 395 | 254 | -18% | 28% | |||||||||||||||||||
| Accumulated retained profits and reserves of insurance and funds management entities |
(811) | (875) | (931) | -7% | -13% | |||||||||||||||||||
| Deferred fee revenue including fees deferred as part of loan yields |
175 | 238 | 290 | -26% | -40% | |||||||||||||||||||
| Available for sale reserve attributable to deconsolidated subsidiaries |
(82) | (110) | (98) | -25% | -16% | |||||||||||||||||||
| Other
|
|
(115)
|
|
|
(129)
|
|
|
(99)
|
|
|
-11%
|
|
|
16%
|
| |||||||||
|
Total
|
|
(509)
|
|
|
(481)
|
|
|
(584)
|
|
|
6%
|
|
|
-13%
|
| |||||||||
| Table 2: Deductions from Common Equity Tier 1 capital |
||||||||||||||||||||||||
| Unamortised goodwill & other intangibles (excluding ANZ Wealth Australia and New Zealand) |
(3,532) | (3,913) | (3,767) | -10% | -6% | |||||||||||||||||||
| Intangible component of investments in ANZ Wealth Australia and New Zealand |
(2,099) | (2,103) | (2,091) | 0% | 0% | |||||||||||||||||||
| Capitalised software |
(1,887) | (2,139) | (2,190) | -12% | -14% | |||||||||||||||||||
| Capitalised expenses including loan and lease origination fees |
(1,129) | (1,148) | (1,078) | -2% | 5% | |||||||||||||||||||
| Applicable deferred net tax assets |
(902) | (899) | (793) | 0% | 14% | |||||||||||||||||||
| Expected losses in excess of eligible provisions |
Table 8 | (696) | (700) | (600) | -1% | 16% | ||||||||||||||||||
| Investment in other insurance and funds management subsidiaries |
(274) | (297) | (297) | -8% | -8% | |||||||||||||||||||
| Investment in ANZ Wealth Australia and New Zealand |
(1,749) | (1,752) | (1,749) | 0% | 0% | |||||||||||||||||||
| Investment in banking associates and minority interests |
(3,826) | (4,674) | (4,708) | -18% | -19% | |||||||||||||||||||
| Other deductions
|
|
(1,088)
|
|
|
(554)
|
|
|
(505)
|
|
|
96%
|
|
|
large
|
| |||||||||
|
Total
|
|
(17,182)
|
|
|
(18,179)
|
|
|
(17,778)
|
|
|
-5%
|
|
|
-3%
|
| |||||||||
| Table 3: Additional Tier 1 capital |
||||||||||||||||||||||||
| Convertible Preference Shares |
||||||||||||||||||||||||
| ANZ CPS2 |
- | 1,068 | 1,969 | -100% | -100% | |||||||||||||||||||
| ANZ CPS3 |
1,340 | 1,340 | 1,338 | 0% | 0% | |||||||||||||||||||
| ANZ Capital Notes 1 |
1,116 | 1,115 | 1,113 | 0% | 0% | |||||||||||||||||||
| ANZ Capital Notes 2 |
1,603 | 1,602 | 1,600 | 0% | 0% | |||||||||||||||||||
| ANZ Capital Notes 3 |
962 | 962 | 961 | 0% | 0% | |||||||||||||||||||
| ANZ Capital Notes 4 |
1,607 | 1,604 | - | 0% | n/a | |||||||||||||||||||
| ANZ Bank NZ Capital Notes |
454 | 473 | 446 | -4% | 2% | |||||||||||||||||||
| ANZ Capital Securities |
1,218 | 1,329 | - | -8% | n/a | |||||||||||||||||||
| Regulatory adjustments and deductions
|
|
(426)
|
|
|
(475)
|
|
|
(467)
|
|
|
-10%
|
|
|
-9%
|
| |||||||||
|
Total
|
|
7,874
|
|
|
9,018
|
|
|
6,960
|
|
|
-13%
|
|
|
13%
|
| |||||||||
| Table 4: Tier 2 capital |
||||||||||||||||||||||||
| General reserve for impairment of financial assets |
257 | 267 | 255 | -4% | 1% | |||||||||||||||||||
| Perpetual subordinated notes |
1,156 | 1,190 | 1,145 | -3% | 1% | |||||||||||||||||||
| Term subordinated debt notes |
10,841 | 11,281 | 8,985 | -4% | 21% | |||||||||||||||||||
| Regulatory adjustments and deductions |
(518) | (936) | (660) | -45% | -22% | |||||||||||||||||||
| Transitional adjustments
|
|
(2,088)
|
|
|
(1,474)
|
|
|
(1,649)
|
|
|
42%
|
|
|
27%
|
| |||||||||
|
Total
|
|
9,648
|
|
|
10,328
|
|
|
8,076
|
|
|
-7%
|
|
|
19%
|
| |||||||||
107
SUPPLEMENTARY INFORMATION
Capital management, cont’d
| As at | Movement | |||||||||||||||||||||
|
Mar 17 |
Sep 16 |
Mar 16 |
Mar 17 |
Mar 17 |
||||||||||||||||||
| $M | $M | $M | v. Sep 16 | v. Mar 16 | ||||||||||||||||||
| Table 5: Risk weighted assets |
||||||||||||||||||||||
| On balance sheet |
253,532 | 259,356 | 235,875 | -2% | 7% | |||||||||||||||||
| Commitments |
56,279 | 58,167 | 62,223 | -3% | -10% | |||||||||||||||||
| Contingents |
12,648 | 13,295 | 14,489 | -5% | -13% | |||||||||||||||||
| Derivatives
|
|
19,350
|
|
|
21,215
|
|
|
21,721
|
|
|
-9%
|
|
|
-11%
|
| |||||||
| Total credit risk |
Table 6 | 341,809 | 352,033 | 334,308 | -3% | 2% | ||||||||||||||||
| Market risk - Traded |
6,323 | 6,188 | 6,059 | 2% | 4% | |||||||||||||||||
| Market risk - IRRBB |
10,332 | 11,700 | 10,280 | -12% | 1% | |||||||||||||||||
| Operational risk
|
|
38,576
|
|
|
38,661
|
|
|
37,688
|
|
|
0%
|
|
|
2%
|
| |||||||
|
Total risk weighted assets
|
|
397,040 |
|
|
408,582 |
|
|
388,335 |
|
|
-3% |
|
|
2% |
| |||||||
| As at | Movement | |||||||||||||||||||||
|
Mar 17 |
Sep 16 |
Mar 16 |
Mar 17 |
Mar 17 |
||||||||||||||||||
| $M | $M | $M | v. Sep 16 | v. Mar 16 | ||||||||||||||||||
| Table 6: Credit risk weighted assets by Basel asset class |
||||||||||||||||||||||
| Subject to Advanced IRB approach |
||||||||||||||||||||||
| Corporate |
127,544 | 130,799 | 139,643 | -2% | -9% | |||||||||||||||||
| Sovereign |
6,718 | 6,634 | 6,185 | 1% | 9% | |||||||||||||||||
| Bank |
14,267 | 14,884 | 15,061 | -4% | -5% | |||||||||||||||||
| Residential mortgage |
86,218 | 84,275 | 57,218 | 2% | 51% | |||||||||||||||||
| Qualifying revolving retail (credit cards) |
7,513 | 7,334 | 7,744 | 2% | -3% | |||||||||||||||||
| Other retail
|
|
31,004
|
|
|
31,360
|
|
|
30,681
|
|
|
-1%
|
|
|
1%
|
| |||||||
|
Credit risk weighted assets subject to Advanced IRB approach
|
|
273,264
|
|
|
275,286
|
|
|
256,532
|
|
|
-1%
|
|
|
7%
|
| |||||||
|
Credit risk specialised lending exposures subject to slotting criteria
|
|
33,896
|
|
|
36,100
|
|
|
35,066
|
|
|
-6%
|
|
|
-3%
|
| |||||||
| Subject to Standardised approach |
||||||||||||||||||||||
| Corporate |
16,264 | 20,459 | 22,149 | -21% | -27% | |||||||||||||||||
| Residential mortgage |
2,354 | 2,493 | 2,616 | -6% | -10% | |||||||||||||||||
| Other retail (includes credit cards)
|
|
3,131
|
|
|
3,277
|
|
|
3,550
|
|
|
-4%
|
|
|
-12%
|
| |||||||
|
Credit risk weighted assets subject to Standardised approach
|
|
21,749
|
|
|
26,229
|
|
|
28,315
|
|
|
-17%
|
|
|
-23%
|
| |||||||
|
Credit Valuation Adjustment and Qualifying Central Counterparties
|
|
8,168
|
|
|
9,371
|
|
|
9,147
|
|
|
-13%
|
|
|
-11%
|
| |||||||
| Credit risk weighted assets relating to securitisation exposures |
1,171 | 1,203 | 1,194 | -3% | -2% | |||||||||||||||||
| Other assets
|
|
3,561
|
|
|
3,844
|
|
|
4,054
|
|
|
-7%
|
|
|
-12%
|
| |||||||
|
Total credit risk weighted assets
|
|
341,809
|
|
|
352,033
|
|
|
334,308
|
|
|
-3%
|
|
|
2%
|
| |||||||
108
SUPPLEMENTARY INFORMATION
Capital management, cont’d
| Collective Provision and Individual
|
Basel Expected Loss1
|
|||||||||||||||||||||||||
| Table 7: Total provision for credit impairment and expected loss by division |
Mar 17 |
Sep 16 |
Mar 16 |
Mar 17 |
Sep 16 |
Mar 16 |
||||||||||||||||||||
| $M | $M | $M | $M | $M | $M | |||||||||||||||||||||
| Australia |
1,877 | 1,794 | 1,751 | 2,735 | 2,654 | 2,608 | ||||||||||||||||||||
| Institutional |
1,494 | 1,683 | 1,682 | 1,337 | 1,404 | 1,410 | ||||||||||||||||||||
| New Zealand |
470 | 491 | 451 | 766 | 802 | 717 | ||||||||||||||||||||
| Asia Retail & Pacific |
199 | 211 | 213 | 5 | 7 | 5 | ||||||||||||||||||||
| TSO and Group Centre
|
|
14
|
|
|
4
|
|
|
3
|
|
|
-
|
|
|
1
|
|
|
-
|
| ||||||||
|
Total provision for credit impairment and expected loss
|
|
4,054
|
|
|
4,183
|
|
|
4,100
|
|
|
4,843
|
|
|
4,868
|
|
|
4,740
|
| ||||||||
| 1. | Only applicable to Advanced Internal Ratings based portfolios. |
| As at
|
Movement
|
|||||||||||||||||||
|
Mar 17 |
Sep 16 |
Mar 16 |
Mar 17 |
Mar 17 |
||||||||||||||||
| Table 8: APRA Expected loss in excess of eligible provisions | $M | $M | $M | v. Sep 16 | v. Mar 16 | |||||||||||||||
| APRA Basel 3 expected loss: non-defaulted |
2,866 | 2,959 | 2,894 | -3% | -1% | |||||||||||||||
| Less: Qualifying collective provision |
||||||||||||||||||||
| Collective provision |
(2,785) | (2,876) | (2,862) | -3% | -3% | |||||||||||||||
| Non-qualifying collective provision |
349 | 350 | 313 | 0% | 12% | |||||||||||||||
| Standardised collective provision
|
|
257
|
|
|
267
|
|
|
255
|
|
|
-4%
|
|
|
1%
|
| |||||
| Non-defaulted excess included in deduction |
687 | 700 | 600 | -2% | 15% | |||||||||||||||
| APRA Basel 3 expected loss: defaulted |
1,977 | 1,909 | 1,846 | 4% | 7% | |||||||||||||||
| Less: Qualifying individual provision |
||||||||||||||||||||
| Individual provision |
(1,269) | (1,307) | (1,238) | -3% | 3% | |||||||||||||||
| Additional individual provision for partial write offs |
(540) | (509) | (528) | 6% | 2% | |||||||||||||||
| Standardised individual provision |
149 | 195 | 171 | -24% | -13% | |||||||||||||||
| Collective provision on advanced defaulted
|
|
(308)
|
|
|
(304)
|
|
|
(265)
|
|
|
1%
|
|
|
16%
|
| |||||
| 9 | (16) | (14) | large | large | ||||||||||||||||
| Shortfall in expected loss not included in deduction
|
|
-
|
|
|
16
|
|
|
14
|
|
|
-100%
|
|
|
-100%
|
| |||||
|
Defaulted excess included in deduction
|
|
9
|
|
|
-
|
|
|
-
|
|
|
n/a
|
|
|
n/a
|
| |||||
|
Gross deduction
|
|
696
|
|
|
700
|
|
|
600
|
|
|
-1%
|
|
|
16%
|
| |||||
109
SUPPLEMENTARY INFORMATION
Average balance sheet and related interest1, 2, 3
|
Half Year Mar 17
|
Half Year Sep 16
|
Half Year Mar 16
|
||||||||||||||||||||||||||||||||||||||||||
|
Avg bal $M |
Int $M |
Rate % |
Avg bal $M |
Int $M |
Rate % |
Avg bal $M |
Int $M |
Rate % |
||||||||||||||||||||||||||||||||||||
| Loans and advances |
||||||||||||||||||||||||||||||||||||||||||||
| Overdrafts and credit cards |
19,546 | 1,058 | 10.9% | 20,109 | 1,084 | 10.8% | 20,539 | 1,062 | 10.3% | |||||||||||||||||||||||||||||||||||
| Commercial bills outstanding |
11,877 | 117 | 2.0% | 12,325 | 126 | 2.0% | 13,237 | 112 | 1.7% | |||||||||||||||||||||||||||||||||||
| Term loans - housing |
302,562 | 6,932 | 4.6% | 295,674 | 7,221 | 4.9% | 285,812 | 7,203 | 5.0% | |||||||||||||||||||||||||||||||||||
| Term loans - non-housing |
213,423 | 4,399 | 4.1% | 213,827 | 4,576 | 4.3% | 221,728 | 4,890 | 4.4% | |||||||||||||||||||||||||||||||||||
| Lease financing |
8,160 | 259 | 6.4% | 8,096 | 263 | 6.5% | 8,365 | 279 | 6.7% | |||||||||||||||||||||||||||||||||||
| Other loans and advances |
1,533 | 74 | n/a | 2,292 | - | n/a | 2,239 | 26 | n/a | |||||||||||||||||||||||||||||||||||
| Individual provision for credit impairment
|
|
(1,320)
|
|
|
-
|
|
|
n/a
|
|
|
(1,238)
|
|
|
-
|
|
|
n/a
|
|
|
(988)
|
|
|
-
|
|
|
n/a
|
| |||||||||||||||||
|
Total |
|
555,781
|
|
|
12,839 |
|
|
4.6%
|
|
|
551,085 |
|
|
13,270 |
|
|
4.8% |
|
|
550,932 |
|
|
13,572 |
|
|
4.9% |
| |||||||||||||||||
|
Other interest earning assets |
||||||||||||||||||||||||||||||||||||||||||||
| Cash |
53,260 | 266 | 1.0% | 46,076 | 256 | 1.1% | 51,054 | 247 | 1.0% | |||||||||||||||||||||||||||||||||||
| Settlement Balances owed to ANZ |
16,972 | 22 | 0.3% | 17,403 | 12 | 0.1% | 18,521 | 34 | 0.4% | |||||||||||||||||||||||||||||||||||
| Collateral Paid |
11,950 | 41 | 0.7% | 14,042 | 48 | 0.7% | 10,737 | 26 | 0.5% | |||||||||||||||||||||||||||||||||||
| Trading and available for sale assets |
104,548 | 1,150 | 2.2% | 100,467 | 1,182 | 2.4% | 98,884 | 1,134 | 2.3% | |||||||||||||||||||||||||||||||||||
| Regulatory Deposits |
1,382 | 11 | 1.6% | 1,192 | 9 | 1.5% | 1,259 | 7 | 1.1% | |||||||||||||||||||||||||||||||||||
|
Other assets |
|
13 |
|
|
97 |
|
|
n/a |
|
|
10 |
|
|
84 |
|
|
n/a |
|
|
8 |
|
|
70 |
|
|
n/a |
| |||||||||||||||||
|
Total |
|
188,125 |
|
|
1,587 |
|
|
1.7% |
|
|
179,190 |
|
|
1,591 |
|
|
1.8% |
|
|
180,463 |
|
|
1,518 |
|
|
1.7% |
| |||||||||||||||||
|
Total interest earning assets4 |
|
743,906 |
|
|
14,426 |
|
|
3.9% |
|
|
730,275 |
|
|
14,861 |
|
|
4.1% |
|
|
731,395 |
|
|
15,090 |
|
|
4.1% |
| |||||||||||||||||
|
Non-interest earning assets |
||||||||||||||||||||||||||||||||||||||||||||
| Derivatives |
76,087 | 90,011 | 79,804 | |||||||||||||||||||||||||||||||||||||||||
| Premises and equipment |
2,100 | 2,200 | 2,222 | |||||||||||||||||||||||||||||||||||||||||
| Insurance assets |
35,688 | 34,974 | 34,846 | |||||||||||||||||||||||||||||||||||||||||
| Other assets |
62,939 | 60,423 | 55,395 | |||||||||||||||||||||||||||||||||||||||||
| Collective provision for credit impairment
|
|
(2,826)
|
|
|
(2,813)
|
|
|
(2,914)
|
|
|||||||||||||||||||||||||||||||||||
|
Total |
|
173,988 |
|
|
184,795 |
|
|
169,353 |
|
|||||||||||||||||||||||||||||||||||
|
Total average assets |
|
917,894 |
|
|
915,070 |
|
|
900,748 |
|
|||||||||||||||||||||||||||||||||||
|
Interest bearing deposits and other borrowings |
||||||||||||||||||||||||||||||||||||||||||||
| Certificates of deposit |
59,500 | 664 | 2.2% | 61,712 | 724 | 2.3% | 63,722 | 781 | 2.5% | |||||||||||||||||||||||||||||||||||
| Term deposits |
205,073 | 1,951 | 1.9% | 199,583 | 1,895 | 1.9% | 197,297 | 1,942 | 2.0% | |||||||||||||||||||||||||||||||||||
| On demand and short term deposits |
209,759 | 1,777 | 1.7% | 207,316 | 1,970 | 1.9% | 204,031 | 2,193 | 2.1% | |||||||||||||||||||||||||||||||||||
| Deposits from banks |
62,179 | 369 | 1.2% | 50,770 | 312 | 1.2% | 51,307 | 327 | 1.3% | |||||||||||||||||||||||||||||||||||
| Commercial paper |
10,656 | 124 | 2.3% | 20,053 | 283 | 2.8% | 25,783 | 288 | 2.2% | |||||||||||||||||||||||||||||||||||
| Securities sold under agreements to repurchase | 2,088 | 10 | 1.0% | 800 | 4 | 1.0% | 1,191 | 4 | 0.7% | |||||||||||||||||||||||||||||||||||
| Borrowing corporations’ debt
|
|
1,379
|
|
|
25
|
|
|
3.6%
|
|
|
1,573
|
|
|
31
|
|
|
3.9%
|
|
|
1,576
|
|
|
33
|
|
|
4.2%
|
| |||||||||||||||||
|
Total |
|
550,634 |
|
|
4,920 |
|
|
1.8% |
|
|
541,807 |
|
|
5,219 |
|
|
1.9% |
|
|
544,907 |
|
|
5,568 |
|
|
2.0% |
| |||||||||||||||||
|
Other interest bearing liabilities |
||||||||||||||||||||||||||||||||||||||||||||
| Settlement Balances owed by ANZ |
4,963 | 13 | 0.5% | 5,298 | 17 | 0.6% | 4,478 | 15 | 0.7% | |||||||||||||||||||||||||||||||||||
| Collateral Received |
6,019 | 18 | 0.6% | 7,093 | 25 | 0.7% | 5,806 | 14 | 0.5% | |||||||||||||||||||||||||||||||||||
| Debt issuances & subordinated debt |
111,683 | 1,940 | 3.5% | 105,685 | 1,954 | 3.7% | 101,507 | 1,819 | 3.6% | |||||||||||||||||||||||||||||||||||
| Other liabilities
|
|
2,902
|
|
|
119
|
|
|
n/a
|
|
|
5,282
|
|
|
119
|
|
|
n/a
|
|
|
5,109
|
|
|
106
|
|
|
n/a
|
| |||||||||||||||||
| Total
|
|
125,567
|
|
|
2,090
|
|
|
3.3%
|
|
|
123,358
|
|
|
2,115
|
|
|
3.4%
|
|
|
116,900
|
|
|
1,954
|
|
|
3.3%
|
| |||||||||||||||||
|
Total interest bearing liabilities4
|
|
676,201
|
|
|
7,010
|
|
|
2.1%
|
|
|
665,165
|
|
|
7,334
|
|
|
2.2%
|
|
|
661,807
|
|
|
7,522
|
|
|
2.3% |
| |||||||||||||||||
|
Non-interest bearing liabilities |
||||||||||||||||||||||||||||||||||||||||||||
| Deposits |
46,703 | 43,865 | 42,328 | |||||||||||||||||||||||||||||||||||||||||
| Derivatives |
78,588 | 92,110 | 85,666 | |||||||||||||||||||||||||||||||||||||||||
| Insurance Liabilities |
36,246 | 35,662 | 35,456 | |||||||||||||||||||||||||||||||||||||||||
| External unit holder liabilities (life insurance funds) | 3,333 | 3,265 | 3,291 | |||||||||||||||||||||||||||||||||||||||||
| Other liabilities |
19,024 | 18,189 | 14,735 | |||||||||||||||||||||||||||||||||||||||||
|
Total |
|
183,894 |
|
|
193,091 |
|
|
181,476 |
|
|||||||||||||||||||||||||||||||||||
|
Total average liabilities
|
|
860,095
|
|
|
858,256
|
|
|
843,283
|
|
|||||||||||||||||||||||||||||||||||
| 1. | Averages used are predominantly daily averages. |
| 2. | In the March 2017 half, the Group changed its calculation of net interest margin to net home loan deposit offset balances against total interest earning assets. Average home loan deposit offset balances for the March 2017 half for the Australia division were $24,979 million (Sep 16 half: $23,653 million; Mar 16 half: $22,996 million). Refer to page 20 for further details. |
| 3. | Balance sheet amounts and metrics include assets and liabilities held for sale. |
| 4. | Intra-group interest earning assets and interest income and Intra-group interest earning liabilities and interest expense have been eliminated. |
110
SUPPLEMENTARY INFORMATION
Average balance sheet and related interest1, 2, 3 (cont’d)
|
Half Year Mar 17
|
Half Year Sep 16
|
Half Year Mar 16
|
||||||||||||||||||||||||||||||||||
|
Avg bal $M |
Int $M |
Rate % |
Avg bal $M |
Int $M |
Rate % |
Avg bal $M |
Int $M |
Rate % |
||||||||||||||||||||||||||||
| Loans and advances |
||||||||||||||||||||||||||||||||||||
| Australia |
375,642 | 9,024 | 4.8% | 369,168 | 9,357 | 5.1% | 364,039 | 9,429 | 5.2% | |||||||||||||||||||||||||||
| Asia Pacific, Europe & America |
64,699 | 1,093 | 3.4% | 69,355 | 1,141 | 3.3% | 79,132 | 1,296 | 3.3% | |||||||||||||||||||||||||||
| New Zealand
|
|
115,440
|
|
|
2,722
|
|
|
4.7%
|
|
|
112,562
|
|
|
2,772
|
|
|
4.9%
|
|
|
107,761
|
|
|
2,847
|
|
|
5.3%
|
| |||||||||
|
Total
|
|
555,781
|
|
|
12,839
|
|
|
4.6%
|
|
|
551,085
|
|
|
13,270
|
|
|
4.8%
|
|
|
550,932
|
|
|
13,572
|
|
|
4.9%
|
| |||||||||
| Trading and available for sale assets |
||||||||||||||||||||||||||||||||||||
| Australia |
60,330 | 662 | 2.2% | 58,696 | 710 | 2.4% | 56,200 | 661 | 2.4% | |||||||||||||||||||||||||||
| Asia Pacific, Europe & America |
29,489 | 264 | 1.8% | 26,882 | 229 | 1.7% | 29,199 | 233 | 1.6% | |||||||||||||||||||||||||||
| New Zealand
|
|
14,729
|
|
|
224
|
|
|
3.0%
|
|
|
14,889
|
|
|
243
|
|
|
3.3%
|
|
|
13,485
|
|
|
240
|
|
|
3.6%
|
| |||||||||
|
Total
|
|
104,548
|
|
|
1,150
|
|
|
2.2%
|
|
|
100,467
|
|
|
1,182
|
|
|
2.4%
|
|
|
98,884
|
|
|
1,134
|
|
|
2.3%
|
| |||||||||
| Total interest earning assets4 |
||||||||||||||||||||||||||||||||||||
| Australia |
466,147 | 9,912 | 4.3% | 455,855 | 10,277 | 4.5% | 443,036 | 10,292 | 4.6% | |||||||||||||||||||||||||||
| Asia Pacific, Europe & America |
143,750 | 1,491 | 2.1% | 142,512 | 1,473 | 2.1% | 162,505 | 1,612 | 2.0% | |||||||||||||||||||||||||||
| New Zealand
|
|
134,009
|
|
|
3,023
|
|
|
4.5%
|
|
|
131,908
|
|
|
3,111
|
|
|
4.7%
|
|
|
125,854
|
|
|
3,186
|
|
|
5.1%
|
| |||||||||
|
Total
|
|
743,906
|
|
|
14,426
|
|
|
3.9%
|
|
|
730,275
|
|
|
14,861
|
|
|
4.1%
|
|
|
731,395
|
|
|
15,090
|
|
|
4.1%
|
| |||||||||
| Total average assets |
||||||||||||||||||||||||||||||||||||
| Australia |
593,672 | 584,543 | 569,243 | |||||||||||||||||||||||||||||||||
| Asia Pacific, Europe & America |
170,297 | 169,939 | 188,923 | |||||||||||||||||||||||||||||||||
| New Zealand |
153,925 | 160,588 | 142,582 | |||||||||||||||||||||||||||||||||
|
Total average assets
|
|
917,894
|
|
|
915,070
|
|
|
900,748
|
|
|||||||||||||||||||||||||||
| Interest bearing deposits and other borrowings |
||||||||||||||||||||||||||||||||||||
| Australia |
318,638 | 3,299 | 2.1% | 308,684 | 3,561 | 2.3% | 310,744 | 3,789 | 2.4% | |||||||||||||||||||||||||||
| Asia Pacific, Europe & America |
143,505 | 590 | 0.8% | 145,807 | 530 | 0.7% | 151,696 | 547 | 0.7% | |||||||||||||||||||||||||||
| New Zealand
|
|
88,491
|
|
|
1,031
|
|
|
2.3%
|
|
|
87,316
|
|
|
1,128
|
|
|
2.6%
|
|
|
82,467
|
|
|
1,232
|
|
|
3.0%
|
| |||||||||
|
Total
|
|
550,634
|
|
|
4,920
|
|
|
1.8%
|
|
|
541,807
|
|
|
5,219
|
|
|
1.9%
|
|
|
544,907
|
|
|
5,568
|
|
|
2.0%
|
| |||||||||
| Total interest bearing liabilities4 |
||||||||||||||||||||||||||||||||||||
| Australia |
398,657 | 4,681 | 2.4% | 388,743 | 5,086 | 2.6% | 386,820 | 5,138 | 2.7% | |||||||||||||||||||||||||||
| Asia Pacific, Europe & America |
167,295 | 871 | 1.0% | 168,031 | 725 | 0.9% | 172,261 | 714 | 0.8% | |||||||||||||||||||||||||||
| New Zealand
|
|
110,249
|
|
|
1,458
|
|
|
2.7%
|
|
|
108,391
|
|
|
1,523
|
|
|
2.8%
|
|
|
102,726
|
|
|
1,670
|
|
|
3.3%
|
| |||||||||
|
Total
|
|
676,201
|
|
|
7,010
|
|
|
2.1%
|
|
|
665,165
|
|
|
7,334
|
|
|
2.2%
|
|
|
661,807
|
|
|
7,522
|
|
|
2.3%
|
| |||||||||
| Total average liabilities |
||||||||||||||||||||||||||||||||||||
| Australia |
534,389 | 523,928 | 526,500 | |||||||||||||||||||||||||||||||||
| Asia Pacific, Europe & America |
190,287 | 192,679 | 193,380 | |||||||||||||||||||||||||||||||||
| New Zealand
|
|
135,419
|
|
|
141,649
|
|
|
123,403
|
|
|||||||||||||||||||||||||||
|
Total |
860,095 | 858,256 | 843,283 | |||||||||||||||||||||||||||||||||
| Total average shareholder’s equity |
||||||||||||||||||||||||||||||||||||
| Ordinary share capital, reserves, retained earnings and non-controlling interests
|
|
57,799
|
|
|
56,814
|
|
|
57,465
|
|
|||||||||||||||||||||||||||
|
Total
|
|
57,799
|
|
|
56,814
|
|
|
57,465
|
|
|||||||||||||||||||||||||||
| Total average liabilities and shareholder’s equity
|
|
917,894
|
|
|
915,070
|
|
|
900,748
|
|
|||||||||||||||||||||||||||
| 1. | Averages used are predominantly daily averages. |
| 2. | In the March 2017 half, the Group changed its calculation of net interest margin to net home loan deposit offset balances against total interest earning assets. Average home loan deposit offset balances for the March 2017 half for the Australia division were $24,979 million (Sep 16 half: $23,653 million; Mar 16 half: $22,996 million). Refer to page 20 for further details. |
| 3. | Balance sheet amounts and metrics include assets and liabilities held for sale. |
| 4. | Intra-group interest earning assets and interest income and Intra-group interest earning liabilities and interest expense have been eliminated. |
111
SUPPLEMENTARY INFORMATION
Average balance sheet and related interest1 (cont’d)
| Half Year
|
||||||||||||
|
Mar 17 |
Sep 16 |
Mar 16 |
||||||||||
| Gross earnings rate2 |
||||||||||||
| Australia |
4.49 | 4.77 | 4.75 | |||||||||
| Asia Pacific, Europe & America |
1.99 | 1.86 | 1.91 | |||||||||
| New Zealand |
4.52 | 4.72 | 5.06 | |||||||||
| Group
|
|
3.89
|
|
|
4.07
|
|
|
4.13
|
| |||
Net interest spread and net interest margin may be analysed as follows:
| Half Year
|
||||||||||||
|
Mar 17 |
Sep 16 |
Mar 16 |
||||||||||
| Australia2 |
||||||||||||
| Net interest spread |
2.07 | 2.15 | 2.08 | |||||||||
| Interest attributable to net non-interest bearing items
|
|
0.24
|
|
|
0.25
|
|
|
0.31
|
| |||
| Net interest margin - Australia
|
|
2.31
|
|
|
2.40
|
|
|
2.39
|
| |||
| Asia Pacific, Europe & America2 |
||||||||||||
| Net interest spread |
0.95 | 1.00 | 1.08 | |||||||||
| Interest attributable to net non-interest bearing items
|
|
0.04
|
|
|
0.03
|
|
|
0.03
|
| |||
| Net interest margin - Asia Pacific, Europe & America
|
|
0.99
|
|
|
1.03
|
|
|
1.11
|
| |||
| New Zealand2 |
||||||||||||
| Net interest spread |
1.84 | 1.85 | 1.81 | |||||||||
| Interest attributable to net non-interest bearing items
|
|
0.33
|
|
|
0.34
|
|
|
0.38
|
| |||
| Net interest margin - New Zealand
|
|
2.17
|
|
|
2.19
|
|
|
2.19
|
| |||
| Group |
||||||||||||
| Net interest spread |
1.81 | 1.86 | 1.84 | |||||||||
| Interest attributable to net non-interest bearing items
|
|
0.19
|
|
|
0.20
|
|
|
0.23
|
| |||
| Net interest margin
|
|
2.00
|
|
|
2.06
|
|
|
2.07
|
| |||
| Net interest margin (excluding Markets)
|
|
2.58
|
|
|
2.64
|
|
|
2.63
|
| |||
| 1. | In the March 2017 half, the Group changed its calculation of net interest margin to net home loan deposit offset balances against total interest earning assets. Average home loan deposit offset balances for the March 2017 half for the Australia division were $24,979 million (Sep 16 half: $23,653 million; Mar 16 half: $22,996 million). Refer to page 20 for further details. |
| 2. | Geographic gross earnings rate, net interest spread and net interest margin are calculated gross of intra group items (Intra-group interest earning assets and associated interest income and intra-group interest bearing liabilities and associated interest expense). |
112
SUPPLEMENTARY INFORMATION
Funds management and insurance income analysis (Group)
The tables below supplement the Wealth Australia disclosures provided on pages 63 to 65 to present the Group’s overall funds management and insurance businesses by incorporating the relevant Australia division, New Zealand division and Asia Retail & Pacific division funds management and insurance businesses.
| Half Year | Movement | |||||||||||||||||||||
|
Mar 17 |
Sep 16 |
Mar 16 |
Mar 17 |
Mar 17 |
||||||||||||||||||
| Reference Page | $M | $M | $M | v. Sep 16 | v. Mar 16 | |||||||||||||||||
| Net funds management and insurance income - statutory basis |
75 | 696 | 907 | 857 | -23% | -19% | ||||||||||||||||
| Adjustments between cash and statutory profit (pre-tax) |
||||||||||||||||||||||
| Treasury shares adjustment |
70 | 82 | 80 | (34) | 3% | large | ||||||||||||||||
| Policyholders tax gross up |
70 | (161) | (185) | (32) | -13% | large | ||||||||||||||||
| Revaluation of policy liabilities
|
70
|
|
51
|
|
|
(55)
|
|
|
(20)
|
|
|
large
|
|
|
large
|
| ||||||
|
Net funds management and insurance income - cash basis |
70 |
|
668 |
|
|
747 |
|
|
771 |
|
|
-11% |
|
|
-13% |
| ||||||
| Wealth Australia - Funds management and insurance income |
493 | 559 | 597 | -12% | -17% | |||||||||||||||||
| Australia - Funds management and insurance income |
13 | 22 | 25 | -41% | -48% | |||||||||||||||||
| New Zealand - Funds management and insurance income |
173 | 170 | 160 | 2% | 8% | |||||||||||||||||
| Asia Retail & Pacific - Funds management and insurance income |
47 | 59 | 60 | -20% | -22% | |||||||||||||||||
| Inter-divisional eliminations
|
|
(58)
|
|
|
(63)
|
|
|
(71)
|
|
|
-8%
|
|
|
-18%
|
| |||||||
|
Net funds management and insurance income - cash basis
|
22
|
|
668
|
|
|
747
|
|
|
771
|
|
|
-11%
|
|
|
-13%
|
| ||||||
| Half Year | Movement | |||||||||||||||||||
|
Mar 17 |
Sep 16 |
Mar 16 |
Mar 17 |
Mar 17 |
||||||||||||||||
| $M | $M | $M | v. Sep 16 | v. Mar 16 | ||||||||||||||||
| Insurance operating margin |
||||||||||||||||||||
| Life Insurance Planned profit margin |
||||||||||||||||||||
| Group & Individual |
64 | 79 | 72 | -19% | -11% | |||||||||||||||
| Experience profit/(loss)1 |
(26) | (11) | 3 | large | large | |||||||||||||||
| General Insurance operating profit margin
|
|
64
|
|
|
59
|
|
|
51
|
|
|
8%
|
|
|
25%
|
| |||||
|
Wealth Australia
|
|
102
|
|
|
127
|
|
|
126
|
|
|
-20%
|
|
|
-19%
|
| |||||
| Life Insurance Planned profit margin |
||||||||||||||||||||
| Individual |
36 | 20 | 20 | 80% | 80% | |||||||||||||||
| Experience profit/(loss)1
|
|
3
|
|
|
9
|
|
|
4
|
|
|
-67%
|
|
|
-25%
|
| |||||
|
New Zealand
|
|
39
|
|
|
29
|
|
|
24
|
|
|
34%
|
|
|
63%
|
| |||||
|
Total
|
|
141
|
|
|
156
|
|
|
150
|
|
|
-10%
|
|
|
-6%
|
| |||||
| 1. | Experience profit/(loss) variations are gains or losses arising from actual experience differing from plan, predominantly driven by lapses, claims and expenses. |
| As at | Movement | |||||||||||||||||||
|
Mar 17 |
Sep 16 |
Mar 16 |
Mar 17 |
Mar 17 |
||||||||||||||||
| $M | $M | $M | v. Sep 16 | v. Mar 16 | ||||||||||||||||
| Insurance annual in-force premiums |
||||||||||||||||||||
| Group |
427 | 445 | 439 | -4% | -3% | |||||||||||||||
| Individual2 |
1,348 | 1,339 | 1,297 | 1% | 4% | |||||||||||||||
| General Insurance
|
|
226
|
|
|
226
|
|
|
335
|
|
|
0%
|
|
|
-33%
|
| |||||
|
Total
|
|
2,001
|
|
|
2,010
|
|
|
2,071
|
|
|
0%
|
|
|
-3%
|
| |||||
| New | ||||||||||||||||
| Sep 16 | business | Lapses | Mar 17 | |||||||||||||
| $M | $M1 | $M | $M | |||||||||||||
| Insurance in-force book movement |
||||||||||||||||
| Group |
445 | 19 | (37) | 427 | ||||||||||||
| Individual2 |
1,339 | 74 | (65) | 1,348 | ||||||||||||
| General Insurance
|
|
226
|
|
|
76
|
|
|
(76)
|
|
|
226
|
| ||||
|
Total
|
|
2,010
|
|
|
169
|
|
|
(178)
|
|
|
2,001
|
| ||||
| 1. | New business includes the impact of foreign currency gains/(losses) on translation. |
| 2. | Lapses for Individual include the impact of the disposal of the New Zealand medical business in the March 2016 half. |
113
SUPPLEMENTARY INFORMATION
Funds management and insurance income analysis (Group) (cont’d)
| As at
|
Movement
|
|||||||||||||||||||||||
| Funds under management | Mar 17
$M |
Sep 16
$M |
Mar 16
$M |
Mar 17
v. Sep 16 |
Mar 17
v. Mar 16 |
|||||||||||||||||||
| Funds under management - average |
75,714 | 74,347 | 71,313 | 2% | 6% | |||||||||||||||||||
| Funds under management - end of period |
76,509 | 75,918 | 71,216 | 1% | 7% | |||||||||||||||||||
| Composed of: |
||||||||||||||||||||||||
| Australian equities |
17,104 | 16,963 | 15,988 | 1% | 7% | |||||||||||||||||||
| International equities |
20,207 | 18,422 | 16,784 | 10% | 20% | |||||||||||||||||||
| Cash and fixed interest |
34,203 | 35,800 | 33,979 | -4% | 1% | |||||||||||||||||||
| Property and infrastructure
|
|
4,995
|
|
|
4,733
|
|
|
4,465
|
|
|
6%
|
|
|
12%
|
| |||||||||
| Total
|
|
76,509
|
|
|
75,918
|
|
|
71,216
|
|
|
1%
|
|
|
7%
|
| |||||||||
| Funds Management cash flows by product | Sep 16
$M |
Inflows
$M |
Outflows
$M |
Other1
$M |
Mar 17
$M |
|||||||||||||||
| Wealth Australia Division |
||||||||||||||||||||
| Open Solutions |
||||||||||||||||||||
| OneAnswer Frontier |
9,958 | 719 | (631 | ) | 454 | 10,500 | ||||||||||||||
| ANZ Smart Choice |
11,190 | 1,122 | (629 | ) | 3,099 | 14,782 | ||||||||||||||
| Wrap (Voyage and Grow) |
2,160 | 312 | (150 | ) | 635 | 2,957 | ||||||||||||||
| Closed Solutions |
||||||||||||||||||||
| Retail |
19,028 | 281 | (1,432 | ) | (34 | ) | 17,843 | |||||||||||||
| Employer |
5,915 | 72 | (324 | ) | (2,494 | ) | 3,169 | |||||||||||||
| Australia Division |
||||||||||||||||||||
| Private Bank |
2,411 | 134 | (196 | ) | 93 | 2,442 | ||||||||||||||
| New Zealand Division |
||||||||||||||||||||
| KiwiSaver |
8,864 | 797 | (385 | ) | (141 | ) | 9,135 | |||||||||||||
| Retail |
2,741 | 1,707 | (1,457 | ) | (96 | ) | 2,895 | |||||||||||||
| Private Bank |
6,682 | 502 | (462 | ) | (262 | ) | 6,460 | |||||||||||||
| Bonus Bonds |
3,397 | 492 | (567 | ) | (137 | ) | 3,185 | |||||||||||||
| Other New Zealand
|
|
3,572
|
|
|
336
|
|
|
(664
|
)
|
|
(103
|
)
|
|
3,141
|
| |||||
| Total
|
|
75,918
|
|
|
6,474
|
|
|
(6,897
|
)
|
|
1,014
|
|
|
76,509
|
| |||||
| 1. | Other includes investment income net of taxes, fees and charges, distributions and the impact of foreign currency translations. In Wealth Australia it also includes the transition of funds under management from Employer Super to ANZ Smart Choice of approximately $2.5 billion, as a result of regulatory changes in the industry. |
| Embedded value and value of new business (insurance and investments only) | Wealth
Australia
$M1 |
New
Zealand
$M |
Total
$M |
|||||||||
| Embedded value as at September 2016 2 |
4,536 | 616 | 5,152 | |||||||||
| Value of new business3 |
50 | 7 | 57 | |||||||||
| Expected return4 |
151 | 24 | 175 | |||||||||
| Experience deviations and assumption changes5
|
|
(67)
|
|
|
9
|
|
|
(58)
|
| |||
| Embedded value before economic assumption changes and net transfer |
4,670 | 656 | 5,326 | |||||||||
| Economic assumptions change6 |
(80) | (64) | (144) | |||||||||
| Net transfer7
|
|
(143)
|
|
|
(43)
|
|
|
(186)
|
| |||
| Embedded value as at March 2017
|
|
4,447
|
|
|
549
|
|
|
4,996
|
| |||
| 1. | The product lines used are on the same basis as prior periods. This is different to the product lines that are subject to the strategic review in Wealth Australia. |
| 2. | Embedded value represents the present value of future profits and releases of capital arising from the business in-force at the valuation date, and adjusted net assets. It is determined using best estimate assumptions with franking credits included at 70% of face value. Projected cash flows have been discounted using capital asset pricing model risk discount rates of 7.75%-9.25%. ANZ Lenders Mortgage Insurance, ANZ Financial Planning and ANZ Share Investing businesses are not included in the valuation. Value of new business represents the present value of future profits less the cost of capital arising from new business written over the period. |
| 3. | Value of new business represents the present value of future profits less the cost of capital arising from new business written over the period. |
| 4. | Expected return represents the expected increase in value over the period. |
| 5. | Experience deviations and assumption changes arise from deviations and changes to best estimate assumptions underlying the prior period embedded value. Unfavorable experience in Wealth Australia was primarily driven by credit card repricing and retail life claims experience. |
| 6. | Interest rate movements have led to a negative value impact. |
| 7. | Net transfer represents the net capital movements over the period including capital injections, transfer of cash dividends paid and value of franking credits. For Wealth Australia there was $120 million of cash dividends paid, $6 million of dividends in AT1 preference shares paid and $17 million of franking credits expected to be transferred to the parent entity. For New Zealand there were no cash dividends paid in the March 2017 half. |
114
SUPPLEMENTARY INFORMATION
Select geographical disclosures
The following divisions operate across the geographic locations illustrated below:
| • | Institutional division – Asia, Europe & America, Pacific and New Zealand |
| • | Asia Retail & Pacific division – Asia and Pacific |
| • | New Zealand division – New Zealand |
Asia Pacific, Europe & America geography
| Asia $M |
Europe & America $M |
Pacific $M |
APEA Total $M |
|||||||||||||
| March 2017 Half Year |
||||||||||||||||
| Statutory profit |
(8 | ) | 151 | 95 | 238 | |||||||||||
| Cash profit |
(10 | ) | 107 | 95 | 192 | |||||||||||
| Net loans and advances |
49,568 | 7,695 | 3,412 | 60,675 | ||||||||||||
| Customer deposits |
60,656 | 52,521 | 5,374 | 118,551 | ||||||||||||
| Risk weighted assets
|
|
55,062
|
|
|
19,852
|
|
|
7,555
|
|
|
82,469
|
| ||||
| March 2016 Half Year |
||||||||||||||||
| Statutory profit |
84 | 64 | 94 | 242 | ||||||||||||
| Cash profit |
83 | 86 | 94 | 263 | ||||||||||||
| Net loans and advances |
57,532 | 7,882 | 3,726 | 69,140 | ||||||||||||
| Customer deposits |
64,413 | 49,888 | 5,403 | 119,704 | ||||||||||||
| Risk weighted assets
|
|
64,115
|
|
|
24,212
|
|
|
7,546
|
|
|
95,873
|
| ||||
| September 2016 Half Year |
||||||||||||||||
| Statutory profit |
206 | 119 | 67 | 392 | ||||||||||||
| Cash profit |
208 | 120 | 67 | 395 | ||||||||||||
| Net loans and advances |
54,303 | 8,441 | 3,636 | 66,380 | ||||||||||||
| Customer deposits |
60,635 | 48,138 | 5,491 | 114,264 | ||||||||||||
| Risk weighted assets
|
|
59,132
|
|
|
21,698
|
|
|
7,725
|
|
|
88,555
|
| ||||
New Zealand geography (in NZD)
| Half Year
|
Movement
|
|||||||||||||||||||
| Mar 17 NZD M |
Sep 16 NZD M |
Mar 16 NZD M |
Mar 17 v. Sep 16 |
Mar 17 v. Mar 16 |
||||||||||||||||
| Net interest income |
1,534 | 1,536 | 1,493 | 0% | 3% | |||||||||||||||
| Other operating income
|
|
514
|
|
|
393
|
|
|
402
|
|
|
31%
|
|
|
28%
|
| |||||
| Operating income |
2,048 | 1,929 | 1,895 | 6% | 8% | |||||||||||||||
| Operating expenses
|
|
(718
|
)
|
|
(765)
|
|
|
(815)
|
|
|
-6%
|
|
|
-12%
|
| |||||
| Profit before credit impairment and income tax |
1,330 | 1,164 | 1,080 | 14% | 23% | |||||||||||||||
| Credit impairment (charge)/release
|
|
(40
|
)
|
|
(99)
|
|
|
(50)
|
|
|
-60%
|
|
|
-20%
|
| |||||
| Profit before income tax |
1,290 | 1,065 | 1,030 | 21% | 25% | |||||||||||||||
| Income tax expense and non-controlling interests
|
|
(362
|
)
|
|
(287)
|
|
|
(279)
|
|
|
26%
|
|
|
30%
|
| |||||
| Cash profit |
928 | 778 | 751 | 19% | 24% | |||||||||||||||
| Adjustments between statutory profit and cash profit
|
|
(59
|
)
|
|
1
|
|
|
12
|
|
|
large
|
|
|
large
|
| |||||
| Statutory profit
|
|
869
|
|
|
779
|
|
|
763
|
|
|
12%
|
|
|
14%
|
| |||||
| Individual credit impairment charge/(release) - cash |
69 | 88 | 50 | -22% | 38% | |||||||||||||||
| Collective credit impairment charge/(release) - cash |
(29 | ) | 11 | - | large | n/a | ||||||||||||||
| Net loans and advances |
122,954 | 120,651 | 117,470 | 2% | 5% | |||||||||||||||
| Customer deposits |
96,259 | 91,360 | 90,148 | 5% | 7% | |||||||||||||||
| Risk weighted assets |
74,511 | 76,005 | 74,537 | -2% | 0% | |||||||||||||||
| Total full time equivalent staff (FTE)
|
|
7,761
|
|
|
7,869
|
|
|
8,063
|
|
|
-1%
|
|
|
-4%
|
| |||||
115
SUPPLEMENTARY INFORMATION
Exchange rates
Major exchange rates used in the translation of foreign subsidiaries, branches, investments in associates and issued debt are as follows:
|
Balance Sheet
|
Profit & Loss Average
|
|||||||||||||||||||||||||||
|
As at
|
Half Year
|
|||||||||||||||||||||||||||
|
Mar 17 |
Sep 16 |
Mar 16 |
Mar 17 |
Sep 16 |
Mar 16 |
|||||||||||||||||||||||
| Chinese Yuan |
5.2716 | 5.0809 | 4.9471 | 5.1672 | 4.9507 | 4.6622 | ||||||||||||||||||||||
| Euro |
0.7160 | 0.6789 | 0.6760 | 0.7025 | 0.6694 | 0.6558 | ||||||||||||||||||||||
| Pound Sterling |
0.6122 | 0.5874 | 0.5335 | 0.6071 | 0.5432 | 0.4886 | ||||||||||||||||||||||
| Indian Rupee |
49.557 | 50.764 | 50.741 | 50.639 | 50.258 | 48.101 | ||||||||||||||||||||||
| Indonesian Rupiah |
10,184 | 9,900 | 10,164 | 10,018 | 9,939 | 9,835 | ||||||||||||||||||||||
| Japanese Yen |
85.565 | 76.844 | 85.951 | 83.904 | 78.750 | 85.328 | ||||||||||||||||||||||
| Malaysian Ringgit |
3.3834 | 3.1576 | 3.0015 | 3.3021 | 3.0295 | 3.0565 | ||||||||||||||||||||||
| New Taiwan Dollar |
23.216 | 23.895 | 24.640 | 23.681 | 24.100 | 23.708 | ||||||||||||||||||||||
| New Zealand Dollar |
1.0939 | 1.0487 | 1.1093 | 1.0593 | 1.0640 | 1.0834 | ||||||||||||||||||||||
| Papua New Guinea Kina |
2.4304 | 2.4143 | 2.3724 | 2.3906 | 2.3648 | 2.1565 | ||||||||||||||||||||||
| United States Dollar
|
|
0.7644
|
|
|
0.7617
|
|
|
0.7651
|
|
|
0.7533
|
|
|
0.7510
|
|
|
0.7212
|
| ||||||||||
Derivative financial instruments
Derivative financial instruments are contracts whose value is derived from one or more underlying variables or indices defined in the contract, require little or no initial net investment and are settled at a future date. Derivatives include contracts traded on registered exchanges and contracts agreed between counterparties. The use of derivatives and their sale to customers as risk management products is an integral part of the Group’s trading and sales activities. Derivatives are also used to manage the Group’s own exposure to fluctuations in foreign exchange and interest rates as part of its asset and liability management activities.
The following table provides an overview of the Group’s foreign exchange, interest rate, commodity and credit derivatives. They include all trading and balance sheet risk management contracts. The derivative instruments become favourable (assets) or unfavourable (liabilities) as a result of fluctuations in market rates relative to the terms of the derivative.
| Assets
|
Liabilities
|
Assets
|
Liabilities
|
Assets
|
Liabilities
|
|||||||||||||||||||||||||||
|
As at |
As at |
As at |
||||||||||||||||||||||||||||||
| Fair Values | Mar 17 |
Mar 17 |
Sep 16 |
Sep 16 |
Mar 16 |
Mar 16 |
||||||||||||||||||||||||||
| $M | $M | $M | $M | $M | $M | |||||||||||||||||||||||||||
| Foreign exchange contracts |
||||||||||||||||||||||||||||||||
| Spot and forward contracts |
12,703 | (11,830) | 10,960 | (10,794) | 17,145 | (16,911) | ||||||||||||||||||||||||||
| Swap agreements |
11,439 | (13,247) | 10,680 | (14,309) | 18,000 | (23,473) | ||||||||||||||||||||||||||
| Options purchased |
565 | - | 887 | - | 1,388 | - | ||||||||||||||||||||||||||
| Options sold
|
|
-
|
|
|
(587)
|
|
|
-
|
|
|
(802)
|
|
|
-
|
|
|
(1,087)
|
| ||||||||||||||
|
|
24,707
|
|
|
(25,664)
|
|
|
22,527
|
|
|
(25,905)
|
|
|
36,533
|
|
|
(41,471)
|
| |||||||||||||||
|
Commodity contracts |
||||||||||||||||||||||||||||||||
| Derivative contracts
|
|
2,340
|
|
|
(1,461)
|
|
|
2,294
|
|
|
(1,395)
|
|
|
2,424
|
|
|
(1,950)
|
| ||||||||||||||
| Interest rate contracts |
||||||||||||||||||||||||||||||||
| Forward rate agreements |
2 | (2) | 12 | (17) | 35 | (46) | ||||||||||||||||||||||||||
| Swap agreements |
35,939 | (36,011) | 61,355 | (59,011) | 48,490 | (46,127) | ||||||||||||||||||||||||||
| Futures contracts |
40 | (316) | 33 | (119) | 31 | (213) | ||||||||||||||||||||||||||
| Options purchased |
649 | - | 1,098 | - | 907 | - | ||||||||||||||||||||||||||
| Options sold
|
|
-
|
|
|
(1,388)
|
|
|
-
|
|
|
(2,076)
|
|
|
-
|
|
|
(1,557)
|
| ||||||||||||||
|
|
36,630
|
|
|
(37,717)
|
|
|
62,498
|
|
|
(61,223)
|
|
|
49,463
|
|
|
(47,943)
|
| |||||||||||||||
|
Credit default swaps |
||||||||||||||||||||||||||||||||
| Structured credit derivatives purchased |
56 | - | 40 | - | 49 | - | ||||||||||||||||||||||||||
| Other credit derivatives purchased
|
|
14
|
|
|
(129)
|
|
|
117
|
|
|
(125)
|
|
|
256
|
|
|
(268)
|
| ||||||||||||||
| Total credit derivatives purchased
|
|
70
|
|
|
(129)
|
|
|
157
|
|
|
(125)
|
|
|
305
|
|
|
(268)
|
| ||||||||||||||
| Structured credit derivatives sold |
- | (64) | - | (50) | - | (62) | ||||||||||||||||||||||||||
| Other credit derivatives sold
|
|
135
|
|
|
(15)
|
|
|
20
|
|
|
(27)
|
|
|
22
|
|
|
(12)
|
| ||||||||||||||
| Total credit derivatives sold
|
|
135
|
|
|
(79)
|
|
|
20
|
|
|
(77)
|
|
|
22
|
|
|
(74)
|
| ||||||||||||||
| Total fair value
|
|
63,882
|
|
|
(65,050)
|
|
|
87,496
|
|
|
(88,725)
|
|
|
88,747
|
|
|
(91,706)
|
| ||||||||||||||
116
DEFINITIONS
AASB – Australian Accounting Standards Board. The term “AASB” is commonly used when identifying Australian Accounting Standards issued by the AASB.
ADI – Authorised Deposit-taking Institution.
APRA – Australian Prudential Regulation Authority.
APS – ADI Prudential Standard.
BCBS – Basel Committee on Banking Supervision.
Cash and cash equivalents comprise coins, notes, money at call, balances held with central banks, liquid settlement balances (readily convertible to known amounts of cash which are subject to insignificant risk of changes in value) and securities purchased under agreements to resell (“reverse repos”) in less than three months.
Cash profit is an additional measure of profit which is prepared on a basis other than in accordance with accounting standards. Cash profit represents ANZ’s preferred measure of the result of the ongoing business activities of the Group, enabling readers to assess Group and Divisional performance against prior periods and against peer institutions. To calculate cash profit, the Group excludes non-core items from statutory profit as noted below. These items are calculated consistently period on period so as not to discriminate between positive and negative adjustments.
Gains and losses are adjusted where they are significant, or have the potential to be significant in any one period, and fall into one of three categories:
| 1. | gains or losses included in earnings arising from changes in tax, legal or accounting legislation or other non-core items not associated with the ongoing operations of the Group; |
| 2. | treasury shares, revaluation of policy liabilities, economic hedging impacts and similar accounting items that represent timing differences that will reverse through earnings in the future; and |
| 3. | accounting reclassifications between individual line items that do not impact reported results, such as policyholders tax gross up. |
Cash profit is not a measure of cash flow or profit determined on a cash accounting basis.
Collective provision is the provision for credit losses that are inherent in the portfolio but not able to be individually identified. A collective provision is only recognised when a loss event has occurred. Losses expected as a result of future events, no matter how likely, are not recognised.
Covered bonds are bonds issued by an ADI to external investors secured against a pool of the ADI’s assets (the cover pool) assigned to a bankruptcy remote special purpose entity. The primary assets forming the cover pool are mortgage loans. The mortgages remain on the issuer’s balance sheet. The covered bond holders have dual recourse to the issuer and the cover pool assets. The mortgages included in the cover pool cannot be otherwise pledged or disposed of but may be repurchased and substituted in order to maintain the credit quality of the pool. The Group issues covered bonds as part of its funding activities.
Credit risk is the risk of financial loss resulting from the failure of ANZ’s customers and counterparties to honour or perform fully the terms of a loan or contract.
Credit risk weighted assets represent assets which are weighted for credit risk according to a set formula as prescribed in APS 112/113.
Derivative credit valuation adjustment (CVA) – Over the life of a derivative instrument, ANZ uses a CVA model to adjust fair value to take into account the impact of counterparty credit quality. The methodology calculates the present value of expected losses over the life of the financial instrument as a function of probability of default, loss given default, expected credit risk exposure and an asset correlation factor. Impaired derivatives are also subject to a CVA.
Customer deposits represent term deposits, other deposits bearing interest, deposits not bearing interest and borrowing corporations’ debt excluding securitisation deposits.
Dividend payout ratio is the total ordinary dividend payment divided by profit attributable to shareholders of the Company, adjusted for the amount of preference share dividends paid.
Gross loans and advances (GLA) is made up of loans and advances, acceptances and capitalised brokerage/mortgage origination fees less unearned income.
IFRS – International Financial Reporting Standards.
Impaired assets are those financial assets where doubt exists as to whether the full contractual amount will be received in a timely manner, or where concessional terms have been provided because of the financial difficulties of the customer. Financial assets are impaired if there is objective evidence of impairment as a result of a loss event that occurred prior to the reporting date, and that loss event has had an impact, which can be reliably estimated, on the expected future cash flows of the individual asset or portfolio of assets.
Impaired loans comprise drawn facilities where the customer’s status is defined as impaired.
Individual provision is the amount of expected credit losses on financial instruments assessed for impairment on an individual basis (as opposed to on a collective basis). It takes into account expected cash flows over the lives of those financial instruments.
Interest rate risk in the banking book (IRRBB) relates to the potential adverse impact of changes in market interest rates on ANZ’s future net interest income. The risk generally arises from:
| 1. | Repricing and yield curve risk - the risk to earnings or market value as a result of changes in the overall level of interest rates and/or the relativity of these rates across the yield curve; |
| 2. | Basis risk - the risk to earnings or market value arising from volatility in the interest margin applicable to banking book items; and |
| 3. | Optionality risk - the risk to earnings or market value arising from the existence of stand-alone or embedded options in banking book items. |
Internationally comparable ratios are ANZ’s interpretation of the regulations documented in the Basel Committee publications; “Basel 3: A global regulatory framework for more resilient banks and banking systems” (June 2011) and “International Convergence of Capital Measurement and Capital Standards” (June 2006). They also include differences identified in APRA’s information paper entitled International Capital Comparison Study (13 July 2015).
Net interest margin is net interest income as a percentage of average interest earning assets.
Net loans and advances represent gross loans and advances less provisions for credit impairment.
117
DEFINITIONS
Net tangible assets equal share capital and reserves attributable to shareholders of the Company less preference share capital and unamortised intangible assets (including goodwill and software).
Operating expenses include personnel expenses, premises expenses, technology expenses, restructuring expenses, and other operating expenses (excluding credit impairment charges).
Operating income includes net interest income, net fee and commission income, net funds management and insurance income, share of associates’ profit and other income.
Restructured items comprise facilities in which the original contractual terms have been modified for reasons related to the financial difficulties of the customer. Restructuring may consist of reduction of interest, principal or other payments legally due, or an extension in maturity materially beyond those typically offered to new facilities with similar risk.
Return on average assets is the profit attributable to shareholders of the Company, adjusted for the amount of preference share dividends paid, divided by average total assets.
Return on average ordinary shareholders’ equity is the profit attributable to shareholders of the Company, adjusted for the amount of preference share dividends paid, divided by average ordinary shareholders’ equity.
Regulatory deposits are mandatory reserve deposits lodged with local central banks in accordance with statutory requirements.
Risk weighted assets (RWA) – Assets (both on and off-balance sheet) are risk weighted according to each asset’s inherent potential for default and what the likely losses would be in the case of default. In the case of non asset backed risks (i.e. market and operational risk), RWA is determined by multiplying the capital requirements for those risks by 12.5.
Settlement balances owed to/by ANZ represent financial assets and/or liabilities which are in the course of being settled. These may include trade dated assets and liabilities, nostro/vostro accounts and securities settlement accounts.
118
DEFINITIONS
| Description of divisions |
During the March 2017 half, the Group made changes to the Group’s operating model for technology, operations and shared services to accelerate delivery of its technology and digital roadmap, bring operations closer to its customers and continue operational efficiency gains. As a result of these organisational changes, divisional operations from Technology, Services & Operations (“TSO”) and Group Centre have been realigned to divisions. The residual TSO and Group Centre now contains Group Technology, Group Hubs, Enterprise Services and Group Property and the Group Centre. The Group operates on a divisional structure with six divisions: Australia, New Zealand, Institutional, Asia Retail & Pacific, Wealth Australia and Technology, Services & Operations and Group Centre.
Other than those described above, there have been no other significant structural change in March 2017 half. However, certain prior period comparatives have been restated to align with current period presentation. The divisions reported below are consistent with internal reporting provided to the chief operating decision maker, being the Chief Executive Officer.
Australia
The Australia division comprises the Retail and Corporate & Commercial Banking (C&CB) business units.
| • | Retail provides products and services to consumer and private banking customers in Australia via the branch network, mortgage specialists, the contact centre and a variety of self-service channels (internet banking, phone banking, ATMs, website and digital banking). |
| • | C&CB provides a full range of banking services including traditional relationship banking and sophisticated financial solutions, including asset financing through dedicated managers focusing on privately owned small, medium and large enterprises as well as the agricultural business segment. |
Institutional
The Institutional division services global institutional and business customers across three product sets: Transaction Banking, Loans & Specialised Finance and Markets.
| • | Transaction Banking provides working capital and liquidity solutions including documentary trade, supply chain financing as well as cash management solutions, deposits, payments and clearing. |
| • | Loans & Specialised Finance provides specialised loan structuring and execution, loan syndication, project and export finance, debt structuring and acquisition finance, structured trade and asset finance, and corporate advisory. |
| • | Markets provide risk management services on foreign exchange, interest rates, credit, commodities, debt capital markets and wealth solutions in addition to managing the Group’s interest rate exposure and liquidity position. |
New Zealand
The New Zealand division comprises the Retail and Commercial business units.
| • | Retail provides a full range of banking and wealth management services to consumer, private banking and small business banking customers. We deliver our services via our internet and app-based digital solutions and network of branches, mortgage specialists, relationship managers and contact centres. |
| • | Commercial provides a full range of banking services including traditional relationship banking and sophisticated financial solutions (including asset financing) through dedicated managers focusing on privately owned medium to large enterprises and the agricultural business segment. |
Wealth Australia
The Wealth Australia division comprises the Insurance and Funds Management business units, which provide insurance, investment and superannuation solutions intended to make it easier for customers to connect with, protect and grow their wealth.
| • | Insurance includes life insurance, general insurance and ANZ Lenders Mortgage Insurance. |
| • | Funds Management includes the Pensions and Investments business and ANZ Share Investing. |
Asia Retail & Pacific
The Asia Retail & Pacific division comprises the Asia Retail and Pacific business units, connecting customers to specialists for their banking needs.
| • | Asia Retail provides general banking and wealth management services to affluent and emerging affluent retail customers across nine Asian countries via relationship managers, branches, contact centres and a variety of self-service digital channels (internet and mobile banking, phone and ATMs). Core products offered include deposits, credit cards, loans, investments and insurance. Subject to regulatory approval, ANZ expects the sale of its Retail and Wealth businesses in Singapore, Hong Kong, China, Taiwan and Indonesia to be completed during 2017 and early 2018. |
| • | Pacific provides products and services to retail customers, small to medium-sized enterprises, institutional customers and Governments located in the Pacific Islands. Products and services include retail products provided to consumers, traditional relationship banking and sophisticated financial solutions provided to business customers through dedicated managers. |
Technology, Services & Operations and Group Centre
TSO and Group Centre provide support to the operating divisions, including technology, group operations, shared services, property, risk management, financial management, strategy, marketing, human resources and corporate affairs. The Group Centre includes Group Treasury, Shareholder Functions and minority investments in Asia.
|
|
119
ASX APPENDIX 4D – CROSS REFERENCE INDEX
| Page | ||
| Details of the reporting period (4D Item 1) | After front cover | |
| Results for Announcement to the Market (4D Item 2) | After front cover | |
| Net Tangible Assets per security (4D Item 3) | 10 | |
| Details of entities over which control has been gained or lost (4D Item 4) | 100 | |
| Dividends and dividend dates (4D Item 5) | After front cover | |
| Dividend Reinvestment Plan (4D Item 6) | After front cover | |
| Details of associates and joint venture entities (4D Item 7) | 100 | |
120
ALPHABETICAL INDEX
| PAGE | ||||
| Appendix 4D Cross Reference Index | 120 | |||
| Appendix 4D Statement | 2 | |||
| Auditor’s Review Report and Independence Declaration | 103 | |||
| Average Balance Sheet and Related Interest | 110 | |||
| Basis of Preparation | 80 | |||
| Capital Management | 106 | |||
| Changes in Composition of the Group | 100 | |||
| Condensed Consolidated Balance Sheet | 77 | |||
| Condensed Consolidated Cash Flow Statement | 78 | |||
| Condensed Consolidated Income Statement | 75 | |||
| Condensed Consolidated Statement of Changes in Equity | 79 | |||
| Condensed Consolidated Statement of Comprehensive Income | 76 | |||
| Contingent Liabilities and Contingent Assets | 100 | |||
| Credit Risk | 93 | |||
| Definitions | 117 | |||
| Deposits and Other Borrowings | 90 | |||
| Derivative Financial Instruments | 116 | |||
| Directors’ Declaration | 102 | |||
| Directors’ Report | 74 | |||
| Dividends | 85 | |||
| Divisional Results | 43 | |||
| Earnings Per Share | 86 | |||
| Exchange Rates | 116 | |||
| Fair Value Measurement | 95 | |||
| Full Time Equivalent Staff | 16 | |||
| Funds Management and Insurance Income Analysis (Group) | 113 | |||
| Group Results | 17 | |||
| Income | 82 | |||
| Income Tax Expense | 84 | |||
| Investments In Associates | 100 | |||
| Net Loans and Advances | 88 | |||
| Operating Expenses | 83 | |||
| Profit Reconciliation | 67 | |||
| Provision for Credit Impairment | 89 | |||
| Related Party Disclosures | 100 | |||
| Segment Analysis | 87 | |||
| Select Geographical Disclosures | 115 | |||
| Share Capital | 99 | |||
| Shareholders’ Equity | 99 | |||
| Subordinated Debt | 92 | |||
| Subsequent Events Since Balance Date | 101 | |||
| Summary | 7 | |||
121
THIS PAGE HAS BEEN LEFT BLANK INTENTIONALLY
122