Attached files
| file | filename |
|---|---|
| 8-K - 8-K - Ally Financial Inc. | dfast8-k2017.htm |
Ally Financial Inc.
Dodd-Frank Act Stress Test 2017
Estimates in the Severely Adverse Scenario
Forward-Looking Statements
The following disclosure contains forward-looking statements within the meaning of the Private Securities Litigation Reform Act of 1995. These statements can be identified by the fact that they do not relate strictly to historical or current facts-such as statements that describe the assumptions in the 2017 stress test or its results. Forward-looking statements often use words such as “believe,” “expect,” “anticipate,” “intend,” “pursue,” “seek,” “continue,” “estimate,” “project,” “outlook,” “forecast,” “potential,” “target,” “objective,” “trend,” “plan,” “goal,” “initiative,” “priorities,” or other words of comparable meaning or future-tense or conditional verbs such as “may,” “will,” “should,” “would,” or “could.” Forward-looking statements convey our expectations, intentions, or forecasts about future events, circumstances, or results. All forward-looking statements, by their nature, are subject to assumptions, risks, and uncertainties, which may change over time and many of which are beyond our control. You should not rely on any forward-looking statement as a prediction or guarantee about the future. Actual future objectives, strategies, plans, prospects, performance, conditions, or results may differ materially from those set forth in any forward-looking statement. Some of the factors that may cause actual results or other future events or circumstances to differ from those in forward-looking statements are described in our Annual Report on Form 10-K for the year ended December 31, 2016, our subsequent Quarterly Reports on Form 10-Q or Current Reports on Form 8-K, or other applicable documents that are filed or furnished with the U.S. Securities and Exchange Commission (collectively, our “SEC filings”). Any forward-looking statement made by us or on our behalf speaks only as of the date that it was made. We do not undertake to update any forward-looking statement to reflect the impact of events, circumstances, or results that arise after the date that the statement was made. You, however, should consult further disclosures (including disclosures of a forward-looking nature) that we may make in any subsequent SEC filings.
It should be noted that, when supplied, the 2017 severely adverse scenario was expressly disclaimed by the Board of Governors of the Federal Reserve System (the "Federal Reserve") as a forecast. Rather, the 2017 severely adverse scenario described a hypothetical scenario that was designed to assess the strength of banking organizations and their resilience to unfavorable economic conditions. Accordingly, the 2017 stress test and its results do not represent or reflect our forecasts or current expectations or plans in connection with future businesses, revenues, expenses, gains, losses, assets, liabilities or capital ratios. The assumptions in the 2017 stress test, moreover, may not reflect our actions, decisions not to act, or other responses if severely adverse economic conditions were to arise.
- 1 - | ||
Overview
As required under the rules published by the Federal Reserve to address the Dodd-Frank Act Stress Test (“DFAST”) requirements, Ally Financial Inc. (“Ally”, or the “Company”) is providing a summary of 2017 company-run stress test results under the Supervisory Severely Adverse (“Severely Adverse”) scenario as prescribed by the Federal Reserve in the Comprehensive Capital Analysis and Review ("CCAR") exercise. The stress test results were submitted to the Federal Reserve on April 5, 2017 and cover a nine-quarter forecast horizon beginning in the first quarter of 2017 and continuing through the first quarter of 2019. The Severely Adverse scenario and the related forecasts of macroeconomic variables were developed by the Federal Reserve to be comparable to the most severe post-war U.S. recessions.
As demonstrated through numerous stress tests over the past several years, Ally’s business model is adequately positioned to withstand the effects of a severely stressed macroeconomic environment. The following summary of projected impacts to profitability, loss rates, and capital position reflects the assumptions and severity of the 2017 scenario developed by the Federal Reserve. It is important to note that this scenario is not a forecast of Ally’s business operations or financial condition, but rather a hypothetical scenario designed to assess the strength of Ally and its resilience to severely adverse economic conditions should they occur. The results suggest that Ally’s performance would deteriorate in the Severely Adverse scenario due to increased provision for credit losses, reduced business volumes, net interest margin compression, and market and operational risk related losses. However, Ally would continue to meet all contractual obligations to creditors, counterparties, and bondholders and would exceed all regulatory capital requirements.
Stress Testing Methodologies
Ally’s process for stress testing and assessing capital adequacy leverages a robust enterprise risk management infrastructure that seeks to identify and measure all material risks arising from exposures and business activities. When conducting comprehensive enterprise-wide stress tests, all of Ally’s material risk exposures are considered and evaluated. Ally’s material risks are credit, vehicle residual value, insurance/underwriting, market, liquidity, business/strategic, reputational, and operational.
Stress testing is an integral component of Ally’s risk, capital, liquidity, product, and customer management strategies. Stress tests are used to provide insight into how risk exposures and capital sources and uses, might be affected by severe, yet plausible, stress scenarios. Stress tests are conducted using a combination of quantitative approaches, internal and external data sources, analytical tools, and management judgment. Models and spreadsheets, whether internally or vendor developed, are subject to a validation or an annual review by Ally’s model and spreadsheet risk management function. Variance and sensitivity analyses, as well as trend reporting and benchmarking techniques, are used to challenge stress test results at various levels of the Company. Throughout the stress testing process, numerous reviews are conducted by working groups, business unit management, senior executives, and various
- 2 - | ||
councils and committees. In addition, DFAST/CCAR results are reviewed and approved by Ally's Board of Directors.
The following provides a brief description of the methodologies used in stress testing to translate Ally’s material risks into financial impacts over the nine-quarter horizon.
Balance Sheet
Ally’s current and projected earning asset portfolio is primarily composed of U.S. auto-related assets. The auto portfolio includes consumer lending products (retail loans and leases) as well as dealer financing products (primarily floorplan financing). Asset balances are projected based on Ally's expectation of new origination volumes and existing asset amortization under the stress scenario. Given the relatively short duration of Ally's auto finance products (approximately 2.5 years for retail loans and less than 100 days for floorplan loans), existing assets amortize significantly over the stress horizon. Therefore, the size of Ally’s balance sheet over the nine-quarter stress period is largely dependent on the assumptions for new and used auto originations. Key assumptions for originations include new and used industry light vehicle sales, market share of certain manufacturers, and Ally’s financing penetration rates. A statistical modeling approach is used to project industry light vehicle sales while historical experience and management judgment factor into projections for other business assumptions. Similar to the asset portfolio, liability balances are developed using a mix of models, historical experience, and management judgment.
Pre-Provision Net Revenue ("PPNR")
PPNR measures net revenues from the asset portfolio and is composed of net interest income, non-interest income, and non-interest expense. These components are further segmented and, as a result, various processes and methodologies are used to produce projections over the stress test horizon. Since PPNR is a comprehensive reporting item, it incorporates stress impacts from many of Ally’s material risks, including vehicle residual value, insurance/underwriting, market, liquidity, business/strategic, reputational, and operational.
• | Net Interest Income (“NII”): Net interest income for Ally is significantly influenced by the size, product mix, and credit mix of the earning asset portfolio and the net interest margin on those assets. A quantitative model that utilizes inputs such as balance projections, earning asset yields, interest rates, and credit spreads is used to project NII. The methodology used to develop balance projections was described previously while other key assumptions are developed using a mix of quantitative models, historical experience, and management judgment. While rental income, gains/losses on disposal, and depreciation expense for operating leases are reported within NII in Ally’s financial statements (filed with the SEC), these same items are reported within non-interest income and non-interest expense for the purposes of DFAST per regulatory PPNR reporting requirements. |
- 3 - | ||
• | Non-Interest Income: Ally’s non-interest income largely consists of insurance premiums, operating lease revenue, servicing fees, and gains/losses on the disposal of operating lease assets. Similar to NII projections, revenues from insurance premiums and operating leases are dependent on the size of the earning asset portfolio, as well as the margin on those assets. Servicing fees are impacted by the size of the servicing portfolio, SmartAuction activity, and late charges. Ally’s recognized gains/losses on the disposal of operating leases are generally a function of the remaining cost basis (net of accumulated depreciation) of the lease at the time of termination and the sales proceeds received from remarketing the vehicle. Ally models the future expected value of off-lease vehicles (residual value) using key inputs such as U.S. Gross Domestic Product, unemployment rate, gasoline prices, and used vehicle supply and demand forecasts. |
• | Non-Interest Expense: Non-interest expense includes depreciation expense on operating leases, expenses associated with the insurance business, compensation and benefits expense, operational risk expense (e.g., fraud, legal, compliance, information technology), and various other administrative expenses such as expenses associated with deposit operations. Depreciation expense on operating leases is projected using the current depreciation rates on the existing lease portfolio, while depreciation rates for new leases assumed to be originated during the stress test horizon are set based on the projection of vehicle residual values, also used in projecting the gain/loss on disposal of operating leases. Expenses associated with the insurance business include sales commissions and provisions for claims losses, which naturally decline as new vehicle sales volumes, and thereby new insurance contracts, decline in the recessionary environment. Projections of compensation and benefits expense, information technology costs, and certain marketing expenses are closely aligned with the projected level of business activity and the severity of the recession. However, other non-interest expense projections generally reflect a conservative bias as no management actions are assumed in the Severely Adverse scenario that would materially reduce expenses to coincide with declining business activity. In addition to routine business driven expenses, consideration is also given to operational risk and other losses that may arise in the stress environment. Given the broad scope of operational risk and limited and varied data, Ally uses a non-modeled approach for estimating a conservative level of operational risk losses in a given scenario. The non-modeled approach includes the use of Ally’s own historical experience (inclusive of losses from discontinued operations), operational risk scenario analysis, and management judgment. |
Losses and Provision for Loan Losses
Credit risk associated with the consumer and commercial loan portfolios manifests itself in the provision for loan losses. The amount of the provision reflects the projected charge-offs for each portfolio under the given scenario while preserving an appropriate allowance for loan losses to ensure adequate coverage at the end of each period.
- 4 - | ||
Ally’s loan loss estimation tools are developed using modeling approaches that incorporate macroeconomic variables and are deemed appropriate for stress testing purposes. Generally, the loan loss models have the following characteristics:
• | Are statistically-driven (e.g., regression-based); |
• | Are product specific; |
• | Incorporate portfolio characteristics as well as macroeconomic factors; and |
• | Follow a frequency and severity framework incorporating quantitative measures of probability of default (“PD”) and loss given default (“LGD”) |
Gains / Losses on Securities Portfolio
Ally’s investment portfolio is subject to market risk. Models are used to project changes in market values due to changes in equity prices, interest rates, credit spreads, and volatility. A credit rating migration analysis is also performed to identify potential other-than-temporary impairments (“OTTI”) in the investment securities portfolio. Different segments of the portfolio are modeled separately while each security in the portfolio is incorporated into the analysis.
Capital
The various balance sheet, revenue, and loss estimates as outlined above are combined to generate full balance sheet and income statement projections. These financial statements serve as the basis for the calculation of capital and risk-weighted assets (“RWAs”) that are used to derive pro forma quarterly capital ratios. Ally has calculated capital ratios under the Basel III Standardized Approach, reflective of appropriate transition provisions. The resulting pro forma regulatory capital ratios are evaluated against management’s real-time operating targets and post-stress capital goals (minimums), which are essential inputs into Ally’s continuous capital adequacy assessment and associated governance.
Ally Summary Results
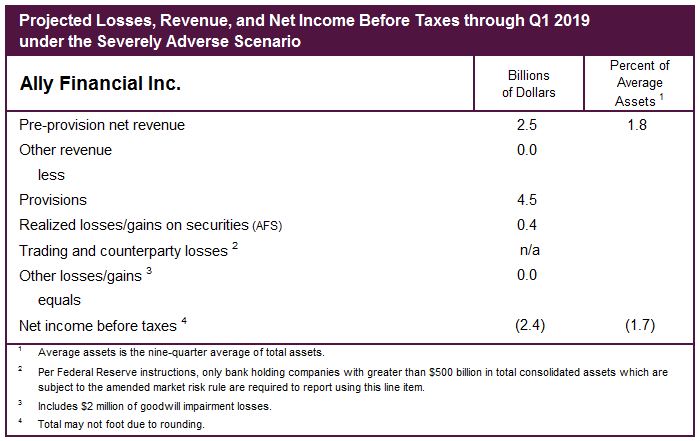
In the Severely Adverse scenario, Ally’s stress results show an approximately $2.4 billion pre-tax net loss over the nine-quarter horizon. A decline in NII resulted primarily from a significant reduction in earning asset balances over the stress test horizon. Given the severity of the economic scenario, the expectation is that light vehicle sales would decline, thereby reducing future industry revenue opportunities from retail and lease originations as well as from dealer floorplan financing. A decline in industry light vehicle sales coinciding with reduced consumer demand in a severe macroeconomic recession is supported by historical experience. Consistent with declines in industry light vehicle sales experienced during past recessions, the size of Ally’s balance sheet trends lower in the Severely Adverse scenario as fewer vehicles are sold and, therefore, less financing is needed. This decline in industry sales also negatively impacts revenue from the insurance business. The provision for loan losses and related allowances increase in the Severely Adverse scenario to keep pace with the expected rise in
- 5 - | ||
credit losses, despite a significantly smaller balance sheet over the nine-quarter stress test horizon. Realized gains/losses on securities reflect sharp declines in the equity and bond markets.
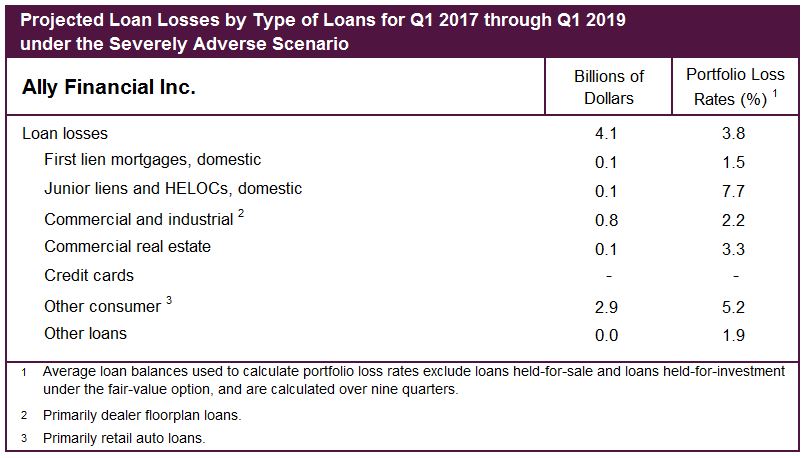
Projected credit losses total $4.1 billion with a weighted average loss rate of 3.8% for the total loan portfolio over the nine-quarter horizon. It is important to note that the loss rates are not annualized, but rather reflect a nine-quarter cumulative loss rate. Ally’s largest loan portfolios, retail auto loans and dealer floorplan financing, have historically experienced low loss rates. Ally’s projected loss rates in the stress test are consistent with those experienced during the most recent economic recession and, in some cases are significantly more conservative.
Ally’s balance sheet is mainly composed of high-quality, short duration auto assets (approximately 2.5 years for retail loans and less than 100 days for floorplan loans) enabling the Company to withstand severe stress events and exceed regulatory capital requirements throughout the stress test horizon. In prior recessions, Ally’s auto loan origination volume and asset balances have declined in line with the directional trend of new and used industry light vehicle sales. Consistent with historical experience,
- 6 - | ||
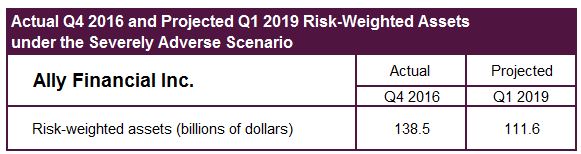
Ally projected a decline in industry light vehicle sales that led to reduced loan volume and a smaller balance sheet over time in the Severely Adverse scenario. This is reflected in the reduction in risk-weighted assets from $138.5 billion as of Q4 2016 to $111.6 billion at the end of Q1 2019.
In accordance with DFAST regulatory guidance, capital actions completed in the first quarter of the stress test horizon (Q1 2017) are included in the projection of pro forma capital ratios. For the remainder of the horizon, the Federal Reserve prescribes a standardized set of capital actions that, among other things, does not permit the redemption or repurchase of any capital instrument that is eligible for inclusion in the numerator of a regulatory capital ratio (e.g., the repurchase of common stock). Ally has included these assumptions in all capital projections, consistent with regulatory guidance. Ally also assumes all contractual payments are made for existing trust preferred and subordinated debt securities.
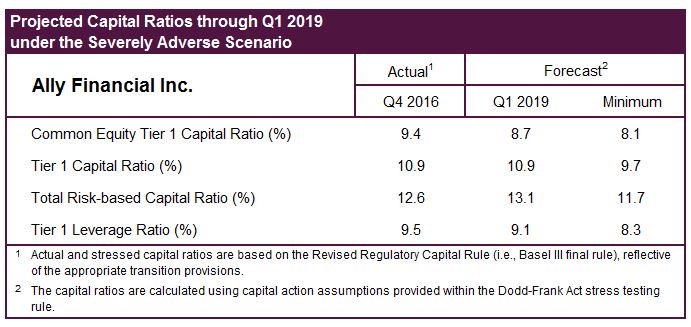
Ally’s capital levels are significantly reduced through the horizon, primarily driven by the $2.4 billion pre-tax net loss projected in the Severely Adverse scenario. The impact to Ally's capital ratios is mostly offset by a meaningful decline in risk-weighted assets, which provides significant conservation of capital. Ally’s Common Equity Tier 1 ratio of 9.4% as of Q4 2016 declines modestly to 8.7% by the end of the planning horizon. All capital ratios exceed regulatory minimums throughout the horizon. The following table summarizes Ally's Q4 2016 actual capital ratios in addition to the low point and end point under the Severely Adverse scenario.
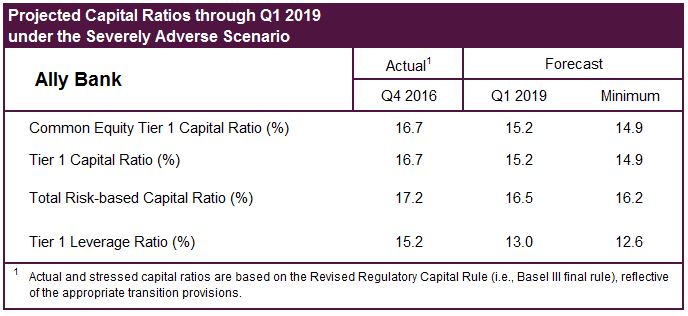
Ally Bank accounts for over 75% of Ally's overall assets. Accordingly, Ally Bank’s results in the Severely Adverse scenario reflect many of the same themes that drive Ally Financial’s stress results. Specifically, the forecasted decline in light vehicle sales drives balance sheet contraction, which helps to offset the impact of reduced NII and increased losses. The following table summarizes Ally
- 7 - | ||
Bank's Q4 2016 actual capital ratios in addition to the low point and end point under the Severely Adverse scenario.
- 8 - | ||