Attached files
| file | filename |
|---|---|
| 8-K - ANNALY CAPITAL MANAGEMENT, INC. 8-K - ANNALY CAPITAL MANAGEMENT INC | a51578722.htm |
Exhibit 99.1

June 22, 2017 The JMP Securities Financial Services & Real Estate Conference
This presentation, other written or oral communications, and our public documents to which we refer contain or incorporate by reference certain forward-looking statements which are based on various assumptions (some of which are beyond our control) and may be identified by reference to a future period or periods or by the use of forward-looking terminology, such as “may,” “will,” “believe,” “expect,” “anticipate,” “continue,” or similar terms or variations on those terms or the negative of those terms. Actual results could differ materially from those set forth in forward looking statements due to a variety of factors, including, but not limited to, changes in interest rates; changes in the yield curve; changes in prepayment rates; the availability of mortgage-backed securities and other securities for purchase; the availability of financing and, if available, the terms of any financings; changes in the market value of our assets; changes in business conditions and the general economy; our ability to grow our commercial business; our ability to grow our residential mortgage credit business; credit risks related to our investments in credit risk transfer securities, residential mortgage-backed securities and related residential mortgage credit assets, commercial real estate assets and corporate debt; risks related to investments in mortgage servicing rights and ownership of a servicer; our ability to consummate any contemplated investment opportunities; changes in government regulations affecting our business; our ability to maintain our qualification as a REIT for U.S. federal income tax purposes; and our ability to maintain our exemption from registration under the Investment Company Act of 1940, as amended. For a discussion of the risks and uncertainties which could cause actual results to differ from those contained in the forward-looking statements, see “Risk Factors” in our most recent Annual Report on Form 10-K and any subsequent Quarterly Reports on Form 10-Q. We do not undertake, and specifically disclaim any obligation, to publicly release the result of any revisions which may be made to any forward-looking statements to reflect the occurrence of anticipated or unanticipated events or circumstances after the date of such statements, except as required by law. Safe Harbor Notice 2

Overview

Source: Bloomberg and Company filings. Market data as of June 19, 2017. Financial data as of March 31, 2017. Note: mREIT peers represented by Bloomberg mREIT Index (“BBREMTG”) unless otherwise noted. Agency peers include AGNC, CYS, CMO, ANH and ARR. Represents Annaly Capital Management, Inc.’s (“Annaly” or “NLY”) average operating expense as a percentage of average assets compared to the BBREMTG from 2012 to Q1 2017 annualized. Analysis includes companies in BBREMTG with market capitalization above $200mm as of December 31 of each respective year and as of March 31, 2017 for 2017. Outperformance, Size, Diversification, Efficiency, Ownership and Culture Market Leadership Market Leading Performance Total Return of ~81% Since 2014, Nearly Twice the Return of the S&P 500 and 25% Better than mREIT Peers Operating Efficiency Diversification Strategy Operating at 65% Lower Expense vs. mREIT Peers(1) Size and Liquidity Employee Stock Ownership Guidelines 18x the Market Cap of the Median mREIT; ~20% Less Leverage than Agency Peers Over 40% of Employees Have Been Asked to Purchase Annaly Stock Durability and Financing Optionality Consolidator Enhanced Book Value Protection through Diversification, Hedging, and Financing Options Diversification Four Complementary Investment Groups – Cyclical and Countercyclical Annaly Investment Thesis Dividend Stability 15 Consecutive Quarters of Stable Dividends Declared Longevity, Growth and Evolution Annaly is an Industry Leading, Diversified Capital Manager Completed the Largest Industry Acquisition Ever 4

Source: Bloomberg, Company filings. Financial data as of March 31, 2017. Market data as of June 19, 2017.Agency assets include to be announced (“TBA”) purchase contracts (market value) and mortgage servicing rights (“MSRs”). Commercial Real Estate (“CRE”) assets are exclusive of consolidated variable interest entities (“VIEs”) associated with B-Piece commercial mortgage-backed securities.Dedicated capital excludes TBA purchase contracts (market value), non-portfolio related activity and varies from total stockholders’ equity.Sector rank compares Annaly dedicated capital in each of its four investment groups at March 31, 2017 (adjusted for P/B as of June 19, 2017) to the market capitalization of the companies in each respective sector as of June 19, 2017. Comparative sectors used for Agency, CRE, Residential Credit ranking are their respective sector within the BBREMTG. The comparative sector used for the MML ranking is the S&P BDC Index. Annaly is a Leading Diversified Capital Manager Agency The Annaly Agency Group invests in Agency Mortgage-Backed Securities (MBS) Residential Credit The Annaly Residential Credit Group invests in non-Agency residential mortgage assets within securitized products and whole loan markets Commercial Real Estate (CRE) The Annaly Commercial Real Estate Group (“ACREG”) originates and invests in commercial mortgage loans, securities, and other commercial real estate debt and equity investments Middle Market Lending (MML) The Annaly Middle Market Lending Group (“AMML”) provides financing to private equity backed middle market businesses across the respective capital structures 5 $83.8bn Assets(1)|$9.4bn Capital(2) $2.8bn Assets|$1.1bn Capital(2) $2.1bn Assets(1)|$1.0bn Capital(2) $0.8bn Assets|$0.6bn Capital(2) Sector Rank(3)#1/6 Sector Rank(3)#8/18 Sector Rank(3)#4/11 Sector Rank(3)#14/41 Countercyclical/Defensive Cyclical/Growth Cyclical/Growth Countercyclical/Defensive
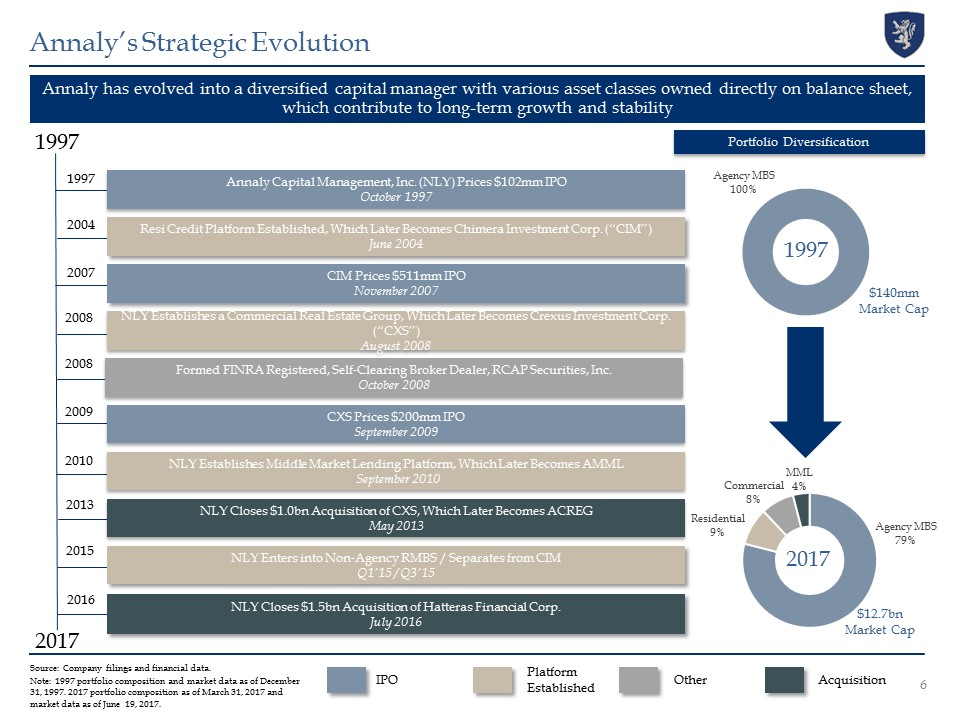
6 Annaly has evolved into a diversified capital manager with various asset classes owned directly on balance sheet, which contribute to long-term growth and stability Source: Company filings and financial data. Note: 1997 portfolio composition and market data as of December 31, 1997. 2017 portfolio composition as of March 31, 2017 and market data as of June 19, 2017. Annaly’s Strategic Evolution 2017 1997 IPO Platform Established Other Acquisition Portfolio Diversification $12.7bn Market Cap $140mm Market Cap 1997 1997 2004 2007 2008 2008 2009 2010 2013 2015 2016 2017 Annaly Capital Management, Inc. (NLY) Prices $102mm IPO October 1997 Resi Credit Platform Established, Which Later Becomes Chimera Investment Corp. (“CIM”)June 2004 CIM Prices $511mm IPO November 2007 NLY Establishes a Commercial Real Estate Group, Which Later Becomes Crexus Investment Corp. (“CXS”)August 2008 CXS Prices $200mm IPOSeptember 2009 Formed FINRA Registered, Self-Clearing Broker Dealer, RCAP Securities, Inc.October 2008 NLY Establishes Middle Market Lending Platform, Which Later Becomes AMML September 2010 NLY Closes $1.0bn Acquisition of CXS, Which Later Becomes ACREGMay 2013 NLY Closes $1.5bn Acquisition of Hatteras Financial Corp.July 2016 NLY Enters into Non-Agency RMBS / Separates from CIMQ1’15 / Q3’15
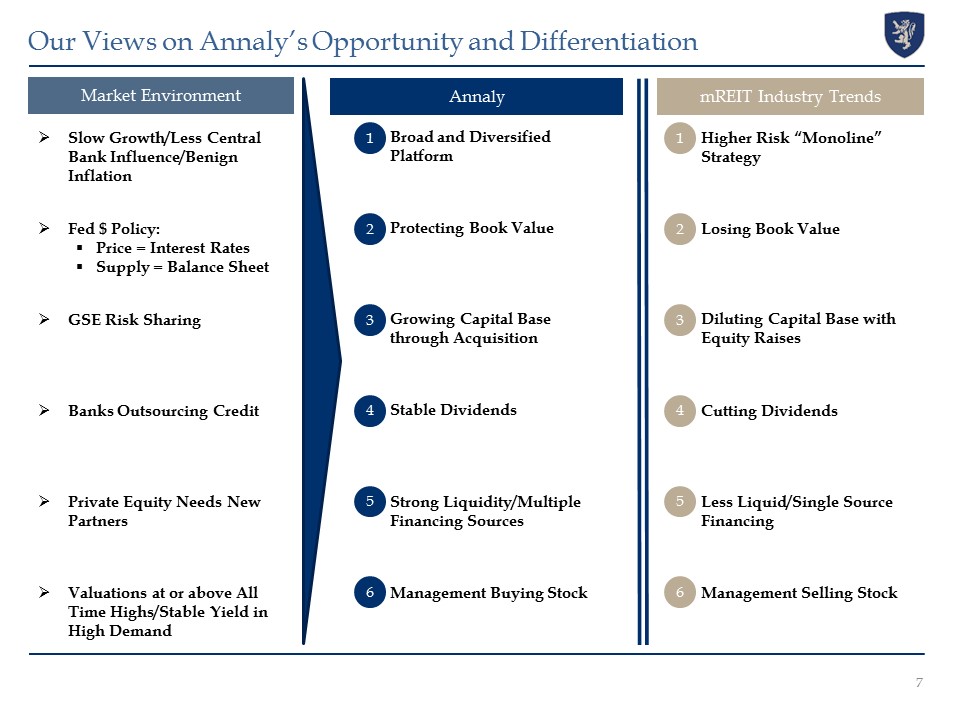
Market Environment 7 Our Views on Annaly’s Opportunity and Differentiation Annaly mREIT Industry Trends 1 1 2 2 3 3 4 4 5 5 6 6 Slow Growth/Less Central Bank Influence/Benign Inflation Fed $ Policy:Price = Interest RatesSupply = Balance Sheet GSE Risk Sharing Banks Outsourcing Credit Valuations at or above All Time Highs/Stable Yield in High Demand Private Equity Needs New Partners Broad and Diversified Platform Protecting Book Value Growing Capital Base through Acquisition Stable Dividends Management Buying Stock Strong Liquidity/Multiple Financing Sources Higher Risk “Monoline” Strategy Losing Book Value Diluting Capital Base with Equity Raises Cutting Dividends Management Selling Stock Less Liquid/Single Source Financing
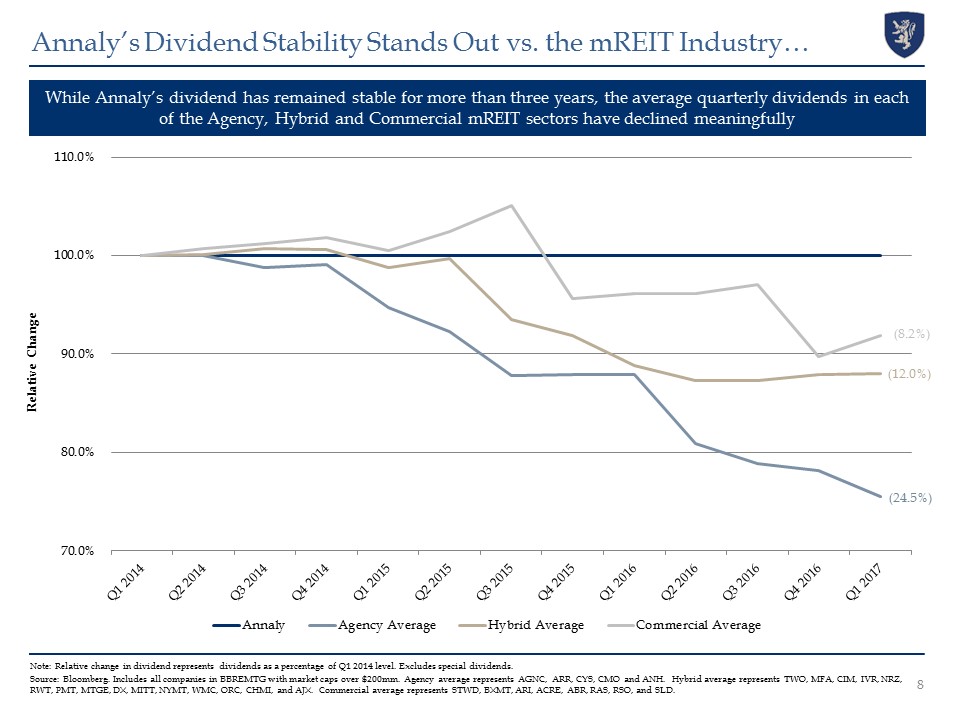
Annaly’s Dividend Stability Stands Out vs. the mREIT Industry… Note: Relative change in dividend represents dividends as a percentage of Q1 2014 level. Excludes special dividends.Source: Bloomberg. Includes all companies in BBREMTG with market caps over $200mm. Agency average represents AGNC, ARR, CYS, CMO and ANH. Hybrid average represents TWO, MFA, CIM, IVR, NRZ, RWT, PMT, MTGE, DX, MITT, NYMT, WMC, ORC, CHMI, and AJX. Commercial average represents STWD, BXMT, ARI, ACRE, ABR, RAS, RSO, and SLD. \\nyprodfs02\fidac\Capital Markets\Marketing\Internal\Board Mtg\NLY\2016.09 Dividend\Excel\ While Annaly’s dividend has remained stable for more than three years, the average quarterly dividends in each of the Agency, Hybrid and Commercial mREIT sectors have declined meaningfully Relative Change (24.5%) (8.2%) (12.0%) 8

…and vs. Other Equity Yield Investments Source: Bloomberg, Company filings. Market data as of June 19, 2017. Dividend declarations shown from December 31, 2013 to March 31, 2017. Note: mREIT sectors include companies that are currently in the BBREMTG as of June 19, 2017 with market caps over $200mm. Equity REITs represent BBREIT Index. Utilities represent the Russell 3000 Utilities Index. MLPs represent the Alerian MLP Index. Asset Managers represent the S&P 500 Asset Management and Custody Bank Index. Banks represent the KBW Bank Index. In a universe of yield manufacturers, Annaly has maintained superior dividend stability % of Companies to Cut Dividend Dividend Yield Aggregate # of Cuts 0 23 6 17 182 50 4 12 100 9
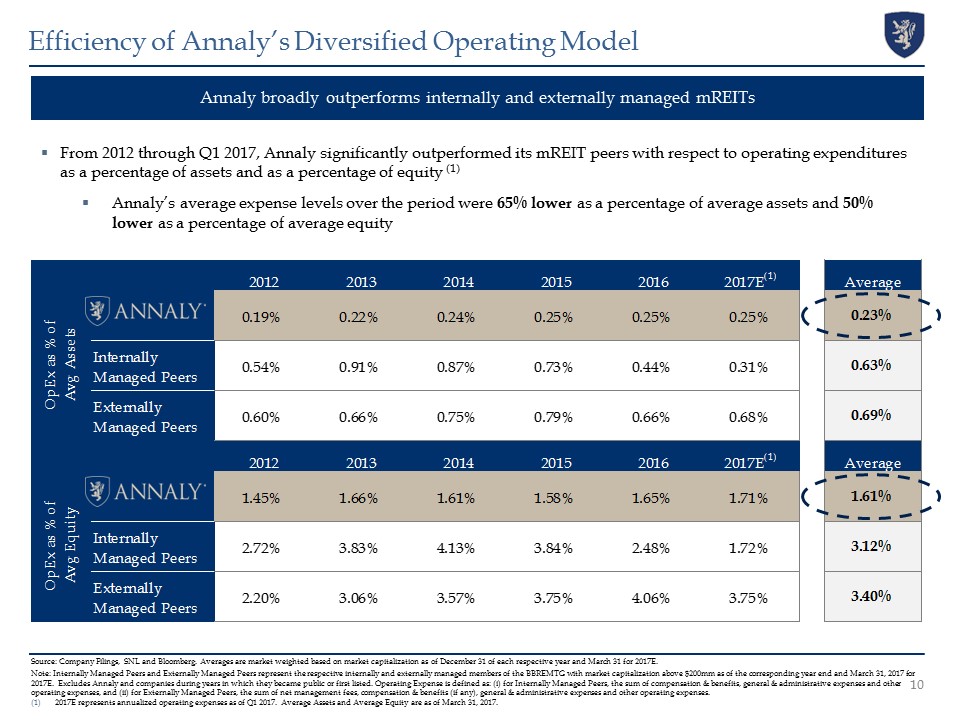
Annaly broadly outperforms internally and externally managed mREITs From 2012 through Q1 2017, Annaly significantly outperformed its mREIT peers with respect to operating expenditures as a percentage of assets and as a percentage of equity (1)Annaly’s average expense levels over the period were 65% lower as a percentage of average assets and 50% lower as a percentage of average equity Efficiency of Annaly’s Diversified Operating Model Source: Company Filings, SNL and Bloomberg. Averages are market weighted based on market capitalization as of December 31 of each respective year and March 31 for 2017E.Note: Internally Managed Peers and Externally Managed Peers represent the respective internally and externally managed members of the BBREMTG with market capitalization above $200mm as of the corresponding year end and March 31, 2017 for 2017E. Excludes Annaly and companies during years in which they became public or first listed. Operating Expense is defined as: (i) for Internally Managed Peers, the sum of compensation & benefits, general & administrative expenses and other operating expenses, and (ii) for Externally Managed Peers, the sum of net management fees, compensation & benefits (if any), general & administrative expenses and other operating expenses.2017E represents annualized operating expenses as of Q1 2017. Average Assets and Average Equity are as of March 31, 2017. 10

Source: Bloomberg. mREITs represent the BBREMTG. Equity REITs represent BBREIT Index. Utilities represent the Russell 3000 Utilities Index. MLPs represent the Alerian MLP Index. Asset Managers represent the S&P 500 Asset Management and Custody Bank Index. Banks represent the KBW Bank Index. S&P represents SPX Index.Note: Market data from December 31, 2013 to June 19, 2017. Annaly Has Outperformed the S&P and Other Equity Yield Investments Annaly’s current investment team has outperformed other yield options since 2014 11

3 Major Questions Have Been Answered

Source: Bloomberg. Market data as of June 19, 2017. Annaly has outperformed as market “paranoia” eases over Fed policy Increased Visibility of Fed Policy Dates 1st Hike12/16/15 - 12/13/16 2nd Hike12/14/16 - 3/14/17 3rd Hike3/15/17 – 6/13/17 4th Hike6/14/17 – 6/19/17 Total Hiking Cycle12/16/15 - 6/19/17 Fed Funds Rate 0.25 - 0.50% 0.50 - 0.75% 0.75 - 1.00% 1.00 - 1.25% 0.25 – 1.25% NLY Total Return 26% 9% 16% 3% 62% S&P Total Return 14% 5% 4% 1% 22% Mid Point of Target Rate Indexed Change in Closing Price 13 1
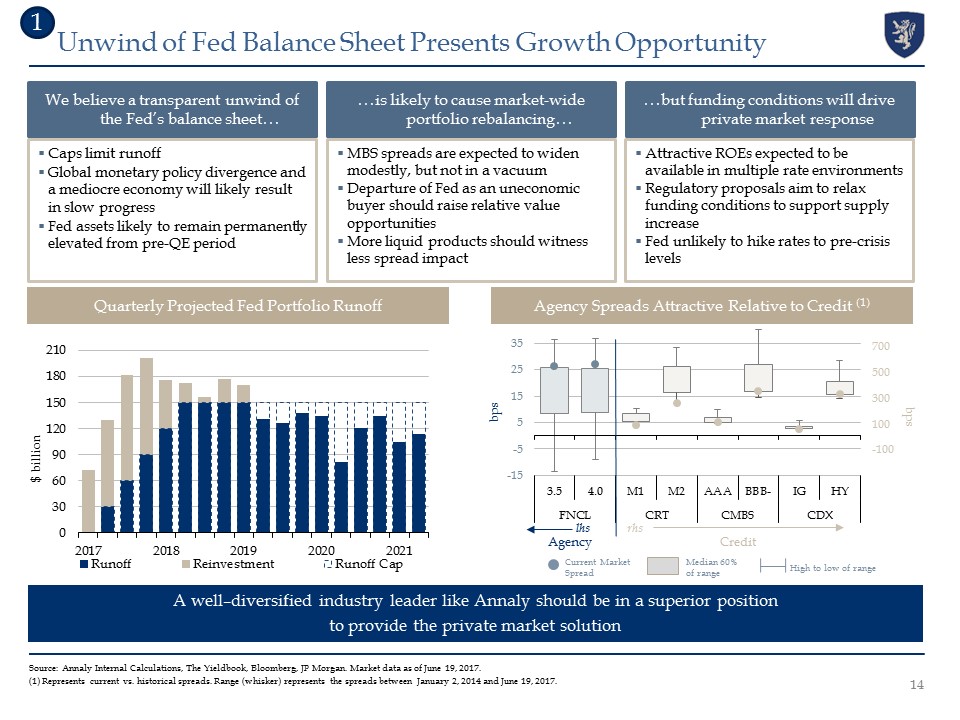
Caps limit runoffGlobal monetary policy divergence and a mediocre economy will likely result in slow progressFed assets likely to remain permanently elevated from pre-QE period We believe a transparent unwind of the Fed’s balance sheet… Attractive ROEs expected to be available in multiple rate environmentsRegulatory proposals aim to relax funding conditions to support supply increaseFed unlikely to hike rates to pre-crisis levels …but funding conditions will drive private market response MBS spreads are expected to widen modestly, but not in a vacuumDeparture of Fed as an uneconomic buyer should raise relative value opportunitiesMore liquid products should witness less spread impact …is likely to cause market-wide portfolio rebalancing… Source: Annaly Internal Calculations, The Yieldbook, Bloomberg, JP Morgan. Market data as of June 19, 2017. (1) Represents current vs. historical spreads. Range (whisker) represents the spreads between January 2, 2014 and June 19, 2017. Unwind of Fed Balance Sheet Presents Growth Opportunity A well–diversified industry leader like Annaly should be in a superior position to provide the private market solution Quarterly Projected Fed Portfolio Runoff 1 14 Agency Credit bps bps Current Market Spread Median 60% of range High to low of range Agency Spreads Attractive Relative to Credit (1)
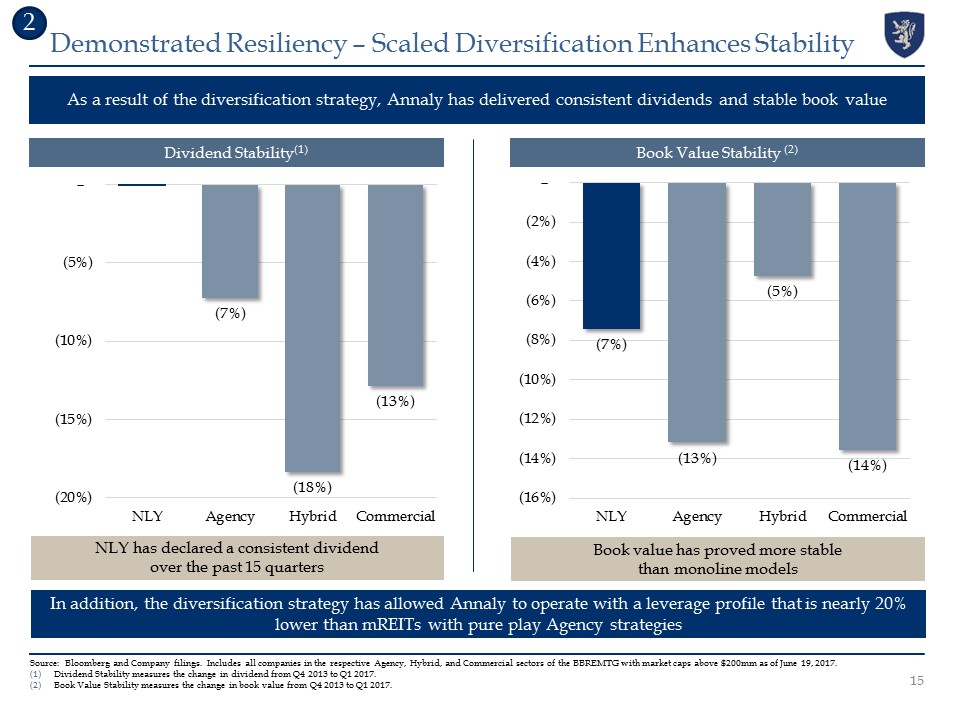
Source: Bloomberg and Company filings. Includes all companies in the respective Agency, Hybrid, and Commercial sectors of the BBREMTG with market caps above $200mm as of June 19, 2017.Dividend Stability measures the change in dividend from Q4 2013 to Q1 2017.Book Value Stability measures the change in book value from Q4 2013 to Q1 2017. Demonstrated Resiliency – Scaled Diversification Enhances Stability As a result of the diversification strategy, Annaly has delivered consistent dividends and stable book value Dividend Stability(1) Book Value Stability (2) In addition, the diversification strategy has allowed Annaly to operate with a leverage profile that is nearly 20% lower than mREITs with pure play Agency strategies NLY has declared a consistent dividend over the past 15 quarters Book value has proved more stable than monoline models 15 2

~20% fewer mortgage REITs with over ~$14 billion higher industry market capitalization Source: Market data per Bloomberg as of June 19, 2017. Note: Hatteras refers to Hatteras Financial Corp. Analysis compares companies in the BBREMTG as of June 19, 2017 to the same list of companies as of April 8, 2016 (trading day prior to Hatteras acquisition announcement). Outline denotes market cap gain from April 8, 2016 to June 19, 2017. Removed companies represent those that have been acquired or removed from the index. Total number of mREITs in BBREMTG decreased to 33 from 40Annaly represents ~20% of total mREIT market cap Since the acquisition of Hatteras, Annaly’s market capitalization has increased by over $3.0bnDuring the same time period, the total number of mREITs in the industry decreased to 33 from 40Annaly’s market capitalization is greater than the sum of the 22 smallest mREITs combined NRF CLNY HTS IMH BMNM ORGN VRTB NLY AGNC STWD TWO MFA CIM BXMT IVR CMO MTGE ANH WMC MITT RAS ORC AJX ORM SLD EARN CHMI NRZ CYS ARI RWT PMT ARR STAR NYMT AMTG RSO ABR ACRE DX OAKS LOAN Shifting Industry Landscape since Announcement Acquisition of Hatteras 3 16
Annaly’s Outperformance

Annaly vs. Other Yield Sectors – Total Return On a short-term and long-term basis, Annaly has continued to outperform the mREIT industry as well as the broader market and other yield oriented investment options Source: Bloomberg. Market data as of June 19, 2017.Note: mREITs represent BBREMTG. S&P represents the SPX Index. Asset Managers represent the S&P 500 Asset Management and Custody Bank Index. MLPs represent the Alerian MLP Index. Utilities represent the Russell 3000 Utilities Index. Banks represent the KBW Bank Index. 18

Source: Bloomberg and Company Filings. Market cap and total return data as of June 19, 2017.Note: Dividend data as of quarter ended March 31, 2017. Rank based on dividends paid over the last 5 years. Number of employees is based on Bloomberg data as of June 19, 2017, except for Annaly which is based on internal data as of June 19, 2017. (1) Analysis of top 15 dividend paying financial companies from 2012 to Q1 2017 by the largest 15 companies in each of the S&P Financials Index, BBREMTG, and US REIT list per Bloomberg (each by market cap). Excludes companies with less than $1bn in dividends paid for 2016. Annaly is a Market Leading Yield Manufacturer 19 Of the top 15 dividend paying financial companies (1), Annaly has generated the highest total return in 2017 YTD

20 In addition to producing superior book value and dividend stability, Annaly’s management team has significantly increased ownership in the Company, tying decisions to performance and shareholder value Annaly Stability and Management Ownership vs. mREIT Industry Hybrid Commercial Agency Source: SNL Financial, Bloomberg, Company Filings.Note: Data shown from December 31, 2013 to March 31, 2017. Includes all companies in the respective Agency, Hybrid, and Commercial sectors of the BBREMTG with market caps above $200mm as of June 19, 2017.CEO sales include sales by former and current CEOs over the relevant time period. Resiliency Ownership (1)

Source: FactSet data as of March 31, 2017 filings. ‘Top 30 Shareholders’ denotes Top 30 NLY shareholders as of March 31, 2017. 27 of the Top 30 NLY shareholders initiated positions prior to or during Q4’13, while the remaining 3 have initiated positions in NLY since that time.Institutional ownership percentage represents the total NLY shares owned by institutional investors divided by NLY shares outstanding as of quarter end for each respective period. Annaly’s Outperformance Supported by Growth in Institutional Sponsorship 21 Annaly’s institutional shareholder base has increased in size and breadth as the company has continued to outperform as well as engage in a comprehensive marketing campaign Institutional ownership has increased by over 20% with over 300 new shareholders since Q4’13During this time, the Top 30 Shareholders have increased their share ownership by 95% (1)Within the institutional shareholder base, the number of international shareholders has increased by ~15% since Q4’13 Institutional Ownership (%) (2) 48% 53% 57% 56% 58% (1)

Re-Evaluation of Valuation

Annaly vs. Other Yield Sectors – Relative Valuation Source: Bloomberg. mREITs represent BBREMTG. Banks represent the KBW Bank Index. Utilities represent the Russell 3000 Utilities Index. S&P represent the SPX Index. Asset Managers represent the S&P 500 Asset Management and Custody Bank Index. MLPs represent the Alerian MLP Index. Note: Market Data as of June 19, 2017. Financial data as of Q1 2017.Total Return represents the total return for the period beginning December 31, 2013 to June 19, 2017. Annaly’s performance and yield profiles are superior to other yield asset classes, yet valuation still lags the other yield sectors 23 Total Return (1) Price to Book Yield

We believe there is a lack of meaningful valuation differentiation among mREITs… …despite differentiation betweenvalue drivers Current Valuation Approach IncludesPrice to Book MultiplesDividend Yields ExcludesUnique Investment ChannelsDiversificationRelative RiskCost of CapitalPerformance & Track RecordFranchise Value … resulting from limited approaches to valuing mREITs… Source: Bloomberg. Market data as of June 19, 2017.Note: mREITs represent companies in BBREMTG with market capitalization above $200mm as of March 31, 2017. 24 As valuations converge in the mREIT sector, it becomes an opportune time to reexamine valuation methodologies Annaly Valuation | Methodology Review Factors That Impact Relative ValueAlphaStability of Total Return (Book Value + Dividends)Margins & Operating EfficiencyDiversification & ScalabilityMarket BetaAvailability of Funding & LiquidityIndustry Relative Value to Other SectorsIndustry Leadership Premium A New Approach
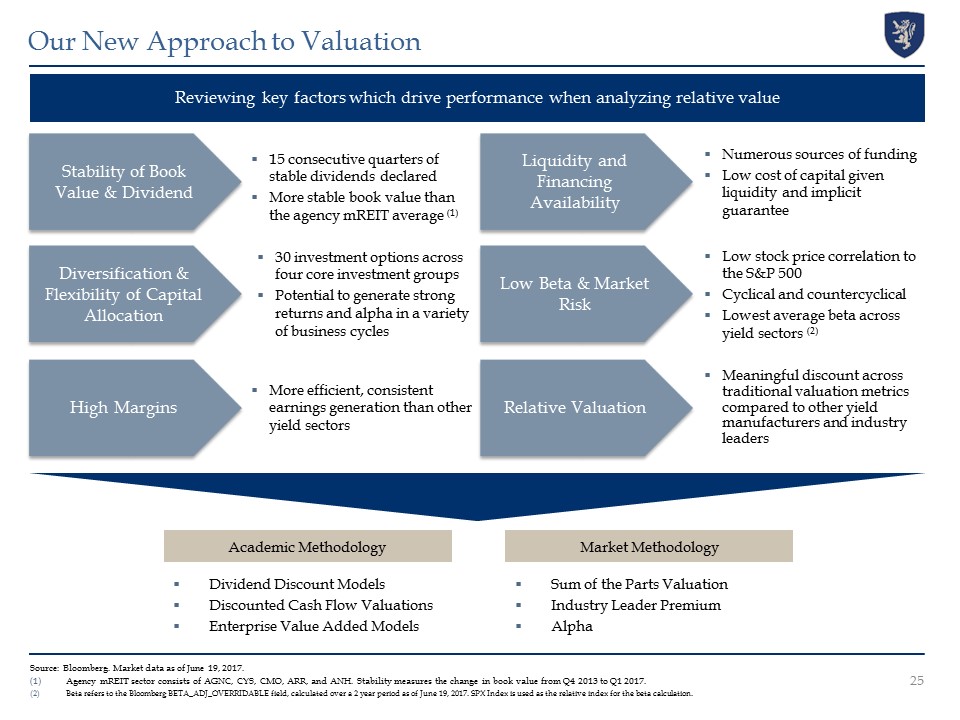
Source: Bloomberg. Market data as of June 19, 2017. Agency mREIT sector consists of AGNC, CYS, CMO, ARR, and ANH. Stability measures the change in book value from Q4 2013 to Q1 2017.Beta refers to the Bloomberg BETA_ADJ_OVERRIDABLE field, calculated over a 2 year period as of June 19, 2017. SPX Index is used as the relative index for the beta calculation. 25 Reviewing key factors which drive performance when analyzing relative value Our New Approach to Valuation Stability of Book Value & Dividend Diversification & Flexibility of Capital Allocation High Margins Relative Valuation Liquidity and Financing Availability Low Beta & Market Risk Numerous sources of fundingLow cost of capital given liquidity and implicit guarantee 15 consecutive quarters of stable dividends declaredMore stable book value than the agency mREIT average (1) Low stock price correlation to the S&P 500Cyclical and countercyclicalLowest average beta across yield sectors (2) 30 investment options across four core investment groupsPotential to generate strong returns and alpha in a variety of business cycles More efficient, consistent earnings generation than other yield sectors Meaningful discount across traditional valuation metrics compared to other yield manufacturers and industry leaders Academic Methodology Market Methodology Dividend Discount ModelsDiscounted Cash Flow ValuationsEnterprise Value Added Models Sum of the Parts ValuationIndustry Leader PremiumAlpha

Source: Bloomberg, Company Financials. Operating Margin and ROE figures based on trailing 12 month financials. Market data as of June 19, 2017. Note: mREITs represent BBREMTG. S&P represent the SPX Index. Asset Managers represent the S&P 500 Asset Management and Custody Bank Index. MLPs represent the Alerian MLP Index. Utilities represent the Russell 3000 Utilities Index. Banks represent the KBW Bank Index.Annaly Operating margin defined as (trailing 12 month net interest income – trailing 12 month operating expense) / trailing 12 month interest income. Bloomberg OPER_MARGIN field used for indices.Annaly Leverage is defined as Q1 2017 Economic Leverage. Bloomberg FNCL_LVRG field minus 1, making it a measure of debt to equity, used for indices. Companies with >50x leverage excluded. Beta refers to the Bloomberg BETA_ADJ_OVERRIDABLE field, calculated over a 2 year period as of June 19, 2017. SPX Index is used as the relative index for the beta calculation.Cost of Equity refers to the Bloomberg WACC_COST_EQUITY field which derives the cost of equity based on the Capital Asset Pricing Model methodology.EVA Spread Calculated as the ROE minus the Cost of Equity. Relative Value Comparison Annaly trades at a relative discount to other yield producing sectors despite outperforming across operating and performance metrics 26 Undervalued / More Efficient Overvalued / Less Efficient
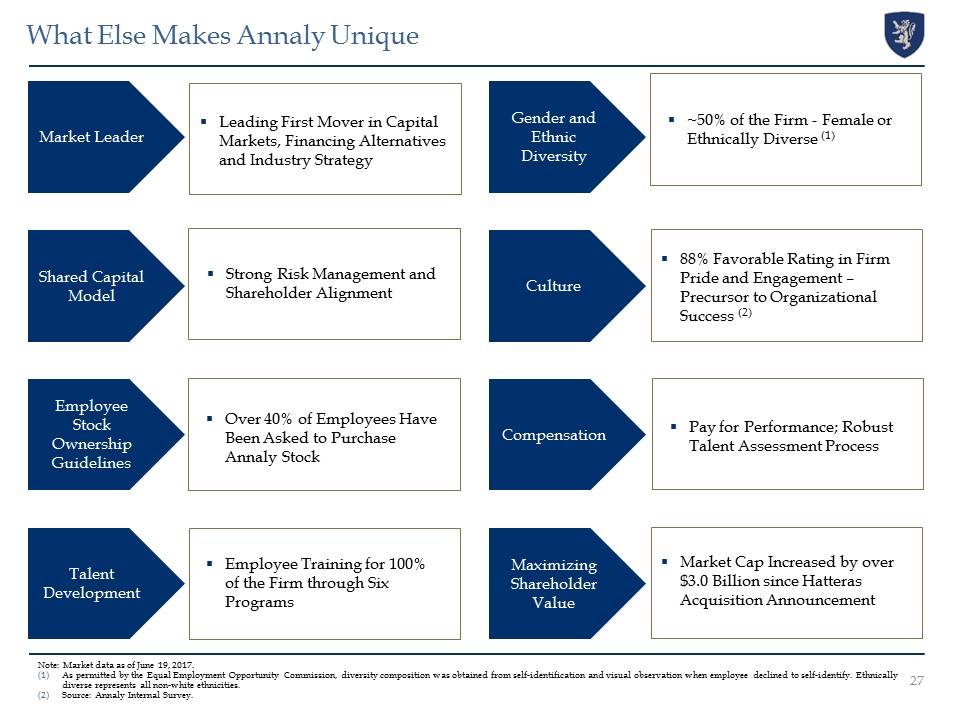
Culture 88% Favorable Rating in Firm Pride and Engagement – Precursor to Organizational Success (2) Employee Stock Ownership Guidelines Maximizing Shareholder Value Over 40% of Employees Have Been Asked to Purchase Annaly Stock Market Cap Increased by over $3.0 Billion since Hatteras Acquisition Announcement Talent Development Employee Training for 100% of the Firm through Six Programs What Else Makes Annaly Unique Market Leader Leading First Mover in Capital Markets, Financing Alternatives and Industry Strategy 27 Gender and Ethnic Diversity ~50% of the Firm - Female or Ethnically Diverse (1) Note: Market data as of June 19, 2017. As permitted by the Equal Employment Opportunity Commission, diversity composition was obtained from self-identification and visual observation when employee declined to self-identify. Ethnically diverse represents all non-white ethnicities.Source: Annaly Internal Survey. Strong Risk Management and Shareholder Alignment Shared Capital Model Compensation Pay for Performance; Robust Talent Assessment Process
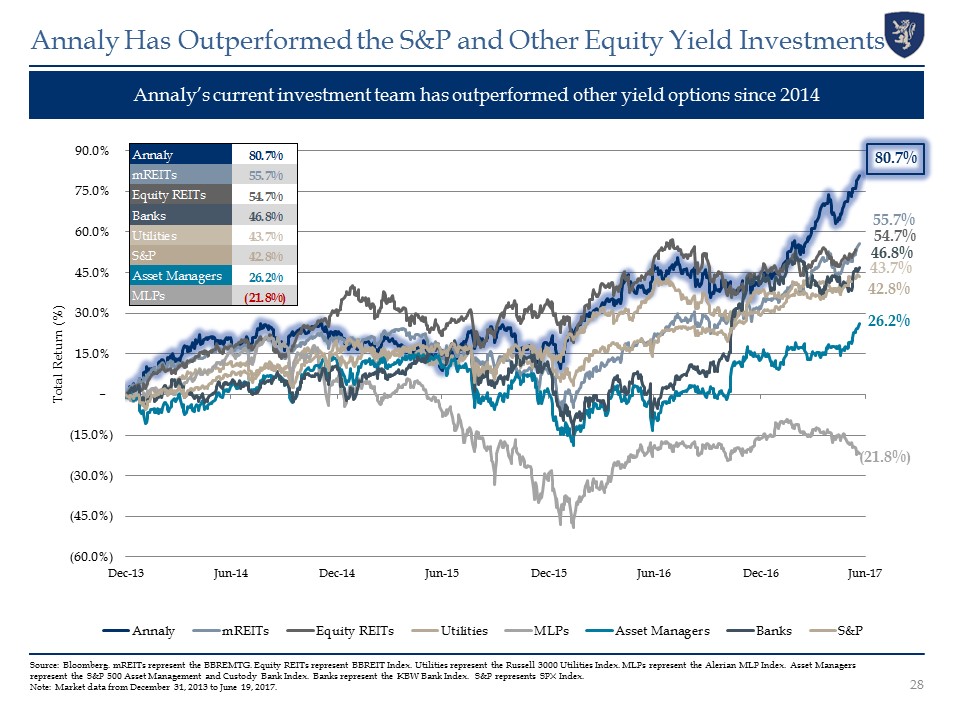
Source: Bloomberg. mREITs represent the BBREMTG. Equity REITs represent BBREIT Index. Utilities represent the Russell 3000 Utilities Index. MLPs represent the Alerian MLP Index. Asset Managers represent the S&P 500 Asset Management and Custody Bank Index. Banks represent the KBW Bank Index. S&P represents SPX Index.Note: Market data from December 31, 2013 to June 19, 2017. Annaly Has Outperformed the S&P and Other Equity Yield Investments Annaly’s current investment team has outperformed other yield options since 2014 28