Attached files
| file | filename |
|---|---|
| 8-K - 8-K - Sonus, Inc. | a17-15317_18k.htm |
Exhibit 99.1
Creating a global leader in real-time communications software and cloud solutions INVESTOR UPDATE June 19, 2017
Forward Looking Statements IMPORTANT INFORMATION ABOUT THE TRANSACTION WILL BE FILED WITH THE SEC In connection with the proposed transaction, Sonus will cause Solstice Sapphire Investments, Inc., a wholly-owned subsidiary of Sonus formed to act as a holding company in connection with the transaction (“NewCo”), to file with the SEC a Registration Statement on Form S-4 that will include a joint proxy statement of Sonus and GENBAND and certain of its affiliates (the “GENBAND Parties”) and a prospectus of NewCo and Sonus and the parties may file with the SEC other relevant documents concerning the proposed transaction. Sonus will mail the joint proxy statement/prospectus to the Sonus stockholders and the GENBAND Party equity holders. SONUS STOCKHOLDERS AND GENBAND PARTY EQUITY HOLDERS ARE URGED TO READ THE REGISTRATION STATEMENT AND JOINT PROXY STATEMENT/PROSPECTUS REGARDING THE PROPOSED TRANSACTION WHEN IT BECOMES AVAILABLE AND ANY OTHER RELEVANT DOCUMENTS FILED WITH THE SEC, AS WELL AS ANY AMENDMENTS OR SUPPLEMENTS TO THOSE DOCUMENTS, BECAUSE THEY WILL CONTAIN IMPORTANT INFORMATION. Investors and security holders may obtain a free copy of the joint proxy statement/prospectus (when available) and other filings containing information about Sonus at the SEC’s website at www.sec.gov. The joint proxy statement/prospectus (when available) and the other filings may also be obtained free of charge from Sonus’ Investor Relations website (http://investors.sonusnet.com/) or by requesting them from Sonus’ corporate secretary at Sonus Networks, Inc., 4 Technology Park Drive, Westford, Massachusetts 01886, Attention: Corporate Secretary. Sonus, NewCo, the GENBAND Parties and certain of their respective directors and executive officers, under the SEC’s rules, may be deemed to be participants in the solicitation of proxies of Sonus stockholders in connection with the proposed transaction. Information about the directors and executive officers of Sonus and their ownership of Sonus common stock is set forth in the proxy statement for Sonus’ 2017 annual meeting of stockholders, as filed with the SEC on Schedule 14A on April 28, 2017. Additional information regarding the interests of those participants and other persons who may be deemed participants in the transaction may be obtained by reading the joint proxy statement/prospectus regarding the proposed transaction when it becomes available. Free copies of this document may be obtained as described in the preceding paragraphs. NO OFFERS OR SOLICITATIONS This communication shall not constitute an offer to sell or the solicitation of an offer to sell or the solicitation of an offer to buy any securities, nor shall there be any sale of securities in any jurisdiction in which such offer, solicitation or sale would be unlawful prior to registration or qualification under the securities laws of any such jurisdiction. No offer of securities shall be made except by means of a prospectus meeting the requirements of Section 10 of the Securities Act of 1933, as amended. CAUTIONARY NOTE REGARDING FORWARD-LOOKING STATEMENTS This communication contains “forward-looking statements”—that is, statements related to future, not past, events. In this context, forward-looking statements often address expected future business and financial performance and financial condition, and often contain words such as “expect,” “anticipate,” “intend,” “plan,” “believe,” “seek,” “see,” “will,” “would,” or “target.” Forward-looking statements by their nature address matters that are, to different degrees, uncertain, such as statements about the consummation of the proposed transaction and the expected performance of the combined companies. Uncertainties that could cause actual results to be materially different than those expressed in Sonus’ and GENBAND’s forward-looking statements include the failure to consummate the proposed transaction or to make or take any filing or other action required to consummate such transaction in a timely matter or at all. These or other uncertainties may cause actual future results to be materially different from those expressed in Sonus’ and the GENBAND Parties’ forward-looking statements. These risks and uncertainties include, but are not limited to, economic, competitive, legal, governmental and technological factors. Accordingly, there is no assurance that the expectations of Sonus or any GENBAND Party will be realized. Many factors could cause actual results to differ materially from these forward-looking statements with respect to the proposed transaction, including risks relating to the completion of the proposed transaction on anticipated terms and timing, including obtaining equity holder and regulatory approvals, anticipated tax treatment, unforeseen liabilities, future capital expenditures, revenues, expenses, earnings, synergies, economic performance, indebtedness, financial condition, losses, future prospects, business and management strategies for the management, expansion and growth of the new combined company’s operations, the ability of Sonus and the GENBAND Parties to integrate the business successfully and to achieve anticipated synergies, potential litigation relating to the proposed transaction, and the risk that disruptions from the proposed transaction will harm Sonus’ or the GENBAND Parties’ business. While the list of factors presented here is considered representative, no such list should be considered to be a complete statement of all potential risks and uncertainties. Unlisted factors may present significant additional obstacles to the realization of forward looking statements. Consequences of material differences in results as compared with those anticipated in the forward-looking statements could include, among other things, business disruption, operational problems, financial loss, legal liability to third parties and similar risks, any of which could have a material adverse effect on Sonus’ or the GENBAND Parties’ consolidated financial condition, results of operations or liquidity. Neither Sonus nor any GENBAND Party assumes any obligation to provide revisions to any forward-looking statements should circumstances change, except as otherwise required by securities and other applicable laws. 2
Products and Reach Highly complementary product portfolios and expanded geographic reach Scale and Customers Enhanced scale with deeper global sales footprint and more diversified customer base Financial Profile Significantly higher revenues, gross profit, earnings and cash flow from operations Synergies $40 million - $50 million of anticipated annual cost synergies by end of 2018 Future Growth Strong growth platforms powered by Sonus’ new security analytics and control platform for real time flows and digital services and GENBAND’s “Kandy” cloud communications platform as a service (CPaaS) Compelling strategic & financial rationale 3 Comprehensive product offering and actionable growth strategy
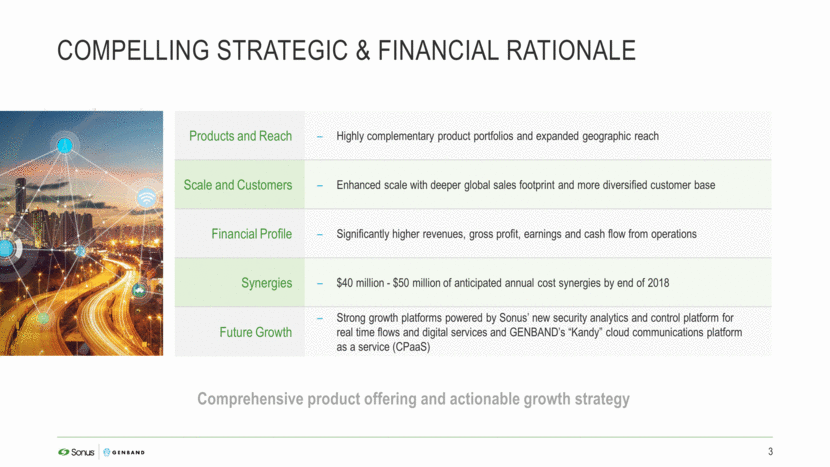
Structure/Ownership Sonus and GENBAND shareholders will each own approximately 50% of the combined company GENBAND’s equity holders will receive ~50 million shares of common stock of the combined company and a $22.5 million unsecured note Enterprise Value ~$745 million – based on Sonus’ closing stock price of $7.79 on May 22, 2017, and estimated net cash at closing Financing Not contingent on external financing Synergies $40 million - $50 million in anticipated annual cost synergies by end of 2018 Board of Directors Five representatives designated by GENBAND and four representatives designated by Sonus Current Sonus Chairman Richard Lynch will serve as Chairman of the combined company; Sonus CEO Ray Dolan to join the combined company Board Management Sonus CEO Ray Dolan to be combined company CEO GENBAND CEO David Walsh to oversee Kandy business GENBAND CFO Daryl Raiford to be combined company CFO Remainder of management to be named from current leadership of both companies prior to closing Closing Conditions Subject to Sonus and GENBAND shareholder approval, listing of the combined company’s common stock on Nasdaq, Hart-Scott-Rodino review and other customary closing conditions Timing Announced May 23, 2017 Expected to close in the second half of 2017 Transaction Overview 4
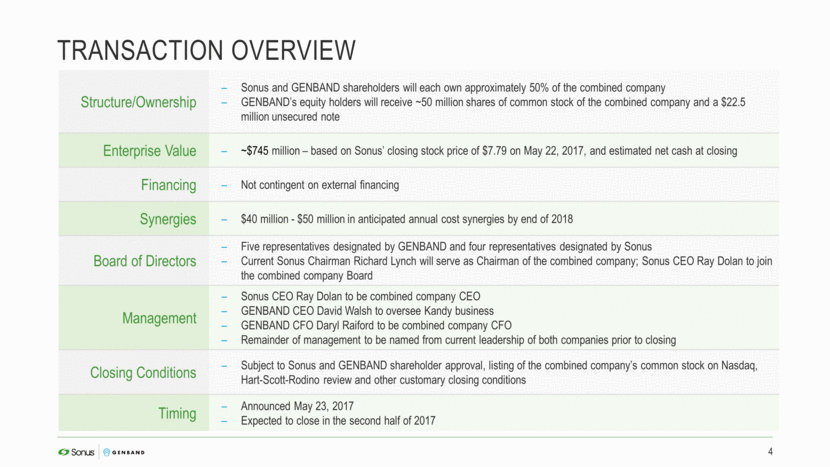
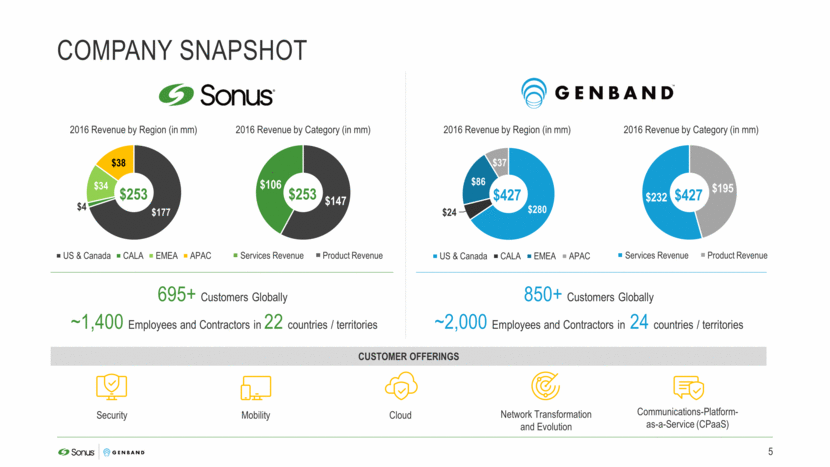
Company snapshot 695+ Customers Globally ~1,400 Employees and Contractors in 22 countries / territories Network Transformation and Evolution Cloud CUSTOMER OFFERINGS Security Mobility Communications-Platform-as-a-Service (CPaaS) 850+ Customers Globally ~2,000 Employees and Contractors in 24 countries / territories 2016 Revenue by Category (in mm) 2016 Revenue by Region (in mm) 2016 Revenue by Region (in mm) 2016 Revenue by Category (in mm) $253 $253 $427 $427 5 Services Revenue Product Revenue Services Revenue Product Revenue $147 $106 Product Revenue Services Revenue $195 $232 Product Revenue Services Revenue $280 $24 $86 $37 US & Canada CALA EMEA APAC $177 $4 $34 $38 US & Canada CALA EMEA APAC
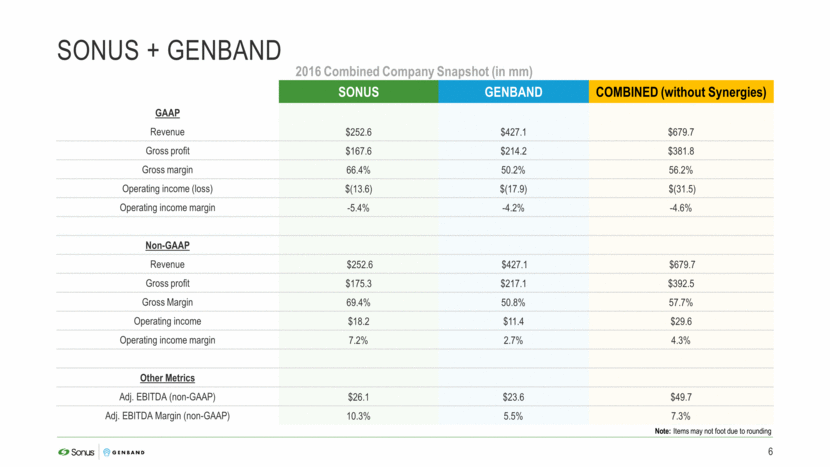
SONUS + GENBAND 6 2016 Combined Company Snapshot (in mm) SONUS GENBAND COMBINED (without Synergies) GAAP Revenue $252.6 $427.1 $679.7 Gross profit $167.6 $214.2 $381.8 Gross margin 66.4% 50.2% 56.2% Operating income (loss) $(13.6) $(17.9) $(31.5) Operating income margin -5.4% -4.2% -4.6% Non-GAAP Revenue $252.6 $427.1 $679.7 Gross profit $175.3 $217.1 $392.5 Gross Margin 69.4% 50.8% 57.7% Operating income $18.2 $11.4 $29.6 Operating income margin 7.2% 2.7% 4.3% Other Metrics Adj. EBITDA (non-GAAP) $26.1 $23.6 $49.7 Adj. EBITDA Margin (non-GAAP) 10.3% 5.5% 7.3% Note: Items may not foot due to rounding
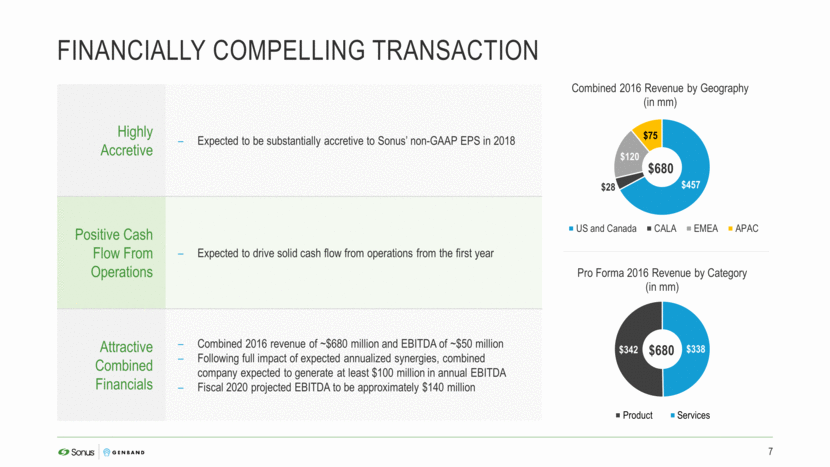
Financially compelling transaction 7 $680 $680 Highly Accretive Expected to be substantially accretive to Sonus’ non-GAAP EPS in 2018 Positive Cash Flow From Operations Expected to drive solid cash flow from operations from the first year Attractive Combined Financials Combined 2016 revenue of ~$680 million and EBITDA of ~$50 million Following full impact of expected annualized synergies, combined company expected to generate at least $100 million in annual EBITDA Fiscal 2020 projected EBITDA to be approximately $140 million Services Product $338 $342 Pro Forma 2016 Revenue by Category (in mm) Product Services $457 $28 $120 $75 Combined 2016 Revenue by Geography (in mm ) US and Canada CALA EMEA APAC
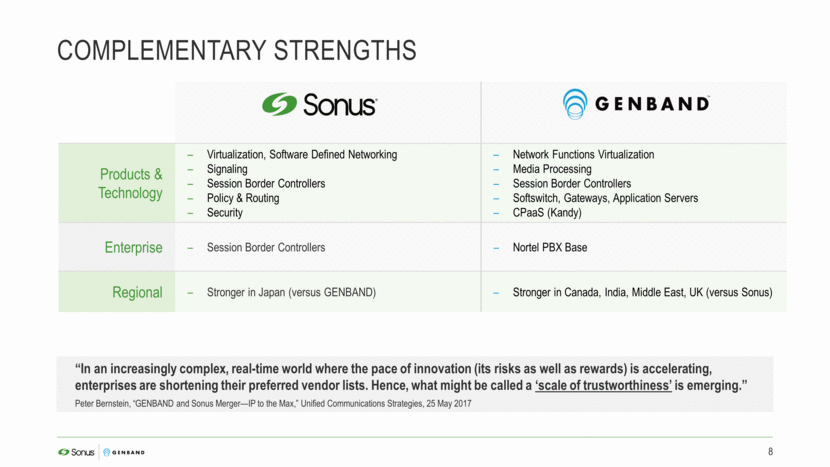
“In an increasingly complex, real-time world where the pace of innovation (its risks as well as rewards) is accelerating, enterprises are shortening their preferred vendor lists. Hence, what might be called a ‘scale of trustworthiness’ is emerging.” Peter Bernstein, “GENBAND and Sonus Merger—IP to the Max,” Unified Communications Strategies, 25 May 2017 Products & Technology Virtualization, Software Defined Networking Signaling Session Border Controllers Policy & Routing Security Network Functions Virtualization Media Processing Session Border Controllers Softswitch, Gateways, Application Servers CPaaS (Kandy) Enterprise Session Border Controllers Nortel PBX Base Regional Stronger in Japan (versus GENBAND) Stronger in Canada, India, Middle East, UK (versus Sonus) COMPLEMENTARY STRENGTHS 8
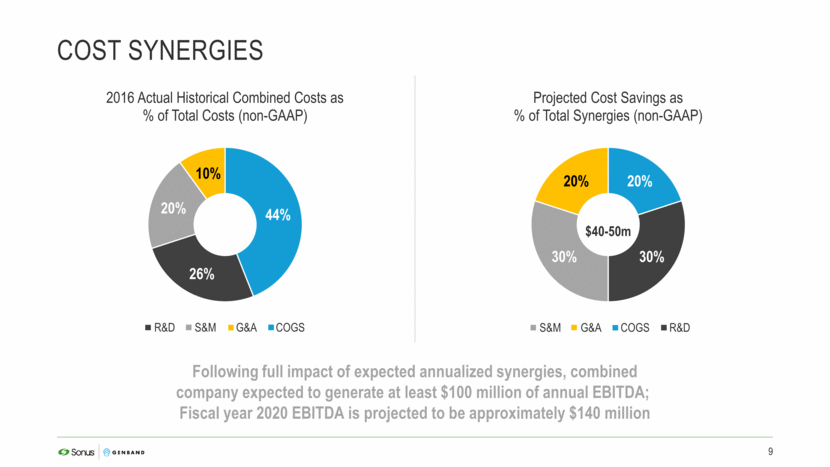
Cost synergies 9 Following full impact of expected annualized synergies, combined company expected to generate at least $100 million of annual EBITDA; Fiscal year 2020 EBITDA is projected to be approximately $140 million $40-50m R&D S&M G&A COGS S&M G&A COGS R&D
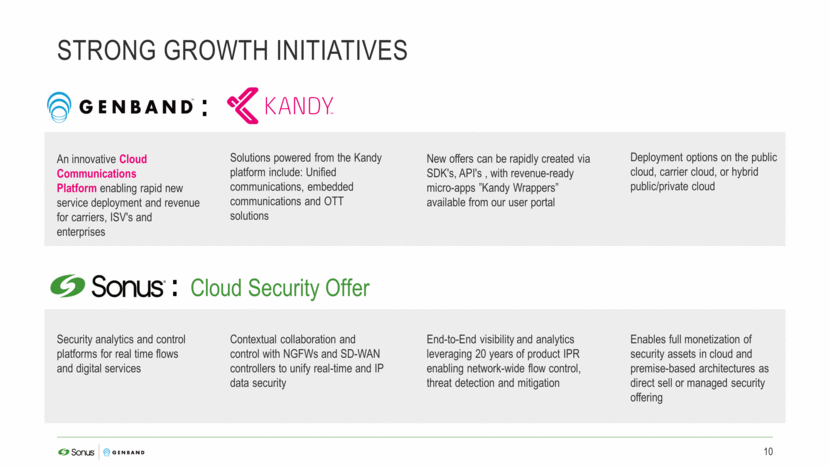
Strong growth initiatives 10 An innovative Cloud Communications Platform enabling rapid new service deployment and revenue for carriers, ISV's and enterprises Solutions powered from the Kandy platform include: Unified communications, embedded communications and OTT solutions Cloud Security Offer Security analytics and control platforms for real time flows and digital services New offers can be rapidly created via SDK's, API's , with revenue-ready micro-apps ”Kandy Wrappers” available from our user portal Deployment options on the public cloud, carrier cloud, or hybrid public/private cloud Contextual collaboration and control with NGFWs and SD-WAN controllers to unify real-time and IP data security End-to-End visibility and analytics leveraging 20 years of product IPR enabling network-wide flow control, threat detection and mitigation Enables full monetization of security assets in cloud and premise-based architectures as direct sell or managed security offering : :
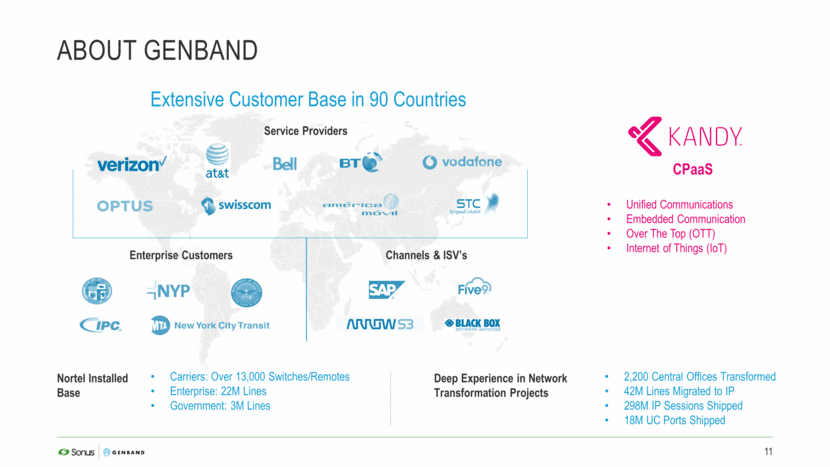
Extensive Customer Base in 90 Countries 2,200 Central Offices Transformed 42M Lines Migrated to IP 298M IP Sessions Shipped 18M UC Ports Shipped ABOUT genband Service Providers Channels & ISV’s Enterprise Customers 11 Deep Experience in Network Transformation Projects CPaaS Unified Communications Embedded Communication Over The Top (OTT) Internet of Things (IoT) Nortel Installed Base Carriers: Over 13,000 Switches/Remotes Enterprise: 22M Lines Government: 3M Lines
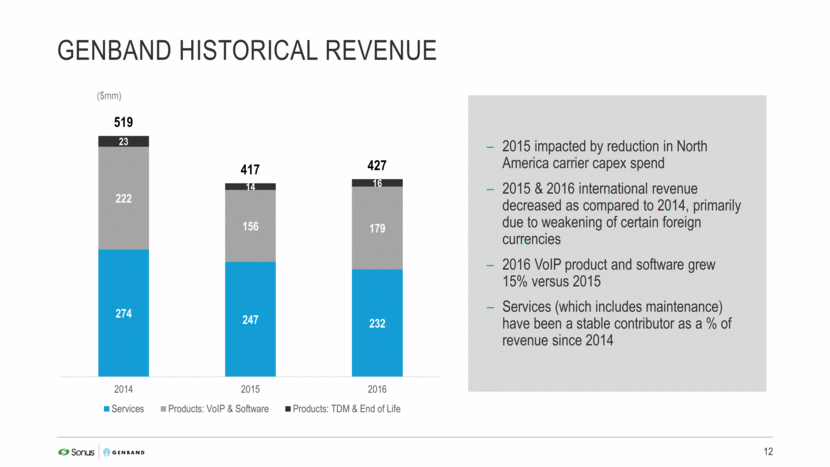
Genband HISTORICAL Revenue 2015 impacted by reduction in North America carrier capex spend 2015 & 2016 international revenue decreased as compared to 2014, primarily due to weakening of certain foreign currencies 2016 VoIP product and software grew 15% versus 2015 Services (which includes maintenance) have been a stable contributor as a % of revenue since 2014 12 ($mm) 274 247 232 222 156 179 23 14 16 519 417 427 2014 2015 2016 Services Products: VoIP & Software Products: TDM & End of Life
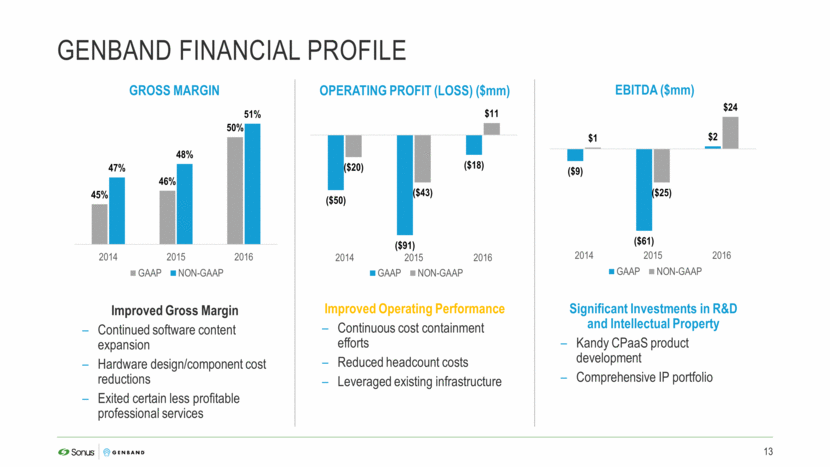
Significant Investments in R&D and Intellectual Property Kandy CPaaS product development Comprehensive IP portfolio Improved Operating Performance Continuous cost containment efforts Reduced headcount costs Leveraged existing infrastructure Improved Gross Margin Continued software content expansion Hardware design/component cost reductions Exited certain less profitable professional services Genband Financial profile 13 GROSS MARGIN OPERATING PROFIT (LOSS) ($mm) EBITDA ($mm) 45% 46% 50% 47% 48% 51% 2014 2015 2016 GAAP NON-GAAP ($50) ($91) ($18) ($20) ($43) $11 2014 2015 2016 GAAP NON-GAAP ($9) ($61) $2 $1 ($25) $24 2014 2015 2016 GAAP NON-GAAP
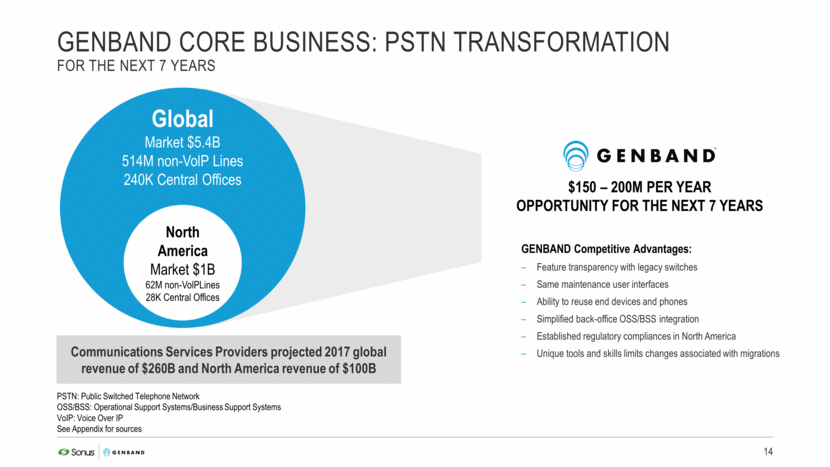
GENBAND CORE BUSINESS: PSTN Transformation For the next 7 years 14 PSTN: Public Switched Telephone Network OSS/BSS: Operational Support Systems/Business Support Systems VoIP: Voice Over IP See Appendix for sources North America Market $1B 62M non-VolPLines 28K Central Offices Global Market $5.4B 514M non-VolP Lines 240K Central Offices GENBAND Competitive Advantages: Feature transparency with legacy switches Same maintenance user interfaces Ability to reuse end devices and phones Simplified back-office OSS/BSS integration Established regulatory compliances in North America Unique tools and skills limits changes associated with migrations $150 – 200M PER YEAR Opportunity for the next 7 years Communications Services Providers projected 2017 global revenue of $260B and North America revenue of $100B
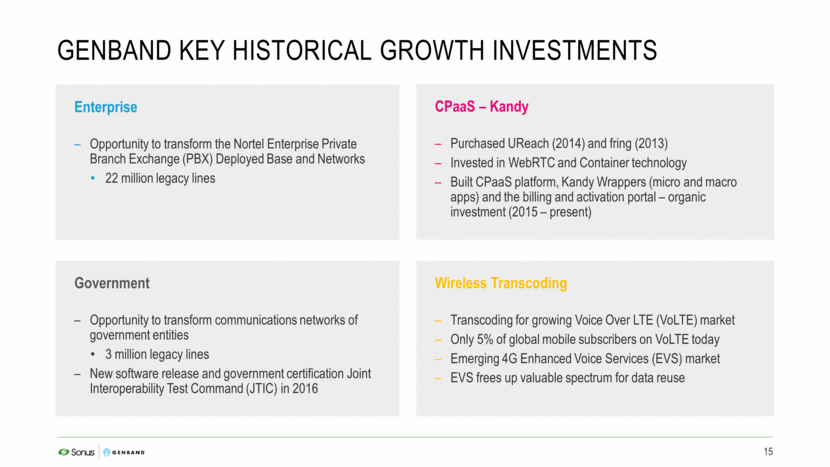
GENBAND KEY HISTORICAL GROWTH INVESTMENTS 15 Wireless Transcoding Transcoding for growing Voice Over LTE (VoLTE) market Only 5% of global mobile subscribers on VoLTE today Emerging 4G Enhanced Voice Services (EVS) market EVS frees up valuable spectrum for data reuse CPaaS – Kandy Purchased UReach (2014) and fring (2013) Invested in WebRTC and Container technology Built CPaaS platform, Kandy Wrappers (micro and macro apps) and the billing and activation portal – organic investment (2015 – present) Enterprise Opportunity to transform the Nortel Enterprise Private Branch Exchange (PBX) Deployed Base and Networks 22 million legacy lines Government Opportunity to transform communications networks of government entities 3 million legacy lines New software release and government certification Joint Interoperability Test Command (JTIC) in 2016
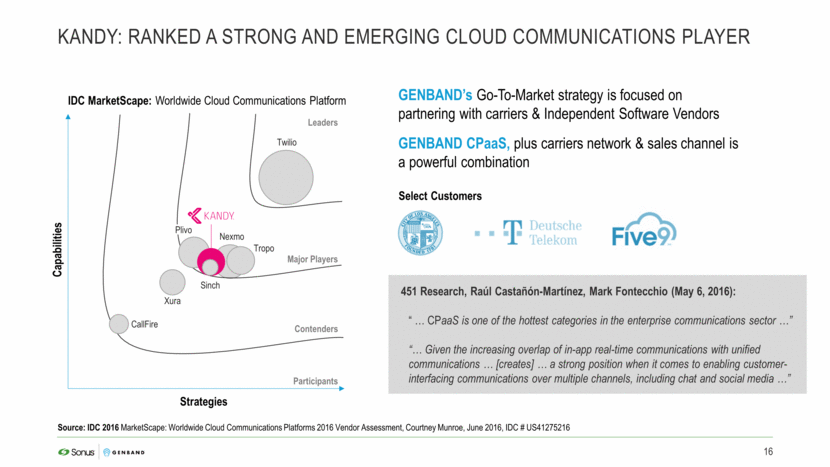
Kandy: Ranked a strong and emerging Cloud communications Player Source: IDC 2016 MarketScape: Worldwide Cloud Communications Platforms 2016 Vendor Assessment, Courtney Munroe, June 2016, IDC # US41275216 16 451 Research, Raúl Castañón-Martínez, Mark Fontecchio (May 6, 2016): “ CPaaS is one of the hottest categories in the enterprise communications sector ” “ Given the increasing overlap of in-app real-time communications with unified communications [creates] a strong position when it comes to enabling customer-interfacing communications over multiple channels, including chat and social media ” GENBAND’s Go-To-Market strategy is focused on partnering with carriers & Independent Software Vendors GENBAND CPaaS, plus carriers network & sales channel is a powerful combination Select Customers IDC MarketScape: Worldwide Cloud Communications Platform Strategies Capabilities Leaders Major Players Contenders Participants CallFire Xura Plivo Tropo Nexmo Twilio Sinch
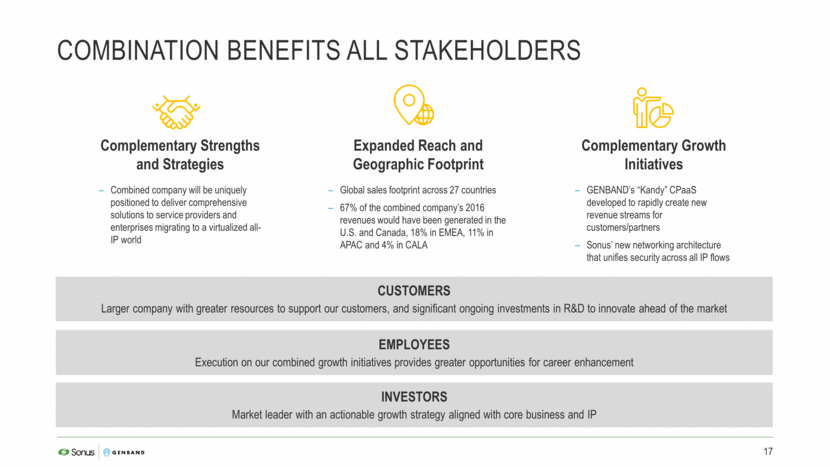
CUSTOMERS Larger company with greater resources to support our customers, and significant ongoing investments in R&D to innovate ahead of the market INVESTORS Market leader with an actionable growth strategy aligned with core business and IP EMPLOYEES Execution on our combined growth initiatives provides greater opportunities for career enhancement Combination Benefits All Stakeholders 17 Complementary Strengths and Strategies Combined company will be uniquely positioned to deliver comprehensive solutions to service providers and enterprises migrating to a virtualized all-IP world Expanded Reach and Geographic Footprint Global sales footprint across 27 countries 67% of the combined company’s 2016 revenues would have been generated in the U.S. and Canada, 18% in EMEA, 11% in APAC and 4% in CALA Complementary Growth Initiatives GENBAND’s “Kandy” CPaaS developed to rapidly create new revenue streams for customers/partners Sonus’ new networking architecture that unifies security across all IP flows
Appendix

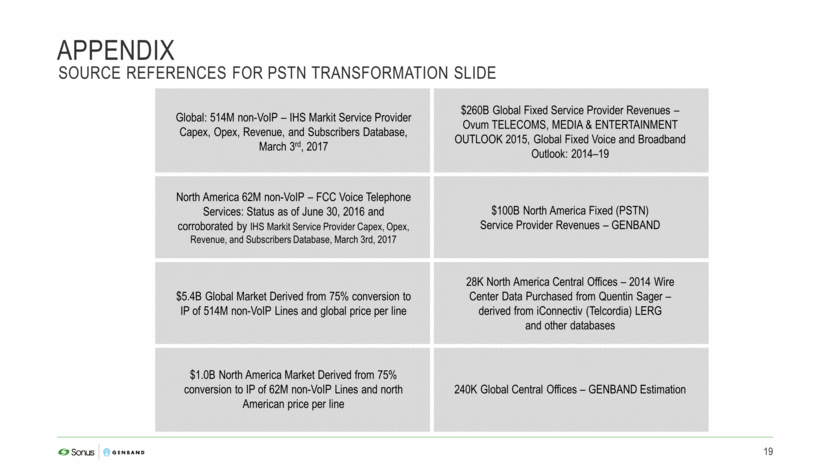
Appendix 19 Global: 514M non-VoIP – IHS Markit Service Provider Capex, Opex, Revenue, and Subscribers Database, March 3rd, 2017 $260B Global Fixed Service Provider Revenues – Ovum TELECOMS, MEDIA & ENTERTAINMENT OUTLOOK 2015, Global Fixed Voice and Broadband Outlook: 2014–19 North America 62M non-VoIP – FCC Voice Telephone Services: Status as of June 30, 2016 and corroborated by IHS Markit Service Provider Capex, Opex, Revenue, and Subscribers Database, March 3rd, 2017 $100B North America Fixed (PSTN) Service Provider Revenues – GENBAND $5.4B Global Market Derived from 75% conversion to IP of 514M non-VoIP Lines and global price per line 28K North America Central Offices – 2014 Wire Center Data Purchased from Quentin Sager – derived from iConnectiv (Telcordia) LERG and other databases $1.0B North America Market Derived from 75% conversion to IP of 62M non-VoIP Lines and north American price per line 240K Global Central Offices – GENBAND Estimation SOURCE REFERENCES FOR PSTN Transformation SLIDE
[LOGO]

