Attached files
Table of Contents
As filed with the Securities and Exchange Commission on June 19, 2017.
Registration No. 333-218362
UNITED STATES
SECURITIES AND EXCHANGE COMMISSION
Washington, D.C. 20549
Amendment No. 1
to
FORM S-1
REGISTRATION STATEMENT
UNDER
THE SECURITIES ACT OF 1933
Byline Bancorp, Inc.
(Exact Name of Registrant as Specified in Its Charter)
| Delaware |
6022 | 36-3012593 | ||
| (State or Other Jurisdiction of Incorporation or Organization) |
(Primary Standard Industrial Classification Code Number) |
(IRS Employer Identification Number) |
180 North LaSalle Street, Suite 300
Chicago, Illinois 60601
(773) 244-7000
(Address, Including Zip Code, and Telephone Number, Including Area Code, of Registrant’s Principal Executive Offices)
Alberto J. Paracchini
Chief Executive Officer
Byline Bancorp, Inc.
180 North LaSalle Street, Suite 300
Chicago, Illinois 60601
(773) 244-7000
(Name, Address, Including Zip Code, and Telephone Number, Including Area Code, of Agent for Service)
Copies to:
| Donald J. Toumey Catherine M. Clarkin Sullivan & Cromwell LLP 125 Broad Street New York, NY 10004 (212) 558-4000 |
Michael J. Zeidel Skadden, Arps, Slate, Meagher & Flom LLP 4 Times Square New York, NY 10036 (212) 735-3000 |
Approximate date of commencement of proposed sale to the public: As soon as practicable after the effective date of the Registration Statement.
If any of the securities being registered on this form are to be offered on a delayed or continuous basis pursuant to Rule 415 under the Securities Act of 1933, check the following box. ☐
If this form is filed to register additional securities for an offering pursuant to Rule 462(b) under the Securities Act, check the following box and list the Securities Act registration statement number of the earlier effective registration statement for the same offering. ☐
If this form is a post-effective amendment filed pursuant to Rule 462(c) under the Securities Act, check the following box and list the Securities Act registration statement number of the earlier effective registration statement for the same offering. ☐
If this form is a post-effective amendment filed pursuant to Rule 462(d) under the Securities Act, check the following box and list the Securities Act registration statement number of the earlier effective registration statement for the same offering. ☐
Indicate by check mark whether the registrant is a large accelerated filer, an accelerated filer, a non-accelerated filer, a smaller reporting company or an emerging growth company. See the definitions of “large accelerated filer”, “accelerated filer”, “smaller reporting company” and “emerging growth company” in Rule 12b-2 of the Securities Exchange Act of 1934.
| Large accelerated filer | ☐ | Accelerated filer | ☐ | |||||
| Non-accelerated filer | ☒ | (Do not check if a smaller reporting company) | Smaller reporting company | ☐ | ||||
| Emerging growth company | ☒ |
If an emerging growth company, indicate by check mark if the registrant has elected not to use the extended transition period for complying with any new or revised financial accounting standards provided to Section 7(a)(2)(B) of the Securities Act. ☐
CALCULATION OF REGISTRATION FEE
|
| ||||||||
| Title of each class of securities to be registered |
Amount to be |
Proposed maximum offering price per share(2) |
Proposed maximum aggregate offering price(2) |
Amount of registration fee(3) | ||||
| Common Stock, par value $0.01 per share |
6,555,000 | $21.00 | $137,655,000 | $15,954.22 | ||||
|
| ||||||||
|
| ||||||||
| (1) | Includes 855,000 additional shares of common stock that the underwriters have the option to purchase from the registrant. |
| (2) | Estimated solely for purposes of computing the amount of the registration fee pursuant to Rule 457(a) under the Securities Act of 1933. |
| (3) | Of this amount, $8,692.50 has previously been paid. |
The Registrant hereby amends this Registration Statement on such date or dates as may be necessary to delay its effective date until the Registrant shall file a further amendment which specifically states that this Registration Statement shall thereafter become effective in accordance with Section 8(a) of the Securities Act of 1933 or until the Registration Statement shall become effective on such date as the Commission, acting pursuant to said Section 8(a), may determine.
Table of Contents
The information in this prospectus is not complete and may be changed. We may not sell these securities until the registration statement filed with the Securities and Exchange Commission is effective. This prospectus is not an offer to sell these securities and it is not soliciting an offer to buy these securities in any state where the offer or sale is not permitted.
Subject to Completion
Preliminary Prospectus dated June 19, 2017
PROSPECTUS
5,700,000 Shares

Common Stock
This is Byline Bancorp, Inc.’s initial public offering. We are selling 3,775,194 shares of our common stock and the selling stockholders are selling 1,924,806 shares of our common stock. We will not receive any proceeds from the sale of shares to be offered by the selling stockholders.
We expect the public offering price to be between $19.00 and $21.00 per share. Currently, no public market exists for the shares. After pricing of the offering, we expect that the shares will trade on the New York Stock Exchange under the symbol ‘‘BY’’.
Investing in the common stock involves risks that are described in the “Risk Factors” section beginning on page 18 of this prospectus.
We are an “emerging growth company” under the federal securities laws and will be subject to reduced public company reporting requirements.
| Per Share |
Total |
|||||||
| Public offering price |
$ | $ | ||||||
| Underwriting discounts and commissions(1) |
$ | $ | ||||||
| Proceeds, before expenses, to us |
$ | $ | ||||||
| Proceeds, before expenses, to the selling stockholders |
$ | $ | ||||||
| (1) | See “Underwriting” for a description of the compensation payable to the underwriters. |
The underwriters may also exercise their option to purchase up to an additional 855,000 shares from us at the public offering price, less the underwriting discounts and commissions, for 30 days after the date of this prospectus.
Neither the Securities and Exchange Commission nor any state securities commission has approved or disapproved of these securities or determined if this prospectus is truthful or complete. Any representation to the contrary is a criminal offense.
The shares will be ready for delivery on or about , 2017.
Joint Book-Running Managers
| BofA Merrill Lynch | Keefe, Bruyette & Woods | |
| A Stifel Company |
Co-Managers
| Piper Jaffray | Sandler O’Neill + Partners, L.P. | Stephens Inc. |
The date of this prospectus is , 2017.
Table of Contents
Obsess about our customers. Every single experience and interaction matters. Go to extraordinary lengths to convert customers into fans. Insist on excellence. And the highest ethical standards in everything we do. Embrace change. Change is constant. Without change, we cannot grow. Think like an owner. Be frugal. Take ownership of issues until they are resolved. Present new ideas. Know the numbers. Facts matter. We don’t know our business if we don’t know our numbers. Fast is better than slow. Speed matters in business. Get it done. Deliver results. Inspire. Respect, challenge and collaborate with each other every day. Teamwork is our greatest strength. Connected Things That Matter.

Table of Contents
| Page | ||||
| 1 | ||||
| 14 | ||||
| Summary Historical Consolidated Financial and Operating Information |
16 | |||
| 18 | ||||
| 49 | ||||
| 52 | ||||
| 53 | ||||
| 54 | ||||
| 55 | ||||
| 57 | ||||
| Unaudited Pro Forma Consolidated Financial Information and Other Data |
59 | |||
| Selected Historical Consolidated Financial and Operating Information |
62 | |||
| GAAP Reconciliation and Management Explanation of Non-GAAP Financial Measures |
64 | |||
| Management’s Discussion and Analysis of Financial Condition and Results of Operations |
66 | |||
| 107 | ||||
| 110 | ||||
| 129 | ||||
| 142 | ||||
| 151 | ||||
| 166 | ||||
| 169 | ||||
| 171 | ||||
| 177 | ||||
| Certain United States Federal Tax Consequences for Non-U.S. Holders of Our Common Stock |
179 | |||
| 182 | ||||
| 184 | ||||
| 192 | ||||
| 192 | ||||
| 192 | ||||
| F-1 | ||||
Certain Defined Terms
Unless we state otherwise or the context otherwise requires, references in this prospectus to:
| • | “we”, “our”, “us”, “ourselves”, “Byline”, “the company” and “the Company” refer to Byline Bancorp, Inc., a newly formed Delaware corporation, and its consolidated subsidiaries, after giving effect to the reincorporation transactions described in the section entitled “Reincorporation”. For all periods prior to the completion of such reincorporation transactions, these terms refer to Byline Bancorp, Inc., an Illinois corporation, and its consolidated subsidiaries; |
| • | “Recapitalization” refers to the $207 million recapitalization of our predecessor, Metropolitan Bank Group, Inc., on June 28, 2013; |
| • | “Ridgestone” refers to Ridgestone Financial Services, Inc.; |
| • | “Ridgestone acquisition” refers to Byline Bancorp, Inc.’s purchase of all of Ridgestone Financial Services, Inc.’s outstanding capital stock on October 14, 2016; |
-i-
Table of Contents
| • | our “bank” and “Byline Bank” refer to Byline Bank, an Illinois state-chartered bank, and a direct, wholly-owned subsidiary of Byline Bancorp, Inc.; |
| • | “BHC Act” refers to the U.S. Bank Holding Company Act of 1956, as amended; |
| • | “Federal Reserve” refers to the Board of Governors of the Federal Reserve System; |
| • | “fiscal year” refers to our fiscal year, which is based on a twelve-month period ending December 31 of each year (e.g., fiscal year 2016 refers to the twelve-month period ending December 31, 2016); |
| • | our “stock” refers to our common stock unless otherwise specified; and |
| • | “Great Recession” refers to the sharp decline in U.S. economic activity from approximately December 2007 to June 2009. |
About This Prospectus
We and the underwriters have not authorized anyone to provide any information other than that contained in this prospectus or in any free writing prospectus prepared by or on behalf of us or to which we have referred you. We and the underwriters take no responsibility for, and can provide no assurance as to the reliability of, any other information that others may give you. We are not, and the underwriters are not, making an offer of these securities in any jurisdiction where the offer is not permitted. You should not assume that the information contained in this prospectus is accurate as of any date other than the date on the front cover of this prospectus. This prospectus includes references to information contained on, or that can be accessed through, our website. Information contained on, or that can be accessed through, our website is not part of, and is not incorporated into, this prospectus.
We have proprietary rights to trademarks and other intellectual property appearing in this prospectus that are important to our business. Solely for convenience, the trademarks appearing in this prospectus are without the® symbol, but such references are not intended to indicate, in any way, that we will not assert, to the fullest extent under applicable law, our rights or the rights of the applicable licensors to these trademarks and other intellectual property. All trademarks appearing in this prospectus are the property of their respective owners.
Any discrepancies included in this prospectus between totals and the sums of the percentages and dollar amounts presented are due to rounding.
Industry and Market Data
Within this prospectus, we reference certain industry and sector information and statistics. We have obtained this information and statistics from various independent, third party sources. Nothing in the data used or derived from third party sources should be construed as advice. Some data and other information are also based on our good faith estimates, which are derived from our review of internal surveys and independent sources. We believe that these external sources and estimates are reliable, but have not independently verified them. Statements as to our market position are based on market data currently available to us. Although we are not aware of any misstatements regarding the demographic, economic, employment, industry and trade association data presented herein, these estimates involve inherent risks and uncertainties and are based on assumptions that are subject to change.
Implications of Being an Emerging Growth Company
As a company with less than $1,070,000,000 in revenues during our last fiscal year, we qualify as an “emerging growth company” under the Jumpstart Our Business Startups Act of 2012, or the JOBS Act. An
-ii-
Table of Contents
emerging growth company may take advantage of reduced reporting requirements and is relieved of certain other significant requirements that are otherwise generally applicable to public companies. As an emerging growth company:
| • | we may present only two years of audited financial statements and only two years of related management discussion and analysis of financial condition and results of operations; |
| • | we are exempt from the requirement to obtain an audit of our internal control over financial reporting under the Sarbanes-Oxley Act of 2002; |
| • | we are permitted to provide less extensive disclosure about our executive compensation arrangements; and |
| • | we are not required to give our stockholders non-binding advisory votes on executive compensation or golden parachute arrangements. |
We have elected to take advantage of the scaled disclosure requirements and other relief described above in this prospectus and may take advantage of these exemptions for so long as we remain an emerging growth company. We will remain an emerging growth company until the earliest of (i) the end of the fiscal year during which we have total annual gross revenues of $1,070,000,000 or more, (ii) the end of the fiscal year following the fifth anniversary of the completion of this offering, (iii) the date on which we have, during the previous three-year period, issued more than $1.0 billion in non-convertible debt and (iv) the end of the fiscal year in which the market value of our equity securities that are held by non-affiliates exceeds $700 million as of June 30 of that year.
In addition to scaled disclosure and the other relief described above, the JOBS Act permits us an extended transition period for complying with new or revised accounting standards affecting public companies. We have elected to take advantage of this extended transition period, which means that the financial statements included in this prospectus, as well as any financial statements that we file in the future, will not be subject to all new or revised accounting standards generally applicable to public companies for the transition period for so long as we remain an emerging growth company or until we affirmatively and irrevocably opt out of the extended transition period under the JOBS Act.
Reincorporation
In March 2017, Byline Bancorp, Inc., an Illinois corporation, or Byline Illinois, formed Byline Bancorp, Inc., a Delaware corporation, or Byline Delaware. On June 16, 2017, Byline Illinois merged with and into Byline Delaware, the registrant, with Byline Delaware surviving. In the merger, each share of Byline Illinois common stock issued and outstanding was converted automatically into the right to receive one fifth (0.20) of a share of common stock of Byline Delaware, with cash to be paid in lieu of fractional shares, and shares of each series of Byline Illinois’ preferred stock were converted into a substantially similar series of Byline Delaware preferred stock. Fractional shares will be paid in cash based on the initial public offering price of Byline Bancorp, Inc. common stock. We refer to these transactions as the “Reincorporation”. See “Reincorporation” for further information.
-iii-
Table of Contents
This summary provides a brief overview of important information regarding key aspects of the offering contained elsewhere in this prospectus. This summary does not contain all of the information that you should consider before deciding to invest in our common stock. You should read this entire prospectus carefully, including the more detailed information regarding the risks of purchasing our common stock in the sections titled “Risk Factors” and “Management’s Discussion and Analysis of Financial Condition and Results of Operations” and our consolidated financial statements and the related notes thereto, before making an investment decision.
Our Company
We are a bank holding company headquartered in Chicago, Illinois and conduct all our business activities through our subsidiary, Byline Bank, a full service commercial bank. We have been a part of the Chicago banking community for over 100 years and operate the fifth largest branch network in the City of Chicago with 56 branches in the Chicago metropolitan area. We offer a broad range of banking products and services to small and medium sized businesses, commercial real estate and financial sponsors, and to consumers who generally live or work near our branches. In addition to our traditional commercial banking business, we provide small ticket equipment leasing solutions and were the sixth most active Small Business Administration (“SBA”) lender in the United States as reported by the SBA for the year ended September 30, 2016. As of March 31, 2017, we had consolidated total assets of $3.3 billion, total gross loans and leases outstanding of $2.1 billion, total deposits of $2.6 billion and total stockholders’ equity of $389.7 million.
Our mission is to provide customers with a high degree of service, convenience and the products they need to achieve their financial objectives. We aim to do so one customer, one relationship and one neighborhood at a time. We believe that customers value convenience, prompt decision making and knowledge of the local market when choosing a banking partner. We distinguish ourselves from smaller competitors with the breadth and sophistication of our product capabilities, ranging from basic deposit accounts to cash-flow based loan facilities and cash management products; and we differentiate ourselves from larger competitors with our level of responsiveness, local decision making and the accessibility of our service. Given the large presence of out-of-state banks and the scarcity of local community banks that can competitively serve small and medium sized businesses, we see an attractive opportunity for Byline to be the bank that Chicago deserves.
Our culture is rooted in a set of core values that we refer to as the Things That Matter. These values underlie everything we do, including the way we engage with customers, collaborate with colleagues, do business and manage our resources. We believe our culture and the quality of our people have been catalysts of our success and will continue to propel our future.
In 2013, our predecessor, Metropolitan Bank Group, Inc. (“Metropolitan”), experienced significant credit and financial losses resulting primarily from the collapse of real estate prices during the Great Recession. Despite deterioration in asset quality and financial performance, Metropolitan maintained a high quality deposit base, an attractive branch network and strong customer loyalty, which made it an ideal candidate for a turnaround. Our Chief Executive Officer, Chief Financial Officer and Chairman led an investment group in the $207 million Recapitalization of Metropolitan, the largest recapitalization of a Chicago bank in over 25 years. Under a new leadership team headed by our Chief Executive Officer, Alberto Paracchini, we have built upon Metropolitan’s strengths and have restructured, refocused and rationalized Byline Bank to deliver growth and profitability. We also launched a new brand called Byline, which represented an important milestone in presenting our franchise under a unified name to our customers and employees.
Over the past four years, we have significantly improved our asset quality while adding $1.3 billion in net originated loans and leases to create a more diversified and balanced loan and lease portfolio. We
-1-
Table of Contents
aggressively reduced the level of troubled loans and other real estate owned in our portfolio, and our nonperforming assets, as a percentage of loans and real estate owned, declined to 1.0% as of March 31, 2017 from 28.2% as of March 31, 2013. In addition, we sought to optimize our deposit base by expanding the percentage of non-interest bearing deposits to total deposits, enhance online and mobile capabilities and broaden our cash management products to better meet our customers’ needs. During this period, we consolidated from 88 to 57 branches, reducing our costs with minimal deposit attrition, and improved our efficiency, including through the consolidation of multiple banking platforms into one. In addition to improving efficiency, consolidating our banking platforms allowed us to better monitor operations while strengthening our governance and controls.
The table below details our transformation:
| What We Were |
What We Are |
|||||||
| At and for the three months ended 3/31/2013 |
At and for the three 3/31/2017 |
|||||||
| Deposit Franchise |
||||||||
| # of Bank Brand Names |
12 | 1 | ||||||
| # of Branches |
88 | 57 | ||||||
| Non-interest bearing Deposits / Total Deposits |
26 | % | 28 | % | ||||
| Cost of Deposits (1) |
0.27 | % | 0.24 | % | ||||
| Deposits / Branch ($mm) |
$ | 26 | $ | 45 | ||||
| Loan and Lease Portfolio |
|
|||||||
| Total Loans and Leases(2) ($mm) |
$ | 1,542 | $ | 2,167 | ||||
| Loans and Leases / Deposits(3) |
68 | % | 84 | % | ||||
| Commercial & Industrial Loans / Total Loans & Leases |
3 | % | 21 | % | ||||
| Non-performing Assets / Loans & Leases + Other Real Estate Owned(4) |
28.2 | % | 1.0 | % | ||||
| Non-accrual & 90 Days or More Past Due Loans & Leases ($mm) |
$ | 258 | $ | 8 | ||||
| Other Real Estate Owned ($mm) |
$ | 116 | $ | 13 | ||||
| Capital |
|
|||||||
| Common Equity ($mm) |
($ | 31 | ) | $ | 364 | |||
| Common Equity/Assets |
(1.3 | %) | 11.1 | % | ||||
| Tangible Common Equity ($mm)(5) |
($ | 43 | ) | $ | 293 | |||
| Tangible Common Equity / Tangible Assets(5) |
(1.8 | %) | 9.1 | % | ||||
| Profitability |
||||||||
| Return on Average Assets |
(2.57 | %) | 0.80 | % | ||||
| Non-interest Expense / Average Assets |
4.96 | % | 3.53 | % | ||||
| Non-interest Income / Total Revenue |
(4.27 | %) | 29.41 | % | ||||
Source: SNL Financial and company management. Financial information as of and for the three months ended March 31, 2013 is derived from Metropolitan’s historical Consolidated Financial Statements for Holding Companies filed with the Federal Reserve Bank on Form FR Y-9C. The FR Y-9C reports were prepared by Metropolitan’s management team prior to the Recapitalization and may not reflect similar assumptions or accounting standards used in our financial statements. The financial information as of and for the three months ended March 31, 2013 included in this table has not been reviewed or audited by our independent registered public accounting firm and may not be directly comparable to Byline’s financial results for the quarter ended March 31, 2017.
| (1) | Represents annualized (meaning, recalculated as an annual rate) interest expense for the quarter divided by average total deposits for the quarter. |
| (2) | Represents total loans and leases held for sale and held for investment. |
| (3) | Represents total loans and leases held for sale and held for investment divided by total deposits. |
| (4) | Represents total non-performing assets, which includes nonaccrual loans and leases, troubled debt restructured loans and other real estate owned divided by total loans and leases held for investment and other real estate owned. |
| (5) | Represents a non-GAAP financial measure. See “GAAP Reconciliation and Management Explanation of Non-GAAP Financial Measures” for a reconciliation of our non-GAAP measures to the most directly comparable GAAP financial measure. |
-2-
Table of Contents
We plan to leverage our seasoned management team, the attractive market opportunity in the Chicago metropolitan area, our diversified lending approach and our track record of successfully integrating acquisitions to drive future growth. We believe that having a deep understanding of customers, longstanding ties to the communities in which we operate, a strong market position and exceptional employees allow us to provide the attention, responsiveness and customized service our clients seek while offering a diverse range of products to serve a variety of needs.
Our Products and Services
We are a full-service, commercial-focused community bank. We offer a broad range of loan and deposit products to commercial customers and consumers through multiple distribution channels.
Lending and leasing. We offer a comprehensive range of commercial loan products and services to our customers, including term loans, revolving lines of credit, construction loans and treasury management products. Commercial lending is a fundamental component of our business model. We focus on lending to small and medium sized businesses in the Chicago metropolitan area across a diverse range of industries. Loans originated or managed by commercial lending represented $1.6 billion, or 73%, of our total gross loans outstanding as of March 31, 2017. Our commercial lending business is supported by a seasoned lending team of 20 commercial bankers, averaging more than 17 years in the business as of March 31, 2017.
In October 2016, we acquired Ridgestone Financial Services, Inc., one of the nation’s leading SBA lenders. Ridgestone was the sixth most active SBA lender in the country and the most active SBA lender in Illinois and Wisconsin, as reported by the SBA for the year ended September 30, 2016. Ridgestone originated $472 million in loans under Section 7(a) of the SBA program, or 7(a) loans, for the SBA fiscal year ended September 30, 2016 and generated significant fee income from the sales of the government guaranteed portions of loans and servicing.
In 2014, we acquired a team of leasing professionals and a small ticket leasing portfolio from Baytree National Bank & Trust Company and Wells Fargo Corporation. As of March 31, 2017, we had a $163 million small ticket equipment leasing portfolio. At origination, the average leasing tickets were between $50,000 and $60,000.
We also offer consumer lending products, including mortgage loans, home equity loans and other consumer loans to individuals through our branch network. As part of our portfolio diversification and excess liquidity deployment strategies since the Recapitalization, we have periodically purchased portfolios of 1-4 family residential mortgage loans to complement our internal loan production. Given our core focus on commercial lending, we believe it is likely that the percentage of 1-4 family residential mortgage loans within our total loan portfolio will decrease over time.
Deposits. We offer traditional retail deposit products through our branch network, along with online, mobile and direct banking channels. The wide variety of deposit products we offer include non-interest bearing accounts, interest-bearing demand products, savings accounts, money market accounts and certificates of deposit. We also support our business clients with a variety of deposit and cash management products, along with a suite of business transaction accounts. We believe these tailored products allow us to provide a robust service offering to our clients and support their day-to-day funding needs.
-3-
Table of Contents
We Are Not Like the Other Guys
We believe the following strengths differentiate us from our competitors and will drive future growth:
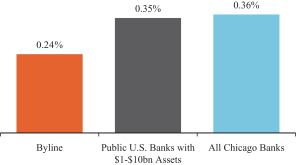
Core deposit franchise and focus. The quality of our deposit franchise and access to stable funding are key components of our success. We have a strong deposit franchise characterized by a high level of core deposits, high proportion of non-interest bearing accounts and relatively low funding costs. As of March 31,
2017, deposits accounted for 89% of total liabilities and core deposits, which we define as all deposits excluding time deposits exceeding $100,000, constituted 84% of our deposit base. We increased our percentage of non-interest bearing deposits from 27% at December 31, 2013 to 28% at March 31, 2017. Our cost of deposits was 0.24% for the quarter ended March 31, 2017.
| 2017 Q1 Deposit Mix
|
2017 Q1 Cost of Deposits
| |

|
|
Source: Company data and SNL Financial. Data as of March 31, 2017.
Our local presence and our scale are essential to the continued growth of our deposit base. Small businesses are a significant source of low cost deposits and represent opportunities for future growth. Small business owners value our ability to provide convenience and access to local, responsive decision makers. Commercial accounts also generally have higher deposit balances and transaction volumes than individual deposit accounts. As of March 31, 2017, commercial deposits represented 19% of total deposits.
Since the Recapitalization, we have consolidated from 88 to 57 branches, reducing our costs with minimal loss of deposits. Following the introduction of our Byline brand, customers now recognize us by a single name and we strive to deliver a consistent customer experience across our entire branch network. We have also enhanced our online and mobile capabilities and expanded our cash management products to meet our customers’ needs.
We believe that our Chicago branch network, service driven culture, diversified product offering and focus on small and medium sized businesses will allow us to accelerate deposit growth. We plan to continue investing in our brand, employees and product capabilities to further improve customer loyalty with a view toward growing our high quality deposit portfolio.
Seasoned management team and board of directors with a strong track record. Our seasoned executive management team has extensive local knowledge of the banking industry. Drawing on their experience and deep ties to the Chicago community, our management team successfully executed our turnaround strategy and guided our transformation while growing our franchise. Under their leadership, we have significantly improved asset
-4-
Table of Contents
quality, built a new, diversified loan and lease portfolio, strengthened our deposit base and improved our operating environment and controls, while also integrating two acquisitions. Our board of directors includes highly accomplished individuals with broad experience operating and working in the financial services industry and provides valuable insight to our business. We believe management’s track record of performance, guided by our board and a culture dedicated to maintaining the highest business and ethical standards and practices, will drive the continued growth of our franchise.
Our executive management team is led by veteran banking executives:
| • | Alberto J. Paracchini, our President and Chief Executive Officer, has over 24 years of experience in the Chicago financial services industry, having spent over 16 years at Popular, Inc., where he held numerous leadership positions in both its banking and mortgage subsidiaries, and serving as Principal at BXM Holdings, Inc. (“BXM”), an investment fund specializing in community banks, where he was a member of the team that led the Recapitalization. |
| • | Lindsay Corby, our Executive Vice President and Chief Financial Officer, has over 16 years of experience in the financial services industry, including as a Principal and member of the team at BXM that led the Recapitalization, and as a Vice President in the investment banking group of Keefe, Bruyette & Woods, Inc. |
| • | Timothy C. Hadro, our Chief Credit Officer and Head of the Special Assets Group for Byline Bank, has more than 42 years of lending experience, more than 34 years of experience in the Chicago banking industry and 31 years of experience at JPMorgan Chase and its predecessor organizations. |
Our board of directors includes highly accomplished individuals with strong track records:
| • | Roberto R. Herencia, our Chairman, is also Chairman of First BanCorp, and a director of Banner Corporation. Mr. Herencia is the current President and Chief Executive Officer of BXM, former President and Chief Executive Officer of Midwest Banc Holdings, Inc., and former Executive Vice President of Popular Inc.; |
| • | L. Gene Beube, former Executive Vice President and Chief Credit Officer of Banco Popular North America; |
| • | Phillip R. Cabrera, former Vice President and International Treasurer of McDonald’s Corporation; |
| • | Antonio del Valle Perochena, Chairman of Grupo Kaluz and Grupo Financiero BX+ and director of Elementia S.A.B. de C.V. and Mexichem, S.A.B. de C.V., holding companies for financial, industrial and construction enterprises, and former Executive Vice President of Insurance and Pensions of ING Group, Mexico; |
| • | Jaime Ruiz Sacristán, Founder and Chairman of the board of directors of BX+, director of Elementia S.A.B. de C.V., Mexichem, S.A.B. de C.V. and Banco Popular Español, S.A., Chairman of the Mexican Stock Exchange and former Chief Executive Officer of Grupo Financiero Bital; and |
| • | Steven M. Rull, Managing Director of Detalus Advisors, LLC and Detalus Securities, LLC and co-Founder of Manchester Partners. |
Attractive market opportunity. Chicago is the third largest metropolitan area in the U.S. and ranks in the top 10% of the U.S. by median household income. The city boasts a highly educated labor force with more than
-5-
Table of Contents
508,000 residents with bachelor’s degrees and an influx of approximately 158,000 college graduates annually. Due to its diversified economy, strong labor force and low cost of doing business compared to other large metropolitan areas, more than 400 major corporations are headquartered in Chicago, including 31 Fortune 500 companies. There are over 27,000 small and medium sized businesses in Chicago that generate between $5 million and $75 million in annual revenue, which we view as our target commercial customers. More recently, Chicago was named by KPMG as one of the top 10 technology innovation hubs worldwide, with Chicago based startups and tech companies having raised a combined $3.4 billion in capital in 2015 and 2016.
The graphs below show Chicago’s diverse labor force and its lower cost of doing business as compared to other major U.S. cities.
| Chicago’s Diverse Labor Force | Cost of Doing Business Index | |
|
|
|
Source: Bureau of Labor Statistics State and Metro Area Employment and KPMG Competitive Alternatives 2016. Labor force data as of March 31, 2017. Business cost data as of December 31, 2016.
Note: Business costs are expressed as an index. An index below 100 indicates lower costs than the U.S. baseline. An index over 100 indicates higher costs than the U.S. baseline (e.g., an index of 95.0 represents costs 5.0% below the U.S. baseline). U.S. baseline is the average of the four largest U.S. metro areas.
-6-
Table of Contents
We believe the lack of similarly sized banks in the Chicago area creates a unique opportunity for us as we strive to provide broader and more sophisticated product capabilities than our smaller competitors while offering more responsive decision making and accessible service to local businesses and consumers than our larger competitors. The table below segments the Chicago bank landscape, which we believe illustrates the opportunity for smaller, local banks between $2 billion and $10 billion in assets:
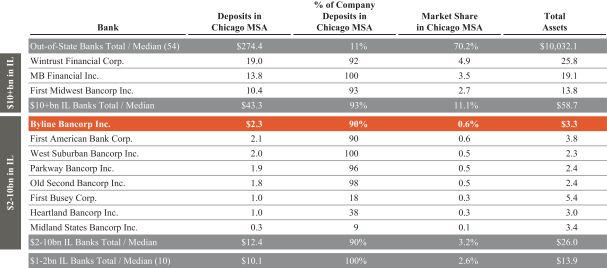
Source: SNL Financial. Deposit and market share data as of June 30, 2016 (giving pro forma effect to pending bank acquisitions) and includes deposits at branches that were subsequently closed. Asset data as of March 31, 2017.
Note: Excludes Northern Trust from $10+bn in IL group.
The table below illustrates the fragmented banking environment in Chicago, demonstrated through a number of significantly smaller banks in our market and a lack of medium sized banks compared to other large metropolitan areas in the U.S.:
| Chicago | Top 10 U.S. MSA Avg |
|||||||
| Percentage of Banks in Market <$1bn Assets |
81.6 | % | 69.1 | % | ||||
| Percentage of Banks in Market $1 – $10bn Assets |
12.8 | % | 23.8 | % | ||||
| Market Share of Top 3 Banks |
45.7 | % | 54.3 | % | ||||
| Market Share of Top 3 Local Banks |
11.1 | % | 18.1 | % | ||||
Source: SNL Financial. Data as of March 31, 2017.
Given the large number of businesses, the attractive demographics and the lack of medium sized local banks capable of serving small and medium sized businesses in our target market, we believe we are well positioned to capitalize on growth opportunities in this market.
Diversified loan growth approach. Our ability to originate loans and leases across a range of industries and product types helps us maintain a diversified loan and lease portfolio. Prior to June 2013, Metropolitan’s loan portfolio was primarily concentrated in commercial real estate. Since the Recapitalization, we have substantially diversified our loan and lease portfolio across various sectors, including commercial and industrial lending, leasing, U.S. government guaranteed loans and real estate loans, allowing us to efficiently manage our
-7-
Table of Contents
credit exposures and capitalize on more lending opportunities. We have also enhanced our product and lending capabilities with the addition of experienced lending teams hired from larger banks. Throughout this growth period we have maintained strong credit quality, and we intend to continue diversifying both our origination sources and types of loans and leases in the future.
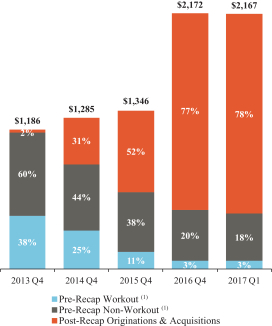
The graphs below show the increased diversification of our loan and lease portfolio from June 30, 2013 to March 31, 2017.
| Breakdown of Loan and Lease Portfolio
| ||
| June 30, 2013 | March 31, 2017 | |
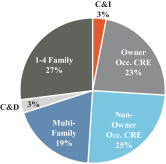
|
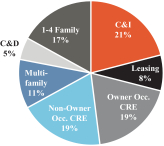
| |
The graph below shows the increasing credit quality of our loan portfolio from the fourth quarter of 2013 to the first quarter of 2017.
Loan Portfolio Over Time
($ in millions)
-8-
Table of Contents
Data as of December 31, 2013, December 31, 2014, December 31, 2015, December 31, 2016 and March 31, 2017.
(1) Workout loans are managed by our Special Assets Group.
Disciplined credit risk management framework. Risk management is a core competency of our business, demonstrated by the strong credit performance of loans originated since the Recapitalization. We have implemented comprehensive policies and procedures for credit underwriting and monitoring of our loan portfolio. The sound credit practices followed by our relationship bankers allow credit decisions to be made efficiently on a local basis consistent with our underwriting standards. We attribute our success to a strong credit culture, the continuous evaluation of risk and return and the strict separation between business development and credit decision making. We are committed to reviewing and monitoring limits set at the loan, relationship, product and portfolio levels. We believe our robust approach to risk management has enabled us to grow our loan and lease portfolio without compromising credit quality.
The graph below shows the decrease in nonperforming assets in our loan portfolio from the fourth quarter of 2013 to the first quarter of 2017.
Evolution of NPAs
($ in millions)
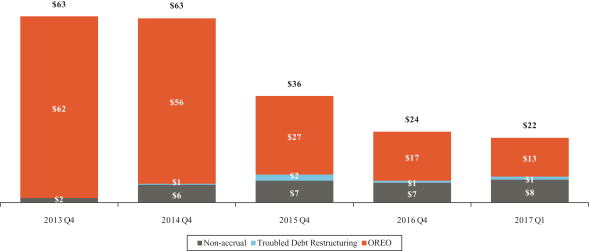
Data as of December 31, 2013, December 31, 2014, December 31, 2015, December 31, 2016 and March 31, 2017.
Premier SBA lending platform enhances fee income. Our acquisition of Ridgestone, completed in October 2016, provides us with a scalable lending platform focused on the origination and servicing of government guaranteed loans. Ridgestone was the most active originator of SBA loans in Illinois and Wisconsin, the second most active originator of SBA loans in Indiana and the sixth most active originator of SBA loans in the United States as reported by the SBA for the year ended September 30, 2016. Ridgestone originated $472 million in 7(a) loans for the SBA fiscal year ended September 30, 2016 and generated significant servicing fee income as well as income from sales of the government guaranteed portions of loans. We believe the combination of the talent, infrastructure and product knowledge we obtained through the acquisition provides us with significant opportunities for additional growth in the government guaranteed loan business throughout the country as Byline Small Business Capital.
-9-
Table of Contents
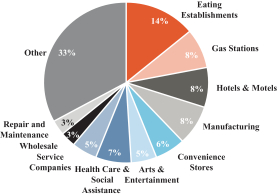
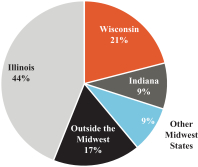
The graphs below show the diversification, by industry and geography, of our Small Business Capital lending portfolio.
| Industry Concentration |
Geographic Concentration | |
|
| |
Data for Small Business Capital as of March 31, 2017.
Our Growth Strategy
We believe we can continue to grow our business and create stockholder value by executing the following strategies:
Capitalize on the attractive Chicago banking opportunity. Chicago has been our home for over 100 years and we believe Chicago residents and businesses exhibit the same loyalty as we do toward our hometown. We have a deep understanding of our customers and the communities that we serve. Given the market opportunity for a commercial bank of our size and the scarcity of banks within the $2 billion to $10 billion asset range, we see a significant opportunity for Byline to gain market share in the Chicago area.
Focus on organic growth. We intend to grow our business organically in a focused and strategic manner. We also intend to maintain an asset sensitive balance sheet, which positions us to benefit in a rising interest rate environment. Our staff, systems and organizational structure have been built to support a larger organization. Over the past four years, we have hired new lending and leasing teams and expanded the breadth of our lending and leasing products. We believe that our overall capabilities, culture and opportunities for career growth will allow us to continue to attract talented new commercial and retail bankers to our business and enable our existing banking teams to drive loan growth. We also believe our bankers have further capacity to penetrate the markets and communities they serve as the brand awareness of Byline Bank continues to grow.
Consider opportunistic acquisitions. We are currently focused on organic growth, but we may consider smaller bank acquisitions that fit within the deposit strength and commercial orientation of our franchise, as well as other non-bank acquisitions. In the future, we may evaluate and act upon acquisition opportunities that we believe could produce attractive returns for our stockholders. In particular, we believe that there will be further bank consolidation in the Chicago metropolitan area and that we are well positioned to be a preferred partner for smaller institutions looking to exit. We have successfully completed two acquisitions in the past three years, both accretive to our franchise value. Our management team has over 82 years of combined experience, including structuring and integrating transactions, which we believe provides an advantage in identifying and executing on strategically and financially compelling opportunities that will supplement our organic growth strategy.
-10-
Table of Contents
Leverage our culture and talent. We have focused intensely on developing a distinct culture guided by a core set of values that we refer to as the Things That Matter. These values underlie everything we do and are designed to foster open communication and full transparency among our colleagues. Consistent with our belief that it is important to invest in our people, over the past four years, we have enhanced our compensation programs, employee benefits and training programs as well as upgraded our workspaces. We believe these investments will enable us to retain and attract talent that fits our team concept and culture. In connection with the Recapitalization, we replaced all senior management of Metropolitan and a significant majority of its lending staff. Many of our new employees hired since then have come from larger banks and have sophisticated product knowledge. We view our team as action-oriented and energized by the opportunities in our markets. We believe that our culture and the quality of our people have been catalysts of our success and will continue to propel our future.
Improve our operating leverage. We plan to focus on the following strategies to further drive our operating efficiency:
| • | Lower operating expenses related to legacy loan and owned real estate workout activities |
| • | Pursue opportunities to drive higher fee income from our account base through the increased use of our treasury management services and the sales of other products and services to loan and lease customers |
| • | Continue to increase our average deposits per branch while adapting to changing consumer behavior |
| • | Invest in technology to automate processes in order to gain scale and reduce unit costs |
Risks Related to Our Company
An investment in our common stock involves substantial risks and uncertainties. Investors should carefully consider all of the information in this prospectus, including the detailed discussion of these risks under “Risk Factors” beginning on page 18, prior to investing in our common stock. Some of the more significant risks include the following:
| • | Our business may be adversely affected by conditions in the financial markets and economic conditions in the markets in which we and our customers operate generally. |
| • | The City of Chicago and State of Illinois currently face significant financial difficulties, which could adversely affect our business. |
| • | Our business is significantly dependent on the real estate markets in which we operate, as a significant percentage of our loan and lease portfolio is secured by real estate. |
| • | We may underestimate the credit losses inherent in our loan and lease portfolio and have credit losses in excess of the amount we provide for loan and lease losses. |
| • | Lack of seasoning of our loan and lease portfolio could increase the risk of credit defaults in the future. |
| • | We operate in a highly competitive and changing industry and market area. |
-11-
Table of Contents
| • | Our business is subject to interest rate risk and fluctuations in interest rates may adversely affect our earnings. |
| • | U.S. government guaranteed lending is an important part of our business. Our U.S. government guaranteed lending program is dependent upon the federal government, and we face specific risks associated with originating U.S. government guaranteed loans. |
| • | Liquidity risks could affect operations and jeopardize our business, financial condition, and results of operations. |
| • | The occurrence of fraudulent activity, including events that occurred prior to the Recapitalization, breaches or failures of our information security controls or cybersecurity-related incidents could have a material adverse effect on our business, financial condition and results of operations. |
| • | We depend on information technology and telecommunications systems of third parties, and any systems failures, interruptions or data breaches involving these systems could adversely affect our operations and financial condition. |
| • | We may not be able to maintain consistent growth, earnings or profitability. |
| • | We may not be able to attract and retain key personnel and other skilled employees. |
| • | Our ability to recognize the benefits of deferred tax assets is dependent on future cash flows and taxable income and the value of our deferred tax assets could be significantly reduced if corporate tax rates in the United States decline. |
| • | The banking industry is highly regulated, and the regulatory framework, together with any future legislative or regulatory changes, may have a significant adverse effect on our operations. |
| • | Certain of our activities are restricted due to commitments entered into with the Federal Reserve by us and certain of our foreign national stockholders. |
| • | Adverse regulatory actions resulting from an examination by federal or state regulators could have a material adverse effect on our business, financial condition and results of operations. |
| • | Litigation and regulatory actions, including possible enforcement actions and investigations, could subject us to significant fines, penalties, judgments, publicity or other requirements resulting in increased expenses or restrictions on our business activities, diversion of management attention or damage to our reputation. |
| • | Our stock price may be volatile, and you could lose part or all of your investment as a result. |
Our Corporate Information
We were originally incorporated in Illinois on December 29, 1978 as North Community Bancorp, Inc., which owned Metropolitan Bank and Trust Company, a bank that was chartered in 1914. The name of the company was changed on December 28, 1987 to Illinois Financial Services, Inc., and again on July 18, 1995, to Metropolitan Bank Group, Inc. In 2015, we changed our name to Byline Bancorp, Inc. Prior to this offering, we reincorporated as a Delaware corporation.
-12-
Table of Contents
We are headquartered at 180 North LaSalle Street, Suite 300, Chicago, IL 60601 and our telephone number is (773) 244-7000. Our website address is www.bylinebank.com. Information contained on, or that can be accessed through, our website is not incorporated by reference into this prospectus, and you should not consider information on our website to be part of this prospectus.
-13-
Table of Contents
| Common stock offered by us |
3,775,194 shares |
| Common stock offered by selling stockholders |
1,924,806 shares |
| Option to purchase additional shares |
855,000 shares from us |
| Common stock to be outstanding after this offering |
28,391,900 shares of common stock (or 29,246,900 shares if the underwriters exercise in full their option to purchase additional shares from us) |
| Use of proceeds |
We estimate that the net proceeds to us from the sale of our common stock in this offering will be approximately $66.4 million, or approximately $82.4 million if the underwriters elect to exercise in full their option to purchase additional shares from us, assuming an initial public offering price of $20.00 per share, the midpoint of the price range set forth on the cover of this prospectus, and after deducting underwriting discounts and commissions and estimated offering expenses. We intend to use the net proceeds from this offering to repay the outstanding balance under our credit agreement of approximately $16.2 million as of June 19, 2017, to repurchase, subject to regulatory approval, all outstanding shares of our Series A Preferred Stock for approximately $26.8 million and for general corporate purposes. We will not receive any proceeds from the sale of shares of common stock by the selling stockholders. See “Use of Proceeds”. |
| Voting rights |
Each holder of our common stock will be entitled to one vote per share on all matters on which our stockholders generally are entitled to vote. See “Description of Capital Stock” for more information. |
| Dividend policy |
We do not expect to pay cash dividends on our common stock in the near-term. Instead, we anticipate that all of our future earnings will be retained to support our operations and finance the growth and development of our business. Any future determination to pay dividends on our common stock will be made by our board of directors and will depend upon our results of operations, financial condition, capital requirements, regulatory and contractual restrictions, our business strategy and other factors that our board of directors deems relevant. See “Dividend Policy and Dividends”. |
| Preemptive rights |
Purchasers of our common stock sold in this offering will not have any preemptive rights. |
| Listing |
Our common stock has been approved for listing, subject to official notice of issuance, on the New York Stock Exchange (the “NYSE”), under the symbol “BY”. |
| Reserved Share Program |
At our request, the underwriters have reserved for sale, at the initial public offering price, up to 10% of the shares offered by this |
-14-
Table of Contents
| prospectus for sale to the directors, senior management, existing stockholders, certain employees of Byline Bancorp, Inc. and Byline Bank and persons having relationships with us. If these persons purchase reserved shares, it will reduce the number of shares available for sale to the general public. Any reserved shares that are not so purchased will be offered by the underwriters to the general public on the same terms as the other shares offered by this prospectus. |
| Risk factors |
Investing in our common stock involves significant risks. See “Risk Factors”, beginning on page 18, for a discussion of certain factors that you should carefully consider before deciding to invest in our common stock. |
Unless we specifically state otherwise, all information in this prospectus is as of the date set forth on the front cover of this prospectus and:
| • | assumes no exercise of the underwriters’ option to purchase additional shares of our common stock; |
| • | assumes that the common stock to be sold in this offering is sold at $20.00 per share, which is the midpoint of the price range set forth on the front cover of this prospectus; |
| • | assumes no exercise of the 628,814 stock options that were outstanding and exercisable as of March 31, 2017; and |
| • | excludes shares of common stock that may be granted under our equity incentive plan we have adopted in connection with this offering, including grants to be made at the completion of this offering. |
We have reserved an aggregate of 1,750,000 shares of our common stock for issuance under our equity incentive plan and employee stock purchase plan. In connection with this offering, we intend to make a special one-time grant of restricted share awards under our equity incentive plan with approximately 58,900 shares of our common stock underlying the special one-time grant of restricted shares to be granted to certain of our employees, including certain of our named executives officers. These restricted shares will cliff vest on the third anniversary of the grant date, subject to continued employment. See “Executive and Director Compensation – Anticipated Changes to Our Compensation Program Following This Offering” for additional information regarding our equity incentive plan and grants we intend to make at the completion of this offering.
-15-
Table of Contents
SUMMARY HISTORICAL CONSOLIDATED FINANCIAL AND OPERATING INFORMATION
You should read the summary historical consolidated financial and operating data set forth below in conjunction with the sections titled “Management’s Discussion and Analysis of Financial Condition and Results of Operations” and “Capitalization”, as well as our consolidated financial statements and the related notes included elsewhere in this prospectus. The following table summarizes certain selected consolidated financial data for the periods presented. Our historical results may not be indicative of our future performance. The summary historical consolidated financial and operating information presented below contains financial measures that are not presented in accordance with accounting principles generally accepted in the United States (“GAAP”) and have not been audited. See “GAAP Reconciliation and Management Explanation of Non-GAAP Financial Measures”.
| Dollars in thousands except share and per share data | (unaudited) As of and for the quarter ended March 31, |
As of and for the year ended December 31, | ||||||||||||||||||
| 2017 | 2016 | 2016 | 2015 | 2014 | ||||||||||||||||
| Income Statement Data |
||||||||||||||||||||
| Interest income |
$ | 32,488 | $ | 22,877 | $ | 98,365 | $ | 83,263 | $ | 89,636 | ||||||||||
| Interest expense |
2,950 | 1,757 | 7,747 | 6,631 | 5,546 | |||||||||||||||
| Net interest income |
29,538 | 21,120 | 90,618 | 76,632 | 84,090 | |||||||||||||||
| Provision for loan and lease losses |
1,891 | 2,513 | 10,352 | 6,966 | 5,711 | |||||||||||||||
| Net interest income, after provision for loan and lease losses |
27,647 | 18,607 | 80,266 | 69,666 | 78,379 | |||||||||||||||
| Non-interest income |
12,308 | 4,288 | 25,904 | 20,839 | 18,253 | |||||||||||||||
| Non-interest expense |
28,851 | 24,487 | 100,686 | 105,172 | 97,919 | |||||||||||||||
| Income (loss) before income taxes |
11,104 | (1,592 | ) | 5,484 | (14,667 | ) | (1,287 | ) | ||||||||||||
| Provision (benefit) for income taxes |
4,544 | (240 | ) | (61,245 | ) | 307 | — | |||||||||||||
| Net income (loss) |
6,560 | (1,352 | ) | 66,729 | (14,974 | ) | (1,287 | ) | ||||||||||||
| Basic earnings (loss) per share |
$ | 0.26 | ($ | 0.08 | ) | $ | 3.31 | ($ | 0.86 | ) | ($ | 0.07 | ) | |||||||
| Diluted earnings (loss) per share |
$ | 0.25 | ($ | 0.08 | ) | $ | 3.27 | ($ | 0.86 | ) | ($ | 0.07 | ) | |||||||
| Weighted-average outstanding shares (basic) |
24,616,706 | 17,522,226 | 20,141,630 | 17,332,775 | 17,332,775 | |||||||||||||||
| Weighted-average outstanding shares (diluted)(1) |
25,078,427 | 17,522,226 | 20,430,783 | 17,332,775 | 17,332,775 | |||||||||||||||
| Balance Sheet Data |
||||||||||||||||||||
| Loans and leases held for investment, net before allowance for loan and lease losses(2) |
$ | 2,143,534 | $ | 1,503,495 | $ | 2,148,011 | $ | 1,345,437 | $ | 1,284,969 | ||||||||||
| Loans and leases held for sale |
23,492 | 214 | 23,976 | 268 | 351 | |||||||||||||||
| Allowance for loan and lease losses (ALLL) |
11,817 | 7,903 | 10,923 | 7,632 | 4,794 | |||||||||||||||
| Acquisition accounting adjustments(3) |
41,024 | 19,566 | 43,242 | 19,171 | 69,834 | |||||||||||||||
| Interest-bearing deposits in other banks |
67,726 | 28,694 | 28,798 | 23,572 | 133,281 | |||||||||||||||
| Investment securities |
723,404 | 797,845 | 747,406 | 879,192 | 689,373 | |||||||||||||||
| Assets held for sale |
13,666 | 2,259 | 14,748 | 2,259 | — | |||||||||||||||
| Other real estate owned, net |
13,173 | 24,466 | 16,570 | 26,715 | 56,181 | |||||||||||||||
| Goodwill and other intangibles |
71,033 | 47,273 | 71,801 | 48,014 | 50,891 | |||||||||||||||
| Servicing assets |
21,223 | — | 21,091 | — | — | |||||||||||||||
| Total assets |
3,284,713 | 2,561,081 | 3,295,830 | 2,479,870 | 2,376,449 | |||||||||||||||
| Total deposits |
2,575,839 | 2,248,563 | 2,490,394 | 2,180,624 | 2,100,057 | |||||||||||||||
| Total liabilities |
2,895,030 | 2,330,071 | 2,913,172 | 2,291,596 | 2,167,378 | |||||||||||||||
| Total stockholders’ equity |
389,683 | 231,010 | 382,658 | 188,274 | 209,071 | |||||||||||||||
| Book value per common share |
14.80 | 11.08 | 14.51 | 10.00 | 11.20 | |||||||||||||||
| Tangible book value per common share(4) |
11.91 | 8.66 | 11.59 | 7.23 | 8.26 | |||||||||||||||
| Performance Ratios |
||||||||||||||||||||
| Net interest margin |
4.04 | % | 3.60 | % | 3.59 | % | 3.44 | % | 3.88 | % | ||||||||||
| Efficiency ratio(5) |
67.11 | 93.44 | 83.83 | 104.84 | 92.78 | |||||||||||||||
| Non-interest expense to average assets |
3.53 | 3.82 | 3.66 | 4.22 | 4.03 | |||||||||||||||
| Pre-tax pre-provision return (loss) on average assets(4) |
1.59 | 0.14 | 0.57 | (0.31 | ) | 0.18 | ||||||||||||||
| Return on average stockholders’ equity |
6.83 | (2.81 | ) | 27.93 | (7.21 | ) | (0.62 | ) | ||||||||||||
| Return on average assets |
0.80 | (0.21 | ) | 2.42 | (0.60 | ) | (0.05 | ) | ||||||||||||
-16-
Table of Contents
| Dollars in thousands except share and per share data | (unaudited) As of and for the quarter ended March 31, |
As of and for the year ended December 31, | ||||||||||||||||||
| 2017 | 2016 | 2016 | 2015 | 2014 | ||||||||||||||||
| Asset Quality Ratios |
||||||||||||||||||||
| Non-performing loans and leases / total loans and leases held for investment, net before ALLL |
0.41 | % | 0.58 | % | 0.34 | % | 0.69 | % | 0.62 | % | ||||||||||
| ALLL / total loans and leases held for investment, net before ALLL |
0.55 | 0.53 | 0.51 | 0.57 | 0.37 | |||||||||||||||
| Net charge-offs (recoveries) / average total loans and leases held for investment, net before ALLL(7) |
0.19 | 0.62 | 0.42 | 0.33 | 0.14 | |||||||||||||||
| Capital Ratios |
||||||||||||||||||||
| Common equity to assets |
11.09 | % | 8.43 | % | 10.84 | % | 6.99 | % | 8.17 | % | ||||||||||
| Tangible common equity to tangible assets(4) |
9.12 | 6.71 | 8.85 | 5.15 | 6.16 | |||||||||||||||
| Leverage ratio |
9.59 | 8.83 | 10.07 | 7.85 | 8.08 | |||||||||||||||
| Tier 1 common ratio(6) |
10.85 | 10.44 | 11.20 | 8.92 | 11.30 | |||||||||||||||
| Tier 1 ratio |
12.94 | 13.43 | 12.78 | 12.00 | 13.37 | |||||||||||||||
| Total capital ratio |
13.49 | 13.94 | 13.28 | 12.51 | 13.73 | |||||||||||||||
| (1) | Due to losses in the first quarter 2016 and for the years ended December 31, 2015 and 2014, zero incremental shares are included because the effect would be anti-dilutive. |
| (2) | Represents loans and leases, net of acquisition accounting adjustments, unearned deferred fees and costs and initial direct costs. |
| (3) | Represents the remaining unamortized premium or unaccreted discount as a result of applying the fair value adjustment at the time of the business combination on acquired loans. |
| (4) | Represents a non-GAAP financial measure. See “GAAP Reconciliation and Management Explanation of Non-GAAP Financial Measures” for a reconciliation of our non-GAAP measures to the most directly comparable GAAP financial measure. |
| (5) | Represents non-interest expense less amortization of intangible assets divided by net interest income and non-interest income. |
| (6) | Ratio not effective until January 1, 2015 but presented for comparison purposes only. |
| (7) | Ratio annualized for the three month period ended March 31, 2017 and 2016. |
-17-
Table of Contents
Investing in our common stock involves a significant degree of risk. The material risks and uncertainties that management believes affect us are described below. Before investing in our common stock, you should carefully consider the risks and uncertainties described below, in addition to the other information contained in this prospectus. Any of the following risks, as well as risks that we do not know or currently deem immaterial, could have a material adverse effect on our business, financial condition or results of operations. As a result, the trading price of our common stock could decline, and you could lose some or all of your investment. Further, to the extent that any of the information in this prospectus constitutes forward-looking statements, the risk factors below are cautionary statements identifying important factors that could cause actual results to differ materially from those expressed in any forward-looking statements made by us or on our behalf. See “Cautionary Note Regarding Forward-Looking Statements”.
Risks Related to Our Business
Credit and Interest Rate Risks
Our business depends on our ability to successfully manage credit risk.
The operation of our business requires us to manage credit risk. As a lender, we are exposed to the risk that our borrowers will be unable to repay their loans and leases according to their terms, and that the collateral securing repayment of their loans, if any, may not be sufficient to ensure repayment. In addition, there are risks inherent in making any loan, including risks with respect to the period of time over which the loan may be repaid, risks relating to proper loan underwriting, risks resulting from changes in economic and industry conditions and risks inherent in dealing with individual borrowers, including the risk that a borrower may not provide information to us about its business in a timely manner, and/or may present inaccurate or incomplete information to us, and risks relating to the value of collateral. In order to manage credit risk successfully, we must, among other things, maintain disciplined and prudent underwriting standards and ensure that our bankers follow those standards. The weakening of these standards for any reason, such as an attempt to attract higher yielding loans, a lack of discipline or diligence by our employees in underwriting and monitoring loans, the inability of our employees to adequately adapt policies and procedures to changes in economic or any other conditions affecting borrowers and the quality of our loan portfolio, may result in loan defaults, foreclosures and additional charge-offs and may necessitate that we significantly increase our allowance for loan and lease losses, each of which could adversely affect our net income. As a result, our inability to successfully manage credit risk could have a material adverse effect on our business, financial condition or results of operations.
We may underestimate the credit losses inherent in our loan and lease portfolio and have credit losses in excess of the amount we provide for loan and lease losses.
The credit quality of our loan and lease portfolio can have a significant impact on our earnings. We maintain an allowance for loan and lease losses, which is a reserve established through a provision for loan and lease losses charged to expense representing management’s best estimate of probable losses that may be incurred within our existing portfolio of loans and leases. The allowance, in the judgment of management, is necessary to reserve for estimated loan and lease losses and risks inherent in our loan and lease portfolio. The level of the allowance reflects management’s continuing evaluation of specific credit risks; the quality of the loan and lease portfolio; the value of the underlying collateral; the level of non-accruing loans and leases; incurred losses inherent in the current loan and lease portfolio; and economic, political and regulatory conditions. Given our limited history in making loans since the Recapitalization, we do not have adequate historical data on loans made by Byline to calculate loan allowances primarily based on Byline’s historical loan experience and, as a result, we calculate loan allowances and reserves, in part, based on industry and peer data, which could increase the subjectivity of the calculation. In accordance with GAAP for business combination accounting, the loans acquired through the Recapitalization and the acquisition of Ridgestone were recorded at their estimated fair
-18-
Table of Contents
value. Therefore, there was no allowance for loan losses associated with those loans at acquisition. Management continues to evaluate the allowance needed on the acquired loans factoring in the net remaining discount ($41.0 million at March 31, 2017).
For our loans and leases, we perform loan reviews and grade loans on an ongoing basis, and we estimate and establish reserves for credit risks and credit losses inherent in our credit exposure (including unfunded lending commitments). The objective of our loan review and grading procedures is to identify existing or emerging credit quality problems so that appropriate steps can be initiated to avoid or minimize future losses. This process, which is critical to our financial results and condition, requires difficult, subjective and complex judgments of loan collectability. As is the case with any such assessments, there is always the chance that we will fail to identify the proper factors or that we will fail to estimate accurately the impact of factors that we do identify.
Although we believe our allowance for loan and lease losses is adequate to absorb probable and reasonably estimable losses in our loan and lease portfolio, this allowance may not be sufficient. We could sustain credit losses that are significantly higher than the amount of our allowance for loan and lease losses. Higher credit losses could arise for a variety of reasons, such as changes in economic conditions affecting borrowers, new information regarding our loans and leases and other factors within and outside our control. If real estate values were to decline or if economic conditions in our markets were to deteriorate unexpectedly, additional loan and lease losses not incorporated in the existing allowance for loan and lease losses might occur. Losses in excess of the existing allowance for loan and lease losses will reduce our net income and could have a material adverse effect on our business, financial condition or results of operations. A severe downturn in the economy generally, in our markets specifically or affecting the business and assets of individual customers, would generate increased charge-offs and a need for higher reserves.
As of March 31, 2017, our allowance for loan and lease losses as a percentage of total loans and leases was 0.55% and as a percentage of total nonperforming loans and leases was 133.57%. Additional credit losses will likely occur in the future and may occur at a rate greater than we have previously experienced. We may be required to take additional provisions for loan and lease losses in the future further to supplement the allowance for credit losses, either due to management’s assessment that the allowance is inadequate or requirements by our banking regulators. In addition, bank regulatory agencies will periodically review our allowance for loan and lease losses, the policies and procedures we use to determine the level of the allowance and the value attributed to nonperforming loans or to real estate acquired through foreclosure. Such regulatory agencies may require us to make further provisions or recognize future charge-offs. Further, if charge-offs in future periods exceed the allowance for loan and lease losses, we may need additional adjustments to increase the allowance for loan and lease losses.
In addition, in June 2016, the Financial Accounting Standards Board (the “FASB”) issued a new accounting standard that will replace the current approach under GAAP for establishing allowances for loan and lease losses, which generally considers only past events and current conditions, with a forward-looking methodology that reflects the expected credit losses over the lives of financial assets, starting when such assets are first originated or acquired. Under the revised methodology, credit losses will be measured based on past events, current conditions and reasonable and supportable forecasts of future conditions that affect the collectability of financial assets. The new standard is expected to result in increases to allowance levels generally and will require the application of the revised methodology to existing financial assets through a one-time adjustment to retained earnings upon initial effectiveness. The standard will be effective for us in 2020 or, if we remain an emerging growth company and continue to elect not to opt out of the extended transition period for new accounting standards, 2021. See Note 2 of Byline’s Consolidated Financial Statements as of December 31, 2016 and 2015 for additional information about the standard.
Any increases in our allowance for credit losses will result in a decrease in net income and may reduce retained earnings and capital and, therefore, have a material adverse effect on our business, financial condition and results of operations.
-19-
Table of Contents
Greater seasoning of our loan portfolio could increase risk of credit defaults in the future.
A significant portion of our loan portfolio is of relatively recent origin. The average age of our loans originated following the Recapitalization as of March 31, 2017 is 2.8 years. Normally, loans do not begin to show signs of credit deterioration or default until they have been outstanding for some period of time (which varies by loan duration and loan type), a process referred to as “seasoning”. As a result, a portfolio of more seasoned loans may more predictably follow a bank’s historical default or credit deterioration patterns than a newer portfolio. Because 61.4% of our portfolio has been originated since the Recapitalization, the current level of delinquencies and defaults may not represent the level that may prevail as the portfolio becomes more seasoned. If delinquencies and defaults increase, we may be required to increase our provision for loan and lease losses, which could have a material adverse effect on our business, financial condition and results of operations.
Our business, profitability and liquidity may be adversely affected by deterioration in the credit quality of, or defaults by, third parties who owe us money, securities or other assets or whose securities or obligations we hold.
In addition to relying on borrowers to repay their loans and leases, we are exposed to the risk that third parties that owe us money, securities or other assets will not perform their obligations. These parties may default on their obligations to us due to bankruptcy, lack of liquidity, operational failure or other reasons. A default by a significant market participant, or concerns that such a party may default, could lead to significant liquidity problems, losses or defaults by other parties, which in turn could adversely affect us.
We are also subject to the risk that our rights against third parties may not be enforceable in all circumstances. Deterioration in the credit quality of third parties whose securities or obligations we hold, including the Federal Home Loan Mortgage Corporation, Government National Mortgage Corporation and municipalities, could result in significant losses.
Our business is subject to interest rate risk and fluctuations in interest rates may adversely affect our earnings.
Fluctuations in interest rates may negatively affect our banking business and may weaken demand for some of our products. Our earnings and cash flows are largely dependent on net interest income, which is the difference between the interest income that we earn on interest earning assets, such as investment securities and loans, and the interest expense that we pay on interest-bearing liabilities, such as deposits and borrowings. Additionally, changes in interest rates also affect the premiums we may receive in connection with the sale of SBA and United States Department of Agriculture (“USDA”) (together, “U.S. government guaranteed”) loans in the secondary market, pre-payment speeds of loans for which we own servicing rights, our ability to fund our operations with customer deposits and the fair value of securities in our investment portfolio. Therefore, any change in general market interest rates, including changes in federal fiscal and monetary policies, can have a significant effect on our net interest income and results of operations.
We seek to mitigate our interest rate risk by entering into interest rate swaps and other interest rate derivative contracts from time to time with counterparties. Our hedging strategies rely on assumptions and projections regarding interest rates, asset levels and general market factors and subject us to counterparty risk. There is no assurance that our interest rate mitigation strategies will be successful and if our assumptions and projections prove to be incorrect or our hedging strategies do not adequately mitigate the impact of changes in interest rates, we may incur losses that could adversely affect our earnings.
Our interest earning assets and interest-bearing liabilities may react in different degrees to changes in market interest rates. Interest rates on some types of assets and liabilities may fluctuate prior to changes in broader market interest rates, while rates on other types of assets and liabilities may lag behind. The result of
these changes to rates may cause differing spreads on interest earning assets and interest-bearing liabilities. Although we take measures intended to manage the risks from changes in market interest rates, we cannot control or accurately predict changes in market rates of interest or be sure our protective measures are adequate.
-20-
Table of Contents
Interest rates are volatile and highly sensitive to many factors that are beyond our control, such as economic conditions and policies of various governmental and regulatory agencies, and, in particular U.S. monetary policy. For example, we face uncertainty regarding the interest rate risk, and resulting effect on our portfolio, that could result if the Board of Governors of the Federal Reserve System (the “Federal Reserve”) reduces the amount of securities it holds on its balance sheet. In recent years, it has been the policy of the Federal Reserve to maintain interest rates at historically low levels through a targeted federal funds rate and the purchase of U.S. Treasury and mortgage-backed securities. As a result, yields on securities we have purchased, and market rates on the loans we have originated, have been at levels lower than were available prior to the Great Recession. Consequently, the average yield on banks’ interest-earning assets has generally decreased during the current low interest rate environment. If a low interest rate environment persists, we may be unable to increase our net interest income.
As of March 31, 2017, we had $732.3 million of non-interest bearing transaction accounts and $192.3 million of interest-bearing transaction accounts. Current interest rates for interest-bearing accounts are very low due to current market conditions. However, we do not know what market rates will eventually be, especially as the Federal Reserve increases interest rates. If we need to offer higher interest rates on checking accounts to maintain current clients or attract new clients, our interest expense will increase, perhaps materially. Furthermore, if we fail to offer interest in a sufficient amount to keep these demand deposits, our core deposits may be reduced, which would require us to obtain funding in other ways or risk slowing our future asset growth.
The appraisals and other valuation techniques we use in evaluating and monitoring loans secured by real property, other real estate owned (“OREO”) and other repossessed assets may not accurately describe the fair value of the asset.
In considering whether to make a loan secured by real property, we generally require an appraisal of the property. However, an appraisal is only an estimate of the value of the property at the time the appraisal is made, and, as real estate values may change significantly in relatively short periods of time (especially in periods of heightened economic uncertainty), this estimate may not accurately describe the fair value of the real property collateral after the loan is made. As a result, we may not be able to realize the full amount of any remaining indebtedness when we foreclose on and sell the relevant property. In addition, we rely on appraisals and other valuation techniques to establish the value of our OREO and personal property that we acquire through foreclosure proceedings and to determine certain loan impairments. If any of these valuations are inaccurate, our consolidated financial statements may not reflect the correct value of our OREO, and our allowance for loan and lease losses may not reflect accurate loan impairments. This could have a material adverse effect on our business, financial condition or results of operations.
We depend on the accuracy and completeness of information about customers and counterparties.
In deciding whether to extend credit or enter into other transactions, and in evaluating and monitoring our loan and lease portfolio on an ongoing basis, we may rely on information furnished by or on behalf of customers and counterparties, including financial statements, credit reports and other financial information. We may also rely on representations of those customers or counterparties or of other third parties, such as independent auditors, as to the accuracy and completeness of that information. Reliance on inaccurate, incomplete, fraudulent or misleading financial statements, credit reports or other financial or business information, or the failure to receive such information on a timely basis, could result in loan losses, reputational damage or other effects that could have a material adverse effect on our business, financial condition or results of operations.
The value of the financial instruments we own may decline in the future.
As of March 31, 2017, we owned $723.4 million of investment securities, which consisted primarily of our positions in U.S. government and government-sponsored enterprises and federal agency obligations,
-21-
Table of Contents
mortgage and asset-backed securities and municipal securities. We evaluate our investment securities on at least a quarterly basis, and more frequently when economic and market conditions warrant such an evaluation, to determine whether any decline in fair value below amortized cost is the result of an other-than-temporary impairment. The process for determining whether impairment is other-than-temporary usually requires complex, subjective judgments about the future financial performance of the issuer in order to assess the probability of receiving all contractual principal and interest payments on the security. Because of changing economic and market conditions affecting issuers, we may be required to recognize other-than-temporary impairment in future periods, which could adversely affect our business, results of operations or financial condition.
In addition, an increase in market interest rates may affect the market value of our securities portfolio, potentially reducing accumulated other comprehensive income and/or earnings.
Concentrated exposures to individual obligors may unfavorably impact our operations.
We have cultivated relationships with certain individuals, businesses and institutions that could result in relatively large exposures to select single obligors. The failure to properly anticipate and address risks associated with any concentrated exposures could have a material adverse effect on our business, financial condition or results of operations.
Funding Risks
Liquidity risks could affect operations and jeopardize our business, financial condition and results of operations.
Liquidity risk is the risk that we will not be able to meet our obligations, including financial commitments, as they come due and is inherent in our operations. An inability to raise funds through deposits, borrowings, the sale of loans and/or investment securities and from other sources could have a substantial negative effect on our liquidity. Our most important source of funds consists of our customer deposits. Deposit balances can decrease for a variety of reasons, including when customers perceive alternative investments, such as the stock market, as providing a better risk/return tradeoff. If customers move money out of bank deposits and into other investments, we could lose a relatively low cost source of funds. This loss would require us to seek other funding alternatives, including wholesale funding, in order to continue to grow, thereby increasing our funding costs and reducing our net interest income and net income.
Other primary sources of funds consist of cash from operations and investment maturities, redemptions and sales. To a lesser extent, proceeds from the issuance and sale of securities to investors has become a source of funds and we may issue additional equity or debt securities following this offering. Additional liquidity is provided by brokered certificates of deposits and repurchase agreements and we have the ability to borrow from the Federal Reserve Bank of Chicago and the Federal Home Loan Bank of Chicago (“FHLB”). We also may borrow from third party lenders from time to time. Our access to funding sources in amounts adequate to finance or capitalize our activities or on terms that are acceptable to us could be impaired by factors that affect us directly or the financial services industry or economy in general, such as disruptions in the financial markets or negative views and expectations about the prospects for the financial services industry. Economic conditions and a loss of confidence in financial institutions may increase our cost of funding and limit access to certain customary sources of capital, including inter-bank borrowings, repurchase agreements and borrowings from the discount window of the Federal Reserve System. There is also the potential risk that collateral calls with respect to our repurchase agreements could reduce our available liquidity.
Any decline in available funding could adversely impact our ability to continue to implement our business plan, including originating loans, investing in securities, meeting our expenses or fulfilling obligations such as repaying our borrowings and meeting deposit withdrawal demands, any of which could have a material adverse impact on our liquidity, business, financial condition and results of operations.
-22-
Table of Contents
Our liquidity is dependent on dividends from Byline Bank.
We are a legal entity separate and distinct from Byline Bank, our wholly-owned banking subsidiary. A substantial portion of our cash flow from operating activities, including cash flow to pay dividends on our preferred stock and principal and interest on any debt we may incur, comes from dividends from Byline Bank. Various federal and state laws and regulations limit the amount of dividends that our bank may pay to us. For example, Illinois law only permits Byline Bank to pay dividends out of its net profits then on hand, after first deducting the bank’s losses and any debts owed to Byline Bank on which interest is past due and unpaid for a period of six months or more, unless the same are well secured and in the process of collection. As of March 31, 2017, Byline Bank had the capacity to pay us a dividend of up to $66.4 million without the need to obtain prior regulatory approval. Also, our right to participate in a distribution of assets upon a subsidiary’s liquidation or reorganization is subject to the prior claims of the subsidiary’s creditors. In the event Byline Bank is unable to pay dividends to us, we may not be able to service any debt we may incur, pay obligations or pay dividends on our preferred stock, which could have a material adverse effect on our business, financial condition or results of operations.
Loss of deposits could increase our funding costs.
As do many banking companies, we rely on customer deposits to meet a considerable portion of our funding needs, and we continue to seek customer deposits to maintain this funding base. We accept deposits directly from consumer and commercial customers and, as of March 31, 2017, we had $2.6 billion in deposits. These deposits are subject to potentially dramatic fluctuations in availability or the price we must pay (in the form of interest) to obtain them due to certain factors outside our control, such as a loss of confidence by customers in us or the banking sector generally, customer perceptions of our financial health and general reputation, increasing competitive pressures from other financial services firms for consumer or corporate customer deposits, changes in interest rates and returns on other investment classes, which could result in significant outflows of deposits within short periods of time or significant changes in pricing necessary to maintain current customer deposits or attract additional deposits. The loss of customer deposits for any reason could increase our funding costs.
We may be adversely affected by changes in the actual or perceived soundness or condition of other financial institutions.
Financial services institutions that deal with each other are interconnected as a result of trading, investment, liquidity management, clearing, counterparty and other relationships. Concerns about, or a default by, one institution could lead to significant liquidity problems and losses or defaults by other institutions, as the commercial and financial soundness of many financial institutions is closely related as a result of these credit, trading, clearing and other relationships. Even the perceived lack of creditworthiness of, or questions about, a counterparty may lead to market-wide liquidity problems and losses or defaults by various institutions. This systemic risk may adversely affect financial intermediaries with which we interact on a daily basis or key funding providers such as the FHLB, any of which could have a material adverse effect on our access to liquidity or otherwise have a material adverse effect on our business, financial condition or results of operations.
We may need to raise additional capital in the future, and such capital may not be available when needed or at all.
We may need to raise additional capital, in the form of debt or equity securities, in the future to have sufficient capital resources to meet our commitments and fund our business needs and future growth, particularly
if the quality of our assets or earnings were to deteriorate significantly. Our ability to raise additional capital, if needed, will depend on, among other things, conditions in the capital markets at that time, which are outside of our control, and our financial condition. We may not be able to obtain capital on acceptable terms or at all. Any occurrence that may limit our access to capital, such as a decline in the confidence of debt purchasers, depositors
-23-
Table of Contents
of our bank or counterparties participating in the capital markets or other disruption in capital markets, may adversely affect our capital costs and our ability to raise capital and, in turn, our liquidity. Further, if we need to raise capital in the future, we may have to do so when many other financial institutions are also seeking to raise capital and would then have to compete with those institutions for investors. An inability to raise additional capital on acceptable terms when needed could have a material adverse effect on our business, financial condition or results of operations.
Operational Risks
We may not be able to implement our growth strategy or manage costs effectively, resulting in lower earnings or profitability.
There can be no assurance that we will be able to continue to grow and to be profitable in future periods, or, if profitable, that our overall earnings will remain consistent or increase in the future. Our strategy focuses on organic growth, supplemented by opportunistic acquisitions.
Our growth requires that we increase our loan and deposit growth while managing risks by following prudent loan underwriting standards without increasing interest rate risk or compressing our net interest margin, maintaining more than adequate capital at all times, hiring and retaining qualified employees and successfully implementing strategic projects and initiatives. Even if we are able to increase our interest income, our earnings may nonetheless be reduced by increased expenses, such as additional employee compensation or other general and administrative expenses and increased interest expense on any liabilities incurred or deposits solicited to fund increases in assets. Additionally, if our competitors extend credit on terms we find to pose excessive risks, or at interest rates which we believe do not warrant the credit exposure, we may not be able to maintain our lending volume and could experience deteriorating financial performance.
Our inability to manage our growth successfully or to continue to expand into new markets could have a material adverse effect on our business, financial condition or results of operations.
The occurrence of fraudulent activity, breaches or failures of our information security controls or cybersecurity-related incidents could have a material adverse effect on our business, financial condition or results of operations.
As a financial institution, we are susceptible to fraudulent activity, information security breaches and cybersecurity-related incidents that may be committed against us or our clients, which may result in financial losses or increased costs to us or our clients, disclosure or misuse of our information or our client information, misappropriation of assets, privacy breaches against our clients, litigation or damage to our reputation. Such fraudulent activity may take many forms, including check fraud, electronic fraud, wire fraud, phishing, social engineering and other dishonest acts. Information security breaches and cybersecurity-related incidents may include fraudulent or unauthorized access to systems used by us or our clients, denial or degradation of service attacks, and malware or other cyber-attacks. In recent periods, there continues to be a rise in electronic fraudulent activity, security breaches and cyber-attacks within the financial services industry, especially in the commercial banking sector due to cyber criminals targeting commercial bank accounts. Consistent with industry trends, we have also experienced an increase in attempted electronic fraudulent activity, security breaches and cybersecurity-related incidents in recent periods. Moreover, in recent periods, several large corporations, including financial institutions and retail companies, have suffered major data breaches, in some cases exposing not only confidential and proprietary corporate information, but also sensitive financial and other personal information of their customers and employees and subjecting them to potential fraudulent activity. Some of our
clients may have been affected by these breaches, which could increase their risks of identity theft and other fraudulent activity that could involve their accounts with us.
We also face risks related to cyber-attacks and other security breaches in connection with debit card transactions that typically involve the transmission of sensitive information regarding our customers through
-24-
Table of Contents
various third parties, including retailers and payment processors. Some of these parties have in the past been the target of security breaches and cyber-attacks, and because the transactions involve third parties and environments such as the point of sale that we do not control or secure, future security breaches or cyber-attacks affecting any of these third parties could affect us through no fault of our own, and in some cases we may have exposure and suffer losses for breaches or attacks relating to them, including costs to replace compromised debit cards and address fraudulent transactions.
Information pertaining to us and our customers is maintained, and transactions are executed, on networks and systems maintained by us and certain third party partners, such as our online banking or reporting systems. The secure maintenance and transmission of confidential information, as well as execution of transactions over these systems, are essential to protect us and our customers against fraud and security breaches and to maintain our customers’ confidence. Breaches of information security also may occur, through intentional or unintentional acts by those having access to our systems or our customers’ or counterparties’ confidential information, including employees. In addition, increases in criminal activity levels and sophistication, advances in computer capabilities, new discoveries, vulnerabilities in third party technologies (including browsers and operating systems) or other developments could result in a compromise or breach of the technology, processes and controls that we use to prevent fraudulent transactions and to protect data about us, our customers and underlying transactions, as well as the technology used by our customers to access our systems. Although we have developed, and continue to invest in, systems and processes that are designed to detect and prevent security breaches and cyber-attacks and periodically test our security, our or our third party partners’ inability to anticipate, or failure to adequately mitigate, breaches of security could result in: losses to us or our customers; our loss of business and/or customers; damage to our reputation; the incurrence of additional expenses; disruption to our business; our inability to grow our online services or other businesses; additional regulatory scrutiny or penalties; or our exposure to civil litigation and possible financial liability—any of which could have a material adverse effect on our business, financial condition or results of operations.
More generally, publicized information concerning security and cyber-related problems could inhibit the use or growth of electronic or web-based applications or solutions as a means of conducting commercial transactions. Such publicity may also cause damage to our reputation as a financial institution. As a result, our business, financial condition or results of operations could be adversely affected.
We depend on information technology and telecommunications systems of third parties, and any systems failures, interruptions or data breaches involving these systems could adversely affect our operations and financial condition.
Our business is highly dependent on the successful and uninterrupted functioning of our information technology and telecommunications systems, third party servicers, accounting systems, mobile and online banking platforms and financial intermediaries. We outsource to third parties many of our major systems, such as data processing, loan servicing, deposit processing and internal audit systems. The failure of these systems, or the termination of a third party software license or service agreement on which any of these systems is based, could interrupt our operations. Because our information technology and telecommunications systems interface with and depend on third party systems, we could experience service denials if demand for such services exceeds capacity or such third party systems fail or experience interruptions. If sustained or repeated, a system failure or service denial could result in a deterioration of our ability to process loans or gather deposits and provide customer service, compromise our ability to operate effectively, result in potential noncompliance with applicable laws or regulations, damage our reputation, result in a loss of customer business and/or subject us to additional regulatory scrutiny and possible financial liability, any of which could have a material adverse effect on our financial
condition and results of operations. In addition, failure of third parties to comply with applicable laws and regulations, or fraud or misconduct on the part of employees of any of these third parties could disrupt our options or adversely affect our reputation.
It may be difficult for us to replace some of our third party vendors, particularly vendors providing our core banking, debit card services and information services, in a timely manner if they are unwilling or unable to
-25-
Table of Contents
provide us with these services in the future for any reason and even if we are able to replace them, it may be at higher cost or result in the loss of customers. Any such events could have a material adverse effect on our business, financial condition or results of operations.
Our operations rely heavily on the secure processing, storage and transmission of information and the monitoring of a large number of transactions on a minute-by-minute basis, and even a short interruption in service could have significant consequences. We also interact with and rely on retailers, for whom we process transactions, as well as financial counterparties and regulators. Each of these third parties may be targets of the same types of fraudulent activity, computer break-ins and other cyber security breaches described above or herein, and the cyber security measures that they maintain to mitigate the risk of such activity may be different than our own and may be inadequate.
As a result of financial entities and technology systems becoming more interdependent and complex, a cyber incident, information breach or loss, or technology failure that compromises the systems or data of one or more financial entities could have a material impact on counterparties or other market participants, including ourselves. Although we review business continuity and backup plans for our vendors and take other safeguards to support our operations, such plans or safeguards may be inadequate. As a result of the foregoing, our ability to conduct business may be adversely affected by any significant disruptions to us or to third parties with whom we interact.
Our use of third party vendors and our other ongoing third party business relationships is subject to increasing regulatory requirements and attention.
Our use of third party vendors for certain information systems is subject to increasingly demanding regulatory requirements and attention by our federal bank regulators. Recent regulation requires us to enhance our due diligence, ongoing monitoring and control over our third party vendors and other ongoing third party business relationships. In certain cases we may be required to renegotiate our agreements with these vendors to meet these enhanced requirements, which could increase our costs. We expect that our regulators will hold us responsible for deficiencies in our oversight and control of our third party relationships and in the performance of the parties with which we have these relationships. As a result, if our regulators conclude that we have not exercised adequate oversight and control over our third party vendors or other ongoing third party business relationships or that such third parties have not performed appropriately, we could be subject to enforcement actions, including civil money penalties or other administrative or judicial penalties or fines as well as requirements for customer remediation, any of which could have a material adverse effect our business, financial condition or results of operations.
We continually encounter technological change.
The financial services industry is continually undergoing rapid technological change with frequent introductions of new, technology-driven products and services. The effective use of technology increases efficiency and enables financial institutions to serve customers better and to reduce costs. Our future success depends, in part, upon our ability to address the needs of our customers by using technology to provide products and services that will satisfy customer demands, as well as to create additional efficiencies in our operations. Many of our competitors have substantially greater resources to invest in technological improvements than we do. We may not be able to effectively implement new, technology-driven products and services or be successful in marketing these products and services to our customers. In addition, the implementation of technological
changes and upgrades to maintain current systems and integrate new ones may also cause service interruptions, transaction processing errors and system conversion delays and may cause us to fail to comply with applicable laws. Failure to successfully keep pace with technological change affecting the financial services industry and failure to avoid interruptions, errors and delays could have a material adverse effect on our business, financial condition or results of operations.
-26-
Table of Contents
We expect that new technologies and business processes applicable to the banking industry will continue to emerge, and these new technologies and business processes may be better than those we currently use. Because the pace of technological change is high and our industry is intensely competitive, we may not be able to sustain our investment in new technology as critical systems and applications become obsolete or as better ones become available. A failure to maintain current technology and business processes could cause disruptions in our operations or cause our products and services to be less competitive, all of which could have a material adverse effect on our business, financial condition or results of operations.
Our limited operating history following the Recapitalization may make it difficult for investors to evaluate our financial trends, and also may impair our ability to accurately forecast our future performance.
We have a limited operating history following the Recapitalization transaction in 2013. In connection with the Recapitalization, we replaced all senior management of our predecessor and a significant majority of its lending staff. As a result, our limited operating history may not provide an adequate basis for investors to evaluate our business, financial condition and results of operations, and makes accurate financial forecasting more difficult for us. It may also be more difficult for us to evaluate trends that may affect our business. In addition, due to the application of the acquisition method of accounting to record, at fair value, all of the assets acquired and liabilities assumed at the time of the Recapitalization, financial information prior to the Recapitalization is not comparable to such information post-Recapitalization. Thus, any predictions about our future revenue and expenses may not be as accurate as they would be if we had a longer operating history or operated in a more predictable business environment.
Current or former employee or predecessor misconduct could expose us to significant legal liability and reputational harm.
We are vulnerable to reputational harm because we operate in an industry in which integrity and the confidence of our customers are of critical importance. Our employees could engage, or our former directors, employees, or controlling stockholders could have engaged, in misconduct that adversely affects our business. For example, if such a person were to engage, or previously engaged, in fraudulent, illegal or suspicious activities, we could be subject to regulatory sanctions and suffer serious harm to our reputation (as a consequence of the negative perception resulting from such activities), financial position, customer relationships and ability to attract new customers. Our business often requires that we deal with confidential information. If our employees were to improperly use or disclose this information, or if former directors, employees, or controlling stockholders previously improperly used or disclosed this information, even if inadvertently, we could suffer serious harm to our reputation, financial position and current and future business relationships. It is not always possible to deter employee misconduct, and the precautions we take to detect and prevent this activity may not always be effective. Misconduct by our employees or former directors, employees, or controlling stockholders, or even unsubstantiated allegations of misconduct, could result in a material adverse effect on our business, financial condition or results of operations.
We may not be able to attract and retain key personnel and other skilled employees.
Our success depends, in large part, on the skills of our management team and our ability to retain, recruit and motivate key officers and employees. There is a limited number of qualified persons with requisite knowledge of, and experience in, certain of our specialized business lines, including our equipment leasing and U.S. government guaranteed lending businesses. A number of our employees have considerable tenure with
Byline Bank and some will be nearing retirement in the next few years, which makes succession planning important to the continued operation of our business. We need to continue to attract and retain key personnel and to recruit qualified individuals who fit our culture to succeed existing key personnel to ensure the continued growth and successful operation of our business. Leadership changes may occur from time to time, and we cannot predict whether significant retirements or resignations will occur or whether we will be able to recruit additional qualified personnel. Competition for senior executives and skilled personnel in the financial services
-27-
Table of Contents
and banking industry is intense, which means the cost of hiring, incentivizing and retaining skilled personnel may continue to increase. This could have a material adverse effect on our business, financial condition or results of operations. In addition, our ability to effectively compete for senior executives and other qualified personnel by offering competitive compensation and benefit arrangements may be restricted by applicable banking laws and regulations, including restrictions recently proposed for adoption by U.S. regulatory agencies, including the Federal Reserve and the Federal Deposit Insurance Corporation (“FDIC”). The loss of the services of any senior executive or other key personnel, the inability to recruit and retain qualified personnel in the future or the failure to develop and implement a viable succession plan, could have a material adverse effect on our business, financial condition or results of operations.
New lines of business, products, product enhancements or services may subject us to additional risks.
From time to time, we may implement new lines of business or offer new products and product enhancements as well as new services within our existing lines of business. There are substantial risks and uncertainties associated with these efforts, particularly in instances in which the markets are not fully developed. In implementing, developing or marketing new lines of business, products, product enhancements or services, we may invest significant time and resources, although we may not assign the appropriate level of resources or expertise necessary to make these new lines of business, products, product enhancements or services successful or to realize their expected benefits. Further, initial timetables for the introduction and development of new lines of business, products, product enhancements or services may not be achieved, and price and profitability targets may not prove feasible. External factors, such as compliance with regulations, competitive alternatives and shifting market preferences, may also affect the ultimate implementation of a new line of business or offerings of new products, product enhancements or services. Furthermore, any new line of business, product, product enhancement or service or system conversion could have a significant impact on the effectiveness of our system of internal controls. Failure to successfully manage these risks in the development and implementation of new lines of business or offerings of new products, product enhancements or services could have a material adverse effect on our business, financial condition or results of operations.
External Risks
Our business may be adversely affected by conditions in the financial markets and economic conditions generally.
Our financial performance generally, and in particular the ability of our borrowers to pay interest on and repay principal of outstanding loans and the value of collateral securing those loans, as well as demand for loans and other products and services we offer, is highly dependent upon the business environment in the markets in which we operate and in the United States as a whole. Unlike larger banks that are more geographically diversified, we provide banking and financial services to customers primarily in the Chicago metropolitan area. The economic conditions in this local market may be different from, or worse than, the economic conditions in the United States as a whole. Some elements of the business environment that affect our financial performance include short-term and long-term interest rates, the prevailing yield curve, inflation and price levels, tax policy, monetary policy, unemployment and the strength of the domestic economy and the local economy in the markets in which we operate. Unfavorable market conditions can result in a deterioration in the credit quality of our borrowers and the demand for our products and services, an increase in the number of loan delinquencies, defaults and charge-offs, additional provisions for loan and lease losses, adverse asset values and an overall material adverse effect on the quality of our loan and lease portfolio. Unfavorable or uncertain economic and
market conditions can be caused by, among other factors, declines in economic growth, business activity or investor or business confidence; limitations on the availability or increases in the cost of credit and capital; changes in inflation or interest rates; increases in real estate and other state and local taxes; high unemployment; natural disasters; or a combination of these or other factors.
-28-
Table of Contents
The City of Chicago and State of Illinois currently face significant financial difficulties, which could adversely affect our business.
We have significant loan exposure in the Chicago metropolitan area and both the City of Chicago and the State of Illinois currently face significant fiscal challenges, including large budget deficits, substantial unfunded pension obligations and low credit ratings compared to other local entities, which could negatively impact us to the extent this leads to declines in business activity and overall economic conditions in Illinois and the Chicago metropolitan area. These fiscal challenges may also lead to significant increases in real estate taxes on properties in the Chicago metropolitan area, which could negatively affect certain of our borrowers’ ability to make payments on our loans. In addition, the State of Illinois is currently operating without a budget, which has in some cases led to the State not meeting its financial obligations in a timely manner.
Some of our commercial loan borrowers are not-for-profit entities that may be dependent on the receipt of contractual payments and reimbursements from the State of Illinois for services rendered. To the extent the City of Chicago or State of Illinois, as applicable, delays or suspends these payments and reimbursements, this could adversely affect the ability of borrowers to meet their loan repayment obligations to us. Any resulting delinquencies and defaults on these loans would in turn adversely affect our financial condition and results of operations.
Our business is significantly dependent on the real estate markets in which we operate, as a significant percentage of our loan portfolio is secured by real estate.
Many of the loans in our portfolio are secured by real estate. As of March 31, 2017, our real estate loans include $105 million of construction and development loans, $239 million of multifamily loans, $410 million of non-owner occupied commercial real estate (“CRE”) loans and $363 million of residential mortgage loans, with the majority of these real estate loans concentrated in the City of Chicago and the State of Illinois. Real property values in our market may be different from, and in some instances worse than, real property values in other markets or in the United States as a whole, and may be affected by a variety of factors outside of our control and the control of our borrowers, including national and local economic conditions, generally. The Chicago metropolitan area has experienced volatility in real estate values over the past decade. Declines in real estate values, including prices for homes and commercial properties in the Chicago metropolitan area, could result in a deterioration of the credit quality of our borrowers, an increase in the number of loan delinquencies, defaults and charge-offs, and reduced demand for our products and services, generally. Our CRE loans may have a greater risk of loss than residential mortgage loans, in part because these loans are generally larger or more complex to underwrite. In particular, real estate construction and acquisition and development loans have certain risks not present in other types of loans, including risks associated with construction cost overruns, project completion risk, general contractor credit risk and risks associated with the ultimate sale or use of the completed construction. In addition, declines in real property values in the states in which we operate could reduce the value of any collateral we realize following a default on these loans and could adversely affect our ability to continue to grow our loan and lease portfolio consistent with our underwriting standards. We may have to foreclose on real estate assets if borrowers default on their loans, in which case we are required to record the related asset to the then fair market value of the collateral, which may ultimately result in a loss. An increase in the level of nonperforming assets increases our risk profile and may affect the capital levels regulators believe are appropriate in light of the ensuing risk profile. Our failure to effectively mitigate these risks could have a material adverse effect on our business, financial condition or results of operations.
Our small business customers may lack the resources to weather a downturn in the economy.
One of our primary strategies is serving the banking and financial services needs of small and medium sized businesses. These businesses generally have fewer financial resources than larger entities and less access to capital sources and loan facilities. If economic conditions are generally unfavorable in our market areas, our small business borrowers may be disproportionately affected and their ability to repay outstanding loans may be negatively affected, resulting in an adverse effect on our results of operations and financial condition.
-29-
Table of Contents
We operate in a highly competitive and changing industry and market area and compete with both banks and non-banks.
We operate in the highly competitive financial services industry and face significant competition for customers from financial institutions located both within and beyond our principal markets. We compete with national commercial banks, regional banks, private banks, savings banks, credit unions, non-bank financial services companies and other financial institutions operating within or near the areas we serve, many of whom target the same customers we do in the Chicago metropolitan area. As customer preferences and expectations continue to evolve, technology has lowered barriers to entry and made it possible for banks to expand their geographic reach by providing services over the Internet and for non-banks to offer products and services traditionally provided by banks, such as automatic transfer and automatic payment systems. The banking industry is experiencing rapid changes in technology, and, as a result, our future success will depend in part on our ability to address our customers’ needs by using technology. Customer loyalty can be influenced by a competitor’s new products, especially offerings that could provide cost savings or a higher return to the customer. Increased lending activity of competing banks following the Great Recession has also led to increased competitive pressures on loan rates and terms for high-quality credits. We may not be able to compete successfully with other financial institutions in our markets, particularly with larger financial institutions operating in our markets that have significantly greater resources than us, and we may have to pay higher interest rates to attract deposits, accept lower yields to attract loans and pay higher wages for new employees, resulting in lower net interest margins and reduced profitability. Many of our non-bank competitors are not subject to the same extensive regulations that govern our activities and may have greater flexibility in competing for business. The financial services industry could become even more competitive as a result of legislative, regulatory and technological changes and continued consolidation. In addition, some of our current commercial banking customers may seek alternative banking sources as they develop needs for credit facilities larger than we may be able to accommodate or more expansive product mixes offered by larger institutions. We also face increased competition in our U.S. government guaranteed lending business which can adversely affect our volume and the premium, if any, recognized on sales of the guaranteed portions of such U.S. government guaranteed loans. Our inability to compete successfully in the markets in which we operate could have a material adverse effect on our business, financial condition or results of operations.
Our ability to maintain, attract and retain customer relationships is highly dependent on our reputation.
We rely, in part, on the reputation of our bank to attract customers and retain our customer relationships. Damage to our reputation could undermine the confidence of our current and potential customers in our ability to provide high-quality financial services. Such damage could also impair the confidence of our counterparties and vendors and ultimately affect our ability to effect transactions. Maintenance of our reputation depends not only on our success in maintaining our service-focused culture and controlling and mitigating the various risks described in this prospectus, but also on our success in identifying and appropriately addressing issues that may arise in areas such as potential conflicts of interest, anti-money laundering, customer personal information and privacy issues, customer and other third party fraud, record-keeping, regulatory investigations and any litigation that may arise from the failure or perceived failure of us to comply with legal and regulatory requirements. Maintaining our reputation also depends on our ability to successfully prevent third parties from infringing on the “Byline Bank” brand and associated trademarks and our other intellectual property. Defense of our reputation, trademarks and other intellectual property, including through litigation, could result in costs that could have a material adverse effect on our business, financial condition or results of operations.
Downgrades to the credit rating of the U.S. government or of its securities or any of its agencies by one or more of the credit ratings agencies could have a material adverse effect on general economic conditions, as well as our business.
On August 5, 2011, Standard & Poor’s cut the credit rating of the U.S. federal government’s long-term sovereign debt from AAA to AA+, while also keeping its outlook negative. Moody’s had lowered its own
-30-
Table of Contents
outlook for the same debt to “Negative” on August 2, 2011, and Fitch also lowered its outlook for the same debt to “Negative”, on November 28, 2011. In 2013, both Moody’s and Standard & Poor’s revised their outlooks from “Negative” to “Stable”, and on March 21, 2014, Fitch revised its outlook from “Negative” to “Stable”. Further downgrades of the U.S. federal government’s sovereign credit rating, and the perceived creditworthiness of U.S. government-backed obligations, could affect our ability to obtain funding that is collateralized by affected instruments and our ability to access capital markets on favorable terms. Such downgrades could also affect the pricing of funding, when funding is available. A downgrade of the credit rating of the U.S. government, or of its agencies, government-sponsored enterprises or related institutions or instrumentalities, may also adversely affect the market value of such instruments and, further, exacerbate the other risks to which we are subject and any related adverse effects on our business, financial condition or results of operations.
Severe weather, natural disasters, pandemics, acts of war or terrorism or other external events could significantly impact our business.
Severe weather, natural disasters, widespread disease or pandemics, acts of war or terrorism or other adverse external events could have a significant impact on our ability to conduct business. In addition, such events could affect the stability of our deposit base, impair the ability of borrowers to repay outstanding loans and leases, impair the value of collateral securing loans, cause significant property damage, result in loss of revenue or cause us to incur additional expenses. The occurrence of any of these events in the future could have a material adverse effect on our business, financial condition or results of operations.
Guaranteed Loans Risks
Small Business Administration lending is an important part of our business. Our SBA lending program is dependent upon the U.S. federal government, and we face specific risks associated with originating SBA loans.
Our SBA lending program is dependent upon the U.S. federal government. As an approved participant in the SBA Preferred Lender’s Program (an “SBA Preferred Lender”), we enable our clients to obtain SBA loans without being subject to the potentially lengthy SBA approval process necessary for lenders that are not SBA Preferred Lenders. The SBA periodically reviews the lending operations of participating lenders to assess, among other things, whether the lender exhibits prudent risk management. When weaknesses are identified, the SBA may request corrective actions or impose enforcement actions, including revocation of the lender’s SBA Preferred Lender status. If we lose our status as an SBA Preferred Lender, we may lose some or all of our customers to lenders who are SBA Preferred Lenders, and as a result we could experience a material adverse effect to our financial results. Any changes to the SBA program, including but not limited to changes to the level of guarantee provided by the federal government on SBA loans, changes to program specific rules impacting volume eligibility under the guaranty program, as well as changes to the program amounts authorized by Congress may also have a material adverse effect on our business. In addition, any default by the U.S. government on its obligations or any prolonged government shutdown could, among other things, impede our ability to originate SBA loans or sell such loans in the secondary market, which could materially adversely affect our business, results of operations and financial condition.
The SBA’s 7(a) Loan Program is the SBA’s primary program for helping start-up and existing small businesses, with financing guaranteed for a variety of general business purposes. Generally, we sell the guaranteed portion of our SBA 7(a) loans in the secondary market. These sales result in premium income for us
at the time of sale and create a stream of future servicing income, as we retain the servicing rights to these loans. For the reasons described above, we may not be able to continue originating these loans or sell them in the secondary market. Furthermore, even if we are able to continue originate and sell SBA 7(a) loans in the secondary market, we might not continue to realize premiums upon the sale of the guaranteed portion of these loans or the premiums may decline due to economic and competitive factors. When we originate SBA loans, we incur credit risk on the non-guaranteed portion of the loans, and if a customer defaults on a loan, we share any
-31-
Table of Contents
loss and recovery related to the loan pro-rata with the SBA. If the SBA establishes that a loss on an SBA guaranteed loan is attributable to significant technical deficiencies in the manner in which the loan was originated, funded or serviced by us, the SBA may seek recovery of the principal loss related to the deficiency from us. Generally, we do not maintain reserves or loss allowances for such potential claims and any such claims could materially adversely affect our business, financial condition or results of operations.
The laws, regulations and standard operating procedures that are applicable to SBA loan products may change in the future. We cannot predict the effects of these changes on our business and profitability. Because government regulation greatly affects the business and financial results of all commercial banks and bank holding companies and especially our organization, changes in the laws, regulations and procedures applicable to SBA loans could adversely affect our ability to operate profitably.
The recognition of gains on the sale of loans and servicing asset valuations reflect certain assumptions.
We expect that gains on the sale of U.S. government guaranteed loans will comprise a significant component of our revenue. The gains on such sales recognized for the three months ended March 31, 2017 was $8.1 million. The determination of these gains is based on assumptions regarding the value of unguaranteed loans retained, servicing rights retained and deferred fees and costs, and net premiums paid by purchasers of the guaranteed portions of U.S. government guaranteed loans. The value of retained unguaranteed loans and servicing rights are determined based on market derived factors such as prepayment rates, current market conditions and recent loan sales. Deferred fees and costs are determined using internal analysis of the cost to originate loans. Significant errors in assumptions used to compute gains on sale of loans or servicing asset valuations could result in material revenue misstatements, which may have a material adverse effect on our business, results of operations and profitability. In addition, while we believe these valuations reflect fair value and such valuations are subject to validation by an independent third party, if such valuations are not reflective of fair market value then our business, results of operations and financial condition may be materially and adversely affected.
Legal, Accounting and Compliance Risks
Our accounting estimates and risk management processes and controls rely on analytical and forecasting techniques and models and assumptions, which may not accurately predict future events.
Our accounting policies and methods are fundamental to the manner in which we record and report our financial condition and results of operations. Our management must exercise judgment in selecting and applying many of these accounting policies and methods so they comply with GAAP and reflect management’s judgment of the most appropriate manner to report our financial condition and results of operations. In some cases, management must select the accounting policy or method to apply from two or more alternatives, any of which may be reasonable under the circumstances, yet which may result in our reporting materially different results than would have been reported under a different alternative.
Certain accounting policies are critical to presenting our financial condition and results of operations. They require management to make difficult, subjective or complex judgments about matters that are uncertain. Materially different amounts could be reported under different conditions or using different assumptions or estimates. These critical accounting policies include the allowance for loan and lease losses, fair value measurements and income taxes. See Note 1 of Byline’s Consolidated Financial Statements as of and for the years ended December 31, 2016 and 2015 for further information. Because of the uncertainty of estimates involved in these matters, we may be required to do one or more of the following: significantly increase the allowance for loan losses or sustain loan losses that are significantly higher than the reserve provided; reduce the carrying value of an asset measured at fair value; or significantly increase our accrued tax liability. Any of these could have a material adverse effect on our business, financial condition or results of operations. See “Management’s Discussion and Analysis of Financial Condition and Results of Operations”.
-32-
Table of Contents
Our internal controls, disclosure controls, processes and procedures, and corporate governance policies and procedures are based in part on certain assumptions and can provide only reasonable (not absolute) assurances that the objectives of the system are met. Furthermore, we currently outsource our internal audit function. Any failure or circumvention of our controls, processes and procedures or failure to comply with regulations related to controls, processes and procedures could necessitate changes in those controls, processes and procedures, which may increase our compliance costs, divert management attention from our business or subject us to regulatory actions and increased regulatory scrutiny. Any of these could have a material adverse effect on our business, financial condition or results of operations.
Our goodwill may become impaired, which may adversely impact our results of operations and financial condition and may limit Byline Bank’s ability to pay dividends to us, thereby causing liquidity issues.
As of March 31, 2017, we had goodwill of $52.0 million, or 13.3% of our total stockholders’ equity. The excess purchase consideration over the fair value of net assets from acquisitions, or goodwill, is evaluated for impairment at least annually and on an interim basis if an event or circumstance indicates that it is more likely than not that an impairment has occurred. In testing for impairment, we conduct a qualitative assessment and we also estimate the fair value of net assets based on analyses of our market value, discounted cash flows and peer values. Consequently, the determination of the fair value of goodwill is sensitive to market-based economics and other key assumptions. Variability in market conditions or in key assumptions could result in impairment of goodwill, which is recorded as a non-cash adjustment to income. An impairment of goodwill could have a material adverse effect on our business, financial condition and results of operations.
The accounting for loans acquired in connection with our Recapitalization and acquisitions is based on numerous subjective determinations that may prove to be inaccurate and have a negative impact on our results of operations.
All loans acquired as part of the Recapitalization in 2013 as well as loans acquired in connection with our subsequent acquisitions, including the Ridgestone acquisition in October 2016, have been recorded at their estimated fair value on their acquisition date without a carryover of the related allowance for loan losses. The determination of estimated fair value of acquired loans requires management to make subjective determinations regarding discount rate, estimates of losses on defaults, market conditions and other factors that are highly subjective in nature. A risk exists that our estimate of the fair value of acquired loans will prove to be inaccurate and that we ultimately will not recover the amount at which we recorded such loans on our balance sheet, which would require us to recognize losses.
Loans acquired that have evidence of credit deterioration since origination and for which it is probable at the date of acquisition that we will not collect all contractually required principal and interest payments are accounted for under ASC Topic 310-30, Accounting for Purchased Loans with Deteriorated Credit Quality. These credit-impaired loans, like non-credit-impaired loans acquired, have been recorded at estimated fair value on their acquisition date, based on subjective determinations regarding risk ratings, expected future cash flows and fair value of the underlying collateral, without a carryover of the related allowance for loan and lease losses. We evaluate these loans quarterly to assess expected cash flows. Subsequent decreases to the expected cash flows will generally result in a provision for loan losses. Subsequent increases in cash flows result in a reversal of the provision for loan losses to the extent of prior charges or a reclassification of the difference from non-accretable to accretable with a positive impact on interest income prospectively. Because the accounting for these loans is
based on subjective measures that can change frequently, we may experience fluctuations in our net interest income and provisions for loan losses attributable to these loans. These fluctuations could negatively affect our results of operations.
-33-
Table of Contents
Our ability to recognize the benefits of deferred tax assets is dependent on future cash flows and taxable income and could be significantly reduced if corporate tax rates in the U.S. decline.
We recognize the expected future tax benefit from deferred tax assets when it is more likely than not that the tax benefit will be realized. Otherwise, a valuation allowance is applied against deferred tax assets, reducing the value of such assets. Assessing the recoverability of deferred tax assets requires management to make significant estimates related to expectations of future taxable income from all sources, including reversal of taxable temporary differences, forecasted operating earnings and available tax planning strategies. Estimates of future taxable income are based on forecasted income from operations and the application of existing tax laws in each jurisdiction. The recent acquisition of Ridgestone and the improved risk profile of the Company are key components used in the determination of our ability to realize the expected future benefit of our deferred tax assets. To the extent that future taxable income differs significantly from estimates as a result of the interest rate environment and loan growth capabilities or other factors, our ability to realize the net deferred tax assets could be affected. Over the past several years, there have been discussions regarding decreasing the U.S. federal corporate tax rate, and such discussions have taken on a new focus and prominence given the new U.S. presidential administration and Congress. While we may benefit on a prospective net income basis from any decrease in corporate tax rates, a reduction in the corporate tax rate could result in certain deferred tax assets being re-measured and may result in some portion or all of a deferred tax asset not being expected to be fully utilized. As such, a material decrease in the value of our net deferred tax assets would also result in a valuation allowance being recognized which would result in a corresponding charge to earnings and a material reduction to our net income during the period in which the change is enacted. Our regulatory capital could also be reduced if the decrease in the value of our net deferred tax assets exceeds certain levels. Given the number of uncertainties relating to the ultimate form any corporate tax reform may take, it is not possible to quantify the potential negative impact to our income or regulatory capital that could result from any corporate tax reform.
Additionally, significant future issuances of common stock or common stock equivalents, or changes in the direct or indirect ownership of our common stock or common stock equivalents, could cause an ownership change and could limit our ability to utilize our net operating loss carryforwards and other tax attributes pursuant to Section 382 and Section 383 of the Internal Revenue Code of 1986, as amended (the “Code”). We do not believe that this offering will cause such an ownership change. Future changes in tax law or changes in ownership structure could limit our ability to utilize our recorded net deferred tax assets. As of March 31, 2017 we did not have a valuation allowance against our net deferred tax assets for certain amounts related to U.S. net operating loss carryforwards, and our net deferred tax assets as of March 31, 2017 were $62.9 million. During 2016, the valuation allowance on our net deferred tax assets decreased by approximately $61.9 million. See Note 11 of Byline’s Consolidated Financial Statements as of and for the years ended December 31, 2016 and 2015 for further discussion of our deferred tax assets.
Changes in our accounting policies or in accounting standards could materially affect how we report our financial results and condition.
From time to time, the FASB and the SEC change the financial accounting and reporting standards that govern the preparation of our financial statements. As a result of changes to financial accounting or reporting standards, whether promulgated or required by the FASB or other regulators, we could be required to change certain of the assumptions or estimates we have previously used in preparing our financial statements, which could negatively affect how we record and report our results of operations and financial condition generally. For example, in 2016, the FASB approved a new accounting standard that would require companies to include lease obligations on their balance sheets, which will be effective in 2019, or if we remain an emerging growth company and continue to elect not to opt out of the extended transition period for new accounting standards, 2020. This new standard will result in changes to our accounting presentation and could adversely affect our balance sheet.
-34-
Table of Contents
The banking industry is highly regulated, and the regulatory framework, together with any future legislative or regulatory changes, may have a significant adverse effect on our operations.
The banking industry is extensively regulated and supervised under both federal and state laws and regulations that are intended primarily for the protection of depositors, customers, federal deposit insurance funds and the banking system as a whole, not for the protection of our stockholders and creditors. We are subject to regulation and supervision by the Federal Reserve, and our bank is subject to regulation and supervision by the FDIC and the State of Illinois Department of Financial and Professional Regulation (the “IDFPR”). The laws and regulations applicable to us govern a variety of matters, including permissible types, amounts and terms of loans and investments we may make, the maximum interest rate that may be charged, the amount of reserves we must hold against deposits we take, the types of deposits we may accept, maintenance of adequate capital and liquidity, changes in the control of us and our bank, restrictions on dividends and establishment of new offices. We must obtain approval from our regulators before engaging in certain activities, and there is the risk that such approvals may not be obtained, either in a timely manner or at all. Our regulators also have the ability to compel us to take certain actions, or restrict us from taking certain actions entirely, such as actions that our regulators deem to constitute an unsafe or unsound banking practice. Our failure to comply with any applicable laws or regulations, or regulatory policies and interpretations of such laws and regulations, could result in sanctions by regulatory agencies, civil money penalties or damage to our reputation, all of which could have a material adverse effect on our business, financial condition or results of operations.
Since the Great Recession, federal and state banking laws and regulations, as well as interpretations and implementations of these laws and regulations, have undergone substantial review and change. In particular, the Dodd-Frank Act drastically revised the laws and regulations under which we operate. As an institution with less than $10 billion in assets, certain elements of the Dodd-Frank Act have not been applied to us. While we endeavor to maintain safe banking practices and controls beyond the regulatory requirements applicable to us, our internal controls may not match those of larger banking institutions that are subject to increased regulatory oversight.
Financial institutions generally have also been subjected to increased scrutiny from regulatory authorities. These changes and increased scrutiny have resulted and may continue to result in increased costs of doing business and may in the future result in decreased revenues and net income, reduce our ability to compete effectively to attract and retain customers, or make it less attractive for us to continue providing certain products and services. Any future changes in federal and state laws and regulations, as well as the interpretation and implementation of such laws and regulations, could affect us in substantial and unpredictable ways, including those listed above or other ways that could have a material adverse effect on our business, financial condition or results of operations. Recent political developments, including the change in administration in the United States, have increased additional uncertainty to the implementation, scope and timing of regulatory reforms.
There is uncertainty surrounding the potential legal, regulatory and policy changes by the new presidential administration in the U.S. that may directly affect financial institutions and the global economy.
The new presidential administration has indicated that it would like to see changes made to certain financial reform regulations, including the Dodd-Frank Act, which has resulted in increased regulatory uncertainty, and we are assessing the potential impact on financial and economic markets and on our business. Changes in federal policy and at regulatory agencies are expected to occur over time through policy and personnel changes, which could lead to changes involving the level of oversight and focus on the financial services industry. The nature, timing and economic and political effects of potential changes to the current legal and regulatory framework affecting financial institutions remain highly uncertain. At this time, it is unclear what laws, regulations and policies may change and whether future changes or uncertainty surrounding future changes will adversely affect our operating environment and therefore our business, financial condition and results of operations.
-35-
Table of Contents
Certain of our activities are restricted due to commitments entered into with the Federal Reserve by us and certain of our foreign national stockholders.
Certain of our stockholders who invested in our Recapitalization are foreign nationals, and we and certain of these foreign national stockholders have entered into commitments with the Federal Reserve that restrict some of our activities. In particular, without approval of the Federal Reserve, we are restricted from engaging in certain transactions with these foreign national stockholders, their immediate families, and any company controlled by such foreign national stockholders or by their immediate families. Such transactions include (i) extensions of credit described in the Federal Reserve’s Regulation O, (ii) covered transactions described in sections 23A and 23B of the Federal Reserve Act and the Federal Reserve’s Regulation W, and (iii) subject to certain limited exceptions, business transactions or relationships with companies controlled by such foreign national stockholders or by their immediate families. For additional information about the commitments entered into with the Federal Reserve, see “Certain Relationships and Related Transactions—Foreign National Commitments and Passivity Commitments”. These restrictions could prevent us from pursuing activities that would otherwise be in our and our other stockholders’ best interests. Moreover, if we were to fail to comply with any of these restrictions, we could be subject to enforcement and other legal actions by the Federal Reserve, including civil and criminal penalties, which could have a material adverse effect on our business, financial condition and results of operations.
We are required to act as a source of financial and managerial strength for our bank in times of stress.
As a bank holding company, we are required under federal law to act as a source of financial and managerial strength to our bank, and to commit resources to support our bank if necessary. We may be required to commit additional resources to our bank at times when we may not be in a financial position to provide such resources or when it may not be in our, or our stockholders’ or our creditors’ best interests to do so. Providing such support is more likely to be necessary during times of financial stress for us and our bank, which may make any capital we are required to raise to provide such support more expensive than it might otherwise be. In addition, any capital loans we make to our bank are subordinate in right of payment to depositors and to certain other indebtedness of our bank. In the event of our bankruptcy, any commitment by us to a federal banking regulator to maintain the capital of our bank will be assumed by the bankruptcy trustee and entitled to priority of payment.
We are subject to capital adequacy requirements and may be subject to more stringent capital requirements.
We are subject to capital adequacy guidelines and other regulatory requirements specifying minimum amounts and types of capital that we must maintain. From time to time, the regulators change these regulatory capital adequacy and liquidity guidelines. If we fail to meet these minimum capital adequacy and liquidity guidelines and other regulatory requirements, we or our subsidiaries may be restricted in the types of activities we may conduct and we may be prohibited from taking certain capital actions, such as paying dividends and repurchasing or redeeming capital securities. See “Supervision and Regulation—Regulatory Capital Requirements” for more information on the capital adequacy standards that we must meet and maintain.
In particular, the capital adequacy and liquidity requirements applicable to Byline Bancorp, Inc. and Byline Bank under the recently adopted capital rules implementing the Basel III capital framework in the United States (the “Capital Rules”) began to be phased-in starting in 2015. Basel III not only increases most of the required minimum regulatory capital ratios, it introduces a new Common Equity Tier 1 capital ratio and the concept of a capital conservation buffer. Basel III also expands the current definition of capital by establishing additional criteria that capital instruments must meet to be considered Additional Tier 1 and Tier 2 capital. In order to be a “well-capitalized” depository institution under the new regime, an institution must maintain a Common Equity Tier 1 capital ratio of 6.5% or more; a Tier 1 capital ratio of 8% or more; a total capital ratio of 10% or more; and a leverage ratio of 5% or more. Institutions must also maintain a capital conservation buffer consisting of common equity Tier 1 capital. The Basel III rules also generally preclude certain hybrid securities,
-36-
Table of Contents
such as trust preferred securities, from being counted as Tier 1 capital. However, we are permitted to include qualifying trust preferred securities issued prior to May 19, 2010 as Additional Tier 1 capital. The Basel III Capital Rules became effective as applied to us and Byline Bank on January 1, 2015 with a phase-in period that generally extends through January 1, 2019 for many of the changes.
While we currently meet the requirements of the Basel III-based Capital Rules, we may fail to do so in the future. The failure to meet applicable regulatory capital requirements could result in one or more of our regulators placing limitations or conditions on our activities, including our growth initiatives, or restricting the commencement of new activities, and could affect customer and investor confidence, our costs of funds and level of required deposit insurance assessments to the FDIC, our ability to pay dividends on our capital stock, our ability to make acquisitions, and our business, results of operations and financial conditions, generally.
Monetary policies and regulations of the Federal Reserve could adversely affect our business, financial condition and results of operations.
In addition to being affected by general economic conditions, our earnings and growth are affected by the policies of the Federal Reserve. An important function of the Federal Reserve is to regulate the money supply and credit conditions. Among the instruments used by the Federal Reserve to implement these objectives are open market purchases and sales of U.S. government securities, adjustments of the discount rate and changes in banks’ reserve requirements against bank deposits. These instruments are used in varying combinations to influence overall economic growth and the distribution of credit, bank loans, investments and deposits. Their use also affects interest rates charged on loans or paid on deposits.
The monetary policies and regulations of the Federal Reserve have had a significant effect on the operating results of commercial banks in the past and are expected to continue to do so in the future. The effects of such policies upon our business, financial condition and results of operations cannot be predicted.
Federal and state regulators periodically examine our business, and we may be required to remediate adverse examination findings.
The Federal Reserve, the FDIC, and the IDFPR periodically examine our business, including our compliance with laws and regulations. If, as a result of an examination, a banking agency were to determine that our financial condition, capital resources, asset quality, earnings prospects, management, liquidity or other aspects of any of our operations had become unsatisfactory, or that we or our predecessor were in violation of any law or regulation, they may take a number of different remedial actions as they deem appropriate. These actions include the power to enjoin “unsafe or unsound” practices, to require affirmative action to correct any conditions resulting from any violation or practice, to issue an administrative order that can be judicially enforced, to direct an increase in our capital, to restrict our growth, to assess civil money penalties, to fine or remove officers and directors and, if it is concluded that such conditions cannot be corrected or there is an imminent risk of loss to depositors, to terminate our deposit insurance and place our bank into receivership or conservatorship. Any regulatory action against us could have an adverse effect on our business, financial condition and results of operations.
Our ability to pay dividends may be limited and we do not intend to pay cash dividends on our common stock in the foreseeable future; consequently, your ability to achieve a return on your investment will depend on appreciation in the price of our common stock.
Holders of our common stock are entitled to receive only such dividends as our board of directors may declare out of funds legally available for such payments. We expect that we will retain all earnings, if any, for operating capital, and we do not expect our board of directors to declare any dividends on our common stock in
-37-
Table of Contents
the foreseeable future. Even if we have earnings in an amount sufficient to pay cash dividends, our board of directors may decide to retain earnings for the purpose of financing growth. We cannot assure you that cash
dividends on our common stock will ever be paid. You should not purchase shares of common stock offered hereby if you need or desire dividend income from this investment.
In addition, we are a bank holding company, and our ability to declare and pay dividends is dependent on certain federal regulatory considerations, including the guidelines of the Federal Reserve regarding capital adequacy and dividends. It is the policy of the Federal Reserve that bank holding companies should generally pay dividends on capital stock only out of earnings, and only if prospective earnings retention is consistent with the organization’s expected future needs, asset quality and financial condition.
Further, if we are unable to satisfy the capital requirements applicable to us for any reason, we may not be able to make, or may have to reduce or eliminate, the payment of dividends on our common stock in the event we decide to declare dividends. Any change in the level of our dividends or the suspension of the payment thereof could have a material adverse effect on the market price of our common stock.
We are subject to numerous laws designed to protect consumers, including the Community Reinvestment Act and fair lending laws, and failure to comply with these laws could lead to a wide variety of sanctions.
The Community Reinvestment Act of 1977 (“CRA”) requires our bank, consistent with safe and sound operations, to ascertain and meet the credit needs of its entire community, including low and moderate income areas. Our bank’s failure to comply with the CRA could, among other things, result in the denial or delay of certain corporate applications filed by us or our bank, including applications for branch openings or relocations and applications to acquire, merge or consolidate with another banking institution or holding company. In addition, the Equal Credit Opportunity Act, the Fair Housing Act and other fair lending laws and regulations prohibit discriminatory lending practices by financial institutions. The U.S. Department of Justice, federal banking agencies, and other federal agencies are responsible for enforcing these laws and regulations. A challenge to an institution’s compliance with fair lending laws and regulations could result in a wide variety of sanctions, including damages and civil money penalties, injunctive relief, restrictions on mergers and acquisitions activity, restrictions on expansion, and restrictions on entering new business lines. Private parties may also challenge an institution’s performance under fair lending laws in private class action litigation. Such actions could have a material adverse effect on our business, financial condition, results of operations and growth prospects.
Rulemaking changes implemented by the Consumer Financial Protection Bureau (“CFPB”) may result in higher regulatory and compliance costs that could adversely affect our results of operations.
The Dodd-Frank Act created a new, independent federal agency, the CFPB, which was granted broad rulemaking, supervisory and enforcement powers under various federal consumer financial protection laws. The consumer protection provisions of the Dodd-Frank Act and the examination, supervision and enforcement of those laws and implementing regulations by the CFPB have created a more intense and complex environment for consumer finance regulation. See “Supervision and Regulation—Consumer Financial Protection”. Notwithstanding that insured depository institutions with assets of $10 billion or less (such as Byline Bank) will continue to be supervised and examined by their primary federal regulators, the ultimate impact of this heightened scrutiny is uncertain and could result in changes to pricing, practices, products and procedures. It could also result in increased costs related to regulatory oversight, supervision and examination, remediation efforts and possible penalties.
-38-
Table of Contents
Litigation and regulatory actions, including possible enforcement actions, could subject us to significant fines, penalties, judgments or other requirements resulting in increased expenses or restrictions on our business activities.
Our business is subject to increased litigation and regulatory risks as a result of a number of factors, including the highly regulated nature of the financial services industry and the focus of state and federal
prosecutors on banks and the financial services industry generally. This focus has only intensified since the Great Recession, with regulators and prosecutors focusing on a variety of financial institution practices and requirements, including foreclosure practices, compliance with applicable consumer protection laws, classification of “held for sale” assets and compliance with anti-money laundering statutes, the Bank Secrecy Act and sanctions administered by the Office of Foreign Assets Control of the U.S. Department of the Treasury (“OFAC”).
In the normal course of business, from time to time, we have in the past and may in the future be named as a defendant in various legal actions, including arbitrations, class actions and other litigation, arising in connection with our current and/or prior business activities. Legal actions could include claims for substantial compensatory or punitive damages or claims for indeterminate amounts of damages. In addition, while the arbitration provisions in certain of our customer agreements historically have limited our exposure to consumer class action litigation, there can be no assurance that we will be successful in enforcing our arbitration clause in the future. Further, we have in the past, and may in the future be subject to consent orders with our regulators. We may also, from time to time, be the subject of subpoenas, requests for information, reviews, investigations and proceedings (both formal and informal) by governmental agencies regarding our current and/or prior business activities. Any such legal or regulatory actions may subject us to substantial compensatory or punitive damages, significant fines, penalties, obligations to change our business practices or other requirements resulting in increased expenses, diminished income and damage to our reputation. Our involvement in any such matters, whether tangential or otherwise and even if the matters are ultimately determined in our favor, could also cause significant harm to our reputation and divert management attention from the operation of our business. Further, any settlement, consent order or adverse judgment in connection with any formal or informal proceeding or investigation by government agencies may result in litigation, investigations or proceedings as other litigants and government agencies begin independent reviews of the same activities. As a result, the outcome of legal and regulatory actions could be material to our business, results of operations, financial condition and cash flows depending on, among other factors, the level of our earnings for that period, and could have a material adverse effect on our business, financial condition or results of operations.
Non-compliance with the USA PATRIOT Act, the Bank Secrecy Act or other laws and regulations could result in fines or sanctions against us.
The USA PATRIOT Act of 2001 and the Bank Secrecy Act require financial institutions to design and implement programs to prevent financial institutions from being used for money laundering and terrorist activities. If such activities are detected, financial institutions are obligated to file suspicious activity reports with the Financial Crimes Enforcement Network of the U.S. Department of the Treasury. These rules require financial institutions to establish procedures for identifying and verifying the identity of customers seeking to open new financial accounts. Federal and state bank regulators also have focused on compliance with Bank Secrecy Act and anti-money laundering regulations. Failure to comply with these regulations could result in fines or sanctions, including restrictions on conducting acquisitions or establishing new branches. In recent years, several banking institutions have received large fines for non-compliance with these laws and regulations. While we have developed policies and procedures designed to assist in compliance with these laws and regulations, these policies and procedures may not be effective in preventing violations of these laws and regulations. Failure to maintain and implement adequate programs to combat money laundering and terrorist financing could also have serious reputational consequences for us, which could have a material adverse effect on our business, financial condition or results of operations.
-39-
Table of Contents
Regulations relating to privacy, information security and data protection could increase our costs, affect or limit how we collect and use personal information and adversely affect our business opportunities.
We are subject to various privacy, information security and data protection laws, including requirements concerning security breach notification, and we could be negatively affected by these laws. For example, our business is subject to the Gramm-Leach-Bliley Act which, among other things: (i) imposes certain limitations on
our ability to share nonpublic personal information about our customers with nonaffiliated third parties; (ii) requires that we provide certain disclosures to customers about our information collection, sharing and security practices and afford customers the right to “opt out” of any information sharing by us with nonaffiliated third parties (with certain exceptions) and (iii) requires that we develop, implement and maintain a written comprehensive information security program containing appropriate safeguards based on our size and complexity, the nature and scope of our activities, and the sensitivity of customer information we process, as well as plans for responding to data security breaches. Various state and federal banking regulators and states have also enacted data security breach notification requirements with varying levels of individual, consumer, regulatory or law enforcement notification in certain circumstances in the event of a security breach. Moreover, legislators and regulators in the United States are increasingly adopting or revising privacy, information security and data protection laws that potentially could have a significant impact on our current and planned privacy, data protection and information security-related practices, our collection, use, sharing, retention and safeguarding of consumer or employee information, and some of our current or planned business activities. This could also increase our costs of compliance and business operations and could reduce income from certain business initiatives. This includes increased privacy-related enforcement activity at the federal level, by the Federal Trade Commission and CFPB, as well as at the state level, such as with regard to mobile applications.
Compliance with current or future privacy, data protection and information security laws (including those regarding security breach notification) affecting customer or employee data to which we are subject could result in higher compliance and technology costs and could restrict our ability to provide certain products and services, which could have a material adverse effect on our business, financial conditions or results of operations. Our failure to comply with privacy, data protection and information security laws could result in potentially significant regulatory or governmental investigations or actions, litigation, fines, sanctions and damage to our reputation, which could have a material adverse effect on our business, financial condition or results of operations.
Potential limitations on incentive compensation contained in proposed federal agency rulemaking may adversely affect our ability to attract and retain our highest performing employees.
During the second quarter of 2016, the Federal Reserve and the FDIC, along with other U.S. regulatory agencies, jointly published proposed rules designed to implement provisions of the Dodd-Frank Act prohibiting incentive compensation arrangements that would encourage inappropriate risk taking at covered financial institutions, which includes a bank or bank holding company with $1 billion or more in assets, such as Byline Bank. It cannot be determined at this time whether or when a final rule will be adopted and whether compliance with such a final rule will substantially affect the manner in which we structure compensation for our executives and other employees. Depending on the nature and application of the final rules, we may not be able to compete successfully with certain financial institutions and other companies that are not subject to some or all of the rules to retain and attract executives and other high performing employees. If this were to occur, relationships that we have established with our clients may be impaired and our business, financial condition and results of operations could be adversely affected, perhaps materially.
We are subject to environmental liability risk associated with our lending activities and with the properties we own.
A significant portion of our loan portfolio is secured by real property. During the ordinary course of business, we may foreclose on and take title to properties securing certain loans and there is a risk that hazardous
-40-
Table of Contents
or toxic substances could be found on these properties, notwithstanding our prior due diligence. We also own many of our branches and it is possible that hazardous or toxic substances could be found on these properties. If hazardous or toxic substances are found, we may be liable for remediation costs, as well as for personal injury and property damage. Environmental laws may require us to incur substantial expenses and may materially reduce the affected property’s value or limit our ability to use or sell the affected property. In addition, future laws or more stringent interpretations or enforcement policies with respect to existing laws may increase our
exposure to environmental liability. The remediation costs and any other financial liabilities associated with an environmental hazard could have a material adverse effect on our business, results of operations and financial condition.
Risks Related to Acquisition Activity
We may be adversely affected by risks associated with completed and potential acquisitions, including execution risks, failure to realize anticipated transaction benefits, and failure to overcome integration risks, which could adversely affect our growth and profitability.
We plan to grow our businesses organically but remain open to considering potential smaller bank or other acquisition opportunities that fit within the deposit strength and commercial orientation of our franchise and that we believe support our businesses and make financial and strategic sense. In the event that we do pursue acquisitions, we may have difficulty executing on acquisitions and may not realize the anticipated benefits of any transaction we complete. Any of the foregoing matters could materially and adversely affect us.
Generally, any acquisition of target financial institutions, branches or other banking assets by us will require approval by, and cooperation from, a number of governmental regulatory agencies, possibly including the Federal Reserve and the FDIC as well as the IDFPR. In evaluating applications seeking approval of acquisitions, such regulators consider factors such as, among other things, the competitive effect and public benefits of the transaction, the capital position and managerial resources of the combined organization, the risks to the stability of the U.S. banking or financial system, the applicant’s performance record under the CRA, the applicant’s compliance with fair housing and other consumer protection laws and the effectiveness of all organizations involved in combating money laundering activities. Such regulators could deny our application, which would restrict our growth, or the regulatory approvals may not be granted on terms that are acceptable to us. For example, we could be required to sell branches as a condition to receiving regulatory approvals, and such a condition may not be acceptable to us or may reduce the benefit of an acquisition.
As to any acquisition that we complete, including the Ridgestone acquisition, which took place in October 2016, we may fail to realize some or all of the anticipated transaction benefits if the integration process takes longer or is more costly than expected or otherwise fails to meet our expectations.
In addition, acquisition activities could be material to our business and involve a number of risks, including the following:
| • | incurring time and expense associated with identifying and evaluating potential acquisitions and negotiating potential transactions, resulting in our attention being diverted from the operation of our existing business; |
| • | using inaccurate estimates and judgments to evaluate credit, operations, management and market risks with respect to the target institution or assets; |
| • | actual results of the acquired business may vary significantly from projected results; |
| • | intense competition from other banking organizations and other inquirers for acquisitions, causing us to lose opportunities or overpay for acquisitions; |
-41-
Table of Contents
| • | potential exposure to unknown or contingent liabilities of banks and businesses we acquire; |
| • | unexpected asset quality problems; |
| • | the time and expense required to integrate the operations of the combined businesses, including the integration or replacement of information technology and other systems; |
| • | difficulties in integrating and retaining employees of acquired businesses; |
| • | higher operating expenses relative to operating income from the new operations; |
| • | creating an adverse short-term effect on our results of operations; |
| • | losing key employees or customers as a result of an acquisition that is poorly received; |
| • | significant problems relating to the conversion of the financial and customer data of the entity; |
| • | integration of acquired customers into our financial and customer product systems; |
| • | risk of assuming businesses with internal control deficiencies; or |
| • | risks of impairment to goodwill or other assets. |
Depending on the condition of any institution or assets or liabilities that we may acquire, that acquisition may, at least in the near term, adversely affect our capital and earnings and, if not successfully integrated with our organization, may continue to have such effects over a longer period. We may not be successful in overcoming these risks or any other problems encountered in connection with potential acquisitions, and any acquisition we may consider will be subject to prior regulatory approval.
Also, acquisitions may involve the payment of a premium over book and market values and, therefore, some dilution of our tangible book value and net income per common share may occur in connection with any future transaction. Our inability to overcome these risks could have a material adverse effect on our profitability, return on equity and return on assets, our ability to implement our business strategy and enhance stockholder value, which, in turn, could have a material adverse effect on our business, financial condition and results of operations.
Risks Related to Our Common Stock
No prior public market exists for our common stock, and one may not develop.
Before this offering, there has not been a public trading market for our common stock, and an active trading market may not develop or be sustained after this offering. If an active trading market does not develop, you may have difficulty selling your shares of common stock at an attractive price—or at all. The initial public offering price for our common stock sold in this offering will be determined by us and the underwriters. This price may not be indicative of the price at which our common stock will trade after this offering. The market price of our common stock may decline below the initial offering price, and you may not be able to sell your common stock at or above the price you paid in this offering—or at all.
Our stock price may be volatile, and you could lose part or all of your investment as a result.
Stock price volatility may make it more difficult for you to resell your common stock when you want and at prices you find attractive. Our stock price may fluctuate significantly in response to a variety of factors including, among other things:
| • | actual or anticipated variations in our quarterly results of operations; |
-42-
Table of Contents
| • | recommendations or research reports about us or the financial services industry in general published by securities analysts; |
| • | the failure of securities analysts to cover, or continue to cover, us after this offering; |
| • | operating and stock price performance of other companies that investors deem comparable to us; |
| • | news reports relating to trends, concerns and other issues in the financial services industry; |
| • | perceptions in the marketplace regarding us, our competitors or other financial institutions; |
| • | future sales of our common stock; |
| • | departure of our management team or other key personnel; |
| • | new technology used, or services offered, by competitors; |
| • | significant acquisitions or business combinations, strategic partnerships, joint ventures or capital commitments by or involving us or our competitors; |
| • | changes or proposed changes in laws or regulations, or differing interpretations thereof affecting our business, or enforcement of these laws and regulations; |
| • | litigation and governmental investigations; and |
| • | geopolitical conditions such as acts or threats of terrorism or military conflicts. |
If any of the foregoing occurs, it could cause our stock price to fall and may expose us to litigation that, even if our defense is successful, could distract our management and be costly to defend. General market fluctuations, industry factors and general economic and political conditions and events—such as economic slowdowns or recessions, interest rate changes or credit loss trends—could also cause our stock price to decrease regardless of operating results.
Our principal stockholder, MBG Investors I, L.P. will continue to have significant influence over us following the completion of this offering, and its interests could conflict with those of our other stockholders.
Prior to this offering, our principal stockholder, MBG Investors I, L.P., owned approximately 46.6% of the outstanding shares of our common stock. As a result, MBG Investors I, L.P. is able to influence matters requiring approval by our stockholders, including the election of directors and the approval of mergers or other extraordinary transactions. MBG Investors I, L.P. may also have interests that differ from yours and may vote in a way with which you disagree and which may be adverse to your interests. The concentration of ownership may also have the effect of delaying, preventing or deterring a change of control of the Company, could deprive our stockholders of an opportunity to receive a premium for their common stock as part of a sale of our company and might ultimately affect the market price of our common stock.
MBG Investors I, L.P. could sell its interest in us to a third party in a private transaction, which may not lead to your realization of any change-of-control premium on shares of our common stock and would subject us to the influence of a presently unknown third party.
Following the completion of this offering, MBG Investors I, L.P. will continue to beneficially own a large equity interest of our company. MBG Investors I, L.P. will have the ability, should it choose to do so, to sell some or all of its shares of our common stock in a privately negotiated transaction, which, if sufficient in size, could result in another party gaining significant influence over our company.
-43-
Table of Contents
The ability of MBG Investors I, L.P. to sell its shares of our common stock privately, with no requirement for a concurrent offer to be made to acquire all of the shares of our outstanding common stock that will be publicly traded hereafter, could prevent you from realizing any change-of-control premium on your shares of our common stock that may accrue to MBG Investors I, L.P. on its private sale of our common stock.
We are an emerging growth company within the meaning of the Securities Act of 1933 (the “Securities Act”) and because we have decided to take advantage of certain exemptions from various reporting and other requirements applicable to emerging growth companies, our common stock could be less attractive to investors.
For as long as we remain an “emerging growth company”, as defined in the JOBS Act, we will have the option to take advantage of certain exemptions from various reporting and other requirements that are applicable to other public companies that are not emerging growth companies, including not being required to comply with the auditor attestation requirements of Section 404(b) of the Sarbanes-Oxley Act of 2002 (“Sarbanes-Oxley”), being permitted to have an extended transition period for adopting any new or revised accounting standards that may be issued by the Financial Accounting Standards Board or the SEC reduced disclosure obligations regarding executive compensation in our registration statements, periodic reports and proxy statements and exemptions from the requirements of holding a nonbinding advisory vote on executive compensation and stockholder approval of any golden parachute payments not previously approved. We have elected to, and expect to continue to, take advantage of certain of these and other exemptions until we are no longer an emerging growth company. Further, the JOBS Act allows us to present only two years of audited financial statements and only two years of related management’s discussion and analysis of financial condition and results of operations and provide less than five years of selected financial data in this prospectus.
We will remain an emerging growth company until the earliest of (i) the end of the fiscal year during which we have total annual gross revenues of $1,070,000,000 or more, (ii) the end of the fiscal year following the fifth anniversary of the completion of this offering, (iii) the date on which we have, during the previous three-year period, issued more than $1.0 billion in non-convertible debt, and (iv) the end of the first fiscal year in which (A) the market value of our equity securities that are held by non-affiliates exceeds $700 million as of June 30 of that year, (B) we have been a public reporting company under the Securities Exchange Act of 1934 (the “Exchange Act”) for at least twelve calendar months and (C) we have filed at least one annual report on Form 10-K.
Because we have elected to use the extended transition period for complying with new or revised accounting standards for an “emerging growth company” our financial statements may not be comparable to companies that comply with these accounting standards as of the public company effective dates.
We have elected to use the extended transition period for complying with new or revised accounting standards under Section 7(a)(2)(B) of the Securities Act. This election allows us to delay the adoption of new or revised accounting standards that have different effective dates for public and private companies until those standards apply to private companies. As a result of this election, our financial statements may not be comparable to companies that comply with these accounting standards as of the public company effective dates. Consequently, our financial statements may not be comparable to companies that comply with public company effective dates. Because our financial statements may not be comparable to companies that comply with public company effective dates, investors may have difficulty evaluating or comparing our business, performance or prospects in comparison to other public companies, which may have a negative impact on the value and liquidity of our common stock. We cannot predict if investors will find our common stock less attractive because we plan to rely on this exemption. If some investors find our common stock less attractive as a result, there may be a less active trading market for our common stock and our stock price may be more volatile.
-44-
Table of Contents
Fulfilling our public company financial reporting and other regulatory obligations and transitioning to a standalone public company will be expensive and time consuming and may strain our resources.
As a public company, we will be subject to the reporting requirements of the Exchange Act and will be required to implement specific corporate governance practices and adhere to a variety of reporting requirements under Sarbanes-Oxley and the related rules and regulations of the SEC, as well as the rules of the NYSE. The Exchange Act will require us to file annual, quarterly and current reports with respect to our business and
financial condition. Sarbanes-Oxley will require, among other things, that we maintain effective disclosure controls and procedures and internal control over financial reporting. Compliance with these requirements will place additional demands on our legal, accounting, finance and investor relations staff and on our accounting, financial and information systems and will increase our legal and accounting compliance costs as well as our compensation expense as we may be required to hire additional legal, accounting, tax, finance and investor relations staff. As a public company we may also need to enhance our investor relations and corporate communications functions and attract additional qualified board members. These additional efforts may strain our resources and divert management’s attention from other business concerns, which could have a material adverse effect on our business, financial condition or results of operations. We expect to incur additional incremental ongoing and one-time expenses in connection with our transition to a public company. See “Management’s Discussion and Analysis of Financial Condition and Results of Operations—Non-interest Expense”. The actual amount of the incremental expenses we will incur may be higher, perhaps significantly, from our current estimates.
In accordance with Section 404 of Sarbanes-Oxley, our management will be required to conduct an annual assessment of the effectiveness of our internal control over financial reporting and include a report on these internal controls in the annual reports we will file with the SEC on Form 10-K. Our independent registered public accounting firm will not be required to attest formally to the effectiveness of our internal controls until the later of the year following the first annual report required to be filed with the SEC and the date on which we are no longer an “emerging growth company”. When required, this process will require additional documentation of policies, procedures and systems, further review of that documentation by our third party internal auditing staff and internal accounting staff and our outside independent registered public accounting firm, and additional testing of our internal control over financial reporting by our third party internal auditing staff and internal accounting staff and our outside independent registered public accounting firm. This process will involve considerable time and attention, may strain our internal resources, and will increase our operating costs. We may experience higher than anticipated operating expenses and outside auditor fees during the implementation of these changes and thereafter. If our independent registered public accounting firm is unable to express an opinion as to the effectiveness of our internal control over financial reporting, investors may lose confidence in the accuracy and completeness of our financial reports and the market price of our common stock could be negatively affected, and we could become subject to investigations by the NYSE, the SEC or other regulatory authorities, which could require additional financial and management resources.
If we are not able to implement the requirements of Section 404 of Sarbanes-Oxley in a timely and capable manner, we may be subject to adverse regulatory consequences and there could be a negative reaction in the financial markets due to a loss of investor confidence in us and the reliability of our financial statements. This could have a material adverse effect on our business, financial condition or results of operations.
The financial reporting resources we have put in place may not be sufficient to ensure the accuracy of the additional information we are required to disclose as a publicly listed company.
As a result of becoming a publicly listed company, we will be subject to the heightened financial reporting standards under GAAP and SEC rules, including more extensive levels of disclosure. Complying with these standards requires enhancements to the design and operation of our internal control over financial reporting as well as additional financial reporting and accounting staff with appropriate training and experience in GAAP and SEC rules and regulations.
-45-
Table of Contents
If we are unable to meet the demands that will be placed upon us as a public company, including the requirements of Sarbanes-Oxley, we may be unable to report our financial results accurately, or report them within the timeframes required by law or stock exchange regulations. Failure to comply with Sarbanes-Oxley, when and as applicable, could also potentially subject us to sanctions or investigations by the SEC or other regulatory authorities. If material weaknesses or other deficiencies occur, our ability to report our financial results accurately and timely could be impaired, which could result in late filings of our annual and quarterly
reports under the Exchange Act, restatements of our consolidated financial statements, a decline in our stock price, suspension or delisting of our common stock from the NYSE, and could have a material adverse effect on our business, results of operations or financial condition. Even if we are able to report our financial statements accurately and in a timely manner, any failure in our efforts to implement the improvements or disclosure of material weaknesses in our future filings with the SEC could cause our reputation to be harmed and our stock price to decline significantly.
We have not performed an evaluation of our internal control over financial reporting, as contemplated by Section 404 of Sarbanes-Oxley, nor have we engaged our independent registered public accounting firm to perform an audit of our internal control over financial reporting as of any balance sheet date reported in our financial statements. Had we performed such an evaluation or had our independent registered public accounting firm performed an audit of our internal control over financial reporting, material weaknesses may have been identified. In addition, the JOBS Act provides that, so long as we qualify as an “emerging growth company”, we will be exempt from the provisions of Section 404(b) of Sarbanes-Oxley, which would require that our independent registered public accounting firm provide an attestation report on the effectiveness of our internal control over financial reporting. We may take advantage of this exemption so long as we qualify as an “emerging growth company”.
Investors in this offering will experience immediate and substantial dilution.
The initial public offering price is expected to be substantially higher than the net tangible book value per share of our common stock immediately following this offering. Therefore, if you purchase shares in the offering, you will experience immediate and substantial dilution in net tangible book value per share in relation to the price that you paid for your shares. We expect the dilution as a result of the offering to be $7.31 per share, based on an assumed initial offering price of $20.00 per share (the midpoint of the range set forth on the cover page of this prospectus) and our pro forma net tangible book value of $12.69 per share as of March 31, 2017. Accordingly, if we were liquidated at our pro forma net tangible book value, you would not receive the full amount of your investment.
Future sales of our common stock in the public market, including by our current stockholders, could lower our stock price, and any increase in shares issued as part of our equity-based compensation plans or for other purposes may dilute your ownership in us.
The market price of our common stock could decline as a result of sales of a large number of shares of our common stock available for sale after completion of this offering or from the perception that such sales could occur. These sales, or the possibility that these sales may occur, also may make it more difficult for us to raise additional capital by selling equity securities in the future, at a time and price that we deem appropriate. Upon completion of this offering, we will have a total of 28,391,900 outstanding shares of common stock, assuming the underwriters do not exercise their option to purchase additional shares. Of the outstanding shares, the 5,700,000 shares sold in this offering (or 6,555,000 shares if the underwriters exercise their option to purchase additional shares in full) will be freely tradable without restriction or further registration under the Securities Act, except that any shares purchased or held by our affiliates, as that term is defined under Rule 144 of the Securities Act, may be sold only in compliance with the limitations described in “Shares Eligible for Future Sale”. The remaining 22,691,900 shares outstanding will be restricted securities as defined under Rule 144 subject to certain restrictions on resale. Purchasers in the Reserved Share Program will agree not to sell shares purchased under the program for 180 days after the date of this prospectus. See “Underwriting—Lock-up Agreements” for further information.
-46-
Table of Contents
We have agreed with the underwriters not to offer, pledge, sell or otherwise dispose of or hedge any shares of our common stock, subject to certain exceptions, for the 180-day period following the date of this prospectus, without the prior consent of Merrill Lynch, Pierce, Fenner & Smith Incorporated and Keefe, Bruyette & Woods, Inc. on behalf of the underwriters. Holders of a significant majority of our common stock and all of our officers and directors have entered into similar lock-up agreements with the underwriters, subject to de minimis exceptions. The underwriters may, at any time, release us or any of our officers or directors from this lock-up agreement and allow us to sell shares of our common stock within this 180-day period. In addition, any shares purchased through the reserved share program described in this prospectus are subject to the same 180-day lockup period.
Upon the expiration of the lock-up agreements described above, all of such shares will be eligible for resale in a public market, subject, in the case of shares held by our affiliates, to volume, manner of sale and other limitations under Rule 144 or registration under the Securities Act.
We cannot predict the size of future issuances or sales of our common stock or the effect, if any, that future issuances or sales of shares of our common stock may have on the market price of our common stock. Sales or distributions of substantial amounts of our common stock (including shares issued in connection with an acquisition), or the perception that such sales could occur, may cause the market price of our common stock to decline.
Certain banking laws and certain provisions of our certificate of incorporation may have an anti-takeover effect.
Provisions of federal banking laws, including regulatory approval requirements, could make it difficult for a third party to acquire us, even if doing so would be perceived to be beneficial to our stockholders. Acquisition of 10% or more of any class of voting stock of a bank holding company or depository institution, including shares of our common stock following completion of this offering, generally creates a rebuttable presumption that the acquirer “controls” the bank holding company or depository institution. Also, a bank holding company must obtain the prior approval of the Federal Reserve before, among other things, acquiring direct or indirect ownership or control of more than 5% of the voting shares of any bank, including our bank.
There also are provisions in our amended and restated certificate of incorporation, which we refer to as our certificate of incorporation, and amended and restated bylaws, which we refer to as our bylaws, to be effective prior to the completion of this offering, such as limitations on the ability to call a special meeting of our stockholders, that may be used to delay or block a takeover attempt. In addition, our board of directors will be authorized under our certificate of incorporation to issue shares of our preferred stock, and determine the rights, terms conditions and privileges of such preferred stock, without stockholder approval. These provisions may effectively inhibit a non-negotiated merger or other business combination, which, in turn, could have a material adverse effect on the market price of our common stock.
We have broad discretion in the use of the net proceeds from this offering, and our use of those proceeds may not yield a favorable return on your investment.
We intend to use the net proceeds generated by this offering to support our organic growth and for other general corporate purposes that may include, but are not limited to the repayment or refinancing of outstanding debt, working capital and other general purposes. Our management has broad discretion over how these proceeds are to be used and could spend the proceeds in ways with which you may not agree. In addition, we may not use the proceeds of this offering effectively or in a manner that increases our market value or enhances our profitability. We have not established a timetable for the effective deployment of the proceeds, and we cannot predict how long it will take to deploy the proceeds. Investing the offering proceeds in securities until we are able to deploy the proceeds will provide lower margins than we generally earn on loans, potentially adversely affecting stockholder returns, including earnings per share, return on assets and return on equity.
-47-
Table of Contents
An investment in our common stock is not an insured deposit and is subject to risk of loss.
Your investment in our common stock will not be a bank deposit and will not be insured or guaranteed by the FDIC or any other government agency. Your investment will be subject to investment risk, and you must be capable of affording the loss of your entire investment.
-48-
Table of Contents
CAUTIONARY NOTE REGARDING FORWARD-LOOKING STATEMENTS
This prospectus contains forward-looking statements within the meaning of the Private Securities Litigation Reform Act of 1995. These forward-looking statements reflect our current views with respect to, among other things, future events and our financial performance. These statements are often, but not always, made through the use of words or phrases such as “may”, “might”, “should”, “could”, “predict”, “potential”, “believe”, “expect”, “continue”, “will”, “anticipate”, “seek”, “estimate”, “intend”, “plan”, “projection”, “would”, “annualized” and “outlook”, or the negative version of those words or other comparable words or phrases of a future or forward-looking nature. These forward-looking statements are not historical facts, and are based on current expectations, estimates and projections about our industry, management’s beliefs and certain assumptions made by management, many of which, by their nature, are inherently uncertain and beyond our control. Accordingly, we caution you that any such forward-looking statements are not guarantees of future performance and are subject to risks, assumptions, estimates and uncertainties that are difficult to predict. Although we believe that the expectations reflected in these forward-looking statements are reasonable as of the date made, actual results may prove to be materially different from the results expressed or implied by the forward-looking statements.
A number of important factors could cause our actual results to differ materially from those indicated in these forward-looking statements, including those factors identified in “Risk Factors” or “Management’s Discussion and Analysis of Financial Condition and Results of Operations” or the following:
| • | the geographic concentration of our operations in the Chicago metropolitan area; |
| • | current and future business, economic and market conditions in the United States generally or in Illinois in particular; |
| • | the effects of the current low interest rate environment or changes in interest rates on our net interest income, net interest margin, our investments, and our loan originations, loan servicing rights and loans held for sale and our modeling estimates relating to interest rate changes; |
| • | our inability to receive dividends from our bank, pay dividends to our common stockholders and satisfy obligations as they become due; |
| • | the effects of geopolitical instability, including war, terrorist attacks, and man-made and natural disasters; |
| • | our ability to maintain our bank’s reputation; |
| • | lack of seasoning in our loan portfolio; |
| • | our asset quality and any loan charge-offs; |
| • | our ability to attract and retain customer deposits; |
| • | changes in SBA and USDA rules, regulations and loan products, including specifically the SBA’s Section 7(a) program, changes in SBA and USDA standard operating procedures or changes to the bank’s status as an SBA Preferred Lender; |
| • | our ability to achieve organic loan and deposit growth and the composition of such growth; |
| • | the composition of our loan portfolio; |
| • | time and effort necessary to resolve nonperforming assets; |
-49-
Table of Contents
| • | our ability to attract and retain skilled employees or changes in our management personnel; |
| • | our ability to effectively compete with other financial services companies and the effects of competition in the financial services industry on our business; |
| • | our ability to successfully develop and commercialize new or enhanced products and services; |
| • | changes in the demand for our products and services; |
| • | the effectiveness of our risk management and internal disclosure controls and procedures; |
| • | any failure or interruption of our information and communications systems; |
| • | our ability to identify and address cybersecurity risks; |
| • | our ability to keep pace with technological changes; |
| • | the effects of problems encountered by other financial institutions; |
| • | our access to sources of liquidity and capital to address our liquidity needs; |
| • | fluctuations in the values of our assets and liabilities and off-balance sheet exposures; |
| • | the effects of the failure of any component of our business infrastructure provided by a third party; |
| • | the impact of, and changes in applicable laws, regulations and accounting standards and policies; |
| • | possible changes in trade, monetary and fiscal policies of, and other activities undertaken by, governments, agencies, central banks and similar organizations; |
| • | our likelihood of success in, and the impact of, legal, regulatory or other actions, investigations or proceedings relating to our business or the operations of our predecessor; |
| • | environmental liability associated with our lending activities; |
| • | market perceptions associated with certain aspects of our business; |
| • | possible impairment of our goodwill and other intangible assets, or any adjustment of the valuation of our deferred tax assets; |
| • | changes in the scope and cost of FDIC deposit insurance premiums; |
| • | our limited operating history since the Recapitalization; |
| • | the one-time and incremental costs of operating as a standalone public company; |
| • | our ability to meet our obligations as a public company, including our obligations under Section 404 of Sarbanes-Oxley; and |
| • | damage to our reputation from any of the factors described above, in “Risk Factors” or in “Management’s Discussion and Analysis of Financial Condition and Results of Operations”. |
-50-
Table of Contents
The foregoing factors should not be considered an exhaustive list and should be read together with the other cautionary statements included in this prospectus. If one or more events related to these or other risks or uncertainties materialize, or if our underlying assumptions prove to be incorrect, actual results may differ materially from what we anticipate. Accordingly, you should not place undue reliance on any such forward-looking statements. Any forward-looking statement speaks only as of the date on which it is made, and we do not undertake any obligation to update or review any forward-looking statement, whether as a result of new information, future developments or otherwise.
-51-
Table of Contents
We estimate that the net proceeds to us from the sale of our common stock in this offering will be approximately $66.4 million, or approximately $82.4 million if the underwriters elect to exercise in full their option to purchase additional shares from us, assuming an initial public offering price of $20.00 per share, the midpoint of the price range set forth on the cover of this prospectus, and after deducting underwriting discounts and commissions and estimated offering expenses. Each $1.00 increase (decrease) in the assumed initial public offering price would increase (decrease) the net proceeds to us of this offering by $3.5 million, or $4.3 million if the underwriters elect to exercise in full their option to purchase additional shares, after deducting underwriting discounts and commissions and estimated offering expenses. We intend to use the net proceeds from this offering (i) to repay the outstanding balance under our line of credit of approximately $16.2 million as of June 19, 2017, (ii) to repurchase, subject to regulatory approval, all outstanding shares of our Series A Preferred Stock for approximately $26.8 million, and (iii) for general corporate purposes.
The indebtedness under our line of credit, which was incurred in connection with the Ridgestone acquisition, matures on October 12, 2017 and bears interest at a rate equal to the Prime rate, which is currently 4.25%. See “Management’s Discussion and Analysis of Financial Condition and Results of Operation” for further information.
The aggregate purchase price of approximately $26.8 million that we expect to pay for the proposed repurchase of all outstanding shares of our Series A Preferred Stock is based on the assumed initial public offering price of $20.00 per share of our common stock (the midpoint of the price range set forth on the cover of this prospectus). Each $1.00 increase (decrease) in the assumed initial public offering price would increase (decrease) the aggregate repurchase price of the Series A Preferred Stock by approximately $1.3 million.
We will not receive any proceeds from the sale of common stock by the selling stockholders.
-52-
Table of Contents
We do not intend to pay dividends on our common stock in the near-term. Instead, we anticipate that all of our future earnings will be retained to support our operations and to finance the growth and development of our business. Any future determination relating to our dividend policy will be made by our board of directors and will depend on a number of factors, including: (1) our historic and projected financial condition, liquidity and results of operations, (2) our capital levels and needs, (3) tax considerations, (4) any acquisitions or potential acquisitions that we may examine, (5) statutory and regulatory prohibitions and other limitations, (6) the terms of any credit agreements or other borrowing arrangements that restrict our ability to pay cash dividends, (7) general economic conditions and (8) other factors deemed relevant by our board of directors. We are not obligated to pay dividends on our common stock and are subject to restrictions on paying dividends on our common stock.
As a Delaware corporation, we will be subject to certain restrictions on dividends under the Delaware General Corporation Law (the “DGCL”). Generally, a Delaware corporation may only pay dividends either out of “surplus” or out of the current or the immediately preceding year’s net profits. Surplus is defined as the excess, if any, at any given time, of the total assets of a corporation over its total liabilities and statutory capital. The value of a corporation’s assets can be measured in a number of ways and may not necessarily equal their book value.
In addition, we are subject to certain restrictions on the payment of cash dividends as a result of banking laws, regulations and policies. See “Supervision and Regulation—Dividends; Stress Testing”.
Because we are a bank holding company and do not engage directly in business activities of a material nature, our ability to pay dividends to our stockholders depends, in large part, upon our receipt of dividends from the Bank, which is also subject to numerous limitations on the payment of dividends under federal and state banking laws, regulations and policies. See “Supervision and Regulation—Dividends; Stress Testing”.
-53-
Table of Contents
In March 2017, Byline Bancorp, Inc., an Illinois corporation, or Byline Illinois, formed Byline Bancorp, Inc., a Delaware corporation, or Byline Delaware. On June 16, 2017, Byline Illinois merged with and into Byline Delaware, the registrant, with Byline Delaware surviving. In the merger, each share of Byline Illinois common stock issued and outstanding was converted automatically into the right to receive one fifth (0.20) of a share of common stock of Byline Delaware, with cash to be paid in lieu of fractional shares, and shares of each series of Byline Illinois’ preferred stock were converted into a substantially similar series of Byline Delaware preferred stock.
As a result of the merger, we “reincorporated” as a Delaware corporation. The Reincorporation did not result in any change of the business, management, jobs, fiscal year, assets, liabilities or location of the principal facilities of the Company.
-54-
Table of Contents
The following table shows our capitalization, including regulatory capital ratios, on a consolidated basis, as of March 31, 2017:
| • | on an actual basis, giving effect to the Reincorporation, but before payment of fractional shares of approximately $2,000; and |
| • | on an as adjusted basis after giving effect to (i) the net proceeds from the sale by us of our common stock in this offering (assuming the underwriters do not exercise their option to purchase additional shares from us) at an assumed initial public offering price of $20.00 per share, the midpoint of the price range on the cover of this prospectus, after deducting underwriting discounts and commissions and estimated offering expenses, (ii) the repayment in full of the outstanding balance on our line of credit of approximately $16.2 million as of June 19, 2017 and (iii) the repurchase of all of our outstanding Series A Preferred Stock at an assumed aggregate purchase price of $26.8 million. See “Use of Proceeds” for additional information. |
You should read the following table in conjunction with the sections titled “Use of Proceeds”, “Selected Historical Consolidated Financial and Operating Information” and “Management’s Discussion and Analysis of Financial Condition and Results of Operations” and our consolidated financial statements and related notes appearing elsewhere in this prospectus.
| At March 31, 2017 |
As Adjusted(1) | |||||||
| (dollars in thousands) | ||||||||
| Cash and cash equivalents |
$ | 83,267 | $ | 104,641 | ||||
|
|
|
|
|
|||||
| Debt: |
||||||||
| Short-Term Borrowings |
||||||||
| Line of credit(2) |
18,150 | — | ||||||
| Federal Home Loan Bank advances |
209,663 | 209,663 | ||||||
| Securities sold under agreements to repurchase |
31,940 | 31,940 | ||||||
|
|
|
|
|
|||||
| Total short-term borrowings |
259,753 | 241,603 | ||||||
| Long-Term Borrowings |
||||||||
| Junior subordinated debentures issued to capital trusts, net |
27,130 | 27,130 | ||||||
|
|
|
|
|
|||||
| Total long-term borrowings |
27,130 | 27,130 | ||||||
| Shareholders’ Equity |
||||||||
| Preferred stock, par value $0.01 per share (25,000,000 shares authorized, 15,003 shares have been designated as Series A preferred stock and 50,000 shares have been designated as Series B preferred stock; 15,003 shares of our Series A preferred stock and 10,438 of our Series B preferred stock issued and outstanding on an actual basis and 0 shares of our Series A preferred stock and 10,438 shares of our Series B preferred stock issued and outstanding on an adjusted basis) |
25,441 | 10,438 | (3) | |||||
| Common stock, voting, par value $0.01 per share (150,000,000 shares authorized, 24,616,706 and 28,391,900 shares outstanding on an actual and adjusted basis, respectively) |
311,994 | 378,364 | ||||||
| Additional paid-in capital |
1,844 | 1,844 | ||||||
| Retained earnings |
57,304 | 45,461 | ||||||
| Accumulated other comprehensive loss, net of tax |
(6,900 | ) | (6,900 | ) | ||||
|
|
|
|
|
|||||
| Total shareholders’ equity |
389,683 | 429,207 | ||||||
|
|
|
|
|
|||||
| Total capitalization |
$ | 676,566 | $ | 697,940 | ||||
|
|
|
|
|
|||||
| Capital Ratios |
||||||||
| Common equity tier 1 capital ratio |
10.85 | % | 13.15 | % | ||||
| Tier 1 capital ratio |
12.94 | % | 14.61 | % | ||||
| Total capital ratio |
13.49 | % | 15.16 | % | ||||
| Tier 1 leverage ratio |
9.59 | % | 10.75 | % | ||||
| Common equity to assets |
11.09 | % | 12.67 | % | ||||
| Tangible common equity to tangible assets(4) |
9.12 | % | 10.75 | % | ||||
-55-
Table of Contents
| (1) | A $1.00 increase (decrease) to the assumed initial public offering price of $20.00 per share, the midpoint of the range set forth on the front cover page of this prospectus would increase (decrease), on an as adjusted basis, each of cash and cash equivalents, common stock and additional paid-in capital, total stockholders’ equity (deficit) and total capitalization by approximately $3.5 million, assuming the number of shares offered by us, as set forth on the cover page of this prospectus, remains the same and after deducting the estimated underwriting discounts and commissions and estimated offering expenses payable by us. The as adjusted information discussed above is illustrative only and will be adjusted based on the actual public offering price and other terms of this offering determined at pricing. |
| (2) | Subsequent to March 31, 2017, we repaid $2.0 million of the outstanding balance on the line of credit. |
| (3) | The aggregate purchase price of approximately $26.8 million that we expect to pay for the proposed repurchase of all outstanding shares of our Series A Preferred Stock is based on the assumed initial public offering price of $20.00 per share of our common stock (the midpoint of the price range set forth on the cover of this prospectus). |
| (4) | Tangible common equity to tangible assets is a non-GAAP financial measure. For more information on this financial measure, including a reconciliation to the most directly comparable financial measure, see “GAAP Reconciliation and Management Explanation of Non-GAAP Financial Measures”. |
-56-
Table of Contents
If you invest in our common stock, your ownership interest will be diluted to the extent that the initial public offering price per share of our common stock exceeds the tangible book value per share of our common stock immediately following this offering. Tangible book value per common share is equal to our total stockholders’ equity, less intangible assets, divided by the number of common shares outstanding. The tangible book value of our common stock as of March 31, 2017 was $293.2 million, or $11.91 per share.
After giving further effect to our sale of 3,775,194 shares of common stock in this offering (assuming the underwriters do not exercise their option to purchase additional shares from us) at an assumed initial public offering price of $20.00 per share, which is the midpoint of the price range on the cover of this prospectus, and after deducting underwriting discounts and commissions and estimated offering expenses, the pro forma tangible book value of our common stock at March 31, 2017 would have been approximately $347.7 million, or $12.25 per share. Therefore, this offering will result in an immediate increase of $0.34 in the tangible book value per share of our common stock of existing stockholders and an immediate dilution of $7.75 in the tangible book value per share of our common stock to investors purchasing shares in this offering, or approximately 38.8% of the assumed public offering price of $20.00 per share (which is the midpoint of the price range on the cover of this prospectus).
A $1.00 increase (decrease) in the assumed initial public offering price of $20.00 per share would increase (decrease) each of cash and cash equivalents, common stock, total stockholders’ equity and total capitalization by $3.5 million, assuming that the number of shares offered by us, as set forth on the cover of this prospectus, remains the same, and after deducting the underwriting discounts and commissions and estimated offering expenses. If the underwriters’ option to purchase additional shares from us is exercised in full, the pro forma as adjusted amount of each of cash and cash equivalents, additional paid-in capital, stockholders’ equity and total capitalization would increase by approximately $4.3 million, after deducting underwriting discounts and commissions and estimated offering expenses. Sales of shares by our selling stockholders in this offering do not affect our net tangible book value.
The following table illustrates the calculation of the amount of dilution per share that a purchaser of our common stock in this offering will incur given the assumptions above:
| Assumed initial public offering price per share |
$ | 20.00 | ||||||
| Tangible book value per common share at March 31, 2017 |
$ | 11.91 | ||||||
| Increase in net tangible book value per common share attributable to new investors |
$ | 0.34 | ||||||
| Pro forma tangible book value per common share upon completion of the offering |
$ | 12.25 | ||||||
| Dilution per common share to new investors from offering |
$ | 7.75 |
The following table summarizes, as of March 31, 2017, the number of shares of common stock, the total consideration paid to us and the average price paid per share by existing stockholders and investors purchasing common stock in this offering, and the sale of the common stock offered hereby, as the assumed initial public offering price of $20.00 per share, the midpoint of the price range shown on the cover page of this prospectus (assuming the underwriters do not exercise their option to purchase additional shares from us).
| Shares Purchased | Total Consideration (Dollars in thousands) |
Average Price Per Share |
||||||||||||||||||
| Number | Percent | Amount | Percent | |||||||||||||||||
| Existing stockholders as of March 31, 2017 |
24,616,706 | 86.7 | % | $ | 313,838 | 80.6 | % | $ | 12.75 | |||||||||||
| New investors for this offering |
3,775,194 | 13.3 | % | 75,504 | 19.4 | % | $ | 20.00 | ||||||||||||
|
|
|
|
|
|
|
|
|
|||||||||||||
| Total |
28,391,900 | 100.0 | % | $ | 389,342 | 100.0 | % | $ | 13.71 | |||||||||||
Assuming no shares are sold to existing stockholders in this offering, sales of shares of our common stock by the selling stockholders in this offering will reduce the number of shares of common stock held by existing stockholders to 22,691,900, or approximately 79.9% of the total shares of our common stock outstanding
-57-
Table of Contents
after this offering, and will result in new investors holding 5,700,000 shares, or approximately 20.1% of the total shares of our common stock after this offering.
A $1.00 increase (or decrease) in the assumed initial public offering price of $20.00 per share, which is the midpoint of the price range set forth on the cover page of this prospectus, would increase (or decrease) the total consideration paid by new investors to us, total consideration paid by all stockholders to us and average price per share paid by all stockholders to us by $3.8 million, $3.8 million and $0.13, respectively, assuming the number of shares offered by us, as set forth on the cover page remains the same.
The table above excludes shares of our common stock reserved for issuance under the Byline Bancorp Equity Incentive Plan and the 2017 Omnibus Incentive Compensation Plan. To the extent that other equity awards are issued under our incentive plan, investors participating in this offering will experience further dilution.
-58-
Table of Contents
UNAUDITED PRO FORMA CONSOLIDATED FINANCIAL INFORMATION AND OTHER DATA
The table below sets forth condensed consolidated financial information for each of Byline and Ridgestone as well as unaudited pro forma combined condensed consolidated financial information for the Company and Ridgestone reflecting the Ridgestone acquisition, in each case as of and for the year ended December 31, 2016. Except as otherwise noted in the footnotes to the table, (i) the financial information included under the “Byline Historical” column is derived from the audited financial statements of the Company as of and for the year ended December 31, 2016, and (ii) the financial information under the “Ridgestone Historical” column is derived from the audited financial statements of Ridgestone for the period from January 1, 2016 through October 14, 2016.
The unaudited pro forma combined condensed consolidated financial information has been prepared using the acquisition method of accounting, adjusted from our audited financial statements as of and for the year ended December 31, 2016 to give effect to Byline’s acquisition of Ridgestone and the estimated acquisition accounting adjustments resulting from the acquisition (collectively, the “Transaction”). You should read such information in conjunction with our historical audited financial statements for the year ended December 31, 2016 and the related notes and Ridgestone’s historical audited financial statements for the year ended December 31, 2015 and for the period from January 1, 2016 through October 14, 2016, and the related notes. An unaudited pro forma consolidated statement of financial condition as of December 31, 2016 is not presented, as Ridgestone’s statements of financial condition, including related acquisition accounting adjustments, have already been included in our consolidated statement of financial condition and accompanying notes as of December 31, 2016 included elsewhere in this prospectus.
The unaudited pro forma condensed consolidated statement of operations for the year ended December 31, 2016 is presented as if the Transaction occurred on January 1, 2016.
The unaudited pro forma condensed consolidated financial statements are presented for illustrative purposes only and not necessarily indicative of the actual financial results that would have been achieved had the Transaction completed on an earlier date. The unaudited pro forma combined condensed consolidated financial statements also do not purport to project our consolidated statement of financial condition for any future period. The historical reclassification adjustments to Ridgestone’s historical financial information are presented to conform such financial information to the presentation of the Company’s consolidated statement of operations. The pro forma adjustments are based on the preliminary acquisition accounting adjustments, which involve significant estimates and assumptions that are subject to change. See Note 3 of Byline’s Consolidated Financial Statements as of and for the years ended December 31, 2016 and 2015.
In the opinion of the Company’s management, the pro forma condensed consolidated financial statements include all significant necessary adjustments that can be factually supported to reflect the effects of the Transaction.
| Dollars in thousands except per share data | Byline Historical |
Ridgestone Historical |
Ridgestone Historical Reclassification Adjustments* |
Pro Forma Adjustments |
Byline & Ridgestone Combined Pro Forma |
|||||||||||||||
| Interest and dividend income: |
||||||||||||||||||||
| Interest and fees on loans and leases |
$ | 83,150 | $ | 21,645 | $ | 107 | $ | 556 | (1) | $ | 105,458 | |||||||||
| Interest on securities |
14,822 | 347 | 3 | 9 | (2) | 15,181 | ||||||||||||||
| Other interest and dividend income |
393 | 78 | 2 | — | 473 | |||||||||||||||
|
|
|
|
|
|
|
|
|
|
|
|||||||||||
| Total interest and dividend income |
98,365 | 22,070 | 112 | 565 | 121,112 | |||||||||||||||
-59-
Table of Contents
| Dollars in thousands except per share data | Byline Historical |
Ridgestone Historical |
Ridgestone Historical Reclassification Adjustments* |
Pro Forma Adjustments |
Byline & Ridgestone Combined Pro Forma |
|||||||||||||||
| Interest expense: |
||||||||||||||||||||
| Interest on deposits |
4,580 | 2,521 | — | (851 | )(3) | 6,250 | ||||||||||||||
| Interest on borrowings |
3,167 | 320 | — | (72 | )(4) | 3,415 | ||||||||||||||
|
|
|
|
|
|
|
|
|
|
|
|||||||||||
| Total interest expense |
7,747 | 2,841 | — | (923 | ) | 9,665 | ||||||||||||||
|
|
|
|
|
|
|
|
|
|
|
|||||||||||
| Net interest income |
90,618 | 19,229 | 112 | 1,488 | 111,447 | |||||||||||||||
| Provision for loan and lease losses |
10,352 | 3,632 | — | — | 13,984 | |||||||||||||||
|
|
|
|
|
|
|
|
|
|
|
|||||||||||
| Net interest income after provision for loan and lease losses |
80,266 | 15,597 | 112 | 1,488 | 97,463 | |||||||||||||||
|
|
|
|
|
|
|
|
|
|
|
|||||||||||
| Other operating income: |
||||||||||||||||||||
| Deposit fees and charges |
5,665 | 2,024 | (106 | ) | — | 7,583 | ||||||||||||||
| Net gains on sales of loans |
4,323 | 29,259 | — | — | 33,582 | |||||||||||||||
| Other non-interest income |
15,916 | 3,296 | (130 | ) | — | 19,082 | ||||||||||||||
|
|
|
|
|
|
|
|
|
|
|
|||||||||||
| Total operating income |
25,904 | 34,579 | (236 | ) | — | 60,247 | ||||||||||||||
|
|
|
|
|
|
|
|
|
|
|
|||||||||||
| Other operating expense: |
||||||||||||||||||||
| Salaries and employee benefits |
50,585 | 19,220 | 192 | (2,239 | )(5) | 67,758 | ||||||||||||||
| Occupancy and equipment |
17,098 | 845 | (35 | ) | (16 | )(6) | 17,892 | |||||||||||||
| Legal, audit and other professional fees |
5,862 | 2,727 | (88 | ) | (2,791 | )(7) | 5,710 | |||||||||||||
| Other intangible assets amortization expense |
3,003 | — | — | 74 | (8) | 3,077 | ||||||||||||||
| Other non-interest expense |
24,138 | 6,224 | (193 | ) | (394 | )(9) | 29,775 | |||||||||||||
|
|
|
|
|
|
|
|
|
|
|
|||||||||||
| Total operating expense |
100,686 | 29,016 | (124 | ) | (5,366 | ) | 124,212 | |||||||||||||
|
|
|
|
|
|
|
|
|
|
|
|||||||||||
| Pre-tax income |
5,484 | 21,160 | — | 6,854 | 33,498 | |||||||||||||||
| Provision (benefit) for income taxes |
(61,245 | ) | 9,008 | — | 2,744 | (10) | (49,493 | ) | ||||||||||||
|
|
|
|
|
|
|
|
|
|
|
|||||||||||
| Net income |
$ | 66,729 | $ | 12,152 | $ | — | $ | 4,110 | $ | 82,991 | ||||||||||
|
|
|
|
|
|
|
|
|
|
|
|||||||||||
| Earnings per common share: |
||||||||||||||||||||
| Basic |
$ | 3.31 | 3.54 | |||||||||||||||||
| Diluted |
$ | 3.27 | 3.50 | |||||||||||||||||
| Weighted average number of common shares outstanding: |
||||||||||||||||||||
| Basic |
20,141,630 | 23,434,909 | ||||||||||||||||||
| Diluted |
20,430,783 | 23,724,062 | ||||||||||||||||||
| * | The historical reclassification adjustments to Ridgestone’s historical financial information are presented to conform such financial information to the presentation of the Company’s consolidated statement of operations. |
| (1) | Adjustments to interest and fees on loans and leases reflect the change in loan and lease interest income due to estimated discount accretion associated with fair value adjustments of $31.6 million to acquired loans, assuming the loans had been acquired as of January 1, 2016. The discount accretion was calculated on the effective yield method over the estimated life of the acquired loan portfolio of 6 years. |
| (2) | Adjustments to interest on securities reflect the change in securities income due to estimated discount accretion associated with fair value adjustments of $171,000 to acquired securities, assuming the securities had been acquired as of January 1, 2016. The discount accretion was calculated on the effective yield method over the estimated lives of the acquired securities of 18 years. |
| (3) | Adjustments to interest on deposits reflect the change in deposit interest expense due to estimated premium amortization associated with fair value adjustments of $1.3 million to acquired time deposits, assuming the |
-60-
Table of Contents
| time deposits had been acquired as of January 1, 2016. The premium amortization was calculated on the effective yield method over the weighted average estimated lives of the acquired time deposits of approximately six months. The adjustment reflects the amortization in addition to the amortization recorded by Byline during the period from October 14, 2016 through December 31, 2016. |
| (4) | Adjustments to interest on borrowings reflect the change in interest expense due to estimated premium amortization/discount accretion associated with the fair value adjustments to acquired borrowings and other debt, which include FHLB advances and junior subordinated debenture issued to capital trust. Adjustments reflect the change in interest expense for the year ended December 31, 2016 that would have resulted had the borrowings been acquired as of January 1, 2016. The premium amortization of the fair value adjustment associated with the FHLB advances of $272,000 was calculated on the effective yield method over the estimated lives of the acquired borrowings of two years. The discount accretion of the fair value adjustment associated with the junior subordinated debenture issued to capital trust of $161,000 was calculated on the effective yield method over the estimated lives of the acquired borrowings of 18 years. |
| (5) | Adjustments to salaries and employee benefits reflect the reversal of the accelerated vesting of restricted stock units and expense related to a change in control payment, resulted directly from the Ridgestone acquisition, which are nonrecurring and will not have a continuing impact on the results of operations. |
| (6) | Adjustments to occupancy and equipment expense reflect the discount accretion resulting from a fair value adjustment of an acquired building of $451,000. The amortization of the discount is calculated based on a straight-line basis over the useful life of 23 years. |
| (7) | Adjustments are to exclude transaction costs (e.g., advisory and legal) of approximately $2.8 million directly related to the acquisition of Ridgestone, which are nonrecurring and will not have a continuing impact on the results of operations. |
| (8) | Adjustments to other intangible assets amortization expense reflect the change in other expense that would have resulted from the amortization of the core deposit intangible of $486,000 had the deposits been acquired as at January 1, 2016. The amortization of the core deposit intangible was calculated on an accelerated basis over the estimated useful life of ten years. |
| (9) | Adjustments to other non-interest expense are to reverse the termination expense related to the decommissioning of Ridgestone’s core operating system post acquisition, which are nonrecurring and will not have a continuing impact on the results of operations. |
| (10) | Adjustments to provision (benefit) for income taxes reflect recognition of tax expense associated with the adjusted net taxable income before taxes assuming an effective tax rate of 40.04%. |
-61-
Table of Contents
SELECTED HISTORICAL CONSOLIDATED FINANCIAL AND OPERATING INFORMATION
You should read the selected historical consolidated financial and operating data set forth below in conjunction with the sections titled “Management’s Discussion and Analysis of Financial Condition and Results of Operations” and “Capitalization”, as well as our consolidated financial statements and the related notes included elsewhere in this prospectus. The following table summarizes certain selected consolidated financial data for the periods presented. Our historical results may not be indicative of our future performance. The selected historical consolidated financial and operating information presented below contains financial measures that are not presented in accordance with accounting principles generally accepted in the United States and have not been audited. See “GAAP Reconciliation and Management Explanation of Non-GAAP Financial Measures”.
| (unaudited) As of and for the quarter ended March 31, |
As of and for the year ended December 31, | |||||||||||||||||||
| Dollars in thousands except share and per share data | 2017 | 2016 | 2016 | 2015 | 2014 | |||||||||||||||
| Income Statement Data |
||||||||||||||||||||
| Interest income |
$ | 32,488 | $ | 22,877 | $ | 98,365 | $ | 83,263 | $ | 89,636 | ||||||||||
| Interest expense |
2,950 | 1,757 | 7,747 | 6,631 | 5,546 | |||||||||||||||
| Net interest income |
29,538 | 21,120 | 90,618 | 76,632 | 84,090 | |||||||||||||||
| Provision for loan and lease losses |
1,891 | 2,513 | 10,352 | 6,966 | 5,711 | |||||||||||||||
| Net interest income, after provision for loan and lease losses |
27,647 | 18,607 | 80,266 | 69,666 | 78,379 | |||||||||||||||
| Non-interest income |
12,308 | 4,288 | 25,904 | 20,839 | 18,253 | |||||||||||||||
| Non-interest expense |
28,851 | 24,487 | 100,686 | 105,172 | 97,919 | |||||||||||||||
| Income (loss) before income taxes |
11,104 | (1,592 | ) | 5,484 | (14,667 | ) | (1,287 | ) | ||||||||||||
| Provision (benefit) for income taxes |
4,544 | (240 | ) | (61,245 | ) | 307 | — | |||||||||||||
| Net income (loss) |
6,560 | (1,352 | ) | 66,729 | (14,974 | ) | (1,287 | ) | ||||||||||||
| Basic earnings (loss) per share |
$ | 0.26 | ($ | 0.08 | ) | $ | 3.31 | ($ | 0.86 | ) | ($ | 0.07 | ) | |||||||
| Diluted earnings (loss) per share |
$ | 0.25 | ($ | 0.08 | ) | $ | 3.27 | ($ | 0.86 | ) | ($ | 0.07 | ) | |||||||
| Weighted-average outstanding shares (basic) |
24,616,706 | 17,522,226 | 20,141,630 | 17,332,775 | 17,332,775 | |||||||||||||||
| Weighted-average outstanding shares (diluted)(1) |
25,078,427 | 17,522,226 | 20,430,783 | 17,332,775 | 17,332,775 | |||||||||||||||
| Balance Sheet Data |
||||||||||||||||||||
| Loans and leases held for investment, net before allowance for loan and lease losses(2) |
$ | 2,143,534 | $ | 1,503,495 | $ | 2,148,011 | $ | 1,345,437 | $ | 1,284,969 | ||||||||||
| Loans and leases held for sale |
23,492 | 214 | 23,976 | 268 | 351 | |||||||||||||||
| Allowance for loan and lease losses (ALLL) |
11,817 | 7,903 | 10,923 | 7,632 | 4,794 | |||||||||||||||
| Acquisition accounting adjustments(3) |
41,024 | 19,566 | 43,242 | 19,171 | 69,834 | |||||||||||||||
| Interest-bearing deposits in other banks |
67,726 | 28,694 | 28,798 | 23,572 | 133,281 | |||||||||||||||
| Investment securities |
723,404 | 797,845 | 747,406 | 879,192 | 689,373 | |||||||||||||||
| Assets held for sale |
13,666 | 2,259 | 14,748 | 2,259 | — | |||||||||||||||
| Other real estate owned, net |
13,173 | 24,466 | 16,570 | 26,715 | 56,181 | |||||||||||||||
| Goodwill and other intangibles |
71,033 | 47,273 | 71,801 | 48,014 | 50,891 | |||||||||||||||
| Servicing assets |
21,223 | — | 21,091 | — | — | |||||||||||||||
| Total assets |
3,284,713 | 2,561,081 | 3,295,830 | 2,479,870 | 2,376,449 | |||||||||||||||
| Total deposits |
2,575,839 | 2,248,563 | 2,490,394 | 2,180,624 | 2,100,057 | |||||||||||||||
| Total liabilities |
2,895,030 | 2,330,071 | 2,913,172 | 2,291,596 | 2,167,378 | |||||||||||||||
| Total stockholders’ equity |
389,683 | 231,010 | 382,658 | 188,274 | 209,071 | |||||||||||||||
| Book value per common share |
14.80 | 11.08 | 14.51 | 10.00 | 11.20 | |||||||||||||||
| Tangible book value per common share(4) |
11.91 | 8.66 | 11.59 | 7.23 | 8.26 | |||||||||||||||
-62-
Table of Contents
| (unaudited) As of and for the quarter ended March 31, |
As of and for the year ended December 31, | |||||||||||||||||||
| Dollars in thousands except share and per share data | 2017 | 2016 | 2016 | 2015 | 2014 | |||||||||||||||
| Performance Ratios |
||||||||||||||||||||
| Net interest margin |
4.04 | % | 3.60 | % | 3.59 | % | 3.44 | % | 3.88 | % | ||||||||||
| Efficiency ratio(5) |
67.11 | 93.44 | 83.83 | 104.84 | 92.78 | |||||||||||||||
| Non-interest expense to average assets |
3.53 | 3.82 | 3.66 | 4.22 | 4.03 | |||||||||||||||
| Pre-tax pre-provision return (loss) on average assets(4) |
1.59 | 0.14 | 0.57 | (0.31 | ) | 0.18 | ||||||||||||||
| Return on average stockholders’ equity |
6.83 | (2.81 | ) | 27.93 | (7.21 | ) | (0.62 | ) | ||||||||||||
| Return on average assets |
0.80 | (0.21 | ) | 2.42 | (0.60 | ) | (0.05 | ) | ||||||||||||
| Asset Quality Ratios |
||||||||||||||||||||
| Non-performing loans and leases / total loans and leases held for investment, net before ALLL |
0.41 | % | 0.58 | % | 0.34 | % | 0.69 | % | 0.62 | % | ||||||||||
| ALLL / total loans and leases held for investment, net before ALLL |
0.55 | 0.53 | 0.51 | 0.57 | 0.37 | |||||||||||||||
| Net charge-offs (recoveries) / average total loans and leases held for investment, net before ALLL(7) |
0.19 | 0.62 | 0.42 | 0.33 | 0.14 | |||||||||||||||
| Capital Ratios |
||||||||||||||||||||
| Common equity to assets |
11.09 | % | 8.43 | % | 10.84 | % | 6.99 | % | 8.17 | % | ||||||||||
| Tangible common equity to tangible assets(4) |
9.12 | 6.71 | 8.85 | 5.15 | 6.16 | |||||||||||||||
| Leverage ratio |
9.59 | 8.83 | 10.07 | 7.85 | 8.08 | |||||||||||||||
| Tier 1 common ratio(6) |
10.85 | 10.44 | 11.20 | 8.92 | 11.30 | |||||||||||||||
| Tier 1 ratio |
12.94 | 13.43 | 12.78 | 12.00 | 13.37 | |||||||||||||||
| Total capital ratio |
13.49 | 13.94 | 13.28 | 12.51 | 13.73 | |||||||||||||||
| (1) | Due to losses in the first quarter 2016 and for the years ended December 31, 2015 and 2014, zero incremental shares are included because the effect would be anti-dilutive. |
| (2) | Represents loans and leases, net of acquisition accounting adjustments, unearned deferred fees and costs and initial direct costs. |
| (3) | Represents the remaining unamortized premium or unaccreted discount as a result of applying the fair value adjustment at the time of the business combination on acquired loans. |
| (4) | Represents a non-GAAP financial measure. See “GAAP Reconciliation and Management Explanation of Non-GAAP Financial Measures” for a reconciliation of our non-GAAP measures to the most directly comparable GAAP financial measure. |
| (5) | Represents non-interest expense less amortization of intangible assets divided by net interest income and non-interest income. |
| (6) | Ratio not effective until January 1, 2015 but presented for comparison purposes only. |
| (7) | Ratio annualized for the three month period ended March 31, 2017 and 2016. |
-63-
Table of Contents
GAAP RECONCILIATION AND MANAGEMENT EXPLANATION OF NON-GAAP FINANCIAL
MEASURES
Some of the financial measures included in our “Summary Historical Consolidated Financial and Operating Information” and “Selected Historical Consolidated Financial and Operating Information” are not measures of financial performance recognized by GAAP. Our management uses the non-GAAP financial measures set forth below in its analysis of our performance.
| • | “Pre-tax pre-provision return on average assets” is pre-tax income plus the provision for loan and lease losses, divided by average assets. This metric is important due to the tax benefit resulting from the reversal of the deferred tax asset valuation allowance and demonstrates the profitability excluding the tax benefit and excludes the provision for loan loss. |
| • | “Tangible common equity” is defined as total stockholders’ equity reduced by preferred stock and goodwill and other intangible assets. Management does not consider loan servicing rights as an intangible asset for purposes of this calculation. |
| • | “Tangible assets” is defined as total assets reduced by goodwill and other intangible assets. Management does not consider loan servicing rights as an intangible asset for purposes of this calculation. |
| • | “Tangible book value per share” is tangible common equity divided by total shares of common stock outstanding. It is the ratio of tangible common stockholders’ equity to basic and diluted outstanding shares. This metric is important due to the relative changes in the book value per share exclusive of changes in intangible assets. |
| • | “Tangible common equity to tangible assets” is calculated as tangible common equity divided by tangible assets. This measure is important to investors interested in relative changes in the ratio of total stockholders’ equity to total assets, each exclusive of changes in intangible assets. |
We believe that these non-GAAP financial measures provide useful information to management and investors that is supplementary to our financial condition, results of operations and cash flows computed in accordance with GAAP; however, we acknowledge that our non-GAAP financial measures have a number of limitations. As such, you should not view these disclosures as a substitute for results determined in accordance with GAAP financial measures that other companies use.
-64-
Table of Contents
The following reconciliation table provides a more detailed analysis of these non-GAAP financial measures:
| Dollars in thousands except per share data | (unaudited) As of and for the period ended |
As of and for the year ended December 31, |
||||||||||||||||||
| 2017 |
2016 |
2016 |
2015 |
2014 |
||||||||||||||||
| Pre-tax pre-provision net income: |
||||||||||||||||||||
| Pre-tax income |
$ | 11,104 | ($ | 1,592 | ) | $ | 5,484 | ($ | 14,667 | ) | ($ | 1,287 | ) | |||||||
| Add: provision for loan and lease losses |
1,891 | 2,513 | 10,352 | 6,966 | 5,711 | |||||||||||||||
| Pre-tax pre-provision net income |
$ | 12,995 | $ | 921 | $ | 15,836 | ($ | 7,701 | ) | $ | 4,424 | |||||||||
| Pre-tax pre-provision return on average assets: |
||||||||||||||||||||
| Total average assets |
$ | 3,315,095 | $ | 2,577,438 | $ | 2,754,778 | $ | 2,490,241 | $ | 2,429,293 | ||||||||||
| Pre-tax pre-provision net income |
12,995 | 921 | 15,836 | (7,701 | ) | 4,424 | ||||||||||||||
| Pre-tax pre-provision return on average assets |
1.59 | % | 0.14 | % | 0.57 | % | (0.31 | %) | 0.18 | % | ||||||||||
| Tangible common equity: |
||||||||||||||||||||
| Total stockholders’ equity |
$ | 389,683 | $ | 231,010 | $ | 382,658 | $ | 188,274 | $ | 209,071 | ||||||||||
| Less: Preferred stock |
25,441 | 15,003 | 25,441 | 15,003 | 15,003 | |||||||||||||||
| Less: Goodwill |
51,975 | 25,688 | 51,975 | 25,688 | 25,613 | |||||||||||||||
| Less: Core deposit intangibles and other intangibles |
19,058 | 21,585 | 19,826 | 22,326 | 25,278 | |||||||||||||||
| Tangible common equity |
$ | 293,209 | $ | 168,734 | $ | 285,416 | $ | 125,257 | $ | 143,177 | ||||||||||
| Tangible assets: |
||||||||||||||||||||
| Total assets |
$ | 3,284,713 | $ | 2,561,081 | $ | 3,295,830 | $ | 2,479,870 | $ | 2,376,449 | ||||||||||
| Less: Goodwill |
51,975 | 25,688 | 51,975 | 25,688 | 25,613 | |||||||||||||||
| Less: Core deposit intangibles and other intangibles |
19,058 | 21,585 | 19,826 | 22,326 | 25,278 | |||||||||||||||
| Tangible assets |
$ | 3,213,680 | $ | 2,513,808 | $ | 3,224,029 | $ | 2,431,856 | $ | 2,325,558 | ||||||||||
| Tangible book value per share: |
||||||||||||||||||||
| Tangible common equity |
$ | 293,209 | $ | 168,734 | $ | 285,416 | $ | 125,257 | $ | 143,177 | ||||||||||
| Shares of common stock outstanding |
24,616,706 | 19,487,778 | 24,616,706 | 17,332,775 | 17,332,775 | |||||||||||||||
| Tangible book value per share |
$ | 11.91 | $ | 8.66 | $ | 11.59 | $ | 7.23 | $ | 8.26 | ||||||||||
| Tangible common equity to tangible assets: |
||||||||||||||||||||
| Tangible common equity |
$ | 293,209 | $ | 168,734 | $ | 285,416 | $ | 125,257 | $ | 143,177 | ||||||||||
| Tangible assets |
3,213,680 | 2,513,808 | 3,224,029 | 2,431,856 | 2,325,558 | |||||||||||||||
| Tangible common equity to tangible assets |
9.12 | % | 6.71 | % | 8.85 | % | 5.15 | % | 6.16 | % | ||||||||||
-65-
Table of Contents
MANAGEMENT’S DISCUSSION AND ANALYSIS OF FINANCIAL CONDITION AND RESULTS OF OPERATIONS
The following discussion should be read in conjunction with the “Selected Historical Consolidated Financial Information”, and our financial statements and related notes thereto included elsewhere in this prospectus. In addition to historical information, this discussion contains forward-looking statements that involve risks, uncertainties and assumptions that could cause actual results to differ materially from management’s expectations. Factors that could cause such differences are discussed in the sections entitled “Cautionary Note Regarding Forward-Looking Statements” and “Risk Factors”. We assume no obligation to update any of these forward-looking statements.
Overview
Our business
We are a bank holding company headquartered in Chicago, Illinois and conduct all our business activities through our subsidiary, Byline Bank, a full service commercial bank, and Byline Bank’s subsidiaries. Through Byline Bank, we offer a broad range of banking products and services to small and medium sized businesses, commercial real estate and financial sponsors and to consumers who generally live or work near our branches. In addition to our core commercial banking products, we provide small ticket equipment leasing solutions through Byline Financial Group, a wholly-owned subsidiary of Byline Bank, headquartered in Bannockburn, Illinois with sales offices in Texas, North Carolina, Florida, New York, Michigan and Arizona. Following our acquisition of Ridgestone in October 2016, we also participate in U.S. government guaranteed lending programs and originate U.S. government guaranteed loans. Ridgestone was the sixth most active originator of SBA loans in the country and the most active SBA lender in Illinois and Wisconsin, as reported by the SBA for the year ended September 30, 2016.
We offer traditional retail deposit products through our branch network, along with online, mobile and direct banking channels. The wide variety of deposit products we offer include non-interest bearing accounts, interest-bearing demand products, savings accounts, money market accounts and certificates of deposit with original maturities ranging from seven days to five years. We also offer consumer lending products, including mortgage loans, home equity loans and other consumer loans to individuals through our branch network.
Recapitalization
In 2013, our predecessor, Metropolitan, experienced significant credit and financial losses resulting primarily from the collapse of real estate prices during the Great Recession in addition to a number of regulatory and other operational challenges. Despite deterioration in asset quality and financial performance, Metropolitan maintained a high quality deposit base, an attractive branch network and strong customer loyalty, which made it an ideal candidate for a turnaround.
An investment group raised $206.7 million in equity capital to recapitalize and gain control of Metropolitan through a series of transactions by which Metropolitan merged its multiple subsidiary banks into one and an investor group acquired voting common stock and Series A Preferred Stock of Metropolitan. The investors formed BXM Holdings, Inc. for the purpose of identifying an investment opportunity in a troubled U.S. banking institution. MBG Investors I, L.P. was the lead investor in the Recapitalization and Mr. del Valle Perochena, a member of our board of directors, is the general partner of MBG Investors I, L.P. and possesses the voting and investment power with respect to the securities beneficially owned by MBG Investors I, L.P. BXM Holdings, Inc. hired Roberto Herencia, the Chairman of our board of directors, and Alberto Paracchini, our President, Chief Executive Officer and Director, to identify an investment opportunity and later to effectuate the Recapitalization. Lindsay Corby, our Executive Vice President and Chief Financial Officer, served as a Principal of BXM Holdings, Inc. at the time of the Recapitalization. BXM Holdings, Inc. no longer conducts any
-66-
Table of Contents
operations. At the time of the Recapitalization, Metropolitan owned five banking subsidiaries that operated under 12 different brand names in the Chicago metropolitan area.
We accounted for the Recapitalization as a business combination in accordance with Accounting Standards Codification Topic 805, Business Combinations (“ASC 805”). The transaction qualified as a recapitalization under Section 368(a)(1)(E) of the Code and resulted in carryover treatment of the existing tax bases and tax loss carryforwards treatment of the existing tax bases and tax loss carryforwards, although the utilization of tax attributes (including net operating loss carryforwards and tax credits) became subject to limitations under Sections 382 and 383 of the Code. Accordingly, the assets acquired and liabilities assumed were recorded at their fair value on the date of acquisition. Fair value amounts were determined in accordance with the guidance provided in ASC Topic 820, Fair Value Measurements (“ASC 820”). In many cases, the determination of the fair value required management to make estimates about discount rates, future expected cash flows, market conditions and other future events that are highly subjective in nature.
As of the Recapitalization, we had $2.5 billion in assets that were measured at fair value, including $1.3 billion in loans, $212.2 million in investment securities, $84.0 million of OREO and $29.7 million of core deposit intangible assets. We also acquired $2.3 billion of liabilities at fair value, including $2.2 billion of deposits and $36.9 million of borrowings. The Recapitalization resulted in goodwill of $21.2 million as the estimated fair value of liabilities assumed and consideration paid exceeded the estimated fair value of assets acquired. The goodwill is included within “Goodwill” in our consolidated balance sheets.
As of the Recapitalization, approximately 76.5%, or $1.0 billion, of the loans acquired in the Recapitalization were accounted for under ASC Topic 310-30, Accounting for Purchased Loans with Deteriorated Credit Quality. We also acquired loans with a fair value of $310.3 million that are accounted for under ASC Topic 310-20, Receivables—Nonrefundable Fees and Other Costs, as these specific loans did not exhibit deteriorated credit quality since origination or were loans to borrowers that had revolving privileges at the acquisition date.
Since the Recapitalization, we have added $1.3 billion in net originated loans and leases while significantly improving our asset quality to create a more diversified and balanced loan and lease portfolio. We aggressively reduced the level of troubled loans and leases and other real estate owned in our portfolio as a percentage of loans and leases and real estate owned. This ratio declined to 1.0% as of March 31, 2017 and 1.1% as of December 31, 2016 from 28.2% as of March 31, 2013. In addition, we sought to optimize our deposit base by expanding the percentage of non-interest bearing deposits to total deposits, enhance online and mobile capabilities and broaden our cash management products to better meet our customers’ needs. Since the Recapitalization, we consolidated from 88 to 57 branches, reducing our costs with minimal deposit attrition, and improving our efficiency, including through the consolidation of multiple banking platforms into one. In addition to improving efficiency, consolidating our banking platforms allowed us to better manage our customer relationships and their banking activities while strengthening our governance and controls for compliance, legal and operational risk.
Small ticket leasing acquisition
On October 10, 2014, Byline Bank acquired certain assets and liabilities related to the small ticket leasing operation of Baytree National Bank and Trust Company and Baytree Leasing Company LLC (collectively, “Baytree”). The purchase was accounted for under the acquisition method of accounting in accordance with ASC 805 and resulted in lease financing receivables of $42.0 million and goodwill of $4.5 million. There are no contingent assets or liabilities remaining from the acquisition.
In a separate but related transaction, on September 3, 2014, Byline Bank purchased approximately $55.7 million of direct finance leases that Baytree had sold to a third party. We have grown the portfolio to $163.0 million as of March 31, 2017.
-67-
Table of Contents
Ridgestone acquisition
On October 14, 2016, we completed the Ridgestone acquisition under the terms of a definitive merger agreement (the “Ridgestone Agreement”). As of the acquisition date, Ridgestone had $447.4 million in assets, including $347.3 million of loans, $14.7 million of loans held for sale, $27.2 million of securities, $21.5 million of servicing assets and total deposits of $358.7 million. Ridgestone’s loan portfolio was primarily comprised of the retained unguaranteed portion of U.S. government guaranteed loans as a participant in the SBA and USDA lending programs. Ridgestone achieved an annualized return on equity (“ROE”) of 26.17%, return on assets (“ROA”) of 3.51% and net interest margin of 5.87% for the nine and a half months ended October 14, 2016. After tax earnings from the period of January 1, 2016 to October 14, 2016 were $12.2 million. For the year ended December 31, 2015, Ridgestone attained a ROE of 23.13%, ROA of 2.77% and net interest margin of 5.44%. Earnings after tax for the year ended December 31, 2015 were $11.4 million. Immediately prior to the closing of the acquisition, as of October 14, 2016, Ridgestone’s nonperforming loans totaled 1.74% of total loans and net charge offs to average loans on an annualized basis was 1.18%.
As a result of the acquisition, each share of Ridgestone common stock was converted into the right to receive, at the election of the stockholder and subject to proration under the terms of the Ridgestone Agreement, either cash or Company common stock, or a combination of both. Total consideration included aggregate cash consideration in the amount of $36.8 million and the issuance of 4,199,791 shares of the Company’s common stock valued at $16.25 per common share. There were no contingent assets or liabilities arising from the acquisition.
As a result of the Ridgestone acquisition, the Company:
| • | Grew consolidated total assets from $2.8 billion to $3.3 billion as of October 14, 2016, after giving effect to acquisition accounting adjustments; |
| • | Increased total loans from $1.7 billion to $2.1 billion as of October 14, 2016; |
| • | Increased total deposits from $2.2 billion to $2.6 billion as of October 14, 2016; |
| • | Expanded its employee base from 684 full time equivalent employees to 834 full time equivalent employees as of October 14, 2016; and |
| • | Expanded its footprint through the addition of two full-service banking offices in Brookfield, Wisconsin, and Schaumburg, Illinois. In addition, Ridgestone had loan production offices located in Wisconsin (Green Bay and Wausau), Indiana (Indianapolis) and California (Newport Beach) that the Company continues to operate. |
We determined that the Ridgestone acquisition constitutes a business combination as defined by ASC 805. Accordingly, the assets acquired and liabilities assumed were recorded at their fair value amount on the date of acquisition. Fair value were determined in accordance with the guidance provided in ASC 820. The fair values may be adjusted through the end of the measurement period, which closes at the earlier of the Company receiving all necessary information to complete the acquisition or one year from the date of acquisition.
Strategic branch consolidation
During 2015 and 2016, we performed a strategic review of our existing core banking footprint. With technology improvements and changes to customers’ banking preferences, we examined branch growth potential, customer usage, branch profitability, services provided, markets served and proximity to other locations with a goal of minimizing customer impact and deposit runoff. Since the Recapitalization, our branch network has been reduced from 88 to 57. We will continue to strategically evaluate our locations based on our growth and profitability standards.
-68-
Table of Contents
Critical Accounting Policies and Estimates
Our accounting and reporting policies conform to GAAP and conform to general practices within the industry in which we operate. To prepare financial statements in conformity with GAAP, management makes estimates, assumptions and judgments based on available information. These estimates, assumptions and judgments affect the amounts reported in the financial statements and accompanying notes. These estimates, assumptions and judgements are based on information available as of the date of the financial statements and, as this information changes, actual results could differ from the estimates, assumptions and judgments reflected in the financial statements. In particular, management has identified several accounting policies that, due to the estimates, assumptions and judgements inherent in those policies, are critical in understanding our financial statements.
These policies include (i) acquisition-related fair value computations, (ii) the carrying value of loans and leases, (iii) determining the provision and allowance for loan and lease losses, (iv) the valuation of intangible assets such as goodwill, servicing assets and core deposit intangibles, (v) the determination of fair value for financial instruments, including Other Than Temporary Impairment (“OTTI”) losses, (vi) the valuation of real estate held for sale and (vii) the valuation of or recognition of deferred tax assets and liabilities. Management has presented the application of these policies to the audit committee of our board of directors.
The JOBS Act permits us an extended transition period for complying with new or revised accounting standards affecting public companies. We have elected to take advantage of this extended transition period, which means that the financial statements included in this prospectus, as well as any financial statements that we file in the future, will not be subject to all new or revised accounting standards generally applicable to public companies for the transition period for so long as we remain an emerging growth company or until we affirmatively and irrevocably opt out of the extended transition period under the JOBS Act.
The following is a discussion of the critical accounting policies and significant estimates that require us to make complex and subjective judgments. Additional information about these policies can be found in Note 1 of Byline’s Consolidated Financial Statements as of and for the years ended December 31, 2016 and 2015.
Business combinations
We account for business combinations under the acquisition method of accounting in accordance with ASC 805. We recognize the fair value of the assets acquired and liabilities assumed as of the date of acquisition, with any excess of the fair value of consideration provided over the fair value of the identifiable net tangible and intangible assets acquired recorded as goodwill. Transaction costs are expensed as incurred. Application of the acquisition method requires extensive use of accounting estimates and judgements to determine the fair values of the identifiable assets acquired and liabilities assumed at the acquisition date.
In accordance with ASC 805, the acquiring company retains the right to make appropriate adjustments to the assets and liabilities of the acquired entity for information obtained during the measurement period about facts and circumstances that existed as of the acquisition date. The measurement period ends as of the earlier of (i) one year from the acquisition date or (ii) the date when the acquirer receives the information necessary to complete the business combination accounting.
Carrying value of loans and leases
Our accounting methods for loans and leases differ depending on whether the loans are new loans and leases, or acquired loans and leases; and for acquired loans, whether the loans were acquired at a discount as a result of credit deterioration since the date of origination.
-69-
Table of Contents
Originated loans and leases
We account for originated loans and leases and purchased loans and leases not acquired through business combinations as originated loans. The new loans that management has the intent and ability to hold for the foreseeable future are reported at their outstanding principal balances net of any allowance for loan and lease losses, unamortized deferred fees and costs and unamortized premiums or discounts. The net amount of nonrefundable loan origination fees and certain direct costs associated with the lending process are deferred and amortized to interest income over the contractual lives of the new loans using methods which approximate the level yield method. Discounts and premiums are amortized or accreted to interest income over the estimated term of the new loans using methods that approximate the effective yield method. Interest income on new loans is accrued based on the unpaid principal balance outstanding.
Acquired loans and leases
Acquired loans and leases are recorded at fair value as of the acquisition date. Credit discounts are included in the determination of fair value; therefore, an allowance for loan and lease losses is not recorded at the acquisition date. Acquired loans are evaluated upon acquisition and classified as either acquired impaired or acquired non-impaired. Acquired impaired loans reflect evidence of credit deterioration since origination for which it is probable that all contractually required principal and interest will not be collected by the Company. Subsequent to acquisition, the Company periodically updates for changes in cash flow expectations, and is reflected in interest income over the life of the loan as accretable yield. Any subsequent decreases in expected cash flow attributable to credit deterioration are recognized by recording a provision for loan losses.
For acquired non-impaired loans and leases, the excess or deficit of the loan principal balance over the fair value is recorded as a discount or premium at acquisition and is accreted through interest income over the life of the loan. Subsequent to acquisition, these loans are evaluated for credit deterioration and a provision for loan losses would be recorded when probable loss is incurred. These loans and leases are evaluated for impairment consistent with originated loans.
Provision and allowance for loan and lease losses
The provision for loan and lease losses reflects the amount required to maintain the allowance for loan and lease losses (“ALLL”) at an appropriate level based upon management’s evaluation of the adequacy of general and specific loss reserves.
The ALLL is maintained at a level that management believes is appropriate to provide for known and inherent incurred loan and lease losses as of the date of the Consolidated Statements of Financial Condition and we have established methodologies for the determination of its adequacy. The methodologies are set forth in a formal policy and take into consideration the need for an overall general valuation allowance as well as specific allowances that are determined on an individual loan basis. We increase our ALLL by charging provisions for probable losses against our income and decreased by charge-offs, net of recoveries.
The evaluation is inherently subjective, as it requires estimates that are susceptible to significant revision as more information becomes available. While management uses available information to recognize losses on loans and leases, changes in economic or other conditions may necessitate revision of the estimate in future periods.
The ALLL is maintained at a level sufficient to provide for probable losses based upon an ongoing review of the originated and acquired non-impaired loan and lease portfolios by portfolio category, which include consideration of actual loss experience, peer loss experience, changes in the size and risk profile of the portfolio, identification of individual problem loan and lease situations which may affect a borrower’s ability to repay, and evaluation of prevailing economic conditions.
-70-
Table of Contents
For acquired impaired loans, a specific valuation allowance is established when it is probable that the Company will be unable to collect all of the cash flows expected at acquisition, plus the additional cash flows expected to be collected arising from changes in estimates after acquisition.
The originated and non-impaired acquired loans have limited delinquency and credit loss history and have not yet exhibited an observable loss trend. The credit quality of loans in these loan portfolios are impacted by delinquency status and debt service coverage generated by the borrowers’ businesses and fluctuations in the value of real estate collateral.
Non-impaired acquired loans and originated loans are considered impaired when, based on current information and events, it is probable that the Company will be unable to collect the scheduled payments of principal or interest when due, according to the contractual terms of the loan agreements. All non-impaired acquired loans and originated loans of $250,000 or greater with an internal risk rating of substandard or below and on nonaccrual, as well as loans classified as TDR are reviewed individually for impairment on a quarterly basis.
Goodwill and intangible assets
Goodwill
Goodwill represents the excess of the purchase consideration over the fair value of net assets acquired in connection with the Recapitalization and acquisitions using the acquisition method of accounting. Goodwill is not amortized but is periodically evaluated for impairment under the provisions of ASC Topic 350, Intangibles—Goodwill and Other (“ASC 350”).
Impairment testing is performed using either a qualitative or quantitative approach at the reporting unit level. Our goodwill is allocated to Byline Bank, which is our only applicable reporting unit for the purposes of testing goodwill for impairment. We have selected November 30 as the date to perform the annual goodwill impairment test. Additionally, we perform a goodwill impairment evaluation on an interim basis when events or circumstances indicate impairment potentially exists.
Servicing assets
Servicing assets are recognized separately when they are acquired through sales of loans or when the rights to service loans are purchased. When loans are sold, servicing assets are recorded at fair value in accordance with ASC Topic 860, Transfers and Servicing (“ASC 860”). Fair value is based on market prices for comparable servicing contracts, when available, or alternatively, is based on a valuation model that calculates the present value of estimated future net servicing income. The fair value of servicing rights is highly sensitive to changes in underlying assumptions. Changes in the prepayment speed and discount rate assumptions have the most significant impact on the fair value of servicing rights. See Note 7 and Note 18 of Byline’s Consolidated Financial Statements as of and for the years ended December 31, 2016 and 2015 for additional information.
Core deposit intangible
Other intangible assets primarily consist of core deposit intangible assets. In valuing core deposit intangibles, the Company considered variables such as deposit servicing costs, attrition rates and market discount rates. Core deposit intangibles are reviewed annually or more frequently, when events or changes in circumstances occur that indicate that their carrying values may not be recoverable. If the recoverable amount of the core deposit intangibles is determined to be less than its carrying value, the Company would then measure the amount of impairment based on an estimate of the fair value at that time. We also evaluate whether the events or circumstances have occurred that warrant a revision to the remaining useful lives of intangible assets. In cases where a revision is deemed appropriate, the remaining carrying amounts of the intangible assets are amortized over the revised remaining useful life. Core deposit intangibles are currently amortized over a ten year period.
-71-
Table of Contents
Fair value of financial instruments
ASC Topic 820, Fair Value Measurement (“ASC 820”) defines fair value as the price that would be received to sell a financial asset or paid to transfer a financial liability in an orderly transaction between market participants at the measurement date.
The degree of management judgment involved in determining the fair value of assets and liabilities is dependent upon the availability of quoted market prices or observable market parameters. For financial instruments that trade actively and have quoted market prices or observable market parameters, there is minimal subjectivity involved in measuring fair value. When observable market prices and parameters are not available, management judgment is necessary to estimate fair value. In addition, changes in market conditions may reduce the availability of quoted prices or observable data. For example, reduced liquidity in the capital markets or changes in secondary market activities could result in observable market inputs becoming unavailable. Therefore, when market data is not available, the Company would use valuation techniques requiring more management judgment to estimate the appropriate fair value measurement.
See Note 18 of Byline’s Consolidated Financial Statements as of and for the years ended December 31, 2016 and 2015 for a complete discussion on the Company’s use of fair value of financial assets and liabilities and their related measurement practices.
Valuation of real estate held for sale
Other real estate owned (OREO)
OREO includes real estate assets that have been acquired through, or in lieu of, loan foreclosure or repossession and are to be sold. OREO assets are initially recorded at fair value, less estimated costs to sell, of the collateral of the loan, on the date of foreclosure or repossession, establishing a new cost basis. Adjustments that reduce loan balances to fair value at the time of foreclosure or repossession are recognized as charge-offs in the allowance for loan and lease losses. Positive adjustments, if any, at the time of foreclosure or repossession are recognized in non-interest expense. After foreclosure or repossession, management periodically obtains new valuations and real estate or other assets may be adjusted to a lower carrying amount, determined by the fair value of the asset, less estimated costs to sell. Any subsequent write-downs are recorded as a decrease in the asset and charged against other real estate owned valuation adjustments. Operating expenses of such properties, net of related income, are included in non-interest expense, and gains and losses on their disposition are included in non-interest expense. Gains on internally financed other real estate owned sales are accounted for in accordance with the methods stated in ASC Topic 360-20, Real Estate Sales (“ASC 360-20”). Any losses on the sales of other real estate owned properties are recognized immediately.
Assets held for sale
Assets held for sale consist of former branch locations and real estate purchased for expansion. Assets are considered held for sale when management has approved a plan to sell the assets following a branch closure or other events. The properties are being actively marketed and transferred to assets held for sale based at the lower of its carrying value or its fair value, less estimated costs to sell. Adjustments to reduce the asset balances to fair value are recorded at the time of transfer and are recognized through a charge against income.
Income taxes
The Company uses the asset and liability method to account for income taxes. The objective of the asset and liability method is to establish deferred tax assets and liabilities for the temporary differences between the financial reporting basis and the income tax basis of the Company’s assets and liabilities at enacted tax rates expected to be in effect when such amounts are realized or settled. The Company’s annual tax rate is based on its
-72-
Table of Contents
income, statutory tax rates and available tax planning opportunities. Tax laws are complex and subject to different interpretations by the taxpayer and respective governmental taxing authorities. Significant judgment is required in determining tax expense and in evaluating tax positions, including evaluating uncertainties.
Deferred income tax assets represent amounts available to reduce income taxes payable on taxable income in future years. Such assets arise because of temporary differences between the financial reporting and tax bases of assets and liabilities, as well as from net operating loss carryforwards. The Company reviews its deferred tax positions quarterly for changes which may impact realizability. The Company evaluates the recoverability of these future tax deductions by assessing the adequacy of future expected taxable income from all sources, including reversal of taxable temporary differences, forecasted operating earnings and available tax planning strategies. The Company uses short and long-range business forecasts to provide additional information for its evaluation of the recoverability of deferred tax assets. It is the Company’s policy to recognize interest and penalties associated with uncertain tax positions, if applicable, as components of non-interest expense.
A deferred tax valuation allowance is established to reduce the net carrying amount of deferred tax assets if it is determined to be more likely than not that all or some of the deferred tax asset will not be realized. See Note 11 of Byline’s Consolidated Financial Statements as of and for the years ended December 31, 2016 and 2015 for further information on income taxes.
Recently Issued Accounting Pronouncements
For a discussion of the expected impact of accounting pronouncements recently issued but not adopted by us as of December 31, 2016, see Note 2 of Byline’s Consolidated Financial Statements as of and for the years ended December 31, 2016 and 2015.
Primary Factors Used to Evaluate Our Business
As a financial institution, we manage and evaluate various aspects of both our results of operations and our financial condition. We evaluate the levels and trends of the line items included in our consolidated balance sheet and income statement as well as various financial ratios that are commonly used in our industry. We analyze these ratios and financial trends against our own historical performance, our budgeted performance and the final condition and performance of comparable financial institutions in our region. Comparison of our financial performance against other financial institutions is impacted by the accounting for acquired non-impaired and acquired impaired loans.
These factors and metrics described in this prospectus may not provide an appropriate basis to compare our results or financial condition to the results or financial condition of other financial services companies, given our limited operating history and strategic acquisitions since the Recapitalization.
Results of Operations
Overview
Our results of operations depend substantially on net interest income, which is the difference between interest income on interest-earning assets, consisting primarily of interest income on loans and lease receivables, including accretion income on loans and leases, investment securities and other short-term investments and interest expense on interest-bearing liabilities, consisting primarily of deposits and borrowings. Our results of operations are also dependent upon our generation of non-interest income, consisting primarily of income from fees and service charges on deposits, servicing fees, ATM and interchange fees, net gains or losses on sales of investment securities and loans and fees on mortgage loan sales. Other factors contributing to our results of operations include our provisions for loan and lease losses, income taxes, and non-interest expenses, such as salaries and employee benefits, occupancy and equipment expenses and other miscellaneous operating costs.
-73-
Table of Contents
We reported consolidated net income for the three months ended March 31, 2017 of $6.6 million compared to a net loss of $1.4 million for the three months ended March 31, 2016, an increase of $7.9 million. Consolidated net income for the three months ended March 31, 2017 includes the Small Business Capital operation acquired from Ridgestone for the full quarter. The increase in earnings was due to a $8.4 million increase in net interest income and a $8.0 million increase in non-interest income offset by a $4.4 million increase in non-interest expense and a $4.8 million increase in provision for income taxes. The increase in non-interest expense was primarily due to increases in salaries and employee benefits of $4.7 million as a result of the Ridgestone acquisition partially offset by lower net loss recognized on other real estate owned and related expenses. Provision for income taxes recognized was $4.5 million during the three months ended March 31, 2017 compared to a benefit for income taxes of $240,000 during same period in 2016.
The Company’s results of operations for the three months ended March 31, 2017 produced an annualized return on average assets of 0.80% and an annualized return on average stockholders’ equity of 6.83%, compared to returns for the three months ended March 31, 2016 of -0.21% and -2.81%, respectively.
We reported consolidated net income for the year ended December 31, 2016 of $66.7 million compared to a loss of $15.0 million for the year ended December 31, 2015, an increase in of $81.7 million. The increase in net income was primarily attributable to a $61.9 million income tax benefit that was recognized for the year ended December 31, 2016 due to the reversal of the valuation allowance on the Company’s deferred tax asset. The other factors contributing to the increase in net income were strategies implemented by management during 2015 and 2016 to develop organic loan growth with a high quality deposit base, implementation of a strategic branch consolidation, decreases in Special Assets Group workout expenses, and the Ridgestone acquisition.
Net interest income
Net interest income, representing interest income less interest expense, is a significant contributor to our revenues and earnings. We generate interest income from interest and dividends on interest-earning assets, including loans and investment securities we own. We incur interest expense from interest paid on interest-bearing liabilities, including interest-bearing deposits, FHLB advances, junior subordinated debentures and other borrowings. To evaluate net interest income, we measure and monitor (i) yields on our loans and other interest-earning assets, (ii) the costs of our deposits and other funding sources, (iii) our net interest spread and (iv) our net interest margin. Net interest spread is the difference between rates earned on interest-earning assets and rates paid on interest-bearing liabilities. Net interest margin is calculated as the annualized net interest income divided by average interest-earning assets. Because non-interest-bearing sources of funds, such as non-interest-bearing deposits and stockholders’ equity, also fund interest-earning assets, net interest margin includes the benefit of these non-interest-bearing sources.
We also recognize income from the accretable discounts associated with the purchase of interest-earning assets. Because of our Recapitalization and the acquisition of Ridgestone, we derive a portion of our interest income from the accretable discounts on acquired loans. This accretion will continue to have an impact on our net interest income as long as loans acquired with evidence of credit deterioration at acquisition represent a meaningful portion of our interest-earning assets. As of March 31, 2017, acquired loans with evidence of credit deterioration accounted for under ASC Topic 310-30, Accounting for Purchased Loans with Deteriorated Credit Quality, represented 18.2% of our total loan portfolio.
Changes in the market interest rates and interest rates we earn on interest-earning assets or pay on interest-bearing liabilities, as well as the volume and types of interest-earning assets, interest-bearing and non-interest-bearing liabilities, are usually the largest drivers of periodic changes in net interest spread, net interest margin and net interest income. In addition, our interest income includes the accretion of the discounts on our acquired loans, which will also affect our net interest spread, net interest margin and net interest income.
The following tables present, for the periods indicated, information about (i) weighted average balances, the total dollar amount of interest income from interest-earning assets and the resultant average yields;
-74-
Table of Contents
(ii) average balances, the total dollar amount of interest expense on interest-bearing liabilities and the resultant average rates; (iii) net interest income; (iv) the interest rate spread; and (v) the net interest margin. Yields have been calculated on a pre-tax basis (dollars in thousands).
| (unaudited) Three Months Ended March 31, |
||||||||||||||||||||||||
| 2017 |
2016 |
|||||||||||||||||||||||
| Average Balance(5) |
Interest Inc / Exp |
Average Yield / Rate |
Average Balance(5) |
Interest Inc / Exp |
Average Yield / Rate |
|||||||||||||||||||
| ASSETS |
||||||||||||||||||||||||
| Cash and cash equivalents |
$ | 35,864 | $ | 48 | 0.54 | % | $ | 25,938 | $ | 16 | 0.25 | % | ||||||||||||
| Loans and leases(1) |
2,169,047 | 28,396 | 5.31 | % | 1,447,130 | 18,999 | 5.28 | % | ||||||||||||||||
| Securities available-for-sale(4) |
623,144 | 3,210 | 2.09 | % | 730,271 | 2,984 | 1.64 | % | ||||||||||||||||
| Securities held-to-maturity |
122,134 | 701 | 2.33 | % | 131,812 | 699 | 2.13 | % | ||||||||||||||||
| Tax-exempt securities |
18,436 | 133 | 2.93 | % | 21,433 | 179 | 3.36 | % | ||||||||||||||||
|
|
|
|
|
|
|
|
|
|||||||||||||||||
| Total interest-earning assets |
$ | 2,968,625 | $ | 32,488 | 4.44 | % | $ | 2,356,584 | $ | 22,877 | 3.90 | % | ||||||||||||
|
|
|
|
|
|
|
|
|
|||||||||||||||||
| Allowance for loan and lease losses |
(11,160 | ) | (7,785 | ) | ||||||||||||||||||||
| All other assets |
357,630 | 228,639 | ||||||||||||||||||||||
|
|
|
|
|
|||||||||||||||||||||
| TOTAL ASSETS |
$ | 3,315,095 | $ | 2,577,438 | ||||||||||||||||||||
|
|
|
|
|
|||||||||||||||||||||
| LIABILITIES AND STOCKHOLDERS’ EQUITY |
||||||||||||||||||||||||
| Deposits |
||||||||||||||||||||||||
| Interest checking |
$ | 181,903 | $ | 27 | 0.06 | % | $ | 186,642 | $ | 30 | 0.06 | % | ||||||||||||
| Money market accounts |
367,273 | 212 | 0.23 | % | 389,110 | 228 | 0.24 | % | ||||||||||||||||
| Savings |
446,891 | 79 | 0.07 | % | 439,861 | 75 | 0.07 | % | ||||||||||||||||
| Time deposits |
790,566 | 1,165 | 0.60 | % | 555,853 | 820 | 0.59 | % | ||||||||||||||||
| Federal Home Loan Bank advances |
301,375 | 660 | 0.89 | % | 96,209 | 78 | 0.33 | % | ||||||||||||||||
| Other borrowed funds |
69,841 | 807 | 4.69 | % | 37,059 | 526 | 5.71 | % | ||||||||||||||||
|
|
|
|
|
|
|
|
|
|||||||||||||||||
| Total interest bearing liabilities |
$ | 2,157,849 | $ | 2,950 | 0.55 | % | $ | 1,704,734 | $ | 1,757 | 0.41 | % | ||||||||||||
|
|
|
|
|
|
|
|
|
|||||||||||||||||
| Other liabilities |
767,605 | 679,135 | ||||||||||||||||||||||
| Total stockholders’ equity |
389,641 | 193,569 | ||||||||||||||||||||||
|
|
|
|
|
|||||||||||||||||||||
| TOTAL LIABILITIES AND STOCKHOLDERS’ EQUITY |
$ | 3,315,095 | $ | 2,577,438 | ||||||||||||||||||||
|
|
|
|
|
|||||||||||||||||||||
| Net interest spread(2) |
3.89 | % | 3.49 | % | ||||||||||||||||||||
|
|
|
|
|
|||||||||||||||||||||
| Net interest income |
$ | 29,538 | $ | 21,120 | ||||||||||||||||||||
|
|
|
|
|
|||||||||||||||||||||
| Net interest margin(3) |
4.04 | % | 3.60 | % | ||||||||||||||||||||
|
|
|
|
|
|||||||||||||||||||||
| (1) | Loan and lease balances are net of deferred origination fees and costs and initial direct costs. Non-accrual loans and leases are included in total loan and lease balances. |
| (2) | Represents the average rate earned on interest-earning assets minus the average rate paid on interest-bearing liabilities. |
| (3) | Represents net interest income (annualized) divided by total average earning assets. |
| (4) | Interest income and rates exclude the effects of a tax equivalent adjustment to adjust tax exempt investment income on tax exempt investment securities to a fully taxable basis due to immateriality. |
| (5) | Average balances are average daily balances. |
-75-
Table of Contents
| Year Ended December 31, |
||||||||||||||||||||||||
| 2016 |
2015 |
|||||||||||||||||||||||
| Average Balance(5) |
Interest Inc / Exp |
Average Yield / Rate |
Average Balance(5) |
Interest Inc / Exp |
Average Yield / Rate |
|||||||||||||||||||
| ASSETS |
||||||||||||||||||||||||
| Cash and cash equivalents |
$ | 32,927 | $ | 109 | 0.33 | % | $ | 69,041 | $ | 145 | 0.21 | % | ||||||||||||
| Loans and leases(1) |
1,671,751 | 83,150 | 4.97 | % | 1,254,716 | 69,621 | 5.55 | % | ||||||||||||||||
| Securities available-for-sale(4) |
667,502 | 11,720 | 1.76 | % | 797,057 | 11,517 | 1.44 | % | ||||||||||||||||
| Securities held-to-maturity |
134,477 | 2,733 | 2.03 | % | 89,271 | 1,329 | 1.49 | % | ||||||||||||||||
| Tax-exempt securities |
20,504 | 653 | 3.18 | % | 20,248 | 651 | 3.22 | % | ||||||||||||||||
|
|
|
|
|
|
|
|
|
|||||||||||||||||
| Total interest-earning assets |
$ | 2,527,161 | $ | 98,365 | 3.89 | % | $ | 2,230,333 | $ | 83,263 | 3.73 | % | ||||||||||||
|
|
|
|
|
|
|
|
|
|||||||||||||||||
| Allowance for loan and lease losses |
(7,385 | ) | (5,658 | ) | ||||||||||||||||||||
| All other assets |
234,962 | 265,509 | ||||||||||||||||||||||
|
|
|
|
|
|||||||||||||||||||||
| TOTAL ASSETS |
$ | 2,754,738 | $ | 2,490,184 | ||||||||||||||||||||
|
|
|
|
|
|||||||||||||||||||||
| LIABILITIES AND STOCKHOLDERS’ EQUITY |
||||||||||||||||||||||||
| Deposits |
||||||||||||||||||||||||
| Interest checking |
$ | 187,042 | $ | 131 | 0.07 | % | $ | 187,287 | $ | 127 | 0.07 | % | ||||||||||||
| Money market accounts |
401,628 | 992 | 0.25 | % | 385,175 | 907 | 0.24 | % | ||||||||||||||||
| Savings |
442,458 | 307 | 0.07 | % | 440,736 | 303 | 0.07 | % | ||||||||||||||||
| Time deposits |
583,022 | 3,150 | 0.54 | % | 564,215 | 2,976 | 0.53 | % | ||||||||||||||||
| Federal Home Loan Bank advances |
151,508 | 706 | 0.47 | % | 15,009 | 23 | 0.15 | % | ||||||||||||||||
| Other borrowed funds |
45,172 | 2,461 | 5.45 | % | 35,631 | 2,295 | 6.44 | % | ||||||||||||||||
|
|
|
|
|
|
|
|
|
|||||||||||||||||
| Total interest bearing liabilities |
$ | 1,810,830 | $ | 7,747 | 0.43 | % | $ | 1,628,053 | $ | 6,631 | 0.41 | % | ||||||||||||
|
|
|
|
|
|
|
|
|
|||||||||||||||||
| Other liabilities |
704,958 | 654,535 | ||||||||||||||||||||||
| Total stockholders’ equity |
238,950 | 207,596 | ||||||||||||||||||||||
|
|
|
|
|
|||||||||||||||||||||
| TOTAL LIABILITIES AND STOCKHOLDERS’ EQUITY |
$ | 2,754,738 | $ | 2,490,184 | ||||||||||||||||||||
|
|
|
|
|
|||||||||||||||||||||
| Net interest spread(2) |
3.46 | % | 3.32 | % | ||||||||||||||||||||
|
|
|
|
|
|||||||||||||||||||||
| Net interest income |
$ | 90,618 | $ | 76,632 | ||||||||||||||||||||
|
|
|
|
|
|||||||||||||||||||||
| Net interest margin(3) |
3.59 | % | 3.44 | % | ||||||||||||||||||||
|
|
|
|
|
|||||||||||||||||||||
| (1) | Loan and lease balances are net of deferred origination fees and costs and initial direct costs. Non-accrual loans and leases are included in total loan and lease balances. |
| (2) | Represents the average rate earned on interest-earning assets minus the average rate paid on interest-bearing liabilities. |
| (3) | Represents net interest income (annualized) divided by total average earning assets. |
| (4) | Interest income and rates exclude the effects of a tax equivalent adjustment to adjust tax exempt investment income on tax exempt investment securities to a fully taxable basis due to immateriality. |
| (5) | Average balances are average daily balances. |
Increases and decreases in interest income and interest expense result from changes in average balances (volume) of interest-earning assets and interest-bearing liabilities, as well as changes in weighted average interest rates. The following tables set forth the effects of changing rates and volumes on our net interest income during the periods shown. Information is provided with respect to (i) effects on interest income attributable to changes in volume (changes in volume multiplied by prior rate) and (ii) effects on interest income attributable to changes in rate (changes in rate multiplied by prior volume). Changes applicable to both volume and rate have been allocated to volume. Yields have been calculated on a pre-tax basis. The tables below summarize the increases
-76-
Table of Contents
and decreases in interest income and interest expense resulting from changes in average balances (volume) and changes in average interest rates (dollars in thousands):
| (unaudited) Three Months ended March 31, 2017 compared |
||||||||||||
|
Increase (Decrease) Due to |
||||||||||||
| Volume |
Rate |
Total |
||||||||||
| Interest income |
||||||||||||
| Cash and cash equivalents |
$ | 14 | $ | 18 | $ | 32 | ||||||
| Loans and leases(1) |
9,451 | (54 | ) | 9,397 | ||||||||
| Securities available for sale |
(552 | ) | 778 | 226 | ||||||||
| Securities held to maturity |
(56 | ) | 58 | 2 | ||||||||
| Tax-exempt securities |
(22 | ) | (24 | ) | (46 | ) | ||||||
|
|
|
|
|
|
|
|||||||
| Total interest income |
$ | 8,835 | $ | 776 | $ | 9,611 | ||||||
|
|
|
|
|
|
|
|||||||
| Interest expense |
||||||||||||
| Deposits |
||||||||||||
| Interest checking |
$ | (1 | ) | $ | (2 | ) | $ | (3 | ) | |||
| Money market accounts |
(13 | ) | (3 | ) | (16 | ) | ||||||
| Savings |
1 | 3 | 4 | |||||||||
| Time deposits |
346 | (1 | ) | 345 | ||||||||
| Federal Home Loan Bank advances |
449 | 133 | 582 | |||||||||
| Other borrowed funds |
380 | (99 | ) | 281 | ||||||||
|
|
|
|
|
|
|
|||||||
| Total interest expense |
$ | 1,162 | $ | 31 | $ | 1,193 | ||||||
|
|
|
|
|
|
|
|||||||
| Net interest income |
$ | 7,673 | $ | 745 | $ | 8,418 | ||||||
|
|
|
|
|
|
|
|||||||
|
Year ended December 31, 2016 compared |
||||||||||||
|
Increase (Decrease) Due to |
||||||||||||
| Volume |
Rate |
Total |
||||||||||
| Interest income |
||||||||||||
| Cash and cash equivalents |
$ | (118 | ) | $ | 81 | $ | (37 | ) | ||||
| Loans and leases(1) |
20,743 | (7,214 | ) | 13,529 | ||||||||
| Securities available for sale |
(2,275 | ) | 2,478 | 203 | ||||||||
| Securities held to maturity |
919 | 486 | 1,405 | |||||||||
| Tax-exempt securities |
8 | (6 | ) | 2 | ||||||||
|
|
|
|
|
|
|
|||||||
| Total interest income |
$ | 19,277 | $ | (4,175 | ) | $ | 15,102 | |||||
|
|
|
|
|
|
|
|||||||
| Interest expense |
||||||||||||
| Deposits |
||||||||||||
| Interest checking |
$ | — | $ | 5 | $ | 5 | ||||||
| Money market accounts |
41 | 44 | 85 | |||||||||
| Savings |
1 | 3 | 4 | |||||||||
| Time deposits |
102 | 72 | 174 | |||||||||
| Federal Home Loan Bank advances |
636 | 47 | 683 | |||||||||
| Other borrowed funds |
520 | (355 | ) | 165 | ||||||||
|
|
|
|
|
|
|
|||||||
| Total interest expense |
$ | 1,300 | $ | (184 | ) | $ | 1,116 | |||||
|
|
|
|
|
|
|
|||||||
| Net interest income |
$ | 17,977 | $ | (3,991 | ) | $ | 13,986 | |||||
|
|
|
|
|
|
|
|||||||
| (1) | Includes loans and leases on non-accrual status. |
-77-
Table of Contents
Net interest income for the three months ended March 31, 2017 was $29.5 million compared to $21.1 million during the same period in 2016, an increase of $8.4 million or 39.9%. The increase in interest income of $9.6 million was primarily a result of organic growth of the loan portfolio and due to the Ridgestone acquisition. The three months ended March 31, 2017 represented the first full quarter with the Small Business Capital operations acquired from Ridgestone was integrated in the financial statements. Interest and fees on loans and leases for the three months ended March 31, 2017 was $28.4 million compared to $19.0 million for the three months ended March 31, 2016, an increase of $9.4 million or 49.5%. Interest income on securities for the three months ended March 31, 2017 was $4.0 million compared to $3.9 million for the three months ended March 31, 2016, an increase of $182,000 or 4.7%.
Interest expense increased by $1.2 million for the three months ended March 31, 2017 compared to the three months ended March 31, 2016 primarily due to additional FHLB borrowings and acquired time deposits as a result of the Ridgestone transaction.
Net interest income for the year ended December 31, 2016 was $90.6 million compared to $76.6 million for the year ended December 31, 2015, an increase of $14.0 million or 18.3%. The total increase of $14.0 million in net interest income resulted mainly from volume change as indicated in the table above net of rate decrease. Interest and fees on loans and leases for 2016 was $83.2 million compared to $69.6 million in 2015, an increase of $13.5 million or 19.4%. Interest income on securities for 2016 was $14.8 million compared to $13.5 million in 2015, an increase of $1.4 million or 10.2%. The increase was due to the organic growth of the loan and investment securities balances as well as the acquisition of Ridgestone. Total loans increased by $802.6 million, primarily as a result of the Ridgestone acquisition which represented $351.8 million. Interest and fees on acquired loans related to the Ridgestone acquisition is estimated at $6.8 million for 2016. The decrease in the average rate earned on interest-bearing assets was attributable to a decrease of $9.8 million in acquired loan income due to resolutions within the acquired impaired loan portfolio from the Recapitalization. Acquired loan income for the years ended December 31, 2016 and 2015 was $33.2 million and $43.0 million, respectively.
The increase in interest income was partially offset by the increase in interest expense. Interest expense increased by 16.8% from $6.6 million for the year ended December 31, 2015 to $7.7 million for the year ended December 31, 2016. The increase in interest expense was primarily due to the organic growth of the deposit base, the acquisition of Ridgestone, and increased borrowings. Interest expense on deposits for the year ended December 31, 2016 was $4.6 million compared to $4.3 million for the year ended December 31, 2015, an
increase of $267,000 or 6.2%, of which an increase of $174,000 or 4.0% was related to interest expense on time deposits.
The Company assumed deposits of $361.4 million from the acquisition of Ridgestone. Interest expense on borrowings for 2016 was $3.2 million compared to $2.3 million for the year ended December 31, 2015, an increase of $848,000 or 36.6%. This increase was primarily driven by the increase in outstanding FHLB advances in the year ended December 31, 2016. Growth in the loan portfolio resulted in an increase in average FHLB advances. Interest expense on FHLB advances for the year ended December 31, 2016 was $706,000 compared to $23,000 for the year ended December 31, 2015, an increase of $683,000. Interest expense on Junior Subordinated Debentures issued to unconsolidated trusts was $2.1 million compared to $2.3 million for the year ended December 31, 2015, a decrease of $163,000 or 7.1%. Interest expense on the line of credit was $328,000 for the year ended December 31, 2016. There was no interest expense on the line of credit for the year ended December 31, 2015. The increase of $1.1 million of interest expense resulted from rate changes as indicated in the table above. The increase in the average rate paid on deposits was attributable to higher prevailing rates offered in the market.
The net interest margin for the three months ended March 31, 2017 was 4.04%, an increase of 44 basis points compared to 3.60% for the three months ended March 31, 2016. The primary driver of the increase was due to the increased volume of loans during the quarter.
-78-
Table of Contents
The net interest margin for the year ended December 31, 2016 was 3.59%, an increase of 15 basis points compared to 3.44% for the year ended December 31, 2015. The average yield on interest-earning assets increased by 16 basis points for the year ended December 31, 2016 as compared to the year ended December 31, 2015, while the average rate paid on interest-bearing liabilities increased by 2 basis points, for an increase in the interest rate spread of 13 basis points. The increase in the average yield on interest earning assets was due primarily to an increase in loan interest income resulting from increased loan originations along with loans associated with the Ridgestone acquisition. The higher yielding loans obtained from the Ridgestone acquisition resulted in an increase in the average rate for the combined loan portfolio. The average rate on the acquired impaired loan portfolio from the Recapitalization was 6.22% for the year ended December 31, 2016, up from 6.08% for the year ended December 31, 2015.
Provision for loan and lease losses
The provision for loan and lease losses represents a charge to earnings necessary to establish an allowance for loan losses that, in management’s evaluation, is appropriate to provide coverage for probable losses incurred in the loan portfolio. The allowance for loan losses is increased by the provision for loan losses and is decreased by charge-offs, net of recoveries on prior loan charge-offs.
Provisions for loan losses totaled $1.9 million and $2.5 million for the three months ended March 31, 2017 and March 31, 2016, respectively. We continue to see a reduction in provision expense related to the loan portfolio acquired in the Recapitalization due to better than expected performance and declining workout assets. The ALLL as a percentage of loans increased from 0.51% to 0.55% from December 31, 2016 to March 31, 2017. The increase was primarily due to the change in loan mix, with the originated portfolio increasing by $33.9 million to $1.3 billion at March 31, 2017 and the acquired portfolio decreasing by $38.4 million for the same period.
The provision for loan and lease losses for the year ended December 31, 2016 was $10.4 million compared to $7.0 million for the year ended December 31, 2015, an increase of $3.4 million or 48.6%, primarily due to an increase in loans through organic growth. However, the ALLL as a percentage of loans decreased from 0.57% to 0.51% from December 31, 2015 to December 31, 2016. The primary reason for the percentage decrease is that the loans acquired from Ridgestone were acquired loans at fair value and the allowance for loan losses was not carried over in the acquisition.
Non-interest income
The Company reported non-interest income of $12.3 million and $4.3 million for the three months ended March 31, 2017 and March 31, 2016, respectively. The increase of $8.0 million was primarily due to gains on sales of government guaranteed loans through the Small Business Capital operations of $8.1 million. There were no gains on sales of government guaranteed loans during the three months ended March 31, 2016. Non-interest income for the year ended December 31, 2016 was $25.9 million compared to $20.8 million for the year ended December 31, 2015, an increase of $5.1 million or 24.3%. The increase in non-interest income for 2016 compared to 2015 was primarily driven by increase in gains on sales of loans and servicing fees.
-79-
Table of Contents
The following table presents the major components of our non-interest income for the periods indicated (dollars in thousands):
| (unaudited) |
|
|||||||||||||||
| Three Months |
Year
Ended |
|||||||||||||||
| 2017 |
2016 |
2016 |
2015 |
|||||||||||||
| Fees and service charges on deposits |
$ | 1,219 | $ | 1,389 | $ | 5,665 | $ | 5,803 | ||||||||
| Servicing fees |
919 | — | 1,906 | — | ||||||||||||
| ATM and interchange fees |
1,348 | 1,408 | 5,856 | 6,101 | ||||||||||||
| Net gains on sales of securities available-for-sale |
8 | 923 | 3,227 | 3,064 | ||||||||||||
| Net gains on sales of loans |
8,082 | — | 4,323 | 3,151 | ||||||||||||
| Fees on mortgage loan sales, net |
2 | 20 | 144 | 107 | ||||||||||||
| Other non-interest income |
730 | 548 | 4,783 | 2,613 | ||||||||||||
|
|
|
|
|
|
|
|
|
|||||||||
| Total non-interest income |
$ | 12,308 | $ | 4,288 | $ | 25,904 | $ | 20,839 | ||||||||
|
|
|
|
|
|
|
|
|
|||||||||
-80-
Table of Contents
Fees and service charges on deposits represent fees charged to customers for banking services, such as fees charged on customer deposit accounts, and includes, but it is not limited to, maintenance fees, insufficient fund fees, overdraft protection fees, wire transfer fees and other. Fees on service charges on deposits decreased from $1.4 million for the three months ended March 31, 2016 to $1.2 million for the three months ended March 31, 2017. The decrease was mainly due to a decline in interchange income due to lower transaction volume during the quarter.
Fees and service charges on deposits decreased from $5.8 million for the year ended December 31, 2015 to $5.7 million for the year ended December 31, 2016. The decrease of $138,000 from the year ended December 31, 2015 to December 31, 2016 was mainly driven by lower insufficient fund fees.
ATM and interchange fees income decreased by $60,000 for the three months ended March 31, 2017 compared to the three months ended March 31, 2016. For the year ended December 31, 2016 ATM and interchange fees were $5.9 million compared to $6.1 million for the year ended December 31, 2015, a decrease of $245,000 or 4.0% primarily driven by lower interchange income.
While portions of the loans that we originate are sold and generate gains on sale revenue, servicing rights for the majority of loans that we sell are retained by Byline Bank. In exchange for continuing to service loans that are sold, Byline Bank receives a servicing fee paid from a portion of the interest cash flow of the loan. As a result of the Ridgestone acquisition, we recorded $919,000 in net servicing revenue on the sold portion of the government guaranteed portfolio for the three months ended March 31, 2017. We did not receive servicing fees during for the three months ended March, 31, 2016 because the government guaranteed portfolio was acquired in October 2016 in the Ridgestone acquisition. For the year ended December 31, 2016, loan servicing fee income was $1.9 million. At March 31, 2017 and December 31, 2016, the outstanding balance of guaranteed loans sold in the secondary market and serviced, were $986.1 million and $1.0 billion, respectively.
Gains on sales of securities during the three months ended March 31, 2017 was $8,000 compared to $923,000 for the three months ended March 31, 2016 due to minimal securities sales during the first quarter of 2017.
Gains on sales of securities during 2016 was $3.2 million compared to $3.1 million for the year ended December 31, 2015, an increase of $163,000 or 5.3%. The increase was primarily driven by lower than expected interest rates during the first half of 2016 which created opportunities to realize additional gain on sale income.
For the three months ended March 31, 2017, net gains on sales of loans were $8.1 million. We did not have a government guaranteed lending unit during the three months ended March 31, 2016. For the year ended December 31, 2016, the Company recorded $4.3 million in gains on sales of loans, including $3.1 million in gains on sales of government guaranteed loans acquired as part of the Ridgestone acquisition. The gain on sale of loans in 2015 represented the sales of acquired impaired and non-impaired loans. The increase in gains on sales of loans of $1.2 million over 2015 was primarily driven by gain on sales of government guaranteed loans in the fourth quarter, offset by a reduction in the sale of loans from the acquired loan portfolio.
Other non-interest income increased to $730,000 for the three months ended March 31, 2017, an increase of 33.2% compared to the $548,000 for the three months ended March 31, 2016. The primary driver of this increase was the income related to fee income from a customer swap, which was not introduced until April 2016.
Other non-interest income increased $2.2 million primarily due to the gains on sales of assets for the year ended December 31, 2016 of $947,000 compared to a $197,000 loss for the year ended December 31, 2015, an increase of $1.1 million from the sales of real estate as part of the Company’s branch consolidation strategy.
Another driver of other non-interest income in 2016 was income of $679,000 as a result of customer interest rate swaps, a new product offering to commercial banking loan customers during 2016. Additionally,
-81-
Table of Contents
other non-interest income increased due to gains on sales of leased equipment for the year ended December 31, 2016, which totaled $383,000 compared to $161,000 for the year ended December 31, 2015, an increase of $222,000.
Non-interest expense
Non-interest expense for the three months ended March 31, 2017 was $28.9 million compared to $24.5 million for the three months ended March 31, 2016, an increase of $4.4 million or 17.8% primarily due to the additional expenses from the acquisition of our Small Business Capital operation.
Non-interest expense for the year ended December 31, 2016 was $100.7 million compared to $105.2 million for the year ended December 31, 2015, a decrease of $4.5 million or 4.3%. The improvement in the various non-interest expense categories is indicative of the Company’s improved asset quality and initial branch optimization savings. The improvements were partially offset by the increased expenses related to growth opportunities including the addition of commercial bankers and the Ridgestone acquisition.
The following table presents the major components of our non-interest expense for the periods indicated (dollars in thousands):
| (unaudited) |
|
|||||||||||||||
| Three Months
Ended |
Year
Ended |
|||||||||||||||
| 2017 |
2016 |
2016 |
2015 |
|||||||||||||
| Salaries and employee benefits |
$ | 16,602 | $ | 11,940 | $ | 50,585 | $ | 45,960 | ||||||||
| Occupancy expense, net |
3,739 | 3,802 | 15,066 | 16,682 | ||||||||||||
| Equipment expense |
563 | 535 | 2,032 | 2,359 | ||||||||||||
| Loan and lease related expenses |
569 | 461 | 1,992 | (21 | ) | |||||||||||
| Legal, audit and other professional fees |
1,671 | 993 | 5,862 | 7,089 | ||||||||||||
| Data processing |
2,409 | 1,820 | 8,157 | 7,033 | ||||||||||||
| Net (gain) loss recognized on other real estate owned and other related expenses |
(570 | ) | 899 | 1,719 | 7,792 | |||||||||||
| Regulatory assessments |
184 | 850 | 2,553 | 3,316 | ||||||||||||
| Other intangible assets amortization expense |
769 | 747 | 3,003 | 2,980 | ||||||||||||
| Advertising and promotions |
289 | 235 | 623 | 1,570 | ||||||||||||
| Telecommunications |
418 | 458 | 1,698 | 1,643 | ||||||||||||
| Other non-interest expense |
2,208 | 1,747 | 7,396 | 8,769 | ||||||||||||
|
|
|
|
|
|
|
|
|
|||||||||
| Total non-interest expense |
$ | 28,851 | $ | 24,487 | $ | 100,686 | $ | 105,172 | ||||||||
|
|
|
|
|
|
|
|
|
|||||||||
Salaries and employee benefits, the single largest component of our non-interest expense, totaled $16.6 million for the three months ended March 31, 2017, an increase of $4.7 million compared to the three months ended March 31, 2016 due to an increase in the number of employees as a result of the Ridgestone acquisition. The Company’s staffing increased from 729 full-time equivalent employees as of March 31, 2016 to 791 as of March 31, 2017.
Salaries and employee benefits for the year ended December 31, 2016 was $50.6 million compared to $46.0 million, an increase of $4.6 million, or 10.1%, primarily due to the acquisition of Ridgestone and offset by the headcount reductions from the strategic branch optimization. The Company’s staffing increased from 772 full-time equivalent employees as of December 31, 2015 to 795 as of December 31, 2016. Salaries and employee benefits related to Ridgestone were $4.5 million in 2016, offset by the reduction in retail employees related to the strategic branch consolidations.
Occupancy and equipment expense decreased $35,000 for the three months ended March 31, 2017 from the same period in 2016. The decrease in occupancy and equipment expense for the three months ended
-82-
Table of Contents
March 31, 2017 resulted from the Company’s branch optimization strategy resulting in the consolidation of 28 branches during 2016, partially offset by expenses incurred of $361,000 due to Small Business Capital operations.
Occupancy and equipment expense decreased $1.9 million, or 10.2%, from $19.0 million in 2015 to $17.1 million in 2016. This decrease was primarily driven by the Company’s branch optimization strategy resulting in the consolidation of 28 branches during 2016.
Loan and lease related expenses for the three months ended March 31, 2017 were $569,000 compared to expenses of $461,000 for the three months ended March 31, 2016, an increase of $108,000, due to the increased lending and workout activity resulting from the operations of the Small Business Capital operations partially offset by lower problem loan real estate tax accrual for problem loans.
Loan and lease related expenses for the year ended December 31, 2016 were $2.0 million compared to income of $21,000 for the year ended December 31, 2015, an increase of $2.0 million, due to a decrease in real estate tax accruals of $2.8 million during 2015 as a result of the sale of loans from the acquired loan portfolio.
Legal, audit and other professional fees for the three months ended March 31, 2017 were $1.7 million compared to $993,000 for the three months ended March 31, 2016, an increase of $678,000 or 68.3%. The change is primarily driven by increased legal and professional fees related to our initial public offering and the integration costs associated with the Ridgestone acquisition.
Legal, audit and other professional fees for the year ended December 31, 2016 were $5.9 million compared to $7.1 million for the year ended December 31, 2015, a decrease of $1.2 million or 17.3%. The change is primarily driven by decreased legal and professional fees related to acquired loans and foreclosed real estate and partially offset by acquisition advisory expenses of $1.6 million related to the Ridgestone acquisition during 2016.
Data processing expense for the three months ended March 31, 2017 was $2.4 million compared to $1.8 million for the three months ended March 31, 2016, an increase of $589,000, or 32.4%. The increase is primarily due to an increase in data processing expenses as a result of the Ridgestone acquisition.
Data processing expense for the year ended December 31, 2016 was $8.2 million compared to $7.0 million for the year ended December 31, 2015, an increase $1.1 million, or 16.0%. The increase is primarily due to one-time data processing expenses related to the Ridgestone acquisition, totaling $412,000, which primarily consisted of termination expense related to the decommissioning of Ridgestone’s core operating system post acquisition.
OREO income was $570,000 for the three months ended March 31, 2017, a decrease of $1.5 million compared to OREO expense of $899,000 for the same period in 2016. The decrease is due to the decrease in OREO balances from $24.5 million to $13.2 million from March 31, 2016 to March 31, 2017, respectively and due to increased gains on the sale of other real estate.
OREO expense was $1.7 million in 2016, a decrease of $6.1 million, or 77.9%, compared to $7.8 million in 2015 due to the decrease in OREO balances from $26.7 million to $16.6 million from December 31, 2015 to December 31, 2016, respectively. The other real estate loan reduction was due to the sales of the assets during 2016. For the year ended December 31, 2015, the Company had losses on sale of other real estate of $3.4 million that was driven by an accelerated program to dispose of assets. For the year ended December 31, 2016, the Company had $411,000 of gains on the sale of other real estate.
-83-
Table of Contents
Regulatory assessments for the three months ended March 31, 2017 were $184,000 compared to $850,000 for the same period in 2016, a decrease of $666,000 or 78.4%. Regulatory assessments for the year ended December 31, 2016 were $2.6 million compared to $3.3 million for the year ended December 31, 2015, a decrease of $763,000 or 23.0%. These decreases were primarily due our improved risk profile as a result of improved capital ratios, performance and asset quality.
Advertising and promotions for the three months ended March 31, 2017 were $289,000 compared to $235,000 for same period in 2016, an increase of $54,000 or 23.0% due to increased advertising and promotions in our Small Business Capital operations.
Advertising and promotions for the year ended December 31, 2016 were $623,000 compared to $1.6 million for the year ended December 31, 2015, a decrease of $947,000 or 60.3% due to the one-time rebranding initiative costs incurred during 2015.
Other non-interest expense for the three months ended March 31, 2017 was $2.2 million compared to $1.7 million for the three months ended March 31, 2016, an increase of $461,000, or 26.4%, due to the additional collection expenses from Small Business Capital.
Other non-interest expense for the year ended December 31, 2016 was $7.4 million compared to $8.8 million for the year ended December 31, 2015, a decrease of $1.4 million or 15.7%. This includes a decrease of $1.1 million in legal settlements, $494,000 in postage expense and $466,000 in stationery and supplies, offset by an increase in ATM card issuance costs due to the issuance of EMV chip cards.
Following the completion of this offering, we expect to incur additional one-time and recurring expenses to support our operations as a standalone public company, including expenses related to compliance with applicable legal and financial reporting requirements, incremental expenses to support information technology, corporate governance and compliance infrastructure, expansion of our employee compensation and benefits, investor relations and corporate communications functions. These expenses will adversely affect our efficiency ratio, and we will need to seek opportunities to offset these increased costs.
Income Taxes
Income tax expense for the three months ended March 31, 2017 totaled $4.5 million compared to a tax benefit of $240,000 for the three months ended March 31, 2016. The increase in income tax expense was primarily due to the reversal of our deferred tax asset valuation allowance at the end of 2016 and the increase in taxable income for the three months ended March 31, 2017 compared to a loss for the three months ended March 31, 2016. The Company’s effective tax rate was 40.9% for the three months ended March 31, 2017.
The income tax benefit for the year ended December 31, 2016 was $61.2 million compared to a provision expense of $307,000 for the year ended December 31, 2015. The income tax benefit for the year ended December 31, 2016 was primarily due to the reversal of the $61.9 million valuation allowance established against the net deferred tax assets. The determination to reverse the allowance was based on Ridgestone’s actual pre-tax income, actual combined earnings for the Company and Ridgestone over the prior three years, as well as management’s expectations for sustainable profitability in the future. Business forecasts are used in the evaluation of the recoverability and indicate improved profitability driven by improved asset quality in the Company’s loan portfolio, consecutive quarterly profitability during 2016 and improved future profitability as a result of expense reductions from the strategic branch optimization. Management’s expectations of future profitability are also driven by our improved loan to deposit ratio, cost reduction through branch optimization in 2016, and decreased special asset workout expenses due to loan sales during 2016. As a result of the valuation allowance reversal, the Company’s effective tax rate was negative 1117% for the year ended December 31, 2016. The Company’s effective tax rate was zero for the year ended December 31, 2015.
-84-
Table of Contents
Financial Condition
Balance sheet analysis
The Company’s total assets remained flat at $3.3 billion from December 31, 2016 to March 31, 2017. Loans remained flat for the same period as a result of the change in loan mix, with the originated portfolio increasing by $33.9 million and the acquired portfolio decreasing by $38.4 million, driven by seasonality and payoffs of acquired loans.
Total liabilities decreased by $18.1 million, or 0.6%, from $2.9 billion at December 31, 2016 to $2.9 billion at March 31, 2017. The decrease is a result of a decrease in Federal Home Loan Bank advances of $104.1 million, or 33.2% which was partially offset by an increase in total deposits of $85.4 million, or 3.4%.
The Company’s total assets increased by $816.0 million, or 32.9%, from $2.5 billion at December 31, 2015 to $3.3 billion at December 31, 2016. In addition to organic growth in the loan portfolio, the increase in total assets is attributable to the acquired assets of $456.2 million from Ridgestone. The increase in total assets includes $799.3 million in net loans, or 59.7% and an increase in loans held for sale of $23.7 million. The Company acquired $351.8 million in net loans and $15.4 million of loans held for sale from the Ridgestone acquisition as of the date of acquisition.
Investment portfolio
The investment securities portfolio consists of securities classified as available-for-sale and held-to-maturity. There were no trading securities in our investment portfolio as of March 31, 2017, December 31, 2016 and 2015. All available-for sale securities are carried at fair value and may be used for liquidity purposes should management consider it to be in our best interest. Securities available-for-sale consist primarily of residential mortgage-backed securities, commercial mortgage backed securities and U.S. government agencies securities.
Securities available-for-sale decreased $18.1 million, from $608.6 million at December 31, 2016 to $590.5 million at March 31, 2017. Securities available-for-sale decreased $159.2 million, or 20.7%, from $767.7 million at December 31, 2015 to $608.6 million at December 31, 2016. The decrease was primarily due to the redeployment of liquidity into higher yielding loans and leases.
The held-to-maturity securities portfolio consists of mortgage-backed securities and obligations of states, municipalities and political subdivisions. We carry these securities at amortized cost. As of March 31, 2017 this portfolio totaled $132.9 million. This portfolio totaled $138.8 million at December 31, 2016, compared to $111.5 million at December 31, 2015, an increase of $27.4 million, or 24.6%.
The Company had no securities that were classified as having OTTI as of March 31, 2017, December 31, 2016 and 2015.
-85-
Table of Contents
The following tables summarize the fair value of the available-for-sale and held-to-maturity securities portfolio as of the dates presented (dollars in thousands):
| (Unaudited) |
|
|
||||||||||||||||||||||
| March 31, 2017 |
December 31, 2016 |
December 31, 2015 |
||||||||||||||||||||||
| Amortized |
Fair |
Amortized |
Fair |
Amortized |
Fair |
|||||||||||||||||||
|
Available-for-sale |
||||||||||||||||||||||||
| U.S. Treasury Notes |
$ | 14,996 | $ | 14,926 | $ | 14,995 | $ | 14,920 | $ | 30,580 | $ | 30,345 | ||||||||||||
| U.S. Government agencies |
60,197 | 58,915 | 60,180 | 58,857 | 84,368 | 83,613 | ||||||||||||||||||
| Obligations of states, municipalities, and political subdivisions |
16,336 | 16,190 | 16,271 | 16,059 | 20,687 | 20,752 | ||||||||||||||||||
| Residential mortgage-backed securities |
||||||||||||||||||||||||
| Agency |
360,727 | 352,559 | 376,800 | 368,160 | 593,391 | 588,334 | ||||||||||||||||||
| Non-agency |
19,470 | 19,263 | 20,107 | 19,933 | — | — | ||||||||||||||||||
| Commercial mortgage-backed securities |
||||||||||||||||||||||||
| Agency |
77,128 | 75,578 | 78,954 | 77,403 | 31,514 | 31,191 | ||||||||||||||||||
| Non-agency |
31,987 | 31,061 | 32,061 | 31,052 | — | — | ||||||||||||||||||
| Corporate securities |
17,065 | 17,459 | 17,065 | 17,329 | 7,801 | 7,696 | ||||||||||||||||||
| Other securities |
3,623 | 4,556 | 4,161 | 4,847 | 5,098 | 5,801 | ||||||||||||||||||
|
|
|
|
|
|
|
|
|
|
|
|
|
|||||||||||||
| Total |
$ | 601,529 | $ | 590,507 | $ | 620,594 | $ | 608,560 | $ | 773,439 | $ | 767,732 | ||||||||||||
|
|
|
|
|
|
|
|
|
|
|
|
|
|||||||||||||
|
Held-to-maturity |
||||||||||||||||||||||||
| Obligations of states, municipalities, and political subdivisions |
$ | 24,828 | $ | 24,854 | $ | 24,878 | $ | 24,754 | $ | 25,081 | $ | 25,249 | ||||||||||||
| Residential mortgage-backed securities |
||||||||||||||||||||||||
| Agency |
63,530 | 63,506 | 67,692 | 67,444 | 86,379 | 85,686 | ||||||||||||||||||
| Non-agency |
44,539 | 44,347 | 46,276 | 45,884 | — | — | ||||||||||||||||||
|
|
|
|
|
|
|
|
|
|
|
|
|
|||||||||||||
| Total |
$ | 132,897 | $ | 132,707 | $ | 138,846 | $ | 138,082 | $ | 111,460 | $ | 110,935 | ||||||||||||
|
|
|
|
|
|
|
|
|
|
|
|
|
|||||||||||||
The Company did not classify any securities as trading securities during the first quarter of 2017 or during the years ended December 31, 2016 or 2015.
Certain securities have fair values less than amortized cost and, therefore, contain unrealized losses. At March 31, 2017, the Company evaluated the securities which had an unrealized loss for OTTI and determined all declines in value to be temporary. There were 115 investment securities with unrealized losses at March 31, 2017 of which only two had a continuous unrealized loss position for 12 consecutive months or longer that is greater than 5% of amortized cost. The Company anticipates full recovery of amortized cost with respect to these securities by maturity, or sooner in the event of a more favorable market interest rate environment. The Company does not intend to sell these securities and it is not more likely than not that the Company will be required to sell them before recovery of their amortized cost basis, which may be at maturity.
The following tables (dollars in thousands) set forth certain information regarding contractual maturities and the weighted average yields of our investment securities as of the dates presented. Expected maturities may differ from contractual maturities if borrowers have the right to call or prepay obligations with or without call or prepayment penalties.
-86-
Table of Contents
| Maturity as of March 31, 2017 |
||||||||||||||||||||||||||||||||
|
Due in One Year or Less |
Due from One to Five Years |
Due from Five to Ten Years |
Due after Ten Years |
|||||||||||||||||||||||||||||
| Amortized |
Weighted |
Amortized |
Weighted |
Amortized |
Weighted |
Amortized |
Weighted |
|||||||||||||||||||||||||
| Available-for-sale |
||||||||||||||||||||||||||||||||
| U.S. Treasury Notes |
$ | 4,998 | 1.04 | % | $ | 9,998 | 1.21 | % | $ | — | 0.00 | % | $ | — | 0.00 | % | ||||||||||||||||
| U.S. government agencies |
— | 0.00 | % | 29,201 | 1.31 | % | 30,996 | 1.62 | % | — | 0.00 | % | ||||||||||||||||||||
| Obligations of states, municipalities, and political subdivisions |
410 | 3.73 | % | 3,085 | 3.45 | % | 6,850 | 3.08 | % | 5,991 | 2.95 | % | ||||||||||||||||||||
| Residential mortgage-backed securities |
||||||||||||||||||||||||||||||||
| Agency |
— | 0.00 | % | — | 0.00 | % | 4,434 | 1.41 | % | 356,293 | 2.06 | % | ||||||||||||||||||||
| Non-agency |
— | 0.00 | % | — | 0.00 | % | — | 0.00 | % | 19,470 | 3.28 | % | ||||||||||||||||||||
| Commercial mortgage-backed securities |
||||||||||||||||||||||||||||||||
| Agency |
— | 0.00 | % | — | 0.00 | % | 11,937 | 1.38 | % | 65,191 | 2.16 | % | ||||||||||||||||||||
| Non-agency |
— | 0.00 | % | — | 0.00 | % | — | 0.00 | % | 31,987 | 2.61 | % | ||||||||||||||||||||
| Corporate securities |
— | 0.00 | % | 13,255 | 4.58 | % | 3,810 | 2.54 | % | — | 0.00 | % | ||||||||||||||||||||
| Other securities |
— | 0.00 | % | — | 0.00 | % | — | 0.00 | % | 3,623 | 3.37 | % | ||||||||||||||||||||
|
|
|
|
|
|
|
|
|
|
|
|
|
|
|
|
|
|||||||||||||||||
| Total |
$ | 5,408 | 1.25 | % | $ | 55,539 | 2.19 | % | $ | 58,027 | 1.79 | % | $ | 482,555 | 2.18 | % | ||||||||||||||||
|
|
|
|
|
|
|
|
|
|
|
|
|
|
|
|
|
|||||||||||||||||
| Amortized |
Weighted |
Amortized |
Weighted |
Amortized |
Weighted |
Amortized |
Weighted |
|||||||||||||||||||||||||
| Held-to-maturity |
||||||||||||||||||||||||||||||||
| Obligations of states, municipalities, and political subdivisions |
$ | — | 0.00 | % | $ | 528 | 1.50 | % | $ | 13,358 | 2.44 | % | $ | 10,942 | 2.81 | % | ||||||||||||||||
| Residential mortgage-backed securities |
||||||||||||||||||||||||||||||||
| Agency |
— | 0.00 | % | — | 0.00 | % | — | 0.00 | % | 63,530 | 2.32 | % | ||||||||||||||||||||
| Non-agency |
— | 0.00 | % | — | 0.00 | % | — | 0.00 | % | 44,539 | 3.32 | % | ||||||||||||||||||||
|
|
|
|
|
|
|
|
|
|
|
|
|
|
|
|
|
|||||||||||||||||
| Total |
$ | — | 0.00 | % | $ | 528 | 1.50 | % | $ | 13,358 | 2.44 | % | $ | 119,011 | 2.69 | % | ||||||||||||||||
|
|
|
|
|
|
|
|
|
|
|
|
|
|
|
|
|
|||||||||||||||||
| Maturity as of December 31, 2016 |
||||||||||||||||||||||||||||||||
|
Due in One Year or Less |
Due from One to Five Years |
Due from Five to Ten Years |
Due after Ten Years |
|||||||||||||||||||||||||||||
| Amortized |
Weighted |
Amortized |
Weighted |
Amortized |
Weighted |
Amortized |
Weighted |
|||||||||||||||||||||||||
| Available-for-sale |
||||||||||||||||||||||||||||||||
| U.S. Treasury Notes |
$ | — | 0.00 | % | $ | 14,995 | 1.16 | % | $ | — | 0.00 | % | $ | — | 0.00 | % | ||||||||||||||||
| U.S. government agencies |
— | 0.00 | % | 29,185 | 1.31 | % | 30,995 | 1.62 | % | — | 0.00 | % | ||||||||||||||||||||
| Obligations of states, municipalities, and political subdivisions |
200 | 2.48 | % | 3,236 | 3.51 | % | 6,709 | 3.24 | % | 6,126 | 2.96 | % | ||||||||||||||||||||
| Residential mortgage-backed securities |
||||||||||||||||||||||||||||||||
| Agency |
— | 0.00 | % | — | 0.00 | % | 4,766 | 1.42 | % | 372,034 | 2.08 | % | ||||||||||||||||||||
| Non-agency |
— | 0.00 | % | — | 0.00 | % | — | 0.00 | % | 20,107 | 3.28 | % | ||||||||||||||||||||
| Commercial mortgage-backed securities |
||||||||||||||||||||||||||||||||
| Agency |
— | 0.00 | % | — | 0.00 | % | 11,969 | 1.22 | % | 66,985 | 2.15 | % | ||||||||||||||||||||
| Non-agency |
— | 0.00 | % | — | 0.00 | % | — | 0.00 | % | 32,061 | 2.61 | % | ||||||||||||||||||||
| Corporate securities |
— | 0.00 | % | 13,254 | 4.55 | % | 3,811 | 2.46 | % | — | 0.00 | % | ||||||||||||||||||||
| Other securities |
— | 0.00 | % | — | 0.00 | % | — | 0.00 | % | 4,161 | 3.13 | % | ||||||||||||||||||||
|
|
|
|
|
|
|
|
|
|
|
|
|
|
|
|
|
|||||||||||||||||
| Total |
$ | 200 | 2.48 | % | $ | 60,670 | 2.10 | % | $ | 58,250 | 1.76 | % | $ | 501,474 | 2.19 | % | ||||||||||||||||
|
|
|
|
|
|
|
|
|
|
|
|
|
|
|
|
|
|||||||||||||||||
-87-
Table of Contents
| Amortized |
Weighted |
Amortized |
Weighted |
Amortized |
Weighted |
Amortized |
Weighted |
|||||||||||||||||||||||||
| Held-to-maturity |
||||||||||||||||||||||||||||||||
| Obligations of states, municipalities, and political subdivisions |
$ | — | 0.00 | % | $ | 530 | 1.50 | % | $ | 11,938 | 2.44 | % | $ | 12,410 | 2.77 | % | ||||||||||||||||
| Residential mortgage-backed securities |
||||||||||||||||||||||||||||||||
| Agency |
— | 0.00 | % | — | 0.00 | % | — | 0.00 | % | 67,692 | 2.23 | % | ||||||||||||||||||||
| Non-agency |
— | 0.00 | % | — | 0.00 | % | — | 0.00 | % | 46,276 | 3.32 | % | ||||||||||||||||||||
|
|
|
|
|
|
|
|
|
|
|
|
|
|
|
|
|
|||||||||||||||||
| Total |
$ | — | 0.00 | % | $ | 530 | 1.50 | % | $ | 11,938 | 2.44 | % | $ | 126,378 | 2.68 | % | ||||||||||||||||
|
|
|
|
|
|
|
|
|
|
|
|
|
|
|
|
|
|||||||||||||||||
| (1) | The weighted average yields are based on amortized cost. |
| Maturity as of December 31, 2015 |
||||||||||||||||||||||||||||||||
|
Due in One Year or Less |
Due from One to Five Years |
Due from Five to Ten Years |
Due after Ten Years |
|||||||||||||||||||||||||||||
| Amortized |
Weighted |
Amortized |
Weighted |
Amortized |
Weighted |
Amortized |
Weighted |
|||||||||||||||||||||||||
| Available-for-sale |
||||||||||||||||||||||||||||||||
| U.S. Treasury Notes |
$ | — | 0.00 | % | $ | 30,580 | 0.98 | % | $ | — | 0.00 | % | $ | — | 0.00 | % | ||||||||||||||||
| U.S. government agencies |
1,528 | 0.99 | % | 82,840 | 1.39 | % | — | 0.00 | % | — | 0.00 | % | ||||||||||||||||||||
| Obligations of states, municipalities, and political subdivisions |
1,268 | 3.51 | % | 2,169 | 4.72 | % | 7,121 | 4.07 | % | 10,129 | 3.87 | % | ||||||||||||||||||||
| Residential mortgage-backed securities |
||||||||||||||||||||||||||||||||
| Agency |
— | 0.00 | % | — | 0.00 | % | 111,647 | 1.49 | % | 481,744 | 1.95 | % | ||||||||||||||||||||
| Non-agency |
— | 0.00 | % | — | 0.00 | % | — | 0.00 | % | — | 0.00 | % | ||||||||||||||||||||
| Commercial mortgage-backed securities |
||||||||||||||||||||||||||||||||
| Agency |
— | 0.00 | % | — | 0.00 | % | — | 0.00 | % | 31,514 | 2.09 | % | ||||||||||||||||||||
| Non-agency |
— | 0.00 | % | — | 0.00 | % | — | 0.00 | % | — | 0.00 | % | ||||||||||||||||||||
| Corporate securities |
— | 0.00 | % | 5,240 | 1.82 | % | 2,561 | 1.68 | % | — | 0.00 | % | ||||||||||||||||||||
| Other securities |
— | 0.00 | % | — | 0.00 | % | — | 0.00 | % | 5,098 | 1.65 | % | ||||||||||||||||||||
|
|
|
|
|
|
|
|
|
|
|
|
|
|
|
|
|
|||||||||||||||||
| Total |
$ | 2,796 | 2.13 | % | $ | 120,829 | 1.37 | % | $ | 121,329 | 1.64 | % | $ | 528,485 | 2.00 | % | ||||||||||||||||
|
|
|
|
|
|
|
|
|
|
|
|
|
|
|
|
|
|||||||||||||||||
| Amortized |
Weighted |
Amortized |
Weighted |
Amortized |
Weighted |
Amortized |
Weighted |
|||||||||||||||||||||||||
| Held-to-maturity |
||||||||||||||||||||||||||||||||
| Obligations of states, municipalities, and political subdivisions |
$ | — | 0.00 | % | $ | — | 0.00 | % | $ | 11,953 | 2.37 | % | $ | 13,128 | 2.77 | % | ||||||||||||||||
| Residential mortgage-backed securities |
||||||||||||||||||||||||||||||||
| Agency |
— | 0.00 | % | — | 0.00 | % | — | 0.00 | % | 86,379 | 2.16 | % | ||||||||||||||||||||
| Non-agency |
— | 0.00 | % | — | 0.00 | % | — | 0.00 | % | — | 0.00 | % | ||||||||||||||||||||
|
|
|
|
|
|
|
|
|
|
|
|
|
|
|
|
|
|||||||||||||||||
| Total |
$ | — | 0.00 | % | $ | — | 0.00 | % | $ | 11,953 | 2.37 | % | $ | 99,507 | 2.24 | % | ||||||||||||||||
|
|
|
|
|
|
|
|
|
|
|
|
|
|
|
|
|
|||||||||||||||||
| (1) | The weighted average yields are based on amortized cost. |
Total non-taxable securities classified as obligations of states, municipalities and political subdivisions was $19.1 million at March 31, 2017, a decrease of $0.1 million from December 31, 2016.
Total non-taxable securities classified as obligations of states, municipalities and political subdivisions was $19.0 million at December 31, 2016, a decrease of $2.7 million from December 31, 2015.
There were no holdings of securities of any one issuer, other than U.S. government-sponsored entities and agencies, with total outstanding balances greater than 10% of our stockholders’ equity as of March 31, 2017, December 31, 2016 and 2015.
-88-
Table of Contents
Restricted stock
As a member of the Federal Home Loan Bank system, the Company is required to maintain an investment in the capital stock of the FHLB. No market exists for this stock, and it has no quoted market value. The stock is redeemable at par by the FHLB and is, therefore, carried at cost. In addition, the Company owns stock of Bankers’ Bank that was acquired as part of the Ridgestone acquisition. The stock is redeemable at par and carried at cost. As of March 31, 2017, December 31, 2016 and 2015, the Company held $9.5 million, $15.0 million and $7.6 million, respectively, in FHLB and Bankers’ Bank stocks. We evaluate impairment of our investment in FHLB and Bankers’ Bank based on the ultimate recoverability of the par value rather than by recognizing temporary declines in value. We did not identify any indicators of impairment of FHLB and Bankers’ Bank stock as of March 31, 2017, December 31, 2016 and 2015.
-89-
Table of Contents
Loan and lease concentrations
Lending-related income is the most important component of the Company’s net interest income and is the main driver of the results of our operations. Total loans and leases at March 31, 2017 were $2.1 billion compared to $2.1 billion as of December 31, 2016. Total loans and leases at December 31, 2016 and December 31, 2015 were $2.1 billion and $1.3 billion, respectively, an increase of $802.6 million or 59.7%. This growth in the loan portfolio is due to the Ridgestone acquisition and increased market penetration through organic growth, as well as the addition of experienced lending officers, including the recent addition of a team of experienced sponsor finance lenders with over 50 years of combined experience. We plan to maintain a relatively diversified loan portfolio to help reduce the risk inherent in concentration in certain types of collateral. The following table shows the Company’s allocation of originated, acquired impaired and acquired non-impaired loans as of the dates presented (dollars in thousands):
| (unaudited) March 31, 2017 |
December 31, 2016 |
December 31, 2015 |
||||||||||||||||||||||
| Amount |
% of Total |
Amount |
% of Total |
Amount |
% of Total |
|||||||||||||||||||
| Originated loans |
||||||||||||||||||||||||
| Commercial real estate |
$ | 380,292 | 18 | % | $ | 338,752 | 16 | % | $ | 201,586 | 15 | % | ||||||||||||
| Residential real estate |
391,940 | 18 | % | 394,168 | 18 | % | 215,388 | 16 | % | |||||||||||||||
| Construction, land development, and other land |
89,466 | 4 | % | 119,357 | 6 | % | 29,225 | 2 | % | |||||||||||||||
| Commercial and industrial |
323,422 | 15 | % | 309,097 | 14 | % | 146,858 | 11 | % | |||||||||||||||
| Installment and other |
2,016 | 0 | % | 2,021 | 0 | % | 544 | 0 | % | |||||||||||||||
| Leasing financing receivables |
128,666 | 6 | % | 118,493 | 6 | % | 69,416 | 5 | % | |||||||||||||||
|
|
|
|
|
|
|
|
|
|
|
|
|
|||||||||||||
| Total originated loans |
$ | 1,315,802 | 61 | % | $ | 1,281,888 | 60 | % | $ | 663,017 | 49 | % | ||||||||||||
|
|
|
|
|
|
|
|
|
|
|
|
|
|||||||||||||
| Acquired impaired loans |
||||||||||||||||||||||||
| Commercial real estate |
$ | 201,689 | 9 | % | $ | 207,303 | 10 | % | $ | 243,964 | 18 | % | ||||||||||||
| Residential real estate |
169,676 | 8 | % | 175,717 | 8 | % | 223,738 | 16 | % | |||||||||||||||
| Construction, land development, and other land |
6,116 | 0 | % | 6,979 | 0 | % | 8,634 | 1 | % | |||||||||||||||
| Commercial and industrial |
13,114 | 1 | % | 13,464 | 1 | % | 9,570 | 1 | % | |||||||||||||||
| Installment and other |
439 | 0 | % | 574 | 0 | % | 1,005 | 0 | % | |||||||||||||||
|
|
|
|
|
|
|
|
|
|
|
|
|
|||||||||||||
| Total acquired impaired loans |
$ | 391,034 | 18 | % | $ | 404,037 | 19 | % | $ | 486,911 | 36 | % | ||||||||||||
|
|
|
|
|
|
|
|
|
|
|
|
|
|||||||||||||
| Acquired non-impaired loans |
||||||||||||||||||||||||
| Commercial real estate |
$ | 240,869 | 11 | % | $ | 250,289 | 11 | % | $ | 88,146 | 7 | % | ||||||||||||
| Residential real estate |
39,791 | 2 | % | 40,853 | 2 | % | 45,208 | 3 | % | |||||||||||||||
| Construction, land development, and other land |
9,733 | 1 | % | 14,430 | 1 | % | 2,373 | 0 | % | |||||||||||||||
| Commercial and industrial |
111,931 | 5 | % | 115,677 | 5 | % | 9,268 | 1 | % | |||||||||||||||
| Installment and other |
365 | 0 | % | 364 | 0 | % | 377 | 0 | % | |||||||||||||||
| Leasing financing receivables |
34,009 | 2 | % | 40,473 | 2 | % | 50,137 | 4 | % | |||||||||||||||
|
|
|
|
|
|
|
|
|
|
|
|
|
|||||||||||||
| Total acquired non-impaired loans |
$ | 436,698 | 21 | % | $ | 462,086 | 21 | % | $ | 195,509 | 15 | % | ||||||||||||
|
|
|
|
|
|
|
|
|
|
|
|
|
|||||||||||||
| Total loans |
$ | 2,143,534 | $ | 2,148,011 | $ | 1,345,437 | ||||||||||||||||||
|
|
|
|
|
|
|
|
|
|
|
|
|
|||||||||||||
| Allowance for loan and lease losses |
(11,817 | ) | (10,923 | ) | (7,632 | ) | ||||||||||||||||||
|
|
|
|
|
|
|
|
|
|
|
|
|
|||||||||||||
| Total loans, net allowance for loan losses |
$ | 2,131,717 | 100 | % | $ | 2,137,088 | 100 | % | $ | 1,337,805 | 100 | % | ||||||||||||
|
|
|
|
|
|
|
|
|
|
|
|
|
|||||||||||||
Loans, net of acquisition accounting adjustments, acquired from Ridgestone totaled $351.8 million.
Total loan and lease portfolio was $2.1 billion as of March 31, 2017, relatively unchanged when compared to December 31, 2016 due to seasonality and payoffs of acquired loans. During 2016, the Company
-90-
Table of Contents
experienced growth in real estate loans of 46.3%, with 249.9%, 49.2%, and 26.1% growth occurring in the construction and land development, commercial real estate and residential real estate loan portfolios, respectively. The commercial and industrial loan portfolios also experienced strong growth of 164.5% during 2016. The loan growth for 2016 was driven by the additional banking professionals and the Ridgestone acquisition.
Real estate loans comprised 71.4% and 72.1% of the loan and lease portfolio at March 31, 2017 and December 31, 2016, respectively. The largest portion of the real estate loan portfolio as of March 31, 2017 and December 31, 2016 was commercial real estate loans. At March 31, 2017, commercial real estate loans totaled $822.9 million and comprised 53.8% of real estate loans and 38.4% of the total loan and lease portfolio. At December 31, 2016, commercial real estate loans totaled $796.3 million and comprised 51.4% of real estate loans and 37.1% of the total loan and lease portfolio. During 2016, the commercial real estate loan portfolio increased by 49.2% from $533.7 million at December 31, 2015.
Residential real estate loans totaled $601.4 million at March 31, 2017 compared to $610.7 million at December 31, 2016, a decrease of $9.3 million or 1.5%. During 2016, the portfolio increased from $484.3 million at December 31, 2015, which is an increase of 26.1% or $126.4 million. The residential real estate loan portfolio comprised 39.3% and 39.5% of real estate loans as of March 31, 2017 and December 31, 2016, respectively, and 28.1% and 28.4% of total loans and leases at March 31, 2017 and December 31, 2016, respectively. Acquired residential impaired real estate loans continue to decrease from $223.7 million as of December 31, 2015 to $175.7 million as of December 31, 2016, a decrease of 21.5%, and further decreased to $169.7 million as of March 31, 2017, a decrease of 3.4% from December 31, 2016.
Construction, land development and other land loans totaled $105.3 million at March 31, 2017 compared to $140.8 million at December 31, 2016, a decrease of $35.5 million or 25.2%. During 2016, the portfolio increased by $100.5 million or 249.9% compared to $40.2 million at December 31, 2015. The construction, land development and other land loan portfolio comprised 6.9% and 9.1% of real estate loans as of March 31, 2017 and December 31, 2016, respectively, and 4.9% and 6.6% of the total loan and lease portfolio as of March 31, 2017 and December 31, 2016, respectively. The growth during 2016 was primarily due to the acquisition of Ridgestone and an increase in real estate construction projects.
Commercial and industrial loans totaled $448.5 million and $438.2 million at March 31, 2017 and December 31, 2016, respectively, compared to $165.7 million at December 31, 2015. During 2016, the portfolio increased by $272.5 million or 164.5% due to the Ridgestone acquisition and organic commercial growth. The commercial and industrial loan portfolio comprised 20.9% and 20.4% of the total loan and lease portfolio as of March 31, 2017 and December 31, 2016, respectively.
Lease financing receivables comprised 7.6% and 7.4% of the loan and lease portfolio as of March 31, 2017 and December 31, 2016, respectively. Total lease financing receivables were $162.7 million and $159.0 million at March 31, 2017 and December 31, 2016, respectively, compared to $119.6 million at December 31, 2015. During 2016, the portfolio increased by $39.4 million or 33.0% due to continued growth in our small-ticket vendor sales channels, and our increased syndication activities.
-91-
Table of Contents
Loan portfolio maturities and interest rate sensitivity
The following table shows our loan and lease portfolio by scheduled maturity at March 31, 2017 (dollars in thousands) (unaudited):
|
Due in One Year or Less |
Due after One Year |
Due after Five Years |
||||||||||||||||||||||||||
| Fixed Rate |
Floating |
Fixed |
Floating |
Fixed Rate |
Floating |
Total |
||||||||||||||||||||||
| Originated loans |
||||||||||||||||||||||||||||
| Commercial real estate |
$ | 1,806 | $ | 35,248 | $ | 109,891 | $ | 157,636 | $ | 18,360 | $ | 57,351 | $ | 380,292 | ||||||||||||||
| Residential real estate |
7,612 | 3,814 | 74,869 | 42,980 | 244,827 | 17,838 | 391,940 | |||||||||||||||||||||
| Construction, land development, and other land |
1,850 | 25,829 | — | 51,541 | 2,135 | 8,111 | 89,466 | |||||||||||||||||||||
| Commercial and industrial |
10,526 | 64,769 | 16,957 | 162,758 | 2,307 | 66,105 | 323,422 | |||||||||||||||||||||
| Installment and other |
11 | 950 | 570 | — | 485 | — | 2,016 | |||||||||||||||||||||
| Leasing financing receivables |
2,290 | — | 114,257 | — | 12,119 | — | 128,666 | |||||||||||||||||||||
|
|
|
|
|
|
|
|
|
|
|
|
|
|
|
|||||||||||||||
| Total originated loans |
$ | 24,095 | $ | 130,610 | $ | 316,544 | $ | 414,915 | $ | 280,233 | $ | 149,405 | $ | 1,315,802 | ||||||||||||||
|
|
|
|
|
|
|
|
|
|
|
|
|
|
|
|||||||||||||||
| Acquired impaired loans |
||||||||||||||||||||||||||||
| Commercial real estate |
$ | 57,380 | $ | 455 | $ | 123,684 | $ | 438 | $ | 5,318 | $ | 14,414 | $ | 201,689 | ||||||||||||||
| Residential real estate |
40,436 | 539 | 101,282 | 2,566 | 24,661 | 192 | 169,676 | |||||||||||||||||||||
| Construction, land development, and other land |
2,405 | 243 | 3,020 | — | — | 448 | 6,116 | |||||||||||||||||||||
| Commercial and industrial |
3,165 | 363 | 1,404 | 307 | 2,480 | 5,395 | 13,114 | |||||||||||||||||||||
| Installment and other |
59 | 33 | 189 | — | 158 | — | 439 | |||||||||||||||||||||
|
|
|
|
|
|
|
|
|
|
|
|
|
|
|
|||||||||||||||
| Total acquired impaired loans |
$ | 103,445 | $ | 1,633 | $ | 229,579 | $ | 3,311 | $ | 32,617 | $ | 20,449 | $ | 391,034 | ||||||||||||||
|
|
|
|
|
|
|
|
|
|
|
|
|
|
|
|||||||||||||||
| Acquired non-impaired loans |
||||||||||||||||||||||||||||
| Commercial real estate |
$ | 19,349 | $ | 2,385 | $ | 52,513 | $ | 3,359 | $ | 1,042 | $ | 162,221 | $ | 240,869 | ||||||||||||||
| Residential real estate |
8,368 | 2,818 | 13,789 | 13,099 | 1,175 | 542 | 39,791 | |||||||||||||||||||||
| Construction, land development, and other land |
699 | — | 1,698 | — | — | 7,336 | 9,733 | |||||||||||||||||||||
| Commercial and industrial |
3,308 | 6,626 | 1,896 | 8,563 | 298 | 91,240 | 111,931 | |||||||||||||||||||||
| Installment and other |
38 | 327 | — | — | — | — | 365 | |||||||||||||||||||||
| Leasing financing receivables |
3,521 | — | 29,085 | — | 1,403 | — | 34,009 | |||||||||||||||||||||
|
|
|
|
|
|
|
|
|
|
|
|
|
|
|
|||||||||||||||
| Total acquired non-impaired loans |
$ | 35,283 | $ | 12,156 | $ | 98,981 | $ | 25,021 | $ | 3,918 | $ | 261,339 | $ | 436,698 | ||||||||||||||
|
|
|
|
|
|
|
|
|
|
|
|
|
|
|
|||||||||||||||
| Total loans |
$ | 162,823 | $ | 144,399 | $ | 645,104 | $ | 443,247 | $ | 316,768 | $ | 431,193 | $ | 2,143,534 | ||||||||||||||
|
|
|
|
|
|
|
|
|
|
|
|
|
|
|
|||||||||||||||
As of March 31, 2017, 52% of the loan and lease portfolio bears interest at fixed rates and 48% at floating rates. The expected life of our loan portfolio will differ from contractual maturities because borrowers may have the right to curtail or prepay their loans with or without penalties. Because a portion of the portfolio is accounted for under ASC 310-30, the carrying value is significantly affected by estimates and it is impracticable to allocate scheduled payments for those loans based on those estimates. Consequently, the tables above include information limited to contractual maturities of the underlying loans.
Allowance for loan and lease losses
The ALLL is determined by the Company on a quarterly basis, although we are engaged in monitoring the appropriate level of the allowance on a more frequent basis. The ALLL reflects management’s estimate of probable incurred credit losses inherent in the loan portfolio. The computation includes element of judgement and high levels of subjectivity.
-92-
Table of Contents
Factors considered by the Company include, but are not limited to, actual loss experience, peer loss experience, changes in size and risk profile of the portfolio, identification of individual problem loan and lease situations which may affect a borrower’s ability to repay and evaluation of the prevailing economic conditions. Changes in conditions may necessitate revision of the estimate in future periods.
The Company assesses the ALLL based on three categories: (i) originated loans and leases, (ii) acquired non-impaired loans and leases and (iii) acquired impaired loans with further credit deterioration after the acquisition or the Recapitalization.
Total ALLL was $11.8 million at March 31, 2017 compared to $10.9 million at December 31, 2016, an increase of $0.9 million, or 8.2%. The increase was primarily due to the change in loan mix, with the originated portfolio increasing by $33.9 million to $1.3 billion at March 31, 2017 and the acquired (impaired and non-impaired) portfolio decreasing by $38.4 million for the same period.
Total ALLL was $10.9 million at December 31, 2016 compared to $7.6 million at December 31, 2015, an increase of $3.3 million, or 43.1%. The increase was primarily due to the overall portfolio growth, increased weighting of the qualitative factors, and adjustments of new origination assumptions to better align the ALLL with the loan portfolio’s risk profile.
Total ALLL accounts for 0.55%, 0.51%, and 0.57% of total loans and leases at March 31, 2017, December 31, 2016 and 2015, respectively. This ratio is generally below the median of our peer banks, as the Company valued significant amounts of acquired loans at fair value as a result of either the Recapitalization or the Ridgestone acquisition, which, management believes, limits the amount of reserves needed to cover these loans as of March 31, 2017, December 31, 2016 and 2015. Acquisition accounting adjustments remaining balances resulting from the Recapitalization and the Ridgestone acquisition were $41.0 million, $43.2 million and $19.2 million as of March 31, 2017, December 31, 2016 and December 31, 2015, respectively.
-93-
Table of Contents
The following table presents an analysis of the allowance of the loan and lease losses for the periods presented (dollars in thousands, data at and for the periods ended March 31, 2016 and 2017 is unaudited):
| Commercial |
Residential |
Construction |
Commercial |
Installment |
Lease |
Total |
||||||||||||||||||||||
| Balance at December 31, 2016 |
$ | 1,945 | $ | 2,483 | $ | 742 | $ | 4,196 | $ | 334 | $ | 1,223 | $ | 10,923 | ||||||||||||||
| Provision for acquired impaired loans |
174 | 275 | — | 46 | — | — | 495 | |||||||||||||||||||||
| Provision for acquired non-impaired loans and leases |
(13 | ) | (2 | ) | 23 | 728 | (2 | ) | 170 | 904 | ||||||||||||||||||
| Provision for originated loans and leases |
179 | (272 | ) | (348 | ) | 81 | (1 | ) | 853 | 492 | ||||||||||||||||||
|
|
|
|
|
|
|
|
|
|
|
|
|
|
|
|||||||||||||||
| Total provision |
$ | 340 | $ | 1 | $ | (325 | ) | $ | 855 | $ | (3 | ) | $ | 1,023 | $ | 1,891 | ||||||||||||
|
|
|
|
|
|
|
|
|
|
|
|
|
|
|
|||||||||||||||
| Charge-offs for acquired impaired loans |
(238 | ) | (57 | ) | — | (60 | ) | — | — | (355 | ) | |||||||||||||||||
| Charge-offs for acquired non-impaired loans and leases |
— | (10 | ) | — | (155 | ) | — | (284 | ) | (449 | ) | |||||||||||||||||
| Charge-offs for originated loans and leases |
— | — | — | — | — | (486 | ) | (486 | ) | |||||||||||||||||||
|
|
|
|
|
|
|
|
|
|
|
|
|
|
|
|||||||||||||||
| Total charge-offs |
$ | (238 | ) | $ | (67 | ) | $ | — | $ | (215 | ) | $ | — | $ | (770 | ) | $ | (1,290 | ) | |||||||||
|
|
|
|
|
|
|
|
|
|
|
|
|
|
|
|||||||||||||||
| Recoveries for acquired impaired loans |
— | — | — | — | — | — | — | |||||||||||||||||||||
| Recoveries for acquired non-impaired loans and leases |
— | — | — | — | — | 167 | 167 | |||||||||||||||||||||
| Recoveries for originated loans and leases |
— | — | — | — | — | 126 | 126 | |||||||||||||||||||||
|
|
|
|
|
|
|
|
|
|
|
|
|
|
|
|||||||||||||||
| Total recoveries |
$ | — | $ | — | $ | — | $ | — | $ | — | $ | 293 | $ | 293 | ||||||||||||||
|
|
|
|
|
|
|
|
|
|
|
|
|
|
|
|||||||||||||||
| Net charge-offs (recoveries) |
238 | 67 | — | 215 | — | 477 | 997 | |||||||||||||||||||||
|
|
|
|
|
|
|
|
|
|
|
|
|
|
|
|||||||||||||||
| Acquired impaired loans |
425 | 665 | — | 660 | 1 | — | 1,751 | |||||||||||||||||||||
| Acquired non-impaired loans and leases |
102 | 332 | 33 | 647 | 326 | 331 | 1,771 | |||||||||||||||||||||
| Originated loans and leases |
1,520 | 1,420 | 384 | 3,529 | 4 | 1,438 | 8,295 | |||||||||||||||||||||
|
|
|
|
|
|
|
|
|
|
|
|
|
|
|
|||||||||||||||
| Balance at March 31, 2017 |
$ | 2,047 | $ | 2,417 | $ | 417 | $ | 4,836 | $ | 331 | $ | 1,769 | $ | 11,817 | ||||||||||||||
|
|
|
|
|
|
|
|
|
|
|
|
|
|
|
|||||||||||||||
| Ending ALLL balance |
||||||||||||||||||||||||||||
| Acquired impaired loans |
$ | 425 | $ | 665 | $ | — | $ | 660 | $ | 1 | $ | — | $ | 1,751 | ||||||||||||||
| Acquired non-impaired loans and leases and originated loans and leases individually evaluated for impairment |
— | 282 | 26 | 966 | 325 | — | 1,599 | |||||||||||||||||||||
| Acquired non-impaired loans and leases and originated loans and leases collectively evaluated for impairment |
1,622 | 1,470 | 391 | 3,210 | 5 | 1,769 | 8,467 | |||||||||||||||||||||
| Loans and leases ending balance |
||||||||||||||||||||||||||||
| Acquired impaired loans |
$ | 201,689 | $ | 169,676 | $ | 6,116 | $ | 13,114 | $ | 439 | $ | — | $ | 391,034 | ||||||||||||||
| Acquired non-impaired loans and leases and originated loans and leases individually evaluated for impairment |
9,764 | 1,262 | 85 | 3,317 | 327 | — | 14,755 | |||||||||||||||||||||
| Acquired non-impaired loans and leases and originated loans and leases collectively evaluated for impairment |
611,397 | 430,469 | 99,114 | 432,036 | 2,054 | 162,675 | 1,737,745 | |||||||||||||||||||||
|
|
|
|
|
|
|
|
|
|
|
|
|
|
|
|||||||||||||||
| Total loans and leases at March 31, 2017, gross |
$ | 822,850 | $ | 601,407 | $ | 105,315 | $ | 448,467 | $ | 2,820 | $ | 162,675 | $ | 2,143,534 | ||||||||||||||
|
|
|
|
|
|
|
|
|
|
|
|
|
|
|
|||||||||||||||
| Ratio of net charge-offs to average loans and leases outstanding during the year |
||||||||||||||||||||||||||||
| Acquired impaired loans |
0.05 | % | 0.01 | % | 0.00 | % | 0.01 | % | 0.00 | % | 0.00 | % | 0.07 | % | ||||||||||||||
| Acquired non-impaired loans and leases |
0.00 | % | 0.00 | % | 0.00 | % | 0.03 | % | 0.00 | % | 0.02 | % | 0.05 | % | ||||||||||||||
| Originated loans and leases |
0.00 | % | 0.00 | % | 0.00 | % | 0.00 | % | 0.00 | % | 0.07 | % | 0.07 | % | ||||||||||||||
| Loans ending balance as a percentage of total loans, gross |
||||||||||||||||||||||||||||
| Acquired impaired loans |
9.41 | % | 7.91 | % | 0.29 | % | 0.61 | % | 0.02 | % | 0.00 | % | 18.24 | % | ||||||||||||||
| Acquired non-impaired loans and leases and originated loans and leases individually evaluated for impairment |
0.46 | % | 0.06 | % | 0.00 | % | 0.15 | % | 0.02 | % | 0.00 | % | 0.69 | % | ||||||||||||||
| Acquired non-impaired loans and leases and originated loans and leases collectively evaluated for impairment |
28.52 | % | 20.08 | % | 4.62 | % | 20.16 | % | 0.10 | % | 7.59 | % | 81.07 | % | ||||||||||||||
-94-
Table of Contents
|
Commercial |
Residential |
Construction |
Commercial |
Installment |
Lease |
Total |
||||||||||||||||||||||
| Balance at December 31, 2015 |
$ | 2,280 | $ | 2,981 | $ | 232 | $ | 1,403 | $ | 357 | $ | 379 | $ | 7,632 | ||||||||||||||
| Provision for acquired impaired loans |
1,039 | 616 | 7 | 85 | 5 | — | 1,752 | |||||||||||||||||||||
| Provision for acquired non-impaired loans and leases |
214 | (42 | ) | — | 3 | — | 397 | 572 | ||||||||||||||||||||
| Provision for originated loans and leases |
11 | (72 | ) | 83 | (139 | ) | — | 306 | 189 | |||||||||||||||||||
|
|
|
|
|
|
|
|
|
|
|
|
|
|
|
|||||||||||||||
| Total provision |
$ | 1,264 | $ | 502 | $ | 90 | $ | (51 | ) | $ | 5 | $ | 703 | $ | 2,513 | |||||||||||||
|
|
|
|
|
|
|
|
|
|
|
|
|
|
|
|||||||||||||||
| Charge-offs for acquired impaired loans |
(1,156 | ) | (370 | ) | — | — | — | — | (1,526 | ) | ||||||||||||||||||
| Charge-offs for acquired non-impaired loans and leases |
3 | (163 | ) | — | (3 | ) | — | (516 | ) | (679 | ) | |||||||||||||||||
| Charge-offs for originated loans and leases |
— | — | — | — | — | (166 | ) | (166 | ) | |||||||||||||||||||
|
|
|
|
|
|
|
|
|
|
|
|
|
|
|
|||||||||||||||
| Total charge-offs |
$ | (1,153 | ) | $ | (533 | ) | $ | — | $ | (3 | ) | $ | — | $ | (682 | ) | $ | (2,371 | ) | |||||||||
|
|
|
|
|
|
|
|
|
|
|
|
|
|
|
|||||||||||||||
| Recoveries for acquired impaired loans |
— | — | — | — | — | — | — | |||||||||||||||||||||
| Recoveries for acquired non-impaired loans and leases |
— | — | — | — | — | 110 | 110 | |||||||||||||||||||||
| Recoveries for originated loans and leases |
— | — | — | — | — | 19 | 19 | |||||||||||||||||||||
|
|
|
|
|
|
|
|
|
|
|
|
|
|
|
|||||||||||||||
| Total recoveries |
$ | — | $ | — | $ | — | $ | — | $ | — | $ | 129 | $ | 129 | ||||||||||||||
|
|
|
|
|
|
|
|
|
|
|
|
|
|
|
|||||||||||||||
| Net charge-offs (recoveries) |
1,153 | 533 | — | 3 | — | 553 | 2,242 | |||||||||||||||||||||
|
|
|
|
|
|
|
|
|
|
|
|
|
|
|
|||||||||||||||
| Acquired impaired loans |
617 | 2,136 | 7 | 721 | 35 | — | 3,516 | |||||||||||||||||||||
| Acquired non-impaired loans and leases |
1,408 | 378 | — | 49 | 327 | 150 | 2,312 | |||||||||||||||||||||
| Originated loans and leases |
366 | 436 | 315 | 579 | — | 379 | 2,075 | |||||||||||||||||||||
|
|
|
|
|
|
|
|
|
|
|
|
|
|
|
|||||||||||||||
| Balance at March 31, 2016 |
$ | 2,391 | $ | 2,950 | $ | 322 | $ | 1,349 | $ | 362 | $ | 529 | $ | 7,903 | ||||||||||||||
|
|
|
|
|
|
|
|
|
|
|
|
|
|
|
|||||||||||||||
| Ending ALLL balance |
||||||||||||||||||||||||||||
| Acquired impaired loans |
$ | 617 | $ | 2,136 | $ | 7 | $ | 721 | $ | 35 | $ | — | $ | 3,516 | ||||||||||||||
| Acquired non-impaired loans and leases and originated loans and leases individually evaluated for impairment |
1,309 | 380 | 137 | 163 | 327 | — | 2,316 | |||||||||||||||||||||
| Acquired non-impaired loans and leases and originated loans and leases collectively evaluated for impairment |
465 | 434 | 178 | 465 | — | 529 | 2,071 | |||||||||||||||||||||
| Loans and leases ending balance |
||||||||||||||||||||||||||||
| Acquired impaired loans |
$ | 205,385 | $ | 207,536 | $ | 7,545 | $ | 7,462 | $ | 947 | $ | — | $ | 428,875 | ||||||||||||||
| Acquired non-impaired loans and leases and originated loans and leases individually evaluated for impairment |
6,943 | 3,335 | 208 | 213 | 327 | — | 11,026 | |||||||||||||||||||||
| Acquired non-impaired loans and leases and originated loans and leases collectively evaluated for impairment |
295,297 | 441,539 | 46,041 | 156,496 | 649 | 123,572 | 1,063,594 | |||||||||||||||||||||
|
|
|
|
|
|
|
|
|
|
|
|
|
|
|
|||||||||||||||
| Total loans and leases at March 31, 2016, gross |
$ | 507,625 | $ | 652,410 | $ | 53,794 | $ | 164,171 | $ | 1,923 | $ | 123,572 | $ | 1,503,495 | ||||||||||||||
|
|
|
|
|
|
|
|
|
|
|
|
|
|
|
|||||||||||||||
| Ratio of net charge-offs to average loans and leases outstanding during the year |
||||||||||||||||||||||||||||
| Acquired impaired loans |
0.32 | % | 0.10 | % | 0.00 | % | 0.00 | % | 0.00 | % | 0.00 | % | 0.42 | % | ||||||||||||||
| Acquired non-impaired loans and leases |
0.00 | % | 0.05 | % | 0.00 | % | 0.00 | % | 0.00 | % | 0.11 | % | 0.16 | % | ||||||||||||||
| Originated loans and leases |
0.00 | % | 0.00 | % | 0.00 | % | 0.00 | % | 0.00 | % | 0.04 | % | 0.04 | % | ||||||||||||||
| Loans ending balance as a percentage of total loans, gross |
||||||||||||||||||||||||||||
| Acquired impaired loans |
13.66 | % | 13.80 | % | 0.50 | % | 0.50 | % | 0.07 | % | 0.00 | % | 28.53 | % | ||||||||||||||
| Acquired non-impaired loans and leases and originated loans and leases individually evaluated for impairment |
0.46 | % | 0.22 | % | 0.01 | % | 0.02 | % | 0.02 | % | 0.00 | % | 0.73 | % | ||||||||||||||
| Acquired non-impaired loans and leases and originated loans and leases collectively evaluated for impairment |
19.64 | % | 29.37 | % | 3.06 | % | 10.41 | % | 0.04 | % | 8.22 | % | 70.74 | % | ||||||||||||||
-95-
Table of Contents
| Commercial |
Residential |
Construction |
Commercial |
Installment |
Lease |
Total |
||||||||||||||||||||||
| Balance at December 31, 2015 |
$ | 2,280 | $ | 2,981 | $ | 232 | $ | 1,403 | $ | 357 | $ | 379 | $ | 7,632 | ||||||||||||||
| Provision for acquired impaired loans |
3,011 | (981 | ) | — | 111 | (37 | ) | — | 2,104 | |||||||||||||||||||
| Provision for acquired non-impaired loans and leases |
35 | (68 | ) | 105 | 28 | 2 | 844 | 946 | ||||||||||||||||||||
| Provision for originated loans and leases |
986 | 1,184 | 500 | 2,730 | 24 | 1,878 | 7,302 | |||||||||||||||||||||
|
|
|
|
|
|
|
|
|
|
|
|
|
|
|
|||||||||||||||
| Total provision |
$ | 4,032 | $ | 135 | $ | 605 | $ | 2,869 | $ | (11 | ) | $ | 2,722 | $ | 10,352 | |||||||||||||
|
|
|
|
|
|
|
|
|
|
|
|
|
|
|
|||||||||||||||
| Charge-offs for acquired impaired loans |
(3,256 | ) | (462 | ) | — | (73 | ) | 8 | — | (3,783 | ) | |||||||||||||||||
| Charge-offs for acquired non-impaired loans and leases |
(1,111 | ) | (171 | ) | (95 | ) | (3 | ) | (1 | ) | (1,275 | ) | (2,656 | ) | ||||||||||||||
| Charge-offs for originated loans and leases |
— | — | — | — | (19 | ) | (1,359 | ) | (1,378 | ) | ||||||||||||||||||
|
|
|
|
|
|
|
|
|
|
|
|
|
|
|
|||||||||||||||
| Total charge-offs |
$ | (4,367 | ) | $ | (633 | ) | $ | (95 | ) | $ | (76 | ) | $ | (12 | ) | $ | (2,634 | ) | $ | (7,817 | ) | |||||||
|
|
|
|
|
|
|
|
|
|
|
|
|
|
|
|||||||||||||||
| Recoveries for acquired impaired loans |
— | — | — | — | — | — | — | |||||||||||||||||||||
| Recoveries for acquired non-impaired loans and leases |
— | — | — | — | — | 550 | 550 | |||||||||||||||||||||
| Recoveries for originated loans and leases |
— | — | — | — | — | 206 | 206 | |||||||||||||||||||||
|
|
|
|
|
|
|
|
|
|
|
|
|
|
|
|||||||||||||||
| Total recoveries |
$ | — | $ | — | $ | — | $ | — | $ | — | $ | 756 | $ | 756 | ||||||||||||||
|
|
|
|
|
|
|
|
|
|
|
|
|
|
|
|||||||||||||||
| Net charge-offs (recoveries) |
4,367 | 633 | 95 | 76 | 12 | 1,878 | 7,061 | |||||||||||||||||||||
|
|
|
|
|
|
|
|
|
|
|
|
|
|
|
|||||||||||||||
| Acquired impaired loans |
489 | 447 | — | 674 | 1 | — | 1,611 | |||||||||||||||||||||
| Acquired non-impaired loans and leases |
115 | 344 | 10 | 74 | 328 | 278 | 1,149 | |||||||||||||||||||||
| Originated loans and leases |
1,341 | 1,692 | 732 | 3,448 | 5 | 945 | 8,163 | |||||||||||||||||||||
|
|
|
|
|
|
|
|
|
|
|
|
|
|
|
|||||||||||||||
| Balance at December 31, 2016 |
$ | 1,945 | $ | 2,483 | $ | 742 | $ | 4,196 | $ | 334 | $ | 1,223 | $ | 10,923 | ||||||||||||||
|
|
|
|
|
|
|
|
|
|
|
|
|
|
|
|||||||||||||||
| Ending ALLL balance |
||||||||||||||||||||||||||||
| Acquired impaired loans |
$ | 489 | $ | 447 | $ | — | $ | 674 | $ | 1 | $ | — | $ | 1,611 | ||||||||||||||
| Acquired non-impaired loans and leases and originated loans and leases individually evaluated for impairment |
— | 293 | — | 396 | 328 | — | 1,017 | |||||||||||||||||||||
| Acquired non-impaired loans and leases and originated loans and leases collectively evaluated for impairment |
1,456 | 1,743 | 742 | 3,126 | 5 | 1,223 | 8,295 | |||||||||||||||||||||
| Loans and leases ending balance |
||||||||||||||||||||||||||||
| Acquired impaired loans |
$ | 207,303 | $ | 175,717 | $ | 6,979 | $ | 13,464 | $ | 574 | $ | — | $ | 404,037 | ||||||||||||||
| Acquired non-impaired loans and leases and originated loans and leases individually evaluated for impairment |
8,916 | 1,300 | — | 1,382 | 328 | — | 11,926 | |||||||||||||||||||||
| Acquired non-impaired loans and leases and originated loans and leases collectively evaluated for impairment |
580,125 | 433,721 | 133,787 | 423,392 | 2,057 | 158,966 | 1,732,048 | |||||||||||||||||||||
|
|
|
|
|
|
|
|
|
|
|
|
|
|
|
|||||||||||||||
| Total loans and leases at December 31, 2016, gross |
$ | 796,344 | $ | 610,738 | $ | 140,766 | $ | 438,238 | $ | 2,959 | $ | 158,966 | $ | 2,148,011 | ||||||||||||||
|
|
|
|
|
|
|
|
|
|
|
|
|
|
|
|||||||||||||||
| Ratio of net charge-offs to average loans and leases outstanding during the year |
||||||||||||||||||||||||||||
| Acquired impaired loans |
0.19 | % | 0.03 | % | 0.00 | % | 0.00 | % | 0.00 | % | 0.00 | % | 0.23 | % | ||||||||||||||
| Acquired non-impaired loans and leases |
0.07 | % | 0.01 | % | 0.01 | % | 0.00 | % | 0.00 | % | 0.04 | % | 0.13 | % | ||||||||||||||
| Originated loans and leases |
0.00 | % | 0.00 | % | 0.00 | % | 0.00 | % | 0.00 | % | 0.07 | % | 0.07 | % | ||||||||||||||
| Loans ending balance as a percentage of total loans, gross |
||||||||||||||||||||||||||||
| Acquired impaired loans |
9.65 | % | 8.18 | % | 0.32 | % | 0.63 | % | 0.03 | % | 0.00 | % | 18.81 | % | ||||||||||||||
| Acquired non-impaired loans and leases and originated loans and leases individually evaluated for impairment |
0.42 | % | 0.06 | % | 0.00 | % | 0.06 | % | 0.02 | % | 0.00 | % | 0.56 | % | ||||||||||||||
| Acquired non-impaired loans and leases and originated loans and leases collectively evaluated for impairment |
27.01 | % | 20.19 | % | 6.23 | % | 19.71 | % | 0.10 | % | 7.40 | % | 80.63 | % | ||||||||||||||
-96-
Table of Contents
Non-performing assets
Non-performing loans and leases include loans and leases 90 days past due and still accruing, loans and leases accounted for on a non-accrual basis and accruing restructured loans. Non-performing assets consist of non-performing loans and leases plus OREO (i.e. real estate acquired through foreclosure or deed in lieu of foreclosure).
Non-accrual loans and leases as of March 31, 2017, December 31, 2016 and 2015 totaled $7.8 million, $6.8 million and $7.4 million, respectively.
Total OREO held by the Company was $13.2 million as of March 31, 2017, a decrease of $3.4 million from December 31, 2016. The decrease in OREO resulted from dispositions of $3.9 million and valuation adjustments of $276,000, offset by net additions to OREO through loan foreclosures totaling $799,000.
Total OREO held by the Company decreased from $26.7 million as of December 31, 2015 to $16.6 million as of December 31, 2016. The $10.1 million decrease in OREO for the year ended December 31, 2016 resulted from the disposition of OREO of $17.4 million and valuation adjustments of $953,000 offset by additional OREO resulting from the acquisition of Ridgestone of $1.5 million and net additions through loan foreclosures of $6.7 million.
The following table sets forth the amounts of non-performing loans and leases, non-performing assets, and OREO at the dates indicated (dollars in thousands):
| (unaudited) | ||||||||||||
| March 31, |
December 31, |
December 31, |
||||||||||
| Non-accrual loans and leases(1)(2)(3) |
$ | 7,843 | $ | 6,784 | $ | 7,402 | ||||||
| Past due loans and leases 90 days or more and still accruing interest |
— | — | — | |||||||||
| Accruing troubled debt restructured loans |
1,004 | 602 | 1,909 | |||||||||
|
|
|
|
|
|
|
|||||||
| Total non-performing loans and leases |
8,847 | 7,386 | 9,311 | |||||||||
| Other real estate owned |
13,173 | 16,570 | 26,715 | |||||||||
|
|
|
|
|
|
|
|||||||
| Total non-performing assets |
$ | 22,020 | $ | 23,956 | $ | 36,026 | ||||||
|
|
|
|
|
|
|
|||||||
| Total non-performing loans as a percentage of total loans and leases |
0.41 | % | 0.34 | % | 0.69 | % | ||||||
| Total non-performing assets as a percentage of total assets |
0.67 | % | 0.73 | % | 1.45 | % | ||||||
| Allowance for loan and lease losses as a percentage of non-performing loans and leases |
133.57 | % | 147.88 | % | 81.98 | % | ||||||
| (1) | Includes $479,000, $552,000 and $833,000 of non-accrual restructured loans at March 31, 2017, December 31, 2016 and 2015. |
| (2) | For the three months ended March 31, 2017, $203,000 in interest income would have been recorded had non-accrual loans been current and the amount of interest we recorded on these loans was $78,000. |
| (3) | For the three months ended March 31, 2017, $9,000 in interest income would have been recorded had troubled debt restructurings included within accrual loans been current. |
Acquired impaired loans (accounted for under ASC 310-30) that are delinquent and/or on non-accrual status continue to accrue income provided the respective pool in which those assets reside maintains a discount and recognizes accretion income. The aforementioned loans are characterized as performing loans based on contractual delinquency. If the pool no longer has a discount and accretion income can no longer be recognized, any loan within that pool on non-accrual status will be classified as non-accrual for presentation purposes.
Total non-accrual loans increased by $1.1 million between December 31, 2016 and March 31, 2017 due to the additional non-accrual loans primarily in the government guaranteed loan portfolio. Total non-accrual
-97-
Table of Contents
loans decreased by $618,000 or 8.3% between December 31, 2015 and 2016. The decrease was primarily due to the reduction in acquired loans from the recapitalization and offset by the addition of loans from the Ridgestone acquisition. At December 31, 2016, there were $746,000 of non-accrual loans acquired from Ridgestone.
Total accruing loans past due decreased from $14.1 million at December 31, 2016 to $12.7 million at March 31, 2017. Total accruing loans past due increased from $2.2 million at December 31, 2015 to $14.1 million at December 31, 2016. This represents an increase of $11.9 million or 546.7%, and can be attributed to the addition of loans from the Ridgestone acquisition. Of the $11.9 million increase, $11.0 million are from loans that were 30—59 days past due; $7.7 million, or 54.3% of past due loans were acquired from Ridgestone in 2016.
The following tables summarize the recorded investment, unpaid principal balance, related allowance, average recorded investment, and interest income recognized for loans and leases considered impaired as of the periods indicated (dollars in thousands):
| (unaudited) March 31, 2017 |
||||||||||||||||||||||||||||
|
Unpaid |
Impaired |
Impaired |
Impaired |
Specific |
Average |
Interest |
||||||||||||||||||||||
| Commercial real estate |
$ | 10,353 | $ | 5,190 | $ | — | $ | 9,764 | $ | — | $ | 9,798 | $ | 130 | ||||||||||||||
| Residential real estate |
2,383 | 57,715 | 484 | 778 | 282 | 1,275 | 8 | |||||||||||||||||||||
| Construction, land development, and other land |
87 | — | 85 | — | 26 | 86 | 6 | |||||||||||||||||||||
| Commercial and industrial |
3,485 | 7,439 | 1,743 | 1,574 | 966 | 3,283 | 63 | |||||||||||||||||||||
| Installment and other |
315 | — | 327 | — | 325 | 328 | 4 | |||||||||||||||||||||
|
|
|
|
|
|
|
|
|
|
|
|
|
|
|
|||||||||||||||
| Total impaired loans held in portfolio, net |
$ | 16,623 | $ | 70,344 | $ | 2,639 | $ | 12,116 | $ | 1,599 | $ | 14,770 | $ | 211 | ||||||||||||||
|
|
|
|
|
|
|
|
|
|
|
|
|
|
|
|||||||||||||||
| December 31, 2016 |
||||||||||||||||||||||||||||
|
Unpaid |
Impaired |
Impaired |
Impaired |
Specific |
Average |
Interest |
||||||||||||||||||||||
| Commercial real estate |
$ | 9,502 | $ | 5,226 | $ | — | $ | 8,916 | $ | — | $ | 8,975 | $ | 305 | ||||||||||||||
| Residential real estate |
2,527 | 2,252 | 496 | 804 | 293 | 1,346 | 46 | |||||||||||||||||||||
| Commercial and industrial |
1,393 | 8,189 | 861 | 521 | 396 | 1,430 | (2 | ) | ||||||||||||||||||||
| Installment and other |
361 | 7 | 328 | — | 328 | 328 | 16 | |||||||||||||||||||||
|
|
|
|
|
|
|
|
|
|
|
|
|
|
|
|||||||||||||||
| Total impaired loans held in portfolio, net |
$ | 13,783 | $ | 15,674 | $ | 1,685 | $ | 10,241 | $ | 1,017 | $ | 12,079 | $ | 365 | ||||||||||||||
|
|
|
|
|
|
|
|
|
|
|
|
|
|
|
|||||||||||||||
-98-
Table of Contents
| December 31, 2015 |
||||||||||||||||||||||||||||
|
Unpaid |
Impaired |
Impaired |
Impaired |
Specific |
Average |
Interest |
||||||||||||||||||||||
| Commercial real estate |
$ | 4,719 | $ | 87,514 | $ | 2,798 | $ | 1,362 | $ | 1,076 | $ | 4,220 | $ | 110 | ||||||||||||||
| Residential real estate |
5,438 | 9,064 | 1,221 | 2,821 | 615 | 4,115 | 78 | |||||||||||||||||||||
| Construction, land development, and other land |
1,201 | — | 208 | — | 137 | 208 | — | |||||||||||||||||||||
| Commercial and industrial |
171 | 10,768 | 171 | — | 171 | 185 | 1 | |||||||||||||||||||||
| Installment and other |
335 | 79 | 327 | — | 327 | 327 | 23 | |||||||||||||||||||||
|
|
|
|
|
|
|
|
|
|
|
|
|
|
|
|||||||||||||||
| Total impaired loans held in portfolio, net |
$ | 11,864 | $ | 107,425 | $ | 4,725 | $ | 4,183 | $ | 2,326 | $ | 9,055 | $ | 212 | ||||||||||||||
|
|
|
|
|
|
|
|
|
|
|
|
|
|
|
|||||||||||||||
Deposits
Total deposits at March 31, 2017 were $2.6 billion, representing an increase of $85.4 million, or 3.4%, compared to $2.5 billion at December 31, 2016. As of March 31, 2017, deposits accounted for 89.0% of total liabilities, and core deposits, which we define as all deposits excluding certificates of deposit exceeding $100,000, constituted 84.3% of our deposit base.
Total deposits at December 31, 2016 were $2.5 billion, representing an increase of $309.8 million, or 14.2%, compared to $2.2 billion at December 31, 2015. The majority of the growth in deposits is due to the acquisition of Ridgestone, which added $361.4 million to deposits at the time of the acquisition. This was offset by $34.3 million in net time deposit run off in 2016. We expect deposits to remain our primary funding source in the future as we continue to grow our high quality deposit base by investing in our product capabilities and lowering our cost of deposits. As of December 31, 2016, deposits accounted for 85% of total liabilities, and core deposits, which we define as all deposits excluding certificates of deposit exceeding $100,000, constituted 84.6% of our deposit base.
We gather deposits primarily through each of our 56 branch locations in the Chicago metropolitan area and one branch in Brookfield, Wisconsin. Through our branch network, online, mobile and direct banking channels, we offer a variety of deposit products including demand deposit accounts, interest-bearing products, savings accounts, and certificates of deposit. We offer competitive online, mobile and direct banking channels. Small businesses are a significant source of low cost deposits as they value convenience, flexibility and access to local decision makers that are responsive to their needs.
-99-
Table of Contents
The following tables show the average balance amounts and the average contractual rates paid on our deposits for the periods indicated (dollars in thousands):
| (unaudited) |
||||||||||||||||
|
For the Three Months |
For the Three Months |
|||||||||||||||
| Average |
Average |
Average |
Average |
|||||||||||||
| Non-interest-bearing deposits |
$ | 716,162 | 0.00 | % | $ | 647,537 | 0.00 | % | ||||||||
| Interest-bearing checking accounts |
181,903 | 0.06 | % | 186,642 | 0.06 | % | ||||||||||
| Money market demand accounts |
367,273 | 0.23 | % | 389,110 | 0.24 | % | ||||||||||
| Other savings |
446,891 | 0.07 | % | 439,861 | 0.07 | % | ||||||||||
| Time deposits (below $100,000) |
400,175 | 0.49 | % | 319,954 | 0.47 | % | ||||||||||
| Time deposits ($100,000 and above) |
390,391 | 0.71 | % | 235,899 | 0.76 | % | ||||||||||
|
|
|
|
|
|
|
|
|
|||||||||
| Total |
$ | 2,502,795 | 0.24 | % | $ | 2,219,003 | 0.21 | % | ||||||||
|
|
|
|
|
|
|
|
|
|||||||||
| For the Year Ended December 31, 2016 |
For the Year Ended December 31, 2015 |
|||||||||||||||
| Average |
Average |
Average |
Average |
|||||||||||||
| Non-interest-bearing deposits |
$ | 666,221 | 0.00 | % | $ | 620,464 | 0.00 | % | ||||||||
| Interest-bearing checking accounts |
187,042 | 0.07 | % | 187,287 | 0.07 | % | ||||||||||
| Money market demand accounts |
401,628 | 0.25 | % | 385,175 | 0.24 | % | ||||||||||
| Other savings |
442,458 | 0.07 | % | 440,736 | 0.07 | % | ||||||||||
| Time deposits (below $100,000) |
318,544 | 0.39 | % | 322,598 | 0.44 | % | ||||||||||
| Time deposits ($100,000 and above) |
264,478 | 0.73 | % | 241,617 | 0.67 | % | ||||||||||
|
|
|
|
|
|
|
|
|
|||||||||
| Total |
$ | 2,280,371 | 0.20 | % | $ | 2,197,877 | 0.20 | % | ||||||||
|
|
|
|
|
|
|
|
|
|||||||||
The following table shows time deposits and other time deposits of $100,000 or more by time remaining until maturity:
| (unaudited) At March 31, 2017 |
||||
| Time Deposits |
||||
| Three months or less |
$ | 116,511 | ||
| Over three months through six months |
84,874 | |||
| Over six months through 12 months |
112,262 | |||
| Over 12 months |
89,918 | |||
|
|
|
|||
| Total |
$ | 403,565 | ||
|
|
|
|||
Borrowed funds
Other than deposits, we also utilize FHLB advances as a supplementary funding source to finance our operations. The Company’s advances from the FHLB are collateralized by residential, multi-family real estate loans and securities. At March 31, 2017, December 31, 2016 and December 31, 2015, the Company had maximum borrowing capacity from the FHLB of $1.2 billion, $961.8 million and $888.3 million, respectively, subject to the availability of collateral. During the three months ended March 31, 2017, outstanding FHLB advances before acquisition accounting adjustment decreased to $209.5 million due to an increase in seasonal deposits. During 2016, FHLB advances increased by $275.7 million due to increased loan demand and timing of seasonal deposits outflows. Of the $275.7 million increase, $9.8 million was acquired with the Ridgestone merger net of acquisition accounting adjustments.
-100-
Table of Contents
The following table sets forth certain information regarding our short-term borrowings at the dates and for the periods indicated (dollars in thousands):
| (unaudited) March 31, |
As of and for the Years Ended December 31, |
|||||||||||
| 2017 |
2016 |
2015 |
||||||||||
| Federal Home Loan Bank advances: |
||||||||||||
| Average balance outstanding |
$ | 301,375 | $ | 151,508 | $ | 15,009 | ||||||
| Maximum outstanding at any month-end period during the year |
374,697 | 313,715 | 100,000 | |||||||||
| Balance outstanding at end of period |
209,663 | 313,715 | 38,000 | |||||||||
| Weighted average interest rate during period |
0.89 | % | 0.47 | % | 0.15 | % | ||||||
| Weighted average interest rate at end of period |
1.08 | 0.73 | 0.16 | |||||||||
| Line of credit: |
||||||||||||
| Average balance outstanding |
$ | 19,400 | $ | 6,424 | $ | — | ||||||
| Maximum outstanding at any month-end period during the year |
20,650 | 30,000 | — | |||||||||
| Balance outstanding at end of period |
18,150 | 20,650 | — | |||||||||
| Weighted average interest rate during period |
3.79 | % | 3.55 | % | — | % | ||||||
| Weighted average interest rate at end of period |
4.00 | 3.75 | — | |||||||||
The following table shows the scheduled maturities of these advances and weighted average interest rates at March 31, 2017 (dollars in thousands) (unaudited):
| Scheduled Maturities |
Amount |
Weighted |
||||||
| 2017 |
$ | 200,000 | 0.97 | % | ||||
| 2018 |
9,663 | 3.20 | % | |||||
|
|
|
|
|
|||||
| Total |
$ | 209,663 | 1.08 | % | ||||
|
|
|
|
|
|||||
Customer repurchase agreements (sweeps)
Securities sold under agreements to repurchase represent a demand deposit product offered to customers that sweep balances in excess of the FDIC insurance limit into overnight repurchase agreements. The Company pledges securities as collateral for the repurchase agreements. As of March 31, 2017, securities sold under agreements to repurchase increased $14.7 million to $31.9 million from December 31, 2016. Securities sold under agreements to repurchase increased by $4.5 million from $12.7 million at December 31, 2015 to $17.2 million at December 31, 2016.
Liquidity
We manage liquidity based upon factors that include the amount of core deposits as a percentage of total deposits, the level of diversification of our funding sources, the amount of non-deposit funding used to fund assets, the availability of unused funding sources, off-balance sheet obligations, the availability of assets to be readily converted into cash without undue loss, the amount of cash and liquid securities we hold and the re-pricing characteristics and maturities of our assets when compared to the re-pricing characteristics of our liabilities, the ability to securitize and sell certain pools of assets and other factors.
Our liquidity needs are primarily met by cash and securities positions, growth in deposits, cash flow from amortizing loan portfolios, and borrowings from the FHLB. For additional information regarding our operating, investing, and financing cash flows, see “Consolidated Statements of Cash Flows” in Byline’s Consolidated Financial Statements as of and for the years ended December 31, 2016 and 2015.
-101-
Table of Contents
As of March 31, 2017, we held $83.3 million in cash and cash equivalents. We maintain an investment portfolio of various holdings, types and maturities. We had securities available for sale of $590.5 million and securities held-to-maturity of $132.9 million as of March 31, 2017 and total unpledged securities was $504.3 million.
As of March 31, 2017, Byline Bank had maximum borrowing capacity from the FHLB of $1.2 billion and from the FRB of $169.5 million. As of March 31, 2017, Byline Bank had open advances, before acquisition accounting adjustment, of $209.5 million and open letters of credit of $300,000, leaving us with available FHLB and FRB borrowing capacity of $1.1 billion. In addition, Byline Bank had an uncommitted federal funds line of $20.0 million available to use.
As of December 31, 2016, Byline Bank had maximum borrowing capacity from the FHLB of $961.8 million and from the FRB of $110.6 million. As of December 31, 2016, Byline Bank had open advances of $313.5 million and open letters of credit of $400,000, leaving us with available FHLB and FRB borrowing capacity of $758.5 million. In addition, Byline Bank had an uncommitted federal funds line of $20.0 million available to use. On October 13, 2016, we entered into a $30.0 million revolving credit agreement with The Private Bank and Trust Company. As of December 31, 2016, this revolving line of credit had an outstanding balance of $20.7 million. On April 13, 2017, the revolving line of credit was converted to a non-revolving line of credit as long as the outstanding balance exceeds $5.0 million. When the outstanding balance decreases to $5.0 million, or below, the line of credit will be converted to a revolving line of credit with credit availability up to $5.0 million until maturity at October 12, 2017.
There are regulatory limitations that affect the ability of Byline Bank to pay dividends to the Company. See Note 21 of Byline’s Consolidated Financial Statements as of and for the years ended December 31, 2016 and 2015 for additional information. Management believes that such limitations will not impact our ability to meet our ongoing short-term cash obligations.
We expect to use a portion of the net proceeds of this offering to repay all amounts outstanding under our revolving agreement, although we will maintain the committed amount under such agreement. We expect that our cash and liquidity resources will be generated by the operations of Byline Bank, which we expect to be sufficient to satisfy our liquidity and capital requirements for at least the next twelve months.
Capital resources
Stockholders’ equity at March 31, 2017 was $389.7 million compared to $382.7 million at December 31, 2016, an increase of $7.0 million, or 1.8%. The increase was primarily driven by our earnings during the first quarter of 2017.
Stockholders’ equity at December 31, 2016 was $382.7 million compared to $188.3 million at December 31, 2015, an increase of $194.4 million, or 103.2%. The increase was primarily driven by the Ridgestone acquisition, a common equity private placement of $50.0 million in 2016, a non-cumulative perpetual preferred stock private placement of $10.4 million and an increase of $66.7 million to retained earnings.
The Company and Byline Bank are subject to various regulatory capital requirements administered by federal banking regulators. Failure to meet minimum capital requirements can initiate certain mandatory and possibly additional discretionary actions by federal banking regulators that, if undertaken, could have a direct material effect on the Company’s and Byline Bank’s financial statements.
Under Capital Rules, the Company and Byline Bank must meet specific capital guidelines that involve quantitative measures of their assets, liabilities and certain off-balance sheet items as calculated under regulatory accounting practices. Byline Bank must also meet certain specific capital guidelines under the prompt corrective action framework. The capital amounts and classification are subject to qualitative judgments by the federal
-102-
Table of Contents
banking regulators about components, risk weightings and other factors. Quantitative measures established by regulation to ensure capital adequacy require the Company and Byline Bank to maintain minimum amounts and ratios of CET1 Capital, Tier 1 capital and total capital to risk-weighted assets and of Tier 1 capital to average consolidated assets, (referred to as the “leverage ratio”), as defined under the Capital Rules. For further information, see “Supervision and Regulation—Regulatory Capital Requirements” and “Supervision and Regulation- Prompt Corrective Action Framework.”
As of March 31, 2017, the FDIC categorized Byline Bank as well-capitalized under the prompt corrective action framework, as defined in “Supervision and Regulation”. There have been no conditions or events since March 31, 2017 that management believes have changed Byline Bank’s classifications.
The regulatory capital ratios for the Company and Byline Bank to meet the minimum capital adequacy standards and for Byline Bank to be considered well capitalized under the prompt corrective action framework are set forth in the following tables. The Company’s and Byline Bank’s actual capital amounts and ratios as of the periods indicated (dollars in thousands).
| Actual |
Minimum Capital Required |
Required to be Considered Well Capitalized |
||||||||||||||||||||||
| March 31, 2017 (unaudited) |
Amount |
Ratio |
Amount |
Ratio |
Amount |
Ratio |
||||||||||||||||||
| Total capital to risk weighted assets: |
||||||||||||||||||||||||
| Company |
$ | 320,034 | 13.49 | % | $ | 189,753 | 8.00 | % | $ | 237,191 | N/A | |||||||||||||
| Bank |
330,588 | 13.88 | % | 190,534 | 8.00 | % | 238,168 | 10.00 | % | |||||||||||||||
| Tier 1 capital to risk weighted assets: |
||||||||||||||||||||||||
| Company |
$ | 306,987 | 12.94 | % | $ | 142,314 | 6.00 | % | $ | 189,753 | N/A | |||||||||||||
| Bank |
317,541 | 13.33 | % | 142,901 | 6.00 | % | 190,534 | 8.00 | % | |||||||||||||||
| Common Equity Tier 1 (CET1) to risk weighted assets: |
||||||||||||||||||||||||
| Company |
$ | 257,431 | 10.85 | % | $ | 106,736 | 4.50 | % | $ | 154,174 | N/A | |||||||||||||
| Bank |
317,541 | 13.33 | % | 107,176 | 4.50 | % | 154,809 | 6.50 | % | |||||||||||||||
| Tier 1 capital to average assets: |
||||||||||||||||||||||||
| Company |
$ | 306,987 | 9.59 | % | $ | 128,020 | 4.00 | % | $ | 160,025 | N/A | |||||||||||||
| Bank |
317,541 | 9.89 | % | 128,453 | 4.00 | % | 160,567 | 5.00 | % | |||||||||||||||
| Actual |
Minimum Capital Required |
Required to be Considered Well Capitalized |
||||||||||||||||||||||
| December 31, 2016 |
Amount |
Ratio |
Amount |
Ratio |
Amount |
Ratio |
||||||||||||||||||
| Total capital to risk weighted assets: |
||||||||||||||||||||||||
| Company |
$ | 316,314 | 13.28 | % | $ | 190,257 | 8.00 | % | $ | 238,159 | N/A | |||||||||||||
| Bank |
325,465 | 13.61 | % | 191,267 | 8.00 | % | 239,084 | 10.00 | % | |||||||||||||||
| Tier 1 capital to risk weighted assets: |
||||||||||||||||||||||||
| Company |
$ | 304,324 | 12.78 | % | $ | 142,895 | 6.00 | % | $ | 190,527 | N/A | |||||||||||||
| Bank |
313,474 | 13.11 | % | 143,450 | 6.00 | % | 191,267 | 8.00 | % | |||||||||||||||
| Common Equity Tier 1 (CET1) to risk weighted assets: |
||||||||||||||||||||||||
| Company |
$ | 266,760 | 11.20 | % | $ | 107,171 | 4.50 | % | $ | 154,803 | N/A | |||||||||||||
| Bank |
313,474 | 13.11 | % | 107,588 | 4.50 | % | 155,404 | 6.50 | % | |||||||||||||||
| Tier 1 capital to average assets: |
||||||||||||||||||||||||
| Company |
$ | 304,324 | 10.07 | % | $ | 120,850 | 4.00 | % | $ | 151,062 | N/A | |||||||||||||
| Bank |
313,474 | 10.35 | % | 121,169 | 4.00 | % | 151,461 | 5.00 | % | |||||||||||||||
-103-
Table of Contents
| Actual |
Minimum Capital Required |
Required to be Considered Well Capitalized |
||||||||||||||||||||||
| December 31, 2015 |
Amount |
Ratio |
Amount |
Ratio |
Amount |
Ratio |
||||||||||||||||||
| Total capital to risk weighted assets: |
||||||||||||||||||||||||
| Company |
$ | 202,578 | 12.51 | % | $ | 129,534 | 8.00 | % | $ | 161,917 | N/A | |||||||||||||
| Bank |
192,253 | 11.87 | % | 129,537 | 8.00 | % | 161,921 | 10.00 | % | |||||||||||||||
| Tier 1 capital to risk weighted assets: |
||||||||||||||||||||||||
| Company |
$ | 194,364 | 12.00 | % | $ | 97,150 | 6.00 | % | $ | 129,534 | N/A | |||||||||||||
| Bank |
184,039 | 11.37 | % | 97,153 | 6.00 | % | 129,537 | 8.00 | % | |||||||||||||||
| Common Equity Tier 1 (CET1) to risk weighted assets: |
||||||||||||||||||||||||
| Company |
$ | 144,361 | 8.92 | % | $ | 72,863 | 4.50 | % | $ | 105,246 | N/A | |||||||||||||
| Bank |
184,039 | 11.37 | % | 72,864 | 4.50 | % | 105,249 | 6.50 | % | |||||||||||||||
| Tier 1 capital to average assets: |
||||||||||||||||||||||||
| Company |
$ | 194,364 | 7.85 | % | $ | 99,076 | 4.00 | % | $ | 123,845 | N/A | |||||||||||||
| Bank |
184,039 | 7.43 | % | 99,077 | 4.00 | % | 123,846 | 5.00 | % | |||||||||||||||
The Company and Byline Bank must maintain a capital conservation buffer consisting of CET1 capital greater than 2.5% of risk-weighted assets above the required minimum risk-based capital levels in order to avoid limitations on paying dividends, repurchasing shares, and paying discretionary bonuses. The capital conservation buffer requirement began to be phased in on January 1, 2016 when a buffer greater than 0.625% of risk-weighted assets was required, which amount increases each year until the buffer requirement is fully implemented on January 1, 2019. The conservation buffers for the Company and Byline Bank exceed the fully phased in minimum capital requirement as of March 31, 2017.
Provisions of state and federal banking regulations may limit, by statute, the amount of dividends that may be paid to the Company by Byline Bank without prior approval of Byline Bank’s regulatory agencies. The Company is economically dependent on the cash dividends received from Byline Bank. These dividends represent the primary cash flow from operating activities used to service obligations. During the three months ended March 31, 2017, the Company received an $800,000 cash dividend from Byline Bank to make interest payments on the line of credit and the trust preferred securities and to pay dividends on the Company’s Series B preferred stock. There were no cash dividends received by the Company from Byline Bank for the year ended December 31, 2016. Cash dividends of $700,000 to pay the interest payments on the trust preferred securities were received by the Company from Byline Bank for the year ended December 31, 2015.
Contractual obligations
The following table summarizes aggregated information about our outstanding contractual obligations and other long-term liabilities as of March 31, 2017. The payment amounts represent those amounts contractually due to the recipients (dollars in thousands (unaudited)).
| Payments Due by Period |
||||||||||||||||||||
| Total |
Less than |
One
to |
Three
to |
More |
||||||||||||||||
| Contractual Obligations |
||||||||||||||||||||
| Deposits without stated maturity |
$ | 1,764,803 | $ | 1,764,803 | $ | — | $ | — | $ | — | ||||||||||
| Time deposits |
811,036 | 638,977 | 158,653 | 13,392 | 14 | |||||||||||||||
| Short term borrowings |
259,753 | 259,753 | — | — | — | |||||||||||||||
| Long term borrowings |
27,130 | — | — | — | 27,130 | |||||||||||||||
| Operating lease obligations |
13,412 | 2,937 | 4,795 | 3,120 | 2,560 | |||||||||||||||
|
|
|
|
|
|
|
|
|
|
|
|||||||||||
| Total |
$ | 2,876,134 | $ | 2,666,470 | $ | 163,448 | $ | 16,512 | $ | 29,704 | ||||||||||
|
|
|
|
|
|
|
|
|
|
|
|||||||||||
-104-
Table of Contents
FHLB advances are fully described in Note 12 of Byline’s Consolidated Financial Statements as of December 31, 2016 and 2015. Operating lease obligations are in place for facilities and land on which banking facilities are located. See Note 17 of Byline’s Consolidated Financial Statements as of December 31, 2016 and 2015 for additional information.
Off-balance sheet items and other financing arrangements
We are a party to financial instruments with off-balance sheet risk in the normal course of business to meet the financing needs of our customers. These financial instruments include commitments to extend credit, commercial letters of credit and standby letters of credit. Those instruments involve, to varying degrees, elements of credit and interest rate risk in excess of the amount recognized in the consolidated statements of financial condition. The contractual or notional amounts of those instruments reflect the extent of involvement we have in particular classes of financial instruments.
Commitments to extend credit are agreements to lend to a customer as long as there is no violation of any condition established in the contract. Commitments generally have fixed expiration dates or other termination clauses and may require payment of a fee. Since many of the commitments are expected to expire without being drawn upon, the total commitment amount does not necessarily represent future cash requirements. We evaluate each customer’s creditworthiness on a case-by-case basis. The amount of collateral obtained, if deemed necessary by Byline Bank upon extension of credit, is based on management’s credit evaluation of the counterparty. Collateral is primarily obtained in the form of commercial and residential real estate (including income producing commercial properties).
Standby letters of credit are conditional commitments issued by Byline Bank to guarantee to a third-party the performance of a customer. Those guarantees are primarily issued to support public and private borrowing arrangements, bond financing and similar transactions. The credit risk involved in issuing letters of credit is essentially the same as that involved in extending loan facilities to customers.
Commitments to make loans are generally made for periods of 90 days or less. The fixed rate loan commitments have interest rates ranging from 2.1% to 19.5% and maturities up to 2025. Variable rate loan commitments have interest rates ranging from 2.5% to 9.8% and maturities up to 2046.
Our exposure to credit loss in the event of non-performance by the other party to the financial instrument for commitments to extend credit and standby letters of credit is represented by the contractual or notional amount of those instruments. We use the same credit policies in making commitments and conditional obligations as for funded instruments. We do not anticipate any material losses as a result of the commitments and standby letters of credit.
The following table summarizes commitments as of the dates presented (dollars in thousands).
| (Unaudited) March 31, 2017 |
December 31, |
|||||||||||||||||||||||
| 2016 |
2015 |
|||||||||||||||||||||||
| Fixed Rate |
Variable Rate |
Fixed Rate |
Variable Rate |
Fixed Rate |
Variable Rate |
|||||||||||||||||||
| Commitments to extend credit |
$ | 35,720 | $ | 367,278 | $ | 37,731 | $ | 332,928 | $ | 31,579 | $ | 169,298 | ||||||||||||
| Standby letters of credit |
954 | 3,239 | 1,060 | 4,135 | 1,147 | 1,497 | ||||||||||||||||||
|
|
|
|
|
|
|
|
|
|
|
|
|
|||||||||||||
| Total |
$ | 36,674 | $ | 370,517 | $ | 38,791 | $ | 337,063 | $ | 32,726 | $ | 170,795 | ||||||||||||
|
|
|
|
|
|
|
|
|
|
|
|
|
|||||||||||||
During the first quarter ended March 31, 2017 and for the year ended December 31, 2016, we entered into interest rate swaps that are used to manage differences in the amount, timing, and duration of our known or expected cash receipts and its known or expected cash payments principally related to certain variable rate borrowings. We also entered into interest rate swaps with certain qualified borrowers to facilitate the borrowers’ risk management strategies and concurrently entered into mirror-image derivatives with a third party counterparty. There were no interest rate swap agreements entered into during 2015.
-105-
Table of Contents
We recognize derivative financial instruments at fair value regardless of the purpose or intent for holding the instrument. We record derivative assets and derivative liabilities on the Consolidated Statements of Financial Condition within other assets and other liabilities, respectively. Because the derivative assets and liabilities recorded on the balance sheet at March 31, 2017 do not represent the amounts that may ultimately be paid under these contracts, these assets and liabilities are listed in the table below (dollars in thousands):
| (Unaudited) March 31, 2017 |
||||||||||||||||
| Derivative Assets |
Derivative Liabilities |
|||||||||||||||
| Notional |
Fair Value |
Notional |
Fair Value |
|||||||||||||
| Interest rate contracts—pay fixed, receive floating |
$ | 150,000 | $ | 3,925 | $ | 50,000 | $ | 254 | ||||||||
| Other interest rate swaps—pay fixed, receive floating |
37,136 | 727 | 37,136 | 701 | ||||||||||||
-106-
Table of Contents
QUANTITATIVE AND QUALITATIVE DISCLOSURES ABOUT MARKET RISK
Our primary market risk is interest rate risk, which is defined as the risk of loss of net interest income or net interest margin because of changes in interest rates.
We seek to measure and manage the potential impact of interest rate risk. Interest rate risk occurs when interest-earning assets and interest-bearing liabilities mature or re-price at different times, on a different basis or in unequal amounts. Interest rate risk also arises when our assets, liabilities and off-balance sheet contracts each respond differently to changes in interest rates, including as a result of explicit and implicit provisions in agreements related to such assets and liabilities and in off-balance sheet contracts that alter the applicable interest rate and cash flow characteristics as interest rates change. The two primary examples of such provisions that we are exposed to are the duration and rate sensitivity associated with indeterminate-maturity deposits (e.g., non-interest-bearing checking accounts, negotiable order of withdrawal (“NOW”) accounts, savings accounts and money market deposits accounts (“MMDAs”) and the rate of prepayment associated with fixed-rate lending and mortgage-backed securities. Interest rates may also affect loan demand, credit losses, mortgage origination volume and other items affecting earnings.
We are also exposed to interest rate risk through the retained portion of the SBA loans we make and the related servicing rights. Our SBA loan portfolio is comprised primarily of SBA 7(a) loans, 91% of which are quarterly or monthly adjustable with the prime rate. The SBA portfolio reacts differently in a rising rate environment than our other non-guaranteed portfolios. Generally, when interest rates rise, the prepayments in the SBA portfolio tend to increase.
Our management of interest rate risk is overseen by our bank’s asset liability committee and is chaired by Byline Bank’s Treasurer based on a risk management infrastructure approved by our board of directors that outlines reporting and measurement requirements. In particular, this infrastructure sets limits and management targets, calculated monthly, for various metrics, including our economic value sensitivity, our economic value of equity and net interest income simulations involving parallel shifts in interest rate curves, steepening and flattening yield curves, and various prepayment and deposit duration assumptions. Our risk management infrastructure also requires a periodic review of all key assumptions used, such as identifying appropriate interest rate scenarios, setting loan prepayment rates based on historical analysis, non-interest-bearing and interest-bearing demand deposit durations based on historical analysis and the targeted investment term of capital.
We manage the interest rate risk associated with our interest-bearing liabilities by managing the interest rates and tenors associated with our borrowings from the FHLB and deposits from our customers that we rely on for funding. In particular, from time to time we use special offers on deposits to alter the interest rates and tenors associated with our interest-bearing liabilities. We manage the interest rate risk associated with our interest-earning assets by managing the interest rates and tenors associated with our investment and loan portfolios, from time to time purchasing and selling investment securities and selling residential mortgage loans in the secondary market.
We utilize interest rate swaps to hedge our interest rate exposure on commercial loans when it meets our clients’ and Byline Bank’s needs. Typically, customer interest rate swaps are for terms of more than five years. As of March 31, 2017, we had a notional amount of $74.3 million of interest rate swaps outstanding. The overall effectiveness of our hedging strategies is subject to market conditions, the quality of our execution, the accuracy of our valuation assumptions, the associated counterparty credit risk and changes in interest rates.
We do not engage in speculative trading activities relating to interest rates, foreign exchange rates, commodity prices, equities or credit.
We are also subject to credit risk. Credit risk is the risk that borrowers or counterparties will be unable or unwilling to repay their obligations in accordance with the underlying contractual terms. We manage and
-107-
Table of Contents
control credit risk in the loan and lease portfolio by adhering to well-defined underwriting criteria and account administration standards established by management. Written credit policies document underwriting standards, approval levels, exposure limits and other limits or standards deemed necessary and prudent. Portfolio diversification at the obligor, industry, product and/or geographic location levels is actively managed to mitigate concentration risk. In addition, credit risk management also includes an independent credit review process that assesses compliance with commercial, real estate and other credit policies, risk ratings and other critical credit information. In addition to implementing risk management practices that are based upon established and sound lending practices, we adhere to sound credit principles. We understand and evaluate our customers’ borrowing needs and capacity to repay, in conjunction with their character and history. See “Business—Risk Management—Credit and Interest Rate Risk Management” for further information about our credit risk management function.
Evaluation of Interest Rate Risk
We use a net interest income simulation model to measure and evaluate potential changes in our net interest income. We run various hypothetical interest rate scenarios at least monthly and compare these results against a scenario with no changes in interest rates. Our net interest income simulation model incorporates various assumptions, which we believe are reasonable but which may have a significant impact on results such as: (1) the timing of changes in interest rates, (2) shifts or rotations in the yield curve, (3) re-pricing characteristics for market-rate-sensitive instruments on and off balance sheet, (4) differing sensitivities of financial instruments due to differing underlying rate indices, (5) varying loan prepayment speeds for different interest rate scenarios, (6) the effect of interest rate limitations in our assets, such as floors and caps, (7) the effect of our interest rate swaps and (8) overall growth and repayment rates and product mix of assets and liabilities. Because of limitations inherent in any approach used to measure interest rate risk, simulation results are not intended as a forecast of the actual effect of a change in market interest rates on our results but rather as a means to better plan and execute appropriate asset-liability management strategies and manage our interest rate risk.
Potential changes to our net interest income in hypothetical rising and declining rate scenarios calculated as of March 31, 2017 are presented in the following table. The projections assume (1) immediate, parallel shifts downward of the yield curve of 100 basis points and immediate, parallel shifts upward of the yield curve of 100, 200, 300 and 400 basis points and (2) gradual shifts downward of 100 basis points over 12 months and gradual shifts upward of 100, 200, 300 and 400 basis points over 12 months. In the current interest rate environment, a downward shift of the yield curve of 200, 300 and 400 basis points does not provide us with meaningful results. In a downward parallel shift of the yield curve, interest rates at the short-end of the yield curve are not modeled to decline any further than 0%. For the immediate-shift scenarios, we assume short-term rates follow a forward yield curve throughout the forecast period that is dictated by the instantaneously shocked yield curve from the as of date. In the gradual-shift scenarios, we take each rate across the yield curve from the as of date and shock it by 1/12th of the total change in rates each month for twelve months.
|
Estimated Increase (Decrease) in Net Interest Income |
||||||||
| Change in Market Interest Rates as of March 31, 2017 | Twelve Months Ending |
Twelve
Months Ending |
||||||
| Immediate Shifts |
||||||||
| +400 basis points |
11.4 | % | 8.1 | % | ||||
| +300 basis points |
9.0 | % | 6.5 | % | ||||
| +200 basis points |
6.3 | % | 4.8 | % | ||||
| +100 basis points |
3.3 | % | 2.7 | % | ||||
| -100 basis points |
(6.7 | )% | (7.7 | )% | ||||
| Dynamic Balance Sheet and Rate Shifts |
||||||||
| +200 basis points |
6.2 | % | ||||||
| +100 basis points |
3.2 | % | ||||||
| -100 basis points |
(5.2 | )% | ||||||
-108-
Table of Contents
The results of this simulation analysis are hypothetical, and a variety of factors might cause actual results to differ substantially from what is depicted. For example, if the timing and magnitude of interest rate changes differ from those projected, our net interest income might vary significantly. Non-parallel yield curve shifts such as a flattening or steepening of the yield curve or changes in interest rate spreads, would also cause our net interest income to be different from that depicted. An increasing interest rate environment could reduce projected net interest income if deposits and other short-term liabilities re-price faster than expected or faster than our assets re-price. Actual results could differ from those projected if we grow assets and liabilities faster or slower than estimated, if we experience a net outflow of deposit liabilities or if our mix of assets and liabilities otherwise changes. Actual results could also differ from those projected if we experience substantially different repayment speeds in our loan portfolio than those assumed in the simulation model. Finally, these simulation results do not contemplate all the actions that we may undertake in response to potential or actual changes in interest rates, such as changes to our loan, investment, deposit, funding or hedging strategies.
-109-
Table of Contents
Our Company
We are a bank holding company headquartered in Chicago, Illinois and conduct all our business activities through our subsidiary, Byline Bank, a full service commercial bank. We have been a part of the Chicago banking community for over 100 years and operate the fifth largest branch network in the City of Chicago with 56 branches in the Chicago metropolitan area. We offer a broad range of banking products and services to small and medium sized businesses, commercial real estate and financial sponsors, and to consumers who generally live or work near our branches. In addition to our traditional commercial banking business, we provide small ticket equipment leasing solutions and were the sixth most active Small Business Administration (“SBA”) lender in the United States as reported by the SBA for the year ended September 30, 2016. As of March 31, 2017, we had consolidated total assets of $3.3 billion, total gross loans and leases outstanding of $2.1 billion, total deposits of $2.6 billion and total stockholders’ equity of $389.7 million.
Our mission is to provide customers with a high degree of service, convenience and the products they need to achieve their financial objectives. We aim to do so one customer, one relationship and one neighborhood at a time. We believe that customers value convenience, prompt decision making and knowledge of the local market when choosing a banking partner. We distinguish ourselves from smaller competitors with the breadth and sophistication of our product capabilities, ranging from basic deposit accounts to cash-flow based loan facilities and cash management products; and we differentiate ourselves from larger competitors with our level of responsiveness, local decision making and the accessibility of our service. Given the large presence of out-of-state banks and the scarcity of local community banks that can competitively serve small and medium sized businesses, we see an attractive opportunity for Byline to be the bank that Chicago deserves.
Our culture is rooted in a set of core values that we refer to as the Things That Matter. These values underlie everything we do, including the way we engage with customers, collaborate with colleagues, do business and manage our resources. We believe our culture and the quality of our people have been catalysts of our success and will continue to propel our future.
In 2013, our predecessor, Metropolitan Bank Group, Inc. (“Metropolitan”), experienced significant credit and financial losses resulting primarily from the collapse of real estate prices during the Great Recession. Despite deterioration in asset quality and financial performance, Metropolitan maintained a high quality deposit base, an attractive branch network and strong customer loyalty, which made it an ideal candidate for a turnaround. Our Chief Executive Officer, Chief Financial Officer and Chairman led an investment group in the $207 million Recapitalization of Metropolitan, the largest recapitalization of a Chicago bank in over 25 years. Under a new leadership team headed by our Chief Executive Officer, Alberto J. Paracchini, we have built upon Metropolitan’s strengths and have restructured, refocused and rationalized Byline Bank to deliver growth and profitability. We also launched a new brand called Byline, which represented an important milestone in presenting our franchise under a unified name to our customers and employees.
Over the past four years, we have significantly improved our asset quality while adding $1.3 billion in net originated loans and leases to create a more diversified and balanced loan and lease portfolio. We aggressively reduced the level of troubled loans and other real estate owned in our portfolio, and our nonperforming assets, as a percentage of loans and real estate owned, declined to 1.0% as of March 31, 2017 from 28.2% as of March 31, 2013. In addition, we sought to optimize our deposit base by expanding the percentage of non-interest bearing deposits to total deposits, enhance online and mobile capabilities and broaden our cash management products to better meet our customers’ needs. During this period, we consolidated from 88 to 57 branches, reducing our costs with minimal deposit attrition, and improved our efficiency, including through the consolidation of multiple banking platforms into one. In addition to improving efficiency, consolidating our banking platforms allowed us to better monitor operations while strengthening our governance and controls.
-110-
Table of Contents
The table below details our transformation:
| What We Were |
What We Are | |||||||
| At and for the three months ended 3/31/2013 |
At and for the three 3/31/2017 |
|||||||
| Deposit Franchise |
|
|||||||
| # of Bank Brand Names |
12 | 1 | ||||||
| # of Branches |
88 | 57 | ||||||
| Non-interest bearing Deposits / Total Deposits |
26 | % | 28 | % | ||||
| Cost of Deposits(1) |
0.27 | % | 0.24 | % | ||||
| Deposits / Branch ($mm) |
$ | 26 | $ | 45 | ||||
| Loan and Lease Portfolio |
|
|||||||
| Total Loans and Leases(2) ($mm) |
$ | 1,542 | $ | 2,167 | ||||
| Loans and Leases / Deposits(3) |
68 | % | 84 | % | ||||
| Commercial & Industrial Loans / Total Loans & Leases |
3 | % | 21 | % | ||||
| Non-performing Assets / Loans & Leases + Other Real Estate Owned(4) |
28.2 | % | 1.0 | % | ||||
| Non-accrual & 90 Days or More Past Due Loans & Leases ($mm) |
$ | 258 | $ | 8 | ||||
| Other Real Estate Owned ($mm) |
$ | 116 | $ | 13 | ||||
| Capital |
|
|||||||
| Common Equity ($mm) |
($ | 31 | ) | $ | 364 | |||
| Common Equity/Assets |
(1.3 | %) | 11.1 | % | ||||
| Tangible Common Equity ($mm)(5) |
($ | 43 | ) | $ | 293 | |||
| Tangible Common Equity / Tangible Assets(5) |
(1.8 | %) | 9.1 | % | ||||
| Profitability |
||||||||
| Return on Average Assets |
(2.57 | %) | 0.80 | % | ||||
| Non-interest Expense / Average Assets |
4.96 | % | 3.53 | % | ||||
| Non-interest Income / Total Revenue |
(4.27 | %) | 29.41 | % | ||||
Source: SNL Financial and company management. Financial information as of and for the three months ended March 31, 2013 is derived from Metropolitan’s historical Consolidated Financial Statements for Holding Companies filed with the Federal Reserve Bank on Form FR Y-9C. The FR Y-9C reports were prepared by Metropolitan’s management team prior to the Recapitalization and may not reflect similar assumptions or accounting standards used in our financial statements. The financial information as of and for the three months ended March 31, 2013 included in this table has not been reviewed or audited by our independent registered public accounting firm and may not be directly comparable to Byline’s financial results for the quarter ended March 31, 2017.
| (1) | Represents annualized (meaning, recalculated as an annual rate) interest expense for the quarter divided by average total deposits for the quarter. |
| (2) | Represents total loans and leases held for sale and held for investment. |
| (3) | Represents total loans and leases held for sale and held for investment divided by total deposits. |
| (4) | Represents total non-performing assets, which includes nonaccrual loans and leases, troubled debt restructured loans and other real estate owned divided by total loans and leases held for investment and other real estate owned. |
| (5) | Represents a non-GAAP financial measure. See “GAAP Reconciliation and Management Explanation of Non-GAAP Financial Measures” for a reconciliation of our non-GAAP measures to the most directly comparable GAAP financial measure. |
We plan to leverage our seasoned management team, the attractive market opportunity in the Chicago metropolitan area, our diversified lending approach and our track record of successfully integrating acquisitions to drive future growth. We believe that having a deep understanding of customers, longstanding ties to the communities in which we operate, a strong market position and exceptional employees allow us to provide the attention, responsiveness and customized service our clients seek while offering a diverse range of products to serve a variety of needs.
-111-
Table of Contents
We Are Not Like the Other Guys
We believe the following strengths differentiate us from our competitors and will drive future growth:
Core deposit franchise and focus. The quality of our deposit franchise and access to stable funding are key components of our success. We have a strong deposit franchise characterized by a high level of core deposits, high proportion of non-interest bearing accounts and relatively low funding costs. As of March 31, 2017, deposits accounted for 89% of total liabilities, and core deposits, which we define as all deposits excluding time deposits exceeding $100,000, constituted 84% of our deposit base. We also increased our percentage of non-interest bearing deposits from 27% at December 31, 2013 to 28% at March 31, 2017 and our cost of deposits was 0.24% for the quarter ended March 31, 2017.
Our local presence and our scale are essential to the continued growth of our deposit base. Small businesses are a significant source of low cost deposits and represent opportunities for future growth. Small business owners value our ability to provide convenience and access to local, responsive decision makers. Commercial accounts also generally have higher deposit balances and transaction volumes than individual deposit accounts. As of March 31, 2017, commercial deposits represented 19% of total deposits.
Since the Recapitalization, we have consolidated from 88 to 57 branches, reducing our costs with minimal loss of deposits. Following the introduction of our Byline brand, customers now recognize us by a single name and we strive to deliver a consistent customer experience across our entire branch network. We have also enhanced our online and mobile capabilities and expanded our cash management products to meet our customers’ needs.
We believe that our Chicago branch network, service driven culture, diversified product offering and focus on small and medium sized businesses will allow us to accelerate deposit growth. We plan to continue investing in our brand, employees and product capabilities to further improve customer loyalty with a view toward growing our high quality deposit portfolio.
Seasoned management team and board of directors with a strong track record. Our seasoned executive management team has extensive local knowledge of the banking industry. Drawing on their experience and deep ties to the Chicago community, our management team successfully executed our turnaround strategy and guided our transformation while growing our franchise. Under their leadership, we have significantly improved asset quality, built a new, diversified loan and lease portfolio, strengthened our deposit base and improved our operating environment and controls, while also integrating two acquisitions. Our board of directors includes highly accomplished individuals with broad experience operating and working in the financial services industry and provides valuable insight to our business. We believe management’s track record of performance, guided by our board and a culture dedicated to maintaining the highest business and ethical standards and practices, will drive the continued growth of our franchise.
Our executive management team is led by veteran banking executives:
| • | Alberto J. Paracchini, our President and Chief Executive Officer, has over 24 years of experience in the Chicago financial services industry, having spent over 16 years at Popular, Inc., where he held numerous leadership positions in both its banking and mortgage subsidiaries, and serving as Principal at BXM Holdings, Inc. (“BXM”), an investment fund specializing in community banks, where he was a member of the team that led the Recapitalization. |
| • | Lindsay Corby, our Executive Vice President and Chief Financial Officer, has over 16 years of experience in the financial services industry, including as a Principal and member of the team at BXM that led the Recapitalization, and as a Vice President in the investment banking group of Keefe, Bruyette & Woods, Inc. |
-112-
Table of Contents
| • | Timothy C. Hadro, our Chief Credit Officer and Head of the Special Assets Group for Byline Bank, has more than 42 years of lending experience, more than 34 years of experience in the Chicago banking industry and 31 years of experience at JPMorgan Chase and its predecessor organizations. |
Our board of directors includes highly accomplished individuals with strong track records:
| • | Roberto R. Herencia, our Chairman, is also Chairman of First BanCorp, and a director of Banner Corporation. Mr. Herencia is the current President and Chief Executive Officer of BXM, former President and Chief Executive Officer of Midwest Banc Holdings, Inc., and former Executive Vice President of Popular Inc.; |
| • | L. Gene Beube, former Executive Vice President and Chief Credit Officer of Banco Popular North America; |
| • | Phillip R. Cabrera, former Vice President and International Treasurer of McDonald’s Corporation; |
| • | Antonio del Valle Perochena, Chairman of Grupo Kaluz and Grupo Financiero BX+ and director of Elementia S.A.B. de C.V. and Mexichem, S.A.B. de C.V., holding companies for financial, industrial and construction enterprises, and former Executive Vice President of Insurance and Pensions of ING Group, Mexico; |
| • | Jaime Ruiz Sacristán, Founder and Chairman of the board of directors of BX+, director of Elementia S.A.B. de C.V., Mexichem, S.A.B. de C.V. and Banco Popular Español, S.A., Chairman of the Mexican Stock Exchange and former Chief Executive Officer of Grupo Financiero Bital; and |
| • | Steven M. Rull, Managing Director of Detalus Advisors, LLC and Detalus Securities, LLC and co-Founder of Manchester Partners. |
Attractive market opportunity. Chicago is the third largest metropolitan area in the U.S. and ranks in the top 10% of the U.S. by median household income. The city boasts a highly educated labor force with more than 508,000 residents with bachelor’s degrees and an influx of approximately 158,000 college graduates annually. Due to its diversified economy, strong labor force and low cost of doing business compared to other large metropolitan areas, more than 400 major corporations are headquartered in Chicago, including 31 Fortune 500 companies. There are over 27,000 small and medium sized businesses in Chicago that generate between $5 million and $75 million in annual revenue, which we view as our target commercial customers. More recently, Chicago was named by KPMG as one of the top 10 technology innovation hubs worldwide, with Chicago based startups and tech companies having raised a combined $3.4 billion in capital in 2015 and 2016.
-113-
Table of Contents
The graphs below show Chicago’s diverse labor force and its lower cost of doing business as compared to other major U.S. cities.
| Chicago’s Diverse Labor Force | Cost of Doing Business Index | |

|
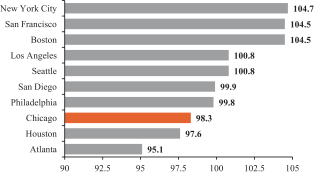
| |
Source: Bureau of Labor Statistics State and Metro Area Employment and KPMG Competitive Alternatives 2016. Labor force data as of March 31, 2017. Business cost data as of December 31, 2016.
Note: Business costs are expressed as an index. An index below 100 indicates lower costs than the U.S. baseline. An index over 100 indicates higher costs than the U.S. baseline (e.g., an index of 95.0 represents costs 5.0% below the U.S. baseline). U.S. baseline is the average of the four largest U.S. metro areas.
We believe the lack of similarly sized banks in the Chicago area creates a unique opportunity for us as we strive to provide broader and more sophisticated product capabilities than our smaller competitors while offering more responsive decision making and accessible service to local businesses and consumers than our larger competitors. The table below segments the Chicago bank landscape, which we believe illustrates the opportunity for smaller, local banks between $2 billion and $10 billion in assets:
Source: SNL Financial. Deposit and market share data as of June 30, 2016 (giving pro forma effect to pending bank acquisitions) and includes deposits at branches that were subsequently closed. Asset data as of March 31, 2017.
Note: Excludes Northern Trust from $10+bn in IL group.
-114-
Table of Contents
The table below illustrates the fragmented banking environment in Chicago, demonstrated through a number of significantly smaller banks in our market and a lack of medium sized banks compared to other large metropolitan areas in the U.S.:
| Chicago |
Top 10 U.S. MSA Avg |
|||||||
| Percentage of Banks in Market <$1bn Assets |
81.6 | % | 69.1 | % | ||||
| Percentage of Banks in Market $1—$10bn Assets |
12.8 | % | 23.8 | % | ||||
| Market Share of Top 3 Banks |
45.7 | % | 54.3 | % | ||||
| Market Share of Top 3 Local Banks |
11.1 | % | 18.1 | % | ||||
Source: SNL Financial. Data as of March 31, 2017.
Given the large number of businesses, the attractive demographics and the lack of medium sized local banks capable of serving small and medium sized businesses in our target market, we believe we are well positioned to capitalize on growth opportunities in this market.
Diversified loan growth approach. Our ability to originate loans and leases across a range of industries and product types helps us maintain a diversified loan and lease portfolio. Prior to June 2013, Metropolitan’s loan portfolio was primarily concentrated in commercial real estate. Since the Recapitalization, we have substantially diversified our loan and lease portfolio across various sectors, including commercial and industrial lending, leasing, U.S. government guaranteed loans and real estate loans, allowing us to efficiently manage our credit exposures and capitalize on more lending opportunities. We have also enhanced our product and lending capabilities with the addition of experienced lending teams hired from larger banks. Throughout this growth period we have maintained strong credit quality, and we intend to continue diversifying both our origination sources and types of loans and leases in the future.
The graphs below show the increased diversification of our loan and lease portfolio from June 30, 2013 to March 31, 2017.
| Breakdown of Loan and Lease Portfolio | ||
| June 30, 2013 |
March 31, 2017 | |
|
|
| |
-115-
Table of Contents
The graph below shows the increasing credit quality of our loan portfolio from the fourth quarter of 2013 to the first quarter of 2017.
Loan Portfolio Over Time
($ in millions)
Data as of December 31, 2013, December 31, 2014, December 31, 2015, December 31, 2016 and March 31, 2017.
| (1) | Workout loans are managed by our Special Assets Group. |
Disciplined credit risk management framework. Risk management is a core competency of our business, demonstrated by the strong credit performance of loans originated since the Recapitalization. We have implemented comprehensive policies and procedures for credit underwriting and monitoring of our loan portfolio. The sound credit practices followed by our relationship bankers allow credit decisions to be made efficiently on a local basis consistent with our underwriting standards. We attribute our success to a strong credit culture, the continuous evaluation of risk and return and the strict separation between business development and credit decision making. We are committed to reviewing and monitoring limits set at the loan, relationship, product and portfolio levels. We believe our robust approach to risk management has enabled us to grow our loan and lease portfolio without compromising credit quality.
-116-
Table of Contents
The graph below shows the decrease in nonperforming assets in our loan portfolio from the fourth quarter of 2013 to the first quarter of 2017.
Evolution of NPAs
($ in millions)
Data as of December 31, 2013, December 31, 2014, December 31, 2015, December 31, 2016 and March 31, 2017.
Premier SBA lending platform enhances fee income. Our acquisition of Ridgestone, completed in October 2016, provides us with a scalable lending platform focused on the origination and servicing of government guaranteed loans. Ridgestone was the most active originator of SBA loans in Illinois and Wisconsin, the second most active originator of SBA loans in Indiana and the sixth most active originator of SBA loans in the United States as reported by the SBA for the year ended September 30, 2016. Ridgestone originated $472 million in 7(a) loans for the SBA fiscal year ended September 30, 2016 and generated significant servicing fee income as well as income from sales of the government guaranteed portions of loans. We believe the combination of the talent, infrastructure and product knowledge we obtained through the acquisition provides us with significant opportunities for additional growth in the government guaranteed loan business throughout the country as Byline Small Business Capital.
The graphs below show the diversification, by industry and geography, of our Small Business Capital lending portfolio.
| Industry Concentration | Geographic Concentration | |
|
|
| |
Data for Small Business Capital as of March 31, 2017.
-117-
Table of Contents
Our Growth Strategy
We believe we can continue to grow our business and create stockholder value by executing the following strategies:
Capitalize on the attractive Chicago banking opportunity. Chicago has been our home for over 100 years, and we believe Chicago residents and businesses exhibit the same loyalty as we do toward our hometown. We have a deep understanding of our customers and the communities that we serve. Given the market opportunity for a commercial bank of our size and the scarcity of banks within the $2 billion to $10 billion asset range, we see a significant opportunity for Byline to gain market share in the Chicago area.
Focus on organic growth. We intend to grow our business organically in a focused and strategic manner. We also intend to maintain an asset sensitive balance sheet, which positions us to benefit in a rising interest rate environment. Our staff, systems and organizational structure have been built to support a larger organization. Over the past four years, we have hired new lending and leasing teams and expanded the breadth of our lending and leasing products. We believe that our overall capabilities, culture and opportunities for career growth will allow us to continue to attract talented new commercial and retail bankers to our business and enable our existing banking teams to drive loan growth. We also believe our bankers have further capacity to penetrate the markets and communities they serve as the brand awareness of Byline Bank continues to grow.
Consider opportunistic acquisitions. We are currently focused on organic growth, but we may consider smaller bank acquisitions that fit within the deposit strength and commercial orientation of our franchise, as well as other non-bank acquisitions. In the future, we may evaluate and act upon acquisition opportunities that we believe could produce attractive returns for our stockholders. In particular, we believe that there will be further bank consolidation in the Chicago metropolitan area and that we are well positioned to be a preferred partner for smaller institutions looking to exit. We have successfully completed two acquisitions in the past three years, both accretive to our franchise value. Our management team has over 82 years of combined experience, including structuring and integrating transactions, which we believe provides an advantage in identifying and executing on strategically and financially compelling opportunities that will supplement our organic growth strategy.
Leverage our culture and talent. We have focused intensely on developing a distinct culture guided by a core set of values that we refer to as the Things That Matter. These values underlie everything we do and are designed to foster open communication and full transparency among our colleagues. Consistent with our belief that it is important to invest in our people, over the past four years, we have enhanced our compensation programs, employee benefits and training programs as well as upgraded our workspaces. We believe these investments will enable us to retain and attract talent that fits our team concept and culture. In connection with the Recapitalization, we replaced all senior management of Metropolitan and a significant majority of its lending staff. Many of our employees hired since then have come from larger banks and have sophisticated product knowledge. We view our team as action-oriented and energized by the opportunities in our markets. We believe that our culture and the quality of our people have been catalysts of our success and will continue to propel our future.
Improve our operating leverage. We plan to focus on the following strategies to further drive our operating efficiency:
| • | Lower operating expenses related to legacy loan and owned real estate workout activities |
| • | Pursue opportunities to drive higher fee income from our account base through the increased use of our treasury management services and the sales of other products and services to loan and lease customers |
| • | Continue to increase our average deposits per branch while adapting to changing consumer behavior |
| • | Invest in technology to automate processes in order to gain scale and reduce unit costs |
-118-
Table of Contents
Our Products and Services
We are a full-service, commercial bank offering a broad range of deposit products and lending services to small and medium sized businesses, commercial real estate and financial sponsors, and consumers around our 56 branch locations in the Chicago metropolitan area and one branch in Brookfield, Wisconsin. The products and services we offer are described below.
Retail deposits
We offer customers traditional retail deposit products through our branch network and the ability to access their accounts through online and mobile banking platforms. The wide variety of deposit products we offer include non-interest bearing accounts, MMDAs, savings accounts, NOW accounts and time deposits with maturities ranging from 7 days to 5 years. We consider our core deposits, defined as all deposits except for time deposits exceeding $100,000, to be our primary and most valuable funding source, and as of March 31, 2017, core deposits represented 84% of our total deposits. We strive to retain an attractive deposit mix from both large and small customers as well as a broad market reach, which has resulted in our top 50 customers accounting for only 10% of all deposits, as of March 31, 2017. Our bankers are incentivized to acquire and maintain quality, core deposits as we depend on them to fund the majority of our loans and leases. Our incentive compensation plans are designed so that those arrangements appropriately balance risk and financial rewards, are compatible with effective risk management practices and are supported by effective governance. We believe that our long-standing and high quality relationships with our depositors who provide us with long-term funding are due to the convenience and dedicated service we offer. We leverage our expansive branch locations and deep network of customer relationships in the Chicago metropolitan area to provide both low-cost funding sources for our lending business and deposit-related fee income. We had $2.6 billion of deposits, and our cost of deposits was 0.24% for the quarter ended March 31, 2017.
| 2017 Q1 Deposit Mix | 2017 Q1 Cost of Deposits | |
|
|
| |
Source: Company data and SNL Financial. Data as of March 31, 2017.
Commercial banking
Commercial banking is a fundamental component of our business. We define commercial banking as lending to small and medium sized businesses, real estate and financial sponsors. As of March 31, 2017, loans originated or managed by commercial lending represented $1.6 billion, or 73%, of our total gross loans outstanding. The business is supported by a seasoned lending team of 20 commercial bankers with deep local experience averaging 17 years. As of March 31, 2017, our top 10 commercial lending relationships accounted for approximately 10% of our total gross loans outstanding. We offer a comprehensive range of commercial loan,
-119-
Table of Contents
deposit and cash management products. Our conservative underwriting approach and ongoing risk management has resulted in average net charge-offs of less than 0.01% for loans originated since the Recapitalization. Our primary commercial lending groups are described below:
Commercial real estate: Our commercial real estate (“CRE”) business focuses on experienced real estate professionals with long track records of performance and access to ample equity capital sources. We believe our specialized expertise and efficient decision making process differentiate us from our competitors. We offer fixed and floating rate term loans, construction financing and revolving lines of credit in a wide range of term options. Since the Recapitalization, our CRE group has originated over $570 million of commitments, across more than 180 loans. Our CRE portfolio is broadly diversified by property type including loans secured by multi-family, retail, industrial and office properties. As of March 31, 2017 the CRE group had $417 million in loans outstanding comprised of 53% fixed rate loans and 47% floating rate loans with a weighted average interest rate of 3.83% and 56% overall line of credit usage (including construction lines of credit).
Commercial & industrial: Our commercial and industrial (“C&I”) group focuses on small and lower middle market businesses with up to $50 million of annual revenue and seek to establish long term relationships. We believe this customer segment is underserved by larger institutions that do not focus on this space, as well as by smaller institutions that lack product sophistication and capabilities. We provide solutions to over 1,200 customers across a diverse range of industries. We offer a broad range of lending products including term loans, revolving lines of credit, and cash management products and services. As of March 31, 2017, the C&I group managed a portfolio of $220 million in loans outstanding. The portfolio has grown at a 53% compounded annual growth rate since June 2013.
Sponsor finance: Our sponsor finance group provides senior secured financing solutions to private equity-backed lower middle market companies throughout the U.S. with earnings before interest, tax, depreciation and amortization generally between $2 million and $10 million. Our five lending professionals in this group have over 50 years of combined experience, and have collectively closed over $500 million in sponsor finance commitments over the course of their careers. We support the acquisition, recapitalization and growth investment efforts of private equity firms operating in the lower middle market, and believe our expertise in this niche is unique for a bank our size. As of March 31, 2017 we had $123 million in sponsor finance loans outstanding.
Syndications: From time-to-time, our syndications group seeks to deploy excess liquidity by opportunistically participating in syndicated loans, acquiring whole loans, or purchasing participations from lead banks that have existing relationships with well-capitalized and experienced sponsors. We employed this strategy extensively following the Recapitalization by leveraging our relationships with local, regional and national lenders as we developed our own lending capabilities and had excess liquidity. Now, with developed lending capabilities, our participation in syndications has decreased and represents a smaller piece of our portfolio. The syndications group targets transactions in the home mortgage, commercial real estate and C&I categories that provide attractive risk/reward characteristics, and we continue to maintain the ability to sell loan positions to manage credit and specific customer and industry concentrations. As of March 31, 2017, the group had $348 million in loan syndications outstanding.
Commercial deposits and cash management: We also support our business clients with a variety of deposit and cash management products, along with business transaction accounts. Our comprehensive suite of products includes treasury services, information reporting, fraud management, cash collection and interest rate derivative products. We believe these tailored products allow us to provide a robust service offering to our clients and support their day-to-day funding and risk management needs. These services are provided through multiple points of contact including branch, online and mobile interfaces.
-120-
Table of Contents
| Commercial Banking By Business Line | Commercial Banking By State | |
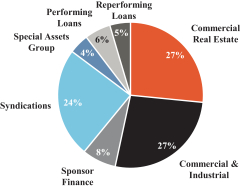
|
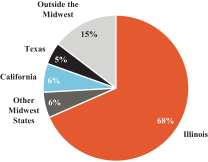
| |
Data as of March 31, 2017.
Small Business Capital
We launched our SBA business with the acquisition of Ridgestone in October 2016. Ridgestone was the sixth most active SBA lender in the country and the most active originator of SBA loans in Illinois and Wisconsin, as reported by the SBA, for the period from October 1, 2015 to September 30, 2016. The Small Business Capital operation originated $472 million in 7(a) loans for the period from October 1, 2015 to September 30, 2016. Small Business Capital originated $97 million for the three months ended March 31, 2017. This business serves small businesses in need of, and qualifying for, U.S. government guaranteed loans. We also provide SBA lending services throughout the Midwest, Tennessee and California. We generally sell the government guaranteed portion of SBA and USDA loans into the secondary market while retaining the non-guaranteed portion of the loan and the servicing rights. This allows us to realize one-time gain on sale income along with a recurring servicing and interest revenue stream. In addition to the business development officers that we rely on to generate new business, we also have a dedicated servicing, portfolio management and workout staff with specialized expertise in U.S. government guaranteed loans. As of March 31, 2017 we held $394 million in outstanding government guaranteed loans.
| Geographic Concentration | Industry Concentration | |
|
|
|
Data for Small Business Capital as of March 31, 2017.
Small ticket equipment leasing
In 2014, we purchased small ticket leasing assets from Baytree National Bank & Trust Company and Wells Fargo Corporation, and today through our bank subsidiary Byline Financial Group, we provide financing
-121-
Table of Contents
solutions for equipment vendors and their end-users. The vertical markets served by our equipment vendors are primarily specialized in healthcare, manufacturing, technology, specialty vehicles and energy efficiency. The end-users, (i.e., our lessees and borrowers) are primarily physician group practices, other healthcare related entities, manufacturers, retailers, veterinarians, wholesalers and automotive related industries. The average leasing size at origination for Byline Financial Group for the three months ended March 31, 2017 was approximately $52,000. As of March 31, 2017 the weighted average yield of the Byline Financial Group portfolio was 5.5% and the gross portfolio yield was 6.4%. Our 16 person sales force originates leases throughout the country, and we have lessees in nearly every state. For the three months ended March 31, 2017, we originated $20 million in leases of mostly new equipment. As of March 31, 2017 the Byline Financial Group had $161 million in leases outstanding with a weighted average life of approximately 2.5 years.
| Geographic Concentration | Industry Concentration | |
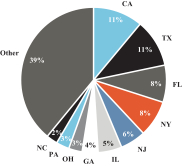
|
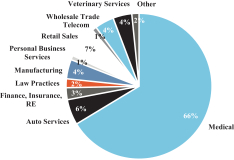
| |
Data as of March 31, 2017.
Distribution Channels
The primary market in which we operate is the Chicago metropolitan area, and our 56 branch network in this area is our core distribution channel. We operate the fifth largest branch network in the city of Chicago as of March 31, 2017, and we take advantage of our focused footprint and deep-rooted relationships to target local customers with a diversified product offering.
Our expansive local branch network enables us to gather low cost deposits, promote the Byline brand and customer loyalty, originate loans, leases and other products and maintain relationships with our customers through regular community involvement. Our branch network is fundamental to our ability to achieve successful customer outreach in line with our culture, which promotes high-touch engagement with our customers and proactive solutions.
While our branch network will continue to be our primary delivery channel, we understand the evolving banking environment requires digital interaction to keep pace with our customers’ needs. We have both rationalized our branch network to increase efficiency while investing in our product development, particularly our online and mobile banking platforms that allow customers to transact via the digital channel including bill payments, mobile deposits and peer-to-peer payment options. Approximately 76% of our checking account customers are enrolled in our online banking platform, and approximately 63% of our checking account customers are enrolled in mobile banking, as of March 31, 2017.
When we deem it advisable, we launch marketing campaigns through our branches and online platform to advertise new products or promotional services. We view these two channels as key touchpoints with our customers and frequently strategize how we can best utilize these distribution networks.
-122-
Table of Contents
Risk Management
We believe that effective risk management is of primary importance to our organization. Risk management refers holistically to the activities by which we identify, measure, monitor, evaluate and manage the risks we face in the course of our banking activities. These include liquidity, interest rate, credit, operational, cyber/technological, legal, compliance, regulatory, strategic, financial and reputational risk exposures. Our board of directors and management team has created a risk-conscious culture that is focused on quality growth, which starts with highly capable and experienced risk management teams and infrastructure capable of addressing the evolving risks we face, as well as the changing regulatory and compliance landscape. Our risk management approach employs comprehensive policies and processes to establish robust governance and emphasizes personal ownership and accountability for risk with all our employees. We believe a disciplined and conservative underwriting approach has been the key to our strong asset quality following the Recapitalization.
Our board of directors sets the tone at the top of our organization, adopting and overseeing the implementation of our company-wide risk management framework, which establishes our overall risk appetite and risk management strategy. The risk committee of our board of directors provides oversight of our enterprise risk management function. The risk committee approves the Risk Appetite Framework, which includes risk policies, procedures, limits, targets and reporting structured to guide decisions regarding the appropriate balance between risk and return considerations in our business, receives periodic reporting on the risks and control environment effectiveness and monitors risk levels in relation to the approved risk appetite. Additionally, the audit committee of the board of directors oversees governance of the regulatory, compliance, financial and internal control risks of the company. The Executive Credit Committee of the board is responsible for establishing and managing the overall credit risk framework and the related policies governing that risk. Our management and board of directors place significant focus on maintaining a healthy risk profile and ensuring sustainable growth. Our risk appetite seeks to balance the risks necessary to achieve our strategic goals while ensuring that our risks are appropriately managed and remain within our defined limits.
Enterprise risk management
Our Enterprise Risk Management Committee, which is comprised primarily of members of senior management, provides oversight of our risk management across our business. The committee is chaired by our Chief Risk Officer and includes the senior managers of major functional business units and supporting risk management personnel. The responsibilities of the Enterprise Risk Management Committee include monitoring our overall risk profile and ensuring that it remains within the board-approved Risk Appetite Framework, implementing remediation actions for risk exposures that are outside of our approved risk limits or deemed imprudent, assessing new and emerging risks, monitoring our risk management culture, assessing acceptability of the risk impacts of any material change to our business and overseeing compliance with regulatory expectations and requirements.
Our Chief Risk Officer leads our enterprise risk management function and oversees the principal risks facing our business. Our Chief Risk Officer reports to our Chief Executive Officer and has direct access to the risk committee of our board of directors. Our enterprise risk management function implements a company-wide approach to risk taking and coordinates risk management efforts. This group develops an enterprise risk framework, works with business units in risk identification, materiality assessment and quantification processes and ensures the adopted risk quantification approach is integrated within Byline Bank’s risk framework.
Credit and interest rate risk management
Credit risk is the risk that borrowers or counterparties will be unable or unwilling to repay their obligations in accordance with the underlying contractual terms and the risk that credit assets will suffer significant deterioration in market value. We manage and control credit risk in our loan and lease portfolio by adhering to well-defined underwriting criteria and account administration standards established by management.
-123-
Table of Contents
Written credit policies document underwriting standards, approval levels, exposure limits and other limits or standards deemed necessary and prudent. Portfolio diversification at the obligor, industry and product levels is actively managed to mitigate concentration risk. In addition, credit risk management includes an independent credit review process that assesses compliance with commercial, real estate and consumer credit policies, risk rating standards and other critical credit information. In addition to implementing risk management practices that are based upon established and sound lending practices, we adhere to sound credit principles. We understand and evaluate our customers’ borrowing needs and capacity to repay, in conjunction with their character and history.
The Executive Credit Committee of our board of directors provides oversight of our credit risk management function. The Executive Credit Committee oversees the risk appetite, the development of policies, practices and systems for measuring credit risk and monitors the performance and quality of our credit portfolio. At the management level, our Chief Credit Officer leads this process and has primary oversight, ultimately delegating credit approval authority to our credit officers with the approval of the board of directors and Executive Credit Committee. We believe this robust governance system provides for a fulsome credit approval process.
Our credit officers are assigned specific lines of business and work closely with our Chief Credit Officer and Executive Credit Committee to monitor lending trends, concentrations, regulations and strategies to ensure underwriting guidance is aligned with our credit philosophy. We review our credit policies regularly and any changes must be approved by our board of directors. Our credit team also produces various credit statistics on our loan and lease portfolio reported to our board on a regular basis.
Our Chief Credit Officer has the authority to approve loans with principal amounts up to $5 million. Loans with principal amounts between $5 million and $10 million require the approval of our Bank Credit Committee, which is comprised of members of senior management including our Chief Executive Officer, Chief Risk Officer, Head of Commercial Banking, and Chairman of the Board. The Executive Credit Committee, which includes members of our board of directors, must approve all loans with principal amounts greater than $10 million.
Our bankers are our first line of defense for assuring credit quality and the integrity of our risk rating process. Our bankers must have an understanding of the nature of the borrower’s business, operations, competitive position, financial requirements and the nature and value of the underlying collateral. Our credit department serves as a second line of defense and ensures a uniform approach to the assessment and management of credit by formulating processes and guidelines and defining credit standards. Internal loan review serves as a third line of defense and reports to the audit committee through the Chief Risk Officer. We currently outsource the internal loan review to a major independent firm. The firm conducts a minimum of three onsite reviews each year covering in excess of 40% of our loan portfolio. The firm independently selects the sample of loans for review, which is augmented by special emphasis items from our Chief Risk Officer and chair of the Executive Credit Committee. Additionally, the Credit Administrative Group conducts a portfolio review semiannually with each Commercial Lending unit. These credit management practices build and strengthen our banking relationships with our customers while identifying potential issues in a proactive manner to avoid unnecessary risk.
Our management of interest rate risk is overseen by our Asset and Liability Committee, which is chaired by our Treasurer based on a risk management infrastructure approved by our board of directors that outlines reporting and measurement requirements. In particular, this infrastructure sets limits and management targets, calculated monthly, for various interest rate-related metrics, including our economic value sensitivity, our economic value of equity and net interest income simulations involving parallel shifts in interest rate curves, steepening and flattening yield curves and various prepayment and deposit duration assumptions. Our interest rate management policies also require a periodic review of all key assumptions used, such as identifying appropriate interest rate scenarios, setting loan prepayment rates and deposit durations based on historical analysis, and the targeted investment term of capital.
-124-
Table of Contents
Operational risk management
Operational risk is the risk of loss arising from inadequate or failed processes, people or systems, external events (such as natural disasters), or compliance, reputational or legal matters, including the risk of loss resulting from fraud, litigation and breaches in data security. Operational risk is inherent in all of our business ventures and the management of that risk is important to the achievement of our objectives. We have an operational risk framework that consists of policies and procedures, a Risk & Control Self-Assessment Program, operational loss/near miss tracking, a Branch Review Program and an Operational Risk Management Committee. This framework allows for the ongoing assessment of risks within our business and evaluates the strength and effectiveness of our mitigating strategies. We have established key risk indicators and corresponding tolerance thresholds to determine adherence to our risk appetite. Additionally, operational risk reporting supports transparency and the proactive management of risk exposures.
Our Head of Operations & Technology Services directs the operational risk activities within Byline Bank. The operations coordinators in each operational department serve as a first line of defense against operational risk. These individuals oversee the quality of transaction processing on a daily basis by following documented procedures, workflows and policies. Our operational risk department serves as the second line of defense through managing the Risk & Control Self-Assessment Program, Branch Review Program, operational reviews of product usage, operational loss/near miss reporting and regular risk assessments. Internal audit reviews our programs and our operational functions on an annual basis and serves as the third line of defense. These operational risk practices are designed to allow us to proactively identify new risks, properly assess our controls for known risks and respond to events appropriately and consistently when they occur.
Technology risk
Technology Risk represents the risk of financial loss, disruption, or reputational damage from a failure of information technology (“IT”) systems, including both hardware and software failures and defects, as well as malicious attempts by third parties to inflict intentional harm, such as insider sabotage, malware or cyber-attack. Technology risk may arise from staff errors, technology system failures, third party disruption, unauthorized system access, natural disasters or cyber threats. We manage technology risks through the planning and monitoring of IT activities. We also maintain compliance with legal requirements and regulatory guidance (including the Gramm-Leach-Bliley Act and guidance from the Federal Financial Institutions Examination Council). We have established an Information Technology Steering Committee as a subcommittee of the Enterprise Risk Management Committee to assist our board of directors and senior management in overseeing the IT-related activities and the risk inherent therein. Important areas of focus for the Information Technology Steering Committee include overseeing IT strategic plans and investment priorities, monitoring major IT projects, implementing IT policies and monitoring the general level of risk. We have developed and monitor key metrics to measure the effectiveness of our technology risk management and these results are reported and reviewed regularly. For a discussion of our information technology systems, see “—Information Technology Systems” below.
The IT group is managed by the Director of Information Technology, who reports to the Head of Operations and Technology Services, and serves as our first line of defense. The Director of Information Technology is responsible for managing effective and strong IT controls. These controls are outlined in several areas, including the key financial control framework, the Federal Financial Institutions Examination Council General IT Examination guidelines and the Gramm-Leach-Bliley Act. The Information Security (IS) Department serves as our second line of defense for technology risk. Our IS Department oversees network and perimeter security monitoring, a Risk & Control Self-Assessment Program, a logging and monitoring program, regular monitoring of IT controls with reporting and metrics, an incident response program, a security awareness program and disaster recovery and business continuity programs. The IS Department plays an important role in
-125-
Table of Contents
the evaluation of IT risk with our vendor management program. As an added level of oversight and our third line of defense, our technology management practices and policies are independently reviewed on an annual basis by
various audit and examination groups, including internal teams, third party vendors and local and national regulators. The results of the audits and examinations are tracked and reported to management and the appropriate board committees.
Policies and Procedures
We promote a culture of compliance that starts at the top of our organization and emphasizes standards of honesty and integrity. Our Policy Committee reviews and approves management-level policies and recommends to the board of directors approval of the board-level policies. Our risk management culture is further supported by a Procedure Committee that monitors our procedures and forms for compliance with the policies approved by the board and the Policy Committee. We also have a whistleblower process to allow for independent reporting of any related issues.
Our Enhanced Due Diligence policy is fundamental to our Bank Secrecy Act (“BSA”)/Anti-Money Laundering (“AML”) compliance program. The goal of our Enhanced Due Diligence policy and program is to develop and maintain an awareness of the unique financial details of our customers and the ability to predict the type and frequency of transactions in which our customers are likely to engage. In doing so, we can better identify, research and report suspicious activity as required by BSA regulations. The BSA/Compliance/Community Reinvestment Act Senior Management Subcommittee of the Enterprise Risk Management Committee assists the board of directors in discharging its responsibility to ensure we maintain an effective BSA/AML control structure. Our BSA policy and program includes annual BSA/AML and Office of Foreign Assets Control risk assessments.
Investment Portfolio
As of March 31, 2017 the fair value of our investment portfolio totaled $723.2 million, with an average effective yield of 2.16% and an estimated duration of approximately 4.5 years. The primary objectives of the investment portfolio are to generate economic value, provide liquidity in accordance with the liquidity regulations and to be responsive to cash needs and assist in managing interest rate risk. The majority of our investment portfolio, or 66.5%, consists of residential mortgage-backed securities, along with 14.9% in commercial mortgage-backed securities and 5.6% in municipal securities. The remainder of our securities portfolio is invested in corporate bonds, asset backed securities, trust preferred securities and other securities. We regularly evaluate the composition of our investment portfolio as the interest rate yield curve changes and may sell investment securities from time to time to adjust our exposure to interest rates or to provide liquidity to meet loan demand.
Competition
The financial services industry is highly competitive as we compete for loans, leases, deposits and customer relationships in our market. Competition involves efforts to retain current clients, make new loans and obtain new deposits, increase the scope and sophistication of services offered and offer competitive interest rates paid on deposits and charged on loans. Within our branch footprint, we primarily face competition from national, regional and other local banks that have established branch networks throughout the Chicago metropolitan area, giving them visible retail presence to customers.
In commercial banking, we face competition to underwrite loans to sound, stable businesses and real estate projects at competitive price levels that make sense for our business and risk profile. Our major commercial bank competitors include larger national, regional and local banks that may have the ability to make loans on larger projects than we can or provide a larger mix of product offerings. We also compete with smaller local banks that may have aggressive pricing and unique terms on various types of loans.
-126-
Table of Contents
In retail banking, we primarily compete with local banks that have visible retail presence and personnel in our market areas. The primary factors driving competition in consumer banking are customer service, interest rates, fees charged, branch location and hours of operation and the range of products offered. We compete for deposits by advertising, offering competitive interest rates and seeking to provide a higher level of personal service. We also face competition from non-traditional alternatives to banks.
We believe our ability to provide a flexible, sophisticated product offering and an efficient process to our customers allows us to stay competitive in the financial services environment. Our local presence and hands-on approach enables us to provide a high level of service that our customers value.
Intellectual Property
In the highly competitive banking industry in which we operate, intellectual property is important to the success of our business. We registered the “Byline Bank” and “Byline Bancorp” trademarks with the United States Patent and Trademark Office, along with various other trademarks and logos, and we intend to protect the use of our trademarks and other intellectual property nationwide.
Information Technology Systems
We devote significant resources to maintain stable, reliable, efficient and scalable information technology systems. We utilize a single, highly integrated core processing system from a third party vendor across our entire business that improves cost efficiency and acquisition integration. We work with our third party vendors to monitor and maximize the efficiency of our use of their applications. We use integrated systems to originate and process loans and deposit accounts, which reduces processing time, improves customer experience and reduces costs.
We require a resilient, agile, secure and sustainable information technology infrastructure to support corporate strategic goals, deliver standardized services, optimize technology investments and understand and align processes and procedures into daily activities providing enterprise solutions that support business practices. Following the Recapitalization, we enhanced our technology platform to operate more efficiently and with the ability to increase in scale. Our goal is to ensure that technology and human resources are adequately developed, properly utilized, and managed to support business unit and enterprise wide strategic goals.
We have implemented a virtualization strategy for our servers and storage, reducing the dependency on physical hardware. Currently, 96% of all production data center servers are virtualized. In line with industry best practices, we also employed new security devices and internal controls to protect our internal network from external networks and unauthorized personnel, as we view information security as a critical competency. We leverage multiple tools to collect, correlate and log information from various technology resources, as well as provide intrusion detection and intrusion prevention. We utilize an outsourced managed security service for internal and external vulnerability assessments and pro-active perimeter cyber security protection. Our IS Department proactively identifies and monitors systems to analyze risk to the organization and implement mitigating controls where appropriate. Formal annual business continuity and disaster recovery exercises are conducted regularly, along with continuous training. We have successfully integrated businesses and platforms gained through acquisitions, which we believe is fundamental to our strategic goals. We have benefited from the investments made in our organization and technology platforms to efficiently convert acquired business models to seamlessly fit within our infrastructure.
Employees
As of March 31, 2017 we had 791 full-time equivalent employees. None of our employees are parties to a collective bargaining agreement. We consider our relationship with our employees to be good and have not experienced interruptions of operations due to labor disagreements.
-127-
Table of Contents
Properties
Our corporate headquarters is located at 180 North LaSalle Street, Suite 300, Chicago, IL 60601. In addition to our corporate headquarters, we operated 56 branch offices located in the Chicago metropolitan area and one branch office in Brookfield, Wisconsin as of March 31, 2017. We lease 19 of our retail branch offices and our headquarters and own the remainder of our retail branch offices. We are continually evaluating opportunities to improve our existing branches, and we have closed and may close branches in certain circumstances to improve our efficiency.
Legal and Regulatory Proceedings
We operate in a highly regulated environment. From time to time we are a party to various litigation matters incidental to the conduct of our business. We are not presently party to any legal proceedings the resolution of which we believe would have a material adverse effect on our business, prospects, financial condition, liquidity, results of operation, cash flows or capital levels.
-128-
Table of Contents
We and our subsidiaries are subject to extensive regulation under federal and state banking laws that establish a comprehensive framework for our operations. This framework may materially affect our growth potential and financial performance and is intended primarily for the protection of depositors, customers, federal deposit insurance funds and the banking system as a whole, not for the protection of our stockholders and creditors. Significant elements of the statutes, regulations and policies applicable to us and our subsidiaries are described below.
Regulatory Agencies
Byline is a bank holding company under the BHC Act. Consequently, Byline and its subsidiaries are subject to supervision, regulation and examination by the Federal Reserve. The BHC Act provides generally for “umbrella” regulation of bank holding companies and functional regulation of holding company subsidiaries by applicable regulatory agencies. Byline Bank, our bank subsidiary, is an FDIC-insured commercial bank chartered under the laws of Illinois. Our bank is not a member of the Federal Reserve System. Consequently, the FDIC and the IDFPR are the primary regulators of our bank and also regulate our bank’s subsidiaries. As the owner of an Illinois-chartered bank, Byline is also subject to supervision and examination by the IDFPR. Following completion of this offering, Byline will be subject to the disclosure and regulatory requirements of the Securities Act and the Exchange Act as administered by the SEC, and, following the listing of our common stock, the rules adopted by the NYSE applicable to listed companies.
Permissible Activities for Bank Holding Companies
In general, the BHC Act limits the business of bank holding companies to banking, managing or controlling banks and other activities that the Federal Reserve has determined to be so closely related to banking as to be a proper incident thereto, which include certain activities relating to extending credit or acting as an investment or financial advisor. Byline currently does not conduct any non-banking activities through its parent company or through any non-bank subsidiaries.
Bank holding companies that qualify and elect to be treated as “financial holding companies” may engage in a broader range of additional activities than bank holding companies that are not financial holding companies. In particular, financial holding companies may engage in activities that are (i) financial in nature or incidental to such financial activities or (ii) complementary to a financial activity and do not pose a substantial risk to the safety and soundness of depository institutions or the financial system generally. These activities include securities underwriting and dealing, insurance underwriting and making merchant banking investments. We have not elected to be treated as a financial holding company and currently have no plans to make a financial holding company election.
The Federal Reserve has the power to order any bank holding company or any of its subsidiaries to terminate any activity or to terminate its ownership or control of any subsidiary when the Federal Reserve has reasonable grounds to believe that continuing such activity, ownership or control constitutes a serious risk to the financial soundness, safety or stability of any bank subsidiary of the bank holding company.
Permissible Activities for Banks
As an Illinois-chartered commercial bank, our bank’s business is subject to extensive supervision and regulation by state and federal bank regulatory agencies. Our business is generally limited to activities permitted by Illinois law and any applicable federal laws. Under the Illinois Banking Act, our bank may generally engage in all usual banking activities, including, among other things, accepting deposits; lending money on personal and real estate security; issuing letters of credit; buying, discounting, and negotiating promissory notes and other forms of indebtedness; buying and selling foreign currency and, subject to certain limitations, certain investment securities; engaging in certain insurance activities and maintaining safe deposit boxes on premises.
-129-
Table of Contents
Illinois law also imposes restrictions on Byline Bank’s activities intended to ensure the safety and soundness of our bank. For example, Byline Bank is restricted under the Illinois Banking Act from investing in certain types of investment securities and is generally limited in the amount of money it can lend to a single borrower or invest in securities issued by a single issuer.
Acquisitions by Bank Holding Companies
The BHC Act, Section 18(c) of the Federal Deposit Insurance Act, popularly known as the “Bank Merger Act”, the Illinois Banking Act, the Illinois Bank Holding Company Act and other federal and state statutes regulate acquisitions of commercial banks and other FDIC-insured depository institutions. We must obtain the prior approval of the Federal Reserve under the BHC Act before (i) acquiring more than 5% of the voting stock of any FDIC-insured depository institution or other bank holding company (other than directly through our bank), (ii) acquiring all or substantially all of the assets of any bank or bank holding company or (iii) merging or consolidating with any other bank holding company. Under the Bank Merger Act, the prior approval of the FDIC is required for our bank to merge with another bank or purchase all or substantially all of the assets or assume any of the deposits of another FDIC-insured depository institution or to assume certain liabilities of non-banks. In reviewing applications seeking approval of merger and acquisition transactions, banking regulators consider, among other things, the competitive effect and public benefits of the transactions, the capital position and managerial resources of the combined organization, the risks to the stability of the U.S. banking or financial system, the applicant’s performance record under the CRA, the applicant’s compliance with fair housing and other consumer protection laws and the effectiveness of all organizations involved in combating money laundering activities. In addition, failure to implement or maintain adequate compliance programs could cause banking regulators not to approve an acquisition where regulatory approval is required or to prohibit an acquisition even if approval is not required.
Dividends; Stress Testing
Byline is a legal entity separate and distinct from Byline Bank and other subsidiaries. As a bank holding company, Byline is subject to certain restrictions on its ability to pay dividends under applicable banking laws and regulations.
Federal banking regulators are authorized to determine under certain circumstances relating to the financial condition of a bank holding company or a bank that the payment of dividends would be an unsafe or unsound practice and to prohibit payment thereof. In particular, federal banking regulators have stated that paying dividends that deplete a banking organization’s capital base to an inadequate level would be an unsafe and unsound banking practice and that banking organizations should generally pay dividends only out of current operating earnings. In addition, in the current financial and economic environment, the Federal Reserve has indicated that bank holding companies should carefully review their dividend policy and has discouraged payment ratios that are at maximum allowable levels unless both asset quality and capital are very strong. Under the Capital Rules, institutions that seek to pay dividends must maintain 2.5% in Common Equity Tier 1 capital attributable to the capital conservation buffer, which is to be phased in over a three-year period that began on January 1, 2016. See “—Regulatory Capital Requirements”.
A significant portion of our income comes from dividends from our bank, which is also the primary source of our liquidity. In addition to the restrictions discussed above, our bank is subject to limitations under Illinois law regarding the level of dividends that it may pay to us. Under the Illinois Banking Act, Byline Bank generally may not pay dividends in excess of its net profits. Under these restrictions, Byline Bank could pay aggregate dividends of approximately $66.4 million to us without obtaining affirmative government approvals as of March 31, 2017.
In October 2012, as required by the Dodd-Frank Act, the Federal Reserve and the FDIC published final rules regarding company-run stress testing. These rules require bank holding companies and banks with average
-130-
Table of Contents
total consolidated assets greater than $10 billion to conduct an annual company-run stress test of capital, consolidated earnings and losses under one base and at least two stress scenarios provided by the federal banking regulators. Neither we nor our bank is currently subject to the stress testing requirements, but we expect that if we become subject to those requirements, the Federal Reserve, the FDIC and the IDFPR will consider our results and those of our bank as an important factor in evaluating our and our bank’s capital adequacy, any proposed acquisitions by us or by our bank and whether any proposed dividends or stock repurchases by us or by our bank may be an unsafe or unsound practice.
Transactions with Affiliates and Insiders
Transactions between our bank and its subsidiaries, on the one hand, and Byline or any other subsidiary, on the other hand, are regulated under Sections 23A and 23B of the Federal Reserve Act. The Federal Reserve Act imposes quantitative and qualitative requirements and collateral requirements on covered transactions by Byline Bank with, or for the benefit of, its affiliates. Generally, the Federal Reserve Act limits the extent to which our bank or its subsidiaries may engage in “covered transactions” with any one affiliate to an amount equal to 10% of our bank’s capital stock and surplus, limits the aggregate amount of all such transactions with all affiliates to an amount equal to 20% of such capital stock and surplus, and requires those transactions to be on terms at least as favorable to our bank as if the transaction were conducted with an unaffiliated third party. Covered transactions are defined by statute to include a loan or extension of credit, as well as a purchase of securities issued by an affiliate, a purchase of assets (unless otherwise exempted by the Federal Reserve) from the affiliate, certain derivative transactions with an affiliate, the acceptance of securities issued by the affiliate as collateral for a loan, and the issuance of a guarantee, acceptance or letter of credit on behalf of an affiliate. In addition, any credit transactions with any affiliate, must be secured by designated amounts of specified collateral.
Federal law also limits our bank’s authority to extend credit to its directors, executive officers and 10% stockholders, as well as to entities controlled by such persons. Among other things, extensions of credit to insiders are required to be made on terms that are substantially the same as, and follow credit underwriting procedures that are not less stringent than, those prevailing for comparable transactions with unaffiliated persons. Also, the terms of such extensions of credit may not involve more than the normal risk of non-repayment or present other unfavorable features and may not exceed certain limitations on the amount of credit extended to such persons individually and in the aggregate. In addition, certain of our stockholders are foreign nationals, and we and certain of these foreign national stockholders have entered into commitments with the Federal Reserve that restrict our ability to engage in certain business transactions without the consent of the Federal Reserve. Certain of our stockholders have also entered into passivity commitments with the Federal Reserve that generally restrict these stockholders from entering into banking or nonbanking transactions with us. For further information, see “Certain Relationships and Related Transactions—Foreign National Commitments and Passivity Commitments”.
Source of Strength
Federal Reserve policy and federal law require bank holding companies to act as a source of financial and managerial strength to their subsidiary banks. Under this requirement, we are expected to commit resources to support Byline Bank, including at times when we may not be in a financial position to provide such resources, and it may not be in our, or our stockholders’ or creditors’, best interests to do so. In addition, any capital loans we make to our bank are subordinate in right of payment to depositors and to certain other indebtedness of our bank. In the event of our bankruptcy, any commitment by us to a federal banking regulatory agency to maintain the capital of our bank will be assumed by the bankruptcy trustee and entitled to priority of payment.
Regulatory Capital Requirements
The Federal Reserve monitors the capital adequacy of our holding company on a consolidated basis, and the FDIC and the IDFPR monitor the capital adequacy of our bank. The banking regulators use a combination of
-131-
Table of Contents
risk-based guidelines and a leverage ratio to evaluate capital adequacy. The risk-based capital guidelines applicable to us and our bank are based on the Basel Committee’s December 2010 final capital framework, known as Basel III, as implemented by the federal banking regulators. The risk-based guidelines are intended to make regulatory capital requirements sensitive to differences in credit and market risk profiles among banks and bank holding companies, to account for off-balance sheet exposure and to minimize disincentives for holding liquid assets.
Basel III and the Capital Rules. In July 2013, the federal banking regulators approved final rules, or the Capital Rules, implementing the Basel Committee’s December 2010 final capital framework for strengthening international capital standards, known as Basel III, and various provisions of the Dodd-Frank Act. The Capital Rules substantially revise the risk-based capital requirements applicable to bank holding companies and banks, including us and our bank, compared to the previous risk-based capital rules. The Capital Rules revise the components of capital and address other issues affecting the numerator in regulatory capital ratio calculations. The Capital Rules, among other things, (i) include a new capital measure called “Common Equity Tier 1” (“CET1”), (ii) specify that Tier 1 capital consists of CET1 and “Additional Tier 1 capital” instruments meeting certain revised requirements, (iii) define CET1 narrowly by requiring that most deductions/adjustments to regulatory capital measures be made to CET1 and not to the other components of capital, and (iv) expand the scope of the deductions/adjustments to capital as compared to prior regulations. The Capital Rules also address risk weights and other issues affecting the denominator in regulatory capital ratio calculations, including replacing the existing risk-weighting approach derived from Basel I with a more risk-sensitive approach based, in part, on the standardized approach adopted by the Basel Committee in its 2004 capital accords, known as Basel II. The Capital Rules also implement the requirements of Section 939A of the Dodd-Frank Act to remove references to credit ratings from the federal banking regulators’ rules. Subject to a phase-in period for various provisions, the Capital Rules became effective for us and for our bank beginning on January 1, 2015.
Under the Basel III Capital Rules, the minimum capital ratios are (i) 4.5% CET1 to risk-weighted assets, (ii) 6% Tier 1 capital (that is, CET1 plus Additional Tier 1 capital) to risk-weighted assets, (iii) 8% total capital (that is, Tier 1 capital plus Tier 2 capital) to risk-weighted assets and (iv) 4% Tier 1 capital to average consolidated assets as reported on consolidated financial statements (known as the “leverage ratio”).
The current Capital Rules also include a capital conservation buffer designed to absorb losses during periods of economic stress. The capital conservation buffer is composed entirely of CET1, on top of these minimum risk-weighted asset ratios. The implementation of the capital conservation buffer began on January 1, 2016 at the 0.625% level and will be phased in over a three-year period (increasing by 0.625% on each subsequent January 1) until it reaches 2.5% on January 1, 2019. In addition, the Capital Rules provide for a countercyclical capital buffer applicable only to certain covered institutions. We do not expect the countercyclical capital buffer to be applicable to us or our bank. Banking institutions with a ratio of CET1 to risk-weighted assets above the minimum but below the capital conservation buffer (or below the combined capital conservation buffer and countercyclical capital buffer, when the latter is applied) will face constraints on dividends, equity repurchases and compensation based on the amount of the shortfall.
When fully phased-in, the Capital Rules will require us, and our bank, to maintain an additional capital conservation buffer of 2.5% of CET1, effectively resulting in minimum ratios of (i) 7% CET1 to risk-weighted assets, (ii) 8.5% Tier 1 capital to risk-weighted assets, (iii) 10.5% total capital to risk-weighted assets and (iv) a minimum leverage ratio of 4%.
The Capital Rules provide for a number of deductions from and adjustments to CET1. These include, for example, the requirement that mortgage servicing rights, certain deferred tax assets and significant investments in non-consolidated financial entities be deducted from CET1 to the extent that any one such category exceeds 10% of CET1 or all such categories in the aggregate exceed 15% of CET1. Implementation of the deductions and other adjustments to CET1 began on January 1, 2015 and will be phased in over a four-year period (beginning at 40% on January 1, 2015 and an additional 20% per year thereafter). The Capital Rules also generally preclude
-132-
Table of Contents
certain hybrid securities, such as trust preferred securities, from being counted as Tier 1 capital for most bank holding companies. Bank holding companies such as us who had less than $15 billion in assets as of December 31, 2009 (and who continue to have less than $15 billion in assets) are permitted to include qualifying trust preferred securities issued prior to May 19, 2010 as Additional Tier 1 capital under the Capital Rules, however.
In addition, under the general risk-based Capital Rules, the effects of accumulated other comprehensive income items included in capital were excluded for the purposes of determining regulatory capital ratios. Under the Capital Rules, the effects of certain accumulated other comprehensive income items are not excluded; however, non-advanced approaches banking organizations, including Byline and Byline Bank, were able to make a one-time permanent election to continue to exclude these items. Both Byline and Byline Bank made this election.
The Capital Rules also prescribed a new standardized approach for risk weightings that expanded the risk-weighting categories from the current four Basel I-derived categories (0%, 20%, 50% and 100%) to a much larger and more risk-sensitive number of categories, depending on the nature of the assets, generally ranging from 0%, for U.S. government and agency securities, to 600%, for certain equity exposures, and resulting in higher risk weights for a variety of asset categories.
With respect to our bank, the Capital Rules also revised the prompt corrective action regulations pursuant to Section 38 of the Federal Deposit Insurance Act (the “FDIA”). See “—Prompt Corrective Action Framework”.
Liquidity Regulations
Historically, the regulation and monitoring of bank and bank holding company liquidity has been addressed as a supervisory matter, without required formulaic measures. The Basel III final framework requires banks and bank holding companies to measure their liquidity against specific liquidity tests that, although similar in some respects to liquidity measures historically applied by banks and regulators for management and supervisory purposes, going forward would be required by regulation. One test, referred to as the liquidity coverage ratio, or LCR, is designed to ensure that the banking entity maintains an adequate level of unencumbered high-quality liquid assets equal to the entity’s expected net cash outflow for a 30-day time horizon (or, if greater, 25% of its expected total cash outflow) under an acute liquidity stress scenario. The other test, referred to as the net stable funding ratio, or NSFR, is designed to promote more medium- and long-term funding of the assets and activities of banking entities over a one-year time horizon. These requirements will incentivize banking entities to increase their holdings of U.S. Treasury securities and other sovereign debt as a component of assets and increase the use of long-term debt as a funding source.
In September 2014, the federal banking regulators approved final rules implementing the LCR for advanced approaches banking organizations (i.e., banking organizations with $250 billion or more in total consolidated assets or $10 billion or more in total on-balance sheet foreign exposure) and a modified version of the LCR for bank holding companies with at least $50 billion in total consolidated assets that are not advanced approach banking organizations. Neither of these final versions of the LCR would apply to us or our bank. In the second quarter of 2016, the federal banking regulators issued a proposed rule that would implement the NSFR for certain U.S. banking organizations. The proposed rule would require certain U.S. banking organizations to ensure they have access to stable funding over a one-year time horizon and has an effective date of January 1, 2018. The proposed rule would not apply to U.S. banking organizations with less than $50 billion in total consolidated assets such as Byline and Byline Bank.
Prompt Corrective Action Framework
The FDIA also requires the federal banking regulators to take prompt corrective action in respect of depository institutions that fail to meet specified capital requirements. The FDIA establishes five capital
-133-
Table of Contents
categories (“well-capitalized”, “adequately capitalized”, “undercapitalized”, “significantly undercapitalized” and “critically undercapitalized”), and the federal banking regulators are required to take certain mandatory supervisory actions, and are authorized to take other discretionary actions, with respect to institutions that are undercapitalized, significantly undercapitalized or critically undercapitalized. The severity of these mandatory and discretionary supervisory actions depends upon the capital category in which the institution is placed. The relevant capital measures, which reflect changes under the Capital Rules that became effective on January 1, 2015, are the total capital ratio, the CET1 capital ratio, the Tier 1 capital ratio and the leverage ratio.
A bank will be (i) “well capitalized” if the institution has a total risk-based capital ratio of 10% or greater, a CET1 capital ratio of 6.5% or greater, a Tier 1 risk-based capital ratio of 8% or greater and a leverage ratio of 5% or greater, and is not subject to any order or written directive by any such regulatory authority to meet and maintain a specific capital level for any capital measure; (ii) “adequately capitalized” if the institution has a total risk-based capital ratio of 8% or greater, a CET1 capital ratio of 4.5% or greater, a Tier 1 risk-based capital ratio of 6% or greater and a leverage ratio of 4% or greater and is not “well capitalized”; (iii) “undercapitalized” if the institution has a total risk-based capital ratio that is less than 8%, a CET1 capital ratio less than 4.5%, a Tier 1 risk-based capital ratio of less than 6% or a leverage ratio of less than 4%; (iv) “significantly undercapitalized” if the institution has a total risk-based capital ratio of less than 6%, a CET1 capital ratio less than 3%, a Tier 1 risk-based capital ratio of less than 4% or a leverage ratio of less than 3%; and (v) “critically undercapitalized” if the institution’s tangible equity is equal to or less than 2% of average quarterly tangible assets. A bank’s capital category is determined solely for the purpose of applying prompt corrective action regulations, and the capital category may not constitute an accurate representation of Byline Bank’s overall financial condition or prospects for other purposes.
The FDIA generally prohibits a depository institution from making any capital distributions (including payment of a dividend) or paying any management fee to its parent holding company if the depository institution would thereafter be “undercapitalized”. An institution that is categorized as undercapitalized, significantly undercapitalized or critically undercapitalized is required to submit an acceptable capital restoration plan to its appropriate federal banking regulator. Under the FDIA, in order for the capital restoration plan to be accepted by the appropriate federal banking agency, a bank holding company must guarantee that a subsidiary depository institution will comply with its capital restoration plan, subject to certain limitations. The bank holding company must also provide appropriate assurances of performance. The obligation of a controlling bank holding company under the FDIA to fund a capital restoration plan is limited to the lesser of 5% of an undercapitalized subsidiary’s assets or the amount required to meet regulatory capital requirements. An undercapitalized institution is also generally prohibited from increasing its average total assets, making acquisitions and capital distributions, establishing any branches or engaging in any new line of business, except in accordance with an accepted capital restoration plan or with the approval of the FDIC. Institutions that are undercapitalized or significantly undercapitalized and either fail to submit an acceptable capital restoration plan or fail to implement an approved capital restoration plan may be subject to a number of requirements and restrictions, including orders to sell sufficient voting stock to become adequately capitalized, requirements to reduce total assets and cessation of receipt of deposits from correspondent banks.
Significantly undercapitalized depository institutions may be subject to a number of requirements and restrictions, including orders to sell sufficient voting stock to become adequately capitalized, requirements to reduce total assets, and cessation of receipt of deposits from correspondent banks. Critically undercapitalized depository institutions are subject to appointment of a receiver or conservator.
The appropriate federal banking agency may, under certain circumstances, reclassify a well capitalized insured depository institution as adequately capitalized. The FDIA provides that an institution may be reclassified if the appropriate federal banking agency determines (after notice and opportunity for hearing) that the institution is in an unsafe or unsound condition or deems the institution to be engaging in an unsafe or unsound practice. The appropriate agency is also permitted to require an adequately capitalized or undercapitalized institution to comply with the supervisory provisions as if the institution were in the next lower
-134-
Table of Contents
category (but not treat a significantly undercapitalized institution as critically undercapitalized) based on supervisory information other than the capital levels of the institution. An institution may be downgraded to, or deemed to be in, a capital category that is lower than indicated by its capital ratios if it is determined to be in an unsafe or unsound condition or if it receives an unsatisfactory examination rating with respect to certain matters.
As of March 31, 2017, we and our bank were well capitalized with Tier 1 capital ratios of 12.94% and 13.33%, respectively, total capital ratios of 13.49% and 13.88%, respectively, Tier 1 leverage ratios of 9.59% and 9.89%, respectively, and a CET1 ratio of 10.85% and 13.33%, respectively, as calculated under Basel III which went into effect on January 1, 2015.
As of December 31, 2016, we and our bank were well capitalized with Tier 1 capital ratios of 12.78% and 13.11%, respectively, total capital ratios of 13.28% and 13.61%, respectively, Tier 1 leverage ratios of 10.07% and 10.35%, respectively, and a CET1 ratio of 11.20% and 13.11%, respectively, as calculated under Basel III which went into effect on January 1, 2015. For more information on these financial measures at the Company and Byline Bank, see Note 21 of Byline’s Consolidated Financial Statements as of and for the years ended December 31, 2016 and 2015.
Safety and Soundness Standards
The FDIA requires the federal banking agencies to prescribe standards, by regulations or guidelines, relating to internal controls, information systems and internal audit systems, loan documentation, credit underwriting, interest rate risk exposure, asset growth, asset quality, earnings, stock valuation and compensation, fees and benefits, and such other operational and managerial standards as the agencies deem appropriate. The federal banking agencies have adopted the Interagency Guidelines for Establishing Standards for Safety and Soundness. The guidelines establish general standards relating to internal controls and information systems, internal audit systems, loan documentation, credit underwriting, interest rate exposure, asset growth, asset quality, earnings and compensation, fees and benefits. In general, these guidelines require, among other things, appropriate systems and practices to identify and manage the risk and exposures specified in the guidelines. These guidelines also prohibit excessive compensation as an unsafe and unsound practice and describe compensation as excessive when the amounts paid are unreasonable or disproportionate to the services performed by an executive officer, employee, director or principal stockholder. In addition, the agencies adopted regulations that authorize, but do not require, an agency to order an institution that has been given notice by an agency that it is not satisfying any of such safety and soundness standards to submit a compliance plan. If, after being so notified, an institution fails to submit an acceptable compliance plan or fails in any material respect to implement an acceptable compliance plan, the banking regulator must issue an order directing action to correct the deficiency and may issue an order directing other actions of the types to which an undercapitalized institution may be subject under the FDIA. See “—Prompt Corrective Action Framework”. If an institution fails to comply with such an order, the banking regulator may seek to enforce such order in judicial proceedings and to impose civil money penalties.
Deposit Insurance
FDIC insurance assessments
As an FDIC-insured bank, our bank must pay deposit insurance assessments to the FDIC based on its average total assets minus its average tangible equity. Deposits are insured up to applicable limits by the FDIC and such insurance is backed by the full faith and credit of the United States Government.
As an institution with less than $10 billion in assets, our bank’s assessment rates are based on the level of risk it poses to the FDIC’s deposit insurance fund (DIF). Pursuant to changes adopted by the FDIC that were effective July 1, 2016, the initial base rate for deposit insurance is between three and 30 basis points. Total base assessment after possible adjustments now ranges between 1.5 and 40 basis points. For established smaller
-135-
Table of Contents
institutions, like Byline Bank, supervisory ratings are used along with (i) an initial base assessment rate, (ii) an unsecured debt adjustment (which can be positive or negative), and (iii) a brokered deposit adjustment, to calculate a total base assessment rate.
Under the Dodd-Frank Act, the limit on FDIC deposit insurance was increased to $250,000. The coverage limit is per depositor, per insured depository institution for each account ownership category. The Dodd-Frank Act also set a new minimum DIF reserve ratio at 1.35% of estimated insured deposits. In October 2010, the FDIC adopted a new DIF restoration plan to ensure that the fund reserve ratio reaches 1.35% by September 30, 2020, as required by the Dodd-Frank Act. In August 2016, the FDIC announced that the DIF reserve ratio had surpassed 1.15% as of June 30, 2016.
Under the FDIA, the FDIC may terminate deposit insurance upon a finding that an institution has engaged in unsafe and unsound practices, is in an unsafe or unsound condition to continue operations or has violated any applicable law, regulation, rule, order or condition imposed by the FDIC.
Other assessments
In addition, the Deposit Insurance Funds Act of 1996 authorized the Financing Corporation (“FICO”) to impose assessments on certain deposits in order to service the interest on the FICO’s bond obligations from deposit insurance fund assessments. The amount assessed on individual institutions is in addition to the amount, if any, paid for deposit insurance according to the FDIC’s risk-related assessment rate schedules. Assessment rates may be adjusted quarterly to reflect changes in the assessment base.
All Illinois state-chartered banks are required to pay supervisory assessments to the IDFPR to fund the operations of that agency. The amount of the assessment is calculated on the basis of Byline Bank’s total assets.
The Volcker Rule
The Dodd-Frank Act, pursuant to a statutory provision commonly called the “Volcker Rule”, prohibits banks and their affiliates from engaging in proprietary trading and investing in and sponsoring hedge funds and private equity funds. The Volcker Rule, which became effective in July 2015, does not significantly affect the operations of Byline and its subsidiaries, as we do not have any significant engagement in the businesses prohibited by the Volcker Rule.
Depositor Preference
The FDIA provides that, in the event of the “liquidation or other resolution” of an insured depository institution, the claims of deposits of the institution, including the claims of the FDIC as subrogee of insured depositors, and certain claims for administrative expenses of the FDIC as a receiver, will have priority over other general unsecured claims against the institution. If an insured depository institution fails, insured and uninsured depositors, along with the FDIC, will have priority in payment ahead of unsecured, non-deposit creditors, including depositors whose deposits are payable only outside of the United States and the parent bank holding company, with respect to any extensions of credit they have made to such insured depository institution.
Interstate Branching
Illinois state-chartered banks, such as Byline Bank, have the authority under Illinois law to establish branches anywhere in the State of Illinois, subject to receipt of all required regulatory approvals.
Federal law permits state and national banks to merge with banks in other states subject to: (i) regulatory approval; (ii) federal and state deposit concentration limits; and (iii) any state law limitations requiring the merging bank to have been in existence for a minimum period of time (not to exceed five years) prior to the merger. The establishment of new interstate branches or the acquisition of individual branches of a bank in
-136-
Table of Contents
another state (rather than the acquisition of an out-of-state bank in its entirety) has historically been permitted only in those states the laws of which expressly authorize such expansion. However, the Dodd-Frank Act permits well-capitalized and well-managed banks to establish new branches across state lines without these impediments.
Consumer Financial Protection
We are subject to a number of federal and state consumer protection laws that extensively govern our relationship with our customers. These laws include the Equal Credit Opportunity Act (“ECOA”), the Fair Credit Reporting Act, the Truth in Lending Act (“TILA”), the Truth in Savings Act, the Electronic Fund Transfer Act, the Expedited Funds Availability Act, the Home Mortgage Disclosure Act, the Fair Housing Act, the Real Estate Settlement Procedures Act, the Fair Debt Collection Practices Act, Fair Credit Reporting Act, the Service Members Civil Relief Act, the Right to Financial Privacy Act, Telephone Consumer Protection Act, CAN-SPAM Act, and these laws’ respective state-law counterparts, as well as state usury laws and laws regarding unfair and deceptive acts and practices. These and other federal laws, among other things, require disclosures of the cost of credit and terms of deposit accounts, provide substantive consumer rights, prohibit discrimination in credit transactions, regulate the use of credit report information, provide financial privacy protections, restrict our ability to raise interest rates on extensions of credit and subject us to substantial regulatory oversight. Violations of applicable consumer protection laws can result in significant potential liability from litigation brought by customers, including actual damages, restitution and attorneys’ fees. Federal banking regulators, state attorneys general and state and local consumer protection agencies may also seek to enforce consumer protection requirements and obtain these and other remedies, including regulatory sanctions, customer rescission rights, action by the state and local attorneys general in each jurisdiction in which we operate and civil money penalties. Failure to comply with consumer protection requirements may also result in our failure to obtain any required bank regulatory approval for merger or acquisition transactions we may wish to pursue or our prohibition from engaging in such transactions even if approval is not required.
The Dodd-Frank Act created a new, independent federal agency, the Consumer Financial Protection Bureau (“CFPB”), which was granted broad rulemaking, supervisory and enforcement powers under various federal consumer financial protection laws with respect to certain consumer financial products and services, including the ability to require reimbursements and other payments to customers for alleged legal violations. The CFPB has the authority to impose significant penalties, as well as injunctive relief that prohibits lenders from engaging in allegedly unlawful practices. The CFPB is also authorized to engage in consumer financial education, track consumer complaints, request data and promote the availability of financial services to underserved consumers and communities. Although all institutions are subject to rules adopted by the CFPB and examination by the CFPB in conjunction with examinations by the institution’s primary federal regulator, the CFPB has primary examination and enforcement authority over institutions with assets of $10 billion or more. The FDIC has primary responsibility for examination of our bank and enforcement with respect to various federal consumer protection laws so long as our bank has total consolidated assets of less than $10 billion, and state authorities are responsible for monitoring our compliance with all state consumer laws. The CFPB also has the authority to require reports from institutions with less than $10 billion in assets, such as our bank, to support the CFPB in implementing federal consumer protection laws, supporting examination activities, and assessing and detecting risks to consumers and financial markets.
The consumer protection provisions of the Dodd-Frank Act and the examination, supervision and enforcement of those laws and implementing regulations by the CFPB have created a more intense and complex environment for consumer finance regulation. The CFPB has significant authority to implement and enforce federal consumer finance laws, including the TILA, the ECOA and new requirements for financial services products provided for in the Dodd-Frank Act.
The CFPB has broad rulemaking authority for a wide range of consumer financial laws that apply to all banks including, among other things, the authority to prohibit “unfair, deceptive, or abusive” acts and practices. Abusive acts or practices are defined in the Dodd-Frank Act as those that (1) materially interfere with a
-137-
Table of Contents
consumer’s ability to understand a term or condition of a consumer financial product or service, or (2) take unreasonable advantage of a consumer’s (a) lack of financial savvy, (b) inability to protect herself or himself in the selection or use of consumer financial products or services, or (c) reasonable reliance on a covered entity to act in the consumer’s interests. The review of products and practices to prevent such acts and practices is a continuing focus of the CFPB, and of banking regulators more broadly. The ultimate impact of this heightened scrutiny is uncertain but it could result in changes to pricing, practices, products and procedures. It could also result in increased costs related to regulatory oversight, supervision and examination, additional remediation efforts and possible penalties. The Dodd-Frank Act does not prevent states from adopting stricter consumer protection standards. State regulation of financial products and potential enforcement actions could also adversely affect our business, financial condition or results of operations.
Federal Home Loan Bank Membership
Byline Bank is a member of the FHLB, which serves as a central credit facility for its members. The FHLB is funded primarily from proceeds from the sale of obligations of the FHLB system. It makes loans to member banks in the form of FHLB advances. All advances from the FHLB are required to be fully collateralized as determined by the FHLB.
Ability-To-Pay Rules and Qualified Mortgages
As required by the Dodd-Frank Act, the CFPB issued a series of final rules in January 2013 amending Regulation Z, implementing TILA, which requires mortgage lenders to make a reasonable and good faith determination, based on verified and documented information, that a consumer applying for a residential mortgage loan has a reasonable ability to repay the loan according to its terms. These final rules prohibit creditors, such as Byline Bank, from extending residential mortgage loans without regard for the consumer’s ability to repay and add restrictions and requirements to residential mortgage origination and servicing practices. In addition, these rules restrict the imposition of prepayment penalties and restrict compensation practices relating to residential mortgage loan origination. Mortgage lenders are required to determine consumers’ ability to repay in one of two ways. The first alternative requires the mortgage lender to consider eight underwriting factors when making the credit decision. Alternatively, the mortgage lender can originate “qualified mortgages”, which are entitled to a presumption that the creditor making the loan satisfied the ability-to-repay requirements. In general, a qualified mortgage is a residential mortgage loan that does not have certain high risk features, such as negative amortization, interest-only payments, balloon payments, or a term exceeding 30 years. In addition, to be a qualified mortgage, the points and fees paid by a consumer cannot exceed 3% of the total loan amount and the borrower’s total debt-to-income ratio must be no higher than 43% (subject to certain limited exceptions for loans eligible for purchase, guarantee or insurance by a government sponsored enterprise or a federal agency).
Commercial Real Estate Guidance
In December 2015, the federal banking regulators released a statement entitled “Interagency Statement on Prudent Risk Management for Commercial Real Estate Lending” (the “CRE Guidance”). In the CRE Guidance, the federal banking regulators (i) expressed concerns with institutions that ease commercial real estate underwriting standards, (ii) directed financial institutions to maintain underwriting discipline and exercise risk management practices to identify, measure and monitor lending risks, and (iii) indicated that they will continue to pay special attention to commercial real estate lending activities and concentrations going forward. The federal banking regulators previously issued guidance in December 2006, entitled “Interagency Guidance on Concentrations in Commercial Real Estate Lending, Sound Risk Management Practices”, which stated that an institution is potentially exposed to significant commercial real estate concentration risk, and should employ enhanced risk management practices, where (1) total commercial real estate loans represent 300% or more of its total capital and (2) the outstanding balance of such institution’s commercial real estate loan portfolio has increased by 50% or more during the prior 36 months.
-138-
Table of Contents
Leveraged Lending Guidance
In March 2013, the federal banking regulators jointly issued guidance on leveraged lending that updates and replaces the guidance for leveraged finance activities issued by the federal banking regulators in April 2001. The revised leveraged lending guidance describes regulatory expectations for the sound risk management of leveraged lending activities, including the importance for institutions to maintain, among other things, (i) a credit limit and concentration framework consistent with the institution’s risk appetite, (ii) underwriting standards that define acceptable leverage levels, (iii) strong pipeline management policies and procedures and (iv) guidelines for conducting periodic portfolio and pipeline stress tests.
Community Reinvestment Act of 1977
Under the CRA, our bank has an obligation, consistent with safe and sound operations, to help meet the credit needs of the market areas where it operates, which includes providing credit to low- and moderate-income individuals and communities. In connection with its examination of our bank, the FDIC is required to assess our bank’s compliance with the CRA. Our bank’s failure to comply with the CRA could, among other things, result in the denial or delay in certain corporate applications filed by us or our bank, including applications for branch openings or relocations and applications to acquire, merge or consolidate with another banking institution or holding company. Our bank received a rating of “Satisfactory” in its most recently completed CRA examination in 2016 that was as of February 17, 2016.
Financial Privacy
The federal banking regulators have adopted rules limiting the ability of banks and other financial institutions to disclose non-public information about consumers to unaffiliated third parties. These limitations require disclosure of privacy policies to consumers and, in some circumstances, allow consumers to prevent disclosure of certain personal information to an unaffiliated third party. These regulations affect how consumer information is transmitted through diversified financial companies and conveyed to outside vendors.
Anti-Money Laundering and the USA PATRIOT ACT
A major focus of governmental policy on financial institutions in recent years has been combating money laundering and terrorist financing. The Uniting and Strengthening America by Providing Appropriate Tools Required to Intercept and Obstruct Terrorism Act of 2001, or the USA Patriot Act, substantially broadened the scope of United States anti-money laundering laws and regulations by imposing significant new compliance and due diligence obligations, creating new crimes and penalties and expanding the extra-territorial jurisdiction of the United States in these areas: customer identification programs, money laundering, terrorist financing, identifying and reporting suspicious activities and currency transactions, currency crimes, and cooperation between financial institutions and law enforcement authorities. The U.S. Treasury Department’s Financial Crimes Enforcement Network, among other federal agencies, also promulgates rules and regulations regarding the USA Patriot Act with which financial institutions are required to comply. Financial institutions are prohibited from entering into specified financial transactions and account relationships and must use enhanced due diligence procedures in their dealings with certain types of high-risk customers and implement a written customer identification program. Financial institutions must take certain steps to assist government agencies in detecting and preventing money laundering and report certain types of suspicious transactions. Regulatory authorities routinely examine financial institutions for compliance with these obligations, and failure of a financial institution to maintain and implement adequate programs to combat money laundering and terrorist financing, or to comply with all of the relevant laws or regulations, could have serious legal and reputational consequences for the institution, including causing applicable bank regulatory authorities not to approve merger or acquisition transactions when regulatory approval is required or to prohibit such transactions even if approval is not required. Regulatory authorities have imposed cease and desist orders and significant civil money penalties against institutions found to be violating these obligations and have in some cases brought criminal actions against some institutions for these types of violations.
-139-
Table of Contents
Office of Foreign Assets Control Regulation
The U.S. Treasury Department’s Office of Foreign Assets Control, or OFAC, administers and enforces economic and trade sanctions against targeted foreign countries and regimes, under authority of various laws, including designated foreign countries, nationals and others. OFAC publishes lists of specially designated targets and countries. We and our bank are responsible for, among other things, blocking accounts of, and transactions with, such targets and countries, prohibiting unlicensed trade and financial transactions with them and reporting blocked transactions after their occurrence. Failure to comply with these sanctions could have serious legal and reputational consequences and could result in civil money penalties imposed on the institution by OFAC. Failure to comply with these sanctions could also cause applicable bank regulatory authorities not to approve merger or acquisition transactions when regulatory approval is required or to prohibit such transactions even if approval is not required.
Incentive Compensation
The Federal Reserve will review, as part of the regular, risk-focused examination process, the incentive compensation arrangements of banking organizations, such as us, that are not “large, complex banking organizations.” These reviews will be tailored to each organization based on the scope and complexity of the organization’s activities and the prevalence of incentive compensation arrangements. The findings of the supervisory initiatives will be included in reports of examination. Deficiencies will be incorporated into the organization’s supervisory ratings, which can affect the organization’s ability to make acquisitions and take other actions. Enforcement actions may be taken against a banking organization if its incentive compensation arrangements, or related risk management control or governance processes, pose a risk to the organization’s safety and soundness and the organization is not taking prompt and effective measures to correct the deficiencies.
In June 2010, the federal banking regulators issued comprehensive final guidance on incentive compensation policies intended to ensure that the incentive compensation policies of banking organizations do not undermine the safety and soundness of such organizations by encouraging excessive risk-taking. The guidance, which covers all employees that have the ability to materially affect the risk profile of an organization, either individually or as part of a group, is based upon the key principles that a banking organization’s incentive compensation arrangements should (1) provide incentives that appropriately balance risk and financial results in a manner that does not encourage employees to expose their organizations to imprudent risk, (2) be compatible with effective internal controls and risk management and (3) be supported by strong corporate governance, including active and effective oversight by the organization’s board of directors.
During the second quarter of 2016, certain U.S. regulators, including the Federal Reserve, the FDIC and the SEC, proposed revised rules on incentive-based payment arrangements at specified regulated entities having at least $1 billion in total assets (including Byline and Byline Bank). The proposed revised rules would establish general qualitative requirements applicable to all covered entities, which would include: (i) prohibiting incentive arrangements that encourage inappropriate risks by providing excessive compensation; (ii) prohibiting incentive arrangements that encourage inappropriate risks that could lead to a material financial loss; (iii) establishing requirements for performance measures to appropriately balance risk and reward; (iv) requiring board of director oversight of incentive arrangements; and (v) mandating appropriate record-keeping.
Pursuant to rules adopted by the stock exchanges and approved by the SEC in January 2013 under the Dodd-Frank Act, public company compensation committee members must meet heightened independence requirements and consider the independence of compensation consultants, legal counsel and other advisors to the compensation committee. A compensation committee must have the authority to hire advisors and to have the public company fund reasonable compensation of such advisors.
Public companies will be required, once stock exchanges impose additional listing requirements under the Dodd-Frank Act, to implement “clawback” procedures for incentive compensation payments and to disclose
-140-
Table of Contents
the details of the procedures which allow recovery of incentive compensation that was paid on the basis of erroneous financial information necessitating a restatement due to material noncompliance with financial reporting requirements. This clawback policy is intended to apply to compensation paid within a three-year look-back window of the restatement and would cover all executives who received incentive awards.
Cybersecurity
In March 2015, federal regulators issued two related statements regarding cybersecurity. One statement indicates that financial institutions should design multiple layers of security controls to establish lines of defense and to ensure that their risk management processes also address the risk posed by compromised customer credentials, including security measures to reliably authenticate customers accessing internet-based services of the financial institution. The other statement indicates that a financial institution’s management is expected to maintain sufficient business continuity planning processes to ensure the rapid recovery, resumption and maintenance of the institution’s operations after a cyber-attack involving destructive malware. A financial institution is also expected to develop appropriate processes to enable recovery of data and business operations and address rebuilding network capabilities and restoring data if the institution or its critical service providers fall victim to this type of cyber-attack. If we fail to observe the regulatory guidance, we could be subject to various regulatory sanctions, including financial penalties.
In the ordinary course of business, we rely on electronic communications and information systems to conduct our operations and to store sensitive data. We employ an in-depth, layered, defensive approach that leverages people, processes and technology to manage and maintain cybersecurity controls. We employ a variety of preventative and detective tools to monitor, block, and provide alerts regarding suspicious activity, as well as to report on any suspected advanced persistent threats. Notwithstanding the strength of our defensive measures, the threat from cyberattacks is severe, attacks are sophisticated and increasing in volume, and attackers respond rapidly to changes in defensive measures. While to date, we have not experienced a significant compromise, significant data loss or any material financial losses related to cybersecurity attacks, our systems and those of our customers and third party service providers are under constant threat and it is possible that we could experience a significant event in the future. Risks and exposures related to cybersecurity attacks are expected to remain high for the foreseeable future due to the rapidly evolving nature and sophistication of these threats, as well as due to the expanding use of Internet banking, mobile banking and other technology-based products and services by us and our customers.
Future Legislation and Regulation
Congress may enact legislation from time to time that affects the regulation of the financial services industry, and state legislatures may enact legislation from time to time affecting the regulation of financial institutions chartered by or operating in those states. Federal and state regulatory agencies also periodically propose and adopt changes to their regulations or change the manner in which existing regulations are applied. The substance or impact of pending or future legislation or regulation, or the application thereof, cannot be predicted, although enactment of the proposed legislation could affect the regulatory structure under which we operate and may significantly increase our costs, impede the efficiency of our internal business processes, require us to increase our regulatory capital or modify our business strategy, or limit our ability to pursue business opportunities in an efficient manner. Our business, financial condition, results of operations or prospects may be adversely affected, perhaps materially, as a result.
-141-
Table of Contents
Executive Officers and Directors
The following table sets forth information regarding our directors and executive officers.
| Name |
Age |
Position | ||||
| Executive Officers: |
||||||
| Alberto J. Paracchini |
46 | President, Chief Executive Officer and Director | ||||
| Lindsay Corby |
39 | Executive Vice President and Chief Financial Officer | ||||
| Timothy C. Hadro |
66 | Executive Vice President and Chief Credit Officer | ||||
| Rick Schobert |
64 | Chief Risk Officer | ||||
| Bruce Lammers |
61 | President of Small Business Capital | ||||
| Donald J. Meyer |
66 | Executive Vice President of Commercial Banking | ||||
| Thomas J. Bell III |
50 | Senior Vice President and Corporate Treasurer | ||||
| Megan Biggam |
38 | Senior Vice President of Retail Banking | ||||
| Non-Employee Directors: |
||||||
| Roberto R. Herencia |
57 | Chairman of the Board of Directors | ||||
| L. Gene Beube |
77 | Director | ||||
| Phillip R. Cabrera |
65 | Director | ||||
| Antonio del Valle Perochena |
48 | Director | ||||
| Jaime Ruiz Sacristán |
67 | Director | ||||
| Steven M. Rull |
67 | Director | ||||
Executive Officers
Alberto J. Paracchini has served as President, Chief Executive Officer and Director of Byline since June 2013. Mr. Paracchini also serves as President, Chief Executive Officer and Director of Byline Bank. Prior to joining Byline, Mr. Paracchini served as Principal for BXM Holdings, Inc., an investment fund specializing in community bank investments, from October 2010 to June 2013 and spent 16 years at Popular, Inc., where he held numerous leadership positions in both its banking and mortgage subsidiaries. From January 2010 through May 2010, Mr. Paracchini was Executive Vice President at Midwest Bank & Trust. From 2006 through 2008, Mr. Paracchini served as President and Chief Financial Officer of Popular Financial Holdings and Chief Financial Officer of E-Loan, an internet banking and mortgage company. Prior to 2006, Mr. Paracchini spent 13 years at Banco Popular North America, where he held several senior leadership roles including Chief Financial Officer, Treasurer and the head of all operations and technology functions. Mr. Paracchini is a member of the Cook County Council of Economic Advisors and Economic Club of Chicago. Mr. Paracchini holds a bachelor’s degree from Marquette University and an M.B.A. from the University of Chicago Booth School of Business. Mr. Paracchini’s qualifications to serve as a member of our board of directors include his extensive experience in the financial services industry and his demonstrated leadership skills.
Lindsay Corby has been Executive Vice President and Chief Financial Officer of Byline since July 2015. Ms. Corby is also the Executive Vice President and Chief Financial Officer of Byline Bank. Ms. Corby joined Byline in June 2013, serving as Chief Administrative Officer until July 2015. Prior to joining Byline, Ms. Corby was a Principal at BXM Holdings, Inc. from February 2011 to June 2013. In addition, Ms. Corby served on the board of directors of QCR Holdings, Inc., a public bank holding company, from 2012 to 2016. Prior to joining BXM Holdings, Inc., Ms. Corby was a Vice President in the investment banking group of Keefe, Bruyette & Woods, Inc., focused on mergers and acquisitions, capital markets transactions, complex recapitalizations and valuation activities for U.S. financial institutions. Ms. Corby received a bachelor’s degree in Spanish, a bachelor of business administration in accounting and a master’s degree in accounting from Southern Methodist University. Ms. Corby is also a graduate of the Kellogg Executive Education, Women’s Senior Leadership Program, and is a registered Certified Public Accountant.
-142-
Table of Contents
Timothy C. Hadro has served as Chief Credit Officer of Byline Bank since January 2015 and as Head of the Special Assets Group for Byline Bank since August 2013. Prior to joining Byline, Mr. Hadro was co-founding principal of Loan Management Solutions, a distressed loan consulting firm. Prior to that experience, Mr. Hadro spent 31 years with JP Morgan Chase and its predecessor organizations. Mr. Hadro serves as a director on the advisory board of Banner Group, a private apartment and self-storage development company and as a director of Community Investment Corporation, Chicago’s largest non-profit mortgage lender. Mr. Hadro holds a bachelor’s degree in mathematics and economics from Macalester College in St. Paul, Minnesota and an M.B.A. from the University of Chicago Booth School of Business.
Rick Schobert has been the Chief Risk Officer of Byline Bank since October 2013. Prior to joining Byline, Mr. Schobert was a Senior Credit Risk examiner at the Federal Reserve Bank of Atlanta from April to October 2013. Prior to that experience, he was a financial institution consultant at Schobert & Carper, LLC from July 2011 to March 2013. Mr. Schobert also served as a member of the supervisory committee and board of directors of First Federal Credit Union, an Arizona credit union, from May 2012 to March 2013. He also was an Executive Vice President and Chief Operating Officer at West Valley National Bank in Avondale, Arizona from July 2010 to July 2011. Prior to that experience, Mr. Schobert held management and bank examination positions at the Office of the Comptroller of the Currency from July 1979 to June 2010. Mr. Schobert received a bachelor’s degree and a master’s degree in business administration from the University of Wisconsin.
Bruce Lammers has been the President of Small Business Capital for Byline Bank since October 2016. Prior to joining Byline, Mr. Lammers served as President and Chief Executive Officer of Ridgestone Bank from September 2006 until the Ridgestone acquisition in October 2016. Prior to that experience, Mr. Lammers served as the Chief Operating Officer and Executive Vice President of Amcore Bank, Senior Vice President and Senior Commercial Loan Officer of the Sheboygan, Wisconsin office of U.S. Bank and President of the Northeastern Wisconsin Region of U.S. Bank. Mr. Lammers received a bachelor of business administration in accounting from Lakeland University.
Donald J. Meyer has served as Executive Vice President of Commercial Banking for Byline since August 2013. Prior to joining to Byline, Mr. Meyer was a co-founding Principal of Loan Management Solutions, a distressed loan consulting firm, from August 2009 to July 2013. Prior to that experience, Mr. Meyer was the Chief Investment Officer for Centerline Capital Group, a subsidiary of Centerline Holding Company, a NYSE listed real estate finance company, from 2006 to 2009. During 2008 and 2009, Mr. Meyer also served as the Chief Executive Officer of American Mortgage Acceptance Company, a commercial mortgage real estate investment trust managed by Centerline that filed for Chapter 11 bankruptcy in 2010. Mr. Meyer serves as a director of Neighborhood Housing Services of Chicago, a non-profit organization providing home mortgage and financial education to potential home owners in low and moderate income neighborhoods. Mr. Meyer holds a bachelor’s degree in finance from the University of Illinois.
Thomas J. Bell III has been Senior Vice President and Corporate Treasurer for Byline Bank since August 2013. Prior to joining Byline, Mr. Bell previously served as a consultant for and then the Senior Vice President, Treasurer and Head of Planning of Anchor Bancorp from July 2010 to August 2013 where he was responsible for treasury, finance and capital management. Prior to joining Anchor Bancorp, Mr. Bell was an Executive Vice President, Treasurer and Chief Investment Officer for Midwest Banc Holdings, Inc. from December 2008 to June 2010. Prior to that experience, Mr. Bell served as a Senior Vice President with for ABN AMRO North America Inc., a Chicago-based holding company for the LaSalle Bank Corporation. Prior to his experience at ABM AMRO North America, Inc., Mr. Bell spent several years with the Federal Reserve Bank of Chicago. Mr. Bell received a bachelor’s degree in finance from Lewis University.
Megan Biggam has served as Senior Vice President of Retail Banking of Byline Bank since June 2013. Prior to joining Byline, Ms. Biggam was the Director of Marketing of Metrobank Group, Byline’s predecessor bank parent, from August 2008 to June 2013. Prior joining Metrobank Group, Ms. Biggam was a Division Marketing Manager at Washington Mutual, overseeing the retail marketing development for the Chicago, Atlanta and New Jersey markets. Prior to joining Washington Mutual, Ms. Biggam was the Regional Marketing Director for TCF Bank for the Chicago and Milwaukee markets. Ms. Biggam received a bachelor’s degree in journalism from Indiana University.
-143-
Table of Contents
Non-Employee Directors
Our board of directors consists of seven members, including our Chief Executive Officer. We expect all of our directors to continue to serve on our board of directors following the completion of this offering.
Roberto R. Herencia has served as Chairman of our board of directors since June 2013 and serves as chair of the audit, compensation and governance and nominating committees, as well as a member of the risk committee. Mr. Herencia also serves as Chairman of the board of directors of Byline Bank. Mr. Herencia led the Recapitalization of our predecessor, Metropolitan, as President and Chief Executive Officer of BXM Holdings, Inc., a position he has held since November 2010. Prior to BXM Holdings, Inc., Mr. Herencia served as President and Chief Executive Officer of Midwest Banc Holdings, Inc. and spent 17 years with Popular Inc. as its Executive Vice President and as President of Popular Inc.’s subsidiary, Banco Popular North America. Mr. Herencia has also served as an independent director of Banner Corporation and its subsidiary, Banner Bank, since March 2016, and as Chairman of the board of directors of First BanCorp, and its subsidiary, FirstBank Puerto Rico, since October 2011. Mr. Herencia previously served as an independent director of privately held SKBHC Holdings LLC, and its two subsidiary banks, American West Bank and First National Bank of Starbuck, from December 2010 to September 2015. Appointed by President Obama in 2011, Mr. Herencia serves on the Overseas Private Investment Corporation’s board of directors. Mr. Herencia holds a bachelor’s degree in finance from Georgetown University and an M.B.A. from the Kellogg School of Management at Northwestern University. Mr. Herencia’s qualifications include over 32 years of experience in the banking industry, having held senior roles in corporate, commercial, small business, problem asset restructuring and retail banking, as well as extensive experience with complex and distressed turnaround efforts, having executed over 15 mergers and acquisitions in his career.
L. Gene Beube has served on our board of directors since June 2013 and serves on the risk, audit, compensation and governance and nominating committees. Mr. Beube also serves on the board of directors of Byline Bank. Prior to joining Byline, Mr. Beube ran LGB Consulting, a credit risk management consultancy, from February 2005 to December 2011 after retiring as Executive Vice President and Chief Credit Officer for Banco Popular North America, a position he held from 1997 through January 2005. Prior to joining Banco Popular North America, Mr. Beube held various positions at First National Bank of Chicago from 1962 to 1997 and retired as Senior Vice President and Senior Credit Officer. Mr. Beube holds a bachelor’s degree in finance and a master’s degree from the College of Business Administration at the University of Illinois. Mr. Beube’s qualifications include over 50 years of both domestic and international experience in the banking industry.
Phillip R. Cabrera has served on our board of directors since June 2013 and serves as chair of the risk committee as well as a member of our audit, compensation and governance and nominating committees. Mr. Cabrera also serves on the board of directors of Byline Bank. Since retiring from the McDonald’s Corporation in 2015, Mr. Cabrera has served as an advisor and consultant to Air Products and INDURA, Santiago, Chile, assisting management in identifying and remedying gaps in audit, treasury, governance and controls. Mr. Cabrera retired as Vice President and International Treasurer of McDonald’s Corporation in October 2015, where for 21 years he held varied executive roles. Prior to his tenure at McDonald’s, Mr. Cabrera was a Managing Director and Senior Partner in the Latin America Group of Continental Bank and served as President of Continental International Finance Corporation, a holding company for Continental Bank’s international equity investments, from 1993 to 1994. Mr. Cabrera also serves on the board of directors of Institutional Cash Distributors, an Internet broker of money funds. Mr. Cabrera previously served on the advisory board of Unibanco, Banco do Investimento do Brazil from 1982 to 1986. Mr. Cabrera holds a bachelor’s degree in business administration from Bradley University and a master’s degree in international management with a
finance concentration from the Thunderbird School of Global Management and served in the U.S. Army. Mr. Cabrera’s qualifications include over 30 years of experience in corporate finance, corporate treasury and banking.
-144-
Table of Contents
Antonio del Valle Perochena has served on our board of directors since June 2013 and serves on our compensation committee. Mr. del Valle Perochena also serves on the board of directors of Byline Bank. Mr. del Valle Perochena has been the Chairman of the board of directors of Kaluz, S.A., which is the holding company for Mexichem, S.A.B. and Elementia, S.A., since September 2013 and has been the Chairman of the board of directors of Grupo Financiero Ve por Más, S.A. (BX+) since 2006. Prior to incorporating Kaluz and BX+, which are financial, industrial and construction enterprises, in 2003, Mr. del Valle Perochena worked at ING Group as Executive Vice President of Insurance and Pensions in Mexico from 1996 to 1999, and later as Director of New Projects of the direct banking business of the group, ING Direct, in Madrid, Spain from 1999 to 2001. Mr. del Valle Perochena has served as a director of Pochteca Group and Grupo Empresarial Kaluz since 2003 and as a director of Afianzadora Sofimex since 2004. Mr. del Valle Perochena holds a business administration degree and Masters in Management from Universidad Anáhuac. He also holds a Senior Management graduate degree at IPADE and a specialization in literature at the Iberoamericana University. Mr. del Valle Perochena’s qualifications include over 20 years of experience in the financial and business sectors.
Jaime Ruiz Sacristán has served on our board of directors since June 2013 and serves on the risk and governance and nominating committees. Mr. Ruiz Sacristán also serves on the board of directors of Byline Bank. Mr. Ruiz Sacristán is the Founder and Chairman of the board of directors of Banco Ve por Más, a position he has held since 2003, has been a director of Banco Popular Español since September 2016 and has served as Chairman of the board of directors of the Mexican Stock Exchange since January 2015. Prior to founding and working for Banco Ve por Más from July 1992 to March 2003, Mr. Ruiz Sacristán held various positions as Grupo Financiero Bital, including serving as its Chief Executive Officer from 2001 to 2003, and was a director at each of its portfolio companies. Prior to Grupo Financiero Bital, Mr. Ruiz Sacristán held several senior management positions in Banco Mexicano Somex and Citibank Mexico. Mr. Ruiz Sacristán was unanimously elected and served as President of the Mexican Banks Association from April 2011 to April 2013. Mr. Ruiz Sacristán holds a bachelor’s degree in business administration from Universidad Anáhuac and an M.B.A. from the Kellogg School of Management at Northwestern University. Mr. Ruiz Sacristán’s qualifications include over 35 years of experience in the banking and financial sectors.
Steven M. Rull has served on our board of directors since October 2016 and serves on the risk committee. Mr. Rull also serves on the board of directors of Byline Bank. From 2007 to 2016, Mr. Rull served as lead director of the board of Ridgestone Financial Services, Inc. and its subsidiary, Ridgestone Bank, which we acquired in 2016. Mr. Rull co-founded Manchester Holdings and its wholly-owned subsidiaries, Detalus Advisors, a retail and institutional asset manager, and Detalus Consulting, a financial technology and financial advisory firm, in 2001. Mr. Rull co-founded Manchester Partners, an investment and consulting firm where he serves as Managing Director, in 1997. Mr. Rull served as Chairman and Chief Executive Officer of Bunker Hill Bancorp and its subsidiary, Boulevard Bank, from 2003 until its sale in 2013. He also held positions as Chairman of Atlanta Bancorporation and director of its subsidiary, Bank of Atlanta, from 2005 until its sale in 2014. Mr. Rull was the co-head of the capital markets division of Mark Twain Bank from 1994 to 1997. Prior to this role, he held positions as Chief Investment Officer and Chief Financial Officer of United Postal Bancorp from 1987 to 1994 and as President of the Mortgage Division of Mercantile Bank, which acquired United Postal Bancorp in 1994. Mr. Rull holds a bachelor’s degree in accounting from Southern Illinois University Edwardsville and was a Certified Public Accountant in the state of Missouri from 1973 to 1996. Mr. Rull’s qualifications include over 40 years of management and advisory experience in the financial services industry.
Composition of Our Board of Directors
Our board of directors has seven members. Under our amended and restated certificate of incorporation, the number of directors constituting our board of directors will be fixed from time to time by resolution of our board of directors. Each of our directors is currently elected for a one-year term.
-145-
Table of Contents
Board Leadership Structure and Qualifications
We believe that our directors should have the highest professional and personal ethics and values, consistent with our longstanding values and standards. They should have broad experience at the policy-making level in business, government or banking. They should be committed to enhancing stockholder value and should have sufficient time to carry out their duties and to provide insight and practical wisdom based on experience. Each director must represent the interests of all stockholders. When considering potential director candidates, our board of directors considers the candidate’s character, judgment, diversity, skills, including financial literacy, and experience in the context of our needs and those of the board of directors. Our board also considers the candidate’s service on boards of other companies and whether such service would impair the candidate’s ability to perform responsibly all director duties for Byline.
Our board of directors does not have a formal policy requiring the separation of the roles of Chief Executive Officer and Chairman of the Board. It is the board of directors’ view that rather than having a rigid policy, the board of directors, with the advice and assistance of the governance and nominating committee, and upon consideration of all relevant factors and circumstances, will determine, as and when appropriate, whether the two offices should be separate. Currently, our leadership structure separates the offices of Chief Executive Officer and Chairman of the Board, with Mr. Paracchini serving as our Chief Executive Officer and Mr. Herencia as Chairman of the Board, reinforcing the leadership role of our board of directors in its oversight of our business and affairs.
Director Independence
Under the rules of the NYSE, independent directors must comprise a majority of our board of directors not later than the first anniversary date of this offering. The rules of the NYSE, as well as those of the SEC, impose several requirements with respect to the independence of our directors. Our board of directors has undertaken a review of the independence of each director in accordance with these rules. Based on information provided by each director concerning his background, employment and affiliations, our board of directors has determined that Roberto R. Herencia, L. Gene Beube, Phillip R. Cabrera, Antonio del Valle Perochena, Jaime Ruiz Sacristán and Steven M. Rull do not have relationships that would interfere with the exercise of independent judgment in carrying out the responsibilities of a director and that each of these directors is “independent” as that term is defined under the applicable rules. Our board of directors has determined that Mr. del Valle Perochena is independent for purposes of his service on the board of directors but does not satisfy the heightened independence requirements for compensation committee members, and we will avail ourselves of the transition period in Section 303A of the NYSE Listed Company Manual, under which Mr. del Valle Perochena can continue to serve on the compensation committee until the one year anniversary of the listing date. In making these determinations, our board of directors considered the current and prior relationships that each non-employee director has with our company and all other facts and circumstances our board of directors deemed relevant in determining their independence, including the beneficial ownership of our shares by each non-employee director.
-146-
Table of Contents
Committees of Our Board of Directors
The standing committees of our board of directors consist of an audit committee, a compensation committee, a governance and nominating committee and a risk committee. The responsibilities of these committees are described below. Our board of directors may also establish such other committees as it deems appropriate, in accordance with applicable law and regulations and our corporate governance documents. The following table summarizes the expected membership of each of the committees of the board of directors upon completion of the offering:
| Director Name |
Audit Committee |
Compensation |
Governance and Committee |
Risk Committee | ||||
| Roberto R. Herencia |
Chair | Chair | Chair | Member | ||||
| L. Gene Beube |
Member | Member | Member | Member | ||||
| Phillip R. Cabrera |
Member | Member | Member | Chair | ||||
| Antonio del Valle Perochena |
Member | |||||||
| Jaime Ruiz Sacristán |
Member | Member | ||||||
| Steven M. Rull |
Member |
Audit committee. The audit committee assists the board of directors in fulfilling its responsibilities for general oversight of the integrity of our financial statements, our compliance with legal and regulatory requirements, the independent auditors’ qualifications and independence, the performance of our internal audit function and independent auditors and risk assessment and risk management. Among other things, upon completion of this offering, the audit committee will:
| • | annually review the audit committee charter and the committee’s performance; |
| • | appoint, evaluate and determine the compensation of our independent auditors; |
| • | review and approve the scope of the annual audit, the audit fee, the financial statements, significant accounting policy changes, material weaknesses identified by outside auditors or the internal audit function and risk management issues; |
| • | prepare the audit committee report for inclusion in our proxy statement for our annual meeting; |
| • | review disclosure controls and procedures, internal controls, internal audit function and corporate policies with respect to financial information; |
| • | assist the board of directors in monitoring our compliance with applicable legal and regulatory requirements; |
| • | oversee investigations into complaints concerning financial matters, if any; and |
| • | review other risks that may have a significant impact on our financial statements. |
The audit committee works closely with management as well as our independent auditors. The audit committee has the authority to obtain advice and assistance from, and receive appropriate funding to engage outside legal, accounting or other advisors as the audit committee deems necessary to carry out its duties. The audit committee has adopted a written charter that among other things, specifies the scope of its rights and responsibilities. Before completion of the offering, the charter will be available on our website at www.bylinebank.com.
Upon completion of the offering, the audit committee will be composed solely of members who satisfy the applicable independence, financial literacy and other requirements of the NYSE for audit committees, and at
-147-
Table of Contents
least one of its members will be an “audit committee financial expert”. Roberto R. Herencia, L. Gene Beube and Phillip R. Cabrera will also qualify as independent directors under the independence requirements of Rule 10A-3 of the Exchange Act.
Compensation committee. The compensation committee is responsible for discharging the board’s responsibilities relating to compensation of our executive officers and directors. Among other things, upon completion of this offering, the compensation committee will:
| • | evaluate human resources and compensation strategies; |
| • | review and approve objectives relevant to executive officer compensation; |
| • | evaluate performance and determine the compensation of the Chief Executive Officer in accordance with those objectives; |
| • | approve any changes to non-equity-based benefit plans involving a material financial commitment; |
| • | recommend to the board of directors compensation for directors; |
| • | prepare the compensation committee report required by SEC rules to be included in our annual report; and |
| • | evaluate performance in relation to the compensation committee charter. |
The compensation committee has adopted a written charter that among other things, specifies the scope of its rights and responsibilities. Before completion of the offering, the charter will be available on our website at www.bylinebank.com. On or before the one year anniversary of the listing date, the compensation committee will be composed solely of members who satisfy the applicable independence requirements of the NYSE for compensation committees.
Governance and nominating committee. The governance and nominating committee is responsible for making recommendations to our board of directors regarding candidates for directorships and the size and composition of our board of directors. In addition, the governance and nominating committee will be responsible for overseeing our corporate governance guidelines and reporting and making recommendations to our board of directors concerning governance matters. Among other things, the governance and nominating committee will:
| • | identify individuals qualified to be directors consistent with the criteria approved by the board of directors, subject to any waivers granted by the board, and recommend director nominees to the full board of directors; |
| • | ensure that the audit and compensation committees have the benefit of qualified “independent” directors; |
| • | oversee management continuity planning; |
| • | lead the board of directors in its annual performance review; and |
| • | take a leadership role in shaping the corporate governance of our organization. |
The governance and nominating committee has adopted a written charter that among other things, specifies the scope of its rights and responsibilities. Before completion of the offering, the charter will be available on our website at www.bylinebank.com. Upon completion of the offering, the governance and nominating committee will be composed solely of members who satisfy the applicable independence requirements of the NYSE for governance and nominating committees.
-148-
Table of Contents
Risk committee. The risk committee is responsible for overseeing our enterprise-risk management policies, commensurate with our capital structure, risk profile, complexity, size and other risk-related factors:
| • | monitor our overall risk profile and review risk management policies; |
| • | monitor our process to identify, assess and manage risks that could prevent us from achieving our business objectives; |
| • | oversee actions relating to interest rate risk and liquidity risks; |
| • | oversee actions relating to the activities of our enterprise risk management oversight groups; and |
| • | facilitate communication among management, the board of directors and our enterprise risk management oversight groups. |
The risk committee has adopted a written charter that specifies among other things, the scope of its rights and responsibilities.
Board Oversight of Risk Management
Our board of directors believes that effective risk management and control processes are critical to our safety and soundness, our ability to predict and manage the challenges that we face and, ultimately, our long-term corporate success. Our board of directors, both directly and through its committees, is responsible for overseeing our risk management processes, with each of the committees of our board of directors assuming a different and important role in overseeing the management of the risks we face.
The risk committee of our board of directors oversees our enterprise-wide risk management framework, which establishes our overall risk appetite and risk management strategy and enables our management to understand, manage and report on the risks we face. Our risk committee also reviews and oversees policies and practices established by management to identify, assess, measure and manage key risks we face, including the risk appetite metrics developed by management and approved by our board of directors. The audit committee of our board of directors is responsible for overseeing risks associated with financial matters (particularly financial reporting, accounting practices and policies, disclosure controls and procedures and internal control over financial reporting) and engaging as appropriate with our risk committee to assess our enterprise-wide risk framework. The compensation committee of our board of directors has primary responsibility for risks and exposures associated with our compensation policies, plans and practices, regarding both executive compensation and the compensation structure generally. In particular, our compensation committee, in conjunction with our President and Chief Executive Officer and Director of Human Resources and other members of our management as appropriate, reviews our incentive compensation arrangements to ensure these programs are consistent with applicable laws and regulations, including safety and soundness requirements, and do not encourage imprudent or excessive risk-taking by our employees. The governance and nominating committee of our board of directors oversees risks associated with the independence of our board of directors and potential conflicts of interest.
Our senior management is responsible for implementing and reporting to our board of directors regarding our risk management processes, including by assessing and managing the risks we face, including strategic, operational, regulatory, investment and execution risks, on a day-to-day basis. Our senior management is also responsible for creating and recommending to our board of directors for approval appropriate risk appetite metrics reflecting the aggregate levels and types of risk we are willing to accept in connection with the operation of our business and pursuit of our business objectives.
The role of our board of directors in our risk oversight is consistent with our leadership structure, with our President and Chief Executive Officer and the other members of senior management having responsibility for
-149-
Table of Contents
assessing and managing our risk exposure, and our board of directors and its committees providing oversight in connection with those efforts. We believe this division of risk management responsibilities presents a consistent, systemic and effective approach for identifying, managing and mitigating risks throughout our operations.
Compensation Committee Interlocks and Insider Participation
Upon completion of this offering, none of the members of our compensation committee will be or will have been an officer or employee of Byline or its subsidiary, Byline Bank. In addition, none of our executive officers serve or have served as a member of the board of directors, compensation committee or other board committee performing equivalent functions of any entity that has one or more executive officers serving as one of our directors or on our compensation committee.
Code of Business Conduct and Ethics
Our board of directors will adopt a code of business conduct and ethics (the “Code of Ethics”) that applies to all of our directors, officers and employees, including our principal executive officer, principal financial officer and principal accounting officer and persons performing similar functions. The Code of Ethics will be available upon written request to Corporate Secretary, Byline Bancorp, Inc., 180 North LaSalle Street, Suite 300, Chicago, Illinois 60601 and on our website at www.bylinebank.com. If we amend or grant any waiver from a provision of our Code of Ethics that applies to our executive officers, we will publicly disclose such amendment or waiver on our website and as required by applicable law, including by filing a Current Report on Form 8-K.
-150-
Table of Contents
EXECUTIVE AND DIRECTOR COMPENSATION
Summary Compensation Table
The “named executive officers” of Byline Bancorp, Inc. are Alberto J. Paracchini, our principal executive officer, and Lindsay Corby and Timothy C. Hadro, our other two executive officers as of December 31, 2016. In June 2017, our Board of Directors identified additional employees who serve as executive officers effective as of June 2017, see “Management - Executive Officers” above. The following table presents compensation awarded in the fiscal years ended December 31, 2015 and 2016 to our named executive officers or paid to or accrued for those executive officers for services rendered during fiscal years 2015 and 2016. All share and option information in “Executive and Director Compensation” reflects our Reincorporation in Delaware in connection with this offering, and the resulting exchange of one share of Byline Delaware common stock for every five shares of Byline Illinois common stock.
| Year | Salary | Bonus(1) | Option Awards(2) |
All Other Compensation(3) |
Total | |||||||||||||||||||
| Name and Principal Position | ||||||||||||||||||||||||
| Alberto J. Paracchini |
2016 | $ | 375,000 | $ | 281,250 | $ | — | $ | 20,806 | $ | 677,056 | |||||||||||||
| President and Chief Executive Officer |
2015 | 350,000 | 110,000 | 808,937 | 13,223 | 1,282,160 | ||||||||||||||||||
| Lindsay Corby |
2016 | 265,000 | 136,475 | — | 13,834 | 415,309 | ||||||||||||||||||
| Executive Vice President and Chief Financial Officer |
2015 | 250,000 | 76,165 | 183,850 | 7,451 | 517,466 | ||||||||||||||||||
| Timothy C. Hadro |
2016 | 260,000 | 114,400 | — | 14,450 | 388,850 | ||||||||||||||||||
| Executive Vice President and Chief Credit Officer |
2015 | 260,000 | 77,274 | 183,850 | 8,252 | 529,376 | ||||||||||||||||||
| (1) | The amounts in this column represent earned annual cash incentive awards under the Byline Executive Incentive Plan. |
| (2) | The amounts in this column represent the grant date fair value, as determined in accordance with FASB ASC Topic 718 using the valuation methodology for stock options set forth in Note 19 to the Byline’s Consolidated Financial Statements as of and for the years ended December 31, 2016 and 2015 included in this prospectus, of awards of Byline stock options granted pursuant to the Byline Bancorp Equity Incentive Plan. At the time of grant, 50% of the options were subject to performance-based vesting conditions and 50% were subject to time-based vesting conditions, as described below under “Stock Options Awarded under the Byline Bancorp Equity Incentive Plan.” |
| (3) | The items comprising “All Other Compensation” for 2016 are as follows: |
| Contributions to Defined Contribution Plans(a) |
Insurance Premiums(b) |
Total | ||||||||||
| Name | ||||||||||||
| Alberto J. Paracchini |
$ | 6,641 | $ | 14,165 | $ | 20,806 | ||||||
| Lindsay Corby |
5,118 | 8,716 | 13,834 | |||||||||
| Timothy C. Hadro |
4,767 | 9,683 | 14,450 | |||||||||
| (a) | Reflects company contributions under the Byline Bancorp, Inc. 401(k) Plan consistent with company policy for all Byline employees. |
| (b) | Reflects insurance premiums paid for the benefit of each of our named executive officers for medical, dental, life, short-term disability and long-term disability insurance policies consistent with company policy for all Byline employees. |
-151-
Table of Contents
Narrative Disclosure to Summary Compensation Table
Base salary
Each named executive officer’s base salary is a fixed component of compensation for each year for performing specific job duties and functions. The total base salaries earned by our named executive officers in fiscal years 2015 and 2016 are disclosed in the Summary Compensation Table above.
Base salaries for our named executive officers are reviewed annually by the compensation committee of the Byline board of directors (the “Compensation Committee”). Messrs. Paracchini and Hadro’s base salaries were initially established pursuant to their employment agreements with Byline Bank, as described under “Employment agreements with Messrs. Paracchini and Hadro” below, but are subject to review and approval of the Compensation Committee.
Annual incentive
Our named executive officers participate in Byline’s Executive Incentive Plan, which was adopted by the Company in 2014 and is an annual incentive plan under which earned awards are determined following the end of each year based on corporate and individual achievement during the year. Performance is assessed against performance goals and targets that are established for the fiscal year; for each of our named executive officers for each of 2015 and 2016, corporate goals were weighted 70% and individual performance goals were weighted 30%. Named executive officers can earn up to a maximum of 150% of their target annual incentive awards and annual incentive awards may be as low as 0% if the Company’s performance target is not met. The Compensation Committee has discretion to enhance the awards for our named executive officers above the amounts earned based on corporate and individual performance. Executives must be employed on the date of payment in order to receive payment of an earned award.
In 2016, target annual cash incentives under the Executive Incentive Plan for each of our named executive officers was 50% of the named executive officer’s base salary. The annual cash incentives awarded for 2016 performance were: $281,250 for Mr. Paracchini (representing achievement at 150%); $136,475 for Ms. Corby (representing achievement at 103%); and $114,400 for Mr. Hadro (representing achievement at 88%).
Stock options awarded under the Byline Bancorp Equity Incentive Plan
In March 2015, the board of directors of the Company approved the Byline Bancorp Equity Incentive Plan (the “Byline Equity Plan”) in order to promote the long-term financial interests and growth of the Company by attracting, motivating and retaining key management and other personnel, in a manner aligned with the long-term interests of the Company’s stockholders. In June 2017, the board of directors terminated the Byline Equity Plan in connection with the IPO, such that no new awards may be made under the Byline Equity Plan. Awards previously granted under the Byline Equity Plan, however, remain outstanding. The Byline Equity Plan is administered by the Compensation Committee. Prior to the plan’s termination, the Compensation Committee had discretion to grant stock options under the Byline Equity Plan to eligible employees, non-employee members of the board of directors or other persons having a service relationship with the Company.
Our named executive officers were granted awards of stock options under the Byline Equity Plan on June 26, 2015 (each, a “2015 Option Award”) in the following amounts: 428,988 options for Mr. Paracchini; 97,496 options for Ms. Corby; and 97,496 options for Mr. Hadro. Pursuant to each named executive officer’s stock option award agreement, the 2015 Option Award was divided into equal amounts of (1) options with time-based vesting conditions (“Time Options”) and (2) options with performance-based vesting conditions (“Performance Options”). The Time Options were designed to vest based on a participant’s continued employment, with 20% vesting annually beginning on the first anniversary of June 28, 2013, the date of the Recapitalization. The Performance Options vest based on the achievement of four performance criteria: (1) adversely classified assets as a percent of each of Tier 1 capital and allowance for loan and lease losses (the
-152-
Table of Contents
“Adversely Classified Assets Goal”); (2) return on average assets; (3) outstanding memorandums of understanding or consent orders (the “MOU Goal”); and (4) internal rate of return for stockholders holding the Company’s common stock as of the Recapitalization. Upon the achievement of the applicable performance criteria, Performance Options are treated as Time Options and vest based on a participant’s continued employment, with 20% vesting annually beginning on the first anniversary of the Recapitalization (with credit for time vesting already completed as of the date the performance criteria are achieved). As of December 31, 2016, Byline achieved the Adversely Classified Assets Goal and the MOU Goal. Accordingly, as of December 31, 2016, 128,696 of the Time Options and 42,894 of the Performance Options granted to Mr. Paracchini were vested, 29,249 of the Time Options and 9,748 of the Performance Options granted to Ms. Corby were vested and 29,249 of the Time Options and 9,748 of the Performance Options granted to Mr. Hadro were vested, as shown under Outstanding Equity Awards at Fiscal Year End below.
Following a “change in control”, if an option holder’s employment is terminated without “cause” or the option holder terminates employment for “good reason”, in each case within 12 months after such “change in
control”, the unvested portion of the Time Options will become immediately vested and exercisable and the Performance Options will only remain subject to the applicable performance conditions, which will be measured at the normal time. Following a “special change in control”, the Time Options will become immediately vested and exercisable and the Performance Options will only remain subject to achievement of the applicable performance goals measured at the time of the “special change in control.”
“Change in control” generally means: (1) any person other than a fiduciary holding shares under an employee benefit plan or a corporation owned directly or indirectly by the stockholders of the Company in substantially the same proportions as their ownership of stock of the Company is or becomes the beneficial owner of more than 50% of both the total voting power of the then outstanding shares (“Voting Stock”) and the fair market value of the outstanding shares of capital stock of the Company (“Economic Stock”); (2) the consummation of a reorganization, merger or consolidation, or the sale or other disposition of all or substantially all of the assets of the Company unless all or substantially all of the individuals and entities who were the beneficial owners of both the Voting Stock and Economic Stock beneficially own, directly or indirectly, more than 50% of either (A) the total voting power represented by the voting securities entitled to vote generally in the election of directors of the corporation resulting from the transaction or (B) the total fair market value represented by all the voting and nonvoting equity securities of the corporation resulting from the transaction in substantially the same proportions as their ownership, immediately prior to the transaction, of the Voting Stock and Economic Stock (combined); or (3) the stockholders of the Company approve a plan of complete liquidation or dissolution of the Company.
“Special change in control” generally means a “change in control”, other than by plan of complete liquidation or dissolution, where in addition, either (1) the beneficial owners of at least 25% of the Voting Stock and the Economic Stock, in the aggregate, held by the beneficial owners holding all of the Voting Stock and the Economic Stock on June 28, 2013 receive in such transaction either cash or securities that are publicly traded on a securities exchange (and not restricted for more than 30 days other than pursuant to applicable law or regulation); or (2) such transaction satisfies the definition of a “change in control” above with “70%” replacing “50%” each time it appears.
“Cause” is defined in the employment agreement for each of Messrs. Paracchini and Hadro (described below under “Employment Agreements with Messrs. Paracchini and Hadro”). For Ms. Corby, “cause” generally means: (1) willful and continued failure to substantially perform duties; (2) willfully engaging in illegal conduct, an act of dishonesty or gross misconduct related to the performance of duties and responsibilities; (3) commission of a crime involving moral turpitude, dishonesty, fraud, theft or financial impropriety; (4) willful violation of a material requirement of any applicable code of ethics or standards of conduct of Byline or Byline Bank or fiduciary duty; or (5) a breach of the Agreement Protecting Company Interests (described below under “Employment Agreements with Messrs. Paracchini and Hadro”).
-153-
Table of Contents
“Good reason” is defined in the employment agreement for each of Messrs. Paracchini and Hadro. If an option holder is not a party to an employment agreement, the option award agreement does not provide a right to terminate employment for “good reason” following a change in control. Ms. Corby is not party to an employment agreement.
Employment agreements with Messrs. Paracchini and Hadro
Byline Bank previously entered into an employment agreement with Mr. Paracchini, which became effective on January 21, 2016, and an employment agreement with Mr. Hadro, which became effective on March 4, 2015. Each agreement is for an initial term of three years with automatic one-year extensions at the end of each year following the initial term unless notice of termination is provided. During the term of their respective agreements, Mr. Paracchini serves as President and Chief Executive Officer, reporting to the board of directors of Byline Bank, and Mr. Hadro serves as Executive Vice President, Head of Special Assets Group (and has since been named Byline’s Chief Credit Officer). Material terms of the employment agreements include: for
Mr. Paracchini, an annual base salary of $350,000 (which has since been increased and is $375,000 as of December 31, 2016), participation in the Executive Incentive Plan, with a maximum annual bonus of 75% of his annual base salary, and participation in the Byline Equity Plan; and for Mr. Hadro, an annual base salary of $260,000, participation in the Executive Incentive Plan with a target annual bonus of 50% of his annual base salary, and participation in Byline’s long-term incentive program (which was previously covered by Mr. Hadro’s participation in the Byline Equity Plan).
Messrs. Paracchini and Hadro’s employment agreements also include severance benefits that are, in each case, subject to signing a release. If Byline Bank terminates the executive without “cause” (and not due to disability) or the executive resigns for “good reason”, the executive will be entitled to: (1) one-and-a-half times (for Mr. Paracchini) or one times (for Mr. Hadro) the sum of (A) his then-current annual base salary; and (B) the excess of the applicable COBRA premiums for health, dental and vision benefits on the date of termination (provided that he elects COBRA continuation coverage) over the amount of health, dental and vision premiums charged to active employees of the Company for like coverage on the date of termination, payable in cash in installments over 18 months (for Mr. Paracchini) or 12 months (for Mr. Hadro) following termination of employment, and (2) a pro rata bonus for the year of termination based on actual performance and paid following the end of the fiscal year. In the event the executive is terminated without “cause” (and not due to disability) or the executive voluntarily resigns for “good reason” within two years (for Mr. Paracchini) or one year (for Mr. Hadro) following a “change in control”, he will be entitled to each of the severance payments described above plus one-and-a-half times (for Mr. Paracchini) or one times (for Mr. Hadro) the higher of the two immediately preceding completed fiscal years’ earned bonus, with all amounts other than the pro rata bonus payable in a lump sum following termination of employment. In the event of a “special change in control”, regardless of whether employment is terminated, each of Mr. Paracchini and Mr. Hadro is entitled to each of the severance payments described above for a qualifying termination following a “change in control” with such pro rata bonus being paid based on achievement of applicable performance goals through the date of the “special change in control” (as opposed to through the end of the fiscal year).
“Cause” generally means: (1) willful and continued failure to perform substantially your duties; (2) willfully engaging in illegal conduct, an act of dishonesty or gross misconduct related to the performance of your duties and responsibilities; (3) being charged with a crime (or in the case of Mr. Hadro, the commission of a crime) involving moral turpitude, dishonesty, fraud, theft or financial impropriety; (4) willful violation of a material requirement of any applicable code of ethics or standards of conduct of Byline or violation of fiduciary duty to Byline; or (5) a breach of the Agreement Protecting Company Interests.
“Good reason” generally means: (1) any material reduction in base salary; (2) any material adverse change in title, position, authority or reporting relationships (for Mr. Paracchini) or being required to report to any employee other than the Chief Executive Officer (for Mr. Hadro); (3) the requirement to relocate principal place of employment to a location in excess of thirty-five (35) miles (for Mr. Paracchini) or fifty (50) miles (for
-154-
Table of Contents
Mr. Hadro) from the principal work location on the date of the employment agreement; or (4) the failure to nominate to, or removal from, the board of directors of Byline Bank (for Mr. Paracchini only).
“Change in control” and “special change in control” are defined consistent with the definitions provided under “Stock Options Awarded under the Byline Bancorp Equity Incentive Plan” above.
As a condition to their respective employment agreements, Messrs. Paracchini and Hadro entered into Agreements Protecting Company Interests with Byline Bancorp, Inc. and Byline Bank. Ms. Corby also entered into an Agreement Protecting Company Interests with Byline Bancorp, Inc. and Byline Bank in connection with her receipt of a 2015 Option Award. The Agreement Protecting Company Interests contains (1) a confidentiality provision regarding the use and disclosure of confidential information during the term of employment and after, (2) a customer and employee non-solicit during employment and for eighteen (18) months following termination of employment (for Mr. Paracchini) and twelve (12) months (for Ms. Corby and Mr. Hadro), and (3) assignment of inventions and non-disparagement provisions.
Savings and Retirement Plans
Byline maintains the Byline Bancorp, Inc. 401(k) Plan (the “401(k) Plan”), which is a tax-qualified defined contribution savings plan for all eligible employees of Byline, including each of our named executive officers. Under the 401(k) Plan, eligible employees may contribute up to 90% of their pay (subject to Internal Revenue Service limitations) to the 401(k) Plan. Contributions are withheld by payroll deductions on a pre-tax basis. Byline matches 100% of the first 3% of the pay that an employee contributes on a pre-tax basis to the 401(k) Plan and 50% of the next 2% of the pay that an employee contributes on a pre-tax basis to the 401(k) Plan. Messrs. Paracchini and Hadro and Ms. Corby are eligible for such matching contributions. Participants are 100% vested in their pre-tax contributions and, upon completion of three years of service, the employer matching contributions. Each of our named executive officers is fully vested in their employer matching contributions.
Outstanding Equity Awards at Fiscal Year End
As of December 31, 2016, our named executive officers held outstanding equity-based awards of the Company as listed in the table below.
| Option Awards | ||||||||||||||||||||||||
| Grant Date | Number of Securities Underlying Unexercised Options (#) exercisable |
Number of Securities Underlying Unexercised Options (#) unexercisable(1) |
Equity Incentive Plan awards: Number of securities underlying unexercised unearned options (#)(2) |
Option Exercise Price |
Option Expiration Date(3) |
|||||||||||||||||||
| Name | ||||||||||||||||||||||||
| Alberto J. Paracchini |
6/26/2015 | 171,590 | 85,798 | 171,600 | $ | 11.18 | 6/26/2025 | |||||||||||||||||
| Lindsay Corby |
6/26/2015 | 38,997 | 19,499 | 39,000 | $ | 11.18 | 6/26/2025 | |||||||||||||||||
| Timothy C. Hadro |
3/2/2015 | 38,997 | 19,499 | 39,000 | $ | 11.18 | 3/2/2025 | |||||||||||||||||
| (1) | These options were granted pursuant to the Byline Equity Plan and vest 50% on June 28, 2017 and 50% on June 28, 2018. |
| (2) | These options were granted pursuant to the Byline Equity Plan and are earned based on the achievement of performance goals, as described under “Stock Options Awarded under the Byline Bancorp Equity Incentive Plan” above and, except with respect to certain qualifying terminations, the participant’s continued employment on the date of such achievement. |
| (3) | The options may expire earlier than the expiration date listed in the case of termination of employment, a participant’s breach of their Agreement to Protect Company Interests, a change in control or the suspension or termination of the Byline Equity Plan by the Byline board of directors. |
-155-
Table of Contents
Anticipated Changes to Our Compensation Program Following This Offering
In connection with this offering, our board of directors has adopted, and Byline Bancorp, Inc., an Illinois corporation, as our sole stockholder prior to the Reincorporation, has approved, the incentive plans and benefits described below, under which we will be permitted to grant a variety of equity-based and cash-based incentive awards.
2017 Omnibus Incentive Compensation Plan
Our board of directors has adopted, and our sole stockholder has approved, the Byline Bancorp, Inc. 2017 Omnibus Incentive Compensation Plan (the “Omnibus Plan”) in connection with this offering.
The purposes of the Omnibus Plan are to help us attract, retain and motivate key employees (including prospective employees), consultants and non-employee directors, align the interests of those individuals with the interests of the Company’s stockholders and promote ownership of the Company’s equity. To accomplish these purposes, the Omnibus Plan provides for the grant of stock options (both stock options intended to meet the requirements of “incentive stock options” under Section 422 of the Code and “non-qualified stock options” that do not meet such requirements), stock appreciation rights (“SARs”), restricted stock, restricted stock units, dividend equivalent rights and other equity-based, equity-related or cash-based awards (including performance share awards and performance units settled in cash) (collectively, “awards”).
Shares Subject to the Omnibus Plan
A total of 1,550,000 shares of our common stock (as adjusted in connection with the Reincorporation) will be reserved and available for issuance under the Omnibus Plan. If an award granted under the Omnibus Plan expires, is forfeited or is settled in cash, the shares of our common stock not acquired pursuant to the award will again become available for subsequent issuance under the Omnibus Plan. Shares of our common stock subject to awards that are assumed, converted or substituted under the Omnibus Plan as a result of our acquisition of another company will not be counted against the number of shares that may be granted under the Omnibus Plan. With respect to awards of stock-settled SARs, the total number of shares that may be granted under the Omnibus Plan will be reduced by the full number of shares underlying the exercised portion of such award (rather than only the number of shares actually delivered upon exercise). The following types of shares under the Omnibus Plan will not become available for the grant of new awards under the Omnibus Plan: (i) shares withheld to satisfy any tax withholding obligation, (ii) shares tendered to, or withheld by, us to pay the exercise price of an option and (iii) shares covered by a SAR (to the extent that it is settled in shares).
The aggregate number of shares of our common stock that may be granted to any employee during a fiscal year in the form of awards (other than stock options and SARs) that are intended to be “performance-based compensation” for purposes of Section 162(m) of the Code, may not exceed shares (which will be calculated by dividing approximately $3,500,000 by the public offering price). The maximum number of shares of our common stock that may be granted to any single individual during a fiscal year in the form of stock options may not exceed 200,000 shares (as adjusted in connection with the Reincorporation). The maximum number of shares of our common stock that may be granted to any single individual during a fiscal year in the form of SARs may not exceed 200,000 shares (as adjusted in connection with the Reincorporation). Aggregate awards to any one non-employee director in respect of any fiscal year, solely with respect to his or her service as a director, may not exceed $2,000,000 based on the aggregate value of cash awards and fair market value of stock-based awards, in each case, determined as of the date of grant.
Administration of the Omnibus Plan
The Omnibus Plan will be administered by the compensation committee (and its delegates) unless the board of directors determines otherwise. For purposes of this summary, we refer to the committee that
-156-
Table of Contents
administers the Omnibus Plan, and to any person or group to whom this committee delegates authority, as the compensation committee. Subject to the terms of the Omnibus Plan, the compensation committee will determine which employees, consultants and non-employee directors will receive awards under the Omnibus Plan, the dates of grant, the number and types of awards to be granted, the exercise or purchase price of each award, and the terms and conditions of the awards, including the period of their exercisability and vesting and the fair market value applicable to a stock award.
In addition, the compensation committee has the authority to determine whether any award may be settled in cash, shares of our common stock, other securities or other awards or property. The compensation committee has the authority to interpret the Omnibus Plan and may adopt any administrative rules, regulations, procedures and guidelines governing the Omnibus Plan or any awards granted under the Omnibus Plan as it deems to be appropriate. The compensation committee may also delegate any of its powers, responsibilities or duties to any person who is not a member of the compensation committee or any administrative group within the Company. Our board of directors may also grant awards or administer the Omnibus Plan.
Conditions on Awards
All of the awards described below are subject to the conditions, limitations, restrictions, vesting and forfeiture provisions determined by the compensation committee, in its sole discretion, subject to certain limitations provided in the Omnibus Plan. The compensation committee may condition the vesting of or the lapsing of any applicable vesting restrictions or conditions on awards upon the attainment of performance goals, continuation of service, or any other term or conditions. The vesting conditions placed on any award need not be the same with respect to each grantee and the compensation committee will have the sole discretion to amend any outstanding award to accelerate or waive any or all restrictions, vesting provisions or conditions set forth in the award agreement.
Each award granted under the Omnibus Plan will be evidenced by an award agreement, which will govern that award’s terms and conditions. In the case of any conflict or potential inconsistency between the Omnibus Plan and a provision of any award or award agreement with respect to an award, the Omnibus Plan will govern.
Types of Awards
The Omnibus Plan provides for the grant of stock options intended to meet the requirements of “incentive stock options” under Section 422 of the Code as well as “non-qualified stock options” that do not meet such requirements, SARs, restricted stock, restricted stock units, dividend equivalent rights and other equity-based, equity-related or cash-based awards (including performance-based awards).
Stock Options
An award of a stock option gives a grantee the right to purchase a certain number of shares of our common stock during a specified term in the future, after a vesting period (if any), at an exercise price equal to at least 100% of the fair market value of our common stock on the grant date. The term of a stock option may not exceed 10 years from the date of grant. Incentive stock options may only be granted from a plan that has been approved by our stockholders and will be exercisable in any fiscal year only to the extent that the aggregate fair market value of our common stock with respect to which the incentive stock options are exercisable for the first time does not exceed $100,000. No incentive stock option may be granted to any person who, at the time of the grant, owns or is deemed to own stock possessing more than 10% of our total combined voting power or that of any of our affiliates unless (i) the option exercise price is at least 110% of the fair market value of the stock subject to the option on the date of grant and (ii) the term of the incentive stock option does not exceed five years from the date of grant. The exercise price of any stock option may be paid using (i) cash, check or certified bank check, (ii) shares of our common stock, (iii) a net exercise of the stock option, (iv) other legal consideration approved by the Company and permitted by applicable law or (v) any combination of the foregoing.
-157-
Table of Contents
Stock Appreciation Rights (SARs)
A SAR entitles the grantee to receive an amount equal to the difference between the fair market value of our common stock on the exercise date and the exercise price of the SAR (which may not be less than 100% of the fair market value of a share of our common stock on the grant date), multiplied by the number of shares subject to the SAR. The term of a SAR may not exceed 10 years from the date of grant. Payment to a grantee upon the exercise of a SAR may be either in cash, shares of our common stock or other securities or property, or a combination of the foregoing, as determined by the compensation committee.
Restricted Stock
A restricted stock award is an award of outstanding shares of our common stock that does not vest until a specified period of time has elapsed or other conditions have been satisfied, as determined by the compensation committee, and which will be forfeited if the conditions to vesting are not met. The compensation committee will issue a certificate in respect to the shares of restricted stock, unless the compensation committee elects to use another system, such as book entries by the transfer agent, as evidencing ownership of such shares. In the event a certificate is issued it may be registered in the name of the grantee, and the Company will hold the certificate until the restrictions upon the award have lapsed. During the period that any restrictions apply, the transfer of stock awards is generally prohibited. Grantees have full voting rights with respect to their restricted shares. Unless the compensation committee determines otherwise, all ordinary cash dividend payments or other ordinary distributions paid upon a restricted stock award will be retained by us and will be paid to the relevant grantee (without interest) when the award of restricted shares vests and will revert back to us if for any reason the restricted share upon which such dividends or other distributions were paid reverts back to us.
Restricted Stock Units
A restricted stock unit is an unfunded and unsecured obligation to issue a share of common stock (or an equivalent cash amount) to the grantee in the future. Restricted stock units become payable on terms and conditions determined by the compensation committee and will be settled either in cash, shares of our common stock or other securities or property, or a combination of the foregoing, as determined by the compensation committee.
Dividend Equivalent Rights
Dividend equivalent rights entitle the grantee to receive amounts equal to all or any of the ordinary cash dividends that are paid on the shares underlying a grant while the grant is outstanding. Dividend equivalent rights may be paid in cash, in shares of our common stock or in another form. The compensation committee will determine whether dividend equivalent rights will be conditioned upon the exercise of the award to which they relate (subject to compliance with Section 409A of the Code) and other terms and conditions, as determined by the compensation committee. No dividends may be paid unless and until an award vests.
Other Stock-Based or Cash-Based Awards
Under the Omnibus Plan, the compensation committee may grant other types of equity-based, equity-related or cash-based awards subject to such terms and conditions that the compensation committee may determine. Such awards may include the grant or offer for sale of unrestricted shares of our common stock, performance share awards and performance units settled in cash.
Performance-Based Awards
At the discretion of the compensation committee, other stock-based or cash-based awards may be granted in a manner which is intended to be deductible by the Company under Section 162(m) of the Code
-158-
Table of Contents
(taking into account any transition relief available thereunder). In such event, the performance-based award will be determined based on the attainment of written objective performance goals based on one or more of the Performance Criteria (as defined below), and may be measured in absolute terms or relative to historic performance or the performance of other companies or an index. The performance goal(s) must be approved by the compensation committee for a performance period established by the compensation committee (i) while the outcome for that performance period is substantially uncertain and (ii) no more than 90 days after the commencement of the performance period to which the performance goal relates or, if the performance period is less than one year, the number of days which is equal to 25% of the relevant performance period. When setting performance goals, the compensation committee will also prescribe a formula to determine the amount of the performance-based award that may be payable upon the level of attainment of the performance goals during the performance period. Following the completion of each performance period, the compensation committee will have the sole discretion to determine whether the applicable performance goals have been met with respect to each individual, and if they have, will certify the amount of the applicable performance-based award. The amount of a performance-based award actually paid may be less (but not more) than the amount determined according to the formula, at the discretion of the compensation committee.
If performance goals are established by the compensation committee in connection with the grant of an award, they will be based upon performance criteria which may include one or more of the following (“Performance Criteria”): (1) return measures (including, but not limited to, total shareholder return; return on equity; return on tangible common equity; return on tier 1 common equity; return on assets or net assets; return on risk-weighted assets; and return on capital (including return on total capital or return on invested capital)); (2) revenues (including, but not limited to, total revenue; gross revenue; net revenue; revenue growth; and net sales); (3) income/earnings measures (including, but not limited to, earnings per share; earnings or loss (including earnings before or after interest, taxes, depreciation and amortization); gross income; net income after cost of capital; net interest income; non-interest income; fee income; net interest margin; operating income (before or after taxes); pre- or after-tax income or loss; pre- or after-tax operating income; net earnings; net income or loss; operating margin; gross margin; and adjusted net income); (4) expense measures (including, but not limited to, expenses; operating efficiencies; non-interest expense and operating/efficiency ratios; and improvement in or attainment of expense levels or working capital levels (including cash and accounts receivable)); (5) balance sheet/risk management measures (including, but not limited to, loans; deposits; assets; tangible equity; charge-offs; net charge-offs; non-performing assets or loans; risk-weighted assets; classified assets; criticized assets; allowance for loans and lease losses; loan loss reserves; asset quality levels; year-end cash; investments; interest-sensitivity gap levels; regulatory compliance; satisfactory internal or external audits; financial ratings; shareholders’ equity; tier 1 capital; and liquidity); (6) cash flow measures (including, but not limited to, cash flow or cash flow per share (before or after dividends); and cash flow return on investment); (7) share price measures (including, but not limited to, share price; appreciation in and/or maintenance of share price; and market capitalization); (8) strategic objectives (including, but not limited to, market share; debt reduction; operating efficiencies; customer satisfaction; customer or household growth; employee satisfaction; research and development achievements; branding; mergers and acquisitions; succession management; people development; management retention; expense reduction initiatives; reductions in costs; risk management; regulatory compliance and achievements; and recruiting and maintaining personnel); and (9) other measures (including, but not limited to, financial ratios (including those measuring liquidity, activity, profitability or leverage); cost of capital or assets under management; and financing and other capital raising transactions). Any of the above criteria may be used with or without adjustment for extraordinary items or nonrecurring items, and to the extent permitted under Section 162(m) of the Code (taking into account any transition relief available thereunder), the compensation committee may provide for objectively determinable adjustments, modifications or amendments, as determined in accordance with GAAP, to any of the Performance Criteria for one or more of the items of gain, loss, profit or expense.
-159-
Table of Contents
Adjustments
In connection with a recapitalization, stock split, reverse stock split, stock dividend, spinoff, split up, combination, reclassification or exchange of shares, merger, consolidation, rights offering, separation, reorganization or liquidation, or any other change in the corporate structure or shares, including any extraordinary dividend or extraordinary distribution, the compensation committee will make adjustments as it deems appropriate in (i) the maximum number of shares of our common stock reserved for issuance as grants, (ii) the maximum number of stock options, SARs or awards intended to qualify as “performance-based compensation” that any individual participating in the Omnibus Plan may be granted in any fiscal year, (iii) the number and kind of shares covered by outstanding grants, (iv) the kind of shares that may be issued under the Omnibus Plan and (v) the terms of any outstanding stock awards, including exercise or strike price, if applicable.
Amendment; Termination
Our board of directors may amend or terminate the Omnibus Plan at any time, provided that no such amendment may materially adversely impair the rights of a grantee of an award without the grantee’s consent. Our stockholders must approve any amendment to the extent required to comply with the Code, applicable laws or applicable stock exchange requirements. Unless terminated sooner by our board of directors or extended with stockholder approval, the Omnibus Plan will terminate on the day immediately preceding the tenth anniversary of the date on which our stockholder approved the Omnibus Plan, but any outstanding award will remain in effect until the underlying shares are delivered or the award lapses.
Change in Control
Unless the compensation committee determines otherwise, or as otherwise provided in the applicable award agreement, (i) in the case of a grantee other than a non-employee director, if such grantee’s employment is terminated by us without “cause” (as defined in the Omnibus Plan) or the participant resigns his or her employment for “good reason” (as defined in the Omnibus Plan), in either case, on or within two years after a “change in control” (as defined in the Omnibus Plan), (A) all outstanding awards will become fully vested (including lapsing of all restrictions and conditions), and, as applicable, exercisable and (B) any shares deliverable pursuant to restricted stock units will be delivered promptly (but no later than 15 days) following such grantee’s termination of employment and (ii) in the case of a non-employee director grantee, each award will become fully vested (including the lapsing of all restrictions and conditions) and, as applicable, exercisable upon a “change in control” (as defined in the Omnibus Plan), and any shares deliverable pursuant to restricted stock units will be delivered promptly (but no later than 15 days) following such change in control. As of the change in control date, any outstanding performance-based awards will be deemed earned at the greater of the target level and the actual performance level at the date of the change in control with respect to all open performance periods and will cease to be subject to any further performance conditions.
In the event of a change in control, the compensation committee may also (i) provide for the assumption of or the issuance of substitute awards, (ii) provide that for a period of at least 20 days prior to the change in control, stock options or SARs that would not otherwise become exercisable prior to a change in control will be exercisable as to all shares of common stock, as the case may be, subject thereto and that any stock options or SARs not exercised prior to the consummation of the change in control will terminate and be of no further force or effect as of the consummation of the change in control, (iii) modify the terms of such awards to add events or conditions (including the termination of employment within a specified period after a change in control) upon which the vesting of such awards will accelerate, (iv) deem any performance conditions satisfied at target, maximum or actual performance through closing or provide for the performance conditions to continue (as is or as adjusted by the compensation committee) after closing or (v) settle awards for an amount of cash or securities equal to their value (in the case of stock options and SARs that are settled in cash, the value of such awards will be equal to their in-the-money spread value, if any, of such awards, as determine in the sole discretion of the compensation committee). In the event that the consideration paid in the change in control includes contingent
-160-
Table of Contents
value rights, earnout or indemnity payments or similar payments, then the compensation committee will determine if awards settled pursuant to item (v) above are (a) valued at closing taking into account such contingent consideration (with the value determined by the compensation committee in its sole discretion) or (b) entitled to a share of such contingent consideration.
In general terms, except in connection with any initial public offering and except as expressly defined in an award agreement, a change in control under the Omnibus Plan occurs if following the completion of this offering:
| • | during any period of not more than 36 months, individuals who constitute the board of directors as of the beginning of the period whose appointment or election is endorsed by two-thirds of the incumbent directors no longer constitute a majority of the board; |
| • | a person, other than MBG Investors I, L.P. or any of its direct or indirect subsidiaries, becomes a beneficial owner, directly or indirectly, of our capital stock representing 50% of the voting power of our outstanding capital stock; |
| • | we merge into another entity, unless (i) the business combination is with MBG Investors I, L.P. or any of its direct or indirect subsidiaries or (ii) (a) more than 50% of the combined voting power of the merged entity or its parent is represented by our voting securities that were outstanding immediately prior to the merger, (b) the board of directors prior to the merger constitutes at least 50% of the board of the merged entity or its parent following the merger and (c) no person is or becomes the beneficial owner of 50% or more of the combined voting power of the outstanding capital stock eligible to elect directors of the merged entity or its parent; |
| • | we sell or dispose of all or substantially all of our assets (other than to MBG Investors I, L.P. or any of its direct or indirect subsidiaries); or |
| • | we are liquidated or dissolved. |
Clawback
All awards under the Omnibus Plan will be subject to any clawback or recapture policy that we may adopt from time to time.
Byline Bancorp, Inc. Employee Stock Purchase Plan
Our board of directors has adopted, and our sole stockholder has approved, the Byline Bancorp, Inc. Employee Stock Purchase Plan (the “ESPP”) in connection with this offering. The ESPP will allow our employees to purchase shares of our common stock at a discount from the market price through automatic payroll deductions. A total of 200,000 (as adjusted in connection with the Reincorporation) shares of our common stock will be reserved and available for sale under the ESPP, subject to adjustment in accordance with the terms of the ESPP. We intend for the ESPP to be qualified under Section 423 of the Code.
Administration
The ESPP will be administered by the compensation committee of our board of directors, who may delegate its administrative authority to a person or committee who shall serve as the “Plan Administrator.” The compensation committee has delegated such authority to our senior human resources officer. The Plan Administrator will have the authority to make and adopt rules and regulations not inconsistent with the provisions of the ESPP or the Code. In addition, the Plan Administrator will correct any defect or supply any omission or reconcile any inconsistency in the ESPP. The interpretations and decisions of the Plan Administrator in respect to the ESPP will be final and binding.
-161-
Table of Contents
Eligible Employees
All of our employees or employees of participating subsidiaries, as defined in the ESPP, whose customary term of employment is for more than 20 hours per week, are eligible to participate in the ESPP. In addition, no employee may purchase shares of our common stock under the ESPP that would result in the employee owning 5% or more of the total combined voting power or value of our stock or the stock of any of our subsidiaries.
Offerings
From time-to-time, the Company will offer employees the opportunity to buy stock in the Company through the ESPP. Unless determined otherwise by the compensation committee, offerings will begin on January 1 and July 1 of each year and last for a period of six months. The compensation committee will establish an enrollment period, a period of time prior to the beginning of an offering during which eligible participants may subscribe to an offering in such manner as the compensation committee may prescribe (which may include enrollment by submitting forms, by voice response, internet access or other electronic means). Eligible employees elect whether to participate in the ESPP (i.e., have deductions made from their after-tax compensation for the purpose of buying shares) during the enrollment period.
Each eligible employee who is a participant as of the date an offering commences is deemed to be granted an option to participate in the ESPP for that offering. The compensation committee may also establish a waiting period of up to two years after an employee is first employed before the employee may participate, or permit employees who are hired during an offering period to participate in the offering. On the last day of each offering period, the accumulated balance in each participant’s account will be used to purchase shares at the purchase price described below. The compensation committee may also provide for periodic purchase dates during an offering period.
A participant can change his or her level of withholding, or withdraw his or her subscription at any time (but not retroactively), during an offering, subject to rules and limitations established by the Plan Administrator. A participant whose employment is terminated during an offering period will be deemed to have withdrawn his or her subscription. Upon the withdrawal (or deemed withdrawal) of a participant, the balance in his or her account will either be refunded or used to purchase shares on the next purchased date, as determined by the compensation committee.
Purchase Price
The purchase price paid by participants for the shares purchased under the ESPP will be set by the compensation committee and will, in any case, be no less than 85% of the lower of the fair market value of a share of our common stock on the first day of the applicable offering period or on the purchase date. Unless provided otherwise, the default purchase price per share provided for in the ESPP will be 85% of the fair market value of a share of our common stock on the last day of the applicable offering period or earlier purchase date.
Limitations on Purchase
As required by the Code, no eligible employee may purchase stock under the ESPP at a rate which, when aggregated with his or her other rights to purchase our common stock, exceeds $25,000 in fair market value per year. Unless the Plan Administrator determines otherwise, employees are also limited in making elections under the ESPP to contributing no more than 15% of their after-tax compensation to the ESPP.
Mandatory Retention or Sale of Stock
To facilitate compliance with applicable law, the compensation committee may require participants to (a) retain any shares purchased under the ESPP for a designated period of time or may establish other procedures
-162-
Table of Contents
to restrict transfer of such shares or (b) sell shares immediately upon purchase or within a specified period following a termination of employment.
Adjustments
In the event of a stock split, stock dividend, reverse stock split, extraordinary cash dividend, recapitalization, reorganization, reclassification or combination of shares, merger, consolidation, distribution, split-up, spin-off, exchange of shares, sale of assets or similar corporate transaction or event, the compensation committee, in the manner it deems equitable, will adjust (a) the number and class of shares or other securities reserved for issuance under the ESPP, (b) the number and class of shares or other securities that are subject to outstanding options, and (c) the appropriate market value and other price determinations applicable to options (including the purchase price).
Termination and Amendment of the ESPP
Our compensation committee generally may, at any time, terminate or amend the ESPP in any respect, except that, without approval of our shareholders, no amendment may increase the maximum number of our shares reserved under the ESPP or modify the requirements as to eligibility for participation in the ESPP. No termination or amendment of the ESPP may terminate or materially and adversely affect a participant’s rights under the ESPP without such participant’s consent. Unless earlier terminated by the compensation committee, the ESPP shall terminate when no more shares are available for issuance under the ESPP.
IPO Awards
In connection with this offering, the Board has approved the award of a special one-time grant of approximately 58,900 restricted shares under the Omnibus Plan (the “IPO award”) to certain key employees, including Messrs. Paracchini and Hadro and Ms. Corby, to be granted upon the completion of this offering. Mr. Paracchini will receive an award of 10,000 restricted shares (valued at $ based on the price per share of our common stock in the initial public offering), Ms. Corby will receive an award of 7,500 restricted shares (valued at $ based on the price per share of our common stock in the initial public offering) and Mr. Hadro will receive an award of 5,000 restricted shares (valued at $ based on the price per share of our common stock in the initial public offering).
The award agreements for the IPO awards provide that 100% of the restricted shares will cliff vest on the third anniversary of the grant date, subject to continued employment. On a termination of employment by reason of death or disability or a change in control, the restricted shares will vest in full and all transfer restrictions will immediately lapse.
Director Compensation
2016 Director Compensation Table
The following table lists the individuals who served on Byline’s board of directors in 2016 and received compensation in 2016 for their service as directors. All compensation paid to directors is for their service on both the Byline board of directors and the Byline Bank board of directors. Messrs. del Valle Perochena and Ruiz Sacristán did not receive compensation in 2016 for their service on the Byline board of directors.
| Fees earned or paid in cash(1) |
Option Awards(2) | All Other Compensation(3) |
Total | |||||||||||||
| Name | ||||||||||||||||
| Roberto R. Herencia |
$ | 800,000 | $ | — | $ | 32,831 | $ | 832,831 | ||||||||
| L. Gene Beube |
120,000 | — | — | 120,000 | ||||||||||||
| Phillip R. Cabrera |
115,000 | — | — | 115,000 | ||||||||||||
| Steven M. Rull |
10,417 | — | — | 10,417 | ||||||||||||
-163-
Table of Contents
| (1) | Mr. Herencia received $400,000 in annual director fees for his service on the Byline board of directors and its committees. In addition, Mr. Herencia received a special incentive payment of $400,000 to compensate him for the extensive duties and responsibilities he has assumed as Chairman of the board following the Recapitalization transactions. His responsibilities include meeting with Byline’s executive officers and other members of management on a regular basis to ensure appropriate oversight of Byline’s business and meeting on a regular basis with regulators. The incentive payment was paid in two equal installments in each of September 2016 and March 2017 to serve as an incentive for Mr. Herencia to maintain his roles at Byline. Messrs. Beube and Cabrera each received $100,000 in annual director fees for their service on the Byline board of directors in 2016. Mr. Rull, who joined the Byline board of directors on October 14, 2016, received $10,417 in annual director fees for his service in 2016. In addition, Mr. Beube received $15,000 for his service as Chair of the Executive Credit Committee and $5,000 for his service as a member of the Audit Committee; and Mr. Cabrera received $5,000 for his service as Chair of the Regulatory Compliance Committee, $5,000 for his service as a member of the Audit Committee and $5,000 for his service as a member of the Executive Credit Committee. |
| (2) | Mr. Herencia has 428,988 options outstanding as of March 31, 2017, with 171,590 of those options vested and exercisable, 85,798 options subject to time-based vesting conditions and 171,600 subject to performance conditions. No such options were granted in 2016. |
| (3) | Reflects reimbursement for health insurance premiums. |
Byline Bancorp, Inc. Director Compensation Program
As in effect in June 2017, our director compensation program provides the following compensation for non-employee members of our board of directors:
| • | An annual cash retainer of $100,000 for directors who were serving on June 1, 2016 and $75,000 for all other directors; |
| • | An additional annual cash retainer of $15,000 for the chair of the executive credit committee; |
| • | An additional annual cash retainer of $5,000 for the chair of the risk committee; |
| • | An additional annual membership fee of $5,000 for each member of the audit committee and/or executive credit committee; and |
| • | An aggregate annual cash retainer of $400,000 for the Chairman of our board of directors, which includes the annual board retainer and all committee membership and committee chair retainers that the Chairman would otherwise be entitled to. The Chairman currently serves as the chair of each of the audit committee, the compensation committee and the governance and nominating committee. |
The Chairman of the board of directors will also receive an additional annual special incentive payment of $400,000, payable in two equal installments in September 2017 and March 2018, subject to continued service through such dates, to compensate the Chairman for the extensive duties and responsibilities assumed following the Recapitalization transaction. The Chairman’s responsibilities include meeting with Byline’s executive officers and other members of management on a regular basis to ensure appropriate oversight of Byline’s business and meeting on a regular basis with regulators. The annual special incentive payment also serves as an incentive for the Chairman to maintain his or her role at Byline.
We also reimburse all directors for reasonable and substantiated out-of-pocket expenses incurred in connection with the performance of their duties as directors. Additionally, the Chairman of the Board will be reimbursed for cell phone services and two business-related club memberships and will receive an annual stipend of $43,800 that may be used toward medical and health insurance expenses.
-164-
Table of Contents
Directors agree, in connection with their service as directors, that they will not, without the prior consent of Byline, directly or indirectly, provide any material services to any other banking entity which competes in any material respect with Byline and its subsidiaries as long as they serve as a director of Byline (other than services disclosed in writing prior to the adoption of the director compensation program).
Notwithstanding the above, any director who is an officer of the Company will not receive any director compensation.
-165-
Table of Contents
PRINCIPAL AND SELLING STOCKHOLDERS
The following table sets forth information, as of the date of this prospectus, regarding the beneficial ownership of our common stock, immediately prior to and immediately after the consummation of this offering, by:
| • | all persons known by us to own beneficially more than 5% of our outstanding common stock; |
| • | the selling stockholders; |
| • | each of our named executive officers; |
| • | each of our directors; and |
| • | all of our directors and executive officers as a group. |
Beneficial ownership is determined in accordance with the rules of the SEC. These rules generally attribute beneficial ownership of securities to persons who possess sole or shared voting power or investment power with respect to such securities. A security holder is also deemed to be, as of any date, the beneficial owner of all securities that such security holder has the right to acquire within 60 days after such date through (i) the exercise of any option or warrant, (ii) the conversion of a security, (iii) the power to revoke a trust, discretionary account or similar arrangement or (iv) the automatic termination of a trust, discretionary account or similar arrangement. Except as otherwise indicated, all persons listed below have sole voting and investment power with respect to the shares beneficially owned by them, subject to applicable community property laws. Except as otherwise indicated, the address for each stockholder listed below is c/o Byline Bancorp, Inc., 180 North LaSalle Street, Suite 300, Chicago, Illinois 60601. Information presented assumes no participation by the 5% or greater stockholders, directors or officers in the Reserved Share Program.
| Name of Beneficial Owners Greater than 5% Shareholders |
Beneficial Ownership |
Number of |
Beneficial Ownership After the Completion |
|||||||||||||||||
| Number |
Percentage |
Number |
Percentage |
|||||||||||||||||
| MBG Investors I, L.P.(1) |
11,467,123 | 46.58 | % | 0 | 11,467,123 | 39.21 | % | |||||||||||||
| ECR Holdings, S.A. de C.V.(2) |
2,038,691 | 8.28 | % | 0 | 2,038,691 | 6.97 | % | |||||||||||||
| Fambeck Servicios Financieros del Exterior, S.A. de C.V.(3) |
1,706,540 | 6.93 | % | 1,706,540 | 0 | 0.00 | % | |||||||||||||
| Directors and Executive Officers |
||||||||||||||||||||
| Roberto R. Herencia(4) |
306,072 | 1.20 | % | 0 | 306,072 | 1.02 | % | |||||||||||||
| L. Gene Beube |
2,781 | * | 0 | 2,781 | * | |||||||||||||||
| Phillip R. Cabrera(5) |
2,201 | * | 0 | 2,201 | * | |||||||||||||||
| Antonio del Valle Perochena(1) |
11,467,123 | 46.58 | % | 0 | 11,467,123 | 39.21 | % | |||||||||||||
| Jaime Ruiz Sacristán(6) |
107,582 | * | 0 | 107,582 | * | |||||||||||||||
| Steven M. Rull(7) |
190,400 | * | 0 | 190,400 | * | |||||||||||||||
| Alberto Paracchini(8) |
230,304 | * | 0 | 240,304 | * | |||||||||||||||
| Lindsay Corby(9) |
54,018 | * | 0 | 61,518 | * | |||||||||||||||
| Timothy C. Hadro(10) |
48,747 | * | 0 | 53,747 | * | |||||||||||||||
| Rick Schobert(11) |
19,498 | * | 0 | 19,498 | * | |||||||||||||||
| Bruce Lammers(12) |
49,163 | * | 0 | 49,163 | * | |||||||||||||||
| Donald J. Meyer(13) |
48,747 | * | 0 | 53,747 | * | |||||||||||||||
| Thomas J. Bell III(14) |
32,153 | * | 0 | 33,153 | * | |||||||||||||||
| Megan Biggam(15) |
25,297 | * | 0 | 27,297 | * | |||||||||||||||
| All directors and executive officers as a group (14 persons) |
12,584,086 | 51.02 | % | 12,614,586 | 43.05 | % | ||||||||||||||
| Additional Selling Stockholders |
||||||||||||||||||||
| Trinity Universal Insurance Company(16) |
436,532 | 1.77 | % | 218,266 | 218,266 | * | ||||||||||||||
| * | Represents beneficial ownership of less than 1%. |
-166-
Table of Contents
| (1) | Mr. Antonio del Valle Perochena as general partner of MBG Investors I, L.P. possesses the voting and investment power with respect to the securities beneficially owned by MBG Investors I, L.P. and may be deemed the beneficial owner of such securities. The address for MBG Investors I, L.P. is 365 Bay Street, Suite 800, M5H2V1 Toronto, Ontario, Canada. Mr. del Valle Perochena owns 16.625% of the partnership interests of MBG Investors I, L.P. and serves on our board of directors. Mr. del Valle Perochena disclaims beneficial ownership of such shares except to the extent of his pecuniary interest therein. |
| (2) | Mr. Eugenio Santiago Clariond Reyes as sole administrator of ECR Holdings, S.A. de C.V. possesses the voting and investment power with respect to the securities beneficially owned by ECR Holdings, S.A. de C.V. and may be deemed the beneficial owner of such securities. The address for ECR Holdings, S.A. de C.V. is Vasconcelos 220, San Pedro Garza Garcia, Nuevo Leon, Mexico. |
| (3) | Mr. Juan Francisco Beckmann Vidal as sole administrator of Fambeck Servicios Financieros del Exterior, S.A. de C.V. possesses the voting and investment power with respect to the securities beneficially owned by Fambeck Servicios Financieros del Exterior, S.A. de C.V. and may be deemed the beneficial owner of such securities. The address for Fambeck Servicios Financieros del Exterior, S.A. de C.V. is Guillermo Gonzalez Camarena 800, 4th Floor, Mexico D.F., 01210. |
| (4) | Includes 10,147 shares of common stock held through the Roberto Herencia Inc. Defined Benefit Plan as Mr. Herencia has investment and voting power over the securities held by the Plan. Includes 214,490 shares of our common stock underlying options that have vested. Excludes 214,498 shares of our common stock underlying options that are subject to vesting. |
| (5) | Includes 1,600 shares of common stock held through Phillip R. Cabrera Revocable Trust as Mr. Cabrera has investment and voting power over the securities held by the Trust. |
| (6) | Represents the power to vote or direct the voting of shares of common stock owned by Tenedora Jacaru, S.A. de C.V. as the result of Mr. Ruiz Sacristán’s majority ownership interest in Tenedora Jacaru, S.A. de C.V. |
| (7) | Includes the 190,400 shares of common stock owned by Mr. Rull held indirectly through the Rull Family Partnership, L.P. as Mr. Rull possesses the voting and investment power with respect to the securities beneficially owned by the Rull Family Partnership, L.P. |
| (8) | Includes 214,490 shares of our common stock underlying options that have vested. Excludes 214,498 shares of our common stock underlying options that are subject to vesting. Shares beneficially owned after the completion of this offering include restricted shares of common stock to be granted to Mr. Paracchini in connection with the IPO awards. The IPO awards will cliff vest on the third anniversary of the grant date, subject to continued employment. For a discussion of these awards, see “Executive and Director Compensation –IPO Awards”. |
| (9) | Includes 48,747 shares of our common stock underlying options that have vested. Excludes 48,749 shares of our common stock underlying options that are subject to vesting. Shares beneficially owned after the completion of this offering include restricted shares of common stock to be granted to Ms. Corby in connection with the IPO awards. The IPO awards will cliff vest on the third anniversary of the grant date, subject to continued employment. For a discussion of these awards, see “Executive and Director Compensation –IPO Awards”. |
| (10) | Includes 48,747 shares of our common stock underlying options that have vested. Excludes 48,749 shares of our common stock underlying options that are subject to vesting. Shares beneficially owned after the completion of this offering include restricted shares of common stock to be granted to Mr. Hadro in connection with the IPO awards. The IPO awards will cliff vest on the third anniversary of the grant date, subject to continued employment. For a discussion of these awards, see “Executive and Director Compensation –IPO Awards”. |
| (11) | Includes 19,498 shares of our common stock underlying options that have vested. Excludes 19,499 shares of our common stock underlying options that are subject to vesting. |
| (12) | Excludes 182,400 shares of our common stock underlying options that are subject to vesting. |
| (13) | Includes 48,747 shares of our common stock underlying options that have vested. Excludes 48,749 shares of our common stock underlying options that are subject to vesting. Shares beneficially owned after the completion of this offering include restricted shares of common stock to be granted to Mr. Meyer in |
-167-
Table of Contents
| connection with the IPO awards. The IPO awards will cliff vest on the third anniversary of the grant date, subject to continued employment. For a discussion of these awards, see “Executive and Director Compensation –IPO Awards”. |
| (14) | Includes 29,248 shares of our common stock underlying options that have vested. Excludes 29,249 shares of our common stock underlying options that are subject to vesting. Shares beneficially owned after the completion of this offering include restricted shares of common stock to be granted to Mr. Bell in connection with the IPO awards. The IPO awards will cliff vest on the third anniversary of the grant date, subject to continued employment. For a discussion of these awards, see “Executive and Director Compensation –IPO Awards”. |
| (15) | Includes 24,374 shares of our common stock underlying options that have vested. Excludes 24,374 shares of our common stock underlying options that are subject to vesting. Shares beneficially owned after the completion of this offering include restricted shares of common stock to be granted to Ms. Biggam in connection with the IPO awards. The IPO awards will cliff vest on the third anniversary of the grant date, subject to continued employment. For a discussion of these awards, see “Executive and Director Compensation –IPO Awards”. |
| (16) | Trinity Universal Insurance Company is a wholly-owned subsidiary of Kemper Corporation and, accordingly, Kemper Corporation may be deemed to be the beneficial owner of the securities beneficially owned by Trinity Universal Insurance Company. The address for Trinity Universal Insurance Company is One East Wacker Drive – 9th Floor, Chicago, Illinois 60601. |
-168-
Table of Contents
CERTAIN RELATIONSHIPS AND RELATED TRANSACTIONS
We or one of our subsidiaries may occasionally enter into transactions with certain “related persons”. Related persons include our executive officers, directors, 5% or more beneficial owners of our common stock, immediate family members of these persons and entities in which one of these persons has a direct or indirect material interest. We generally refer to transactions with these related persons as “related party transactions”.
Related Party Transaction Policy
Our board of directors will adopt a written policy governing the review and approval of transactions with related parties that will or may be expected to exceed $120,000 in any fiscal year. The policy will call for the related party transactions to be reviewed and, if deemed appropriate, approved or ratified by our audit committee. Upon determination by our audit committee that a transaction requires review under the policy, the material facts are required to be presented to the audit committee. In determining whether or not to approve a related party transaction, our audit committee will take into account, among other relevant factors, whether the related party transaction is in our best interests, whether it involves a conflict of interest and the commercial reasonableness of the transaction. In the event that we become aware of a related party transaction that was not approved under the policy before it was entered into, our audit committee will review such transaction as promptly as reasonably practical and will take such course of action as may be deemed appropriate under the circumstances. In the event a member of our audit committee is not disinterested with respect to the related party transaction under review, that member may not participate in the review, approval or ratification of that related party transaction.
Certain decisions and transactions are not subject to the related party transaction approval policy, including: (i) decisions on compensation or benefits relating to directors or executive officers and (ii) indebtedness to us in the ordinary course of business, on substantially the same terms, including interest rate and collateral, as those prevailing at the time for comparable loans with persons not related to us and not presenting more than the normal risk of collectability or other unfavorable features.
Certain Related Party Transactions
On March 24, 2016, we issued and sold 1,541,585 shares of common stock to MBG Investors I, L.P., a 5% stockholder, and received $25,050,764 for the sale of such securities. Mr. del Valle Perochena, one of our directors, had a pecuniary interest of $4,164,689 in this transaction based on his 16.625% ownership interest in MBG Investors I, L.P. On September 30, 2016, we issued and sold 658,740 shares of common stock to MBG Investors I, L.P. and we received $10,704,532 for the sale of such securities. Mr. del Valle Perochena had a pecuniary interest of $1,779,628 in this transaction based on his 16.625% ownership interest in MBG Investors I, L.P.
On March 24, 2016, we issued and sold 217,137 shares of common stock to ECR Holdings, S.A. de C.V., a 5% stockholder, and we received $3,528,489 for the sale of such securities. On September 30, 2016, we issued and sold 92,199 shares of common stock to ECR Holdings, S.A. de C.V. and we received $1,498,235 for the sale of such securities.
On March 24, 2016, we issued and sold 8,617 shares of common stock to Roberto Herencia, one of our directors, and we received $140,000 for the sale of such securities. On September 30, 2016, we issued and sold 3,585 shares of common stock to Mr. Herencia and we received $58,260 for the sale of such securities.
On December 31, 2016, the Joann R. Rull Irrevocable Trust purchased 250 shares of Series F preferred stock (which were exchanged for series B preferred stock of Byline Delaware in the Reincorporation), and we received $250,000 for the sale of such securities. Steven M. Rull, one of our directors, is the trustee of the trust and his immediate family members are the beneficiaries.
-169-
Table of Contents
Other Related Party Transactions
In the ordinary course of our business, we have engaged and expect to continue engaging through our bank in ordinary banking transactions with our directors, executive officers, their immediate family members and companies in which they may have a 5% or more beneficial ownership interest, including loans to such persons. Any such loan was made on substantially the same terms, including interest rates and collateral, as those prevailing at the time such loan was made as loans made to persons who were not related to us. These loans do not involve more than the normal credit collection risk and do not present any other unfavorable features to us.
At our request, the underwriters have reserved for sale, at the initial public offering price, up to 10% of the shares offered by this prospectus for sale to the directors, senior management, existing stockholders, certain employees of Byline Bancorp, Inc. and Byline Bank and persons having relationships with us through a reserved share program. See “Underwriting—Reserved Shares” for additional information regarding the reserved share program.
Foreign National Commitments and Passivity Commitments
Certain of our stockholders are foreign nationals, and we and certain of these foreign national stockholders have entered into commitments with the Federal Reserve that restrict our ability to engage in certain business transactions without the consent of the Federal Reserve. In particular, subject to certain limited exceptions, we are not permitted to engage in or be a party to any business transaction or relationship with a company that is controlled by these foreign national stockholders or by their immediate families. In addition, our bank is not permitted to engage in or be a party to any extension of credit, as defined in the Federal Reserve’s Regulation O, to these foreign national stockholders, their immediate families or any company controlled by these foreign national stockholders. Our bank is also not permitted to engage in or be a party to any covered transaction, as defined in the Federal Reserve Act and the Federal Reserve’s Regulation W, with any company that is controlled by these foreign national stockholders.
Certain of our stockholders have entered into passivity commitments with the Federal Reserve that generally restrict these stockholders from entering into banking or nonbanking transactions with us. These stockholders may establish and maintain deposit accounts with us provided that the aggregate balance of these deposit accounts does not exceed $500,000 and the accounts are maintained on substantially the same terms as those prevailing for comparable accounts of persons who are unaffiliated with us.
-170-
Table of Contents
The following description of our capital stock is a summary of the material terms of our amended and restated certificate of incorporation and amended and restated bylaws. Reference is made to the more detailed provisions of, and the descriptions are qualified in their entirety by reference to, these documents, which are filed with the SEC as exhibits to the registration statement of which this prospectus is a part, and applicable law.
General
Our authorized capital stock consists of 150,000,000 shares of common stock, $0.01 par value per share, and 25,000,000 shares of preferred stock, par value $0.01 per share, of which 15,003 shares have been designated as Series A preferred stock and 50,000 shares have been designated as Series B preferred stock. As of March 31, 2017, there were issued and outstanding 24,616,706 shares of our common stock, 15,003 shares of our Series A preferred stock and 10,438 shares of our Series B preferred stock. The authorized but unissued shares of our capital stock will be available for future issuance without stockholder approval, unless otherwise required by applicable law or the rules of any applicable securities exchange. All of our issued and outstanding shares of capital stock are validly issued, fully paid and non-assessable.
Common Stock
Subject to the rights and preferences granted to holders of our preferred stock then outstanding, and except with respect to voting rights, conversion rights and certain distributions of our capital stock, holders of our common stock rank equally with respect to distributions and have identical rights, preferences, privileges and restrictions, including the right to attend meetings and receive any information distributed by us with respect to such meetings.
Dividends. Holders of our common stock are equally entitled to receive ratably such dividends as may be declared from time to time by our board of directors out of legally available funds. In no event will any stock dividends or stock splits or combinations of stock be declared or made on common stock unless the shares of common stock at the time outstanding are treated equally and identically, provided that, in the event of a dividend of common stock, shares of common stock shall only be entitled to receive shares of common stock. The ability of our board of directors to declare and pay dividends on our common stock is subject to the laws of the state of Delaware, applicable federal and state banking laws and regulations, and the terms of any senior securities (including preferred stock) we may then have outstanding. Our principal source of income is dividends that are declared and paid by our bank on its capital stock. Therefore, our ability to pay dividends is dependent upon the receipt of dividends from our bank. See “Dividend Policy and Dividends”.
Voting rights. Each holder of our common stock is entitled to one vote for each share of record held on all matters submitted to a vote of stockholders, except as otherwise required by law and subject to the rights and preferences of the holders of any outstanding shares of our preferred stock. Holders of our common stock are not entitled to cumulative voting in the election of directors. Directors are elected by a plurality of the votes cast.
Liquidation rights. In the event of our liquidation, dissolution or winding up, holders of common stock are entitled to share ratably in all of our assets remaining after payment of liabilities, including, but not limited to, the liquidation preference of any then outstanding preferred stock. Because we are a bank holding company, our rights and the rights of our creditors and stockholders to receive the assets of any subsidiary upon liquidation or recapitalization may be subject to prior claims of our subsidiary’s creditors, except to the extent that we may be a creditor with recognized claims against our subsidiary.
Preemptive and other rights. Holders of our common stock are not entitled to any preemptive, subscription or redemption rights, and no sinking fund will be applicable to our common stock.
-171-
Table of Contents
Preferred Stock
Our amended and restated certificate of incorporation authorizes our board of directors to establish one or more series of preferred stock. Unless required by law or any stock exchange, the authorized but unissued shares of preferred stock will be available for issuance without further action by our stockholders. Our board of directors is authorized to divide the preferred stock into series and, with respect to each series, to fix and determine the designation, terms, preferences, limitations and relative rights thereof, including dividend rights, dividend rates, conversion rights, voting rights, redemption rights and terms, liquidation preferences, sinking fund provisions and the number of shares constituting the series. Subject to the rights of the holders of any series of preferred stock, the number of authorized shares of any series of preferred stock may be increased (but not above the total number of shares of preferred stock authorized under our amended and restated certificate of incorporation) or decreased (but not below the number of shares thereof then outstanding) by the affirmative vote of the holders of a majority in voting power of the outstanding shares. Without stockholder approval, we could issue preferred stock that could impede or discourage an acquisition attempt or other transaction that some, or a majority, of our stockholders may believe is in their best interests or in which they may receive a premium for their common stock over the market price of the common stock.
We have two series of preferred stock outstanding as of the date of this prospectus, the terms of which are summarized below. In the Reincorporation merger, Series E Preferred Stock of Byline Illinois were exchanged for Series A Preferred Stock of Byline Delaware and Series F Preferred Stock of Byline Illinois were exchanged for Series B Preferred Stock of Byline Delaware. The Series A Preferred Stock and Series B Preferred Stock have substantially the same rights and privileges as the Series E Preferred Stock and Series F Preferred Stock, respectively.
Series A preferred stock
Preferential rights. Our Series A preferred stock ranks on parity with our common stock as to dividends and senior to our common stock as to distribution upon the liquidation, dissolution, or winding up of Byline. Our Series A preferred stock ranks junior to our Series B preferred stock as to dividends and equal to our Series B preferred stock as to distributions upon the liquidation, dissolution or winding up of Byline. Our Series A preferred stock is not convertible into or exchangeable for any shares of common stock or any other class of Byline capital stock. Holders of our Series A preferred stock do not have any preemptive rights. Byline may issue stock with preferences equal with or junior to the Series A preferred stock without the consent of the holders of the Series A preferred stock.
Dividends. As long as shares of Series A preferred stock remain outstanding, Byline cannot declare or pay any dividend or make any other distribution on any common stock, unless at the time of such dividend or other distribution Byline simultaneously declares and pays a dividend or makes a distribution, in cash or the same securities, assets or property as is paid to the holders of common stock, on each outstanding share of Series A preferred stock in an amount equal to the product of (i) the per share dividend or distribution paid on one share of common stock multiplied by (ii) the Common Stock Multiplier (as defined in the Series A preferred stock certificate of designations). Dividends on the Series A preferred stock are noncumulative.
If the board of directors does not declare a dividend with respect to the common stock in respect of any dividend period, the holders of Series A preferred stock will have no right to receive any dividend for such dividend period, and Byline will have no obligation to pay a dividend for such dividend period, whether or not dividends are declared and paid for any future dividend period with respect to the Series A preferred stock, the common stock or any other class or series of preferred stock.
Voting rights. Holders of Series A preferred stock do not have voting rights other than those described below and as specifically required by Delaware law.
-172-
Table of Contents
Without the vote or consent of a majority of the Series A preferred stock then outstanding, voting as a single class with all other classes and series of parity securities having similar voting rights then outstanding,
Byline may not (i) alter or change the provisions of Byline’s certificate of incorporation (including any certificate of amendment or certificate of designations relating to the Series A preferred stock) or bylaws so as to adversely affect the powers, preferences or rights of the holders of shares of Series A preferred stock or (ii) merge or consolidate with another entity where Byline is not the surviving corporation and the Series A preferred stock is changed into anything other than a class or series of preferred stock of the surviving corporation having voting rights that, if such change had been effected by amendment of the certificate of incorporation, would not have required a vote of the holders of the Series A preferred stock under the certificate of designations for the Series A preferred stock.
Liquidation rights. In the event of the voluntary or involuntary liquidation, dissolution or winding up of Byline, holders of Series A preferred stock are entitled to receive out of assets available for distribution to stockholders, before any distribution of assets may be made to or set aside to holders of our common stock and any capital stock ranking junior to the Series A preferred stock as to distributions, a liquidating distribution in an amount equal to the greater of (i) $10 per share, plus any declared but unpaid dividends thereon, and (ii) the amount that a holder of one share of Series A preferred stock would be entitled to receive if such share were instead equal to a number of shares of common stock equal to the Common Stock Multiplier immediately prior to such liquidation, dissolution or winding up, plus any declared but unpaid dividends thereon.
Redemption. With the prior approval of the Federal Reserve, Byline may redeem the Series A preferred stock (i) in whole or in part, at its option, at any time or from time to time on or after July 1, 2018 or (ii) in whole, but not in part, upon the occurrence of a Regulatory Capital Treatment Event (as defined in the Series A preferred stock certificate of designations), in each case at the redemption price equal to the product of the current market price of the common stock and the Common Stock Multiplier, plus any declared and unpaid dividends, without accumulation of any undeclared dividends, to, but excluding, the date fixed for redemption.
Series B preferred stock
Preferential rights. Our Series B preferred stock ranks senior to our common stock as to dividends and distributions upon the liquidation, dissolution or winding up of Byline, ranks senior to our Series A preferred stock as to dividends and ranks equal to our Series A preferred stock as to distributions upon the liquidation, dissolution or winding up of Byline. The Series B preferred stock is not convertible into or exchangeable for any shares of common stock or any other class of Byline capital stock. Holders of our Series B preferred stock do not have any preemptive rights. We may issue stock with preferences equal with or junior to the Series B preferred stock without the consent of the holders of the Series B preferred stock.
Dividends. Holders of our Series B preferred stock are entitled to receive cash dividends when and as declared by the board of directors of Byline or a duly authorized committee of the board out of assets legally available for payment, (i) from the date of issuance to, but excluding December 31, 2021, at an annual rate of 7.50% on the liquidation preference amount of $1,000 per share of Series B preferred stock and (ii) from, and including, December 31, 2021, at an annual rate equal to three-month LIBOR plus 5.41% on the liquidation preference amount of $1,000 per share of Series B preferred stock, quarterly in arrears, on March 31, June 30, September 30, and December 31 of each year, beginning on March 31, 2017. Dividends on the Series B preferred stock are noncumulative.
Voting rights. Holders of Series B Preferred Stock do not have voting rights other than those described below and as specifically required by Delaware law.
Without the vote or consent of the holders of shares entitled to cast at least two-thirds of the votes entitled to be cast by the holders of the total number of shares of Series B preferred stock then outstanding, Byline may not create any class of stock having preference as to dividends or upon the liquidation, dissolution or
-173-
Table of Contents
winding up of Byline over the Series B preferred stock, or alter or change the provisions of Byline’s amended and restated certificate of incorporation (including any certificate of amendment or certificate of designations relating to the Series B preferred stock) or bylaws so as to adversely affect the powers, preferences or rights of the holders of shares of Series B preferred stock.
Liquidation rights. In the event of the voluntary or involuntary liquidation, dissolution or winding up of Byline, holders of Series B preferred stock are entitled to receive out of assets available for distribution to stockholders, before any distribution of assets may be made to or set aside to holders of capital stock ranking junior to the Series B preferred stock as to distributions, a liquidating distribution in an amount equal to $1,000 per share, plus any declared but unpaid dividends thereon to the date of final distribution.
Redemption. With the prior approval of the Federal Reserve, Byline may redeem the Series B preferred stock (i) in whole or in part, at its option, at any time or from time to time on any dividend payment date on or after March 31, 2022, or (ii) in whole, but not in part, at any time within 90 days following a Regulatory Capital Event (as defined in the Series B preferred stock certificate of designations), in each case at the redemption price equal to $1,000 per share, plus any declared and unpaid dividends, without accumulation of any undeclared dividends, to, but excluding, the date fixed for redemption.
Authorized but Unissued Capital Stock
The DGCL does not generally require stockholder approval for the issuance of authorized shares. These additional shares may be used for a variety of corporate purposes, including future public offerings, to raise additional capital or to facilitate acquisitions. However, the listing requirements of the NYSE, which would apply so long as the common stock remains listed on the NYSE, require stockholder approval of certain issuances equal to or exceeding 20% of the then outstanding voting power or then outstanding number of shares of common stock.
One of the effects of the existence of unissued and unreserved common stock or preferred stock may be to enable our board of directors to issue shares to persons friendly to current management, which issuance could render more difficult or discourage an attempt to obtain control of us by means of a merger, tender offer, proxy contest or otherwise, and thereby protect the continuity of our management and possibly deprive our stockholders of opportunities they may believe are in their best interests or in which they may receive a premium for their common stock over the market price of the common stock.
Anti-Takeover Effects of Provisions of Applicable Law and Our Amended and Restated Certificate of Incorporation and Bylaws
Business combination statute. We have elected to opt out of Section 203 of the DGCL, which prohibits a Delaware corporation from engaging in any business combination with any interested stockholder for a period of three years after the date that such stockholder became an interested stockholder, subject to certain exceptions.
Federal banking law. The ability of a third party to acquire our stock is also limited under applicable U.S. banking laws, including regulatory approval requirements. The BHC Act requires any “bank holding company” to obtain the approval of the Federal Reserve before acquiring, directly or indirectly, more than 5% of our outstanding common stock. Any “company” (as defined in the BHC Act) other than a bank holding company is required to obtain the approval of the Federal Reserve before acquiring “control” of us. “Control” generally means (i) the ownership or control of 25% or more of a class of voting securities, (ii) the ability to elect a majority of the directors or (iii) the ability otherwise to exercise a controlling influence over management and policies. A person, other than an individual, that controls us for purposes of the BHC Act is subject to regulation and supervision as a bank holding company under the BHC Act. In addition, under the Change in Bank Control
-174-
Table of Contents
Act of 1978, as amended, and the Federal Reserve’s regulations thereunder, any person, either individually or acting through or in concert with one or more persons, is required to provide notice to the Federal Reserve prior to acquiring, directly or indirectly, 10% or more of our outstanding common stock (or any other class of our voting securities).
Requirements for advance notification of stockholder nominations and proposals. Our amended and restated bylaws establish advance notice procedures with respect to stockholder proposals and nomination of candidates for election as directors. These procedures provide that notice of such stockholder proposal must be timely given in writing to our corporate secretary prior to the meeting at which the action is to be taken. Generally, to be timely, notice must be received at our principal executive offices not less than 90 days nor more than 120 days prior to the first anniversary date of the annual meeting for the preceding year. For purposes of the provision, our 2017 annual meeting is deemed to have occurred on June 14, 2017. The notice must contain certain information required to be provided by our amended and restated bylaws.
Limits on written consents. Our amended and restated certificate of incorporation provides that any action to be taken by the stockholders that the stockholders are required or permitted to take must be effected at a duly called annual or special meeting of stockholders. Our stockholders are not permitted to take action by written consent.
Annual meetings; limits on special meetings. Following this offering, we expect to hold our first annual meeting of stockholders in 2018. Subject to the rights of the holders of any series of preferred stock, special meetings of the stockholders may be called only by (i) our board of directors, (ii) the Chairperson of the board, (iii) the Vice Chairperson, if any, of the board and (iv) our President.
Amending our amended and restated certificate of incorporation and amended and restated bylaws
Our amended and restated certificate of incorporation may be amended or altered in any manner provided by the DGCL. Our amended and restated bylaws may be adopted, amended, altered or repealed by stockholders only upon approval of at least two-thirds of outstanding shares of our common stock. Additionally, our amended and restated certificate of incorporation will provide that our amended and restated bylaws may be amended, altered or repealed by our board of directors by a majority vote.
Sole and Exclusive Forum
Our amended and restated bylaws provide that, unless we consent in writing to an alternative forum, the Court of Chancery of the State of Delaware will be the sole and exclusive forum for (i) any derivative action or proceeding brought on our behalf, (ii) any action asserting a claim of breach of a fiduciary duty owed by any of our directors, officers, employees or agents to us or our stockholders, (iii) any action asserting a claim arising pursuant to any provision of the DGCL, our certificate of incorporation or our bylaws or (iv) any action asserting a claim that is governed by the internal affairs doctrine. Any person purchasing or otherwise acquiring any interest in any shares of our capital stock shall be deemed to have notice of and to have consented to this provision of our amended and restated certificate of incorporation. This choice of forum provision may have the effect of discouraging lawsuits against us and our directors, officers, employees and agents. The enforceability of similar choice of forum provisions in other companies’ certificates of incorporation or bylaws has been challenged in legal proceedings, and it is possible that, in connection with one or more actions or proceedings described above, a court could find the provision of our amended and restated certificate of incorporation to be inapplicable or unenforceable.
Indemnification and Limitation of Liability
Our amended and restated bylaws provide generally that we will indemnify and hold harmless, to the full extent permitted by law, our directors, officers, employees and agents, as well as other persons who have
-175-
Table of Contents
served as our directors, officers, employees or agents and other persons who serve or have served at our request at another corporation, limited liability company, public limited company, partnership, joint venture, trust, employee benefit plan, fund or other enterprise in connection with any actual or threatened action, suit or proceeding, subject to limited exceptions. Insofar as indemnification for liabilities arising under the Securities Act may be permitted to our directors, officers and controlling persons, we have been informed that, in the
opinion of the SEC, such indemnification is against public policy as expressed in the Securities Act and is, therefore, unenforceable. Finally, our ability to provide indemnification to our directors and officers is limited by federal banking laws and regulations.
Our amended and restated certificate of incorporation limits, to the full extent permitted by law, the personal liability of our directors in actions brought on our behalf or on behalf of our stockholders for monetary damages as a result of a director’s breach of fiduciary duty while acting in a capacity as a director. Our amended and restated certificate of incorporation does not eliminate or limit our right or the right of our stockholders to seek injunctive or other equitable relief not involving monetary damages.
Listing
Our common stock has been approved for listing, subject to official notice of issuance, on the NYSE under the symbol “BY”.
Transfer Agent and Registrar
The transfer agent and registrar for our common stock is American Stock Transfer & Trust Company, LLC.
-176-
Table of Contents
SHARES ELIGIBLE FOR FUTURE SALE
Prior to this offering, there has been no market for our common stock. Future sales of substantial amounts of our common stock in the public market, or the perception that such sales may occur, could adversely affect market prices prevailing from time to time. Furthermore, because only a limited number of shares will be available for sale shortly after this offering due to existing contractual and legal restrictions on resale as described below, there may be sales of substantial amounts of our common stock in the public market after the restrictions lapse. This may adversely affect the prevailing market price and our ability to raise equity capital in the future.
Upon completion of this offering, we will have 28,391,900 shares of common stock outstanding (29,246,900 shares if the underwriters exercise in full their option to purchase additional shares from us). In addition, 1,857,123 shares of our common stock will be issuable upon the vesting and settlement of outstanding equity awards. Of these shares, 5,700,000 shares of our common stock (or 6,555,000 shares if the underwriters exercise their option to purchase additional shares of common stock in full) sold in this offering will be freely transferable without restriction or further registration under the Securities Act, except for any shares purchased by our “affiliates”, as that term is defined in Rule 144 under the Securities Act. The remaining 22,691,900 shares of our common stock outstanding are “restricted shares” as defined in Rule 144. Restricted shares may be sold in the public market only if registered under the Securities Act or if they qualify for an exemption from registration under Rule 144. As a result of the contractual 180-day lock-up period described below applicable to certain of our stockholders and the provisions of Rule 144, the shares subject to the lockup will be available for sale in the public market only after 180 days from the date of this prospectus (subject to registration or an exemption from registration).
Rule 144
In general, a person who has beneficially owned restricted shares of our common stock for at least six months would be entitled to sell such securities, provided that (i) such person is not deemed to have been one of our affiliates at the time of, or at any time during the 90 days preceding, the sale and (ii) we are subject to the Exchange Act periodic reporting requirements for at least 90 days before the sale. Persons who have beneficially owned restricted shares of our common stock for at least six months but who are our affiliates at the time of, or any time during the 90 days preceding, the sale, would be subject to additional restrictions, by which such person would be entitled to sell within any three-month period only a number of securities that does not exceed the greater of the following:
| • | 1% of the number of shares of our common stock then outstanding, which will equal approximately 284,000 shares immediately after this offering; or |
| • | the average weekly trading volume of our common stock on during the four calendar weeks preceding the filing of a notice on Form 144 with respect to the sale; |
provided, in each case, that we are subject to the Exchange Act periodic reporting requirements for at least 90 days before the sale. Such sales both by affiliates and by non-affiliates must also comply with the manner of sale and notice provisions of Rule 144 to the extent applicable.
Lock-up Agreements
We, our executive officers and directors, the selling stockholders, holders of a significant majority of our common stock and purchasers of shares in the Reserved Share Program, subject to de minimis exceptions, have agreed not to sell or transfer any common stock or securities convertible into, exchangeable for, exercisable for, or repayable with common stock, for 180 days after the date of this prospectus without first obtaining the written consent of Merrill Lynch, Pierce, Fenner & Smith Incorporated and Keefe, Bruyette & Woods, Inc, as representatives of the underwriters. See “Underwriting”. At any time and without public notice, the representatives may, in their sole discretion, release all or some of the securities from these lock-up agreements. The underwriters do not have any present intention or arrangement to release any shares of our common stock subject to lock-up agreements prior to the expiration of the 180-day lock-up period.
-177-
Table of Contents
Equity Incentive Plans
We intend to file with the SEC a registration statement on Form S-8 covering the shares of common stock reserved for issuance under our equity incentive plans. That registration statement is expected to be filed and become effective as soon as practicable after the closing of this offering. Upon effectiveness, the shares of common stock covered by that registration statement will be eligible for sale in the public market, subject to the lock-up agreements and Rule 144 restrictions described above.
Rule 701
In general, under Rule 701 under the Securities Act, an employee, consultant or advisor who purchases shares of our common stock from us in connection with a compensatory stock or option plan or other written agreement is eligible to resell those shares 90 days after the effective date of the registration statement of which this prospectus forms a part in reliance on Rule 144, but without compliance with some of the restrictions, including the holding period restriction, contained in Rule 144.
-178-
Table of Contents
CERTAIN UNITED STATES FEDERAL TAX CONSEQUENCES FOR NON-U.S. HOLDERS OF OUR COMMON STOCK
This section summarizes certain United States federal income and estate tax consequences of the ownership and disposition of shares of our common stock by a non-U.S. holder (as defined below). It applies to you only if you acquire your shares of our common stock in this offering and you hold the shares of our common stock as a capital asset for United States federal income tax purposes. You are a non-U.S. holder if you are, for United States federal income tax purposes:
| • | a nonresident alien individual; |
| • | a foreign corporation; or |
| • | an estate or trust that in either case is not subject to United States federal income tax on a net income basis on income or gain from our common stock. |
This section does not consider the specific facts and circumstances that may be relevant to a particular non-U.S. holder and does not address United States federal alternative minimum tax consequences or the treatment of a non-U.S. holder under the laws of any state, local or foreign taxing jurisdiction. In addition, it does not represent a detailed description of the United States federal income tax consequences applicable to you if you are subject to special treatment under the United States federal income tax laws (including if you are a United States expatriate, “controlled foreign corporation”, “passive foreign investment company” or a partnership or other pass-through entity for United States federal income tax purposes). This section is based on the tax laws of the United States, including the Code, existing and proposed Treasury regulations, and administrative and judicial interpretations, all as currently in effect. These laws are subject to change, possibly on a retroactive basis.
If an entity classified as a partnership for United States federal income tax purposes holds the shares of our common stock, the United States federal income tax treatment of a partner will generally depend on the status of the partner and the tax treatment of the partnership. A partner in a partnership holding shares of our common stock should consult its tax advisor with regard to the United States federal income tax treatment of an investment in our common stock.
You should consult your tax advisor regarding the United States federal tax consequences of acquiring, holding and disposing of shares of our common stock in your particular circumstances, as well as any tax consequences that may arise under the laws of any state, local or foreign taxing jurisdiction.
Dividends
If we make a distribution of cash or other property (other than certain distributions of our stock) in respect of our common stock, the distribution generally will be treated as a dividend to the extent of our current or accumulated earnings and profits, as determined under United States federal income tax principles. Any portion of a distribution that exceeds our current and accumulated earnings and profits will generally be treated first as a tax-free return of capital, on a share-by-share basis, to the extent of your tax basis in our common stock (and will reduce your basis in such common stock), and, to the extent such portion exceeds your tax basis in our common stock, the excess will be treated as gain from the taxable disposition of the common stock, the tax treatment of which is discussed below under “Gain on Taxable Disposition of Common Stock”.
Except as described below, if you are a non-U.S. holder, distributions paid to you that are characterized as dividends for United States federal income tax purposes are subject to withholding of United States federal income tax at a 30% rate or at a lower rate if you are eligible for the benefits of an income tax treaty that provides for a lower rate. If you are eligible for a lower treaty rate, we and other payors will generally be required to
-179-
Table of Contents
withhold at a 30% rate (rather than the lower treaty rate) on dividend payments to you, unless you have furnished to us or another payor:
| • | a valid Internal Revenue Service (“IRS”) Form W-8 or an acceptable substitute form upon which you certify, under penalties of perjury, your status as a non-United States person and your entitlement to the lower treaty rate with respect to such payments; or |
| • | in the case of payments made outside the United States to an offshore account (generally, an account maintained by you at an office or branch of a bank or other financial institution at any location outside the United States), other documentary evidence establishing your entitlement to the lower treaty rate in accordance with Treasury regulations. |
If you are eligible for a reduced rate of United States withholding tax under a tax treaty, you may obtain a refund of any amounts withheld in excess of that rate by filing a refund claim with the IRS.
If dividends paid to you are “effectively connected” with your conduct of a trade or business within the United States, and, if required by a tax treaty, the dividends are attributable to a permanent establishment that you maintain in the United States, we and other payors generally are not required to withhold tax from the dividends, provided that you have furnished to us or another payor a valid IRS Form W-8ECI or an acceptable substitute form upon which you represent, under penalties of perjury, that:
| • | you are a non-United States person; and |
| • | the dividends are effectively connected with your conduct of a trade or business within the United States and are includible in your gross income. |
“Effectively connected” dividends are taxed at rates applicable to United States citizens, resident aliens and domestic United States corporations.
If you are a corporate non-U.S. holder, “effectively connected” dividends that you receive may, under certain circumstances, be subject to an additional “branch profits tax” at a 30% rate or at a lower rate if you are eligible for the benefits of an income tax treaty that provides for a lower rate.
Gain on Taxable Disposition of Common Stock
If you are a non-U.S. holder, you generally will not be subject to United States federal income tax on gain that you recognize on a taxable disposition of shares of our common stock unless:
| • | the gain is “effectively connected” with your conduct of a trade or business in the United States, and if required by a tax treaty, the gain is attributable to a permanent establishment that you maintain in the United States; |
| • | you are an individual, you are present in the United States for 183 or more days in the taxable year of the sale and certain other conditions exist; or |
| • | we are or have been a United States real property holding corporation for United States federal income tax purposes and you held, directly or indirectly, at any time during the five-year period ending on the date of disposition, more than 5% of our common stock and you are not eligible for any treaty exemption. |
If you are a non-U.S. holder and the gain from the taxable disposition of shares of our common stock is effectively connected with your conduct of a trade or business in the United States (and, if required by a tax
-180-
Table of Contents
treaty, the gain is attributable to a permanent establishment that you maintain in the United States), you will be subject to tax on the net gain derived from the sale at rates applicable to United States citizens, resident aliens and domestic United States corporations. If you are a corporate non-U.S. holder, “effectively connected” gains that you recognize may also, under certain circumstances, be subject to an additional “branch profits tax” at a 30% rate or at a lower rate if you are eligible for the benefits of an income tax treaty that provides for a lower rate. If you are an individual non-U.S. holder described in the second bullet point immediately above, you will be subject to a flat 30% tax or a lower rate if you are eligible for the benefits of an income tax treaty that provides for a lower rate, on the gain derived from the sale, which may be offset by United States source capital losses, even though you are not considered a resident of the United States.
We have not been, are not and do not anticipate becoming a United States real property holding corporation for United States federal income tax purposes.
FATCA Withholding
Pursuant to sections 1471 through 1474 of the Code, commonly known as the Foreign Account Tax Compliance Act (“FATCA”), a 30% withholding tax (“FATCA withholding”) may be imposed on certain payments to you or to certain foreign financial institutions, investment funds and other non-U.S. persons receiving payments on your behalf if you or such persons fail to comply with certain information reporting requirements. Such payments will include dividends and the gross proceeds from the sale or other taxable disposition of shares of our common stock. Payments of dividends that you receive in respect of shares of our common stock could be subject to this withholding if you are subject to the FATCA information reporting requirements and fail to comply with them or if you hold shares of our common stock through a non-U.S. person (e.g., a foreign bank or broker) that fails to comply with these requirements (even if payments to you would not otherwise have been subject to FATCA withholding). Payments of gross proceeds from a sale or other taxable disposition of shares of our common stock could also be subject to FATCA withholding unless such disposition occurs before January 1, 2019. You should consult your tax advisor regarding the relevant U.S. law and other official guidance on FATCA withholding.
Backup Withholding and Information Reporting
If you are a non-U.S. holder, we and other payors are required to report payments of dividends on IRS Form 1042-S even if the payments are exempt from United States withholding tax. You are otherwise generally exempt from backup withholding and information reporting requirements with respect to dividend payments and the payment of the proceeds from the sale of shares of our common stock effected at a United States office of a broker provided that either (i) the payor or broker does not have actual knowledge or reason to know that you are a United States person and you have furnished a valid IRS Form W-8 or other documentation upon which the payor or broker may rely to treat the payments as made to a non-United States person or (ii) you otherwise establish an exemption.
Payment of the proceeds from the sale of shares of our common stock effected at a foreign office of a broker generally will not be subject to information reporting or backup withholding. However, a sale effected at a foreign office of a broker could be subject to information reporting in the same manner as a sale within the United States (and in certain cases may be subject to backup withholding as well) if (i) the broker has certain connections to the United States, (ii) the proceeds or confirmation are sent to the United States or (iii) the sale has certain other specified connections with the United States. In addition, certain foreign brokers may be required to report the amount of gross proceeds from the sale or other taxable disposition of shares of our common stock under FATCA if you are presumed to be a United States person.
Federal Estate Taxes
Shares of our common stock held by a non-U.S. holder at the time of death will be included in the holder’s gross estate for United States federal estate tax purposes, unless an applicable estate tax treaty provides otherwise.
-181-
Table of Contents
The following is a summary of certain considerations associated with the purchase of the shares of our common stock by employee benefit plans that are subject to Title I of ERISA, plans, individual retirement accounts and other arrangements that are subject to Section 4975 of the Code and entities whose underlying assets are considered to include “plan assets” of any such plan, account or arrangement (each a “Plan”), as well as arrangements that are subject to provisions under any federal, state, local, non-U.S. or other laws or regulations that are similar to Title I of ERISA or Section 4975 of the Code (such arrangements “Non-ERISA Arrangements”, and such provisions “Similar Laws”).
THE FOLLOWING IS MERELY A SUMMARY, HOWEVER, AND SHOULD NOT BE CONSTRUED AS LEGAL ADVICE OR AS COMPLETE IN ALL RELEVANT RESPECTS. ALL INVESTORS ARE URGED TO CONSULT THEIR LEGAL ADVISORS BEFORE INVESTING IN US AND TO MAKE THEIR OWN INDEPENDENT DECISION.
General Fiduciary Matters
ERISA and the Code impose certain duties on persons who are fiduciaries of a Plan and prohibit certain transactions involving the assets of a Plan and its fiduciaries or other interested parties. Under ERISA and the Code, any person who exercises any discretionary authority or control over the administration of such Plan or the management or disposition of the assets of such a Plan, or who renders investment advice for a fee or other compensation to such a Plan, is generally considered to be a fiduciary of the Plan.
In considering an investment in shares of our common stock with a portion of the assets of any Plan or Non-ERISA Arrangement, a fiduciary should determine whether the investment is in accordance with the documents and instruments governing the Plan or Non-ERISA Arrangement and the applicable provisions of ERISA, the Code or any Similar Law relating to a fiduciary’s duties to the Plan or Non-ERISA Arrangement including, without limitation, the prudence, diversification, delegation of control and prohibited transaction provisions of ERISA, the Code and any other applicable Similar Laws.
Prohibited Transaction Issues
Section 406 of ERISA and Section 4975 of the Code prohibit Plans from engaging in specified transactions involving plan assets with persons or entities who are “parties in interest”, within the meaning of ERISA, or “disqualified persons”, within the meaning of Section 4975 of the Code, unless an exemption is available. A party in interest or disqualified person who engages in a non-exempt prohibited transaction may be subject to excise taxes and other penalties and liabilities under ERISA and the Code, and a prohibited transaction may result in the disqualification of an IRA. In addition, the fiduciary of the Plan that engages in such a non-exempt prohibited transaction may be subject to penalties and liabilities under ERISA and the Code.
The acquisition of shares of our common stock by a Plan with respect to which we or an underwriter is considered a party in interest or a disqualified person may constitute or result in a direct or indirect prohibited transaction under Section 406 of ERISA and/or Section 4975 of the Code, unless the investment is acquired in accordance with an applicable statutory, class or individual prohibited transaction exemption. In this regard, the United States Department of Labor has issued prohibited transaction class exemptions (“PTCEs”) that may apply to the acquisition of our common stock. These class exemptions include, without limitation, PTCE 84-14 respecting transactions determined by independent qualified professional asset managers, PTCE 90-1 respecting insurance company pooled separate accounts, PTCE 91-38 respecting bank collective investment funds, PTCE 95-60 respecting life insurance company general accounts and PTCE 96-23 respecting transactions determined by in-house asset managers. In addition, Section 408(b)(17) of ERISA and Section 4975(d)(20) of the Code provide an exemption from the prohibited transaction provisions of ERISA and Section 4975 of the Code for the acquisition and the disposition of the common stock, provided that neither the issuer of the securities nor any of
-182-
Table of Contents
its affiliates (directly or indirectly) have or exercise any discretionary authority or control or render any investment advice with respect to the assets of any Plan involved in the transaction and provided further that the Plan pays no more and receives no less than “adequate consideration” in connection with the transaction. There can be no assurance that all of the conditions of any such exemptions will be satisfied.
Representation
Accordingly, by acceptance of the shares of our common stock, each purchaser or subsequent transferee of our common stock will be deemed to have represented and warranted either that (i) no portion of such purchaser’s or transferee’s assets used to acquire such shares constitutes assets of any Plan or (ii) the purchase of our common stock by such purchaser or transferee will not constitute a non-exempt prohibited transaction under Section 406 of ERISA or Section 4975 of the Code or similar violation under any applicable Similar Laws.
Responsibility for Purchase
Purchasers of our common stock have exclusive responsibility for ensuring that their acquisition and holding of our common stock does not violate the fiduciary or prohibited transaction rules of ERISA or the Code, or any similar provision of applicable Similar Laws. In addition, the foregoing discussion is general in nature, is not intended to be all-inclusive, and is based on laws in effect on the date of this prospectus. Such discussion should not be construed as legal advice. Due to the complexity of these rules and the penalties that may be imposed upon persons involved in non-exempt prohibited transactions, it is particularly important that fiduciaries, or other persons considering purchasing shares of our common stock on behalf of, or with the assets of, any Plan or Non-ERISA Arrangement consult with counsel regarding the potential applicability of ERISA, Section 4975 of the Code and Similar Laws to such investment and whether an exemption would be applicable to the purchase of shares of our common stock.
-183-
Table of Contents
Merrill Lynch, Pierce, Fenner & Smith Incorporated and Keefe, Bruyette & Woods, Inc. are acting as representatives of each of the underwriters named below. Subject to the terms and conditions set forth in an underwriting agreement among us, the selling stockholders and the underwriters, we and the selling stockholders have agreed to sell to the underwriters, and each of the underwriters has agreed, severally and not jointly, to purchase from us and the selling stockholders, the number of shares of common stock set forth opposite its name below.
| Underwriter | Number of Shares |
|||
| Merrill Lynch, Pierce, Fenner & Smith Incorporated |
||||
| Keefe, Bruyette & Woods, Inc. |
||||
| Piper Jaffray & Co. |
||||
| Sandler O’Neill & Partners, L.P. |
||||
| Stephens Inc. |
||||
|
|
|
|||
|
Total |
5,700,000 | |||
|
|
|
|||
Subject to the terms and conditions set forth in the underwriting agreement, the underwriters have agreed, severally and not jointly, to purchase all of the shares sold under the underwriting agreement if any of these shares are purchased. If an underwriter defaults, the underwriting agreement provides that the purchase commitments of the non-defaulting underwriters may be increased or the underwriting agreement may be terminated.
We and the selling stockholders have agreed to indemnify the underwriters against certain liabilities, including liabilities under the Securities Act, or to contribute to payments the underwriters may be required to make in respect of those liabilities.
The underwriters are offering the shares, subject to prior sale, when, as and if issued to and accepted by them, subject to approval of legal matters by their counsel, including the validity of the shares, and other conditions contained in the underwriting agreement, such as the receipt by the underwriters of officer’s certificates and legal opinions. The underwriters reserve the right to withdraw, cancel or modify offers to the public and to reject orders in whole or in part.
Commissions and Discounts
The representatives have advised us and the selling stockholders that the underwriters propose initially to offer the shares to the public at the public offering price set forth on the cover page of this prospectus and to dealers at that price less a concession not in excess of $ per share. After the initial offering, the public offering price, concession or any other term of the offering may be changed.
The following table shows the public offering price, underwriting discounts and commissions and proceeds before expenses to us and the selling stockholders. The information assumes either no exercise or full exercise by the underwriters of their option to purchase additional shares.
| Per Share | Without Option | With Option | ||||||||||
| Public offering price |
$ | $ | $ | |||||||||
| Underwriting discounts and commissions |
$ | $ | $ | |||||||||
| Proceeds, before expenses, to us |
$ | $ | $ | |||||||||
| Proceeds, before expenses, to the selling stockholders |
$ | $ | $ | |||||||||
-184-
Table of Contents
The expenses of the offering, not including the underwriting discounts and commissions, are estimated at $4.5 million and are payable by us and the selling stockholders. We have agreed to reimburse the underwriters for expenses in connection with the Financial Industry Regulatory Authority review of this offering in an amount not to exceed $50,000. In addition, the underwriters have agreed to reimburse us for certain expenses incurred by us in connection with this offering upon closing of this offering.
Option to Purchase Additional Shares
We have granted an option to the underwriters, exercisable for 30 days after the date of this prospectus, to purchase up to 855,000 additional shares at the public offering price, less the underwriting discounts and commissions. If the underwriters exercise this option, each will be obligated, subject to conditions contained in the underwriting agreement, to purchase a number of additional shares proportionate to that underwriter’s initial amount reflected in the above table.
Reserved Shares
At our request, the underwriters have reserved for sale, at the initial public offering price, up to 10% of the shares offered by this prospectus for sale to the directors, senior management, existing stockholders, certain employees of Byline Bancorp, Inc. and Byline Bank and persons having relationships with us through a reserved share program. If these persons purchase reserved shares, this will reduce the number of shares available for sale to the general public. Any reserved shares that are not so purchased will be offered by the underwriters to the general public on the same terms as the other shares offered by this prospectus.
No Sales of Similar Securities
We and the selling stockholders, our executive officers and directors, holders of a significant majority of our common stock and purchasers of shares in the Reserved Share Program, subject to de minimis exceptions, have agreed not to sell or transfer any common stock or securities convertible into, exchangeable for, exercisable for, or repayable with common stock, for 180 days after the date of this prospectus without first obtaining the written consent of Merrill Lynch, Pierce, Fenner & Smith Incorporated and Keefe, Bruyette & Woods, Inc. Specifically, we and these other persons have agreed, with certain limited exceptions, not to directly or indirectly
| • | offer, pledge, sell or contract to sell any common stock, |
| • | sell any option or contract to purchase any common stock, |
| • | purchase any option or contract to sell any common stock, |
| • | grant any option, right or warrant for the sale of any common stock, |
| • | lend or otherwise dispose of or transfer any common stock, |
| • | request or demand that we file a registration statement related to the common stock, or |
| • | enter into any swap or other agreement that transfers, in whole or in part, the economic consequence of ownership of any common stock whether any such swap or transaction is to be settled by delivery of shares or other securities, in cash or otherwise. |
This lock-up provision applies to common stock and to securities convertible into or exchangeable or exercisable for or repayable with common stock. It also applies to common stock owned now or acquired later by the person executing the agreement or for which the person executing the agreement later acquires the power of disposition.
-185-
Table of Contents
Listing
Our common stock has been approved for listing, subject to official notice of issuance, on the NYSE, under the symbol “BY”. In order to meet the requirements for listing on that exchange, the underwriters have undertaken to sell a minimum number of shares to a minimum number of beneficial owners as required by that exchange.
Before this offering, there has been no public market for our common stock. The initial public offering price will be determined through negotiations among us and the representatives. In addition to prevailing market conditions, the factors to be considered in determining the initial public offering price are
| • | the valuation multiples of publicly traded companies that the representatives believe to be comparable to us, |
| • | our financial information, |
| • | the history of, and the prospects for, our company and the industry in which we compete, |
| • | an assessment of our management, its past and present operations, and the prospects for, and timing of, our future revenues, |
| • | the present state of our development, and |
| • | the above factors in relation to market values and various valuation measures of other companies engaged in activities similar to ours. |
An active trading market for the shares may not develop. It is also possible that after the offering the shares will not trade in the public market at or above the initial public offering price.
The underwriters do not expect to sell more than 5% of the shares in the aggregate to accounts over which they exercise discretionary authority.
Price Stabilization, Short Positions and Penalty Bids
Until the distribution of the shares is completed, SEC rules may limit underwriters and selling group members from bidding for and purchasing our common stock. However, the representatives may engage in transactions that stabilize the price of the common stock, such as bids or purchases to peg, fix or maintain that price.
In connection with the offering, the underwriters may purchase and sell our common stock in the open market. These transactions may include short sales, purchases on the open market to cover positions created by short sales and stabilizing transactions. Short sales involve the sale by the underwriters of a greater number of shares than they are required to purchase in the offering. “Covered” short sales are sales made in an amount not greater than the underwriters’ option to purchase additional shares described above. The underwriters may close out any covered short position by either exercising their option to purchase additional shares or purchasing shares in the open market. In determining the source of shares to close out the covered short position, the underwriters will consider, among other things, the price of shares available for purchase in the open market as compared to the price at which they may purchase shares through the option granted to them. “Naked” short sales are sales in excess of such option. The underwriters must close out any naked short position by purchasing shares in the open market. A naked short position is more likely to be created if the underwriters are concerned that there may be downward pressure on the price of our common stock in the open market after pricing that could adversely affect investors who purchase in the offering. Stabilizing transactions consist of various bids for or purchases of shares of common stock made by the underwriters in the open market prior to the completion of the offering.
-186-
Table of Contents
The underwriters may also impose a penalty bid. This occurs when a particular underwriter repays to the underwriters a portion of the underwriting discount received by it because the representatives have repurchased shares sold by or for the account of such underwriter in stabilizing or short covering transactions.
Similar to other purchase transactions, the underwriters’ purchases to cover the syndicate short sales may have the effect of raising or maintaining the market price of our common stock or preventing or retarding a
decline in the market price of our common stock. As a result, the price of our common stock may be higher than the price that might otherwise exist in the open market. The underwriters may conduct these transactions on the NYSE in the over-the-counter market or otherwise.
Neither we nor any of the underwriters make any representation or prediction as to the direction or magnitude of any effect that the transactions described above may have on the price of our common stock. In addition, neither we nor any of the underwriters make any representation that the representatives will engage in these transactions or that these transactions, once commenced, will not be discontinued without notice.
Electronic Distribution
In connection with the offering, certain of the underwriters or securities dealers may distribute prospectuses by electronic means, such as e-mail.
Other Relationships
Some of the underwriters and their affiliates have engaged in, and may in the future engage in, investment banking and other commercial dealings in the ordinary course of business with us or our affiliates. They have received, or may in the future receive, customary fees and commissions for these transactions.
In addition, in the ordinary course of their business activities, the underwriters and their affiliates may make or hold a broad array of investments and actively trade debt and equity securities (or related derivative securities) and financial instruments (including bank loans) for their own account and for the accounts of their customers. Such investments and securities activities may involve securities and/or instruments of ours or our affiliates. The underwriters and their affiliates may also make investment recommendations and/or publish or express independent research views in respect of such securities or financial instruments and may hold, or recommend to clients that they acquire, long and/or short positions in such securities and instruments.
A person associated with one of the underwriters acquired approximately 72,608 shares of our common stock in certain private transactions with other stockholders prior to the filing of the registration statement of which this prospectus forms a part with the Securities and Exchange Commission (the “Acquired Shares”). The Acquired Shares will be deemed to be underwriting compensation in connection with this offering and will be subject to lock-up restrictions, as required by FINRA Rule 5110(g)(1), and may not be sold during the offering, or sold, transferred, assigned, pledged, or hypothecated, or be the subject of any hedging, short sale, derivative, put, or call transaction that would result in the effective economic disposition of such securities by any person for a period of 180 days immediately following the date of effectiveness of the registration statement of which this prospectus forms a part or commencement of sales of the offering, except as provided in FINRA Rule 5110(g)(2).
European Economic Area
In relation to each member state of the European Economic Area, no offer of ordinary shares which are the subject of the offering has been, or will be made to the public in that Member State, other than under the following exemptions under the Prospectus Directive:
| (a) | to any legal entity which is a qualified investor as defined in the Prospectus Directive; |
-187-
Table of Contents
| (b) | to fewer than 150 natural or legal persons (other than qualified investors as defined in the Prospectus Directive), subject to obtaining the prior consent of the Representatives for any such offer; or |
| (c) | in any other circumstances falling within Article 3(2) of the Prospectus Directive, |
provided that no such offer of ordinary shares referred to in (a) to (c) above shall result in a requirement for the Company or any Representative to publish a prospectus pursuant to Article 3 of the Prospectus Directive, or supplement a prospectus pursuant to Article 16 of the Prospectus Directive.
Each person located in a Member State to whom any offer of ordinary shares is made or who receives any communication in respect of an offer of ordinary shares, or who initially acquires any ordinary shares will be deemed to have represented, warranted, acknowledged and agreed to and with each Representative and the Company that (1) it is a “qualified investor” within the meaning of the law in that Member State implementing Article 2(1)(e) of the Prospectus Directive; and (2) in the case of any ordinary shares acquired by it as a financial intermediary as that term is used in Article 3(2) of the Prospectus Directive, the ordinary shares acquired by it in
the offer have not been acquired on behalf of, nor have they been acquired with a view to their offer or resale to, persons in any Member State other than qualified investors, as that term is defined in the Prospectus Directive, or in circumstances in which the prior consent of the Representatives has been given to the offer or resale; or where ordinary shares have been acquired by it on behalf of persons in any Member State other than qualified investors, the offer of those ordinary shares to it is not treated under the Prospectus Directive as having been made to such persons.
The Company, the Representatives and their respective affiliates will rely upon the truth and accuracy of the foregoing representations, acknowledgments and agreements.
This prospectus has been prepared on the basis that any offer of shares in any Member State will be made pursuant to an exemption under the Prospectus Directive from the requirement to publish a prospectus for offers of shares. Accordingly, any person making or intending to make an offer in that Member State of shares which are the subject of the offering contemplated in this prospectus may only do so in circumstances in which no obligation arises for the Company or any of the Representatives to publish a prospectus pursuant to Article 3 of the Prospectus Directive in relation to such offer. Neither the Company nor the Representatives have authorized, nor do they authorize, the making of any offer of shares in circumstances in which an obligation arises for the Company or the Representatives to publish a prospectus for such offer.
For the purposes of this provision, the expression an “offer of ordinary shares to the public” in relation to any ordinary shares in any Member State means the communication in any form and by any means of sufficient information on the terms of the offer and the ordinary shares to be offered so as to enable an investor to decide to purchase or subscribe the ordinary shares, as the same may be varied in that Member State by any measure implementing the Prospectus Directive in that Member State, the expression “Prospectus Directive” means Directive 2003/71/EC (as amended) and includes any relevant implementing measure in each Member State.
The above selling restriction is in addition to any other selling restrictions set out below.
Notice to Prospective Investors in the United Kingdom
In addition, in the United Kingdom, this document is being distributed only to, and is directed only at, and any offer subsequently made may only be directed at persons who are “qualified investors” (as defined in the Prospectus Directive) (i) who have professional experience in matters relating to investments falling within
-188-
Table of Contents
Article 19 (5) of the Financial Services and Markets Act 2000 (Financial Promotion) Order 2005, as amended (the “Order”) and/or (ii) who are high net worth companies (or persons to whom it may otherwise be lawfully communicated) falling within Article 49(2)(a) to (d) of the Order (all such persons together being referred to as “relevant persons”). This document must not be acted on or relied on in the United Kingdom by persons who are not relevant persons. In the United Kingdom, any investment or investment activity to which this document relates is only available to, and will be engaged in with, relevant persons.
Notice to Prospective Investors in Switzerland
The shares may not be publicly offered in Switzerland and will not be listed on the SIX Swiss Exchange (“SIX”) or on any other stock exchange or regulated trading facility in Switzerland. This document has been prepared without regard to the disclosure standards for issuance prospectuses under art. 652a or art. 1156 of the Swiss Code of Obligations or the disclosure standards for listing prospectuses under art. 27 ff. of the SIX Listing Rules or the listing rules of any other stock exchange or regulated trading facility in Switzerland. Neither this document nor any other offering or marketing material relating to the shares or the offering may be publicly distributed or otherwise made publicly available in Switzerland.
Neither this document nor any other offering or marketing material relating to the offering, the Company or the shares have been or will be filed with or approved by any Swiss regulatory authority. In particular, this document will not be filed with, and the offer of shares will not be supervised by, the Swiss Financial Market Supervisory Authority, and the offer of shares has not been and will not be authorized under the Swiss Federal Act on Collective Investment Schemes (“CISA”). The investor protection afforded to acquirers of interests in collective investment schemes under the CISA does not extend to acquirers of shares.
Notice to Prospective Investors in the Dubai International Financial Centre
This prospectus relates to an Exempt Offer in accordance with the Offered Securities Rules of the Dubai Financial Services Authority (“DFSA”). This prospectus is intended for distribution only to persons of a type specified in the Offered Securities Rules of the DFSA. It must not be delivered to, or relied on by, any other person. The DFSA has no responsibility for reviewing or verifying any documents in connection with Exempt Offers. The DFSA has not approved this prospectus nor taken steps to verify the information set forth herein and has no responsibility for the prospectus. The shares to which this prospectus relates may be illiquid and/or subject to restrictions on their resale. Prospective purchasers of the shares offered should conduct their own due diligence on the shares. If you do not understand the contents of this prospectus you should consult an authorized financial advisor.
Notice to Prospective Investors in Australia
No placement document, prospectus, product disclosure statement or other disclosure document has been lodged with the Australian Securities and Investments Commission, in relation to the offering. This prospectus does not constitute a prospectus, product disclosure statement or other disclosure document under the Corporations Act 2001 (the “Corporations Act”), and does not purport to include the information required for a prospectus, product disclosure statement or other disclosure document under the Corporations Act.
Any offer in Australia of the shares may only be made to persons (the “Exempt Investors”) who are “sophisticated investors” (within the meaning of section 708(8) of the Corporations Act), “professional investors” (within the meaning of section 708(11) of the Corporations Act) or otherwise pursuant to one or more exemptions contained in section 708 of the Corporations Act so that it is lawful to offer the shares without disclosure to investors under Chapter 6D of the Corporations Act.
The shares applied for by Exempt Investors in Australia must not be offered for sale in Australia in the period of 12 months after the date of allotment under the offering, except in circumstances where disclosure to
-189-
Table of Contents
investors under Chapter 6D of the Corporations Act would not be required pursuant to an exemption under section 708 of the Corporations Act or otherwise or where the offer is pursuant to a disclosure document which complies with Chapter 6D of the Corporations Act. Any person acquiring shares must observe such Australian on-sale restrictions.
This prospectus contains general information only and does not take account of the investment objectives, financial situation or particular needs of any particular person. It does not contain any securities recommendations or financial product advice. Before making an investment decision, investors need to consider whether the information in this prospectus is appropriate to their needs, objectives and circumstances, and, if necessary, seek expert advice on those matters.
Notice to Prospective Investors in Hong Kong
The shares have not been offered or sold and will not be offered or sold in Hong Kong, by means of any document, other than (a) to “professional investors” as defined in the Securities and Futures Ordinance (Cap. 571) of Hong Kong and any rules made under that Ordinance; or (b) in other circumstances which do not result in the document being a “prospectus” as defined in the Companies Ordinance (Cap. 32) of Hong Kong or which do not constitute an offer to the public within the meaning of that Ordinance. No advertisement, invitation or document relating to the shares has been or may be issued or has been or may be in the possession of any person
for the purposes of issue, whether in Hong Kong or elsewhere, which is directed at, or the contents of which are likely to be accessed or read by, the public of Hong Kong (except if permitted to do so under the securities laws of Hong Kong) other than with respect to shares which are or are intended to be disposed of only to persons outside Hong Kong or only to “professional investors” as defined in the Securities and Futures Ordinance and any rules made under that Ordinance.
Notice to Prospective Investors in Japan
The shares have not been and will not be registered under the Financial Instruments and Exchange Law of Japan (Law No. 25 of 1948, as amended) and, accordingly, will not be offered or sold, directly or indirectly, in Japan, or for the benefit of any Japanese Person or to others for re-offering or resale, directly or indirectly, in Japan or to any Japanese Person, except in compliance with all applicable laws, regulations and ministerial guidelines promulgated by relevant Japanese governmental or regulatory authorities in effect at the relevant time. For the purposes of this paragraph, “Japanese Person” shall mean any person resident in Japan, including any corporation or other entity organized under the laws of Japan.
Notice to Prospective Investors in Singapore
This prospectus has not been registered as a prospectus with the Monetary Authority of Singapore. Accordingly, this prospectus and any other document or material in connection with the offer or sale, or invitation for subscription or purchase, of shares may not be circulated or distributed, nor may the shares be offered or sold, or be made the subject of an invitation for subscription or purchase, whether directly or indirectly, to persons in Singapore other than (i) to an institutional investor under Section 274 of the Securities and Futures Act, Chapter 289 of Singapore (the “SFA”), (ii) to a relevant person pursuant to Section 275(1), or any person pursuant to Section 275(1A), and in accordance with the conditions specified in Section 275, of the SFA, or (iii) otherwise pursuant to, and in accordance with the conditions of, any other applicable provision of the SFA.
Where the shares are subscribed or purchased under Section 275 of the SFA by a relevant person which is:
| (a) | a corporation (which is not an accredited investor (as defined in Section 4A of the SFA)) the sole business of which is to hold investments and the entire share capital of which is owned by one or more individuals, each of whom is an accredited investor; or |
-190-
Table of Contents
| (b) | a trust (where the trustee is not an accredited investor) whose sole purpose is to hold investments and each beneficiary of the trust is an individual who is an accredited investor, |
securities (as defined in Section 239(1) of the SFA) of that corporation or the beneficiaries’ rights and interest (howsoever described) in that trust shall not be transferred within six months after that corporation or that trust has acquired the shares pursuant to an offer made under Section 275 of the SFA except:
| (c) | to an institutional investor or to a relevant person defined in Section 275(2) of the SFA, or to any person arising from an offer referred to in Section 275(1A) or Section 276(4)(i)(B) of the SFA; |
| (d) | where no consideration is or will be given for the transfer; |
| (e) | where the transfer is by operation of law; |
| (f) | as specified in Section 276(7) of the SFA; or |
| (g) | as specified in Regulation 32 of the Securities and Futures (Offers of Investments) (Shares and Debentures) Regulations 2005 of Singapore. |
Notice to Prospective Investors in Canada
The shares may be sold only to purchasers purchasing, or deemed to be purchasing, as principal that are accredited investors, as defined in National Instrument 45-106 Prospectus Exemptions or subsection 73.3(1) of the Securities Act (Ontario), and are permitted clients, as defined in National Instrument 31-103 Registration Requirements, Exemptions and Ongoing Registrant Obligations. Any resale of the shares must be made in accordance with an exemption from, or in a transaction not subject to, the prospectus requirements of applicable securities laws.
Securities legislation in certain provinces or territories of Canada may provide a purchaser with remedies for rescission or damages if this prospectus (including any amendment thereto) contains a misrepresentation, provided that the remedies for rescission or damages are exercised by the purchaser within the time limit prescribed by the securities legislation of the purchaser’s province or territory. The purchaser should refer to any applicable provisions of the securities legislation of the purchaser’s province or territory for particulars of these rights or consult with a legal advisor.
Pursuant to section 3A.3 (or, in the case of securities issued or guaranteed by the government of a non-Canadian jurisdiction, section 3A.4) of National Instrument 33-105 Underwriting Conflicts (NI 33-105), the underwriters are not required to comply with the disclosure requirements of NI 33-105 regarding underwriter conflicts of interest in connection with this offering.
-191-
Table of Contents
The validity of the shares of our common stock offered hereby will be passed upon for us by Sullivan & Cromwell LLP, New York, New York. The validity of the shares of common stock offered hereby will be passed upon for the underwriters by Skadden, Arps, Slate, Meagher & Flom LLP, New York, NY.
The consolidated financial statements of Byline Bancorp, Inc. and subsidiaries as of and for the years ended December 31, 2016 and 2015 included in this prospectus have been audited by Moss Adams LLP, an independent registered public accounting firm, as stated in their report included herein. Such consolidated financial statements have been so included in reliance upon the report of such firm given upon their authority as experts in accounting and auditing.
The consolidated financial statements of Ridgestone Financial Services, Inc. as of October 14, 2016 and December 31, 2015 and for the period from January 1, 2016 to October 14, 2016 and for the year ended December 31, 2015 included in this prospectus have been so included in reliance on the report of Crowe Horwath LLP, independent auditor, given on the authority of said firm as experts in auditing and accounting.
WHERE YOU CAN FIND MORE INFORMATION
This prospectus, which constitutes a part of a registration statement on Form S-1 filed with the SEC, does not contain all of the information set forth in the registration statement and the related exhibits and schedules. Some items are omitted in accordance with the rules and regulations of the SEC. Accordingly, we refer you to the complete registration statement, including its exhibits and schedules, for further information about us and the shares of common stock to be sold in this offering. Statements or summaries in this prospectus as to the contents of any contract or other document referred to in this prospectus are not necessarily complete and, where that contract or document is filed as an exhibit to the registration statement, each statement or summary is qualified in all respects by reference to the exhibit to which the reference relates. You may read and copy the registration statement, including the exhibits and schedules to the registration statement, at the SEC’s Public Reference Room at 100 F Street, N.E., Room 1580, Washington, D.C. 20549. Information about the operation of the Public Reference Room may be obtained by calling the SEC at 1-800-SEC-0330. Our filings with the SEC, including the registration statement, are also available to you for free on the SEC’s Internet website at www.sec.gov.
Upon completion of the offering, we will become subject to the informational and reporting requirements of the Exchange Act and, in accordance with those requirements, will file reports and proxy and information statements with the SEC. You will be able to inspect and copy these reports and proxy and information statements and other information at the addresses set forth above. Those filings will also be available to the public on, or accessible through, our website under the heading “Investor Relations” at www.bylinebank.com. The information we file with the SEC or contained on or accessible through our corporate website or any other website we may maintain is not part of this prospectus or the registration statement of which this prospectus forms a part. We intend to furnish to our stockholders our annual reports containing our audited consolidated financial statements certified by an independent public accounting firm.
-192-
Table of Contents
INDEX TO CONSOLIDATED FINANCIAL STATEMENTS
| Byline Bancorp, Inc. and Subsidiaries |
||||
| F-2 | ||||
| Consolidated Financial Statements |
||||
| Consolidated Statements of Financial Condition as of December 31, 2016 and December 31, 2015 |
F-3 | |||
| Consolidated Statements of Operations for the years ended December 31, 2016 and December 31, 2015 |
F-4 | |||
| F-5 | ||||
| F-6 | ||||
| Consolidated Statements of Cash Flows for the years ended December 31, 2016 and December 31, 2015 |
F-7 | |||
| F-9 | ||||
| Unaudited Interim Condensed Consolidated Financial Statements |
||||
| F-69 | ||||
| Consolidated Statements of Operations for the Three Months Ended March 31, 2017 and 2016 (unaudited) |
F-70 | |||
| F-71 | ||||
| F-72 | ||||
| Consolidated Statements of Cash Flows for the Three Months Ended March 31, 2017 and 2016 (unaudited) |
F-73 | |||
| Notes to Unaudited Condensed Consolidated Financial Statements |
F-75 | |||
| Ridgestone Financial Services, Inc. |
||||
| F-116 | ||||
| Consolidated Financial Statements |
||||
| Consolidated Balance Sheets as of October 14, 2016 and December 31, 2015 |
F-117 | |||
| F-118 | ||||
| F-119 | ||||
| F-120 | ||||
| F-121 | ||||
| F-122 | ||||
F-1
Table of Contents
REPORT OF INDEPENDENT REGISTERED PUBLIC ACCOUNTING FIRM
To the Board of Directors and Stockholders
Byline Bancorp, Inc. and Subsidiaries
We have audited the accompanying consolidated statements of financial condition of Byline Bancorp, Inc. and Subsidiaries (the “Company”) as of December 31, 2016 and 2015, and the related consolidated statements of operations, comprehensive income (loss), changes in stockholders’ equity, and cash flows for the years then ended. These consolidated financial statements are the responsibility of the Company’s management. Our responsibility is to express an opinion on these consolidated financial statements based on our audits.
We conducted our audits in accordance with the standards of the Public Company Accounting Oversight Board (United States) and in accordance with auditing standards generally accepted in the United States of America. Those standards require that we plan and perform the audit to obtain reasonable assurance about whether the consolidated financial statements are free of material misstatement. The Company is not required to have, nor were we engaged to perform, an audit of its internal control over financial reporting. Our audits included consideration of internal control over financial reporting as a basis for designing audit procedures that are appropriate in the circumstances, but not for the purpose of expressing an opinion on the effectiveness of the Company’s internal control over financial reporting. Accordingly, we express no such opinion. An audit also includes examining, on a test basis, evidence supporting the amounts and disclosures in the consolidated financial statements, assessing the accounting principles used and significant estimates made by management, as well as evaluating the overall consolidated financial statement presentation. We believe that our audits provide a reasonable basis for our opinion.
In our opinion, the consolidated financial statements referred to above present fairly, in all material respects, the consolidated financial position of Byline Bancorp, Inc. and Subsidiaries as of December 31, 2016 and 2015, and the consolidated results of their operations and their cash flows for the years then ended in conformity with accounting principles generally accepted in the United States of America.
/s/ Moss Adams LLP
Portland, Oregon
April 7, 2017, except for Note 26,
as to which the date is June 19, 2017
F-2
Table of Contents
BYLINE BANCORP, INC. AND SUBSIDIARIES
CONSOLIDATED STATEMENTS OF FINANCIAL CONDITION
DECEMBER 31, 2016 AND 2015
| (dollars in thousands) | 2016 |
2015 |
||||||
| ASSETS | ||||||||
| Cash and due from banks |
$ | 17,735 | $ | 21,312 | ||||
| Interest bearing deposits with other banks |
28,798 | 23,572 | ||||||
|
|
|
|
|
|||||
| Cash and cash equivalents |
46,533 | 44,884 | ||||||
| Securities available-for-sale, at fair value |
608,560 | 767,732 | ||||||
| Securities held-to-maturity, at amortized cost (fair value 2016—$138,082, 2015—$110,935) |
138,846 | 111,460 | ||||||
| Restricted stock, at cost |
14,993 | 7,608 | ||||||
| Loans held for sale |
23,976 | 268 | ||||||
| Loans and leases: |
||||||||
| Loans and leases |
2,148,011 | 1,345,437 | ||||||
| Allowance for loan and lease losses |
(10,923 | ) | (7,632 | ) | ||||
|
|
|
|
|
|||||
| Net loans and leases |
2,137,088 | 1,337,805 | ||||||
| Servicing assets, at fair value |
21,091 | — | ||||||
| Accrued interest receivable |
6,866 | 5,319 | ||||||
| Premises and equipment, net |
102,074 | 115,174 | ||||||
| Assets held for sale |
14,748 | 2,259 | ||||||
| Other real estate owned, net |
16,570 | 26,715 | ||||||
| Goodwill |
51,975 | 25,688 | ||||||
| Other intangible assets, net |
19,826 | 22,326 | ||||||
| Bank-owned life insurance |
6,557 | 3,982 | ||||||
| Deferred tax assets, net |
67,760 | — | ||||||
| Other assets |
18,367 | 8,650 | ||||||
|
|
|
|
|
|||||
| Total assets |
$ | 3,295,830 | $ | 2,479,870 | ||||
|
|
|
|
|
|||||
| LIABILITIES AND STOCKHOLDERS’ EQUITY | ||||||||
| LIABILITIES |
||||||||
| Non-interest bearing demand deposits |
$ | 724,457 | $ | 626,396 | ||||
| Interest bearing deposits: |
||||||||
| NOW, savings accounts, and money market accounts |
989,421 | 994,283 | ||||||
| Time deposits |
776,516 | 559,945 | ||||||
|
|
|
|
|
|||||
| Total deposits |
2,490,394 | 2,180,624 | ||||||
| Accrued interest payable |
2,427 | 1,072 | ||||||
| Revolving line of credit |
20,650 | — | ||||||
| Federal Home Loan Bank advances |
313,715 | 38,000 | ||||||
| Securities sold under agreements to repurchase |
17,249 | 12,659 | ||||||
| Junior subordinated debentures issued to capital trusts, net |
26,926 | 24,711 | ||||||
| Accrued expenses and other liabilities |
41,811 | 34,530 | ||||||
|
|
|
|
|
|||||
| Total liabilities |
2,913,172 | 2,291,596 | ||||||
| COMMITMENTS AND CONTINGENT LIABILITIES (Note 17) |
||||||||
| STOCKHOLDERS’ EQUITY (Note 25) |
||||||||
| Preferred stock |
25,441 | 15,003 | ||||||
| Common stock, voting $.01 par value; 150,000,000 shares authorized at December 31, 2016 and 2015; 24,616,706 shares issued and outstanding at December 31, 2016; 17,332,772 shares issued and outstanding at December 31, 2015 |
311,994 | 193,729 | ||||||
| Additional paid-in capital |
1,558 | 1,045 | ||||||
| Retained earnings (accumulated deficit) |
50,933 | (15,796 | ) | |||||
| Accumulated other comprehensive loss, net of tax |
(7,268 | ) | (5,707 | ) | ||||
|
|
|
|
|
|||||
| Total stockholders’ equity |
382,658 | 188,274 | ||||||
|
|
|
|
|
|||||
| Total liabilities and stockholders’ equity |
$ | 3,295,830 | $ | 2,479,870 | ||||
|
|
|
|
|
|||||
See accompanying Notes to Consolidated Financial Statements.
F-3
Table of Contents
BYLINE BANCORP, INC. AND SUBSIDIARIES
CONSOLIDATED STATEMENTS OF OPERATIONS
FOR THE YEARS ENDED DECEMBER 31, 2016 AND 2015
| (dollars in thousands, except share and per share data) | 2016 |
2015 |
||||||
| INTEREST AND DIVIDEND INCOME |
||||||||
| Interest and fees on loans and leases |
$ | 83,150 | $ | 69,621 | ||||
| Interest on taxable securities |
14,169 | 12,799 | ||||||
| Interest on tax-exempt securities |
653 | 651 | ||||||
| Other interest and dividend income |
393 | 192 | ||||||
|
|
|
|
|
|||||
| Total interest and dividend income |
98,365 | 83,263 | ||||||
| INTEREST EXPENSE |
||||||||
| Deposits |
4,580 | 4,313 | ||||||
| Federal Home Loan Bank advances |
706 | 23 | ||||||
| Subordinated debentures and other borrowings |
2,461 | 2,295 | ||||||
|
|
|
|
|
|||||
| Total interest expense |
7,747 | 6,631 | ||||||
|
|
|
|
|
|||||
| Net interest income |
90,618 | 76,632 | ||||||
| PROVISION FOR LOAN AND LEASE LOSSES |
10,352 | 6,966 | ||||||
|
|
|
|
|
|||||
| Net interest income after provision for loan and lease losses |
80,266 | 69,666 | ||||||
|
|
|
|
|
|||||
| NON-INTEREST INCOME |
||||||||
| Fees and service charges on deposits |
5,665 | 5,803 | ||||||
| Servicing fees |
1,906 | — | ||||||
| ATM and interchange fees |
5,856 | 6,101 | ||||||
| Net gains on sales of securities available-for-sale |
3,227 | 3,064 | ||||||
| Net gains on sales of loans |
4,323 | 3,151 | ||||||
| Fees on mortgage loan sales, net |
144 | 107 | ||||||
| Other non-interest income |
4,783 | 2,613 | ||||||
|
|
|
|
|
|||||
| Total non-interest income |
25,904 | 20,839 | ||||||
|
|
|
|
|
|||||
| NON-INTEREST EXPENSE |
||||||||
| Salaries and employee benefits |
50,585 | 45,960 | ||||||
| Occupancy expense, net |
15,066 | 16,682 | ||||||
| Equipment expense |
2,032 | 2,359 | ||||||
| Loan and lease related expenses |
1,992 | (21 | ) | |||||
| Legal, audit and other professional fees |
5,862 | 7,089 | ||||||
| Data processing |
8,157 | 7,033 | ||||||
| Net (gain) loss recognized on other real estate owned and other related expenses |
1,719 | 7,792 | ||||||
| Regulatory assessments |
2,553 | 3,316 | ||||||
| Other intangible assets amortization expense |
3,003 | 2,980 | ||||||
| Advertising and promotions |
623 | 1,570 | ||||||
| Telecommunications |
1,698 | 1,643 | ||||||
| Other non-interest expense |
7,396 | 8,769 | ||||||
|
|
|
|
|
|||||
| Total non-interest expense |
100,686 | 105,172 | ||||||
|
|
|
|
|
|||||
| INCOME (LOSS) BEFORE PROVISION FOR INCOME TAXES |
5,484 | (14,667 | ) | |||||
| PROVISION (BENEFIT) FOR INCOME TAXES |
(61,245 | ) | 307 | |||||
|
|
|
|
|
|||||
| NET INCOME (LOSS) |
$ | 66,729 | $ | (14,974 | ) | |||
|
|
|
|
|
|||||
| EARNINGS (LOSS) PER SHARE |
||||||||
| Basic |
$ | 3.31 | $ | (0.86 | ) | |||
| Diluted |
$ | 3.27 | $ | (0.86 | ) | |||
See accompanying Notes to Consolidated Financial Statements.
F-4
Table of Contents
BYLINE BANCORP, INC. AND SUBSIDIARIES
CONSOLIDATED STATEMENTS OF COMPREHENSIVE INCOME (LOSS)
FOR THE YEARS ENDED DECEMBER 31, 2016 AND 2015
| (dollars in thousands) | 2016 |
2015 |
||||||
| Net income (loss) |
$ | 66,729 | $ | (14,974 | ) | |||
| Securities available-for-sale |
||||||||
| Unrealized holding losses arising during the period |
(3,100 | ) | (3,804 | ) | ||||
| Reclassification adjustments for net gains included in net income (loss) |
(3,227 | ) | (3,064 | ) | ||||
| Tax effect |
2,533 | — | ||||||
|
|
|
|
|
|||||
| Net of tax |
(3,794 | ) | (6,868 | ) | ||||
| Cash flow hedges |
||||||||
| Unrealized holding gains |
3,684 | — | ||||||
| Reclassification adjustments for losses included in net income (loss) |
40 | — | ||||||
| Tax effect |
(1,491 | ) | — | |||||
|
|
|
|
|
|||||
| Net of tax |
2,233 | — | ||||||
|
|
|
|
|
|||||
| Total other comprehensive loss |
(1,561 | ) | (6,868 | ) | ||||
|
|
|
|
|
|||||
| Comprehensive income (loss) |
$ | 65,168 | $ | (21,842 | ) | |||
|
|
|
|
|
|||||
|
Gains |
Unrealized Gains |
Total |
||||||||||
| Balance, January 1, 2015 |
$ | — | $ | 1,161 | $ | 1,161 | ||||||
| Other comprehensive loss, net of tax |
— | (6,868 | ) | (6,868 | ) | |||||||
|
|
|
|
|
|
|
|||||||
| Balance, December 31, 2015 |
— | (5,707 | ) | (5,707 | ) | |||||||
| Other comprehensive income (loss), net of tax |
2,233 | (3,794 | ) | (1,561 | ) | |||||||
|
|
|
|
|
|
|
|||||||
| Balance, December 31, 2016 |
$ | 2,233 | $ | (9,501 | ) | $ | (7,268 | ) | ||||
|
|
|
|
|
|
|
|||||||
See accompanying Notes to Consolidated Financial Statements.
F-5
Table of Contents
BYLINE BANCORP, INC. AND SUBSIDIARIES
CONSOLIDATED STATEMENTS OF CHANGES IN STOCKHOLDERS’ EQUITY
FOR THE YEARS ENDED DECEMBER 31, 2016 AND 2015
| (dollars in thousands, except share data) | Preferred Stock |
|
Additional Paid-In Capital |
Retained Earnings (Accumulated Deficit) |
Accumulated Other Comprehensive Income (Loss) |
Total Stockholders’ Equity |
||||||||||||||||||||||||||
| Shares |
Amount |
Shares |
Amount |
|||||||||||||||||||||||||||||
| Balance, January 1, 2015 |
15,003 | $ | 15,003 | 17,332,775 | $ | 193,729 | $ | — | $ | (822 | ) | $ | 1,161 | $ | 209,071 | |||||||||||||||||
| Net loss |
— | — | — | — | — | (14,974 | ) | — | (14,974 | ) | ||||||||||||||||||||||
| Other comprehensive loss, net of tax |
— | — | — | — | — | — | (6,868 | ) | (6,868 | ) | ||||||||||||||||||||||
| Share-based compensation expense |
— | — | — | — | 1,045 | — | — | 1,045 | ||||||||||||||||||||||||
|
|
|
|
|
|
|
|
|
|
|
|
|
|
|
|
|
|||||||||||||||||
| Balance, December 31, 2015 |
15,003 | 15,003 | 17,332,775 | 193,729 | 1,045 | (15,796 | ) | (5,707 | ) | 188,274 | ||||||||||||||||||||||
| Issuance of common stock, net of issuance cost |
— | — | 3,078,075 | 50,018 | (426 | ) | — | — | 49,592 | |||||||||||||||||||||||
| Issuance of common stock due to business combination |
— | — | 4,199,791 | 68,247 | — | — | — | 68,247 | ||||||||||||||||||||||||
| Issuance of preferred stock |
9,388 | 9,388 | — | — | — | — | — | 9,388 | ||||||||||||||||||||||||
| Subscription of preferred stock |
1,050 | 1,050 | — | — | — | — | — | 1,050 | ||||||||||||||||||||||||
| Net income |
— | — | — | — | — | 66,729 | — | 66,729 | ||||||||||||||||||||||||
| Other comprehensive loss, net of tax |
— | — | — | — | — | — | (1,561 | ) | (1,561 | ) | ||||||||||||||||||||||
| Share-based compensation expense |
— | — | — | — | 899 | — | — | 899 | ||||||||||||||||||||||||
| Exercise of stock options, net of tax |
— | — | 6,065 | — | 40 | — | — | 40 | ||||||||||||||||||||||||
|
|
|
|
|
|
|
|
|
|
|
|
|
|
|
|
|
|||||||||||||||||
| Balance, December 31, 2016 |
25,441 | $ | 25,441 | 24,616,706 | $ | 311,994 | $ | 1,558 | $ | 50,933 | $ | (7,268 | ) | $ | 382,658 | |||||||||||||||||
|
|
|
|
|
|
|
|
|
|
|
|
|
|
|
|
|
|||||||||||||||||
See accompanying Notes to Consolidated Financial Statements.
F-6
Table of Contents
BYLINE BANCORP, INC. AND SUBSIDIARIES
CONSOLIDATED STATEMENTS OF CASH FLOWS
FOR THE YEARS ENDED DECEMBER 31, 2016 AND 2015
| (dollars in thousands) | 2016 |
2015 |
||||||
| CASH FLOWS FROM OPERATING ACTIVITIES |
||||||||
| Net income (loss) |
$ | 66,729 | $ | (14,974 | ) | |||
| Adjustments to reconcile net income (loss) to net cash from operating activities: |
||||||||
| Provision for loan and lease losses |
10,352 | 6,966 | ||||||
| Impairment loss on premises and equipment |
327 | 687 | ||||||
| Impairment loss on assets held for sale |
408 | — | ||||||
| Depreciation and amortization of premises and equipment |
5,060 | 5,800 | ||||||
| Net amortization of securities |
7,090 | 7,969 | ||||||
| Net gains on sales of securities available-for-sale |
(3,227 | ) | (3,064 | ) | ||||
| Net losses on sales or disposals of premises and equipment |
20 | 197 | ||||||
| Net gains on sales of assets held for sale |
(967 | ) | — | |||||
| Net gains on sales of loans |
(4,323 | ) | (3,151 | ) | ||||
| Originations of mortgage loans held for sale |
(5,687 | ) | (3,805 | ) | ||||
| Proceeds from mortgage loans sold |
6,003 | 3,888 | ||||||
| Originations of government guaranteed loans |
(35,949 | ) | — | |||||
| Proceeds from government guaranteed loans sold |
30,624 | — | ||||||
| Accretion of premiums and discounts on acquired loans, net |
(33,179 | ) | (42,998 | ) | ||||
| Net change in servicing assets |
(796 | ) | — | |||||
| Net valuation adjustments on other real estate owned |
953 | 9,265 | ||||||
| Net gains on sales of other real estate owned |
(1,364 | ) | (5,828 | ) | ||||
| Amortization of intangible assets |
3,003 | 2,980 | ||||||
| Amortization of time deposit premium |
(590 | ) | (143 | ) | ||||
| Amortization of Federal Home Loan Bank advances premium |
(44 | ) | — | |||||
| Accretion of junior subordinated debentures discount |
876 | 944 | ||||||
| Share-based compensation expense |
899 | 1,045 | ||||||
| Exercise of share-based awards |
40 | — | ||||||
| Deferred tax asset, net of valuation |
(61,503 | ) | — | |||||
| Increase in cash surrender value of bank owned life insurance |
(223 | ) | (209 | ) | ||||
| Changes in assets and liabilities: |
||||||||
| Accrued interest receivable |
(503 | ) | (978 | ) | ||||
| Other assets |
(3,950 | ) | (843 | ) | ||||
| Accrued interest payable |
1,355 | (4,521 | ) | |||||
| Accrued expenses and other liabilities |
(7,655 | ) | (2,700 | ) | ||||
|
|
|
|
|
|||||
| Net cash used in operating activities |
(26,221 | ) | (43,473 | ) | ||||
|
|
|
|
|
|||||
| CASH FLOWS FROM INVESTING ACTIVITIES |
||||||||
| Purchases of securities available-for-sale |
(557,527 | ) | (856,768 | ) | ||||
| Proceeds from maturities and calls of securities available-for-sale |
95,412 | 103,274 | ||||||
| Proceeds from paydowns of securities available-for-sale |
105,837 | 144,158 | ||||||
| Proceeds from sales of securities available-for-sale |
534,418 | 511,028 | ||||||
| Purchases of securities held-to-maturity |
(59,436 | ) | (120,498 | ) | ||||
| Proceeds from paydowns of securities held-to-maturity |
30,469 | 15,155 | ||||||
| Purchases of Federal Home Loan Bank stock |
(6,454 | ) | (124 | ) | ||||
| Proceeds from other loans sold |
2,213 | 27,606 | ||||||
| Net change in loans and leases |
(420,065 | ) | (48,662 | ) | ||||
| Purchases of premises and equipment |
(5,948 | ) | (4,019 | ) | ||||
| Proceeds from sales of premises and equipment |
1,156 | 1,354 | ||||||
| Proceeds from sales of assets held for sale |
2,566 | — | ||||||
| Proceeds from sales of other real estate owned |
17,306 | 38,563 | ||||||
| Net cash paid in acquisition of business |
(11,273 | ) | — | |||||
|
|
|
|
|
|||||
| Net cash used in investing activities |
(271,326 | ) | (188,933 | ) | ||||
|
|
|
|
|
|||||
See accompanying Notes to Consolidated Financial Statements.
F-7
Table of Contents
BYLINE BANCORP, INC. AND SUBSIDIARIES
CONSOLIDATED STATEMENTS OF CASH FLOWS
FOR THE YEARS ENDED DECEMBER 31, 2016 AND 2015
| (dollars in thousands) | 2016 |
2015 |
||||||
| CASH FLOWS FROM FINANCING ACTIVITIES |
||||||||
| Net (decrease) increase in deposits |
$ | (51,010 | ) | $ | 80,710 | |||
| Proceeds from Federal Home Loan Bank advances |
6,512,100 | 1,943,500 | ||||||
| Repayments of Federal Home Loan Bank advances |
(6,246,114 | ) | (1,905,500 | ) | ||||
| Proceeds from revolving line of credit |
30,000 | — | ||||||
| Repayments of revolving line of credit |
(9,350 | ) | — | |||||
| Net increase in other borrowings |
4,590 | 1,927 | ||||||
| Proceeds from issuance of common stock, net |
49,592 | — | ||||||
| Proceeds from issuance of preferred stock |
9,388 | — | ||||||
|
|
|
|
|
|||||
| Net cash provided by financing activities |
299,196 | 120,637 | ||||||
|
|
|
|
|
|||||
| NET CHANGE IN CASH AND CASH EQUIVALENTS |
1,649 | (111,769 | ) | |||||
| CASH AND CASH EQUIVALENTS, beginning of period |
44,884 | 156,653 | ||||||
|
|
|
|
|
|||||
| CASH AND CASH EQUIVALENTS, end of period |
$ | 46,533 | $ | 44,884 | ||||
|
|
|
|
|
|||||
| SUPPLEMENTAL DISCLOSURES OF CASH FLOW INFORMATION: |
||||||||
| Cash paid during the period for interest |
$ | 6,150 | $ | 10,351 | ||||
|
|
|
|
|
|||||
| Cash refunded during the period for taxes |
$ | (250 | ) | $ | — | |||
|
|
|
|
|
|||||
| SUPPLEMENTAL DISCLOSURES OF NON-CASH INVESTING AND FINANCING ACTIVITIES: |
||||||||
| Change in fair value of available-for-sale securities, net of tax |
$ | (3,794 | ) | $ | (6,868 | ) | ||
|
|
|
|
|
|||||
| Change in fair value of cash flow hedges, net of tax |
$ | 2,233 | $ | — | ||||
|
|
|
|
|
|||||
| Delayed payments of mortgage-backed securities |
$ | 121 | $ | 2,228 | ||||
|
|
|
|
|
|||||
| Due to broker |
$ | 9,978 | $ | 10,000 | ||||
|
|
|
|
|
|||||
| Transfers of loans to loans held for sale |
$ | 1,477 | $ | 65,074 | ||||
|
|
|
|
|
|||||
| Transfers of loans to other real estate owned |
$ | 6,672 | $ | 13,792 | ||||
|
|
|
|
|
|||||
| Internally financed loan sale |
$ | — | $ | 40,252 | ||||
|
|
|
|
|
|||||
| Internally financed sale of other real estate owned |
$ | 1,447 | $ | 1,259 | ||||
|
|
|
|
|
|||||
| Transfers of land and premises to assets held for sale |
$ | 14,496 | $ | 2,259 | ||||
|
|
|
|
|
|||||
| Subscription receivable of preferred stock |
$ | 1,050 | $ | — | ||||
|
|
|
|
|
|||||
| Total assets acquired from acquisition |
$ | 456,153 | $ | — | ||||
|
|
|
|
|
|||||
| Total liabilities assumed from acquisition |
$ | 377,440 | $ | — | ||||
|
|
|
|
|
|||||
| Common stock issued due to acquisition of business |
$ | 68,247 | $ | — | ||||
|
|
|
|
|
|||||
See accompanying Notes to Consolidated Financial Statements.
F-8
Table of Contents
BYLINE BANCORP, INC. AND SUBSIDIARIES
NOTES TO CONSOLIDATED FINANCIAL STATEMENTS
(Table dollars in thousands, except share and per share data)
Note 1—Business and Summary of Significant Accounting Policies
Nature of business—Byline Bancorp, Inc. (the “Company,” “we,” “us,” “our”) is a bank holding company whose principal activity is the ownership and management of its subsidiary bank, Byline Bank (the “Bank”). The Bank originates commercial, mortgage and consumer loans and leases, government guaranteed loans, and receives deposits from customers located primarily in the Chicago, Illinois metropolitan area. The Bank operates 56 Chicago metropolitan area and one Brookfield, Wisconsin, banking offices. The Bank operates under a state bank charter, provides a full range of banking services, and has full trust powers. As a state-chartered financial institution that is not a member of the Federal Reserve System, the Bank is subject to regulation by the Illinois Department of Financial and Professional Regulation and the Federal Deposit Insurance Corporation. The Company is regulated by the Board of Governors of the Federal Reserve System.
On June 28, 2013, the Company completed an external recapitalization involving a series of transactions that included the merging of the Company’s multiple subsidiary banks into the Bank. In connection with the merger of the subsidiary banks at the time of recapitalization, the Company entered into certain Conditions and Commitments to the merger and integration of the banks, which contained on-going requirements related to payment of dividends, execution of an integration plan, director and senior officer appointments, changes in responsibilities, and reporting requirements. The Company accounted for the external recapitalization as a business combination in accordance with Financial Accounting Standards Board (“FASB”) Accounting Standards Codification (“ASC”) Topic 805, Business Combinations. The transaction qualified as a recapitalization under Section 368(a)(1)(E) of the Internal Revenue Code and resulted in carryover treatment of the existing tax bases and tax loss carryforwards.
The Company is a participant in the Small Business Administration (“SBA”) and the United States Department of Agriculture (“USDA”) (collectively referred to as “government guaranteed loans”) lending programs and originates government guaranteed loans as a result of its acquisition of Ridgestone Financial Services, Inc. (“Ridgestone”) on October 14, 2016. See Note 3—Acquisition of a Business for additional information regarding the transaction.
The Company also engages in short-term direct financing lease contracts through BFG Corporation, doing business as Byline Financial Group (“BFG”), a wholly-owned subsidiary of the Bank. BFG is located in Bannockburn, Illinois with sales offices in Texas, North Carolina, Florida, New York, Michigan and Arizona.
On June 14, 2017, stockholders of record as of May 22, 2017 voted to approve an Agreement and Plan of Merger between Byline Bancorp, Inc., an Illinois corporation (“Byline Illinois”), and Byline Bancorp, Inc., a wholly owned Delaware subsidiary of the Company, including the amended and restated certificate of incorporation and by-laws of the Company. Each share of Byline Illinois common stock issued and outstanding immediately prior to the effective time of the Merger was converted automatically into the right to receive one fifth (0.20) of a share of common stock of the Company. Fractional shares are to be paid in cash based on the initial public offering price of Byline Bancorp, Inc.’s common stock.
Basis of financial statement presentation and consolidation—The consolidated financial statements include the accounts of the Company and its subsidiaries. Significant intercompany items and transactions have been eliminated in consolidation. The accounting and reporting policies of the Company conform to accounting principles generally accepted in the United States of America (“GAAP”) as contained within the FASB’s ASC and rules and regulations of the Securities and Exchange Commission (“SEC”), including the instructions to Regulation S-X. In accordance with applicable accounting standards, the Company does not consolidate statutory
F-9
Table of Contents
BYLINE BANCORP, INC. AND SUBSIDIARIES
NOTES TO CONSOLIDATED FINANCIAL STATEMENTS
(Table dollars in thousands, except share and per share data)
Note 1—Business and Summary of Significant Accounting Policies (Continued)
trusts established for the sole purposes of issuing trust preferred securities and related trust common securities. See Note 15, Junior Subordinated Debentures, for additional discussion. Dollars within footnote tables disclosed within the consolidated financial statements are presented in thousands, except share and per share data. Operating results include the years ended December 31, 2016 and 2015.
Use of estimates—In preparing the consolidated financial statements, management is required to make estimates and assumptions that affect the reported amounts of certain assets and liabilities and the disclosure of contingent assets and liabilities as of the date of the Consolidated Statements of Financial Condition and certain revenues and expenses for the periods included in the Consolidated Statements of Operations and the accompanying notes. Actual results could differ from those estimates.
Estimates that are particularly susceptible to significant changes in the near term relate to the determination of expected cash flows of acquired impaired loans, the allowance for loan and lease losses, valuation of servicing assets, fair value measurements for assets and liabilities, goodwill, other intangible assets, and assessment of the requirement for a valuation allowance against deferred tax assets.
Basic and diluted earnings per share—Basic earnings per common share is computed by dividing income available to common stockholders by the weighted-average number of common shares outstanding for the period. Diluted earnings per common share reflects the potential dilution that would occur if securities or other contracts to issue common stock were exercised or converted into common stock or resulted in the issuance of common stock that would then be shared in the earnings of the Company. Diluted earnings per common share is computed using the weighted-average number of shares determined for the basic earnings per common share computation plus the diluted effect of share-based compensation using the treasury stock method.
Business combinations—The Company accounts for business combinations under the acquisition method of accounting in accordance with ASC Topic 805, Business Combinations (“ASC 805”). The Company recognizes the fair value of the assets acquired and liabilities assumed as of the date of acquisition, with any excess of the fair value of consideration provided over the fair value of the identifiable net tangible and intangible assets acquired recorded as goodwill. Transaction costs are immediately expensed. The results of operations of the acquired business are included in the Consolidated Statements of Operations from the effective date of the acquisition, which is the date control is obtained.
In accordance with ASC 805, the acquiring company retains the right to make appropriate adjustments to the assets and liabilities of the acquired entity for information obtained during the measurement period about facts and circumstances that existed as of the acquisition date. The measurement period ends as of the earlier of (a) one year from the acquisition date or (b) the date when the acquirer receives the information necessary to complete the business combination accounting.
Cash and cash equivalents—Cash and cash equivalents have original maturities of three months or less. The Company holds cash and cash equivalents on deposit with other banks and financial institutions in amounts that periodically exceed the federal deposit insurance limit. The Company evaluates the credit quality of these banks and financial institutions to mitigate its credit risk and has not experienced any losses in such accounts.
Cash on hand or on deposit with the Federal Reserve Bank of Chicago was required to meet regulatory reserve and clearing requirements. The reserve requirement was $14.1 million and $8.9 million as of
F-10
Table of Contents
BYLINE BANCORP, INC. AND SUBSIDIARIES
NOTES TO CONSOLIDATED FINANCIAL STATEMENTS
(Table dollars in thousands, except share and per share data)
Note 1—Business and Summary of Significant Accounting Policies (Continued)
December 31, 2016 and 2015, respectively, and the Bank met the requirement at each balance sheet date. The average amount of interest bearing deposits with other banks for the years ended December 31, 2016 and 2015 were $33.0 million and $69.0 million, respectively.
Securities—Securities that are held principally for resale in the near term are classified as trading and recorded at fair value with changes in fair value included in earnings. The Company did not invest in securities classified as trading during 2016 and 2015. Securities are classified as available-for-sale if the instrument may be sold in response to such factors including changes in market interest rates and related changes in prepayment risk, needs for liquidity, changes in the availability of and the yield on alternative instruments, and changes in funding sources and terms. Gains or losses on the sales of available-for-sale securities are recorded on the trade date and determined using the specific-identification method. Unrealized holding gains or losses, net of tax, on available-for-sale securities are carried as accumulated other comprehensive income (loss) within stockholders’ equity until realized. Securities are classified as held-to-maturity and carried at amortized cost when management has the positive intent and ability to hold them to maturity.
Fair values of securities are generally based on quoted market prices for the same or similar instruments. Interest income includes the amortization of purchase premiums and discounts, which are recognized using the effective interest method over the period to maturity.
Management evaluates securities for other-than-temporary impairment (“OTTI”) on a quarterly basis, and more frequently when economic or market conditions warrant such evaluation. The evaluation is based upon factors such as the creditworthiness of the issuers or guarantors, the underlying collateral, if applicable, and the continuing performance of the securities. Management also evaluates other facts and circumstances that may be indicative of an OTTI condition. This includes, but is not limited to, an evaluation of the type of security, length of time and extent to which the fair value has been less than cost, and near-term prospects of the issuer.
The Company’s assessment of OTTI considers whether it intends to sell a security or if it is likely that it would be required to sell the security before recovery of the amortized cost basis of the investment, which may be at maturity. For debt securities, if the Company intends to sell the security or it is more likely than not that it will be required to sell the security before recovering its cost basis, the entire impairment loss is recognized in earnings as an OTTI. If the Company does not intend to sell the security and it is more likely than not that it will be required to sell the security, and the Company does not expect to recover the entire amortized cost basis of the security, only the portion of the impairment loss representing credit losses would be recognized in earnings. The credit loss on a security is measured as the difference between the amortized cost basis and the present value of the cash flows expected to be collected. Projected cash flows are discounted by the original or current effective interest rate depending on the nature of the security being measured for potential OTTI. The remaining impairment related to all other factors, the difference between the present value of the cash flows expected to be collected and fair value, is recognized as a charge to other comprehensive income (loss).
Restricted stock—The Company owns stock of the Federal Home Loan Bank of Chicago (“FHLB”). No ready market exists for this stock, and it has no quoted market value. As a member of the FHLB system, the Bank is required to maintain an investment in FHLB stock. The stock is redeemable at par by the FHLB and is, therefore, carried at cost. In addition, the Company owns stock of Bankers Bank that was acquired as part of the Ridgestone transaction. The stock is redeemable at par and carried at cost.
Restricted stock is generally viewed as a long-term investment. Accordingly, when evaluating for impairment, its value is determined based on the ultimate recoverability of the par value rather than by
F-11
Table of Contents
BYLINE BANCORP, INC. AND SUBSIDIARIES
NOTES TO CONSOLIDATED FINANCIAL STATEMENTS
(Table dollars in thousands, except share and per share data)
Note 1—Business and Summary of Significant Accounting Policies (Continued)
recognizing temporary declines in value. The Bank did not recognize impairment of its restricted stock as a result of its impairment analyses for the years ended December 31, 2016 and 2015.
Loans held for sale—Loans that management has the intent and ability to sell are designated as held for sale. Government guaranteed loans and mortgage loans originated are carried at either amortized cost or estimated fair value. The Company determines whether to account for loans at fair value or amortized cost at origination. The loans accounted for at fair value remain at fair value after the determination. The loans accounted for at amortized cost are carried at the lower of cost or fair value, valued on a loan by loan basis. Net unrealized losses, if any, are recorded as a valuation allowance and charged to earnings. Gains or losses on sales of government guaranteed loans are recognized based on the difference between the net sales proceeds, carrying value of the sold loan, fair value of the servicing asset recognized, and fair value of the retained loan (if any), and are reflected as operating activities in the Consolidated Statements of Cash Flows. The difference between the initial carrying balance of the retained loan and the relative fair value is recorded as a discount to the retained loan, establishing a new carrying balance. The recorded discount is accreted to earnings on a level yield basis. Government guaranteed loans are generally sold with servicing retained.
Loans transferred to loans held for sale are carried at the lower of cost or fair value, less estimated costs to sell. At the time of transfer, write-downs are recorded as charge-offs, establishing a new cost basis. Any subsequent adjustments are determined on an individual loan basis and are recognized as a charge to non-interest income. Sales proceeds received that are in excess of the new cost basis within 90 days are recorded to the allowance for loan and lease losses, up to the amount previously charged off. Any remaining proceeds are recorded as a gain on sale and included in non-interest income. Sales proceeds that are less than the new cost basis upon transfer and are received within 90 days of classifying the loans as held for sale are recorded as a charge-off to the allowance for loan and lease losses. Any proceeds received after 90 days of classifying the loans as held for sale are recorded as a gain or loss on sale and included in other non-interest income.
Originated loans—Originated loans are stated at the amount of unpaid principal outstanding, net of purchase premiums and discounts, and any deferred fees or costs. Net deferred fees, costs, discounts and premiums are recognized as yield adjustments over the contractual life of the loan. Interest on loans is calculated daily based on the principal amount outstanding.
Originated loans are classified as impaired when, based on current information and events, it is probable that the Bank will be unable to collect the scheduled payments of principal and interest when due, in accordance with the terms of the original loan agreement. The carrying value of impaired loans is based on the present value of expected future cash flows (discounted at each loan’s effective interest rate) or, for collateral dependent loans, at the fair value of the collateral less estimated selling costs. If the measurement of each impaired loan’s value is less than the recorded investment in the loan, impairment is recognized and the carrying value of the loan is adjusted in the allowance for loan and lease losses as a specific component provided or through a charge-off of the impaired portion of the loan.
Accrual of interest on impaired loans is discontinued when the loan is 90 days past due or when, in management’s opinion, the borrower may be unable to make payments as they become due. When the accrual of interest is discontinued, all unpaid accrued interest is reversed through interest income. Payments received during the time a loan is on non-accrual status are applied to principal. Interest income is not recognized until the loan is returned to accrual status or after the principal balance is paid in full. Loans are returned to accrual status when all the principal and interest amounts contractually due are brought current and future payments are reasonably assured as evidenced by agreed upon performance for a period of not less than six months.
F-12
Table of Contents
BYLINE BANCORP, INC. AND SUBSIDIARIES
NOTES TO CONSOLIDATED FINANCIAL STATEMENTS
(Table dollars in thousands, except share and per share data)
Note 1—Business and Summary of Significant Accounting Policies (Continued)
Troubled debt restructuring—A troubled debt restructuring (“TDR”) is a formal restructuring of a loan in which the Bank, for economic or legal reasons related to the borrower’s financial difficulties, grants a concession to the borrower. The concessions may be granted in various forms, including providing a below-market interest rate, reduction in the loan balance or accrued interest, extension of the maturity date, or a combination of these. Troubled debt restructurings are considered to be impaired loans and are subject to the Bank’s impaired loan accounting policy. Acquired impaired loans are not subject to TDR accounting.
The Bank does not accrue interest on a TDR unless it believes collection of all principal and interest under the modified terms is reasonably assured. For a TDR to begin accruing interest, the borrower must demonstrate some level of past performance and the future capacity to perform under the modified terms. Generally, six months of consecutive payment performance under the restructured terms is required before a TDR is returned to accrual status.
Direct finance leases—The Bank engages in leasing for small-ticket equipment, software, machinery and ancillary supplies and services to customers under leases that qualify as direct financing leases for financial reporting. Certain leases qualify as operating leases for income tax purposes. Under the direct financing method of accounting, the minimum lease payments to be received under the lease contract, together with the estimated unguaranteed residual values of up to 15% of the cost of the related equipment, are recorded as lease receivables when the lease is signed and funded and the lease property is delivered to the customer. The excess of the minimum lease payments and residual values over the amount financed is recorded as unearned lease income. Unearned lease income is recognized over the term of the lease based on the effective yield interest method. Residual value is the estimated fair market value of the equipment on lease at lease termination. In estimating the equipment’s fair value at lease termination, the Bank relies on historical experience by equipment type and manufacturer and, where available, valuations by independent appraisers, adjusted for known trends. The Bank’s estimates are for reasonableness; however, the amounts the Bank will ultimately realize could differ from the estimated amounts. If the review results in other-than-temporary impairment, the impairment is recognized in current period earnings. An upward adjustment of the estimated residual value is not recorded.
The policies for delinquency and non-accrual for direct finance leases are materially consistent with those described for all classes of loan receivables.
The Bank defers and amortizes certain initial direct costs over the contractual term of the lease as an adjustment to the yield. The unamortized direct costs are recorded as a reduction of unearned lease income.
Acquired impaired loans—Loans initially acquired with evidence of credit quality deterioration are accounted for under ASC Topic 310-30, Accounting for Purchased Loans with Deteriorated Credit Quality (“ASC 310-30”). These loans were recorded either on a pool or a loan-by-loan basis at their estimated fair value where applicable. The Bank aggregated loans into pools based on similar credit risks and predominant risk characteristics such as delinquency status and loan type.
Management estimated the fair values of acquired loans at both the recapitalization date and the Ridgestone acquisition date based on estimated future cash flows. The excess of cash flows expected to be collected over a loan’s carrying value is considered to be the accretable yield and is recognized as interest income over the estimated life of the loan or pool using the effective yield method. The acquisition date estimates of accretable yield may subsequently change due to changes in management’s estimates of timing and amounts of expected cash flows. The excess of the contractual amounts due over the cash flows expected to be collected is
F-13
Table of Contents
BYLINE BANCORP, INC. AND SUBSIDIARIES
NOTES TO CONSOLIDATED FINANCIAL STATEMENTS
(Table dollars in thousands, except share and per share data)
Note 1—Business and Summary of Significant Accounting Policies (Continued)
considered to be the non-accretable difference. The non-accretable difference represents the Bank’s estimate of the credit losses expected to occur and is considered in determining the fair value of the loans. Reclassifications between accretable yield and non-accretable difference represent changes in expected cash flows over the remaining estimated life of the loan or pool. Subsequent increases in expected cash flows over those expected at inception are adjusted through an increase to the accretable yield on a prospective basis. Any subsequent decreases in expected cash flows attributable to credit deterioration are recognized by recording an additional provision for loan losses.
Once a pool of loans is assembled, the integrity of the pool is maintained. A loan can only be removed from a pool if either of the following conditions is met: (1) the Bank sells, forecloses, or otherwise receives assets in satisfaction of the loan, or (2) the loan is written off. A refinancing or restructuring of a loan does not result in a removal of a loan from a pool. Loan sales are accounted for under ASC Topic 860, Transfers and Servicing (“ASC 860”), when control over the assets have been relinquished. See transfers of financial assets accounting policy.
Acquired non-impaired loans and leases—Acquired non-impaired loans and leases are accounted for under ASC Subtopic 310-20, Receivables Nonrefundable Fees and Other Costs (“ASC 310-20”). These loans and leases were individually recorded at fair value at the time of acquisition. The component of fair value representing an adjustment to an asset’s outstanding principal balance is accreted or amortized over the life of the related asset as a yield adjustment. Any previously recognized allowance for loan and lease losses and unearned fees or discounts are not carried over and recognized at the date of acquisition. The balance of the asset is then evaluated periodically pursuant to the Bank’s allowance for loan and lease loss accounting policy and any adjustment required for credit risk is recorded within the allowance for loan and lease losses.
Allowance for loan and lease losses and reserve for unfunded commitments—The allowance for loan and lease losses is maintained at a level management believes is appropriate to provide for probable loan and lease losses as of the date of the Consolidated Statements of Financial Condition. The allowance for loan and lease losses is increased by a provision for loans and lease losses and decreased by charge-offs, net of recoveries. Loan and lease losses are charged against the allowance for loan and lease losses when management believes the uncollectibility of a loan balance is confirmed. Subsequent recoveries, if any, are credited to the allowance for loan and lease losses. The allowance for loan and lease losses is based on management’s evaluation of the loan and lease portfolio giving consideration to the nature and volume of the loan portfolio, the value of the underlying collateral, overall portfolio quality, review of specific problem loans, and prevailing economic conditions that may affect the borrower’s ability to pay. While management uses the best information available to make its evaluation, future adjustments to the allowance for loan and lease losses may be necessary if there are significant changes in economic condition. The allowance for loan and lease losses consists of general and specific components. Allocations of the allowance for loan and lease losses not attributable to acquired impaired loans may be made for specific loans and leases, but the entire allowance is available for any loan and lease that, in management’s judgement, should be charged off.
The general component covers loans and leases that are collectively evaluated for impairment. Larger groups of smaller balance homogeneous loans, such as consumer and residential real estate loans, and leases are collectively evaluated for impairment, and accordingly, they are not included in the separately identified impairment disclosures. The general component is based on a trailing 12-quarter weighted average loss rate for each loan category based on the Company’s peer group and adjusted for qualitative and other economic factors. These factors include (1) changes in lending policies and procedures, including changes in underwriting
F-14
Table of Contents
BYLINE BANCORP, INC. AND SUBSIDIARIES
NOTES TO CONSOLIDATED FINANCIAL STATEMENTS
(Table dollars in thousands, except share and per share data)
Note 1—Business and Summary of Significant Accounting Policies (Continued)
standards and collections, charge-off and recovery practices; (2) changes in international, national, regional and local conditions; (3) changes in the nature and volume of the portfolio and terms of the loans and leases; (4) changes in experience, depth and ability of lending management and other relevant staff; (5) changes in the volume and severity of past due loans and leases; (6) changes in the quality of the Company’s loan review system; (7) changes in the value of the underlying collateral for collateral dependent loans; (8) existence and effect of any concentrations of credit and changes in the levels of such concentrations; and (9) the effect of other external factors (i.e., competition, legal and regulatory requirements) on the level of estimated credit losses. Based upon management’s judgement of other factors that fall outside of the predefined qualitative or historical loss rates, the allowance for loan and lease losses may include an unallocated component as a proportion of the loan and lease categories collectively evaluated for impairment.
The specific component relates to loans that are risk-rated substandard or worse, and based on current information and events, it is likely that the Company will be unable to collect all amounts due according to the contractual terms of the loan agreement. Factors considered by management in determining the impairment include payment status, collateral value, strength of guarantor, and the probability of collecting scheduled principal and interest payments when due. Loans that experience insignificant payment delays and payment shortfalls generally are not classified as impaired and are reviewed on a case-by-case basis. TDRs are individually evaluated for impairment and are measured at the present value of estimated future cash flows using the loan’s effective rate at origination. If a TDR is considered to be a collateral dependent loan, the loan is reported at the fair value of the collateral, less estimated costs to sell.
The allowance for loan losses also includes amounts representing decreases in expected cash flows attributable to credit deterioration of acquired impaired loans. The evaluation is inherently subjective, as it requires estimates that are susceptible to significant revision as more information becomes available.
A reserve for unfunded commitments is maintained at a level that, in the opinion of management, is sufficient to absorb probable losses associated with the Bank’s commitment to lend funds under existing agreements, such as letters or lines of credit. Management determines the appropriate reserve for unfunded commitments based upon reviews of individual credit facilities, current economic conditions, the risk characteristics of the various categories of commitments, and other relevant factors. The reserve for unfunded commitments is based on estimates, and ultimate losses may vary from the current estimates. These estimates are evaluated on a quarterly basis and, as adjustments become necessary, they are recognized in earnings in the periods in which they become known. Advances that are considered uncollectible are charged to the reserve for unfunded commitments.
Provisions and recoveries of advances previously charged-off are recognized within the reserve for unfunded commitments, which is included in other liabilities within the Consolidated Statements of Financial Condition. The factors supporting the allowance for loan and lease losses and the reserve for unfunded commitments do not diminish the fact that the entire allowance for loan and lease losses and reserve for unfunded commitments not attributable to acquired impaired loans are each available to absorb losses in the loan and lease portfolios and related commitment portfolio, respectively.
The allowance for loan and lease losses and reserve for unfunded commitments are both subject to review by regulatory agencies during examinations and may require us to recognize adjustments to the allowance for loan and lease losses or the reserve for unfunded commitments.
Servicing assets—Servicing assets are recognized separately when they are acquired through sales of loans. When loans are sold, servicing assets are recorded at fair value in accordance with ASC 860. Fair value is
F-15
Table of Contents
BYLINE BANCORP, INC. AND SUBSIDIARIES
NOTES TO CONSOLIDATED FINANCIAL STATEMENTS
(Table dollars in thousands, except share and per share data)
Note 1—Business and Summary of Significant Accounting Policies (Continued)
based on market prices for comparable servicing contracts, when available, or alternatively, is based on a valuation model that calculates the present value of estimated future net servicing income.
Sales of government guaranteed loans are executed on a servicing retained basis. The standard SBA loan sale agreement is structured to provide the Company with a servicing spread paid from a portion of the interest cash flow of the loan. SBA regulations require the Bank to retain a portion of the cash flow from the interest payments received for a sold loan. The USDA loan sale agreements are not standardized with respect to servicing.
Servicing fee income, which is reported on the Consolidated Statements of Operations as servicing fees, is recorded for fees earned for servicing loans. The fees are based on a contractual percentage of the outstanding principal. Late fees and ancillary fees related to loan servicing are not material.
The Company has elected the fair value measurement method and measures servicing rights at fair value at each reporting date and reports changes in fair value of servicing assets in earnings in the period in which the changes occur, and are included with servicing fees on the Consolidated Statements of Operations. The fair values of servicing rights are subject to significant fluctuations as a result of changes in estimated and actual prepayment speeds, default rates, and losses.
Concentrations of credit risk—Most of the Bank’s business activity is concentrated with customers located within its principal market areas, with the exception of government guaranteed loans and leasing activities. The Bank originates commercial real estate, construction, land development and other land, commercial and industrial, residential real estate, installment and other loans, and leases. Generally, loans are secured by accounts receivable, inventory, deposit accounts, personal property or real estate.
Rights to collateral vary and are legally documented to the extent practicable. The Bank has a concentration in commercial real estate loans and the ability of borrowers to honor these and other contracts is dependent upon the real estate and general economic conditions within their geographic market.
Transfers of financial assets—Transfers of financial assets are accounted for as sales when control over the assets has been relinquished. The Company has assessed that partial sales of financial assets meet the definition of participating interest. Control over transferred assets is deemed to be surrendered when the assets have been isolated from the Company and the transferee obtains the right (free of conditions that constrain it from taking advantage of that right) to pledge or exchange the transferred assets. Gains or losses are recognized in the period of sale upon derecognition of the asset.
Premises and equipment—Premises and equipment acquired through a business combination are stated at the acquisition date fair value. All other premises and equipment are stated at cost less accumulated depreciation. Depreciation on premises and equipment is recognized on a straight-line basis over their estimated useful lives ranging from three to 39 years. Land is also carried at its fair value following a business combination and is not subject to depreciation. Leasehold improvements are amortized over the shorter of the life of the related asset or expected term of the underlying lease. Gains and losses on the dispositions of premises and equipment are included in non-interest income. Expenditures for new premises, equipment and major betterments are capitalized. Normal costs of maintenance and repairs are expensed as incurred.
Long-lived depreciable assets are evaluated periodically for impairment when events or changes in circumstances indicate the carrying amounts may be not recoverable. Impairment exists when the undiscounted
F-16
Table of Contents
BYLINE BANCORP, INC. AND SUBSIDIARIES
NOTES TO CONSOLIDATED FINANCIAL STATEMENTS
(Table dollars in thousands, except share and per share data)
Note 1—Business and Summary of Significant Accounting Policies (Continued)
expected future cash flows of a long-lived asset are less than its carrying value. In that event, the Company recognizes a loss for the difference between the carrying amount and the estimated fair value of the asset based on a quoted market price, if applicable, or a discounted cash flow analysis. Impairment losses are recorded in non-interest expense.
Assets held for sale—Assets held for sale consist of former branch locations and real estate previously purchased for expansion. Assets are considered held for sale when management has approved to sell the assets following a branch closure or other events. The properties are being actively marketed and transferred to assets held for sale based at the lower of its carrying value or its fair value, less estimated costs to sell.
Other real estate owned—Other real estate owned (“OREO”) includes real estate assets that have been acquired through, or in lieu of, loan foreclosure or repossession and are to be sold. OREO assets are initially recorded at fair value, less estimated costs to sell, of the collateral of the loan, on the date of foreclosure or repossession, establishing a new cost basis. Adjustments that reduce loan balances to fair value at the time of foreclosure or repossession are recognized as charge-offs in the allowance for loan and lease losses. Positive adjustments, if any, at the time of foreclosure or repossession are recognized in non-interest expense. After foreclosure or repossession, management periodically obtains new valuations, and real estate or other assets may be adjusted to a lower carrying amount, determined by the fair value of the asset, less estimated costs to sell. Any subsequent write-downs are recorded as a decrease in the asset and charged against other real estate owned valuation adjustments. Operating expenses of such properties, net of related income, are included in non-interest expense, and gains and losses on their disposition are included in non-interest expense. Gains on internally financed other real estate owned sales are accounted for in accordance with the methods stated in ASC Topic 360-20, Real Estate Sales (“ASC 360-20”). Any losses on the sales of other real estate owned properties are recognized immediately.
Goodwill—The excess of the cost of the recapitalization and acquisitions over the fair value of the net assets acquired, including core deposit intangible, consists of goodwill. Goodwill is not amortized but is periodically evaluated for impairment under the provisions of ASC Topic 350, Intangibles—Goodwill and Other (“ASC 350”).
Impairment testing is performed using either a qualitative or quantitative approach at the reporting unit level. All of the Company’s goodwill is allocated to the Bank, which is the Company’s only applicable reporting unit for the purposes of testing goodwill for impairment. The Company has selected November 30 as the date it performs the annual goodwill impairment test. Additionally, the Company performs a goodwill impairment evaluation on an interim basis when events or circumstances indicate impairment potentially exists. The Company performs impairment testing using a qualitative approach to determine whether it is more likely than not that the fair value of a reporting unit is less than its carrying amount. A significant amount of judgment is involved in determining if an indicator of impairment has occurred. Such indicators may include, among others, a material change in the estimated value of the Company based on current market multiples common for community banks of similar size and operations; a significant adverse change in legal factors or in the business climate; adverse action or assessment by a regulator; and unanticipated competition. If the assessment of qualitative factors indicates that it is not more likely than not that impairment exists, no further testing is performed; otherwise, the Company would proceed with a quantitative two-step goodwill impairment test. In the first step, the Company compares its estimate of the fair value of the reporting unit, which is based on a discounted cash flow analysis, with its carrying amount, including goodwill. If the fair value of the reporting unit exceeds its carrying amount, goodwill of the reporting unit is not impaired and the second step is not required. If necessary, the second step compares the implied fair value of
F-17
Table of Contents
BYLINE BANCORP, INC. AND SUBSIDIARIES
NOTES TO CONSOLIDATED FINANCIAL STATEMENTS
(Table dollars in thousands, except share and per share data)
Note 1—Business and Summary of Significant Accounting Policies (Continued)
the reporting unit goodwill with the carrying amount of that goodwill. The implied fair value of goodwill is determined by assigning the value of the reporting unit to all of the assets and liabilities of that unit, including any other identifiable intangible assets. An impairment loss is recognized if the carrying amount of the reporting unit goodwill exceeds the implied fair value of the goodwill.
Based on an annual analysis completed as of November 30, 2016, the Company determined that it is more likely than not that goodwill was not impaired.
Other intangible assets—Other intangible assets primarily consist of core deposit intangible assets. Other intangible assets with definite useful lives are amortized to their estimated residual values over their respective estimated useful lives, and are also reviewed periodically for impairment. Amortization of other intangible assets is included in other non-interest expense. Core deposit intangibles were recognized apart from goodwill at the time of the recapitalization and the acquisition of Ridgestone based on market valuations. Core deposit intangibles are amortized over a ten-year period. In valuing core deposit intangibles, the Company considered variables such as deposit servicing costs, attrition rates and market discount rates. If the estimated fair value is less than the carrying value, the core deposit intangible would be reduced to such value and the impairment recognized as non-interest expense. The Company did not recognize impairment on its core deposit intangibles for the years ended December 31, 2016 and 2015.
Bank-owned life insurance—The Bank holds life insurance policies that provide protection against the adverse financial effects that could result from the death of current and former employees, and provide tax deferred income. Although the lives of individual current or former management-level employees are insured, the Bank is the owner and is split beneficiary on certain policies. The Bank is exposed to credit risk to the extent an insurance company is unable to fulfill its financial obligations under a policy. Split-dollar life insurance is recorded as an asset at cash surrender value. Increases in the cash value of these policies, as well as insurance proceeds received, are recorded in other non-interest income and are not subject to income tax. At December 31, 2016 and 2015, bank-owned life insurance totaled $6.6 million and $4.0 million, respectively. The liabilities associated with the bank-owned life insurance were $457,000 and $458,000 at December 31, 2016 and 2015, respectively.
Income taxes—The Company uses the asset and liability method to account for income taxes. The objective of the asset and liability method is to establish deferred tax assets and liabilities for the temporary differences between the financial reporting basis and the income tax basis of the Company’s assets and liabilities at enacted tax rates expected to be in effect when such amounts are realized or settled. The Company’s annual tax rate is based on its income, statutory tax rates and available tax planning opportunities. Tax laws are complex and subject to different interpretations by the taxpayer and respective governmental taxing authorities. Significant judgment is required in determining tax expense and in evaluating tax positions, including evaluating uncertainties.
Deferred income tax assets represent amounts available to reduce income taxes payable on taxable income in future years. Such assets arise because of temporary differences between the financial reporting and tax bases of assets and liabilities, as well as from net operating loss carryforwards. The Company reviews its deferred tax positions periodically and adjusts the balances as new information becomes available. The Company evaluates the recoverability of these future tax deductions by assessing the adequacy of future expected taxable income from all sources, including reversal of taxable temporary differences, forecasted operating earnings and available tax planning strategies. The Company uses short and long-range business forecasts to provide
F-18
Table of Contents
BYLINE BANCORP, INC. AND SUBSIDIARIES
NOTES TO CONSOLIDATED FINANCIAL STATEMENTS
(Table dollars in thousands, except share and per share data)
Note 1—Business and Summary of Significant Accounting Policies (Continued)
additional information for its evaluation of the recoverability of deferred tax assets. It is the Company’s policy to recognize interest and penalties associated with uncertain tax positions, if applicable, as components of non-interest expense.
A deferred tax valuation allowance is established to reduce the net carrying amount of deferred tax assets if it is determined to be more likely than not that all or some of the deferred tax asset will not be realized. At December 31, 2016, the Company did not record a deferred tax valuation allowance. At December 31, 2015, the Company’s recorded valuation allowance related to its net deferred tax assets was $61.4 million.
Derivative financial instruments and hedging activities—The Company enters into derivative transactions principally to protect against the risk of adverse price or interest rate movements on the future cash flows of certain assets. ASC Topic 815, Derivatives and Hedging (“ASC 815”), establishes accounting and reporting standards requiring that every derivative instrument be recorded in the statement of condition as either an asset or liability measured at its fair value. The accounting for changes in the fair value of a derivative instrument depends on whether it has been designated and qualifies as part of a hedging relationship and on the type of hedging relationship. On the date the derivative contract is entered into, the Company designates the derivative as a fair value hedge, a cash flow hedge, or a non-designated derivative.
Fair value hedges are accounted for by recording the changes in the fair value of the derivative instrument and the changes in the fair value related to the risk being hedged of the hedged asset or liability on the Consolidated Statements of Financial Condition with corresponding offsets recorded in the Consolidated Statements of Operations. The adjustment to the hedged asset or liability is included in the basis of the hedged item, while the fair value of the derivative is recorded as an asset or liability.
Cash flow hedges are accounted for by recording the changes in the fair value of the effective portion of the derivative instrument in other comprehensive income (loss) and are recognized in the Consolidated Statements of Operations when the hedged item affects earnings.
Derivative instruments that are not designated as hedges according to accounting guidance are reported in the Consolidated Statements of Financial Condition at fair value and the changes in fair value are recognized as non-interest income during the period of the change.
The Company formally documents the relationship between a derivative instrument and a hedged asset or liability, as well as its risk management objective and strategy for undertaking various hedge transactions. The Company also formally assesses, both at the hedge’s inception and on an ongoing basis, whether the derivatives that are used in the hedging transactions are highly effective in offsetting changes in fair values or cash flows of hedged items.
Comprehensive income (loss)—Recognized revenue, expenses, gains and losses are included in net income (loss). Certain changes in assets and liabilities, such as unrealized gains and losses on available-for-sale securities and adjustments related to cash flow hedges, are reported on a cumulative basis, net of tax effects, as a separate component of equity on the Consolidated Statements of Financial Condition. Changes in such items, along with net income (loss), are components of comprehensive income (loss).
Advertising expense—Advertising costs are expensed as incurred.
F-19
Table of Contents
BYLINE BANCORP, INC. AND SUBSIDIARIES
NOTES TO CONSOLIDATED FINANCIAL STATEMENTS
(Table dollars in thousands, except share and per share data)
Note 1—Business and Summary of Significant Accounting Policies (Continued)
Off-balance sheet instruments—In the ordinary course of business, the Company has entered into off-balance sheet arrangements consisting of commitments to extend credit, commercial letters of credit, and standby letters of credit. The face amount for these items represents the exposure to loss, before considering customer collateral or ability to repay. Such financial instruments are recorded in the consolidated financial statements when they are funded or when the related fees are incurred or received.
Segment reporting—The Company has one reportable segment. The Company’s chief operating decision maker evaluates the operations of the Company using consolidated information for purposes of allocating resources and assessing performance. Therefore, segments disclosures are not required.
Loss contingencies—Loss contingencies, including claims and legal actions arising in the ordinary course of business, are recorded as liabilities when the likelihood of loss is probable and an amount or range of loss can be reasonably estimated. Management does not believe there are any such matters that will have a material effect on the Consolidated Financial Statements for the years ended December 31, 2016 and 2015.
Share-based compensation—The Company accounts for share-based compensation in accordance with ASC Topic 718, Compensation—Stock Compensation (“ASC 718”), which requires compensation cost relating to share-based compensation transactions be recognized in the Consolidated Statements of Operations, based generally upon the grant-date fair value of the share-based compensation granted by the Company. Share-based awards may have service, market or performance conditions. Refer to Note 19—Stock Option Plan for additional information.
Fair value of assets and liabilities—Fair value is defined as the price that would be received to sell an asset, or paid to transfer a liability, including respective accrued interest balances, in an orderly transaction between market participants at the measurement date. The Company determines fair value based upon quoted prices when available or through the use of alternative approaches, such as matrix or model pricing, when market quotes are not readily accessible or available. The valuation techniques used are based on observable and unobservable inputs. Observable inputs reflect market data obtained from independent sources, while unobservable inputs reflect the Company’s market assumptions.
Reclassifications—Some items in the prior year consolidated financial statements were reclassified to conform to the current presentation. Reclassifications had no effect on prior year net loss or stockholders’ equity.
Note 2—Recently Issued Accounting Pronouncements
The following reflect recent accounting pronouncements that have been adopted or are pending adoption by the Company. As the Company qualifies as an emerging growth company and has elected the extended transition period for complying with new or revised accounting pronouncements, it is not subject to new or revised accounting standards applicable to public companies during the extended transition period. The accounting pronouncements pending adoption below reflect effective dates for the Company as an emerging growth company with the extended transition period.
Revenue from Contracts with Customers In May 2014, FASB issued Accounting Standards Update (“ASU”) No. 2014-09, deferred by ASU No. 2015-14 and clarifying standards, Revenue from Contracts with Customers, which creates Topic 606 and supersedes Topic 605, Revenue Recognition. The core principle of Topic 606 is that an entity recognizes revenue to depict the transfer of promised goods or services to customers
F-20
Table of Contents
BYLINE BANCORP, INC. AND SUBSIDIARIES
NOTES TO CONSOLIDATED FINANCIAL STATEMENTS
(Table dollars in thousands, except share and per share data)
Note 2—Recently Issued Accounting Pronouncements (Continued)
in an amount that reflects the consideration to which the entity expects to be entitled in exchange for those goods or services. In general, the new guidance requires companies to use more judgment and make more estimates than under current guidance, including identifying performance obligations in the contract, estimating the amount of variable consideration to include in the transaction price and allocating the transaction price to each separate performance obligation. Under the terms of ASU No. 2015-14 the standard is effective for interim and annual periods beginning after December 15, 2017. Early application is permitted only as of annual reporting periods beginning after December 15, 2016, including interim reporting periods within that reporting period. For financial reporting purposes, the standard allows for either full retrospective adoption, meaning the standard is applied to all of the periods presented, or modified retrospective adoption, meaning the standard is applied only to the most current period presented in the financial statements with the cumulative effect of initially applying the standard recognized at the date of initial application. The Company is currently evaluating the provisions of ASU No. 2014-09 to determine the potential impact the standard will have on the Company’s Consolidated Financial Statements. As a financial institution, the Company’s largest component of revenue, interest income, is excluded from the scope of this ASU. The Company is currently evaluating which, if any, of its sources of non-interest income will be impacted by this ASU. The Company expects to adopt this new guidance on January 1, 2019, with a cumulative effect adjustment to opening retained earnings, if such adjustment is deemed to be significant. In April 2016, FASB issued ASU No. 2016-10, Identifying Performance Obligations and Licensing. The amendments in this ASU do not change the core principle of the guidance in Topic 606. Rather, the amendments in this ASU clarify the following two aspects of Topic 606: (1) identifying performance obligations and (2) licensing implementation guidance, while retaining the related principles for those areas. The amendments in this ASU affect the guidance in ASU 2014-09, discussed above, which is not yet effective. The effective date and transition requirements for the amendments in this ASU are the same as the effective date and transition requirements in Topic 606, Revenues from Contracts with Customers. The Company is evaluating the provisions of this ASU in conjunction with ASU No. 2014-09 to determine the potential impact Topic 606 and its amendments will have on the Company’s Consolidated Financial Statements.
In May 2016, FASB issued ASU No. 2016-12, Narrow-Scope Improvements and Practical Expedients, amending ASC Topic 606, Revenue from Contracts with Customers. The amendments in this ASU do not change the core principle of the guidance in Topic 606. Rather, the amendments in this ASU affect only several narrow aspects of Topic 606. The amendments in this ASU affect the guidance in ASU 2014-09, discussed above, which is not yet effective. The effective date and transition requirements for the amendments in this ASU are the same as the effective date and transition requirements in Topic 606. The Company is evaluating the provisions of this ASU in conjunction with ASU No. 2014-09 to determine the potential impact Topic 606 and its amendments will have on the Company’s Consolidated Financial Statements.
Customer’s Accounting for Fees Paid in a Cloud Computing Arrangement In April 2015, FASB issued ASU No. 2015-05, Customer’s Accounting for Fees Paid in a Cloud Computing Arrangement. The amendments in this ASU provide guidance to customers in cloud computing arrangements about whether a cloud computing arrangement includes a software license. If a cloud computing arrangement includes a software license, the customer should account for the software license element of the arrangement consistent with the acquisition of other software licenses. If a cloud computing arrangement does not include a software license, the customer should account for the arrangement as a service contract. The amendments were effective for annual periods, including interim periods within those annual periods, beginning after December 15, 2015 and were adopted by the Company as of January 1, 2016. This ASU did not have a material effect on the Company’s Consolidated Financial Statements.
F-21
Table of Contents
BYLINE BANCORP, INC. AND SUBSIDIARIES
NOTES TO CONSOLIDATED FINANCIAL STATEMENTS
(Table dollars in thousands, except share and per share data)
Note 2—Recently Issued Accounting Pronouncements (Continued)
Business Combinations—Simplifying the Accounting for Measurement-Period Adjustments In September 2015, FASB issued ASU No. 2015-16, Simplifying the Accounting for Measurement-Period Adjustments. The amendments in this ASU require that an acquirer recognize adjustments to provisional amounts that are identified during the measurement period in the reporting period when the adjustment amounts are determined. The acquirer is required to record in the same period’s financial statements the effect on earnings from changes in depreciation, amortization, or other income effects resulting from the change to provisional amounts, calculated as if the accounting had been completed at the acquisition date. The acquirer must present separately on the income statement, or disclose in the notes, the amount recorded in current-period earnings that would have been recorded in previous reporting periods if the provisional amount had been recognized at the acquisition date. The amendments in this ASU were effective for fiscal years beginning after December 15, 2015.
The Company adopted this new authoritative guidance on January 1, 2016, and it did not have an impact on the Company’s Consolidated Financial Statements, but may in the future.
Recognition and Measurement of Financial Assets and Financial Liabilities In January 2016, FASB issued ASU No. 2016-01, Recognition and Measurement of Financial Assets and Financial Liabilities. The amendments in this ASU require equity securities to be measured at fair value with changes in the fair value recognized through net income. The amendments allow equity investments that do not have readily determinable fair values to be remeasured at fair value under certain circumstances and require enhanced disclosures about those investments. The amendments simplify the impairment assessment of equity investments without readily determinable fair values. The amendments also eliminate the requirement to disclose the method(s) and significant assumptions used to estimate the fair value that is required to be disclosed for financial instruments measured at amortized cost on the balance sheet. The amendments in this ASU require separate presentation in other comprehensive income of the portion of the total change in the fair value of a liability resulting from a change in the instrument-specific credit risk when the entity has elected to measure the liability at fair value in accordance with the fair value option for financial instruments. This amendment excludes from net income gains or losses that the entity may not realize because those financial liabilities are not usually transferred or settled at their fair values before maturity. The amendments in this ASU require separate presentation of financial assets and financial liabilities by measurement category and form of financial asset (that is, securities or loans and receivables) on the balance sheet or in the accompanying notes to the financial statements. The amendments in this ASU are effective for fiscal years beginning after December 15, 2017, including interim periods within those fiscal years. The Company is currently evaluating the provisions of ASU No. 2016-01 to determine the potential impact the new standard will have on the Company’s Consolidated Financial Statements. Assuming the Company remains an emerging growth company, the new authoritative guidance will be effective for reporting periods after January 1, 2019 and is not expected to have a significant impact on the Company’s Consolidated Financial Statements.
Leases (Topic 842) In February 2016, FASB issued ASU No. 2016-02, Leases. The amendments in this ASU require lessees to recognize the following for all leases (with the exception of short-term) at the commencement date; a lease liability, which is a lessee‘s obligation to make lease payments arising from a lease, measured on a discounted basis; and a right-of-use asset, which is an asset that represents the lessee’s right to use, or control the use of, a specified asset for the lease term. The amendments in this ASU leave lessor accounting largely unchanged, although certain targeted improvements were made to align lessor accounting with the lessee accounting model. This ASU simplifies the accounting for sale and leaseback transactions primarily because lessees must recognize lease assets and lease liabilities. Lessees will no longer be provided with a source of off-balance sheet financing. The amendments in this ASU are effective for fiscal years
F-22
Table of Contents
BYLINE BANCORP, INC. AND SUBSIDIARIES
NOTES TO CONSOLIDATED FINANCIAL STATEMENTS
(Table dollars in thousands, except share and per share data)
Note 2—Recently Issued Accounting Pronouncements (Continued)
beginning after December 15, 2018, including interim periods within those fiscal years. Early application is permitted upon issuance. Lessees (for capital and operating leases) and lessors (for sales-type, direct financing, and operating leases) must apply a modified retrospective transition approach for leases existing at, or entered into after, the beginning of the earliest comparative period presented in the financial statements. The modified retrospective approach would not require any transition accounting for leases that expired before the earliest comparative period presented. Lessees and lessors may not apply a full retrospective transition approach. The Company is evaluating the new guidance and its impact on the Company’s Consolidated Statements of Operations and Consolidated Statements of Financial Condition. Assuming the Company remains an emerging growth company, the new authoritative guidance will be effective for reporting periods after January 1, 2020. The Company expects an increase in assets and liabilities as a result of recording additional lease contracts where the Company is lessee.
Derivatives and Hedging (Topic 815) In March 2016, FASB issued ASU No. 2016-05, Effect of Derivative Contract Novations on Existing Hedge Accounting Relationships. The amendments in this ASU clarify that a change in the counterparty to a derivative instrument that has been designated as the hedging instrument under Topic 815 (Derivatives and Hedging) does not, in and of itself, require dedesignation of that hedging relationship provided that all other hedge accounting criteria continue to be met. The amendments in this ASU are effective for financial statements issued for fiscal years beginning after December 15, 2016, and interim periods within those fiscal years. An entity has an option to apply the amendments in this ASU on either a prospective basis or a modified retrospective basis. Early adoption is permitted, including adoption in an interim period. This ASU became effective for the Company on January 1, 2017 and is not expected to have a material impact on the Company’s Consolidated Financial Statements.
In March 2016, FASB issued ASU No. 2016-06, Contingent Put and Call Options in Debt Instruments. The amendments in this ASU clarify the requirements for assessing whether contingent call (put) options that can accelerate the payment of principal on debt instruments are clearly and closely related to their debt hosts. To determine how to account for debt instruments with embedded features, including contingent put and call options, an entity is required to assess whether the embedded derivatives must be bifurcated from the host contract and accounted for separately. Part of this assessment consists of evaluating whether the embedded derivative features are clearly and closely related to the debt host. Under existing guidance, for contingently exercisable options to be considered clearly and closely related to a debt host, they must be indexed only to interest rates or credit risk. ASU 2016-06 addresses inconsistent interpretations of whether an event that triggers an entity’s ability to exercise the embedded contingent option must be indexed to interest rates or credit risk for that option to qualify as clearly and closely related. Diversity in practice has developed because the existing four-step decision sequence in ASC 815 focuses only on whether the payoff was indexed to something other than an interest rate or credit risk. As a result, entities have been uncertain whether they should (1) determine whether the embedded features are clearly and closely related to the debt host solely on the basis of the four-step decision sequence or (2) first apply the four-step decision sequence and then also evaluate whether the event triggering the exercisability of the contingent put or call option is indexed only to an interest rate or credit risk. This ASU clarifies that in assessing whether an embedded contingent put or call option is clearly and closely related to the debt host, an entity is required to perform only the four-step decision sequence in ASC 815 as amended by this ASU. The entity does not have to separately assess whether the event that triggers its ability to exercise the contingent option is itself indexed only to interest rates or credit risk. The amendments in this ASU are effective for financial statements issued for fiscal years beginning after December 15, 2016, and interim periods within those fiscal years. This ASU became effective for the Company on January 1, 2017 and is not expected to have a material impact on the Company’s Consolidated Financial Statements.
F-23
Table of Contents
BYLINE BANCORP, INC. AND SUBSIDIARIES
NOTES TO CONSOLIDATED FINANCIAL STATEMENTS
(Table dollars in thousands, except share and per share data)
Note 2—Recently Issued Accounting Pronouncements (Continued)
Compensation—Stock Compensation (Topic 718) In March 2016, FASB issued ASU No. 2016-09, Improvements to Employee Share-Based Payment Accounting. FASB issued this ASU as part of its Simplification Initiative. The areas for simplification in this ASU involve several aspects of the accounting for share-based payment transactions, including the income tax consequences, classification of awards as either equity or liabilities, and classification on the statement of cash flows. Amendments in this ASU relate to the timing of when excess tax benefits are recognized, minimum statutory withholding requirements, forfeitures, and intrinsic value should be applied using a modified retrospective transition method by means of a cumulative-effect adjustment to equity as of the beginning of the period in which the guidance is adopted. Amendments related to the presentation of employee taxes paid on the statement of cash flows when an employer withholds shares to meet the minimum statutory withholding requirement should be applied retrospectively. Amendments in this ASU require recognition of excess tax benefits and tax deficiencies in the income statement and the practical expedient for estimating expected term should be applied prospectively.
An entity may elect to apply the amendments in this ASU related to the presentation of excess tax benefits on the statement of cash flows using either a prospective transition method or a retrospective transition method. The amendments in this ASU are effective for annual periods beginning after December 15, 2016, and interim periods within those annual periods. This ASU became effective for the Company on January 1, 2017 and is not expected to have a material impact on the Company’s Consolidated Financial Statements.
Financial Instruments—Credit Losses (Topic 326) In June 2016, FASB issued ASU No. 2016-13, Measurement of Credit Losses on Financial Instruments. Current GAAP requires an “incurred loss” methodology for recognizing credit losses that delays recognition until it is probable a loss has been incurred. The main objective of this ASU is to provide financial statement users with more decision-useful information about the expected credit losses on financial instruments and other commitments to extend credit held by a reporting entity at each reporting date. The amendments in this ASU replace the incurred loss impairment methodology in current GAAP with a methodology that reflects expected credit losses and requires consideration of a broader range of reasonable and supportable information to inform credit loss estimates. The amendments in this ASU require a financial asset (or group of financial assets) measured at amortized cost basis to be presented at the net amount expected to be collected. The allowance for credit losses is a valuation account that is deducted from the amortized cost basis of the financial asset(s) to present the net carrying value at the amount expected to be collected on the financial asset. The measurement of expected credit losses will be based on relevant information about past events, including historical experience, current conditions, and reasonable and supportable forecasts that affect the collectability of the reported amount. The amendments in this ASU broaden the information that an entity must consider in developing its expected credit loss estimate for assets measured either collectively or individually. The use of forecasted information incorporates more timely information in the estimate of expected credit loss, which will be more decision useful to users of the financial statements. The amendments in this ASU will be effective for fiscal years beginning after December 15, 2019, including interim periods within those fiscal years. Assuming the Company remains an emerging growth company, the new authoritative guidance will be effective for reporting periods after January 1, 2021. The Company is still evaluating the effects this ASU will have on the Company’s Consolidated Financial Statements. While the Company has not quantified the impact of this ASU, it does expect changing from the current incurred loss model to an expected loss model will result in an earlier recognition of losses.
Statement of Cash Flows (Topic 230) In August 2016, FASB issued ASU No. 2016-15, Classification of Certain Cash Receipts and Cash Payments. There is diversity in practice in how certain cash receipts and cash payments are presented and classified in the statement of cash flows under Topic 230 and other Topics. This
F-24
Table of Contents
BYLINE BANCORP, INC. AND SUBSIDIARIES
NOTES TO CONSOLIDATED FINANCIAL STATEMENTS
(Table dollars in thousands, except share and per share data)
Note 2—Recently Issued Accounting Pronouncements (Continued)
ASU addresses eight specific cash flow issues with the objective of reducing the existing diversity in practice. Those eight issues are (1) debt prepayment or debt extinguishment costs, (2) settlement of zero-coupon debt instruments or other debt instruments with coupon interest rates that are insignificant in relation to the effective interest rate of the borrowing, (3) contingent consideration payments made after a business combination, (4) proceeds from the settlement of insurance claims, (5) proceeds from the settlement of corporate-owned life insurance policies, including bank-owned life insurance policies, (6) distributions received from equity method investees, (7) beneficial interests in securitization transactions, and (8) separately identifiable cash flows and application of the predominance principle. Current GAAP either is unclear or does not include specific guidance on these eight cash flow classification issues. These amendments provide guidance for each of the eight issues, thereby reducing current and potential future diversity in practice. The amendments in this ASU are effective for fiscal years beginning after December 15, 2017, and interim periods within those fiscal years. Early adoption is permitted, including adoption in an interim period. Assuming the Company remains an emerging growth company, the new authoritative guidance will be effective for reporting periods after January 1, 2019. The Company is currently evaluating the provisions of ASU No. 2016-15 to determine the potential impact the new standard will have on the Company’s Consolidated Financial Statements.
In November 2016, the FASB issued ASU No. 2016-18, Statement of Cash Flows (230), Restricted Cash. The ASU will require that a statement of cash flows explain the change during the period in the total of cash, cash equivalents, and amounts generally described as restricted cash or restricted cash equivalents. Therefore, amounts generally described as restricted cash and restricted cash equivalents should be included with cash and cash equivalents when reconciling the beginning-of-period and end-of-period total amounts shown on the statement of cash flows. The amendments in this update apply to all entities that have restricted cash or restricted cash equivalents and are required to present a statement of cash flows under Topic 230. The amendment is effective for annual reporting periods beginning after December 15, 2017, and interim periods within those fiscal years. Early adoption of the update is permitted. Assuming the Company remains an emerging growth company, the new authoritative guidance will be effective for reporting periods after January 1, 2019. The Company does not expect this ASU to have a material impact on the Company’s Consolidated Financial Statements.
Income Taxes (Topic 740) In October 2016, the FASB issued ASU No. 2016-16, Income Taxes, Intra-Entity Transfers of Assets Other Than Inventory. The ASU was issued to improve the accounting for income tax consequences of intra-entity transfers of assets other than inventory. Current GAAP prohibits the recognition of current and deferred income taxes for an intra-entity asset transfer until the asset has been sold to an outside party; this update clarifies that an entity should recognize the income tax consequences of an intra-entity transfer of assets other than inventory when the transfer occurs. The amendment is effective for annual reporting periods beginning after December 15, 2017, and interim periods within those fiscal years. Early adoption of the update is permitted. Assuming the Company remains an emerging growth company, the new authoritative guidance will be effective for reporting periods after January 1, 2019. The Company does not expect this ASU to have a material impact on the Company’s Consolidated Financial Statements.
Consolidation (Topic 810) In October 2016, the FASB issued ASU No. 2016-17, Consolidation, Interests Held through Related Parties That Are under Common Control. The ASU was issued to amend the consolidation guidance on how a reporting entity that is the single decision maker of a variable interest entity (“VIE”) should treat indirect interests in the entity held through related parties that are under common control with the reporting entity when determining whether it is the primary beneficiary of that VIE. The primary beneficiary of a VIE is the reporting entity that has a controlling financial interest in a VIE and, therefore,
F-25
Table of Contents
BYLINE BANCORP, INC. AND SUBSIDIARIES
NOTES TO CONSOLIDATED FINANCIAL STATEMENTS
(Table dollars in thousands, except share and per share data)
Note 2—Recently Issued Accounting Pronouncements (Continued)
consolidates the VIE. A reporting entity has an indirect interest in a VIE if it has a direct interest in a related party that, in turn, has a direct interest in the VIE. The amendment is effective for annual reporting periods beginning after December 15, 2016, and interim periods within those fiscal years. Early adoption of the update is permitted. The Company adopted this new authoritative guidance on January 1, 2017 and it did not have an impact on the Company’s Consolidated Financial Statements.
Business Combinations (Topic 805) In January 2017, the FASB issued ASU No. 2017-01, Clarifying the Definition of a Business. The guidance clarifies the definition of a business to assist entities with evaluating whether transactions should be accounted for as acquisitions or disposals of assets or businesses. This guidance is effective for annual and interim periods beginning after December 15, 2017. Early adoption is permitted. Assuming the Company remains an emerging growth company, the new authoritative guidance will be effective for reporting periods after January 1, 2019. The Company does not expect a material impact of this ASU on the Company’s Consolidated Financial Statements.
Intangibles—Goodwill and Other (Topic 350) In January 2017, FASB issued ASU No. 2017-04, Simplifying the Test for Goodwill Impairment. The amendments in this ASU are intended to reduce the cost and complexity of the goodwill impairment test by eliminating step two from the impairment test. The amendments modify the concept of impairment from the condition that exists when the carrying amount of goodwill exceeds its implied fair value to the condition that exists when the carrying amount of a reporting unit exceeds its fair value. Under the amendments in this ASU, an entity will perform its annual, or interim, goodwill impairment test by comparing the fair value of the reporting unit with its carrying amount. An impairment charge should be recognized for the amount which the carrying amount exceeds the reporting unit’s fair value; however, the loss recognized should not exceed the total amount of goodwill allocated to that reporting unit. The amendments in this ASU are effective for the Company’s annual or any interim goodwill impairment test in fiscal years beginning after December 15, 2019. Early adoption is permitted for interim or annual goodwill impairment tests performed on testing dates after January 1, 2017. The Company is early adopting these amendments in 2017 and does not expect a material impact on the Company’s Consolidated Financial Statements.
Nonrefundable Fees and Other Costs (Subtopic 310-20) In March 2017, FASB issued ASU No. 2017-08, Receivables—Nonrefundable Fees and Other Costs. The amendments in the ASU shorten the amortization period for certain callable debt securities held at a premium at the earliest call date. Under current GAAP, the Company amortizes the premium as an adjustment of yield over the contractual life of the instrument. As a result, upon exercise of a call on a callable debt security held at a premium, the unamortized premium is charged to earnings. The ASU shortens the amortization period for certain callable debt securities held at a premium and requires the premium to be amortized to the earliest call date. However, the amendments do not require an accounting change for securities held at a discount; the discount continues to be amortized to maturity. The amendments are effective for annual periods beginning after December 15, 2019, and interim periods within annual periods beginning after December 15, 2020. Early adoption is permitted. The Company is required to apply the amendments on a modified retrospective basis through a cumulative-effect adjustment directly to retained earnings as of the beginning of the period of adoption. Assuming the Company remains an emerging growth company, the new authoritative guidance will be effective for reporting periods after January 1, 2020. The Company is currently evaluating the provisions of ASU No. 2017-08 to determine the potential impact the new standard will have on the Company’s Consolidated Financial Statements.
F-26
Table of Contents
BYLINE BANCORP, INC. AND SUBSIDIARIES
NOTES TO CONSOLIDATED FINANCIAL STATEMENTS
(Table dollars in thousands, except share and per share data)
Note 3—Acquisition of a Business
On October 14, 2016, the Company acquired stock of Ridgestone and its subsidiaries under the terms of a definitive merger agreement (“Agreement”) dated June 9, 2016. Ridgestone operated two wholly-owned subsidiaries, Ridgestone Bank and RidgeStone Capital Trust I, and specializes in government guaranteed lending as a participant in the SBA and USDA lending programs. Ridgestone provided financial services through its two full-service banking offices in Brookfield, Wisconsin and Schaumburg, Illinois. In addition, Ridgestone had loan production offices located in Wisconsin (Green Bay and Wausau), Indiana (Indianapolis) and California (Newport Beach).
Under the terms of the Agreement, each Ridgestone common share was converted into the right to receive, at the election of the shareholder (subject to proration as outlined in the Agreement), either cash or Company common stock, or the combination of both. Total consideration included aggregate cash in the amount of $36.8 million and the issuance of 4,199,791 shares of the Company’s common stock valued at $16.25 per common share. The transaction resulted in goodwill of $26.3 million, which is nondeductible for tax purposes, as this acquisition was a nontaxable transaction. Goodwill represents the premium paid over the fair value of the net tangible and intangible assets acquired and reflects related synergies expected from the combined operations. Acquisition advisory expenses related to the Ridgestone acquisition of $1.6 million are reflected in non-interest expense on the Consolidated Statements of Operations. Stock issuance costs were not material. There were no contingent assets or liabilities arising from the acquisition.
The acquisition of Ridgestone was accounted for using the acquisition method of accounting in accordance with ASC 805. Assets acquired, liabilities assumed and consideration exchanged were recorded at their respective acquisition date fair values. Determining the fair value of assets and liabilities involves significant judgment regarding methods and assumptions used to calculate estimated fair values. Fair values are preliminary and subject to refinement for up to one year after the closing date of the acquisition as additional information regarding the closing date fair values become available. Fair values are preliminary estimates due to deferred tax assets and deferred tax liabilities.
F-27
Table of Contents
BYLINE BANCORP, INC. AND SUBSIDIARIES
NOTES TO CONSOLIDATED FINANCIAL STATEMENTS
(Table dollars in thousands, except share and per share data)
Note 3—Acquisition of a Business (Continued)
The following table presents a summary of the estimates of fair values of assets acquired and liabilities assumed as of the acquisition date:
| Assets |
||||
| Cash and cash equivalents |
$ | 25,480 | ||
| Securities available-for-sale |
27,662 | |||
| Restricted stock |
931 | |||
| Loans held for sale |
15,363 | |||
| Loans |
351,820 | |||
| Servicing assets |
20,295 | |||
| Premises and equipment |
2,011 | |||
| Other real estate owned |
1,525 | |||
| Other intangible assets |
486 | |||
| Bank-owned life insurance |
2,352 | |||
| Other assets |
8,228 | |||
|
|
|
|||
| Total assets acquired |
456,153 | |||
| Liabilities |
||||
| Deposits |
361,370 | |||
| Federal Home Loan Bank advances |
9,773 | |||
| Junior subordinated debentures |
1,339 | |||
| Accrued expenses and other liabilities |
4,958 | |||
|
|
|
|||
| Total liabilities assumed |
377,440 | |||
|
|
|
|||
| Net assets acquired |
$ | 78,713 | ||
|
|
|
|||
| Consideration paid |
||||
| Common stock (4,199,791 shares issued at $16.25 per share) |
68,247 | |||
| Cash paid |
36,753 | |||
|
|
|
|||
| Total consideration paid |
105,000 | |||
|
|
|
|||
| Goodwill |
$ | 26,287 | ||
|
|
|
The following table presents the acquired non-impaired loans as of the acquisition date:
| Fair value |
$ | 312,166 | ||
| Gross contractual amounts receivable |
450,292 | |||
| Estimate of contractual cash flows not expected to be collected(1) |
19,661 | |||
| Estimate of contractual cash flows expected to be collected |
430,631 |
| (1) | Includes interest payments not expected to be collected due to loan prepayments as well as principal and interest payments not expected to be collected due to customer default. |
The discount on the acquired non-impaired loans is being accreted into income over the life of the loans on an effective yield basis.
The following table provides the unaudited pro forma information for the results of operations for the years ended December 31, 2016 and 2015, as if the acquisition had occurred on January 1, 2015. The pro forma
F-28
Table of Contents
BYLINE BANCORP, INC. AND SUBSIDIARIES
NOTES TO CONSOLIDATED FINANCIAL STATEMENTS
(Table dollars in thousands, except share and per share data)
Note 3—Acquisition of a Business (Continued)
results combine the historical results of Ridgestone into the Company’s Consolidated Statements of Operations, including the impact of certain acquisition accounting adjustments, which includes loan discount accretion, intangible assets amortization, deposit premium accretion and borrowing discount amortization. The pro forma results have been prepared for comparative purposes only and are not necessarily indicative of the results that would have been obtained had the acquisition actually occurred on January 1, 2015. No assumptions have been applied to the pro forma results of operations regarding possible revenue enhancements, provision for credit losses, expense efficiencies or asset dispositions. The acquisition-related expenses that have been recognized are included in net income in the following table.
|
Years ended December 31, |
||||||||
| 2016 |
2015 |
|||||||
| Total revenues (net interest income and non-interest income) |
$ | 171,059 | $ | 151,054 | ||||
| Net income (loss) |
$ | 82,252 | $ | (1,437 | ) | |||
| Earnings per share—basic |
$ | 3.54 | $ | (0.07 | ) | |||
| Earnings per share—diluted |
$ | 3.50 | $ | (0.07 | ) | |||
The operating results of the Company include the operating results produced by the acquired assets and assumed liabilities of Ridgestone for period from October 15, 2016 through December 31, 2016. Revenues and earnings of the acquired company since the acquisition date have not been disclosed as it is not practicable as Ridgestone was merged into the Company and separate financial information is not readily available.
Note 4—Securities
The following tables summarize the amortized cost and fair values of securities available-for-sale and securities held-to-maturity at December 31, 2016 and 2015 and the corresponding amounts of gross unrealized gains and losses:
| 2016 |
Amortized |
Gross |
Gross |
Fair Value |
||||||||||||
|
Available-for-sale |
||||||||||||||||
| U.S. Treasury Notes |
$ | 14,995 | $ | 4 | $ | (79 | ) | $ | 14,920 | |||||||
| U.S. Government agencies |
60,180 | — | (1,323 | ) | 58,857 | |||||||||||
| Obligations of states, municipalities, and political subdivisions |
16,271 | 60 | (272 | ) | 16,059 | |||||||||||
| Residential mortgage-backed securities |
||||||||||||||||
| Agency |
376,800 | — | (8,640 | ) | 368,160 | |||||||||||
| Non-agency |
20,107 | — | (174 | ) | 19,933 | |||||||||||
| Commercial mortgage-backed securities |
||||||||||||||||
| Agency |
78,954 | — | (1,551 | ) | 77,403 | |||||||||||
| Non-agency |
32,061 | — | (1,009 | ) | 31,052 | |||||||||||
| Corporate securities |
17,065 | 350 | (86 | ) | 17,329 | |||||||||||
| Other securities |
4,161 | 742 | (56 | ) | 4,847 | |||||||||||
|
|
|
|
|
|
|
|
|
|||||||||
| Total |
$ | 620,594 | $ | 1,156 | $ | (13,190 | ) | $ | 608,560 | |||||||
|
|
|
|
|
|
|
|
|
|||||||||
F-29
Table of Contents
BYLINE BANCORP, INC. AND SUBSIDIARIES
NOTES TO CONSOLIDATED FINANCIAL STATEMENTS
(Table dollars in thousands, except share and per share data)
Note 4—Securities (Continued)
| Amortized |
Gross |
Gross |
Fair Value |
|||||||||||||
|
Held-to-maturity |
||||||||||||||||
| Obligations of states, municipalities, and political subdivisions |
$ | 24,878 | $ | 105 | $ | (229 | ) | $ | 24,754 | |||||||
| Residential mortgage-backed securities |
||||||||||||||||
| Agency |
67,692 | 35 | (283 | ) | 67,444 | |||||||||||
| Non-agency |
46,276 | 50 | (442 | ) | 45,884 | |||||||||||
|
|
|
|
|
|
|
|
|
|||||||||
| Total |
$ | 138,846 | $ | 190 | $ | (954 | ) | $ | 138,082 | |||||||
|
|
|
|
|
|
|
|
|
|||||||||
| 2015 |
Amortized |
Gross |
Gross |
Fair Value |
||||||||||||
|
Available-for-sale |
||||||||||||||||
| U.S. Treasury Notes |
$ | 30,580 | $ | — | $ | (235 | ) | $ | 30,345 | |||||||
| U.S. Government agencies |
84,368 | 9 | (764 | ) | 83,613 | |||||||||||
| Obligations of states, municipalities, and political subdivisions |
20,687 | 151 | (86 | ) | 20,752 | |||||||||||
| Residential mortgage-backed securities |
||||||||||||||||
| Agency |
593,391 | 184 | (5,241 | ) | 588,334 | |||||||||||
| Non-agency |
— | — | — | — | ||||||||||||
| Commercial mortgage-backed securities |
||||||||||||||||
| Agency |
31,514 | — | (323 | ) | 31,191 | |||||||||||
| Non-agency |
— | — | — | — | ||||||||||||
| Corporate securities |
7,801 | — | (105 | ) | 7,696 | |||||||||||
| Other securities |
5,098 | 733 | (30 | ) | 5,801 | |||||||||||
|
|
|
|
|
|
|
|
|
|||||||||
| Total |
$ | 773,439 | $ | 1,077 | $ | (6,784 | ) | $ | 767,732 | |||||||
|
|
|
|
|
|
|
|
|
|||||||||
| Amortized |
Gross |
Gross |
Fair Value |
|||||||||||||
|
Held-to-maturity |
||||||||||||||||
| Obligations of states, municipalities, and political subdivisions |
$ | 25,081 | $ | 310 | $ | (142 | ) | $ | 25,249 | |||||||
| Residential mortgage-backed securities |
||||||||||||||||
| Agency |
86,379 | 8 | (701 | ) | 85,686 | |||||||||||
| Non-agency |
— | — | — | — | ||||||||||||
|
|
|
|
|
|
|
|
|
|||||||||
| Total |
$ | 111,460 | $ | 318 | $ | (843 | ) | $ | 110,935 | |||||||
|
|
|
|
|
|
|
|
|
|||||||||
The Company did not classify securities as trading during 2016 and 2015.
F-30
Table of Contents
BYLINE BANCORP, INC. AND SUBSIDIARIES
NOTES TO CONSOLIDATED FINANCIAL STATEMENTS
(Table dollars in thousands, except share and per share data)
Note 4—Securities (Continued)
Gross unrealized losses and fair values, aggregated by investment category and length of time that individual securities have been in a continuous unrealized loss position as of December 31, 2016 and 2015 are summarized as follows:
| 2016 |
Less than 12 Months |
12 Months or Longer |
Total | |||||||||||||||||||||||||
| # of |
Fair Value |
Unrealized |
Fair |
Unrealized |
Fair Value |
Unrealized |
||||||||||||||||||||||
|
Available-for-sale |
||||||||||||||||||||||||||||
| U.S. Treasury Notes |
3 | $ | 9,918 | $ | (79 | ) | $ | — | $ | — | $ | 9,918 | $ | (79 | ) | |||||||||||||
| U.S. Government agencies |
10 | 58,857 | (1,323 | ) | — | — | 58,857 | (1,323 | ) | |||||||||||||||||||
| Obligations of states, municipalities and political subdivisions |
14 | 7,799 | (259 | ) | 115 | (13 | ) | 7,914 | (272 | ) | ||||||||||||||||||
| Residential mortgage-backed securities |
||||||||||||||||||||||||||||
| Agency |
41 | 364,713 | (8,483 | ) | 3,447 | (157 | ) | 368,160 | (8,640 | ) | ||||||||||||||||||
| Non-agency |
2 | 19,933 | (174 | ) | — | — | 19,933 | (174 | ) | |||||||||||||||||||
| Commercial mortgage-backed securities |
||||||||||||||||||||||||||||
| Agency |
8 | 70,762 | (1,488 | ) | 6,641 | (63 | ) | 77,403 | (1,551 | ) | ||||||||||||||||||
| Non-agency |
5 | 31,052 | (1,009 | ) | — | — | 31,052 | (1,009 | ) | |||||||||||||||||||
| Corporate securities |
4 | 5,097 | (78 | ) | 2,522 | (8 | ) | 7,619 | (86 | ) | ||||||||||||||||||
| Other securities |
1 | — | — | 1,994 | (56 | ) | 1,994 | (56 | ) | |||||||||||||||||||
|
|
|
|
|
|
|
|
|
|
|
|
|
|
|
|||||||||||||||
| Total |
88 | $ | 568,131 | $ | (12,893 | ) | $ | 14,719 | $ | (297 | ) | $ | 582,850 | $ | (13,190 | ) | ||||||||||||
|
|
|
|
|
|
|
|
|
|
|
|
|
|
|
|||||||||||||||
| Less than 12 Months |
12 Months or Longer |
Total | ||||||||||||||||||||||||||
| # of |
Fair Value |
Unrealized |
Fair |
Unrealized |
Fair Value |
Unrealized |
||||||||||||||||||||||
|
Held-to-maturity |
||||||||||||||||||||||||||||
| Obligations of states, municipalities, and political subdivisions |
22 | $ | 16,235 | $ | (229 | ) | $ | — | $ | — | $ | 16,235 | $ | (229 | ) | |||||||||||||
| Residential mortgage-backed securities |
||||||||||||||||||||||||||||
| Agency |
15 | 52,156 | (283 | ) | — | — | 52,156 | (283 | ) | |||||||||||||||||||
| Non-agency |
5 | 29,245 | (442 | ) | — | — | 29,245 | (442 | ) | |||||||||||||||||||
|
|
|
|
|
|
|
|
|
|
|
|
|
|
|
|||||||||||||||
| Total |
42 | $ | 97,636 | $ | (954 | ) | $ | — | $ | — | $ | 97,636 | $ | (954 | ) | |||||||||||||
|
|
|
|
|
|
|
|
|
|
|
|
|
|
|
|||||||||||||||
F-31
Table of Contents
BYLINE BANCORP, INC. AND SUBSIDIARIES
NOTES TO CONSOLIDATED FINANCIAL STATEMENTS
(Table dollars in thousands, except share and per share data)
Note 4—Securities (Continued)
| 2015 |
Less than 12 Months |
12 Months or Longer |
Total | |||||||||||||||||||||||||
| # of |
Fair Value |
Unrealized |
Fair |
Unrealized |
Fair Value |
Unrealized |
||||||||||||||||||||||
|
Available-for-sale |
||||||||||||||||||||||||||||
| U.S. Treasury Notes |
9 | $ | 30,345 | $ | (235 | ) | $ | — | $ | — | $ | 30,345 | $ | (235 | ) | |||||||||||||
| U.S. Government agencies |
15 | 72,576 | (764 | ) | — | — | 72,576 | (764 | ) | |||||||||||||||||||
| Obligations of states, municipalities and political subdivisions |
12 | 7,553 | (86 | ) | 25 | — | 7,578 | (86 | ) | |||||||||||||||||||
| Residential mortgage-backed securities |
||||||||||||||||||||||||||||
| Agency |
77 | 555,282 | (5,241 | ) | — | — | 555,282 | (5,241 | ) | |||||||||||||||||||
| Non-agency |
0 | — | — | — | — | — | — | |||||||||||||||||||||
| Commercial mortgage-backed securities |
||||||||||||||||||||||||||||
| Agency |
3 | 23,038 | (236 | ) | 8,153 | (87 | ) | 31,191 | (323 | ) | ||||||||||||||||||
| Non-agency |
0 | — | — | — | — | — | — | |||||||||||||||||||||
| Corporate securities |
3 | 7,696 | (105 | ) | — | — | 7,696 | (105 | ) | |||||||||||||||||||
| Other securities |
1 | 1,964 | (30 | ) | — | — | 1,964 | (30 | ) | |||||||||||||||||||
|
|
|
|
|
|
|
|
|
|
|
|
|
|
|
|||||||||||||||
| Total |
120 | $ | 698,454 | $ | (6,697 | ) | $ | 8,178 | $ | (87 | ) | $ | 706,632 | $ | (6,784 | ) | ||||||||||||
|
|
|
|
|
|
|
|
|
|
|
|
|
|
|
|||||||||||||||
| Less than 12 Months |
12 Months or Longer |
Total | ||||||||||||||||||||||||||
| # of |
Fair Value |
Unrealized |
Fair |
Unrealized |
Fair Value |
Unrealized |
||||||||||||||||||||||
|
Held-to-maturity |
||||||||||||||||||||||||||||
| Obligations of states, municipalities, and political subdivisions |
16 | $ | 12,342 | $ | (142 | ) | $ | — | $ | — | $ | 12,342 | $ | (142 | ) | |||||||||||||
| Residential mortgage-backed securities |
||||||||||||||||||||||||||||
| Agency |
17 | 81,899 | (701 | ) | — | — | 81,899 | (701 | ) | |||||||||||||||||||
| Non-agency |
0 | — | — | — | — | — | — | |||||||||||||||||||||
|
|
|
|
|
|
|
|
|
|
|
|
|
|
|
|||||||||||||||
| Total |
33 | $ | 94,241 | $ | (843 | ) | $ | — | $ | — | $ | 94,241 | $ | (843 | ) | |||||||||||||
|
|
|
|
|
|
|
|
|
|
|
|
|
|
|
|||||||||||||||
Certain securities have fair values less than amortized cost and, therefore, contain unrealized losses. At December 31, 2016, the Company evaluated the securities which had an unrealized loss for OTTI and determined all declines in value to be temporary. There were 130 investment securities with unrealized losses at December 31, 2016, of which only two had a continuous unrealized loss position for 12 consecutive months or longer that is greater than 5% of amortized cost. The Company anticipates full recovery of amortized cost with respect to these securities by maturity, or sooner in the event of a more favorable market interest rate environment. The Company does not intend to sell these securities and it is not more likely than not that the Company will be required to sell them before recovery of their amortized cost basis, which may be at maturity.
F-32
Table of Contents
BYLINE BANCORP, INC. AND SUBSIDIARIES
NOTES TO CONSOLIDATED FINANCIAL STATEMENTS
(Table dollars in thousands, except share and per share data)
Note 4—Securities (Continued)
The proceeds from all sales of securities were available-for-sale and the associated gains and losses for the years ended December 31, 2016 and 2015 are listed below:
| 2016 |
2015 |
|||||||
| Proceeds |
$ | 534,418 | $ | 511,028 | ||||
| Gross gains |
3,358 | 3,124 | ||||||
| Gross losses |
131 | 60 | ||||||
The amount of net gains reclassified from accumulated other comprehensive loss into earnings for the years ended December 31, 2016 and 2015 were $3.2 million and $3.1 million, respectively.
Securities pledged at December 31, 2016 and 2015 had carrying amounts of $178.6 million and $144.5 million, respectively. At December 31, 2016 and 2015, of those pledged, the carrying amounts of securities pledged as collateral for public fund deposits were $93.2 million and $128.4 million, respectively; for FHLB advances of $58.7 million and $0, respectively; and for customer repurchase agreements of $19.9 million and $16.0 million, respectively. Other securities were pledged for derivative positions, letters of credit and for purposes required or permitted by law. At December 31, 2016, and 2015, there were no holdings of securities of any one issuer, other than the U.S. Government and its agencies, in an amount greater than 10% of stockholders’ equity.
At December 31, 2016, the amortized cost and fair value of debt securities are shown by contractual maturity. Expected maturities may differ from contractual maturities if borrowers have the right to call or prepay obligations with or without call or prepayment penalties. Securities not due at a single maturity date are shown separately.
| Amortized |
Fair Value |
|||||||
|
Available-for-sale |
||||||||
| Due in one year or less |
$ | 200 | $ | 200 | ||||
| Due from one to five years |
60,670 | 60,436 | ||||||
| Due from five to ten years |
41,515 | 40,568 | ||||||
| Due after ten years |
7,195 | 7,032 | ||||||
| Mortgage-backed securities |
507,922 | 496,548 | ||||||
| Other securities with no defined maturity |
3,092 | 3,776 | ||||||
|
|
|
|
|
|||||
| Total |
$ | 620,594 | $ | 608,560 | ||||
|
|
|
|
|
|||||
|
Held-to-maturity |
||||||||
| Due from one to five years |
$ | 530 | $ | 523 | ||||
| Due from five to ten years |
11,938 | 11,801 | ||||||
| Due after ten years |
12,410 | 12,430 | ||||||
| Mortgage-backed securities |
113,968 | 113,328 | ||||||
|
|
|
|
|
|||||
| Total |
$ | 138,846 | $ | 138,082 | ||||
|
|
|
|
|
|||||
F-33
Table of Contents
BYLINE BANCORP, INC. AND SUBSIDIARIES
NOTES TO CONSOLIDATED FINANCIAL STATEMENTS
(Table dollars in thousands, except share and per share data)
Note 5—Loan and Lease Receivables
Outstanding loan and lease receivables as of December 31, 2016 and 2015 were categorized as follows:
| 2016 |
2015 |
|||||||
| Commercial real estate |
$ | 796,950 | $ | 534,249 | ||||
| Residential real estate |
610,699 | 484,085 | ||||||
| Construction, land development, and other land |
141,122 | 40,360 | ||||||
| Commercial and industrial |
439,476 | 165,709 | ||||||
| Installment and other |
2,917 | 1,899 | ||||||
| Lease financing receivables |
155,999 | 117,514 | ||||||
|
|
|
|
|
|||||
| Total loans and leases |
2,147,163 | 1,343,816 | ||||||
| Net unamortized deferred fees and costs |
(2,119 | ) | (418 | ) | ||||
| Initial direct costs |
2,967 | 2,039 | ||||||
| Allowance for loan and lease losses |
(10,923 | ) | (7,632 | ) | ||||
|
|
|
|
|
|||||
| Net loans and leases |
$ | 2,137,088 | $ | 1,337,805 | ||||
|
|
|
|
|
|||||
| 2016 |
2015 |
|||||||
| Lease financing receivables |
||||||||
| Net minimum lease payments |
$ | 168,345 | $ | 126,159 | ||||
| Unguaranteed residual values |
1,787 | 2,099 | ||||||
| Unearned income |
(14,133 | ) | (10,744 | ) | ||||
|
|
|
|
|
|||||
| Total lease financing receivables |
155,999 | 117,514 | ||||||
| Initial direct costs |
2,967 | 2,039 | ||||||
|
|
|
|
|
|||||
| Lease financial receivables before allowance for lease losses |
$ | 158,966 | $ | 119,553 | ||||
|
|
|
|
|
|||||
At December 31, 2016 and 2015, total loans and leases included U.S. Government guaranteed loans of $332.9 million and $2.6 million, respectively. At December 31, 2016 and 2015, installment and other loans included overdraft deposits of $1.0 million and $1.1 million, respectively, which were reclassified as loans. At December 31, 2016 and 2015, loans and loans held for sale pledged as security for borrowings were $507.2 million and $545.3 million, respectively. Total loans and leases consist of originated loans and leases, acquired impaired loans and acquired non-impaired loans and leases.
The minimum annual lease payments for lease financing receivables as of December 31, 2016 are summarized as follows:
|
Minimum lease |
||||
| 2017 |
$ | 58,780 | ||
| 2018 |
46,929 | |||
| 2019 |
33,109 | |||
| 2020 |
20,583 | |||
| 2021 |
8,031 | |||
| Thereafter |
913 | |||
|
|
|
|||
| Total |
$ | 168,345 | ||
|
|
|
|||
F-34
Table of Contents
BYLINE BANCORP, INC. AND SUBSIDIARIES
NOTES TO CONSOLIDATED FINANCIAL STATEMENTS
(Table dollars in thousands, except share and per share data)
Note 5—Loan and Lease Receivables (Continued)
Originated loans and leases represent originations following a business combination. Acquired impaired loans are loans acquired from a business combination with evidence of credit quality deterioration and are accounted for under ASC 310-30. Acquired non-impaired loans and leases represent loans and leases acquired from a business combination without evidence of credit quality deterioration and are accounted for under ASC 310-20. Leases and revolving loans do not qualify to be accounted for as acquired impaired loans and are accounted for under ASC 310-20. The following tables summarize the balances for each respective loan and lease category as of December 31, 2016 and 2015:
| 2016 |
Originated |
Acquired |
Acquired |
Total |
||||||||||||
| Commercial real estate |
$ | 338,752 | $ | 207,303 | $ | 250,289 | $ | 796,344 | ||||||||
| Residential real estate |
394,168 | 175,717 | 40,853 | 610,738 | ||||||||||||
| Construction, land development, and other land |
119,357 | 6,979 | 14,430 | 140,766 | ||||||||||||
| Commercial and industrial |
309,097 | 13,464 | 115,677 | 438,238 | ||||||||||||
| Installment and other |
2,021 | 574 | 364 | 2,959 | ||||||||||||
| Lease financing receivables |
118,493 | — | 40,473 | 158,966 | ||||||||||||
|
|
|
|
|
|
|
|
|
|||||||||
| Total loans and leases |
$ | 1,281,888 | $ | 404,037 | $ | 462,086 | $ | 2,148,011 | ||||||||
|
|
|
|
|
|
|
|
|
|||||||||
| 2015 |
Originated |
Acquired |
Acquired |
Total |
||||||||||||
| Commercial real estate |
$ | 201,586 | $ | 243,964 | $ | 88,146 | $ | 533,696 | ||||||||
| Residential real estate |
215,388 | 223,738 | 45,208 | 484,334 | ||||||||||||
| Construction, land development, and other land |
29,225 | 8,634 | 2,373 | 40,232 | ||||||||||||
| Commercial and industrial |
146,858 | 9,570 | 9,268 | 165,696 | ||||||||||||
| Installment and other |
544 | 1,005 | 377 | 1,926 | ||||||||||||
| Lease financing receivables |
69,416 | — | 50,137 | 119,553 | ||||||||||||
|
|
|
|
|
|
|
|
|
|||||||||
| Total loans and leases |
$ | 663,017 | $ | 486,911 | $ | 195,509 | $ | 1,345,437 | ||||||||
|
|
|
|
|
|
|
|
|
|||||||||
Acquired impaired loans—As part of the Ridgestone acquisition, the Bank acquired impaired loans that are accounted for under ASC 310-30 in the amount of $39.7 million. Refer to Note 3—Acquisition of a Business for additional information regarding the transaction. There were no other acquired impaired loans purchased during 2016 or 2015. The following table presents a reconciliation of the undiscounted contractual cash flows, non-accretable difference, accretable yield, and fair value of acquired impaired loans as of the acquisition date of October 14, 2016:
| Undiscounted contractual cash flows |
$ | 66,488 | ||
| Undiscounted cash flows not expected to be collected (non-accretable difference) |
(19,918 | ) | ||
|
|
|
|||
| Undiscounted cash flows expected to be collected |
46,570 | |||
| Accretable yield at acquisition |
(6,916 | ) | ||
|
|
|
|||
| Estimated fair value of impaired loans acquired at acquisition |
$ | 39,654 | ||
|
|
|
The outstanding balance and carrying amount of all acquired impaired loans are summarized below. The balances do not include an allowance for loan and lease losses of $1.6 million and $3.3 million, respectively, at December 31, 2016 and 2015.
F-35
Table of Contents
BYLINE BANCORP, INC. AND SUBSIDIARIES
NOTES TO CONSOLIDATED FINANCIAL STATEMENTS
(Table dollars in thousands, except share and per share data)
Note 5—Loan and Lease Receivables (Continued)
| 2016 |
2015 |
|||||||||||||||
| Outstanding |
Carrying |
Outstanding |
Carrying |
|||||||||||||
| Commercial real estate |
$ | 278,893 | $ | 207,303 | $ | 305,979 | $ | 243,964 | ||||||||
| Residential real estate |
236,384 | 175,717 | 287,760 | 223,738 | ||||||||||||
| Construction, land development, and other land |
15,292 | 6,979 | 20,362 | 8,634 | ||||||||||||
| Commercial and industrial |
23,164 | 13,464 | 10,803 | 9,570 | ||||||||||||
| Installment and other |
1,976 | 574 | 2,467 | 1,005 | ||||||||||||
|
|
|
|
|
|
|
|
|
|||||||||
| Total loans |
$ | 555,709 | $ | 404,037 | $ | 627,371 | $ | 486,911 | ||||||||
|
|
|
|
|
|
|
|
|
|||||||||
The following table summarizes the changes in accretable yield for acquired impaired loans for the years ended December 31, 2016 and 2015:
| 2016 |
2015 |
|||||||
| Beginning balance |
$ | 43,915 | $ | 68,238 | ||||
| Additions |
6,916 | — | ||||||
| Accretion to interest income |
(26,208 | ) | (35,547 | ) | ||||
| Reclassification from nonaccretable difference |
12,245 | 11,224 | ||||||
|
|
|
|
|
|||||
| Ending balance |
$ | 36,868 | $ | 43,915 | ||||
|
|
|
|
|
|||||
Acquired non-impaired loans and leases—The Company acquired non-impaired loans as part of the Ridgestone acquisition in the amount of $312.2 million. Refer to Note 3—Acquisition of a Business for additional information regarding the transaction.
The unpaid principal balance and carrying value for acquired non-impaired loans and leases at December 31, 2016 and 2015 were as follows:
| 2016 |
2015 |
|||||||||||||||
|
Unpaid |
Carrying |
Unpaid |
Carrying |
|||||||||||||
| Commercial real estate |
$ | 259,055 | $ | 250,289 | $ | 87,708 | $ | 88,146 | ||||||||
| Residential real estate |
41,282 | 40,853 | 45,471 | 45,208 | ||||||||||||
| Construction, land development, and other land |
14,619 | 14,430 | 2,432 | 2,373 | ||||||||||||
| Commercial and industrial |
125,806 | 115,677 | 9,369 | 9,268 | ||||||||||||
| Installment and other |
402 | 364 | 390 | 377 | ||||||||||||
| Lease financing receivables |
40,205 | 40,473 | 49,420 | 50,137 | ||||||||||||
|
|
|
|
|
|
|
|
|
|||||||||
| Total acquired non-impaired loans and leases |
$ | 481,369 | $ | 462,086 | $ | 194,790 | $ | 195,509 | ||||||||
|
|
|
|
|
|
|
|
|
|||||||||
Note 6—Allowance for Loan and Lease Losses and Reserve for Unfunded Commitments
Loans and leases considered for inclusion in the allowance for loan and lease losses include acquired non-impaired loans and leases, those acquired impaired loans with credit deterioration after acquisition or recapitalization, and originated loans and leases. Although all acquired loans and leases are included in the following table, only those with credit deterioration subsequent to acquisition date are actually included in the allowance for loan and lease losses.
F-36
Table of Contents
BYLINE BANCORP, INC. AND SUBSIDIARIES
NOTES TO CONSOLIDATED FINANCIAL STATEMENTS
(Table dollars in thousands, except share and per share data)
Note 6—Allowance for Loan and Lease Losses and Reserve for Unfunded Commitments (Continued)
The following tables summarize the balance and activity within the allowance for loan and lease losses, the components of the allowance for loan and lease losses in terms of loans and leases individually and collectively evaluated for impairment, and corresponding loan and lease balances by type as of and for the years ended December 31, 2016 and 2015:
| 2016 |
Commercial Real Estate |
Residential |
Construction, |
Commercial |
Installment |
Lease |
Total |
|||||||||||||||||||||
| Allowance for loan and lease losses |
||||||||||||||||||||||||||||
| Beginning balance |
$ | 2,280 | $ | 2,981 | $ | 232 | $ | 1,403 | $ | 357 | $ | 379 | $ | 7,632 | ||||||||||||||
| Provisions |
4,032 | 135 | 605 | 2,869 | (11 | ) | 2,722 | 10,352 | ||||||||||||||||||||
| Charge-offs |
(4,367 | ) | (633 | ) | (95 | ) | (76 | ) | (12 | ) | (2,634 | ) | (7,817 | ) | ||||||||||||||
| Recoveries |
— | — | — | — | — | 756 | 756 | |||||||||||||||||||||
|
|
|
|
|
|
|
|
|
|
|
|
|
|
|
|||||||||||||||
| Ending balance |
$ | 1,945 | $ | 2,483 | $ | 742 | $ | 4,196 | $ | 334 | $ | 1,223 | $ | 10,923 | ||||||||||||||
|
|
|
|
|
|
|
|
|
|
|
|
|
|
|
|||||||||||||||
| Ending balance: |
||||||||||||||||||||||||||||
| Individually evaluated for impairment |
$ | — | $ | 293 | $ | — | $ | 396 | $ | 328 | $ | — | $ | 1,017 | ||||||||||||||
| Collectively evaluated for impairment |
1,456 | 1,743 | 742 | 3,126 | 5 | 1,223 | 8,295 | |||||||||||||||||||||
| Loans acquired with deteriorated credit quality |
489 | 447 | — | 674 | 1 | — | 1,611 | |||||||||||||||||||||
|
|
|
|
|
|
|
|
|
|
|
|
|
|
|
|||||||||||||||
| Total allowance for loan and lease losses |
$ | 1,945 | $ | 2,483 | $ | 742 | $ | 4,196 | $ | 334 | $ | 1,223 | $ | 10,923 | ||||||||||||||
|
|
|
|
|
|
|
|
|
|
|
|
|
|
|
|||||||||||||||
| Commercial |
Residential |
Construction, |
Commercial |
Installment |
Lease |
Total |
||||||||||||||||||||||
| Loans and leases ending balance: |
||||||||||||||||||||||||||||
| Individually evaluated for impairment |
$ | 8,916 | $ | 1,300 | $ | — | $ | 1,382 | $ | 328 | $ | — | $ | 11,926 | ||||||||||||||
| Collectively evaluated for impairment |
580,125 | 433,721 | 133,787 | 423,392 | 2,057 | 158,966 | 1,732,048 | |||||||||||||||||||||
| Loans acquired with deteriorated credit quality |
207,303 | 175,717 | 6,979 | 13,464 | 574 | — | 404,037 | |||||||||||||||||||||
|
|
|
|
|
|
|
|
|
|
|
|
|
|
|
|||||||||||||||
| Total loans and leases evaluated for allowance for loan and lease losses |
$ | 796,344 | $ | 610,738 | $ | 140,766 | $ | 438,238 | $ | 2,959 | $ | 158,966 | $ | 2,148,011 | ||||||||||||||
|
|
|
|
|
|
|
|
|
|
|
|
|
|
|
|||||||||||||||
F-37
Table of Contents
BYLINE BANCORP, INC. AND SUBSIDIARIES
NOTES TO CONSOLIDATED FINANCIAL STATEMENTS
(Table dollars in thousands, except share and per share data)
Note 6—Allowance for Loan and Lease Losses and Reserve for Unfunded Commitments (Continued)
| 2015 |
Commercial |
Residential |
Construction, |
Commercial |
Installment |
Lease |
Total |
|||||||||||||||||||||
| Allowance for loan and lease losses |
||||||||||||||||||||||||||||
| Beginning balance |
$ | 1,112 | $ | 1,936 | $ | 834 | $ | 648 | $ | 121 | $ | 143 | $ | 4,794 | ||||||||||||||
| Provisions |
2,464 | 1,873 | (585 | ) | 782 | 237 | 2,195 | 6,966 | ||||||||||||||||||||
| Charge-offs |
(1,296 | ) | (828 | ) | (17 | ) | (30 | ) | (1 | ) | (2,187 | ) | (4,359 | ) | ||||||||||||||
| Recoveries |
— | — | — | 3 | — | 228 | 231 | |||||||||||||||||||||
|
|
|
|
|
|
|
|
|
|
|
|
|
|
|
|||||||||||||||
| Ending balance |
$ | 2,280 | $ | 2,981 | $ | 232 | $ | 1,403 | $ | 357 | $ | 379 | $ | 7,632 | ||||||||||||||
|
|
|
|
|
|
|
|
|
|
|
|
|
|
|
|||||||||||||||
| Ending balance: |
||||||||||||||||||||||||||||
| Individually evaluated for impairment |
$ | 1,076 | $ | 615 | $ | 137 | $ | 171 | $ | 327 | $ | — | $ | 2,326 | ||||||||||||||
| Collectively evaluated for impairment |
470 | 476 | 95 | 596 | — | 379 | 2,016 | |||||||||||||||||||||
| Loans acquired with deteriorated credit quality |
734 | 1,890 | — | 636 | 30 | — | 3,290 | |||||||||||||||||||||
|
|
|
|
|
|
|
|
|
|
|
|
|
|
|
|||||||||||||||
| Total allowance for loan and lease losses |
$ | 2,280 | $ | 2,981 | $ | 232 | $ | 1,403 | $ | 357 | $ | 379 | $ | 7,632 | ||||||||||||||
|
|
|
|
|
|
|
|
|
|
|
|
|
|
|
|||||||||||||||
| Commercial |
Residential |
Construction, |
Commercial |
Installment |
Lease |
Total |
||||||||||||||||||||||
| Loans and leases ending balance: |
||||||||||||||||||||||||||||
| Individually evaluated for impairment |
$ | 4,160 | $ | 4,042 | $ | 208 | $ | 171 | $ | 327 | $ | — | $ | 8,908 | ||||||||||||||
| Collectively evaluated for impairment |
285,571 | 256,555 | 31,390 | 155,955 | 594 | 119,553 | 849,618 | |||||||||||||||||||||
| Loans acquired with deteriorated credit quality |
243,964 | 223,738 | 8,634 | 9,570 | 1,005 | — | 486,911 | |||||||||||||||||||||
|
|
|
|
|
|
|
|
|
|
|
|
|
|
|
|||||||||||||||
| Total loans and leases evaluated for allowance for loan and lease losses |
$ | 533,695 | $ | 484,335 | $ | 40,232 | $ | 165,696 | $ | 1,926 | $ | 119,553 | $ | 1,345,437 | ||||||||||||||
|
|
|
|
|
|
|
|
|
|
|
|
|
|
|
|||||||||||||||
For acquired impaired loans, there was a net reversal of $1.7 million of the allowance for loan and lease losses during the year ended December 31, 2016. The Company increased the allowance for loan and leases losses by $1.4 million for the year ended December 31, 2015.
F-38
Table of Contents
BYLINE BANCORP, INC. AND SUBSIDIARIES
NOTES TO CONSOLIDATED FINANCIAL STATEMENTS
(Table dollars in thousands, except share and per share data)
Note 6—Allowance for Loan and Lease Losses and Reserve for Unfunded Commitments (Continued)
The following tables summarize the recorded investment, unpaid principal balance, related allowance, average recorded investment, and interest income recognized for loans and leases considered impaired as of December 31, 2016 and 2015, which excludes acquired impaired loans:
| 2016 |
Recorded |
Unpaid |
Related |
Average |
Interest |
|||||||||||||||
| With no related allowance recorded |
||||||||||||||||||||
| Commercial real estate |
$ | 8,916 | $ | 9,502 | $ | — | $ | 8,975 | $ | 305 | ||||||||||
| Residential real estate |
804 | 1,999 | — | 827 | 45 | |||||||||||||||
| Commercial and Industrial |
521 | 524 | — | 516 | (2 | ) | ||||||||||||||
| With an allowance recorded |
||||||||||||||||||||
| Residential real estate |
496 | 528 | 293 | 519 | 1 | |||||||||||||||
| Commercial and industrial |
861 | 869 | 396 | 914 | — | |||||||||||||||
| Installment and Other |
328 | 361 | 328 | 328 | 16 | |||||||||||||||
|
|
|
|
|
|
|
|
|
|
|
|||||||||||
| Total impaired loans |
$ | 11,926 | $ | 13,783 | $ | 1,017 | $ | 12,079 | $ | 365 | ||||||||||
|
|
|
|
|
|
|
|
|
|
|
|||||||||||
| 2015 |
Recorded |
Unpaid |
Related |
Average |
Interest |
|||||||||||||||
| With no related allowance recorded |
||||||||||||||||||||
| Commercial real estate |
$ | 1,362 | $ | 1,922 | $ | — | $ | 1,394 | $ | 64 | ||||||||||
| Residential real estate |
2,821 | 4,222 | — | 2,865 | 63 | |||||||||||||||
| With an allowance recorded |
||||||||||||||||||||
| Commercial real estate |
2,798 | 2,797 | 1,076 | 2,826 | 46 | |||||||||||||||
| Residential real estate |
1,221 | 1,216 | 615 | 1,250 | 15 | |||||||||||||||
| Construction, land development, and other land |
208 | 1,201 | 137 | 208 | — | |||||||||||||||
| Commercial and industrial |
171 | 171 | 171 | 185 | 1 | |||||||||||||||
| Installment and other |
327 | 335 | 327 | 327 | 23 | |||||||||||||||
|
|
|
|
|
|
|
|
|
|
|
|||||||||||
| Total impaired loans |
$ | 8,908 | $ | 11,864 | $ | 2,326 | $ | 9,055 | $ | 212 | ||||||||||
|
|
|
|
|
|
|
|
|
|
|
|||||||||||
For purposes of these tables, the unpaid principal balance represents the outstanding contractual balance. Impaired loans include loans that are individually evaluated for impairment as well as troubled debt restructurings for all loan categories. The sum of non-accrual loans and loans past due 90 days still on accrual will differ from the total impaired loan amount.
The Bank’s credit risk rating methodology assigns risk ratings from 1 to 10, where a higher rating represents higher risk. The risk rating categories are described by the following groupings:
Pass—Ratings 1—4 define the risk levels of borrowers and guarantors that offer a minimal to an acceptable level of risk.
Watch—A watch asset (rating of 5) has credit exposure that presents higher than average risk and warrants greater than routine attention by Bank personnel due to conditions affecting the borrower, the borrower’s industry or the economic environment.
F-39
Table of Contents
BYLINE BANCORP, INC. AND SUBSIDIARIES
NOTES TO CONSOLIDATED FINANCIAL STATEMENTS
(Table dollars in thousands, except share and per share data)
Note 6—Allowance for Loan and Lease Losses and Reserve for Unfunded Commitments (Continued)
Special Mention—A special mention asset (rating of 6) has potential weaknesses that deserve management’s close attention. If left uncorrected, these potential weaknesses may result in deterioration of the repayment prospects for the asset or in the Bank’s credit position at some future date.
Substandard Accrual—A substandard accrual asset (rating of 7) has well-defined weakness or weaknesses in cash flow and collateral coverage resulting in a distinct possibility that the Bank will sustain some loss if the deficiencies are not corrected. This classification may be used in limited cases, where despite credit severity, the borrower is current on payments and there is an agreed plan for credit remediation.
Substandard Non-Accrual—A substandard asset (rating of 8) has well-defined weakness or weaknesses in cash flow and collateral coverage resulting in the distinct possibility that the Bank will sustain some loss if the deficiencies are not corrected.
Doubtful—A doubtful asset (rating of 9) has all the weaknesses inherent in one classified substandard with the added characteristic that the weaknesses make collection or liquidation in full, on the basis of currently existing facts, conditions and values, highly questionable and improbable.
Loss—A loss asset (rating of 10) is considered uncollectible and of such little value that its continuance as a realizable asset is not warranted.
The following tables summarize the risk rating categories of the loans and leases considered for inclusion in the allowance for loan and lease losses calculation, excluding acquired impaired loans, as of December 31, 2016 and 2015:
| 2016 |
Commercial |
Residential |
Construction, |
Commercial |
Installment |
Lease |
Total |
|||||||||||||||||||||
| Pass |
$ | 536,499 | $ | 419,880 | $ | 129,732 | $ | 369,136 | $ | 2,052 | $ | 157,296 | $ | 1,614,595 | ||||||||||||||
| Watch |
38,707 | 10,885 | 2,897 | 52,872 | 4 | 324 | 105,689 | |||||||||||||||||||||
| Special Mention |
5,377 | 3,116 | 1,158 | 1,258 | 1 | 512 | 11,422 | |||||||||||||||||||||
| Substandard |
8,458 | 1,140 | — | 1,508 | 328 | 739 | 12,173 | |||||||||||||||||||||
| Doubtful |
— | — | — | — | — | 95 | 95 | |||||||||||||||||||||
| Loss |
— | — | — | — | — | — | — | |||||||||||||||||||||
|
|
|
|
|
|
|
|
|
|
|
|
|
|
|
|||||||||||||||
| Total |
$ | 589,041 | $ | 435,021 | $ | 133,787 | $ | 424,774 | $ | 2,385 | $ | 158,966 | $ | 1,743,974 | ||||||||||||||
|
|
|
|
|
|
|
|
|
|
|
|
|
|
|
|||||||||||||||
| 2015 |
Commercial |
Residential |
Construction, |
Commercial |
Installment |
Lease |
Total |
|||||||||||||||||||||
| Pass |
$ | 259,656 | $ | 236,255 | $ | 30,801 | $ | 148,577 | $ | 592 | $ | 118,486 | $ | 794,367 | ||||||||||||||
| Watch |
16,073 | 18,923 | 589 | 2,181 | — | 375 | 38,141 | |||||||||||||||||||||
| Special Mention |
10,833 | 1,997 | — | 5,075 | 2 | 254 | 18,161 | |||||||||||||||||||||
| Substandard |
3,170 | 3,411 | 208 | 293 | 327 | 331 | 7,740 | |||||||||||||||||||||
| Doubtful |
— | 10 | — | — | — | 107 | 117 | |||||||||||||||||||||
| Loss |
— | — | — | — | — | — | — | |||||||||||||||||||||
|
|
|
|
|
|
|
|
|
|
|
|
|
|
|
|||||||||||||||
| Total |
$ | 289,732 | $ | 260,596 | $ | 31,598 | $ | 156,126 | $ | 921 | $ | 119,553 | $ | 858,526 | ||||||||||||||
|
|
|
|
|
|
|
|
|
|
|
|
|
|
|
|||||||||||||||
F-40
Table of Contents
BYLINE BANCORP, INC. AND SUBSIDIARIES
NOTES TO CONSOLIDATED FINANCIAL STATEMENTS
(Table dollars in thousands, except share and per share data)
Note 6—Allowance for Loan and Lease Losses and Reserve for Unfunded Commitments (Continued)
The following tables summarize contractual past due and current loan information for acquired non-impaired and originated loans by category as of December 31, 2016 and 2015:
| 2016 |
30-59 Days |
60-89 Days |
Greater than |
Non-accrual |
Total |
Current |
Total |
|||||||||||||||||||||
| Commercial real estate |
$ | 2,944 | $ | 648 | $ | — | $ | 3,935 | $ | 7,527 | $ | 581,514 | $ | 589,041 | ||||||||||||||
| Residential real estate |
243 | — | — | 1,118 | 1,361 | 433,660 | 435,021 | |||||||||||||||||||||
| Construction, land development, and other land |
1,363 | — | — | — | 1,363 | 132,424 | 133,787 | |||||||||||||||||||||
| Commercial and industrial |
6,066 | 374 | — | 958 | 7,398 | 417,376 | 424,774 | |||||||||||||||||||||
| Installment and other |
— | — | — | 328 | 328 | 2,057 | 2,385 | |||||||||||||||||||||
| Lease Financing Receivables |
2,070 | 390 | — | 445 | 2,905 | 156,061 | 158,966 | |||||||||||||||||||||
|
|
|
|
|
|
|
|
|
|
|
|
|
|
|
|||||||||||||||
| Total |
$ | 12,686 | $ | 1,412 | $ | — | $ | 6,784 | $ | 20,882 | $ | 1,723,092 | $ | 1,743,974 | ||||||||||||||
|
|
|
|
|
|
|
|
|
|
|
|
|
|
|
|||||||||||||||
| 2015 |
30-59 Days |
60-89 Days |
Greater than |
Non-accrual |
Total |
Current |
Total |
|||||||||||||||||||||
| Commercial real estate |
$ | — | $ | — | $ | — | $ | 3,179 | $ | 3,179 | $ | 286,553 | $ | 289,732 | ||||||||||||||
| Residential real estate |
74 | 95 | — | 2,999 | 3,168 | 257,428 | 260,596 | |||||||||||||||||||||
| Construction, land development, and other land |
— | — | — | 208 | 208 | 31,390 | 31,598 | |||||||||||||||||||||
| Commercial and industrial |
— | — | — | 251 | 251 | 155,875 | 156,126 | |||||||||||||||||||||
| Installment and other |
— | 1 | — | 327 | 328 | 593 | 921 | |||||||||||||||||||||
| Lease Financing Receivables |
1,596 | 414 | — | 438 | 2,448 | 117,105 | 119,553 | |||||||||||||||||||||
|
|
|
|
|
|
|
|
|
|
|
|
|
|
|
|||||||||||||||
| Total |
$ | 1,670 | $ | 510 | $ | — | $ | 7,402 | $ | 9,582 | $ | 848,944 | $ | 858,526 | ||||||||||||||
|
|
|
|
|
|
|
|
|
|
|
|
|
|
|
|||||||||||||||
At December 31, 2016 and 2015, the Company had a recorded investment in troubled debt restructurings of $1.2 million and $2.7 million, respectively. The restructurings were granted due to borrower financial difficulty and provide for a modification of loan repayment terms. The Company has not allocated any specific allowance for these loans at December 31, 2016 and 2015. In addition, there were no commitments outstanding on troubled debt restructurings.
Loans modified as troubled debt restructurings that occurred during the years ended December 31, 2016 and 2015 did not result in any charge-offs or permanent reductions of the recorded investments in the loans. Troubled debt restructurings that subsequently defaulted within twelve months of the restructure date during the years ended December 31, 2016 and 2015 had a recorded investment of $477,000 and $750,000, respectively.
At December 31, 2016 and 2015, the reserve for unfunded commitments was $760,000 and $268,000, respectively. During the years ended December 31, 2016 and 2015, the provisions for unfunded commitments were $493,000 and $94,000, respectively. There were no charge-offs or recoveries related to the reserve for unfunded commitments during both periods.
F-41
Table of Contents
BYLINE BANCORP, INC. AND SUBSIDIARIES
NOTES TO CONSOLIDATED FINANCIAL STATEMENTS
(Table dollars in thousands, except share and per share data)
Note 7—Servicing Assets
As part of the Ridgestone acquisition, the Company acquired loan servicing assets. Refer to Note 3—Acquisition of a Business for additional information regarding the transaction. The Company did not hold any servicing assets as of December 31, 2015.
Loans serviced for others are not included in the Consolidated Statements of Financial Condition. The unpaid principal balances of these loans serviced for others were as follows of December 31, 2016:
| 2016 |
||||
| Loan portfolios serviced for: |
||||
| SBA |
$ | 911,803 | ||
| USDA |
106,125 | |||
|
|
|
|||
| Total |
$ | 1,017,928 | ||
|
|
|
|||
Activity for servicing assets and the related changes in fair value are as follows:
| 2016 |
||||
| Beginning balance |
$ | — | ||
| Acquired servicing assets at fair value |
20,295 | |||
| Additions, net |
539 | |||
| Changes in fair value |
257 | |||
|
|
|
|||
| Ending balance |
$ | 21,091 | ||
|
|
|
|||
Loan servicing income totaled $1.9 million for the year ended December 31, 2016.
The fair value of servicing rights is highly sensitive to changes in underlying assumptions. Changes in prepayment speed assumptions have the most significant impact on the fair value of servicing rights.
Generally, as interest rates rise on variable rate loans, loan prepayments increase due to an increase in refinance activity, which may result in a decrease in the fair value of servicing assets. Measurement of fair value is limited to the condition existing and the assumptions used as of a particular point in time, and those assumptions may change over time. Refer to Note 17—Fair Value Measurement for further details.
Note 8—Other Real Estate Owned
The following table presents the change in other real estate owned (“OREO”) for the years ended December 31, 2016 and 2015.
| 2016 |
2015 |
|||||||
| Beginning balance |
$ | 26,715 | $ | 56,181 | ||||
| Acquisition of OREO through business combination |
1,525 | — | ||||||
| Net additions to other real estate owned |
6,672 | 13,793 | ||||||
| Dispositions of OREO |
(17,389 | ) | (33,994 | ) | ||||
| Valuation adjustments |
(953 | ) | (9,265 | ) | ||||
|
|
|
|
|
|||||
| Ending balance |
$ | 16,570 | $ | 26,715 | ||||
|
|
|
|
|
|||||
F-42
Table of Contents
BYLINE BANCORP, INC. AND SUBSIDIARIES
NOTES TO CONSOLIDATED FINANCIAL STATEMENTS
(Table dollars in thousands, except share and per share data)
Note 9—Premises and Equipment
Classifications of premises and equipment as of December 31, 2016 and 2015 were as follows:
| 2016 |
2015 |
|||||||
| Premises |
$ | 53,495 | $ | 62,560 | ||||
| Furniture, fixtures and equipment |
7,214 | 4,231 | ||||||
| Leasehold improvements |
1,093 | 1,585 | ||||||
|
|
|
|
|
|||||
| Total cost |
61,802 | 68,376 | ||||||
| Less accumulated depreciation and amortization |
(9,780 | ) | (8,786 | ) | ||||
|
|
|
|
|
|||||
| Net book value of premises, furniture, fixtures, equipment, leasehold improvements |
52,022 | 59,590 | ||||||
| Construction in progress |
3,869 | 2,272 | ||||||
| Land |
46,183 | 53,312 | ||||||
|
|
|
|
|
|||||
| Premises and equipment, net |
$ | 102,074 | $ | 115,174 | ||||
|
|
|
|
|
|||||
During 2015, the Company approved the closure of sixteen retail branches based on a detailed assessment of the branch network and analysis of branch and market data. During 2016, twelve additional retail branches were also approved to be closed. Branches owned by the Company and actively marketed for sale were transferred to assets held for sale based on their carrying value or fair value, less estimated costs to sell. Assets are considered held for sale when management has approved the sale of the assets following a branch closure or other events. During 2016 and 2015, land and premises of $16.0 million and $2.3 million were transferred to assets held for sale, respectively. An assessment of the recoverability of other long-lived assets associated with all branches resulted in impairment losses of $408,000 and $687,000 during the years ended December 31, 2016 and 2015, respectively, which are reflected in non-interest expense.
Depreciation and amortization expense for the years ended December 31, 2016 and 2015 was $5.1 million and $5.8 million, respectively. Refer to Note 17—Commitments and Contingent Liabilities for additional discussion related to operating lease commitments.
Note 10—Goodwill, Core Deposit Intangible and Other Intangible Assets
The Company’s annual goodwill test was performed as of November 30, 2016. The Company determined that no impairment existed as of that date. Refer to Note 1—Business and Summary of Significant Accounting Policies for discussion of goodwill.
The following table summarizes the changes in the Company’s goodwill and core deposit intangible assets for the years ended December 31, 2016 and 2015:
| 2016 |
2015 |
|||||||||||||||
| Goodwill |
Core Deposit |
Goodwill |
Core Deposit |
|||||||||||||
| Beginning balance |
$ | 25,688 | $ | 22,275 | $ | 25,613 | $ | 25,245 | ||||||||
| Additions |
26,287 | 486 | 75 | — | ||||||||||||
| Amortization or accretion |
— | (2,985 | ) | — | (2,970 | ) | ||||||||||
|
|
|
|
|
|
|
|
|
|||||||||
| Ending balance |
$ | 51,975 | $ | 19,776 | $ | 25,688 | $ | 22,275 | ||||||||
|
|
|
|
|
|
|
|
|
|||||||||
| Accumulated amortization or accretion |
N/A | $ | 10,410 | N/A | $ | 7,425 | ||||||||||
| Weighted average remaining amortization or accretion period |
N/A | 6.6 Years | N/A | 7.5 Years | ||||||||||||
F-43
Table of Contents
BYLINE BANCORP, INC. AND SUBSIDIARIES
NOTES TO CONSOLIDATED FINANCIAL STATEMENTS
(Table dollars in thousands, except share and per share data)
Note 10—Goodwill, Core Deposit Intangible and Other Intangible Assets (Continued)
The Company has other intangible assets of $50,000 and $51,000 as of December 31, 2016 and 2015, respectively, related to trademark-related transactions. The increases in goodwill and core deposit intangible for the year ended December 31, 2016 resulted from the Ridgestone acquisition. The increase in goodwill during the year ended December 31, 2015 resulted in a measurement period adjustment related to finalizing the fair values of certain assets acquired and certain liabilities assumed in a business combination that occurred during 2014.
The following table presents the estimated amortization expense for core deposit intangible and other intangible assets recognized at December 31, 2016:
| Estimated |
||||
| 2017 |
$ | 3,072 | ||
| 2018 |
3,061 | |||
| 2019 |
3,050 | |||
| 2020 |
3,024 | |||
| 2021 |
3,017 | |||
| Thereafter |
4,602 | |||
|
|
|
|||
| Total |
$ | 19,826 | ||
|
|
|
|||
Note 11—Income Taxes
The following were the components of provision for income taxes for the years ended December 31, 2016 and 2015:
| 2016 |
2015 |
|||||||
| Current tax expense |
||||||||
| Federal |
$ | — | $ | 250 | ||||
| State and local |
— | 57 | ||||||
|
|
|
|
|
|||||
| Total current tax expense |
— | 307 | ||||||
| Deferred tax expense |
||||||||
| Federal |
478 | 4,929 | ||||||
| State and local |
136 | 656 | ||||||
|
|
|
|
|
|||||
| Total deferred tax expense |
614 | 5,585 | ||||||
|
|
|
|
|
|||||
| Total deferred tax benefit before reversal of valuation allowance |
614 | 5,585 | ||||||
|
|
|
|
|
|||||
| Deferred tax valuation allowance |
(61,859 | ) | (5,585 | ) | ||||
|
|
|
|
|
|||||
| Provision (benefit) for income taxes |
$ | (61,245 | ) | $ | 307 | |||
|
|
|
|
|
|||||
F-44
Table of Contents
BYLINE BANCORP, INC. AND SUBSIDIARIES
NOTES TO CONSOLIDATED FINANCIAL STATEMENTS
(Table dollars in thousands, except share and per share data)
Note 11—Income Taxes (Continued)
The following is a reconciliation between the statutory U.S. federal income tax rate of 35% and the effective tax rate:
| 2016 |
2015 |
|||||||
| Calculated tax benefit at statutory rate |
35.0 | % | 35.0 | % | ||||
| Increase (decrease) in income taxes resulting from: |
||||||||
| Reversal of valuation allowance, net of change in estimated Section 382 impact |
(1,167.6 | ) | 73.4 | |||||
| State and local income taxes |
6.1 | 5.0 | ||||||
| Tax exempt income |
(5.3 | ) | 24.2 | |||||
| Non-deductible expenses |
14.8 | (137.6 | ) | |||||
|
|
|
|
|
|||||
| Total benefit for income taxes |
-1117.0 | % | 0.0 | % | ||||
|
|
|
|
|
|||||
The income tax benefit for the year ended December 31, 2016 was primarily attributable to the reversal of the Company’s previously established valuation allowance of $61.4 million. Management concluded that no valuation allowance was necessary on the Company’s net deferred tax assets as a result of the Ridgestone acquisition. This determination was based on Ridgestone’s actual pre-tax income over the prior three years, and pro-forma combined earnings for the Company and Ridgestone over the prior three years, as well as management’s expectations for sustainable profitability in the future. Management monitors deferred tax assets on a quarterly basis for changes affecting realizability. The valuation allowance could be adjusted in future periods.
F-45
Table of Contents
BYLINE BANCORP, INC. AND SUBSIDIARIES
NOTES TO CONSOLIDATED FINANCIAL STATEMENTS
(Table dollars in thousands, except share and per share data)
Note 11—Income Taxes (Continued)
The following were the significant components of the deferred tax assets and liabilities as of December 31, 2016 and 2015:
| 2016 |
2015 |
|||||||
| Deferred tax assets: |
||||||||
| Net operating losses and tax credits |
$ | 61,906 | $ | 60,657 | ||||
| Interest on non-accrual loans |
2,882 | 3,632 | ||||||
| Allowance for loan losses and loan basis |
22,017 | 10,918 | ||||||
| Deposits |
316 | 45 | ||||||
| AMT credit carryforward |
1,073 | 1,073 | ||||||
| Other real estate owned |
214 | 2,073 | ||||||
| Net unrealized holding losses on securities available-for-sale |
4,818 | 2,750 | ||||||
| Other |
3,241 | 1,230 | ||||||
|
|
|
|
|
|||||
| Total deferred tax assets |
96,467 | 82,378 | ||||||
|
|
|
|
|
|||||
| Deferred tax liabilities: |
||||||||
| Premises and equipment |
(6,907 | ) | (7,614 | ) | ||||
| Core deposit intangibles |
(7,858 | ) | (8,660 | ) | ||||
| Servicing assets |
(7,899 | ) | — | |||||
| Trust preferred securities |
(3,809 | ) | (4,119 | ) | ||||
| Unrealized holding gain on cash flow hedges |
(1,491 | ) | — | |||||
| Other |
(743 | ) | (608 | ) | ||||
|
|
|
|
|
|||||
| Total deferred tax liabilities |
(28,707 | ) | (21,001 | ) | ||||
|
|
|
|
|
|||||
| Less valuation allowance on net deferred tax asset |
— | (61,377 | ) | |||||
|
|
|
|
|
|||||
| Net deferred tax assets after valuation allowance |
$ | 67,760 | $ | — | ||||
|
|
|
|
|
|||||
Pursuant to Sections 382 and 383 of the Internal Revenue Code, annual use of net operating loss and credit carryforwards may be limited in the event a cumulative change in ownership of more than 50 percent occurs within a three-year period. The Company has determined that such an ownership change occurred as of June 28, 2013 as a result of the recapitalization. This ownership change resulted in estimated limitations on the utilization of tax attributes, including net operating loss carryforwards and tax credits. Pursuant to Sections 382 and 383, a portion of the limited net operating loss carryforwards and credits become available to use each year. The Company estimates that approximately $756,000 of the restricted Federal and Illinois net operating losses will become available each year.
After the impact of Section 382, $116.4 million of Federal and $420.8 million of Illinois net operating loss carryforwards are available to offset future taxable income. The Federal and Illinois net operating losses will begin to expire in 2026 and 2020, respectively, if not utilized in an earlier period. Federal alternative minimum tax credits of $1.1 million are available to offset future federal income tax. These credits have no expiration. The Company and the Bank file consolidated income tax returns.
The Company and the Bank are no longer subject to United States federal income tax examinations for years before 2013 and state income tax examinations for years before 2012.
F-46
Table of Contents
BYLINE BANCORP, INC. AND SUBSIDIARIES
NOTES TO CONSOLIDATED FINANCIAL STATEMENTS
(Table dollars in thousands, except share and per share data)
Note 12—Federal Home Loan Bank Advances
The following table summarizes the FHLB advances, including acquisition accounting adjustments of $228,000 as of December 31, 2016 and no acquisition accounting adjustments as of December 31, 2015, along with weighted average costs and scheduled maturities:
| 2016 |
2015 |
|||||||
| Federal Home Loan advances |
$ | 313,715 | $ | 38,000 | ||||
| Weighted average cost |
0.73 | % | 0.16 | % | ||||
| Scheduled |
|
|||||||
| 2017 |
$ | 304,000 | ||||||
| 2018 |
9,715 | |||||||
|
|
|
|||||||
| Total |
$ | 313,715 | ||||||
|
|
|
|||||||
At December 31, 2016, fixed-rate advances totaled $133.7 million with interest rates ranging from 0.70% to 3.22% and maturities ranging from January 2017 to February 2018. Total floating rate advances totaled $180.0 million with interest rates of 0.57% and 0.72% and maturities of February 2017 and March 2017. The Company’s advances from the FHLB are collateralized by residential real estate loans and securities. The Bank’s required investment in FHLB stock is $1 for every $20 in advances. Refer to Note 4—Securities for additional discussion. At December 31, 2016 and 2015, the Bank had additional borrowing capacity from the FHLB of $647.9 million and $849.8 million, respectively, subject to the availability of proper collateral. The Bank’s maximum borrowing capacity is limited to 35% of total assets.
FHLB advances assumed from the Ridgestone acquisition of $1.5 million are putable quarterly and are required to be repaid upon the request of the FHLB.
The Company hedges interest rates on borrowed funds using interest rate swaps through which the Company receives variable amounts and pays fixed amounts. Refer to Note 22—Derivative Instruments and Hedging Activities for additional information.
Note 13—Other Borrowings
The following is a summary of the Company’s other borrowings as of December 31, 2016 and 2015:
| 2016 |
2015 |
|||||||
| Securities sold under agreements to repurchase |
$ | 17,249 | $ | 12,659 | ||||
| Revolving line of credit |
20,650 | — | ||||||
|
|
|
|
|
|||||
| Total |
$ | 37,899 | $ | 12,659 | ||||
|
|
|
|
|
|||||
Securities sold under agreements to repurchase represent a demand deposit product offered to customers that sweep balances in excess of the FDIC insurance limit into overnight repurchase agreements. The Company pledges securities as collateral for the repurchase agreements. Refer to Note 4—Securities for additional discussion.
On October 13, 2016, in connection with the Ridgestone acquisition, the Company entered into a $30.0 million revolving credit agreement with The PrivateBank and Trust Company with a $300,000
F-47
Table of Contents
BYLINE BANCORP, INC. AND SUBSIDIARIES
NOTES TO CONSOLIDATED FINANCIAL STATEMENTS
(Table dollars in thousands, except share and per share data)
Note 13—Other Borrowings (Continued)
commitment fee payable at such time. Refer to Note 3—Acquisition of a Business for additional information. The revolving line of credit has a maturity date of October 12, 2017 and bears an interest rate equal to the Prime rate. At December 31, 2016, the interest rate was 3.75%. As of December 31, 2016, the Company was in compliance with all financial covenants set forth in the revolving line of credit agreement.
The following table presents short-term credit lines available for use, for which the Company did not have an outstanding balance as of December 31, 2016 and 2015:
| 2016 |
2015 |
|||||||
| Federal Reserve Bank of Chicago discount window line |
$ | 110,600 | $ | 170,900 | ||||
| Available federal funds line |
20,000 | 20,000 | ||||||
Note 14—Time Deposits
Time deposits in denominations of $100,000 or more at December 31, 2016 and 2015 were $383.7 million and $237.0 million, respectively. Time deposits in denominations of $250,000 or more at December 31, 2016 and 2015 were $117.4 million and $57.6 million, respectively.
At December 31, 2016, the scheduled maturities of time deposits were as follows:
| Scheduled Maturities |
||||
| 2017 |
$ | 693,702 | ||
| 2018 |
56,084 | |||
| 2019 |
11,937 | |||
| 2020 |
8,515 | |||
| 2021 |
6,278 | |||
|
|
|
|||
| Total |
$ | 776,516 | ||
|
|
|
|||
Note 15—Junior Subordinated Debentures
At December 31, 2016 and 2015, the Company’s junior subordinated debentures by issuance were as follows:
| Name of Trust |
Aggregate |
Aggregate |
Stated Maturity |
Contractual |
Interest Rate Spread |
|||||||||||||||
| Metropolitan Statutory Trust 1 |
$ | 35,000 | $ | 35,000 | March 17, 2034 | 3.78 | % | Three-month LIBOR + 2.79% | ||||||||||||
| RidgeStone Capital Trust I |
1,500 | — | June 30, 2033 | 5.09 | % | Five-year LIBOR + 3.50% | ||||||||||||||
|
|
|
|
|
|||||||||||||||||
| Total liability, at par |
36,500 | 35,000 | ||||||||||||||||||
| Discount |
(9,574 | ) | (10,289 | ) | ||||||||||||||||
|
|
|
|
|
|||||||||||||||||
| Total liability, at fair value |
$ | 26,926 | $ | 24,711 | ||||||||||||||||
|
|
|
|
|
|||||||||||||||||
In 2004, the Company’s predecessor, Metropolitan Bank Group, Inc., issued $35.0 million floating rate junior subordinated debentures to Metropolitan Statutory Trust 1, which was formed for the issuance of trust
F-48
Table of Contents
BYLINE BANCORP, INC. AND SUBSIDIARIES
NOTES TO CONSOLIDATED FINANCIAL STATEMENTS
(Table dollars in thousands, except share and per share data)
Note 15—Junior Subordinated Debentures (Continued)
preferred securities. The debentures bear interest at three-month London Interbank Offered Rate (“LIBOR”) plus 2.79% (3.78% and 3.32% at December 31, 2016 and 2015, respectively). Interest is payable quarterly. The Company has the right to redeem the debentures, in whole or in part, on any interest payment date on or after March 2009. In August 2010, the Company notified the trustee of Metropolitan Statutory Trust 1 that it would be deferring its regularly scheduled quarterly interest payments. Pursuant to the terms of the indenture governing the subordinated debentures, the Company had the right to defer interest payments for up to 20 quarters, or through the June 17, 2015 payment date. On September 17, 2015, the Company made a payment of $6.4 million, which included $6.2 million of accrued deferred interest payments and continues to make quarterly payments pursuant to the terms. Accrued interest payable was $50,000 and $49,000 as of December 31, 2016 and 2015, respectively.
As part of the Ridgestone acquisition, the Company assumed the obligations to RidgeStone Capital Trust I of $1.5 million in principal amount, which was formed for the issuance of trust preferred securities. Refer to Note 3—Acquisition of a Business for additional information. Beginning on June 30, 2008, the interest rate reset to the five-year LIBOR plus 3.50% (5.09% at December 31, 2016), which is in effect until September 30, 2018 and updated every five years. Interest is paid on a quarterly basis. Ridgestone deferred interest payments on the subordinated debentures from 2009 through 2014. The Company has the right to redeem the debentures, in whole or in part, on any interest payment date on or after June 30, 2008. There was no accrued interest payable as of December 31, 2016.
The Trusts are not consolidated with the Company. Accordingly, the Company reports the subordinated debentures held by the Trusts as liabilities. The Company owns all of the common securities of each trust. The junior subordinated debentures qualify, and are treated as, Tier 1 regulatory capital of the Company subject to regulatory limitations. The trust preferred securities issued by each trust rank equally with the common securities in right of payment, except that if an event of default under the indenture governing the notes has occurred and is continuing, the preferred securities will rank senior to the common securities in right of payment.
Note 16—Employee Benefit Plans
The Bank’s defined contribution 401(k) savings plan (the “Plan”) covers substantially all employees that have completed certain service requirements. The Board of Directors determines the amount of any discretionary profit sharing contribution made to the plan. There were no profit sharing contributions to the Plan for the years ended December 31, 2016 and 2015. The net assets of the plan are not included in the Consolidated Statements of Financial Condition.
As of February 1, 2016, a 401(k) employer match contribution was adopted by the Bank, pursuant to which the Bank will make a contribution equal to 50% of the first 4% contributed by employees. Total expense for the employer contributions made to the Plan was $655,000 during the year ended December 31, 2016. Effective January 1, 2017, the employer match was increased to equal 100% of the first 3% and 50% for the next 2% contributed by employees.
Note 17—Commitments and Contingent Liabilities
Legal contingencies—In the ordinary course of business, the Company and Bank have various outstanding commitments and contingent liabilities that are not recognized in the accompanying consolidated financial statements. In addition, the Company may be a defendant in certain claims and legal actions arising in the ordinary course of business. In the opinion of management, after consultation with legal counsel, the ultimate disposition of these matters is currently not expected to have a material adverse effect on the Consolidated
F-49
Table of Contents
BYLINE BANCORP, INC. AND SUBSIDIARIES
NOTES TO CONSOLIDATED FINANCIAL STATEMENTS
(Table dollars in thousands, except share and per share data)
Note 17—Commitments and Contingent Liabilities (Continued)
Statements of Financial Condition or Consolidated Statements of Operations for years ended December 31, 2016 and 2015.
Operating lease commitments—The Company has entered into various operating lease agreements primarily for facilities and land on which banking facilities are located. Certain lease agreements have renewal options at the end of the original lease term and certain lease agreements have escalation clauses in the rent payments.
The minimum annual rental commitments for operating leases subsequent to December 31, 2016, exclusive of taxes and other charges, are summarized as follows:
|
Minimum Rental |
||||
| 2017 |
$ | 2,766 | ||
| 2018 |
2,105 | |||
| 2019 |
1,875 | |||
| 2020 |
1,480 | |||
| 2021 |
1,212 | |||
| Thereafter |
2,791 | |||
|
|
|
|||
| Total |
$ | 12,229 | ||
|
|
|
|||
The Company’s rental expenses for the years ended December 31, 2016 and 2015 were $3.8 million and $3.6 million, respectively. During the years ended December 31, 2016 and 2015, the Company received $737,000 and $744,000, respectively, in sublease income which is included in the consolidated statements of operations as a reduction of occupancy expense. The total amount of minimum rentals to be received in the future on these subleases is approximately $1.8 million, and the leases have contractual lives extending through 2025. In addition to the above required lease payments, the Company has contractual obligations related primarily to information technology contracts and other maintenance contracts. The amounts are not material.
Commitments to extend credit—The Bank is party to financial instruments with off-balance sheet risk in the normal course of business to meet the financing needs of its customers. These financial instruments include commitments to extend credit and standby letters of credit. Those instruments involve, to varying degrees, elements of credit and interest rate risk in excess of the amount recognized in the Consolidated Statements of Financial Condition. The contractual or notional amounts of those instruments reflect the extent of involvement the Bank has in particular classes of financial instruments.
The Bank’s exposure to credit loss in the event of non-performance by the other party to the financial instrument for commitments to extend credit and standby letters of credit is represented by the contractual or notional amount of those instruments. The Bank uses the same credit policies in making commitments and conditional obligations as it does for funded instruments. The Bank does not anticipate any material losses as a result of the commitments and standby letters of credit.
F-50
Table of Contents
BYLINE BANCORP, INC. AND SUBSIDIARIES
NOTES TO CONSOLIDATED FINANCIAL STATEMENTS
(Table dollars in thousands, except share and per share data)
Note 17—Commitments and Contingent Liabilities (Continued)
The following table summarizes the contract or notional amount of outstanding loan and lease commitments at December 31, 2016 and 2015:
| 2016 |
2015 |
|||||||||||||||
| Fixed Rate |
Variable Rate |
Fixed Rate |
Variable Rate |
|||||||||||||
| Commitments to extend credit |
$ | 37,731 | $ | 332,928 | $ | 31,579 | $ | 169,298 | ||||||||
| Standby letters of credit |
1,060 | 4,135 | 1,147 | 1,497 | ||||||||||||
|
|
|
|
|
|
|
|
|
|||||||||
| Total |
$ | 38,791 | $ | 337,063 | $ | 32,726 | $ | 170,795 | ||||||||
|
|
|
|
|
|
|
|
|
|||||||||
Commitments to extend credit are agreements to lend to a customer as long as there is no violation of any condition established in the contract. Commitments generally have fixed expiration dates or other termination clauses and may require payment of a fee. Since many of the commitments are expected to expire without being drawn upon, the total commitment amount does not necessarily represent future cash requirements. The Bank evaluates each customer’s creditworthiness on a case-by-case basis. The amount of collateral obtained, if deemed necessary by the Bank upon extension of credit, is based on management’s credit evaluation of the counterparty. Collateral is primarily obtained in the form of commercial and residential real estate (including income producing commercial properties).
Standby letters of credit are conditional commitments issued by the Bank to guarantee to a third-party the performance of a customer. Those guarantees are primarily issued to support public and private borrowing arrangements, bond financing and similar transactions. The credit risk involved in issuing letters of credit is essentially the same as that involved in extending loan facilities to customers.
Commitments to make loans are generally made for periods of 90 days or less. The fixed rate loan commitments have interest rates ranging from 2.0% to 19.5% and maturities up to 2025. Variable rate loan commitments have interest rates ranging from 2.4% to 14.9% and maturities up to 2046.
Note 18—Fair Value Measurement
Fair value is the exchange price that would be received for an asset or paid to transfer a liability (exit price) in the principal or most advantageous market for the asset or liability in an orderly transaction between market participants on the measurement date. In addition, the Company has the ability to obtain fair values for markets that are not accessible. These types of inputs create the following fair value hierarchy:
Level 1—Quoted prices in active markets for identical assets or liabilities.
Level 2—Quoted prices for similar instruments in active markets, quoted prices for identical or similar instruments in markets that are not active and model-derived valuations whose inputs are observable or whose significant value drivers are observable.
Level 3—Unobservable inputs that are supported by little or no market activity and that are significant to the fair value of the asset or liability. Unobservable inputs are used to measure fair value to the extent that observable inputs are not available. The Company’s own data used to develop unobservable inputs may be adjusted for market considerations when reasonably available.
F-51
Table of Contents
BYLINE BANCORP, INC. AND SUBSIDIARIES
NOTES TO CONSOLIDATED FINANCIAL STATEMENTS
(Table dollars in thousands, except share and per share data)
Note 18—Fair Value Measurement (Continued)
A financial instrument’s categorization within the valuation hierarchy is based upon the lowest level of input that is significant to the fair value measurement. The Company’s assessment of the significance of a particular input to the fair value measurement in its entirety requires judgment, and considers factors specific to assets and liabilities.
The Company used the following methods and significant assumptions to estimate fair value for certain assets measured and carried at fair value on a recurring basis:
Securities available-for-sale—The Company obtains fair value measurements from an independent pricing service. Management reviews the procedures used by the third party, including significant inputs used in the fair value calculations. The fair value measurements consider observable data that may include dealer quotes, market spreads, cash flows, the U.S. Treasury yield curve, live trading levels, trade execution data, market consensus prepayment speeds, credit information and the bond’s terms and conditions, among other things. When market quotes are not readily accessible or available, alternative approaches are utilized, such as matrix or model pricing.
The Company’s methodology for pricing non-rated bonds focuses on three distinct inputs: equivalent rating, yield and other pricing terms. To determine the rating for a given non-rated municipal bond, the Company references a publicly issued bond by the same issuer if available as well as other additional key metrics to support the credit worthiness. Typically, pricing for these types of bonds would require a higher yield than a similar rated bond from the same issuer. A reduction in price is applied to the rating obtained from the comparable bond, as the Company believes if liquidated, a non-rated bond would be valued less than a similar bond with a verifiable rating. The reduction applied by the Company is one notch lower (i.e. a “AA” rating for a comparable bond would be reduced to “AA-” for the Company’s valuation). In 2016, all of the ratings derived by the Company were “BBB” or better with and without comparable bond proxies. The fair value measurement of municipal bonds is sensitive to the rating input, as a higher rating typically results in an increased valuation. The remaining pricing inputs used in the bond valuation are observable. Based on the rating determined, the Company obtains a corresponding current market yield curve available to market participants. Other terms including coupon, maturity date, redemption price, number of coupon payments per year, and accrual method are obtained from the individual bond term sheets.
Servicing assets—Fair value is based on a loan-by-loan basis taking into consideration the original term to maturity, the current age of the loan and the remaining term to maturity. The valuation methodology utilized for the servicing assets begins with generating future cash flows for each servicing asset, based on their unique characteristics and market-based assumptions for prepayment speeds. The present value of the future cash flows are then calculated utilizing market-based discount rate assumptions. Servicing assets were acquired through a business combination during 2016. Refer to Note 7—Servicing Assets.
Derivative instruments—Interest rate swaps are valued by a third party, using models that primarily use market observable inputs, such as yield curves, and are validated by comparison with valuations provided by the respective counterparties. Derivative financial instruments are included in other assets and other liabilities in the Consolidated Statements of Financial Condition.
F-52
Table of Contents
BYLINE BANCORP, INC. AND SUBSIDIARIES
NOTES TO CONSOLIDATED FINANCIAL STATEMENTS
(Table dollars in thousands, except share and per share data)
Note 18—Fair Value Measurement (Continued)
The following tables summarize the Company’s financial assets and liabilities that were measured at fair value on a recurring basis as of December 31, 2016 and 2015:
| Fair Value Measurements Using |
||||||||||||||||
| 2016 |
Fair Value |
Level 1 |
Level 2 |
Level 3 |
||||||||||||
| Financial assets |
||||||||||||||||
| Securities available-for-sale |
||||||||||||||||
| U.S. Treasury Notes |
$ | 14,920 | $ | 14,920 | $ | — | $ | — | ||||||||
| U.S. Government agencies |
58,857 | — | 58,857 | — | ||||||||||||
| Obligations of states, municipalities, and political subdivisions |
16,059 | — | 15,509 | 550 | ||||||||||||
| Mortgage-backed securities; residential |
||||||||||||||||
| Agency |
368,160 | — | 368,160 | — | ||||||||||||
| Non-Agency |
19,933 | — | 19,933 | — | ||||||||||||
| Mortgage-backed securities; commercial |
||||||||||||||||
| Agency |
77,403 | — | 77,403 | — | ||||||||||||
| Non-Agency |
31,052 | — | 31,052 | — | ||||||||||||
| Corporate securities |
17,329 | — | 17,329 | — | ||||||||||||
| Other securities |
4,847 | 1,938 | 2,379 | 530 | ||||||||||||
| Servicing assets(1) |
21,091 | — | — | 21,091 | ||||||||||||
| Derivative assets |
4,317 | — | 4,317 | — | ||||||||||||
| Financial liabilities |
||||||||||||||||
| Derivative liabilities |
559 | — | 559 | — | ||||||||||||
| (1) | See Note 7 for a rollforward of recurring Level 3 fair values for servicing assets. |
|
Fair Value Measurements Using |
||||||||||||||||
| 2015 |
Fair Value |
Level 1 |
Level 2 |
Level 3 |
||||||||||||
| Financial assets |
||||||||||||||||
| Securities available-for-sale |
||||||||||||||||
| U.S. Treasury Notes |
$ | 30,345 | $ | 30,345 | $ | — | $ | — | ||||||||
| U.S. Government agencies |
83,613 | — | 83,613 | — | ||||||||||||
| Obligations of states, municipalities, and political subdivisions |
20,752 | — | 20,752 | — | ||||||||||||
| Mortgage-backed securities; residential |
||||||||||||||||
| Agency |
588,334 | — | 588,334 | — | ||||||||||||
| Non-Agency |
— | — | — | — | ||||||||||||
| Mortgage-backed securities; commercial |
||||||||||||||||
| Agency |
31,191 | — | 31,191 | — | ||||||||||||
| Non-Agency |
— | — | — | — | ||||||||||||
| Corporate securities |
7,696 | — | 7,696 | — | ||||||||||||
| Other securities |
5,801 | 1,964 | 3,837 | — | ||||||||||||
| Servicing assets |
— | — | — | — | ||||||||||||
| Derivative assets |
— | — | — | — | ||||||||||||
| Financial liabilities |
||||||||||||||||
| Derivative liabilities |
— | — | — | — | ||||||||||||
F-53
Table of Contents
BYLINE BANCORP, INC. AND SUBSIDIARIES
NOTES TO CONSOLIDATED FINANCIAL STATEMENTS
(Table dollars in thousands, except share and per share data)
Note 18—Fair Value Measurement (Continued)
During 2016, the Company acquired the servicing assets and single-issuer trust preferred securities included in other securities categorized as Level 3 of the fair value hierarchy through a business combination. Refer to Note 7—Servicing Assets for the rollforward of recurring Level 3 fair values. During the year ended December 31, 2016, the Company recognized $1,000 of accretion income for the single-issuer trust preferred securities.
In addition, during 2016, the Company purchased privately-issued municipal securities that are categorized as Level 3. These municipal securities are bonds issued for one municipal government entity primarily located in the Chicago metropolitan and are privately placed, non-rated bonds without CUSIP numbers.
There were no financial instruments classified as Level 3 as of December 31, 2015. The Company did not have any transfers between Level 1 and Level 2 of the fair value hierarchy during the years ended December 31, 2016 and 2015. The Company’s policy for determining transfers between levels occurs at the end of the reporting period when circumstances in the underlying valuation criteria change and result in transfer between levels.
The following table presents additional information about the unobservable inputs used in the fair value measurements on recurring basis that were categorized within Level 3 of the fair value hierarchy as of December 31, 2016:
| Financial Instruments |
Valuation Technique |
Unobservable Inputs |
Range of Inputs |
Weighted |
Impact to | |||||||||
| Obligations of states, municipalities, and political obligations |
Discounted cash flow | Probability of default | 2.0%—2.4% | 2.2% | Decrease | |||||||||
| Single issuer trust preferred |
Discounted cash flow | Probability of default | 7.5%—12.0% | 8.8% | Decrease | |||||||||
| Servicing assets |
Discounted cash flow | Prepayment speeds | 5.6%—9.2% | 7.2% | Decrease | |||||||||
| Discount rate | 7.6%—18.6% | 12.7% | Decrease | |||||||||||
| Expected weighted average loan life |
0.5—8.2 years | 6.1 years | Increase | |||||||||||
The Company used the following methods and significant assumptions to estimate fair value for certain assets measured and carried at fair value on a non-recurring basis:
Loans held for sale—Mortgage loans originated and intended for sale in the secondary market are carried at the lower of aggregate cost or fair value based on contract price. Loans transferred to loans held for sale are carried at the lower of cost or fair value, less estimated costs to sell.
Impaired loans (excluding acquired impaired loans)—Impaired loans, other than those existing on the date of a business acquisition, are primarily carried at the fair value of the underlying collateral, less estimated costs to sell, if the loan is collateral dependent. Valuations of impaired loans that are collateral dependent are supported by third party appraisals, which are obtained not less than once every twelve months in accordance with the Bank’s credit policy. Impaired loans that are not collateral dependent are not material.
Assets held for sale—Assets held for sale consist of former branch locations, vacant land, and a house previously purchased for expansion. Assets are considered held for sale when management has approved to sell
F-54
Table of Contents
BYLINE BANCORP, INC. AND SUBSIDIARIES
NOTES TO CONSOLIDATED FINANCIAL STATEMENTS
(Table dollars in thousands, except share and per share data)
Note 18—Fair Value Measurement (Continued)
the assets following a branch closure or other events. The properties are being actively marketed and transferred to assets held for sale based on the lower of carrying value or its fair value, less estimated costs to sell.
Other real estate owned—Certain assets held within other real estate owned represent real estate or other collateral that has been adjusted to its estimated fair value, less cost to sell, as a result of transferring from the loan portfolio at the time of foreclosure or repossession and based on management’s periodic impairment evaluation. From time to time, non-recurring fair value adjustments to other real estate owned are recorded to reflect partial write-downs based on an observable market price or current appraised value of property.
Adjustments to fair value based on such non-recurring transactions generally result from the application of lower-of-cost-or-market accounting or write-downs of individual assets due to impairment. The following tables summarize the Company’s assets that were measured at fair value on a non-recurring basis, excluding acquired impaired loans, as of December 31, 2016 and 2015:
| 2016 |
Fair Value Measurements Using |
|||||||||||||||
| Fair Value |
Level 1 |
Level 2 |
Level 3 |
|||||||||||||
| Non-recurring |
||||||||||||||||
| Impaired loans |
||||||||||||||||
| (excluding acquired impaired loans) |
||||||||||||||||
| Commercial real estate |
$ | 8,916 | $ | — | $ | — | $ | 8,916 | ||||||||
| Residential real estate |
1,007 | — | — | 1,007 | ||||||||||||
| Construction, land development, and other land |
— | — | — | — | ||||||||||||
| Commercial and industrial |
986 | — | — | 986 | ||||||||||||
| Installment and Other |
— | — | — | — | ||||||||||||
| Assets held for sale |
14,748 | — | — | 14,748 | ||||||||||||
| Other real estate owned |
16,570 | — | — | 16,570 | ||||||||||||
|
2015 |
Fair Value Measurements Using |
|||||||||||||||
| Fair Value | Level 1 | Level 2 | Level 3 | |||||||||||||
| Non-recurring |
||||||||||||||||
| Impaired loans |
||||||||||||||||
| (excluding acquired impaired loans) |
||||||||||||||||
| Commercial real estate |
$ | 3,084 | $ | — | $ | — | $ | 3,084 | ||||||||
| Residential real estate |
3,427 | — | — | 3,427 | ||||||||||||
| Construction, land development, and other land |
71 | — | — | 71 | ||||||||||||
| Commercial and industrial |
— | — | — | — | ||||||||||||
| Installment and Other |
— | — | — | — | ||||||||||||
| Assets held for sale |
2,259 | — | — | 2,259 | ||||||||||||
| Other real estate owned |
26,715 | — | — | 26,715 | ||||||||||||
F-55
Table of Contents
BYLINE BANCORP, INC. AND SUBSIDIARIES
NOTES TO CONSOLIDATED FINANCIAL STATEMENTS
(Table dollars in thousands, except share and per share data)
Note 18—Fair Value Measurement (Continued)
The following table provides a description of the valuation technique, unobservable inputs and qualitative information about the Company’s assets and liabilities classified as Level 3 and measured at fair value on a non-recurring basis as of December 31, 2016 and 2015:
| Financial Instruments |
Valuation Technique | Unobservable Inputs | Range of Inputs | Impact to Valuation from an Increased or Higher Input Value | ||||
|
Impaired loans (excluding acquired impaired loans) |
Appraisals |
Appraisal adjustments, |
6%—10% |
Decrease | ||||
|
Assets held for sale |
List price, contract |
Sales costs and other |
7% |
Decrease | ||||
|
Other real estate owned |
Appraisals |
Appraisal adjustments, |
7%—20% |
Decrease |
The following methods and assumptions were used by the Company in estimating fair values of other assets and liabilities for disclosure purposes:
Cash and cash equivalents—For these short-term instruments, the carrying amount is a reasonable estimate of fair value. The fair value for time certificates with other banks is based on the market values for comparable investments.
Securities held-to-maturity—The Company obtains fair value measurements from an independent pricing service. Management reviews the procedures used by the third party, including significant inputs used in the fair value calculations. The fair value measurements consider observable data that may include dealer quotes, market spreads, cash flows, the U.S. Treasury yield curve, live trading levels, trade execution data, market consensus prepayment speeds, credit information and the bond’s terms and conditions, among other things. When market quotes are not readily accessible or available, alternative approaches are utilized, such as matrix or model pricing.
Restricted stock—The fair value has been determined to approximate cost.
Loans held for sale—The fair value of loans held for sale are based on quoted market prices, where available, and determined by discounted estimated cash flows using interest rates approximating the Company’s current origination rates for similar loans adjusted to reflect the inherent credit risk.
Loan and lease receivables, net—For certain variable rate loans that reprice frequently and with no significant changes in credit risk, fair value is estimated at carrying value. The fair value of other types of loans is estimated by discounting future cash flows, using current rates at which similar loans would be made to borrowers with similar credit ratings and for the same remaining maturities.
F-56
Table of Contents
BYLINE BANCORP, INC. AND SUBSIDIARIES
NOTES TO CONSOLIDATED FINANCIAL STATEMENTS
(Table dollars in thousands, except share and per share data)
Note 18—Fair Value Measurement (Continued)
Deposit liabilities—The fair value of demand deposits, savings accounts, and certain money market deposits is the amount payable on demand at the reporting date. The fair value of fixed-maturity certificates of deposit is estimated by discounting future cash flows, using rates currently offered for deposits of similar remaining maturities.
Federal Home Loan Bank advances—The fair value of FHLB advances is estimated by discounting the agreements based on maturities using rates currently offered for FHLB advances of similar remaining maturities adjusted for prepayment penalties that would be incurred if the borrowings were paid off on the measurement date.
Securities sold under agreements to repurchase—The carrying amount approximates fair value due to maturities of less than ninety days.
Junior subordinated debentures—The fair value of junior subordinated debentures, in the form of trust preferred securities, is determined using rates currently available to the Company for debt with similar terms and remaining maturities.
Accrued interest receivable and payable—The carrying amount approximates fair value.
Commitments to extend credit and commercial and standby letters of credit—The fair values of these off-balance sheet commitments to extend credit and commercial and standby letters of credit are not considered practicable to estimate because of the lack of quoted market prices and the inability to estimate fair value without incurring excessive costs.
The estimated fair values of financial instruments and levels within the fair value hierarchy are as follows:
| 2016 |
2015 |
|||||||||||||||||||
|
Fair Value |
Carrying |
Estimated |
Carrying |
Estimated |
||||||||||||||||
| Financial assets |
||||||||||||||||||||
| Cash and due from banks |
1 | $ | 17,735 | $ | 17,735 | $ | 21,312 | $ | 21,312 | |||||||||||
| Interest bearing deposits with other banks |
2 | 28,798 | 28,798 | 23,572 | 23,572 | |||||||||||||||
| Securities held-to-maturity |
2 | 138,846 | 138,082 | 111,460 | 110,935 | |||||||||||||||
| Other restricted stock |
2 | 14,993 | 14,993 | 7,608 | 7,608 | |||||||||||||||
| Loans held for sale |
3 | 23,976 | 26,487 | 268 | 268 | |||||||||||||||
| Loans and lease receivables, net |
3 | 2,137,088 | 2,068,157 | 1,337,805 | 1,333,675 | |||||||||||||||
| Accrued interest receivable |
3 | 6,866 | 6,866 | 5,319 | 5,319 | |||||||||||||||
| Financial liabilities |
||||||||||||||||||||
| Non-interest bearing deposits |
2 | 724,457 | 724,457 | 626,396 | 626,396 | |||||||||||||||
| Interest bearing deposits |
2 | 1,765,937 | 1,723,941 | 1,554,228 | 1,552,990 | |||||||||||||||
| Accrued interest payable |
2 | 2,427 | 2,427 | 1,072 | 1,072 | |||||||||||||||
| Revolving line of credit |
2 | 20,650 | 20,650 | — | — | |||||||||||||||
| Federal Home Loan Bank advances |
2 | 313,715 | 313,646 | 38,000 | 38,000 | |||||||||||||||
| Securities sold under repurchase agreement |
2 | 17,249 | 17,249 | 12,659 | 12,659 | |||||||||||||||
| Junior subordinated debentures |
3 | 26,926 | 26,943 | 24,711 | 24,150 | |||||||||||||||
F-57
Table of Contents
BYLINE BANCORP, INC. AND SUBSIDIARIES
NOTES TO CONSOLIDATED FINANCIAL STATEMENTS
(Table dollars in thousands, except share and per share data)
Note 19—Stock Option Plan
The Company maintained a nonqualified, share-based, stock option plan adopted prior to recapitalization (“MBG Plan”). There were no options granted or exercised under this plan during the years ended December 31, 2016, and 2015. At the time of the Company’s reincorporation into Delaware, the Board of Directors cancelled the MBG Plan and all outstanding options were cancelled.
In October 2014, the Company adopted the Byline Bancorp, Inc. Equity Incentive Plan (“BYB Plan”). The maximum number of shares available for grants under this Plan is 2,476,122 shares. During 2016 and 2015, the Company granted 212,400 and 1,634,568, respectively. The types of stock options granted were Time Options and Performance Options. The exercise price of each option is equal to the fair value of the stock as of the date of grant. These option awards have vesting periods ranging from 1 to 5 years and have 10-year contractual terms. Stock volatility was computed as the average of the volatilities of peer group companies.
Time Options are conditional based on completion of service. Performance Options have conditional vesting based on either performance targets or market performance. Certain Performance Options’ performance goals will be satisfied (in whole or in part) if the Bank achieves various performance targets such as profitability, asset quality, and conditional based on market performance, as outlined in the BYB Plan. Each of the performance goals identified are measured for achievement (or failure to achieve) independent of each other.
The fair values of the stock options were determined using the Black-Scholes-Merton model for Time Options and a Monte Carlo simulation model for Performance Options. The fair values of options under the BYB Plan were determined using the following assumptions as of the grant dates:
| Time Options |
||||||||
| 2016 |
2015 |
|||||||
| Risk-free interest rate |
1.34% - 1.40% | 1.68% - 1.85% | ||||||
| Expected term (years) |
5.2 - 5.6 | 5.7 - 6.3 | ||||||
| Expected stock price volatility |
20.39% | 16.18% - 16.55% | ||||||
| Expected dividend yield |
0.00% | 0.00% | ||||||
| Weighted average grant date fair value |
$ 3.55 | $ 2.25 | ||||||
| Performance Options |
||||||||
| 2016 |
2015 |
|||||||
| Risk-free interest rate |
Implied forward rates | Implied forward rates | ||||||
| Expected term (years) |
Variable | Variable | ||||||
| Expected stock price volatility |
20.34% - 20.39% | 16.18% - 16.55% | ||||||
| Expected dividend yield |
0.00% | 0.00% | ||||||
| Weighted average grant date fair value |
$ 3.75 | $ 1.65 | ||||||
F-58
Table of Contents
BYLINE BANCORP, INC. AND SUBSIDIARIES
NOTES TO CONSOLIDATED FINANCIAL STATEMENTS
(Table dollars in thousands, except share and per share data)
Note 19—Stock Option Plan (Continued)
The following table discloses the activity in shares subject to options and the weighted average exercise prices, in actual dollars, for the year ended December 31, 2016:
| BYB Plan |
||||||||||||
| Number of Shares |
Weighted |
Weighted |
||||||||||
| Beginning balance |
1,634,568 | $ | 11.35 | 9.5 | ||||||||
| Granted |
212,400 | 16.25 | ||||||||||
| Expired |
— | — | ||||||||||
| Exercised |
(19,498 | ) | 11.18 | |||||||||
| Forfeited |
(29,247 | ) | 11.18 | |||||||||
|
|
|
|||||||||||
| Ending balance outstanding at December 31 |
1,798,223 | $ | 11.95 | 9.8 | ||||||||
|
|
|
|||||||||||
| Exercisable at December 31 |
628,814 | $ | 11.55 | |||||||||
|
|
|
|||||||||||
During 2016, proceeds from the exercise of stock options were $218,000 and related tax benefit recognized was $40,000. There were no stock options exercised during 2015. The total fair value of stock options vested during the years ended December 31, 2016 and 2015 amounted to $13.0 million and $5.1 million, respectively.
The Company recognizes share-based compensation based on the estimated fair value of the option at the grant date. Forfeitures are estimated based upon industry standards. Share-based compensation expense is included in non-interest expense in the Consolidated Statements of Operations. The following table summarizes share-based compensation expense for the years ended December 31, 2016 and 2015:
| Year Ended December 31, |
||||||||
| 2016 |
2015 |
|||||||
| Total share-based compensation |
$ | 899 | $ | 1,045 | ||||
| Income tax benefit |
360 | — | ||||||
| Unrecognized compensation expense |
1,752 | 1,983 | ||||||
| Weighted-average amortization period remaining |
1.8 years | 3.8 years | ||||||
Note 20—Related Party Transactions
Loans to related parties—Loans that may be made to the Bank’s executive officers, as defined in 12 CFR 215 (Regulation O), directors, principal stockholders and their affiliates would be on substantially the same terms, including interest rates and collateral, as those prevailing at the time for comparable transactions with unrelated persons and would not involve more than normal risk of collectability. As of December 31, 2016 and 2015, there were no loans made to the related parties described above.
Deposits from related parties—Deposits from related parties were not material as of December 31, 2016 and 2015.
Other—At December 31, 2016, a short-term receivable of $100,000 was outstanding from a related party for a subscription for the Series B preferred stock subscription and was repaid in January 2017. Refer to
F-59
Table of Contents
BYLINE BANCORP, INC. AND SUBSIDIARIES
NOTES TO CONSOLIDATED FINANCIAL STATEMENTS
(Table dollars in thousands, except share and per share data)
Note 20—Related Party Transactions (Continued)
Note 25—Stockholders’ Equity for additional information regarding the transaction. As of December 31, 2015, there were no receivables outstanding from related parties.
Note 21—Regulatory Capital Requirements
The Company and the Bank are subject to various regulatory capital requirements administered by their respective banking agencies. Failure to meet minimum capital requirements can initiate certain mandatory and possibly additional discretionary actions by regulators that, if undertaken, could have a direct material effect on the Company’s financial statements.
Under capital adequacy guidelines and the regulatory framework for prompt corrective action, the Company and the Bank must meet specific capital guidelines that involve quantitative measures of their assets, liabilities and certain off-balance sheet items as calculated under regulatory accounting practices. The capital amounts and classification are also subject to qualitative judgments by the regulators about components, risk weightings and other factors. Quantitative measures established by regulation to ensure capital adequacy require the Company and the Bank to maintain minimum amounts and ratios of Common Equity Tier 1 capital (“CET1”), Tier 1 capital and total capital to risk-weighted assets and of Tier 1 capital to average consolidated assets, as defined in the regulations.
As of December 31, 2016, the most recent notification from the FDIC categorized the Bank as well-capitalized under the framework for prompt corrective action. There are no conditions or events since that notification that management believes have changed the Bank’s category.
F-60
Table of Contents
BYLINE BANCORP, INC. AND SUBSIDIARIES
NOTES TO CONSOLIDATED FINANCIAL STATEMENTS
(Table dollars in thousands, except share and per share data)
Note 21—Regulatory Capital Requirements (Continued)
The required regulatory capital ratios are set forth in the following tables along with the minimum capital amounts required for the Company and the Bank and well capitalized with respect to the Bank. The Company’s and the Bank’s actual capital amounts and ratios as of December 31, 2016 and 2015 are also presented.
| 2016 |
Actual |
Minimum Capital |
Required to be Well Capitalized |
|||||||||||||||||||||
| Amount |
Ratio |
Amount |
Ratio |
Amount |
Ratio |
|||||||||||||||||||
| Total capital to risk weighted assets: |
||||||||||||||||||||||||
| Company |
$ | 316,314 | 13.28 | % | $ | 190,527 | 8.00 | % | $ | 238,159 | N/A | |||||||||||||
| Bank |
325,465 | 13.61 | % | 191,267 | 8.00 | % | 239,084 | 10.00 | % | |||||||||||||||
| Tier 1 capital to risk weighted assets: |
||||||||||||||||||||||||
| Company |
$ | 304,324 | 12.78 | % | $ | 142,895 | 6.00 | % | $ | 190,527 | N/A | |||||||||||||
| Bank |
313,474 | 13.11 | % | 143,450 | 6.00 | % | 191,267 | 8.00 | % | |||||||||||||||
| Common Equity Tier 1 (CET1) to risk weighted assets: |
||||||||||||||||||||||||
| Company |
$ | 266,760 | 11.20 | % | $ | 107,171 | 4.50 | % | $ | 154,803 | N/A | |||||||||||||
| Bank |
313,474 | 13.11 | % | 107,588 | 4.50 | % | 155,404 | 6.50 | % | |||||||||||||||
| Tier 1 capital to average assets: |
||||||||||||||||||||||||
| Company |
$ | 304,324 | 10.07 | % | $ | 120,850 | 4.00 | % | $ | 151,062 | N/A | |||||||||||||
| Bank |
313,474 | 10.35 | % | 121,169 | 4.00 | % | 151,461 | 5.00 | % | |||||||||||||||
| 2015 |
Actual |
Minimum Capital |
Required to be Well Capitalized |
|||||||||||||||||||||
| Amount |
Ratio |
Amount |
Ratio |
Amount |
Ratio |
|||||||||||||||||||
| Total capital to risk weighted assets: |
||||||||||||||||||||||||
| Company |
$ | 202,578 | 12.51 | % | $ | 129,534 | 8.00 | % | $ | 161,917 | N/A | |||||||||||||
| Bank |
192,253 | 11.87 | % | 129,537 | 8.00 | % | 161,921 | 10.00 | % | |||||||||||||||
| Tier 1 capital to risk weighted assets: |
||||||||||||||||||||||||
| Company |
$ | 194,364 | 12.00 | % | $ | 97,150 | 6.00 | % | $ | 129,534 | N/A | |||||||||||||
| Bank |
184,039 | 11.37 | % | 97,153 | 6.00 | % | 129,537 | 8.00 | % | |||||||||||||||
| Common Equity Tier 1 (CET1) to risk weighted assets: |
||||||||||||||||||||||||
| Company |
$ | 144,361 | 8.92 | % | $ | 72,863 | 4.50 | % | $ | 105,246 | N/A | |||||||||||||
| Bank |
184,039 | 11.37 | % | 72,864 | 4.50 | % | 105,249 | 6.50 | % | |||||||||||||||
| Tier 1 capital to average assets: |
||||||||||||||||||||||||
| Company |
$ | 194,364 | 7.85 | % | $ | 99,076 | 4.00 | % | $ | 123,845 | N/A | |||||||||||||
| Bank |
184,039 | 7.43 | % | 99,077 | 4.00 | % | 123,846 | 5.00 | % | |||||||||||||||
The Company and the Bank must maintain a capital conservation buffer consisting of additional CET1 capital greater than 2.5% of risk-weighted assets above the required minimum risk-based capital levels in order to avoid limitations on paying dividends, repurchasing shares, and paying discretionary bonuses. The capital conservation buffer requirement began to be phased in on January 1, 2016 when a buffer greater than 0.625% of risk-weighted assets was required. This amount increases each year until the buffer requirement is fully implemented on January 1, 2019. The conservation buffers for the Company and the Bank exceed the fully phased in minimum as of December 31, 2016.
F-61
Table of Contents
BYLINE BANCORP, INC. AND SUBSIDIARIES
NOTES TO CONSOLIDATED FINANCIAL STATEMENTS
(Table dollars in thousands, except share and per share data)
Note 21—Regulatory Capital Requirements (Continued)
Provisions of state and federal banking regulations may limit, by statute, the amount of dividends that may be paid to the Company by the Bank without prior approval of the Bank’s regulatory agencies. The Company is economically dependent on the cash dividends received from the Bank. These dividends represent the primary cash flow from operating activities used to service obligations. There were no cash dividends received by the Company from the Bank for the year ended December 31, 2016. Cash dividends of $700,000 to pay the junior subordinated debentures were received by the Company from the Bank for the year ended December 31, 2015.
Note 22—Derivative Instruments and Hedging Activities
During 2016, the Company entered into interest rate swaps that are used to manage differences in the amount, timing, and duration of the Company’s known or expected cash receipts and its known or expected cash payments principally related to certain variable rate borrowings. The Company also entered into interest rate swaps with certain qualified borrowers to facilitate the borrowers’ risk management strategies and concurrently entered into mirror-image derivatives with a third party counterparty. There were no interest rate swap agreements entered into during 2015.
The Company recognizes derivative financial instruments at fair value regardless of the purpose or intent for holding the instrument. The Company records derivative assets and derivative liabilities on the Consolidated Statements of Financial Condition within accrued interest receivable and other assets and accrued interest payable and other liabilities, respectively. The following table presents the fair value of the Company’s derivative financial instruments and classification on the Consolidated Statements of Financial Condition as of December 31, 2016:
| Derivative Assets |
Derivative Liabilities |
|||||||||||||||
| Classification |
Fair Value |
Classification |
Fair Value |
|||||||||||||
| Derivatives designated as hedging instruments |
||||||||||||||||
| Interest rate swaps designated as cash flow hedges |
Other assets | $ | 3,719 | Other liabilities | $ | — | ||||||||||
|
|
|
|
|
|||||||||||||
| Total derivatives designated as hedging instruments |
$ | 3,719 | $ | — | ||||||||||||
|
|
|
|
|
|||||||||||||
| Derivatives not designated as hedging instruments |
||||||||||||||||
| Other interest rate swaps |
Other assets | $ | 598 | Other liabilities | $ | 559 | ||||||||||
|
|
|
|
|
|||||||||||||
| Total derivatives not designated as hedging instruments |
$ | 598 | $ | 559 | ||||||||||||
|
|
|
|
|
|||||||||||||
Interest rate swaps designated as cash flow hedges—Cash flow hedges of interest payments associated with certain FHLB advances had notional amounts totaling $100.0 million as of December 31, 2016. The aggregate fair value of the swaps is recorded in other assets (liabilities) with changes in fair value recorded in other comprehensive income (loss), net of taxes, to the extent effective. The amount included in accumulated other comprehensive income (loss) would be reclassified to current earnings when the hedged FHLB advances affect earnings. The Company assesses the effectiveness of each hedging relationship by comparing the changes in fair value of the derivative hedging instrument with the changes in fair value of the designated hedged transactions. The Company expects the hedges to remain highly effective during the remaining terms of the swaps and did not recognize any hedge ineffectiveness in current earnings during the year ended December 31, 2016.
F-62
Table of Contents
BYLINE BANCORP, INC. AND SUBSIDIARIES
NOTES TO CONSOLIDATED FINANCIAL STATEMENTS
(Table dollars in thousands, except share and per share data)
Note 22—Derivative Instruments and Hedging Activities (Continued)
The following table reflects the cash flow hedges as of December 31, 2016:
| Effective Date |
Maturity Date |
Notional Amount |
Fair Value as of |
|||||||
| September 20, 2016 | September 20, 2021 | $ | 25,000 | $ | 853 | |||||
| September 20, 2016 | September 20, 2021 | 25,000 | 895 | |||||||
| December 20, 2016 | December 20, 2021 | 25,000 | 1,111 | |||||||
| December 20, 2016 | December 20, 2021 | 25,000 | 860 | |||||||
|
|
|
|
|
|||||||
| $ | 100,000 | $ | 3,719 | |||||||
|
|
|
|
|
|||||||
Interest expense recorded on these swap transactions totaled $40,000 during 2016 and is reported as a component of interest expense on FHLB advances. At December 31, 2016, the Company estimates $40,000 of the unrealized gain to be reclassified as a reduction of interest expense during the next twelve months.
The following table reflects the net gains (losses) recorded in accumulated other comprehensive income (loss) and the Consolidated Statements of Operations relating to the cash flow derivative instruments for the year ended December 31, 2016:
| Amount of Gain Recognized in OCI (Effective Portion) |
Amount of Loss Reclassified from OCI to Income as an Increase to Interest Expense |
Amount of Gain (Loss) Recognized in Other Non-Interest Income (Ineffective Portion) |
||||||||||
| Interest rate swaps |
$ | 3,724 | $ | (40 | ) | $ | — | |||||
Other interest rate swaps—During 2016, the Company entered into nine interest rate swap agreements with borrowers and simultaneously entered into an offsetting interest rate derivative transactions with counterparties. The total combined notional amount was $51.2 million with maturities ranged from April 2023 to October 2026. The fair values of the interest rate swap agreements are reflected in other assets and other liabilities with corresponding gains or losses reflected in non-interest income. During the year ended December 31, 2016, transaction fees related to these derivative instruments were $679,000.
The following table reflects other interest rate swaps as of December 31, 2016:
| Notional amounts |
$ | 51,213 | ||
| Derivative assets fair value |
598 | |||
| Derivative liabilities fair value |
559 | |||
| Weighted average pay rates |
4.08 | % | ||
| Weighted average receive rates |
2.91 | % | ||
| Weighted average maturity |
7.9 years |
Credit risk—Derivative instruments are inherently subject to market risk and credit risk. Market risk is associated with changes in interest rates and credit risk relates to the Company’s risk of loss when the counterparty to a derivative contract fails to perform according to the terms of the agreement. Market and credit risks are managed and monitored as part of the Company’s overall asset-liability management process. The credit risk related to derivatives entered into with certain qualified borrowers is managed through the Company’s loan underwriting process. The Company’s loan underwriting process also approves the Bank’s swap counterparty used to mirror the borrowers’ swap. The Company has a bilateral agreement with each swap counterparty that
F-63
Table of Contents
BYLINE BANCORP, INC. AND SUBSIDIARIES
NOTES TO CONSOLIDATED FINANCIAL STATEMENTS
(Table dollars in thousands, except share and per share data)
Note 22—Derivative Instruments and Hedging Activities (Continued)
provides that fluctuations in derivative values are to be fully collateralized with either cash or securities. The credit valuation adjustment (“CVA”) is a fair value adjustment to the derivative to account for this risk. During the year ended December 31, 2016, the CVA resulted in an increase to non-interest income of $39,000.
The Company has agreements with its derivative counterparties that contain a cross-default provision under which if the Company defaults on any of its indebtedness, including default where repayment of the indebtedness has not been accelerated by the lender, then the Company could also be declared in default on its derivative obligations. The Company also has agreements with certain derivative counterparties that contain a provision where if the Company fails to maintain its status as a well or adequately capitalized institution, then the counterparty could terminate the derivative positions and the Company would be required to settle its obligations under the agreements. As of December 31, 2016, derivatives with counterparties resulted in a net asset position.
The Company records interest rate derivatives subject to master netting agreements at their gross value and does not offset derivative asset and liabilities on the Consolidated Statements of Financial Condition. The table below summarizes the Company’s interest rate derivatives and offsetting positions as of December 31, 2016:
| Derivative Assets |
Derivative Liabilities |
|||||||
| Gross amounts recognized |
$ | 4,317 | $ | 559 | ||||
| Less: Amounts offset in the Consolidated Statements of Financial Condition |
— | — | ||||||
|
|
|
|
|
|||||
| Net amount presented in the Consolidated Statements of Financial Condition |
$ | 4,317 | $ | 559 | ||||
|
|
|
|
|
|||||
| Gross amounts not offset in the Consolidated Statements of Financial Condition |
||||||||
| Offsetting derivative positions |
— | — | ||||||
| Collateral posted |
(4,317 | ) | — | |||||
|
|
|
|
|
|||||
| Net credit exposure |
$ | — | $ | 559 | ||||
|
|
|
|
|
|||||
As of December 31, 2016, the counterparties posted collateral of $4.8 million, which resulted in excess collateral with the Company. For purposes of this disclosure, the amount of posted collateral by the counterparties is limited to the amount offsetting the derivative asset.
In February 2017 and March 2017, the Company executed four additional cash flow hedges totaling $100.0 million in notional value with maturity dates in March 2022.
F-64
Table of Contents
BYLINE BANCORP, INC. AND SUBSIDIARIES
NOTES TO CONSOLIDATED FINANCIAL STATEMENTS
(Table dollars in thousands, except share and per share data)
Note 23—Parent Company Only Condensed Financial Statements
The following represents the condensed financial statements of Byline Bancorp, Inc., the Parent Company, on a stand-alone basis as of December 31, 2016 and 2015:
Statements of Financial Condition
Parent Company Only
(dollars in thousands)
| 2016 |
2015 |
|||||||
| ASSETS |
||||||||
| Cash and due from subsidiary bank |
$ | 9,965 | $ | 97 | ||||
| Investment in banking subsidiary |
419,801 | 212,949 | ||||||
| Other assets |
2,755 | — | ||||||
|
|
|
|
|
|||||
| Total assets |
$ | 432,521 | $ | 213,046 | ||||
|
|
|
|
|
|||||
| LIABILITIES AND STOCKHOLDERS’ EQUITY |
||||||||
| Revolving line of credit |
$ | 20,650 | $ | — | ||||
| Junior subordinated debentures |
26,926 | 24,711 | ||||||
| Accrued expenses and other liabilities |
2,287 | 61 | ||||||
| Stockholders’ equity |
382,658 | 188,274 | ||||||
|
|
|
|
|
|||||
| Total liabilities and stockholders’ equity |
$ | 432,521 | $ | 213,046 | ||||
|
|
|
|
|
|||||
Statements of Operations
Parent Company Only
(dollars in thousands)
| Years
ended |
||||||||
| 2016 |
2015 |
|||||||
| Other noninterest income |
$ | 57 | $ | — | ||||
| Interest expense |
2,460 | 2,295 | ||||||
| Other noninterest expense |
381 | 312 | ||||||
|
|
|
|
|
|||||
| Loss before provision for income taxes and equity in undistributed income (loss) of subsidiary |
(2,784 | ) | (2,607 | ) | ||||
| Provision for income taxes |
204 | 8 | ||||||
|
|
|
|
|
|||||
| Loss before equity in undistributed income (loss) of subsidiary |
(2,988 | ) | (2,615 | ) | ||||
| Equity in undistributed income (loss) of subsidiary |
69,717 | (12,359 | ) | |||||
|
|
|
|
|
|||||
| Net income (loss) |
$ | 66,729 | $ | (14,974 | ) | |||
|
|
|
|
|
|||||
F-65
Table of Contents
BYLINE BANCORP, INC. AND SUBSIDIARIES
NOTES TO CONSOLIDATED FINANCIAL STATEMENTS
(Table dollars in thousands, except share and per share data)
Note 23—Parent Company Only Condensed Financial Statements (Continued)
Statements of Cash Flows
Parent Company Only
(dollars in thousands)
| Years
ended |
||||||||
| 2016 |
2015 |
|||||||
| CASH FLOWS FROM OPERATING ACTIVITIES |
||||||||
| Net income (loss) |
$ | 66,729 | $ | (14,974 | ) | |||
| Adjustments to reconcile net income (loss) to net cash from operating activities: |
||||||||
| Equity in undistributed (income) loss of subsidiary |
(69,717 | ) | 12,359 | |||||
| Stock-based compensation expense |
899 | 1,045 | ||||||
| Exercise of share-based awards |
40 | — | ||||||
| Accretion of junior subordinated debentures discount |
876 | 944 | ||||||
| Changes in other assets and other liabilities |
16 | (5,546 | ) | |||||
|
|
|
|
|
|||||
| Net cash used in operating activities |
(1,157 | ) | (6,172 | ) | ||||
| CASH FLOWS FROM INVESTING ACTIVITIES |
||||||||
| Investments in and advances to subsidiary |
(32,019 | ) | — | |||||
| Net cash paid in acquisition of business |
(36,586 | ) | — | |||||
|
|
|
|
|
|||||
| Net cash used in investing activities |
(68,605 | ) | — | |||||
| CASH FLOWS FROM FINANCING ACTIVITIES |
||||||||
| Proceeds from revolving line of credit |
30,000 | — | ||||||
| Repayments of revolving line of credit |
(9,350 | ) | — | |||||
| Proceeds from issuance of common stock, net |
49,592 | — | ||||||
| Proceeds from issuance of preferred stock |
9,388 | — | ||||||
|
|
|
|
|
|||||
| Net cash provided by financing activities |
79,630 | — | ||||||
| NET CHANGE IN CASH AND CASH EQUIVALENTS |
9,868 | (6,172 | ) | |||||
| CASH AND CASH EQUIVALENTS, beginning of period |
97 | 6,269 | ||||||
|
|
|
|
|
|||||
| CASH AND CASH EQUIVALENTS, end of period |
$ | 9,965 | $ | 97 | ||||
|
|
|
|
|
|||||
Note 24—Earnings per Share
A reconciliation of the numerators and denominators for earnings per common share computations for the years ended December 31, 2016 and 2015 is presented below. Options to purchase 1,634,568 shares of common stock under the BYB Plan were outstanding as of December 31, 2015, but were not included in the computation of diluted earnings per share due to a loss for the period and, therefore, were anti-dilutive.
F-66
Table of Contents
BYLINE BANCORP, INC. AND SUBSIDIARIES
NOTES TO CONSOLIDATED FINANCIAL STATEMENTS
(Table dollars in thousands, except share and per share data)
Note 24—Earnings per Share (Continued)
The following represent the calculation of basic and diluted earnings per share:
| Years ended December 31, |
||||||||
| 2016 |
2015 |
|||||||
| Net income (loss) |
$ | 66,729 | $ | (14,974 | ) | |||
| Less: Dividends on preferred shares |
— | — | ||||||
|
|
|
|
|
|||||
| Net income (loss) available to common stockholders |
$ | 66,729 | $ | (14,974 | ) | |||
|
|
|
|
|
|||||
| Weighted-average common stock outstanding: |
||||||||
| Weighted-average common stock outstanding (basic) |
20,141,630 | 17,332,775 | ||||||
| Incremental shares(1)(2) |
289,153 | — | ||||||
|
|
|
|
|
|||||
| Weighted-average common stock outstanding (dilutive) |
20,430,783 | 17,332,775 | ||||||
|
|
|
|
|
|||||
| Basic earnings per common share |
$ | 3.31 | $ | (0.86 | ) | |||
| Diluted earnings per common share |
$ | 3.27 | $ | (0.86 | ) | |||
| (1) | This amount represents outstanding stock options for which the exercise price is less than the average market price of the Company’s common stock. |
| (2) | During 2015, due to a loss for the period, zero incremental shares are included because the effect would be anti-dilutive. |
Note 25—Stockholders’ Equity
A summary of the Company’s common and preferred stock at December 31, 2016 and 2015 is as follows:
| 2016 |
2015 |
|||||||
| Series A non-cumulative perpetual preferred stock |
||||||||
| Par value |
$ | 0.01 | $ | 0.01 | ||||
| Shares authorized |
15,003 | 15,003 | ||||||
| Shares issued |
15,003 | 15,003 | ||||||
| Shares outstanding |
15,003 | 15,003 | ||||||
| Series B 7.5% fixed to floating non-cumulative perpetual preferred stock |
||||||||
| Par value |
$ | 0.01 | N/A | |||||
| Shares authorized |
50,000 | N/A | ||||||
| Shares issued |
9,388 | N/A | ||||||
| Subscription receivable |
1,050 | N/A | ||||||
| Shares outstanding |
9,388 | N/A | ||||||
| Common stock, voting |
||||||||
| Par value |
$ | — | $ | — | ||||
| Shares authorized |
150,000,000 | 150,000,000 | ||||||
| Shares issued |
24,616,706 | 17,332,775 | ||||||
| Shares outstanding |
24,616,706 | 17,332,775 | ||||||
In connection with the recapitalization, the Company authorized and issued voting common stock and Series A non-voting, non-cumulative perpetual preferred stock with liquidation preference. The Series A preferred stock is redeemable at the Company’s option on or after July 1, 2018. Under the terms of the Series A
F-67
Table of Contents
BYLINE BANCORP, INC. AND SUBSIDIARIES
NOTES TO CONSOLIDATED FINANCIAL STATEMENTS
(Table dollars in thousands, except share and per share data)
Note 25—Stockholders’ Equity (Continued)
preferred stock certificate of designation, the Company would have to declare and pay a dividend or make a distribution prior to paying a dividend on its common stock, redeeming the Series A, or upon liquidation, in accordance with the terms of the preferred stock, which may reduce the earnings available to common stock holders upon declaration.
During 2016, the Company authorized and issued Series B 7.50% fixed-to-floating non-voting, non-cumulative perpetual preferred stock with liquidation preference of $1,000 per share, plus the amount of unpaid dividends, if any, which is redeemable at the Company’s option on or after March 31, 2022. Holders of either Series A or Series B preferred stock shall not have any rights to convert such stock into shares of any other class of capital stock of the Company.
On January 30, 2017, the Company issued an additional 1,050 shares of Series B preferred stock, which is reflected as a subscription receivable as of December 31, 2016. On February 7, 2017, the Company declared a full dividend on the Series B preferred stock for the dividend period ending March 31, 2017 and payable on March 31, 2017 to holders of record as of March 16, 2017.
Note 26—Subsequent Events
On May 19, 2017, the Company issued a press release announcing its intention to pursue an initial public offering of common stock (the “IPO”) in 2017. In anticipation of the IPO, the Board of Directors considered the potential benefits afforded by Delaware law to public companies, including greater predictability and enhanced ability to attract and retain qualified independent directors, and determined that it is in the best interests of the Company and its stockholders to reincorporate in Delaware prior to the IPO.
On June 14, 2017, stockholders of record as of May 22, 2017 voted to approve an Agreement and Plan of Merger between Byline Bancorp, Inc., an Illinois corporation (“Byline Illinois”), and Byline Bancorp, Inc., a wholly owned Delaware subsidiary of the Company, including the amended and restated certificate of incorporation and by-laws of the Company. Each share of Byline Illinois common stock issued and outstanding immediately prior to the effective time of the Merger was converted automatically into the right to receive one fifth (0.20) of a share of common stock of the Company. Fractional shares are to be paid in cash based on the initial public offering price of Byline Bancorp, Inc.’s common stock.
F-68
Table of Contents
BYLINE BANCORP, INC. AND SUBSIDIARIES
CONSOLIDATED STATEMENTS OF FINANCIAL CONDITION
| (dollars in thousands) |
(Unaudited) |
December 31, |
||||||
| ASSETS | ||||||||
| Cash and due from banks |
$ | 15,541 | $ | 17,735 | ||||
| Interest bearing deposits with other banks |
67,726 | 28,798 | ||||||
|
|
|
|
|
|||||
| Cash and cash equivalents |
83,267 | 46,533 | ||||||
| Securities available-for-sale, at fair value |
590,507 | 608,560 | ||||||
| Securities held-to-maturity, at amortized cost (fair value March 31, 2017—$132,707, December 31, 2016—$138,082) |
132,897 | 138,846 | ||||||
| Restricted stock, at cost |
9,503 | 14,993 | ||||||
| Loans held for sale |
23,492 | 23,976 | ||||||
| Loans and leases: |
||||||||
| Loans and leases |
2,143,534 | 2,148,011 | ||||||
| Allowance for loan and lease losses |
(11,817 | ) | (10,923 | ) | ||||
|
|
|
|
|
|||||
| Net loans and leases |
2,131,717 | 2,137,088 | ||||||
| Servicing assets, at fair value |
21,223 | 21,091 | ||||||
| Accrued interest receivable |
7,498 | 6,866 | ||||||
| Premises and equipment, net |
99,563 | 102,074 | ||||||
| Assets held for sale |
13,666 | 14,748 | ||||||
| Other real estate owned, net |
13,173 | 16,570 | ||||||
| Goodwill |
51,975 | 51,975 | ||||||
| Other intangible assets, net |
19,058 | 19,826 | ||||||
| Bank-owned life insurance |
6,676 | 6,557 | ||||||
| Deferred tax assets, net |
62,925 | 67,760 | ||||||
| Other assets |
17,573 | 18,367 | ||||||
|
|
|
|
|
|||||
| Total assets |
$ | 3,284,713 | $ | 3,295,830 | ||||
|
|
|
|
|
|||||
| LIABILITIES AND STOCKHOLDERS’ EQUITY | ||||||||
| LIABILITIES |
||||||||
| Non-interest bearing demand deposits |
$ | 732,267 | $ | 724,457 | ||||
| Interest bearing deposits: |
||||||||
| NOW, savings accounts, and money market accounts |
1,032,536 | 989,421 | ||||||
| Time deposits |
811,036 | 776,516 | ||||||
|
|
|
|
|
|||||
| Total deposits |
2,575,839 | 2,490,394 | ||||||
| Accrued interest payable |
1,893 | 2,427 | ||||||
| Line of credit |
18,150 | 20,650 | ||||||
| Federal Home Loan Bank advances |
209,663 | 313,715 | ||||||
| Securities sold under agreements to repurchase |
31,940 | 17,249 | ||||||
| Junior subordinated debentures issued to capital trusts, net |
27,130 | 26,926 | ||||||
| Accrued expenses and other liabilities |
30,415 | 41,811 | ||||||
|
|
|
|
|
|||||
| Total liabilities |
2,895,030 | 2,913,172 | ||||||
| STOCKHOLDERS’ EQUITY |
||||||||
| Preferred stock |
25,441 | 25,441 | ||||||
| Common stock, voting $0.01 par value; 150,000,000 shares authorized at March 31, 2017 and December 31, 2016; 24,616,706 shares issued and outstanding at March 31, 2017 and December 31, 2016 |
311,994 | 311,994 | ||||||
| Additional paid-in capital |
1,844 | 1,558 | ||||||
| Retained earnings |
57,304 | 50,933 | ||||||
| Accumulated other comprehensive loss, net of tax |
(6,900 | ) | (7,268 | ) | ||||
|
|
|
|
|
|||||
| Total stockholders’ equity |
389,683 | 382,658 | ||||||
|
|
|
|
|
|||||
| Total liabilities and stockholders’ equity |
$ | 3,284,713 | $ | 3,295,830 | ||||
|
|
|
|
|
|||||
See accompanying Notes to Consolidated Financial Statements.
F-69
Table of Contents
BYLINE BANCORP, INC. AND SUBSIDIARIES
CONSOLIDATED STATEMENTS OF OPERATIONS
(UNAUDITED)
| (dollars in thousands, except share and per share data) | Three Months Ended March 31, |
|||||||
| 2017 |
2016 |
|||||||
| INTEREST AND DIVIDEND INCOME |
||||||||
| Interest and fees on loans and leases |
$ | 28,396 | $ | 18,999 | ||||
| Interest on taxable securities |
3,790 | 3,635 | ||||||
| Interest on tax-exempt securities |
133 | 179 | ||||||
| Other interest and dividend income |
169 | 64 | ||||||
|
|
|
|
|
|||||
| Total interest and dividend income |
32,488 | 22,877 | ||||||
| INTEREST EXPENSE |
||||||||
| Deposits |
1,483 | 1,153 | ||||||
| Federal Home Loan Bank advances |
660 | 78 | ||||||
| Subordinated debentures and other borrowings |
807 | 526 | ||||||
|
|
|
|
|
|||||
| Total interest expense |
2,950 | 1,757 | ||||||
|
|
|
|
|
|||||
| Net interest income |
29,538 | 21,120 | ||||||
| PROVISION FOR LOAN AND LEASE LOSSES |
1,891 | 2,513 | ||||||
|
|
|
|
|
|||||
| Net interest income after provision for loan and lease losses |
27,647 | 18,607 | ||||||
|
|
|
|
|
|||||
| NON-INTEREST INCOME |
||||||||
| Fees and service charges on deposits |
1,219 | 1,389 | ||||||
| Servicing fees |
919 | — | ||||||
| ATM and interchange fees |
1,348 | 1,408 | ||||||
| Net gains on sales of securities available-for-sale |
8 | 923 | ||||||
| Net gains on sales of loans |
8,082 | — | ||||||
| Fees on mortgage loan sales, net |
2 | 20 | ||||||
| Other non-interest income |
730 | 548 | ||||||
|
|
|
|
|
|||||
| Total non-interest income |
12,308 | 4,288 | ||||||
|
|
|
|
|
|||||
| NON-INTEREST EXPENSE |
||||||||
| Salaries and employee benefits |
16,602 | 11,940 | ||||||
| Occupancy expense, net |
3,739 | 3,802 | ||||||
| Equipment expense |
563 | 535 | ||||||
| Loan and lease related expenses |
569 | 461 | ||||||
| Legal, audit and other professional fees |
1,671 | 993 | ||||||
| Data processing |
2,409 | 1,820 | ||||||
| Net (gain) loss recognized on other real estate owned and other related expenses |
(570 | ) | 899 | |||||
| Regulatory assessments |
184 | 850 | ||||||
| Other intangible assets amortization expense |
769 | 747 | ||||||
| Advertising and promotions |
289 | 235 | ||||||
| Telecommunications |
418 | 458 | ||||||
| Other non-interest expense |
2,208 | 1,747 | ||||||
|
|
|
|
|
|||||
| Total non-interest expense |
28,851 | 24,487 | ||||||
|
|
|
|
|
|||||
| INCOME (LOSS) BEFORE PROVISION FOR INCOME TAXES |
11,104 | (1,592 | ) | |||||
| PROVISION (BENEFIT) FOR INCOME TAXES |
4,544 | (240 | ) | |||||
|
|
|
|
|
|||||
| NET INCOME (LOSS) |
6,560 | (1,352 | ) | |||||
|
|
|
|
|
|||||
| Dividends on preferred shares |
189 | — | ||||||
| NET INCOME (LOSS) AVAILABLE TO COMMON STOCKHOLDERS |
$ | 6,371 | $ | (1,352 | ) | |||
|
|
|
|
|
|||||
| EARNINGS (LOSS) PER SHARE |
||||||||
| Basic |
$ | 0.26 | $ | (0.08 | ) | |||
| Diluted |
0.25 | (0.08 | ) | |||||
| Weighted average common shares outstanding for basic earnings (loss) per common share |
24,616,706 | 17,522,226 | ||||||
| Diluted weighted average common shares outstanding for diluted earnings (loss) per common share |
25,078,427 | 17,522,226 | ||||||
See accompanying Notes to Consolidated Financial Statements.
F-70
Table of Contents
BYLINE BANCORP, INC. AND SUBSIDIARIES
CONSOLIDATED STATEMENTS OF COMPREHENSIVE INCOME (LOSS)
(UNAUDITED)
| (dollars in thousands) | Three Months Ended March 31, |
|||||||
| 2017 | 2016 | |||||||
| Net income (loss) |
$ | 6,560 | $ | (1,352 | ) | |||
| Securities available-for-sale |
||||||||
| Unrealized holding gains arising during the period |
1,020 | 9,812 | ||||||
| Reclassification adjustments for net gains included in net income (loss) |
(8 | ) | (923 | ) | ||||
| Tax effect |
(626 | ) | — | |||||
|
|
|
|
|
|||||
| Net of tax |
386 | 8,889 | ||||||
| Cash flow hedges |
||||||||
| Unrealized holding gains arising during the period |
25 | — | ||||||
| Reclassification adjustments for losses included in net income (loss) |
(54 | ) | — | |||||
| Tax effect |
11 | — | ||||||
|
|
|
|
|
|||||
| Net of tax |
(18 | ) | — | |||||
|
|
|
|
|
|||||
| Total other comprehensive income |
368 | 8,889 | ||||||
|
|
|
|
|
|||||
| Comprehensive income |
$ | 6,928 | $ | 7,537 | ||||
|
|
|
|
|
|||||
|
Gains |
Unrealized Gains |
Total |
||||||||||
| Balance, January 1, 2017 |
$ | 2,233 | $ | (9,501 | ) | $ | (7,268 | ) | ||||
| Other comprehensive gain (loss), net of tax |
(18 | ) | 386 | 368 | ||||||||
|
|
|
|
|
|
|
|||||||
| Balance, March 31, 2017 |
$ | 2,215 | $ | (9,115 | ) | $ | (6,900 | ) | ||||
|
|
|
|
|
|
|
|||||||
See accompanying Notes to Consolidated Financial Statements.
F-71
Table of Contents
BYLINE BANCORP, INC. AND SUBSIDIARIES
CONSOLIDATED STATEMENTS OF CHANGES IN STOCKHOLDERS’ EQUITY
Three Months Ended March 31, 2017 and 2016
(Amounts in thousands, except per share data) (Unaudited)
| (dollars in thousands, except share data)
|
Preferred Stock |
|
Additional |
Retained |
Accumulated |
Total |
||||||||||||||||||||||||||
| Shares | Amount | Shares | Amount | |||||||||||||||||||||||||||||
| Balance, January 1, 2016 |
15,003 | $ | 15,003 | 17,332,775 | $ | 193,729 | $ | 1,045 | $ | (15,796 | ) | $ | (5,707 | ) | $ | 188,274 | ||||||||||||||||
| Net loss |
— | — | — | — | — | (1,352 | ) | — | (1,352 | ) | ||||||||||||||||||||||
| Other comprehensive income, net of tax |
— | — | — | — | — | — | 8,889 | 8,889 | ||||||||||||||||||||||||
| Issuance of common stock, net of issuance cost |
— | — | 2,155,003 | 35,018 | — | — | — | 35,018 | ||||||||||||||||||||||||
| Share-based compensation expense |
— | — | — | — | 181 | — | — | 181 | ||||||||||||||||||||||||
|
|
|
|
|
|
|
|
|
|
|
|
|
|
|
|
|
|||||||||||||||||
| Balance, March 31, 2016 |
15,003 | $ | 15,003 | 19,487,778 | $ | 228,747 | $ | 1,226 | $ | (17,148 | ) | $ | 3,182 | $ | 231,010 | |||||||||||||||||
|
|
|
|
|
|
|
|
|
|
|
|
|
|
|
|
|
|||||||||||||||||
| Balance, January 1, 2017 |
25,441 | $ | 25,441 | 24,616,706 | $ | 311,994 | $ | 1,558 | $ | 50,933 | $ | (7,268 | ) | $ | 382,658 | |||||||||||||||||
| Net income |
— | — | — | — | — | 6,560 | — | 6,560 | ||||||||||||||||||||||||
| Other comprehensive income, net of tax |
— | — | — | — | — | — | 368 | 368 | ||||||||||||||||||||||||
| Cash dividends declared on preferred stock |
— | — | — | — | — | (189 | ) | — | (189 | ) | ||||||||||||||||||||||
| Share-based compensation expense |
— | — | — | — | 286 | — | — | 286 | ||||||||||||||||||||||||
|
|
|
|
|
|
|
|
|
|
|
|
|
|
|
|
|
|||||||||||||||||
| Balance, March 31, 2017 |
25,441 | $ | 25,441 | 24,616,706 | $ | 311,994 | $ | 1,844 | $ | 57,304 | $ | (6,900 | ) | $ | 389,683 | |||||||||||||||||
|
|
|
|
|
|
|
|
|
|
|
|
|
|
|
|
|
|||||||||||||||||
See accompanying Notes to Consolidated Financial Statements.
F-72
Table of Contents
BYLINE BANCORP, INC. AND SUBSIDIARIES
CONSOLIDATED STATEMENTS OF CASH FLOWS
Three Months Ended March 31, 2017 and 2016
(Amounts in thousands) (Unaudited)
| Three Months
Ended |
||||||||
| 2017 |
2016 |
|||||||
| CASH FLOWS FROM OPERATING ACTIVITIES |
||||||||
| Net income (loss) |
$ | 6,560 | $ | (1,352 | ) | |||
| Adjustments to reconcile net income (loss) to net cash from operating activities: |
||||||||
| Provision for loan and lease losses |
1,891 | 2,513 | ||||||
| Depreciation and amortization of premises and equipment |
1,298 | 1,390 | ||||||
| Net amortization of securities |
1,184 | 1,823 | ||||||
| Net gains on sales of securities available-for-sale |
(8 | ) | (923 | ) | ||||
| Net gains on sales of assets held for sale |
(162 | ) | — | |||||
| Net gains on sales of loans |
(8,082 | ) | — | |||||
| Originations of mortgage loans held for sale |
(4 | ) | (840 | ) | ||||
| Proceeds from mortgage loans sold |
155 | 894 | ||||||
| Originations of government guaranteed loans |
(61,918 | ) | — | |||||
| Proceeds from government guaranteed loans sold |
70,410 | — | ||||||
| Accretion of premiums and discounts on acquired loans, net |
(7,955 | ) | (9,326 | ) | ||||
| Net change in servicing assets |
(132 | ) | — | |||||
| Net valuation adjustments on other real estate owned |
276 | (81 | ) | |||||
| Net gains on sales of other real estate owned |
(1,228 | ) | (35 | ) | ||||
| Amortization of intangible assets |
769 | 747 | ||||||
| Amortization of time deposit premium |
(463 | ) | (24 | ) | ||||
| Amortization of Federal Home Loan Bank advances premium |
(52 | ) | — | |||||
| Accretion of junior subordinated debentures discount |
204 | 222 | ||||||
| Share-based compensation expense |
286 | 181 | ||||||
| Deferred tax asset |
4,220 | — | ||||||
| Increase in cash surrender value of bank owned life insurance |
(119 | ) | (115 | ) | ||||
| Changes in assets and liabilities: |
||||||||
| Accrued interest receivable |
(666 | ) | (1,400 | ) | ||||
| Other assets |
588 | 521 | ||||||
| Accrued interest payable |
(534 | ) | 188 | |||||
| Accrued expenses and other liabilities |
(1,418 | ) | (3,637 | ) | ||||
|
|
|
|
|
|||||
| Net cash provided by (used in) operating activities |
5,100 | (9,254 | ) | |||||
|
|
|
|
|
|||||
| CASH FLOWS FROM INVESTING ACTIVITIES |
||||||||
| Purchases of securities available-for-sale |
(745 | ) | (38,252 | ) | ||||
| Proceeds from maturities and calls of securities available-for-sale |
1,182 | 4,500 | ||||||
| Proceeds from paydowns of securities available-for-sale |
17,718 | 26,992 | ||||||
| Proceeds from sales of securities available-for-sale |
8 | 140,001 | ||||||
| Purchases of securities held-to-maturity |
— | (48,482 | ) | |||||
| Proceeds from paydowns of securities held-to-maturity |
5,337 | 3,947 | ||||||
| Purchases of Federal Home Loan Bank stock |
(2,610 | ) | (2,742 | ) | ||||
| Federal Home Loan Bank stock repurchases |
8,100 | — | ||||||
| Proceeds from other loans sold |
9,984 | — | ||||||
| Net change in loans and leases |
(9,403 | ) | (153,365 | ) | ||||
| Purchases of premises and equipment |
(797 | ) | (1,484 | ) | ||||
| Proceeds from sales of assets held for sale |
2,752 | — | ||||||
| Proceeds from sales of other real estate owned |
5,148 | 4,756 | ||||||
|
|
|
|
|
|||||
| Net cash provided by (used in) investing activities |
36,674 | (64,129 | ) | |||||
See accompanying Notes to Consolidated Financial Statements.
F-73
Table of Contents
BYLINE BANCORP, INC. AND SUBSIDIARIES
CONSOLIDATED STATEMENTS OF CASH FLOWS
Three Months Ended March 31, 2017 and 2016
(Amounts in thousands) (Unaudited)
| Three Months
Ended |
||||||||
| 2017 |
2016 |
|||||||
| CASH FLOWS FROM FINANCING ACTIVITIES |
||||||||
| Net increase in deposits |
$ | 85,908 | $ | 67,963 | ||||
| Proceeds from Federal Home Loan Bank advances |
825,000 | 1,917,000 | ||||||
| Repayments of Federal Home Loan Bank advances |
(929,000 | ) | (1,943,000 | ) | ||||
| Repayments of line of credit |
(2,500 | ) | — | |||||
| Net increase (decrease) in other borrowings |
14,691 | (237 | ) | |||||
| Dividends paid on preferred stock |
(189 | ) | — | |||||
| Proceeds from issuance of common stock |
— | 35,018 | ||||||
| Proceeds from issuance of preferred stock |
1,050 | — | ||||||
|
|
|
|
|
|||||
| Net cash provided by (used in) financing activities |
(5,040 | ) | 76,744 | |||||
|
|
|
|
|
|||||
| NET INCREASE IN CASH AND CASH EQUIVALENTS |
36,734 | 3,361 | ||||||
| CASH AND CASH EQUIVALENTS, beginning of period |
46,533 | 44,884 | ||||||
|
|
|
|
|
|||||
| CASH AND CASH EQUIVALENTS, end of period |
$ | 83,267 | $ | 48,245 | ||||
|
|
|
|
|
|||||
| SUPPLEMENTAL DISCLOSURES OF CASH FLOW INFORMATION: |
||||||||
| Cash paid during the period for interest |
$ | 3,795 | $ | 1,371 | ||||
|
|
|
|
|
|||||
| Cash payments (refunds) during the period for taxes |
$ | 832 | $ | (250 | ) | |||
|
|
|
|
|
|||||
| SUPPLEMENTAL DISCLOSURES OF NON-CASH INVESTING AND FINANCING ACTIVITIES: |
||||||||
| Change in fair value of available-for-sale securities, net of tax |
$ | 386 | $ | 8,889 | ||||
|
|
|
|
|
|||||
| Change in fair value of cash flow hedges, net of tax |
$ | (18 | ) | $ | — | |||
|
|
|
|
|
|||||
| Delayed payments of mortgage-backed securities |
$ | 372 | $ | 788 | ||||
|
|
|
|
|
|||||
| Due to broker settlement |
$ | (9,978 | ) | $ | — | |||
|
|
|
|
|
|||||
| Transfers of loans to loans held for sale |
$ | 10,061 | $ | — | ||||
|
|
|
|
|
|||||
| Transfers of loans to other real estate owned |
$ | 799 | $ | 2,391 | ||||
|
|
|
|
|
|||||
| Transfers of land and premises to assets held for sale |
$ | 1,508 | $ | — | ||||
|
|
|
|
|
|||||
| Transfers of premises and equipment to other assets |
$ | 502 | $ | — | ||||
|
|
|
|
|
|||||
See accompanying Notes to Consolidated Financial Statements.
F-74
Table of Contents
BYLINE BANCORP, INC. AND SUBSIDIARIES
NOTES TO CONDENSED CONSOLIDATED FINANCIAL STATEMENTS
(Table dollars in thousands, except share and per share data) (Unaudited)
Note 1—Basis of Presentation
These unaudited condensed consolidated financial statements include the accounts of Byline Bancorp, Inc., a Delaware corporation (the “Company,” “we,” “us,” “our”), a bank holding company whose principal activity is the ownership and management of its Illinois state chartered subsidiary bank, Byline Bank (the “Bank”), based in Chicago, Illinois.
These unaudited interim financial statements have been prepared in accordance with accounting principles generally accepted in the United States of America (“GAAP”) for interim financial information and in accordance with the instructions to Form 10-Q and Article 10 of Regulation S-X as promulgated by the Securities and Exchange Commission (“SEC”). In preparing these financial statements, the Company has evaluated events and transactions subsequent to March 31, 2017 for potential recognition or disclosure. In the opinion of management, all adjustments (consisting of normal recurring accruals) considered necessary for a fair presentation of the financial position and results of operations for the periods presented have been included. Certain information in footnote disclosures normally included in financial statements prepared in accordance with GAAP has been condensed or omitted pursuant to the rules and regulations of the SEC and the accounting standards for interim financial statements. These financial statements should be read in conjunction with the Company’s Consolidated Financial Statements and notes thereto for the years ended December 31, 2016 and 2015.
In accordance with the Financial Accounting Standards Board (“FASB”) Accounting Standards Codification (“ASC”) Topic 855, “Subsequent Events,” the Company’s management has evaluated subsequent events for potential recognition or disclosure through the date of the issuance of these consolidated financial statements. No subsequent events were identified that would have required a change to the consolidated financial statements or disclosure in the notes to the consolidated financial statements, other than as disclosed in Note 20, Subsequent Events.
On June 14, 2017, stockholders of record as of May 22, 2017 voted to approve an Agreement and Plan of Merger between Byline Bancorp, Inc., an Illinois corporation (“Byline Illinois”), and Byline Bancorp, Inc., a wholly owned Delaware subsidiary of the Company, including the amended and restated certificate of incorporation and by-laws of the Company. Each share of Byline Illinois common stock issued and outstanding immediately prior to the effective time of the Merger was converted automatically into the right to receive one fifth (0.20) of a share of common stock of the Company. Fractional shares are to be paid in cash based on the initial public offering price of Byline Bancorp, Inc. common stock.
Certain prior period amounts have been reclassified to conform to current period presentation. These reclassifications did not result in any changes to previously reported net income or stockholders’ equity.
Note 2—Recently Issued Accounting Pronouncements
The following reflect recent accounting pronouncements that have been adopted or are pending adoption by the Company. As the Company qualifies as an emerging growth company and has elected the extended transition period for complying with new or revised accounting pronouncements, it is not subject to new or revised accounting standards applicable to public companies during the extended transition period. The accounting pronouncements pending adoption below reflect effective dates for the Company as an emerging growth company with the extended transition period.
Revenue from Contracts with Customers In May 2014, FASB issued Accounting Standards Update (“ASU”) No. 2014-09, deferred by ASU No. 2015-14 and clarifying standards, Revenue from Contracts with
F-75
Table of Contents
BYLINE BANCORP, INC. AND SUBSIDIARIES
NOTES TO CONDENSED CONSOLIDATED FINANCIAL STATEMENTS
(Table dollars in thousands, except share and per share data) (Unaudited)
Note 2—Recently Issued Accounting Pronouncements (Continued)
Customers, which creates Topic 606 and supersedes Topic 605, Revenue Recognition. The core principle of Topic 606 is that an entity recognizes revenue to depict the transfer of promised goods or services to customers in an amount that reflects the consideration to which the entity expects to be entitled in exchange for those goods or services. In general, the new guidance requires companies to use more judgment and make more estimates than under current guidance, including identifying performance obligations in the contract, estimating the amount of variable consideration to include in the transaction price and allocating the transaction price to each separate performance obligation. Under the terms of ASU No. 2015-14 the standard is effective for interim and annual periods beginning after December 15, 2017. Early application is permitted only as of annual reporting periods beginning after December 15, 2016, including interim reporting periods within that reporting period. For financial reporting purposes, the standard allows for either full retrospective adoption, meaning the standard is applied to all of the periods presented, or modified retrospective adoption, meaning the standard is applied only to the most current period presented in the financial statements with the cumulative effect of initially applying the standard recognized at the date of initial application. The Company is currently evaluating the provisions of ASU No. 2014-09 to determine the potential impact the standard will have on the Company’s Consolidated Financial Statements. As a financial institution, the Company’s largest component of revenue, interest income, is excluded from the scope of this ASU. The Company is currently evaluating which, if any, of its sources of non-interest income will be impacted by this ASU. The Company expects to adopt this new guidance on January 1, 2019, with a cumulative effect adjustment to opening retained earnings, if such adjustment is deemed to be significant. In April 2016, FASB issued ASU No. 2016-10, Identifying Performance Obligations and Licensing. The amendments in this ASU do not change the core principle of the guidance in Topic 606. Rather, the amendments in this ASU clarify the following two aspects of Topic 606: (1) identifying performance obligations and (2) licensing implementation guidance, while retaining the related principles for those areas. The amendments in this ASU affect the guidance in ASU 2014-09, discussed above, which is not yet effective. The effective date and transition requirements for the amendments in this ASU are the same as the effective date and transition requirements in Topic 606, Revenues from Contracts with Customers. The Company is evaluating the provisions of this ASU in conjunction with ASU No. 2014-09 to determine the potential impact Topic 606 and its amendments will have on the Company’s Consolidated Financial Statements.
In May 2016, FASB issued ASU No. 2016-12, Narrow-Scope Improvements and Practical Expedients, amending ASC Topic 606, Revenue from Contracts with Customers. The amendments in this ASU do not change the core principle of the guidance in Topic 606. Rather, the amendments in this ASU affect only several narrow aspects of Topic 606. The amendments in this ASU affect the guidance in ASU 2014-09, discussed above, which is not yet effective. The effective date and transition requirements for the amendments in this ASU are the same as the effective date and transition requirements in Topic 606. The Company is evaluating the provisions of this ASU in conjunction with ASU No. 2014-09 to determine the potential impact Topic 606 and its amendments will have on the Company’s Consolidated Financial Statements.
Customer’s Accounting for Fees Paid in a Cloud Computing Arrangement In April 2015, FASB issued ASU No. 2015-05, Customer’s Accounting for Fees Paid in a Cloud Computing Arrangement. The amendments in this ASU provide guidance to customers in cloud computing arrangements about whether a cloud computing arrangement includes a software license. If a cloud computing arrangement includes a software license, the customer should account for the software license element of the arrangement consistent with the acquisition of other software licenses. If a cloud computing arrangement does not include a software license, the customer should account for the arrangement as a service contract. The amendments were effective for annual periods, including interim periods within those annual periods, beginning after December 15, 2015 and were adopted by the Company as of January 1, 2016. This ASU did not have a material effect on the Company’s Consolidated Financial Statements.
F-76
Table of Contents
BYLINE BANCORP, INC. AND SUBSIDIARIES
NOTES TO CONDENSED CONSOLIDATED FINANCIAL STATEMENTS
(Table dollars in thousands, except share and per share data) (Unaudited)
Note 2—Recently Issued Accounting Pronouncements (Continued)
Business Combinations—Simplifying the Accounting for Measurement-Period Adjustments In September 2015, FASB issued ASU No. 2015-16, Simplifying the Accounting for Measurement-Period Adjustments. The amendments in this ASU require that an acquirer recognize adjustments to provisional amounts that are identified during the measurement period in the reporting period when the adjustment amounts are determined. The acquirer is required to record in the same period’s financial statements the effect on earnings from changes in depreciation, amortization, or other income effects resulting from the change to provisional amounts, calculated as if the accounting had been completed at the acquisition date. The acquirer must present separately on the income statement, or disclose in the notes, the amount recorded in current-period earnings that would have been recorded in previous reporting periods if the provisional amount had been recognized at the acquisition date. The amendments in this ASU were effective for fiscal years beginning after December 15, 2015. The Company adopted this new authoritative guidance on January 1, 2016, and it did not have an impact on the Company’s Consolidated Financial Statements, but may in the future.
Recognition and Measurement of Financial Assets and Financial Liabilities In January 2016, FASB issued ASU No. 2016-01, Recognition and Measurement of Financial Assets and Financial Liabilities. The amendments in this ASU require equity securities to be measured at fair value with changes in the fair value recognized through net income. The amendments allow equity investments that do not have readily determinable fair values to be remeasured at fair value under certain circumstances and require enhanced disclosures about those investments. The amendments simplify the impairment assessment of equity investments without readily determinable fair values. The amendments also eliminate the requirement to disclose the method(s) and significant assumptions used to estimate the fair value that is required to be disclosed for financial instruments measured at amortized cost on the balance sheet. The amendments in this ASU require separate presentation in other comprehensive income of the portion of the total change in the fair value of a liability resulting from a change in the instrument-specific credit risk when the entity has elected to measure the liability at fair value in accordance with the fair value option for financial instruments. This amendment excludes from net income gains or losses that the entity may not realize because those financial liabilities are not usually transferred or settled at their fair values before maturity. The amendments in this ASU require separate presentation of financial assets and financial liabilities by measurement category and form of financial asset (that is, securities or loans and receivables) on the balance sheet or in the accompanying notes to the financial statements. The amendments in this ASU are effective for fiscal years beginning after December 15, 2017, including interim periods within those fiscal years. The Company is currently evaluating the provisions of ASU No. 2016-01 to determine the potential impact the new standard will have on the Company’s Consolidated Financial Statements. Assuming the Company remains an emerging growth company, the new authoritative guidance will be effective for reporting periods after January 1, 2019 and is not expected to have a significant impact on the Company’s Consolidated Financial Statements.
Leases (Topic 842) In February 2016, FASB issued ASU No. 2016-02, Leases. The amendments in this ASU require lessees to recognize the following for all leases (with the exception of short-term) at the commencement date; a lease liability, which is a lessee‘s obligation to make lease payments arising from a lease, measured on a discounted basis; and a right-of-use asset, which is an asset that represents the lessee’s right to use, or control the use of, a specified asset for the lease term. The amendments in this ASU leave lessor accounting largely unchanged, although certain targeted improvements were made to align lessor accounting with the lessee accounting model. This ASU simplifies the accounting for sale and leaseback transactions primarily because lessees must recognize lease assets and lease liabilities. Lessees will no longer be provided with a source of off-balance sheet financing. The amendments in this ASU are effective for fiscal years beginning after December 15, 2018, including interim periods within those fiscal years. Early application is
F-77
Table of Contents
BYLINE BANCORP, INC. AND SUBSIDIARIES
NOTES TO CONDENSED CONSOLIDATED FINANCIAL STATEMENTS
(Table dollars in thousands, except share and per share data) (Unaudited)
Note 2—Recently Issued Accounting Pronouncements (Continued)
permitted upon issuance. Lessees (for capital and operating leases) and lessors (for sales-type, direct financing, and operating leases) must apply a modified retrospective transition approach for leases existing at, or entered into after, the beginning of the earliest comparative period presented in the financial statements. The modified retrospective approach would not require any transition accounting for leases that expired before the earliest comparative period presented. Lessees and lessors may not apply a full retrospective transition approach. The Company is evaluating the new guidance and its impact on the Company’s Consolidated Statements of Operations and Consolidated Statements of Financial Condition. Assuming the Company remains an emerging growth company, the new authoritative guidance will be effective for reporting periods after January 1, 2020. The Company expects an increase in assets and liabilities as a result of recording additional lease contracts where the Company is lessee.
Derivatives and Hedging (Topic 815) In March 2016, FASB issued ASU No. 2016-05, Effect of Derivative Contract Novations on Existing Hedge Accounting Relationships. The amendments in this ASU clarify that a change in the counterparty to a derivative instrument that has been designated as the hedging instrument under Topic 815 (Derivatives and Hedging) does not, in and of itself, require dedesignation of that hedging relationship provided that all other hedge accounting criteria continue to be met. The amendments in this ASU are effective for financial statements issued for fiscal years beginning after December 15, 2016, and interim periods within those fiscal years. An entity has an option to apply the amendments in this ASU on either a prospective basis or a modified retrospective basis. Early adoption is permitted, including adoption in an interim period. This ASU became effective for the Company on January 1, 2017 and did not have a material impact on the Company’s Consolidated Financial Statements.
In March 2016, FASB issued ASU No. 2016-06, Contingent Put and Call Options in Debt Instruments. The amendments in this ASU clarify the requirements for assessing whether contingent call (put) options that can accelerate the payment of principal on debt instruments are clearly and closely related to their debt hosts. To determine how to account for debt instruments with embedded features, including contingent put and call options, an entity is required to assess whether the embedded derivatives must be bifurcated from the host contract and accounted for separately. Part of this assessment consists of evaluating whether the embedded derivative features are clearly and closely related to the debt host. Under existing guidance, for contingently exercisable options to be considered clearly and closely related to a debt host, they must be indexed only to interest rates or credit risk. ASU 2016-06 addresses inconsistent interpretations of whether an event that triggers an entity’s ability to exercise the embedded contingent option must be indexed to interest rates or credit risk for that option to qualify as clearly and closely related. Diversity in practice has developed because the existing four-step decision sequence in ASC 815 focuses only on whether the payoff was indexed to something other than an interest rate or credit risk. As a result, entities have been uncertain whether they should (1) determine whether the embedded features are clearly and closely related to the debt host solely on the basis of the four-step decision sequence or (2) first apply the four-step decision sequence and then also evaluate whether the event triggering the exercisability of the contingent put or call option is indexed only to an interest rate or credit risk. This ASU clarifies that in assessing whether an embedded contingent put or call option is clearly and closely related to the debt host, an entity is required to perform only the four-step decision sequence in ASC 815 as amended by this ASU. The entity does not have to separately assess whether the event that triggers its ability to exercise the contingent option is itself indexed only to interest rates or credit risk. The amendments in this ASU are effective for financial statements issued for fiscal years beginning after December 15, 2016, and interim periods within those fiscal years. This ASU became effective for the Company on January 1, 2017 and did not have a material impact on the Company’s Consolidated Financial Statements.
F-78
Table of Contents
BYLINE BANCORP, INC. AND SUBSIDIARIES
NOTES TO CONDENSED CONSOLIDATED FINANCIAL STATEMENTS
(Table dollars in thousands, except share and per share data) (Unaudited)
Note 2—Recently Issued Accounting Pronouncements (Continued)
Compensation—Stock Compensation (Topic 718) In March 2016, FASB issued ASU No. 2016-09, Improvements to Employee Share-Based Payment Accounting. FASB issued this ASU as part of its Simplification Initiative. The areas for simplification in this ASU involve several aspects of the accounting for share-based payment transactions, including the income tax consequences, classification of awards as either equity or liabilities, and classification on the statement of cash flows. Amendments in this ASU relate to the timing of when excess tax benefits are recognized, minimum statutory withholding requirements, forfeitures, and intrinsic value should be applied using a modified retrospective transition method by means of a cumulative-effect adjustment to equity as of the beginning of the period in which the guidance is adopted. Amendments related to the presentation of employee taxes paid on the statement of cash flows when an employer withholds shares to meet the minimum statutory withholding requirement should be applied retrospectively. Amendments in this ASU require recognition of excess tax benefits and tax deficiencies in the income statement and the practical expedient for estimating expected term should be applied prospectively.
An entity may elect to apply the amendments in this ASU related to the presentation of excess tax benefits on the statement of cash flows using either a prospective transition method or a retrospective transition method. The amendments in this ASU are effective for annual periods beginning after December 15, 2016, and interim periods within those annual periods. This ASU became effective for the Company on January 1, 2017 and did not have a material impact on the Company’s Consolidated Financial Statements.
In May 2017, the FASB issued ASU 2017-09, Scope of Modification Accounting. The new standard provides guidance about which changes to the terms or conditions of a share-based payment award require an entity to apply modification accounting in Topic 718. This pronouncement is effective for annual reporting periods beginning after December 15, 2017 but early adoption is permitted. The Company is currently evaluating the impact of adopting this guidance.
Financial Instruments—Credit Losses (Topic 326) In June 2016, FASB issued ASU No. 2016-13, Measurement of Credit Losses on Financial Instruments. Current GAAP requires an “incurred loss” methodology for recognizing credit losses that delays recognition until it is probable a loss has been incurred. The main objective of this ASU is to provide financial statement users with more decision-useful information about the expected credit losses on financial instruments and other commitments to extend credit held by a reporting entity at each reporting date. The amendments in this ASU replace the incurred loss impairment methodology in current GAAP with a methodology that reflects expected credit losses and requires consideration of a broader range of reasonable and supportable information to inform credit loss estimates. The amendments in this ASU require a financial asset (or group of financial assets) measured at amortized cost basis to be presented at the net amount expected to be collected. The allowance for credit losses is a valuation account that is deducted from the amortized cost basis of the financial asset(s) to present the net carrying value at the amount expected to be collected on the financial asset. The measurement of expected credit losses will be based on relevant information about past events, including historical experience, current conditions, and reasonable and supportable forecasts that affect the collectability of the reported amount. The amendments in this ASU broaden the information that an entity must consider in developing its expected credit loss estimate for assets measured either collectively or individually. The use of forecasted information incorporates more timely information in the estimate of expected credit loss, which will be more decision useful to users of the financial statements. The amendments in this ASU will be effective for fiscal years beginning after December 15, 2019, including interim periods within those fiscal years. Assuming the Company remains an emerging growth company, the new authoritative guidance will be effective for reporting periods after January 1, 2021. The Company is still evaluating the effects this ASU will have on the Company’s Consolidated Financial Statements. While the
F-79
Table of Contents
BYLINE BANCORP, INC. AND SUBSIDIARIES
NOTES TO CONDENSED CONSOLIDATED FINANCIAL STATEMENTS
(Table dollars in thousands, except share and per share data) (Unaudited)
Note 2—Recently Issued Accounting Pronouncements (Continued)
Company has not quantified the impact of this ASU, it does expect changing from the current incurred loss model to an expected loss model will result in an earlier recognition of losses.
Statement of Cash Flows (Topic 230) In August 2016, FASB issued ASU No. 2016-15, Classification of Certain Cash Receipts and Cash Payments. There is diversity in practice in how certain cash receipts and cash payments are presented and classified in the statement of cash flows under Topic 230 and other Topics. This ASU addresses eight specific cash flow issues with the objective of reducing the existing diversity in practice. Those eight issues are (1) debt prepayment or debt extinguishment costs, (2) settlement of zero-coupon debt instruments or other debt instruments with coupon interest rates that are insignificant in relation to the effective interest rate of the borrowing, (3) contingent consideration payments made after a business combination, (4) proceeds from the settlement of insurance claims, (5) proceeds from the settlement of corporate-owned life insurance policies, including bank-owned life insurance policies, (6) distributions received from equity method investees, (7) beneficial interests in securitization transactions, and (8) separately identifiable cash flows and application of the predominance principle. Current GAAP either is unclear or does not include specific guidance on these eight cash flow classification issues. These amendments provide guidance for each of the eight issues, thereby reducing current and potential future diversity in practice. The amendments in this ASU are effective for fiscal years beginning after December 15, 2017, and interim periods within those fiscal years. Early adoption is permitted, including adoption in an interim period. Assuming the Company remains an emerging growth company, the new authoritative guidance will be effective for reporting periods after January 1, 2019. The Company is currently evaluating the provisions of ASU No. 2016-15 to determine the potential impact the new standard will have on the Company’s Consolidated Financial Statements.
In November 2016, the FASB issued ASU No. 2016-18, Statement of Cash Flows (230), Restricted Cash. The ASU will require that a statement of cash flows explain the change during the period in the total of cash, cash equivalents, and amounts generally described as restricted cash or restricted cash equivalents. Therefore, amounts generally described as restricted cash and restricted cash equivalents should be included with cash and cash equivalents when reconciling the beginning-of-period and end-of-period total amounts shown on the statement of cash flows. The amendments in this update apply to all entities that have restricted cash or restricted cash equivalents and are required to present a statement of cash flows under Topic 230. The amendment is effective for annual reporting periods beginning after December 15, 2017, and interim periods within those fiscal years. Early adoption of the update is permitted. Assuming the Company remains an emerging growth company, the new authoritative guidance will be effective for reporting periods after January 1, 2019. The Company does not expect this ASU to have a material impact on the Company’s Consolidated Financial Statements.
Income Taxes (Topic 740) In October 2016, the FASB issued ASU No. 2016-16, Income Taxes, Intra-Entity Transfers of Assets Other Than Inventory. The ASU was issued to improve the accounting for income tax consequences of intra-entity transfers of assets other than inventory. Current GAAP prohibits the recognition of current and deferred income taxes for an intra-entity asset transfer until the asset has been sold to an outside party; this update clarifies that an entity should recognize the income tax consequences of an intra-entity transfer of assets other than inventory when the transfer occurs. The amendment is effective for annual reporting periods beginning after December 15, 2017, and interim periods within those fiscal years. Early adoption of the update is permitted. Assuming the Company remains an emerging growth company, the new authoritative guidance will be effective for reporting periods after January 1, 2019. The Company does not expect this ASU to have a material impact on the Company’s Consolidated Financial Statements.
F-80
Table of Contents
BYLINE BANCORP, INC. AND SUBSIDIARIES
NOTES TO CONDENSED CONSOLIDATED FINANCIAL STATEMENTS
(Table dollars in thousands, except share and per share data) (Unaudited)
Note 2—Recently Issued Accounting Pronouncements (Continued)
Consolidation (Topic 810) In October 2016, the FASB issued ASU No. 2016-17, Consolidation, Interests Held through Related Parties That Are under Common Control. The ASU was issued to amend the consolidation guidance on how a reporting entity that is the single decision maker of a variable interest entity (“VIE”) should treat indirect interests in the entity held through related parties that are under common control with the reporting entity when determining whether it is the primary beneficiary of that VIE. The primary beneficiary of a VIE is the reporting entity that has a controlling financial interest in a VIE and, therefore, consolidates the VIE. A reporting entity has an indirect interest in a VIE if it has a direct interest in a related party that, in turn, has a direct interest in the VIE. The amendment is effective for annual reporting periods beginning after December 15, 2016, and interim periods within those fiscal years. Early adoption of the update is permitted. The Company adopted this new authoritative guidance on January 1, 2017 and it did not have an impact on the Company’s Consolidated Financial Statements.
Business Combinations (Topic 805) In January 2017, the FASB issued ASU No. 2017-01, Clarifying the Definition of a Business. The guidance clarifies the definition of a business to assist entities with evaluating whether transactions should be accounted for as acquisitions or disposals of assets or businesses. This guidance is effective for annual and interim periods beginning after December 15, 2017. Early adoption is permitted. Assuming the Company remains an emerging growth company, the new authoritative guidance will be effective for reporting periods after January 1, 2019. The Company does not expect a material impact of this ASU on the Company’s Consolidated Financial Statements.
Intangibles—Goodwill and Other (Topic 350) In January 2017, FASB issued ASU No. 2017-04, Simplifying the Test for Goodwill Impairment. The amendments in this ASU are intended to reduce the cost and complexity of the goodwill impairment test by eliminating step two from the impairment test. The amendments modify the concept of impairment from the condition that exists when the carrying amount of goodwill exceeds its implied fair value to the condition that exists when the carrying amount of a reporting unit exceeds its fair value. Under the amendments in this ASU, an entity will perform its annual, or interim, goodwill impairment test by comparing the fair value of the reporting unit with its carrying amount. An impairment charge should be recognized for the amount which the carrying amount exceeds the reporting unit’s fair value; however, the loss recognized should not exceed the total amount of goodwill allocated to that reporting unit. The amendments in this ASU are effective for the Company’s annual or any interim goodwill impairment test in fiscal years beginning after December 15, 2019. Early adoption is permitted for interim or annual goodwill impairment tests performed on testing dates after January 1, 2017. The Company is early adopting these amendments in 2017 and does not expect a material impact on the Company’s Consolidated Financial Statements.
Nonrefundable Fees and Other Costs (Subtopic 310-20) In March 2017, FASB issued ASU No. 2017-08, Receivables—Nonrefundable Fees and Other Costs. The amendments in the ASU shorten the amortization period for certain callable debt securities held at a premium at the earliest call date. Under current GAAP, the Company amortizes the premium as an adjustment of yield over the contractual life of the instrument. As a result, upon exercise of a call on a callable debt security held at a premium, the unamortized premium is charged to earnings. The ASU shortens the amortization period for certain callable debt securities held at a premium and requires the premium to be amortized to the earliest call date. However, the amendments do not require an accounting change for securities held at a discount; the discount continues to be amortized to maturity. The amendments are effective for annual periods beginning after December 15, 2019, and interim periods within annual periods beginning after December 15, 2020. Early adoption is permitted. The Company is required to apply the amendments on a modified retrospective basis through a cumulative-effect adjustment directly to retained earnings as of the beginning of the period of adoption. Assuming the Company remains an emerging
F-81
Table of Contents
BYLINE BANCORP, INC. AND SUBSIDIARIES
NOTES TO CONDENSED CONSOLIDATED FINANCIAL STATEMENTS
(Table dollars in thousands, except share and per share data) (Unaudited)
Note 2—Recently Issued Accounting Pronouncements (Continued)
growth company, the new authoritative guidance will be effective for reporting periods after January 1, 2020. The Company is currently evaluating the provisions of ASU No. 2017-08 to determine the potential impact the new standard will have on the Company’s Consolidated Financial Statements.
Other Income (Subtopic 610-20) In February 2017, the FASB issued ASU No. 2017-05, Other Income-Gains and Losses from the Derecognition of Nonfinancial Assets. This ASU will clarify the scope of Subtopic 610-20 and add guidance for partial sales of nonfinancial assets. The amendments should be applied either on retrospectively to each period presented or with a modified retrospective approach. The amendment is effective for annual periods beginning after December 15, 2018, and interim periods within annual periods beginning after December 15, 2019. The Company is currently evaluating the provisions of ASU No. 2017-05 to determine the potential impact the new standard will have on the Company’s Consolidated Financial Statements.
Note 3—Acquisition of a Business
On October 14, 2016, the Company acquired stock of Ridgestone and its subsidiaries under the terms of a definitive merger agreement (“Agreement”) dated June 9, 2016. Ridgestone operated two wholly-owned subsidiaries, Ridgestone Bank and RidgeStone Capital Trust I, and specializes in government guaranteed lending as a participant in the SBA and USDA lending programs. Ridgestone provided financial services through its two full-service banking offices in Brookfield, Wisconsin and Schaumburg, Illinois. In addition, Ridgestone had loan production offices located in Wisconsin (Green Bay and Wausau), Indiana (Indianapolis) and California (Newport Beach).
Under the terms of the Agreement, each Ridgestone common share was converted into the right to receive, at the election of the stockholder (subject to proration as outlined in the Agreement), either cash or Company common stock, or the combination of both. Total consideration included aggregate cash in the amount of $36.8 million and the issuance of 4,199,791 shares of the Company’s common stock valued at $16.25 per common share. The transaction resulted in goodwill of $26.3 million, which is nondeductible for tax purposes, as this acquisition was a nontaxable transaction. Goodwill represents the premium paid over the fair value of the net tangible and intangible assets acquired and reflects related synergies expected from the combined operations. Acquisition advisory expenses related to the Ridgestone acquisition of $1.6 million are reflected in non-interest expense on the Consolidated Statements of Operations. Stock issuance costs were not material. There were no contingent assets or liabilities arising from the acquisition.
The acquisition of Ridgestone was accounted for using the acquisition method of accounting in accordance with ASC 805. Assets acquired, liabilities assumed and consideration exchanged were recorded at their respective acquisition date fair values. Determining the fair value of assets and liabilities involves significant judgment regarding methods and assumptions used to calculate estimated fair values. Fair values are preliminary and subject to refinement for up to one year after the closing date of the acquisition as additional information regarding the closing date fair values become available. Fair values are preliminary estimates due to deferred tax assets and deferred tax liabilities.
F-82
Table of Contents
BYLINE BANCORP, INC. AND SUBSIDIARIES
NOTES TO CONDENSED CONSOLIDATED FINANCIAL STATEMENTS
(Table dollars in thousands, except share and per share data) (Unaudited)
Note 3—Acquisition of a Business (Continued)
The following table presents a summary of the estimates of fair values of assets acquired and liabilities assumed as of the acquisition date:
| Assets |
||||
| Cash and cash equivalents |
$ | 25,480 | ||
| Securities available-for-sale |
27,662 | |||
| Restricted stock |
931 | |||
| Loans held for sale |
15,363 | |||
| Loans |
351,820 | |||
| Servicing assets |
20,295 | |||
| Premises and equipment |
2,011 | |||
| Other real estate owned |
1,525 | |||
| Other intangible assets |
486 | |||
| Bank-owned life insurance |
2,352 | |||
| Other assets |
8,228 | |||
|
|
|
|||
| Total assets acquired |
456,153 | |||
| Liabilities |
||||
| Deposits |
361,370 | |||
| Federal Home Loan Bank advances |
9,773 | |||
| Junior subordinated debentures |
1,339 | |||
| Accrued expenses and other liabilities |
4,958 | |||
|
|
|
|||
| Total liabilities assumed |
377,440 | |||
|
|
|
|||
| Net assets acquired |
$ | 78,713 | ||
|
|
|
|||
| Consideration paid |
||||
| Common stock (4,199,791 shares issued at $16.25 per share) |
68,247 | |||
| Cash paid |
36,753 | |||
|
|
|
|||
| Total consideration paid |
105,000 | |||
|
|
|
|||
| Goodwill |
$ | 26,287 | ||
|
|
|
The following table presents the acquired non-impaired loans as of the acquisition date:
| Fair value |
$ | 312,166 | ||
| Gross contractual amounts receivable |
450,292 | |||
| Estimate of contractual cash flows not expected to be collected(1) |
19,661 | |||
| Estimate of contractual cash flows expected to be collected |
430,631 |
| (1) | Includes interest payments not expected to be collected due to loan prepayments as well as principal and interest payments not expected to be collected due to customer default. |
The discount on the acquired non-impaired loans is being accreted into income over the life of the loans on an effective yield basis.
F-83
Table of Contents
BYLINE BANCORP, INC. AND SUBSIDIARIES
NOTES TO CONDENSED CONSOLIDATED FINANCIAL STATEMENTS
(Table dollars in thousands, except share and per share data) (Unaudited)
Note 3—Acquisition of a Business (Continued)
The following table provides the pro forma information for the results of operations for the three months ended March 31, 2016, as if the acquisition had occurred on January 1, 2016. The pro forma results combine the historical results of Ridgestone into the Company’s Consolidated Statements of Operations, including the impact of certain acquisition accounting adjustments, which includes loan discount accretion, intangible assets amortization, deposit premium accretion and borrowing discount amortization. The pro forma results have been prepared for comparative purposes only and are not necessarily indicative of the results that would have been obtained had the acquisition actually occurred on January 1, 2016. No assumptions have been applied to the pro forma results of operations regarding possible revenue enhancements, provision for credit losses, expense efficiencies or asset dispositions. The acquisition-related expenses that have been recognized are included in net income in the following table.
|
Three |
||||
| Total revenues (net interest income and non-interest income) |
$ | 41,359 | ||
| Net income (loss) |
$ | 3,771 | ||
| Earnings per share—basic |
$ | 0.17 | ||
| Earnings per share—diluted |
$ | 0.17 | ||
The operating results of the Company include the operating results produced by the acquired assets and assumed liabilities of Ridgestone for the period from January 1, 2017 through March 31, 2017. Revenues and earnings of the acquired company since the acquisition date have not been disclosed as it is not practicable as Ridgestone was merged into the Company and separate financial information is not readily available.
Note 4—Securities
The following tables summarize the amortized cost and fair values of securities available-for-sale and securities held-to-maturity as of the dates shown and the corresponding amounts of gross unrealized gains and losses:
| March 31, 2017 |
Amortized |
Gross |
Gross |
Fair Value |
||||||||||||
|
Available-for-sale |
||||||||||||||||
| U.S. Treasury Notes |
$ | 14,996 | $ | 1 | $ | (71 | ) | $ | 14,926 | |||||||
| U.S. Government agencies |
60,197 | 1 | (1,283 | ) | 58,915 | |||||||||||
| Obligations of states, municipalities, and political subdivisions |
16,336 | 70 | (216 | ) | 16,190 | |||||||||||
| Residential mortgage-backed securities |
||||||||||||||||
| Agency |
360,727 | 7 | (8,175 | ) | 352,559 | |||||||||||
| Non-agency |
19,470 | — | (207 | ) | 19,263 | |||||||||||
| Commercial mortgage-backed securities |
||||||||||||||||
| Agency |
77,128 | 47 | (1,597 | ) | 75,578 | |||||||||||
| Non-agency |
31,987 | — | (926 | ) | 31,061 | |||||||||||
| Corporate securities |
17,065 | 443 | (49 | ) | 17,459 | |||||||||||
| Other securities |
3,623 | 995 | (62 | ) | 4,556 | |||||||||||
|
|
|
|
|
|
|
|
|
|||||||||
| Total |
$ | 601,529 | $ | 1,564 | $ | (12,586 | ) | $ | 590,507 | |||||||
|
|
|
|
|
|
|
|
|
|||||||||
F-84
Table of Contents
BYLINE BANCORP, INC. AND SUBSIDIARIES
NOTES TO CONDENSED CONSOLIDATED FINANCIAL STATEMENTS
(Table dollars in thousands, except share and per share data) (Unaudited)
Note 4—Securities (Continued)
| Amortized |
Gross |
Gross |
Fair Value |
|||||||||||||
|
Held-to-maturity |
||||||||||||||||
| Obligations of states, municipalities, and political subdivisions |
$ | 24,828 | $ | 156 | $ | (130 | ) | $ | 24,854 | |||||||
| Residential mortgage-backed securities |
||||||||||||||||
| Agency |
63,530 | 198 | (222 | ) | 63,506 | |||||||||||
| Non-agency |
44,539 | 34 | (226 | ) | 44,347 | |||||||||||
|
|
|
|
|
|
|
|
|
|||||||||
| Total |
$ | 132,897 | $ | 388 | $ | (578 | ) | $ | 132,707 | |||||||
|
|
|
|
|
|
|
|
|
|||||||||
| December 31, 2016 |
Amortized |
Gross |
Gross |
Fair Value |
||||||||||||
|
Available-for-sale |
||||||||||||||||
| U.S. Treasury Notes |
$ | 14,995 | $ | 4 | $ | (79 | ) | $ | 14,920 | |||||||
| U.S. Government agencies |
60,180 | — | (1,323 | ) | 58,857 | |||||||||||
| Obligations of states, municipalities, and political subdivisions |
16,271 | 60 | (272 | ) | 16,059 | |||||||||||
| Residential mortgage-backed securities |
||||||||||||||||
| Agency |
376,800 | — | (8,640 | ) | 368,160 | |||||||||||
| Non-agency |
20,107 | — | (174 | ) | 19,933 | |||||||||||
| Commercial mortgage-backed securities |
||||||||||||||||
| Agency |
78,954 | — | (1,551 | ) | 77,403 | |||||||||||
| Non-agency |
32,061 | — | (1,009 | ) | 31,052 | |||||||||||
| Corporate securities |
17,065 | 350 | (86 | ) | 17,329 | |||||||||||
| Other securities |
4,161 | 742 | (56 | ) | 4,847 | |||||||||||
|
|
|
|
|
|
|
|
|
|||||||||
| Total |
$ | 620,594 | $ | 1,156 | $ | (13,190 | ) | $ | 608,560 | |||||||
|
|
|
|
|
|
|
|
|
|||||||||
| Amortized |
Gross |
Gross |
Fair Value |
|||||||||||||
|
Held-to-maturity |
||||||||||||||||
| Obligations of states, municipalities, and political subdivisions |
$ | 24,878 | $ | 105 | $ | (229 | ) | $ | 24,754 | |||||||
| Residential mortgage-backed securities |
||||||||||||||||
| Agency |
67,692 | 35 | (283 | ) | 67,444 | |||||||||||
| Non-agency |
46,276 | 50 | (442 | ) | 45,884 | |||||||||||
|
|
|
|
|
|
|
|
|
|||||||||
| Total |
$ | 138,846 | $ | 190 | $ | (954 | ) | $ | 138,082 | |||||||
|
|
|
|
|
|
|
|
|
|||||||||
The Company did not classify securities as trading during 2016 or the first quarter of 2017.
F-85
Table of Contents
BYLINE BANCORP, INC. AND SUBSIDIARIES
NOTES TO CONDENSED CONSOLIDATED FINANCIAL STATEMENTS
(Table dollars in thousands, except share and per share data) (Unaudited)
Note 4—Securities (Continued)
Gross unrealized losses and fair values, aggregated by investment category and length of time that individual securities have been in a continuous unrealized loss position as of March 31, 2017 and December 31, 2016 are summarized as follows:
| Less than 12 Months | 12 Months or Longer | Total | ||||||||||||||||||||||||||
| March 31, 2017 |
# of Securities |
Fair Value |
Unrealized Losses |
Fair Value |
Unrealized Losses |
Fair Value |
Unrealized Losses |
|||||||||||||||||||||
|
Available-for-sale |
||||||||||||||||||||||||||||
| U.S. Treasury Notes |
4 | $ | 12,927 | $ | (71 | ) | $ | — | $ | — | $ | 12,927 | $ | (71 | ) | |||||||||||||
| U.S. Government agencies |
9 | 57,915 | (1,283 | ) | — | — | 57,915 | (1,283 | ) | |||||||||||||||||||
| Obligations of states, municipalities and political subdivisions |
13 | 7,184 | (203 | ) | 116 | (13 | ) | 7,300 | (216 | ) | ||||||||||||||||||
| Residential mortgage-backed securities |
||||||||||||||||||||||||||||
| Agency |
39 | 330,757 | (8,024 | ) | 3,151 | (151 | ) | 333,908 | (8,175 | ) | ||||||||||||||||||
| Non-agency |
2 | 19,263 | (207 | ) | — | — | 19,263 | (207 | ) | |||||||||||||||||||
| Commercial mortgage-backed securities |
||||||||||||||||||||||||||||
| Agency |
7 | 57,318 | (1,525 | ) | 6,278 | (72 | ) | 63,596 | (1,597 | ) | ||||||||||||||||||
| Non-agency |
5 | 31,061 | (926 | ) | — | — | 31,061 | (926 | ) | |||||||||||||||||||
| Corporate securities |
2 | 2,466 | (49 | ) | — | — | 2,466 | (49 | ) | |||||||||||||||||||
| Other securities |
1 | — | — | 1,994 | (62 | ) | 1,994 | (62 | ) | |||||||||||||||||||
|
|
|
|
|
|
|
|
|
|
|
|
|
|
|
|||||||||||||||
| Total |
82 | $ | 518,891 | $ | (12,288 | ) | $ | 11,539 | $ | (298 | ) | $ | 530,430 | $ | (12,586 | ) | ||||||||||||
|
|
|
|
|
|
|
|
|
|
|
|
|
|
|
|||||||||||||||
| Less than 12 Months | 12 Months or Longer | Total | ||||||||||||||||||||||||||
| # of Securities |
Fair Value |
Unrealized Losses |
Fair Value |
Unrealized Losses |
Fair Value |
Unrealized Losses |
||||||||||||||||||||||
|
Held-to-maturity |
||||||||||||||||||||||||||||
| Obligations of states, municipalities, and political subdivisions |
17 | $ | 12,052 | $ | (130 | ) | $ | — | $ | — | $ | 12,052 | $ | (130 | ) | |||||||||||||
| Residential mortgage-backed securities |
||||||||||||||||||||||||||||
| Agency |
11 | 23,563 | (222 | ) | — | — | 23,563 | (222 | ) | |||||||||||||||||||
| Non-agency |
5 | 29,152 | (226 | ) | — | — | 29,152 | (226 | ) | |||||||||||||||||||
|
|
|
|
|
|
|
|
|
|
|
|
|
|
|
|||||||||||||||
| Total |
33 | $ | 64,767 | $ | (578 | ) | $ | — | $ | — | $ | 64,767 | $ | (578 | ) | |||||||||||||
|
|
|
|
|
|
|
|
|
|
|
|
|
|
|
|||||||||||||||
F-86
Table of Contents
BYLINE BANCORP, INC. AND SUBSIDIARIES
NOTES TO CONDENSED CONSOLIDATED FINANCIAL STATEMENTS
(Table dollars in thousands, except share and per share data) (Unaudited)
Note 4—Securities (Continued)
| December 31, 2016 |
Less than 12 Months |
12 Months or Longer |
Total | |||||||||||||||||||||||||
| # of |
Fair Value |
Unrealized |
Fair |
Unrealized |
Fair Value |
Unrealized |
||||||||||||||||||||||
|
Available-for-sale |
||||||||||||||||||||||||||||
| U.S. Treasury Notes |
3 | $ | 9,918 | $ | (79 | ) | $ | — | $ | — | $ | 9,918 | $ | (79 | ) | |||||||||||||
| U.S. Government agencies |
10 | 58,857 | (1,323 | ) | — | — | 58,857 | (1,323 | ) | |||||||||||||||||||
| Obligations of states, municipalities and political subdivisions |
14 | 7,799 | (259 | ) | 115 | (13 | ) | 7,914 | (272 | ) | ||||||||||||||||||
| Residential mortgage-backed securities |
||||||||||||||||||||||||||||
| Agency |
41 | 364,713 | (8,483 | ) | 3,447 | (157 | ) | 368,160 | (8,640 | ) | ||||||||||||||||||
| Non-agency |
2 | 19,933 | (174 | ) | — | — | 19,933 | (174 | ) | |||||||||||||||||||
| Commercial mortgage-backed securities |
||||||||||||||||||||||||||||
| Agency |
8 | 70,762 | (1,488 | ) | 6,641 | (63 | ) | 77,403 | (1,551 | ) | ||||||||||||||||||
| Non-agency |
5 | 31,052 | (1,009 | ) | — | — | 31,052 | (1,009 | ) | |||||||||||||||||||
| Corporate securities |
4 | 5,097 | (78 | ) | 2,522 | (8 | ) | 7,619 | (86 | ) | ||||||||||||||||||
| Other securities |
1 | — | — | 1,994 | (56 | ) | 1,994 | (56 | ) | |||||||||||||||||||
|
|
|
|
|
|
|
|
|
|
|
|
|
|
|
|||||||||||||||
| Total |
88 | $ | 568,131 | $ | (12,893 | ) | $ | 14,719 | $ | (297 | ) | $ | 582,850 | $ | (13,190 | ) | ||||||||||||
|
|
|
|
|
|
|
|
|
|
|
|
|
|
|
|||||||||||||||
| Less than 12 Months | 12 Months or Longer | Total | ||||||||||||||||||||||||||
| # of Securities |
Fair Value |
Unrealized Losses |
Fair Value |
Unrealized Losses |
Fair Value |
Unrealized Losses |
||||||||||||||||||||||
|
Held-to-maturity |
||||||||||||||||||||||||||||
| Obligations of states, municipalities, and political subdivisions |
22 | $ | 16,235 | $ | (229 | ) | $ | — | $ | — | $ | 16,235 | $ | (229 | ) | |||||||||||||
| Residential mortgage-backed securities |
||||||||||||||||||||||||||||
| Agency |
15 | 52,156 | (283 | ) | — | — | 52,156 | (283 | ) | |||||||||||||||||||
| Non-agency |
5 | 29,245 | (442 | ) | — | — | 29,245 | (442 | ) | |||||||||||||||||||
|
|
|
|
|
|
|
|
|
|
|
|
|
|
|
|||||||||||||||
| Total |
42 | $ | 97,636 | $ | (954 | ) | $ | — | $ | — | $ | 97,636 | $ | (954 | ) | |||||||||||||
|
|
|
|
|
|
|
|
|
|
|
|
|
|
|
|||||||||||||||
Certain securities have fair values less than amortized cost and, therefore, contain unrealized losses. At March 31, 2017, the Company evaluated the securities which had an unrealized loss for other than temporary impairment and determined all declines in value to be temporary. There were 115 investment securities with unrealized losses at March 31, 2017, of which only two had a continuous unrealized loss position for 12 consecutive months or longer that is greater than 5% of amortized cost. The Company anticipates full recovery of amortized cost with respect to these securities by maturity, or sooner in the event of a more favorable market interest rate environment. The Company does not intend to sell these securities and it is not more likely than not that the Company will be required to sell them before recovery of their amortized cost basis, which may be at maturity.
F-87
Table of Contents
BYLINE BANCORP, INC. AND SUBSIDIARIES
NOTES TO CONDENSED CONSOLIDATED FINANCIAL STATEMENTS
(Table dollars in thousands, except share and per share data) (Unaudited)
Note 4—Securities (Continued)
The proceeds from all sales of securities were available-for-sale and the associated gains and losses for the three months ended March 31, 2017 and 2016 are listed below:
| For the three months March 31, |
||||||||
| 2017 | 2016 | |||||||
| Proceeds |
$ | 8 | $ | 140,001 | ||||
| Gross gains |
8 | 923 | ||||||
| Gross losses |
— | — | ||||||
The amount of net gains reclassified from accumulated other comprehensive loss into earnings for the three months ended March 31, 2017 and 2016 were $8,000 and $923,000, respectively.
Securities pledged at March 31, 2017 and December 31, 2016 had carrying amounts of $219.1 million and $178.6 million, respectively. At March 31, 2017 and December 31, 2016, of those pledged, the carrying amounts of securities pledged as collateral for public fund deposits were $172.9 million and $93.2 million, respectively, and for customer repurchase agreements of $39.4 million, $19.9 million, respectively. There were no securities pledged for advances from the Federal Home Loan Bank as of March 31, 2017. At December 31, 2016 the carrying amount of securities pledged for advances from the Federal Home Loan Bank were $58.7 million. Other securities were pledged for derivative positions, letters of credit and for purposes required or permitted by law. At March 31, 2017 and December 31, 2016, there were no holdings of securities of any one issuer, other than the U.S. Government and its agencies, in an amount greater than 10% of stockholders’ equity.
At March 31, 2017, the amortized cost and fair value of debt securities are shown by contractual maturity. Expected maturities may differ from contractual maturities if borrowers have the right to call or prepay obligations with or without call or prepayment penalties. Securities not due at a single maturity date are shown separately.
| Amortized Cost |
Fair Value |
|||||||
|
Available-for-sale |
||||||||
| Due in one year or less |
$ | 5,408 | $ | 5,407 | ||||
| Due from one to five years |
55,539 | 55,492 | ||||||
| Due from five to ten years |
41,656 | 40,724 | ||||||
| Due after ten years |
6,521 | 6,396 | ||||||
| Mortgage-backed securities |
489,312 | 478,461 | ||||||
| Other securities with no defined maturity |
3,093 | 4,027 | ||||||
|
|
|
|
|
|||||
| Total |
$ | 601,529 | $ | 590,507 | ||||
|
|
|
|
|
|||||
|
Held-to-maturity |
||||||||
| Due from one to five years |
$ | 528 | $ | 528 | ||||
| Due from five to ten years |
13,358 | 13,322 | ||||||
| Due after ten years |
10,942 | 11,004 | ||||||
| Mortgage-backed securities |
108,069 | 107,853 | ||||||
|
|
|
|
|
|||||
| Total |
$ | 132,897 | $ | 132,707 | ||||
|
|
|
|
|
|||||
F-88
Table of Contents
BYLINE BANCORP, INC. AND SUBSIDIARIES
NOTES TO CONDENSED CONSOLIDATED FINANCIAL STATEMENTS
(Table dollars in thousands, except share and per share data) (Unaudited)
Note 5—Loan and Lease Receivables
Outstanding loan and lease receivables as of the dates shown were categorized as follows:
| March 31, |
December 31, |
|||||||
| Commercial real estate |
$ | 823,500 | $ | 796,950 | ||||
| Residential real estate |
601,354 | 610,699 | ||||||
| Construction, land development, and other land |
105,592 | 141,122 | ||||||
| Commercial and industrial |
449,853 | 439,476 | ||||||
| Installment and other |
2,775 | 2,917 | ||||||
| Lease financing receivables |
159,489 | 155,999 | ||||||
|
|
|
|
|
|||||
| Total loans and leases |
2,142,563 | 2,147,163 | ||||||
| Net unamortized deferred fees and costs |
(2,215 | ) | (2,119 | ) | ||||
| Initial direct costs |
3,186 | 2,967 | ||||||
| Allowance for loan and lease losses |
(11,817 | ) | (10,923 | ) | ||||
|
|
|
|
|
|||||
| Net loans and leases |
$ | 2,131,717 | $ | 2,137,088 | ||||
|
|
|
|
|
|||||
| March 31, |
December 31, |
|||||||
| Lease financing receivables |
||||||||
| Net minimum lease payments |
$ | 172,333 | $ | 168,345 | ||||
| Unguaranteed residual values |
1,776 | 1,787 | ||||||
| Unearned income |
(14,620 | ) | (14,133 | ) | ||||
|
|
|
|
|
|||||
| Total lease financing receivables |
159,489 | 155,999 | ||||||
| Initial direct costs |
3,186 | 2,967 | ||||||
|
|
|
|
|
|||||
| Lease financial receivables before allowance for lease losses |
$ | 162,675 | $ | 158,966 | ||||
|
|
|
|
|
|||||
At March 31, 2017 and December 31, 2016, total loans and leases included U.S. Government guaranteed loans of $394.4 million and $332.9 million, respectively. At March 31, 2017 and December 31, 2016, installment and other loans included overdraft deposits of $1.0 million, which were reclassified as loans. At March 31, 2017 and December 31, 2016, loans and loans held for sale pledged as security for borrowings were $553.6 million and $507.2 million, respectively. Total loans and leases consist of originated loans and leases, acquired impaired loans and acquired non-impaired loans and leases.
The minimum annual lease payments for lease financing receivables as of March 31, 2017 are summarized as follows:
|
Minimum lease |
||||
| 2017 |
$ | 47,026 | ||
| 2018 |
51,560 | |||
| 2019 |
37,538 | |||
| 2020 |
23,718 | |||
| 2021 |
10,798 | |||
| Thereafter |
1,693 | |||
|
|
|
|||
| Total |
$ | 172,333 | ||
|
|
|
|||
F-89
Table of Contents
BYLINE BANCORP, INC. AND SUBSIDIARIES
NOTES TO CONDENSED CONSOLIDATED FINANCIAL STATEMENTS
(Table dollars in thousands, except share and per share data) (Unaudited)
Note 5—Loan and Lease Receivables (Continued)
Originated loans and leases represent originations following a business combination. Acquired impaired loans are loans acquired from a business combination with evidence of credit quality deterioration and are accounted for under ASC 310-30. Acquired non-impaired loans and leases represent loans and leases acquired from a business combination without evidence of credit quality deterioration and are accounted for under ASC 310-20. Leases and revolving loans do not qualify to be accounted for as acquired impaired loans and are accounted for under ASC 310-20. The following tables summarize the balances for each respective loan and lease category as of March 31, 2017 and December 31, 2016:
| March 31, 2017 |
Originated |
Acquired |
Acquired |
Total |
||||||||||||
| Commercial real estate |
$ | 380,292 | $ | 201,689 | $ | 240,869 | $ | 822,850 | ||||||||
| Residential real estate |
391,940 | 169,676 | 39,791 | 601,407 | ||||||||||||
| Construction, land development, and other land |
89,466 | 6,116 | 9,733 | 105,315 | ||||||||||||
| Commercial and industrial |
323,422 | 13,114 | 111,931 | 448,467 | ||||||||||||
| Installment and other |
2,016 | 439 | 365 | 2,820 | ||||||||||||
| Lease financing receivables |
128,666 | — | 34,009 | 162,675 | ||||||||||||
|
|
|
|
|
|
|
|
|
|||||||||
| Total loans and leases |
$ | 1,315,802 | $ | 391,034 | $ | 436,698 | $ | 2,143,534 | ||||||||
|
|
|
|
|
|
|
|
|
|||||||||
| December 31, 2016 |
Originated |
Acquired |
Acquired |
Total |
||||||||||||
| Commercial real estate |
$ | 338,752 | $ | 207,303 | $ | 250,289 | $ | 796,344 | ||||||||
| Residential real estate |
394,168 | 175,717 | 40,853 | 610,738 | ||||||||||||
| Construction, land development, and other land |
119,357 | 6,979 | 14,430 | 140,766 | ||||||||||||
| Commercial and industrial |
309,097 | 13,464 | 115,677 | 438,238 | ||||||||||||
| Installment and other |
2,021 | 574 | 364 | 2,959 | ||||||||||||
| Lease financing receivables |
118,493 | — | 40,473 | 158,966 | ||||||||||||
|
|
|
|
|
|
|
|
|
|||||||||
| Total loans and leases |
$ | 1,281,888 | $ | 404,037 | $ | 462,086 | $ | 2,148,011 | ||||||||
|
|
|
|
|
|
|
|
|
|||||||||
The outstanding balance and carrying amount of all acquired impaired loans are summarized below. The balances do not include an allowance for loan and lease losses of $1.8 million and $1.6 million, respectively, at March 31, 2017 and December 31, 2016.
| March 31, 2017 |
December 31, 2016 |
|||||||||||||||
| Outstanding |
Carrying |
Outstanding |
Carrying |
|||||||||||||
| Commercial real estate |
$ | 273,022 | $ | 201,689 | $ | 278,893 | $ | 207,303 | ||||||||
| Residential real estate |
230,077 | 169,676 | 236,384 | 175,717 | ||||||||||||
| Construction, land development, and other land |
14,974 | 6,116 | 15,292 | 6,979 | ||||||||||||
| Commercial and industrial |
22,210 | 13,114 | 23,164 | 13,464 | ||||||||||||
| Installment and other |
1,925 | 439 | 1,976 | 574 | ||||||||||||
|
|
|
|
|
|
|
|
|
|||||||||
| Total acquired impaired loans |
$ | 542,208 | $ | 391,034 | $ | 555,709 | $ | 404,037 | ||||||||
|
|
|
|
|
|
|
|
|
|||||||||
F-90
Table of Contents
BYLINE BANCORP, INC. AND SUBSIDIARIES
NOTES TO CONDENSED CONSOLIDATED FINANCIAL STATEMENTS
(Table dollars in thousands, except share and per share data) (Unaudited)
Note 5—Loan and Lease Receivables (Continued)
The following table summarizes the changes in accretable yield for acquired impaired loans for the three months ended March 31, 2017 and 2016:
| Three months
ended |
||||||||
| 2017 |
2016 |
|||||||
| Beginning balance |
$ | 36,868 | $ | 43,915 | ||||
| Accretion to interest income |
(5,684 | ) | (7,747 | ) | ||||
| Reclassification from nonaccretable difference |
3,560 | 4,552 | ||||||
|
|
|
|
|
|||||
| Ending balance |
$ | 34,744 | $ | 40,720 | ||||
|
|
|
|
|
|||||
Acquired non-impaired loans and leases—The unpaid principal balance and carrying value for acquired non-impaired loans and leases at March 31, 2017 and December 31, 2016 were as follows:
| March 31, 2017 |
December 31, 2016 |
|||||||||||||||
|
Unpaid |
Carrying |
Unpaid |
Carrying |
|||||||||||||
| Commercial real estate |
$ | 248,909 | $ | 240,869 | $ | 259,055 | $ | 250,289 | ||||||||
| Residential real estate |
40,170 | 39,791 | 41,282 | 40,853 | ||||||||||||
| Construction, land development, and other land |
9,927 | 9,733 | 14,619 | 14,430 | ||||||||||||
| Commercial and industrial |
124,178 | 111,931 | 125,806 | 115,677 | ||||||||||||
| Installment and other |
358 | 365 | 402 | 364 | ||||||||||||
| Lease financing receivables |
33,102 | 34,009 | 40,205 | 40,473 | ||||||||||||
|
|
|
|
|
|
|
|
|
|||||||||
| Total acquired non-impaired loans and leases |
$ | 456,644 | $ | 436,698 | $ | 481,369 | $ | 462,086 | ||||||||
|
|
|
|
|
|
|
|
|
|||||||||
Note 6—Allowance for Loan and Lease Losses and Reserve for Unfunded Commitments
Loans and leases considered for inclusion in the allowance for loan and lease losses include acquired non-impaired loans and leases, those acquired impaired loans with credit deterioration after acquisition or recapitalization, and originated loans and leases. Although all acquired loans and leases are included in the following table, only those with credit deterioration subsequent to acquisition date are actually included in the allowance for loan and lease losses.
F-91
Table of Contents
BYLINE BANCORP, INC. AND SUBSIDIARIES
NOTES TO CONDENSED CONSOLIDATED FINANCIAL STATEMENTS
(Table dollars in thousands, except share and per share data) (Unaudited)
Note 6—Allowance for Loan and Lease Losses and Reserve for Unfunded Commitments (Continued)
The following tables summarize the balance and activity within the allowance for loan and lease losses, the components of the allowance for loan and lease losses in terms of loans and leases individually and collectively evaluated for impairment, and corresponding loan and lease balances by type for the three months ended March 31, 2017 and 2016 are as follows:
| March 31, 2017 |
Commercial |
Residential |
Construction, |
Commercial |
Installment |
Lease |
Total |
|||||||||||||||||||||
| Allowance for loan and lease losses |
||||||||||||||||||||||||||||
| Beginning balance |
$ | 1,945 | $ | 2,483 | $ | 742 | $ | 4,196 | $ | 334 | $ | 1,223 | $ | 10,923 | ||||||||||||||
| Provisions |
340 | 1 | (325 | ) | 855 | (3 | ) | 1,023 | 1,891 | |||||||||||||||||||
| Charge-offs |
(238 | ) | (67 | ) | — | (215 | ) | — | (770 | ) | (1,290 | ) | ||||||||||||||||
| Recoveries |
— | — | — | — | — | 293 | 293 | |||||||||||||||||||||
|
|
|
|
|
|
|
|
|
|
|
|
|
|
|
|||||||||||||||
| Ending balance |
$ | 2,047 | $ | 2,417 | $ | 417 | $ | 4,836 | $ | 331 | $ | 1,769 | $ | 11,817 | ||||||||||||||
|
|
|
|
|
|
|
|
|
|
|
|
|
|
|
|||||||||||||||
| Ending balance: |
||||||||||||||||||||||||||||
| Individually evaluated for impairment |
$ | — | $ | 282 | $ | 26 | $ | 966 | $ | 325 | $ | — | $ | 1,599 | ||||||||||||||
| Collectively evaluated for impairment |
1,622 | 1,470 | 391 | 3,210 | 5 | 1,769 | 8,467 | |||||||||||||||||||||
| Loans acquired with deteriorated credit quality |
425 | 665 | — | 660 | 1 | — | 1,751 | |||||||||||||||||||||
|
|
|
|
|
|
|
|
|
|
|
|
|
|
|
|||||||||||||||
| Total allowance for loan and lease losses |
$ | 2,047 | $ | 2,417 | $ | 417 | $ | 4,836 | $ | 331 | $ | 1,769 | $ | 11,817 | ||||||||||||||
|
|
|
|
|
|
|
|
|
|
|
|
|
|
|
|||||||||||||||
| Commercial |
Residential |
Construction, |
Commercial |
Installment |
Lease |
Total |
||||||||||||||||||||||
| Loans and leases ending balance: |
||||||||||||||||||||||||||||
| Individually evaluated for impairment |
$ | 9,764 | $ | 1,262 | $ | 85 | $ | 3,317 | $ | 327 | $ | — | $ | 14,755 | ||||||||||||||
| Collectively evaluated for impairment |
611,397 | 430,469 | 99,114 | 432,036 | 2,054 | 162,675 | 1,737,745 | |||||||||||||||||||||
| Loans acquired with deteriorated credit quality |
201,689 | 169,676 | 6,116 | 13,114 | 439 | — | 391,034 | |||||||||||||||||||||
|
|
|
|
|
|
|
|
|
|
|
|
|
|
|
|||||||||||||||
| Total loans and leases evaluated for allowance for loan and lease losses |
$ | 822,850 | $ | 601,407 | $ | 105,315 | $ | 448,467 | $ | 2,820 | $ | 162,675 | $ | 2,143,534 | ||||||||||||||
|
|
|
|
|
|
|
|
|
|
|
|
|
|
|
|||||||||||||||
F-92
Table of Contents
BYLINE BANCORP, INC. AND SUBSIDIARIES
NOTES TO CONDENSED CONSOLIDATED FINANCIAL STATEMENTS
(Table dollars in thousands, except share and per share data) (Unaudited)
Note 6—Allowance for Loan and Lease Losses and Reserve for Unfunded Commitments (Continued)
| March 31, 2016 |
Commercial |
Residential |
Construction, |
Commercial |
Installment |
Lease |
Total |
|||||||||||||||||||||
| Allowance for loan and lease losses |
||||||||||||||||||||||||||||
| Beginning balance |
$ | 2,280 | $ | 2,981 | $ | 232 | $ | 1,403 | $ | 357 | $ | 379 | $ | 7,632 | ||||||||||||||
| Provisions |
1,264 | 502 | 90 | (51 | ) | 5 | 703 | 2,513 | ||||||||||||||||||||
| Charge-offs |
(1,153 | ) | (533 | ) | — | (3 | ) | — | (682 | ) | (2,371 | ) | ||||||||||||||||
| Recoveries |
— | — | — | — | — | 129 | 129 | |||||||||||||||||||||
|
|
|
|
|
|
|
|
|
|
|
|
|
|
|
|||||||||||||||
| Ending balance |
$ | 2,391 | $ | 2,950 | $ | 322 | $ | 1,349 | $ | 362 | $ | 529 | $ | 7,903 | ||||||||||||||
|
|
|
|
|
|
|
|
|
|
|
|
|
|
|
|||||||||||||||
| Ending balance: |
||||||||||||||||||||||||||||
| Individually evaluated for impairment |
$ | 1,309 | $ | 380 | $ | 137 | $ | 163 | $ | 327 | $ | — | $ | 2,316 | ||||||||||||||
| Collectively evaluated for impairment |
465 | 434 | 178 | 465 | — | 529 | 2,071 | |||||||||||||||||||||
| Loans acquired with deteriorated credit quality |
617 | 2,136 | 7 | 721 | 35 | — | 3,516 | |||||||||||||||||||||
|
|
|
|
|
|
|
|
|
|
|
|
|
|
|
|||||||||||||||
| Total allowance for loan and lease losses |
$ | 2,391 | $ | 2,950 | $ | 322 | $ | 1,349 | $ | 362 | $ | 529 | $ | 7,903 | ||||||||||||||
|
|
|
|
|
|
|
|
|
|
|
|
|
|
|
|||||||||||||||
| Commercial |
Residential |
Construction, |
Commercial |
Installment |
Lease |
Total |
||||||||||||||||||||||
| Loans and leases ending balance: |
||||||||||||||||||||||||||||
| Individually evaluated for impairment |
$ | 6,943 | $ | 3,335 | $ | 208 | $ | 213 | $ | 327 | $ | — | $ | 11,026 | ||||||||||||||
| Collectively evaluated for impairment |
295,297 | 441,539 | 46,041 | 156,496 | 649 | 123,572 | 1,063,594 | |||||||||||||||||||||
| Loans acquired with deteriorated credit quality |
205,385 | 207,536 | 7,545 | 7,462 | 947 | — | 428,875 | |||||||||||||||||||||
|
|
|
|
|
|
|
|
|
|
|
|
|
|
|
|||||||||||||||
| Total loans and leases evaluated for allowance for loan and lease losses |
$ | 507,625 | $ | 652,410 | $ | 53,794 | $ | 164,171 | $ | 1,923 | $ | 123,572 | $ | 1,503,495 | ||||||||||||||
|
|
|
|
|
|
|
|
|
|
|
|
|
|
|
|||||||||||||||
The Company increased the allowance for loans and lease losses by $894,000 for the three months ended March 31, 2017. The Company increased the allowance for loan and leases losses by $271,000 for the three months ended March 31, 2016. For acquired impaired loans, the Company increased the allowance for loan and lease losses by $140,000 for the three months ended March 31, 2017 and $226,000 for the three months ended March 31, 2016.
F-93
Table of Contents
BYLINE BANCORP, INC. AND SUBSIDIARIES
NOTES TO CONDENSED CONSOLIDATED FINANCIAL STATEMENTS
(Table dollars in thousands, except share and per share data) (Unaudited)
Note 6—Allowance for Loan and Lease Losses and Reserve for Unfunded Commitments (Continued)
The following tables summarize the recorded investment, unpaid principal balance, and related allowance for loans and leases considered impaired as of March 31, 2017 and December 31, 2016, which excludes acquired impaired loans:
| March 31, 2017 |
Recorded |
Unpaid |
Related |
|||||||||
| With no related allowance recorded |
||||||||||||
| Commercial real estate |
$ | 9,764 | $ | 10,353 | $ | — | ||||||
| Residential real estate |
778 | 1,902 | — | |||||||||
| Commercial and Industrial |
1,574 | 1,675 | — | |||||||||
| With an allowance recorded |
||||||||||||
| Residential real estate |
484 | 481 | 282 | |||||||||
| Construction, land development and other land |
85 | 87 | 26 | |||||||||
| Commercial and industrial |
1,743 | 1,810 | 966 | |||||||||
| Installment and Other |
327 | 315 | 325 | |||||||||
|
|
|
|
|
|
|
|||||||
| Total impaired loans |
$ | 14,755 | $ | 16,623 | $ | 1,599 | ||||||
|
|
|
|
|
|
|
|||||||
| December 31, 2016 |
Recorded |
Unpaid |
Related |
|||||||||
| With no related allowance recorded |
||||||||||||
| Commercial real estate |
$ | 8,916 | $ | 9,502 | $ | — | ||||||
| Residential real estate |
804 | 1,999 | — | |||||||||
| Commercial and Industrial |
521 | 524 | — | |||||||||
| With an allowance recorded |
||||||||||||
| Residential real estate |
496 | 528 | 293 | |||||||||
| Commercial and industrial |
861 | 869 | 396 | |||||||||
| Installment and Other |
328 | 361 | 328 | |||||||||
|
|
|
|
|
|
|
|||||||
| Total impaired loans |
$ | 11,926 | $ | 13,783 | $ | 1,017 | ||||||
|
|
|
|
|
|
|
|||||||
F-94
Table of Contents
BYLINE BANCORP, INC. AND SUBSIDIARIES
NOTES TO CONDENSED CONSOLIDATED FINANCIAL STATEMENTS
(Table dollars in thousands, except share and per share data) (Unaudited)
Note 6—Allowance for Loan and Lease Losses and Reserve for Unfunded Commitments (Continued)
The following table summarize the average recorded investment and interest income recognized for loans and leases considered impaired, which excludes acquired impaired loans, for the periods ended as follows:
| March 31, 2017 |
Average |
Interest |
||||||
| With no related allowance recorded |
||||||||
| Commercial real estate |
$ | 9,798 | $ | 130 | ||||
| Residential real estate |
787 | 7 | ||||||
| Commercial and Industrial |
1,402 | 60 | ||||||
| With an allowance recorded |
||||||||
| Residential real estate |
488 | 1 | ||||||
| Construction, land development and other land |
86 | 6 | ||||||
| Commercial and industrial |
1,881 | 3 | ||||||
| Installment and Other |
328 | 4 | ||||||
|
|
|
|
|
|||||
| Total impaired loans |
$ | 14,770 | $ | 211 | ||||
|
|
|
|
|
|||||
| March 31, 2016 |
Average |
Interest |
||||||
| With no related allowance recorded |
||||||||
| Commercial real estate |
$ | 5,639 | $ | 79 | ||||
| Residential real estate |
845 | 14 | ||||||
| With an allowance recorded |
||||||||
| Residential real estate |
537 | 1 | ||||||
| Commercial and industrial |
211 | 1 | ||||||
| Installment and Other |
329 | 5 | ||||||
|
|
|
|
|
|||||
| Total impaired loans |
$ | 7,561 | $ | 100 | ||||
|
|
|
|
|
|||||
For purposes of these tables, the unpaid principal balance represents the outstanding contractual balance. Impaired loans include loans that are individually evaluated for impairment as well as troubled debt restructurings for all loan categories. The sum of non-accrual loans and loans past due 90 days still on accrual will differ from the total impaired loan amount.
F-95
Table of Contents
BYLINE BANCORP, INC. AND SUBSIDIARIES
NOTES TO CONDENSED CONSOLIDATED FINANCIAL STATEMENTS
(Table dollars in thousands, except share and per share data) (Unaudited)
Note 6—Allowance for Loan and Lease Losses and Reserve for Unfunded Commitments (Continued)
The following tables summarize the risk rating categories of the loans and leases considered for inclusion in the allowance for loan and lease losses calculation, excluding acquired impaired loans, as of March 31, 2017 and December 31, 2016:
| March 31, 2017 |
Commercial |
Residential |
Construction, |
Commercial |
Installment |
Lease |
Total |
|||||||||||||||||||||
| Pass |
$ | 568,820 | $ | 415,599 | $ | 95,839 | $ | 366,399 | $ | 2,049 | $ | 160,299 | $ | 1,609,005 | ||||||||||||||
| Watch |
38,032 | 11,838 | 2,124 | 64,247 | 3 | 681 | 116,925 | |||||||||||||||||||||
| Special Mention |
6,134 | 3,090 | 1,151 | 1,355 | 1 | 341 | 12,072 | |||||||||||||||||||||
| Substandard |
8,175 | 1,204 | 85 | 3,352 | 328 | 1,186 | 14,330 | |||||||||||||||||||||
| Doubtful |
— | — | — | — | — | 168 | 168 | |||||||||||||||||||||
| Loss |
— | — | — | — | — | — | — | |||||||||||||||||||||
|
|
|
|
|
|
|
|
|
|
|
|
|
|
|
|||||||||||||||
| Total |
$ | 621,161 | $ | 431,731 | $ | 99,199 | $ | 435,353 | $ | 2,381 | $ | 162,675 | $ | 1,752,500 | ||||||||||||||
|
|
|
|
|
|
|
|
|
|
|
|
|
|
|
|||||||||||||||
| December 31, 2016 |
Commercial |
Residential |
Construction, |
Commercial |
Installment |
Lease |
Total |
|||||||||||||||||||||
| Pass |
$ | 536,499 | $ | 419,880 | $ | 129,732 | $ | 369,136 | $ | 2,052 | $ | 157,296 | $ | 1,614,595 | ||||||||||||||
| Watch |
38,707 | 10,885 | 2,897 | 52,872 | 4 | 324 | 105,689 | |||||||||||||||||||||
| Special Mention |
5,377 | 3,116 | 1,158 | 1,258 | 1 | 512 | 11,422 | |||||||||||||||||||||
| Substandard |
8,458 | 1,140 | — | 1,508 | 328 | 739 | 12,173 | |||||||||||||||||||||
| Doubtful |
— | — | — | — | — | 95 | 95 | |||||||||||||||||||||
| Loss |
— | — | — | — | — | — | — | |||||||||||||||||||||
|
|
|
|
|
|
|
|
|
|
|
|
|
|
|
|||||||||||||||
| Total |
$ | 589,041 | $ | 435,021 | $ | 133,787 | $ | 424,774 | $ | 2,385 | $ | 158,966 | $ | 1,743,974 | ||||||||||||||
|
|
|
|
|
|
|
|
|
|
|
|
|
|
|
|||||||||||||||
The following tables summarize contractual past due and current loan information for acquired non-impaired and originated loans by category at March 31, 2017 and December 31, 2016:
| March 31, 2017 |
30-59 Days |
60-89 Days |
Greater than |
Non-accrual |
Total |
Current |
Total |
|||||||||||||||||||||
| Commercial real estate |
$ | 6,472 | $ | — | $ | — | $ | 4,442 | $ | 10,914 | $ | 610,247 | $ | 621,161 | ||||||||||||||
| Residential real estate |
913 | 31 | — | 1,204 | 2,148 | 429,583 | 431,731 | |||||||||||||||||||||
| Construction, land development, and other land |
565 | — | — | 85 | 650 | 98,549 | 99,199 | |||||||||||||||||||||
| Commercial and industrial |
1,616 | 1,841 | — | 1,241 | 4,698 | 430,655 | 435,353 | |||||||||||||||||||||
| Installment and other |
— | — | — | 328 | 328 | 2,053 | 2,381 | |||||||||||||||||||||
| Lease Financing Receivables |
473 | 811 | — | 543 | 1,827 | 160,848 | 162,675 | |||||||||||||||||||||
|
|
|
|
|
|
|
|
|
|
|
|
|
|
|
|||||||||||||||
| Total |
$ | 10,039 | $ | 2,683 | $ | — | $ | 7,843 | $ | 20,565 | $ | 1,731,935 | $ | 1,752,500 | ||||||||||||||
|
|
|
|
|
|
|
|
|
|
|
|
|
|
|
|||||||||||||||
F-96
Table of Contents
BYLINE BANCORP, INC. AND SUBSIDIARIES
NOTES TO CONDENSED CONSOLIDATED FINANCIAL STATEMENTS
(Table dollars in thousands, except share and per share data) (Unaudited)
Note 6—Allowance for Loan and Lease Losses and Reserve for Unfunded Commitments (Continued)
| December 31, 2016 |
30-59 Days |
60-89 Days |
Greater than |
Non-accrual |
Total |
Current |
Total |
|||||||||||||||||||||
| Commercial real estate |
$ | 2,944 | $ | 648 | $ | — | $ | 3,935 | $ | 7,527 | $ | 581,514 | $ | 589,041 | ||||||||||||||
| Residential real estate |
243 | — | — | 1,118 | 1,361 | 433,660 | 435,021 | |||||||||||||||||||||
| Construction, land development, and other land |
1,363 | — | — | — | 1,363 | 132,424 | 133,787 | |||||||||||||||||||||
| Commercial and industrial |
6,066 | 374 | — | 958 | 7,398 | 417,376 | 424,774 | |||||||||||||||||||||
| Installment and other |
— | — | — | 328 | 328 | 2,057 | 2,385 | |||||||||||||||||||||
| Lease Financing Receivables |
2,070 | 390 | — | 445 | 2,905 | 156,061 | 158,966 | |||||||||||||||||||||
|
|
|
|
|
|
|
|
|
|
|
|
|
|
|
|||||||||||||||
| Total |
$ | 12,686 | $ | 1,412 | $ | — | $ | 6,784 | $ | 20,882 | $ | 1,723,092 | $ | 1,743,974 | ||||||||||||||
|
|
|
|
|
|
|
|
|
|
|
|
|
|
|
|||||||||||||||
At March 31, 2017 and December 31, 2016, the Company had a recorded investment in troubled debt restructurings of $1.5 million and $1.2 million, respectively. The restructurings were granted due to borrower financial difficulty and provide for a modification of loan repayment terms. The Company has not allocated any specific allowance for these loans at March 31, 2017 and December 31, 2016. In addition, there were no commitments outstanding on troubled debt restructurings.
Loans modified as troubled debt restructurings that occurred during the three months ended March 31, 2017 and year ended December 31, 2016 did not result in any charge-offs or permanent reductions of the recorded investments in the loans. Troubled debt restructurings that subsequently defaulted within twelve months of the restructure date during the year ended December 31, 2016 had a recorded investment of $477,000. No troubled debt restructurings subsequently defaulted within twelve months of the restructure date during the three months ended March 31, 2017.
At March 31, 2017 and December 31, 2016, the reserve for unfunded commitments was $810,000 and $760,000, respectively. During the three months ended March 31, 2017 and 2016, the provisions for unfunded commitments were $50,000 and $(22,000), respectively. There were no charge-offs or recoveries related to the reserve for unfunded commitments during the periods.
Note 7—Servicing Assets
As part of the Ridgestone acquisition, the Company acquired loan servicing assets. The Company did not hold any servicing assets until the acquisition on October 14, 2016.
Loans serviced for others are not included in the Consolidated Statements of Financial Condition. The unpaid principal balances of these loans serviced for others were as follows as of March 31, 2017 and December 31, 2016:
| March 31, |
December 31, |
|||||||
| Loan portfolios serviced for: |
||||||||
| SBA |
$ | 903,157 | $ | 911,803 | ||||
| USDA |
82,965 | 106,125 | ||||||
|
|
|
|
|
|||||
| Total |
$ | 986,122 | $ | 1,017,928 | ||||
|
|
|
|
|
|||||
F-97
Table of Contents
BYLINE BANCORP, INC. AND SUBSIDIARIES
NOTES TO CONDENSED CONSOLIDATED FINANCIAL STATEMENTS
(Table dollars in thousands, except share and per share data) (Unaudited)
Note 7—Servicing Assets (Continued)
Activity for servicing assets and the related changes in fair value are as follows:
| March 31, |
||||
| Beginning balance |
$ | 21,091 | ||
| Additions, net |
1,422 | |||
| Changes in fair value |
(1,290 | ) | ||
|
|
|
|||
| Ending balance |
$ | 21,223 | ||
|
|
|
|||
Loan servicing income totaled $919,000, net of the changes in fair value, for the three months ended March 31, 2017.
The fair value of servicing rights is highly sensitive to changes in underlying assumptions. Changes in prepayment speed assumptions have the most significant impact on the fair value of servicing rights.
Generally, as interest rates rise on variable rate loans, loan prepayments increase due to an increase in refinance activity, which may result in a decrease in the fair value of servicing assets. Measurement of fair value is limited to the condition existing and the assumptions used as of a particular point in time, and those assumptions may change over time. Refer to Note 16—Fair Value Measurement for further details.
Note 8—Other Real Estate Owned
The following table presents the change in other real estate owned (“OREO”) for the three months ended March 31, 2017 and 2016.
| March 31, |
||||||||
| 2017 |
2016 |
|||||||
| Beginning balance |
$ | 16,570 | $ | 26,715 | ||||
| Net additions to other real estate owned |
799 | 2,356 | ||||||
| Dispositions of OREO |
(3,920 | ) | (4,686 | ) | ||||
| Valuation adjustments |
(276 | ) | 81 | |||||
|
|
|
|
|
|||||
| Ending balance |
$ | 13,173 | $ | 24,466 | ||||
|
|
|
|
|
|||||
F-98
Table of Contents
BYLINE BANCORP, INC. AND SUBSIDIARIES
NOTES TO CONDENSED CONSOLIDATED FINANCIAL STATEMENTS
(Table dollars in thousands, except share and per share data) (Unaudited)
Note 9—Goodwill, Core Deposit Intangible and Other Intangible Assets
The following table summarizes the changes in the Company’s goodwill and core deposit intangible assets for the three months ended March 31, 2017 and 2016:
| March 31, |
||||||||||||||||
| 2017 |
2016 |
|||||||||||||||
| Goodwill |
Core Deposit |
Goodwill |
Core Deposit |
|||||||||||||
| Beginning balance |
$ | 51,975 | $ | 19,776 | $ | 25,688 | $ | 22,275 | ||||||||
| Amortization or accretion |
— | (765 | ) | — | (743 | ) | ||||||||||
|
|
|
|
|
|
|
|
|
|||||||||
| Ending balance |
$ | 51,975 | $ | 19,011 | $ | 25,688 | $ | 21,532 | ||||||||
|
|
|
|
|
|
|
|
|
|||||||||
| Accumulated amortization or accretion |
N/A | $ | 11,175 | N/A | $ | 8,168 | ||||||||||
| Weighted average remaining amortization or accretion period |
N/A | 6.4 Years | N/A | 7.3 Years | ||||||||||||
The Company has other intangible assets of $47,000 and $50,000 as of March 31, 2017 and December 31, 2016, respectively, related to trademark-related transactions.
The following table presents the estimated amortization expense for core deposit intangible and other intangible assets recognized at March 31, 2017:
| Estimated |
||||
| 2017 |
$ | 2,304 | ||
| 2018 |
3,061 | |||
| 2019 |
3,050 | |||
| 2020 |
3,024 | |||
| 2021 |
3,017 | |||
| Thereafter |
4,602 | |||
|
|
|
|||
| Total |
$ | 19,058 | ||
|
|
|
|||
Note 10—Income Taxes
The Company uses an estimated annual effective tax rate method in computing its interim tax provision. This effective tax rate is based on forecasted annual pre-tax income, permanent tax differences and statutory tax rates.
The effective tax rates for the three months ended March 31, 2017 and 2016 were 40.9% and 15.1%, respectively. The Company began to recognize income tax expense in the quarter ended December 31, 2016 after the reversal of $61.9 million of the Company’s previously established valuation allowance on its net deferred tax assets.
Deferred tax assets decreased $4.8 million from $67.8 million at December 31, 2016 to $62.9 million at March 31, 2017. This decrease was primarily due to a reduction in the Company’s net operation loss carryforwards being applied to the current year tax liability.
F-99
Table of Contents
BYLINE BANCORP, INC. AND SUBSIDIARIES
NOTES TO CONDENSED CONSOLIDATED FINANCIAL STATEMENTS
(Table dollars in thousands, except share and per share data) (Unaudited)
Note 11—Deposits
The composition of deposits was as follows as of March 31, 2017 and December 31, 2016:
| March 31, |
December 31, |
|||||||
| Non-interest bearing demand deposits |
$ | 732,267 | $ | 724,457 | ||||
| Interest bearing checking accounts |
192,317 | 173,929 | ||||||
| Money market demand accounts |
393,372 | 369,074 | ||||||
| Other savings |
446,847 | 446,418 | ||||||
| Time deposits (below $100,000) |
407,471 | 392,854 | ||||||
| Time deposits ($100,000 and above) |
403,565 | 383,662 | ||||||
|
|
|
|
|
|||||
| Total deposits |
$ | 2,575,839 | $ | 2,490,394 | ||||
|
|
|
|
|
|||||
Time deposits of $100,000 or more included $18.7 million and $30.8 million of brokered deposits at March 31, 2017 and December 31, 2016, respectively. Time deposits in denominations of $250,000 or more at March 31, 2017 and December 31, 2016 were $113.7 million and $117.4 million, respectively.
Note 12—Federal Home Loan Bank Advances
The following table summarizes the FHLB advances as of March 31, 2017 and December 31, 2016, which include acquisition accounting adjustments of $176,000 and $228,000, respectively, along with weighted average costs and scheduled maturities:
| March 31, |
December 31, |
|||||||
| Federal Home Loan advances |
$ | 209,663 | $ | 313,715 | ||||
| Weighted average cost |
1.08 | % | 0.73 | % | ||||
| Scheduled Maturities |
||||||||
| 2017 |
$ | 200,000 | ||||||
| 2018 |
9,663 | |||||||
|
|
|
|||||||
| Total |
$ | 209,663 | ||||||
|
|
|
|||||||
At March 31, 2017, advances had fixed terms with interest rates ranging from 0.96% to 3.22% and maturities ranging from June 2017 to February 2018. The Bank’s advances from the FHLB are collateralized by residential real estate loans and securities. At March 31, 2017 and December 31, 2016, the Bank had additional borrowing capacity from the FHLB of $943.9 million and $647.9 million, respectively, subject to the availability of proper collateral. The Bank’s maximum borrowing capacity is limited to 35% of total assets.
FHLB advances assumed from the Ridgestone acquisition of $1.5 million are putable quarterly and are required to be repaid upon the request of the FHLB.
The Company hedges interest rates on borrowed funds using interest rate swaps through which the Company receives variable amounts and pays fixed amounts. Refer to Note 17—Derivative Instruments and Hedge Activities for additional information.
F-100
Table of Contents
BYLINE BANCORP, INC. AND SUBSIDIARIES
NOTES TO CONDENSED CONSOLIDATED FINANCIAL STATEMENTS
(Table dollars in thousands, except share and per share data) (Unaudited)
Note 13—Other Borrowings
The following is a summary of the Company’s other borrowings as of March 31, 2017 and December 31, 2016:
| March 31, |
December 31, |
|||||||
| Securities sold under agreements to repurchase |
$ | 31,940 | $ | 17,249 | ||||
| Line of credit |
18,150 | 20,650 | ||||||
|
|
|
|
|
|||||
| Total |
$ | 50,090 | $ | 37,899 | ||||
|
|
|
|
|
|||||
Securities sold under agreements to repurchase represent a demand deposit product offered to customers that sweep balances in excess of the FDIC insurance limit into overnight repurchase agreements. The Company pledges securities as collateral for the repurchase agreements. Refer to Note 4—“Securities” for additional discussion.
On October 13, 2016, in connection with the Ridgestone acquisition, the Company entered into a $30.0 million credit agreement with The PrivateBank and Trust Company with a $300,000 commitment fee payable at such time. The line of credit has a maturity date of October 12, 2017 and bears an interest rate equal to the Prime rate. At March 31, 2017 and December 31, 2016, the interest rate was 4.00% and 3.75%, respectively. As of March 31, 2017 and December 31, 2016, the Company was in compliance with all financial covenants set forth in the line of credit agreement.
The following table presents short-term credit lines available for use, for which the Company did not have an outstanding balance as of March 31, 2017 and December 31, 2016:
| March 31, |
December 31, |
|||||||
| Federal Reserve Bank of Chicago discount window line |
$ | 169,500 | $ | 110,600 | ||||
| Available federal funds line |
20,000 | 20,000 | ||||||
Note 14—Junior Subordinated Debentures
At March 31, 2017 and December 31, 2016, the Company’s junior subordinated debentures by issuance were as follows:
| Name of Trust |
Aggregate Principal Amount March 31, |
Aggregate Amount December 31, |
Stated Maturity |
Contractual Rate at March 31, 2017 |
Interest Rate Spread |
|||||||||||||||
| Metropolitan Statutory Trust 1 |
$ | 35,000 | $ | 35,000 | March 17, 2034 | 3.94 | % | Three-month LIBOR + 2.79% | ||||||||||||
| RidgeStone Capital Trust I |
1,500 | 1,500 | June 30, 2033 | 5.09 | % | Five-year LIBOR + 3.50% | ||||||||||||||
|
|
|
|
|
|||||||||||||||||
| Total liability, at par |
36,500 | 36,500 | ||||||||||||||||||
| Discount |
(9,370 | ) | (9,574 | ) | ||||||||||||||||
|
|
|
|
|
|||||||||||||||||
| Total liability, at fair value |
$ | 27,130 | $ | 26,926 | ||||||||||||||||
|
|
|
|
|
|||||||||||||||||
F-101
Table of Contents
BYLINE BANCORP, INC. AND SUBSIDIARIES
NOTES TO CONDENSED CONSOLIDATED FINANCIAL STATEMENTS
(Table dollars in thousands, except share and per share data) (Unaudited)
Note 14—Junior Subordinated Debentures (Continued)
In 2004, the Company’s predecessor, Metropolitan Bank Group, Inc., issued $35.0 million floating rate junior subordinated debentures to Metropolitan Statutory Trust 1, which was formed for the issuance of trust preferred securities. The debentures bear interest at three-month London Interbank Offered Rate (“LIBOR”) plus 2.79% (3.94% and 3.78% at March 31, 2017 and December 31, 2016, respectively). Interest is payable quarterly. The Company has the right to redeem the debentures, in whole or in part, on any interest payment date on or after March 2009. Accrued interest payable was $59,000 and $50,000 as of March 31, 2017 and December 31, 2016, respectively.
As part of the Ridgestone acquisition, the Company assumed the obligations to Ridgestone Capital Trust I of $1.5 million in principal amount, which was formed for the issuance of trust preferred securities. Refer to Note 3—Acquisition of a Business for additional information. Beginning on June 30, 2008, the interest rate reset to the five-year LIBOR plus 3.50% (5.09% at March 31, 2017 and December 31, 2016), which is in effect until September 30, 2018 and updated every five years. Interest is paid quarterly. The Company has the right to redeem the debentures, in whole or in part, on any interest payment date on or after June 30, 2008. There was no accrued interest payable as of March 31, 2017.
The Trusts are not consolidated with the Company. Accordingly, the Company reports the subordinated debentures held by the Trusts as liabilities. The Company owns all of the common securities of each trust. The junior subordinated debentures qualify, and are treated as, Tier 1 regulatory capital of the Company subject to regulatory limitations. The trust preferred securities issued by each trust rank equally with the common securities in right of payment, except that if an event of default under the indenture governing the notes has occurred and is continuing, the preferred securities will rank senior to the common securities in right of payment.
Note 15—Commitments and Contingent Liabilities
Legal contingencies—In the ordinary course of business, the Company and Bank have various outstanding commitments and contingent liabilities that are not recognized in the accompanying consolidated financial statements. In addition, the Company may be a defendant in certain claims and legal actions arising in the ordinary course of business. In the opinion of management, after consultation with legal counsel, the ultimate disposition of these matters is currently not expected to have a material adverse effect on the Company’s Consolidated Statements of Financial Condition as of March 31, 2017 and December 31, 2016 or Consolidated Statements of Operations for the periods ended March 31, 2017 and 2016.
Operating lease commitments—The Company has entered into various operating lease agreements primarily for facilities and land on which banking facilities are located. Certain lease agreements have renewal options at the end of the original lease term and certain lease agreements have escalation clauses in the rent payments.
F-102
Table of Contents
BYLINE BANCORP, INC. AND SUBSIDIARIES
NOTES TO CONDENSED CONSOLIDATED FINANCIAL STATEMENTS
(Table dollars in thousands, except share and per share data) (Unaudited)
Note 15—Commitments and Contingent Liabilities (Continued)
The minimum annual rental commitments for operating leases subsequent to March 31, 2017, exclusive of taxes and other charges, are summarized as follows:
|
Minimum Rental |
||||
| 2017 |
$ | 2,247 | ||
| 2018 |
2,669 | |||
| 2019 |
2,315 | |||
| 2020 |
1,815 | |||
| 2021 |
1,568 | |||
| Thereafter |
2,798 | |||
|
|
|
|||
| Total |
$ | 13,412 | ||
|
|
|
|||
The Company’s rental expenses for the three months ended March 31, 2017 and 2016 were $1.1 million and $891,000, respectively. During the three months ended March 31, 2017 and 2016, the Company received $190,000 and $180,000, respectively, in sublease income which is included in the Consolidated Statements of Operations as a reduction of occupancy expense. In addition to the above required lease payments, the Company has contractual obligations related primarily to information technology contracts and other maintenance contracts. The amounts are not material.
Commitments to extend credit—The Bank is party to financial instruments with off-balance sheet risk in the normal course of business to meet the financing needs of its customers. These financial instruments include commitments to extend credit and standby letters of credit. Those instruments involve, to varying degrees, elements of credit and interest rate risk in excess of the amount recognized in the Consolidated Statements of Financial Condition. The contractual or notional amounts of those instruments reflect the extent of involvement the Bank has in particular classes of financial instruments.
The Bank’s exposure to credit loss in the event of non-performance by the other party to the financial instrument for commitments to extend credit and standby letters of credit is represented by the contractual or notional amount of those instruments. The Bank uses the same credit policies in making commitments and conditional obligations as it does for funded instruments. The Bank does not anticipate any material losses as a result of the commitments and standby letters of credit.
The following table summarizes the contract or notional amount of outstanding loan and lease commitments at March 31, 2017 and December 31, 2016:
| March 31, 2017 |
December 31, 2016 |
|||||||||||||||
| Fixed Rate |
Variable Rate |
Fixed Rate |
Variable Rate |
|||||||||||||
| Commitments to extend credit |
$ | 35,720 | $ | 367,278 | $ | 37,731 | $ | 332,928 | ||||||||
| Standby letters of credit |
954 | 3,239 | 1,060 | 4,135 | ||||||||||||
|
|
|
|
|
|
|
|
|
|||||||||
| Total |
$ | 36,674 | $ | 370,517 | $ | 38,791 | $ | 337,063 | ||||||||
|
|
|
|
|
|
|
|
|
|||||||||
Commitments to extend credit are agreements to lend to a customer as long as there is no violation of any condition established in the contract. Commitments generally have fixed expiration dates or other termination clauses and may require payment of a fee. Since many of the commitments are expected to expire
F-103
Table of Contents
BYLINE BANCORP, INC. AND SUBSIDIARIES
NOTES TO CONDENSED CONSOLIDATED FINANCIAL STATEMENTS
(Table dollars in thousands, except share and per share data) (Unaudited)
Note 15—Commitments and Contingent Liabilities (Continued)
without being drawn upon, the total commitment amount does not necessarily represent future cash requirements. The Bank evaluates each customer’s creditworthiness on a case-by-case basis. The amount of collateral obtained, if deemed necessary by the Bank upon extension of credit, is based on management’s credit evaluation of the counterparty. Collateral is primarily obtained in the form of commercial and residential real estate (including income producing commercial properties).
Standby letters of credit are conditional commitments issued by the Bank to guarantee to a third-party the performance of a customer. Those guarantees are primarily issued to support public and private borrowing arrangements, bond financing and similar transactions. The credit risk involved in issuing letters of credit is essentially the same as that involved in extending loan facilities to customers.
Commitments to make loans are generally made for periods of 90 days or less. The fixed rate loan commitments have interest rates ranging from 2.1% to 19.5% and maturities up to 2025. Variable rate loan commitments have interest rates ranging from 2.5% to 9.8% and maturities up to 2042.
Note 16—Fair Value Measurement
Fair value is the exchange price that would be received for an asset or paid to transfer a liability (exit price) in the principal or most advantageous market for the asset or liability in an orderly transaction between market participants on the measurement date. In addition, the Company has the ability to obtain fair values for markets that are not accessible.
These types of inputs create the following fair value hierarchy:
Level 1—Quoted prices in active markets for identical assets or liabilities.
Level 2—Quoted prices for similar instruments in active markets, quoted prices for identical or similar instruments in markets that are not active and model-derived valuations whose inputs are observable or whose significant value drivers are observable.
Level 3—Unobservable inputs that are supported by little or no market activity and that are significant to the fair value of the asset or liability. Unobservable inputs are used to measure fair value to the extent that observable inputs are not available. The Company’s own data used to develop unobservable inputs may be adjusted for market considerations when reasonably available.
A financial instrument’s categorization within the valuation hierarchy is based upon the lowest level of input that is significant to the fair value measurement. The Company’s assessment of the significance of a particular input to the fair value measurement in its entirety requires judgment, and considers factors specific to assets and liabilities.
The Company used the following methods and significant assumptions to estimate fair value for certain assets measured and carried at fair value on a recurring basis:
Securities available-for-sale—The Company obtains fair value measurements from an independent pricing service. Management reviews the procedures used by the third party, including significant inputs used in the fair value calculations. The fair value measurements consider observable data that may include dealer quotes,
F-104
Table of Contents
BYLINE BANCORP, INC. AND SUBSIDIARIES
NOTES TO CONDENSED CONSOLIDATED FINANCIAL STATEMENTS
(Table dollars in thousands, except share and per share data) (Unaudited)
Note 16—Fair Value Measurement (Continued)
market spreads, cash flows, the U.S. Treasury yield curve, live trading levels, trade execution data, market consensus prepayment speeds, credit information and the bond’s terms and conditions, among other things. When market quotes are not readily accessible or available, alternative approaches are utilized, such as matrix or model pricing.
The Company’s methodology for pricing non-rated bonds focuses on three distinct inputs: equivalent rating, yield and other pricing terms. To determine the rating for a given non-rated municipal bond, the Company references a publicly issued bond by the same issuer if available as well as other additional key metrics to support the credit worthiness. Typically, pricing for these types of bonds would require a higher yield than a similar rated bond from the same issuer. A reduction in price is applied to the rating obtained from the comparable bond, as the Company believes if liquidated, a non-rated bond would be valued less than a similar bond with a verifiable rating. The reduction applied by the Company is one notch lower (i.e. a “AA” rating for a comparable bond would be reduced to “AA-” for the Company’s valuation). In the first quarter of 2017 and 2016, all of the ratings derived by the Company were “BBB” or better with and without comparable bond proxies. The fair value measurement of municipal bonds is sensitive to the rating input, as a higher rating typically results in an increased valuation. The remaining pricing inputs used in the bond valuation are observable. Based on the rating determined, the Company obtains a corresponding current market yield curve available to market participants. Other terms including coupon, maturity date, redemption price, number of coupon payments per year, and accrual method are obtained from the individual bond term sheets.
Servicing assets—Fair value is based on a loan-by-loan basis taking into consideration the original term to maturity, the current age of the loan and the remaining term to maturity. The valuation methodology utilized for the servicing assets begins with generating future cash flows for each servicing asset, based on their unique characteristics and market-based assumptions for prepayment speeds. The present value of the future cash flows are then calculated utilizing market-based discount rate assumptions.
Derivative instruments—Interest rate swaps are valued by a third party, using models that primarily use market observable inputs, such as yield curves, and are validated by comparison with valuations provided by the respective counterparties. Derivative financial instruments are included in other assets and other liabilities in the Consolidated Statements of Financial Condition.
F-105
Table of Contents
BYLINE BANCORP, INC. AND SUBSIDIARIES
NOTES TO CONDENSED CONSOLIDATED FINANCIAL STATEMENTS
(Table dollars in thousands, except share and per share data) (Unaudited)
Note 16—Fair Value Measurement (Continued)
The following tables summarize the Company’s financial assets and liabilities that were measured at fair value on a recurring basis at March 31, 2017 and December 31, 2016:
| Fair Value Measurements Using |
||||||||||||||||
| March 31, 2017 |
Fair Value |
Level 1 |
Level 2 |
Level 3 |
||||||||||||
| Financial assets |
||||||||||||||||
| Securities available-for-sale |
||||||||||||||||
| U.S. Treasury Notes |
$ | 14,926 | $ | 14,926 | $ | — | $ | — | ||||||||
| U.S. Government agencies |
58,915 | — | 58,915 | — | ||||||||||||
| Obligations of states, municipalities, and political subdivisions |
16,190 | — | 15,640 | 550 | ||||||||||||
| Mortgage-backed securities; residential |
||||||||||||||||
| Agency |
352,559 | — | 352,559 | — | ||||||||||||
| Non-Agency |
19,263 | — | 19,263 | — | ||||||||||||
| Mortgage-backed securities; commercial |
||||||||||||||||
| Agency |
75,578 | — | 75,578 | — | ||||||||||||
| Non-Agency |
31,061 | — | 31,061 | — | ||||||||||||
| Corporate securities |
17,459 | — | 17,459 | — | ||||||||||||
| Other securities |
4,556 | 1,931 | 2,094 | 531 | ||||||||||||
| Servicing assets(1) |
21,223 | — | — | 21,223 | ||||||||||||
| Derivative assets |
4,652 | — | 4,652 | — | ||||||||||||
| Financial liabilities |
||||||||||||||||
| Derivative liabilities |
955 | — | 955 | — | ||||||||||||
| (1) | See Note 7 for a rollforward of recurring Level 3 fair values for servicing assets. |
| Fair Value Measurements Using |
||||||||||||||||
| December 31, 2016 |
Fair Value |
Level 1 |
Level 2 |
Level 3 |
||||||||||||
| Financial assets |
||||||||||||||||
| Securities available-for-sale |
||||||||||||||||
| U.S. Treasury Notes |
$ | 14,920 | $ | 14,920 | $ | — | $ | — | ||||||||
| U.S. Government agencies |
58,857 | — | 58,857 | — | ||||||||||||
| Obligations of states, municipalities, and political subdivisions |
16,059 | — | 15,509 | 550 | ||||||||||||
| Mortgage-backed securities; residential |
||||||||||||||||
| Agency |
368,160 | — | 368,160 | — | ||||||||||||
| Non-Agency |
19,933 | — | 19,933 | — | ||||||||||||
| Mortgage-backed securities; commercial |
||||||||||||||||
| Agency |
77,403 | — | 77,403 | — | ||||||||||||
| Non-Agency |
31,052 | — | 31,052 | — | ||||||||||||
| Corporate securities |
17,329 | — | 17,329 | — | ||||||||||||
| Other securities |
4,847 | 1,938 | 2,379 | 530 | ||||||||||||
| Servicing assets(1) |
21,091 | — | — | 21,091 | ||||||||||||
| Derivative assets |
4,317 | — | 4,317 | — | ||||||||||||
| Financial liabilities |
||||||||||||||||
| Derivative liabilities |
559 | — | 559 | — | ||||||||||||
F-106
Table of Contents
BYLINE BANCORP, INC. AND SUBSIDIARIES
NOTES TO CONDENSED CONSOLIDATED FINANCIAL STATEMENTS
(Table dollars in thousands, except share and per share data) (Unaudited)
Note 16—Fair Value Measurement (Continued)
| (1) | See Note 7 for a rollforward of recurring Level 3 fair values for servicing assets. |
During 2016, the Company acquired the servicing assets and single-issuer trust preferred securities included in other securities categorized as Level 3 of the fair value hierarchy through a business combination. Refer to Note 7—“Servicing Assets” for the rollforward of recurring Level 3 fair values. During the three months ended March 31, 2017, the Company recognized $1,000 of accretion income for the single-issuer trust preferred securities and no accretion income during the three months ended March 31, 2016.
In addition, during 2016, the Company purchased privately-issued municipal securities that are categorized as Level 3. These municipal securities are bonds issued for one municipal government entity primarily located in the Chicago metropolitan and are privately placed, non-rated bonds without Committee on Uniform Security Identification Procedures numbers.
The Company did not have any transfers between Level 1 and Level 2 of the fair value hierarchy during the three months ended March 31, 2017 and 2016. The Company’s policy for determining transfers between levels occurs at the end of the reporting period when circumstances in the underlying valuation criteria change and result in transfer between levels.
The following table presents additional information about the unobservable inputs used in the fair value measurements on recurring basis that were categorized within Level 3 of the fair value hierarchy as of March 31, 2017:
| Financial Instruments |
Valuation Technique |
Unobservable Inputs |
Range of Inputs |
Weighted |
Impact to | |||||
| Obligations of states, municipalities, and political obligations |
Discounted cash flow | Probability of default | 2.0%—2.4% | 2.2% | Decrease | |||||
| Single issuer trust preferred |
Discounted cash flow | Probability of default | 7.5%—12.0% | 8.8% | Decrease | |||||
| Servicing assets |
Discounted cash flow | Prepayment speeds | 5.6%—9.2% | 7.2% | Decrease | |||||
| Discount rate | 7.6%—18.6% | 12.7% | Decrease | |||||||
| Expected weighted average loan life |
0.5—8.2 years | 6.1 years | Increase |
The Company used the following methods and significant assumptions to estimate fair value for certain assets measured and carried at fair value on a non-recurring basis:
Loans held for sale—Mortgage loans originated and intended for sale in the secondary market are carried at the lower of aggregate cost or fair value based on contract price. Loans transferred to loans held for sale are carried at the lower of cost or fair value, less estimated costs to sell.
Impaired loans (excluding acquired impaired loans)—Impaired loans, other than those existing on the date of a business acquisition, are primarily carried at the fair value of the underlying collateral, less estimated costs to sell, if the loan is collateral dependent. Valuations of impaired loans that are collateral dependent are supported by third party appraisals, which are obtained not less than once every twelve months in accordance with the Bank’s credit policy. Impaired loans that are not collateral dependent are not material.
F-107
Table of Contents
BYLINE BANCORP, INC. AND SUBSIDIARIES
NOTES TO CONDENSED CONSOLIDATED FINANCIAL STATEMENTS
(Table dollars in thousands, except share and per share data) (Unaudited)
Note 16—Fair Value Measurement (Continued)
Assets held for sale—Assets held for sale consist of former branch locations, vacant land, and a house previously purchased for expansion. Assets are considered held for sale when management has approved to sell the assets following a branch closure or other events. The properties are being actively marketed and transferred to assets held for sale based on the lower of carrying value or its fair value, less estimated costs to sell.
Other real estate owned—Certain assets held within other real estate owned represent real estate or other collateral that has been adjusted to its estimated fair value, less cost to sell, as a result of transferring from the loan portfolio at the time of foreclosure or repossession and based on management’s periodic impairment evaluation. From time to time, non-recurring fair value adjustments to other real estate owned are recorded to reflect partial write-downs based on an observable market price or current appraised value of property.
Adjustments to fair value based on such non-recurring transactions generally result from the application of lower-of-cost-or-market accounting or write-downs of individual assets due to impairment. The following tables summarize the Company’s assets that were measured at fair value on a non-recurring basis, excluding acquired impaired loans, as of March 31, 2017 and December 31, 2016:
| March 31, 2017 |
Fair Value Measurements Using |
|||||||||||||||
| Fair Value |
Level 1 |
Level 2 |
Level 3 |
|||||||||||||
| Non-recurring |
||||||||||||||||
| Impaired loans |
||||||||||||||||
| (excluding acquired impaired loans) |
||||||||||||||||
| Commercial real estate |
$ | 9,764 | $ | — | $ | — | $ | 9,764 | ||||||||
| Residential real estate |
980 | — | — | 980 | ||||||||||||
| Construction, land development, and other land |
59 | — | — | 59 | ||||||||||||
| Commercial and industrial |
2,351 | — | — | 2,351 | ||||||||||||
| Installment and Other |
2 | — | — | 2 | ||||||||||||
| Assets held for sale |
13,666 | — | — | 13,666 | ||||||||||||
| Other real estate owned |
13,173 | — | — | 13,173 | ||||||||||||
| December 31, 2016 |
Fair Value Measurements Using |
|||||||||||||||
| Fair Value |
Level 1 |
Level 2 |
Level 3 |
|||||||||||||
| Non-recurring |
||||||||||||||||
| Impaired loans |
||||||||||||||||
| (excluding acquired impaired loans) |
||||||||||||||||
| Commercial real estate |
$ | 8,916 | $ | — | $ | — | $ | 8,916 | ||||||||
| Residential real estate |
1,007 | — | — | 1,007 | ||||||||||||
| Construction, land development, and other land |
— | — | — | — | ||||||||||||
| Commercial and industrial |
986 | — | — | 986 | ||||||||||||
| Installment and Other |
— | — | — | — | ||||||||||||
| Assets held for sale |
14,748 | — | — | 14,748 | ||||||||||||
| Other real estate owned |
16,570 | — | — | 16,570 | ||||||||||||
F-108
Table of Contents
BYLINE BANCORP, INC. AND SUBSIDIARIES
NOTES TO CONDENSED CONSOLIDATED FINANCIAL STATEMENTS
(Table dollars in thousands, except share and per share data) (Unaudited)
Note 16—Fair Value Measurement (Continued)
The following table provides a description of the valuation technique, unobservable inputs and qualitative information about the Company’s assets and liabilities classified as Level 3 and measured at fair value on a non-recurring basis as of March 31, 2017:
| Financial Instruments |
Valuation Technique |
Unobservable Inputs |
Range of Inputs |
Impact to | ||||
|
Impaired loans (excluding acquired impaired loans) |
Appraisals |
Appraisal adjustments, sales costs and other discount adjustments for market conditions |
6% - 10% |
Decrease | ||||
|
Assets held for sale |
List price, contract price |
Sales costs and other discount adjustments for market conditions |
7% |
Decrease | ||||
|
Other real estate owned |
Appraisals |
Appraisal adjustments, sales costs and other discount adjustments for market conditions |
7% - 20% |
Decrease |
The following methods and assumptions were used by the Company in estimating fair values of other assets and liabilities for disclosure purposes:
Cash and cash equivalents—For these short-term instruments, the carrying amount is a reasonable estimate of fair value. The fair value for time certificates with other banks is based on the market values for comparable investments.
Securities held-to-maturity—The Company obtains fair value measurements from an independent pricing service. Management reviews the procedures used by the third party, including significant inputs used in the fair value calculations. The fair value measurements consider observable data that may include dealer quotes, market spreads, cash flows, the U.S. Treasury yield curve, live trading levels, trade execution data, market consensus prepayment speeds, credit information and the bond’s terms and conditions, among other things. When market quotes are not readily accessible or available, alternative approaches are utilized, such as matrix or model pricing.
Restricted stock—The fair value has been determined to approximate cost.
Loans held for sale—The fair value of loans held for sale are based on quoted market prices, where available, and determined by discounted estimated cash flows using interest rates approximating the Company’s current origination rates for similar loans adjusted to reflect the inherent credit risk.
Loan and lease receivables, net—For certain variable rate loans that reprice frequently and with no significant changes in credit risk, fair value is estimated at carrying value. The fair value of other types of loans is estimated by discounting future cash flows, using current rates at which similar loans would be made to borrowers with similar credit ratings and for the same remaining maturities.
F-109
Table of Contents
BYLINE BANCORP, INC. AND SUBSIDIARIES
NOTES TO CONDENSED CONSOLIDATED FINANCIAL STATEMENTS
(Table dollars in thousands, except share and per share data) (Unaudited)
Note 16—Fair Value Measurement (Continued)
Deposit liabilities—The fair value of demand deposits, savings accounts, and certain money market deposits is the amount payable on demand at the reporting date. The fair value of fixed-maturity certificates of deposit is estimated by discounting future cash flows, using rates currently offered for deposits of similar remaining maturities.
Federal Home Loan Bank advances—The fair value of FHLB advances is estimated by discounting the agreements based on maturities using rates currently offered for FHLB advances of similar remaining maturities adjusted for prepayment penalties that would be incurred if the borrowings were paid off on the measurement date.
Securities sold under agreements to repurchase—The carrying amount approximates fair value due to maturities of less than ninety days.
Junior subordinated debentures—The fair value of junior subordinated debentures, in the form of trust preferred securities, is determined using rates currently available to the Company for debt with similar terms and remaining maturities.
Accrued interest receivable and payable—The carrying amount approximates fair value.
Commitments to extend credit and commercial and standby letters of credit—The fair values of these off-balance sheet commitments to extend credit and commercial and standby letters of credit are not considered practicable to estimate because of the lack of quoted market prices and the inability to estimate fair value without incurring excessive costs.
The estimated fair values of financial instruments and levels within the fair value hierarchy are as follows:
| March 31, 2017 |
December 31, 2016 |
|||||||||||||||||||
|
Fair Value |
Carrying |
Estimated |
Carrying |
Estimated |
||||||||||||||||
| Financial assets |
||||||||||||||||||||
| Cash and due from banks |
1 | $ | 15,541 | $ | 15,541 | $ | 17,735 | $ | 17,735 | |||||||||||
| Interest bearing deposits with other banks |
2 | 67,726 | 67,726 | 28,798 | 28,798 | |||||||||||||||
| Securities held-to-maturity |
2 | 132,897 | 132,707 | 138,846 | 138,082 | |||||||||||||||
| Other restricted stock |
2 | 9,503 | 9,503 | 14,993 | 14,993 | |||||||||||||||
| Loans held for sale |
3 | 23,492 | 26,173 | 23,976 | 26,487 | |||||||||||||||
| Loans and lease receivables, net |
3 | 2,131,717 | 2,061,740 | 2,137,088 | 2,068,157 | |||||||||||||||
| Accrued interest receivable |
3 | 7,498 | 7,498 | 6,866 | 6,866 | |||||||||||||||
| Financial liabilities |
||||||||||||||||||||
| Non-interest bearing deposits |
2 | 732,267 | 732,267 | 724,457 | 724,457 | |||||||||||||||
| Interest bearing deposits |
2 | 1,843,572 | 1,797,175 | 1,765,937 | 1,723,941 | |||||||||||||||
| Accrued interest payable |
2 | 1,893 | 1,893 | 2,427 | 2,427 | |||||||||||||||
| Revolving line of credit |
2 | 18,150 | 18,150 | 20,650 | 20,650 | |||||||||||||||
| Federal Home Loan Bank advances |
2 | 209,663 | 209,604 | 313,715 | 313,646 | |||||||||||||||
| Securities sold under repurchase agreement |
2 | 31,940 | 31,931 | 17,249 | 17,249 | |||||||||||||||
| Junior subordinated debentures |
3 | 27,130 | 26,947 | 26,926 | 26,943 | |||||||||||||||
F-110
Table of Contents
BYLINE BANCORP, INC. AND SUBSIDIARIES
NOTES TO CONDENSED CONSOLIDATED FINANCIAL STATEMENTS
(Table dollars in thousands, except share and per share data) (Unaudited)
Note 17—Derivative Instruments and Hedge Activities
The Company recognizes derivative financial instruments at fair value regardless of the purpose or intent for holding the instrument. The Company records derivative assets and derivative liabilities on the Consolidated Statements of Financial Condition within accrued interest receivable and other assets and accrued interest payable and other liabilities, respectively. The following tables present the fair value of the Company’s derivative financial instruments and classification on the Consolidated Statements of Financial Condition as of March 31, 2017 and December 31, 2016:
| March 31, 2017 |
December 31, 2016 |
|||||||||||||||||||||||
| Fair Value |
Fair Value |
|||||||||||||||||||||||
| Notional |
Other |
Other |
Notional |
Other |
Other |
|||||||||||||||||||
| Derivatives designated as hedging instruments |
||||||||||||||||||||||||
| Interest rate swaps designated as cash flow hedges |
$ | 200,000 | $ | 3,925 | $ | 254 | $ | 100,000 | $ | 3,719 | $ | — | ||||||||||||
| Derivatives not designated as hedging instruments |
||||||||||||||||||||||||
| Other interest rate swaps |
$ | 74,272 | $ | 727 | $ | 701 | $ | 51,213 | $ | 598 | $ | 559 | ||||||||||||
|
|
|
|
|
|
|
|
|
|
|
|
|
|||||||||||||
| Total derivatives |
$ | 274,272 | $ | 4,652 | $ | 955 | $ | 151,213 | $ | 4,317 | $ | 559 | ||||||||||||
|
|
|
|
|
|
|
|
|
|
|
|
|
|||||||||||||
Interest rate swaps designated as cash flow hedges—Cash flow hedges of interest payments associated with certain FHLB advances had notional amounts totaling $200.0 million as of March 31, 2017. The aggregate fair value of the swaps is recorded in other assets or other liabilities with changes in fair value recorded in other comprehensive income (loss), net of taxes, to the extent effective. The amount included in accumulated other comprehensive income (loss) would be reclassified to current earnings when the hedged FHLB advances affect earnings. The Company assesses the effectiveness of each hedging relationship by comparing the changes in fair value of the derivative hedging instrument with the changes in fair value of the designated hedged transactions. The Company expects the hedges to remain highly effective during the remaining terms of the swaps and did not recognize any hedge ineffectiveness in current earnings during the quarter ended March 31, 2017.
Interest expense recorded on these swap transactions totaled $54,000 during the first quarter of 2017 and is reported as a component of interest expense on FHLB advances. At March 31, 2017, the Company estimates $449,000 of the unrealized gain to be reclassified as an increase to interest expense during the next twelve months.
The following table reflects the net gains (losses) recorded in accumulated other comprehensive income (loss) and the Consolidated Statements of Operations relating to the cash flow derivative instruments for the quarter ended March 31, 2017.
|
Amount of Gain |
Amount of Loss |
Amount of Gain (Loss) |
||||||||||
| Interest rate swaps |
$ | 3,695 | $ | (54 | ) | $ | — | |||||
Other interest rate swaps—The total combined notional amount was $74.3 million with maturities ranged from January 2020 to October 2026. The fair values of the interest rate swap agreements are reflected in
F-111
Table of Contents
BYLINE BANCORP, INC. AND SUBSIDIARIES
NOTES TO CONDENSED CONSOLIDATED FINANCIAL STATEMENTS
(Table dollars in thousands, except share and per share data) (Unaudited)
Note 17—Derivative Instruments and Hedge Activities (Continued)
other assets and other liabilities with corresponding gains or losses reflected in non-interest income. During the quarter ended March 31, 2017, transaction fees related to these derivative instruments were $113,000.
The following table reflects other interest rate swaps as of March 31, 2017:
| Notional amounts |
$ | 74,272 | ||
| Derivative assets fair value |
727 | |||
| Derivative liabilities fair value |
701 | |||
| Weighted average pay rates |
4.19 | % | ||
| Weighted average receive rates |
3.22 | % | ||
| Weighted average maturity |
7.4 years |
Credit risk—Derivative instruments are inherently subject to market risk and credit risk. Market risk is associated with changes in interest rates and credit risk relates to the Company’s risk of loss when the counterparty to a derivative contract fails to perform according to the terms of the agreement. Market and credit risks are managed and monitored as part of the Company’s overall asset-liability management process. The credit risk related to derivatives entered into with certain qualified borrowers is managed through the Company’s loan underwriting process. The Company’s loan underwriting process also approves the Bank’s swap counterparty used to mirror the borrowers’ swap. The Company has a bilateral agreement with each swap counterparty that provides that fluctuations in derivative values are to be fully collateralized with either cash or securities. The credit valuation adjustment (“CVA”) is a fair value adjustment to the derivative to account for this risk. During the quarter ended March 31, 2017, the CVA resulted in a decrease to non-interest income of $13,000.
The Company has agreements with its derivative counterparties that contain a cross-default provision under which if the Company defaults on any of its indebtedness, including default where repayment of the indebtedness has not been accelerated by the lender, then the Company could also be declared in default on its derivative obligations. The Company also has agreements with certain derivative counterparties that contain a provision where if the Company fails to maintain its status as a well or adequately capitalized institution, then the counterparty could terminate the derivative positions and the Company would be required to settle its obligations resulted in a net asset position.
F-112
Table of Contents
BYLINE BANCORP, INC. AND SUBSIDIARIES
NOTES TO CONDENSED CONSOLIDATED FINANCIAL STATEMENTS
(Table dollars in thousands, except share and per share data) (Unaudited)
Note 17—Derivative Instruments and Hedge Activities (Continued)
The Company records interest rate derivatives subject to master netting agreements at their gross value and does not offset derivative asset and liabilities on the Consolidated Statements of Financial Condition. The table below summarizes the Company’s interest rate derivatives and offsetting positions as of March 31, 2017:
| Derivative Assets |
Derivative Liabilities |
|||||||
| Gross amounts recognized |
$ | 4,652 | $ | 955 | ||||
| Less: Amounts offset in the Consolidated Statements of Financial Condition |
— | — | ||||||
|
|
|
|
|
|||||
| Net amount presented in the Consolidated Statements of Financial Condition |
$ | 4,652 | $ | 955 | ||||
|
|
|
|
|
|||||
| Gross amounts not offset in the Consolidated Statements of Financial Condition |
||||||||
| Offsetting derivative positions |
— | — | ||||||
| Collateral posted |
(4,260 | ) | 955 | |||||
|
|
|
|
|
|||||
| Net credit exposure |
$ | 392 | $ | — | ||||
|
|
|
|
|
|||||
In February 2017 and March 2017, the Company executed four additional cash flow hedges totaling $100.0 million in notional value with maturity dates in March 2022. Subsequent to March 31, 2017, the Company entered into two addition cash flow hedges totaling $50.0 million in notional value with maturity dates in September 2022 and March 2023.
Note 18—Earnings per Share
A reconciliation of the numerators and denominators for earnings per common share computations for the quarters ended March 31, 2017 and 2016 is presented below. Options to purchase 1,634,568 shares of common stock were outstanding as of March 31, 2016, but were not included in the computation of diluted earnings per share due to a loss for the period and, therefore, were anti-dilutive.
The following represent the calculation of basic and diluted earnings per share:
| Three months ended March 31, |
||||||||
| 2017 |
2016 |
|||||||
| Net income (loss) |
$ | 6,560 | $ | (1,352 | ) | |||
| Less: Dividends on preferred shares |
189 | — | ||||||
|
|
|
|
|
|||||
| Net income (loss) available to common stockholders |
$ | 6,371 | $ | (1,352 | ) | |||
|
|
|
|
|
|||||
| Weighted-average common stock outstanding: |
||||||||
| Weighted-average common stock outstanding (basic) |
24,616,706 | 17,522,226 | ||||||
| Incremental shares(1)(2) |
461,721 | — | ||||||
|
|
|
|
|
|||||
| Weighted-average common stock outstanding (dilutive) |
25,078,427 | 17,522,226 | ||||||
|
|
|
|
|
|||||
| Basic earnings per common share |
$ | 0.26 | $ | (0.08 | ) | |||
| Diluted earnings per common share |
$ | 0.25 | $ | (0.08 | ) | |||
| (1) | This amount represents outstanding stock options for which the exercise price is less than the average market price of the Company’s common stock. |
F-113
Table of Contents
BYLINE BANCORP, INC. AND SUBSIDIARIES
NOTES TO CONDENSED CONSOLIDATED FINANCIAL STATEMENTS
(Table dollars in thousands, except share and per share data) (Unaudited)
Note 18—Earnings per Share (Continued)
| (2) | During the three months ended March 31, 2016, due to a loss for the period, zero incremental shares are included because the effect would be anti-dilutive. The number of shares excluded was 307,820. |
Note 19—Stockholders’ Equity
A summary of the Company’s common and preferred stock at March 31, 2017 and December 31, 2016 is as follows:
| March 31, 2017 |
December 31, 2016 |
|||||||
| Series A non-cumulative perpetual preferred stock |
||||||||
| Par value |
$ | 0.01 | $ | 0.01 | ||||
| Shares authorized |
15,003 | 15,003 | ||||||
| Shares issued |
15,003 | 15,003 | ||||||
| Shares outstanding |
15,003 | 15,003 | ||||||
| Series B 7.5% fixed to floating non-cumulative perpetual preferred stock |
||||||||
| Par value |
$ | 0.01 | $ | 0.01 | ||||
| Shares authorized |
50,000 | 50,000 | ||||||
| Shares issued |
10,438 | 9,388 | ||||||
| Subscription receivable |
— | 1,050 | ||||||
| Shares outstanding |
10,438 | 9,388 | ||||||
| Common stock, voting |
||||||||
| Par value |
$ | — | $ | — | ||||
| Shares authorized |
150,000,000 | 150,000,000 | ||||||
| Shares issued |
24,616,706 | 24,616,706 | ||||||
| Shares outstanding |
24,616,706 | 24,616,706 | ||||||
In connection with the recapitalization, the Company authorized and issued voting common stock and Series A non-voting, non-cumulative perpetual preferred stock with liquidation preference. The Series A preferred stock is redeemable at the Company’s option on or after July 1, 2018. Under the terms of the Series A preferred stock certificate of designation, the Company would have to declare and pay a dividend or make a distribution prior to paying a dividend on its common stock, redeeming the Series A, or upon liquidation, in accordance with the terms of the preferred stock, which may reduce the earnings available to common stockholders upon declaration.
During 2016, the Company authorized and issued Series B 7.50% fixed-to-floating non-voting, noncumulative perpetual preferred stock with liquidation preference of $1,000 per share, plus the amount of unpaid dividends, if any, which is redeemable at the Company’s option on or after March 31, 2022. Holders of either Series A or Series B preferred stock do not have any rights to convert such stock into shares of any other class of capital stock of the Company.
On January 30, 2017, the Company issued an additional 1,050 shares of Series B preferred stock, which is reflected as a subscription receivable as of December 31, 2016. On February 7, 2017, the Company declared a full dividend on the Series B preferred stock for the dividend period ending March 31, 2017 and payable on March 31, 2017 to holders of record as of March 16, 2017.
F-114
Table of Contents
BYLINE BANCORP, INC. AND SUBSIDIARIES
NOTES TO CONDENSED CONSOLIDATED FINANCIAL STATEMENTS
(Table dollars in thousands, except share and per share data) (Unaudited)
Note 20—Subsequent Events
On May 19, 2017, the Company issued a press release announcing its intention to pursue an initial public offering of common stock (the “IPO”) in 2017. In anticipation of the IPO, the Board of Directors considered the potential benefits afforded by Delaware law to public companies, including greater predictability and enhanced ability to attract and retain qualified independent directors, and determined that it is in the best interests of the Company and its stockholders to reincorporate in Delaware prior to the IPO.
On June 14, 2017, stockholders of record as of May 22, 2017 voted to approve an Agreement and Plan of Merger between Byline Bancorp, Inc., an Illinois corporation (“Byline Illinois”), and Byline Bancorp, Inc., a wholly owned Delaware subsidiary of the Company, including the amended and restated certificate of incorporation and by-laws of the Company. Each share of Byline Illinois common stock issued and outstanding immediately prior to the effective time of the Merger was converted automatically into the right to receive one fifth (0.20) of a share of common stock of the Company. Fractional shares are to be paid in cash based on the initial public offering price of Byline Bancorp, Inc.’s common stock. Following the Merger, there will be no change in authorized shares.
F-115
Table of Contents
Ridgestone Financial Services, Inc.
Acquired by Byline Bancorp, Inc.
Report on the Financial Statements
We have audited the accompanying consolidated financial statements of Ridgestone Financial Services, Inc., which comprise the consolidated balance sheets as of October 14, 2016 and December 31, 2015, and the related consolidated statements of income, comprehensive income, shareholders’ equity, and cash flows for the period from January 1, 2016 to October 14, 2016 and for the year ended December 31, 2015, and the related notes to the financial statements.
Management’s Responsibility for the Financial Statements
Management is responsible for the preparation and fair presentation of these consolidated financial statements in accordance with accounting principles generally accepted in the United States of America; this includes the design, implementation, and maintenance of internal control relevant to the preparation and fair presentation of consolidated financial statements that are free from material misstatement, whether due to fraud or error.
Auditor’s Responsibility
Our responsibility is to express an opinion on these consolidated financial statements based on our audits. We conducted our audits in accordance with auditing standards generally accepted in the United States of America. Those standards require that we plan and perform the audit to obtain reasonable assurance about whether the consolidated financial statements are free from material misstatement.
An audit involves performing procedures to obtain audit evidence about the amounts and disclosures in the consolidated financial statements. The procedures selected depend on the auditor’s judgment, including the assessment of the risks of material misstatement of the consolidated financial statements, whether due to fraud or error. In making those risk assessments, the auditor considers internal control relevant to the entity’s preparation and fair presentation of the consolidated financial statements in order to design audit procedures that are appropriate in the circumstances, but not for the purpose of expressing an opinion on the effectiveness of the entity’s internal control. Accordingly, we express no such opinion. An audit also includes evaluating the appropriateness of accounting policies used and the reasonableness of significant accounting estimates made by management, as well as evaluating the overall presentation of the consolidated financial statements.
We believe that the audit evidence we have obtained is sufficient and appropriate to provide a basis for our audit opinion.
Opinion
In our opinion, the consolidated financial statements referred to above present fairly, in all material respects, the financial position of Ridgestone Financial Services, Inc. as of October 14, 2016 and December 31, 2015, and the results of its operations and its cash flows for the period from January 1, 2016 to October 14, 2016 and the year ended December 31, 2015, in accordance with accounting principles generally accepted in the United States of America.
/s/ Crowe Horwath LLP
Oak Brook, Illinois
March 27, 2017
F-116
Table of Contents
RIDGESTONE FINANCIAL SERVICES, INC.
CONSOLIDATED BALANCE SHEETS
As of October 14, 2016 and December 31, 2015
(In thousands of dollars, except per share data)
| October 14, |
December 31, |
|||||||
| ASSETS |
||||||||
| Cash and due from banks |
$ | 24,914 | $ | 12,465 | ||||
| Federal funds sold |
566 | 634 | ||||||
|
|
|
|
|
|||||
| Cash and cash equivalents |
25,480 | 13,099 | ||||||
| Securities available-for-sale |
27,214 | 27,390 | ||||||
| Loans held for sale ($8,915 and $2,067 at fair value) |
14,716 | 41,464 | ||||||
| Loans carried at fair value and held in portfolio |
3,338 | 4,022 | ||||||
| Loans carried at amortized cost and held in portfolio, net of allowance of $8,816 and $8,996 |
343,966 | 306,299 | ||||||
| Other real estate owned, net |
1,710 | 1,515 | ||||||
| Premises and equipment, net |
2,526 | 2,500 | ||||||
| Federal Home Loan Bank stock, at cost |
854 | 724 | ||||||
| Company-owned life insurance |
2,352 | 2,317 | ||||||
| Servicing assets, at fair value |
21,499 | 19,107 | ||||||
| Accrued interest receivable and other assets |
3,748 | 4,386 | ||||||
|
|
|
|
|
|||||
| Total assets |
$ | 447,403 | $ | 422,823 | ||||
|
|
|
|
|
|||||
| LIABILITIES AND SHAREHOLDERS’ EQUITY |
||||||||
| Deposits |
||||||||
| Non-interest bearing |
$ | 40,254 | $ | 34,133 | ||||
| Interest bearing |
318,459 | 309,438 | ||||||
|
|
|
|
|
|||||
| Total deposits |
358,713 | 343,571 | ||||||
| Federal Home Loan Bank advances |
9,487 | 9,487 | ||||||
| Borrowings |
— | 775 | ||||||
| Subordinated debentures |
1,550 | 1,550 | ||||||
| Accrued interest payable and other liabilities |
13,204 | 13,592 | ||||||
|
|
|
|
|
|||||
| Total liabilities |
382,954 | 368,975 | ||||||
| Shareholders’ equity |
||||||||
| Preferred stock, no par value; 100,000 shares authorized; no shares issued and outstanding |
— | — | ||||||
| Common stock, no par value; 10,000,000 shares authorized; 3,393,665 and 3,369,041 shares issued and outstanding |
— | — | ||||||
| Additional paid-in capital |
31,538 | 30,826 | ||||||
| Accumulated earnings |
32,745 | 23,124 | ||||||
| Accumulated other comprehensive income (loss) |
166 | (102 | ) | |||||
|
|
|
|
|
|||||
| Total shareholders’ equity |
64,449 | 53,848 | ||||||
|
|
|
|
|
|||||
| Total liabilities and shareholders’ equity |
$ | 447,403 | $ | 422,823 | ||||
|
|
|
|
|
|||||
See accompanying notes to the consolidated financial statements.
F-117
Table of Contents
RIDGESTONE FINANCIAL SERVICES, INC.
CONSOLIDATED STATEMENTS OF INCOME
For the period from January 1, 2016 to October 14, 2016 and the year ended December 31, 2015
(In thousands of dollars, except per share data)
| October 14, |
December 31, |
|||||||
| Interest income |
||||||||
| Loans, including fees |
$ | 21,645 | $ | 23,333 | ||||
| Securities available-for-sale |
347 | 537 | ||||||
| Federal funds sold and other |
78 | 55 | ||||||
|
|
|
|
|
|||||
| 22,070 | 23,925 | |||||||
| Interest expense |
||||||||
| Deposits |
2,521 | 2,638 | ||||||
| Federal Home Loan Bank advances |
248 | 309 | ||||||
| Note payable and subordinated debentures |
72 | 112 | ||||||
|
|
|
|
|
|||||
| 2,841 | 3,059 | |||||||
|
|
|
|
|
|||||
| Net interest income |
19,229 | 20,866 | ||||||
| Provision for loan losses |
3,632 | 3,340 | ||||||
|
|
|
|
|
|||||
| Net interest income after provision for loan losses |
15,597 | 17,526 | ||||||
| Non-interest income |
||||||||
| Net gains on loan sales |
29,259 | 25,923 | ||||||
| Loan servicing |
2,982 | 3,337 | ||||||
| Service charges and fees |
2,024 | 2,486 | ||||||
| Earnings on company-owned life insurance |
64 | 77 | ||||||
| Gains on sale of securities available-for-sale |
— | 99 | ||||||
| Gain (loss) on sales of other real estate owned |
(34 | ) | 201 | |||||
| Other |
284 | 385 | ||||||
|
|
|
|
|
|||||
| 34,579 | 32,508 | |||||||
| Non-interest expense |
||||||||
| Salaries and employee benefits |
19,220 | 18,721 | ||||||
| Occupancy and equipment |
845 | 1,134 | ||||||
| Professional fees |
2,727 | 5,561 | ||||||
| Data processing |
650 | 341 | ||||||
| Federal deposit insurance |
155 | 234 | ||||||
| Other real estate owned |
399 | 320 | ||||||
| Collection fees |
366 | 76 | ||||||
| Other |
4,654 | 4,230 | ||||||
|
|
|
|
|
|||||
| 29,016 | 30,617 | |||||||
|
|
|
|
|
|||||
| Income before income taxes |
21,160 | 19,417 | ||||||
| Income tax expense |
9,008 | 8,032 | ||||||
|
|
|
|
|
|||||
| Net income |
$ | 12,152 | $ | 11,385 | ||||
|
|
|
|
|
|||||
| Earnings per share: |
||||||||
| Basic |
$ | 3.60 | $ | 3.38 | ||||
| Diluted |
3.60 | 3.37 | ||||||
See accompanying notes to the consolidated financial statements.
F-118
Table of Contents
RIDGESTONE FINANCIAL SERVICES, INC.
CONSOLIDATED STATEMENTS OF COMPREHENSIVE INCOME
For the period from January 1, 2016 to October 14, 2016 and the year ended December 31, 2015
(In thousands of dollars, except per share data)
| October 14, |
December 31, |
|||||||
| Net income |
$ | 12,152 | $ | 11,385 | ||||
| Other comprehensive income: |
||||||||
| Unrealized gains on securities: |
||||||||
| Unrealized gains on securities, during the period |
446 | 236 | ||||||
| Reclassification adjustment for gains included in net income |
— | (99 | ) | |||||
| Tax effect |
(178 | ) | (54 | ) | ||||
|
|
|
|
|
|||||
| Other comprehensive income |
268 | 83 | ||||||
|
|
|
|
|
|||||
| Comprehensive income |
$ | 12,420 | $ | 11,468 | ||||
|
|
|
|
|
|||||
See accompanying notes to the consolidated financial statements.
F-119
Table of Contents
RIDGESTONE FINANCIAL SERVICES, INC.
CONSOLIDATED STATEMENTS OF SHAREHOLDERS’ EQUITY
For the period from January 1, 2016 to October 14, 2016 and the year ended December 31, 2015
(In thousands of dollars, except per share data)
| Common |
Additional |
Accumulated |
Accumulated |
Total |
||||||||||||||||
| Balance at January 1, 2015 |
$ | — | $ | 30,662 | $ | 15,950 | $ | (185 | ) | $ | 46,427 | |||||||||
| Net income |
— | — | 11,385 | — | 11,385 | |||||||||||||||
| Other comprehensive income |
— | — | — | 83 | 83 | |||||||||||||||
| Common stock dividends ($1.25 per share) |
— | — | (4,211 | ) | — | (4,211 | ) | |||||||||||||
| Stock awards earned—13,276 shares |
— | 164 | — | — | 164 | |||||||||||||||
|
|
|
|
|
|
|
|
|
|
|
|||||||||||
| Balance at December 31, 2015 |
— | 30,826 | 23,124 | (102 | ) | 53,848 | ||||||||||||||
| Net income |
— | — | 12,152 | — | 12,152 | |||||||||||||||
| Other comprehensive income |
— | — | — | 268 | 268 | |||||||||||||||
| Common stock dividends ($0.75 per share) |
— | — | (2,531 | ) | — | (2,531 | ) | |||||||||||||
| Stock awards earned—24,624 shares |
— | 712 | — | — | 712 | |||||||||||||||
|
|
|
|
|
|
|
|
|
|
|
|||||||||||
| Balance at October 14, 2016 |
$ | — | $ | 31,538 | $ | 32,745 | $ | 166 | $ | 64,449 | ||||||||||
|
|
|
|
|
|
|
|
|
|
|
|||||||||||
See accompanying notes to the consolidated financial statements.
F-120
Table of Contents
RIDGESTONE FINANCIAL SERVICES, INC.
CONSOLIDATED STATEMENTS OF CASH FLOWS
For the period from January 1, 2016 to October 14, 2016 and the year ended December 31, 2015
(In thousands of dollars, except per share data)
| October 14, |
December 31, |
|||||||
| Cash flows from operating activities |
||||||||
| Net income |
$ | 12,152 | $ | 11,385 | ||||
| Adjustments to reconcile net income to net cash from operating activities |
||||||||
| Provision for loan losses |
3,632 | 3,340 | ||||||
| Gains on sale of securities |
— | (99 | ) | |||||
| Depreciation |
224 | 311 | ||||||
| Net amortization of securities |
4 | 14 | ||||||
| Earnings on company-owned life insurance, net of expenses |
(35 | ) | (43 | ) | ||||
| Stock awards earned |
712 | 164 | ||||||
| Net gains on loan sales |
(29,259 | ) | (25,923 | ) | ||||
| Loans originated for sale |
(231,188 | ) | (256,543 | ) | ||||
| Proceeds from sales of loans held for sale |
281,194 | 255,150 | ||||||
| Change in fair value of servicing assets |
3,609 | 4,008 | ||||||
| Change in fair value for loans carried at fair value |
(161 | ) | (255 | ) | ||||
| Loss (gain) on sale of other real estate owned |
34 | (201 | ) | |||||
| Other real estate owned impairment |
46 | 132 | ||||||
| Loss on sale of premises and equipment |
— | 5 | ||||||
| Net change in: |
||||||||
| Accrued interest receivable and other assets |
460 | (250 | ) | |||||
| Accrued expenses and other liabilities |
454 | 3,729 | ||||||
|
|
|
|
|
|||||
| Net cash from operating activities |
41,878 | (5,076 | ) | |||||
| Cash flows from investing activities |
||||||||
| Sales of available-for-sale securities |
— | 5,930 | ||||||
| Purchases of available-for-sale securities |
— | (3,989 | ) | |||||
| Proceeds from principal pay downs, calls, and maturities of available-for-sale securities |
618 | 817 | ||||||
| Loan originations and payments, net |
(41,826 | ) | (24,040 | ) | ||||
| Purchases of premises and equipment |
(250 | ) | (91 | ) | ||||
| Purchase of FHLB stock |
(130 | ) | — | |||||
| Proceeds from sales of other real estate owned |
1,097 | 3,622 | ||||||
|
|
|
|
|
|||||
| Net cash from investing activities |
(40,491 | ) | (17,751 | ) | ||||
| Cash flows from financing activities |
||||||||
| Net change in deposits |
15,142 | 16,218 | ||||||
| Repayments on Federal Home Loan Bank advances |
— | (5,000 | ) | |||||
| Federal Home Loan Bank advances |
— | 5,000 | ||||||
| Common stock dividends |
(3,373 | ) | (3,369 | ) | ||||
| Proceeds from/ (payments on) line of credit |
(775 | ) | 775 | |||||
| Repayments of note payable |
— | (900 | ) | |||||
|
|
|
|
|
|||||
| Net cash from financing activities |
10,994 | 12,724 | ||||||
|
|
|
|
|
|||||
| Net change in cash and cash equivalents |
12,381 | (10,103 | ) | |||||
| Beginning cash and cash equivalents |
13,099 | 23,202 | ||||||
|
|
|
|
|
|||||
| Ending cash and cash equivalents |
$ | 25,480 | $ | 13,099 | ||||
|
|
|
|
|
|||||
| Supplemental cash flow information: |
||||||||
| Interest paid |
$ | 2,616 | $ | 2,651 | ||||
| Income tax payments, net |
7,762 | 5,320 | ||||||
| Supplemental non-cash flow information: |
||||||||
| Transfers from loans to other real estate owned |
$ | 1,372 | $ | 494 | ||||
| Dividends declared but not paid |
— | 842 | ||||||
See accompanying notes to the consolidated financial statements.
F-121
Table of Contents
RIDGESTONE FINANCIAL SERVICES, INC.
NOTES TO THE CONSOLIDATED FINANCIAL STATEMENTS
For the period from January 1, 2016 to October 14, 2016 and the year ended December 31, 2015
(In thousands of dollars, except per share data)
NOTE 1—SUMMARY OF SIGNIFICANT ACCOUNTING POLICIES
Nature of Operations and Principles of Consolidation: The consolidated financial statements include Ridgestone Financial Services, Inc. (“the Holding Company”) and its wholly owned subsidiary, Ridgestone Bank (“the Bank”), collectively referred to herein as “the Company.” Intercompany transactions and balances are eliminated in consolidation.
The Company provides financial services through its offices located in Wisconsin (Brookfield, Green Bay, and Wausau), Illinois (Schaumburg), and Indiana (Indianapolis). The Company also has a loan production office located in Southern California (Newport Beach). Its primary deposit products are checking, savings, and time deposit accounts, and its primary lending products are offered through programs of the Small Business Administration (“SBA”) and U.S. Department of Agriculture (“USDA”). Substantially all loans are secured by specific items of collateral including business assets, and commercial real estate. Commercial loans are expected to be repaid from cash flow from operations of businesses. However, the customers’ ability to repay their loans is dependent on the cash flow of the business entity and general economic conditions.
On June 9, 2016, the Company entered into a merger agreement with Byline Bancorp, Inc. (“Byline”) pursuant to which Ridgestone Financial Services, Inc. would merge into Byline Bancorp, Inc., an Illinois Corporation, and Ridgestone Bank would merge into Byline Bank, an Illinois chartered bank and wholly-owned subsidiary of Byline. The total consideration for the merger was $105 million, with 35% paid in cash and 65% paid in Byline stock. The merger was completed at the close of business on October 14, 2016. The operations of the Company beginning October 15, 2016 are included in the financial reporting of Byline Bancorp, Inc.
Subsequent Events: The Company has evaluated subsequent events for recognition and disclosure through March 27, 2017, which is the date the financial statements were available to be issued.
Use of Estimates: To prepare financial statements in conformity with accounting principles generally accepted in the United States of America, management makes estimates and assumptions based on available information. These estimates and assumptions affect the amounts reported in the financial statements and the disclosures provided, and actual results could differ.
Cash Flow: Cash and cash equivalents include cash, deposits with other financial institutions, and federal funds sold. Net cash flows are reported for customer loan and deposit transactions, federal funds purchased and sold, and Company-owned life insurance.
Securities: Securities are classified as available-for-sale because they may be sold before maturity, and are carried at fair value, with unrealized holding gains and losses reported in other comprehensive income, net of tax.
Interest income includes amortization and accretion of purchase premiums and discounts. Premiums and discounts on securities are amortized and accreted on the level-yield method without anticipating prepayments, except for mortgage-backed securities where prepayments are anticipated. Gains and losses on sales are recorded on the trade date and determined using the specific identification method.
Management evaluates securities for other-than-temporary impairment at least on a quarterly basis, and more frequently when economic or market conditions warrant such an evaluation. For securities in an unrealized loss position, management considers the extent and duration of the unrealized loss, and the financial condition
F-122
Table of Contents
RIDGESTONE FINANCIAL SERVICES, INC.
NOTES TO THE CONSOLIDATED FINANCIAL STATEMENTS (Continued)
For the period from January 1, 2016 to October 14, 2016 and the year ended December 31, 2015
(In thousands of dollars, except per share data)
NOTE 1—SUMMARY OF SIGNIFICANT ACCOUNTING POLICIES (Continued)
and near-term prospects of the issuer. Management also assesses whether it intends to sell, or is more likely than not that it will be required to sell, a security in an unrealized loss position before recovery of its amortized cost basis. If either criteria regarding intent or requirement to sell is met, the entire difference between amortized cost and fair value is recognized as impairment through earnings. For securities that do not meet the aforementioned criteria, the amount of impairment is split into two components as follows: 1) other-than-temporary impairment related to credit loss, which must be recognized in the statement of income and 2) other-than-temporary impairment related to other factors, which is recognized in other comprehensive income. The credit loss is defined as the difference between the present value of the cash flows expected to be collected and the amortized cost basis. The assessment of whether an other-than temporary decline exists involves a high degree of subjectivity and judgment and is based on the information available to management at a point in time.
Loans Held for Sale: The Company is a participant in the SBA and the USDA lending programs and originates SBA and USDA loans.
SBA and USDA loans that management has the intent and ability to sell are designated as held for sale. Loans held for sale are either accounted for at amortized cost or fair value. The Company determines whether to account for SBA and USDA loans at fair value or amortized cost at origination. The SBA and USDA loans accounted for at fair value remain at fair value after the determination. The loans accounted for at amortized cost are carried at the lower of cost or fair value, determined on a loan by loan basis. Net unrealized losses, if any, are recorded as a valuation allowance and charged to earnings.
Gains or losses on held for sale loans are recognized upon completion of the sale and based on the difference between the net sales proceeds, carrying value of sold loan, and fair value of retained loan (if any). The difference between the initial carrying balance of the retained loan and fair value is recorded as a discount to the retained loan, establishing a new carrying balance. The recorded discount is accreted to earnings on a level yield basis. SBA and USDA loans are sold with servicing retained.
Loans at Fair Value: The Company elected the fair value option on certain SBA and USDA loans that are held for sale. The election is being made to allow for immediate gain recognition of the anticipated held for sale loan amount. This election also results in the Company’s retained portion of the SBA and USDA loans to be recorded at fair value and to remain at fair value. The Company has elected fair value of certain loans to allow for immediate gain recognition in cases where a sale cannot be completed prior to the end of a specific reporting period or where the economics of a sale might be maximized by delaying the sale.
Loans: Loans that the Company has the intent and ability to hold are stated at the principal amount outstanding, net of deferred loan fees and the allowance for loan losses. Interest on loans is accrued and credited to income over the terms of the respective loans based upon principal balances outstanding.
Loans originated and held for sale in the secondary market are carried at the lower of cost, net of loan fees collected, or estimated fair value in the aggregate. These loans are sold without recourse. Gains and losses from the sale of loans are determined based upon the net proceeds and the carrying value of the loans sold. Net unrealized losses are recognized in a valuation allowance by charges to income.
Loan fees related to non-SBA and non-USDA loans, net of direct loan origination costs, are deferred and amortized over the term of the loan as a yield adjustment without anticipating prepayments. Where serious
F-123
Table of Contents
RIDGESTONE FINANCIAL SERVICES, INC.
NOTES TO THE CONSOLIDATED FINANCIAL STATEMENTS (Continued)
For the period from January 1, 2016 to October 14, 2016 and the year ended December 31, 2015
(In thousands of dollars, except per share data)
NOTE 1—SUMMARY OF SIGNIFICANT ACCOUNTING POLICIES (Continued)
doubt exists as to the collectability of a loan, the accrual of interest is discontinued. Past due status is based on the contractual terms of the loan. Nonaccrual loans and loans past due 90 days still on accrual include both smaller balance homogeneous loans that are collectively evaluated for impairment and individually classified impaired loans. A loan is moved to non-accrual status in accordance with the Company’s policy, typically after 90 days of non-payment.
Interest income for all classes of loans is discontinued at the time a loan is 90 days past due unless the loan is both well secured and in the process of collection. All interest accrued but not received on loans placed on nonaccrual is reversed against interest income. Interest received on such loans is accounted for on the cash-basis or cost recovery method, until qualifying for return to accrual status. Loans are returned to accrual status when all principal and interest amounts contractually due are brought current and future payments are reasonably assured.
Allowance for Loan Losses: The allowance for loan losses is a valuation allowance for probable incurred credit losses, increased by the provision for loan losses and decreased by charge-offs less recoveries. Loan losses are charged against the allowance when management believes that the uncollectibility of a loan balance is confirmed. Subsequent recoveries, if any, are credited to the allowance. Management estimates the allowance balance required using past loan loss experience, the nature and volume of the portfolio, information about specific borrower situations and estimated collateral values, economic conditions, and other factors. Allocations of the allowance may be made for specific loans, but the entire allowance is available for any loan that, in management’s judgment, should be charged off.
The allowance consists of specific and general components. The specific component relates to loans that are individually classified as impaired.
A loan is impaired when, based on current information and events, it is probable that the Company will be unable to collect all amounts due according to the contractual terms of the loan agreement. Loans for which the terms have been modified resulting in a concession, and for which the borrower is experiencing financial difficulties, are considered troubled debt restructurings and classified as impaired. Factors considered by management in determining impairment include payment status, collateral value, and the probability of collecting scheduled principal and interest payments when due. Loans that experience insignificant payment delays and payment shortfalls generally are not classified as impaired. Management determines the significance of payment delays and payment shortfalls on a case-by-case basis, taking into consideration all of the circumstances surrounding the loan and the borrower, including the length of the delay, the reasons for the delay, the borrower’s prior payment record, and the amount of the shortfall in relation to the principal and interest owed.
Construction, commercial, and commercial real estate loans are individually evaluated for impairment. Large groups of smaller balance homogeneous loans, such as consumer and residential real estate loans are collectively evaluated for impairment, and accordingly, they are not separately identified for impairment disclosures. Troubled debt restructurings are separately identified for impairment disclosures and are measured at the present value of estimated future cash flows using the loan’s effective rate at inception. If a troubled debt restructuring is considered to be a collateral dependent loan, the loan is reported, net, at the fair value of the collateral. For troubled debt restructurings that subsequently default, the Company determines the amount of reserve in accordance with the accounting policy for the allowance for loan losses.
Cash payments on impaired loans representing interest income are reported as such. Other cash payments are recorded as reductions in carrying value.
F-124
Table of Contents
RIDGESTONE FINANCIAL SERVICES, INC.
NOTES TO THE CONSOLIDATED FINANCIAL STATEMENTS (Continued)
For the period from January 1, 2016 to October 14, 2016 and the year ended December 31, 2015
(In thousands of dollars, except per share data)
NOTE 1—SUMMARY OF SIGNIFICANT ACCOUNTING POLICIES (Continued)
A general component of the allowance for loan losses covers non-impaired loans and is based on actual historical loss experience, by portfolio category, adjusted for current factors. This actual loss experience is supplemented with other economic factors based on the risks present for each portfolio category. These economic factors include consideration of the following: levels of and trends in delinquencies; trends in growth; national and local economic trends and conditions; trends in collateral values; and effects of changes in credit concentrations.
The following portfolio categories have been identified: land, construction, commercial real estate, commercial and industrial, SBA and USDA, religious type organization, and consumer and other.
Management considers the following when assessing the risk in the loan portfolio: Commercial and industrial are dependent on the strength of the industries of the related borrowers and the success of their businesses. Commercial loans are advanced for equipment purchases or to provide working capital or meet other financing needs of the business. These loans may be secured by accounts receivable, inventory, equipment or other business assets. Financial information is obtained from the borrower to evaluate the debt service coverage and ability to repay the loans.
Commercial real estate, land, and construction loans are dependent on the industries tied to these loans as well as the local commercial real estate market. The loans are secured by the real estate, and appraisals are obtained to support the loan amount. An evaluation of the project’s cash flows is performed to evaluate the borrower’s ability to repay the loan at the time of origination and periodically updated during the life of the loan.
Consumer, SBA and USDA, and religious type organization loans are dependent on local economies. Consumer loans are generally secured by consumer assets, but may be unsecured. At the time of origination, the Company evaluates the borrower’s repayment ability through a review of debt to income ratios and credit scores.
Servicing Assets: Servicing assets are recognized separately when they are acquired through sales of loans. When loans are sold, servicing assets are recorded at fair value with the income statement effect recorded in gains on sales of loans. Fair value is based on market prices for comparable servicing contracts, when available, or alternatively, is based on a valuation model that calculates the present value of estimated future net servicing income.
Sales of SBA and USDA loans are executed on a servicing retained basis. The standard SBA loan sale agreement is structured to provide the Company with a servicing spread paid from a portion of the interest cash flow of the loan. SBA regulations require the Company to retain a portion of the cash flow from the interest payments received for a sold loan. The USDA loan sale agreements are not standardized with respect to servicing.
The Company has elected the fair value measurement method and measures servicing rights at fair value at each reporting date. The changes in fair value of servicing assets are reported in earnings in the period in which the changes occur, and are included with loan servicing on the statement of operations. The fair values of servicing rights are subject to significant fluctuations as a result of changes in estimated and actual prepayment speeds, default rates, and losses.
Servicing fee income which is reported on the income statement as loan servicing is recorded for fees earned for servicing loans. The fees are based on a contractual percentage of the outstanding principal. Late fees and ancillary fees related to loan servicing are not material.
F-125
Table of Contents
RIDGESTONE FINANCIAL SERVICES, INC.
NOTES TO THE CONSOLIDATED FINANCIAL STATEMENTS (Continued)
For the period from January 1, 2016 to October 14, 2016 and the year ended December 31, 2015
(In thousands of dollars, except per share data)
NOTE 1—SUMMARY OF SIGNIFICANT ACCOUNTING POLICIES (Continued)
Transfers of Financial Assets: Transfers of financial assets are accounted for as sales, when control over the assets has been relinquished. Control over transferred assets is deemed to be surrendered when the assets have been isolated from the Company, the transferee obtains the right (free of conditions that constrain it from taking advantage of that right) to pledge or exchange the transferred assets, and the Company does not maintain effective control over the transferred assets through an agreement to repurchase them before their maturity.
Other Real Estate Owned: Assets acquired through or instead of loan foreclosure are initially recorded at fair value less costs to sell when acquired, establishing a new cost basis. Physical possession of residential real estate property collateralizing a consumer mortgage loan occurs when legal title is obtained upon completion of foreclosure or when the borrower conveys all interest in the property to satisfy the loan through completion of a deed in lieu of foreclosure or similar legal agreement. If fair value declines subsequent to foreclosure, a valuation allowance is recorded through expense. Operating costs after acquisition are expensed and permanent improvements that increase the value of other real estate owned are capitalized.
Premises and Equipment: Land is carried at cost. Premises and equipment are stated at cost less accumulated depreciation. Depreciation is computed using the straight-line method over the estimated useful lives of the assets. Useful lives are estimated to be 7 to 39 years for building and improvements and 3 to 7 years for furniture, fixtures, and equipment.
Federal Home Loan Bank (“FHLB”) Stock: The Bank is a member of the FHLB system. Members are required to own a certain amount of stock based on the level of borrowings and other factors, and may invest additional amounts. FHLB stock is carried at cost, classified as a restricted security, and periodically evaluated for impairment based on ultimate recovery of par value.
Company-Owned Life Insurance: The Company owns and is the beneficiary of life insurance policies on former executives. Company-owned life insurance is recorded at the amount that can be realized under the insurance contract at the balance sheet date, which is the cash surrender value adjusted for other charges or other amounts due that are probable at settlement.
Long-Term Assets: Premises and equipment are reviewed for impairment when events indicate their carrying amount may not be recoverable from future undiscounted cash flows. If impaired, the assets are recorded at fair value.
Loan Commitments and Related Financial Instruments: Financial instruments include off-balance-sheet credit instruments, such as commitments to make loans and commercial letters of credit, issued to meet customer financing needs. The face amount for these items represents the exposure to loss, before considering customer collateral or ability to repay. Such financial instruments are recorded when they are funded.
Income Taxes: Income tax expense is the total of the current year income tax due or refundable and the change in deferred tax assets and liabilities. Deferred tax assets and liabilities are the expected future tax amounts for the temporary differences between carrying amounts and tax bases of assets and liabilities, computed using enacted tax rates. A valuation allowance, if needed, reduces deferred tax assets to the amount expected to be realized.
F-126
Table of Contents
RIDGESTONE FINANCIAL SERVICES, INC.
NOTES TO THE CONSOLIDATED FINANCIAL STATEMENTS (Continued)
For the period from January 1, 2016 to October 14, 2016 and the year ended December 31, 2015
(In thousands of dollars, except per share data)
NOTE 1—SUMMARY OF SIGNIFICANT ACCOUNTING POLICIES (Continued)
A tax position is recognized as a benefit only if it is “more likely than not” that the tax position would be sustained in a tax examination, with a tax examination being presumed to occur. The amount recognized is the largest amount of tax benefit that is greater than 50% likely of being realized on examination. For tax positions not meeting the “more likely than not” test, no tax benefit is recorded.
The Company recognizes interest and/or penalties related to income tax matters in other expense. No interest and/or penalties related to tax matters were incurred during the period from January 1, 2016 to October 14, 2016 and the year ended December 31, 2015. The Company is no longer subject to examination by Federal taxing authorities for years before 2013. The Company is no longer subject to examination by Wisconsin taxing authorities for years before 2012. The Company is subject to examination from other state taxing authorities from 2010-2016.
Fair Value of Financial Instruments: Fair values of financial instruments are estimated using relevant market information and other assumptions, as more fully disclosed in a separate note. Fair value estimates involve uncertainties and matters of significant judgment regarding interest rates, credit risk, prepayments, and other factors, especially in the absence of broad markets for particular items. Changes in assumptions or in market conditions could significantly affect the estimates.
Dividend Restrictions: Banking regulations require maintaining certain capital levels and may limit the dividends paid by the Bank to the Holding Company or by the Holding Company to its shareholders.
Comprehensive Income: Comprehensive income consists of net income and other comprehensive income (loss). Other comprehensive income (loss) includes unrealized gains and losses on securities available-for-sale which are also recognized as separate component of equity.
Loss Contingencies: Loss contingencies, including claims and legal actions arising in the ordinary course of business, are recorded as liabilities when the likelihood of loss is probable and an amount or range of loss can be reasonably estimated. Management does not believe there now are such matters that will have a material effect on the financial statements.
In August 2011, the Bank was named as a defendant in two lawsuits in actions by a company which filed for bankruptcy after its two principal officers were discovered to have stolen funds from its customers. The Bank was the depository bank of an omnibus account, which held subscribers’ Health Savings Account funds. In this litigation, the bankruptcy trustee sought to recover approximately $15.6 million from the Bank. On July 15, 2015, an order was entered by the bankruptcy court approving a settlement by the Bank of all outstanding claims made against it in connection with the matter. The cases were settled for $4.75 million, of which $750,000 was paid by the Bank’s insurer. The net settlement expense of $4.0 million is included in professional fees for the year ended December 31, 2015.
Earnings Per Share: Basic earnings per share is net income divided by the weighted average number of common shares outstanding during the period. Diluted earnings per common share show the dilutive effect, if any, of additional common shares issuable from stock awards.
Operating Segments: While management monitors revenue streams of the various products and services, operations are managed and financial performance is evaluated on a Company-wide basis. Operating segments are aggregated into one as operating results for all segments are similar. Accordingly, all of the financial service operations are considered by management to be aggregated in one reportable operating segment.
F-127
Table of Contents
RIDGESTONE FINANCIAL SERVICES, INC.
NOTES TO THE CONSOLIDATED FINANCIAL STATEMENTS (Continued)
For the period from January 1, 2016 to October 14, 2016 and the year ended December 31, 2015
(In thousands of dollars, except per share data)
NOTE 1—SUMMARY OF SIGNIFICANT ACCOUNTING POLICIES (Continued)
Reclassifications: Some items in the prior year financial statements were reclassified to conform to the current presentation.
NOTE 2—SECURITIES AVAILABLE FOR SALE
The following table summarizes the amortized cost and fair value of the available-for-sale securities portfolio as of October 14, 2016 and December 31, 2015 and the corresponding amounts of gross unrealized gains and losses recognized in accumulated other comprehensive income (loss):
| Amortized |
Gross |
Gross |
Fair |
|||||||||||||
| October 14, 2016 |
||||||||||||||||
| Collateralized mortgage obligations—residential |
$ | 2,327 | $ | 30 | $ | — | $ | 2,357 | ||||||||
| Mortgage-backed—residential |
480 | 43 | — | 523 | ||||||||||||
| U.S. government-sponsored entities |
23,431 | 320 | — | 23,751 | ||||||||||||
| Single issuer trust preferred |
700 | — | (117 | ) | 583 | |||||||||||
|
|
|
|
|
|
|
|
|
|||||||||
| $ | 26,938 | $ | 393 | $ | (117 | ) | $ | 27,214 | ||||||||
|
|
|
|
|
|
|
|
|
|||||||||
| December 31, 2015 |
||||||||||||||||
| Collateralized mortgage obligations—residential |
$ | 2,875 | $ | — | $ | (59 | ) | $ | 2,816 | |||||||
| Mortgage-backed—residential |
572 | 49 | — | 621 | ||||||||||||
| U.S. government-sponsored entities |
23,413 | 60 | (103 | ) | 23,370 | |||||||||||
| Single issuer trust preferred |
700 | — | (117 | ) | 583 | |||||||||||
|
|
|
|
|
|
|
|
|
|||||||||
| $ | 27,560 | $ | 109 | $ | (279 | ) | $ | 27,390 | ||||||||
|
|
|
|
|
|
|
|
|
|||||||||
Collateral mortgage obligations and mortgage-backed securities are issued by government sponsored entities.
At October 14, 2016 and December 31, 2015, there were no holdings of securities of any one issuer other than U.S. government sponsored entities in any amount greater than 10% of shareholders’ equity.
F-128
Table of Contents
RIDGESTONE FINANCIAL SERVICES, INC.
NOTES TO THE CONSOLIDATED FINANCIAL STATEMENTS (Continued)
For the period from January 1, 2016 to October 14, 2016 and the year ended December 31, 2015
(In thousands of dollars, except per share data)
NOTE 2—SECURITIES AVAILABLE FOR SALE (Continued)
The following table summarizes securities with unrealized losses at October 14, 2016 and December 31, 2015, aggregated by major security type and length of time in a continuous unrealized loss position:
| Less Than 12 Months |
12 Months or Longer |
Total |
||||||||||||||||||||||
| Fair |
Unrealized |
Fair |
Unrealized Losses |
Fair Value |
Unrealized |
|||||||||||||||||||
| October 14, 2016 |
||||||||||||||||||||||||
| Single issuer trust preferred |
$ | — | $ | — | $ | 583 | $ | (117 | ) | $ | 583 | $ | (117 | ) | ||||||||||
|
|
|
|
|
|
|
|
|
|
|
|
|
|||||||||||||
| Total available-for-sale |
$ | — | $ | — | $ | 583 | $ | (117 | ) | $ | 583 | $ | (117 | ) | ||||||||||
|
|
|
|
|
|
|
|
|
|
|
|
|
|||||||||||||
|
Less Than 12 Months |
12 Months or Longer |
Total |
||||||||||||||||||||||
| Fair |
Unrealized |
Fair |
Unrealized |
Fair |
Unrealized |
|||||||||||||||||||
| December 31, 2015 |
||||||||||||||||||||||||
| Collateralized mortgage obligations |
$ | 2,816 | $ | (59 | ) | $ | — | $ | — | $ | 2,816 | $ | (59 | ) | ||||||||||
| U.S. government-sponsored entities |
18,869 | (103 | ) | — | — | 18,869 | (103 | ) | ||||||||||||||||
| Single issuer trust preferred |
— | — | 583 | (117 | ) | 583 | (117 | ) | ||||||||||||||||
|
|
|
|
|
|
|
|
|
|
|
|
|
|||||||||||||
| Total available-for-sale |
$ | 21,685 | $ | (162 | ) | $ | 583 | $ | (117 | ) | $ | 22,268 | $ | (279 | ) | |||||||||
|
|
|
|
|
|
|
|
|
|
|
|
|
|||||||||||||
The Company owns two single issuer trust preferred securities with total unrealized losses of $117 at October 14, 2016 and December 31, 2015. These securities were issued by two Wisconsin-based bank holding companies. Although the repayment capacity is the obligation of the issuers, the issuers rely substantially on dividends of subsidiary banks. Interest payments on the securities were temporarily deferred for one issuer, but during 2015 this issuer became current on interest payments. The issuers remained current on interest payments through October 14, 2016.
The issuers have the ability to defer interest payments for five years and if not cured within five years, including all accrued but unpaid interest during the deferral period, the issuers will be in default. The Company has evaluated the issuers’ most recent financial statements available including the financial statements of the subsidiary banks and, based on those financial statements and the issuers curing the deferred interest, management believes no credit loss is expected on these securities.
Unrealized losses on government sponsored entities have not been recognized into income because the issuer bonds are of high credit quality.
For all securities with unrealized losses, management does not intend to sell and it is likely that management will not be required to sell the securities prior to their anticipated recovery, and the decline in fair value is largely due to changes in interest rates and other market conditions. The fair value is expected to recover as the securities approach maturity.
F-129
Table of Contents
RIDGESTONE FINANCIAL SERVICES, INC.
NOTES TO THE CONSOLIDATED FINANCIAL STATEMENTS (Continued)
For the period from January 1, 2016 to October 14, 2016 and the year ended December 31, 2015
(In thousands of dollars, except per share data)
NOTE 2—SECURITIES AVAILABLE FOR SALE (Continued)
The proceeds from sales of securities and the associated gains and losses are listed below:
| Period Ended |
Year Ended |
|||||||
| October 14, |
December 31, |
|||||||
| Proceeds |
$ | — | $ | 5,930 | ||||
| Gross gains |
— | 99 | ||||||
| Gross losses |
— | — | ||||||
The fair value of debt securities by contractual maturity at October 14, 2016 were as follows. Securities not due at a single maturity date, collateralized mortgage obligations and mortgage-backed securities, are shown separately.
| Amortized |
Fair |
|||||||
| Due less than one year |
$ | 2,500 | $ | 2,509 | ||||
| Due after one year through five years |
20,931 | 21,242 | ||||||
| Due after five years through ten years |
— | — | ||||||
| Due after ten years |
700 | 583 | ||||||
| Collateralized mortgage obligation and mortgage-backed |
2,807 | 2,880 | ||||||
|
|
|
|
|
|||||
| $ | 26,938 | $ | 27,214 | |||||
|
|
|
|
|
|||||
Securities pledged as collateral for Federal Home Loan Bank advances and other borrowing arrangements at October 14, 2016 and December 31, 2015 had a carrying amount of $26,631 and $15,867.
F-130
Table of Contents
RIDGESTONE FINANCIAL SERVICES, INC.
NOTES TO THE CONSOLIDATED FINANCIAL STATEMENTS (Continued)
For the period from January 1, 2016 to October 14, 2016 and the year ended December 31, 2015
(In thousands of dollars, except per share data)
NOTE 3—LOANS
The Company has elected to account for certain loans at fair value. The following presents loan balances for loans accounted for at fair value and for loans accounted for at amortized cost, at October 14, 2016 (“2016”) and December 31, 2015 (“2015”).
| Fair Value |
Amortized Cost |
Total |
||||||||||||||||||||||
| 2016 |
2015 |
2016 |
2015 |
2016 |
2015 |
|||||||||||||||||||
| Land |
||||||||||||||||||||||||
| Raw land for development |
$ | — | $ | — | $ | 1,158 | 1,172 | $ | 1,158 | $ | 1,172 | |||||||||||||
| Lots and developed land |
— | — | 213 | 350 | 213 | 350 | ||||||||||||||||||
| Construction |
— | — | 2,763 | 1,874 | 2,763 | 1,874 | ||||||||||||||||||
| Commercial real estate |
||||||||||||||||||||||||
| Owner occupied |
— | — | 6,647 | 6,943 | 6,647 | 6,943 | ||||||||||||||||||
| Non-owner occupied |
— | — | 9,648 | 12,449 | 9,648 | 12,449 | ||||||||||||||||||
| Commercial and industrial |
— | — | 13,352 | 13,738 | 13,352 | 13,738 | ||||||||||||||||||
| SBA and USDA |
3,338 | 4,022 | 299,350 | 256,219 | 302,688 | 260,241 | ||||||||||||||||||
| Religious type organizations |
— | — | 16,697 | 18,820 | 16,697 | 18,820 | ||||||||||||||||||
| Consumer and other |
— | — | 2,670 | 3,459 | 2,670 | 3,459 | ||||||||||||||||||
|
|
|
|
|
|
|
|
|
|
|
|
|
|||||||||||||
| Subtotal |
3,338 | 4,022 | 352,498 | 315,024 | 355,836 | 319,046 | ||||||||||||||||||
| Net deferred loan cost |
— | — | 284 | 271 | 284 | 271 | ||||||||||||||||||
| Allowance for loan losses |
— | — | (8,816 | ) | (8,996 | ) | (8,816 | ) | (8,996 | ) | ||||||||||||||
|
|
|
|
|
|
|
|
|
|
|
|
|
|||||||||||||
| Total loans held in portfolio |
3,338 | 4,022 | 343,966 | 306,299 | 347,304 | 310,321 | ||||||||||||||||||
| Loans held for sale |
8,915 | 2,067 | 5,801 | 39,397 | 14,716 | 41,464 | ||||||||||||||||||
|
|
|
|
|
|
|
|
|
|
|
|
|
|||||||||||||
| Total Loans |
$ | 12,253 | $ | 6,089 | $ | 349,767 | $ | 345,696 | $ | 362,020 | $ | 351,785 | ||||||||||||
|
|
|
|
|
|
|
|
|
|
|
|
|
|||||||||||||
For loans carried at fair value, the fair value and contractual principal of those loans are as follows:
| October 14, 2016 |
December 31, 2015 |
|||||||||||||||
| Fair |
Contractual |
Fair |
Contractual |
|||||||||||||
| SBA and USDA |
$ | 3,338 | $ | 3,552 | $ | 4,022 | $ | 4,397 | ||||||||
| Loans held for sale |
8,915 | 8,006 | 2,067 | 1,893 | ||||||||||||
|
|
|
|
|
|
|
|
|
|||||||||
| Total loans |
$ | 12,253 | $ | 11,558 | $ | 6,089 | $ | 6,290 | ||||||||
|
|
|
|
|
|
|
|
|
|||||||||
The Company originates SBA and USDA loans and a portion of such qualifying loans are guaranteed. These loans are secured by specific items of collateral and include guarantees generally ranging from 75% to 90% of outstanding principal loan balance. From time to time, the Company will sell the guaranteed portion of a loan and will retain the unguaranteed loan balance in its loan portfolio.
F-131
Table of Contents
RIDGESTONE FINANCIAL SERVICES, INC.
NOTES TO THE CONSOLIDATED FINANCIAL STATEMENTS (Continued)
For the period from January 1, 2016 to October 14, 2016 and the year ended December 31, 2015
(In thousands of dollars, except per share data)
NOTE 3—LOANS (Continued)
The contractual principal and discounts on unguaranteed SBA and USDA loans, which are included in the total loans were as follows:
| October 14, |
December 31, |
|||||||
| Commercial |
$ | 122,871 | $ | 106,832 | ||||
| Commercial real estate |
207,426 | 176,540 | ||||||
|
|
|
|
|
|||||
| Total contractual principal |
330,297 | 283,372 | ||||||
| Discount on unguaranteed loans |
(27,609 | ) | (23,131 | ) | ||||
|
|
|
|
|
|||||
| Net carrying value |
$ | 302,688 | $ | 260,241 | ||||
|
|
|
|
|
|||||
Activity in the allowance for loan losses was as follows:
|
Period Ended |
Year
Ended |
|||||||
| Beginning balance |
$ | 8,996 | $ | 7,363 | ||||
| Provision for loan losses |
3,632 | 3,340 | ||||||
| Loans charged off |
(4,279 | ) | (2,877 | ) | ||||
| Recoveries |
467 | 1,170 | ||||||
|
|
|
|
|
|||||
| Ending balance |
$ | 8,816 | $ | 8,996 | ||||
|
|
|
|
|
|||||
The following table presents the activity in the allowance for loan losses by portfolio category for the period from January 1, 2016 to October 14, 2016 and the year ended December 31, 2015:
| Period Ended October 14, 2016 |
Beginning |
Provision |
Loans |
Recoveries |
Ending |
|||||||||||||||
| Land |
||||||||||||||||||||
| Lots and developed land |
$ | — | $ | — | $ | — | $ | — | $ | — | ||||||||||
| Construction |
21 | 22 | — | — | 43 | |||||||||||||||
| Commercial real estate |
||||||||||||||||||||
| Owner occupied |
161 | 288 | — | — | 449 | |||||||||||||||
| Non-owner occupied |
1,679 | (578 | ) | — | 172 | 1,273 | ||||||||||||||
| Commercial and industrial |
77 | 249 | (252 | ) | 19 | 93 | ||||||||||||||
| SBA and USDA |
6,732 | 2,635 | (3,279 | ) | 276 | 6,364 | ||||||||||||||
| Religious type organizations |
265 | 1,013 | (748 | ) | — | 530 | ||||||||||||||
| Consumer and other |
61 | 3 | — | — | 64 | |||||||||||||||
|
|
|
|
|
|
|
|
|
|
|
|||||||||||
| $ | 8,996 | $ | 3,632 | $ | (4,279 | ) | $ | 467 | $ | 8,816 | ||||||||||
|
|
|
|
|
|
|
|
|
|
|
|||||||||||
F-132
Table of Contents
RIDGESTONE FINANCIAL SERVICES, INC.
NOTES TO THE CONSOLIDATED FINANCIAL STATEMENTS (Continued)
For the period from January 1, 2016 to October 14, 2016 and the year ended December 31, 2015
(In thousands of dollars, except per share data)
NOTE 3—LOANS (Continued)
| Year Ended December 31, 2015 |
Beginning Balance |
Provision (Credits) for Loan Losses |
Loans Charged- Off |
Recoveries |
Ending |
|||||||||||||||
| Land |
||||||||||||||||||||
| Lots and developed land |
$ | 20 | $ | (20 | ) | $ | — | $ | — | $ | — | |||||||||
| Construction |
145 | (124 | ) | — | — | 21 | ||||||||||||||
| Commercial real estate |
||||||||||||||||||||
| Owner occupied |
345 | (184 | ) | — | — | 161 | ||||||||||||||
| Non-owner occupied |
1,266 | 1,024 | (668 | ) | 57 | 1,679 | ||||||||||||||
| Commercial and industrial |
544 | (478 | ) | — | 11 | 77 | ||||||||||||||
| SBA and USDA |
4,465 | 3,183 | (1,959 | ) | 1,043 | 6,732 | ||||||||||||||
| Religious type organizations |
570 | (364 | ) | — | 59 | 265 | ||||||||||||||
| Consumer and other |
8 | 303 | (250 | ) | — | 61 | ||||||||||||||
|
|
|
|
|
|
|
|
|
|
|
|||||||||||
| $ | 7,363 | $ | 3,340 | $ | (2,877 | ) | $ | 1,170 | $ | 8,996 | ||||||||||
|
|
|
|
|
|
|
|
|
|
|
|||||||||||
The following table presents the balance in the allowance for loan losses and the recorded investment (recorded investment includes unpaid principal balance only) in loans carried at amortized cost by portfolio category based on impairment method as of October 14, 2016:
| Allowance for Loan Losses | Loan Balances | |||||||||||||||||||||||
| October 14, 2016 |
Individually |
Collectively |
Total |
Individually |
Collectively |
Total |
||||||||||||||||||
| Land |
||||||||||||||||||||||||
| Raw land for development |
$ | — | $ | — | $ | — | $ | — | $ | 1,158 | $ | 1,158 | ||||||||||||
| Lots and development land |
— | — | — | — | 213 | 213 | ||||||||||||||||||
| Construction |
— | 43 | 43 | — | 2,763 | 2,763 | ||||||||||||||||||
| Commercial real estate |
||||||||||||||||||||||||
| Owner occupied |
333 | 116 | 449 | 565 | 6,082 | 6,647 | ||||||||||||||||||
| Non-owner occupied |
945 | 328 | 1,273 | 6,014 | 3,634 | 9,648 | ||||||||||||||||||
| Commercial and industrial |
— | 93 | 93 | — | 13,352 | 13,352 | ||||||||||||||||||
| SBA and USDA |
1,896 | 4,468 | 6,364 | 8,928 | 290,422 | 299,350 | ||||||||||||||||||
| Religious type organizations |
237 | 293 | 530 | 7,973 | 8,724 | 16,697 | ||||||||||||||||||
| Consumer and other |
— | 64 | 64 | — | 2,670 | 2,670 | ||||||||||||||||||
|
|
|
|
|
|
|
|
|
|
|
|
|
|||||||||||||
| Total |
$ | 3,411 | $ | 5,405 | $ | 8,816 | $ | 23,480 | $ | 329,018 | $ | 352,498 | ||||||||||||
|
|
|
|
|
|
|
|
|
|
|
|
|
|||||||||||||
F-133
Table of Contents
RIDGESTONE FINANCIAL SERVICES, INC.
NOTES TO THE CONSOLIDATED FINANCIAL STATEMENTS (Continued)
For the period from January 1, 2016 to October 14, 2016 and the year ended December 31, 2015
(In thousands of dollars, except per share data)
NOTE 3—LOANS (Continued)
The following table presents the balance in the allowance for loan losses and the recorded investment (recorded investment includes unpaid principal balance only) in loans carried at amortized cost by portfolio category based on impairment method as of December 31, 2015:
| Allowance for Loan Losses | Loan Balances | |||||||||||||||||||||||
| December 31, 2015 |
Individually |
Collectively |
Total |
Individually |
Collectively |
Total |
||||||||||||||||||
| Land |
||||||||||||||||||||||||
| Raw land for development |
$ | — | $ | — | $ | — | $ | 1,172 | $ | — | $ | 1,172 | ||||||||||||
| Lots and development land |
— | — | — | — | 350 | 350 | ||||||||||||||||||
| Construction |
— | 21 | 21 | — | 1,874 | 1,874 | ||||||||||||||||||
| Commercial real estate |
||||||||||||||||||||||||
| Owner occupied |
— | 161 | 161 | — | 6,943 | 6,943 | ||||||||||||||||||
| Non-owner occupied |
967 | 712 | 1,679 | 5,144 | 7,305 | 12,449 | ||||||||||||||||||
| Commercial and industrial |
— | 77 | 77 | — | 13,738 | 13,738 | ||||||||||||||||||
| SBA and USDA |
2,021 | 4,711 | 6,732 | 13,757 | 242,462 | 256,219 | ||||||||||||||||||
| Religious type organizations |
6 | 259 | 265 | 7,596 | 11,224 | 18,820 | ||||||||||||||||||
| Consumer and other |
— | 61 | 61 | 585 | 2,874 | 3,459 | ||||||||||||||||||
|
|
|
|
|
|
|
|
|
|
|
|
|
|||||||||||||
| Total |
$ | 2,994 | $ | 6,002 | $ | 8,996 | $ | 28,254 | $ | 286,770 | $ | 315,024 | ||||||||||||
|
|
|
|
|
|
|
|
|
|
|
|
|
|||||||||||||
F-134
Table of Contents
RIDGESTONE FINANCIAL SERVICES, INC.
NOTES TO THE CONSOLIDATED FINANCIAL STATEMENTS (Continued)
For the period from January 1, 2016 to October 14, 2016 and the year ended December 31, 2015
(In thousands of dollars, except per share data)
NOTE 3—LOANS (Continued)
The following table presents information related to impaired loans by class of loans as of and for the period from January 1, 2016 to October 14, 2016:
| Recorded |
Allowance for |
Average |
||||||||||
| October 14, 2016 |
||||||||||||
| With no related allowance recorded: |
||||||||||||
| Land |
||||||||||||
| Raw land for development |
$ | — | $ | — | $ | — | ||||||
| Lots and development land |
— | — | — | |||||||||
| Construction |
— | — | — | |||||||||
| Commercial real estate |
||||||||||||
| Owner occupied |
— | — | — | |||||||||
| Non-owner occupied |
1,217 | — | 767 | |||||||||
| Commercial and industrial |
— | — | — | |||||||||
| SBA and USDA |
3,364 | — | 3,333 | |||||||||
| Religious type organizations |
2,484 | — | 3,252 | |||||||||
| Consumer and other |
— | — | — | |||||||||
|
|
|
|
|
|
|
|||||||
| 7,065 | — | 7,352 | ||||||||||
| With an allowance recorded: |
||||||||||||
| Land |
||||||||||||
| Raw land for development |
— | — | — | |||||||||
| Lots and development land |
— | — | — | |||||||||
| Construction |
— | — | — | |||||||||
| Commercial real estate |
||||||||||||
| Owner occupied |
565 | 333 | 282 | |||||||||
| Non-owner occupied |
4,797 | 945 | 4,812 | |||||||||
| Commercial and industrial |
— | — | — | |||||||||
| SBA and USDA |
5,564 | 1,896 | 8,010 | |||||||||
| Religious type organizations |
5,489 | 237 | 4,533 | |||||||||
| Consumer and other |
— | — | — | |||||||||
|
|
|
|
|
|
|
|||||||
| 16,415 | 3,411 | 17,637 | ||||||||||
|
|
|
|
|
|
|
|||||||
| Total |
$ | 23,480 | $ | 3,411 | $ | 24,989 | ||||||
|
|
|
|
|
|
|
|||||||
Recorded investment approximates the unpaid principal balance.
F-135
Table of Contents
RIDGESTONE FINANCIAL SERVICES, INC.
NOTES TO THE CONSOLIDATED FINANCIAL STATEMENTS (Continued)
For the period from January 1, 2016 to October 14, 2016 and the year ended December 31, 2015
(In thousands of dollars, except per share data)
NOTE 3—LOANS (Continued)
The following table presents information related to impaired loans by class of loans as of and for the year ended December 31, 2015:
| Recorded |
Allowance |
Average |
||||||||||
| December 31, 2015 |
||||||||||||
| With no related allowance recorded: |
||||||||||||
| Land |
||||||||||||
| Raw land for development |
$ | 1,172 | $ | — | $ | 586 | ||||||
| Lots and development land |
— | — | 173 | |||||||||
| Construction |
— | — | — | |||||||||
| Commercial real estate |
||||||||||||
| Owner occupied |
— | — | 269 | |||||||||
| Non-owner occupied |
317 | — | 1,797 | |||||||||
| Commercial and industrial |
— | — | — | |||||||||
| SBA and USDA |
3,301 | — | 2,228 | |||||||||
| Religious type organizations |
4,020 | — | 4,804 | |||||||||
| Consumer and other |
585 | — | — | |||||||||
|
|
|
|
|
|
|
|||||||
| 9,395 | — | 9,857 | ||||||||||
| With an allowance recorded: |
||||||||||||
| Land |
||||||||||||
| Raw land for development |
— | — | — | |||||||||
| Lots and development land |
— | — | — | |||||||||
| Construction |
— | — | — | |||||||||
| Commercial real estate |
||||||||||||
| Owner occupied |
— | — | — | |||||||||
| Non-owner occupied |
4,827 | 967 | 3,962 | |||||||||
| Commercial and industrial |
— | — | — | |||||||||
| SBA and USDA |
10,456 | 2,021 | 5,619 | |||||||||
| Religious type organizations |
3,576 | 6 | 1,788 | |||||||||
| Consumer and other |
— | — | — | |||||||||
|
|
|
|
|
|
|
|||||||
| 18,859 | 2,994 | 11,369 | ||||||||||
|
|
|
|
|
|
|
|||||||
| Total |
$ | 28,254 | $ | 2,994 | $ | 21,226 | ||||||
|
|
|
|
|
|
|
|||||||
Recorded investment approximates the unpaid principal balance.
For loans carried at fair value, changes in fair value of $161 and $255 were recorded as net gains on loan sales within the consolidated statement of income for the period from January 1, 2016 to October 14, 2016 and the year ended December 31, 2015, respectively. The changes in fair value recognized in income were attributable to changes in interest rates and not to changes in credit quality of the loans carried at fair value. At October 14, 2016 and December 31, 2015, $114 and $94 of loans are carried at fair value and are past due greater than ninety days, on non-accrual status, or considered to be impaired.
F-136
Table of Contents
RIDGESTONE FINANCIAL SERVICES, INC.
NOTES TO THE CONSOLIDATED FINANCIAL STATEMENTS (Continued)
For the period from January 1, 2016 to October 14, 2016 and the year ended December 31, 2015
(In thousands of dollars, except per share data)
NOTE 3—LOANS (Continued)
The following is a schedule of activity for the period from January 1, 2016 to October 14, 2016 and the year ended December 31, 2015 for loans carried at fair value:
| Period Ended |
Year Ended |
|||||||||||||||
| Portfolio |
Held for |
Portfolio |
Held for |
|||||||||||||
| Beginning balance |
$ | 4,022 | $ | 2,067 | $ | 6,434 | $ | 4,333 | ||||||||
| Originations |
— | 8,915 | — | 2,067 | ||||||||||||
| Sales |
— | (1,894 | ) | — | (4,319 | ) | ||||||||||
| Repayments |
(845 | ) | (173 | ) | (2,667 | ) | (14 | ) | ||||||||
| Changes in fair value |
161 | — | 255 | — | ||||||||||||
|
|
|
|
|
|
|
|
|
|||||||||
| Ending balance |
$ | 3,338 | $ | 8,915 | $ | 4,022 | $ | 2,067 | ||||||||
|
|
|
|
|
|
|
|
|
|||||||||
Information on individually impaired, non-performing, and trouble debt restructured loans were as follows:
| October 14, |
December 31, |
|||||||
| Period end loans with no allocated allowance for loan losses |
$ | 7,065 | $ | 9,395 | ||||
| Period end loans with allocated allowance for loan losses |
16,415 | 18,859 | ||||||
|
|
|
|
|
|||||
| Total |
$ | 23,480 | $ | 28,254 | ||||
|
|
|
|
|
|||||
| Amount of the allowance for loan losses allocated |
$ | 3,411 | $ | 2,994 | ||||
| Average of individually impaired loans during period |
27,447 | 21,226 | ||||||
| Non-accrual loans |
$ | 6,456 | $ | 4,957 | ||||
| Loans past due more than ninety days and still accruing |
— | — | ||||||
|
|
|
|
|
|||||
| Total non-performing loans |
$ | 6,456 | $ | 4,957 | ||||
|
|
|
|
|
|||||
| Troubled debt restructurings—accrual status |
$ | 14,217 | $ | 15,031 | ||||
| Troubled debt restructurings—non-accrual status |
3,405 | 1,374 | ||||||
|
|
|
|
|
|||||
| Total troubled debt restructurings |
$ | 17,622 | $ | 16,405 | ||||
|
|
|
|
|
|||||
| Allowance allocated to troubled debt restructurings |
$ | 240 | $ | 1,476 | ||||
Interest income recognized during impairment was not material for the period from January 1, 2016 to October 14, 2016 and the year ended December 31, 2015. The Company has not committed additional funds to customers whose loans are classified as troubled debt restructuring.
F-137
Table of Contents
RIDGESTONE FINANCIAL SERVICES, INC.
NOTES TO THE CONSOLIDATED FINANCIAL STATEMENTS (Continued)
For the period from January 1, 2016 to October 14, 2016 and the year ended December 31, 2015
(In thousands of dollars, except per share data)
NOTE 3—LOANS (Continued)
The following table presents the aging of the recorded investment in past due loans as of October 14, 2016 by class of loans:
| October 14, 2016 |
30 - 59 |
60 - 89 |
Greater than Past Due |
Total |
Non-accrual |
Loans Not |
Total |
|||||||||||||||||||||
| Land |
||||||||||||||||||||||||||||
| Raw land for development |
$ | — | $ | — | $ | — | $ | — | $ | — | $ | 1,158 | $ | 1,158 | ||||||||||||||
| Lots and development land |
— | — | — | — | — | 213 | 213 | |||||||||||||||||||||
| Construction |
— | — | — | — | — | 2,763 | 2,763 | |||||||||||||||||||||
| Commercial real estate |
||||||||||||||||||||||||||||
| Owner occupied |
— | 565 | — | 565 | — | 6,082 | 6,647 | |||||||||||||||||||||
| Non-owner occupied |
2,812 | 279 | — | 3,091 | 50 | 6,507 | 9,648 | |||||||||||||||||||||
| Commercial and industrial |
374 | 175 | — | 549 | 439 | 12,364 | 13,352 | |||||||||||||||||||||
| SBA and USDA |
5,331 | 224 | — | 5,555 | 5,427 | 291,706 | 302,688 | |||||||||||||||||||||
| Religious type organizations |
2,603 | — | — | 2,603 | 540 | 13,554 | 16,697 | |||||||||||||||||||||
| Consumer and other |
— | — | — | — | — | 2,670 | 2,670 | |||||||||||||||||||||
|
|
|
|
|
|
|
|
|
|
|
|
|
|
|
|||||||||||||||
| Total |
$ | 11,120 | $ | 1,243 | $ | — | $ | 12,363 | $ | 6,456 | $ | 337,017 | $ | 355,836 | ||||||||||||||
|
|
|
|
|
|
|
|
|
|
|
|
|
|
|
|||||||||||||||
The following table presents the aging of the recorded investment in past due loans as of December 31, 2015 by class of loans:
| December 31, 2015 |
30 - 59 Days Past Due |
60 - 89 Days Past Due |
Greater than 89 Days Past Due |
Total |
Non-accrual Loans |
Loans Not Past Due |
Total |
|||||||||||||||||||||
| Land |
||||||||||||||||||||||||||||
| Raw land for development |
$ | — | $ | — | $ | — | $ | — | $ | — | $ | 1,172 | $ | 1,172 | ||||||||||||||
| Lots and development land |
— | — | — | — | — | 350 | 350 | |||||||||||||||||||||
| Construction |
— | — | — | — | — | 1,874 | 1,874 | |||||||||||||||||||||
| Commercial real estate |
||||||||||||||||||||||||||||
| Owner occupied |
— | — | — | — | 195 | 6,748 | 6,943 | |||||||||||||||||||||
| Non-owner occupied |
— | — | — | — | 37 | 12,412 | 12,449 | |||||||||||||||||||||
| Commercial and industrial |
— | — | — | — | — | 13,738 | 13,738 | |||||||||||||||||||||
| SBA and USDA |
384 | 388 | — | 772 | 4,140 | 255,329 | 260,241 | |||||||||||||||||||||
| Religious type organizations |
— | 856 | — | 856 | — | 17,964 | 18,820 | |||||||||||||||||||||
| Consumer and other |
— | — | — | — | 585 | 2,874 | 3,459 | |||||||||||||||||||||
|
|
|
|
|
|
|
|
|
|
|
|
|
|
|
|||||||||||||||
| Total |
$ | 384 | $ | 1,244 | $ | — | $ | 1,628 | $ | 4,957 | $ | 312,461 | $ | 319,046 | ||||||||||||||
|
|
|
|
|
|
|
|
|
|
|
|
|
|
|
|||||||||||||||
At October 14, 2016 and December 31, 2015, the Company had $1,001 and $1,017 of non-accrual loans that are less than thirty days past due.
Troubled Debt Restructurings
Loans for which the terms have been modified resulting in a concession, and for which the borrower is experiencing financial difficulties, are considered troubled debt restructurings and classified as impaired. As of
F-138
Table of Contents
RIDGESTONE FINANCIAL SERVICES, INC.
NOTES TO THE CONSOLIDATED FINANCIAL STATEMENTS (Continued)
For the period from January 1, 2016 to October 14, 2016 and the year ended December 31, 2015
(In thousands of dollars, except per share data)
NOTE 3—LOANS (Continued)
October 14, 2016 and December 31, 2015, the Company had $17,622 and $16,405 in loans classified as troubled debt restructurings. The Company has allocated $240 and $1,476 of specific reserves to customers whose loan terms have been modified in troubled debt restructurings as of October 14, 2016 and December 31, 2015. The Company has not committed to lend any additional amounts as of October 14, 2016 and December 31, 2015 to customers with outstanding loans that are classified as troubled debt restructurings.
During the period from January 1, to October 14, 2016 and the year ending December 31, 2015, the terms of certain loans were modified as troubled debt restructurings. The modification of the terms of such loans included one or a combination of the following: a reduction of the stated interest rate of the loan; an extension of the maturity date at a stated rate of interest lower than the current market rate for new debt with similar risk; a deferral of principal and interest.
Modifications involving a reduction of the stated interest rate of the loan were for periods ranging from three months to five years. Modifications involving an extension of the maturity date were for periods ranging from three months to five years. Payment deferrals were for period ranging from three to seven months.
The following table presents loans by class modified as troubled debt restructurings that occurred during the period from January 1, 2016 to October 14, 2016:
| Number of Loans |
Pre-Modification |
Post-Modification |
||||||||||
| Troubled Debt Restructurings: |
||||||||||||
| SBA and USDA |
13 | $ | 2,979 | $ | 2,979 | |||||||
| Religious type organizations |
4 | 1,011 | 1,011 | |||||||||
|
|
|
|
|
|
|
|||||||
| 17 | $ | 3,990 | $ | 3,990 | ||||||||
|
|
|
|
|
|
|
|||||||
The troubled debt restructurings described above resulted in $281 of additions to the allowance for loan losses and $125 of charge offs during the period from January 1, 2016 to October 14, 2016.
The following table presents loans by class modified as troubled debt restructurings that occurred during the year ending December 31, 2015:
| Number of Loans |
Pre-Modification |
Post-Modification |
||||||||||
| Troubled Debt Restructurings: |
||||||||||||
| Lots and development land |
1 | $ | 1,664 | $ | 1,664 | |||||||
| Commercial real estate |
||||||||||||
| Owner occupied |
1 | 177 | 177 | |||||||||
| Non-owner occupied |
3 | 2,200 | 2,200 | |||||||||
| SBA and USDA |
6 | 1,826 | 1,826 | |||||||||
| Religious type organizations |
2 | 2,291 | 2,291 | |||||||||
|
|
|
|
|
|
|
|||||||
| 13 | $ | 8,158 | $ | 8,158 | ||||||||
|
|
|
|
|
|
|
|||||||
F-139
Table of Contents
RIDGESTONE FINANCIAL SERVICES, INC.
NOTES TO THE CONSOLIDATED FINANCIAL STATEMENTS (Continued)
For the period from January 1, 2016 to October 14, 2016 and the year ended December 31, 2015
(In thousands of dollars, except per share data)
NOTE 3—LOANS (Continued)
The troubled debt restructurings described above resulted in $679 of additions to the allowance for loan losses and no charge offs during the year ending December 31, 2015.
The following table presents loans by class modified as troubled debt restructurings for which there was a payment default within twelve months following the modification during the period from January 1, 2016 to October 14, 2016:
| Troubled Debt Restructurings That Subsequently Defaulted: |
Number |
Recorded |
||||||
| Religious type organizations |
2 | $ | 476 | |||||
| SBA and USDA |
3 | 736 | ||||||
|
|
|
|
|
|||||
| 5 | $ | 1,212 | ||||||
|
|
|
|
|
|||||
The following table presents loans by class modified as troubled debt restructurings for which there was a payment default within twelve months following the modification during the year ending December 31, 2015:
| Troubled Debt Restructurings That Subsequently Defaulted: |
Number |
Recorded |
||||||
| Commercial real estate |
||||||||
| Non-owner occupied |
1 | $ | 933 | |||||
| SBA and USDA |
3 | 838 | ||||||
|
|
|
|
|
|||||
| 4 | $ | 1,771 | ||||||
|
|
|
|
|
|||||
Credit Quality Indicators:
The Company categorizes loans into risk categories based on relevant information about the ability of borrowers to service their debt such as: current financial information, historical payment experience, credit documentation, public information, and current economic trends, among other factors. The Company analyzes loans individually by classifying the loans as to credit risk. This analysis includes non-homogeneous loans, such as construction, commercial and commercial real estate loans. This analysis is performed annually on a loan-by-loan basis. The risk category of homogeneous loans is evaluated when a loan becomes delinquent. The Company uses the following definitions for classified risk rating:
Substandard. Loans classified as substandard are inadequately protected by the current net worth and paying capacity of the obligor or of the collateral pledged, if any. Loans so classified have a well-defined weakness or weaknesses that jeopardize the liquidation of the debt. They are characterized by the distinct possibility that the institution will sustain some loss if the deficiencies are not corrected.
Doubtful. Loans classified as doubtful have all the weaknesses inherent in those classified as substandard, with the added characteristic that the weaknesses make collection or liquidation in full, on the basis of currently existing facts, conditions, and values, highly questionable and improbable.
F-140
Table of Contents
RIDGESTONE FINANCIAL SERVICES, INC.
NOTES TO THE CONSOLIDATED FINANCIAL STATEMENTS (Continued)
For the period from January 1, 2016 to October 14, 2016 and the year ended December 31, 2015
(In thousands of dollars, except per share data)
NOTE 3—LOANS (Continued)
Loans not meeting the criteria above that are analyzed individually as part of the above-described process are considered to be pass rated loans. As of October 14, 2016 and December 31, 2015, and based on the most recent analysis performed, the risk category of loans by class of loans is as follows:
| Pass |
Classified |
Total |
||||||||||
| October 14, 2016 |
||||||||||||
| Construction |
$ | 2,763 | $ | — | $ | 2,763 | ||||||
| Commercial real estate |
12,228 | 4,067 | 16,295 | |||||||||
| Commercial |
323,789 | 10,319 | 334,108 | |||||||||
|
|
|
|
|
|
|
|||||||
| Total |
$ | 338,780 | $ | 14,386 | $ | 353,166 | ||||||
|
|
|
|
|
|
|
|||||||
| Pass |
Classified |
Total |
||||||||||
| December 31, 2015 |
||||||||||||
| Construction |
$ | 1,874 | $ | — | $ | 1,329 | ||||||
| Commercial real estate |
17,837 | 1,555 | 19,392 | |||||||||
| Commercial |
279,809 | 14,152 | 293,961 | |||||||||
|
|
|
|
|
|
|
|||||||
| Total |
$ | 299,880 | $ | 15,707 | $ | 315,587 | ||||||
|
|
|
|
|
|
|
|||||||
NOTE 4—OTHER REAL ESTATE OWNED
Changes in the other real estate owned are as follows:
| 2016 |
2015 |
|||||||
| Balance, beginning of year |
$ | 1,515 | $ | 4,574 | ||||
| Transfer of loans |
1,372 | 494 | ||||||
| Impairment recognized |
(46 | ) | (132 | ) | ||||
| Net proceeds from sales |
(1,097 | ) | (3,622 | ) | ||||
| Net (loss) gain on sales |
(34 | ) | 201 | |||||
|
|
|
|
|
|||||
| Balance, ending |
$ | 1,710 | $ | 1,515 | ||||
|
|
|
|
|
|||||
Expenses, excluding write-downs and net loss on sales relating to other real estate owned, for the period from January 1, 2016 to October 14, 2016 and for the year ended December 31, 2015 were $399 and $320, respectively.
F-141
Table of Contents
RIDGESTONE FINANCIAL SERVICES, INC.
NOTES TO THE CONSOLIDATED FINANCIAL STATEMENTS (Continued)
For the period from January 1, 2016 to October 14, 2016 and the year ended December 31, 2015
(In thousands of dollars, except per share data)
NOTE 5—PREMISES AND EQUIPMENT
Year-end premises and equipment were as follows:
| 2016 |
2015 |
|||||||
| Land |
$ | 418 | $ | 418 | ||||
| Buildings and improvements |
2,087 | 2,005 | ||||||
| Furniture, fixtures, and equipment |
2,332 | 2,164 | ||||||
|
|
|
|
|
|||||
| 4,837 | 4,587 | |||||||
| Accumulated depreciation |
(2,311 | ) | (2,087 | ) | ||||
|
|
|
|
|
|||||
| Premises and equipment, net |
$ | 2,526 | $ | 2,500 | ||||
|
|
|
|
|
|||||
The Company leases certain branch properties under operating leases. Rent expense was $273 and $399 for the period from January 1, 2016 to October 14, 2016 and during the year ended December 31, 2015, respectively. Rent commitments at October 14, 2016, before considering renewal options that generally are present, were as follows:
| 2017 |
$ | 350 | ||
| 2018 |
317 | |||
| 2019 |
98 | |||
| 2020 |
— | |||
| 2021 |
— | |||
|
|
|
|||
| Total |
$ | 765 | ||
|
|
|
NOTE 6—SERVICING ASSETS
Loans serviced for others are not included in the accompanying consolidated balance sheet. The principal balances of these loans were as follows:
| October 14, 2016 |
December 31, 2015 |
|||||||
| Loan portfolios serviced for: |
||||||||
| SBA |
$ | 873,150 | $ | 700,231 | ||||
| USDA |
87,878 | 107,724 | ||||||
|
|
|
|
|
|||||
| $ | 961,028 | $ | 807,955 | |||||
|
|
|
|
|
|||||
Activity for servicing assets and the related changes in fair value are as follows:
| Period Ended October 14, 2016 |
Year Ended December 31, 2015 |
|||||||
| Servicing assets: |
||||||||
| Beginning of year fair value |
$ | 19,107 | $ | 17,587 | ||||
| Additions |
6,001 | 5,528 | ||||||
| Changes in fair value |
(3,609 | ) | (4,008 | ) | ||||
|
|
|
|
|
|||||
| End of year fair value |
$ | 21,499 | $ | 19,107 | ||||
|
|
|
|
|
|||||
F-142
Table of Contents
RIDGESTONE FINANCIAL SERVICES, INC.
NOTES TO THE CONSOLIDATED FINANCIAL STATEMENTS (Continued)
For the period from January 1, 2016 to October 14, 2016 and the year ended December 31, 2015
(In thousands of dollars, except per share data)
NOTE 6—SERVICING ASSETS (Continued)
Components of loan servicing income are as follows:
| Period Ended October 14, 2016 |
Year Ended December 31, 2015 |
|||||||
| Servicing fee income |
$ | 6,591 | $ | 7,345 | ||||
| Changes in fair value |
(3,609 | ) | (4,008 | ) | ||||
|
|
|
|
|
|||||
| $ | 2,982 | $ | 3,337 | |||||
|
|
|
|
|
|||||
The fair value of servicing rights at October 14, 2016 was determined using discount rates ranging from 7.59% to 18.64%, prepayment speeds ranging from 5.55% to 9.19%, depending on the stratification of the specific right, and a weighted average default rate of 1.20%. The fair value of servicing rights at December 31, 2015 was determined using discount rates ranging from 9.21% to 17.83%, prepayment speeds ranging from 5.57% to 11.59%, depending on the stratification of the specific right, and a weighted average default rate of 1.20%.
NOTE 7—DEPOSITS
Time deposits of $250 or more were $28,446 and $26,877 at October 14, 2016 and December 31, 2015.
Brokered deposits were $42,129 and $40,538 at October 14, 2016 and December 31, 2015.
Scheduled maturities of all time deposits for the next five years were as follows:
| Period ended December 31, |
Non-Brokered | Brokered | Total | |||||||||
| 2016 |
$ | 29,932 | $ | 11,302 | $ | 41,234 | ||||||
| 2017 |
197,697 | 30,827 | 228,524 | |||||||||
| 2018 |
1,547 | — | 1,547 | |||||||||
| 2019 |
352 | — | 352 | |||||||||
| 2020 |
160 | — | 160 | |||||||||
| Thereafter |
327 | — | 327 | |||||||||
|
|
|
|
|
|
|
|||||||
| $ | 230,015 | $ | 42,129 | $ | 272,144 | |||||||
|
|
|
|
|
|
|
|||||||
NOTE 8—FEDERAL HOME LOAN BANK ADVANCES
At year end, advances from the Federal Home Loan Bank were as follows:
| Maturity Date |
Fixed Rate | 2016 | 2015 | |||||||||
| January 16, 2018 (Putable quarterly) |
3.15 | % | $ | 1,500 | $ | 1,500 | ||||||
| February 5, 2018 |
3.22 | % | 7,987 | 7,987 | ||||||||
|
|
|
|
|
|||||||||
| $ | 9,487 | $ | 9,487 | |||||||||
|
|
|
|
|
|||||||||
Each advance is payable at its maturity date, with a prepayment penalty for fixed rate advances. At October 14, 2016 and December 31, 2015, the advances were collateralized by pledged securities totaling
F-143
Table of Contents
RIDGESTONE FINANCIAL SERVICES, INC.
NOTES TO THE CONSOLIDATED FINANCIAL STATEMENTS (Continued)
For the period from January 1, 2016 to October 14, 2016 and the year ended December 31, 2015
(In thousands of dollars, except per share data)
NOTE 8—FEDERAL HOME LOAN BANK ADVANCES (Continued)
$24,607 and $10,353 and qualifying loans of $3,292 and $5,278. Based on this collateral and the Company’s holdings of FHLB stock, the Company was eligible to borrow an additional $15,120 at October 14, 2016. Putable advances are required to be repaid upon the request of the FHLB.
NOTE 9—BORROWINGS
Note Payable: On January 18, 2015 the Company executed a promissory note with a correspondent bank with an interest rate equal to the 30 day LIBOR Rate plus 3.00% and required monthly principal payments of $18,750 plus interest, with final payment of the remaining balance on the note due on January 19, 2017. During 2015, the Company repaid the note payable in full.
Line of Credit: On June 15, 2015, The Company executed a new loan agreement with a correspondent bank for a line of credit of $3,000,000 at the Prime Rate, as set forth in the Wall Street Journal (3.75% at October 14, 2016) with an initial maturity date of June 15, 2016. The maturity date of the line of credit was extended to June 15, 2017. A portion of the line was used to pay off the note descried above. Payments of interest only are required quarterly. The loan is secured by all of the stock of the Bank and contains covenants related to the Bank’s capital and non-performing assets. At October 14, 2016, management believes that the Company was in compliance with the debt covenants. At October 14, 2016 and December 31, 2015, the Company had $0 and $775 outstanding on the line of credit.
NOTE 10—SUBORDINATED DEBENTURES
In 2003, the Company’s predecessor formed RidgeStone Capital Trust I (“the Trust”). The Trust was formed as a statutory business trust formed under the laws of the state of Delaware and is wholly owned by the Company. The Trust issued floating rate capital trust preferred securities with an aggregate liquidation amount of $1,500 ($1 per preferred security) to third-party institutional investors. The Company then issued junior subordinated debentures aggregating $1,550 to the Trust in exchange for ownership of all of the common securities of the Trust and the proceeds from the preferred securities sold by the Trust. The junior subordinated debentures are the sole assets of the Trust. The junior subordinated debentures and the preferred securities pay interest and dividends on a quarterly basis. Beginning on June 30, 2008, the rate reset to LIBOR plus 3.50% and resets every five years thereafter. At October 14, 2016 and December 31, 2015 the rate was 5.09%.
The Company’s investment in the common stock of the Trust is $50 and is included in other assets. Consistent with generally accepted accounting principles, the Trust is not consolidated with the Company. Accordingly, the Company reports the subordinated debentures held by the Trust as a liability.
The subordinated debentures will mature on June 30, 2033, at which time the preferred securities must be redeemed. The subordinated debentures and preferred securities can be redeemed contemporaneously, in whole or in part. The Company has the right, at any time, as long as there are no continuing events of default, to defer payments of interest on the debentures for consecutive periods not exceeding five years; but not beyond the stated maturity of the debentures. The subordinated debentures qualify as regulatory capital, subject to regulatory limitation.
F-144
Table of Contents
RIDGESTONE FINANCIAL SERVICES, INC.
NOTES TO THE CONSOLIDATED FINANCIAL STATEMENTS (Continued)
For the period from January 1, 2016 to October 14, 2016 and the year ended December 31, 2015
(In thousands of dollars, except per share data)
NOTE 11—INCOME TAXES
Income tax expense was as follows:
| Period Ended October 14, 2016 |
Year Ended December 31, 2015 |
|||||||
| Current expense |
$ | 7,853 | $ | 7,832 | ||||
| Deferred expense |
1,155 | 200 | ||||||
|
|
|
|
|
|||||
| Total |
$ | 9,008 | $ | 8,032 | ||||
|
|
|
|
|
|||||
Effective tax rates differ from federal statutory rates applied to financial statement income due to the following:
| Period Ended October 14, 2016 |
Year Ended December 31, 2015 |
|||||||
| Income tax at federal statutory rate of 35% |
$ | 7,406 | $ | 6,779 | ||||
| Effect of: |
||||||||
| Earnings on Company-owned life insurance |
(12 | ) | (15 | ) | ||||
| State taxes |
1,054 | 1,149 | ||||||
| Non-deductible transaction expenses |
336 | 18 | ||||||
| Other, net |
224 | 101 | ||||||
|
|
|
|
|
|||||
| Total |
$ | 9,008 | $ | 8,032 | ||||
|
|
|
|
|
|||||
| Effective tax rate |
42.57 | % | 41.37 | % | ||||
|
|
|
|
|
|||||
F-145
Table of Contents
RIDGESTONE FINANCIAL SERVICES, INC.
NOTES TO THE CONSOLIDATED FINANCIAL STATEMENTS (Continued)
For the period from January 1, 2016 to October 14, 2016 and the year ended December 31, 2015
(In thousands of dollars, except per share data)
NOTE 11—INCOME TAXES (Continued)
Year-end deferred tax assets and liabilities were as follows:
| October 14, 2016 |
December 31, 2015 |
|||||||
| Deferred tax assets: |
||||||||
| Allowance for loan losses |
$ | 587 | $ | — | ||||
| Accrued expenses |
301 | 1,251 | ||||||
| Other real estate owned |
25 | 22 | ||||||
| State net operating loss carryforward |
83 | 86 | ||||||
| Net unrealized loss on available for sale securities |
— | 68 | ||||||
| Other, net |
8 | 4 | ||||||
|
|
|
|
|
|||||
| 1,004 | 1,431 | |||||||
| Deferred tax liabilities: |
||||||||
| Allowance for loan losses |
— | (300 | ) | |||||
| Premises and equipment |
(230 | ) | (215 | ) | ||||
| Prepaids |
(29 | ) | (55 | ) | ||||
| FHLB stock dividends |
(2 | ) | (2 | ) | ||||
| Servicing rights |
(8,331 | ) | (7,224 | ) | ||||
| Net unrealized gain on available for sale securities |
(110 | ) | — | |||||
|
|
|
|
|
|||||
| (8,702 | ) | (7,796 | ) | |||||
|
|
|
|
|
|||||
| Net deferred tax liability |
$ | (7,698 | ) | $ | (6,365 | ) | ||
|
|
|
|
|
|||||
Unused Wisconsin net operating losses of $1,564 and $1,668 as of October 14, 2016 and December 31, 2015, respectively, begin to expire in 2031. The Company files a U.S. federal income tax return and state income tax returns in various states. Income tax returns filed by the Company are no longer subject to examination by federal for tax years prior to 2013 and state income tax authorities for tax years prior to 2012.
NOTE 12—RELATED-PARTY TRANSACTIONS
Certain directors, officers, and shareholders of the Company (including their affiliates, families, and companies in which they are principal owners) are considered to be related parties of the Company. From time to time, these related parties may enter into loan and deposit relationships. At October 14, 2016 and December 31, 2015, no related parties had outstanding loan balances. Deposits from these related parties totaled $150 and $361 as of October 14, 2016 and December 31, 2015.
NOTE 13—INCENTIVE PLAN AND EMPLOYMENT AGREEMENTS
The Company has a Long Term Incentive Plan (the “Plan”) for certain officers and employees. The Plan provides a cash incentive based on the achievement of specific performance goals and stock awards. Benefits vest over a three to five year period, and the cash awards are paid when vested. A Plan provision requires the benefits to fully vest upon a change in control, and accordingly, the unvested cash and stock benefits fully vested by October 14, 2016.
The Plan permits the issuance of incentive stock options, stock appreciation rights, and restricted stock awards. The Plan provides a means to attract, retain, and reward individuals who can and do contribute to such
F-146
Table of Contents
RIDGESTONE FINANCIAL SERVICES, INC.
NOTES TO THE CONSOLIDATED FINANCIAL STATEMENTS (Continued)
For the period from January 1, 2016 to October 14, 2016 and the year ended December 31, 2015
(In thousands of dollars, except per share data)
NOTE 13—INCENTIVE PLAN AND EMPLOYMENT AGREEMENTS (Continued)
success and to further align their interests with those of the Company’s shareholders. Each employee or director of, or service provider to, the Company or any related company of the Company is available to be a participant in the Plan. The Plan provides that the maximum number of shares of stock that may be delivered to participants shall be equal to 207,000. No incentive stock options or stock appreciation rights have been awarded. Awards consist of performance-based stock incentives based on the performance of the Company and the award represents the right of the participant to receive a payment in the future subject to the terms of the agreement. A summary of changes in the Company’s nonvested shares for the year follows:
| Nonvested Shares |
Shares |
Weighted-Average Grant-Date Fair Value |
||||||
| Nonvested at January 1, 2016 |
19,617 | $ | 13.66 | |||||
| Granted |
— | — | ||||||
| Vested |
19,617 | 13.66 | ||||||
| Forfeited |
— | — | ||||||
|
|
|
|
|
|||||
| Nonvested at October 14, 2016 |
— | $ | — | |||||
|
|
|
|
|
|||||
During the period from January 1, 2016 to October 14, 2016 and the year ended December 31, 2015, 5,210 and 13,276 shares, respectively, were also issued to certain executives based on performance. The shares were vested on award date.
During 2016, the 19,617 nonvested shares were fully vested due to the plan’s change in control provisions triggered by the merger transaction. At October 14, 2016, there was no unrecognized compensation cost related to nonvested shares under the plan.
Certain executives entered into change in control agreements with the Company during June 2014, which provide benefits upon termination due to a change in control. No amounts have been accrued or expensed under these employment agreements since the merger transaction did not cause termination.
A key executive has an employment agreement which provides benefits, including: compensation, performance bonus, severance, other benefits, and a change in control provision. The change in control benefits were triggered by the merger transaction, and accordingly, benefits were accrued and paid during the period ended October 14, 2016.
The Company recognized expenses, reported in salaries and employee benefits on the consolidated statements of income, totaling $2,847 and $1,334 under the incentive plan, including the stock incentive vesting, and employment agreements during the period from January 1, 2016 to October 14, 2016, and the year ended December 31, 2015, respectively.
F-147
Table of Contents
RIDGESTONE FINANCIAL SERVICES, INC.
NOTES TO THE CONSOLIDATED FINANCIAL STATEMENTS (Continued)
For the period from January 1, 2016 to October 14, 2016 and the year ended December 31, 2015
(In thousands of dollars, except per share data)
NOTE 14—EARNINGS PER COMMON SHARE
The table below calculates the earnings per share for the period from January 1, 2016 to October 14, 2016, and for the year ended December 31, 2015:
| Period Ended October 14, 2016 |
Year Ended December 31, 2015 |
|||||||
| Basic: |
||||||||
| Net income |
$ | 12,152 | $ | 11,385 | ||||
| Weighted average common shares outstanding |
3,374,318 | 3,369,041 | ||||||
|
|
|
|
|
|||||
| Basic earnings per share |
$ | 3.60 | $ | 3.38 | ||||
|
|
|
|
|
|||||
| Diluted: |
||||||||
| Net income |
$ | 12,152 | $ | 11,385 | ||||
| Weighted-average common shares outstanding for basic |
3,374,318 | 3,369,041 | ||||||
| Add dilutive effects of assumed exercise of stock awards |
— | 9,808 | ||||||
|
|
|
|
|
|||||
| Weighted-average common shares outstanding for diluted |
3,374,318 | 3,378,849 | ||||||
|
|
|
|
|
|||||
| Diluted earnings per share |
$ | 3.60 | $ | 3.37 | ||||
|
|
|
|
|
|||||
At October 14, 2016 and December 31, 2015, there were no anti-dilutive stock awards.
NOTE 15—REGULATORY MATTERS
Banks and bank holding companies are subject to regulatory capital requirements administered by federal banking agencies. Since the Company has consolidated assets of less than $1 billion and meets the criteria of the Federal Reserve’s Small Bank Holding Company Policy Statement, regulatory minimum capital tests are applied primarily at the subsidiary bank level. Capital adequacy guidelines and, additionally for banks, prompt corrective action regulations involve quantitative measures of assets, liabilities, and certain off-balance-sheet items calculated under regulatory accounting practices. Capital amounts and classifications are also subject to qualitative judgments by regulators. Failure to meet capital requirements can initiate regulatory action.
The final rules implementing Basel Committee on Banking Supervision’s capital guideline for U.S. Banks (Basel III rules) became effective for the Company on January 1, 2015 with full compliance with all of the requirements being phased in over a multi-year schedule, and fully phased in by January 1, 2019. Under the Basel III rules, the Bank must hold a capital conservation buffer above the adequately capitalized risk-based capital ratios. The capital conservation buffer is being phased in at 0.625% per year beginning in 2016 until fully phased in at 2.5% in 2019. The required capitalization buffer at October 14, 2016 was $2,476. The net unrealized gain or loss on available for sale securities is not included in computing regulatory capital. Management believes as of October 14, 2016 and December 31, 2015, the Bank meets all capital adequacy requirements to which it is subject.
Prompt corrective action regulations provide five classifications: well capitalized, adequately capitalized, undercapitalized, significantly undercapitalized, and critically undercapitalized, although these terms are not used to represent overall financial condition. If adequately capitalized, regulatory approval is required to accept brokered deposits. If undercapitalized, capital distributions are limited, as is asset growth and expansion, and capital restoration plans are required. As of October 14, 2016 and the year ended December 31, 2015, the
F-148
Table of Contents
RIDGESTONE FINANCIAL SERVICES, INC.
NOTES TO THE CONSOLIDATED FINANCIAL STATEMENTS (Continued)
For the period from January 1, 2016 to October 14, 2016 and the year ended December 31, 2015
(In thousands of dollars, except per share data)
NOTE 15—REGULATORY MATTERS (Continued)
most recent regulatory notifications categorized the Bank as well capitalized under the regulatory framework for prompt corrective action. There are no conditions or events since that notification that management believes have changed the institution’s category.
Actual and required capital amounts and ratios at October 14, 2016 and December 31, 2015 are presented below:
| Actual |
Required
For |
To Be
Well |
||||||||||||||||||||||
| Amount |
Ratio |
Amount |
Ratio |
Amount |
Ratio |
|||||||||||||||||||
| 2016 |
||||||||||||||||||||||||
| Total Capital (to risk weighted assets) |
$ | 65,752 | 16.62 | % | $ | 31,640 | 8.0 | % | $ | 39,550 | 10.0 | % | ||||||||||||
| Tier 1 Capital (to risk weighted assets) |
60,731 | 15.36 | 23,730 | 6.0 | 31,640 | 8.0 | ||||||||||||||||||
| Common Tier 1 (CET 1) |
60,731 | 15.36 | 17,798 | 4.5 | 25,708 | 6.5 | ||||||||||||||||||
| Tier 1 Capital (to average assets) |
60,731 | 13.60 | 17,860 | 4.0 | 22,325 | 5.0 | ||||||||||||||||||
| Actual |
Required
For |
To Be Well Prompt Corrective Action Provisions |
||||||||||||||||||||||
| Amount |
Ratio |
Amount |
Ratio |
Amount |
Ratio |
|||||||||||||||||||
| 2015 |
||||||||||||||||||||||||
| Total Capital (to risk weighted assets) |
$ | 57,464 | 14.59 | % | $ | 31,518 | 8.0 | % | $ | 39,398 | 10.0 | % | ||||||||||||
| Tier 1 Capital (to risk weighted assets) |
52,477 | 13.32 | 23,631 | 6.0 | 31,508 | 8.0 | ||||||||||||||||||
| Common Tier 1 (CET 1) |
52,477 | 13.32 | 17,723 | 4.5 | 25,601 | 6.5 | ||||||||||||||||||
| Tier 1 Capital (to average assets) |
52,477 | 12.35 | 16,995 | 4.0 | 21,244 | 5.0 | ||||||||||||||||||
NOTE 16—LOAN COMMITMENTS AND OTHER RELATED ACTIVITIES
The Company is party to financial instruments with off-balance-sheet risk in the normal course of business to meet the financing needs of its customers. These financial instruments include standby letters of credit and commitments to fund loans. The Company’s exposure to credit loss in the event of nonperformance by the parties to these financial instruments is represented by the contractual amount of the instruments. Commitments may expire without being used. The same credit policies are used to make such commitments as are used for loans, including obtaining collateral at exercise of the commitment and other performance measures as may be required by the Company. Commitments to fund loans include SBA and USDA loans, which based on market conditions, the Company may choose to sell. These financial instruments are summarized as follows:
| October 14, 2016 |
December 31, 2015 |
|||||||||||||||
| Fixed Rate |
Variable Rate |
Fixed Rate |
Variable Rate |
|||||||||||||
| Financial instruments whose contract amounts represent credit risk |
||||||||||||||||
| Standby letters of credit |
$ | — | $ | 1,111 | $ | — | $ | 1,047 | ||||||||
| Commitments to fund loans |
— | 201,602 | — | 229,595 | ||||||||||||
F-149
Table of Contents
RIDGESTONE FINANCIAL SERVICES, INC.
NOTES TO THE CONSOLIDATED FINANCIAL STATEMENTS (Continued)
For the period from January 1, 2016 to October 14, 2016 and the year ended December 31, 2015
(In thousands of dollars, except per share data)
NOTE 16—LOAN COMMITMENTS AND OTHER RELATED ACTIVITIES (Continued)
Commitments to fund loans are generally made for periods of 180 days or less.
NOTE 17—FAIR VALUE
Fair value is the exchange price that would be received for an asset or paid to transfer a liability (exit price) in the principal or most advantageous market for the asset or liability in an orderly transaction between market participants on the measurement date. There are three levels of inputs that may be used to measure fair value:
Level 1—Quoted prices (unadjusted) for identical assets or liabilities in active markets that the entity has the ability to access as of the measurement date.
Level 2—Significant other observable inputs other than Level 1 prices such as quoted prices for similar assets or liabilities; quoted prices in markets that are not active; or other inputs that are observable or can be corroborated by observable market data.
Level 3—Significant unobservable inputs that reflect a company’s own assumptions about the assumptions that market participants would use in pricing an asset or liability.
The Company used the following methods and significant assumptions to estimate the fair value.
Securities: The fair value of securities available-for-sale are calculated based on market prices of similar securities or by matrix pricing, which is a mathematical technique widely used in the industry to value debt securities without relying exclusively on quoted prices for the specific securities but rather by relying on the securities’ relationship to other benchmark quoted securities (Level 2). For securities where market prices of similar securities are not available, fair values are calculated using discounted cash flows or other market indicators (Level 3). Level 3 securities include single issuer trust preferred securities that are not traded in a market. The fair value measurement of a Level 3 security is based on a discounted cash flow model that incorporates the probability of default assumption to measure the fair value of the security. The Company evaluates the issuers’ most recent financial statements available including the financial statements of the subsidiary banks and incorporates the interest deferrals into the calculation.
Impaired Loans: The fair value of impaired loans with specific allocations of the allowance for loan losses is generally based on real estate appraisals. These appraisals may utilize a single valuation approach or a combination of approaches including comparable sales and the income approach. Adjustments are routinely made in the appraisal process by the appraisers to adjust for differences between the comparable sales and income data available. Such adjustments are usually significant and typically result in a Level 3 classification of the inputs for determining fair value. Non-real estate collateral may be valued using an appraisal, net book value per the borrower’s financial statements, or aging reports, adjusted or discounted based on management’s historical knowledge, changes in market conditions from the time of the valuation, and management’s expertise and knowledge of the client and client’s business, resulting in a Level 3 fair value classification. Impaired loans are evaluated on a quarterly basis for additional impairment and adjusted accordingly.
Other Real Estate Owned: Assets acquired through or instead of loan foreclosure are initially recorded at fair value less costs to sell when acquired, establishing a new cost basis. These assets are subsequently accounted for at lower of cost or fair value less estimated costs to sell. Fair value is commonly based on recent real estate
F-150
Table of Contents
RIDGESTONE FINANCIAL SERVICES, INC.
NOTES TO THE CONSOLIDATED FINANCIAL STATEMENTS (Continued)
For the period from January 1, 2016 to October 14, 2016 and the year ended December 31, 2015
(In thousands of dollars, except per share data)
NOTE 17—FAIR VALUE (Continued)
appraisals which are updated no less frequently than annually. These appraisals may utilize a single valuation approach or a combination of approaches including comparable sales and the income approach. Adjustments are routinely made in the appraisal process by the independent appraisers to adjust for differences between the comparable sales and income data available. Such adjustments are usually significant and typically result in a Level 3 classification of the inputs for determining fair value. Real estate owned properties are evaluated on a periodic basis for additional impairment and adjusted accordingly.
Appraisals for both collateral-dependent impaired loans and other real estate owned are generally performed by certified general appraisers (for commercial properties) or certified residential appraisers (for residential properties) whose qualifications and licenses have been reviewed and verified by the Company. Once received, management reviews the assumptions and approaches utilized in the appraisal as well as the overall resulting fair value in comparison with independent data sources such as recent market data or industry-wide statistics. Upon sale of collateral, the Company compares the actual selling price of collateral that has been sold to the most recent appraised value to determine what additional adjustment should be made to the appraisal value to arrive at fair value for the remaining assets carried at fair value.
Servicing Rights: Fair value is based on market prices for comparable servicing contracts valued on a loan-by-loan basis taking into consideration the original term to maturity, the current age of the loan and the remaining term to maturity. The valuation methodology utilized for the servicing rights begins with generating future cash flows for each servicing asset, based on their unique characteristics and market-based assumptions for prepayment speeds. The present value of the future cash flows are then calculated utilizing market-based discount rate assumptions. Fair value at October 14, 2016 and year end 2015 was determined using the following weighted average assumptions:
| 2016 |
2015 |
|||||||
| Discount rate |
12.7 | % | 12.1 | % | ||||
| Prepayment speed |
7.2 | % | 7.4 | % | ||||
| Expected weighted average loan life |
6.1 years | 6.3 years | ||||||
Loans: As described in earlier Notes, the Company accounts for certain loans at fair value. Fair value is calculated quarterly based on market prices for comparable loans valued on a loan-by-loan basis taking into consideration the original term to maturity, the current age of the loan, the remaining term to maturity, and credit quality indicators. The valuation methodology utilized begins with generating future cash flows for each loan based on their unique characteristics and market-based assumptions. The present value of the future cash flows are then calculated utilizing market-based discount rate assumptions. The fair value of loans held for sale is estimated based upon quotes from third party investors resulting in a Level 2 classification.
F-151
Table of Contents
RIDGESTONE FINANCIAL SERVICES, INC.
NOTES TO THE CONSOLIDATED FINANCIAL STATEMENTS (Continued)
For the period from January 1, 2016 to October 14, 2016 and the year ended December 31, 2015
(In thousands of dollars, except per share data)
NOTE 17—FAIR VALUE (Continued)
Assets measured at fair value on a recurring basis at October 14, 2016 and December 31, 2015 are summarized below:
| Total |
Quoted Prices in Active Markets for Identical Assets (Level 1) |
Significant Other Observable Inputs (Level 2) |
Significant Unobservable Inputs (Level 3) |
|||||||||||||
| October 14, 2016 |
||||||||||||||||
| Collateralized mortgage obligations—residential |
$ | 2,357 | $ | — | $ | 2,357 | $ | — | ||||||||
| Mortgage-backed—residential |
523 | — | 523 | — | ||||||||||||
| U.S. government sponsored entities |
23,751 | — | 23,751 | — | ||||||||||||
| Single issuer trust preferred |
583 | — | — | 583 | ||||||||||||
| Loans |
3,338 | — | 3,338 | — | ||||||||||||
| Loans held for sale |
8,915 | — | 8,915 | — | ||||||||||||
| Servicing assets |
21,499 | — | 21,499 | — | ||||||||||||
|
|
|
|
|
|
|
|
|
|||||||||
| $ | 60,966 | $ | — | $ | 60,383 | $ | 583 | |||||||||
|
|
|
|
|
|
|
|
|
|||||||||
| December 31, 2015 |
||||||||||||||||
| Collateralized mortgage obligations—residential |
$ | 2,816 | $ | — | $ | 2,816 | $ | — | ||||||||
| Mortgage-backed—residential |
621 | — | 621 | — | ||||||||||||
| U.S. government sponsored entities |
23,370 | — | 23,370 | — | ||||||||||||
| Single issuer trust preferred |
583 | — | — | 583 | ||||||||||||
| Loans |
4,022 | — | 4,022 | — | ||||||||||||
| Loans held for sale |
2,067 | — | 2,067 | — | ||||||||||||
| Servicing assets |
19,107 | — | 19,107 | — | ||||||||||||
|
|
|
|
|
|
|
|
|
|||||||||
| $ | 52,586 | $ | — | $ | 52,003 | $ | 583 | |||||||||
|
|
|
|
|
|
|
|
|
|||||||||
The following table presents quantitative information about recurring Level 3 fair value measurements at October 14, 2016 and December 31, 2015:
| Fair Value |
Valuation Techniques |
Unobservable Input |
Range |
|||||||||||||
| October 14, 2016 |
||||||||||||||||
| Single issuer trust preferred |
$ | 583 | Discounted cash flow | Probability of default | 8%-11% | |||||||||||
| December 31, 2015 |
||||||||||||||||
| Single issuer trust preferred |
$ | 583 | Discounted cash flow | Probability of default | 8%-11% | |||||||||||
The change in the fair value of securities with a fair value measured using Level 3 inputs during the period from January 1, 2016 to October 14, 2016 and the year ended December 31, 2015 was $0 and $0.
The Company has elected the fair value option for certain loans. Interest income is recorded based on the contractual terms of the loan and in accordance with the Company’s policy on loans held for investment. None of these loans are 90 days or more past due and all are accruing interest as of October 14, 2016 and December 31, 2015. Interest income recognized during the period from January 1, 2016 to October 14, 2016 and the year ended December 31, 2015 was $226 and $258. For those loans carried at fair value, changes in fair value
F-152
Table of Contents
RIDGESTONE FINANCIAL SERVICES, INC.
NOTES TO THE CONSOLIDATED FINANCIAL STATEMENTS (Continued)
For the period from January 1, 2016 to October 14, 2016 and the year ended December 31, 2015
(In thousands of dollars, except per share data)
NOTE 17—FAIR VALUE (Continued)
of $161 and $255 were recognized during the period from January 1, 2016 to October 14, 2016 and the year ended December 31, 2015.
Servicing assets, which are carried at fair value, included changes in fair value of $(3,609) and $(4,008) during the period from January 1, 2016 to October 14, 2016 and the year ended December 31, 2015.
There were no transfers between Level 1, Level 2, and Level 3 during the period from January 1, 2016 to October 14, 2016 and the year ended December 31, 2015.
Assets measured at fair value on a non-recurring basis at October 14, 2016 and December 31, 2015 are summarized below:
| Total |
Quoted Prices in (Level 1) |
Significant (Level 2) |
Significant (Level 3) |
|||||||||||||
| October 14, 2016 |
||||||||||||||||
| Impaired loans |
||||||||||||||||
| Commercial real estate |
$ | 4,084 | $ | — | $ | — | $ | 4,084 | ||||||||
| SBA and USDA |
3,668 | — | — | 3,668 | ||||||||||||
|
|
|
|
|
|
|
|
|
|||||||||
| $ | 7,752 | $ | — | $ | — | $ | 7,752 | |||||||||
|
|
|
|
|
|
|
|
|
|||||||||
| Total |
Quoted Prices in (Level 1) |
Significant |
Significant (Level 3) |
|||||||||||||
| December 31, 2015 |
||||||||||||||||
| Impaired loans |
||||||||||||||||
| Commercial real estate |
$ | 3,860 | $ | — | $ | — | $ | 3,860 | ||||||||
| SBA and USDA |
8,435 | — | — | 8,435 | ||||||||||||
| Real estate owned |
||||||||||||||||
| Commercial real estate |
1,394 | — | — | 1,394 | ||||||||||||
| Construction |
121 | — | — | 121 | ||||||||||||
|
|
|
|
|
|
|
|
|
|||||||||
| $ | 13,810 | $ | — | $ | — | $ | 13,810 | |||||||||
|
|
|
|
|
|
|
|
|
|||||||||
At October 14, 2016 and December 31, 2015, there were no liabilities measured at fair value.
At October 14, 2016, impaired loans carried at fair value had a carrying amount of $10,926 with valuation allowances of $3,174. At December 31, 2015, impaired loans carried at fair value had a carrying amount of $15,283 with valuation allowances of $2,988. Additional provisions recognized on impaired loans for the period from January 1, 2016 to October 14, 2016 and the year ended December 31, 2015 were $1,736 and $2,021.
At October 14, 2016 and December 31, 2015, there was no valuation allowance recorded for other real estate owned.
F-153
Table of Contents
RIDGESTONE FINANCIAL SERVICES, INC.
NOTES TO THE CONSOLIDATED FINANCIAL STATEMENTS (Continued)
For the period from January 1, 2016 to October 14, 2016 and the year ended December 31, 2015
(In thousands of dollars, except per share data)
NOTE 17—FAIR VALUE (Continued)
The following table presents quantitative information about level 3 fair value measurements for financial instruments measured at fair value on a non-recurring basis at October 14, 2016:
| Fair Value |
Valuation Technigue(s) |
Unobservable lnput(s) |
Range |
|||||||||
| Impaired loans-commercial real estate |
$ | 4,084 | Sales comparison approach | Adjustment for differences between the comparable sales | (14)%-84% | |||||||
| Impaired loans-SBA and USDA |
$ | 3,668 | Sales comparison approach | Adjustment for differences between the comparable sales | (6)%-29% | |||||||
The following table presents quantitative information about level 3 fair value measurements for financial instruments measured at fair value on a non-recurring basis at December 31, 2015:
| Fair Value |
Valuation Technigue(s) |
Unobservable lnput(s) |
Range |
|||||||||
| Impaired loans-commercial real estate |
$ | 3,860 | Sales comparison approach | Adjustment for differences between the comparable sales | 0%-26% | |||||||
| Impaired loans-SBA and USDA |
$ | 8,435 | Sales comparison approach | Adjustment for differences between the comparable sales | 1%-37% | |||||||
| Real estate owned- commercial real estate |
$ | 1,394 | Sales comparison approach | Adjustment for differences between the comparable sales | 11%-57% | |||||||
| Real estate owned- construction |
$ | 121 | Sales comparison approach | Adjustment for differences between the comparable sales | 0%-78% | |||||||
Carrying amounts and estimated fair values of financial instruments, not previously presented, at October 14, 2016 and December 31, 2015 are presented in the following table.
| 2016 |
2015 |
|||||||||||||||
| Carrying |
Fair Value |
Carrying |
Fair Value |
|||||||||||||
| Financial assets |
||||||||||||||||
| Cash and cash equivalents |
$ | 25,480 | $ | 25,480 | $ | 13,099 | $ | 13,099 | ||||||||
| Loans, net (less impaired at fair value) |
332,212 | 327,976 | 292,489 | 282,659 | ||||||||||||
| Federal Home Loan Bank stock |
854 | N/A | 724 | N/A | ||||||||||||
| Accrued interest receivable |
1,321 | 1,321 | 2,286 | 2,286 | ||||||||||||
| Financial liabilities |
||||||||||||||||
| Deposits |
$ | 358,713 | $ | 359,243 | $ | 343,571 | $ | 344,021 | ||||||||
| Federal Home Loan Bank advances |
9,487 | 9,781 | 9,487 | 9,858 | ||||||||||||
| Borrowings |
— | — | 775 | 775 | ||||||||||||
| Subordinated debentures |
1,550 | 1,475 | 1,550 | 1,442 | ||||||||||||
| Accrued interest payable |
1,399 | 1,399 | 1,174 | 1,174 | ||||||||||||
The methods and assumptions, not previously presented, used to estimate fair values are as follows:
Cash and Cash Equivalents—The carrying amounts of cash and short-term instruments approximate fair values.
F-154
Table of Contents
RIDGESTONE FINANCIAL SERVICES, INC.
NOTES TO THE CONSOLIDATED FINANCIAL STATEMENTS (Continued)
For the period from January 1, 2016 to October 14, 2016 and the year ended December 31, 2015
(In thousands of dollars, except per share data)
NOTE 17—FAIR VALUE (Continued)
Loans—Fair values of loans are estimated as follows: For variable rate loans that reprice frequently and with no significant change in credit risk, fair values are based on carrying values. Fair values for other loans are estimated using discounted cash flow analyses, using interest rates currently being offered for loans with similar terms to borrowers of similar credit quality. Impaired loans are valued at the lower of cost or fair value as described previously. The methods utilized to estimate the fair value of loans do not necessarily represent an exit price.
FHLB Stock—It is not practical to determine the fair value of FHLB stock due to restrictions placed on its transferability.
Deposits—The fair values disclosed for demand deposits (e.g., interest and non-interest checking, passbook savings, and certain types of money market accounts) are, by definition, equal to the amount payable on demand at the reporting date (i.e., their carrying amount). The carrying amounts of variable rate, fixed-term money market accounts and certificates of deposit approximate their fair values at the reporting date. Fair values for fixed rate certificates of deposit are estimated using a discounted cash flows calculation that applies interest rates currently being offered on certificates to a schedule of aggregated expected monthly maturities on time deposits.
Federal Home Loan Bank advances, borrowings, and subordinated debentures—The carrying amounts of short-term borrowings, generally maturing within ninety days, approximate their fair values. The fair values of the Company’s long-term borrowings are estimated using discounted cash flow analyses based on the current borrowing rates for similar types of borrowing arrangements. The fair values of the Company’s subordinated debentures are estimated using discounted cash flow analyses based on the current borrowing rates for similar types of borrowing arrangement.
Accrued Interest Receivable/Payable—The carrying amounts of accrued interest approximate fair value.
Off-Balance-Sheet Instruments—Fair values for off-balance-sheet, credit-related financial instruments are based on fees currently charged to enter into similar agreements, taking into account the remaining terms of the agreements and the counterparties’ credit standing. The fair value of commitments is not material.
F-155
Table of Contents
RIDGESTONE FINANCIAL SERVICES, INC.
NOTES TO THE CONSOLIDATED FINANCIAL STATEMENTS (Continued)
For the period from January 1, 2016 to October 14, 2016 and the year ended December 31, 2015
(In thousands of dollars, except per share data)
NOTE 18—PARENT COMPANY CONDENSED FINANCIAL STATEMENTS
The following are the condensed balance sheets and statements of income and cash flows for Ridgestone Financial Services, Inc. as of October 14, 2016 and December 31, 2015 and for the period from January 1, 2016 to October 14, 2016 and the year ended December 31, 2015:
Condensed Balance Sheets
| October 14, |
December 31, |
|||||||
| Assets |
||||||||
| Cash and cash equivalents |
$ | 167 | $ | 361 | ||||
| Investment in bank subsidiary |
65,028 | 54,899 | ||||||
| Other |
807 | 1,756 | ||||||
|
|
|
|
|
|||||
| $ | 66,002 | $ | 57,016 | |||||
|
|
|
|
|
|||||
| Liabilities and Stockholders’ Equity |
||||||||
| Liabilities |
$ | 1,553 | $ | 3,168 | ||||
| Stockholders’ equity |
64,449 | 53,848 | ||||||
|
|
|
|
|
|||||
| $ | 66,002 | $ | 57,016 | |||||
|
|
|
|
|
|||||
Condensed Statements of Income
|
Period ended |
Year
ended |
|||||||
| Income: |
||||||||
| Dividend from bank subsidiary |
$ | 3,135 | $ | 4,625 | ||||
| Interest income |
2 | 2 | ||||||
|
|
|
|
|
|||||
| 3,137 | 4,627 | |||||||
| Expenses: |
||||||||
| Interest expense |
72 | 112 | ||||||
| Other operating expenses |
62 | 57 | ||||||
|
|
|
|
|
|||||
| 134 | 169 | |||||||
|
|
|
|
|
|||||
| Income before income tax benefit and equity in undistributed earnings |
3,003 | 4,458 | ||||||
| Income tax benefit |
— | (17 | ) | |||||
|
|
|
|
|
|||||
| Income before equity in undistributed net income of bank subsidiary |
3,003 | 4,475 | ||||||
| Equity in undistributed net income from bank subsidiary |
9,149 | 6,910 | ||||||
|
|
|
|
|
|||||
| Net income |
$ | 12,152 | $ | 11,385 | ||||
|
|
|
|
|
|||||
F-156
Table of Contents
RIDGESTONE FINANCIAL SERVICES, INC.
NOTES TO THE CONSOLIDATED FINANCIAL STATEMENTS (Continued)
For the period from January 1, 2016 to October 14, 2016 and the year ended December 31, 2015
(In thousands of dollars, except per share data)
NOTE 18—PARENT COMPANY CONDENSED FINANCIAL STATEMENTS (Continued)
Condensed Statements of Cash Flows
|
Period ended |
Year
ended |
|||||||
| Operating activities: |
||||||||
| Net income |
$ | 12,152 | $ | 11,385 | ||||
| Adjustments to reconcile net income (loss) to net cash provided by (used in) operating activities: |
||||||||
| Equity in undistributed net income of bank subsidiary |
(9,149 | ) | (6,910 | ) | ||||
| Stock awards earned |
712 | 164 | ||||||
| Change in other assets and liabilities |
(536 | ) | (105 | ) | ||||
|
|
|
|
|
|||||
| Net cash from operating activities |
3,179 | 4,534 | ||||||
| Financing activities: |
||||||||
| Repayment of note payable |
— | (900 | ) | |||||
| Dividends paid on common stock |
(3,373 | ) | (3,369 | ) | ||||
|
|
|
|
|
|||||
| Net cash from financing activities |
(3,373 | ) | (4,269 | ) | ||||
|
|
|
|
|
|||||
| Net change in cash and cash equivalents |
(194 | ) | 265 | |||||
| Cash and cash equivalents at beginning of year |
361 | 96 | ||||||
|
|
|
|
|
|||||
| Cash and cash equivalents at end of year |
$ | 167 | $ | 361 | ||||
|
|
|
|
|
|||||
F-157
Table of Contents
Through and including, , 2017 (the 25th day after the date of this prospectus), all dealers effecting transactions in our common stock, whether or not participating in this offering, may be required to deliver a prospectus. This delivery requirement is in addition to a dealer’s obligation to deliver a prospectus when acting as an underwriter and with respect to an unsold allotment or subscription.
5,700,000 Shares
Common Stock
PROSPECTUS
BofA Merrill Lynch
Keefe, Bruyette & Woods
A Stifel Company
Piper Jaffray
Sandler O’Neill + Partners, L.P.
Stephens Inc.
, 2017
Table of Contents
PART II
INFORMATION NOT REQUIRED IN PROSPECTUS
Item 13. Other Expenses of Issuance and Distribution.
Estimated expenses, other than underwriting discounts and commissions, in connection with the sale of the registrant’s common stock are as follows:
| Amount to be Paid | ||||
| SEC registration fee |
$ | 16,000 | ||
| Financial Industry Regulatory Authority, Inc. filing fee |
21,000 | |||
| Listing fees and expenses |
25,000 | |||
| Printing fees and expenses |
709,000 | |||
| Legal and accounting fees and expenses |
3,755,000 | |||
| Miscellaneous |
21,000 | |||
|
|
|
|||
| Total |
$ | 4,547,000 | ||
|
|
|
|||
Item 14. Indemnification of Directors and Officers.
Section 145 of the Delaware General Corporation Law, or DGCL, grants each corporation organized thereunder the power to indemnify any person who is or was a director, officer, employee or agent of a corporation or enterprise against expenses (including attorneys’ fees), judgments, fines and amounts paid in settlement actually and reasonably incurred by such person in connection with any threatened, pending or completed action, suit or proceeding, whether civil, criminal, administrative or investigative, by reason of being or having been in any such capacity, if such person acted in good faith and in a manner such person reasonably believed to be in or not opposed to the best interests of the corporation, and, with respect to any criminal action or proceeding had no reasonable cause to believe such person’s conduct was unlawful, except that with respect to an action or suit brought by or in the right of the corporation such indemnification is limited to expenses (including attorneys’ fees) in connection with the defense or settlement of such action or suit. The DGCL provides that Section 145 is not exclusive of other rights to which those seeking indemnification may be entitled under any bylaw, agreement, vote of stockholders or disinterested directors or otherwise. The registrant’s amended and restated bylaws provide for indemnification by the registrant of its directors, officers, employees and agents to the fullest extent permitted by the DGCL, subject to limited exceptions.
Section 102(b)(7) of the DGCL permits a corporation to provide in its certificate of incorporation that a director of the corporation shall not be personally liable to the corporation or its stockholders for monetary damages for breach of fiduciary duty as a director, except for liability (i) for any breach of the director’s duty of loyalty to the corporation or its stockholders, (ii) for acts or omissions not in good faith or which involve intentional misconduct or a knowing violation of law, (iii) for unlawful payments of dividends or unlawful stock repurchases, redemptions or other distributions or (iv) for any transaction from which the director derived an improper personal benefit. The registrant’s amended and restated certificate of incorporation provides for such limitation of liability.
The registrant maintains insurance policies under which coverage is provided (a) to its directors and officers, in their respective capacities as such, against loss arising from a claim made for any actual or alleged wrongful act, and (b) to itself with respect to payments which the registrant may make to such officers and directors pursuant to the above indemnification provision or otherwise as a matter of law.
II-1
Table of Contents
Reference is made to the form of Underwriting Agreement to be filed as Exhibit 1.1 hereto for provisions providing that the underwriters are obligated, under certain circumstances, to indemnify the registrant’s directors, officers and controlling persons against certain liabilities under the Securities Act.
Item 15. Recent Sales of Unregistered Securities.
In the three years preceding the filing of this registration statement, the registrant has not issued any securities that were not registered under the Securities Act, other than in connection with the transactions described herein that were exempt from registration.
In March 2016 and September 2016, the Company sold 3,078,075 shares of common stock for an aggregate purchase price of $50.0 million to certain existing stockholders and, in December 2016 and January 2017, the Company sold 10,438 shares of Series B preferred stock for an aggregate purchase price of $10.4 million. These sales were made solely to accredited investors and did not involve a public offering. Accordingly such sales were exempt from registration under the Securities Act pursuant to the exemption provided by Section 4(a)(2) of the Securities Act and Regulation D under the Securities Act.
In addition, in connection with the Ridgestone acquisition on October 14, 2016, the Company issued 4,199,791 shares of common stock to existing Ridgestone stockholders in a private placement exempt from registration pursuant to Regulation D under the Securities Act. For further information regarding the Ridgestone acquisition, see Note 3 of Byline’s Consolidated Financial Statements as of December 31, 2016 and 2015.
In 2015 and 2016, the Company also granted certain of its employees and directors 1,846,968 stock options under the Byline Bancorp Equity Incentive Plan. These grants were made in reliance upon exemptions from registration requirements under Section 4(a)(2) of the Securities Act and pursuant to Rule 701 under the Securities Act.
Item 16. Exhibits and Financial Statement Schedules.
(a) Exhibits: The following exhibits are filed as part of this Registration Statement:
| Number |
Description | |
| 1.1 | Form of Underwriting Agreement | |
| 3.1 | Amended and Restated Certificate of Incorporation | |
| 3.2 | Amended and Restated Bylaws | |
| 3.3 | Certificate of Designations of Noncumulative Perpetual Preferred Stock, Series A | |
| 3.4 | Certificate of Designations of 7.50% Fixed-to-Floating Noncumulative Perpetual Preferred Stock, Series B | |
| 4.1 | Certain Instruments defining the rights of holders of long-term debt securities of the registrant and its subsidiaries are omitted pursuant to Item 601(b)(4)(iii) of Regulation S-K. The registrant hereby undertakes to furnish to the SEC, upon request, copies of any such instruments. | |
| 5.1 | Opinion of Sullivan & Cromwell LLP | |
| 10.1 | Revolving Credit Agreement, dated October 13, 2016, by and between Byline Bancorp, Inc. and The PrivateBank and Trust Company | |
| 10.2 | Waiver Letter, dated June 7, 2017, by and between Byline Bancorp, Inc. and The PrivateBank and Trust Company | |
| 10.3 | Employment Agreement with Alberto J. Paracchini† | |
| 10.4 | Employment Agreement with Timothy C. Hadro† | |
II-2
Table of Contents
| Number |
Description | |
| 10.5 | Employment Agreement with Bruce W. Lammers† | |
| 10.6 | Employment Agreement with Donald J. Meyer† | |
| 10.7 | Byline Bancorp Equity Incentive Plan† | |
| 10.8 | Form of Byline Bancorp Equity Incentive Plan Stock Option Agreement† | |
| 10.9 | Form of Byline Bancorp, Inc. 2017 Omnibus Incentive Compensation Plan† | |
| 10.10 | Form of Byline Bancorp, Inc. 2017 Omnibus Incentive Compensation Plan IPO Restricted Share Award Agreement† | |
| 10.11 | Form of Byline Bancorp, Inc. Employee Stock Purchase Plan† | |
| 21.1 | Subsidiaries of Byline Bancorp, Inc. | |
| 23.1 | Consent of Moss Adams LLP | |
| 23.2 | Consent of Crowe Horwath LLP | |
| 23.3 | Consent of Sullivan & Cromwell LLP (contained in Exhibit 5.1) | |
| 24.1 | Power of Attorney (included on signature page to the Registration Statement)* | |
| * | Previously filed. |
| † | Indicates a management contract or compensatory plan. |
(b) Consolidated Financial Statement Schedules: All schedules are omitted because the required information is inapplicable or the information is presented in the consolidated financial statements and the related notes.
Item 17. Undertakings
The undersigned registrant hereby undertakes:
(a) to provide to the underwriter at the closing specified in the underwriting agreements, certificates in such denominations and registered in such names as required by the underwriter to permit prompt delivery to each purchaser;
(b) that insofar as indemnification for liabilities arising under the Securities Act of 1933 may be permitted to directors, officers and controlling persons of the registrant pursuant to the foregoing provisions, or otherwise, the registrant has been advised that in the opinion of the Securities and Exchange Commission such indemnification is against public policy as expressed in the Act and is, therefore, unenforceable. In the event that a claim for indemnification against such liabilities (other than the payment by the registrant of expenses incurred or paid by a director, officer or controlling person of the registrant in the successful defense of any action, suit or proceeding) is asserted by such director, officer or controlling person in connection with the securities being registered, the registrant will, unless in the opinion of its counsel the matter has been settled by controlling precedent, submit to a court of appropriate jurisdiction the question whether such indemnification by it is against public policy as expressed in the Act and will be governed by the final adjudication of such issue;
(c) that for purposes of determining any liability under the Securities Act of 1933, the information omitted from the form of prospectus filed as part of this registration statement in reliance upon Rule 430A and contained in a form of prospectus filed by the registrant pursuant to Rule 424(b)(1) or (4) or 497(h) under the Securities Act shall be deemed to be part of this registration statement as of the time it was declared effective; and
(d) that for the purpose of determining any liability under the Securities Act of 1933, each post-effective amendment that contains a form of prospectus shall be deemed to be a new registration statement relating to the securities offered therein, and the offering of such securities at that time shall be deemed to be the initial bona fide offering thereof.
II-3
Table of Contents
SIGNATURES
Pursuant to the requirements of the Securities Act of 1933, the registrant has duly caused this Registration Statement on Form S-1 to be signed on its behalf by the undersigned, thereunto duly authorized, in the city of Chicago, State of Illinois on June 19, 2017.
| BYLINE BANCORP, INC. | ||
| By: | /s/ Alberto J. Paracchini | |
| Name: Alberto J. Paracchini | ||
| Title: President and Chief Executive Officer | ||
Pursuant to the requirements of the Securities Act of 1933, this Registration Statement has been signed by the following persons in the capacities and on the dates indicated:
| Signature |
Title |
Date | ||
| /s/ Alberto J. Paracchini Alberto J. Paracchini |
President, Chief Executive Officer and Director (Principal Executive Officer) |
June 19, 2017 | ||
| /s/ Lindsay Corby Lindsay Corby |
Executive Vice President and Chief Financial Officer (Principal Financial Officer and Principal Accounting Officer) |
June 19, 2017 | ||
| * Roberto R. Herencia |
Chairman | June 19, 2017 | ||
| * L. Gene Beube |
Director | June 19, 2017 | ||
| * Phillip R. Cabrera |
Director | June 19, 2017 | ||
| * Antonio del Valle Perochena |
Director | June 19, 2017 | ||
| * Steven M. Rull |
Director | June 19, 2017 | ||
| * Jaime Ruiz Sacristán |
Director | June 19, 2017 | ||
| * | /s/ Alberto J. Paracchini | |
| By: | Alberto J. Paracchini Attorney-in-fact | |
II-4
Table of Contents
INDEX TO EXHIBITS
| Number |
Description | |
| 1.1 | Form of Underwriting Agreement | |
| 3.1 | Amended and Restated Certificate of Incorporation | |
| 3.2 | Amended and Restated Bylaws | |
| 3.3 | Certificate of Designations of Noncumulative Perpetual Preferred Stock, Series A | |
| 3.4 | Certificate of Designations of 7.50% Fixed-to-Floating Noncumulative Perpetual Preferred Stock, Series B | |
| 4.1 | Certain Instruments defining the rights of holders of long-term debt securities of the registrant and its subsidiaries are omitted pursuant to Item 601(b)(4)(iii) of Regulation S-K. The registrant hereby undertakes to furnish to the SEC, upon request, copies of any such instruments. | |
| 5.1 | Opinion of Sullivan & Cromwell LLP | |
| 10.1 | Revolving Credit Agreement, dated October 13, 2016, by and between Byline Bancorp, Inc. and The PrivateBank and Trust Company | |
| 10.2 | Waiver Letter, dated June 7, 2017, by and between Byline Bancorp, Inc. and The PrivateBank and Trust Company | |
| 10.3 | Employment Agreement with Alberto J. Paracchini† | |
| 10.4 | Employment Agreement with Timothy C. Hadro† | |
| 10.5 | Employment Agreement with Bruce W. Lammers† | |
| 10.6 | Employment Agreement with Donald J. Meyer† | |
| 10.7 | Byline Bancorp Equity Incentive Plan† | |
| 10.8 | Form of Byline Bancorp Equity Incentive Plan Stock Option Agreement† | |
| 10.9 | Form of Byline Bancorp, Inc. 2017 Omnibus Incentive Compensation Plan† | |
| 10.10 | Form of Byline Bancorp, Inc. 2017 Omnibus Incentive Compensation Plan IPO Restricted Share Award Agreement† | |
| 10.11 | Form of Byline Bancorp, Inc. Employee Stock Purchase Plan† | |
| 21.1 | Subsidiaries of Byline Bancorp, Inc. | |
| 23.1 | Consent of Moss Adams LLP | |
| 23.2 | Consent of Crowe Horwath LLP | |
| 23.3 | Consent of Sullivan & Cromwell LLP (contained in Exhibit 5.1) | |
| 24.1 | Power of Attorney (included on signature page to the Registration Statement)* | |
| * | Previously filed. |
| † | Indicates a management contract or compensatory plan. |
II-5