Attached files
| file | filename |
|---|---|
| EX-23.2 - EX-23.2 - Altice USA, Inc. | a2232351zex-23_2.htm |
| EX-23.1 - EX-23.1 - Altice USA, Inc. | a2232351zex-23_1.htm |
Use these links to rapidly review the document
TABLE OF CONTENTS
INDEX TO FINANCIAL STATEMENTS
As filed with the Securities and Exchange Commission on June 16, 2017
Registration No. 333-217240
UNITED STATES
SECURITIES AND EXCHANGE COMMISSION
Washington, D.C. 20549
Amendment No. 4
to
FORM S-1
REGISTRATION STATEMENT
UNDER
THE SECURITIES ACT OF 1933
Altice USA, Inc.
(Exact name of registrant as specified in its Charter)
| Delaware (State or other jurisdiction of incorporation or organization) |
4841 (Primary Standard Industrial Classification Code Number) |
38-3980194 (I.R.S. Employer Identification No.) |
1111 Stewart Avenue
Bethpage, NY 11714
(516) 803-2300
(Address, including zip code, and telephone number, including area code, of registrant's principal executive office)
David Connolly
Executive Vice President and General Counsel
1111 Stewart Avenue
Bethpage, NY 11714
(516) 803-2300
(Name, address, including zip code, and telephone number, including area code, of agent for service)
Richard B. Alsop Kyungwon Lee Shearman & Sterling LLP 599 Lexington Avenue New York, NY 10022 (212) 848-4000 |
Craig Marcus Michael Kazakevich Ropes & Gray LLP Prudential Tower 800 Boylston Street Boston, MA 02199 (617) 951-7000 |
Approximate date of commencement of proposed sale to the public:
As soon as practicable after the effective date of this registration statement.
If any of the securities being registered on this Form are to be offered on a delayed or continuous basis pursuant to Rule 415 under the Securities Act of 1933, check the following box. o
If this Form is filed to register additional securities for an offering pursuant to Rule 462(b) under the Securities Act, check the following box and list the Securities Act registration statement number of the earlier effective registration statement for the same offering. o
If this Form is a post-effective amendment filed pursuant to Rule 462(c) under the Securities Act, check the following box and list the Securities Act registration statement number of the earlier effective registration statement for the same offering. o
If this Form is a post-effective amendment filed pursuant to Rule 462(d) under the Securities Act, check the following box and list the Securities Act registration statement number of the earlier effective registration statement for the same offering. o
Indicate by check mark whether the registrant is a large accelerated filer, an accelerated filer, a non-accelerated filer, or a smaller reporting company. See the definitions of "large accelerated filer," "accelerated filer," "smaller reporting company" and "emerging growth company" in Rule 12b-2 of the Exchange Act. (check one)
| Large accelerated filer o | Accelerated filer o | Non-accelerated filer ý (Do not check if a smaller reporting company) |
Smaller reporting company o Emerging growth company o |
If an emerging growth company, indicate by check mark if the registrant has elected not to use the extended transition period for complying with any new or revised financial accounting standards provided pursuant to Section 7(a)(2)(B) of the Securities Act. o
The registrant hereby amends this registration statement on such date or dates as may be necessary to delay its effective date until the registrant shall file a further amendment which specifically states that this registration statement shall thereafter become effective in accordance with Section 8(a) of the Securities Act of 1933, as amended, or until the registration statement shall become effective on such date as the Securities and Exchange Commission, acting pursuant to Section 8(a), may determine.
The information in this prospectus is not complete and may be changed. We and the selling stockholders may not sell these securities until the registration statement filed with the Securities and Exchange Commission is effective. This prospectus is not an offer to sell these securities and it is not soliciting an offer to buy these securities in any state where the offer or sale is not permitted.
Subject to Completion
Preliminary Prospectus dated June 16, 2017
PROSPECTUS
46,551,725 Shares
Altice USA, Inc.
Class A Common Stock
This is Altice USA, Inc.'s initial public offering. We are selling 12,068,966 shares of our Class A common stock and the selling stockholders identified in this prospectus are selling 34,482,759 shares of our Class A common stock. We will not receive any of the proceeds from the sale of the shares of Class A common stock by the selling stockholders.
Following this offering, we will have three classes of common stock: Class A common stock, Class B common stock and Class C common stock. The rights of holders of Class A common stock, Class B common stock and Class C common stock will be identical except with respect to voting and conversion rights. Each share of Class A common stock will be entitled to one vote. Each share of Class B common stock will be entitled to twenty-five votes and will be convertible at any time into one share of Class A common stock. If we issue any shares of Class C common stock, they will be non-voting. The holders of our outstanding Class B common stock will hold approximately 98.0% of the voting power of our outstanding capital stock immediately following this offering.
We expect the public offering price to be between $27.00 and $31.00. Prior to this offering, there has been no public market for our Class A common stock. Our Class A common stock has been approved for listing on the New York Stock Exchange under the symbol "ATUS."
After the completion of this offering, we will be a "controlled company" within the meaning of the corporate governance standards of the New York Stock Exchange. See "Risk Factors" beginning on page 20 and "Management—Controlled Company" beginning on page 179 for additional information.
Investing in our Class A common stock involves risks that are described in the "Risk Factors" section beginning on page 20 of this prospectus.
|
||||
| |
Per Share |
Total |
||
|---|---|---|---|---|
Public offering price |
$ | $ | ||
Underwriting discount and commissions(1) |
$ | $ | ||
Proceeds, before expenses, to us |
$ | $ | ||
Proceeds, before expenses, to the selling stockholders |
$ | $ | ||
|
||||
- (1)
- See "Underwriting" beginning on page 235 for additional information regarding underwriting compensation.
The underwriters may also exercise their option to purchase up to an additional 5,172,414 shares of Class A common stock from the selling stockholders, at the public offering price, for 30 days after the date of this prospectus.
Neither the Securities and Exchange Commission nor any state securities commission has approved or disapproved of these securities or determined if this prospectus is truthful or complete. Any representation to the contrary is a criminal offense.
The underwriters expect to deliver the shares of Class A common stock to purchasers on or about , 2017.
| Joint Book-Running Managers | ||||||
J.P. Morgan |
Morgan Stanley |
Citigroup |
Goldman Sachs & Co. LLC |
|||
BofA Merrill Lynch |
Barclays |
BNP PARIBAS |
||
Credit Agricole CIB |
Deutsche Bank Securities |
RBC Capital Markets |
||
Co-Managers |
||||
Scotiabank |
SOCIETE GENERALE |
TD Securities |
||
The date of this prospectus is , 2017.


TABLE OF CONTENTS
You should rely only on the information contained in this prospectus and in any free writing prospectus prepared by or on behalf of us and delivered or made available to you. Neither we, the selling stockholders nor any of the underwriters have authorized anyone to provide you with additional or different information. We and the selling stockholders are offering to sell, and seeking offers to buy, shares of our Class A common stock only in jurisdictions where offers and sales are permitted. The information contained in this prospectus or a free writing prospectus is accurate only as of its date, regardless of its time of delivery or of any sale of shares of our Class A common stock. Our business, financial condition, operating results and prospects may have changed since that date.
Through and including , 2017 (the 25th day after the date of this prospectus), all dealers effecting transactions in these securities, whether or not participating in this offering, may be required to deliver a prospectus. This is in addition to a dealer's obligation to deliver a prospectus when acting as an underwriter and with respect to an unsold allotment or subscription.
i
Certain numerical figures included in this prospectus have been subject to rounding adjustments. Accordingly, such numerical figures shown as totals in various tables may not be arithmetic aggregations of the figures that precede them.
FOR INVESTORS OUTSIDE THE UNITED STATES
We, the selling stockholders and the underwriters are offering to sell, and seeking offers to buy, shares of our common stock only in jurisdictions where offers and sales are permitted. Neither we, the selling stockholders nor any of the underwriters have done anything that would permit this offering or possession or distribution of this prospectus in any jurisdiction where action for that purpose is required, other than in the United States. Persons outside of the United States who come into possession of this prospectus must inform themselves about, and observe any restrictions relating to, the offering of the shares of Class A common stock and the distribution of this prospectus outside of the United States.
TRADEMARKS, SERVICE MARKS AND TRADE NAMES
We own or have rights to use the trademarks, service marks and trade names that we use in connection with our businesses, such as Altice, Suddenlink, Optimum, Lightpath, Altice Media Solutions, Altice Labs, Altice Technical Services, News 12 Networks, News 12 Varsity and Audience Partners. Each trademark, service mark and trade name of any other company appearing in this prospectus is, to our knowledge, owned by such other company. Solely for convenience, the trademarks, service marks and trade names referred to in this prospectus are listed without the ® and ™ symbols, but such references are not intended to indicate in any way that we will not assert, to the fullest extent under applicable law, our rights or the rights of any applicable licensors to these trademarks, service marks and trade names.
Market and industry data and forecasts used in this prospectus have been obtained from independent industry sources. Some market data and statistical information contained in this prospectus are also based on management's estimates and calculations, which are derived from our review and interpretation of the independent sources, our internal market and brand research, our knowledge of the industry and public filings. Although we believe these sources to be reliable, we have not independently verified the data obtained from these sources and we cannot assure you of the accuracy or completeness of the data. Forecasts and other forward-looking information obtained from these sources are subject to the same qualifications and uncertainties as the other forward-looking statements contained in this prospectus.
ii
The following is a glossary of certain industry terms used throughout this prospectus:
| ARPU | Average monthly revenue per residential customer. | |
B2B |
Business-to-business, referring to business customers. |
|
Churn |
Customer attrition rate. |
|
CLEC |
Competitive Local Exchange Carrier. |
|
DBS |
Direct Broadcast Satellite. |
|
DOCSIS |
Data Over Cable Service Interface Specification. |
|
DSL |
Digital subscriber line. |
|
DVR |
Digital video recorder. |
|
FTTH |
Fiber-to-the-home. |
|
FTTT |
Fiber-to-the-tower. |
|
Gbps |
Gigabits per second. |
|
GPON |
Gigabit Passive Optical Network. |
|
HD |
High-definition. |
|
HFC |
Hybrid fiber-coaxial. |
|
Homes Passed |
Represents the estimated number of single residence homes, apartments and condominium units passed by the cable distribution network in areas serviceable without further extending the transmission lines. In addition, it includes commercial establishments that have connected to our cable distribution network. |
|
ILEC |
Incumbent Local Exchange Carrier. |
|
Mbps |
Megabits per second. |
|
MDU |
Multiple dwelling unit. |
|
MVPD |
Multichannel video programming distributor. |
|
Net additions |
Number of new customers less the number of customers who disconnect service. |
|
OTT |
Over-the-top; video programming and other content transmitted over the Internet. |
|
SIP |
Session Initiated Protocol. |
|
SMATV |
Satellite Master Antenna Television. |
|
SMB |
Small and medium-sized business. |
|
VOD |
Video-on-demand. |
|
VoIP |
Voice over Internet Protocol. |
|
U.S. industry peers |
Companies that operate incumbent HFC networks in the United States. |
iii
This summary highlights information about us and this offering presented in greater detail elsewhere in this prospectus. This summary is not complete and does not contain all the information you should consider before investing in our Class A common stock. You should read the entire prospectus carefully, especially the sections titled "Risk Factors" and "Management's Discussion and Analysis of Financial Condition and Results of Operations" and our consolidated financial statements and related notes included elsewhere in this prospectus, before investing in our Class A common stock. In this prospectus, the terms "Altice USA," "we," "us," "our" and the "Company" refer to Altice USA, Inc. and its consolidated subsidiaries, "Altice N.V." refers to our parent company, Altice N.V., and "Altice Group" refers to Altice N.V. and its consolidated subsidiaries. See "Industry Terms" for a glossary of certain abbreviations and terms used throughout this prospectus. Unless otherwise indicated, all information in this prospectus assumes no exercise of the underwriters' option to purchase additional shares of our Class A common stock. For more information regarding how we calculate the pro forma financial information presented in this section, please see "Unaudited Pro Forma Consolidated Financial Information."
Overview
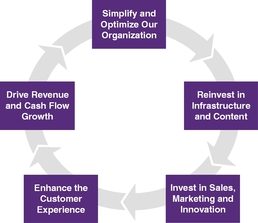
Altice USA is one of the largest broadband communications and video services providers in the United States. We deliver broadband, pay television, telephony services, Wi-Fi hotspot access, proprietary content and advertising services to approximately 4.9 million residential and business customers. Our footprint extends across 21 states through a fiber-rich broadband network with more than 8.5 million homes passed as of March 31, 2017. As the U.S. business of Altice N.V., we are driven at all levels by the "Altice Way"—our founder-inspired owner-operator culture and strategy of operational efficiency, innovation and long-term value creation for stockholders. In developing and implementing our strategy, we are focused on the following principles, which are part of the Altice Way:
- •
- Simplify and optimize our organization through streamlining business processes, centralizing
functions and eliminating non-essential operating expenses and service arrangements.
- •
- Reinvest in infrastructure and content, including upgrading our HFC network and building out a
FTTH network to strengthen our infrastructure capabilities and competitiveness.
- •
- Invest in sales, marketing and innovation, including brand-building, enhancing our sales
channels and automating provisioning and installation processes.
- •
- Enhance the customer experience by offering a technologically advanced customer platform
combined with superior connectivity and service across the customer lifecycle.
- •
- Drive revenue and cash flow growth through cross-selling, market share gains, new product launches and improvements in our operating and capital efficiency.
We believe the Altice Way, which has been successfully implemented across Altice Group, distinguishes us from our U.S. industry peers and competitors.
We acquired Cequel Corporation ("Suddenlink" or "Cequel") on December 21, 2015 and Cablevision Systems Corporation ("Optimum" or "Cablevision") on June 21, 2016. These acquisitions are referred to throughout this prospectus as the "Suddenlink Acquisition" (or the "Cequel Acquisition") and the "Optimum Acquisition (or the "Cablevision Acquisition"), respectively, and collectively as the "Acquisitions." We are a holding company that does not conduct any business operations of our own. We serve our customers through two business segments: Optimum, which operates in the New York metropolitan area, and Suddenlink, which principally operates in markets in the south-central United States. We have made significant progress in integrating the operations of Optimum and Suddenlink and are already realizing the operational and commercial benefits of
1
common ownership and one management team as we implement the Altice Way throughout our organization.
We are a majority-owned and controlled U.S. subsidiary of Altice N.V., the multinational cable, fiber, telecommunications, content, media and advertising company founded and controlled by communications and media entrepreneur Patrick Drahi. Our management team benefits from Altice Group's experience in implementing the Altice Way around the world. Mr. Drahi, who has over 25 years of experience owning and managing communications and media operations, has built Altice Group from a regional French cable company founded in 2002 into one of the world's leading broadband communications and video services companies. Over the past 15 years, he has led a transformation of the broadband communications and video services industry through investment in networks and improvements in customer experience and operations to enhance both service delivery and operational efficiency. As of December 31, 2016, Altice Group delivered broadband, pay television and telephony services to more than 50 million customers in Western Europe, the United States, Israel and the Caribbean and reported pro forma consolidated revenue of €23.5 billion and pro forma Adjusted EBITDA of €8.9 billion for the fiscal year ended December 31, 2016. Upon the completion of this offering, Altice N.V. (indirectly through CVC 3 B.V. ("CVC 3"), an indirect subsidiary of Altice N.V.), Neptune Holding US LP ("Holding LP"), a Delaware limited partnership controlled by CVC 3, Uppernext S.C.S.p. ("Uppernext"), an entity controlled by Mr. Drahi, and A4 S.A., an entity controlled by the family of Mr. Drahi, on a combined basis will own 75.2% of our issued and outstanding shares of common stock, which will represent 98.5% of the voting power of our outstanding capital stock. Altice N.V. and its subsidiaries, including CVC 3 and Holding LP, Uppernext and A4 S.A. are collectively referred to herein as the "Altice Parties."
In early 2015, Altice N.V. made the strategic decision to invest in operations in the United States, the country with the largest broadband communications and video services market in the world. Altice N.V. believed that by employing the Altice Way, it could significantly improve upon the historical growth rates, profitability and operational efficiency of broadband communications and video services companies operating in this market. The following attractive market characteristics underpinned Altice N.V.'s U.S. investment thesis:
- •
- favorable demographics supporting underlying market growth;
- •
- demand for higher-speed broadband services;
- •
- demand for more advanced customer platforms and user interfaces;
- •
- opportunities to enhance operational efficiency and reduce overhead; and
- •
- opportunities for further industry consolidation.
Following the Acquisitions, we began employing the Altice Way to simplify our organizational structure, reduce management layers, streamline decision-making processes and redeploy resources with a focus on network investment, customer service enhancements and marketing support. As a result, we have made significant progress in integrating the operations of Optimum and Suddenlink, centralizing our business functions, reorganizing our procurement processes, eliminating duplicative management functions, terminating lower-return projects and non-essential consulting and third-party service arrangements, and investing in our employee relations and our culture. Improved operational efficiency has allowed us to redeploy physical, technical and financial resources towards upgrading our network and enhancing the customer experience to drive customer growth. This focus is demonstrated by reduced network outages since the Acquisitions, which we believe improves the consistency and quality of the customer experience. In addition, we have expanded, and intend to continue expanding, our e-commerce channels for sales and marketing.
2
Since the Acquisitions, we have also upgraded our networks to nearly triple the maximum available broadband speeds we are offering to our Optimum customers and expanded our 1 Gbps broadband service to approximately 60% of our Suddenlink footprint, compared to approximately 40% prior to the Suddenlink Acquisition. In addition, we have commenced a five-year plan to build a FTTH network, which will enable us to deliver more than 10 Gbps broadband speeds across our entire Optimum footprint and part of our Suddenlink footprint. We believe this FTTH network will be more resilient with reduced maintenance requirements, fewer service outages and lower power usage, which we expect will drive further cost efficiencies in our business. In order to further enhance the customer experience, we plan to introduce a new home communications hub during the second quarter of 2017. Our new home communications hub will be an innovative, integrated platform with a dynamic and sophisticated user interface, combining a set-top box, Internet router and cable modem in one device, and will be the most advanced home communications hub offered by any Altice Group business. We are also beginning to offer managed data and communications services to our business customers and more advanced advertising services, such as targeted multi-screen advertising and data analytics, to our advertising and other business clients.
Many of our initiatives have already resulted in a positive impact to our customer relationships and financial results since the Acquisitions, as reflected in the year-over-year growth across the metrics in the following table:
| |
Three months ended March 31, | ||||||||||||||||||
|---|---|---|---|---|---|---|---|---|---|---|---|---|---|---|---|---|---|---|---|
| |
Altice USA | |
|
|
|
||||||||||||||
| |
Cablevision | Cequel | |||||||||||||||||
| |
|
Pro Forma 2016(a) |
|||||||||||||||||
(in thousands except percentage data)
|
2017 | 2017 | 2016(a) | 2017 | 2016 | ||||||||||||||
Customer Relationships |
4,913 | 4,859 | 3,148 | 3,125 | 1,765 | 1,734 | |||||||||||||
% growth |
1.1 | % | 0.7 | % | 1.8 | % | |||||||||||||
Revenue |
2,305,676 | 2,273,479 | 1,644,801 | 1,645,890 | 660,875 | 627,589 | |||||||||||||
% growth |
1.4 | % | (0.1 | )% | 5.3 | % | |||||||||||||
Adjusted EBITDA(b) |
941,736 | 743,588 | 627,073 | 480,859 | 314,662 | 262,729 | |||||||||||||
% growth |
26.6 | % | 30.4 | % | 19.8 | % | |||||||||||||
% of Revenue |
40.8 | % | 32.7 | % | 38.1 | % | 29.2 | % | 47.6 | % | 41.9 | % | |||||||
Adjusted EBITDA less capital expenditures(b) |
684,309 | 528,732 | 442,674 | 332,207 | 241,634 | 196,525 | |||||||||||||
% growth |
29.4 | % | 33.3 | % | 23.0 | % | |||||||||||||
% of Revenue |
29.7 | % | 23.3 | % | 26.9 | % | 20.2 | % | 36.6 | % | 31.3 | % | |||||||
Net loss attributable to stockholders |
(76,425 | ) | (190,075 | ) | (60,808 | ) | 94,377 | 14,739 | (32,329 | ) | |||||||||
% growth |
59.8 | % | (164.4 | )% | 145.6 | % | |||||||||||||
- (a)
- Includes
results for Newsday Media Group ("Newsday"). Altice USA sold a 75% stake in Newsday in July 2016. Newsday's revenue for the three months ended
March 31, 2016 was approximately $52 million.
- (b)
- For additional information regarding Adjusted EBITDA, including a reconciliation of Adjusted EBITDA to Net Loss, please refer to "Prospectus Summary—Summary Historical and Pro Forma Combined Financial Data."
Our Competitive Strengths
We believe the following competitive strengths have been instrumental to our success and position us for future growth and strong financial performance.
3
Our Owner-Operator Culture
We are part of a founder-controlled organization with an owner-operator culture and strategy that is focused on operational efficiency, innovation and long-term value creation for stockholders. This focus is reinforced by a system that delivers a substantial portion of management compensation in the form of long-term equity awards. Since the Acquisitions, our management team has moved quickly to, among other things, simplify and redesign our product offerings, drive adoption of higher broadband speeds and begin building a new FTTH network. We continuously challenge ourselves to improve our operational and financial performance. We encourage communication across the organization while empowering nimble, efficient decision-making that is focused at every level on enhancing the overall customer experience. We believe our owner-operator culture and the Altice Way differentiate us and position us to outperform our U.S. industry peers. We further believe the benefits of the Altice Way have been demonstrated by Altice N.V.'s performance, which is reflected in the 42% average annual total return of Altice N.V.'s Class A ordinary shares since its initial public offering in January 2014 through March 31, 2017, compared to the 5% average annual total return of the STOXX Europe 600 Telecommunications Index, of which Altice N.V.'s Class A ordinary shares are a component, during the same time period.
Leading Position in Attractive Markets
The markets served by our broadband networks have generally experienced higher levels of disposable income and household density compared to other broadband communications and video services markets in the United States. As of March 31, 2017, approximately 75% of the homes passed by our network were in either the New York metropolitan area or Texas. The following table provides a comparison of management's estimate of income and density metrics for our markets to both our largest U.S. publicly-traded industry peers as well as the national averages.
| |
Altice USA | Charter Communications |
Comcast | Cable One | U.S. National Median |
|||||||||||
|---|---|---|---|---|---|---|---|---|---|---|---|---|---|---|---|---|
2016 Household Median Income (in thousands) |
$ | 86 | $ | 63 | $ | 72 | $ | 59 | $ | 66 | ||||||
Housing Units per Square Mile as of April 1, 2010 based on most recent U.S. census data |
668 | 99 | 119 | 24 | 37 | |||||||||||
The footprint of our Optimum network includes New York City, the world's largest media and entertainment market as measured by 2014 revenue. This network represents our largest cluster of cable and fiber network systems. As of March 31, 2017, this network passed approximately 5.1 million homes and provided broadband, pay television and telephony services to approximately 3.1 million unique residential and business customers, representing approximately 64% of our entire customer base. We believe our leading market demographics support revenue growth potential in terms of customer additions and increased ARPU. We believe the market density of the New York metropolitan area allows our Optimum segment to operate with greater capital efficiency and lower capital expenditures as a percentage of revenue than our U.S. industry peers. Our presence in this market and its high-profile customer base also gives us access to a large and valuable base of advertisers, advertising inventory and advertising data, each of which supports growth prospects for our advertising business.
The footprint of our Suddenlink network includes markets in Texas, West Virginia, Louisiana, Arkansas, North Carolina, Oklahoma, Arizona, California, Missouri and eight other states. As of March 31, 2017, this network passed approximately 3.4 million homes and provided broadband, pay television and telephony services to approximately 1.8 million unique residential and business customers, representing approximately 36% of our customer base. We believe less than 15% of our
4
Suddenlink footprint currently faces competition from broadband communications and video services providers offering download speeds comparable to our fastest offered speeds. In addition, household penetration of residential broadband connections with speeds of at least 25 Mbps in these markets was less than 37% as of June 30, 2016 compared to approximately 48% nationwide, as estimated by management, providing us with attractive future growth opportunities. As a result, we believe Suddenlink's markets are among the most attractive broadband communications and video services markets in the United States.
Advanced Network and Customer Platform Technologies
Technological innovation and network investments are key components of the Altice Way. Substantially all of our HFC network is digital video and DOCSIS 3.0 compatible, with approximately 300 homes per node and a bandwidth capacity of at least 750 MHz throughout. This network allows us to provide our customers with advanced broadband, pay television and telephony services. In addition, we believe our Optimum footprint offers the densest Wi-Fi network among our U.S. industry peers as measured by the number of Wi-Fi hotspots per broadband subscriber. Since the Acquisitions, we have nearly tripled the maximum available broadband speeds we are offering to our Optimum customers from 101 Mbps to 300 Mbps for residential customers and 350 Mbps for business customers and have expanded our 1 Gbps broadband service to approximately 60% of our Suddenlink footprint from approximately 40% prior to the Suddenlink Acquisition.
Our advanced network has contributed to our revenue growth by allowing us to meet market demand for increasingly faster speeds. The chart below illustrates the significant increase in the percentage of our new residential customers choosing service plans with speeds greater than or equal to 100 Mbps since the Acquisitions.
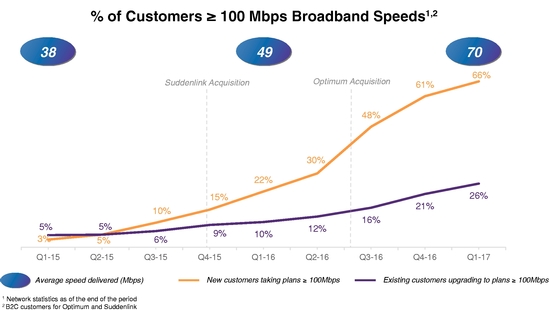
|
To position us to satisfy anticipated market demand for increasing speeds and support evolving technologies, such as the expected transition of mobile networks to 5G, and to enable us to capture associated revenue growth opportunities, we have commenced a five-year plan to build a FTTH network that will enable us to deliver more than 10 Gbps broadband speeds across our entire Optimum footprint and part of our Suddenlink footprint.
We also plan to introduce a new home communications hub during the second quarter of 2017, which will be the most advanced home communications hub offered by any Altice Group business. This new hub will be an innovative, integrated platform with a dynamic and sophisticated user interface,
5
combining a set-top box, Internet router and cable modem in one device. It is based on LaBox, a home communications hub Altice Group has successfully deployed in France, the Dominican Republic and Israel, and will be initially offered to customers subscribing to our triple product packages. It will be capable of delivering broadband, Wi-Fi, pay television services, OTT services and fixed-line telephony and will support 4K video and a remote DVR. We intend to continue enhancing the features and functionality of our new home communications hub after its initial introduction.
We believe the development of our advanced network and new home communications hub epitomizes the engineering and innovation-centric ethos within Altice Group.
Customer-Centric Operating and Service Model Supported by Technology and Data Analytics
We seek to provide our customers with the best connectivity and service experience available. This customer-centric approach drives our decision-making processes and is another key component of the Altice Way. Through investments in our information technology ("IT") platforms and a focus on process improvement, we have simplified and harmonized our service offering bundles, and improved our technical service delivery and our customer service. We are investing in our sales channels, including enhancing our e-commerce channels in response to customer behavior. While inbound sales remain the largest sales channel for each of Optimum and Suddenlink, our e-commerce channels' share of new sales has grown substantially since the Acquisitions. We develop, monitor and analyze detailed customer metrics to identify root-causes of customer dissatisfaction and to further improve the customer experience. Taken together, we believe these initiatives will further reduce calls and service visits, increase customer satisfaction and strengthen our top-line performance and cash flow generation.
Benefits of a Global Communications Group
Unlike most of our U.S. industry peers, we benefit from being part of an international media and communications group. As the U.S. business of Altice N.V., we have access to the innovation, management expertise and best practices developed and tested in other Altice Group markets such as France, Portugal, the Dominican Republic and Israel. For example, our new home communications hub will be based on LaBox, which was developed by Altice Labs, Altice N.V.'s technology, services and operations innovation center, and our FTTH network build-out will leverage Altice Labs' technology and expertise developed for the deployment of GPON technology in Altice Group's fiber networks. Our B2B service offerings draw from platforms, services and expertise developed by sophisticated B2B operators across the Altice Group footprint such as Portugal Telecom in Portugal and SFR in France. We also benefit from Altice Group's significant scale advantages, allowing us to draw on centralized functions, including procurement and technical services. In addition, Altice Group operates converged networks, including wireless operations in markets outside the United States. We believe these scale benefits and operational expertise assist us in increasing our operating efficiency and reducing our capital expenditures while also improving the customer experience.
Altice Group also cross-deploys talent and expertise across its businesses, allowing us to benefit from our senior management's experience in successfully implementing the Altice Way around the world. We believe this diversity of experience differentiates us from our more traditional U.S.-centric industry peers.
Strategic Focus on Operational Efficiency
An important principle of the Altice Way is leveraging operational efficiency in order to invest in network improvements and increase returns. We believe our focus on simplifying customer service offerings and streamlining and improving our operations through an intense focus on efficiency is unmatched by our U.S. industry peers. We continuously strive to remove unnecessary management layers, streamline decision-making processes, trim excess costs and question whether our current
6
methodologies are indeed the most efficient. For example, the home installation, repair, outside plant maintenance and network construction elements of our business have been reorganized under Altice Technical Services ("ATS"), Altice N.V.'s services organization in the United States. We believe this reorganization will allow us to focus on our core competencies and realize operational cost efficiencies. The financial resources created by these strategies allow us to invest in network improvements and customer experience enhancements. We believe the operating and financial benefits that result from our focus on operational efficiency will continue to give us a competitive advantage against our competitors and U.S. industry peers.
Powerful Financial Model Driving Strong Returns
We believe the benefits of the Altice Way have already significantly strengthened our financial performance and will continue to do so, allowing us to deliver strong returns.
Our revenue growth for the three months ended March 31, 2017 was 1.4% as compared to pro forma revenue for the three months ended March 31, 2016. Excluding Newsday, our year-over-year revenue growth for the three months ended March 31, 2017 was 3.8%. We believe we can continue growing our revenue by increasing market penetration of our services (particularly broadband), driving continued growth in B2B services, launching new services, gaining market share from competitors due to the high quality and value of our services and leveraging improved customer satisfaction to sell additional services.
We believe we are one of the most profitable and cash flow generative broadband communications and video services providers in the United States. Our Adjusted EBITDA margin has increased from 32.7% for the three months ended March 31, 2016 on a pro forma basis giving effect to the Optimum Acquisition to 40.8% for the three months ended March 31, 2017. Combined with our revenue growth, this translates into a 27% year-over-year Adjusted EBITDA growth. See "Summary Historical and Pro Forma Financial Data" for additional information regarding Adjusted EBITDA, including a reconciliation of Adjusted EBITDA to net income.
As of March 31, 2017, based on an analysis of our current operating expenses, we believe we have realized a substantial portion of the total $1.1 billion in operating cost savings we announced that we would achieve over the three-year period following the Acquisitions. Our analysis compares the full year 2015 combined operating expenses of Cablevision and Cequel to the operating expenses of the Company for the quarter ended March 31, 2017, annualized. We believe we have been successful in achieving these cost savings on an expedited basis by delayering management, eliminating non-essential operating expenses and service arrangements and rationalizing our supplier relationships. Management's focus on these initiatives has resulted in cost savings that are primarily reflected in our Other Operating Expenses line item. See "Management's Discussion and Analysis of Financial Condition and Results of Operations" for more information.
For the three months ended March 31, 2017, our capital expenditures as a percentage of revenue was 11.2%, which we believe is one of the lowest among our U.S. industry peers, even as we increased our investments in network and service capabilities. The ratio of our Adjusted EBITDA less capital expenditures to revenue for the three months ended March 31, 2017 was 30%, implying that for each dollar of revenue that we realized in that quarter we generated approximately $0.30 of Adjusted EBITDA less capital expenditures, which we believe exceeds the performance of our U.S. industry peers. We believe our profitability, capital efficiency and cash generation profile, which is among the highest in the industry, results from a number of factors, including our focus on operational efficiency derived from the Altice Way, the advanced state of our HFC network infrastructure, our highly clustered network footprint and our customer base with relatively high ARPU and low churn.
7
Experienced Management Team Supported by Founder
Our CEO and Co-Presidents have substantial experience in communications and media operations, finance and mergers and acquisitions, and a proven track record in executing the Altice Way. Dexter Goei, our CEO and Chairman since 2016, joined Altice N.V. in 2009, and as its CEO he spearheaded the rapid expansion of the company from a French cable operator to a multinational communications enterprise with fixed and mobile assets across six different countries. A key aspect of Mr. Goei's role as CEO of Altice USA is to carry forward the same entrepreneurial and owner-operator culture that is at the core of the Altice Way and Altice N.V.'s success. Abdelhakim Boubazine, our Co-President and COO since 2015, was previously the CEO of Altice Group's Dominican Republic business, where he oversaw pay television, broadband and mobile operations for more than four million customers. Charles Stewart, our Co-President and CFO since 2015, previously served as CEO of Itau BBA International plc, where he oversaw Itau-Unibanco's wholesale banking activities in Europe, United States and Asia. Prior to that, he spent nineteen years at Morgan Stanley in a variety of investment banking roles including nine years focused on the U.S. cable industry. Our management team operates in a coordinated fashion with Altice N.V.'s management team and is supported by Altice Group's founder and controlling stockholder, Mr. Drahi. We believe this facilitates a flat corporate structure, speed in decision making and a focus on long-term value creation.
Our Business Strategy
Our business strategy is based on the successful Altice Way. By executing on the principles described below, we aim to provide advanced, innovative broadband, pay television and telephony services to our customers and deliver strong returns to our stockholders.
Simplify and Optimize Our Organization
Since the Acquisitions, we have implemented the Altice Way across our organization to streamline processes and service offerings and to improve productivity by centralizing our business functions, reorganizing our procurement processes, eliminating duplicative management functions and overhead, terminating lower-return projects and non-essential consulting and third-party service arrangements, and investing in our employee relations and our culture. This has resulted in a revitalized organization as well as improved financial performance, which we are leveraging to re-invest in our business. We are also reorganizing and simplifying our customer service, programming and data analytics; using ATS to increase quality, efficiency and productivity; and updating and simplifying our IT infrastructure through further investments and integration.
8
Reinvest in Infrastructure and Content
Our entire Optimum footprint is upgraded to deliver broadband speeds of up to 300 Mbps for residential customers and up to 350 Mbps for business customers, and we have expanded our 1 Gbps broadband service to approximately 60% of our Suddenlink footprint, compared to approximately 40% prior to the Suddenlink Acquisition. In addition, we have commenced a five-year plan to build a FTTH network, which will enable us to deliver more than 10 Gbps broadband speeds across our entire Optimum footprint and part of our Suddenlink footprint. We believe we can carry out this network build-out efficiently and within our current capital expenditure levels because of (i) the proximity of fiber to our end customers in our existing network; (ii) our access to Altice Labs' experience and expertise in deploying GPON for its FTTH projects in other markets; (iii) our favorable network topology that is over 75% aerial; and (iv) the lower unit construction costs available to us through ATS. We believe our FTTH investment will further prepare us for the future by enabling us to provide our residential and business customers with technologically advanced services and increased network reliability, while providing us with lower operating costs and opportunities for new revenue sources. For instance, we believe our FTTH investment will offer significant strategic value as the mobile and fixed network environments continue to converge, particularly as mobile operators deploy 5G and subsequent mobile networks.
Our reinvestment in content has focused on the news category with ongoing investments in our hyper-local news channel News12, our 25% investment in the U.S. operations of i24 News, the Altice Group global news network that was launched in the United States in February 2017, and our 25% interest in Newsday, a daily newspaper that primarily serves Long Island. In addition, we are evaluating opportunities to deploy other content assets owned by Altice Group.
Invest in Sales, Marketing and Innovation
We are reinvesting in our sales channels, including enhancing our e-commerce channels such as Optimum.com and Suddenlink.com, and developing e-commerce-only promotions. For the three months ended March 31, 2017, 26% and 14% of our gross adds were via our online sales channel for Suddenlink and Optimum, respectively, compared to 16% and 4% for the three months ended March 31, 2016. We are also focused on building our brand to emphasize the quality of our services by developing Optimum Experience retail stores in shopping malls and other high-traffic locations.
We seek to innovate across many areas of our business. For our residential customers, this includes our focus on new customer platforms and faster data speeds. For our business customers, we are introducing new value-added managed services while for our advertising clients we offer advanced, targeted and multi-screen advertising services and data analytics using our proprietary data and the advanced technology platforms that we have developed and acquired.
We are also focused on simplifying our bundled offerings and standardizing our pricing structures. Since the Optimum Acquisition we have reduced the number of Optimum bundles by approximately 50% and since the Suddenlink Acquisition we have reduced the number of Suddenlink pricing structures by approximately 80%.
Enhance the Customer Experience
We intend to deliver a superior customer experience through implementation of the Altice Way. First, we aim to offer the most technologically advanced customer platforms, including our new home communications hub, which is an innovative, integrated platform with a dynamic and sophisticated user interface combining a set-top box, Internet router and cable modem in one device. Second, by leveraging our advanced infrastructure (with more than 8.5 million homes passed and approximately 1.8 million Wi-Fi hotspots as of March 31, 2017), we seek to provide our customers with a bandwidth and connectivity experience superior to what our competition offers. We believe our FTTH network
9
build-out will further enhance our infrastructure position, improve service reliability for our customers and lower our maintenance costs. Third, we strive to provide the best service across the customer lifecycle from point of sale to installation and customer care. A key aspect of this initiative is to link internal sales incentives to metrics tied to the length of a new customer relationship and product mix, as opposed to more traditional criteria of new sales, in order to refocus our organization away from churn retention to churn prevention. For example, the number of technical service calls handled by our representatives in March 2017 was 27% lower compared to March 2016 while the number of customer service calls and the number of service visits handled by our representatives was 23% and 20% lower, respectively, over the same period.
Drive Revenue and Cash Flow Growth
Since the Acquisitions, we have made significant progress in improving our growth in revenue, Adjusted EBITDA and cash flow and believe we have additional opportunities to drive continued growth in these financial metrics based on the following factors:
- •
- continued market demand for our bundled services, particularly broadband driven by increased data consumption and bandwidth requirements;
- •
- focus on selling and cross-selling higher value and more enriched service offerings to our residential and business customers, as well as the
introduction of new services leveraging our advanced HFC and FTTH networks;
- •
- market share gains driven by product innovation and the quality and value of our services;
- •
- focus on connectivity, business and advertising services;
- •
- improvements in our operating and capital efficiency through continued implementation of the Altice Way;
and
- •
- opportunities to further improve our capital structure.
Opportunistically Grow Through Value-Accretive Acquisitions
We intend to opportunistically grow through value-accretive acquisitions. Our controlling stockholder, Altice N.V., has made over 30 acquisitions since its inception in 2002, including the Acquisitions. We believe Altice N.V. has consistently demonstrated an ability to acquire and effectively integrate companies, realize efficiencies and cost synergies, improve revenue trends and grow Adjusted EBITDA and Adjusted EBITDA less capital expenditures. In the five largest acquisitions completed by Altice N.V. over the last five years, SFR, Portugal Telecom, Orange Dominicana, Optimum and Suddenlink, it has increased Adjusted EBITDA margin on average by approximately 7 percentage points between the quarter immediately preceding the closing of the applicable acquisition and the three months ended March 31, 2017. Altice N.V.'s track record of creating value through acquisitions is also reflected in the 32% average annual total return of SFR's ordinary shares since its initial public offering in November 2013 until March 31, 2017, compared to the 5% average annual total return of the STOXX Europe 600 Telecommunications Index, of which SFR's ordinary shares are a component, during the same time period. We believe the U.S. broadband communications and video services market offers a number of attractive opportunities to grow our business through strategic acquisitions. We believe the Altice Way and our related ability to achieve efficiencies and cost synergies following acquisitions provide us with a competitive advantage in such future consolidation opportunities. However, there is no assurance that we would be able to achieve similar results or that any such acquisitions would have a similar impact on our stock price performance.
10
Risks Affecting Our Business
Investing in our Class A common stock involves a high degree of risk. There are a number of risks you should carefully consider before investing in our Class A common stock. These risks are discussed more fully under "Risk Factors" beginning on page 20 of this prospectus, and include, but are not limited to:
- •
- If we are unable to successfully compete in our highly competitive business environment, where we face rapid changes in technology, consumer
expectations and behavior, including significant unanticipated increases in the use of bandwidth-intensive Internet-based services, our ability to attract new subscribers, and retain current
subscribers, may be adversely impacted.
- •
- Programming and retransmission costs are increasing and we may not have the ability to pass these increases on to our subscribers. Disputes
with programmers and the inability to retain or obtain popular programming can adversely affect our relationship with subscribers and lead to subscriber losses.
- •
- If we do not successfully implement our growth strategy, including completing our capital investment plans on time and on budget, such as the
build-out of our FTTH network, and the deployment of our new home communications hub, our business, financial condition, results of operations and liquidity could be materially adversely affected.
- •
- We are highly leveraged and have substantial indebtedness, and our ability to incur additional indebtedness and use our funds is limited by
significant restrictive covenants in financing agreements. We will need to raise significant amounts of funding over the next several years to fund capital expenditures, repay existing obligations and
meet other obligations. We may also engage in extraordinary transactions that involve the incurrence of large amounts of indebtedness.
- •
- The financial markets are subject to volatility and disruptions, which have in the past, and may in the future, adversely affect our business,
including by affecting the cost of new capital and our ability to fund acquisitions or other strategic transactions. We have in past periods incurred substantial losses from continuing operations, and
we may do so in the future, which may reduce our ability to raise needed capital.
- •
- We rely on network and information systems for our operations and a disruption or failure of, or defects in, those systems may disrupt our
operations, damage our reputation with customers and adversely affect our results of operations. Our business depends on intellectual property rights and on not infringing on the intellectual property
rights of others.
- •
- Our business is subject to extensive governmental legislation and regulation, which could adversely affect our business, increase our
operational and administrative expenses and limit our revenues.
- •
- The tri-class structure of our common stock has the effect of concentrating voting control with Altice N.V. and its affiliates and
shares of Class B common stock will not automatically convert to shares of Class A common stock upon transfer to a third party. Holders of a single series of our common stock may not
have any remedies if an action by our directors has an adverse effect on only that series of our common stock.
- •
- Altice N.V. and Mr. Drahi will continue to control us and their interests may conflict with ours or yours in the future. Certain of our
overlapping directors and officers have relationships with Altice N.V., which may result in the diversion of corporate opportunities and other conflicts with respect to our business and
executives.
- •
- We will be a "controlled company" within the meaning of the rules of the New York Stock Exchange ("NYSE"), and will qualify for, and intend to rely on, exemptions from certain
11
corporate governance requirements that would otherwise provide protection to stockholders of other companies.
Ownership and Organization
Prior to this offering, Altice USA was owned 90% by CVC 3 and 10% by Holding LP. As described below under "Organizational Transactions," in connection with this offering, a number of transactions will be undertaken. As a result of these organizational transactions, immediately prior to the completion of this offering, Altice USA will be owned 67.6% by Altice N.V. (indirectly through CVC 3); 1.0% by Uppernext; less than 0.01% by A4 S.A.; 7.8% by Holding LP (4.05% is attributable to Neptune Management LP ("Management LP") in connection with the Carry Unit Plan (as defined herein) and 3.78% is attributable to Altice N.V. (indirectly through CVC 3)); 14.0% by funds advised by BC Partners LLP ("BCP"); 9.1% by entities affiliated with the Canada Pension Plan Investment Board ("CPPIB" and together with BCP, the "Sponsors"); and 0.4% by Altice USA executive officers and directors and 0.1% by other Altice USA management.
BCP is a leading international private equity firm with advised funds of over €12 billion. Established in 1986, the firm operates as an integrated team through offices in Europe and North America to acquire and develop businesses and create value in partnership with management. Since inception, BCP has completed 93 acquisitions with a total enterprise value of approximately €115 billion, demonstrating discipline in bull markets and an ability to invest in attractive opportunities amidst turbulence and recession. BCP has a long and distinguished history of partnering with numerous companies in the Technology, Media, and Telecom space including Com Hem, Springer, Cartrawler, Mergermarket and Intelsat.
CPPIB is a sophisticated, global institutional investor, managing a fund that ranks among the world's 10 largest retirement funds. It invests the funds not needed by the Canada Pension Plan to pay current benefits on behalf of 20 million contributors and beneficiaries. Headquartered in Toronto, with offices in Hong Kong, London, Luxembourg, Mumbai, New York, São Paulo and Sydney, CPPIB is governed and managed independently of the Canada Pension Plan and at arm's length from governments. At March 31, 2017, the Fund's assets totaled C$317 billion, of which approximately C$39 billion is invested through the Private Investments group. CPPIB's Private Investments team manages investment activities in Direct Private Equity, Principal Credit, and Natural Resources. Direct Private Equity manages an approximately C$18 billion portfolio of investments and focuses on majority- or shared-control investments across multiple industry sectors worldwide. Current and previous technology and telecom investments include Suddenlink Communications, Informatica, Asurion, IMS Health and Skype, among others.
Organizational Transactions
Prior to the closing of this offering, the following organizational transactions will be consummated:
- •
- we will amend and restate our certificate of incorporation to, among other things, provide for Class A common stock, Class B
common stock and Class C common stock;
- •
- the Sponsors and Uppernext will exchange their indirect ownership interest in the Company for shares of the Company's common stock;
- •
- Management LP will redeem its Class B units for shares of the Company's common stock that it receives from the redemption of its
Class B units in Holding LP;
- •
- Uppernext will sell shares of the Company's common stock to A4 S.A.;
- •
- $525 million aggregate principal amount of notes issued by the Company to the Sponsors (together with accrued and unpaid interest and applicable premium) will be converted into shares of the Company's common stock at the initial public offering price;
12
- •
- $1,225 million aggregate principal amount of notes issued by the Company to a subsidiary of Altice N.V. (together with accrued
and unpaid interest and applicable premium) will be transferred to CVC 3 and then converted into shares of the Company's common stock at the initial public offering price;
- •
- the Sponsors will transfer a portion of their shares of the Company's common stock to an affiliate of Altice N.V. as payment in
connection with certain carried interests in the Sponsor's investments in the Company (such affiliate of Altice N.V. will subsequently transfer the shares of the Company's common stock to CVC
3);
- •
- the Sponsors, Holding LP, A4 S.A. and former Class B unitholders of Management LP (including Uppernext) will exchange
shares of the Company's common stock for shares of the Company's Class A common stock; and
- •
- CVC 3 and A4 S.A. will exchange shares of the Company's common stock for shares of the Company's Class B common stock.
The above transactions will occur after the date of this prospectus and prior to the closing of this offering and are collectively referred to as the "Organizational Transactions."
The following diagram shows our organizational structure after giving effect to the Organizational Transactions and this offering, assuming no exercise by the underwriters of their option to purchase additional shares of Class A common stock.
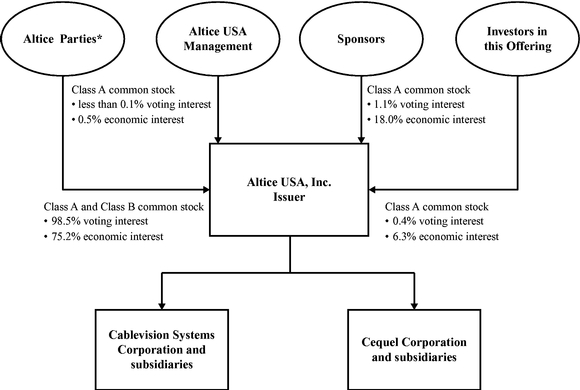
- *
- Altice N.V. (indirectly through CVC 3 and Holding LP), Uppernext and A4 S.A.
Company Information
We were incorporated in Delaware on September 14, 2015. Our principal executive office is located at 1111 Stewart Avenue, Bethpage, NY 11714. Our telephone number at that address is (516) 803-2300. Our website address is www.alticeusa.com. Information on our and our subsidiaries' websites or Twitter feeds, the Altice N.V. website or Twitter feed, or any Altice N.V. filing, is deemed
13
not to be a part of this prospectus and inclusions of websites and Twitter feeds are inactive textual references only.
Pre-IPO Distribution
Prior to the closing of this offering, we will make a cash distribution of approximately $670 million to our stockholders, which will be funded by borrowings of $500 million under the CVC Revolving Credit Facility (as defined herein) and approximately $170 million of cash on hand (collectively, the "Pre-IPO Distribution").
14
Class A common stock offered by us |
12,068,966 shares. | |
Class A common stock offered by the selling stockholders |
34,482,759 shares. |
|
Underwriters' option |
5,172,414 shares. |
|
Class A common stock outstanding after this offering* |
246,750,944 shares. |
|
Class B common stock outstanding after this offering* |
490,318,022 shares. |
|
Class C common stock outstanding after this offering |
None. |
|
Total Class A and Class B common stock outstanding after this offering |
737,068,966 shares. |
|
Use of proceeds |
We estimate that the net proceeds to us from this offering, after deducting the underwriting discount and estimated offering expenses payable by us, will be approximately $330.95 million, based on an assumed initial public offering price of $29.00 per share, the mid-point of the price range set forth on the cover page of this prospectus. |
|
|
We will not receive any proceeds from the sale of shares by the selling stockholders. |
|
|
We currently intend to use the net proceeds that we receive from this offering to redeem a portion of the $2 billion aggregate principal amount outstanding of the 10.875% Senior Notes due 2025 ("CSC 2025 Senior Notes") issued by CSC Holdings, LLC ("CSC Holdings"), our wholly-owned subsidiary. At any time prior to October 15, 2018, CSC Holdings may redeem up to 40% of the original aggregate principal amount of the CSC 2025 Senior Notes with the proceeds of certain equity offerings at a redemption price of 110.875% of the principal amount, together with accrued and unpaid interest, if any, to, but excluding, the date of redemption. See "Description of Certain Indebtedness—Cablevision Bonds—CSC Holdings Notes." |
|
|
See "Use of Proceeds." |
|
Directed share program |
At our request, the underwriters have reserved up to 5% of the common stock being offered by this prospectus for sale at the initial public offering price to our directors and officers, our employees, employees of ATS and certain employees of Altice N.V. and its subsidiaries. The sales will be made by Morgan Stanley & Co. LLC, an underwriter of this offering, and its affiliates through a directed share program. We do not know if these persons will choose to purchase all or any portion of these reserved shares, but any purchases they do make will reduce the number of shares available to the general public. Any reserved shares not so purchased will be offered by the underwriters to the general public on the same terms as the other shares of common stock offered by this prospectus. Any shares purchased by our directors and officers in the directed share program will be subject to a 180-day lock-up period, and any shares purchased by other persons in our directed share program will be subject to a 35-day lock-up period. |
15
Risk factors |
Investing in our Class A common stock involves a high degree of risk. There are a number of risks you should consider before investing in our Class A common stock. These risks are discussed more fully under "Risk Factors" beginning on page 20 of this prospectus. |
|
Dividend policy |
We currently intend to retain any future earnings to fund the operation, development and expansion of our business and do not intend to pay any dividends on our Class A or Class B common stock. Any future determination relating to our dividend policy will be made in the sole and absolute discretion of our board of directors and will depend upon then existing conditions, including our financial condition, results of operations, contractual restrictions, capital requirements, business prospects and other factors that our board of directors may deem relevant. See "Dividend Policy" and "Description of Certain Indebtedness." |
|
Voting rights |
Following this offering, we will have three classes of common stock: Class A common stock, Class B common stock and Class C common stock. Each share of Class A common stock will be entitled to one vote. Each share of Class B common stock will be entitled to twenty-five votes and will be convertible at any time into one share of Class A common stock. If we issue any shares of Class C common stock, they will be non-voting. The holders of our outstanding Class B common stock will hold approximately 98.0% of the voting power of our outstanding capital stock immediately following this offering. |
|
NYSE symbol |
Our Class A common stock has been approved for listing on the NYSE under the symbol "ATUS." |
- *
- Based on an assumed initial public offering price of $29.00, the mid-point of the price range set forth on the cover page of this prospectus. If the initial public offering is $27.00, the low end of the price range set forth on the cover page of this prospectus, the Class A common stock and Class B common stock outstanding after this offering would be 247,163,184 and 489,905,782, respectively. If the initial public offering is $31.00, the high end of the price range set forth on the cover page of this prospectus, the Class A common stock and Class B common stock outstanding after this offering would be 246,391,895 and 490,677,071, respectively.
Unless otherwise indicated, the information presented in this prospectus:
- •
- assumes the shares of our Class A common stock to be sold in this offering are sold at $29.00 per share, the mid-point of the price
range set forth on the cover page of this prospectus;
- •
- assumes no exercise of the underwriters' option to purchase additional shares; and
- •
- all share numbers reflect the Organizational Transactions, as defined in "Summary—Ownership and Organization—Organizational Transactions."
16
SUMMARY HISTORICAL AND PRO FORMA FINANCIAL DATA
The summary consolidated historical balance sheet and operating data of Altice USA for the year ended December 31, 2016 presented below have been derived from the audited consolidated financial statements of Altice USA included elsewhere herein. The summary consolidated historical balance sheet and operating data of Altice USA as of and for the three months ended March 31, 2017 and 2016 presented below have been derived from the unaudited condensed consolidated financial statements of Altice USA included elsewhere herein. The historical operating data of Altice USA for the year ended December 31, 2016 include the operating results of Cequel for the year ended December 31, 2016 and the operating results of Cablevision for the period from the date of acquisition, June 21, 2016, through December 31, 2016. The consolidated pro forma operating data of Altice USA for the year ended December 31, 2016 and the three months ended March 31, 2016 have been derived from the unaudited pro forma consolidated statements of operations included in this prospectus and give effect to the Cablevison Acquisition as if it had occurred on January 1, 2016.
The summary historical and pro forma results presented below are not necessarily indicative of the results to be expected for any future period. This information should be read in conjunction with the audited consolidated financial statements of Altice USA, the unaudited pro forma consolidated statements of operations of Altice USA, and Management's Discussion and Analysis of Financial Condition and Results of Operations of Altice USA included elsewhere herein.
| |
Altice USA | Altice USA | ||||||||||||||
|---|---|---|---|---|---|---|---|---|---|---|---|---|---|---|---|---|
| |
Three months ended March 31, | Year ended December 31, | ||||||||||||||
| |
2017 | 2016 | 2016 | 2016 | 2016 | |||||||||||
| |
Historical | Pro Forma | Historical | Pro Forma | Historical | |||||||||||
| |
(dollars in thousands) |
|||||||||||||||
Revenue: |
||||||||||||||||
Residential: |
||||||||||||||||
Pay TV |
$ | 1,071,361 | $ | 1,054,058 | $ | 279,737 | $ | 4,227,222 | $ | 2,759,216 | ||||||
Broadband |
611,769 | 547,680 | 196,690 | 2,290,039 | 1,617,029 | |||||||||||
Telephony |
210,873 | 221,012 | 39,735 | 872,115 | 529,973 | |||||||||||
Business services and wholesale |
319,591 | 300,855 | 84,404 | 1,230,643 | 819,541 | |||||||||||
Advertising |
79,968 | 79,364 | 20,887 | 365,429 | 245,702 | |||||||||||
Other(a) |
12,114 | 70,510 | 6,136 | 169,368 | 45,751 | |||||||||||
| | | | | | | | | | | | | | | | | |
Total revenue |
2,305,676 | 2,273,479 | 627,589 | 9,154,816 | 6,017,212 | |||||||||||
Operating expenses: |
||||||||||||||||
Programming and other direct costs |
758,352 | 767,825 | 189,595 | 2,988,549 | 1,899,994 | |||||||||||
Other operating expenses |
613,437 | 776,764 | 175,265 | 2,853,821 | 1,716,851 | |||||||||||
Restructuring and other expense (credits) |
76,929 | 8,606 | 7,569 | 229,774 | 240,395 | |||||||||||
Depreciation and amortization |
608,724 | 636,061 | 200,900 | 2,484,284 | 1,700,306 | |||||||||||
| | | | | | | | | | | | | | | | | |
Operating income |
248,234 | 84,223 | 54,260 | 598,388 | 459,666 | |||||||||||
Other non-operating expenses, net |
(370,330 | ) | (382,203 | ) | (269,403 | ) | (1,769,940 | ) | (1,550,811 | ) | ||||||
| | | | | | | | | | | | | | | | | |
Loss from continuing operations before income taxes |
(122,096 | ) | (297,980 | ) | (215,143 | ) | (1,171,552 | ) | (1,091,145 | ) | ||||||
Income tax benefit |
45,908 | 107,839 | 74,395 | 450,295 | 259,666 | |||||||||||
| | | | | | | | | | | | | | | | | |
Loss from continuing operations, net of income taxes |
(76,188 | ) | (190,141 | ) | (140,748 | ) | (721,257 | ) | (831,479 | ) | ||||||
Loss from discontinued operations, net of income taxes |
— | — | — | — | — | |||||||||||
| | | | | | | | | | | | | | | | | |
Net loss |
(76,188 | ) | (190,141 | ) | (140,748 | ) | (721,257 | ) | (831,479 | ) | ||||||
Net income attributable to noncontrolling interests |
(237 | ) | 66 | — | (315 | ) | (551 | ) | ||||||||
| | | | | | | | | | | | | | | | | |
Net loss attributable to Altice USA stockholders |
$ | (76,425 | ) | $ | (190,075 | ) | $ | (140,748 | ) | $ | (721,572 | ) | $ | (832,030 | ) | |
| | | | | | | | | | | | | | | | | |
| | | | | | | | | | | | | | | | | |
| | | | | | | | | | | | | | | | | |
Adjusted EBITDA(b) |
$ | 941,735 | $ | 743,588 | 262,729 | $ | 3,352,045 | $ | 2,414,735 | |||||||
| | | | | | | | | | | | | | | | | |
| | | | | | | | | | | | | | | | | |
| | | | | | | | | | | | | | | | | |
Adjusted EBITDA margin |
40.8 | % | 32.7 | % | 41.9 | % | 36.6 | % | 40.1 | % | ||||||
Capital Expenditures |
$ | 257,427 | $ | 214,856 | $ | 66,204 | $ | 955,672 | $ | 625,541 | ||||||
| | | | | | | | | | | | | | | | | |
| | | | | | | | | | | | | | | | | |
| | | | | | | | | | | | | | | | | |
Capital expenditures as a percentage of revenue |
11.2 | % | 9.5 | % | 10.5 | % | 10.4 | % | 10.4 | % | ||||||
Adjusted EBITDA less capital expenditures |
$ | 684,308 | $ | 528,732 | 196,525 | $ | 2,396,373 | $ | 1,789,194 | |||||||
| | | | | | | | | | | | | | | | | |
| | | | | | | | | | | | | | | | | |
| | | | | | | | | | | | | | | | | |
Adjusted EBITDA less capital expenditures as a percentage of revenue |
29.7 | % | 23.3 | % | 31.3 | % | 26.2 | % | 29.7 | % | ||||||
- (a)
- Other
revenue, on a pro forma basis, for the three months ended March 31, 2016 and for the year ended December 31, 2016 includes revenue recognized by
Newsday (through July 7, 2016, for the annual period). Other revenue, on an actual basis, for the year ended December 31, 2016 includes revenue recognized by Newsday for the period
June 21, 2016, the Cablevision Acquisition Date, through July 7, 2016, the date the Company sold a 75% interest in Newsday and ceased consolidating its operating results.
- (b)
- We define Adjusted EBITDA, which is a non-GAAP financial measure, as net income (loss) excluding income taxes, income (loss) from discontinued operations, other non-operating income or expenses, loss on extinguishment of debt and write-off of deferred financing costs,
17
loss on interest rate swap contracts, gain (loss) on equity derivative contracts, gain (loss) on investments, interest expense (including cash interest expense), interest income, depreciation and amortization (including impairments), share-based compensation expense or benefit, restructuring expense or credits and transaction expenses. We believe Adjusted EBITDA is an appropriate measure for evaluating the operating performance of the Company. Adjusted EBITDA and similar measures with similar titles are common performance measures used by investors, analysts and peers to compare performance in our industry. Internally, we use revenue and Adjusted EBITDA measures as important indicators of our business performance, and evaluate management's effectiveness with specific reference to these indicators. We believe Adjusted EBITDA provides management and investors a useful measure for period-to-period comparisons of our core business and operating results by excluding items that are not comparable across reporting periods or that do not otherwise relate to the Company's ongoing operating results. Adjusted EBITDA should be viewed as a supplement to and not a substitute for operating income (loss), net income (loss), and other measures of performance presented in accordance with U.S. generally accepted accounting principles ("GAAP"). Since Adjusted EBITDA is not a measure of performance calculated in accordance with GAAP, this measure may not be comparable to similar measures with similar titles used by other companies.
We also use Adjusted EBITDA less Capital Expenditures as an indicator of the Company's financial performance. We believe this measure is one of several benchmarks used by investors, analysts and peers for comparison of performance in the Company's industry, although it may not be directly comparable to similar measures reported by other companies.
The following is a reconciliation of net loss to Adjusted EBITDA:
| |
Altice USA | Altice USA | ||||||||||||||
|---|---|---|---|---|---|---|---|---|---|---|---|---|---|---|---|---|
| |
Three Months Ended March 31 | Year ended December 31, | ||||||||||||||
| |
2017 | 2016 | 2016 | 2016 | 2016 | |||||||||||
| |
Historical | Pro Forma | Historical | Pro Forma | Historical | |||||||||||
| |
(dollars in thousands) |
(dollars in thousands) |
||||||||||||||
Net loss |
$ | (76,188 | ) | $ | (190,141 | ) | $ | (140,748 | ) | $ | (721,257 | ) | $ | (831,479 | ) | |
Income tax benefit |
(45,908 | ) | (107,839 | ) | (74,395 | ) | (450,295 | ) | (259,666 | ) | ||||||
Other expense (income)(a) |
224 | (2,045 | ) | (11 | ) | (9,184 | ) | (4,329 | ) | |||||||
Loss on extinguishment of debt and write-off of deferred financing costs |
— | — | — | 127,649 | 127,649 | |||||||||||
Gain on interest rate swap contracts |
(2,342 | ) | — | — | 72,961 | 72,961 | ||||||||||
Loss on equity derivative contracts, net(b) |
71,044 | 48,012 | — | 89,979 | 53,696 | |||||||||||
Gain on investments, net |
(131,658 | ) | (100,365 | ) | — | (271,886 | ) | (141,896 | ) | |||||||
Interest expense, net |
433,062 | 436,601 | 269,414 | 1,760,421 | 1,442,730 | |||||||||||
Depreciation and amortization |
608,724 | 636,061 | 200,900 | 2,484,284 | 1,700,306 | |||||||||||
Restructuring and other expenses |
76,929 | 8,606 | 7,569 | 229,774 | 240,395 | |||||||||||
Share-based compensation |
7,848 | 14,698 | — | 39,599 | 14,368 | |||||||||||
| | | | | | | | | | | | | | | | | |
Adjusted EBITDA |
$ | 941,735 | $ | 743,588 | $ | 262,729 | $ | 3,352,045 | $ | 2,414,735 | ||||||
| | | | | | | | | | | | | | | | | |
| | | | | | | | | | | | | | | | | |
| | | | | | | | | | | | | | | | | |
- (a)
- Includes
primarily dividends received on Comcast common stock owned by the Company.
- (b)
- Consists of unrealized and realized losses (gains) due to the change in fair value of equity derivative contracts relating to the Comcast common stock owned by the Company.
| |
Altice USA | |||||||||
|---|---|---|---|---|---|---|---|---|---|---|
| |
As of March 31, 2017 | As of Dec. 31, 2016 | ||||||||
Balance Sheet Data:
|
Actual | Pro Forma As Adjusted(1) |
Actual | |||||||
| |
(dollars in thousands) |
|||||||||
Cash and cash equivalents |
$ | 463,882 | $ | 248,599 | $ | 486,792 | ||||
Total assets |
36,179,281 | 35,963,998 | 36,474,249 | |||||||
Total debt |
24,072,758 | 22,477,855 | 24,030,065 | |||||||
Net debt excluding collateralized indebtedness and notes payable to affiliates and related parties plus accrued distributions(2) |
20,565,174 | 21,275,254 | 20,507,204 | |||||||
- (1)
- On a pro forma as adjusted basis to give effect to the Pre-IPO Distribution, the Organizational Transactions, the accrual of $169,950 of cash distributions made to the Company's stockholders in April 2017, and the sale by us of shares of our Class A common stock in this offering, based on an assumed initial public offering price of $29.00 per share, the mid-point of the price range set forth on the cover page of this prospectus, and after deducting the underwriting discount and the estimated offering expenses
18
payable by us, and the application of the net proceeds therefrom as described in "Use of Proceeds."
- (2)
- Net debt excluding collateralized indebtedness and notes payable to affiliates and related parties plus accrued distributions is net of cash and cash equivalents. The pro forma and pro forma as adjusted amounts reflect the accrual of cash distributions of $169,950 and $169,750 made in April 2017 and to be made before the pricing of this offering, respectively.
Customer Metrics
The following table sets forth certain customer metrics by segment (unaudited):
| |
As of March 31, 2017 | As of December 31, 2016 | Pro Forma As of March 31, 2016 |
|||||||||||||||||||||||||
|---|---|---|---|---|---|---|---|---|---|---|---|---|---|---|---|---|---|---|---|---|---|---|---|---|---|---|---|---|
| |
Cablevision | Cequel(g) | Total | Cablevision | Cequel(g) | Total | Cablevision | Cequel(g) | Total | |||||||||||||||||||
| |
(in thousands, except per customer amounts) |
|||||||||||||||||||||||||||
Homes passed(a) |
5,128 | 3,419 | 8,547 | 5,116 | 3,407 | 8,524 | 5,086 | 3,362 | 8,448 | |||||||||||||||||||
Total customer relationships(b) |
3,148 | 1,765 | 4,913 | 3,141 | 1,751 | 4,892 | 3,125 | 1,734 | 4,859 | |||||||||||||||||||
Residential |
2,887 | 1,661 | 4,548 | 2,879 | 1,649 | 4,528 | 2,866 | 1,638 | 4,504 | |||||||||||||||||||
SMB |
261 | 103 | 365 | 262 | 102 | 364 | 258 | 96 | 354 | |||||||||||||||||||
Residential customers(c): |
||||||||||||||||||||||||||||
Pay TV |
2,413 | 1,087 | 3,500 | 2,428 | 1,107 | 3,535 | 2,473 | 1,150 | 3,623 | |||||||||||||||||||
Broadband |
2,636 | 1,366 | 4,003 | 2,619 | 1,344 | 3,963 | 2,580 | 1,308 | 3,888 | |||||||||||||||||||
Telephony |
1,955 | 596 | 2,551 | 1,962 | 597 | 2,559 | 1,999 | 597 | 2,596 | |||||||||||||||||||
Residential triple product customer penetration(d): |
64.4 | % | 25.4 | % | 50.2 | % | 64.8 | % | 25.5 | % | 50.5 | % | 66.9 | % | 25.8 | % | 52.0 | % | ||||||||||
Penetration of homes passed(e): |
61.4 | % | 51.6 | % | 57.5 | % | 61.4 | % | 51.4 | % | 57.4 | % | 61.4 | % | 51.6 | % | 57.5 | % | ||||||||||
ARPU(f) |
$ | 155.83 | $ | 110.00 | $ | 139.11 | $ | 154.49 | $ | 109.30 | $ | 138.07 | $ | 152.18 | $ | 105.68 | $ | 135.32 | ||||||||||
- (a)
- Represents
the estimated number of single residence homes, apartments and condominium units passed by the cable distribution network in areas serviceable without
further extending the transmission lines. In addition, it includes commercial establishments that have connected to our cable distribution network. For Cequel, broadband services were not available to
approximately 100 homes passed and telephony services were not available to approximately 500 homes passed.
- (b)
- Represents
number of households/businesses that receive at least one of the Company's services.
- (c)
- Customers
represent each customer account (set up and segregated by customer name and address), weighted equally and counted as one customer, regardless of size,
revenue generated, or number of boxes, units, or outlets. In calculating the number of customers, we count all customers other than inactive/disconnected customers. Free accounts are included in the
customer counts along with all active accounts, but they are limited to a prescribed group. Most of these accounts are also not entirely free, as they typically generate revenue through pay-per-view
or other pay services. Free status is not granted to regular customers as a promotion. In counting bulk residential customers, such as an apartment building, we count each subscribing family unit
within the building as one customer, but do not count the master account for the entire building as a customer. We count a bulk commercial customer, such as a hotel, as one customer, and do not count
individual room units at that hotel.
- (d)
- Represents
the number of customers that subscribe to three of our services divided by total residential customer relationships.
- (e)
- Represents
the number of total customer relationships divided by homes passed.
- (f)
- Calculated
by dividing the average monthly revenue for the respective quarter (fourth quarter for annual periods) presented derived from the sale of broadband, pay
television and telephony services to residential customers for the respective quarter by the average number of total residential customers for the same period.
- (g)
- The metrics for Cequel presented in the table above have been adjusted from previously reported amounts to conform to the methodology used to calculate the equivalent Cablevision metrics.
19
Investing in our Class A common stock involves a high degree of risk. You should consider carefully the risks and uncertainties described below, together with all of the other information in this prospectus, including the financial statements and the related notes included elsewhere in this prospectus and the information set forth under the caption "Cautionary Statement Regarding Forward-Looking Statements," before deciding whether to invest in shares of our Class A common stock. We describe below what we believe are currently the material risks and uncertainties we face, but they are not the only risks and uncertainties we face. Additional risks and uncertainties that we are unaware of, or that we currently believe are not material, may also become important factors that adversely affect our business. If any of the following risks actually occur, our business, financial condition, results of operations and future prospects could be materially and adversely affected. In that event, the market price of our Class A common stock could decline and you could lose part or all of your investment.
Risk Factors Relating to Our Business
We operate in a highly competitive business environment which could materially adversely affect our business, financial condition, results of operations and liquidity.
We operate in a highly competitive, consumer-driven industry and we compete against a variety of broadband, pay television and telephony providers and delivery systems, including broadband communications companies, wireless data and telephony providers, satellite-delivered video signals, Internet-delivered video content and broadcast television signals available to residential and business customers in our service areas. Some of our competitors include AT&T and its DirecTV subsidiary, CenturyLink, DISH Network, Frontier and Verizon. In addition, our pay television services compete with all other sources of leisure, news, information and entertainment, including movies, sporting or other live events, radio broadcasts, home-video services, console games, print media and the Internet.
In some instances, our competitors have fewer regulatory burdens, easier access to financing, greater resources, greater operating capabilities and efficiencies of scale, stronger brand-name recognition, longstanding relationships with regulatory authorities and customers, more subscribers, more flexibility to offer promotional packages at prices lower than ours and greater access to programming or other services. This competition creates pressure on our pricing and has adversely affected, and may continue to affect, our ability to add and retain customers, which in turn adversely affects our business, financial condition and results of operations. The effects of competition may also adversely affect our liquidity and ability to service our debt. For example, we face intense competition from Verizon, which has constructed FTTH network infrastructure that passes a significant number of households in our New York metropolitan service area. We estimate that Verizon is currently able to sell a fiber-based triple play, including broadband, pay television and telephony services, to at least half of the households in our New York metropolitan service area and may expand these and other service offerings to more customers in the future. Any estimate of Verizon's build-out and sales activity in our New York metropolitan service area is difficult to assess because it is based on visual inspections and other limited estimating techniques and therefore serves only as an approximation.
Our competitive risks are heightened by the rapid technological change inherent in our business, evolving consumer preferences and the need to acquire, develop and adopt new technology to differentiate our products and services from those of our competitors, and to meet consumer demand. We may need to anticipate far in advance which technology we should use for the development of new products and services or the enhancement of existing products and services. The failure to accurately anticipate such changes may adversely affect our ability to attract and retain customers, which in turn could adversely affect our business, financial condition and results of operations. Consolidation and cooperation in our industry may allow our competitors to acquire service capabilities or offer products that are not available to us or offer similar products and services at prices lower than ours. For
20
example, Comcast and Charter Communications have agreed to jointly explore operational efficiencies to speed their respective entries into the wireless market, including in the areas of creating common operating platforms and emerging wireless technology platforms. In addition, changes in the regulatory and legislative environments may result in changes to the competitive landscape.
In addition, certain of our competitors own directly or are affiliated with companies that own programming content or have exclusive arrangements with content providers that may enable them to obtain lower programming costs or offer exclusive programming that may be attractive to prospective subscribers. For example, DirecTV has exclusive arrangements with the National Football League that give it access to programming we cannot offer. AT&T also has an agreement to acquire Time Warner, which owns a number of cable networks, including TBS, CNN and HBO, as well as Warner Bros. Entertainment, which produces television, film and home-video content. AT&T's and DirecTV's potential access to Time Warner programming could allow AT&T and DirecTV to offer competitive and promotional packages that could negatively affect our ability to maintain or increase our existing customers and revenues. DBS operators such as DISH Network and DirecTV also have marketing arrangements with certain phone companies in which the DBS provider's pay television services are sold together with the phone company's broadband and mobile and traditional phone services.
Another source of competition for our pay television services is the delivery of video content over the Internet directly to subscribers, some of which is offered without charging a fee for access to the content. This competition comes from a number of different sources, including companies that deliver movies, television shows and other video programming over broadband Internet connections, such as Netflix, Hulu, iTunes, YouTube, Amazon Prime, Sling TV, Playstation Vue, DirecTV Now and Go90. It is possible that additional competitors will enter the market and begin providing video content over the Internet directly to subscribers. Increasingly, content owners, such as HBO and CBS, are selling their programming directly to consumers over the Internet without requiring a pay-television subscription. The availability of these services has and will continue to adversely affect customer demand for our pay television services, including premium and on-demand services. Further, due to consumer electronics innovations, consumers are able to watch such Internet-delivered content on television sets and mobile devices, such as smartphones and tablets. Internet access services are also offered by providers of wireless services, including traditional cellular phone carriers and others focused solely on wireless data services. All wireless carriers have started to offer unlimited data plans, which could, in some cases, become a substitute for the fixed broadband services we provide. The Federal Communications Commission ("FCC") is likely to continue to make additional radio spectrum available for these wireless Internet access services.
Our pay television services also face competition from broadcast television stations, entities that make digital video recorded movies and programs available for home rental or sale, SMATV systems, which generally serve large MDUs under an agreement with the landlord and service providers and open video system operators. Private cable systems can offer improved reception of local television stations and many of the same satellite-delivered program services that are offered by cable systems. SMATV systems currently benefit from operating advantages not available to franchised cable systems, including fewer regulatory burdens. Cable television has also long competed with broadcast television, which consists of television signals that the viewer is able to receive without charge using an "off-air" antenna. The extent of such competition is dependent upon the quality and quantity of broadcast signals available through "off-air" reception, compared to the services provided by the local cable system. The use of radio spectrum now provides traditional broadcasters with the ability to deliver HD television pictures and multiple digital-quality program streams. There can be no assurance that existing, proposed or as yet undeveloped technologies will not become dominant in the future and render our video service offering less profitable or even obsolete.
Most broadband communications companies, which already have wired networks, an existing customer base and other operational functions in place (such as billing and service personnel), offer
21
DSL services. We believe DSL service competes with our broadband service and is often offered at prices lower than our Internet services. However, DSL is often offered at speeds lower than the speeds we offer. In addition, DSL providers may currently be in a better position to offer Internet services to businesses since their networks tend to be more complete in commercial areas. They may also increasingly have the ability to combine video services with telephone and Internet services offered to their customers, particularly as broadband communications companies enter into co-marketing agreements with other service providers. In addition, current and future fixed and wireless Internet services, such as 3G, 4G and 5G fixed and wireless broadband services and Wi-Fi networks, and devices such as wireless data cards, tablets and smartphones, and mobile wireless routers that connect to such devices, may compete with our broadband services.
Our telephony services compete directly with established broadband communications companies and other carriers, including wireless providers, as increasing numbers of homes are replacing their traditional telephone service with wireless telephone service. We also compete against VoIP providers like Vonage, Skype, GoogleTalk, Facetime, WhatsApp and magicJack that do not own networks but can provide service to any person with a broadband connection, in some cases free of charge. In addition, we compete against ILECs, other CLECs and long-distance voice-service companies for large commercial and enterprise customers. While we compete with the ILECs, we also enter into interconnection agreements with ILECs so that our customers can make and receive calls to and from customers served by the ILECs and other telecommunications providers. Federal and state law and regulations require ILECs to enter into such agreements and provide facilities and services necessary for connection, at prices subject to regulation. The specific price, terms and conditions of each agreement, however, depend on the outcome of negotiations between us and each ILEC. Interconnection agreements are also subject to approval by the state regulatory commissions, which may arbitrate negotiation impasses. We have entered into interconnection agreements with Verizon for New York, New Jersey and portions of Connecticut, and with Frontier for portions of Connecticut, which have been approved by the respective state commissions. We have also entered into interconnection agreements with other ILECs in New York and New Jersey. These agreements, like all interconnection agreements, are for limited terms and upon expiration are subject to renegotiation, potential arbitration and approval under the laws in effect at that time.
We also face competition for our advertising sales from traditional and non-traditional media outlets, including television and radio stations, traditional print media and the Internet.
We face significant risks as a result of rapid changes in technology, consumer expectations and behavior.
The broadband communications industry has undergone significant technological development over time and these changes continue to affect our business, financial condition and results of operations. Such changes have had, and will continue to have, a profound impact on consumer expectations and behavior. Our video business faces technological change risks as a result of the continuing development of new and changing methods for delivery of programming content such as Internet-based delivery of movies, shows and other content which can be viewed on televisions, wireless devices and other developing mobile devices. Consumers' video consumption patterns are also evolving, for example, with more content being downloaded for time-shifted consumption. A proliferation of delivery systems for video content can adversely affect our ability to attract and retain subscribers and the demand for our services and it can also decrease advertising demand on our delivery systems. Our broadband business faces technological challenges from rapidly evolving wireless Internet solutions. Our telephony service offerings face technological developments in the proliferation of telephony delivery systems including those based on Internet and wireless delivery. If we do not develop or acquire and successfully implement new technologies, we will limit our ability to compete effectively for subscribers, content and advertising. We cannot provide any assurance that we will realize, in full or in part, the anticipated benefits we expect from the introduction of our new home communications hub or that it will be
22
introduced to the market in the timeframe we anticipate and with all anticipated features and functionality. In addition, we may be required to make material capital and other investments to anticipate and to keep up with technological change. These challenges could adversely affect our business, financial condition and results of operations.
Additionally, our U.S. industry peers might introduce a "quad-play" offering that bundles broadband, pay television, telephony and mobile communications services. This might lead our customers to expect similar bundled offerings from us, which in turn could result in increased customer churn if we do not, or are unable to, offer similar quad-play bundles, or could require additional investments by us to meet market demand. There can be no assurance that we can offer quad-play bundles successfully or on terms favorable to us.
Programming and retransmission costs are increasing and we may not have the ability to pass these increases on to our subscribers. Disputes with programmers and the inability to retain or obtain popular programming can adversely affect our relationship with subscribers and lead to subscriber losses.
Programming costs are one of our largest categories of expenses. In recent years, the cost of programming in the cable and satellite video industries has increased significantly and is expected to continue to increase, particularly with respect to costs for sports programming and broadcast networks. We may not be able to pass programming cost increases on to our subscribers due to the increasingly competitive environment. If we are unable to pass these increased programming costs on to our subscribers, our results of operations would be adversely affected. Moreover, programming costs are related directly to the number of subscribers to whom the programming is provided. Our smaller subscriber base relative to our competitors may limit our ability to negotiate lower per-subscriber programming costs, which could result in reduced operating margins relative to our competitors with a larger subscriber base.
The expiration dates of our various programming contracts are staggered, which results in the expiration of a portion of our programming contracts throughout each year. A contract with one of our ten largest programmers has expired and we are currently in the process of renegotiating a renewal of this contract. We attempt to control our programming costs and, therefore, the cost of our video services to our customers, by negotiating favorable terms for the renewal of our affiliation agreements with programmers. On certain occasions in the past, such negotiations have led to disputes with programmers that have resulted in temporary periods during which we did not carry or decided to stop carrying a particular broadcast network or programming service or services. Additionally, in our Suddenlink segment, we were unable to reach agreement with Viacom on acceptable economic terms for a long-term contract renewal and, effective October 1, 2014, all Viacom networks were removed from our channel lineups in our Suddenlink footprint. We and Viacom did not reach a new agreement to include certain Viacom networks in the Suddenlink channel lineup until May 2017. To the extent we are unable to reach agreement with certain programmers on terms we believe are reasonable, we may be forced to, or determine for strategic or business reasons to, remove certain programming channels from our line-up and may decide to replace such programming channels with other programming channels, which may not be available on acceptable terms or be as attractive to customers. Such disputes, or the removal or replacement of programming, may inconvenience some of our subscribers and can lead to customer dissatisfaction and, in certain cases, the loss of customers, which could have a material adverse effect on our business, financial condition, results of operations and liquidity. There can be no assurance that our existing programming contracts will be renewed on favorable or comparable terms, or at all, or that the rights we negotiate will be adequate for us to execute our business strategy.
We may also be subject to increasing financial and other demands by broadcast stations. Federal law allows commercial television broadcast stations to make an election between "must-carry" rights and an alternative "retransmission consent" regime. Local stations that elect "must-carry" are entitled
23
to mandatory carriage on our systems, but at no fee. When a station opts for retransmission consent, cable operators negotiate for the right to carry the station's signal, which typically requires payment of a per-subscriber fee. Our retransmission agreements with stations expire from time to time. Upon expiration of these agreements, we may carry some stations under short-term arrangements while we attempt to negotiate new long-term retransmission agreements. In connection with any negotiation of new retransmission agreements, we may become subject to increased or additional costs, which we may not be able to pass on to our customers. To the extent that we cannot pass on such increased or additional costs to customers or offset such increased or additional costs through the sale of additional services, our business, financial condition, results of operations and liquidity could be materially adversely affected. In addition, in the event contract negotiations with stations are unsuccessful, we could be required, or determine for strategic or business reasons, to cease carrying such stations' signals, possibly for an indefinite period. Any loss of stations could make our video service less attractive to our customers, which could result in a loss of customers, which could have a material adverse effect on our business, financial condition, results of operations and liquidity. There can be no assurance that any expiring retransmission agreements will be renewed on favorable or comparable terms, or at all.
We may not be able to successfully implement our growth strategy.
Our future growth, profitability and results of operations depend upon our ability to successfully implement our business strategy, which, in turn, is dependent upon a number of factors, including our ability to continue to:
- •
- simplify and optimize our organization;
- •
- reinvest in infrastructure and content;
- •
- invest in sales, marketing and innovation;
- •
- enhance the customer experience;
- •
- drive revenue and cash flow growth; and
- •
- opportunistically grow through value-accretive acquisitions.
There can be no assurance that we can successfully achieve any or all of the above initiatives in the manner or time period that we expect. Furthermore, achieving these objectives will require investments which may result in short-term costs without generating any current revenues and therefore may be dilutive to our earnings. We cannot provide any assurance that we will realize, in full or in part, the anticipated benefits we expect our strategy will achieve. The failure to realize those benefits could have a material adverse effect on our business, financial condition and results of operations. In addition, if we are unable to continue improving our operational performance and customer experience we may face a decrease in new subscribers and an increase in subscriber churn, which could have a material adverse effect on our business, financial condition and results of operations. In particular, there can be no assurance that we will be able to successfully implement our plan to build a FTTH network within the anticipated five-year timeline or at all or within the cost parameters we currently expect. Similarly, we may not be successful in deploying our new home communications hub on our current timeline or at all and we may face technological or other challenges in pursuing these or other initiatives.
24
The financial markets are subject to volatility and disruptions, which have in the past, and may in the future, adversely affect our business, including by affecting the cost of new capital and our ability to fund acquisitions or other strategic transactions.
The capital markets experience volatility and disruption. At times, the markets have exerted extreme downward pressure on stock prices and upward pressure on the cost of new debt, which has severely restricted credit availability for many companies.
Historical market disruptions have typically been accompanied by a broader economic downturn, which has historically led to lower demand for our products, such as video services, as well as lower levels of television advertising, and increased incidence of customers' inability to pay for the services we provide. A recurrence of these conditions may further adversely impact our business, financial condition and results of operations.
We rely on the capital markets, particularly for offerings of debt securities and borrowings under syndicated facilities, to meet our financial commitments and liquidity needs and to fund acquisitions or other strategic transactions. Disruptions or volatility in the capital markets could also adversely affect our ability to refinance on satisfactory terms, or at all, our scheduled debt maturities and could adversely affect our ability to draw on our revolving credit facilities.
Disruptions in the capital markets as well as the broader global financial market can also result in higher interest rates on publicly issued debt securities and increased costs under credit facilities. Such disruptions could increase our interest expense, adversely affecting our business, financial position and results of operations.
Our access to funds under our revolving credit facilities is dependent on the ability of the financial institutions that are parties to those facilities to meet their funding commitments. Those financial institutions may not be able to meet their funding commitments if they experience shortages of capital and liquidity or if they experience excessive volumes of borrowing requests within a short period of time. Moreover, the obligations of the financial institutions under our revolving credit facilities are several and not joint and, as a result, a funding default by one or more institutions does not need to be made up by the others.
Longer term, volatility and disruptions in the capital markets and the broader global financial market as a result of uncertainty, changing or increased regulation of financial institutions, reduced alternatives or failures of significant financial institutions could adversely affect our access to the liquidity needed for our businesses. Such disruptions could require us to take measures to conserve cash or impede or delay potential acquisitions, strategic transactions and refinancing transactions until the markets stabilize or until alternative credit arrangements or other funding for our business needs can be arranged.
We are highly leveraged and have substantial indebtedness, which reduces our capability to withstand adverse developments or business conditions.
We have incurred substantial amounts of indebtedness to finance the Acquisitions, our operations, upgrades to our cable plant and acquisitions of other cable systems, sources of programming and other businesses. We have also incurred substantial indebtedness in order to offer new or upgraded services to our current and potential customers. At March 31, 2017, our total aggregate indebtedness was approximately $22.3 billion (excluding notes payable to affiliates and related parties). Because we are highly leveraged, our payments on our indebtedness are significant in relation to our revenues and cash flow, which exposes us to significant risk in the event of downturns in our businesses (whether through competitive pressures or otherwise), our industry or the economy generally, since our cash flows would decrease, but our required payments under our indebtedness would not.
25
Economic downturns may impact our ability to comply with the covenants and restrictions in our indentures, credit facilities and agreements governing our other indebtedness and may impact our ability to pay or refinance our indebtedness as it comes due. If we do not repay or refinance our debt obligations when they become due and do not otherwise comply with the covenants and restrictions in our indentures, credit facilities and agreements governing our other indebtedness, we would be in default under those agreements and the underlying debt could be declared immediately due and payable. In addition, any default under any of our indentures, credit facilities or agreements governing our other indebtedness could lead to an acceleration of debt under any other debt instruments or agreements that contain cross-acceleration or cross-default provisions. If the indebtedness incurred under our indentures, credit facilities and agreements governing our other indebtedness were accelerated, we would not have sufficient cash to repay amounts due thereunder. To avoid a default, we could be required to defer capital expenditures, sell assets, seek strategic investments from third parties or otherwise reduce or eliminate discretionary uses of cash. However, if such measures were to become necessary, there can be no assurance that we would be able to sell sufficient assets or raise strategic investment capital sufficient to meet our scheduled debt maturities as they come due. In addition, any significant reduction in necessary capital expenditures could adversely affect our ability to retain our existing customer base and obtain new customers, which would adversely affect our business, financial position and results of operations.
Our overall leverage and the terms of our financing arrangements could also:
- •
- make it more difficult for us to satisfy obligations under our outstanding indebtedness;
- •
- limit our ability to obtain additional financing in the future for working capital, capital expenditures or acquisitions;
- •
- limit our ability to refinance our indebtedness on terms acceptable to us or at all;
- •
- limit our ability to adapt to changing market conditions;
- •
- restrict us from making strategic acquisitions or cause us to make non-strategic divestitures;
- •
- require us to dedicate a significant portion of our cash flow from operations to paying the principal of and interest on our indebtedness,
thereby limiting the availability of our cash flow to fund future capital expenditures, working capital and other corporate purposes;
- •
- limit our flexibility in planning for, or reacting to, changes in our business and the broadband communications industry generally; and
- •
- place us at a competitive disadvantage compared with competitors that have a less significant debt burden.
In addition, a substantial portion of our indebtedness bears interest at variable rates. If market interest rates increase, our variable-rate debt will have higher debt service requirements, which could adversely affect our cash flows and financial condition. For more information, see "Management's Discussion and Analysis of Financial Condition and Results of Operations—Quantitative and Qualitative Disclosures About Market Risk—Interest Rate Risk." Although we have historically entered into, and may in the future enter into, hedging arrangements to limit our exposure to an increase in interest rates, such arrangements may not offer complete protection from this risk.
If we incur additional indebtedness, such indebtedness could further exacerbate the risks associated with our substantial indebtedness.
If we incur additional indebtedness, such indebtedness will be added to our current debt levels and the related risks we currently face could be magnified. Any decrease in our revenues or an increase in operating costs (and corresponding reduction in our cash flows) would also adversely affect our ability to pay our indebtedness as it comes due.
26
We have in past periods incurred substantial losses from continuing operations, and we may do so in the future, which may reduce our ability to raise needed capital.
We have in the past reported substantial losses from continuing operations and we may do so in the future. Significant losses from continuing operations could limit our ability to raise any needed financing, or to do so on favorable terms, as such losses could be taken into account by potential investors, lenders and the organizations that issue investment ratings on our indebtedness.
A lowering or withdrawal of the ratings assigned to our subsidiaries' debt securities and credit facilities by ratings agencies may further increase our future borrowing costs and reduce our access to capital.
Credit rating agencies continually revise their ratings for companies they follow. The condition of the financial and credit markets and prevailing interest rates have fluctuated in the past and are likely to fluctuate in the future. In addition, developments in our business and operations or the amount of indebtedness could lead to a ratings downgrade on our or our subsidiaries' indebtedness. The debt ratings for our subsidiaries' debt securities and credit facilities are currently below the "investment grade" category, which results in higher borrowing costs as well as a reduced pool of potential investors of that debt as some investors will not purchase debt securities or become lenders under credit facilities that are not rated in an investment grade rating category. In addition, there can be no assurance that any rating assigned will remain for any given period of time or that a rating will not be lowered or withdrawn entirely by a rating agency, if in that rating agency's judgment, future circumstances relating to the basis of the rating, such as adverse changes, so warrant. Any such fluctuation in the rating of us or our subsidiaries may impact our ability to access debt markets in the future or increase our cost of future debt which could have a material adverse effect on our business, financial condition and results of operations, which in return may adversely affect the trading price of shares of our Class A common stock.
Our subsidiaries' ability to meet obligations under their indebtedness may be restricted by limitations on our other subsidiaries' ability to send funds.
Our subsidiaries that have incurred indebtedness under indentures and credit facilities are primarily holding companies whose ability to pay interest and principal on such indebtedness is wholly or partially dependent upon the operations of their respective subsidiaries and the distributions or other payments of cash, in the form of distributions, loans or advances, those other subsidiaries deliver to our indebted subsidiaries. Our subsidiaries are separate and distinct legal entities and, unless any such subsidiaries has guaranteed the underlying indebtedness, have no obligation, contingent or otherwise, to pay any amounts due on our indebted subsidiaries' indebtedness or to make any funds available to our indebted subsidiaries to do so. These subsidiaries may not generate enough cash to make such funds available to our indebted subsidiaries and in certain circumstances legal and contractual restrictions may also limit their ability to do so. Also, our subsidiaries' creditors, including trade creditors, in the event of a liquidation or reorganization of any subsidiary, would be entitled to a claim on the assets of such subsidiaries, including any assets transferred to those subsidiaries, prior to any of our claims as a stockholder and those creditors are likely to be paid in full before any distribution is made to us. To the extent that we are a creditor of a subsidiary, our claims could be subordinated to any security interest in the assets of that subsidiary and/or any indebtedness of that subsidiary senior to that held by us.
In addition, our Optimum and Suddenlink businesses are each currently financed on a standalone basis and constitute separate financing groups, which are subject to covenants that restrict the use of their respective cash flows outside their respective restricted groups. Consequently, cash flows from operations of Optimum and its subsidiaries may not be able to be applied to meet the obligations or other expenses of Suddenlink and its subsidiaries and cash flows from operations of Suddenlink may not be able to be applied to meet the obligations or other expenses of Optimum and its subsidiaries, except to the extent that the relevant restricted group is able to pay a dividend under the agreements governing their respective indebtedness.
27
Our ability to incur additional indebtedness and use our funds is limited by significant restrictive covenants in financing agreements.
The indentures, credit facilities and agreements governing the indebtedness of our subsidiaries contain various negative covenants that restrict our subsidiaries' (and their respective subsidiaries') ability to, among other things:
- •
- incur additional indebtedness and guarantee indebtedness;
- •
- pay dividends or make other distributions, or repurchase or redeem capital stock;
- •
- prepay, redeem or repurchase subordinated debt or equity;
- •
- issue certain preferred stock;
- •
- make loans and investments;
- •
- sell assets;
- •
- incur liens;
- •
- enter into transactions with affiliates;
- •
- create or permit any encumbrances or restrictions on the ability of their respective subsidiaries to pay dividends or make other distributions,
make loans or advances or transfer assets, in each case to such subsidiary, or its other restricted subsidiaries; and
- •
- consolidate, merge or sell all or substantially all of their assets.
We are also subject to certain affirmative covenants under our subsidiaries' revolving credit facilities, which, among other things, require the relevant Optimum and Suddenlink subsidiaries to each maintain a specified financial ratio if there are any outstanding utilizations. Our ability to meet these financial ratios may be affected by events beyond our control and, as a result, we cannot assure you that we will be able to meet these ratios.
Violation of these covenants could result in a default that would permit the relevant creditors to require the immediate repayment of the borrowings thereunder, which could result in a default under other debt instruments and agreements that contain cross-default provisions and, in the case of revolving credit facilities, permit the relevant lenders to restrict the relevant borrower's ability to borrow undrawn funds under such revolving credit facilities. A default under any of the agreements governing our indebtedness could materially adversely affect our growth, financial condition and results of operations.
As a result, we may be:
- •
- limited in how we conduct our business;
- •
- unable to raise additional debt or equity financing to operate during general economic or business downturns; or
- •
- unable to compete effectively or to take advantage of new business opportunities.
These restrictions could have a material adverse effect on our ability to grow in accordance with our strategy and on the value of our debt and equity securities. In addition, our financial results, substantial indebtedness and credit ratings could materially adversely affect the availability and terms of our financing.
28
We will need to raise significant amounts of funding over the next several years to fund capital expenditures, repay existing obligations and meet other obligations and the failure to do so successfully could adversely affect our business. We may also engage in extraordinary transactions that involve the incurrence of large amounts of indebtedness.
Our business is capital intensive. Operating and maintaining our cable systems requires significant amounts of cash payments to third parties. Capital expenditures were $625.5 million in 2016 and primarily included payments for customer premise equipment, such as new digital video cable boxes and modems, as well as infrastructure and capital expenditures related to our networks, in addition to the capital requirements of our other businesses.
We have commenced a five-year plan to build a FTTH network, which will enable us to deliver more than 10 Gbps broadband speeds across our entire Optimum footprint and part of our Suddenlink footprint. We also plan to introduce a new home communications hub during the second quarter of 2017, which will be the most advanced home communications hub offered by any Altice Group business. We may not be able to execute these initiatives within the anticipated timelines and we may incur greater than anticipated costs and capital expenditures in connection therewith, fail to realize anticipated benefits, experience business disruptions or encounter other challenges to executing either as planned. The failure to realize the anticipated benefits of these initiatives could have a material adverse effect on our business, financial condition and results of operations.
We expect these capital expenditures to continue to be significant as we further enhance our service offerings. We may have substantial future capital commitments in the form of long-term contracts that require substantial payments over a period of time. We may not be able to generate sufficient cash internally to fund anticipated capital expenditures, meet these obligations and repay our indebtedness at maturity. Accordingly, we may have to do one or more of the following:
- •
- refinance existing obligations to extend maturities;
- •
- raise additional capital, through debt or equity issuances or both;
- •
- cancel or scale back current and future spending programs; or
- •
- sell assets or interests in one or more of our businesses.
However, we may not be able to refinance existing obligations or raise any required additional capital or to do so on favorable terms. Borrowing costs related to future capital raising activities may be significantly higher than our current borrowing costs and we may not be able to raise additional capital on favorable terms, or at all, if financial markets experience volatility. If we are unable to pursue our current and future spending programs, we may be forced to cancel or scale back those programs. Our choice of which spending programs to cancel or reduce may be limited. Failure to successfully pursue our capital expenditure and other spending plans could materially and adversely affect our ability to compete effectively. It is possible that in the future we may also engage in extraordinary transactions and such transactions could result in the incurrence of substantial additional indebtedness.
We rely on network and information systems for our operations and a disruption or failure of, or defects in, those systems may disrupt our operations, damage our reputation with customers and adversely affect our results of operations.
Network and information systems are essential to our ability to deliver our services to our customers. While we have in place multiple security systems designed to protect against intentional or unintentional disruption, failure, misappropriation or corruption of our network and information systems, there can be no assurance that our efforts to protect our network and information systems will prevent any of the problems identified above. A problem of this type might be caused by events such as computer hacking, computer viruses, worms and other destructive or disruptive software, "cyber-
29
attacks" and other malicious activity, defects in the hardware and software comprising our network and information systems, as well as natural disasters, power outages, terrorist attacks and similar events. Such events could have an adverse impact on us and our customers, including degradation of service, service disruption, excessive call volume to call centers and damage to our plant, equipment and data. Operational or business delays may result from the disruption of network or information systems and the subsequent remediation activities. Moreover, these events may create negative publicity resulting in reputation or brand damage with customers and our results of operations could suffer.
We also use certain vendors to supply some of the hardware, software and support of our network, some of which have been customized or altered to fit our business needs. Certain of these vendors and suppliers may have leverage over us considering that there are limited suppliers of certain products and services, or that there is a long lead time and/or significant expense required to transition to another provider. In addition, some of these vendors and suppliers do not have a long operating history or may not be able to continue to supply the equipment and services we desire. Some of our hardware, software and operational support vendors and some of our service providers represent our sole source of supply or have, either through contract or as a result of intellectual property rights, a position of some exclusivity. In addition, because of the pace at which technological innovations occur in our industry, we may not be able to obtain access to the latest technology on reasonable terms. Any delays or the termination or disruption in these relationships as a result of contractual disagreements, operational or financial failures on the part of our vendors and suppliers, or other adverse events that prevent such vendors and suppliers from providing the equipment or services we need, with the level of quality we require, in a timely manner and at reasonable prices, could result in significant costs to us and have a negative effect on our ability to provide services and rollout advanced services. Our ability to replace such vendors and suppliers may be limited and, as a result, our business, financial condition, results of operations and liquidity could be materially adversely affected.
If we experience a significant data security breach or fail to detect and appropriately respond to a significant data security breach, our results of operations and reputation could suffer.
The nature of our business involves the receipt and storage of information about our customers and employees. We have procedures in place to detect and respond to data security incidents. However, because the techniques used to obtain unauthorized access, disable or degrade service, or sabotage systems change frequently and may be difficult to detect for long periods of time, we may be unable to anticipate these techniques or implement adequate preventive measures. In addition, hardware, software or applications we develop or procure from third parties may contain defects in design or manufacture or other problems that could unexpectedly compromise information security. Unauthorized parties may also attempt to gain access to our systems or facilities and to our proprietary business information. If our efforts to protect the security of information about our customers and employees are unsuccessful, a significant data security breach may result in costly government enforcement actions, private litigation and negative publicity resulting in reputation or brand damage with customers, and our financial condition and results of operations could suffer.
A portion of our workforce is represented by labor unions. Collective bargaining agreements can increase our expenses. Labor disruptions could adversely affect our business, financial condition and results of operations.
As of March 31, 2017, 217 of our full-time employees were covered by collective bargaining agreements (primarily technicians in Brooklyn, New York) with the Communication Workers of America ("CWA"). Optimum and the CWA entered into a collective bargaining agreement in 2015. This agreement was renewed in June 2016 for an additional three-year term. On March 10, 2017, the International Brotherhood of Electrical Workers ("IBEW") was certified to represent 100 employees in Oakland, New Jersey. We have not yet negotiated a collective bargaining agreement with the IBEW relating to these employees and there can be no assurance that we will be able to do so on terms acceptable to us. The collective bargaining agreements with the CWA and IBEW covering these groups
30
of employees or any other agreements with other unions may increase our expenses. In addition, any disruptions to our operations due to labor related problems could have an adverse effect on our business, financial condition and results of operations.
A significant amount of our book value consists of intangible assets that may not generate cash in the event of a voluntary or involuntary sale.
At March 31, 2017, we reported approximately $36.2 billion of consolidated total assets, of which approximately $27.2 billion were intangible. Intangible assets primarily included franchises from city and county governments to operate cable systems, goodwill, customer relationships and trade names. While we believe the carrying values of our intangible assets are recoverable, we may not receive any cash in the event of a voluntary or involuntary sale of these intangible assets, particularly if we were not continuing as an operating business. We urge you to read carefully our consolidated financial statements contained herein, which provide more detailed information about these intangible assets.
We may engage in acquisitions and other strategic transactions and the integration of such acquisitions and other strategic transactions could materially adversely affect our business, financial condition and results of operations.
Our business has grown significantly as a result of acquisitions, including the Acquisitions, which entail numerous risks including:
- •
- distraction of our management team in identifying potential acquisition targets, conducting due diligence and negotiating acquisition
agreements;
- •
- difficulties in integrating the operations, personnel, products, technologies and systems of acquired businesses;
- •
- difficulties in enhancing our customer support resources to adequately service our existing customers and the customers of acquired businesses;
- •
- the potential loss of key employees or customers of the acquired businesses;
- •
- unanticipated liabilities or contingencies of acquired businesses;
- •
- unbudgeted costs which we may incur in connection with pursuing potential acquisitions which are not consummated;
- •
- failure to achieve projected cost savings or cash flow from acquired businesses, which are based on projections that are inherently uncertain;
- •
- fluctuations in our operating results caused by incurring considerable expenses to acquire and integrate businesses before receiving the
anticipated revenues expected to result from the acquisitions; and
- •
- difficulties in obtaining regulatory approvals required to consummate acquisitions.
We also participate in competitive bidding processes, some of which may involve significant cable systems. If we are the winning bidder in any such process involving significant cable systems or we otherwise engage in acquisitions or other strategic transactions in the future, we may incur additional debt, contingent liabilities and amortization expenses, which could materially adversely affect our business, financial condition and results of operations. We could also issue substantial additional equity which could dilute existing stockholders.
If our acquisitions, including the Acquisitions and the integration of the Optimum and Suddenlink businesses, do not result in the anticipated operating efficiencies, are not effectively integrated, or result in costs which exceed our expectations, our business, financial condition and results of operations could be materially adversely affected.
31
Certain of our overlapping directors and officers have relationships with Altice N.V., which may result in the diversion of corporate opportunities and other conflicts with respect to our business and executives.
Following this offering, four of our directors, including our Chief Executive Officer, will be employed by or affiliated with Altice N.V. and A4 S.A. These directors have fiduciary duties to us and, in addition, have duties to Altice N.V. and A4 S.A. As a result, these directors and officers may face real or apparent conflicts of interest with respect to matters affecting both us and Altice N.V. or A4 S.A., whose interests may be adverse to ours in some circumstances.
Our amended and restated certificate of incorporation that will be in effect on the closing of this offering recognizes that Mr. Drahi and certain directors, principals, officers, employees and/or other representatives of Altice N.V., A4 S.A. and their affiliates (each such director, principal, officer, employee and/or other representative, an "Altice Group Representative" and collectively, the "Altice Group Representatives") may serve as our directors, officers or agents and that Mr. Drahi, Altice N.V., A4 S.A., the Altice Group Representatives and their respective affiliates, and members of our board of directors designated by Altice N.V. and A4 S.A. pursuant to the stockholders' agreement (the "Designated Directors"), may now engage, may continue to engage and may in the future engage in the same or similar activities or related lines of business as those in which we, directly or indirectly, may engage and/or other business activities that overlap with or compete with those in which we, directly or indirectly, may engage. In the amended and restated certificate of incorporation we have renounced our rights to certain business opportunities and the amended and restated certificate of incorporation provides that none of Mr. Drahi, Altice N.V., A4 S.A., any Altice Group Representative, any Designated Director, or their respective affiliates, have any duty to refrain from, directly or indirectly, engaging in the same or similar business activities or lines of businesses in which we or any of our affiliates engage or are reasonably likely to engage, or otherwise competing with us or any of our affiliates, or have any duty to communicate such opportunities to us, unless such opportunities arise in or are predominantly related to North America. The amended and restated certificate of incorporation further provides that, to the fullest extent permitted by law, none of Mr. Drahi, Altice N.V., A4 S.A., any Altice Group Representative, any Designated Director (including any Designated Director who serves as one of our officers) or any of the foregoing persons' affiliates shall be liable to us or our stockholders for breach of any fiduciary duty solely because they engage in such activities.
Significant unanticipated increases in the use of bandwidth-intensive Internet-based services could increase our costs.
The rising popularity of bandwidth-intensive Internet-based services poses risks for our broadband services. Examples of such services include peer-to-peer file sharing services, gaming services and the delivery of video via streaming technology and by download. If heavy usage of bandwidth-intensive broadband services grows beyond our current expectations, we may need to incur more expenses than currently anticipated to expand the bandwidth capacity of our systems or our customers could have a suboptimal experience when using our broadband service. In order to continue to provide quality service at attractive prices, we need the continued flexibility to develop and refine business models that respond to changing consumer uses and demands and to manage bandwidth usage efficiently. Our ability to undertake such actions could be restricted by regulatory and legislative efforts to impose so-called "net neutrality" requirements on broadband communication providers like us that provide broadband services. For more information, see "Regulation—Broadband."
Our business depends on intellectual property rights and on not infringing on the intellectual property rights of others.
We rely on our patents, copyrights, trademarks and trade secrets, as well as licenses and other agreements with our vendors and other parties, to use our technologies, conduct our operations and
32
sell our products and services. Our intellectual property rights may be challenged and invalidated by third parties and may not be strong enough to provide meaningful commercial competitive advantage. Third parties have in the past, and may in the future, assert claims or initiate litigation related to exclusive patent, copyright, trademark and other intellectual property rights to technologies and related standards that are relevant to us. These assertions have increased over time as a result of our growth and the general increase in the pace of patent claims assertions, particularly in the United States. Because of the existence of a large number of patents in the networking field, the secrecy of some pending patents and the rapid rate of issuance of new patents, we believe it is not possible to determine in advance whether a product or any of its components infringes or will infringe on the patent rights of others. Asserted claims and/or initiated litigation can include claims against us or our manufacturers, suppliers or customers, alleging infringement of their proprietary rights with respect to our existing or future products and/or services or components of those products and/or services.
Regardless of the merit of these claims, they can be time-consuming, result in costly litigation and diversion of technical and management personnel, or require us to modify our business, develop a non-infringing technology, be enjoined from use of certain intellectual property, use alternate technology or enter into license agreements. There can be no assurance that licenses will be available on acceptable terms and conditions, if at all, or that our indemnification by our suppliers will be adequate to cover our costs if a claim were brought directly against us or our customers. Furthermore, because of the potential for high court awards that are not necessarily predictable, it is not unusual to find even arguably unmeritorious claims settled for significant amounts. If any infringement or other intellectual property claim made against us by any third party is successful, if we are required to indemnify a customer with respect to a claim against the customer, or if we fail to modify our business, develop non-infringing technology, use alternate technology or license the proprietary rights on commercially reasonable terms and conditions, our business, financial condition and results of operations could be materially adversely affected.
We may be liable for the material that content providers distribute over our networks.
The law relating to the liability of private network operators for information carried on, stored or disseminated through their networks is still unsettled. As such, we could be exposed to legal claims relating to content disseminated on our networks. Claims could challenge the accuracy of materials on our network or could involve matters such as defamation, invasion of privacy or copyright infringement. If we need to take costly measures to reduce our exposure to these risks or are required to defend ourselves against such claims, our business, reputation, financial condition and results of operations could be materially adversely affected.
If we are unable to retain key employees, our ability to manage our business could be adversely affected.
Our operational results have depended, and our future results will depend, upon the retention and continued performance of our management team. The competitive environment for management talent in the broadband communications industry could adversely impact our ability to retain and hire new key employees for management positions. The loss of the services of key members of management and the inability or delay in hiring new key employees could adversely affect our ability to manage our business and our future operational and financial results.
Impairment of Altice Group's reputation could adversely affect current and future customers' perception of Altice USA.
Our ability to attract and retain customers depends, in part, upon the external perceptions of Altice Group's reputation, the quality of its products and its corporate and management integrity. The broadband communications and video services industry is by its nature more prone to reputational risks than other industries. This has been compounded in recent years by the free flow of unverified
33
information on the Internet and, in particular, on social media. Impairment, including any loss of goodwill or reputational advantages, of Altice Group's reputation in markets in which we do not operate could adversely affect current and future customers' perception of Altice USA.
Macroeconomic developments may adversely affect our business.
Our performance is subject to global economic conditions and the related impact on consumer spending levels. Continued uncertainty about global economic conditions poses a risk as consumers and businesses may postpone spending in response to tighter credit, unemployment, negative financial news, and/or declines in income or asset values, which could have a material negative effect on demand for our products and services. As our business depends on consumer discretionary spending, our results of operations are sensitive to changes in macroeconomic conditions. Our customers may have less money for discretionary purchases as a result of job losses, foreclosures, bankruptcies, increased fuel and energy costs, higher interest rates, higher taxes, reduced access to credit, and lower home values. These and other economic factors could adversely affect demand for our products, which in turn could adversely affect our financial condition and results of operations.
Online piracy of entertainment and media content could result in reduced revenues and increased expenditures which could materially harm our business, financial condition and results of operations.
Online entertainment and media content piracy is extensive in many parts of the world and is made easier by technological advances. This trend facilitates the creation, transmission and sharing of high quality unauthorized copies of entertainment and media content. The proliferation of unauthorized copies of this content will likely continue, and if it does, could have an adverse effect on our business, financial condition and results of operations because these products could reduce the revenue we receive for our products. Additionally, in order to contain this problem, we may have to implement elaborate and costly security and antipiracy measures, which could result in significant expenses and losses of revenue. There can be no assurance that even the highest levels of security and anti-piracy measures will prevent piracy.
The MSG Distribution and the AMC Networks Distribution could result in significant tax liability.
We have received private letter rulings from the Internal Revenue Service (the "IRS") to the effect that, among other things, the MSG Distribution (whereby Optimum distributed to its stockholders all of the outstanding common stock of The Madison Square Garden Company ("Madison Square Garden"), a company which owns the sports, entertainment and media businesses previously owned and operated by Optimum) and the AMC Networks Distribution (whereby Optimum distributed to its stockholders all of the outstanding common stock of AMC Networks, a company which consisted principally of national programming networks, including AMC, WE tv, IFC and Sundance Channel, previously owned and operated by Optimum) and certain related transactions, will qualify for tax-free treatment under the Code.
Although a private letter ruling from the IRS generally is binding on the IRS, if the factual representations or assumptions made in the letter ruling request are untrue or incomplete in any material respect, we will not be able to rely on the ruling. Furthermore, the IRS will not rule on whether a distribution satisfies certain requirements necessary to obtain tax-free treatment under the Code. Rather, the ruling is based upon our representations that these conditions have been satisfied, and any inaccuracy in such representations could invalidate the ruling.
If the MSG Distribution or the AMC Networks Distribution does not qualify for tax-free treatment for U.S. federal income tax purposes, then, in general, we would be subject to tax as if we had sold the Madison Square Garden common stock or AMC Networks common stock, as the case may be, in a taxable sale for its fair value. Optimum stockholders at the time of the distributions would be subject to tax as if they had received a distribution equal to the fair value of Madison Square Garden common
34
stock or AMC Networks common stock, as the case may be, that was distributed to them, which generally would be treated as a taxable dividend. It is expected that the amount of any such taxes to Optimum's stockholders and us would be substantial.
Risk Factors Relating to Regulatory and Legislative Matters
Our business is subject to extensive governmental legislation and regulation, which could adversely affect our business, increase our operational and administrative expenses and limit our revenues.
Regulation of our industry has increased broadband communications companies' operational and administrative expenses and limited their revenues. Broadband communications companies are subject to, among other things:
- •
- rules governing the provisioning and marketing of cable equipment and compatibility with new digital technologies;
- •
- rules and regulations relating to data protection and customer and employee privacy;
- •
- rules establishing limited rate regulation of video service;
- •
- rules governing the copyright royalties that must be paid for retransmitting broadcast signals;
- •
- rules governing when a cable system must carry a particular broadcast station and when it must first obtain retransmission consent to carry a
broadcast station;
- •
- rules governing the provision of channel capacity to unaffiliated commercial leased access programmers;
- •
- rules limiting the ability to enter into exclusive agreements with MDUs and control inside wiring;
- •
- rules, regulations and regulatory policies relating to the provision of broadband service, including new "net neutrality" requirements;
- •
- rules, regulations and regulatory policies relating to the provision of telephony services;
- •
- rules for franchise renewals and transfers; and
- •
- other requirements covering a variety of operational areas such as equal employment opportunity, emergency alert systems, disability access, technical standards and customer service and consumer protection requirements.
Many aspects of these regulations are currently the subject of judicial proceedings and administrative or legislative proposals. There are also ongoing efforts to amend or expand the federal, state and local regulation of some of our cable systems, which may compound the regulatory risks we already face, and proposals that might make it easier for our employees to unionize. The federal Internet Tax Freedom Act, which prohibited many taxes on Internet access service, but was subject to periodic renewals, was recently modified so that the collection of taxes on Internet service is now permanently prohibited. Certain states and localities are considering new cable and telecommunications taxes that could increase operating expenses. Certain states are also considering adopting energy efficiency regulations governing the operation of equipment that we use, which could constrain innovation. Congress has recently considered whether to rewrite the entire Communications Act of 1934, as amended (the "Communications Act") to account for changes in the communications marketplace or to adopt more focused changes. In response to recent data breaches and increasing concerns regarding the protection of consumers' personal information, Congress and regulatory agencies are considering the adoption of new privacy and data security laws and regulations that could result in additional privacy, as well as network and information security, requirements for our business. These new laws, as well as existing legal and regulatory obligations, could require significant expenditures.
35
Additionally, there have been statements by federal government officials indicating that some laws and regulations applicable to our industry may be repealed or modified in a way that could be favorable to us and our competitors. There can be no assurance that any such repeal or modification will be beneficial to us or will not be more beneficial to our current and future competitors.
Our cable system franchises are subject to non-renewal or termination. The failure to renew a franchise in one or more key markets could adversely affect our business.
Our cable systems generally operate pursuant to franchises, permits and similar authorizations issued by a state or local governmental authority controlling the public rights-of-way. Some franchises establish comprehensive facilities and service requirements, as well as specific customer service standards and monetary penalties for non-compliance. In many cases, franchises are terminable if the franchisee fails to comply with significant provisions set forth in the franchise agreement governing system operations. Franchises are generally granted for fixed terms and must be periodically renewed. Franchising authorities may resist granting a renewal if either past performance or the prospective operating proposal is considered inadequate. Franchise authorities often demand concessions or other commitments as a condition to renewal. In some instances, local franchises have not been renewed at expiration, and we have operated and are operating under either temporary operating agreements or without a franchise while negotiating renewal terms with the local franchising authorities.
As of March 31, 2017, one of our largest franchises, the Town of Hempstead, New York, comprising an aggregate of approximately 85,000 pay television customers, was expired. We are currently lawfully operating in the Town of Hempstead, New York franchise area under temporary authority recognized by the State of New York. Lightpath holds a franchise from New York City that expired on December 20, 2008 and the renewal process is ongoing. We believe New York City is treating the expiration date of this franchise as extended until a formal determination on renewal is made, but there can be no assurance that we will be successful in renewing this franchise on anticipated terms or at all. We expect to renew or continue to operate under all or substantially all of our franchises.
The traditional cable franchising regime is currently undergoing significant change as a result of various federal and state actions. Some state franchising laws do not allow incumbent operators like us to immediately opt into favorable statewide franchising as quickly as new entrants, and often require us to retain certain franchise obligations that are more burdensome than those applied to new entrants.
We cannot assure you that we will be able to comply with all significant provisions of our franchise agreements and certain of our franchisors have from time to time alleged that we have not complied with these agreements. Additionally, although historically we have renewed our franchises without incurring significant costs, we cannot assure you that we will be able to renew, or to renew on terms as favorable, our franchises in the future. A termination of or a sustained failure to renew a franchise in one or more key markets could adversely affect our business in the affected geographic area.
Our cable system franchises are non-exclusive. Accordingly, local and state franchising authorities can grant additional franchises and create competition in market areas where none existed previously, resulting in overbuilds, which could adversely affect our results of operations.
Cable systems are operated under non-exclusive franchises historically granted by local authorities. More than one cable system may legally be built in the same area, which is referred to as an overbuild. It is possible that a franchising authority might grant a second franchise to another cable operator and that such franchise might contain terms and conditions more favorable than those afforded to us. Although entry into the cable industry involves significant cost barriers and risks, well-financed businesses from outside the cable industry, such as public utilities that already possess fiber optic and other transmission lines in the areas they serve, may over time become competitors. In addition, there
36
are a few cities that have constructed their own cable systems, in a manner similar to city-provided utility services, and private cable companies not affiliated with established local exchange carriers have also demonstrated an interest in constructing overbuilds. We believe that for any potential competitor to be successful, such competitor's overbuild would need to be able to serve the homes and businesses in the overbuilt area with equal or better service quality, on a more cost-effective basis than we can.
In some cases, local government entities and municipal utilities may legally compete with us without securing a local franchise or on more favorable franchise terms. There are federal legislative and regulatory proposals now pending regarding the ability of municipalities to construct and deploy broadband facilities that could compete with our cable systems. In addition, certain telephone companies are seeking authority to operate in communities without first obtaining a local franchise. As a result, competing operators may build systems in areas in which we hold franchises. The FCC has adopted rules that streamline entry for new competitors (including those affiliated with telephone companies) and reduce franchising burdens for these new entrants. At the same time, a substantial number of states have adopted new franchising laws. Again, these laws were principally designed to streamline entry for new competitors, and they often provide advantages for these new entrants that are not immediately available to existing operators. As a result of these new franchising laws and regulations, we have seen an increase in the number of competitive cable franchises or operating certificates being issued, and we anticipate that trend to continue.
We believe the markets we serve are not significantly overbuilt. However, the FCC and some state regulatory commissions direct certain subsidies to entities deploying broadband to areas deemed to be "unserved" or "underserved." Many other organizations have applied for and received these funds, including broadband services competitors and new entrants into such services. We have generally opposed such subsidies when directed to areas that we serve and have deployed broadband capable networks. Despite those efforts, we could be placed at a competitive disadvantage if recipients use these funds to subsidize services that compete with our broadband services.
Local franchising authorities have the ability to impose additional regulatory constraints on our business, which could reduce our revenues or increase our expenses.
In addition to the franchise agreement, local franchising authorities in some jurisdictions have adopted cable regulatory ordinances that further regulate the operation of cable systems. This additional regulation increases the cost of operating our business. For example, some local franchising authorities impose minimum customer service standards on our operations. There are no assurances that the local franchising authorities will not impose new and more restrictive requirements. Local franchising authorities who are certified to regulate rates generally have the power to reduce rates and order refunds on the rates charged for basic service and equipment, which could reduce our revenues.
Further regulation of the cable industry could restrict our marketing options or impair our ability to raise rates to cover our increasing costs.
The cable industry has operated under a federal rate regulation regime for approximately two decades. Currently, rate regulation is strictly limited to the basic service tier and associated equipment and installation activities. Our franchise authorities have not certified to exercise this limited rate regulation authority, and they would now need to demonstrate the absence of "effective competition" (as defined under federal law) as part of any rate regulation certification. However, the FCC and Congress continue to be concerned that cable rate increases are exceeding inflation. It is possible that either the FCC or Congress will adopt more extensive rate regulation for our pay television services or regulate our other services, such as broadband and telephony services, which could impede our ability to raise rates, or require rate reductions. To the extent we are unable to raise our rates in response to increasing costs, or are required to reduce our rates, our business, financial condition, results of operations and liquidity will be materially adversely affected. There has been legislative and regulatory
37
interest in requiring cable operators to offer historically bundled programming services on an à la carte basis. It is possible that new marketing restrictions could be adopted in the future. These restrictions could affect how we provide, and limit, customer equipment used in connection with our services and how we provide access to video programming beyond conventional cable delivery. A recent FCC proposal that would require MVPDs to accommodate third-party devices through the provision of multiple "information flows" to third-party devices could, if adopted, adversely affect our relationship with our customers and programmers and our operations. It is also possible that regulations will be adopted affecting the negotiations between MVPDs (like us) and programmers. While these regulations might provide us with additional rights and protections in our programming negotiations, they might also limit our flexibility in ways that adversely affect our operations.
We may be materially adversely affected by regulatory changes related to pole attachment costs.
Pole attachments are cable wires that are attached to utility poles. Cable system pole attachments to utility poles historically have been regulated at the federal or state level, generally resulting in favorable pole attachment rates for attachments used to provide cable service. Any changes in the current pole attachment approach could result in a substantial increase in our pole attachment costs.
Changes in channel carriage regulations could impose significant additional costs on us.
Cable operators also face significant regulation affecting the carriage of broadcast and other programming channels. We can be required to devote substantial capacity to the carriage of programming that we might not otherwise carry voluntarily, including certain local broadcast signals; local public, educational and governmental access programming; and unaffiliated, commercial leased access programming (channel capacity designated for use by programmers unaffiliated with the cable operator). Regulatory changes in this area could disrupt existing programming commitments, interfere with our preferred use of limited channel capacity and limit our ability to offer services that would maximize our revenue potential. It is possible that other legal restraints will be adopted limiting our discretion over programming decisions.
Increasing regulation of our Internet-based products and services could adversely affect our ability to provide new products and services.
On February 26, 2015, the FCC adopted a new "network neutrality" or Open Internet order (the "2015 Order") that: (1) reclassified broadband Internet access service as a Title II common carrier service, (2) applied certain existing Title II provisions and associated regulations; (3) forbore from applying a range of other existing Title II provisions and associated regulations, but to varying degrees indicated that this forbearance may be only temporary and (4) issued new rules expanding disclosure requirements and prohibiting blocking, throttling, paid prioritization and unreasonable interference with the ability of end users and edge providers to reach each other. The 2015 Order also subjected broadband providers' Internet traffic exchange rates and practices to potential FCC oversight and created a mechanism for third parties to file complaints regarding these matters. The 2015 Order has been appealed by multiple parties, but the rules are currently in effect. The 2015 Order could limit our ability to efficiently manage our cable systems and respond to operational and competitive challenges.
Offering telephone services may subject us to additional regulatory burdens, causing us to incur additional costs.
We offer telephone services over our broadband network and continue to develop and deploy interconnected VoIP services. The FCC has ruled that competitive telephone companies that support VoIP services, such as those that we offer to our customers, are entitled to interconnect with incumbent providers of traditional telecommunications services, which ensures that our VoIP services can operate in the market. However, the scope of these interconnection rights are being reviewed in a current
38
FCC proceeding, which may affect our ability to compete in the provision of telephony services or result in additional costs. It remains unclear precisely to what extent federal and state regulators will subject VoIP services to traditional telephone service regulation. Expanding our offering of these services may require us to obtain certain authorizations, including federal and state licenses. We may not be able to obtain such authorizations in a timely manner, or conditions could be imposed upon such licenses or authorizations that may not be favorable to us. The FCC has already extended certain traditional telecommunications requirements, such as E911 capabilities, Universal Service Fund contribution, Communications Assistance for Law Enforcement Act ("CALEA"), measures to protect Customer Proprietary Network Information, customer privacy, disability access, number porting, battery back-up, network outage reporting, rural call completion reporting and other regulatory requirements to many VoIP providers such as us. If additional telecommunications regulations are applied to our VoIP service, it could cause us to incur additional costs and may otherwise materially adversely impact our operations. In 2011, the FCC released an order significantly changing the rules governing intercarrier compensation for the origination and termination of telephone traffic between interconnected carriers. These rules have resulted in a substantial decrease in interstate compensation payments over a multi-year period. Further, the FCC's initiative to collect data concerning certain point to point transport ("special access") services we provide could result in additional regulatory burdens and additional costs.
We may be materially adversely affected by regulatory, legal and economic changes relating to our physical plant.
Our systems depend on physical facilities, including transmission equipment and miles of fiber and coaxial cable. Significant portions of those physical facilities occupy public rights-of-way and are subject to local ordinances and governmental regulations. Other portions occupy private property under express or implied easements, and many miles of the cable are attached to utility poles governed by pole attachment agreements. No assurances can be given that we will be able to maintain and use our facilities in their current locations and at their current costs. Changes in governmental regulations or changes in these relationships could have a material adverse effect on our business and our results of operations.
Changes in tax legislation could adversely affect our business, financial condition and results of operations.
The current administration and the Republican members of the U.S. House of Representatives have publicly stated that one of their top legislative priorities is significant reform of the U.S. federal income tax legislation, including significant changes to the taxation of business entities. Changes in U.S. federal income tax legislation may adversely affect our business, financial condition and results of operations. The timing and details of any tax reform, as well as the impact it may have on us, remain unclear.
Risk Factors Relating to This Offering and Ownership of Our Class A Common Stock
Prior to this offering, no market existed for our Class A common stock and we cannot assure you that an active, liquid trading market will develop for our Class A common stock.
Prior to this offering, there has been no public market for shares of our Class A common stock. We cannot predict the extent to which investor interest in our Company will lead to the development and sustainment of an active trading market on the NYSE or otherwise, or how liquid that market might become. A public trading market having the desirable characteristics of depth, liquidity and orderliness depends upon the existence of willing buyers and sellers at any given time, such existence being dependent upon the individual decisions of buyers and sellers over which neither we nor any market maker has control. If an active and liquid trading market does not develop, you may have difficulty selling any shares of our Class A common stock that you purchase in this initial public
39
offering and the value of our Class A common stock may be materially adversely affected. The initial public offering price for the shares of our Class A common stock was determined by negotiations between us, the selling stockholders and the representatives of the underwriters, and may not be indicative of prices that will prevail in the open market following this offering. The market price of our Class A common stock may decline below the initial public offering price, and you may not be able to sell your shares of our Class A common stock at or above the price you paid in this offering, or at all. An inactive and illiquid trading market may also impair our ability to raise capital to continue to fund operations by selling shares of our Class A common stock and may impair our ability to acquire other companies or technologies by using our Class A common stock as consideration.
You will experience immediate and substantial dilution in the net tangible book value of the shares of Class A common stock you purchase in this offering.
If you purchase shares of our Class A common stock in this offering you will experience immediate and substantial dilution, as the initial public offering price of our Class A common stock will be substantially greater than the pro forma net tangible book value per share of our Class A common stock. If you purchase our Class A common stock in this offering, you will suffer immediate and substantial dilution of approximately $61.11 per share, representing the difference between our pro forma net tangible book deficit per share after giving effect to this offering and the initial public offering price.
Your percentage ownership in us may be diluted by future issuances of capital stock, which could reduce your influence over matters on which stockholders vote.
Pursuant to our amended and restated certificate of incorporation, our board of directors will have the authority, without action or vote of our stockholders, to issue all or any part of our authorized but unissued shares of Class A common stock, including shares issuable upon the exercise of options, Class B common stock, Class C common stock or shares of our authorized but unissued preferred stock. We may issue such capital stock to meet a number of our business needs, including funding any potential acquisitions or other strategic transactions. Issuances of Class A common stock, Class B common stock or voting preferred stock could reduce your influence over matters on which our stockholders vote and, in the case of issuances of preferred stock, would likely result in your interest in us being subject to the prior rights of holders of that preferred stock.
If the market price of our Class A common stock is volatile after this offering, you could lose a significant part of your investment.
Securities markets often experience significant price and volume fluctuations, so even if a trading market develops, the market price of our Class A common stock may be highly volatile and could be subject to wide fluctuations. The market price of our Class A common stock will be influenced by many factors, some of which are beyond our control, including those described above in "—Risk Factors Relating to Our Business" and including, but not limited to, the following:
- •
- the failure of securities analysts to cover our Class A common stock after this offering or changes in financial estimates by analysts;
- •
- the inability to meet the financial estimates of analysts who follow our Class A common stock;
- •
- strategic actions by us or our competitors;
- •
- announcements by us or our competitors of significant contracts, acquisitions, joint marketing relationships, joint ventures or capital
commitments;
- •
- introduction of new products or services by us or our competitors;
40
- •
- variations in our quarterly operating results and those of our competitors;
- •
- variations in Altice N.V.'s operating results and the market price of its shares;
- •
- additions or departures of key personnel;
- •
- general economic and stock market conditions;
- •
- risks related to our business and our industry, including those discussed above;
- •
- changes in conditions or trends in our industry, markets or customers;
- •
- regulatory, legal or political developments;
- •
- changes in accounting principles;
- •
- changes in tax legislation and regulations;
- •
- litigation and governmental investigations;
- •
- terrorist acts;
- •
- future sales of our Class A common stock or other securities;
- •
- default under agreements governing our indebtedness; and
- •
- investor perceptions of the investment opportunity associated with our Class A common stock relative to other investment alternatives.
As a result of these and other factors, investors in our Class A common stock may not be able to resell their shares at or above the initial offering price or may not be able to resell them at all. These broad market and industry factors may materially reduce the market price of our Class A common stock, regardless of our operating performance. In addition, price volatility may be greater if the public float and trading volume of our Class A common stock is low.
Because we have no current plans to pay cash dividends on our Class A common stock for the foreseeable future, you may not receive any return on investment unless you sell your Class A common stock for a price greater than that which you paid for it.
We intend to retain future earnings, if any, for future operations, expansion and debt repayment and have no current plans to pay any cash dividends for the foreseeable future. The declaration, amount and payment of any future dividends on shares of Class A common stock will be at the sole discretion of our board of directors. Our board of directors may take into account general and economic conditions, our financial condition and results of operations, our available cash and current and anticipated cash needs, capital requirements, contractual, legal, tax and regulatory restrictions and implications on the payment of dividends by us to our stockholders or by our subsidiaries to us and such other factors as our board of directors may deem relevant. In addition, our ability to pay dividends is limited by covenants contained in the agreements governing our existing indebtedness and may be limited by covenants contained in any future indebtedness we or our subsidiaries incur. As a result, you may not receive any return on an investment in our Class A common stock unless you sell our Class A common stock for a price greater than that which you paid for it. For more information, see "Dividend Policy."
Future sales, or the perception of future sales, by us or our existing stockholders in the public market following this offering could cause the market price for our Class A common stock to decline.
After this offering, the sale of substantial amounts of shares of our Class A common stock in the public market, or the perception that such sales could occur, could cause the prevailing market price of shares of our Class A common stock to decline. These sales, or the possibility that these sales may
41
occur, also might make it more difficult for us to sell equity securities in the future at a time and at a price that we deem appropriate.
Upon consummation of this offering we will have a total of 737,068,966 shares of Class A common stock outstanding. All of the shares of Class A common stock sold in this offering will be freely tradable without restriction or further registration under the Securities Act of 1933, as amended (the "Securities Act").
Any shares held by our affiliates, as that term is defined under Rule 144 of the Securities Act ("Rule 144"), including Altice N.V. and its affiliates, may be sold only in compliance with the limitations described in "Shares Eligible for Future Sale."
The remaining shares will be "restricted securities" within the meaning of Rule 144 and subject to certain restrictions on resale following the consummation of this offering. Restricted securities may be sold in the public market only if they are registered under the Securities Act or are sold pursuant to an exemption from registration such as Rule 144, as described in "Shares Eligible for Future Sale."
We and our executive officers, directors, and holders of substantially all of our common stock have agreed with the underwriters, subject to certain exceptions, not to dispose of or hedge any of our or their common stock or securities convertible into or exchangeable for shares of common stock during the period from the date of this prospectus continuing through the date 180 days after the date of this prospectus, except with the prior written consent of J.P. Morgan Securities LLC and Morgan Stanley & Co. LLC.
Upon the expiration of the lock-up agreements, the remaining shares will be eligible for resale, which would be subject to volume, manner of sale and other limitations under Rule 144. In addition, pursuant to a stockholders and registration rights agreement, our existing owners have the right, subject to certain conditions, to require us to register the sale of their shares of our Class A common stock, or shares of Class A common stock issuable on conversion of shares of Class B common stock under the Securities Act. By exercising their registration rights and selling a large number of shares, our existing owners could cause the prevailing market price of our Class A common stock to decline. Following completion of this offering, the shares covered by registration rights would represent approximately 79.6% of our outstanding Class A common stock (or 77.5%, if the underwriters exercise in full their option to purchase additional shares). Registration of any of these outstanding shares of Class A common stock would result in such shares becoming freely tradable without compliance with Rule 144 upon effectiveness of the registration statement. See "Shares Eligible for Future Sale."
In addition, we intend to file one or more registration statements on Form S-8 under the Securities Act to register shares of our Class A common stock or securities convertible into or exchangeable for shares of our Class A common stock issued pursuant to the Altice USA 2017 Long Term Incentive Plan. Any such Form S-8 registration statements will automatically become effective upon filing. Shares registered under any such registration statement would be available for sale in the public market following the effective date, unless such shares are subject to vesting restrictions with us, Rule 144 restrictions applicable to our affiliates or the lock-up agreements described elsewhere in this prospectus.
As restrictions on resale end or if these stockholders exercise their registration rights, the market price of our Class A common stock could drop significantly if the holders of Class A common stock sell them or are perceived by the market as intending to sell them. These factors could also make it more difficult for us to raise additional funds through future offerings of our Class A common stock or other securities. In the future, we may also issue our securities in connection with investments or acquisitions. The amount of shares of our Class A common stock or Class C common stock issued in connection with an investment or acquisition could constitute a material portion of then-outstanding shares of our
42
Class A common stock. Any issuance of additional securities in connection with investments or acquisitions may result in additional dilution to you.
The tri-class structure of our common stock has the effect of concentrating voting control with Altice N.V. and its affiliates. This will limit or preclude your ability to influence corporate matters, including the election of directors, amendments of our organizational documents and any merger, consolidation, sale of all or substantially all of our assets or other major corporate transaction requiring stockholder approval. Shares of Class B common stock will not automatically convert to shares of Class A common stock upon transfer to a third party.
Following this offering, our Class B common stock will have twenty-five votes per share and our Class A common stock, which is the stock we are offering in this offering, will have one vote per share. If we issue any shares of Class C common stock, they will be non-voting. Immediately following the completion of this offering, Altice Parties will indirectly hold in the aggregate 98.5% of the voting power of our capital stock.
Because of the twenty-five to one voting ratio between our Class B common stock and Class A common stock, Altice N.V. and its affiliates will continue to control a majority of the combined voting power of our capital stock and therefore be able to control all matters submitted to our stockholders for approval until such date as the holders of a majority of our Class B common stock choose to voluntarily convert their shares into shares of Class A common stock and cease to own shares of our capital stock entitling them to cast a majority of the outstanding votes. This concentrated control will limit or preclude your ability to influence corporate matters for the foreseeable future, including the election of directors, amendments of our organizational documents and any merger, consolidation, sale of all or substantially all of our assets or other major corporate transaction requiring stockholder approval. The disparate voting rights of our common stock may also prevent or discourage unsolicited acquisition proposals or offers for our capital stock that you may feel are in your best interest as one of our stockholders. For additional information, see "Description of Capital Stock."
Shares of our Class B common stock will be convertible into shares of our Class A common stock at the option of the holder at any time. Our amended and restated certificate of incorporation will not provide for the automatic conversion of shares of Class B common stock upon transfer under any circumstances. The holders of Class B common stock thus will be free to transfer them without converting them into shares of Class A common stock.
Altice N.V. and Mr. Drahi will continue to control us and their interests may conflict with ours or yours in the future.
The beneficial ownership interests of Altice Parties following the offering will depend on the price of the shares offered and the number of shares sold. Immediately following this offering, Altice Parties will own 75.2% of our issued and outstanding Class A and Class B common stock which will represent approximately 98.5% of the voting power of our outstanding capital stock. So long as Altice N.V. continues to own common stock representing a substantial portion of the voting power of our capital stock, Altice N.V. and, through his control of Altice N.V., Mr. Drahi, will be able to significantly influence the composition of our board of directors and thereby influence our policies and operations, including the appointment of management, future issuances of our common stock or other securities, the payment of dividends, if any, on our common stock, the incurrence or modification of debt by us, amendments to our amended and restated certificate of incorporation and amended and restated bylaws and the entering into of extraordinary transactions, and their interests may not in all cases be aligned with your interests. In addition, Altice N.V. may have an interest in pursuing acquisitions, divestitures and other transactions that, in its judgment, could enhance its investment or improve its financial condition, even though such transactions might involve risks to you. For example, Altice N.V.
43
could cause us to make acquisitions that increase our indebtedness or cause us to sell revenue-generating assets.
So long as Altice N.V. continues to hold a substantial portion of the voting power of our capital stock, Altice N.V. and, through his control of Altice N.V., Mr. Drahi, will continue to be able to significantly influence or effectively control our decisions. In addition, Altice N.V. will be able to determine the outcome of all matters requiring stockholder approval and will be able to cause or prevent a change of control of the Company or a change in the composition of our board of directors and could preclude any unsolicited acquisition of the Company. The concentration of ownership could deprive you of an opportunity to receive a premium for your shares of our Class A common stock as part of a sale of the Company and ultimately might affect the market price of our Class A common stock.
In addition, we have entered into agreements with affiliates of Altice N.V. pursuant to which they provide us software and network equipment, design and development services, technical services and support for our customers and proprietary content, for which we compensate them on a regular basis. A subsidiary of Altice N.V. also provides consulting, advisory and other services to us in connection with our acquisitions, divestitures, investments, capital raising, financial and business affairs for a quarterly fee. The subsidiary will assign the agreement under which it provides these services to us to Altice N.V. prior to the closing of this offering. If conflicts arise between us and Altice N.V., these conflicts could be resolved in a manner that is unfavorable to us and as a result, our business, financial condition and results of operations could be materially adversely affected. See "Certain Relationships and Related Party Transactions." In addition, if Altice N.V. ceases to control us or we otherwise lose access to the services and expertise available to us through Altice N.V., including, for example, ATS and Altice Labs, our business, financial condition and results of operations could be adversely affected.
Anti-takeover provisions in our organizational documents could delay or prevent a change of control transaction.
Certain provisions of our amended and restated certificate of incorporation and amended and restated bylaws that will be in effect on the closing of this offering may have an anti-takeover effect and may delay, defer or prevent a merger, acquisition, tender offer, takeover attempt or other change of control transaction that a stockholder might consider in its best interest, including those attempts that might result in a premium over the market price for the shares held by our stockholders.
These provisions will provide for, among other things:
- •
- a tri-class common stock structure, as a result of which Altice N.V. generally will be able to control the outcome of all matters
requiring stockholder approval, including the election of directors and significant corporate transactions, such as a merger or other sale of our company or its assets;
- •
- the ability of our board of directors to, without further action by our stockholders, fix the rights, preferences, privileges and restrictions
of up to an aggregate of 100,000,000 shares of preferred stock in one or more series and authorize their issuance; and
- •
- the ability of stockholders holding a majority of the voting power of our capital stock to call a special meeting of stockholders.
These anti-takeover provisions could make it more difficult for a third party to acquire us, even if the third-party's offer may be considered beneficial by many of our stockholders. As a result, our stockholders may be limited in their ability to obtain a premium for their shares of our Class A common stock. See "Description of Capital Stock." In addition, so long as Altice N.V. continues to hold a significant amount of our combined voting power it will be able to prevent a change of control of the Company.
44
Holders of a single series of our common stock may not have any remedies if an action by our directors has an adverse effect on only that series of our common stock.
Under Delaware law, the board of directors has a duty to act with due care and in the best interests of all of our stockholders, including the holders of all series of our common stock. Principles of Delaware law established in cases involving differing treatment of multiple classes or series of stock provide that a board of directors owes an equal duty to all common stockholders regardless of class or series and does not have separate or additional duties to any group of stockholders. As a result, in some circumstances, our directors may be required to make a decision that could be viewed as adverse to the holders of one series of our common stock. Under the principles of Delaware law and the business judgment rule, holders may not be able to successfully challenge decisions that they believe have a disparate impact upon the holders of one series of our stock if our board of directors is disinterested and independent with respect to the action taken, is adequately informed with respect to the action taken and acts in good faith and in the honest belief that the board is acting in the best interest of all of our stockholders.
We will continue to be a "controlled company" within the meaning of the rules of the NYSE. As a result, we will qualify for, and intend to rely on, exemptions from certain corporate governance requirements that would otherwise provide protection to stockholders of other companies.
After completion of this offering, Altice N.V. will continue to control a majority of the voting power of our capital stock. As a result, we will be a "controlled company" within the meaning of the corporate governance standards of the NYSE. Under these rules, a company of which more than 50% of the voting power is held by an individual, group or another company is a "controlled company" and may elect not to comply with certain corporate governance requirements, including:
- •
- the requirement that a majority of our board of directors consists of "independent directors" as defined under the rules of the NYSE;
- •
- the requirement that we have a governance and nominating committee; and
- •
- the requirement that the compensation of our executive officers be determined, or recommended to our board of directors for determination, by a compensation committee comprised solely of independent directors with a written charter addressing the committees' purpose and responsibilities.
Consistent with these exemptions, upon listing with the NYSE we do not intend to have (i) a majority of independent directors on our board of directors; (ii) a fully independent compensation committee; or (iii) a nominating and governance committee. Accordingly, you will not have the same protections afforded to stockholders of companies that are subject to all of the corporate governance requirements of the NYSE.
We will incur increased costs as a result of becoming a public company and in the administration of our organizational structure.
As a public company, we will incur significant legal, accounting, insurance and other expenses that we have not incurred as a private company, including costs associated with public company reporting requirements of the Securities Exchange Act of 1934, as amended (the "Exchange Act"), the Sarbanes-Oxley Act of 2002 (the "Sarbanes-Oxley Act"), the Dodd-Frank Wall Street Reform and Consumer Protection Act of 2010, the listing requirements of the NYSE and other applicable securities laws and regulations. We also have incurred and will incur costs associated with the Sarbanes-Oxley Act and related rules implemented by the SEC. Following the completion of this offering, we will incur ongoing periodic expenses in connection with the administration of our organizational structure. The expenses incurred by public companies generally for reporting and corporate governance purposes have been
45
increasing. We expect these rules and regulations to increase our legal and financial compliance costs and to make some activities more time-consuming and costly, although we are currently unable to estimate these costs with any degree of certainty. These laws and regulations could also make it more difficult or costly for us to obtain certain types of insurance, including director and officer liability insurance, and we may be forced to accept reduced policy limits and coverage or incur substantially higher costs to obtain the same or similar coverage. If these requirements divert the attention of our management and personnel from other business concerns, they could have a material adverse effect on our business, financial condition and results of operations. These laws and regulations could also make it more difficult for us to attract and retain qualified persons to serve on our board of directors, our board committees or as our executive officers. Furthermore, if we are unable to satisfy our obligations as a public company, we could be subject to delisting of our Class A common stock, fines, sanctions and other regulatory action and potentially civil litigation.
Failure to achieve and maintain effective internal controls in accordance with Section 404 of Sarbanes-Oxley could have a material adverse effect on our business and stock price.
We are not currently required to comply with the rules of the SEC implementing Section 404 of the Sarbanes-Oxley Act and therefore are not required to make a formal assessment of the effectiveness of our internal control over financial reporting for that purpose. As a public company, we will be required to document and test our internal control procedures in order to satisfy the requirements of Section 404 of Sarbanes-Oxley, which will require annual management assessments of the effectiveness of our internal control over financial reporting and a report by our independent registered public accounting firm that addresses the effectiveness of internal control over financial reporting. During the course of our testing, we may identify deficiencies which we may not be able to remediate in time to meet our deadline for compliance with Section 404. If our management cannot favorably assess the effectiveness of our internal control over financial reporting or our auditors identify material weaknesses in our internal controls, investor confidence in our financial results may weaken, and our stock price may suffer, and we could become subject to investigations by the NYSE, the SEC or other regulatory authorities, which could require additional financial and management resources.
If securities or industry analysts do not publish research or reports about our business, if they adversely change their recommendations regarding our Class A common stock or if our operating results do not meet their expectations, the market price of our Class A common stock could decline.
The trading market for our Class A common stock will be influenced by the research and reports that industry or securities analysts publish about us or our business. We do not have any control over these analysts. If one or more of these analysts cease coverage of our company or fail to publish reports on us regularly, we could lose visibility in the financial markets, which in turn could cause our stock price or trading volume to decline. Moreover, if one or more of the analysts who cover our company downgrades our Class A common stock or if our operating results do not meet their expectations, the market price of our Class A common stock could decline.
In addition, Altice N.V. is a publicly listed company traded on the Euronext and is subject to equity market volatility, general economic conditions and regulatory changes which may adversely affect the market price of the Altice N.V. ordinary shares. Altice N.V. is currently controlled by Next Alt S.á r.l., a company that is controlled by Mr. Drahi. Next Alt S.á r.l. could sell a substantial number of ordinary shares of Altice N.V. in the public market and such sales, or the perception that such sales could occur, may materially and adversely affect the market price of Altice N.V.'s ordinary shares. A decrease in Altice N.V. share price could negatively affect the market price of our Class A common stock.
46
We could be subject to securities class action litigation.
In the past, securities class action litigation has often been instituted against companies whose securities have experienced periods of volatility in market price. Securities litigation brought against us following volatility in the price of our Class A common stock, regardless of the merit or ultimate results of such litigation, could result in substantial costs, which would hurt our financial condition and results of operations and divert management's attention and resources from our business.
We will have broad discretion in the use of the net proceeds to us from this offering and may not use them effectively.
We will have broad discretion in the application of the net proceeds to us from this offering, including for any of the purposes described in the section titled "Use of Proceeds," and you will not have the opportunity as part of your investment decision to assess whether the net proceeds are being used appropriately. Because of the number and variability of factors that will determine our use of the net proceeds from this offering, their ultimate use may vary substantially from their currently intended use. The failure by our management to apply these funds effectively could harm our business. Pending their use, we may invest the net proceeds from this offering in short-term, investment-grade interest-bearing securities such as money market accounts, certificates of deposit, commercial paper, and guaranteed obligations of the U.S. government that may not generate a high yield to our stockholders. These investments may not yield a favorable return to our investors.
Our amended and restated bylaws will provide that the Court of Chancery of the State of Delaware will be the exclusive forum for substantially all disputes between us and our stockholders, which could limit our stockholders' ability to obtain a favorable judicial forum for disputes with us or our directors, officers or other stockholders.
Our amended and restated bylaws that will be in effect on the closing of this offering will provide that the Court of Chancery of the State of Delaware (or, if the Court of Chancery does not have jurisdiction, another state or federal court located in the State of Delaware) shall be the exclusive forum for: (i) any derivative action or proceeding brought in our name or on our behalf; (ii) any action asserting a breach of fiduciary duty; (iii) any action asserting a claim against us arising under the General Corporation Law of the State of Delaware ("DGCL"); (iv) any action regarding our amended and restated certificate of incorporation or our amended and restated bylaws; or (v) any action asserting a claim against us that is governed by the internal affairs doctrine. Our amended and restated bylaws will permit our board of directors to approve the selection of an alternative forum. Unless waived, this exclusive forum provision may limit a stockholder's ability to bring a claim in a judicial forum that it finds favorable for disputes with us or our directors, officers or other stockholders, which may discourage such lawsuits against us and our directors, officers and other stockholders. Alternatively, if a court were to find this provision in our amended and restated bylaws to be inapplicable or unenforceable in an action, we may incur additional costs associated with resolving such action in other jurisdictions, which could adversely affect our business, financial condition and results of operations.
47
CAUTIONARY STATEMENT REGARDING FORWARD-LOOKING STATEMENTS
This prospectus includes statements that express our opinions, expectations, beliefs, plans, objectives, assumptions or projections regarding future events or future results and therefore are, or may be deemed to be, "forward-looking statements." These "forward-looking statements" appear throughout this prospectus, including in sections entitled "Prospectus Summary," Risk Factors," "Management's Discussion of Analysis of Financial Condition and Results of Operations" and "Business" and relate to matters such as anticipated future growth in revenues, operating income, cash provided by operating activities and other financial measures. Words such as "expects," "anticipates," "believes," "estimates," "may," "will," "should," "could," "seeks," "potential," "continue," "intends," "plans" and similar words and terms used in the discussion of future operating results, future financial performance and future events identify forward-looking statements in this prospectus. All of these forward-looking statements are based on management's current expectations and beliefs about future events. As with any projection or forecast, they are susceptible to uncertainty and changes in circumstances.
We operate in a highly competitive, consumer and technology driven and rapidly changing business that is affected by government regulation and economic, strategic, technological, political and social conditions. Various factors could adversely affect our operations, business or financial results in the future and cause our actual results to differ materially from those contained in the forward-looking statements, including those factors discussed under "Risk Factors" in this prospectus. In addition, important factors that could cause our actual results to differ materially from those in our forward-looking statements include:
- •
- competition for broadband, pay television and telephony customers from existing competitors (such as broadband communications companies, DBS
providers and Internet-based providers) and new competitors entering our footprint;
- •
- changes in consumer preferences, laws and regulations or technology that may cause us to change our operational strategies;
- •
- increased difficulty negotiating programming agreements on favorable terms, if at all, resulting in increased costs to us and/or the loss of
popular programming;
- •
- increasing programming costs and delivery expenses related to our products and services;
- •
- our ability to achieve anticipated customer and revenue growth, to successfully introduce new products and services and to implement our growth
strategy;
- •
- our ability to complete our capital investment plans on time and on budget, including our five-year plan to build a FTTH network and deploy our
new home communications hub;
- •
- the effects of economic conditions or other factors which may negatively affect our customers' demand for our products and services;
- •
- the effects of industry conditions;
- •
- demand for advertising on our cable systems;
- •
- our substantial indebtedness and debt service obligations;
- •
- adverse changes in the credit market;
- •
- financial community and rating agency perceptions of our business, operations, financial condition and the industries in which we operate;
- •
- the restrictions contained in our financing agreements;
- •
- our ability to generate sufficient cash flow to meet our debt service obligations;
48
- •
- fluctuations in interest rates which may cause our interest expense to vary from quarter to quarter;
- •
- technical failures, equipment defects, physical or electronic break-ins to our services, computer viruses and similar problems;
- •
- the disruption or failure of our network, information systems or technologies as a result of computer hacking, computer viruses,
"cyber-attacks," misappropriation of data, outages, natural disasters and other material events;
- •
- our ability to obtain necessary hardware, software, communications equipment and services and other items from our vendors at reasonable costs;
- •
- our ability to effectively integrate acquisitions and to maximize expected operating efficiencies from our acquisitions or as a result of the
transactions contemplated hereby;
- •
- significant unanticipated increases in the use of bandwidth-intensive Internet-based services;
- •
- the outcome of litigation and other proceedings; and
- •
- other risks and uncertainties inherent in our cable and other broadband communications businesses and our other businesses, including those listed under the caption "Risk Factors" in this prospectus.
Additional risks, uncertainties and other factors that may cause our actual results, performance or achievements to be different from those expressed or implied in our forward-looking statements may be found under "Risk Factors" contained in this prospectus. These factors and other risk factors disclosed in this prospectus are not necessarily all of the important factors that could cause our actual results to differ materially from those expressed in any of our forward-looking statements. Other unknown or unpredictable factors could cause our actual results to differ materially from those expressed in any of our forward-looking statements.
Given these uncertainties, you are cautioned not to place undue reliance on such forward-looking statements. The forward-looking statements contained in this prospectus are made only as of the date of this prospectus. Except to the extent required by law, we do not undertake, and specifically decline any obligation, to update any forward-looking statements or to publicly announce the results of any revisions to any of such statements to reflect future events or developments. Comparisons of results for current and any prior periods are not intended to express any future trends or indications of future performance, unless expressed as such, and should only be viewed as historical data.
You should read this prospectus and the documents that we reference in this prospectus and have filed with the SEC as exhibits to the registration statement of which this prospectus is a part with the understanding that our actual future results, levels of activity, performance and events and circumstances may be materially different from what we expect. We qualify all forward-looking statements by these cautionary statements.
49
We estimate that the net proceeds to us from this offering, after deducting the underwriting discount and estimated offering expenses payable by us, will be approximately $330,950,000, based on an assumed initial public offering price of $29.00 per share, the mid-point of the price range set forth on the cover page of this prospectus. An increase or decrease in the initial public offering price by $1.00 per share above or below the mid-point of the proposed range would result in an increase or decrease of approximately $11,670,690, as applicable, in net proceeds to us assuming the number of shares offered by us stays constant. We will not receive any proceeds from the sale of shares by the selling stockholders.
We currently intend to use the net proceeds that we receive from this offering to redeem a portion of the $2 billion aggregate principal amount outstanding of the CSC 2025 Senior Notes issued by CSC Holdings, our wholly-owned subsidiary. At any time prior to October 15, 2018, CSC Holdings may redeem up to 40% of the original aggregate principal amount of the CSC 2025 Senior Notes with the proceeds of certain equity offerings at a redemption price of 110.875% of the principal amount, together with accrued and unpaid interest, if any, to, but excluding, the date of redemption. See "Description of Certain Indebtedness—Cablevision Bonds—CSC Holdings Notes."
50
During fiscal year 2015, Cablevision, our predecessor company, paid a regular quarterly cash dividend of $0.15 per share to holders of both Cablevision's Class A common stock and Class B common stock on April 3, 2015, June 12, 2015 and September 10, 2015. In the fourth quarter of 2016, we declared combined cash dividends of approximately $445 million to our stockholders of which approximately $365 million was paid in the fourth quarter of 2016 and approximately $80 million was paid in the first quarter of 2017. In addition, in April 2017, we made a cash distribution of approximately $170 million to our stockholders. Prior to the closing of this offering, we will make a cash distribution of approximately $670 million to our stockholders, which will be funded by borrowings of approximately $500 million under the CVC Revolving Credit Facility and approximately $170 million of cash on hand.
We currently intend to retain any future earnings to fund the operation, development and expansion of our business and do not intend to pay any dividends on our Class A common stock. Any future determination relating to our dividend policy will be made in the sole and absolute discretion of our board of directors and will depend upon then existing conditions, including our financial condition, results of operations, contractual restrictions, capital requirements, business prospects and other factors that our board of directors may deem relevant. See "Risk Factors—Risk Factors Relating to This Offering and Ownership of Our Class A Common Stock—Because we have no current plans to pay cash dividends on our Class A common stock for the foreseeable future, you may not receive any return on investment unless you sell your Class A common stock for a price greater than that which you paid for it."
In addition, we are a holding company that does not conduct any business operations of our own. As a result, our ability to pay cash dividends on our Class A common stock is dependent upon cash dividends and distributions and other transfers from our subsidiaries. The terms of certain debt instruments to which our subsidiaries are a party currently limit, subject to certain exceptions and qualifications, their ability and the ability of their restricted subsidiaries to: (i) pay dividends or make other distributions or repurchase or redeem our capital stock or subordinated debt, (ii) engage in certain transactions with affiliates and (iii) enter into agreements that restrict the payment of dividends by subsidiaries or the repayment of intercompany loans and advances. See "Description of Certain Indebtedness."
51
The following table sets forth our cash and cash equivalents and capitalization as of March 31, 2017 (dollars in thousands):
- •
- on an actual basis;
- •
- on a pro forma basis to give effect to the Pre-IPO Distribution and the Organizational Transactions, as defined in
"Summary—Ownership and Organization—Organizational Transactions," the accrual of $169,950 of cash distributions made to the Company's stockholders in April 2017,
and
- •
- on a pro forma as adjusted basis to give effect to the sale by us of 12,068,966 shares of our Class A common stock in this offering, based on an assumed public offering price of $29.00 per share, the mid-point of the price range set forth on the cover page of this prospectus, and after deducting the underwriting discount and the estimated offering expenses payable by us, and the intended use of the net proceeds therefrom as described in "Use of Proceeds."
The as adjusted information below is illustrative only and our capitalization following the completion of this offering will be adjusted based on the actual offering price and other terms of this offering determined at pricing. The information set forth below should be read in conjunction with "Selected Historical and Pro Forma Financial Data," "Unaudited Pro Forma Consolidated Financial Information," "Management's Discussion and Analysis of Financial Condition and Results of Operations," the financial statements and related notes and the financial information included elsewhere in this prospectus.
| |
As of March 31, 2017 |
|||||||||
|---|---|---|---|---|---|---|---|---|---|---|
(Dollars in thousands, except share data)
|
Actual | Pro forma | Pro forma As Adjusted |
|||||||
| |
|
(Unaudited) |
(Unaudited) |
|||||||
Cash and cash equivalents(1) |
$ | 463,882 | $ | 313,747 | $ | 248,599 | ||||
| | | | | | | | | | | |
| | | | | | | | | | | |
| | | | | | | | | | | |
Debt: |
||||||||||
Short-term debt: |
||||||||||
Credit facility debt, senior notes and debentures, capital lease obligations and notes payable |
774,659 | 774,659 | 774,659 | |||||||
Collateralized indebtedness |
461,946 | 461,946 | 461,946 | |||||||
Long-term debt: |
||||||||||
Credit facility debt, senior notes and debentures, capital lease obligations and notes payable(2) |
20,254,397 | 20,754,397 | 20,409,494 | |||||||
Collateralized indebtedness |
831,756 | 831,756 | 831,756 | |||||||
Notes payable to affiliates and related parties(3) |
1,750,000 | — | — | |||||||
| | | | | | | | | | | |
Total debt |
24,072,758 | 22,822,758 | 22,477,855 | |||||||
| | | | | | | | | | | |
Redeemable equity |
211,687 | 211,687 | 211,687 | |||||||
| | | | | | | | | | | |
52
| |
As of March 31, 2017 |
|||||||||
|---|---|---|---|---|---|---|---|---|---|---|
(Dollars in thousands, except share data)
|
Actual | Pro forma | Pro forma As Adjusted |
|||||||
| |
|
(Unaudited) |
(Unaudited) |
|||||||
Equity: |
||||||||||
Preferred Stock: $0.01 par value, 100,000,000 authorized, no shares issued and outstanding on a pro forma and pro forma as adjusted basis |
— | — | — | |||||||
Class A common stock: $0.01 par value, 4,000,000,000 shares authorized, 234,681,978 issued and outstanding on a pro forma basis and 246,750,944 issued and outstanding on a pro forma as adjusted basis(4) |
— | 2,347 | 2,468 | |||||||
Class B common stock: $0.01 par value, 1,000,000,000 shares authorized, 490,318,022 issued and outstanding on a pro forma basis and pro forma as adjusted basis(4) |
— | 4,903 | 4,903 | |||||||
Class C common stock: $0.01 par value, 4,000,000,000 shares authorized, no shares issued and outstanding on a pro forma and pro forma as adjusted basis |
— | — | — | |||||||
Common stock: $0.01 par value, 1,000 shares authorized, 100 shares issued and outstanding on actual basis |
— | — | — | |||||||
Paid-in capital(5) |
2,867,863 | 4,287,833 | 4,618,662 | |||||||
Accumulated deficit(6) |
(744,172 | ) | (1,261,092 | ) | (1,304,251 | ) | ||||
Accumulated other comprehensive income |
1,979 | 1,979 | 1,979 | |||||||
Noncontrolling interest |
524 | 524 | 524 | |||||||
| | | | | | | | | | | |
Total equity |
2,126,194 | 3,036,494 | 3,324,285 | |||||||
| | | | | | | | | | | |
Total capitalization |
$ | 26,410,639 | $ | 26,070,939 | $ | 26,013,827 | ||||
| | | | | | | | | | | |
| | | | | | | | | | | |
| | | | | | | | | | | |
Total debt excluding collateralized indebtedness |
$ | 22,779,056 | $ | 21,529,056 | $ | 21,184,153 | ||||
| | | | | | | | | | | |
| | | | | | | | | | | |
| | | | | | | | | | | |
Net debt excluding collateralized indebtedness and notes payable to affiliates and related parties plus accrued distributions(7) |
$ | 20,565,174 | $ | 21,555,009 | $ | 21,275,254 | ||||
| | | | | | | | | | | |
| | | | | | | | | | | |
| | | | | | | | | | | |
- (1)
- The
pro forma and pro forma as adjusted amounts reflect the payment of interest on the notes payable to affiliates and related parties of $150,135 accrued through
March 31, 2017. The pro forma as adjusted amount further reflects the estimated net proceeds of $330,950 from this offering and the anticipated redemption of $350,000 principal amount of the
CSC 2025 Senior Notes and payment of the related redemption premium of $38,063 and accrued interest of $8,035 through March 31, 2017. The pro forma and pro forma as adjusted amounts do not
reflect the payment of distributions of $169,950 and $169,750 made in April 2017 and to be made prior to the closing of this offering, respectively. The accrual for these distributions is reflected in
net debt excluding collateralized indebtedness and notes payable to affiliates and related parties plus accrued distributions.
- (2)
- The
pro forma amount reflects borrowings of $500,000 under the CVC Revolving Credit Facility to fund a portion of the Pre-IPO Distribution. The pro forma as adjusted
amount further reflects the anticipated redemption of $350,000 principal amount of the CSC 2025 Senior Notes, net of deferred financing costs of $5,097.
- (3)
- The pro forma and pro forma as adjusted amounts reflect the conversion of notes payable to affiliates and related parties of $1,750,000 to shares of common stock of the Company.
53
- (4)
- The
pro forma amount reflects the issuance of shares of Class A and Class B common stock in connection with the Organizational Transactions and the
Class A common stock pro forma as adjusted amount gives effect to the sale of our Class A common stock in this offering.
- (5)
- The
pro forma and pro forma as adjusted amounts reflect the conversion of notes payable to affiliates and related parties of $1,750,000, as well as the applicable
premium of $516,920, to shares of Class A and Class B common stock of the Company, net of the par value of common stock issued. The applicable premium of $516,920 is estimated as of an
expected conversion date of June 21, 2017 using current risk free interest rates. Such amount is subject to change as a result of a change in the conversion date and/or changes in risk free
interest rates. In addition, the pro forma and pro forma as adjusted amounts reflect the cash distribution of $169,950 to the Company's stockholders made in April 2017, the Pre-IPO Distribution of
$669,750 and $6,469 related to the issuance of Class A and Class B common stock in connection with the Organizational Transactions. The pro forma as adjusted amount further reflects the
estimated net proceeds of $330,950 from this offering, net of the par value of common stock issued.
- (6)
- The
pro forma and pro forma as adjusted amounts reflect the applicable premium of $516,920 related to the conversion of notes payable to affiliates and related
parties of $1,750,000. The applicable premium of $516,920 is estimated as of an expected conversion date of June 21, 2017 using current risk free interest rates. Such amount is subject to
change as a result of a change in the conversion date and/or changes in risk free interest rates. The pro forma as adjusted amount further reflects the premium of $38,063 and the write-off of deferred
financing costs of $5,097 related to the anticipated redemption of $350,000 principal amount of the CSC 2025 Senior Notes.
- (7)
- Net debt excluding collateralized indebtedness and notes payable to affiliates and related parties plus accrued distributions is net of cash and cash equivalents. The pro forma and pro forma as adjusted amounts reflect the accrual of cash distributions of $169,950 and $169,750 made in April 2017 and to be made before the pricing of this offering, respectively.
54
If you invest in shares of our Class A common stock in this offering, your investment will be immediately diluted to the extent of the difference between the initial public offering price per share of our Class A common stock and the net tangible book deficit per share of our common stock immediately after this offering. Dilution results from the fact that the per share offering price of the shares of Class A common stock is substantially in excess of the net tangible book value per share attributable to the shares of our common stock held by existing owners.
Our net tangible book deficit as of March 31, 2017 was approximately $(24,864.5) million, or $(34.30) per share of common stock (based on an adjusted pre-offering share count of 725 million shares of Class A and Class B common stock). We calculate net tangible book deficit per share by taking the amount of our total tangible assets, reduced by the amount of our total liabilities and then dividing that amount by the total number of shares of Class A and Class B common stock outstanding after giving effect to this offering and the Organizational Transactions.
After giving effect to the Organizational Transactions and the sale of shares of our Class A common stock in this offering at an assumed initial public offering price of $29.00 per share, the mid-point of the price range set forth on the cover page of this prospectus, and after deducting underwriting discounts and estimated offering expenses payable by us, our net tangible book deficit as of March 31, 2017 would have been $(23,666.4) million, or $(32.11) per share of common stock. This represents an immediate decrease in net tangible book deficit of $2.19 per share of common stock to our existing owners and an immediate and substantial dilution of $(61.11) per share of Class A common stock to investors in this offering at the assumed initial public offering price.
The following table illustrates this dilution on a per share of common stock basis to new investors assuming the underwriters do not exercise their option to purchase additional shares of Class A common stock:
Initial public offering price per share |
$ | 29.00 | |||||
Net tangible book deficit per share as of March 31, 2017 |
$ | (34.30 | ) | ||||
Decrease in net tangible book deficit per share attributable to new investors in this offering |
$ | 2.19 | |||||
As adjusted net tangible book deficit per share after giving effect to this offering |
$ | (32.11 | ) | ||||
| | | | | | | | |
Dilution per share to new investors purchasing shares in this offering |
$ | (61.11 | ) | ||||
| | | | | | | | |
| | | | | | | | |
| | | | | | | | |
A $1.00 decrease in the assumed initial public offering price of $29.00 per share, the mid-point of the price range set forth on the cover page of this prospectus, would decrease our net tangible book deficit per share of our common stock by $0.02, assuming that the number of shares offered, as set forth on the cover of this prospectus, remains the same, after deducting the underwriting discount and estimated offering expenses payable by us.
We will not receive any proceeds from any sale of shares of our Class A common stock by the selling stockholders. If the underwriters exercise their option to purchase additional shares of our Class A common stock in full, the pro forma as adjusted net tangible book deficit per share would be $(32.11) per share, the decrease in pro forma net tangible book deficit per share attributable to new investors in this offering would be $2.19 per share and the dilution per share to new investors purchasing shares in this offering would be $(61.11) per share. See "Use of Proceeds."
The table below summarizes as of March 31, 2017, on a pro forma as adjusted basis described above, the number of shares of our common stock, the total consideration and the average price per share (i) paid to us by our existing stockholders (determined based on our paid-in capital) and (ii) to be paid by new investors purchasing our Class A common stock in this offering, before deducting the
55
underwriting discount and estimated offering expenses payable by us and assuming an initial public offering price of $29.00 per share, the mid-point of the price range set forth on the cover page of this prospectus.
| |
|
|
Total Consideration (in thousands) |
|
||||||||||||
|---|---|---|---|---|---|---|---|---|---|---|---|---|---|---|---|---|
| |
Shares Purchased | |
||||||||||||||
| |
Average Price Per Share |
|||||||||||||||
| |
Number | Percent | Amount | Percent | ||||||||||||
Existing stockholders |
725,000,000 | 98.4 | % | $ | 4,268,662 | 92.4 | % | $ | 5.89 | |||||||
New investors |
12,068,966 | 1.6 | % | 350,000 | 7.6 | % | 29.00 | |||||||||
| | | | | | | | | | | | | | | | | |
Total |
737,068,966 | 100.0 | % | $ | 4,618,662 | 100.0 | % | |||||||||
| | | | | | | | | | | | | | | | | |
| | | | | | | | | | | | | | | | | |
| | | | | | | | | | | | | | | | | |
If the underwriters' option to purchase additional shares of Class A common stock is exercised in full, the percentage of shares of our common stock held by existing stockholders will be reduced to 93.0% of the total number of shares of our common stock outstanding after this offering, and the number of shares held by new investors will increase to 51,724,139 shares (including 39,655,173 shares offered by the selling stockholders), or 21.0% of the total number of shares of our Class A common stock outstanding after this offering.
The share information as of March 31, 2017 shown in the table above excludes any shares to be reserved for issuance under our stock option plans that may be adopted prior to the completion of this offering.
56
SELECTED HISTORICAL AND PRO FORMA FINANCIAL DATA
The selected consolidated historical balance sheet and operating data of Altice USA as of and for the year ended December 31, 2016 presented below have been derived from the audited consolidated financial statements of Altice USA included elsewhere herein. The selected consolidated historical balance sheet data of Altice USA as of March 31, 2017 and the operating data of Altice USA for the three months ended March 31, 2017 and 2016 presented below have been derived from the unaudited condensed consolidated financial statements of Altice USA included elsewhere herein. The operating data of Altice USA for the year ended December 31, 2016 include the operating results of Cequel for the year ended December 31, 2016 and the operating results of Cablevision for the period from the date of acquisition, June 21, 2016, through December 31, 2016. The operating data of Altice USA for the three months ended March 31, 2016 include the operating results of Cequel for the three months ended March 31, 2016.
The consolidated pro forma operating data of Altice USA for the year ended December 31, 2016 and the three months ended March 31, 2016 have been derived from the unaudited pro forma consolidated statements of operations included elsewhere herein and give effect to the Cablevision Acquisition as if it had occurred on January 1, 2016.
The selected consolidated historical balance sheet and operating data of Cablevision have been presented for the periods prior to the Cablevision Acquisition as Cablevision is deemed to be the predecessor entity. The selected consolidated historical operating data of Cablevision for the period January 1, 2016 to June 20, 2016 and years ended December 31, 2015 and 2014 presented below have been derived from the audited consolidated financial statements of Cablevision included elsewhere herein. The selected consolidated historical operating data of Cablevision for the years ended December 31, 2013 and 2012 are derived from Cablevision's audited consolidated financial statements which are not included in this prospectus.
The historical quarterly balance sheet and operating data of Cablevision are unaudited and have been presented for each of the quarterly periods in 2015 (Predecessor period) and three months ended March 31, 2016 (Predecessor period), period April 1, 2016 to June 20, 2016 (Predecessor period), period June 21, 2016 to June 30, 2016 (Successor period) and three months ended September 30, 2016 (Successor period) and December 31, 2016 (Successor period).
The historical quarterly balance sheet and operating data of Cequel are unaudited and have been presented for the three months ended March 31, 2015 (Predecessor period), June 30, 2015 (Predecessor period) and September 30, 2015 (Predecessor period) and for the period October 1, 2015 through December 20, 2015 (Predecessor period) and the period December 21, 2015 through December 31, 2015 (Successor period) and each of the quarterly periods in 2016 (Successor periods).
The selected historical and pro forma results presented below are not necessarily indicative of the results to be expected for any future period. This information should be read in conjunction with the audited consolidated financial statements of Altice USA and Cablevision and the notes thereto, the unaudited pro forma consolidated statements of operations of Altice USA, Management's Discussion
57
and Analysis of Financial Condition and Results of Operations of Altice USA and Cablevision included elsewhere herein.
| |
Altice USA | |||||||||
|---|---|---|---|---|---|---|---|---|---|---|
| |
Three Months Ended March 31, | |||||||||
| |
2017 | 2016 | 2016 | |||||||
| |
Historical | Pro Forma | Historical | |||||||
| |
(dollars in thousands) |
|||||||||
Revenue |
$ | 2,305,676 | $ | 2,273,479 | $ | 627,589 | ||||
Operating expenses |
2,057,442 |
2,189,256 |
573,329 |
|||||||
| | | | | | | | | | | |
Operating income |
248,234 | 84,223 | 54,260 | |||||||
Other income (expense): |
||||||||||
Interest expense, net |
(433,062 | ) | (436,601 | ) | (269,414 | ) | ||||
Gain on investments, net |
131,658 | 100,365 | — | |||||||
Loss on equity derivative contracts, net |
(71,044 | ) | (48,012 | ) | — | |||||
Gain on interest rate swap contracts, net |
2,342 | — | — | |||||||
Other income (expense), net |
(224 |
) |
2,045 |
11 |
||||||
| | | | | | | | | | | |
Loss from continuing operations before income taxes |
(122,096 | ) | (297,980 | ) | (215,143 | ) | ||||
Income tax benefit |
45,908 | 107,839 | 74,395 | |||||||
| | | | | | | | | | | |
Net loss |
(76,188 | ) | (190,141 | ) | (140,748 | ) | ||||
Net income attributable to noncontrolling interests |
(237 | ) | 66 | — | ||||||
| | | | | | | | | | | |
Net loss attributable to Altice USA stockholders |
$ | (76,425 | ) | $ | (190,075 | ) | $ | (140,748 | ) | |
| | | | | | | | | | | |
| | | | | | | | | | | |
| | | | | | | | | | | |
INCOME (LOSS) PER SHARE: |
||||||||||
Basic and diluted loss per share attributable to Altice USA stockholders: |
||||||||||
Net loss |
$ | (764 | ) | $ | (1,901 | ) | $ | (1,407 | ) | |
| | | | | | | | | | | |
| | | | | | | | | | | |
| | | | | | | | | | | |
Basic and diluted weighted average common shares (in thousands) |
0.1 | 0.1 | 0.1 | |||||||
| | | | | | | | | | | |
| | | | | | | | | | | |
| | | | | | | | | | | |
Cash dividends declared and paid per common share |
$ | — | $ | — | $ | — | ||||
| | | | | | | | | | | |
| | | | | | | | | | | |
| | | | | | | | | | | |
58
| |
Altice USA | Cablevision(a) | ||||||||||||||||||||
|---|---|---|---|---|---|---|---|---|---|---|---|---|---|---|---|---|---|---|---|---|---|---|
| |
Years ended December 31, |
|
|
|
|
|
||||||||||||||||
| |
2016 | 2016 | |
Years Ended December 31, | ||||||||||||||||||
| |
January 1, 2016 to June 20, 2016 |
|||||||||||||||||||||
| |
Pro Forma | Historical | 2015 | 2014 | 2013 | 2012(b) | ||||||||||||||||
| |
(dollars in thousands) |
|||||||||||||||||||||
Revenue |
$ | 9,154,816 | $ | 6,017,212 | $ | 3,137,604 | $ | 6,545,545 | $ | 6,508,557 | $ | 6,287,383 | $ | 6,180,677 | ||||||||
Operating expenses |
8,556,428 | 5,557,546 | 2,662,298 | 5,697,074 | 5,587,299 | 5,588,159 | 5,411,629 | |||||||||||||||
| | | | | | | | | | | | | | | | | | | | | | | |
Operating income |
598,388 | 459,666 | 475,306 | 848,471 | 921,258 | 699,224 | 769,048 | |||||||||||||||
Other income (expense): |
||||||||||||||||||||||
Interest expense, net |
(1,760,421 | ) | (1,442,730 | ) | (285,508 | ) | (584,839 | ) | (575,580 | ) | (600,637 | ) | (660,074 | ) | ||||||||
Gain (loss) on investments, net |
271,886 | 141,896 | 129,990 | (30,208 | ) | 129,659 | 313,167 | 294,235 | ||||||||||||||
Gain (loss) on equity derivative contracts, net |
(89,979 | ) | (53,696 | ) | (36,283 | ) | 104,927 | (45,055 | ) | (198,688 | ) | (211,335 | ) | |||||||||
Loss on interest rate swap contracts, net |
(72,961 | ) | (72,961 | ) | — | — | — | — | (1,828 | ) | ||||||||||||
Loss on extinguishment of debt and write-off of deferred financing costs |
(127,649 | ) | (127,649 | ) | — | (1,735 | ) | (10,120 | ) | (22,542 | ) | (66,213 | ) | |||||||||
Other income, net |
9,184 | 4,329 | 4,855 | 6,045 | 4,988 | 2,436 | 2,486 | |||||||||||||||
| | | | | | | | | | | | | | | | | | | | | | | |
Income (loss) from continuing operations before income taxes |
(1,171,552 | ) | (1,091,145 | ) | 288,360 | 342,661 | 425,150 | 192,960 | 126,319 | |||||||||||||
Income tax benefit (expense) |
450,295 | 259,666 | (124,848 | ) | (154,872 | ) | (115,768 | ) | (65,635 | ) | (51,994 | ) | ||||||||||
| | | | | | | | | | | | | | | | | | | | | | | |
Income (loss) from continuing operations, net of income taxes |
(721,257 | ) | (831,479 | ) | 163,512 | 187,789 | 309,382 | 127,325 | 74,325 | |||||||||||||
Income (loss) from discontinued operations, net of income taxes(c) |
— | — | — | (12,541 | ) | 2,822 | 338,316 | 159,288 | ||||||||||||||
| | | | | | | | | | | | | | | | | | | | | | | |
Net income (loss) |
(721,257 | ) | (831,479 | ) | 163,512 | 175,248 | 312,204 | 465,641 | 233,613 | |||||||||||||
Net loss (income) attributable to noncontrolling interests |
(315 | ) | (551 | ) | 236 | 201 | (765 | ) | 20 | (90 | ) | |||||||||||
| | | | | | | | | | | | | | | | | | | | | | | |
Net income (loss) attributable to Altice USA / Cablevision stockholders |
$ | (721,572 | ) | $ | (832,030 | ) | $ | 163,748 | $ | 175,449 | $ | 311,439 | $ | 465,661 | $ | 233,523 | ||||||
| | | | | | | | | | | | | | | | | | | | | | | |
| | | | | | | | | | | | | | | | | | | | | | | |
| | | | | | | | | | | | | | | | | | | | | | | |
- (a)
- Represents
the operating results of Cablevision for the period prior to the Cablevision Acquisition (Predecessor period).
- (b)
- Includes
service outage credits of $33,156 (reduction to revenue) and operating expenses of $73,832 related to Superstorm Sandy.
- (c)
- See Note 6 to the consolidated financial statements of Cablevision for the year ended December 31, 2016 for additional information regarding discontinued operations.
59
| |
Altice USA | Cablevision(a) | ||||||||||||||||||||
|---|---|---|---|---|---|---|---|---|---|---|---|---|---|---|---|---|---|---|---|---|---|---|
| |
Years ended December 31, |
|
|
|
|
|
||||||||||||||||
| |
2016 | 2016 | |
Years Ended December 31, | ||||||||||||||||||
| |
January 1, 2016 to June 20, 2016 |
|||||||||||||||||||||
| |
Pro Forma | Historical | 2015 | 2014 | 2013 | 2012(b) | ||||||||||||||||
| |
(dollars in thousands, except per share data for Cablevision) |
|||||||||||||||||||||
INCOME (LOSS) PER SHARE: |
||||||||||||||||||||||
Basic income (loss) per share attributable to Altice USA / Cablevision stockholders: |
||||||||||||||||||||||
Income (loss) from continuing operations, net of income taxes |
$ | (7,216 | ) | $ | (8,320 | ) | $ | 0.60 | $ | 0.70 | $ | 1.17 | $ | 0.49 | $ | 0.28 | ||||||
| | | | | | | | | | | | | | | | | | | | | | | |
| | | | | | | | | | | | | | | | | | | | | | | |
| | | | | | | | | | | | | | | | | | | | | | | |
Income (loss) from discontinued operations, net of income taxes |
$ | — | $ | — | $ | — | $ | (0.05 | ) | $ | 0.01 | $ | 1.30 | $ | 0.61 | |||||||
| | | | | | | | | | | | | | | | | | | | | | | |
| | | | | | | | | | | | | | | | | | | | | | | |
| | | | | | | | | | | | | | | | | | | | | | | |
Net income (loss) |
$ | (7,216 | ) | $ | (8,320 | ) | $ | 0.60 | $ | 0.65 | $ | 1.18 | $ | 1.79 | $ | 0.89 | ||||||
| | | | | | | | | | | | | | | | | | | | | | | |
| | | | | | | | | | | | | | | | | | | | | | | |
| | | | | | | | | | | | | | | | | | | | | | | |
Basic weighted average common shares (in thousands) |
0.1 | 0.1 | 272,035 | 269,388 | 264,623 | 260,763 | 262,258 | |||||||||||||||
| | | | | | | | | | | | | | | | | | | | | | | |
| | | | | | | | | | | | | | | | | | | | | | | |
| | | | | | | | | | | | | | | | | | | | | | | |
Diluted income (loss) per share attributable to Altice USA / Cablevision stockholders: |
||||||||||||||||||||||
Income (loss) from continuing operations, net of income taxes |
$ | (7,216 | ) | $ | (8,320 | ) | $ | 0.58 | $ | 0.68 | $ | 1.14 | $ | 0.48 | $ | 0.28 | ||||||
| | | | | | | | | | | | | | | | | | | | | | | |
| | | | | | | | | | | | | | | | | | | | | | | |
| | | | | | | | | | | | | | | | | | | | | | | |
Income (loss) from discontinued operations, net of income taxes |
$ | — | $ | — | $ | — | $ | (0.05 | ) | $ | 0.01 | $ | 1.27 | $ | 0.60 | |||||||
| | | | | | | | | | | | | | | | | | | | | | | |
| | | | | | | | | | | | | | | | | | | | | | | |
| | | | | | | | | | | | | | | | | | | | | | | |
Net income (loss) |
$ | (7,216 | ) | $ | (8,320 | ) | $ | 0.58 | $ | 0.63 | $ | 1.15 | $ | 1.75 | $ | 0.87 | ||||||
| | | | | | | | | | | | | | | | | | | | | | | |
| | | | | | | | | | | | | | | | | | | | | | | |
| | | | | | | | | | | | | | | | | | | | | | | |
Diluted weighted average common shares (in thousands) |
0.1 | 0.1 | 280,199 | 276,339 | 270,703 | 265,935 | 267,330 | |||||||||||||||
| | | | | | | | | | | | | | | | | | | | | | | |
| | | | | | | | | | | | | | | | | | | | | | | |
| | | | | | | | | | | | | | | | | | | | | | | |
Cash dividends declared and paid per common share |
$ | — | $ | — | $ | — | $ | 0.45 | $ | 0.60 | $ | 0.60 | $ | 0.60 | ||||||||
| | | | | | | | | | | | | | | | | | | | | | | |
| | | | | | | | | | | | | | | | | | | | | | | |
| | | | | | | | | | | | | | | | | | | | | | | |
Amounts attributable to Altice USA / Cablevision stockholders: |
||||||||||||||||||||||
Income (loss) from continuing operations, net of income taxes |
$ | (721,572 | ) | $ | (832,030 | ) | $ | 163,748 | $ | 187,990 | $ | 308,617 | $ | 127,345 | $ | 74,235 | ||||||
Income (loss) from discontinued operations, net of income taxes(c) |
— | — | — | (12,541 | ) | 2,822 | 338,316 | 159,288 | ||||||||||||||
| | | | | | | | | | | | | | | | | | | | | | | |
Net income (loss) |
$ | (721,572 | ) | $ | (832,030 | ) | $ | 163,748 | $ | 175,449 | $ | 311,439 | $ | 465,661 | $ | 233,523 | ||||||
| | | | | | | | | | | | | | | | | | | | | | | |
| | | | | | | | | | | | | | | | | | | | | | | |
| | | | | | | | | | | | | | | | | | | | | | | |
- (a)
- Represents
the operating results of Cablevision for the period prior to the Cablevision Acquisition (Predecessor period).
- (b)
- Includes
service outage credits of $33,156 (reduction to revenue) and operating expenses of $73,832 related to Superstorm Sandy.
- (c)
- See Note 6 to the consolidated financial statements of Cablevision for the year ended December 31, 2016 for additional information regarding discontinued operations.
60
Balance Sheet Data:
| |
Altice USA | Altice USA | Cablevision | ||||||||||||||||
|---|---|---|---|---|---|---|---|---|---|---|---|---|---|---|---|---|---|---|---|
| |
March 31, | December 31, | |||||||||||||||||
| |
2017 | 2016 | 2015 | 2014 | 2013 | 2012 | |||||||||||||
| |
(dollars in thousands) |
|
|||||||||||||||||
Total assets(a) |
$ | 36,179,281 | $ | 36,474,249 | $ | 6,800,174 | $ | 6,682,021 | $ | 6,500,967 | $ | 7,155,058 | |||||||
Notes payable to affiliates and related parties |
1,750,000 | 1,750,000 | — | — | — | — | |||||||||||||
Credit facility debt(a) |
3,488,341 | 3,444,790 | 2,514,454 | 2,769,153 | 3,745,625 | 3,900,218 | |||||||||||||
Collateralized indebtedness |
1,293,702 | 1,286,069 | 1,191,324 | 986,183 | 817,950 | 556,152 | |||||||||||||
Senior notes and debentures(a) |
17,505,718 | 17,507,325 | 5,801,011 | 5,784,213 | 5,068,926 | 5,406,771 | |||||||||||||
Notes payable |
11,453 | 13,726 | 14,544 | 23,911 | 5,334 | 12,585 | |||||||||||||
Capital leases and other obligations |
23,544 | 28,155 | 45,966 | 46,412 | 31,290 | 56,569 | |||||||||||||
Total debt(a) |
24,072,758 | 24,030,065 | 9,567,299 | 9,609,872 | 9,669,125 | 9,932,295 | |||||||||||||
Redeemable equity |
211,687 | 68,147 | — | 8,676 | 9,294 | 11,999 | |||||||||||||
Stockholders' equity (deficiency) |
2,125,670 | 2,029,555 | (4,911,316 | ) | (5,041,469 | ) | (5,284,330 | ) | (5,639,164 | ) | |||||||||
Noncontrolling interest |
524 | 287 | (268 | ) | 779 | 786 | 1,158 | ||||||||||||
Total equity (deficiency) |
2,126,194 | 2,029,842 | (4,911,584 | ) | (5,040,690 | ) | (5,283,544 | ) | (5,638,006 | ) | |||||||||
- (a)
- Years ended December 31, 2015, 2014, 2013 and 2012 have been restated to reflect the adoption of Accounting Standards Update ("ASU") 2015-03, Simplifying the Presentation of Debt Issuance Costs.
The following table sets forth certain customer metrics by segment (unaudited):
| |
As of March 31, 2017 |
As of December 31, 2016 |
Pro Forma As of March 31, 2016 |
|||||||||||||||||||||||||
|---|---|---|---|---|---|---|---|---|---|---|---|---|---|---|---|---|---|---|---|---|---|---|---|---|---|---|---|---|
| |
Cablevision | Cequel(g) | Total | Cablevision | Cequel(g) | Total | Cablevision | Cequel(g) | Total | |||||||||||||||||||
| |
(in thousands, except per customer amounts) |
|||||||||||||||||||||||||||
Homes passed(a) |
5,128 | 3,419 | 8,547 | 5,116 | 3,407 | 8,524 | 5,086 | 3,362 | 8,448 | |||||||||||||||||||
Total customer relationships(b) |
3,148 | 1,765 | 4,913 | 3,141 | 1,751 | 4,892 | 3,125 | 1,734 | 4,859 | |||||||||||||||||||
Residential |
2,887 | 1,661 | 4,548 | 2,879 | 1,649 | 4,528 | 2,866 | 1,638 | 4,504 | |||||||||||||||||||
SMB |
261 | 103 | 365 | 262 | 102 | 364 | 258 | 96 | 354 | |||||||||||||||||||
Residential customers(c): |
||||||||||||||||||||||||||||
Pay TV |
2,413 | 1,087 | 3,500 | 2,428 | 1,107 | 3,535 | 2,473 | 1,150 | 3,623 | |||||||||||||||||||
Broadband |
2,636 | 1,366 | 4,003 | 2,619 | 1,344 | 3,963 | 2,580 | 1,308 | 3,888 | |||||||||||||||||||
Telephony |
1,955 | 596 | 2,551 | 1,962 | 597 | 2,559 | 1,999 | 597 | 2,596 | |||||||||||||||||||
Residential triple product customer penetration(d): |
64.4 | % | 25.4 | % | 50.2 | % | 64.8 | % | 25.5 | % | 50.5 | % | 66.9 | % | 25.8 | % | 52.0 | % | ||||||||||
Penetration of homes passed(e): |
61.4 | % | 51.6 | % | 57.5 | % | 61.4 | % | 51.4 | % | 57.4 | % | 61.4 | % | 51.6 | % | 57.5 | % | ||||||||||
ARPU(f) |
$ | 155.83 | $ | 110.00 | $ | 139.11 | $ | 154.49 | $ | 109.30 | $ | 138.07 | $ | 152.18 | $ | 105.68 | $ | 135.32 | ||||||||||
- (a)
- Represents
the estimated number of single residence homes, apartments and condominium units passed by the cable distribution network in areas serviceable without
further extending the transmission lines. In addition, it includes commercial establishments that have connected to our cable distribution network. For Cequel, broadband services were not available to
approximately 100 homes passed and telephony services were not available to approximately 500 homes passed.
- (b)
- Represents
number of households/businesses that receive at least one of the Company's services.
- (c)
- Customers represent each customer account (set up and segregated by customer name and address), weighted equally and counted as one customer, regardless of size, revenue generated, or number of boxes, units, or outlets. In calculating the number of customers, we count all customers other than inactive/disconnected customers. Free accounts are included in the customer counts along with all active accounts, but they are limited to a prescribed group. Most of these accounts are also not entirely free, as they typically generate revenue through pay-per-view or other pay services. Free status is not granted to regular customers as a promotion. In counting bulk residential customers, such as an apartment building, we count each
61
subscribing family unit within the building as one customer, but do not count the master account for the entire building as a customer. We count a bulk commercial customer, such as a hotel, as one customer, and do not count individual room units at that hotel.
- (d)
- Represents
the number of customers that subscribe to three of our services divided by total residential customer relationships.
- (e)
- Represents
the number of total customer relationships divided by homes passed.
- (f)
- Calculated
by dividing the average monthly revenue for the respective quarter (fourth quarter for annual periods) presented derived from the sale of broadband, pay
television and telephony services to residential customers for the respective quarter by the average number of total residential customers for the same period.
- (g)
- The metrics for Cequel presented in the table above have been adjusted from previously reported amounts to align with the Cablevision metrics definitions.
| |
Cablevision | ||||||||||||||||||||
|---|---|---|---|---|---|---|---|---|---|---|---|---|---|---|---|---|---|---|---|---|---|
| |
Successor |
|
Predecessor | ||||||||||||||||||
| |
Three Months Ended March 31, 2017 |
Three Months Ended December 31, 2016 |
Three Months Ended September 30, 2016 |
|
|
|
Three Months Ended March 31, 2016 |
||||||||||||||
| |
June 21 to June 30, 2016 |
|
April 1 to June 20, 2016 |
||||||||||||||||||
| |
|
||||||||||||||||||||
| |
|
||||||||||||||||||||
| |
(dollars in thousands) |
||||||||||||||||||||
Revenue(i) |
$ | 1,644,801 | $ | 1,645,493 | $ | 1,614,699 | $ | 183,860 | $ | 1,491,714 | $ | 1,645,890 | |||||||||
| | | | | | | | | | | | | | | | | | | | | | |
| | | | | | | | | | | | | | | | | | | | | | |
| | | | | | | | | | | | | | | | | | | | | | |
Net income (loss) |
$ | (60,571 | ) | $ | (160,842 | ) | $ | (132,392 | ) | $ | (35,548 | ) | $ | 69,201 | $ | 94,311 | |||||
Share-based compensation |
5,082 | 8,073 | 1,091 | — | 10,534 | 14,698 | |||||||||||||||
Restructuring and other expenses (credits) |
58,647 | 80,650 | 42,264 | 89,236 | 19,770 | 2,453 | |||||||||||||||
Depreciation and amortization (including impairments) |
443,176 | 437,608 | 481,497 | 44,560 | 202,097 | 212,453 | |||||||||||||||
Interest expense, net |
280,091 | 285,460 | 292,544 | 28,343 | 137,026 | 148,482 | |||||||||||||||
Loss (gain) on investments, net |
(131,658 | ) | (58,429 | ) | (24,833 | ) | (58,634 | ) | (29,625 | ) | (100,365 | ) | |||||||||
Loss (gain) on equity derivative contracts, net |
71,044 | 27,124 | (773 | ) | 27,345 | (11,729 | ) | 48,012 | |||||||||||||
Loss on extinguishment of debt and write-off of deferred financing costs |
— | 102,894 | — | — | — | — | |||||||||||||||
Other income, net |
224 | (1,793 | ) | (2,530 | ) | (6 | ) | (2,884 | ) | (1,971 | ) | ||||||||||
Income tax (benefit) expense |
(38,962 | ) | (99,807 | ) | (89,157 | ) | (24,101 | ) | 62,062 | 62,786 | |||||||||||
| | | | | | | | | | | | | | | | | | | | | | |
Adjusted EBITDA(a) |
$ | 627,073 | $ | 620,938 | $ | 567,711 | $ | 71,195 | $ | 456,452 | $ | 480,859 | |||||||||
| | | | | | | | | | | | | | | | | | | | | | |
| | | | | | | | | | | | | | | | | | | | | | |
| | | | | | | | | | | | | | | | | | | | | | |
Capital expenditures |
$ | 184,399 | $ | 147,392 | $ | 150,815 | $ | 150 | $ | 181,479 | $ | 148,652 | |||||||||
| | | | | | | | | | | | | | | | | | | | | | |
| | | | | | | | | | | | | | | | | | | | | | |
| | | | | | | | | | | | | | | | | | | | | | |
March 31, 2017 |
December 31, 2016 |
September 30, 2016 |
June 30, 2016 |
June 20, 2016 |
March 31, 2016 |
||||||||||||||||
Cash & cash equivalents |
$ | 146,269 | $ | 216,625 | $ | 114,436 | 265,955 | N/A | $ | 933,457 | |||||||||||
Total assets |
25,965,105 | 26,176,709 | 27,636,010 | 26,965,633 | N/A | 6,732,386 | |||||||||||||||
Collateralized indebtedness |
1,293,702 | 1,286,069 | 1,284,234 | 1,246,017 | N/A | 1,191,324 | |||||||||||||||
Total debt (including collateralized indebtedness) |
15,757,281 | 15,721,417 | 17,125,118 | 15,757,623 | N/A | 9,548,076 | |||||||||||||||
62
| |
Cablevision | ||||||||||||
|---|---|---|---|---|---|---|---|---|---|---|---|---|---|
| |
Predecessor | ||||||||||||
| |
Three Months Ended | ||||||||||||
| |
December 31, 2015 |
September 30, 2015 |
June 30, 2015 |
March 31, 2015 |
|||||||||
| |
(dollars in thousands) |
||||||||||||
Revenue(j) |
$ | 1,636,425 | $ | 1,624,828 | $ | 1,661,940 | $ | 1,622,352 | |||||
| | | | | | | | | | | | | | |
| | | | | | | | | | | | | | |
| | | | | | | | | | | | | | |
Net income |
$ | 32,148 | $ | 23,025 | $ | 75,676 | $ | 44,399 | |||||
Share-based compensation |
20,014 | 17,422 | 15,939 | 11,911 | |||||||||
Restructuring and other expenses (credits) |
7,521 | 9,228 | (4 | ) | (532 | ) | |||||||
Depreciation and amortization (including impairments) |
215,135 | 217,288 | 213,929 | 218,900 | |||||||||
Interest expense, net |
147,252 | 146,699 | 145,876 | 145,012 | |||||||||
Loss (gain) on investments, net |
9,567 | 66,388 | (78,818 | ) | 33,071 | ||||||||
Loss (gain) on equity derivative contracts, net |
(15,311 | ) | (66,143 | ) | 22,693 | (46,166 | ) | ||||||
Loss on extinguishment of debt and write-off of deferred financing costs |
— | — | 1,735 | — | |||||||||
Other income |
(1,931 | ) | (1,800 | ) | (1,307 | ) | (1,007 | ) | |||||
Income tax (benefit) expense |
23,782 | 14,541 | 78,609 | 37,940 | |||||||||
Loss from discontinued operations, net of income taxes |
1,633 | 406 | — | 10,502 | |||||||||
| | | | | | | | | | | | | | |
Adjusted EBITDA(a) |
$ | 439,810 | $ | 427,054 | $ | 474,328 | $ | 454,030 | |||||
| | | | | | | | | | | | | | |
| | | | | | | | | | | | | | |
| | | | | | | | | | | | | | |
Capital expenditures |
$ | 212,427 | $ | 222,664 | $ | 214,674 | $ | 166,631 | |||||
| |
Cequel Corporation | |||||||||||||||
|---|---|---|---|---|---|---|---|---|---|---|---|---|---|---|---|---|
| |
Three Months Ended | |||||||||||||||
| |
March 31, 2017 |
December 31, 2016 |
September 30, 2016 |
June 30, 2016 |
March 31, 2016 |
|||||||||||
| |
(dollars in thousands) |
|||||||||||||||
Revenue |
$ | 660,875 | $ | 660,408 | $ | 645,522 | $ | 639,641 | $ | 627,589 | ||||||
| | | | | | | | | | | | | | | | | |
| | | | | | | | | | | | | | | | | |
| | | | | | | | | | | | | | | | | |
Net income (loss) |
14,739 | (59,741 | ) | $ | (5,646 | ) | $ | (136,079 | ) | $ | (32,329 | ) | ||||
Share-based compensation |
2,766 | 4,625 | 579 | — | — | |||||||||||
Restructuring and other expenses (credits) |
18,282 | 16,997 | 2,741 | 939 | 7,569 | |||||||||||
Depreciation and amortization |
165,548 | 176,779 | 189,433 | 169,540 | 200,900 | |||||||||||
Interest expense, net |
103,492 | 105,578 | 104,674 | 104,059 | 102,615 | |||||||||||
Loss (gain) on interest rate swap contracts |
(2,342 | ) | 97,340 | 15,862 | (40,241 | ) | — | |||||||||
Loss on extinguishment of debt and write-off of deferred financing costs |
— | 4,807 | — | 19,948 | — | |||||||||||
Other income |
— | — | — | — | (11 | ) | ||||||||||
Income tax benefit (expense) |
12,177 | (37,767 | ) | (12,057 | ) | 169,791 | (16,015 | ) | ||||||||
| | | | | | | | | | | | | | | | | |
Adjusted EBITDA(a) |
$ | 314,662 | $ | 308,618 | $ | 295,586 | $ | 287,957 | $ | 262,729 | ||||||
| | | | | | | | | | | | | | | | | |
| | | | | | | | | | | | | | | | | |
| | | | | | | | | | | | | | | | | |
Capital expenditures |
$ | 73,028 | $ | 100,423 | $ | 97,341 | $ | 63,216 | $ | 66,204 | ||||||
| | | | | | | | | | | | | | | | | |
| | | | | | | | | | | | | | | | | |
| | | | | | | | | | | | | | | | | |
March 31, 2017 |
December 31, 2016 |
September 30, 2016 |
June 30, 2016 |
March 31, 2016 |
||||||||||||
Cash & cash equivalents |
$ | 317,555 | $ | 190,535 | $ | 431,630 | $ | 331,599 | $ | 159,549 | ||||||
Total assets |
10,330,234 | 10,338,309 | 10,555,770 | 10,566,952 | 10,503,226 | |||||||||||
Total debt (including collateralized indebtedness) |
6,565,477 | 6,558,648 | 6,545,273 | 6,521,857 | 6,425,512 | |||||||||||
63
| |
Cequel Corporation | |||||||||||||||||
|---|---|---|---|---|---|---|---|---|---|---|---|---|---|---|---|---|---|---|
| |
December 21, to December 31, 2015 |
|
October 1, to December 20, 2015 |
Three Months Ended September 30, 2015 |
Three Months Ended June 30, 2015 |
Three Months Ended March 31, 2015 |
||||||||||||
| |
|
|
(dollars in thousands) |
|||||||||||||||
Revenue |
$ | 72,943 | $ | 545,991 | $ | 605,112 | $ | 608,016 | $ | 588,250 | ||||||||
| | | | | | | | | | | | | | | | | | | |
| | | | | | | | | | | | | | | | | | | |
| | | | | | | | | | | | | | | | | | | |
Net income (loss) |
$ | (17,611 | ) | $ | 18,201 | $ | 35,326 | $ | (277,397 | ) | $ | 8,994 | ||||||
Share-based compensation |
— | 109,545 | 41,905 | 125,662 | 10,579 | |||||||||||||
Restructuring and other expenses (credits) |
26,498 | 65,620 | 318 | 649 | 1,230 | |||||||||||||
Depreciation and amortization |
23,574 | 122,428 | 141,418 | 137,834 | 131,677 | |||||||||||||
Interest expense, net |
11,491 | 54,000 | 61,158 | 61,256 | 60,905 | |||||||||||||
Income tax benefit (expense) |
(10,263 | ) | (141,890 | ) | (34,288 | ) | 196,349 | 9,130 | ||||||||||
| | | | | | | | | | | | | | | | | | | |
Adjusted EBITDA(a) |
$ | 33,689 | $ | 227,904 | $ | 245,837 | $ | 244,353 | $ | 222,515 | ||||||||
| | | | | | | | | | | | | | | | | | | |
| | | | | | | | | | | | | | | | | | | |
| | | | | | | | | | | | | | | | | | | |
Capital expenditures |
$ | 30,582 | $ | 84,481 | $ | 112,369 | $ | 118,881 | $ | 132,133 | ||||||||
The following table sets forth certain quarterly customer metrics by segment (unaudited):
| |
Cablevision | |||||||||||||||
|---|---|---|---|---|---|---|---|---|---|---|---|---|---|---|---|---|
| |
March 31, 2017 | December 31, 2016 | September 30, 2016 |
June 30, 2016 |
March 31, 2016 |
|||||||||||
| |
(in thousands, except per customer amounts) |
|||||||||||||||
Homes passed(b) |
5,128 | 5,116 | 5,105 | 5,094 | 5,086 | |||||||||||
Total customer relationships(c) |
3,148 | 3,141 | 3,135 | 3,143 | 3,125 | |||||||||||
Residential |
2,887 | 2,879 | 2,873 | 2,882 | 2,866 | |||||||||||
SMB |
261 | 262 | 261 | 261 | 258 | |||||||||||
Residential customers(d): |
||||||||||||||||
Pay TV |
2,413 | 2,428 | 2,443 | 2,470 | 2,473 | |||||||||||
Broadband |
2,636 | 2,619 | 2,603 | 2,604 | 2,580 | |||||||||||
Telephony |
1,955 | 1,962 | 1,969 | 1,994 | 1,999 | |||||||||||
Residential triple product customer penetration(e): |
64.4 | % | 64.8 | % | 65.3 | % | 66.1 | % | 66.9 | % | ||||||
Penetration of homes passed(f): |
61.4 | % | 61.4 | % | 61.4 | % | 61.7 | % | 61.4 | % | ||||||
ARPU(g) |
$ | 155.83 | $ | 154.49 | $ | 152.55 | $ | 153.52 | $ | 152.18 | ||||||
| |
Cablevision | ||||||||||||
|---|---|---|---|---|---|---|---|---|---|---|---|---|---|
| |
December 31, 2015 |
September 30, 2015 |
June 30, 2015 |
March 31, 2015 |
|||||||||
Homes passed(b) |
5,076 | 5,070 | 5,062 | 5,050 | |||||||||
Total customer relationships(c) |
3,115 | 3,102 | 3,113 | 3,107 | |||||||||
Residential |
2,858 | 2,846 | 2,858 | 2,855 | |||||||||
SMB |
258 | 257 | 254 | 252 | |||||||||
Residential customers(d): |
|||||||||||||
Pay TV |
2,487 | 2,496 | 2,529 | 2,546 | |||||||||
Broadband |
2,562 | 2,538 | 2,537 | 2,525 | |||||||||
Telephony |
2,007 | 2,003 | 2,024 | 2,032 | |||||||||
Residential triple product customer penetration(e): |
67.6 | % | 67.8 | % | 68.3 | % | 68.7 | % | |||||
Penetration of homes passed(f): |
61.4 | % | 61.2 | % | 61.5 | % | 61.5 | % | |||||
ARPU(g) |
$ | 150.61 | $ | 151.09 | $ | 153.88 | $ | 151.05 | |||||
64
| |
Cequel(h) | |||||||||||||||
|---|---|---|---|---|---|---|---|---|---|---|---|---|---|---|---|---|
| |
March 31, 2017 | December 31, 2016 |
September 30, 2016 |
June 30, 2016 |
March 31, 2016 |
|||||||||||
| |
(in thousands, except per customer amounts) |
|||||||||||||||
Homes passed(b) |
3,419 | 3,407 | 3,389 | 3,374 | 3,362 | |||||||||||
Total customer relationships(c) |
1,765 | 1,751 | 1,736 | 1,726 | 1,734 | |||||||||||
Residential |
1,661 | 1,649 | 1,636 | 1,628 | 1,638 | |||||||||||
SMB |
103 | 102 | 100 | 98 | 96 | |||||||||||
Residential customers(d): |
||||||||||||||||
Pay TV |
1,087 | 1,107 | 1,113 | 1,126 | 1,150 | |||||||||||
Broadband |
1,366 | 1,344 | 1,324 | 1,306 | 1,308 | |||||||||||
Telephony |
596 | 597 | 594 | 596 | 597 | |||||||||||
Residential triple product customer penetration(e): |
25.4 | % | 25.5 | % | 25.6 | % | 25.8 | % | 25.8 | % | ||||||
Penetration of homes passed(f): |
51.6 | % | 51.4 | % | 51.2 | % | 51.2 | % | 51.6 | % | ||||||
ARPU(g) |
$ | 110.00 | $ | 109.30 | $ | 108.19 | $ | 107.03 | $ | 105.68 | ||||||
| |
Cequel Corporation | ||||||||||||
|---|---|---|---|---|---|---|---|---|---|---|---|---|---|
| |
December 31, 2015 |
September 30, 2015 |
June 30, 2015 |
March 31, 2015 |
|||||||||
Homes passed(b) |
3,352 | 3,339 | 3,320 | 3,304 | |||||||||
Total customer relationships(c) |
1,712 | 1,696 | 1,680 | 1,691 | |||||||||
Residential |
1,618 | 1,605 | 1,591 | 1,604 | |||||||||
SMB |
94 | 92 | 89 | 87 | |||||||||
Residential customers(d): |
|||||||||||||
Pay TV |
1,154 | 1,155 | 1,163 | 1,194 | |||||||||
Broadband |
1,276 | 1,255 | 1,232 | 1,233 | |||||||||
Telephony |
581 | 566 | 563 | 562 | |||||||||
Residential triple product customer penetration(e): |
25.4 | % | 24.8 | % | 25.0 | % | 25.1 | % | |||||
Penetration of homes passed(f): |
51.1 | % | 50.8 | % | 50.6 | % | 51.2 | % | |||||
ARPU(g) |
$ | 104.04 | $ | 103.50 | $ | 104.35 | $ | 101.28 | |||||
- (a)
- We define Adjusted EBITDA, which is a non-GAAP financial measure, as net income (loss) excluding income taxes, income (loss) from discontinued operations, other non-operating income or expenses, loss on extinguishment of debt and write-off of deferred financing costs, loss on interest rate swap contracts, gain (loss) on equity derivative contracts, gain (loss) on investments, interest expense (including cash interest expense), interest income, depreciation and amortization (including impairments), share-based compensation expense or benefit, restructuring expense or credits and transaction expenses. We believe Adjusted EBITDA is an appropriate measure for evaluating the operating performance of the Company. Adjusted EBITDA and similar measures with similar titles are common performance measures used by investors, analysts and peers to compare performance in our industry. Internally, we use revenue and Adjusted EBITDA measures as important indicators of our business performance, and evaluate management's effectiveness with specific reference to these indicators. We believe Adjusted EBITDA provides management and investors a useful measure for period-to-period comparisons of our core business and operating results by excluding items that are not comparable across reporting periods or that do not otherwise relate to the Company's ongoing operating results. Adjusted EBITDA should be viewed as a supplement to and not a substitute for operating income (loss), net income (loss), and other measures of performance presented in accordance with GAAP. Since Adjusted EBITDA is not a measure of performance calculated in accordance with GAAP, this measure may not be comparable to similar measures with similar titles used by other companies. Refer to the
65
reconciliation of Adjusted EBITDA to net income (loss) in "Summary Historical and Pro Forma Financial Data."
- (b)
- Represents
the estimated number of single residence homes, apartments and condominium units passed by the cable distribution network in areas serviceable without
further extending the transmission lines. In addition, it includes commercial establishments that have connected to our cable distribution network. For Cequel, broadband services were not available to
approximately 100 homes passed and telephony services were not available to approximately 500 homes passed.
- (c)
- Represents
number of households/businesses that receive at least one of the Company's services.
- (d)
- Customers
represent each customer account (set up and segregated by customer name and address), weighted equally and counted as one customer, regardless of size,
revenue generated, or number of boxes, units, or outlets. In calculating the number of customers, we count all customers other than inactive/disconnected customers. Free accounts are included in the
customer counts along with all active accounts, but they are limited to a prescribed group. Most of these accounts are also not entirely free, as they typically generate revenue through pay-per-view
or other pay services. Free status is not granted to regular customers as a promotion. In counting bulk residential customers, such as an apartment building, we count each subscribing family unit
within the building as one customer, but do not count the master account for the entire building as a customer. We count a bulk commercial customer, such as a hotel, as one customer, and do not count
individual room units at that hotel.
- (e)
- Represents
the number of customers that subscribe to three of our services divided by total residential customer relationships.
- (f)
- Represents
the number of total customer relationships divided by homes passed.
- (g)
- Calculated
by dividing the average monthly revenue for the respective quarter (fourth quarter for annual period) presented derived from the sale of broadband, pay
television and telephony services to residential customers for the respective quarter by the average number of total residential customers for the same period.
- (h)
- The
metrics for Cequel presented in the table above have been adjusted from previously reported amounts to conform to the methodology used to calculate the
equivalent Cablevision metrics.
- (i)
- Includes
Newsday revenue of $5,008, $3,811, $54,604, and $51,966 for the three months ended September 30, 2016, the period June 21 to June 30,
2016, the period April 1 to June 20, 2016 and the three months ended March 31, 2016, respectively.
- (j)
- Includes Newsday revenue of $61,018, $57,570, $61,735, and $56,913 for the three months ended December 31, 2015, September 30, 2015, June 30, 2015 and March 31, 2015.
66
UNAUDITED PRO FORMA CONSOLIDATED FINANCIAL INFORMATION
The following unaudited pro forma consolidated statement of operations of Altice USA, Inc. ("Altice USA" or the "Company") for the year ended December 31, 2016 is based on the audited historical consolidated financial statements of the Company and gives effect to the Cablevision Acquisition (defined below) as if it had occurred on January 1, 2016. The unaudited pro forma consolidated statement of operations of the Company for the three months ended March 31, 2016 is based on the unaudited historical condensed consolidated financial statements of the Company and gives effect to the Cablevision Acquisition (defined below) as if it had occurred on January 1, 2016. The unaudited pro forma net loss per share data for the year ended December 31, 2016 and the three months ended March 31, 2017 gives effect to the issuances of common stock in connection with the Organizational Transactions discussed herein, as if they occurred at the beginning of the respective period. The Company's historical consolidated results of operations for the three months ended March 31, 2016 include the operating results of Cequel for the three months ended March 31, 2016. The Company's historical consolidated results of operations for the year ended December 31, 2016 include the operating results of Cequel for the year ended December 31, 2016 and Cablevision for the period subsequent to the Cablevision Acquisition, June 21, 2016 to December 31, 2016 (the "Cablevision Successor" period).
The accompanying unaudited pro forma consolidated statements of operations of Altice USA include the accounts of Altice USA and its wholly-owned subsidiaries. All significant intercompany transactions and balances are eliminated in the consolidated financial statements.
The accompanying unaudited pro forma consolidated statements of operations have been prepared based on assumptions deemed appropriate by the Company. The pro forma adjustments are described in the accompanying notes. The unaudited pro forma consolidated statements of operations are for informational purposes only. The pro forma statements of operations are unaudited and do not purport to reflect the results of operations that would have occurred if the Cablevision Acquisition had been consummated on the date indicated above, nor does it purport to represent the results of operations of the Company for any future dates or periods.
Future results may vary significantly from the information reflected in the unaudited pro forma consolidated statements of operations set forth below due to factors beyond the control of the Company.
The unaudited pro forma consolidated statements of operations do not include any adjustment for costs that may result from integration activities or for synergies resulting from the acquisitions. In 2016, the Company recorded restructuring expenses resulting from initiatives that are intended to simplify the Company's organizational structure. No adjustments have been made to the pro forma statements of operations for these restructuring expenses. The unaudited pro forma statement of operations for the year ended December 31, 2016 does not include an estimated $33,501 of transaction costs incurred in connection with the Cablevision Acquisition.
Optimum Acquisition
On June 21, 2016 (the "Cablevision Acquisition Date"), pursuant to the Agreement and Plan of Merger (the "Merger Agreement"), dated as of September 16, 2015, by and among Cablevision, Altice N.V., Neptune Merger Sub Corp., a wholly-owned subsidiary of Altice ("Merger Sub"), Merger Sub merged with and into Cablevision, with Cablevision surviving the merger (the "Cablevision Acquisition").
In connection with the Cablevision Acquisition, each outstanding share of the Cablevision NY Group Class A common stock, par value $0.01 per share, and Cablevision NY Group Class B common stock, par value $0.01 per share, and together with the Cablevision NY Group Class A common stock,
67
the "Shares") other than (i) Shares owned by Cablevision, Altice N.V. or any of their respective wholly-owned subsidiaries, in each case not held on behalf of third parties in a fiduciary capacity, received $34.90 in cash without interest, less applicable tax withholdings (the "Optimum Acquisition Consideration").
Also in connection with the Cablevision Acquisition, outstanding equity-based awards granted under Cablevision's equity plans were cancelled and converted into cash based upon the $34.90 per Share Cablevision Acquisition price in accordance with the original terms of the awards. The total consideration for the outstanding CNYG Class A Shares, the outstanding CNYG Class B Shares, and the equity-based awards amounted to $9,958,323.
In connection with the Cablevision Acquisition, in October 2015, Neptune Finco Corp. ("Finco"), an indirect wholly-owned subsidiary of Altice formed to complete the financing described herein and the merger with CSC Holdings, a wholly-owned subsidiary of Cablevision, borrowed an aggregate principal amount of $3,800,000 under a term loan facility (the "Term Credit Facility") and entered into revolving loan commitments in an aggregate principal amount of $2,000,000 (the "Revolving Credit Facility" and, together with the Term Credit Facility, the "Credit Facilities").
Finco also issued $1,800,000 aggregate principal amount of 10.125% senior notes due 2023 (the "2023 Notes"), $2,000,000 aggregate principal amount of 10.875% senior notes due 2025 (the "2025 Notes"), and $1,000,000 aggregate principal amount of 6.625% senior guaranteed notes due 2025 (the "2025 Guaranteed Notes") (collectively the "Cablevision Acquisition Notes"). On June 21, 2016, immediately following the Cablevision Acquisition, Finco merged with and into CSC Holdings, with CSC Holdings surviving the merger (the "CSC Holdings Merger"), and the Cablevision Acquisition Notes and the Credit Facilities became obligations of CSC Holdings.
On June 21, 2016, in connection with the Cablevision Acquisition, the Company issued notes payable to affiliates and related parties aggregating $1,750,000, of which $875,000 bear interest at 10.75% and $875,000 bear interest at 11%.
The following table provides the preliminary allocation of the total purchase price of $9,958,323 to the identifiable tangible and intangible assets and liabilities of Cablevision based on preliminary fair value information currently available, which is subject to change within the measurement period (up to one year from the acquisition date).
| |
Cablevision | |||
|---|---|---|---|---|
| |
Preliminary Fair Values |
|||
| |
(dollars in thousands) |
|||
Current assets |
$ | 1,923,071 | ||
Accounts receivable |
271,305 | |||
Property, plant and equipment |
4,864,621 | |||
Goodwill |
5,839,016 | |||
Cable television franchise rights |
8,113,575 | |||
Customer relationships |
4,850,000 | |||
Trade names |
1,010,000 | |||
Amortizable intangible assets |
23,296 | |||
Other non-current assets |
748,998 | |||
Current liabilities |
(2,306,049 | ) | ||
Long-term debt |
(8,355,386 | ) | ||
Deferred income taxes |
(6,834,769 | ) | ||
Other non-current liabilities |
(189,355 | ) | ||
| | | | | |
Total |
$ | 9,958,323 | ||
| | | | | |
| | | | | |
| | | | | |
68
ALTICE USA, INC.
UNAUDITED PRO FORMA CONSOLIDATED STATEMENT OF OPERATIONS
FOR THE YEAR ENDED DECEMBER 31, 2016
(dollars in thousands, except per share amounts)
| |
Historical(1) | Cablevision(2) | Pro Forma Adjustments |
Pro forma | |||||||||
|---|---|---|---|---|---|---|---|---|---|---|---|---|---|
Revenue |
$ | 6,017,212 | $ | 3,137,604 | $ | — | $ | 9,154,816 | |||||
| | | | | | | | | | | | | | |
Operating expenses: |
|||||||||||||
Programming and other direct costs |
1,899,994 | 1,088,555 | — | 2,988,549 | |||||||||
Other operating expenses |
1,716,851 | 1,136,970 | — | 2,853,821 | |||||||||
Restructuring and other expense |
240,395 | 22,223 | (32,844 | )(3) | 229,774 | ||||||||
Depreciation and amortization (including impairments) |
1,700,306 | 414,550 | 369,428 | (4) | 2,484,284 | ||||||||
| | | | | | | | | | | | | | |
|
5,557,546 | 2,662,298 | 336,584 | 8,556,428 | |||||||||
| | | | | | | | | | | | | | |
Operating income |
459,666 | 475,306 | (336,584 | ) | 598,388 | ||||||||
Other income (expense): |
|||||||||||||
Interest expense |
(1,456,541 | ) | (287,098 | ) | (20,032 | )(5) | (1,763,671 | ) | |||||
Interest income |
13,811 | 1,590 | (12,151 | )(6) | 3,250 | ||||||||
Gain on investments, net |
141,896 | 129,990 | — | 271,886 | |||||||||
Loss on equity derivative contracts, net |
(53,696 | ) | (36,283 | ) | — | (89,979 | ) | ||||||
Loss on interest rate swap contracts |
(72,961 | ) | — | — | (72,961 | ) | |||||||
Loss on extinguishment of debt and write-off of deferred financing costs |
(127,649 | ) | — | — | (127,649 | ) | |||||||
Other income, net |
4,329 | 4,855 | — | 9,184 | |||||||||
| | | | | | | | | | | | | | |
|
(1,550,811 | ) | (186,946 | ) | (32,183 | ) | (1,769,940 | ) | |||||
| | | | | | | | | | | | | | |
Income (loss) from continuing operations before income taxes |
(1,091,145 | ) | 288,360 | (368,767 | ) | (1,171,552 | ) | ||||||
Income tax benefit (expense) |
259,666 | (124,848 | ) | 315,477 | (7) | 450,295 | |||||||
| | | | | | | | | | | | | | |
Net income (loss) |
(831,479 | ) | 163,512 | (53,290 | ) | (721,257 | ) | ||||||
Net loss (income) attributable to noncontrolling interests |
(551 | ) | 236 | — | (315 | ) | |||||||
| | | | | | | | | | | | | | |
Net income (loss) attributable to Altice USA stockholders |
$ | (832,030 | ) | $ | 163,748 | $ | (53,290 | ) | $ | (721,572 | ) | ||
| | | | | | | | | | | | | | |
| | | | | | | | | | | | | | |
| | | | | | | | | | | | | | |
Pro forma basic and diluted net loss per share attributable to Altice USA stockholders(8) |
$ | (1.00 | ) | ||||||||||
| | | | | | | | | | | | | | |
| | | | | | | | | | | | | | |
| | | | | | | | | | | | | | |
Pro forma basic and diluted weighted average common shares in thousands(8) |
725,000 | ||||||||||||
| | | | | | | | | | | | | | |
| | | | | | | | | | | | | | |
| | | | | | | | | | | | | | |
Notes to Unaudited Pro Forma Consolidated Statement of Operations for the Year Ended December 31, 2016
- (1)
- The Company's historical consolidated results of operations for the year ended December 31, 2016 include the operating results of Cablevision for the period subsequent to the Cablevision Acquisition, June 21, 2016 to December 31, 2016 (Successor period), and the operating results of Cequel for the year ended December 31, 2016.
69
- (2)
- Represents
the results of operations of Cablevision for the period prior to the Cablevision Acquisition, January 1, 2016 to June 20, 2016 (Predecessor
period), based on the audited historical statement of operations.
- (3)
- Restructuring and other expense. Represents the elimination of incremental transaction costs of $32,844
which were directly related to the Cablevision Acquisition.
- (4)
- Depreciation and amortization. Represents incremental depreciation and amortization that would have been recognized if the Cablevision Acquisition was completed on January 1, 2016 resulting from the step up in fair value of Cablevision's property, plant and equipment and identifiable intangible assets resulting from the application of business combinations accounting.
Full year 2016 pro forma depreciation and amortization based on fair value related to the Cablevision Acquisition |
$ | 1,747,643 | ||
Historical expense for period January 1 to June 20, 2016 |
(414,550 | ) | ||
Historical expense for June 21 to December 31, 2016 included in "Historical" column (based on fair value) |
(963,665 | ) | ||
| | | | | |
Total adjustment |
$ | 369,428 | ||
| | | | | |
| | | | | |
| | | | | |
The adjustment for depreciation was estimated using an average useful life of approximately seven years calculated on a straight line basis for property, plant and equipment.
Customer relationships are amortized using an accelerated method (sum of the years' digits) to reflect the period over which the relationships are expected to generate cash flows. The following table summarizes the amortization expense related to customer relationships of $4,850,000 for Cablevision.
| |
Cablevision | |||
|---|---|---|---|---|
Pro forma Amortization of Customer Relationships: |
||||
Year 1 |
$ | 636,043 | ||
Year 2 |
590,163 | |||
Year 3 |
544,284 | |||
Year 4 |
498,404 | |||
Year 5 |
452,524 | |||
Thereafter |
2,128,582 | |||
The amortization of trade names related to Cablevision reflect an average useful life of 12 years, calculated on a straight line basis.
- (5)
- Interest expense. Primarily represents the following adjustments:
- (i)
- the
incremental increase in interest expense of $87,755 for the period January 1, 2016 through June 20, 2016 related to notes payable to affiliates
aggregating $1,750,000 ($875,000 at 10.75% and $875,000 at 11.0%) to finance the Cablevision Acquisition.
- (ii)
- the
reversal of $37,407 of interest expense and $3,194 of amortization of deferred financing costs associated with the CSC Holdings and Newsday credit facilities
that were repaid on the Cablevision Acquisition date.
- (iii)
- the decrease of $32,502 reflecting the accretion/amortization of fair value adjustments associated with the long-term debt assumed in connection with the Cablevision Acquisition resulting from the application of business combinations accounting and the reversal of amortization of deferred financing cost associated with the long-term debt assumed. The long-term debt assumed was adjusted to fair value based on quoted market prices. The difference between the fair value and the face amount of each borrowing is accreted/amortized over the remaining term of each
70
borrowing. This adjustment results in interest expense that effectively reflects current market interest rates rather than the stated interest rates.
- (6)
- Interest income. Represents the elimination of interest income on the proceeds of the Cablevision
Acquisition Notes that were held in escrow from the date of issuance to the Cablevision Acquisition Date.
- (7)
- Income tax expense. The pro forma income tax adjustments represent (i) the income tax impact
related to the pro forma adjustment discussed above of $147,507 at the combined federal and state statutory rate in effect during the period of 40%, (ii) the elimination of the one-time
deferred tax expense of $153,660, included in the historical results resulting from the remeasurement of Cequel's deferred tax liabilities as a result of Cablevision joining the Altice USA
consolidated tax group, (iii) the elimination of the one-time tax impact of $13,849 associated with the non-deductible transaction costs, included in the historical results and (iv) tax
benefit of $461 associated with the Company not being subject to Section 162(m) of the Internal Revenue Code.
- (8)
- The pro forma net loss per share data for the year ended December 31, 2016 gives effect to the issuances of common stock in connection with the Organizational Transactions discussed herein, as if they occurred at the beginning of the period. Prior to the completion of the offering, the pre-offering number of shares of common stock outstanding will be increased to reflect the issuance of shares to capitalize the notes payable to affiliates and related parties based on the initial public offering price, following which shares of the Company's Class A common stock and Class B common stock will issued to shareholders in a recapitalization such that there will be approximately 725 million shares of Class A common stock and Class B common stock outstanding prior to this offering. Shares of Class B common stock will only be issued to CVC 3 and A4 S.A. in the Organizational Transactions. All other existing shareholders will receive shares of Class A common stock. The computation for pro forma net loss per share is provided below:
Pro forma net loss attributable to Altice USA, Inc. stockholders |
$ | (721,572 | ) | |
Historical weighted average shares of common stock outstanding—basic and diluted (in thousands) |
0.1 | |||
Pro forma adjustment to reflect the assumed issuance of common stock (in thousands) |
725,000 | |||
Weighted average shares of common stock outstanding used in computing the pro forma net loss per share (in thousands)—basic and diluted |
725,000 | |||
Pro forma net loss per share—basic and diluted |
$ | (1.00 | ) |
71
ALTICE USA, INC
UNAUDITED PRO FORMA CONSOLIDATED STATEMENT OF OPERATIONS
FOR THE THREE MONTHS ENDED MARCH 31, 2016
(dollars in thousands, except per share amounts)
| |
Historical(1) | Cablevision(2) | Pro Forma Adjustments |
Pro forma | |||||||||
|---|---|---|---|---|---|---|---|---|---|---|---|---|---|
Revenue |
$ | 627,589 | $ | 1,645,890 | $ | — | $ | 2,273,479 | |||||
| | | | | | | | | | | | | | |
Operating expenses: |
|||||||||||||
Programming and other direct costs |
189,595 | 578,230 | — | 767,825 | |||||||||
Other operating expenses |
175,265 | 601,499 | — | 776,764 | |||||||||
Restructuring and other expense |
7,569 | 2,453 | (1,416) | (3) | 8,606 | ||||||||
Depreciation and amortization (including impairments) |
200,900 | 212,453 | 222,708 | (4) | 636,061 | ||||||||
| | | | | | | | | | | | | | |
|
573,329 | 1,394,635 | 221,292 | 2,189,256 | |||||||||
| | | | | | | | | | | | | | |
Operating income (loss) |
54,260 | 251,255 | (221,292 | ) | 84,223 | ||||||||
Other income (expense): |
|||||||||||||
Interest expense |
(275,829 | ) | (149,367 | ) | (12,255) | (5) | (437,451 | ) | |||||
Interest income |
6,415 | 822 | (6,387) | (6) | 850 | ||||||||
Gain on investments, net |
— | 100,365 | — | 100,365 | |||||||||
Loss on equity derivative contracts, net |
— | (48,012 | ) | — | (48,012 | ) | |||||||
Other income, net |
11 | 2,034 | — | 2,045 | |||||||||
| | | | | | | | | | | | | | |
|
(269,403 | ) | (94,158 | ) | (18,642 | ) | (382,203 | ) | |||||
| | | | | | | | | | | | | | |
Income (loss) from continuing operations before income taxes |
(215,143 | ) | 157,097 | (239,934 | ) | (297,980 | ) | ||||||
Income tax benefit (expense) |
74,395 | (62,786 | ) | 96,230 | (7) | 107,839 | |||||||
| | | | | | | | | | | | | | |
Net income (loss) |
(140,748 | ) | 94,311 | (143,704 | ) | (190,141 | ) | ||||||
Net loss attributable to noncontrolling interests |
— | 66 | — | 66 | |||||||||
| | | | | | | | | | | | | | |
Net income (loss) attributable to Altice USA stockholders |
$ | (140,748 | ) | $ | 94,377 | $ | (143,704 | ) | $ | (190,075 | ) | ||
| | | | | | | | | | | | | | |
| | | | | | | | | | | | | | |
| | | | | | | | | | | | | | |
Pro forma basic and diluted net loss per share attributable to Altice USA stockholders(8) |
$ | (0.26 | ) | ||||||||||
| | | | | | | | | | | | | | |
| | | | | | | | | | | | | | |
| | | | | | | | | | | | | | |
Pro forma basic and diluted weighted average common shares (in thousands)(8) |
725,000 | ||||||||||||
| | | | | | | | | | | | | | |
| | | | | | | | | | | | | | |
| | | | | | | | | | | | | | |
Notes to Unaudited Pro Forma Consolidated Statement of Operations for the Three Months Ended March 31, 2016
- (1)
- The
Company's historical consolidated results of operations for the three months ended March 31, 2016 include the operating results of Cequel.
- (2)
- Represents
the results of operations of Cablevision for the period prior to the Cablevision Acquisition, January 1, 2016 to March 31, 2016 (Predecessor
period), based on the historical statement of operations.
- (3)
- Restructuring and other expense. Represents the elimination of incremental transaction costs of $1,416 which were directly related to the Cablevision Acquisition.
72
- (4)
- Depreciation and amortization. Represents incremental depreciation and amortization that would have been recognized if the Cablevision Acquisition was completed on January 1, 2016 resulting from the step up in fair value of Cablevision's property, plant and equipment and identifiable intangible assets resulting from the application of business combinations accounting.
Pro forma depreciation and amortization based on fair value |
$ | 435,161 | ||
Historical expense |
(212,453 | ) | ||
| | | | | |
Total adjustment |
$ | 222,708 | ||
| | | | | |
| | | | | |
| | | | | |
The adjustment for depreciation was estimated using an average useful life of approximately seven years calculated on a straight line basis for property, plant and equipment.
Customer relationships are amortized using an accelerated method (sum of the years' digits) to reflect the period over which the relationships are expected to generate cash flows. The following table summarizes the amortization expense related to customer relationships of $4,850,000 relating to Cablevision:
Pro forma Amortization of Customer Relationships: |
||||
Year 1 |
$ | 636,043 | ||
Year 2 |
590,163 | |||
Year 3 |
544,284 | |||
Year 4 |
498,404 | |||
Year 5 |
452,524 | |||
Thereafter |
2,128,582 |
The amortization of trade names reflect an average useful life of 12 years calculated on a straight line basis.
- (5)
- Interest expense. Primarily represents the following adjustments:
- (i)
- the
incremental increase in interest expense of $47,578 for the three months ended March 31, 2016 related to notes payable to affiliates aggregating
$1,750,000 ($875,000 at 10.75% and $875,000 at 11.0%) to finance the Cablevision Acquisition.
- (ii)
- the
reversal of $19,716 of interest expense and $1,732 of amortization of deferred financing costs associated with the CSC Holdings and Newsday credit facilities
that were repaid on the Cablevision Acquisition date.
- (iii)
- the
decrease of $16,713 reflecting the accretion/amortization of fair value adjustments associated with the long-term debt assumed in connection with the
Cablevision Acquisition resulting from the application of business combinations accounting and the reversal of amortization of deferred financing cost associated with the long-term debt assumed. The
long-term debt assumed was adjusted to fair value based on quoted market prices. The difference between the fair value and the face amount of each borrowing is accreted/amortized over the remaining
term of each borrowing. This adjustment results in interest expense that effectively reflects current market interest rates rather than the stated interest rates.
- (6)
- Interest income. Represents the elimination of interest income on the proceeds of the Cablevision
Acquisition Notes that were held in escrow from the date of issuance to the Cablevision Acquisition Date.
- (7)
- Income tax expense. The pro forma income tax adjustments represent (i) the income tax impact related to the pro forma adjustment discussed above of $95,973 at the combined federal and state statutory rate in effect during the period of 40%, and (ii) tax benefit of $257 associated with the Company not being subject to Section 162(m) of the Internal Revenue Code.
73
- (8)
- The pro forma net loss per share data for the three months ended March 31, 2017 gives effect to the issuances of common stock in connection with the Organizational Transactions discussed herein, as if they occurred at the beginning of the period. Prior to the completion of the offering, the pre-offering number of shares of common stock outstanding will be increased to reflect the issuance of shares to capitalize the notes payable to affiliates and related parties based on the initial public offering price, following which shares of the Company's Class A common stock and Class B common stock will issued to shareholders in a recapitalization such that there will be approximately 725 million shares of Class A common stock and Class B common stock outstanding prior to this offering. Shares of Class B common stock will only be issued to CVC 3 and A4 S.A. in the Organizational Transactions. All other existing shareholders will receive shares of Class A common stock. The computation for pro forma net loss per share is provided below:
Pro forma net loss attributable to Altice USA, Inc. stockholders |
$ | (190,075 | ) | |
Historical weighted average shares of common stock outstanding—basic and diluted (in thousands) |
0.1 | |||
Pro forma adjustment to reflect the assumed issuance of common stock (in thousands) |
725,000 | |||
Weighted average shares of common stock outstanding used in computing the pro forma net loss per share (in thousands)—basic and diluted |
725,000 | |||
Pro forma net loss per share—basic and diluted |
$ | (0.26 | ) |
74
MANAGEMENT'S DISCUSSION AND ANALYSIS OF FINANCIAL CONDITION AND
RESULTS OF OPERATIONS
All dollar amounts, except per customer and per share data, included in the following discussion are presented in thousands.
Overview
Our Business
We deliver broadband, pay television, telephony services, Wi-Fi hotspot access, proprietary content and advertising services to approximately 4.9 million residential and business customers. Our footprint extends across 21 states through a fiber-rich broadband network with more than 8.5 million homes passed as of March 31, 2017. We have two reportable segments: Cablevision and Cequel. Cablevision provides broadband, pay television and telephony services to residential and business customers in and around the New York metropolitan area. Cequel provides broadband, pay television and telephony services to residential and business customers in the south-central United States, with approximately 97% of its customers located in the ten states of Texas, West Virginia, Louisiana, Arkansas, North Carolina, Oklahoma, Arizona, California, Missouri and Ohio.
Recent Transactions
On December 21, 2015, Altice N.V. acquired approximately 70% of the total outstanding equity interests in Cequel. The consideration for the acquired equity interests was $3,973,528. Following the closing of the Cequel Acquisition, BCP and CPPIB retained 30% of Cequel's outstanding capital stock. In June 2016, Cequel was contributed to Altice USA.
On June 21, 2016, a subsidiary of Altice N.V. merged with and into Cablevision, with Cablevision as the surviving entity and wholly-owned subsidiary of Altice USA. In connection with the merger, each outstanding share of Cablevision NY Group Class A common stock, par value $0.01 per share, and Cablevision NY Group Class B common stock, par value $0.01 per share (together, the "CNYG Shares"), received $34.90 in cash without interest, less applicable tax withholdings. The total consideration for the CNYG Shares and equity-based awards amounted to approximately $9,958,323.
In July 2016, we completed the sale of a 75% interest in Newsday and retained the remaining 25% ownership interest. Effective July 7, 2016, the operating results of Newsday are no longer consolidated with our results and our 25% interest in the operating results of Newsday is recorded on the equity basis.
Key Factors Impacting Operating Results and Financial Condition
Our future performance is dependent, to a large extent, on the impact of direct competition, general economic conditions (including capital and credit market conditions), our ability to manage our businesses effectively, and our relative strength and leverage in the marketplace, both with suppliers and customers. See "Risk Factors," "Industry Overview," and "Business" for more information.
We derive revenue principally through monthly charges to residential subscribers of our broadband, pay television and telephony services. We also derive revenue from equipment rental, DVR, VOD, pay-per-view, installation and home shopping commissions. Our residential pay television, broadband and telephony services accounted for approximately 45%, 27% and 9%, respectively, of our consolidated revenue for the three months ended March 31, 2017 and for the year ended December 31, 2016. We also derive revenue from the sale of a wide and growing variety of products and services to both large enterprise and SMB customers, including broadband, telephony, networking and pay television services. For the three months ended March 31, 2017 and for the year ended December 31, 2016, 14% of our consolidated revenue was derived from these business services. In addition, we derive
75
revenues from the sale of advertising time available on the programming carried on our cable television systems, which accounted for approximately 4% of our consolidated revenue for the three months ended March 31, 2017 and for the year ended December 31, 2016. Our other revenue for the three months ended March 31, 2017 and for the year ended December 31, 2016 accounted for approximately 1% of our consolidated revenue.
Revenue increases are derived from rate increases, increases in the number of subscribers to our services, including additional services sold to our existing subscribers, programming package upgrades by our pay television customers, speed tier upgrades by our broadband customers, and acquisitions of cable systems that result in the addition of new subscribers.
Our ability to increase the number of subscribers to our services is significantly related to our penetration rates.
We operate in a highly competitive consumer-driven industry and we compete against a variety of broadband, pay television and telephony providers and delivery systems, including broadband communications companies, wireless data and telephony providers, satellite-delivered video signals, Internet-delivered video content, and broadcast television signals available to residential and business customers in our service areas. Our competitors include AT&T and its DirecTV subsidiary, CenturyLink, DISH Network and Frontier and Verizon. Consumers' selection of an alternate source of service, whether due to economic constraints, technological advances or preference, negatively impacts the demand for our services. For more information on our competitive landscape, see "Risk Factors," "Industry Overview" and "Business—Competition."
Our programming costs, which are the most significant component of our operating expenses, have increased and are expected to continue to increase primarily as a result of contractual rate increases and new channel launches. See "—Results of Operations" below for more information regarding our key factors impacting our revenues and operating expenses.
Historically, we have made substantial investments in our network and the development of new and innovative products and other service offerings for our customers as a way of differentiating ourselves from our competitors and may continue to do so in the future. We have commenced a five-year plan to build a FTTH network, which will enable us to deliver more than 10 Gbps broadband speeds across our entire Cablevision footprint and part of our Cequel footprint. We may incur greater than anticipated capital expenditures in connection with this initiative, fail to realize anticipated benefits, experience delays and business disruptions or encounter other challenges to executing it as planned. See "—Liquidity and Capital Resources—Capital Expenditures" for additional information regarding our capital expenditures.
Basis of Presentation
The following discussions are presented below:
- •
- Altice USA—Comparison of Actual Results for the Three Months Ended March 31, 2017 to the Actual Results for the Three Months Ended March 31, 2016 and Pro Forma Results for the Three Months Ended March 31, 2016.
The actual results of Altice USA for the three months ended March 31, 2016 include the operating results of Cequel for the three months ended March 31, 2016. The consolidated pro forma results of Altice USA for the three months ended March 31, 2016 have been derived from the unaudited pro forma consolidated statement of operations included elsewhere herein and give effect to the Cablevision Acquisition as if it had occurred on January 1, 2016.
76
- •
- Altice USA—Comparison of Actual Results for the Year Ended December 31, 2016 and Pro Forma Results for the Year Ended December 31, 2016 to Pro Forma Results for the Year Ended December 31, 2015.
- •
- Cablevision (predecessor to Altice USA)—Comparison of Actual Results for the Periods June 21, 2016 through December 31, 2016 and January 1, 2016 through June 20, 2016 to Actual Results for the Year Ended December 31, 2015 and Actual Results for the Year Ended December 31, 2015 to December 31, 2014.
- •
- Cequel—Comparison of Actual Results for the Period December 21, 2015 through December 31, 2015 and January 1, 2015 through December 20, 2015 to Actual Results for the Year Ended December 31, 2014.
The actual results of Altice USA for the year ended December 31, 2016 include the operating results of Cequel for the year ended December 31, 2016 and the operating results of Cablevision for the period from the date of the Cablevision Acquisition, June 21, 2016 through December 31, 2016. The consolidated pro forma results of Altice USA for the year ended December 31, 2016 have been derived from the unaudited pro forma consolidated statements of operations included elsewhere herein and give effect to the Cablevision Acquisition as if it had occurred on January 1, 2016. The consolidated pro forma results of Altice USA for the year ended December 31, 2015 give effect to the Cablevision Acquisition as if it had occurred on January 1, 2015.
The period June 21, 2016 through December 31, 2016 reflects operating results subsequent to the Cablevision Acquisition and is labeled "Successor." The results for the period January 1, 2016 through June 20, 2016 and the years ended December 31, 2015 and 2014 reflect operating results for periods prior to the Cablevision Acquisition and are labeled "Predecessor." The accompanying financial data of Cablevision include a black line division to indicate the application of the different bases of accounting utilized by the Predecessor and Successor reporting entities as a result of push down accounting. As a result, the financial statements for the Predecessor periods and for the Successor period are not comparable. The operating results for the 2016 Successor period are included in the Altice USA consolidated results for the year ended December 31, 2016.
The period December 21, 2015 through December 31, 2015 reflects operating results subsequent to the Cequel Acquisition and is labeled "Successor." The results for the period January 1, 2015 through December 20, 2015 and the year ended December 31, 2014 reflect operating results for periods prior to the Cequel Acquisition and are labeled "Predecessor." The accompanying financial data of Cequel include a black line division to indicate the application of the different bases of accounting utilized by the Predecessor and Successor reporting entities as a result of push down accounting. As a result, the financial statements for the Predecessor periods and for the Successor period are not comparable.
The unaudited pro forma consolidated statements of operations for the year ended December 31, 2016 and the three months ended March 31, 2016 presented herein reflect the Cablevision Acquisition as if it had occurred on January 1, 2016. The unaudited pro forma consolidated statement of operations for the year ended December 31, 2015 presented herein reflects the Cablevision Acquisition and Cequel Acquisition as if they had occurred on January 1, 2015. The pro forma results have been prepared based on assumptions deemed appropriate by the Company. The pro forma adjustments include (i) the elimination of incremental costs that were directly related to the Cablevision Acquisition for the 2016 periods and the Cequel Acquisition for 2015, (ii) the incremental depreciation and amortization that would have been recognized if the Cablevision Acquisition was completed on January 1, 2016 for the 2016 periods and if the Cablevision Acquisition and Cequel Acquisition had occurred on January 1, 2015 for 2015 resulting from the step up in fair value of their property, plant and equipment and identifiable intangible assets resulting from the application of business combinations
77
accounting, (iii) the elimination of share-based compensation which was recorded in the 2015 Predecessor period resulting from the acceleration of vesting of Cequel's equity-based awards pursuant to a change in control provision of the awards, (iv) the incremental interest resulting from the issuance of debt to fund the acquisitions, net of the reversal of interest and amortization of deferred financing costs related to credit facilities that were repaid on the date of acquisition and the accretion/ amortization of fair value adjustments associated with the long-term debt acquired, (v) the elimination of interest income earned on cash proceeds from the issuance of debt prior to the Cablevision Acquisition and (vi) the income tax impact of these pro forma adjustments and the Cablevision Acquisition.
The unaudited pro forma consolidated statements of operations are for informational purposes only. We believe that the pro forma information is useful as it provides additional information given the significant impact of the acquisitions and a reflection of how the combined business performed year over year that is not readily discernible from the actual year over year comparison. We believe that a comparison of the actual results for the three months ended March 31, 2017 to the pro forma results for the three months ended March 31, 2016 provides useful information because it reflects the business operations on a more comparable basis. The pro forma statements of operations are unaudited and do not purport to reflect the results of operations that would have occurred if the Cequel Acquisition and Cablevision Acquisition had been consummated on the dates indicated above, nor does it purport to represent the results of operations of the Company for any future dates or periods.
Non-GAAP Financial Measures
We define Adjusted EBITDA, which is a non-GAAP financial measure, as net income (loss) excluding income taxes, income (loss) from discontinued operations, other non-operating income or expenses, loss on extinguishment of debt and write-off of deferred financing costs, loss on interest rate swap contracts, gain (loss) on equity derivative contracts, gain (loss) on investments, interest expense (including cash interest expense), interest income, depreciation and amortization (including impairments), share-based compensation expense or benefit, restructuring expense or credits and transaction expenses. We believe Adjusted EBITDA is an appropriate measure for evaluating the operating performance of the Company. Adjusted EBITDA and similar measures with similar titles are common performance measures used by investors, analysts and peers to compare performance in our industry. Internally, we use revenue and Adjusted EBITDA measures as important indicators of our business performance, and evaluate management's effectiveness with specific reference to these indicators. We believe Adjusted EBITDA provides management and investors a useful measure for period-to-period comparisons of our core business and operating results by excluding items that are not comparable across reporting periods or that do not otherwise relate to the Company's ongoing operating results. Adjusted EBITDA should be viewed as a supplement to and not a substitute for operating income (loss), net income (loss), and other measures of performance presented in accordance with GAAP. Since Adjusted EBITDA is not a measure of performance calculated in accordance with GAAP, this measure may not be comparable to similar measures with similar titles used by other companies. Refer to the reconciliation of Adjusted EBITDA to net income (loss) in "Summary Historical and Pro Forma Financial Data."
78
Results of Operations for the Three Months Ended March 31, 2017 and 2016—Altice USA
| |
Altice USA | |||||||||
|---|---|---|---|---|---|---|---|---|---|---|
| |
Historical | Pro Forma | Historical | |||||||
| |
Three Months Ended March 31, | |||||||||
| |
2017 | 2016 | 2016 | |||||||
Revenue: |
||||||||||
Residential: |
||||||||||
Pay TV |
$ | 1,071,361 | $ | 1,054,058 | $ | 279,737 | ||||
Broadband |
611,769 | 547,680 | 196,690 | |||||||
Telephony |
210,873 | 221,012 | 39,735 | |||||||
Business services and wholesale |
319,591 | 300,855 | 84,404 | |||||||
Advertising |
79,968 | 79,364 | 20,887 | |||||||
Other |
12,114 | 70,510 | 6,136 | |||||||
| | | | | | | | | | | |
Total revenue |
2,305,676 | 2,273,479 | 627,589 | |||||||
| | | | | | | | | | | |
Operating expenses: |
||||||||||
Programming and other direct costs |
758,352 | 767,825 | 189,595 | |||||||
Other operating expenses |
613,437 | 776,764 | 175,265 | |||||||
Restructuring and other expense |
76,929 | 8,606 | 7,569 | |||||||
Depreciation and amortization |
608,724 | 636,061 | 200,900 | |||||||
| | | | | | | | | | | |
Operating income |
248,234 | 84,223 | 54,260 | |||||||
Other income (expense): |
||||||||||
Interest expense, net |
(433,062 | ) | (436,601 | ) | (269,414 | ) | ||||
Gain on investments, net |
131,658 | 100,365 | — | |||||||
Loss on equity derivative contracts, net |
(71,044 | ) | (48,012 | ) | — | |||||
Gain on interest rate swap contracts |
2,342 | — | — | |||||||
Other income (expense), net |
(224 | ) | 2,045 | 11 | ||||||
| | | | | | | | | | | |
Loss before income taxes |
(122,096 | ) | (297,980 | ) | (215,143 | ) | ||||
Income tax benefit |
45,908 | 107,839 | 74,395 | |||||||
| | | | | | | | | | | |
Net loss |
(76,188 | ) | (190,141 | ) | (140,748 | ) | ||||
Net loss (income) attributable to noncontrolling interests |
(237 | ) | 66 | — | ||||||
| | | | | | | | | | | |
Net loss attributable to Altice USA stockholders |
$ | (76,425 | ) | $ | (190,075 | ) | $ | (140,748 | ) | |
| | | | | | | | | | | |
| | | | | | | | | | | |
| | | | | | | | | | | |
79
The following is a reconciliation of net loss to Adjusted EBITDA:
| |
Altice USA | |||||||||
|---|---|---|---|---|---|---|---|---|---|---|
| |
Historical | Pro Forma (Unaudited) |
Historical | |||||||
| |
Three Months Ended March 31, | |||||||||
| |
2017 | 2016 | 2016 | |||||||
Net loss |
$ | (76,188 | ) | (190,141 | ) | (140,748 | ) | |||
Income tax benefit |
(45,908 | ) | (107,839 | ) | (74,395 | ) | ||||
Other expense (income) |
224 | (2,045 | ) | (11 | ) | |||||
Gain on interest rate swap contracts |
(2,342 | ) | — | — | ||||||
Loss on equity derivative contracts, net(a) |
71,044 | 48,012 | — | |||||||
Gain on investments, net |
(131,658 | ) | (100,365 | ) | — | |||||
Interest expense, net |
433,062 | 436,601 | 269,414 | |||||||
Depreciation and amortization |
608,724 | 636,061 | 200,900 | |||||||
Restructuring and other expenses |
76,929 | 8,606 | 7,569 | |||||||
Share-based compensation |
7,848 | 14,698 | — | |||||||
| | | | | | | | | | | |
Adjusted EBITDA |
$ | 941,735 | $ | 743,588 | $ | 262,729 | ||||
| | | | | | | | | | | |
| | | | | | | | | | | |
| | | | | | | | | | | |
- (a)
- Consists of unrealized and realized losses (gains) due to the change in fair value of equity derivative contracts relating to the Comcast common stock owned by the Company.
The following table sets forth certain customer metrics by segment (unaudited):
| |
|
|
|
December 31, 2016 | March 31, 2016 | |||||||||||||||||||||||
|---|---|---|---|---|---|---|---|---|---|---|---|---|---|---|---|---|---|---|---|---|---|---|---|---|---|---|---|---|
| |
March 31, 2017 | |||||||||||||||||||||||||||
| |
|
Cequel (g) |
|
|
Cequel (g) |
|
||||||||||||||||||||||
| |
Cablevision | Cequel | Total | Cablevision | Total | Cablevision | Total | |||||||||||||||||||||
| |
(in thousands, except per customer amounts) |
|||||||||||||||||||||||||||
Homes passed(a) |
5,128 | 3,419 | 8,547 | 5,116 | 3,407 | 8,524 | 5,086 | 3,362 | 8,448 | |||||||||||||||||||
Total customers relationships(b) |
3,148 | 1,765 | 4,913 | 3,141 | 1,751 | 4,892 | 3,125 | 1,734 | 4,859 | |||||||||||||||||||
Residential |
2,887 | 1,661 | 4,548 | 2,879 | 1,649 | 4,528 | 2,866 | 1,638 | 4,504 | |||||||||||||||||||
SMB |
261 | 103 | 365 | 262 | 102 | 364 | 258 | 96 | 354 | |||||||||||||||||||
Residential customers(c): |
||||||||||||||||||||||||||||
Pay TV |
2,413 | 1,087 | 3,500 | 2,428 | 1,107 | 3,535 | 2,473 | 1,150 | 3,623 | |||||||||||||||||||
Broadband |
2,636 | 1,366 | 4,003 | 2,619 | 1,344 | 3,963 | 2,580 | 1,308 | 3,888 | |||||||||||||||||||
Telephony |
1,955 | 596 | 2,551 | 1,962 | 597 | 2,559 | 1,999 | 597 | 2,596 | |||||||||||||||||||
Residential triple product customer penetration(d): |
64.4 | % | 25.4 | % | 50.2 | % | 64.8 | % | 25.5 | % | 50.5 | % | 66.9 | % | 25.8 | % | 52.0 | % | ||||||||||
Penetration (total customer relationships to homes passed)(e): |
61.4 | % | 51.6 | % | 57.5 | % | 61.4 | % | 51.4 | % | 57.4 | % | 61.4 | % | 51.6 | % | 57.5 | % | ||||||||||
ARPU(f) |
$ | 155.83 | $ | 110.00 | $ | 139.11 | $ | 154.49 | $ | 109.30 | $ | 138.07 | $ | 152.18 | $ | 105.68 | $ | 135.32 | ||||||||||
- (a)
- Represents
the estimated number of single residence homes, apartments and condominium units passed by the cable distribution network in areas serviceable without
further extending the transmission lines. In addition, it includes commercial establishments that have connected to our cable distribution network. For Cequel, broadband services were not available to
approximately 100 homes passed and telephony services were not available to approximately 500 homes passed.
- (b)
- Represents
number of households/businesses that receive at least one of the Company's services.
- (c)
- Customers represent each customer account (set up and segregated by customer name and address), weighted equally and counted as one customer, regardless of size, revenue generated, or number of boxes, units, or outlets. In calculating the number of customers, we count all customers other than inactive/disconnected customers. Free accounts are included in the customer counts along with all active accounts, but they are
80
limited to a prescribed group. Most of these accounts are also not entirely free, as they typically generate revenue through pay-per-view or other pay services. Free status is not granted to regular customers as a promotion. In counting bulk residential customers, such as an apartment building, we count each subscribing family unit within the building as one customer, but do not count the master account for the entire building as a customer. We count a bulk commercial customer, such as a hotel, as one customer, and do not count individual room units at that hotel.
- (d)
- Represents
the number of customers that subscribe to three of our services divided by total residential customer relationships.
- (e)
- Represents
the number of total customer relationships divided by homes passed.
- (f)
- Calculated
by dividing the average monthly revenue for the respective quarter (fourth quarter for annual periods) derived from the sale of broadband, pay television
and telephony services to residential customers for the respective quarter by the average number of total residential customers for the same period.
- (g)
- The metrics for Cequel presented in the table above have been adjusted from previously reported amounts to align with the Cablevision metrics definitions.
| |
|
|
|
Historical | |||||||||
|---|---|---|---|---|---|---|---|---|---|---|---|---|---|
| |
Historical | ||||||||||||
| |
Three Months Ended March 31, 2016 |
||||||||||||
| |
Three Months Ended March 31, 2017 | ||||||||||||
| |
Cablevision | Cequel | Total | Cequel(a) | |||||||||
Revenue: |
|||||||||||||
Residential: |
|||||||||||||
Pay TV |
$ | 789,387 | $ | 281,974 | $ | 1,071,361 | $ | 279,737 | |||||
Broadband |
381,969 | 229,800 | 611,769 | 196,690 | |||||||||
Telephony |
176,401 | 34,472 | 210,873 | 39,735 | |||||||||
Business services and wholesale |
228,685 | 90,906 | 319,591 | 84,404 | |||||||||
Advertising |
61,739 | 18,229 | 79,968 | 20,887 | |||||||||
Other |
6,620 | 5,494 | 12,114 | 6,136 | |||||||||
| | | | | | | | | | | | | | |
Total revenue |
1,644,801 | 660,875 | 2,305,676 | 627,589 | |||||||||
| | | | | | | | | | | | | | |
Operating expenses: |
|||||||||||||
Programming and other direct costs |
568,311 |
190,041 |
758,352 |
189,595 |
|||||||||
Other operating expenses |
454,499 | 158,938 | 613,437 | 175,265 | |||||||||
Restructuring and other expense |
58,647 | 18,282 | 76,929 | 7,569 | |||||||||
Depreciation and amortization |
443,176 | 165,548 | 608,724 | 200,900 | |||||||||
| | | | | | | | | | | | | | |
Operating income |
$ | 120,168 | $ | 128,066 | $ | 248,234 | $ | 54,260 | |||||
| | | | | | | | | | | | | | |
| | | | | | | | | | | | | | |
| | | | | | | | | | | | | | |
- (a)
- Certain reclassifications have been made to previously reported amounts by product to reflect the current presentation.
81
The following table sets forth certain operating information by segment on a pro forma basis:
| |
Pro Forma | |||||||||
|---|---|---|---|---|---|---|---|---|---|---|
| |
Three Months Ended March 31, 2016 | |||||||||
| |
Cablevision | Cequel | Total | |||||||
Revenue: |
||||||||||
Residential: |
||||||||||
Pay TV |
$ | 774,321 | $ | 279,737 | $ | 1,054,058 | ||||
Broadband |
350,990 | 196,690 | 547,680 | |||||||
Telephony |
181,277 | 39,735 | 221,012 | |||||||
Business services and wholesale |
216,451 | 84,404 | 300,855 | |||||||
Advertising |
58,477 | 20,887 | 79,364 | |||||||
Other |
64,374 | 6,136 | 70,510 | |||||||
| | | | | | | | | | | |
Total revenue |
1,645,890 | 627,589 | 2,273,479 | |||||||
| | | | | | | | | | | |
Operating expenses: |
||||||||||
Programming and other direct costs |
578,230 | 189,595 | 767,825 | |||||||
Other operating expenses |
601,499 | 175,265 | 776,764 | |||||||
Restructuring and other expense |
1,037 | 7,569 | 8,606 | |||||||
Depreciation and amortization |
435,161 | 200,900 | 636,061 | |||||||
| | | | | | | | | | | |
Operating income |
$ | 29,963 | $ | 54,260 | $ | 84,223 | ||||
| | | | | | | | | | | |
| | | | | | | | | | | |
| | | | | | | | | | | |
Altice USA—Comparison of Actual Results for the Three Months Ended March 31, 2017 compared to Three Months Ended March 31, 2016 and Comparison of Actual Results for the Three Months Ended March 31, 2017 compared to Pro Forma Results for the Three Months Ended March 31, 2016
Please see "—Basis of Presentation" for an explanation of why we believe that a comparison of the actual results for the three months ended March 31, 2017 to the pro forma results for the three months ended March 31, 2016 provides useful information.
Pay Television Revenue
Actual Three Months Ended March 31, 2017 Compared to Actual Three Months Ended March 31, 2016
Pay television revenue for the three months ended March 31, 2017 was $1,071,361, of which $789,387 relates to our Cablevision segment and $281,974 relates to our Cequel segment. Pay television revenue for the three months ended March 31, 2016 was $279,737 and was derived from our Cequel segment. Pay television is derived principally through monthly charges to residential subscribers of our pay television services. Revenue increases are derived primarily from rate increases, increases in the number of subscribers, including additional services sold to our existing subscribers, and programming package upgrades.
Actual Three Months Ended March 31, 2017 Compared to Pro Forma Three Months Ended March 31, 2016
Pay television revenue for the three months ended March 31, 2017 was $1,071,361 compared to $1,054,058 for the three months ended March 31, 2016, on a pro forma basis. The increase of $17,303 (2%) is comprised of a pro forma increase of $15,066 (2%) for our Cablevision segment and a pro forma increase of $2,237 (1%) for our Cequel segment.
On a pro forma basis, pay television revenue for our Cablevision segment amounted to $789,387 and $774,321 for the three months ended March 31, 2017 and 2016, respectively. The pro forma increase of $15,066 (2%) was due primarily to rate increases for certain video services implemented
82
near the end of the fourth quarter of 2016 and an increase in late fees. Partially offsetting these increases was a decrease in revenue as compared to the prior year due to a decline in pay television customers.
On a pro forma basis, pay television revenue for our Cequel segment amounted to $281,974 and $279,737 for the three months ended March 31, 2017 and 2016, respectively. The pro forma increase of $2,237 was due primarily to certain rate increases (including an increase for retransmission programming and sports programming charges) and an increase in installation services revenue, partially offset by a decline in the number of pay television customers and a decrease in premium, pay-per-view and VOD purchases as compared to the prior year period.
We believe our pay television customer declines noted in the table above are largely attributable to competition, particularly from Verizon in our Cablevision footprint and DBS providers in our Cequel footprint, as well as competition from companies that deliver video content over the Internet directly to customers. These factors are expected to continue to impact our ability to maintain or increase our existing customers and revenue in the future.
Broadband Revenue
Actual Three Months Ended March 31, 2017 Compared to Actual Three Months Ended March 31, 2016
Broadband revenue for the three months ended March 31, 2017 was $611,769 of which $381,969 was derived from our Cablevision segment and $229,800 was derived from our Cequel segment. Broadband revenue for the three months ended March 31, 2016 was $196,690 and was derived from our Cequel segment. Broadband revenue is derived principally through monthly charges to residential subscribers of our broadband services. Revenue increases are derived primarily from rate increases, increases in the number of subscribers, including additional services sold to our existing subscribers, and speed tier upgrades.
Actual Three Months Ended March 31, 2017 Compared to Pro Forma Three Months Ended March 31, 2016
Broadband revenue for the three months ended March 31, 2017 was $611,769 compared to $547,680 for the three months ended March 31, 2016, on a pro forma basis. On a pro forma basis, broadband revenue increased $64,089 (12%) and is comprised of a pro forma increase of $30,979 (9%) for our Cablevision segment and a pro forma increase of $33,110 (17%) for our Cequel segment.
On a pro forma basis, broadband revenue for our Cablevision segment amounted to $381,969 and $350,990 for the three months ended March 31, 2017 and 2016, respectively. The pro forma increase of $30,979 (9%) was due to higher average recurring broadband revenue per broadband customer, an increase in high-speed data customers, and an increase in late fees.
On a pro forma basis, broadband revenue for our Cequel segment amounted to $229,800 and $196,690 for the three months ended March 31, 2017 and 2016, respectively. The pro forma increase of $33,110 (17%) was due primarily to an increase in broadband customers, an increase in rates, an increase resulting from the impact of service level changes and an increase in residential home networking revenue.
Telephony Revenue
Actual Three Months Ended March 31, 2017 Compared to Actual Three Months Ended March 31, 2016
Telephony revenue for the three months ended March 31, 2017 was $210,873 of which $176,401 was derived from the Cablevision segment and $34,472 was derived from our Cequel segment. Telephony revenue for the three months ended March 31, 2016 was $39,735 and was derived from our
83
Cequel segment. Telephony revenue is derived principally through monthly charges to residential subscribers of our telephony services. Revenue increases are derived primarily from rate increases, increases in the number of subscribers, and additional services sold to our existing subscribers.
Actual Three Months Ended March 31, 2017 Compared to Pro Forma Three Months Ended March 31, 2016
Telephony revenue for the three months ended March 31, 2017 was $210,873 compared to $221,012 for the three months ended March 31, 2016, on a pro forma basis. The pro forma decrease of $10,139 (5%) is comprised of a pro forma decrease of $4,876 (3%) and $5,263 (13%) for our Cablevision and Cequel segment, respectively.
On a pro forma basis, telephony revenue for our Cablevision segment amounted to $176,401 and $181,277 for the three months ended March 31, 2017 and 2016, respectively. The pro forma decrease of $4,876 (3%) was due primarily to a decline in international calling and a decline in telephony customers.
On a pro forma basis, telephony revenue for our Cequel segment amounted to $34,472 and $39,735 for the three months ended March 31, 2017 and 2016, respectively, a pro forma decrease of $5,263 (13%) which was due primarily to lower rates offered to customers.
Business Services and Wholesale Revenue
Actual Three Months Ended March 31, 2017 Compared to Actual Three Months Ended March 31, 2016
Business services and wholesale revenue for the three months ended March 31, 2017 was $319,591 of which $228,685 was derived from the Cablevision segment and $90,906 was derived from our Cequel segment. Business services and wholesale revenue for the three months ended March 31, 2016 was $84,404 and was derived from our Cequel segment. Business services and wholesale revenue is derived primarily from the sale of fiber based telecommunications services to the business market, and the sale of broadband, pay television and telephony services to SMBs.
Actual Three Months Ended March 31, 2017 Compared to Pro Forma Three Months Ended March 31, 2016
Business services and wholesale revenue for the three months ended March 31, 2017 was $319,591 compared to $300,855 for the three months ended March 31, 2016, on a pro forma basis. The pro forma increase of $18,736 (6%) is comprised of a pro forma increase of $12,234 (6%) for our Cablevision segment and a pro forma increase of $6,502 (8%) for our Cequel segment.
On a pro forma basis, business services and wholesale revenue for our Cablevision segment amounted to $228,685 and $216,451 for the three months ended March 31, 2017 and 2016, respectively. The pro forma increase of $12,234 (6%) was primarily due to higher average recurring telephony and broadband revenue per SMB customer and an increase in Ethernet revenue resulting from a larger number of services installed, partially offset by reduced traditional voice and data services for commercial customers.
On a pro forma basis, business services and wholesale revenue for our Cequel segment amounted to $90,906 and $84,404 for the three months ended March 31, 2017 and 2016, respectively. The pro forma increase of $6,502 (8%) was primarily due to higher commercial rates and customers for high-speed Internet services, an increase in certain pay television rates (including an increase for retransmission programming charges) and increases in commercial carrier services.
84
Advertising Revenue
Actual Three Months Ended March 31, 2017 Compared to Actual Three Months Ended March 31, 2016
Advertising services revenue for the three months ended March 31, 2017 was $79,968 of which $61,739 was derived from our Cablevision segment and $18,229 was derived from our Cequel segment. Advertising revenue for the three months ended March 31, 2016 was $20,887 and was derived from our Cequel segment. Advertising services revenue is primarily derived from the sale of advertising time available on the programming carried on our cable television systems.
Actual Three Months Ended March 31, 2017 Compared to Pro Forma Three Months Ended March 31, 2016
Advertising services revenue for the three months ended March 31, 2017 was $79,968 compared to $79,364 for the three months ended March 31, 2016, on a pro forma basis. The pro forma increase of $604 is comprised of a pro forma increase of $3,262 (6%) for our Cablevision segment, partially offset bay a pro forma decrease of $2,658 (13%) for our Cequel segment.
On a pro forma basis, advertising services revenue for our Cablevision segment amounted to $61,739 and $58,477 for the three months ended March 31, 2017 and 2016, respectively, a pro forma increase of $3,262 (6%).
On a pro forma basis, advertising services revenue for our Cequel segment amounted to $18,229 and $20,887 for the three months ended March 31, 2017 and 2016, respectively, a pro forma decrease of $2,658 (13%).
Other Revenue
Actual Three Months Ended March 31, 2017 Compared to Actual Three Months Ended March 31, 2016
Other revenue for the three months ended March 31, 2017 was $12,114 of which $6,620 was derived from our Cablevision segment and $5,494 was derived from our Cequel segment. Other revenue for the three months ended March 31, 2016 was $6,136 and was derived from our Cequel segment. Other revenue includes other miscellaneous revenue streams.
Actual Three Months Ended March 31, 2017 Compared to Pro Forma Three Months Ended March 31, 2016
Other revenue for the three months ended March 31, 2017 was $12,114 compared to $70,510 for the three months ended March 31, 2016, on a pro forma basis. The pro forma decrease of $58,396 (83%) is comprised of a pro forma decrease of $57,754 (90%) for our Cablevision segment and a pro forma decrease of $642 (10%) for our Cequel segment.
On a pro forma basis, other revenue for our Cablevision segment amounted to $6,620 and $64,374 for the three months ended March 31, 2017 and 2016, respectively. The pro forma decrease of $57,754 (90%) was primarily due to Cablevision no longer consolidating the operating results of Newsday as a result of the sale of a 75% interest in Newsday, effective July 7, 2016. The Company's 25% interest in the operating results of Newsday is recorded on the equity basis.
On a pro forma basis other revenue for our Cequel segment amounted to $5,494 and $6,136 for the three months ended March 31, 2017 and 2016, respectively, a pro forma decrease of $642 (10%).
85
Programming and Other Direct Costs
Actual Three Months Ended March 31, 2017 Compared to Actual Three Months Ended March 31, 2016
Programming and other direct costs for the three months ended March 31, 2017 amounted to $758,352, of which $568,311 relate to our Cablevision segment and $190,041 relate to our Cequel segment. Programming and other direct costs for the three months ended March 31, 2016 was $189,595 and relate to our Cequel segment. Programming and other direct costs include cable programming costs, which are costs paid to programmers (net of amortization of any incentives received from programmers for carriage) for cable content (including costs of VOD and pay-per-view) and are generally paid on a per-subscriber basis. These costs typically rise due to increases in contractual rates and new channel launches and are also impacted by changes in the number of customers receiving certain programming services. These costs also include interconnection, call completion, circuit and transport fees paid to other telecommunication companies for the transport and termination of voice and data services, which typically vary based on rate changes and the level of usage by our customers. These costs also include franchise fees which are payable to the state governments and local municipalities where we operate and are primarily based on a percentage of certain categories of revenue derived from the provision of pay television service over our cable systems, which vary by state and municipality. These costs change in relation to changes in such categories of revenues or rate changes.
Actual Three Months Ended March 31, 2017 Compared to Pro Forma Three Months Ended March 31, 2016
Programming and other direct costs for the three months ended March 31, 2017 amounted to $758,352 compared to $767,825 for the three months ended March 31, 2016, on a pro forma basis. Programming and other direct costs on a pro forma basis amounted to $568,311 and $578,230 for our Cablevision segment and amounted to $190,041 and $189,595 for our Cequel segment for the three months ended March 31, 2017 and 2016, respectively. The pro forma decrease of $9,473 is attributable to the following:
Cablevision segment: |
||||
Decrease in costs primarily related to the sale of Newsday in July 2016 |
$ | (15,622 | ) | |
Decrease in call completion and transport costs primarily due to lower level of activity |
(5,263 | ) | ||
Decrease in cost of sales (which includes the bulk sale of handset inventory of $5,445 during the first quarter of 2016) |
(4,831 | ) | ||
Increase in programming costs due primarily to contractual rate increases, partially offset by lower costs resulting from lower pay television customers |
16,638 | |||
Other net decreases |
(841 | ) | ||
| | | | | |
|
(9,919 | ) | ||
| | | | | |
Cequel segment: |
||||
Increase in programming costs due primarily to contractual rate increases, partially offset by lower pay television customers and lower pay-per-view and video-on-demand costs |
2,214 | |||
Decrease in franchise costs due to lower pay television customers |
(810 | ) | ||
Net decrease in call completion and interconnection costs due to lower level of activity |
(426 | ) | ||
Other net decreases |
(532 | ) | ||
| | | | | |
|
446 | |||
| | | | | |
|
$ | (9,473 | ) | |
| | | | | |
| | | | | |
| | | | | |
86
Programming costs
Programming costs aggregated $636,232 for the three months ended March 31, 2017 on an actual basis and on a pro forma basis aggregated $617,055 for the three months ended March 31, 2016. Our programming costs increased 3% on a pro forma basis for the three months ended March 31, 2017 as compared to the pro forma basis for the three months ended March 31, 2016 due primarily to an increase in contractual programming rates, partially offset by a decrease in pay television customers. Our programming costs in 2017 will continue to be impacted by changes in programming rates, which we expect to increase by high single digits, and by changes in the number of pay television customers.
Other Operating Expenses
Actual Three Months Ended March 31, 2017 Compared to Actual Three Months Ended March 31, 2016
Other operating expenses for the three months ended March 31, 2017 amounted to $613,437, of which $454,499 related to our Cablevision segment and $158,938 related to our Cequel segment. Other operating expenses for the three months ended March 31, 2016 amounted to $175,265 and relate to our Cequel segment. Other operating expenses include staff costs and employee benefits including salaries of company employees and related taxes, benefits and other employee related expenses. Other operating expenses also include network management and field service costs, which represent costs associated with the maintenance of our broadband network, including costs of certain customer connections and other costs associated with providing and maintaining services to our customers which are impacted by general cost increases for contractors, insurance and other various expenses.
Customer installation and repair and maintenance costs may fluctuate as a result of changes in the level of activities and the utilization of contractors as compared to employees. Also, customer installation costs fluctuate as the portion of our expenses that we are able to capitalize changes. Network repair and maintenance and utility costs also fluctuate as capitalizable network upgrade and enhancement activity changes.
Other operating expenses also include costs related to the operation and maintenance of our call center facilities that handle customer inquiries and billing and collection activities and sales and marketing costs, which include advertising production and placement costs associated with acquiring and retaining customers. These costs vary period to period and certain of these costs, such as sales and marketing, may increase with intense competition. Additionally, other operating expenses include various other administrative costs, including legal fees, and product development costs.
Actual Three Months Ended March 31, 2017 Compared to Pro Forma Three Months Ended March 31, 2016
Other operating expenses for the three months ended March 31, 2017 amounted to $613,437 compared to $776,764 for the three months ended March 31, 2016, on a pro forma basis. Other operating expenses on a pro forma basis amounted to $454,499 and $601,499 for our Cablevision segment and amounted to $158,938 and $175,265 for our Cequel segment for the three months ended
87
March, 31, 2017 and 2016, respectively. The pro forma decrease of $163,327 (21%) is attributable to the following:
Cablevision segment: |
||||
Decrease primarily in employee related costs related to the elimination of certain positions, lower net benefits, including lower bonus expense, and an increase in capitalizable activity, partially offset by merit increases |
$ | (83,109 | ) | |
Decrease in costs primarily related to the sale of Newsday in July 2016 |
(45,678 | ) | ||
Decrease in share-based compensation and long-term incentive plan awards expense |
(10,432 | ) | ||
Decrease in product development costs and product consulting fees |
(8,153 | ) | ||
Decrease in repairs and maintenance costs relating to our operations |
(7,757 | ) | ||
Increase in sales and marketing costs |
7,628 | |||
Increase due to Altice management fee for certain executive services |
5,000 | |||
Other net decreases |
(4,499 | ) | ||
| | | | | |
|
(147,000 | ) | ||
| | | | | |
Cequel segment: |
||||
Decrease primarily in salaries and benefits related to the elimination of certain positions, in connection with the initiatives to simplify the Company's organizational structure, partially offset by a decrease in capitalizable activity |
(16,753 | ) | ||
Decrease in contract labor costs |
(2,053 | ) | ||
Decrease in insurance costs |
(1,706 | ) | ||
Increase in consulting and professional fees |
2,139 | |||
Increase in property, general and sales and use taxes |
1,303 | |||
Other net increases |
743 | |||
| | | | | |
|
(16,327 | ) | ||
| | | | | |
|
$ | (163,327 | ) | |
| | | | | |
| | | | | |
| | | | | |
Restructuring and Other Expense
Actual Three Months Ended March 31, 2017 Compared to Actual Three Months Ended March 31, 2016
Restructuring and other expense for the three months ended March 31, 2017 of $76,929 ($58,647 for our Cablevision segment and $18,282 for our Cequel segment) and $7,569 for the three months ended March 31, 2016 related to our Cequel segment primarily relate to severance and other employee related costs resulting from headcount reductions related to initiatives which commenced in 2016 that are intended to simplify the Company's organizational structure. We currently anticipate that additional restructuring expenses will be recognized as we continue to analyze our organizational structure.
Actual Three Months Ended March 31, 2017 Compared to Pro Forma Three Months Ended March 31, 2016
Restructuring and other expense for the three months ended March 31, 2017 was $76,929 compared to $8,606 ($1,037 for our Cablevision segment and $7,569 for our Cequel segment) for the three months ended March 31, 2016, on a pro forma basis.
Restructuring and other expense for the three months ended March 31, 2017 period primarily relate to severance and other employee related costs resulting from headcount reductions related to initiatives which commenced in 2016 that are intended to simplify the Company's organizational structure.
The pro forma restructuring expense for the three months ended March 31, 2016 related to Cequel is primarily related to severance and other employee related costs resulting from headcount reductions
88
related to initiatives which commenced in 2016 that are intended to simplify the Company's organizational structure at Cequel. Restructuring and other expense for the three months ended March 31, 2016 related to Cablevision includes adjustments related to prior restructuring plans of $1,037.
Depreciation and Amortization
Actual Three Months Ended March 31, 2017 Compared to Actual Three Months Ended March 31, 2016
Depreciation and amortization for the three months ended March 31, 2017 amounted to $608,724, of which $443,176 relates to our Cablevision segment and $165,548 relates to our Cequel segment. Depreciation and amortization for the three months ended March 31, 2016 of $200,900 relates to our Cequel segment.
The decrease of $35,352 (18%) related to our Cequel segment is primarily due to a decrease of approximately $13,000 resulting from accelerated amortization methods used for the step-up related to certain intangible assets, a decrease of approximately $12,800 resulting from revisions made to the fair value of assets acquired and their remaining useful lives resulting from the finalization in the fourth quarter of 2016 of the purchase price allocation in connection with the Cequel Acquisition, and lower depreciation due to certain assets being retired or becoming fully depreciated.
On May 23, 2017, Altice N.V. announced the adoption of a global brand which will replace the Optimum and Suddenlink brands in the future, reducing the remaining useful lives of our trade name intangibles, which will increase amortization expense.
Actual Three Months Ended March 31, 2017 Compared to Pro Forma Three Months Ended March 31, 2016
Depreciation and amortization for the three months ended March 31, 2017 was $608,724 compared to $636,061 for the three months ended March 31, 2016, on a pro forma basis. The pro forma decrease of $27,337 (4%) is comprised of a $8,015 (2%) pro forma increase for our Cablevision segment and a pro forma decrease of $35,352 (18%) for our Cequel segment. The pro forma increase for our Cablevision segment is primarily due to depreciation on new assets additions. For Cequel, the decrease is due primarily to lower amortization expense for certain intangible assets that are being amortized using an accelerated method, offset by depreciation on new assets additions.
Adjusted EBITDA
Actual Three Months Ended March 31, 2017 Compared to Actual Three Months Ended March 31, 2016
Adjusted EBITDA amounted to $941,735 for the three months ended March 31, 2017, of which $627,073 relates to our Cablevision segment and $314,662 relates to our Cequel segment, Adjusted EBITDA of $262,729 for the three months ended March 31, 2016, relates to our Cequel segment. Adjusted EBITDA is a non-GAAP measure that is defined as net loss excluding income taxes, loss from discontinued operations, other non-operating income or expenses, loss on extinguishment of debt and write-off of deferred financing costs, loss on interest rate swap contracts, gain (loss) on equity derivative contracts, gain (loss) on investments, interest expense (including cash interest expense), interest income, depreciation and amortization (including impairments), share-based compensation expense, restructuring expense or credits and transaction expenses. See reconciliation of net loss to adjusted EBITDA above.
For our Cequel segment, adjusted EBITDA increased $51,933 (20%) for the three months ended March 31, 2017 as compared to the same period in the prior year. The increase is due primarily to an increase in revenue and a decrease in operating expenses (excluding depreciation and amortization, restructuring expense and other expenses and share-based compensation).
89
Actual Three Months Ended March 31, 2017 Compared to Pro Forma Three Months Ended March 31, 2016
Adjusted EBITDA for the three months ended March 31, 2017 was $941,735 compared to $743,588 for the three months ended March 31, 2016, on a pro forma basis. The pro forma increase of $198,147 (27%) consists of a pro forma increase of $146,215 (30%) for our Cablevision segment and a pro forma increase of $51,932 (20%) for our Cequel segment. The pro forma increase was due primarily to an increase in revenue, and a decrease in operating expenses (excluding depreciation and amortization, restructuring and other expense and share-based compensation), as discussed above.
Interest Expense, net
Actual Three Months Ended March 31, 2017 Compared to Actual Three Months Ended March 31, 2016
Interest expense, net was $433,062 and $269,414 for the three months ended March 31, 2017 and 2016, respectively, and includes interest on debt issued to finance the Cablevision Acquisition and Cequel Acquisition, as well as interest on debt assumed in connection with these acquisitions.
Actual Three Months Ended March 31, 2017 Compared to Pro Forma Three Months Ended March 31, 2016
Interest expense, net amounted to $433,062 for the three months ended March 31, 2017 and $436,601 for the three months ended March 31, 2016, on a pro forma basis. The pro forma decrease of $3,539 is primarily attributable to a $6,320 decrease in the amortization of deferred financing costs and discounts/premiums resulting from recording debt at fair value in connection with the Cablevision and Cequel Acquisitions, partially offset by an increase of $1,256 due to the change in average debt balances.
See "Liquidity and Capital Resources" discussion below for a detail of our borrower groups.
Gain on Investments, net
Actual Three Months Ended March 31, 2017 Compared to Actual Three Months Ended March 31, 2016
Gain on investments, net for the three months ended March 31, 2017 of $131,658 consists primarily of the increase in the fair value of Comcast common stock owned by the Company for the period. The effects of these gains are partially offset by the losses on the related equity derivative contracts, net described below.
Actual Three Months Ended March 31, 2017 Compared to Pro Forma Three Months Ended March 31, 2016
Gain on investments, net for the three months ended March 31, 2017 amounted to $131,658 and for the three months ended March 31, 2016 amounted to $100,365, on a pro forma basis, assuming the Cablevision Acquisition occurred on January 1, 2016 and consists primarily of the increase in the fair value of Comcast common stock owned by the Company. The effects of these gains are partially offset by the losses on the related equity derivative contracts, net described below.
Loss on Equity Derivative Contracts, net
Actual Three Months Ended March 31, 2017 Compared to Actual Three Months Ended March 31, 2016
Loss on equity derivative contracts, net for the three months ended March 31, 2017 of $71,044 consists of unrealized and realized losses, net due to the change in fair value of equity derivative contracts relating to the Comcast common stock owned by the Company. The effects of these losses are
90
offset by the gain on investment securities pledged as collateral, which are included in gain (loss) on investments, net discussed above.
Actual Three Months Ended March 31, 2017 Compared to Pro Forma Three Months Ended March 31, 2016
Loss on equity derivative contracts, net for the three months ended March 31, 2017 was $71,044 compared to $48,012 for the three months ended March 31, 2016, on a pro forma basis, assuming the Cablevision Acquisition occurred on January 1, 2016 and consists of unrealized and realized losses due to the change in fair value of equity derivative contracts relating to the Comcast common stock owned by the Company.
Gain on interest rate swap contracts
Gain on interest rate swap contracts was $2,342 for the three months ended March 31, 2017 and represents the increase in fair value of the fixed to floating interest rate swaps entered into by our Cequel segment in June 2016. The objective of these swaps is to cover the exposure to changes in the market interest rate of the $1,500,000 principal amount of the Cequel 2026 Senior Secured Notes. These swap contracts are not designated as hedges for accounting purposes.
Income Tax Expense
Actual Three Months Ended March 31, 2017 Compared to Actual Three Months Ended March 31, 2016
Income tax benefit for the three months ended March 31, 2017 amounted to $45,908 compared to $74,395 for the three months ended March 31, 2016. Nondeductible carry unit plan expense resulted in tax expense of $3,140 for the three months ended March 31, 2017. There was no state income tax benefit associated with pre-merger accrued interest at Finco. This resulted in reducing income tax benefit by $8,340 for the three months ended March 31, 2016. Absent these items, the effective tax rate for the three months ended March 31, 2017 and 2016 would have been 40% and 38%, respectively.
Actual Three Months Ended March 31, 2017 Compared to Pro Forma Three Months Ended March 31, 2016
Income tax benefit for the three months ended March 31, 2017 was $45,908 compared to $107,839 for the three months ended March 31, 2016, on a pro forma basis. Nondeductible carry unit plan expense resulted in tax expense of $3,140 for the three months ended March 31, 2017. There was no state income tax benefit associated with pre-merger accrued interest at Finco. This resulted in reducing income tax benefit by $8,340 for the three months ended March 31, 2016, on a pro forma basis. Absent these items, the effective tax rate for the three months ended March 31, 2017 and 2016, on a pro forma basis, would have been 40% and 39%, respectively.
91
Results of Operations for the Year Ended December 31, 2016 and 2015—Altice USA
| |
Altice USA | |||||||||
|---|---|---|---|---|---|---|---|---|---|---|
| |
Historical | Pro Forma (Unaudited) | ||||||||
| |
Year Ended December 31, 2016 |
Year Ended December 31, 2016 |
Year Ended December 31, 2015 |
|||||||
Revenue: |
||||||||||
Residential: |
||||||||||
Pay TV |
$ | 2,759,216 | $ | 4,227,222 | $ | 4,260,631 | ||||
Broadband |
1,617,029 | 2,290,039 | 2,005,012 | |||||||
Telephony |
529,973 | 872,115 | 912,002 | |||||||
Business services and wholesale |
819,541 | 1,230,643 | 1,158,840 | |||||||
Advertising |
245,702 | 365,429 | 345,498 | |||||||
Other |
45,751 | 169,368 | 283,874 | |||||||
| | | | | | | | | | | |
Total revenue |
6,017,212 | 9,154,816 | 8,965,857 | |||||||
| | | | | | | | | | | |
Operating expenses: |
||||||||||
Programming and other direct costs |
1,899,994 | 2,988,549 | 2,982,005 | |||||||
Other operating expenses |
1,716,851 | 2,853,821 | 3,499,669 | |||||||
Restructuring and other expense (credits) |
240,395 | 229,774 | (1,649 | ) | ||||||
Depreciation and amortization (including impairments) |
1,700,306 | 2,484,284 | 2,442,235 | |||||||
| | | | | | | | | | | |
Operating income |
459,666 | 598,388 | 43,597 | |||||||
Other income (expense): |
||||||||||
Interest expense, net |
(1,442,730 | ) | (1,760,421 | ) | (1,715,950 | ) | ||||
Gain (loss) on investments, net |
141,896 | 271,886 | (30,208 | ) | ||||||
Gain (loss) on equity derivative contracts, net |
(53,696 | ) | (89,979 | ) | 104,927 | |||||
Loss on interest rate swap contracts |
(72,961 | ) | (72,961 | ) | — | |||||
Loss on extinguishment of debt and write-off of deferred financing costs |
(127,649 | ) | (127,649 | ) | (1,735 | ) | ||||
Other income, net |
4,329 | 9,184 | 6,045 | |||||||
| | | | | | | | | | | |
Loss from continuing operations before income taxes |
(1,091,145 | ) | (1,171,552 | ) | (1,593,324 | ) | ||||
Income tax benefit |
259,666 | 450,295 | 498,567 | |||||||
| | | | | | | | | | | |
Loss from continuing operations, net of income taxes |
(831,479 | ) | (721,257 | ) | (1,094,757 | ) | ||||
Loss from discontinued operations, net of income taxes |
— | — | (12,541 | ) | ||||||
| | | | | | | | | | | |
Net loss |
(831,479 | ) | (721,257 | ) | (1,107,298 | ) | ||||
Net loss (income) attributable to noncontrolling interests |
(551 | ) | (315 | ) | 201 | |||||
| | | | | | | | | | | |
Net loss attributable to Altice USA stockholders |
$ | (832,030 | ) | $ | (721,572 | ) | $ | (1,107,097 | ) | |
| | | | | | | | | | | |
| | | | | | | | | | | |
| | | | | | | | | | | |
92
The following is a reconciliation of net loss to Adjusted EBITDA:
| |
Altice USA | |||||||||
|---|---|---|---|---|---|---|---|---|---|---|
| |
Historical | Pro Forma (Unaudited) | ||||||||
| |
Year Ended December 31, 2016 |
Year Ended December 31, 2016 |
Year Ended December 31, 2015 |
|||||||
Net loss |
$ | (831,479 | ) | $ | (721,257 | ) | $ | (1,107,298 | ) | |
Loss from discontinued operations, net of income taxes |
— | — | 12,541 | |||||||
Income tax benefit |
(259,666 | ) | (450,295 | ) | (498,567 | ) | ||||
Other income, net(a) |
(4,329 | ) | (9,184 | ) | (6,045 | ) | ||||
Loss on extinguishment of debt and write-off of deferred financing costs |
127,649 | 127,649 | 1,735 | |||||||
Loss on interest rate swap contracts |
72,961 | 72,961 | — | |||||||
Loss (gain) on equity derivative contracts, net(b) |
53,696 | 89,979 | (104,927 | ) | ||||||
Loss (gain) on investments, net |
(141,896 | ) | (271,886 | ) | 30,208 | |||||
Interest expense, net |
1,442,730 | 1,760,421 | 1,715,950 | |||||||
Depreciation and amortization (including impairments) |
1,700,306 | 2,484,284 | 2,442,235 | |||||||
Restructuring and other expenses (credits) |
240,395 | 229,774 | (1,649 | ) | ||||||
Share-based compensation |
14,368 | 39,599 | 285,337 | |||||||
| | | | | | | | | | | |
Adjusted EBITDA |
$ | 2,414,735 | $ | 3,352,045 | $ | 2,769,520 | ||||
| | | | | | | | | | | |
| | | | | | | | | | | |
| | | | | | | | | | | |
- (a)
- Includes
primarily dividends received on Comcast common stock owned by the Company.
- (b)
- Consists of unrealized and realized losses (gains) due to the change in fair value of equity derivative contracts relating to the Comcast common stock owned by the Company.
The following table sets forth certain customer metrics by segment (unaudited):
| |
As of December 31, 2016 | Pro Forma as of December 31, 2015 | |
|||||||||||||||||||
|---|---|---|---|---|---|---|---|---|---|---|---|---|---|---|---|---|---|---|---|---|---|---|
| |
Net Increase (Decrease) |
|||||||||||||||||||||
| |
Cablevision | Cequel(g) | Total | Cablevision | Cequel(g) | Total | ||||||||||||||||
Homes passed(a) |
5,116 | 3,407 | 8,524 | 5,076 | 3,352 | 8,428 | 96 | |||||||||||||||
Total customer relationships(b) |
3,141 | 1,751 | 4,892 | 3,115 | 1,712 | 4,827 | 65 | |||||||||||||||
Residential |
2,879 | 1,649 | 4,528 | 2,858 | 1,618 | 4,475 | 53 | |||||||||||||||
SMB |
262 | 102 | 364 | 258 | 94 | 352 | 12 | |||||||||||||||
Residential customers(c): |
||||||||||||||||||||||
Pay TV |
2,428 | 1,107 | 3,535 | 2,487 | 1,154 | 3,640 | (105 | ) | ||||||||||||||
Broadband |
2,619 | 1,344 | 3,963 | 2,562 | 1,276 | 3,838 | 125 | |||||||||||||||
Telephony |
1,962 | 597 | 2,559 | 2,007 | 581 | 2,588 | (29 | ) | ||||||||||||||
Residential triple product customer penetration(d): |
64.8 | % | 25.5 | % | 50.5 | % | 67.6 | % | 25.4 | % | 52.3 | % | (1.8 | )% | ||||||||
Penetration of homes passed(e): |
61.4 | % | 51.4 | % | 57.4 | % | 61.4 | % | 51.1 | % | 57.3 | % | 0.1 | % | ||||||||
ARPU(f) |
$ | 154.49 | $ | 109.30 | $ | 138.07 | $ | 150.61 | $ | 104.04 | $ | 133.79 | $ | 4.28 | ||||||||
- (a)
- Represents the estimated number of single residence homes, apartments and condominium units passed by the cable distribution network in areas serviceable without further extending the transmission lines. In addition, it includes commercial establishments that have connected to our cable distribution network. For Cequel, broadband services were not available to approximately 100 homes passed and telephony services were not available to approximately 500 homes passed.
93
- (b)
- Represents
number of households/businesses that receive at least one of the Company's services.
- (c)
- Customers
represent each customer account (set up and segregated by customer name and address), weighted equally and counted as one customer, regardless of size,
revenue generated, or number of boxes, units, or outlets. In calculating the number of customers, we count all customers other than inactive/disconnected customers. Free accounts are included in the
customer counts along with all active accounts, but they are limited to a prescribed group. Most of these accounts are also not entirely free, as they typically generate revenue through pay-per-view
or other pay services. Free status is not granted to regular customers as a promotion. In counting bulk residential customers, such as an apartment building, we count each subscribing family unit
within the building as one customer, but do not count the master account for the entire building as a customer. We count a bulk commercial customer, such as a hotel, as one customer, and do not count
individual room units at that hotel.
- (d)
- Represents
the number of customers that subscribe to three of our services divided by total residential customer relationships.
- (e)
- Represents
the number of total customer relationships divided by homes passed.
- (f)
- Calculated
by dividing the average monthly revenue for the respective quarter (fourth quarter for annual periods) presented derived from the sale of broadband, pay
television and telephony services to residential customers for the respective quarter by the average number of total residential customers for the same period.
- (g)
- The metrics for Cequel presented in the table above have been adjusted from previously reported amounts to conform to the methodology used to calculate the equivalent Cablevision metrics.
The following table sets forth certain operating information by segment for the year ended December 31, 2016:
| |
December 31, 2016 | |||||||||
|---|---|---|---|---|---|---|---|---|---|---|
| |
Cablevision | Cequel | Total | |||||||
Revenue(a): |
||||||||||
Residential: |
||||||||||
Pay TV |
$ | 1,638,691 | $ | 1,120,525 | $ | 2,759,216 | ||||
Broadband |
782,615 | 834,414 | 1,617,029 | |||||||
Telephony |
376,034 | 153,939 | 529,973 | |||||||
Business services and wholesale |
468,632 | 350,909 | 819,541 | |||||||
Advertising |
157,331 | 88,371 | 245,702 | |||||||
Other |
20,749 | 25,002 | 45,751 | |||||||
| | | | | | | | | | | |
Total revenue |
3,444,052 | 2,573,160 | 6,017,212 | |||||||
| | | | | | | | | | | |
Operating expenses: |
||||||||||
Programming and other direct costs |
1,164,925 | 735,069 | 1,899,994 | |||||||
Other operating expenses |
1,028,447 | 688,404 | 1,716,851 | |||||||
Restructuring and other expense |
212,150 | 28,245 | 240,395 | |||||||
Depreciation and amortization (including impairments) |
963,665 | 736,641 | 1,700,306 | |||||||
| | | | | | | | | | | |
Operating income |
$ | 74,865 | $ | 384,801 | $ | 459,666 | ||||
| | | | | | | | | | | |
| | | | | | | | | | | |
| | | | | | | | | | | |
- (a)
- Certain reclassifications have been made to previously reported amounts by product to reflect the current presentation.
94
The following table sets forth certain operating information by segment on a pro forma basis (unaudited):
| |
Pro forma December 31, 2016 |
Pro forma December 31, 2015 |
|||||||||||||||||
|---|---|---|---|---|---|---|---|---|---|---|---|---|---|---|---|---|---|---|---|
| |
Cablevision | Cequel | Total | Cablevision | Cequel | Total | |||||||||||||
Revenue: |
|||||||||||||||||||
Residential: |
|||||||||||||||||||
Pay TV |
$ | 3,106,697 | $ | 1,120,525 | $ | 4,227,222 | $ | 3,142,991 | $ | 1,117,640 | $ | 4,260,631 | |||||||
Broadband |
1,455,625 | 834,414 | 2,290,039 | 1,303,918 | 701,094 | 2,005,012 | |||||||||||||
Telephony |
718,176 | 153,939 | 872,115 | 748,181 | 163,821 | 912,002 | |||||||||||||
Business services and wholesale |
879,734 | 350,909 | 1,230,643 | 834,154 | 324,686 | 1,158,840 | |||||||||||||
Advertising |
277,058 | 88,371 | 365,429 | 257,832 | 87,666 | 345,498 | |||||||||||||
Other |
144,366 | 25,002 | 169,368 | 258,469 | 25,405 | 283,874 | |||||||||||||
| | | | | | | | | | | | | | | | | | | | |
Total revenue |
6,581,656 | 2,573,160 | 9,154,816 | 6,545,545 | 2,420,312 | 8,965,857 | |||||||||||||
| | | | | | | | | | | | | | | | | | | | |
Operating expenses: |
|||||||||||||||||||
Programming and other direct costs |
2,253,480 | 735,069 | 2,988,549 | 2,269,290 | 712,715 | 2,982,005 | |||||||||||||
Other operating expenses |
2,165,417 | 688,404 | 2,853,821 | 2,546,319 | 953,350 | 3,499,669 | |||||||||||||
Restructuring and other expense (credits) |
201,529 | 28,245 | 229,774 | (1,649 | ) | — | (1,649 | ) | |||||||||||
Depreciation and amortization (including impairments) |
1,747,643 | 736,641 | 2,484,284 | 1,740,996 | 701,239 | 2,442,235 | |||||||||||||
| | | | | | | | | | | | | | | | | | | | |
Operating income (loss) |
$ | 213,587 | $ | 384,801 | $ | 598,388 | $ | (9,411 | ) | $ | 53,008 | $ | 43,597 | ||||||
| | | | | | | | | | | | | | | | | | | | |
| | | | | | | | | | | | | | | | | | | | |
| | | | | | | | | | | | | | | | | | | | |
Altice USA—Comparison of Actual Results for the Year Ended December 31, 2016 and Pro Forma Results for the Year Ended December 31, 2016 to Pro Forma Results for the Year Ended December 31, 2015
Pay Television Revenue
Actual 2016
Pay television revenue for the year ended December 31, 2016 was $2,759,216, of which $1,638,691 was derived from the Cablevision segment from the date of its acquisition and $1,120,525 relates to our Cequel segment. Pay television is derived principally through monthly charges to residential subscribers of our pay television services. Revenue increases are derived primarily from rate increases, increases in the number of subscribers, including additional services sold to our existing subscribers, and programming package upgrades.
Pro Forma 2016 Compared to Pro Forma 2015
On a pro forma basis, pay television revenue amounted to $4,227,222 and $4,260,631 for the year ended December 31, 2016 and 2015, respectively. The decrease of $33,409 (1%) is comprised of a pro forma decrease of $36,294 (1%) for our Cablevision segment, partially offset by a pro forma increase of $2,885 for our Cequel segment.
On a pro forma basis, pay television revenue for our Cablevision segment amounted to $3,106,697 and $3,142,991 for the years ended December 31, 2016 and 2015, respectively. The pro forma decrease of $36,294 (1%) was due primarily to a decline in pay television customers and a decrease due to a pay-per-view boxing event that took place in 2015. Partially offsetting these decreases were increases in revenue as compared to the prior year due primarily to rate increases for certain pay television services
95
implemented during the first quarter of 2016 and an increase in fees charged to restore suspended services.
On a pro forma basis, pay television revenue for our Cequel segment amounted to $1,120,525 and $1,117,640 for the years ended December 31, 2016 and 2015, respectively. The pro forma increase of $2,885 was due primarily to increases in revenue resulting from certain rate increases (including an increase for retransmission programming and sports programming charges), the impact of incremental pay television service level changes and an increase in HD/DVR service revenue, partially offset by a decline in pay television customers, a decrease in premium, pay-per-view and VOD purchases, and a decrease in converter rental revenue as compared to the 2015 period.
We believe our pay television customer declines noted in the table above are largely attributable to competition, particularly from Verizon in our Cablevision footprint and DBS providers in our Cequel footprint, as well as competition from companies that deliver video content over the Internet directly to customers. These factors are expected to continue to impact our ability to maintain or increase our existing customers and revenue in the future.
Broadband Revenue
Actual 2016
Broadband revenue for the year ended December 31, 2016 was $1,617,029 of which $782,615 was derived from the Cablevision segment from the date of its acquisition and $834,414 relates to Cequel. Broadband revenue is derived principally through monthly charges to residential subscribers of our broadband services. Revenue increases are derived primarily from rate increases, increases in the number of subscribers, including additional services sold to our existing subscribers, and speed tier upgrades.
Pro Forma 2016 Compared to Pro Forma 2015
On a pro forma basis, broadband revenue amounted to $2,290,039 and $2,005,012 for the years ended December 31, 2016 and 2015, respectively. On a pro forma basis, broadband revenue increased $285,027 (14%) for the year ended December 31, 2016 as compared the prior year and is comprised of a pro forma increase of $151,707 (12%) for our Cablevision segment and a pro forma increase of $133,320 (19%) for our Cequel segment.
On a pro forma basis, broadband revenue for our Cablevision segment amounted to $1,455,625 and $1,303,918 for the years ended December 31, 2016 and 2015, respectively. The pro forma increase of $151,707 (12%) was due to rate increases for certain broadband services implemented during the first quarter of 2016, an increase in broadband customers, and an increase in fees charged to restore suspended services.
On a pro forma basis, broadband revenue for our Cequel segment amounted to $834,414 and $701,094 for the years ended December 31, 2016 and 2015, respectively. The pro forma increase of $133,320 (19%) was due primarily to an increase in broadband customers, an increase in rates, an increase resulting from the impact of service level changes and an increase in residential home networking revenue.
Telephony Revenue
Actual 2016
Telephony revenue for the year ended December 31, 2016 was $529,973 of which $376,034 was derived from the Cablevision segment from the date of its acquisition and $153,939 relates to Cequel. Telephony revenue is derived principally through monthly charges to residential subscribers of our
96
telephony services. Revenue increases are derived primarily from rate increases, increases in the number of subscribers, and additional services sold to our existing subscribers.
Pro Forma 2016 Compared to Pro Forma 2015
On a pro forma basis, telephony revenue amounted to $872,115 and $912,002 for the years ended December 31, 2016 and 2015, respectively. On a pro forma basis, telephony revenue decreased $39,887 (4%) for the year ended December 31, 2016 as compared to 2015 and is comprised of a pro forma decrease of $30,005 (4%) and $9,882 (6%) for our Cablevision and Cequel segment, respectively.
On a pro forma basis, telephony revenue for our Cablevision segment amounted to $718,176 and $748,181 for the years ended December 31, 2016 and 2015, respectively. The pro forma decrease of $30,005 (4%) was due primarily to a decline in telephony customers and a decline in international calling.
On a pro forma basis, telephony revenue for our Cequel segment amounted to $153,939 and $163,821 for the years ended December 31, 2016 and 2015, respectively. The pro forma decrease of $9,882 (6%) was due primarily to lower rates offered to customers.
Business Services and Wholesale Revenue
Actual 2016
Business services and wholesale revenue for the year ended December 31, 2016 was $819,541 of which $468,632 was derived from the Cablevision segment from the date of its acquisition and $350,909 relates to Cequel. Business services and wholesale revenue is derived primarily from the sale of fiber based telecommunications services to the business market, and the sale of broadband, pay television and telephony services to SMBs.
Pro Forma 2016 Compared to Pro Forma 2015
On a pro forma basis, business services and wholesale revenue amounted to $1,230,643 and $1,158,840 for the years ended December 31, 2016 and 2015, respectively. On a pro forma basis, business services and wholesale revenue increased $71,803 (6%) for year ended December 31, 2016 as compared to 2015 and is comprised of a pro forma increase of $45,580 (5%) for our Cablevision segment and a pro forma increase of $26,223 (8%) for our Cequel segment.
On a pro forma basis, business services and wholesale revenue for our Cablevision segment amounted to $879,734 and $834,154 for the years ended December 31, 2016 and 2015, respectively. The pro forma increase of $45,580 (5%) was due primarily to rate increases for certain broadband services implemented during the first quarter of 2016, and increase in broadband customers and an increase in Ethernet revenue resulting from a larger number of services installed, partially offset by reduced traditional voice and data services.
On a pro forma basis, business services and wholesale revenue for our Cequel segment amounted to $350,909 and $324,686 for the years ended December 31, 2016 and 2015, respectively. The pro forma increase of $26,223 (8%) was primarily due to higher rates and a larger number of customers for broadband services, higher rates and a larger number of customers for telephony services, an increase in certain video rates (including an increase for retransmission programming charges), and an increase in revenue from premium, pay-per-view and VOD purchases. Offsetting these increases was a decrease in high-speed commercial carrier services.
97
Advertising Revenue
Actual 2016
Advertising services revenue for the year ended December 31, 2016 was $245,702 of which $157,331 was derived from the Cablevision segment from the date of its acquisition and $88,371 was derived from our Cequel segment. Advertising services revenue is primarily derived from the sale of advertising time available on the programming carried on our cable television systems.
Pro Forma 2016 Compared to Pro Forma 2015
On a pro forma basis, advertising revenue amounted to $365,429 and $345,498 for the years ended December 31, 2016 and 2015, respectively. On a pro forma basis, advertising revenue increased $19,931 (6%) for the year ended December 31, 2016 as compared to 2015 and is comprised of a pro forma increase of $19,226 (7%) for our Cablevision segment and a pro forma increase of $705 (1%) for our Cequel segment.
On a pro forma basis, advertising revenue for our Cablevision segment amounted to $277,058 and $257,832 for the years ended December 31, 2016 and 2015, respectively. The pro forma increase in advertising revenue of $19,226 (7%) for our Cablevision segment was due primarily to an increase in advertising sales to the political sector.
On a pro forma basis, advertising revenue for our Cequel segment amounted to $88,371 and $87,666 for the years ended December 31, 2016 and 2015, respectively, a pro forma increase of $705 (1%).
Other Revenue
Actual 2016
Other revenue for the year ended December 31, 2016 was $45,751 of which $20,749 was derived from the Cablevision segment from the date of its acquisition and $25,002 was derived from our Cequel segment. Other revenue primarily includes revenue recognized by Newsday, which was consolidated through July 7, 2016, affiliation fees paid by cable operators for carriage of our News 12 Networks, and other miscellaneous revenue streams.
Pro Forma 2016 Compared to Pro Forma 2015
On a pro forma basis, other revenue amounted to $169,368 and $283,874 for the years ended December 31, 2016 and 2015, respectively. On a pro forma basis, other revenue decreased $114,506 (40%) for the year ended December 31, 2016 as compared to 2015 and is comprised of a pro forma decrease of $114,103 (44%) for our Cablevision segment and a pro forma decrease of $403 (2%) for our Cequel segment.
On a pro forma basis other revenue for our Cablevision segment amounted to $144,366 and $258,469 for the years ended December 31, 2016 and 2015, respectively. The pro forma decrease of $114,103 (44%) was primarily due to Cablevision no longer consolidating the operating results of Newsday as a result of the sale of a 75% interest in Newsday, effective July 7, 2016. The Company's 25% interest in the operating results of Newsday is recorded on the equity basis.
On a pro forma basis, other revenue for our Cequel segment amounted to $25,002 and $25,405 for the years ended December 31, 2016 and 2015, respectively, a pro forma decrease of $403 (2%).
98
Programming and Other Direct Costs
Actual 2016
Programming and other direct costs for the year ended December 31, 2016 amounted to $1,899,994 of which $1,164,925 relate to our Cablevision segment from the date of acquisition and $735,069 relate to our Cequel segment. Programming and other direct costs include cable programming costs, which are costs paid to programmers (net of amortization of any incentives received from programmers for carriage) for cable content (including costs of VOD and pay-per-view) and are generally paid on a per-subscriber basis. These costs typically rise due to increases in contractual rates and new channel launches and are also impacted by changes in the number of customers receiving certain programming services. These costs also include interconnection, call completion, circuit and transport fees paid to other telecommunication companies for the transport and termination of voice and data services, which typically vary based on rate changes and the level of usage by our customers. These costs also include franchise fees which are payable to the state governments and local municipalities where we operate and are primarily based on a percentage of certain categories of revenue derived from the provision of pay television service over our cable systems, which vary by state and municipality. These costs change in relation to changes in such categories of revenues or rate changes.
Pro Forma 2016 Compared to Pro Forma 2015
On a pro forma basis, programming and other direct costs amounted to $2,988,549 and $2,982,005 for the years ended December 31, 2016 and 2015, respectively. Programming and other direct costs on a pro forma basis amounted to $2,253,480 and $2,269,290 for our Cablevision segment and amounted to $735,069 and $712,715 for our Cequel segment for the years ended December 31, 2016 and 2015, respectively. The pro forma increase of $6,544 is attributable to the following:
Cablevision segment: |
||||
Decrease in costs primarily related to the sale of Newsday in July 2016 |
$ | (54,133 | ) | |
Decrease in call completion and transport costs primarily due to lower level of activity |
(20,443 | ) | ||
Decrease in cost of sales (which includes a lower cost or market valuation adjustment of $17,382 related to wireless handset inventory from 2015, partially offset by the bulk sale of handset inventory of $5,445 during the first quarter of 2016) |
(10,238 | ) | ||
Increase in franchise and other fees due primarily to increases in rates in certain areas, partially offset by lower video customers |
3,140 | |||
Increase in programming costs due primarily to contractual rate increases, partially offset by lower video customers |
65,760 | |||
Other net increases |
104 | |||
| | | | | |
|
(15,810 | ) | ||
| | | | | |
Cequel segment: |
||||
Increase in programming costs due primarily to contractual rate increases, partially offset by lower video customers. |
42,325 | |||
Decrease in digital programming, premium channels and pay-per-view |
(8,932 | ) | ||
Decrease in costs associated with carrier circuits and local exchange carrier costs |
(7,015 | ) | ||
Decrease in subscriber line costs associated with Operation Reliant (as later defined) |
(330 | ) | ||
Other net decreases |
(3,694 | ) | ||
| | | | | |
|
22,354 | |||
| | | | | |
|
$ | 6,544 | ||
| | | | | |
| | | | | |
| | | | | |
99
Programming costs
Programming costs aggregated $1,567,688 for the year ended December 31, 2016 on an actual basis and on a pro forma basis aggregated $2,451,480 and $2,353,936 for the years ended December 31, 2016 and 2015, respectively. Our programming costs increased 4% on a pro forma basis for the year ended December 31, 2016 due primarily to an increase in contractual programming rates, partially offset by a decrease in pay television customers. Our programming costs in 2017 will continue to be impacted by changes in programming rates, which we expect to increase by high single digits, and by changes in the number of pay television customers.
Other Operating Expenses
Actual 2016
Other operating expenses for the year ended December 31, 2016 were $1,716,851, of which $1,028,447 relate to our Cablevision segment from the date of acquisition and $688,404 relate to our Cequel segment. Other operating expenses include staff costs and employee benefits including salaries of company employees and related taxes, benefits and other employee related expenses. Other operating expenses also include network management and field service costs, which represent costs associated with the maintenance of our broadband network, including costs of certain customer connections and other costs associated with providing and maintaining services to our customers which are impacted by general cost increases for contractors, insurance and other various expenses.
Customer installation and repair and maintenance costs may fluctuate as a result of changes in the level of activities and the utilization of contractors as compared to employees. Also, customer installation costs fluctuate as the portion of our expenses that we are able to capitalize changes. Network repair and maintenance and utility costs also fluctuate as capitalizable network upgrade and enhancement activity changes.
Other operating expenses also include costs related to the operation and maintenance of our call center facilities that handle customer inquiries and billing and collection activities and sales and marketing costs, which include advertising production and placement costs associated with acquiring and retaining customers. These costs vary period to period and certain of these costs, such as sales and marketing, may increase with intense competition. Additionally, other operating expenses include various other administrative costs, including legal fees, and product development costs.
Pro Forma 2016 Compared to Pro Forma 2015
On a pro forma basis, other operating expenses amounted to $2,853,821 and $3,499,669 for the years ended December 31, 2016 and 2015, respectively. Other operating expenses on a pro forma basis amounted to $2,165,417 and $2,546,319 for our Cablevision segment and amounted to $688,404 and $953,350 for our Cequel segment for the years ended December 31, 2016 and 2015, respectively. The
100
pro forma decrease of $645,848 (18%) for the year ended December 31, 2016 is attributable to the following:
Cablevision segment: |
||||
Decrease primarily in employee related costs related to the elimination of certain positions, lower net benefits and an increase in capitalizable activity, partially offset by merit increases |
$ | (190,274 | ) | |
Decrease in costs primarily related to the sale of Newsday in July 2016 |
(73,650 | ) | ||
Decrease in share-based compensation |
(26,788 | ) | ||
Decrease in expenses related to long-term incentive plan awards |
(14,827 | ) | ||
Decrease in legal costs |
(23,878 | ) | ||
Decrease in sales and marketing costs |
(20,875 | ) | ||
Decrease in repairs and maintenance costs relating to our operations and facilities |
(17,153 | ) | ||
Decrease in contractor costs due primarily to lower truck rolls |
(10,611 | ) | ||
Settlement of a class action legal matter in 2015 |
(9,500 | ) | ||
Decrease in product development costs and product consulting fees |
(4,215 | ) | ||
Increase in Altice management fee for certain executive services |
10,556 | |||
Other net increases |
313 | |||
| | | | | |
|
(380,902 | ) | ||
| | | | | |
Cequel segment: |
||||
Decrease in share-based compensation |
(214,848 | ) | ||
Decrease in employee salaries and benefits including bonus, overtime and other employee related costs primarily relating to the decrease in headcount occurring subsequent to the Cequel Acquisition |
(17,984 | ) | ||
Decrease in the cost of residential customer installations |
(10,120 | ) | ||
Decrease in consulting and professional fees |
(9,847 | ) | ||
Decrease in management fee relating to certain executive, administrative and managerial services provided to the Company prior to the Cequel Acquisition |
(9,987 | ) | ||
Decrease in marketing costs |
(9,424 | ) | ||
Decrease in general and administrative costs |
(8,194 | ) | ||
Decrease in fleet operating costs |
(2,261 | ) | ||
Increase in group health insurance costs |
9,829 | |||
Increase in Altice management fee for certain executive services |
9,704 | |||
Other net decreases |
(1,814 | ) | ||
| | | | | |
|
(264,946 | ) | ||
| | | | | |
|
$ | (645,848 | ) | |
| | | | | |
| | | | | |
| | | | | |
Restructuring and Other Expense (Credits)
Actual 2016
Restructuring and other expense for the year ended December 31, 2016 of $240,395 ($212,150 for our Cablevision segment and $28,245 for our Cequel segment) primarily relate to severance and other employee related costs resulting from headcount reductions related to initiatives which commenced in 2016 that are intended to simplify the Company's organizational structure. We currently anticipate that additional restructuring expenses will be recognized as we continue to analyze our organizational structure.
Pro Forma 2016 Compared to Pro Forma 2015
On a pro forma basis, restructuring and other expense (credits) for the years ended December 31, 2016 and 2015 amounted to $229,774 ($201,529 for our Cablevision segment and $28,245 for our Cequel segment) and $(1,649) for our Cablevision segment, respectively.
101
The pro forma restructuring expense for 2016 is primarily related to severance and other employee related costs resulting from headcount reductions related to initiatives which commenced in 2016 that are intended to simplify the Company's organizational structure at both Cablevision and Cequel. The restructuring credit for 2015 related to prior restructuring plans at Cablevision.
Depreciation and Amortization
Actual 2016
Depreciation and amortization (including impairments) for the year ended December 31, 2016 amounted to $1,700,306, of which $963,665 related to our Cablevision segment from the date of acquisition and $736,641 related to our Cequel segment. Depreciation and amortization for 2016 includes depreciation and amortization related to the step-up in the carrying value of property, plant and equipment and amortizable intangible assets recorded in connection with the Cablevision Acquisition on June 21, 2016 and the Cequel Acquisition on December 21, 2015, partially offset by certain assets being retired or becoming fully depreciated.
On May 23, 2017, Altice N.V. announced the adoption of a global brand which will replace the Optimum and Suddenlink brands in the future, reducing the remaining useful lives of our trade name intangibles, which will increase amortization expense.
Pro Forma 2016 Compared to Pro Forma 2015
On a pro forma basis, depreciation and amortization (including impairments) amounted to $2,484,284 and $2,442,235 for the years ended December 31, 2016 and 2015, respectively. The pro forma increase of $42,049(2%) for the year ended December 31, 2016 is comprised of a $6,647 pro forma increase for our Cablevision segment and a pro forma increase of $35,402 (5%) for our Cequel segment. The pro forma increase for both segments is primarily due to depreciation on new asset additions, partially offset by lower depreciation for certain assets being retired or becoming fully depreciated.
Adjusted EBITDA
Actual 2016
Adjusted EBITDA for the year ended December 31, 2016 amounted to $2,414,735. Adjusted EBITDA is a non-GAAP measure that is defined as net loss excluding income taxes, loss from discontinued operations, other non-operating income or expenses, loss on extinguishment of debt and write-off of deferred financing costs, loss on interest rate swap contracts, gain (loss) on equity derivative contracts, gain (loss) on investments, interest expense (including cash interest expense), interest income, depreciation and amortization (including impairments), share-based compensation expense, restructuring expense or credits and transaction expenses. See reconciliation of net loss to adjusted EBITDA above.
Pro Forma 2016 Compared to Pro Forma 2015
On a pro forma basis, adjusted EBITDA amounted to $3,352,045 and $2,769,520 for the years ended December 31, 2016 and 2015, respectively. The pro forma increase of $582,525 (21%) consists of a pro forma increase of $376,701 (21%) for our Cablevision segment and a pro forma increase of $205,824 (21%) for our Cequel segment. The pro forma increase was due primarily to an increase in revenue, and a decrease in operating expenses (excluding depreciation and amortization, restructuring and other expense and share-based compensation), as discussed above.
102
Interest Expense, net
Actual 2016
Interest expense, net was $1,442,730 for the year ended December 31, 2016 and includes interest on debt issued to finance the Cablevision Acquisition and Cequel Acquisition, as well as interest on debt assumed in connection with these acquisitions.
Pro Forma 2016 Compared to Pro Forma 2015
On a pro forma basis, interest expense, net amounted to $1,760,421 and $1,715,950 for the years ended December 31, 2016 and 2015, respectively. The pro forma increase of $44,471 (3%) is primarily attributable to an increase of $33,549 due to the change in average debt balances, $792 due primarily to an increase in the amortization of deferred financing costs and discounts/premiums resulting recording debt at fair value in connection with the Cablevision and Cequel Acquisitions, partially offset by an increase in interest income of $2,068.
See "Liquidity and Capital Resources" discussion below for a detail of our borrower groups.
Gain on Investments, net
Actual 2016
Gain on investments, net for the year ended December 31, 2016 of $141,896 consists primarily of the increase in the fair value of Comcast common stock owned by the Company for the period from the date of the Cablevision Acquisition. The effects of these gains are partially offset by the losses on the related equity derivative contracts, net described below.
Pro Forma 2016 Compared to Pro Forma 2015
On a pro forma basis, gain (loss) on investments, net for the years ended December 31, 2016 and 2015 amounted to $271,886 and $(30,208), respectively, assuming the Cablevision Acquisition occurred on January 1, 2015 and consists primarily of the increase or decrease in the fair value of Comcast common stock owned by the Company. The effects of these gains (losses) are partially offset by the (losses) gains on the related equity derivative contracts, net described below.
Gain (Loss) on Equity Derivative Contracts, net
Actual 2016
Loss on equity derivative contracts, net for the year ended December 31, 2016 of $(53,696) consists of unrealized and realized gains (losses) due to the change in fair value of equity derivative contracts relating to the Comcast common stock owned by the Company for the period from the date of the Cablevision Acquisition. The effects of these loss are offset by the gain on investment securities pledged as collateral, which are included in gain (loss) on investments, net discussed above.
Pro Forma 2016 Compared to Pro Forma 2015
On a pro forma basis, gain (loss) on equity derivative contracts, net for the years ended December 31, 2016 and 2015 amounted to $(89,979) and $104,927, respectively, assuming the Cablevision Acquisition occurred on January 1, 2015 and consists of unrealized and realized gains (losses) due to the change in fair value of equity derivative contracts relating to the Comcast common stock owned by the Company.
103
Loss on interest rate swap contracts
Loss on interest rate swap contracts was $72,961 for the year ended December 31, 2016 on an actual and pro forma basis and represents the decrease in fair value of the fixed to floating interest rate swaps entered into by our Cequel segment in June 2016. The objective of these swaps is to cover the exposure to changes in the market interest rate of the $1,500,000 principal amount of the Cequel 2026 Senior Secured Notes. These swap contracts are not designated as hedges for accounting purposes.
Loss on Extinguishment of Debt and Write-off of Deferred Financing Costs
Loss on extinguishment of debt and write-off of deferred financing costs for the year ended December 31, 2016 of $127,649 includes primarily the write-off of unamortized deferred financing costs and the unamortized discount related to the prepayment of $1,290,500 outstanding under the term credit facility at Cablevision. On a pro forma basis, loss on extinguishment of debt and write-off of deferred financing costs for the year ended December 31, 2015 was $1,735.
Income Tax Expense
Actual 2016
Income tax benefit for the year ended December 31, 2016 amounted to $259,666. In connection with the acquisition of Cablevision in June 2016, the Company was required to re-measure deferred taxes of Cequel at a higher overall rate, resulting in additional deferred tax expense of $153,660. The impact of the nondeductible share-based compensation related to the Company's carried unit plan resulted in additional tax expense of $5,029. Absent these items, the effective tax rate would have been 38%.
Pro Forma 2016 Compared to Pro Forma 2015
On a pro forma basis, income tax benefit for the year ended December 31, 2016 amounted to $450,295. The impact of the nondeductible share-based compensation related to the Company's carried unit plan resulted in additional tax expense of $5,029. Absent this item, the effective tax rate would have been 39%.
On a pro forma basis, income tax benefit for the year ended December 31, 2015 amounted to $498,567. In April 2015, corporate income tax changes were enacted for both New York State and the City of New York. Those changes included a provision whereby investment income will be subject to higher taxes. Accordingly, in the second quarter of 2015, Cablevision recorded deferred tax expense of $16,334 to remeasure the deferred tax liability for the investment in Comcast common stock and associated derivative securities. During 2015, Cequel recorded tax expense related to equity compensation of $107,143. Absent these items, the effective tax rate would have been 39%.
Loss From Discontinued Operations
Pro Forma 2016 Compared to Pro Forma 2015
On a pro forma basis, loss from discontinued operations for the year ended December 31, 2015 amounted to $12,541, net of income taxes, and primarily reflects an expense related to the settlement of a legal matter relating to Rainbow Media Holdings LLC, a business whose operations were previously discontinued.
104
Results of Operations—Cablevision
The following discussion regarding Cablevision results of operations has been presented for the periods prior to the Cablevision Acquisition as Cablevision is the predecessor entity.
| |
Cablevision | ||||||||||||||
|---|---|---|---|---|---|---|---|---|---|---|---|---|---|---|---|
| |
Successor |
|
Predecessor | ||||||||||||
| |
June 21, 2016 to December 31, 2016 |
|
January 1, 2016 to June 20, 2016 |
|
|
||||||||||
| |
|
Year Ended December 31, 2015 |
Year Ended December 31, 2014 |
||||||||||||
| |
|
||||||||||||||
| |
|
||||||||||||||
Revenue(a): |
|||||||||||||||
Residential: |
|||||||||||||||
Pay TV |
$ | 1,638,691 | $ | 1,468,006 | $ | 3,142,991 | $ | 3,151,872 | |||||||
Broadband |
782,615 | 673,010 | 1,303,918 | 1,248,708 | |||||||||||
Telephony |
376,034 | 342,142 | 748,181 | 743,967 | |||||||||||
Business Services |
468,632 | 411,102 | 834,154 | 811,926 | |||||||||||
Advertising |
157,331 | 119,727 | 257,832 | 285,284 | |||||||||||
Other |
20,749 | 123,617 | 258,469 | 266,800 | |||||||||||
| | | | | | | | | | | | | | | | |
Total revenue |
3,444,052 | 3,137,604 | 6,545,545 | 6,508,557 | |||||||||||
| | | | | | | | | | | | | | | | |
Operating expenses: |
|||||||||||||||
Programming and other direct costs |
1,164,925 | 1,088,555 | 2,269,290 | 2,197,735 | |||||||||||
Other operating expenses |
1,028,447 | 1,136,970 | 2,546,319 | 2,520,582 | |||||||||||
Restructuring and other expense |
212,150 | 22,223 | 16,213 | 2,480 | |||||||||||
Depreciation and amortization (including impairments) |
963,665 | 414,550 | 865,252 | 866,502 | |||||||||||
| | | | | | | | | | | | | | | | |
Operating income |
74,865 | 475,306 | 848,471 | 921,258 | |||||||||||
Other income (expense): |
|||||||||||||||
Interest expense, net |
(606,347 | ) | (285,508 | ) | (584,839 | ) | (575,580 | ) | |||||||
Gain (loss) on investments, net |
141,896 | 129,990 | (30,208 | ) | 129,659 | ||||||||||
Gain (loss) on equity derivative contracts, net |
(53,696 | ) | (36,283 | ) | 104,927 | (45,055 | ) | ||||||||
Loss on extinguishment of debt and write-off of deferred financing costs |
(102,894 | ) | — | (1,735 | ) | (10,120 | ) | ||||||||
Other income (expense), net |
4,329 | 4,855 | 6,045 | 4,988 | |||||||||||
| | | | | | | | | | | | | | | | |
Income (loss) from continuing operations before income taxes |
(541,847 | ) | 288,360 | 342,661 | 425,150 | ||||||||||
Income tax benefit (expense) |
213,065 | (124,848 | ) | (154,872 | ) | (115,768 | ) | ||||||||
| | | | | | | | | | | | | | | | |
Income (loss) from continuing operations, net of income taxes |
(328,782 | ) | 163,512 | 187,789 | 309,382 | ||||||||||
Income (loss) from discontinued operations, net of income taxes |
— | — | (12,541 | ) | 2,822 | ||||||||||
| | | | | | | | | | | | | | | | |
Net income (loss) |
(328,782 | ) | 163,512 | 175,248 | 312,204 | ||||||||||
Net loss (income) attributable to noncontrolling interests |
(551 | ) | 236 | 201 | (765 | ) | |||||||||
| | | | | | | | | | | | | | | | |
Net income (loss) attributable to Cablevision stockholder(s) |
$ | (329,333 | ) | $ | 163,748 | $ | 175,449 | $ | 311,439 | ||||||
| | | | | | | | | | | | | | | | |
| | | | | | | | | | | | | | | | |
| | | | | | | | | | | | | | | | |
- (a)
- Certain reclassifications have been made to previously reported amounts by product to reflect the current presentation.
105
The following is a reconciliation of net income (loss) to Adjusted EBITDA:
| |
Cablevision | ||||||||||||||
|---|---|---|---|---|---|---|---|---|---|---|---|---|---|---|---|
| |
Successor |
|
Predecessor | ||||||||||||
| |
June 21, 2016 to December 31, 2016 |
|
January 1, 2016 to June 20, 2016 |
|
|
||||||||||
| |
|
Year Ended December 31, 2015 |
Year Ended December 31, 2014 |
||||||||||||
| |
|
||||||||||||||
| |
|
||||||||||||||
Net income (loss) |
$ | (328,782 | ) | $ | 163,512 | $ | 175,248 | $ | 312,204 | ||||||
(Income) loss from discontinued operations, net of income taxes |
— | — | 12,541 | (2,822 | ) | ||||||||||
Income tax (benefit) expense |
(213,065 | ) | 124,848 | 154,872 | 115,768 | ||||||||||
Other income(a) |
(4,329 | ) | (4,855 | ) | (6,045 | ) | (4,988 | ) | |||||||
Loss on extinguishment of debt and write-off of deferred financing costs |
102,894 | — | 1,735 | 10,120 | |||||||||||
Loss (gain) on equity derivative contracts, net(b) |
53,696 | 36,283 | (104,927 | ) | 45,055 | ||||||||||
Loss (gain) on investments, net |
(141,896 | ) | (129,990 | ) | 30,208 | (129,659 | ) | ||||||||
Interest expense, net |
606,347 | 285,508 | 584,839 | 575,580 | |||||||||||
Depreciation and amortization (including impairments) |
963,665 | 414,550 | 865,252 | 866,502 | |||||||||||
Restructuring and other expenses |
212,150 | 22,223 | 16,213 | 2,480 | |||||||||||
Share-based compensation |
9,164 | 25,231 | 65,286 | 43,984 | |||||||||||
| | | | | | | | | | | | | | | | |
Adjusted EBITDA |
$ | 1,259,844 | $ | 937,310 | $ | 1,795,222 | $ | 1,834,224 | |||||||
| | | | | | | | | | | | | | | | |
| | | | | | | | | | | | | | | | |
| | | | | | | | | | | | | | | | |
- (a)
- Includes
primarily dividends received on Comcast common stock owned by the Company.
- (b)
- Consists of unrealized and realized losses (gains) due to the change in fair value of equity derivative contracts relating to the Comcast common stock owned by the Company.
The following table sets forth certain customer metrics for Cablevision:
| |
Cablevision | |||||||||||||||
|---|---|---|---|---|---|---|---|---|---|---|---|---|---|---|---|---|
| |
Years Ended December 31, | Net Increase (Decrease) |
||||||||||||||
| |
2016 | 2015 | 2014 | 2016 | 2015 | |||||||||||
| |
(in thousands, except per customer amounts) |
|||||||||||||||
Homes passed(a) |
5,116 | 5,076 | 5,041 | 40 | 35 | |||||||||||
Total customer relationships(b) |
3,141 | 3,115 | 3,113 | 25 | 3 | |||||||||||
Residential |
2,879 | 2,858 | 2,861 | 21 | (3 | ) | ||||||||||
SMB |
262 | 258 | 252 | 4 | 6 | |||||||||||
Residential customers(c): |
||||||||||||||||
Pay TV |
2,428 | 2,487 | 2,574 | (59 | ) | (87 | ) | |||||||||
Broadband |
2,619 | 2,562 | 2,518 | 57 | 44 | |||||||||||
Telephony |
1,962 | 2,007 | 2,047 | (45 | ) | (40 | ) | |||||||||
Residential triple product customer penetration(d): |
64.8 | % | 67.6 | % | 69.2 | % | (2.8 | )% | (1.6 | )% | ||||||
Penetration of homes passed(e): |
61.4 | % | 61.4 | % | 61.7 | % | — | % | (0.3 | )% | ||||||
ARPU(f) |
$ | 154.49 | $ | 150.61 | $ | 149.10 | $ | 3.88 | $ | 1.51 | ||||||
- (a)
- Represents the estimated number of single residence homes, apartments and condominium units passed by the cable distribution network in areas serviceable without further extending the transmission lines. In addition, it includes commercial establishments that have connected to our cable distribution network.
106
- (b)
- Represents
number of households/businesses that receive at least one of the Company's services.
- (c)
- Customers
represent each customer account (set up and segregated by customer name and address), weighted equally and counted as one customer, regardless of size,
revenue generated, or number of boxes, units, or outlets. In calculating the number of customers, we count all customers other than inactive/disconnected customers. Free accounts are included in the
customer counts along with all active accounts, but they are limited to a prescribed group. Most of these accounts are also not entirely free, as they typically generate revenue through pay-per-view
or other pay services. Free status is not granted to regular customers as a promotion. In counting bulk residential customers, such as an apartment building, we count each subscribing family unit
within the building as one customer, but do not count the master account for the entire building as a customer. We count a bulk commercial customer, such as a hotel, as one customer, and do not count
individual room units at that hotel.
- (d)
- Represents
the number of customers that subscribe to three of our services divided by total residential customer relationships.
- (e)
- Represents
the number of total customer relationships divided by homes passed.
- (f)
- Calculated by dividing the average monthly revenue for the respective quarter (fourth quarter for annual periods) presented derived from the sale of broadband, pay television and telephony services to residential customers for the respective quarter by the average number of total residential customers for the same period.
Cablevision—Comparison of Actual Results for the Periods June 21, 2016 through December 31, 2016 and January 1, 2016 through June 20, 2016 to Actual Results for the Year Ended December 31, 2015 and Actual Results for the Year Ended December 31, 2015 to December 31, 2014
Pay Television Revenue
Successor and Predecessor 2016 compared to Predecessor 2015
Pay television revenue amounted to $1,638,691 and $1,468,006 for the period June 21, 2016 through December 31, 2016 and January 1, 2016 through June 20, 2016, respectively, compared to $3,142,991 for the year ended December 31, 2015. Pay television revenue for the Successor and Predecessor periods in 2016 was impacted by a decline in pay television customers, a decrease due to a pay-per-view boxing event that took place in 2015, partially offset by increases in revenue due primarily to rate increases for certain pay television services implemented during the first quarter of 2016 and an increase in fees charged to restore suspended services.
Predecessor 2015 compared to Predecessor 2014
Pay television revenue amounted to $3,142,991 and $3,151,872 for the years ended December 31, 2015 and 2014, respectively. The decrease of $8,881 was due primarily to rate increases for certain pay television services implemented during the second quarter of 2014 and the first quarter of 2015, and lower net promotional activity as a result of continued disciplined pricing policies. In addition, pay-per-view revenue increased primarily due to a boxing event in 2015. Offsetting these increases was a decrease in revenue due primarily to a decline in pay television customers.
We believe our pay television customer declines noted in the table above are largely attributable to intense competition, particularly from Verizon, as well as competition from companies that deliver video content over the Internet directly to customers. Also, the declines are attributable to our disciplined pricing and credit policies. These factors are expected to continue to impact our ability to maintain or increase our existing customers and revenue in the future.
107
Broadband Revenue
Successor and Predecessor 2016 compared to Predecessor 2015
Broadband revenue amounted to $782,615 and $673,010 for the period June 21, 2016 through December 31, 2016 and January 1, 2016 through June 20, 2016, respectively, compared to $1,303,918 for the year ended December 31, 2015. Broadband revenue for the Successor and Predecessor periods in 2016 was impacted by rate increases for certain broadband services implemented during the first quarter of 2016, an increase in broadband customers, and an increase in fees charged to restore suspended services.
Predecessor 2015 compared to Predecessor 2014
Broadband revenue amounted to $1,303,918 and $1,248,708 for the years ended December 31, 2015 and 2014, respectively. The increase of $55,210 (4%) was due to rate increases for certain broadband services implemented during the fourth quarter of 2014 and lower net promotional activity as a result of continued disciplined pricing policies. Broadband revenue also increased due to an increase in broadband customers.
Telephony Revenue
Successor and Predecessor 2016 compared to Predecessor 2015
Telephony revenue amounted to $376,034 and $342,142 for the period June 21, 2016 through December 31, 2016 and January 1, 2016 through June 20, 2016, respectively, compared to $748,181 for the year ended December 31, 2015. Telephony revenue for the Successor and Predecessor periods in 2016 was impacted by a decline in telephony customers and a decline in international calling.
Predecessor 2015 compared to Predecessor 2014
Telephony revenue amounted to $748,181 and $743,967 for the years ended December 31, 2015 and 2014, respectively. The increase of $4,214 (1%) was due primarily to rate increases for certain telephony services implemented during the second quarter of 2014 and lower net promotional activity as a result of continued disciplined pricing policies. Offsetting these increases was a decrease in revenue due primarily to a decline in telephony customers.
Business Services Revenue
Successor and Predecessor 2016 compared to Predecessor 2015
Business services and wholesale revenue amounted to $468,632 and $411,102 for the period June 21, 2016 through December 31, 2016 and January 1, 2016 through June 20, 2016, respectively, compared to $834,154 for the year ended December 31, 2015. Business services and wholesale revenue for the Successor and Predecessor periods in 2016 was impacted by rate increases for certain broadband services implemented during the first quarter of 2016, an increase in broadband customers and an increase in Ethernet revenue from an increase in services installed, partially offset by reduced traditional voice and data services.
Predecessor 2015 compared to Predecessor 2014
Business services and wholesale revenue amounted to $834,154 and $811,926 for the years ended December 31, 2015 and 2014, respectively. The increase of $22,228 (3%) was primarily due to rate increases for certain broadband services implemented during the fourth quarter of 2014 and an increase in Ethernet revenue from an increase in services installed, partially offset by reduced traditional voice and data services.
108
Advertising Revenue
Successor and Predecessor 2016 compared to Predecessor 2015
Advertising revenue amounted to $157,331 and $119,727 for the period June 21, 2016 through December 31, 2016 and January 1, 2016 through June 20, 2016, respectively, compared to $257,832 for the year ended December 31, 2015. Advertising revenue for the Successor and Predecessor periods in 2016 was impacted by an increase in advertising sales to the political sector.
Predecessor 2015 compared to Predecessor 2014
Advertising revenue amounted to $257,832 and $285,284 for the years ended December 31, 2015 and 2014, respectively. The decrease of $27,452 (10%) was primarily due to a decline in advertising sales to the political and gaming sectors.
Other Revenue
Successor and Predecessor 2016 compared to Predecessor 2015
Other revenue amounted to $20,749 and $123,617 for the period June 21, 2016 through December 31, 2016 and January 1, 2016 through June 20, 2016, respectively, compared to $258,469 for the year ended December 31, 2015. Other revenue for the Successor and Predecessor periods in 2016 includes revenue recognized by Newsday through July 7, 2016, affiliation fees paid by cable operators for carriage of our News 12 Networks and other revenue sources. On July 7, 2016, the Company sold a 75% interest in Newsday and as a result no longer consolidates its operating results. As of July 7, 2016, the Company's 25% interest in the operating results of Newsday is recorded on the equity basis.
Predecessor 2015 compared to Predecessor 2014
Other revenue amounted to $258,469 and $266,800 for the years ended December 31, 2015 and 2014, respectively. The decrease of $8,331 (3%) was primarily due to a decrease in revenues at Newsday from $252,405 to $237,236 due primarily to decreases in advertising revenues driven primarily by competition from other media, partially offset by an increase in circulation revenues.
Programming and Other Direct Costs
Programming and other direct costs include cable programming costs, which are costs paid to programmers (net of amortization of any incentives received from programmers for carriage) for cable content (including costs of VOD and pay-per-view) and are generally paid on a per-subscriber basis. These costs typically rise due to increases in contractual rates and new channel launches and are also impacted by changes in the number of customers receiving certain programming services. These costs also include interconnection, call completion, circuit and transport fees paid to other telecommunication companies for the transport and termination of voice and data services, which typically vary based on rate changes and the level of usage by our customers. These costs also include franchise fees which are payable to the state governments and local municipalities where we operate and are primarily based on a percentage of certain categories of revenue derived from the provision of pay television service over our cable systems, which vary by state and municipality. These costs change in relation to changes in such categories of revenues or rate changes. Through July 7, 2016, these costs also included content, production and distribution costs of the Newsday business.
Successor and Predecessor 2016 compared to Predecessor 2015
Programming and other direct costs amounted to $1,164,925 and $1,088,555 for the period June 21, 2016 through December 31, 2016 and January 1, 2016 through June 20, 2016, respectively, compared to $2,269,290 for the year ended December 31, 2015. Programming and other direct costs for
109
the Successor and Predecessor periods in 2016 were impacted by an increase in programming costs due primarily to contractual rate increases, partially offset by lower video customers. These costs were also impacted by the lower costs related to Newsday (due to the sale of our 75% interest in Newsday in July 2016), lower call completion and transport costs primarily due to lower level of activity, lower cost of sales related to wireless handset inventory and higher franchise and other fees due primarily to increases in rates in certain areas, partially offset by lower pay television customers.
Predecessor 2015 compared to Predecessor 2014
Programming and other direct costs amounted to $2,269,290 and $2,197,735 for the year ended December 31, 2015 and 2014, respectively. The increase of $71,555 (3%) is attributable to the following:
| |
2015 | |||
|---|---|---|---|---|
Decrease in costs primarily related Newsday |
$ | (10,143 | ) | |
Decrease in call completion and transport costs primarily due to lower level of activity |
(14,184 | ) | ||
Increase in cost of sales (which includes a lower cost or market valuation adjustment of $17,382 related to wireless handset inventory from 2015) |
20,373 | |||
Increase in franchise and other fees due primarily to increases in rates in certain areas, partially offset by lower video customers |
4,307 | |||
Increase in programming costs due primarily to contractual rate increases and a pay-per-view boxing event in 2015, partially offset by lower video customers |
66,942 | |||
Other net increases |
4,260 | |||
| | | | | |
|
$ | 71,555 | ||
| | | | | |
| | | | | |
| | | | | |
Programming Costs
Programming costs aggregated $978,120 and $883,792 for the period June 21, 2016 through December 31, 2016 and January 1, 2016 through June 20, 2016, respectively, compared to $1,796,021 and $1,728,847 for the year ended December 31, 2015 and 2014, respectively. Our programming costs increased 4% for the 2016 periods and 4% in 2015 due primarily to an increase in contractual programming rates and a pay-per-view boxing event in 2015, partially offset by a decrease in telephony customers. Our programming costs in 2017 will continue to be impacted by changes in programming rates, which we expect to increase by high single digits, and by changes in the number of pay television customers.
Other Operating Expenses
Other operating expenses include staff costs and employee benefits including salaries of company employees and related taxes, benefits and other employee-related expenses. Other operating expenses also include network management and field service costs, which represent costs associated with the maintenance of our broadband network, including costs of certain customer connections and other costs associated with providing and maintaining services to our customers which are impacted by general cost increases for contractors, insurance and other various expenses.
Customer installation and repair and maintenance costs may fluctuate as a result of changes in the level of activities and the utilization of contractors as compared to employees. Also, customer installation costs fluctuate as the portion of our expenses that we are able to capitalize changes. Network repair and maintenance and utility costs also fluctuate as capitalizable network upgrade and enhancement activity changes.
110
Other operating expenses also include costs related to the operation and maintenance of our call center facilities that handle customer inquiries and billing and collection activities and sales and marketing costs, which include advertising production and placement costs associated with acquiring and retaining customers. These costs vary period to period and certain costs, such as sales and marketing, may increase with intense competition. Additionally, other operating expenses include various other administrative costs, including legal fees, and product development costs.
Successor and Predecessor 2016 compared to Predecessor 2015
Other operating expenses amounted to $1,028,447 and $1,136,970 for the period June 21, 2016 through December 31, 2016 and January 1, 2016 through June 20, 2016, respectively, compared to $2,546,319 for the year ended December 31, 2015. Other operating expenses for the Successor and Predecessor periods in 2016 were impacted by a decrease in employee-related costs related to the elimination of certain positions, lower benefits and an increase in capitalizable activity, partially offset by merit increases. These costs were also impacted by the lower costs related to Newsday (due to the sale of our 75% interest in Newsday in July 2016), a decrease in share based compensation, a decrease in long-term incentive plan awards, lower legal costs, lower sales and marketing costs, lower repair and maintenance expenses, lower contractor costs, a settlement of a class action legal matter in 2015, partially offset by an increase in the management fee to Altice N.V.
Predecessor 2015 compared to Predecessor 2014
Other operating expenses amounted to $2,546,319 and $2,520,582 for the years ended December 31, 2015 and 2014, respectively. The increase of $25,737 (1%) is attributable to the following:
| |
2015 | |||
|---|---|---|---|---|
Decrease primarily in employee related costs related to the elimination of certain positions, lower net benefits and an increase in capitalizable activity, partially offset by merit increases |
$ | (21,169 | ) | |
Decrease in costs primarily related to Newsday |
(5,294 | ) | ||
Decrease in expenses related to long-term incentive plan awards |
(15,120 | ) | ||
Increase in share-based compensation |
18,963 | |||
Increase in legal costs |
17,548 | |||
Increase in sales and marketing costs |
9,962 | |||
Decrease in repairs and maintenance costs relating to our operations and facilities |
(1,714 | ) | ||
Decrease in contractor costs due primarily to lower truck rolls |
(18,514 | ) | ||
Settlement of a class action legal matter in 2015 |
9,500 | |||
Increase in product development costs and product consulting fees |
29,785 | |||
Other net increases |
1,790 | |||
| | | | | |
|
$ | 25,737 | ||
| | | | | |
| | | | | |
| | | | | |
Restructuring and Other Expense
Restructuring and other expense amounted to $212,150 and $22,223 for the period June 21, 2016 through December 31, 2016 and January 1, 2016 through June 20, 2016, respectively, compared to $16,213 for the year ended December 31, 2015 and $2,480 for the year ended December 31, 2014. Restructuring and other expense for the Successor 2016 period is primarily related to severance and other employee related costs resulting from headcount reductions related to initiatives which commenced in the Successor period that are intended to simplify the Company's organizational
111
structure. It is currently anticipated that additional restructuring expenses will be recognized as the Company continues to analyze the organizational structure.
The restructuring and other expense for the Predecessor 2016 period is primarily related to transaction costs of $19,924 incurred in connection with the Cablevision Acquisition and adjustments related to prior restructuring plans of $2,299. Restructuring and other expense for 2015 includes transaction costs incurred in connection with the Cablevision Acquisition of $17,862, net of adjustments related to prior restructuring plans of $1,649. The restructuring and other expense of $2,480 for 2014 reflects adjustments related to prior restructuring plans.
Depreciation and Amortization
Depreciation and amortization (including impairments) amounted to $963,665 and $414,550 for the period June 21, 2016 through December 31, 2016 and January 1, 2016 through June 20, 2016, respectively, compared to $865,252 for the year ended December 31, 2015 and $866,502 for the year ended December 31, 2014. Depreciation and amortization for the Successor period in 2016 was impacted by an increase in related to the step-up in the carrying value of property, plant and equipment and amortizable intangible assets recorded in connection with the Cablevision Acquisition on June 21, 2016, partially offset by certain assets being retired or becoming fully depreciated.
On May 23, 2017, Altice N.V. announced the adoption of a global brand which will replace the Optimum brand in the future, reducing the remaining useful life of our trade name intangible, which will increase amortization expense.
Depreciation and amortization decreased $1,250 in 2015 as compared to the prior year due primarily to certain assets becoming fully depreciated, partially offset by depreciation of new asset purchases.
Adjusted EBITDA
Successor and Predecessor 2016 compared to Predecessor 2015
Adjusted EBITDA amounted to $1,259,844 and $937,310 for the period June 21, 2016 through December 31, 2016 and January 1, 2016 through June 20, 2016, respectively, compared to $1,795,222 for the year ended December 31, 2015. Adjusted EBITDA for the 2016 periods was impacted by an increase in revenue, and a decrease in operating expenses (excluding depreciation and amortization, restructuring and other expense and share-based compensation), as discussed above.
Predecessor 2015 compared to Predecessor 2014
Adjusted EBITDA amounted to $1,795,222 and $1,834,224 for the years ended December 31, 2015 and 2014, respectively. The decrease of $39,002 (2%) for 2015 as compared 2014 was due primarily to an increase in operating expenses (excluding depreciation and amortization expense, restructuring and other expense and share-based compensation), partially offset by an increase in revenue as discussed above.
Interest Expense, net
Successor and Predecessor 2016 compared to Predecessor 2015
Interest expense amounted to $606,347 and $285,508 for the period June 21, 2016 through December 31, 2016 and January 1, 2016 through June 20, 2016, respectively, compared to $584,839 for the year ended December 31, 2015. Interest expense for the Successor 2016 period includes additional interest related to the debt incurred to finance the Cablevision Acquisition.
112
Predecessor 2015 compared to Predecessor 2014
Interest expense, net amounted to $584,839 and $575,580 for the years ended December 31, 2015 and 2014, respectively. The increase of $9,259 (2%) for 2015 and as compared to 2014 is attributable to the following:
| |
2015 | |||
|---|---|---|---|---|
Decrease due to change in average debt balances |
$ | (7,941 | ) | |
Increase due to change in average interest rates on our indebtedness |
16,918 | |||
Higher interest income |
(505 | ) | ||
Other net increases, primarily amortization of deferred financing costs |
787 | |||
| | | | | |
|
$ | 9,259 | ||
| | | | | |
| | | | | |
| | | | | |
See "Liquidity and Capital Resources" discussion below for a detail of our borrower groups.
Gain (Loss) on Investments, net
Gain (loss) on investments, net amounted to $141,896 and $129,990 for the period June 21, 2016 through December 31, 2016 and January 1, 2016 through June 20, 2016, respectively, and $(30,208) and $129,659 for the year ended December 31, 2015 and 2014, respectively, and reflect the increase or decrease in the fair value of Comcast common stock owned by the Company. The effects of these gains (losses) are partially offset by the (losses) gains on the related equity derivative contracts, net described below.
Gain (Loss) on Equity Derivative Contracts, net
Gain (loss) on equity derivative contracts, net amounted to $(53,696) and $(36,283) for the period June 21, 2016 through December 31, 2016 and January 1, 2016 through June 20, 2016, respectively, and $104,927 and $(45,055)for the year ended December 31, 2015 and 2014, respectively.
Gain (loss) on equity derivative contracts, net consists of unrealized and realized gains (losses) due to the change in fair value of the Company's equity derivative contracts relating to the Comcast common stock owned by the Company. The effects of these gains (losses) are offset by the (losses) gains on investment securities pledged as collateral, which are included in gain (loss) on investments, net discussed above.
Loss on Extinguishment of Debt and Write-off of Deferred Financing Costs
Loss on extinguishment of debt and write-off of deferred financing costs amounted to $102,894 for the period June 21, 2016 through December 31, 2016 and $1,735 and $10,120 for the years ended December 31, 2015 and 2014, respectively. The Successor 2016 amount includes the write-off of unamortized deferred financing costs and the unamortized discount related to the prepayment of $1,290,500 outstanding under the CSC Holdings, a wholly-owned subsidiary of Cablevision, term credit facility. The 2015 amount includes the write-off of unamortized deferred financing costs and the unamortized discount related to the $200,000 repayment of CSC Holdings term B loan facility.
The 2014 amount includes $9,618, related to the $750,000 repayment of CSC Holdings' outstanding term B loan facility in May 2014 and the $200,000 repayment in September 2014. In addition, the 2014 amount includes the write-off of unamortized deferred financing costs of $1,436 and a net gain of $934, net of fees, recognized in connection with the repurchase of Cablevision's outstanding 5.875% senior notes due September 2022.
113
Income Tax Expense
Income tax benefit (expense) amounted to $213,065 for the period from June 21, 2016 through December 31, 2016 and $(124,848) for the period from January 1, 2016 through June 20, 2016. In the Successor period, excluding the impact of the nondeductible share-based compensation of $3,208, the effective tax rate would have been 40%. In the Predecessor period, certain acquisition-related costs were determined to be nondeductible, resulting in additional deferred tax expense of $9,392. Absent this item, the effective tax rate would have been 40%.
Income tax expense of $154,872 for the year ended December 31, 2015, reflected an effective tax rate of 45%. In April 2015, corporate income tax changes were enacted for both New York State and the City of New York. Those changes included a provision whereby investment income will be subject to higher taxes. Accordingly, in the second quarter of 2015, Cablevision recorded deferred tax expense of $16,334 to remeasure the deferred tax liability for the investment in Comcast common stock and associated derivative securities. Also in 2015, Cablevision recorded tax benefit of $2,630 related to research credits. Absent these items, the effective tax rate for the year ended December 31, 2015 would have been 41%.
Income tax expense of $115,768 for the year ended December 31, 2014, reflected an effective tax rate of 27%. In January 2014, the Internal Revenue Service informed the Company that the consolidated federal income tax returns for 2009 and 2010 were no longer under examination. Accordingly, in the first quarter of 2014, Cablevision recorded a tax benefit of $53,132 associated with the reversal of a noncurrent liability relating to an uncertain tax position. New York State corporate tax reform legislation enacted on March 31, 2014 resulted in tax benefit of $2,050. Also in 2014, Cablevision recorded tax benefit of $2,634 related to research credits. Absent these items, the effective tax rate for the year ended December 31, 2014 would have been 41%.
Loss From Discontinued Operations
Loss from discontinued operations for the year ended December 31, 2015 amounted to $12,541, net of income taxes, and primarily reflects an expense related to the settlement of a legal matter relating to Rainbow Media Holdings LLC, a business whose operations were previously discontinued.
Income from discontinued operations for the year ended December 31, 2014 amounted to $2,822, net of income taxes and resulted primarily from the settlement of a contingency related to Montana property taxes related to Bresnan Cable.
114
Results of Operations—Cequel
The column labeled "Successor" reflects results of operations for the period subsequent to the Cequel Acquisition and the columns labeled "Predecessor" reflect results of operations prior to the Cequel Acquisition.
| |
Cequel | |||||||||||
|---|---|---|---|---|---|---|---|---|---|---|---|---|
| |
Successor |
|
Predecessor | |||||||||
| |
December 21, 2015 to December 31, 2015 |
|
January 1, 2015 to December 20, 2015 |
|
||||||||
| |
|
Year Ended December 31, 2014 |
||||||||||
| |
|
|||||||||||
| |
|
|||||||||||
Revenue: |
||||||||||||
Residential: |
||||||||||||
Pay TV |
$ | 33,715 | $ | 1,083,925 | $ | 1,147,455 | ||||||
Broadband |
21,133 | 679,961 | 601,801 | |||||||||
Telephony |
4,905 | 158,916 | 167,838 | |||||||||
Business Services |
9,783 | 314,903 | 288,386 | |||||||||
Advertising |
2,642 | 85,024 | 101,197 | |||||||||
Other |
765 | 24,640 | 24,020 | |||||||||
| | | | | | | | | | | | | |
Total revenue |
72,943 | 2,347,369 | 2,330,697 | |||||||||
| | | | | | | | | | | | | |
Operating expenses: |
||||||||||||
Operating (excluding depreciation and amortization) |
26,586 | 872,308 | 930,085 | |||||||||
Selling, general and administrative |
39,166 | 889,960 | 546,386 | |||||||||
Depreciation and amortization |
23,533 | 531,561 | 594,459 | |||||||||
Loss on disposal of cable assets |
41 | 1,796 | 4,277 | |||||||||
| | | | | | | | | | | | | |
Operating income |
(16,383 | ) | 51,744 | 255,490 | ||||||||
Other income (expense): |
||||||||||||
Interest expense, net |
(11,491 | ) | (237,319 | ) | (230,146 | ) | ||||||
| | | | | | | | | | | | | |
Income (loss) before income taxes |
(27,874 | ) | (185,575 | ) | 25,344 | |||||||
Income tax benefit (expense) |
10,263 | (29,301 | ) | (8,095 | ) | |||||||
| | | | | | | | | | | | | |
Net income (loss) |
$ | (17,611 | ) | $ | (214,876 | ) | $ | 17,249 | ||||
| | | | | | | | | | | | | |
| | | | | | | | | | | | | |
| | | | | | | | | | | | | |
The following is a reconciliation of net income (loss) to Adjusted EBITDA:
| |
Cequel | |||||||||||
|---|---|---|---|---|---|---|---|---|---|---|---|---|
| |
Successor |
|
Predecessor | |||||||||
| |
December 21, 2015 to December 31, 2015 |
|
January 1, 2015 to December 20, 2015 |
|
||||||||
| |
|
Year Ended December 31, 2014 |
||||||||||
| |
|
|||||||||||
| |
|
|||||||||||
Net income (loss) |
$ | (17,611 | ) | $ | (214,876 | ) | $ | 17,249 | ||||
Income tax (benefit) expense |
(10,263 | ) | 29,301 | 8,095 | ||||||||
Interest expense, net |
11,491 | 237,319 | 230,146 | |||||||||
Depreciation and amortization (including impairments) |
23,574 | 533,357 | 598,736 | |||||||||
Restructuring and other expense(a) |
26,498 | 67,817 | 16,641 | |||||||||
Share-based compensation |
— | 287,691 | 30,681 | |||||||||
| | | | | | | | | | | | | |
Adjusted EBITDA |
$ | 33,689 | $ | 940,609 | $ | 901,548 | ||||||
| | | | | | | | | | | | | |
| | | | | | | | | | | | | |
| | | | | | | | | | | | | |
- (a)
- Includes transaction costs of $26,498, $67,817 and $16,641 for the period December 21, 2015 to December 31, 2015 (Successor), for the period January 1, 2015 to December 20, 2015 (Predecessor) and for the year ended December 31, 2014 (Predecessor), respectively.
115
The following table sets forth certain customer metrics for our Cequel segment:
| |
Cequel(g) | |||||||||
|---|---|---|---|---|---|---|---|---|---|---|
| |
December 31, | Net Increase (Decrease) | ||||||||
| |
2015 | 2014 | 2015 | |||||||
| |
(in thousands, except per customer amounts) |
|||||||||
Homes passed(a) |
3,352 | 3,289 | 63 | |||||||
Total customer relationships(b) |
1,712 | 1,664 | 48 | |||||||
Residential |
1,618 | 1,579 | 39 | |||||||
SMB |
94 | 85 | 9 | |||||||
Residential customers(c): |
||||||||||
Pay TV |
1,154 | 1,200 | (46 | ) | ||||||
Broadband |
1,276 | 1,199 | 77 | |||||||
Telephony |
581 | 553 | 28 | |||||||
Residential triple product customer penetration(d): |
25.4 | % | 25.1 | % | 0.3 | % | ||||
Penetration of homes passed(e): |
51.1 | % | 50.6 | % | 0.5 | % | ||||
ARPU(f) |
$ | 104.04 | $ | 101.05 | $ | 2.99 | ||||
- (a)
- Represents
the estimated number of single residence homes, apartments and condominium units passed by the cable distribution network in areas serviceable without
further extending the transmission lines. In addition, it includes commercial establishments that have connected to our cable distribution network. For Cequel, broadband services were not available to
approximately 100 homes passed and telephony services were not available to approximately 500 homes passed.
- (b)
- Represents
number of households/businesses that receive at least one of the Company's services.
- (c)
- Customers
represent each customer account (set up and segregated by customer name and address), weighted equally and counted as one customer, regardless of size,
revenue generated, or number of boxes, units, or outlets. In calculating the number of customers, we count all customers other than inactive/disconnected customers. Free accounts are included in the
customer counts along with all active accounts, but they are limited to a prescribed group. Most of these accounts are also not entirely free, as they typically generate revenue through pay-per-view
or other pay services. Free status is not granted to regular customers as a promotion. In counting bulk residential customers, such as an apartment building, we count each subscribing family unit
within the building as one customer, but do not count the master account for the entire building as a customer. We count a bulk commercial customer, such as a hotel, as one customer, and do not count
individual room units at that hotel.
- (d)
- Represents
the number of customers that subscribe to three of our services divided by total residential customer relationships.
- (e)
- Represents
the number of total customer relationships divided by homes passed.
- (f)
- Calculated
by dividing the average monthly revenue for the respective quarter (fourth quarter for annual periods) presented derived from the sale of broadband, pay
television and telephony services to residential customers for the respective quarter by the average number of total residential customers for the same period.
- (g)
- The metrics for Cequel presented in the table above have been adjusted from previously reported amounts to conform to the methodology used to calculate the equivalent Cablevision metrics.
116
Cequel—Comparison of Actual Results for the Period December 21, 2015 through December 31, 2015 and January 1, 2015 through December 20, 2015 to Actual Results for the Year Ended December 31, 2014
Pay Television Revenue
Pay television revenue amounted to $33,715 and $1,083,925 for the period December 21, 2015 through December 31, 2015 and January 1, 2015 through December 20, 2015, respectively, compared to $1,147,455 for the year ended December 31, 2014. Pay television revenue for the 2015 periods was impacted by a decline in pay television customers, decreases in premium and VOD purchases and a decrease in converter rental revenue as compared to the year ended December 31, 2014. Offsetting these decreases were increases in revenue resulting from certain rate increases (including an increase for retransmission programming and sports programming charges), the impact of incremental pay television service level changes and an increase in HD/DVR service revenue.
We believe our video customer declines noted in the table above are largely attributable to competition from DBS providers and from companies that deliver video content over the Internet directly to customers.
Broadband Revenue
Broadband revenue amounted to $21,133 and $679,961 for the period December 21, 2015 through December 31, 2015 and January 1, 2015 through December 20, 2015, respectively, compared to $601,801 for the year ended December 31, 2014. Broadband revenue for the 2015 periods was impacted by a continued increase in broadband customers, an increase in rates, an increase resulting from the impact of service level changes and an increase in residential home networking revenue.
Telephony Revenue
Telephony revenue amounted to $4,905 and $158,916 for the period December 21, 2015 through December 31, 2015 and January 1, 2015 through December 20, 2015, respectively, compared to $167,838 for the year ended December 31, 2014. Telephony revenue for the 2015 periods was impacted by lower rates offered to customers.
Business Services Revenue
Business services and wholesale revenue amounted to $9,783 and $314,903 for the period December 21, 2015 through December 31, 2015 (Successor Period) and January 1, 2015 through December 20, 2015, respectively, compared to $288,386 for the year ended December 31, 2014. Business services and wholesale revenue was impacted by higher commercial rates for broadband services, higher commercial rates and customers for telephony services, an increase in high-speed commercial carrier services revenue, an increase in certain pay television rates including an increase for retransmission programming charges and an increase in revenue from premium, pay-per-view and VOD purchases.
Advertising Revenue
Advertising revenue amounted to $2,642 and $85,024 for the period December 21, 2015 through December 31, 2015 and January 1, 2015 through December 20, 2015, respectively, compared to $101,197 for the year ended December 31, 2014. Advertising revenue was impacted by a decline in national advertising sales primarily from political advertising, local ad sales, and lower interconnect revenue.
117
Other Revenue
Other revenue amounted to $765 and $24,640 for the period December 21, 2015 through December 31, 2015 and January 1, 2015 through December 20, 2015, respectively, compared to $24,020 for the year ended December 31, 2014. Other revenue includes equipment sales, wire maintenance charges, security revenues and other miscellaneous revenue streams. Other revenue for the 2015 periods was impacted by an increase in tower construction management services and equipment sales revenues, partially offset by a decrease in site development revenue.
Operating expenses (excluding depreciation and amortization)
Operating expenses (excluding depreciation and amortization) were $26,586, $872,308 and $930,085 for the period December 21, 2015 through December 31, 2015, January 1, 2015 through December 20, 2015, and for the year ended December 31, 2014, respectively. Operating expenses include programming costs, broadband costs, telephony services costs, and plant and operating costs.
Programming costs consist primarily of costs paid to programmers for basic, digital, premium, VOD and pay-per-view programming. Programming costs for the 2015 periods were impacted by a decrease in the number of pay television customers and the removal of Viacom programming from our channel line-up, offset in part by higher contractual rates charged by our programming and broadcast vendors and the costs of new channels launched.
Broadband costs primarily consist of costs for bandwidth connectivity. Broadband costs were impacted by increases in circuit costs to support growth in our residential and commercial broadband business, but were offset in part by decreases in backbone costs and broadband content costs.
Telephony service costs, including delivery and other costs, for the 2015 periods were impacted by the decrease in subscriber line costs associated with Operation Reliant, described below.
Plant and operating costs consist primarily of employee costs related to wages and benefits of technical personnel who maintain our cable network and provide customer support, outside labor costs, vehicle, utilities and pole rental expenses. Plant and operating costs were impacted by an increase in headcount, annual salary increases and increased overtime levels, an increase in technical costs, and an increase in contract labor, partially offset by a decrease in costs associated with Operation Reliant, an initiative to replace our use of the third-party provider with our own internal platform and resources which was completed in 2014.
Selling, general and administrative expenses
Selling, general and administrative expenses were $39,166, $889,960 and $546,386 for the period December 21, 2015 through December 31, 2015, January 1, 2015 through December 20, 2015, and for the year ended December 31, 2014, respectively.
General and administrative expenses consist primarily of wages and benefits for our call centers, customer service and support and administrative personnel; bad debt and collection expenses; billing; advertising; facilities costs; non-cash stock compensation expenses and other non-recurring expenses. General and administrative expenses for the 2015 Predecessor period included $287,691 of share-based compensation expenses related to the profits interest plan. The 2015 Successor period included $26,498 of transaction expenses associated with the Cequel Acquisition. In addition, general and administrative expense were impacted by salary and commission and benefit expense increases, increases in consulting fees resulting from subscriber growth related initiatives and an increase in bad debt expense, offset in part by a decrease in advertising expense.
Marketing and sales expenses primarily consist of wages and benefits for our sales force and costs for marketing and promotional materials. Marketing and sales expenses for the 2015 periods were
118
impacted by an increase in direct mail advertising and e-marketing costs, as well as increases in salary and commission expense increases for our door to door sales force.
Corporate overhead and management fees primarily consist of wages and benefits for our corporate personnel, legal fees, accounting and audit fees and other corporate expenses, and transaction and acquisition due diligence expenses. Corporate overhead and management fees for the 2015 Predecessor periods were impacted by $67,817 of costs related to the Cequel Acquisition, as well as increases in compensation and public relations expenses.
Depreciation and Amortization
Depreciation and amortization (including impairments) amounted to $23,574 and $533,357 for the period December 21, 2015 through December 31, 2015 and January 1, 2015 through December 20, 2015, respectively, compared to $598,736 for the year ended December 31, 2014. Depreciation and amortization (including impairments) for the 2015 Successor period includes depreciation and amortization related to the step-up in the carrying value of property, plant and equipment and amortizable intangible assets recorded in connection with the Cequel Acquisition. The decrease in depreciation and amortization for the 2015 Predecessor period as compared to 2014 was primarily as a result of decreased amortization expenses for customer relationships, as well as a decrease in depreciation resulting from assets being fully depreciated.
Adjusted EBITDA
Adjusted EBITDA amounted to $33,689 and $940,609 for the period December 21, 2015 through December 31, 2015 and January 1, 2015 through December 20, 2015, respectively, compared to $901,548 for the year ended December 31, 2014. Adjusted EBITDA in 2015 was impacted by an increase in revenue, partially offset by an increase in operating expenses (excluding depreciation and amortization, restructuring expense and other expenses and share-based compensation), as discussed above.
Interest Expense, net
Interest expense, net amounted to $11,491 and $237,319 for the period December 21, 2015 through December 31, 2015 and January 1, 2015 through December 20, 2015, respectively, compared to $230,146 for the year ended December 31, 2014. Interest expense for the Successor 2015 period includes additional interest related to the indebtedness issued to fund the Cequel Acquisition. The interest expense for the 2015 Predecessor period as compared to the 2014 Predecessor period increased primarily due to an increase in average debt outstanding and an increase in amortization of debt issuance costs and discounts.
Income Tax Expense
Income tax benefit (expense) amounted to $10,263 and $(29,301) for the period December 21, 2015 through December 31, 2015 and January 1, 2015 through December 20, 2015, respectively, reflecting an effective tax rate of 37% and (16)%, respectively. Income tax expense amounted to $8,095 for the year ended December 31, 2014, reflecting an effective tax rate of 32%. Excluding the impact of non-cash equity compensation expense of $11,556 and the income tax benefit to eliminate the Company's uncertain tax position of $12,984, the effective rate would have been 38%.
119
Liquidity and Capital Resources
Altice USA has no operations independent of its subsidiaries, Cablevision and Cequel, which are funded separately. Funding for our subsidiaries has generally been provided by cash flow from their respective operations, cash on hand and borrowings under their revolving credit facilities and the proceeds from the issuance of securities and borrowings under syndicated term loans in the capital markets. Our decision as to the use of cash generated from operating activities, cash on hand, borrowings under the revolving credit facilities or accessing the capital markets has been based upon an ongoing review of the funding needs of the business, the optimal allocation of cash resources, the timing of cash flow generation and the cost of borrowing under the revolving credit facilities, debt securities and syndicated term loans. We manage our business to a long-term net leverage ratio target of 5.0x. We calculate our consolidated net leverage ratio as net debt to L2QA EBITDA (Adjusted EBITDA for the two most recent consecutive fiscal quarters multiplied by 2.0).
We expect to utilize free cash flow and availability under the revolving credit facilities, as well as future refinancing transactions to further extend the maturities of, or reduce the principal on, our debt obligations. The timing and terms of any refinancing transactions will be subject to, among other factors, market conditions. Additionally, we may, from time to time, depending on market conditions and other factors, use cash on hand and the proceeds from other borrowings to repay the outstanding debt securities through open market purchases, privately negotiated purchases, tender offers, or redemption provisions.
We believe existing cash balances, operating cash flows and availability under our revolving credit facilities will provide adequate funds to support our current operating plan, make planned capital expenditures and fulfill our debt service requirements for the next twelve months. However, our ability to fund our operations, make planned capital expenditures, make scheduled payments on our indebtedness and repay our indebtedness depends on our future operating performance and cash flows and our ability to access the capital markets, which, in turn, are subject to prevailing economic conditions and to financial, business and other factors, some of which are beyond our control. Our collateralized debt maturing in the next 12 months will be settled either by delivering shares of Comcast common stock or by delivering cash from the net proceeds of new monetization transactions. However, competition, market disruptions or a deterioration in economic conditions could lead to lower demand for our products, as well as lower levels of advertising, and increased incidence of customers' inability to pay for the services we provide. These events would adversely impact our results of operations, cash flows and financial position. Although we currently believe that amounts available under the revolving credit facilities will be available when, and if needed, we can provide no assurance that access to such funds will not be impacted by adverse conditions in the financial markets or other conditions. The obligations of the financial institutions under the revolving credit facilities are several and not joint and, as a result, a funding default by one or more institutions does not need to be made up by the others.
In the longer term, we do not expect to be able to generate sufficient cash from operations to fund anticipated capital expenditures, meet all existing future contractual payment obligations and repay our debt at maturity. As a result, we will be dependent upon our continued access to the capital and credit markets to issue additional debt or equity or refinance existing debt obligations. We will need to raise significant amounts of funding over the next several years to fund capital expenditures, repay existing obligations and meet other obligations, and the failure to do so successfully could adversely affect our business. If we are unable to do so, we will need to take other actions including deferring capital expenditures, selling assets, seeking strategic investments from third parties or reducing or eliminating discretionary uses of cash.
120
Debt Outstanding
The following tables summarize the carrying value of our outstanding debt, net of deferred financing costs, discounts and premiums (excluding accrued interest), as well as interest expense and pro forma interest expense.
| |
As of March 31, 2017 | |||||||||||||||
|---|---|---|---|---|---|---|---|---|---|---|---|---|---|---|---|---|
| |
Cablevision | Cequel | Altice USA | Eliminations | Total Altice USA, Inc. |
|||||||||||
Debt outstanding: |
||||||||||||||||
Credit facility debt |
$ | 2,677,412 | $ | 810,929 | $ | — | $ | — | $ | 3,488,341 | ||||||
Senior guaranteed notes |
2,289,901 | — | — | — | 2,289,901 | |||||||||||
Senior secured notes |
2,567,708 | — | — | 2,567,708 | ||||||||||||
Senior notes and debentures |
9,463,492 | 3,184,617 | — | — | 12,648,109 | |||||||||||
Capital lease obligations |
21,321 | 2,223 | — | — | 23,544 | |||||||||||
Notes payable |
11,453 | — | — | — | 11,453 | |||||||||||
| | | | | | | | | | | | | | | | | |
Subtotal |
$ | 14,463,579 | $ | 6,565,477 | $ | — | $ | — | $ | 21,029,056 | ||||||
| | | | | | | | | | | | | | | | | |
Notes payable to affiliates and related parties |
— | — | 1,750,000 | — | 1,750,000 | |||||||||||
Collateralized indebtedness relating to stock monetizations(a) |
1,293,702 | — | — | — | 1,293,702 | |||||||||||
| | | | | | | | | | | | | | | | | |
Total debt |
$ | 15,757,281 | $ | 6,565,477 | $ | 1,750,000 | $ | — | $ | 24,072,758 | ||||||
| | | | | | | | | | | | | | | | | |
| | | | | | | | | | | | | | | | | |
| | | | | | | | | | | | | | | | | |
Interest expense: |
||||||||||||||||
Credit facility debt, senior notes, capital leases and notes payable |
$ | 261,953 | $ | 105,500 | 1,942 | $ | (1,942 | ) | $ | 367,453 | ||||||
Notes payable to affiliates and related parties |
— | — | 47,588 | — | 47,588 | |||||||||||
Collateralized indebtedness relating to stock monetizations(a) |
18,253 | — | $ | — | — | 18,253 | ||||||||||
| | | | | | | | | | | | | | | | | |
Total interest expense |
$ | 280,206 | $ | 105,500 | $ | 49,530 | $ | (1,942 | ) | $ | 433,294 | |||||
| | | | | | | | | | | | | | | | | |
| | | | | | | | | | | | | | | | | |
| | | | | | | | | | | | | | | | | |
- (a)
- This indebtedness is collateralized by shares of Comcast common stock. We intend to settle this debt by either delivering shares of the Comcast common stock and the related equity derivative contracts or by delivering cash from the net proceeds of new monetization transactions.
121
The following table provides details of our outstanding credit facility debt as of March 31, 2017:
| |
Maturity Date | Interest Rate |
Principal | Carrying Value(a) | ||||||||
|---|---|---|---|---|---|---|---|---|---|---|---|---|
Cablevision: |
||||||||||||
CSC Holdings Revolving Credit Facility(b) |
$20,000 on October 9, 2020, remaining on November 30, 2021 | 4.16 | % | $ | 225,256 | $ | 196,407 | |||||
CSC Holdings Term Credit Facility(c) |
July 17, 2025 | 3.94 | % | 2,493,750 | 2,481,005 | |||||||
Cequel: |
||||||||||||
Revolving Credit Facility |
November 30, 2021 | — | — | — | ||||||||
Term Credit Facility(d) |
July 28, 2025 | 3.98 | % | 812,963 | 810,929 | |||||||
| | | | | | | | | | | | | |
|
$ | 3,488,341 | ||||||||||
| | | | | | | | | | | | | |
| | | | | | | | | | | | | |
| | | | | | | | | | | | | |
- (a)
- The
unamortized discounts and deferred financing costs amounted to $43,628 at March 31, 2017.
- (b)
- Includes
$100,256 of credit facility debt incurred to finance the Cablevision Acquisition. See discussion above regarding the amendment to the revolving credit
facility entered into December 2016. At March 31, 2017, $1,984,721, of the facility was undrawn and available, subject to covenant limitations.
- (c)
- Represents
$3,800,000 principal amount of debt incurred to finance the Cablevision Acquisition, net of principal repayments made.
- (d)
- At March 31, 2017, $17,031 of the revolving credit facility was restricted for certain letters of credit issued on behalf of the Company and $332,969 of the facility was undrawn and available, subject to covenant limitations.
Pre-IPO Distribution
Prior to the closing of this offering, the Company will declare and pay a cash dividend of $669,750 to its stockholders, which will be funded by borrowings of $500,000 under the CVC Revolving Credit Facility and $169,750 of cash on hand.
Payment Obligations Related to Debt
As of March 31, 2017, total amounts payable by us in connection with our outstanding obligations (giving effect to the Extension Amendment discussed below) during the period below and thereafter, including related interest, as well as notes payable to affiliates and related parties, capital lease
122
obligations, notes payable, and the value deliverable at maturity under monetization contracts are as follows:
| |
Cablevision (a) |
Cequel | Altice USA | Total | |||||||||
|---|---|---|---|---|---|---|---|---|---|---|---|---|---|
2017 |
$ | 1,605,515 | $ | 272,251 | $ | 286,563 | $ | 2,164,329 | |||||
2018 |
3,079,614 | 375,095 | 192,500 | 3,647,209 | |||||||||
2019 |
1,416,752 | 374,367 | 192,500 | 1,983,619 | |||||||||
2020 |
1,341,908 | 1,423,927 | 192,500 | 2,958,335 | |||||||||
2021 |
2,361,704 | 1,556,463 | 192,500 | 4,110,667 | |||||||||
Thereafter |
12,619,295 | 5,226,772 | 2,231,250 | 20,077,317 | |||||||||
| | | | | | | | | | | | | | |
Total |
$ | 22,424,788 | $ | 9,228,875 | $ | 3,287,813 | $ | 34,941,476 | |||||
| | | | | | | | | | | | | | |
| | | | | | | | | | | | | | |
| | | | | | | | | | | | | | |
- (a)
- Included in the 2017 and 2018 amounts is $500,934 and $534,884, respectively, related to the Company's obligations (including related interest) in connection with monetization contracts it has entered into. The Company has the option, at maturity, to deliver the shares of common stock underlying the monetization contracts in full satisfaction of the maturing collateralized indebtedness and the related derivative contracts or obtain the required cash equivalent of the common stock through new monetization and derivative contracts.
CSC Holdings Restricted Group
CSC Holdings and those of its subsidiaries which conduct our broadband, pay television and telephony services operations, as well as Lightpath, which provides Ethernet-based data, Internet, voice and video transport and managed services to the business market, comprise the "Restricted Group" as they are subject to the covenants and restrictions of the credit facility and indentures governing the notes and debentures issued by CSC Holdings. In addition, the Restricted Group is also subject to the covenants of the debt issued by Cablevision.
Sources of cash for the Restricted Group include primarily cash flow from the operations of the businesses in the Restricted Group, borrowings under its credit facility and issuance of securities in the capital markets and, from time to time, distributions or loans from its subsidiaries. The Restricted Group's principal uses of cash include: capital spending, in particular, the capital requirements associated with the upgrade of its digital broadband, pay television and telephony services (including enhancements to its service offerings such as a broadband wireless network (WiFi)); debt service, including distributions made to Cablevision to service interest expense and principal repayments on its debt securities; other corporate expenses and changes in working capital; and investments that it may fund from time to time.
Cablevision Credit Facilities
On October 9, 2015, Finco, which merged with and into CSC Holdings on June 21, 2016, entered into a senior secured credit facility, which currently provides U.S. dollar term loans currently in an aggregate principal amount of $3,000,000 (the "CVC Term Loan Facility", and the term loans extended under the CVC Term Loan Facility, the "CVC Term Loans") and U.S. dollar revolving loan commitments in an aggregate principal amount of $2,300,000 (the "CVC Revolving Credit Facility" and, together with the CVC Term Loan Facility, the "CVC Credit Facilities"), which are governed by a credit facilities agreement entered into by, inter alios, CSC Holdings certain lenders party thereto and JPMorgan Chase Bank, N.A. as administrative agent and security agent (as amended, restated, supplemented or otherwise modified on June 20, 2016, June 21, 2016, July 21, 2016, September 9, 2016, December 9, 2016 and March 15, 2017, respectively, and as further amended, restated, supplemented or otherwise modified from time to time, the "CVC Credit Facilities Agreement"). Prior to the closing of
123
this offering, we intend to borrow $500,000 under the CVC Revolving Credit Facility to partially fund the Pre-IPO Distribution.
CSC Holdings was in compliance with all of its financial covenants under the CVC Credit Facilities Agreement as of March 31, 2017. In January 2017, CSC Holdings borrowed $225,000 under its revolving credit facility and in February 2017, made a repayment of $175,000 with cash on hand.
For a description of the terms of the CVC Credit Facilities Agreement, see "Description of Certain Indebtedness" elsewhere in this prospectus.
Cequel Credit Facilities
On June 12, 2015, Altice US Finance I Corporation entered into a senior secured credit facility which currently provides U.S. dollar term loans in an aggregate principal amount of $1,265,000 (the "Cequel Term Loan Facility" and the term loans extended under the Cequel Term Loan Facility, the "Cequel Term Loans") and U.S. dollar revolving loan commitments in an aggregate principal amount of $350,000 (the "Cequel Revolving Credit Facility" and, together with the Cequel Term Loan Facility, the "Cequel Credit Facilities") which are governed by a credit facilities agreement entered into by, inter alios, Altice US Finance I Corporation, certain lenders party thereto and JPMorgan Chase Bank, N.A. as administrative agent and security agent (as amended, restated, supplemented or otherwise modified on October 25, 2016, December 9, 2016 and March 15, 2017, and as further amended, restated, supplemented or modified from time to time, the "Cequel Credit Facilities Agreement").
Cequel was in compliance with all of its financial covenants under the Cequel Credit Facilities Agreement as of March 31, 2017.
For a description of the terms of the Cequel Credit Facilities Agreement, see "Description of Certain Indebtedness" elsewhere in this prospectus.
Cablevision Bonds
Cablevision Notes
On September 23, 2009, Cablevision issued $900,000 aggregate principal amount of its 85/8% Senior Notes due 2017 and 85/8% Series B Senior Notes due 2017 (together, the "Cablevision 2017 Senior Notes"). On April 17, 2017, Cablevision redeemed $500,000 aggregate principal amount of its Cablevision 2017 Senior Notes with certain of the proceeds of the term loans incurred under the CVC Credit Facilities Agreement, reducing the aggregate principal amount of outstanding Cablevision 2017 Senior Notes to $400,000.
On April 15, 2010, Cablevision issued $750,000 aggregate principal amount of its 73/4% Senior Notes due 2018 (the "Cablevision 2018 Senior Notes") and $500,000 aggregate principal amount of its 8% Senior Notes due 2020 (the "Cablevision 2020 Senior Notes"). On September 27, 2012, Cablevision issued $750,000 aggregate principal amount of its 57/8% Senior Notes due 2022 (the "Cablevision 2022 Senior Notes" and, together with the Cablevision 2017 Senior Notes, the Cablevision 2018 Senior Notes and the Cablevision 2020 Senior Notes, the "Cablevision Legacy Notes").
As of March 31, 2017, Cablevision was in compliance with all of its financial covenants under the indentures under which the Cablevision Legacy Notes were issued.
For a description of the terms of the Cablevision Legacy Notes, see "Description of Certain Indebtedness" elsewhere in this prospectus.
CSC Holdings Notes
CSC Holdings Senior Guaranteed Notes
On October 9, 2015, Finco issued $1,000,000 aggregate principal amount of its 65/8% Senior Guaranteed Notes due 2025 (the "CSC 2025 Senior Guaranteed Notes"). CSC Holdings assumed the
124
obligations as issuer of the CSC 2025 Senior Guaranteed Notes upon the merger of Finco and CSC Holdings on June 21, 2016. On September 23, 2016, CSC Holdings issued $1,310,000 aggregate principal amount of its 51/2% Senior Guaranteed Notes due 2027 (the "CSC 2027 Senior Guaranteed Notes" and, together with the CSC 2025 Senior Guaranteed Notes, the "CSC Senior Guaranteed Notes").
As of March 31, 2017, CSC Holdings was in compliance with all of its financial covenants under the indentures under which the CSC Senior Guarantees Notes were issued.
For a description of the terms of the CSC Senior Guaranteed Notes, see "Description of Certain Indebtedness" elsewhere in this prospectus.
CSC Holdings Senior Notes
On February 6, 1998, CSC Holdings, as a successor issuer, issued $300,000 aggregate principal amount of its 77/8% Senior Debentures due 2018 (the "CSC 77/8% 2018 Senior Debentures"). On July 21, 1998, CSC Holdings, as successor issuer, issued $500,000 aggregate principal amount of its 75/8% Senior Debentures due 2018 (the "CSC 75/8% 2018 Senior Debentures"). On February 12, 2009, CSC Holdings, as a successor issuer, issued $526,000 aggregate principal amount of its 85/8% Senior Notes due 2019 and 85/8% Series B Senior Notes due 2019 (together, the "CSC 2019 Senior Notes"). On November 15, 2011, CSC Holdings issued $1,000,000 aggregate principal amount of its 63/4% Senior Notes due 2021 and 63/4% Series B Senior Notes due 2021 (together, the "CSC 2021 Senior Notes"). On May 23, 2014, CSC Holdings issued $750,000 aggregate principal amount of its 51/4% Senior Notes due 2024 and 51/4% Series B Senior Notes due 2024 (together, the "CSC 2024 Senior Notes" and, together with the CSC 77/8% 2018 Senior Debentures, the CSC 75/8% 2018 Senior Debentures, the CSC 2019 Senior Notes and the CSC 2021 Senior Notes, the "CSC Legacy Notes").
On October 9, 2015, Finco, issued $1,800,000 aggregate principal amount of its 101/8% Senior Notes due 2023 (the "CSC 2023 Senior Notes") and $2,000,000 107/8% Senior Notes due 2025 together with the CSC 2023 Senior Notes, the "CSC New Senior Notes", and the CSC Legacy Notes and the CSC New Senior Notes, collectively, the "CSC Senior Notes"). CSC Holdings assumed the obligations as issuer of the CSC 2023 Senior Notes upon the merger of Finco and CSC Holdings on June 21, 2016. We intend to redeem $350,000 principal amount of the CSC 2025 Senior Notes with the net proceeds from this offering and cash on hand. See "Use of Proceeds" elsewhere in this prospectus.
As of March 31, 2017, CSC Holdings was in compliance with all of its financial covenants under the indentures under which the CSC Senior Notes were issued.
For a description of the terms of the CSC Senior Notes, see "Description of Certain Indebtedness" elsewhere in this prospectus.
Cequel Bonds
Cequel Senior Secured Notes
On June 12, 2015, Altice US Finance I Corporation issued $1,100,000 aggregate principal amount of its 53/8% Senior Secured Notes due 2023 (the "Cequel 2023 Senior Secured Notes"). On April 26, 2016, Altice US Finance I Corporation issued $1,500,000 aggregate principal amount of its 51/2% Senior Secured Notes due 2026 (the "Cequel 2026 Senior Secured Notes" and, together with the Cequel 2023 Senior Secured Notes, the "Cequel Senior Secured Notes").
As of March 31, 2017, Cequel was in compliance with all of its financial covenants under the indentures under which the Cequel Senior Secured Notes were issued.
For a description of the terms of the Cequel Senior Secured Notes, see "Description of Certain Indebtedness" elsewhere in this prospectus.
125
Cequel Senior Notes
On October 25, 2012, Cequel Capital Corporation and Cequel Communications Holdings I, LLC (collectively, the "Cequel Senior Notes Co-Issuers") issued $500,000 aggregate principal amount of their 63/8% Senior Notes due 2020 (the "Cequel 2020 Senior Notes"). On December 28, 2012, the Cequel Senior Notes Issuers issued an additional $1,000,000 aggregate principal amount of their Cequel 2020 Senior Notes. On April 14, 2017, the Cequel Senior Notes Co-Issuers redeemed $450,000 aggregate principal amount of their Cequel 2020 Senior Notes with certain of the proceeds of the term loans incurred under the Cequel Credit Facilities Agreement, reducing the aggregate principal amount of outstanding Cequel 2020 Senior Notes to $1,050,000.
On May 16, 2013, the Cequel Senior Notes Co-Issuers issued $750,000 aggregate principal amount of their 51/8% Senior Notes due 2021 (the "Cequel 2021 Senior Notes"). On September 9, 2014, the Cequel Senior Notes Co-Issuers issued $500,000 aggregate principal amount of their 51/8% Senior Notes due 2021 (the "Cequel 2021 Mirror Notes" and, together with the Cequel 2020 Senior Notes and the Cequel 2021 Senior Notes, the "Cequel Legacy Notes").
On June 12, 2015, Altice US Finance II Corporation issued $300,000 aggregate principal amount of its 73/4% Senior Notes due 2025 (the "Cequel 2025 Senior Notes" and, together with the Cequel Legacy Notes, the "Cequel Senior Notes").
As of March 31, 2017, Cequel was in compliance with all of its financial covenants under the indentures under which the Cequel Senior Notes were issued.
For a description of the terms of the Cequel Senior Notes, see "Description of Certain Indebtedness" elsewhere in this prospectus.
Capital Expenditures
The following table provides details of the Company's capital expenditures for the three months ended March 31, 2017:
| |
Capital Expenditures | |||||||||
|---|---|---|---|---|---|---|---|---|---|---|
| |
Cablevision | Cequel | Total | |||||||
Customer premise equipment |
$ | 47,675 | $ | 28,279 | $ | 75,954 | ||||
Network infrastructure |
74,948 | 26,028 | 100,976 | |||||||
Support and other |
38,198 | 8,454 | 46,652 | |||||||
Business services |
23,578 | 10,267 | 33,845 | |||||||
| | | | | | | | | | | |
|
$ | 184,399 | $ | 73,028 | $ | 257,427 | ||||
| | | | | | | | | | | |
| | | | | | | | | | | |
| | | | | | | | | | | |
The following table provides details of the Company's capital expenditures on a pro forma basis for the three months ended March 31, 2016 as if the Cablevision Acquisition had occurred as of January 1, 2016:
| |
Pro Forma Capital Expenditures | |||||||||
|---|---|---|---|---|---|---|---|---|---|---|
| |
Cablevision | Cequel | Total | |||||||
Customer premise equipment |
$ | 34,750 | $ | 42,537 | $ | 77,287 | ||||
Network infrastructure |
59,609 | 10,163 | 69,772 | |||||||
Support and other |
33,136 | 4,926 | 38,062 | |||||||
Business services |
21,157 | 8,578 | 29,735 | |||||||
| | | | | | | | | | | |
|
$ | 148,652 | $ | 66,204 | $ | 214,856 | ||||
| | | | | | | | | | | |
| | | | | | | | | | | |
| | | | | | | | | | | |
126
The following table provides details of the Company's capital expenditures for the year ended December 31, 2016 (reflecting capital expenditures for Cablevision from the date of acquisition):
| |
Capital Expenditures | |||||||||
|---|---|---|---|---|---|---|---|---|---|---|
| |
Cablevision | Cequel | Total | |||||||
Customer premise equipment |
$ | 77,536 | $ | 154,718 | $ | 232,254 | ||||
Network infrastructure |
91,952 | 76,926 | 168,878 | |||||||
Support and other |
83,153 | 45,336 | 128,489 | |||||||
Business services |
45,716 | 50,204 | 95,920 | |||||||
| | | | | | | | | | | |
|
$ | 298,357 | $ | 327,184 | $ | 625,541 | ||||
| | | | | | | | | | | |
| | | | | | | | | | | |
| | | | | | | | | | | |
The following table provides details of the Company's capital expenditures on a pro forma basis for the year ended December 31, 2016 as if the Cablevision acquisition had occurred on January 1, 2016:
| |
Pro Forma Capital Expenditures | |||||||||
|---|---|---|---|---|---|---|---|---|---|---|
| |
Year Ended December 31, 2016 | |||||||||
| |
Cablevision | Cequel | Total | |||||||
Customer premise equipment |
$ | 145,954 | $ | 154,718 | $ | 300,672 | ||||
Network infrastructure |
241,204 | 76,926 | 318,130 | |||||||
Support and other |
151,477 | 45,336 | 196,813 | |||||||
Business services |
89,853 | 50,204 | 140,057 | |||||||
| | | | | | | | | | | |
|
$ | 628,488 | $ | 327,184 | $ | 955,672 | ||||
| | | | | | | | | | | |
| | | | | | | | | | | |
| | | | | | | | | | | |
Customer premise equipment includes expenditures for set-top boxes, cable modems and other equipment that is placed in a customer's home, as well as customer installation costs. Network infrastructure includes: (i) scalable infrastructure, such as headend equipment, (ii) line extensions, such as fiber/coaxial cable, amplifiers, electronic equipment, make-ready and design engineering, and (iii) upgrade and rebuild, including costs to modify or replace existing fiber/coaxial cable networks, including enhancements. Support and other capital expenditures includes costs associated with the replacement or enhancement of non-network assets, such as office equipment, buildings and vehicles. Business services capital expenditures include primarily equipment, installation, support, and other costs related to our fiber based telecommunications business.
Cash Flow Discussion
Continuing Operations—Altice USA
Three Months Ended March 31, 2017 and 2016
Operating Activities
Net cash provided by operating activities amounted to $234,645 for the three months ended March 31, 2017 compared to $155,622 for the three months ended March 31, 2016. The 2017 cash provided by operating activities resulted from $447,849 of income from before depreciation and amortization and non-cash items, a $34,707 decrease in accounts receivable, an increase in deferred revenue of $11,257, partially offset by $105,314 resulting from a decrease in accounts payable and accrued expenses, a net decrease of $131,958 in amounts due to affiliates, an increase in current and other assets of $19,554, and a decrease in liability related to interest rate swap contracts of $2,342.
The 2016 cash provided by operating activities resulted from $6,560 of income from before depreciation and amortization and non-cash items and an increase in accounts payable and accrued expenses of $145,421 and an increase of $3,641 in other working capital items.
127
Investing Activities
Net cash used in investing activities for the three months ended March 31, 2017 was $301,172 compared to $65,806 for the three months ended March 31, 2016. The 2017 investing activities consisted primarily of capital expenditures of $257,427, payments for acquisitions, net of cash acquired of $43,608, and $137 in other cash payments.
The 2016 investing activities consisted primarily of $66,204 of capital expenditures, partially offset by net proceeds from the disposal of assets of $398.
Financing Activities
Net cash provided by financing activities amounted to $42,267 for the three months ended March 31, 2017 compared to net cash used of $9,945 for the three months ended March 31, 2016. In 2017, the Company's financing activities consisted primarily of proceeds from credit facility debt of $225,000 and collateralized indebtedness of $156,136, partially offset by repayments of credit facility debt of $183,288, payments of collateralized indebtedness and related derivative contracts of $150,084, principal payments on capital lease obligations of $4,207 and additions to deferred financing costs of $1,290.
In 2016, the Company's financing activities consisted of repayments on long-term debt of $5,980 and principal payments on capital lease obligations of $3,965.
For the Year Ended December 31, 2016
Operating Activities
Net cash provided by operating activities amounted to $1,184,455 for the year ended December 31, 2016. The cash provided by operating activities resulted from $868,827 of income before depreciation and amortization, $310,892 as a result of an increase in accounts payable and other liabilities, $78,823 resulting from an increase in liabilities related to interest rate swap contracts and $48,399 resulting from an increase in current and other assets, partially offset by $122,486 of non-cash items.
Investing Activities
Net cash used in investing activities for the year ended December 31, 2016 was $9,599,319. The investing activities consisted primarily of $8,988,774 payment for the Cablevision Acquisition, net of cash acquired, $625,541 of capital expenditures, net payments related to other investments of $4,608, and additions to other intangible assets of $106, partially offset by other net cash receipts of $19,710, including $13,825 from the sale of an affiliate interest.
Financing Activities
Net cash provided by financing activities for the year ended December 31, 2016 was $131,421. In 2016, the Company's financing activities consisted of proceeds of $1,750,000 from the issuance of notes to an affiliates and related parties, $1,310,000 from the issuance of senior notes, contribution from stockholder of $1,246,499, net proceeds from collateralized indebtedness of $36,286, and an excess tax benefit related to share-based awards of $31. Partially offsetting these increases were net repayments of credit facility debt of $3,623,287, distributions to parent of $365,559, payments of deferred financing costs of $203,712, and principal payments on capital lease obligations of $18,837.
Monetization Contract Maturities
Monetization contracts relating to 5,338,750 shares (adjusted for the 2 for 1 stock split in February 2017) of our Comcast common stock matured in August 2016. We settled our obligations under the
128
related collateralized indebtedness by delivering cash from the net proceeds of a new monetization transactions on our Comcast common stock that will mature in August 2018.
During 2017, monetization contracts covering 26,815,368 shares (adjusted for the 2 for 1 stock split in February 2017) of Comcast common stock held by us will mature. We intend to settle such transactions by either delivering shares of the Comcast common stock and the related equity derivative contracts or by delivering cash from the net proceeds of new monetization transactions.
See "Quantitative and Qualitative Disclosures About Market Risk" for a discussion of our monetization contracts.
Contractual Obligations and Off Balance Sheet Commitments
Our contractual obligations as of December 31, 2016, which consist primarily of our debt obligations and the effect such obligations are expected to have on our liquidity and cash flow in future periods, are summarized in the following table:
| |
Payments Due by Period | ||||||||||||||||||
|---|---|---|---|---|---|---|---|---|---|---|---|---|---|---|---|---|---|---|---|
| |
Total | Year 1 |
Years 2 - 3 |
Years 4 - 5 |
More than 5 years |
Other | |||||||||||||
Off balance sheet arrangements: |
|||||||||||||||||||
Purchase obligations(a) |
$ | 7,136,605 | $ | 2,396,634 | $ | 3,307,915 | $ | 1,394,318 | $ | 37,738 | $ | — | |||||||
Operating lease obligations(b) |
462,007 | 76,513 | 132,228 | 110,611 | 142,655 | — | |||||||||||||
Guarantees(c) |
19,793 | 3,909 | 15,884 | — | — | — | |||||||||||||
Letters of credit(d) |
114,251 | 220 | 14,297 | 99,734 | — | — | |||||||||||||
| | | | | | | | | | | | | | | | | | | | |
|
7,732,656 | 2,477,276 | 3,470,324 | 1,604,663 | 180,393 | — | |||||||||||||
Contractual obligations reflected on the balance sheet: |
|||||||||||||||||||
Debt obligations(e) |
35,341,751 | 3,518,226 | 5,630,130 | 7,131,749 | 19,061,646 | — | |||||||||||||
Capital lease obligations(f) |
30,134 | 15,757 | 11,238 | 1,727 | 1,412 | — | |||||||||||||
Taxes(g) |
7,809 | — | — | — | — | 7,809 | |||||||||||||
| | | | | | | | | | | | | | | | | | | | |
|
35,379,694 | 3,533,983 | 5,641,368 | 7,133,476 | 19,063,058 | 7,809 | |||||||||||||
| | | | | | | | | | | | | | | | | | | | |
Total |
$ | 43,112,350 | $ | 6,011,259 | $ | 9,111,692 | $ | 8,738,139 | $ | 19,243,451 | $ | 7,809 | |||||||
| | | | | | | | | | | | | | | | | | | | |
| | | | | | | | | | | | | | | | | | | | |
| | | | | | | | | | | | | | | | | | | | |
- (a)
- Purchase
obligations primarily include contractual commitments with various programming vendors to provide video services to our customers and minimum purchase
obligations to purchase goods or services. Future fees payable under contracts with programming vendors are based on numerous factors, including the number of subscribers receiving the programming.
Amounts reflected above related to programming agreements are based on the number of subscribers receiving the programming as of December 31, 2016 multiplied by the per subscriber rates or the
stated annual fee, as applicable, contained in the executed agreements in effect as of December 31, 2016. See Note 2 to the Altice USA, Inc. consolidated financial statements for a
discussion of our program rights obligations.
- (b)
- Operating lease obligations represent primarily future minimum payment commitments on various long-term, noncancelable leases, at rates now in force, for office, production and storage space, and rental space on utility poles. See Note 7 to the Altice USA, Inc. consolidated financial statements for a discussion of our operating leases.
129
- (c)
- Includes
franchise and performance surety bonds primarily for our cable television systems. Also includes outstanding guarantees primarily by CSC Holdings in favor
of certain financial institutions in respect of ongoing interest expense obligations in connection with the monetization of our holdings of shares of Comcast common stock. Payments due by period for
these arrangements represent the year in which the commitment expires.
- (d)
- Consists
primarily of letters of credit obtained by CSC Holdings in favor of insurance providers and certain governmental authorities. Payments due by period for
these arrangements represent the year in which the commitment expires.
- (e)
- Includes
interest and principal payments due on our (i) credit facility debt, (ii) senior guaranteed notes, senior secured notes and senior notes and
debentures, (iii) notes payable and (iv) collateralized indebtedness. See Notes 9 and 10 to the Altice USA, Inc. consolidated financial statements for a discussion of our
long-term debt.
- (f)
- Reflects
the principal amount of capital lease obligations, including related interest.
- (g)
- Represents tax liabilities, including accrued interest, relating to uncertain tax positions. See Note 12 to the Altice USA, Inc. consolidated financial statements for a discussion of our income taxes.
The table above does not include obligations for payments required to be made under multi-year franchise agreements based on a percentage of revenues generated from video service per year. For the year ended December 31, 2016, the amount of franchise fees and certain other taxes and fees included as a component of revenue aggregated $154,732.
Other Events
Dividends and Distributions
Pursuant to the terms of the Merger Agreement, Cablevision was not permitted to declare and pay dividends or repurchase stock, in each case, without the prior written consent of Altice N.V. In accordance with these terms, Cablevision did not declare dividends during the period January 1, 2016 through June 20, 2016 (Predecessor).
In the fourth quarter of 2016, the Company declared distributions aggregating $445,176 to the Company's stockholders of which $365,559 was paid in the fourth quarter of 2016 and $79,617 was paid in the first quarter of 2017. These distributions were used to redeem certain debt outstanding at the parent entities. In April 2017, the Company made a cash distribution of $169,950 to the Company's stockholders.
Quantitative and Qualitative Disclosures About Market Risk
Equity Price Risk
We are exposed to market risks from changes in certain equity security prices. Our exposure to changes in equity security prices stems primarily from the shares of Comcast common stock we hold. We have entered into equity derivative contracts consisting of a collateralized loan and an equity collar to hedge our equity price risk and to monetize the value of these securities. These contracts, at maturity, are expected to offset declines in the fair value of these securities below the hedge price per share while allowing us to retain upside appreciation from the hedge price per share to the relevant cap price. The contracts' actual hedge prices per share vary depending on average stock prices in effect at the time the contracts were executed. The contracts' actual cap prices vary depending on the maturity and terms of each contract, among other factors. If any one of these contracts is terminated prior to its scheduled maturity date due to the occurrence of an event specified in the contract, we would be obligated to repay the fair value of the collateralized indebtedness less the sum of the fair
130
values of the underlying stock and equity collar, calculated at the termination date. As of December 31, 2016, we did not have an early termination shortfall relating to any of these contracts.
All of our monetization transactions are obligations of our wholly-owned subsidiaries that are not part of the Restricted Group; however, CSC Holdings provides guarantees of the subsidiaries' ongoing contract payment expense obligations and potential payments that could be due as a result of an early termination event (as defined in the agreements). The guarantee exposure approximates the net sum of the fair value of the collateralized indebtedness less the sum of the fair values of the underlying stock and the equity collar. All of our equity derivative contracts are carried at their current fair value in our consolidated balance sheets with changes in value reflected in our consolidated statement of operations, and all of the counterparties to such transactions currently carry investment grade credit ratings.
The underlying stock and the equity collars are carried at fair value on our consolidated balance sheet and the collateralized indebtedness is carried at its principal value, net of the unamortized fair value adjustment. The fair value adjustment is being amortized over the term of the related indebtedness. The carrying value of our collateralized indebtedness amounted to $1,286,069 at December 31, 2016. At maturity, the contracts provide for the option to deliver cash or shares of Comcast common stock, with a value determined by reference to the applicable stock price at maturity.
As of December 31, 2016, the fair value and the carrying value of our holdings of Comcast common stock aggregated $1,483,030. Assuming a 10% change in price, the potential change in the fair value of these investments would be approximately $148,303. As of December 31, 2016, the net fair value and the carrying value of the equity collar component of the equity derivative contracts entered into to partially hedge the equity price risk of our holdings of Comcast common stock aggregated $2,202, a net liability position. For the year ended December 31, 2016, we recorded a net loss of $53,696 related to our outstanding equity derivative contracts and recorded an unrealized gain of $141,538 related to the Comcast common stock that we held.
Fair Value of Equity Derivative Contracts
|
|
|||
|---|---|---|---|---|
Fair value as of June 21, 2016, net asset position (Cablevision Acquisition) |
$ | 51,494 | ||
Change in fair value, net |
(53,696 | ) | ||
| | | | | |
Fair value as of December 31, 2016, net liability position |
$ | (2,202 | ) | |
| | | | | |
| | | | | |
| | | | | |
The maturity, number of shares deliverable at the relevant maturity, hedge price per share, and the lowest and highest cap prices received for the Comcast common stock monetized via an equity derivative prepaid forward contract are summarized in the following table:
| |
|
|
Cap Price(c) | |||||||||
|---|---|---|---|---|---|---|---|---|---|---|---|---|
| |
|
Hedge Price per Share(b) |
||||||||||
# of Shares Deliverable(a)
|
Maturity | Low | High | |||||||||
26,815,368(d) |
2017 | $27.98 - $29.56 | $ | 35.42 | $ | 38.43 | ||||||
16,139,868 |
2018 | $30.84 - $33.61 | $ | 37.01 | $ | 40.33 | ||||||
- (a)
- Share
amounts have been adjusted for the 2 for 1 stock split in February 2017.
- (b)
- Represents
the price below which we are provided with downside protection and above which we retain upside appreciation. Also represents the price used in
determining the cash proceeds payable to us at inception of the contracts.
- (c)
- Represents
the price up to which we receive the benefit of stock price appreciation.
- (d)
- Includes an equity derivative contract relating to 5,337,750 shares that matured and was settled in January 2017 from proceeds of a new monetization contract covering an equivalent number of shares.
131
Fair Value of Debt: At December 31, 2016, the fair value of our fixed rate debt of $22,405,790 was higher than its carrying value of $20,557,120 by $1,848,670. The fair value of these financial instruments is estimated based on reference to quoted market prices for these or comparable securities. Our floating rate borrowings bear interest in reference to current LIBOR-based market rates and thus their principal values approximate fair value. The effect of a hypothetical 100 basis point decrease in interest rates prevailing at December 31, 2016 would increase the estimated fair value of our fixed rate debt by $1,963,908 to $24,369,698. This estimate is based on the assumption of an immediate and parallel shift in interest rates across all maturities.
Interest Rate Risk
Interest rate risk is primarily a result of exposures to changes in the level, slope and curvature of the yield curve, the volatility of interest rates and credit spreads. Our exposure to interest rate risk results from changes in short-term interest rates. Interest rate risk exists primarily with respect to our credit facility debt, which bears interest at variable rates. The carrying value of our outstanding credit facility debt at December 31, 2016 amounted to $3,444,790. To manage interest rate risk, we have entered into interest rate swap contracts to adjust the proportion of total debt that is subject to variable and fixed interest rates. Such contracts effectively fix the borrowing rates on floating rate debt to provide an economic hedge against the risk of rising rates and/or effectively convert fixed rate borrowings to variable rates to permit the Company to realize lower interest expense in a declining interest rate environment. We monitor the financial institutions that are counterparties to our interest rate swap contracts and we only enter into interest rate swap contracts with financial institutions that are rated investment grade. All such contracts are carried at their fair market values on our consolidated balance sheet, with changes in fair value reflected in the consolidated statement of operations.
In June 2016, Altice US Finance I Corporation entered into two new fixed to floating interest rate swaps. One fixed to floating interest rate swap is converting $750,000 from a fixed rate of 1.6655% to six-month LIBOR and a second tranche of $750,000 from a fixed rate of 1.68% to six-month LIBOR. The objective of these swaps is to cover the exposure of the 2026 Senior Secured Notes to changes in the market interest rate.
These swap contracts are not designated as hedges for accounting purposes. Accordingly, the changes in the fair value of these interest rate swap contracts are recorded through the statement of operations. For the year ended December 31, 2016, the Company recorded a loss on interest rate swap contracts of $72,961.
As of December 31, 2016, our outstanding interest rate swap contracts had an aggregate fair value and carrying value of $78,823 reflected in "liabilities under derivative contracts" in our consolidated balance sheet.
We do not hold or issue derivative instruments for trading or speculative purposes.
Critical Accounting Policies
In preparing its financial statements, the Company is required to make certain estimates, judgments and assumptions that it believes are reasonable based upon the information available. These estimates and assumptions affect the reported amounts of assets and liabilities at the date of the financial statements and the reported amounts of revenues and expenses during the periods presented.
132
The significant accounting policies, which we believe are the most critical to aid in fully understanding and evaluating our reported financial results, include the following:
Business Combinations
The Company applied business combination accounting for the Cablevision Acquisition and the Cequel Acquisition. Business combination accounting requires that the assets acquired and liabilities assumed be recorded at their respective estimated fair values at the date of acquisition. The excess purchase price over fair value of the net assets acquired is recorded as goodwill. In determining estimated fair values, we are required to make estimates and assumptions that affect the recorded amounts, including, but not limited to, expected future cash flows, discount rates, remaining useful lives of long-lived assets, useful lives of identified intangible assets, replacement or reproduction costs of property and equipment and the amounts to be recovered in future periods from acquired net operating losses and other deferred tax assets. Our estimates in this area impact, among other items, the amount of depreciation and amortization, impairment charges in certain instances if the asset becomes impaired, and income tax expense or benefit that we report. Our estimates of fair value are based upon assumptions believed to be reasonable, but which are inherently uncertain. See Note 3 for a summary of the application of business combination accounting.
Impairment of Long-Lived and Indefinite-Lived Assets
The Company's long-lived and indefinite-lived assets at December 31, 2016 include goodwill of $7,992,700, other intangible assets of $19,372,725 ($13,020,081 of which are indefinite-lived intangible assets), and $6,597,635 of property, plant and equipment. Such assets accounted for approximately 93% of the Company's consolidated total assets. Goodwill and identifiable indefinite-lived intangible assets, which primarily represent the Company's cable television franchises are tested annually for impairment during the fourth quarter ("annual impairment test date") and upon the occurrence of certain events or substantive changes in circumstances.
The Company is operated as two reporting units for the goodwill impairment test and two units of accounting for the indefinite-lived asset impairment test. We assess qualitative factors and other relevant events and circumstances that affect the fair value of the reporting unit and its identifiable indefinite-lived intangible assets, such as:
- •
- macroeconomic conditions;
- •
- industry and market conditions;
- •
- cost factors;
- •
- overall financial performance;
- •
- changes in management, strategy or customers;
- •
- relevant specific events such as a change in the carrying amount of net assets, a more-likely-than-not expectation of selling or disposing all,
or a portion, of a reporting unit or unit of accounting; and
- •
- sustained decrease in share price, as applicable.
The Company assesses these qualitative factors to determine whether it is necessary to perform the two-step quantitative goodwill impairment test. This quantitative test is required only if the Company concludes that it is more likely than not that the reporting unit's fair value is less than its carrying amount.
When the qualitative assessment is not used, or if the qualitative assessment is not conclusive, the Company is required to determine goodwill impairment using a two-step process. The first step of the
133
goodwill impairment test is used to identify potential impairment by comparing the fair value of the reporting unit with its carrying amount, including goodwill utilizing an enterprise-value based premise approach. If the carrying amount of the reporting unit exceeds its fair value, the second step of the goodwill impairment test is performed to measure the amount of impairment loss, if any. The second step of the goodwill impairment test compares the implied fair value of the reporting unit's goodwill with the carrying amount of that goodwill. If the carrying amount of the reporting unit's goodwill exceeds the implied fair value of that goodwill, an impairment loss is recognized in an amount equal to that excess. The implied fair value of goodwill is determined in the same manner as the amount of goodwill that would be recognized in a business combination.
The Company assesses the qualitative factors discussed above to determine whether it is necessary to perform the one-step quantitative identifiable indefinite-lived intangible assets impairment test. This quantitative test is required only if the Company concludes that it is more likely than not that a unit of accounting's fair value is less than its carrying amount. When the qualitative assessment is not used, or if the qualitative assessment is not conclusive, the impairment test for identifiable indefinite-lived intangible assets requires a comparison of the estimated fair value of the intangible asset with its carrying value. If the carrying value of the intangible asset exceeds its fair value, an impairment loss is recognized in an amount equal to that excess. At December 31, 2016 the Company had indefinite-lived cable television franchises of $13,020,081 ($8,113,575 at Cablevision and $4,906,506 at Cequel), reflecting agreements we have with state and local governments that allow us to construct and operate a cable business within a specified geographic area and allow us to solicit and service potential customers in the service areas defined by the franchise rights currently held by the Company.
For other long-lived assets, including intangible assets that are amortized such as customer relationships and trade names, the Company evaluates assets for recoverability when there is an indication of potential impairment. If the undiscounted cash flows from a group of assets being evaluated is less than the carrying value of that group of assets, the fair value of the asset group is determined and the carrying value of the asset group is written down to fair value.
In assessing the recoverability of the Company's goodwill and other long-lived assets, the Company must make assumptions regarding estimated future cash flows and other factors to determine the fair value of the respective assets. These estimates and assumptions could have a significant impact on whether an impairment charge is recognized and also the magnitude of any such charge. Fair value estimates are made at a specific point in time, based on relevant information. These estimates are subjective in nature and involve uncertainties and matters of significant judgments and therefore cannot be determined with precision. Changes in assumptions could significantly affect the estimates. Estimates of fair value are primarily determined using discounted cash flows and comparable market transactions. These valuations are based on estimates and assumptions including projected future cash flows, discount rate, determination of appropriate market comparables and determination of whether a premium or discount should be applied to comparables. These valuations also include assumptions for average annual revenue per customer, number of homes passed, operating margin and market penetration as a percentage of homes passed, among other assumptions. Further, the projected cash flow assumptions consider contractual relationships, customer attrition, eventual development of new technologies and market competition. If these estimates or material related assumptions change in the future, the Company may be required to record impairment charges related to its long-lived assets.
During the fourth quarter of 2016, the Company assessed the qualitative factors described above to determine whether it was necessary to perform the two-step quantitative goodwill impairment test and concluded that it was not more likely than not that the reporting unit's fair value was less than its carrying amount. The Company also assessed these qualitative factors to determine whether it was necessary to perform the one-step quantitative identifiable indefinite-lived intangible assets impairment test and concluded that it was not more likely than not that the unit of accounting's fair value was less than its carrying amount.
134
Valuation of Deferred Tax Assets
Deferred tax assets have resulted primarily from the Company's future deductible temporary differences and net operating loss carry forwards ("NOLs"). In assessing the realizability of deferred tax assets, management considers whether it is more likely than not that some portion or all of the deferred tax asset will not be realized. In evaluating the need for a valuation allowance, management takes into account various factors, including the expected level of future taxable income, available tax planning strategies and reversals of existing taxable temporary differences. If such estimates and related assumptions change in the future, the Company may be required to record additional valuation allowances against its deferred tax assets, resulting in additional income tax expense in the Company's consolidated statement of operations. Management evaluates the realizability of the deferred tax assets and the need for additional valuation allowances quarterly. Pursuant to the Cablevision Acquisition and Cequel Acquisition, deferred tax liabilities resulting from the book fair value adjustment increased significantly and future taxable income that will result from the reversal of existing taxable temporary differences for which deferred tax liabilities are recognized is sufficient to conclude it is more likely than not that the Company will realize all of its gross deferred tax, except those deferred tax assets against which a valuation allowance has been recorded which relate to certain state NOLs. The Company increased the valuation allowance by $86 for the period January 1, 2016 through June 20, 2016 and increased the valuation allowance by $297 for the period June 21, 2016 through December 31, 2016. During 2016, certain state NOLs either expired or could not be utilized in the future. The deferred tax asset corresponding to the expired NOLs had been fully offset by a valuation allowance. The associated deferred tax asset and valuation allowance were both reduced by $3,368 in 2016.
Plant and Equipment
Costs incurred in the construction of the Company's cable systems, including line extensions to, and upgrade of, the Company's HFC infrastructure, initial placement of the feeder cable to connect a customer that had not been previously connected, and headend facilities are capitalized. These costs consist of materials, subcontractor labor, direct consulting fees, and internal labor and related costs associated with the construction activities. The internal costs that are capitalized consist of salaries and benefits of the Company's employees and the portion of facility costs, including rent, taxes, insurance and utilities, that supports the construction activities. These costs are depreciated over the estimated life of the plant (10 to 25 years) and headend facilities (4 to 25 years). Costs of operating the plant and the technical facilities, including repairs and maintenance, are expensed as incurred.
Costs associated with the initial deployment of new customer premise equipment necessary to provide broadband, pay television and telephony services are also capitalized. These costs include materials, subcontractor labor, internal labor, and other related costs associated with the connection activities. The departmental activities supporting the connection process are tracked through specific metrics, and the portion of departmental costs that is capitalized is determined through a time weighted activity allocation of costs incurred based on time studies used to estimate the average time spent on each activity. These installation costs are amortized over the estimated useful lives of the CPE necessary to provide broadband, pay television and telephony services. In circumstances where CPE tracking is not available, the Company estimates the amount of capitalized installation costs based on whether or not the business or residence had been previously connected to the network. These installation costs are depreciated over their estimated useful life of 4-8 years. The portion of departmental costs related to disconnecting services and removing CPE from a customer, costs related to connecting CPE that has been previously connected to the network and repair and maintenance are expensed as incurred.
The estimated useful lives assigned to our property, plant and equipment are reviewed on an annual basis or more frequently if circumstances warrant and such lives are revised to the extent
135
necessary due to changing facts and circumstances. Any changes in estimated useful lives are reflected prospectively.
Refer to Note 2 to our consolidated financial statements for a discussion of our accounting policies.
Legal Contingencies
The Company is party to various lawsuits and proceedings and is subject to other claims that arise in the ordinary course of business, some involving claims for substantial damages. The Company records an estimated liability for these claims when management believes the loss from such matters is probable and reasonably estimable. The Company reassesses the risk of loss as new information becomes available and adjusts liabilities as necessary. The actual cost of resolving a claim may be substantially different from the amount of the liability recorded. Refer to Note 16 to our consolidated financial statements for a discussion of our legal contingencies.
Equity Awards
Certain employees of the Company and its affiliates received awards of units in a carry unit plan of an entity which has an ownership interest in the Company. The Company measures the cost of employee services received in exchange for carried units based on the fair value of the award at grant date. In addition these units are presented as temporary equity on our consolidated balance sheet at fair value. An option pricing model is used to calculate the fair value of these units, which requires subjective assumptions for which changes in these assumptions could materially affect the fair value of the units outstanding. Significant assumptions include equity volatility, risk free rate, time to liquidity event, and discount for lack of marketability. The weighted average grant date fair value of the outstanding units is $0.37 per unit and the fair value was $1.76 per unit as of December 31, 2016. For the year ended December 31, 2016, the Company recognized an expense of $14,368 related to the push down of share-based compensation related to the carry plan and the redeemable equity on our balance sheet at December 31, 2016 was $68,147. See Note 14 to our consolidated financial statements for a further discussion of our carry unit plan awards.
Recently Issued But Not Yet Adopted Accounting Pronouncements
In January 2017, the Financial Accounting Standards Board ("FASB") issued Accounting Standards Update ("ASU") No. 2017-04, Intangibles—Goodwill and Other (Topic 350). ASU No. 2017-04 simplifies the subsequent measurement of goodwill by removing the second step of the two-step impairment test. The amendment requires an entity to perform its annual, or interim goodwill impairment test by comparing the fair value of a reporting unit with its carrying amount. An entity still has the option to perform the qualitative assessment for a reporting unit to determine if the quantitative impairment test is necessary. ASU No. 2017-04 becomes effective for us on January 1, 2020 with early adoption permitted and will be applied prospectively.
In January 2017, the FASB issued ASU No. 2017-01, Business Combinations (Topic 805), Clarifying the Definition of a Business, which amends Topic 805 to interpret the definition of a business by adding guidance to assist in evaluating whether transactions should be accounted for as acquisitions (or disposals) of assets or businesses. The new guidance becomes effective for us on January 1, 2019 with early adoption permitted and will be applied prospectively.
In January 2016, the FASB issued ASU No. 2016-01, Financial Instruments—Overall (Subtopic 825-10), Recognition and Measurement of Financial Assets and Financial Liabilities. ASU No. 2016-01 modifies how entities measure certain equity investments and also modifies the recognition of changes in the fair value of financial liabilities measured under the fair value option. Entities will be required to measure equity investments that do not result in consolidation and are not
136
accounted for under the equity method at fair value and recognize any changes in fair value in net income. For financial liabilities measured using the fair value option, entities will be required to record changes in fair value caused by a change in instrument-specific credit risk (own credit risk) separately in other comprehensive income. ASU No. 2016-01 becomes effective for us on January 1, 2018. We have not yet completed the evaluation of the effect that ASU No. 2016-01 will have on our consolidated financial statements.
In May 2014, the FASB issued ASU No. 2014-09, Revenue from Contracts with Customers, requiring an entity to recognize the amount of revenue to which it expects to be entitled for the transfer of promised goods or services to customers. ASU No. 2014-09 will replace most existing revenue recognition guidance in GAAP when it becomes effective and allows the use of either the retrospective or cumulative effect transition method. In August 2015, the FASB issued ASU No. 2015-14 that approved deferring the effective date by one year so that ASU No. 2014-09 would become effective for us on January 1, 2018. The FASB also approved, in July 2015, permitting the early adoption of ASU No. 2014-09, but not before the original effective date for the Company of January 1, 2017.
In December 2016, the FASB issued ASU No. 2016-20, Technical Corrections and Improvements to Topic 606, Revenue from Contracts with Customers, in order to clarify the Codification and to correct any unintended application of the guidance. These items are not expected to have a significant effect on the current accounting standard. The amendments in this update affect the guidance in ASU No. 2014-09, which is not yet effective. ASU No. 2014-09 will be effective, reflecting the one-year deferral, for interim and annual periods beginning after December 15, 2017 (January 1, 2018 for the Company). Early adoption of the standard is permitted but not before the original effective date. Companies can transition to the standard either retrospectively or as a cumulative-effect adjustment as of the date of adoption. We are in the process of evaluating the impact that the adoption of ASU No. 2014-09 will have on our consolidated financial statements and selecting the method of transition to the new standard. We currently expect the adoption to impact the timing of the recognition of residential installation revenue and the recognition of commission expenses.
In August 2016, the FASB issued ASU No. 2016-15, Statement of Cash Flows (Topic 230): Classification of Certain Cash Receipts and Cash Payments which clarifies how entities should classify certain cash receipts and cash payments on the statement of cash flows. ASU No. 2016-15 also clarifies how the predominance principle should be applied when cash receipts and cash payments have aspects of more than one class of cash flows. The new guidance becomes effective for us on January 1, 2018 with early adoption permitted and will be applied retrospectively. We have not yet completed the evaluation of the effect that ASU No. 2016-15 will have on our consolidated financial statements.
In February 2016, the FASB issued ASU No. 2016-02, Leases, which increases transparency and comparability by recognizing a lessee's rights and obligations resulting from leases by recording them on the balance sheet as lease assets and lease liabilities. The new guidance becomes effective for us on January 1, 2019 with early adoption permitted and will be applied using the modified retrospective method. We are currently in the process of determining the impact that ASU No. 2016-02 will have on our consolidated financial statements.
In March 2017, the FASB issued ASU No. 2017-07 Compensation-Retirement Benefits (Topic 715). ASU No. 2017-07 requires that an employer disaggregate the service cost component from the other components of net benefit cost. It also provides guidance on how to present the service cost component and the other components of net benefit cost in the income statement and what component of net benefit cost is eligible for capitalization. ASU No. 2017-07 becomes effective for us on January 1, 2018 with early adoption permitted and will be applied retrospectively. We have not yet completed the evaluation of the effect that ASU No. 2017-07 will have on our consolidated financial statements.
137
Broadband communications and video services companies in the United States are typically fully integrated providers of cable television, broadband Internet access and telephony services to residential and B2B customers. These companies also provide additional services to their B2B customers, including value-added managed services for SMBs and wholesale data access and transport for larger enterprise customers.
Key Industry Trends
Demand for Broadband
Increasing usage of bandwidth-intensive devices and applications such as HD television, online video streaming, content downloading for time-shifted video consumption and content delivered OTT has been driving demand for high-speed broadband Internet. As a result, broadband communications and video services providers have been focusing on providing greater speeds, network capacity and network reliability to their customers in order to capture the revenue opportunity associated with providing high-speed broadband access. This is driving greater investments in next-generation network technologies such as FTTH and DOCSIS 3.1.
The rapid adoption of smartphones, Wi-Fi enabled laptops and other connected devices is driving demand for fixed wireless broadband. In order to facilitate access to video and data content for their customers, broadband communications and video services providers are also deploying Wi-Fi hotspots across their network footprint, enabling these operators to leverage their wireline footprint to provide fixed wireless broadband access to subscribers.
Mobile network operators are currently planning on deploying next-generation "5G" wireless networks that will enable their subscribers to download data at speeds close to 1 Gbps and potentially create a broadband competitor to fixed wireline networks. However, these 5G networks are expected to require a fixed wireline infrastructure that can effectively backhaul data as well as offload a substantial amount of data that currently goes over mobile networks. This provides broadband communications and video services providers the opportunity to use their wireline and fiber networks to offer backhaul and data offloading for mobile operators. Given this "fixed-mobile" convergence, a FTTH network may enable a broadband communications and video services provider to support a 5G wireless network.
The continuously growing demand for broadband access, importance of Wi-Fi hotspots and expected need for a fiber footprint for 5G network deployments all highlight the benefits of a FTTH network to broadband communications and video services providers seeking to capitalize on these trends.
Programming Cost Increases and Greater Quality and Availability of Content
In recent years, the cost of programming in the cable and satellite video sectors has increased significantly and is expected to continue to increase, particularly with respect to costs for sports programming and broadcast networks. This is due to a variety of factors including annual increases imposed by programmers and stations and additional programming being provided to customers, including HD, digital, and VOD programming. Additionally, this has coincided with a significant increase in the quality of programming from high production value original cable series to enhanced camera and statistical data technology in sports broadcasts. Customers also have access to significantly more and increasingly diverse content through the various packages and bundles, some of which are offered through digital Internet-based delivery platforms (e.g., OTT) and/or directly from content owners, such as HBO, CBS and Nickelodeon. The proliferation of content available from new sources through connected devices and the changing consumption patterns of consumers has had a number of effects, such as causing some users to move into smaller bundles (even in some cases away from pay television to "data-only" plans) and creating additional opportunities for broadband communications and video services providers to sell these new products.
138
Pay television is a lower margin business than broadband due to the high cost of programming, the need for set-top boxes, higher installation costs relative to other services and the disproportionately high contribution of pay television to total customer service calls. These effects can be mitigated if a subscriber moves to a data-only plan at a higher-priced broadband tier in order to accommodate the shift to more Internet-based consumption of video. As a result, broadband communications and video services providers have been focusing on broadband customers and have started to sell such subscribers more Internet-based video services. This has resulted in recent increases in data subscribers even as pay television subscriptions have been declining.
Move Towards IP-Based Delivery of Content
Due to the rapidly increasing adoption of mobile, tablet, and PC devices for content consumption by subscribers, broadband communications and video services providers are looking to make video content available for consumption across such connected devices. This distribution model, called "TV Everywhere," necessitates an IP-based delivery of video. The move towards IP-based delivery of video has also been driven by the emergence of OTT platforms that leverage IP-based delivery of content to customers. Availability of video content across any mobile, tablet, and PC device highlights the importance of a widespread Wi-Fi network that will allow customers to efficiently access data-intensive video content from multiple locations.
IP-based content delivery is allowing broadband communications and video services providers to innovate and provide intuitive, easy-to-access user interfaces as well as more advanced customer-premise equipment.
Consolidation in the Cable Sector
Cable networks have a high cost of deployment, making it necessary to achieve economies of scale to create lower costs per customer and increase operating margins. Given this cost structure evolution and the similarly capital intensive nature of broadband networks, scale is also important for broadband communications providers. As a result, there has been significant consolidation among broadband communications providers with more than 15 transactions within the past ten years. As of March 31, 2017, the top four broadband communications providers had a greater than 85% market share in the United States across pay television, broadband and telephony services.
U.S. MVPDs segment market shares
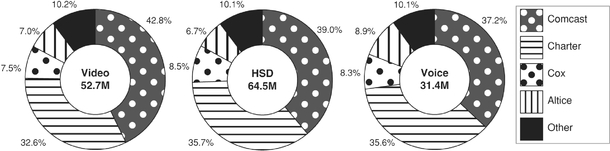
Source: S&P Global Market Intelligence, 2017
Trends Across Key Product Segments
Broadband
Broadband has become one of the fastest growing products in communications services, driven by increasing demand from residential customers for faster Internet access and for bandwidth-intensive services such as video streaming, content downloading for time-shifted video consumption and other applications delivered over OTT platforms such as Amazon, Hulu, Netflix and YouTube. The U.S.
139
residential broadband market had an estimated total size of approximately $35 billion as of May 2016, with an estimated penetration of 77% of total U.S. households as of the first quarter of 2017. We expect this growing broadband adoption and the migration of customers to higher-priced, higher-speed tiers to continue.
Residential wireline broadband penetration of U.S. households units
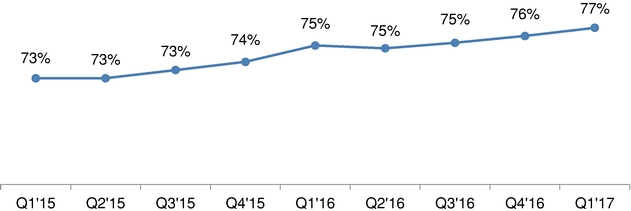
Source: S&P Global Market Intelligence, 2017
Demand for broadband by B2B customers is growing rapidly as well, due to secular trends such as cloud computing, e-commerce, the increasing importance of "Big Data" and the "Internet of Things". The U.S. commercial broadband market has an estimated total size of $8 billion and is expected to grow at a compound annual growth rate ("CAGR") of 7.3% from 2016 to 2026, faster than the projected growth rate for residential broadband Internet, which is expected to grow at a CAGR of 2.9% from 2016 to 2026.
The primary broadband Internet access technologies are FTTH, HFC and DSL, with HFC being the leading platform representing approximately 64% of the market as of March 2017. We believe increasing demand for higher-speed broadband Internet to support advanced applications requiring higher bandwidth and greater download speeds offers a sizable growth opportunity for cable and fiber-based technologies in the near term.
U.S. broadband subscribers by technology and service provider
(Share of total subscribers)
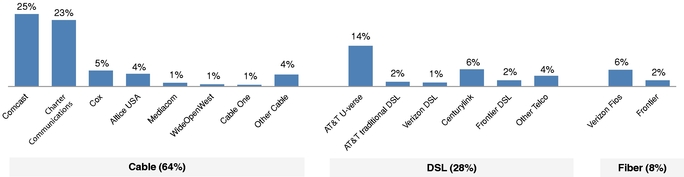
Source: S&P Global Market Intelligence, 2017
The strong growth in cable broadband subscribers has largely been at the expense of the DSL sector, which has lost subscribers to cable as the subscribers seek faster download speeds. Broadband communications and video services providers are now upgrading to the new DOCSIS 3.1 standard, enabling higher spectral efficiency and supporting up to 10 Gbps download and 1 Gbps upload speeds.
140
Broadband net subscriber additions (thousands)
| |
Q1'15 | Q2'15 | Q3'15 | Q4'15 | Q1'16 | Q2'16 | Q3'16 | Q4'16 | Q1'17 | |||||||||||||||||||
|---|---|---|---|---|---|---|---|---|---|---|---|---|---|---|---|---|---|---|---|---|---|---|---|---|---|---|---|---|
Net additions by cable companies |
1,186 | 495 | 899 | 1,219 | 1,280 | 615 | 935 | 917 | 1,102 | |||||||||||||||||||
Net additions by communication companies |
331 | (142 | ) | (128 | ) | (35 | ) | 64 | (364 | ) | (205 | ) | (150 | ) | (51 | ) | ||||||||||||
| | | | | | | | | | | | | | | | | | | | | | | | | | | | | |
Combined net additions |
1,517 | 353 | 771 | 1,185 | 1,344 | 251 | 730 | 767 | 1,051 | |||||||||||||||||||
Source: S&P Global Market Intelligence, 2017
Existing DSL infrastructure offers consumers maximum speeds of 45 Mbps. The speeds actually provided by DSL are, for most users, lower than the headline maximum speed possible due to the distance between the end users' premises and DSL hubs. Most DSL-based operators will likely need to make substantial investments in fiber technologies to be able to support future demand.
Given the continued growth in data consumption and increases in broadband penetration, we believe owning a FTTH network will be a strategic differentiator for broadband communications and video services providers since FTTH is capable of cost-efficiently scaling to support data demand over the longer term. While FTTH commonly supports speeds of between 100 Mbps and 1 Gbps it is capable of supporting more than 10 Gbps. FTTH is currently primarily offered by Verizon as part of its FiOS offering and AT&T through its U-Verse offering.
For SMB customers, providers typically offer broadband as well as Ethernet, data transport and IP-based virtual private networks. For larger enterprise customers, these companies typically offer higher capacity data services, including wide area networking and dedicated data access, and advanced services such as wireless mesh networks. Broadband communications and video services providers also offer wholesale transport services to mobile network operators for cell tower backhaul and to communications companies to connect to customers that their own networks do not reach.
Pay Television
Cable is the leading platform to distribute pay television in the United States, serving 77% of total U.S. households as of March 31, 2017. Competing technologies and delivery systems include DBS operators, video delivered by communications companies and video delivered directly over the Internet. We believe cable has certain advantages over these technologies, notably in terms of availability of interactive features, image quality and number of channels.
Residential multi-channel penetration of U.S. occupied household units
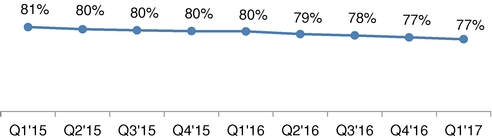
Source: S&P Global Market Intelligence, 2017
141
2017 U.S. pay television by technology and provider
(Share of total pay television subscribers)
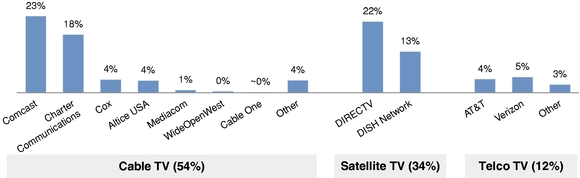
Source: S&P Global Market Intelligence, 2017
Services provided via cable networks are characterized by easy-to-use technology, efficient installation of customer equipment and the reliability of a protected signal delivered directly to the home. Given the trend towards offering bundled pay television, broadband and telephony services, broadband communications and video services providers' market share is expected to benefit from their ability to deliver high-bandwidth, triple-play services.
DBS operators distribute digital signals nationally via satellite directly to television viewers. To receive programming distributed via satellite, viewers require a satellite dish, a satellite receiver and a set-top box. Satellite distribution has several competitive advantages over cable television services in certain geographic areas, particularly in rural areas. However, given the lack of an integrated return path, DBS operators have struggled to deliver easy-to-handle interactive television services, including VOD services, to subscribers who do not have a broadband Internet connection.
Video services delivered over DSL networks present a number of disadvantages compared to cable. In particular, adding television services over a DSL network strains the network and decreases the amount of capacity available for other service offerings, particularly bandwidth-intensive broadband Internet. Given currently available technology, we believe DSL-based triple-play providers will have difficulty providing the same level of services that can be provided over HFC or fiber networks (in particular, for HDTV, viewing of television and VOD on multiple screens, television and VOD simultaneous viewing and recording).
Telephony Services
Traditional switched voice lines have been declining steadily in recent years as they are replaced by VoIP lines. This trend has been more pronounced for communications companies while cable operators have been able to maintain their subscriber base by bundling the fixed-line service into bundled service packages.
U.S. telephony net subscribers additions (thousands)
| |
Q1'15 | Q2'15 | Q3'15 | Q4'15 | Q1'16 | Q2'16 | Q3'16 | Q4'16 | Q1'17 | |||||||||||||||||||
|---|---|---|---|---|---|---|---|---|---|---|---|---|---|---|---|---|---|---|---|---|---|---|---|---|---|---|---|---|
Telephony net additions by cable companies |
450 | 276 | 297 | 660 | 427 | 151 | 26 | 160 | 79 | |||||||||||||||||||
Telephony net additions by communication companies |
(941 | ) | (817 | ) | (1,062 | ) | (987 | ) | (970 | ) | (956 | ) | (884 | ) | (799 | ) | (842 | ) | ||||||||||
| | | | | | | | | | | | | | | | | | | | | | | | | | | | | |
Combined net additions |
(491 | ) | (541 | ) | (765 | ) | (327 | ) | (543 | ) | (806 | ) | (859 | ) | (639 | ) | (763 | ) | ||||||||||
Source: S&P Global Market Intelligence, 2017
142
Broadband communications and video services providers offer B2B customers enterprise class telephone services which include traditional multi-line phone service over DOCSIS and trunking solutions as well as optional add-on services, such as international calling, toll free calling and virtual receptionists.
B2B Trends in Other Services
Value-added, managed services provided by broadband communications and video services providers to B2B customers include business e-mail, hosted private branch exchange, web space storage, network security monitoring, managed Wi-Fi, managed desktop and server backup and managed collaboration services including audio and web conferencing.
With deployments of DOCSIS 3.1 and Passive Optical Networks, broadband communications and video services providers are able to deliver broadband services at speeds of up to 1 Gbps to virtually any business or multi-tenant office building and up to 100 Gbps with service level agreements for enterprise class customers. Such capabilities create opportunities in virtually the entire U.S. managed services market for broadband communications and video services providers. Over the last few years, broadband communications and video services providers have successfully taken market share in the SMB segment from communications companies and are now looking to compete for larger enterprise customers by providing a portfolio of services that include broadband, Ethernet, telephony, network security, business continuity and Wi-Fi.
Based on management estimates, Altice USA's addressable market size for B2B services, including data, video and managed services, was $6.4 billion as of August 2016.
Industry benchmark
Altice USA believes that the U.S. cable operators have a higher revenue potential relative to their European peers, but also higher monthly operating costs excluding programming costs per customer. The table below compares the ARPU and operating expenses excluding programming costs per customer for Altice USA and their European peers.
Altice USA benchmarking vs. European peers1
Altice USA
|
Q1-16 | Q1-17 | |||||
|---|---|---|---|---|---|---|---|
ARPU |
$ | 135.32 | $ | 139.11 | |||
Monthly operating cost per unique customer (excl. programming cost) |
$ | 62.83 | $ | 49.48 | |||
European Peers
|
|||||||
ARPU |
$ | 47.53 | |||||
Monthly operating cost per unique customer (excl. programming cost)2 |
$ | 21.37 | |||||
- 1
- European
peers for ARPU includes Telenet, Ziggo, VMED, Com Hem and UPC Holding. European peers for monthly operating cost per unique customer excluding programming
expenses include Ziggo, VMED and UPC Holding (neither Telenet nor Com Hem publicly report their programming expenses; and European peers for average capital expenditure per unique customer includes
Telenet, Ziggo, VMED, Com Hem and UPC Holding.
- 2
- Average operating cost per unique customer excluding programming expenses for European peers reflects full year 2016 data instead of first quarter 2017 data due to the limited disclosure of programming expenses on a quarterly basis by European peers.
143
Overview
Altice USA is one of the largest broadband communications and video services providers in the United States. We deliver broadband, pay television, telephony services, Wi-Fi hotspot access, proprietary content and advertising services to approximately 4.9 million residential and business customers. Our footprint extends across 21 states through a fiber-rich broadband network with more than 8.5 million homes passed as of March 31, 2017. As the U.S. business of Altice N.V., we are driven at all levels by the "Altice Way"—our founder-inspired owner-operator culture and strategy of operational efficiency, innovation and long-term value creation for stockholders. In developing and implementing our strategy, we are focused on the following principles, which are part of the Altice Way:
- •
- Simplify and optimize our organization through streamlining business processes, centralizing
functions and eliminating non-essential operating expenses and service arrangements.
- •
- Reinvest in infrastructure and content, including upgrading our HFC network and building out a
FTTH network to strengthen our infrastructure capabilities and competitiveness.
- •
- Invest in sales, marketing and innovation, including brand-building, enhancing our sales
channels and automating provisioning and installation processes.
- •
- Enhance the customer experience by offering a technologically advanced customer platform
combined with superior connectivity and service across the customer lifecycle.
- •
- Drive revenue and cash flow growth through cross-selling, market share gains, new product launches and improvements in our operating and capital efficiency.
We believe the Altice Way, which has been successfully implemented across Altice Group, distinguishes us from our U.S. industry peers and competitors.
We acquired Suddenlink on December 21, 2015 and Optimum on June 21, 2016. We are a holding company that does not conduct any business operations of our own. We serve our customers through two business segments: Optimum, which operates in the New York metropolitan area, and Suddenlink, which principally operates in markets in the south-central United States. We have made significant progress in integrating the operations of Optimum and Suddenlink and are already realizing the operational and commercial benefits of common ownership and one management team as we implement the Altice Way throughout our organization.
We are a majority-owned and controlled U.S. subsidiary of Altice N.V., the multinational cable, fiber, telecommunications, content, media and advertising company founded and controlled by communications and media entrepreneur Mr. Drahi. Our management team benefits from Altice Group's experience in implementing the Altice Way around the world. Mr. Drahi, who has over 25 years of experience owning and managing communications and media operations, has built Altice Group from a regional French cable company founded in 2002 into one of the world's leading broadband communications and video services companies. Over the past 15 years, he has led a transformation of the broadband communications and video services industry through investment in networks and improvements in customer experience and operations to enhance both service delivery and operational efficiency. As of December 31, 2016, Altice Group delivered broadband, pay television and telephony services to more than 50 million customers in Western Europe, the United States, Israel and the Caribbean and reported pro forma consolidated revenue of €23.5 billion and pro forma Adjusted EBITDA of €8.9 billion for the fiscal year ended December 31, 2016. Upon the completion of this offering, Altice Parties on a combined basis will own 75.2% of the outstanding shares of our Class A and Class B common stock, which will represent 98.5% of the voting power of our outstanding capital stock.
144
In early 2015, Altice N.V. made the strategic decision to invest in operations in the United States, the country with the largest broadband communications and video services market in the world. Altice N.V. believed that by employing the Altice Way, it could significantly improve upon the historical growth rates, profitability and operational efficiency of broadband communications and video services companies operating in this market. The following attractive market characteristics underpinned Altice N.V.'s U.S. investment thesis:
- •
- favorable demographics supporting underlying market growth;
- •
- demand for higher-speed broadband services;
- •
- demand for more advanced customer platforms and user interfaces;
- •
- opportunities to enhance operational efficiency and reduce overhead; and
- •
- opportunities for further industry consolidation.
Following the Acquisitions, we began employing the Altice Way to simplify our organizational structure, reduce management layers, streamline decision-making processes and redeploy resources with a focus on network investment, customer service enhancements and marketing support. As a result, we have made significant progress in integrating the operations of Optimum and Suddenlink, centralizing our business functions, reorganizing our procurement processes, eliminating duplicative management functions, terminating lower-return projects and non-essential consulting and third-party service arrangements, and investing in our employee relations and our culture. Improved operational efficiency has allowed us to redeploy physical, technical and financial resources towards upgrading our network and enhancing the customer experience to drive customer growth. This focus is demonstrated by reduced network outages since the Acquisitions, which we believe improves the consistency and quality of the customer experience. In addition, we have expanded, and intend to continue expanding, our e-commerce channels for sales and marketing.
Since the Acquisitions, we have also upgraded our networks to nearly triple the maximum available broadband speeds we are offering to our Optimum customers and expanded our 1 Gbps broadband service to approximately 60% of our Suddenlink footprint, compared to approximately 40% prior to the Suddenlink Acquisition. In addition, we have commenced a five-year plan to build a FTTH network, which will enable us to deliver more than 10 Gbps broadband speeds across our entire Optimum footprint and part of our Suddenlink footprint. We believe this FTTH network will be more resilient with reduced maintenance requirements, fewer service outages and lower power usage, which we expect will drive further cost efficiencies in our business. In order to further enhance the customer experience, we plan to introduce a new home communications hub during the second quarter of 2017. Our new home communications hub will be an innovative, integrated platform with a dynamic and sophisticated user interface, combining a set-top box, Internet router and cable modem in one device, and will be the most advanced home communications hub offered by any Altice Group business. We are also beginning to offer managed data and communications services to our business customers and more advanced advertising services, such as targeted multi-screen advertising and data analytics, to our advertising and other business clients.
145
Many of our initiatives have already resulted in a positive impact to our customer relationships and financial results since the Acquisitions, as reflected in the year-over-year growth across the metrics in the following table:
| |
Three months ended March 31, | ||||||||||||||||||
|---|---|---|---|---|---|---|---|---|---|---|---|---|---|---|---|---|---|---|---|
| |
Altice USA | |
|
|
|
||||||||||||||
| |
Cablevision | Cequel | |||||||||||||||||
| |
|
Pro Forma 2016(a) |
|||||||||||||||||
(in thousands except percentage data)
|
2017 | 2017 | 2016(a) | 2017 | 2016 | ||||||||||||||
Customer Relationships |
4,913 | 4,859 | 3,148 | 3,125 | 1,765 | 1,734 | |||||||||||||
% growth |
1.1 | % | 0.7 | % | 1.8 | % | |||||||||||||
Revenue |
2,305,676 | 2,273,479 | 1,644,801 | 1,645,890 | 660,875 | 627,589 | |||||||||||||
% growth |
1.4 | % | (0.1 | )% | 5.3 | % | |||||||||||||
Adjusted EBITDA(b) |
941,736 | 743,588 | 627,073 | 480,859 | 314,662 | 262,729 | |||||||||||||
% growth |
26.6 | % | 30.4 | % | 19.8 | % | |||||||||||||
% of Revenue |
40.8 | % | 32.7 | % | 38.1 | % | 29.2 | % | 47.6 | % | 41.9 | % | |||||||
Adjusted EBITDA less capital expenditures(b) |
684,309 | 528,732 | 442,674 | 332,207 | 241,634 | 196,525 | |||||||||||||
% growth |
29.4 | % | 33.3 | % | 23.0 | % | |||||||||||||
% of Revenue |
29.7 | % | 23.3 | % | 26.9 | % | 20.2 | % | 36.6 | % | 31.3 | % | |||||||
Net loss attributable to stockholders |
(76,425 | ) | (190,075 | ) | (60,808 | ) | 94,377 | 14,739 | (32,329 | ) | |||||||||
% growth |
59.8 | % | (164.4 | )% | 145.6 | % | |||||||||||||
- (a)
- Includes
results for Newsday Media Group ("Newsday"). Altice USA sold a 75% stake in Newsday in July 2016. Newsday's revenue for the three months ended
March 31, 2016 was approximately $52 million.
- (b)
- For additional information regarding Adjusted EBITDA, including a reconciliation of Adjusted EBITDA to Net Loss, please refer to "Prospectus Summary—Summary Historical and Pro Forma Combined Financial Data."
Our Competitive Strengths
We believe the following competitive strengths have been instrumental to our success and position us for future growth and strong financial performance.
Our Owner-Operator Culture
We are part of a founder-controlled organization with an owner-operator culture and strategy that is focused on operational efficiency, innovation and long-term value creation for stockholders. This focus is reinforced by a system that delivers a substantial portion of management compensation in the form of long-term equity awards. Since the Acquisitions, our management team has moved quickly to, among other things, simplify and redesign our product offerings, drive adoption of higher broadband speeds and begin building a new FTTH network. We continuously challenge ourselves to improve our operational and financial performance. We encourage communication across the organization while empowering nimble, efficient decision-making that is focused at every level on enhancing the overall customer experience. We believe our owner-operator culture and the Altice Way differentiate us and position us to outperform our U.S. industry peers. We further believe the benefits of the Altice Way have been demonstrated by Altice N.V.'s performance, which is reflected in the 42% average annual total return of Altice N.V.'s Class A ordinary shares since its initial public offering in January 2014 through March 31, 2017, compared to the 5% average annual total return of the STOXX Europe 600 Telecommunications Index, of which Altice N.V.'s Class A ordinary shares are a component, during the same time period.
146
Leading Position in Attractive Markets
The markets served by our broadband networks have generally experienced higher levels of disposable income and household density compared to other broadband communications and video services markets in the United States. As of March 31, 2017, approximately 75% of the homes passed by our network were in either the New York metropolitan area or Texas. The following table provides a comparison of management's estimate of income and density metrics for our markets to both our largest U.S. publicly-traded industry peers as well as the national averages.
| |
Altice USA | Charter Communications |
Comcast | Cable One | U.S. National Median |
|||||||||||
|---|---|---|---|---|---|---|---|---|---|---|---|---|---|---|---|---|
2016 Household Median Income (in thousands) |
$ | 86 | $ | 63 | $ | 72 | $ | 59 | $ | 66 | ||||||
Housing Units per Square Mile as of April 1, 2010 based on most recent U.S. census data |
668 | 99 | 119 | 24 | 37 | |||||||||||
The footprint of our Optimum network includes New York City, the world's largest media and entertainment market as measured by 2014 revenue. This network represents our largest cluster of cable and fiber network systems. As of March 31, 2017, this network passed approximately 5.1 million homes and provided broadband, pay television and telephony services to approximately 3.1 million unique residential and business customers, representing approximately 64% of our entire customer base. We believe our leading market demographics support revenue growth potential in terms of customer additions and increased ARPU. We believe the market density of the New York metropolitan area allows our Optimum segment to operate with greater capital efficiency and lower capital expenditures as a percentage of revenue than our U.S. industry peers. Our presence in this market and its high-profile customer base also gives us access to a large and valuable base of advertisers, advertising inventory and advertising data, each of which supports growth prospects for our advertising business.
The footprint of our Suddenlink network includes markets in Texas, West Virginia, Louisiana, Arkansas, North Carolina, Oklahoma, Arizona, California, Missouri and eight other states. As of March 31, 2017, this network passed approximately 3.4 million homes and provided broadband, pay television and telephony services to approximately 1.8 million unique residential and business customers, representing approximately 36% of our customer base. We believe less than 15% of our Suddenlink footprint currently faces competition from broadband communications and video services providers offering download speeds comparable to our fastest offered speeds. In addition, household penetration of residential broadband connections with speeds of at least 25 Mbps in these markets was less than 37% as of June 30, 2016 compared to approximately 48% nationwide, as estimated by management, providing us with attractive future growth opportunities. As a result, we believe Suddenlink's markets are among the most attractive broadband communications and video services markets in the United States.
Advanced Network and Customer Platform Technologies
Technological innovation and network investments are key components of the Altice Way. Substantially all of our HFC network is digital video and DOCSIS 3.0 compatible, with approximately 300 homes per node and a bandwidth capacity of at least 750 MHz throughout. This network allows us to provide our customers with advanced broadband, pay television and telephony services. In addition, we believe our Optimum footprint offers the densest Wi-Fi network among our U.S. industry peers as measured by the number of Wi-Fi hotspots per broadband subscriber. Since the Acquisitions, we have nearly tripled the maximum available broadband speeds we are offering to our Optimum customers from 101 Mbps to 300 Mbps for residential customers and 350 Mbps for business customers and have
147
expanded our 1 Gbps broadband service to approximately 60% of our Suddenlink footprint from approximately 40% prior to the Suddenlink Acquisition.
Our advanced network has contributed to our revenue growth by allowing us to meet market demand for increasingly faster speeds. The chart below illustrates the significant increase in the percentage of our new residential customers choosing service plans with speeds greater than or equal to 100 Mbps since the Acquisitions.
|
|
To position us to satisfy anticipated market demand for increasing speeds and support evolving technologies, such as the expected transition of mobile networks to 5G, and to enable us to capture associated revenue growth opportunities, we have commenced a five-year plan to build a FTTH network that will enable us to deliver more than 10 Gbps broadband speeds across our entire Optimum footprint and part of our Suddenlink footprint.
We also plan to introduce a new home communications hub during the second quarter of 2017, which will be the most advanced home communications hub offered by any Altice Group business. This new hub will be an innovative, integrated platform with a dynamic and sophisticated user interface, combining a set-top box, Internet router and cable modem in one device. It is based on LaBox, a home communications hub Altice Group has successfully deployed in France, the Dominican Republic and Israel, and will be initially offered to customers subscribing to our triple product packages. It will be capable of delivering broadband, Wi-Fi, pay television services, OTT services and fixed-line telephony and will support 4K video and a remote DVR. We intend to continue enhancing the features and functionality of our new home communications hub after its initial introduction.
We believe the development of our advanced network and new home communications hub epitomizes the engineering and innovation-centric ethos within Altice Group.
Customer-Centric Operating and Service Model Supported by Technology and Data Analytics
We seek to provide our customers with the best connectivity and service experience available. This customer-centric approach drives our decision-making processes and is another key component of the Altice Way. Through investments in our information technology ("IT") platforms and a focus on process improvement, we have simplified and harmonized our service offering bundles, and improved our technical service delivery and our customer service. We are investing in our sales channels, including enhancing our e-commerce channels in response to customer behavior. While inbound sales
148
remain the largest sales channel for each of Optimum and Suddenlink, our e-commerce channels' share of new sales has grown substantially since the Acquisitions. We develop, monitor and analyze detailed customer metrics to identify root-causes of customer dissatisfaction and to further improve the customer experience. Taken together, we believe these initiatives will further reduce calls and service visits, increase customer satisfaction and strengthen our top-line performance and cash flow generation.
Benefits of a Global Communications Group
Unlike most of our U.S. industry peers, we benefit from being part of an international media and communications group. As the U.S. business of Altice N.V., we have access to the innovation, management expertise and best practices developed and tested in other Altice Group markets such as France, Portugal, the Dominican Republic and Israel. For example, our new home communications hub will be based on LaBox, which was developed by Altice Labs, Altice N.V.'s technology, services and operations innovation center, and our FTTH network build-out will leverage Altice Labs' technology and expertise developed for the deployment of GPON technology in Altice Group's fiber networks. Our B2B service offerings draw from platforms, services and expertise developed by sophisticated B2B operators across the Altice Group footprint such as Portugal Telecom in Portugal and SFR in France. We also benefit from Altice Group's significant scale advantages, allowing us to draw on centralized functions, including procurement and technical services. In addition, Altice Group operates converged networks, including wireless operations in markets outside the United States. We believe these scale benefits and operational expertise assist us in increasing our operating efficiency and reducing our capital expenditures while also improving the customer experience.
Altice Group also cross-deploys talent and expertise across its businesses, allowing us to benefit from our senior management's experience in successfully implementing the Altice Way around the world. We believe this diversity of experience differentiates us from our more traditional U.S.-centric industry peers.
Strategic Focus on Operational Efficiency
An important principle of the Altice Way is leveraging operational efficiency in order to invest in network improvements and increase returns. We believe our focus on simplifying customer service offerings and streamlining and improving our operations through an intense focus on efficiency is unmatched by our U.S. industry peers. We continuously strive to remove unnecessary management layers, streamline decision-making processes, trim excess costs and question whether our current methodologies are indeed the most efficient. For example, the home installation, repair, outside plant maintenance and network construction elements of our business have been reorganized under Altice Technical Services ("ATS"), Altice N.V.'s services organization in the United States. We believe this reorganization will allow us to focus on our core competencies and realize operational cost efficiencies. The financial resources created by these strategies allow us to invest in network improvements and customer experience enhancements. We believe the operating and financial benefits that result from our focus on operational efficiency will continue to give us a competitive advantage against our competitors and U.S. industry peers.
Powerful Financial Model Driving Strong Returns
We believe the benefits of the Altice Way have already significantly strengthened our financial performance and will continue to do so, allowing us to deliver strong returns.
Our revenue growth for the three months ended March 31, 2017 was 1.4% as compared to pro forma revenue for the three months ended March 31, 2016. Excluding Newsday, our year-over-year revenue growth for the three months ended March 31, 2017 was 3.8%. We believe we can continue growing our revenue by increasing market penetration of our services (particularly broadband), driving
149
continued growth in B2B services, launching new services, gaining market share from competitors due to the high quality and value of our services and leveraging improved customer satisfaction to sell additional services.
We believe we are one of the most profitable and cash flow generative broadband communications and video services providers in the United States. Our Adjusted EBITDA margin has increased from 32.7% for the three months ended March 31, 2016 on a pro forma basis giving effect to the Optimum Acquisition to 40.8% for the three months ended March 31, 2017. Combined with our revenue growth, this translates into a 27% year-over-year Adjusted EBITDA growth. See "Summary Historical and Pro Forma Financial Data" for additional information regarding Adjusted EBITDA, including a reconciliation of Adjusted EBITDA to net income.
As of March 31, 2017, based on an analysis of our current operating expenses, we believe we have realized a substantial portion of the total $1.1 billion in operating cost savings we announced that we would achieve over the three-year period following the Acquisitions. Our analysis compares the full year 2015 combined operating expenses of Cablevision and Cequel to the operating expenses of the Company for the quarter ended March 31, 2017, annualized. We believe we have been successful in achieving these cost savings on an expedited basis by delayering management, eliminating non-essential operating expenses and service arrangements and rationalizing our supplier relationships. Management's focus on these initiatives has resulted in cost savings that are primarily reflected in our Other Operating Expenses line item. See "Management's Discussion and Analysis of Financial Condition and Results of Operations" for more information.
For the three months ended March 31, 2017, our capital expenditures as a percentage of revenue was 11.2%, which we believe is one of the lowest among our U.S. industry peers, even as we increased our investments in network and service capabilities. The ratio of our Adjusted EBITDA less capital expenditures to revenue for the three months ended March 31, 2017 was 30%, implying that for each dollar of revenue that we realized in that quarter we generated approximately $0.30 of Adjusted EBITDA less capital expenditures, which we believe exceeds the performance of our U.S. industry peers. We believe our profitability, capital efficiency and cash generation profile, which is among the highest in the industry, results from a number of factors, including our focus on operational efficiency derived from the Altice Way, the advanced state of our HFC network infrastructure, our highly clustered network footprint and our customer base with relatively high ARPU and low churn.
Experienced Management Team Supported by Founder
Our CEO and Co-Presidents have substantial experience in communications and media operations, finance and mergers and acquisitions, and a proven track record in executing the Altice Way. Dexter Goei, our CEO and Chairman since 2016, joined Altice N.V. in 2009, and as its CEO he spearheaded the rapid expansion of the company from a French cable operator to a multinational communications enterprise with fixed and mobile assets across six different countries. A key aspect of Mr. Goei's role as CEO of Altice USA is to carry forward the same entrepreneurial and owner-operator culture that is at the core of the Altice Way and Altice N.V.'s success. Abdelhakim Boubazine, our Co-President and COO since 2015, was previously the CEO of Altice Group's Dominican Republic business, where he oversaw pay television, broadband and mobile operations for more than four million customers. Charles Stewart, our Co-President and CFO since 2015, previously served as CEO of Itau BBA International plc, where he oversaw Itau-Unibanco's wholesale banking activities in Europe, United States and Asia. Prior to that, he spent nineteen years at Morgan Stanley in a variety of investment banking roles including nine years focused on the U.S. cable industry. Our management team operates in a coordinated fashion with Altice N.V.'s management team and is supported by Altice Group's founder and controlling stockholder, Mr. Drahi. We believe this facilitates a flat corporate structure, speed in decision making and a focus on long-term value creation.
150
Our Business Strategy
Our business strategy is based on the successful Altice Way. By executing on the principles described below, we aim to provide advanced, innovative broadband, pay television and telephony services to our customers and deliver strong returns to our stockholders.
Simplify and Optimize Our Organization
Since the Acquisitions, we have implemented the Altice Way across our organization to streamline processes and service offerings and to improve productivity by centralizing our business functions, reorganizing our procurement processes, eliminating duplicative management functions and overhead, terminating lower-return projects and non-essential consulting and third-party service arrangements, and investing in our employee relations and our culture. This has resulted in a revitalized organization as well as improved financial performance, which we are leveraging to re-invest in our business. We are also reorganizing and simplifying our customer service, programming and data analytics; using ATS to increase quality, efficiency and productivity; and updating and simplifying our IT infrastructure through further investments and integration.
Reinvest in Infrastructure and Content
Our entire Optimum footprint is upgraded to deliver broadband speeds of up to 300 Mbps for residential customers and up to 350 Mbps for business customers, and we have expanded our 1 Gbps broadband service to approximately 60% of our Suddenlink footprint, compared to approximately 40% prior to the Suddenlink Acquisition. In addition, we have commenced a five-year plan to build a FTTH network, which will enable us to deliver more than 10 Gbps broadband speeds across our entire Optimum footprint and part of our Suddenlink footprint. We believe we can carry out this network build-out efficiently and within our current capital expenditure levels because of (i) the proximity of fiber to our end customers in our existing network; (ii) our access to Altice Labs' experience and expertise in deploying GPON for its FTTH projects in other markets; (iii) our favorable network topology that is over 75% aerial; and (iv) the lower unit construction costs available to us through ATS. We believe our FTTH investment will further prepare us for the future by enabling us to provide our residential and business customers with technologically advanced services and increased network reliability, while providing us with lower operating costs and opportunities for new revenue sources. For instance, we believe our FTTH investment will offer significant strategic value as the mobile and fixed network environments continue to converge, particularly as mobile operators deploy 5G and subsequent mobile networks.
151
Our reinvestment in content has focused on the news category with ongoing investments in our hyper-local news channel News12, our 25% investment in the U.S. operations of i24 News, the Altice Group global news network that was launched in the United States in February 2017, and our 25% interest in Newsday, a daily newspaper that primarily serves Long Island. In addition, we are evaluating opportunities to deploy other content assets owned by Altice Group.
Invest in Sales, Marketing and Innovation
We are reinvesting in our sales channels, including enhancing our e-commerce channels such as Optimum.com and Suddenlink.com, and developing e-commerce-only promotions. For the three months ended March 31, 2017, 26% and 14% of our gross adds were via our online sales channel for Suddenlink and Optimum, respectively, compared to 16% and 4% for the three months ended March 31, 2016. We are also focused on building our brand to emphasize the quality of our services by developing Optimum Experience retail stores in shopping malls and other high-traffic locations.
We seek to innovate across many areas of our business. For our residential customers, this includes our focus on new customer platforms and faster data speeds. For our business customers, we are introducing new value-added managed services while for our advertising clients we offer advanced, targeted and multi-screen advertising services and data analytics using our proprietary data and the advanced technology platforms that we have developed and acquired.
We are also focused on simplifying our bundled offerings and standardizing our pricing structures. Since the Optimum Acquisition we have reduced the number of Optimum bundles by approximately 50% and since the Suddenlink Acquisition we have reduced the number of Suddenlink pricing structures by approximately 80%.
Enhance the Customer Experience
We intend to deliver a superior customer experience through implementation of the Altice Way. First, we aim to offer the most technologically advanced customer platforms, including our new home communications hub, which is an innovative, integrated platform with a dynamic and sophisticated user interface combining a set-top box, Internet router and cable modem in one device. Second, by leveraging our advanced infrastructure (with more than 8.5 million homes passed and approximately 1.8 million Wi-Fi hotspots as of March 31, 2017), we seek to provide our customers with a bandwidth and connectivity experience superior to what our competition offers. We believe our FTTH network build-out will further enhance our infrastructure position, improve service reliability for our customers and lower our maintenance costs. Third, we strive to provide the best service across the customer lifecycle from point of sale to installation and customer care. A key aspect of this initiative is to link internal sales incentives to metrics tied to the length of a new customer relationship and product mix, as opposed to more traditional criteria of new sales, in order to refocus our organization away from churn retention to churn prevention. For example, the number of technical service calls handled by our representatives in March 2017 was 27% lower compared to March 2016 while the number of customer service calls and the number of service visits handled by our representatives was 23% and 20% lower, respectively, over the same period.
152
Drive Revenue and Cash Flow Growth
Since the Acquisitions, we have made significant progress in improving our growth in revenue, Adjusted EBITDA and cash flow and believe we have additional opportunities to drive continued growth in these financial metrics based on the following factors:
- •
- continued market demand for our bundled services, particularly broadband driven by increased data consumption and bandwidth requirements;
- •
- focus on selling and cross-selling higher value and more enriched service offerings to our residential and business customers, as well as the
introduction of new services leveraging our advanced HFC and FTTH networks;
- •
- market share gains driven by product innovation and the quality and value of our services;
- •
- focus on connectivity, business and advertising services;
- •
- improvements in our operating and capital efficiency through continued implementation of the Altice Way;
and
- •
- opportunities to further improve our capital structure.
Opportunistically Grow Through Value-Accretive Acquisitions
We intend to opportunistically grow through value-accretive acquisitions. Our controlling stockholder, Altice N.V., has made over 30 acquisitions since its inception in 2002, including the Acquisitions. We believe Altice N.V. has consistently demonstrated an ability to acquire and effectively integrate companies, realize efficiencies and cost synergies, improve revenue trends and grow Adjusted EBITDA and Adjusted EBITDA less capital expenditures. In the five largest acquisitions completed by Altice N.V. over the last five years, SFR, Portugal Telecom, Orange Dominicana, Optimum and Suddenlink, it has increased Adjusted EBITDA margin on average by approximately 7 percentage points between the quarter immediately preceding the closing of the applicable acquisition and the three months ended March 31, 2017. Altice N.V.'s track record of creating value through acquisitions is also reflected in the 32% average annual total return of SFR's ordinary shares since its initial public offering in November 2013 until March 31, 2017, compared to the 5% average annual total return of the STOXX Europe 600 Telecommunications Index, of which SFR's ordinary shares are a component, during the same time period. We believe the U.S. broadband communications and video services market offers a number of attractive opportunities to grow our business through strategic acquisitions. We believe the Altice Way and our related ability to achieve efficiencies and cost synergies following acquisitions provide us with a competitive advantage in such future consolidation opportunities. However, there is no assurance that we would be able to achieve similar results or that any such acquisitions would have a similar impact on our stock price performance.
Our Products and Services
We provide broadband, pay television and telephony services to both residential and business customers. We also provide enterprise-grade fiber connectivity, bandwidth and managed services to enterprise customers through Optimum's Lightpath business and advertising time to advertisers.
The prices we charge for our services vary based on the number of services and associated service level or tier our customers choose, coupled with any promotions we may offer. As part of our marketing strategy our customers are increasingly choosing to bundle their subscriptions to two ("double product") or three ("triple product") of our services at the same time. Customers who subscribe to a bundle generally receive a discount from the price of buying each of these services separately, as well as the convenience of receiving multiple services from a single provider, all on a single monthly bill. For example, we offer an "Optimum Triple Play" package that is a special
153
promotion for new customers or eligible current customers where Optimum broadband, pay television and telephony services are each available at a reduced rate for a specified period when purchased together. Approximately 50% of our residential customers were triple product customers as of March 31, 2017.
Residential Services
We offer broadband, pay television and telephony services to residential customers through both our Optimum and Suddenlink segments. The following tables show our residential customer relationships and revenues by service offerings for each of our Optimum and Suddenlink segments as well as on a combined basis.
| |
As of March 31, 2017 | As of December 31, 2016 | Pro Forma As of March 31, 2016 |
|||||||||||||||||||||||||
|---|---|---|---|---|---|---|---|---|---|---|---|---|---|---|---|---|---|---|---|---|---|---|---|---|---|---|---|---|
| |
Optimum | Suddenlink | Total | Optimum | Suddenlink | Total | Optimum | Suddenlink | Total | |||||||||||||||||||
| |
(in thousands) |
|||||||||||||||||||||||||||
Total residential customer relationships |
2,887 | 1,661 | 4,548 | 2,879 | 1,649 | 4,528 | 2,866 | 1,638 | 4,504 | |||||||||||||||||||
Pay TV |
2,413 | 1,087 | 3,500 | 2,428 | 1,107 | 3,535 | 2,473 | 1,150 | 3,623 | |||||||||||||||||||
Broadband |
2,636 | 1,366 | 4,003 | 2,619 | 1,344 | 3,963 | 2,580 | 1,308 | 3,888 | |||||||||||||||||||
Telephony |
1,955 | 596 | 2,551 | 1,962 | 597 | 2,559 | 1,999 | 597 | 2,596 | |||||||||||||||||||
| |
|
|
|
Historical | |||||||||
|---|---|---|---|---|---|---|---|---|---|---|---|---|---|
| |
Historical | ||||||||||||
| |
Three Months Ended March 31, 2016 |
||||||||||||
| |
Three Months Ended March 31, 2017 | ||||||||||||
| |
Optimum | Suddenlink | Total | Suddenlink | |||||||||
| |
(dollars in thousands) |
||||||||||||
Residential revenue: |
|||||||||||||
Pay TV |
$ | 789,387 | $ | 281,974 | $ | 1,071,361 | $ | 279,737 | |||||
Broadband |
381,969 | 229,800 | 611,769 | 196,690 | |||||||||
Telephony |
176,401 | 34,472 | 210,873 | 39,735 | |||||||||
Broadband Services
We offer a variety of broadband service tiers tailored to meet the different needs of our residential subscribers. Current customer offers include four tiers with download speeds ranging from 60 Mbps to 300 Mbps for our Optimum residential customers and 50 Mbps to 1 Gbps for our Suddenlink residential customers. Our broadband services also include access to complimentary features such as our free-to-use Optimum wireless "smart router," as well as Internet security software, including anti-virus, anti-spyware, personal firewall and anti-spam protection. Substantially all of our HFC network is digital and DOCSIS 3.0 compatible, with approximately 300 homes per node and a bandwidth capacity of at least 750 MHz throughout. This network allows us to provide our customers with advanced broadband, pay television and telephony services. Since the Acquisitions, we have nearly tripled the maximum available broadband speeds we are offering to our Optimum customers from 101 Mbps to 300 Mbps for residential customers and 350 Mbps for business customers and expanded our 1 Gbps broadband service to approximately 60% of our Suddenlink footprint from approximately 40% prior to the Suddenlink Acquisition. We have also commenced a five-year plan to build a FTTH network, which will enable us to deliver more than 10 Gbps broadband speeds across our entire Optimum footprint and part of our Suddenlink footprint. See "—Our Competitive Strengths—Advanced Network and Customer Platform Technologies."
In addition, we have deployed Wi-Fi across our Optimum service area with approximately 1.8 million Wi-Fi hotspots as of March 31, 2017. The Optimum Wi-Fi network allows Optimum broadband customers to access the service while they are away from their home or office. Wi-Fi is delivered via wireless access points mounted on our Optimum broadband network, in certain retail
154
partner locations, certain NJ Transit rail stations, New York City parks and other public venues. Similarly, our "smart router" product includes a second network that enables all Optimum broadband customers to access the Optimum Wi-Fi network. Access to the Optimum Wi-Fi network is offered as a free value-added benefit to Optimum broadband customers and for a fee to non-customers in certain locations. Our Wi-Fi service also allows our Optimum broadband customers to access the Wi-Fi networks of Comcast, Charter Communications (within the legacy Time Warner Cable and Bright House Networks footprints) and Cox Communications. Through these relationships we offer our Optimum customers access to approximately 350,000 additional hotspots nationwide.
Pay Television Services
We currently offer a variety of pay television services, which include delivery of broadcast stations and cable networks, and advanced digital pay television services, such as VOD, HD channels, DVR and pay-per-view, to our residential markets. Depending on the market and level of service, our pay television services include, among other programming, local broadcast networks and independent television stations, news, information, sports and entertainment channels, regional sports networks, international channels and premium services such as HBO, Showtime, Cinemax and Starz. Our residential subscribers pay a monthly charge based on the pay television programming level of service, tier or package they receive and the type of equipment they select. Customers who subscribe to seasonal sports packages, international channels and premium services may be charged an additional monthly amount. We may also charge additional fees for pay-per-view programming, DVR and certain VOD services.
As of March 31, 2017, Optimum residential customers were able to receive up to 608 digital channels and Suddenlink residential customers were able to receive up to 309 digital channels depending on their market and level of service. Optimum offers up to 171 HD channels and Suddenlink channel lineups include an average of 110 HD channels, which represent the most widely watched programming, including all major broadcast networks, as well as most leading national cable networks, premium channels and regional sports networks. HDTV features high-resolution picture quality, digital sound quality and a wide-screen, theater-like display when using an HDTV set and an HD-capable converter. We also continue to launch additional HD channels to continuously improve our customer's viewing experience. As of March 31, 2017, approximately 95% of our residential Optimum pay television customers subscribe to HDTV services. As of March 31, 2017, approximately 79% of Suddenlink pay television customers were digital pay television customers and approximately 93% of those digital pay television customers subscribe to HDTV services.
We also provide advanced services, such as pay-per-view and VOD, that give residential pay television subscribers control over when they watch their favorite programming. Our pay-per-view service allows customers to pay to view single showings of programming on an unedited, commercial-free basis, including feature films, live sporting events, concerts and other special events. Our VOD service provides on-demand access to movies, special events, free prime time content and general interest titles. Subscription-based VOD premium content such as HBO and Showtime is made available to customers who subscribe to one of our premium programming packages. Our customers have the ability to start the programs at whatever time is convenient, as well as pause, rewind and (for most content) fast forward both standard definition and HD VOD programming. As of March 31, 2017, pay-per-view services were available for all Optimum and 99% of Suddenlink pay television customers and VOD services were available to all of our Optimum pay television customers and 95% of our Suddenlink pay television customers, and we offered thousands of HD titles on-demand for Optimum and Suddenlink customers, respectively.
For a monthly fee, we offer DVR services through the use of digital converters, the majority of which are HDTV-capable and have video recording capability. As of March 31, 2017, approximately 49% of our residential Optimum pay television customers and 36% of our Suddenlink pay television
155
customers utilized DVR services. Optimum customers can choose either a set-top box DVR with the ability to record, pause and rewind live television or the Multi-Room DVR Plus with remote-storage capability to record 15 shows simultaneously while watching any live or pre-recorded show, and pause and rewind live television. Depending on the market, Suddenlink customers have the option to use a set-top box DVR or a TiVo HD/DVR converter, which delivers multi-room DVR capability using TiVo Mini devices that allow customers to pause and rewind live television, manage recordings from different television locations and play them back throughout the home. In addition, TiVo Stream service, which allows customers to stream live television channels and recorded programming wirelessly throughout their home to Android and iOS devices, and, subject to copyright restrictions, download previously recorded content to these devices so that it can be viewed outside the home, is provided to current TiVo DVR subscribers.
We also plan to introduce a new home communications hub during the second quarter of 2017, which will be the most advanced home communications hub offered by any Altice Group business. This new hub will be an innovative, integrated platform with a dynamic and sophisticated user interface, combining a set-top box, Internet router and cable modem in one device. It is based on LaBox, which Altice N.V. has successfully deployed in France, the Dominican Republic and Israel, and will be initially offered to customers subscribing to our triple-product packages. It will be capable of delivering broadband Internet, Wi-Fi, digital television services, OTT services and fixed-line telephony and will support 4K video and a remote-storage DVR with the capacity to record 15 television programs simultaneously and the ability to rewind live television on the last two channels watched. Additional features will include multiple storage tiers, a point-anywhere voice-command remote control and a companion mobile app that allows viewing of all television content including DVR streaming. Additional televisions will be paired with "minis," which will also act as Wi-Fi extenders for an advanced Wi-Fi experience throughout the home. Additionally, our new home communications hub and the "minis" will offer simple touch-to-pair capability for select mobile devices via near-field communications technology.
We also offer alternative viewing platforms for our pay television programming through mobile applications. Our Optimum customers have access to Optimum App, available for the iPad, iPhone, iPod touch, personal computers, Kindle Fire and select Android phones and tablets, and our Suddenlink customers have access to Suddenlink2GO, available for personal computers and select phones and tablets. Depending on the platform, the Optimum App features include the ability to watch live television, stream on-demand titles from various networks and use the device as a remote to control the customer's digital set-top box while inside the home. Suddenlink2GO enables Suddenlink customers to watch over 400,000 movies, shows and clips from over 380 networks on a personal computer once authenticated via the Suddenlink customer portal and select television shows and movies on their mobile devices.
Telephony Services
Through VoIP telephone service we also offer unlimited local, regional and long-distance calling within the United States, Puerto Rico, Virgin Islands and Canada for a flat monthly rate, including popular calling features such as caller ID with name and number, call waiting, three-way calling, enhanced emergency 911 dialing and television caller ID. We also offer additional options designed to meet our customers' needs, including directory assistance, voicemail services and international calling. Discount and promotional pricing are available when our telephony services are combined with our other service offerings.
Business Services
Both our Optimum and Suddenlink segments offer a wide and growing variety of products and services to both large enterprise and SMB customers, including broadband, telephony, networking and
156
pay television services. For the three months ended March 31, 2017, business services accounted for approximately 14% of the revenue for both our Optimum and Suddenlink segments, respectively, and accounted for approximately 14% of our consolidated revenue. As of the end of that period we served approximately 365,000 SMB customers. We serve enterprise customers primarily through our Lightpath business, a subsidiary of Optimum.
Enterprise Customers
Lightpath provides Ethernet, data transport, IP-based virtual private networks, Internet access, telephony services, including SIP trunking and VoIP services to the business market. Our Lightpath bandwidth connectivity service offers download speeds up to 100 Gbps. Lightpath also provides managed services to businesses, including hosted telephony services (cloud based SIP-based private branch exchange), managed Wi-Fi, managed desktop and server backup and managed collaboration services including audio and web conferencing. Through Lightpath, we also offer FTTT services to wireless carriers for cell tower backhaul and enable wireline communications service providers to connect to customers that their own networks do not reach. Lightpath's customers include companies in health care, financial, education, legal and professional services, and other industries, as well as the public sector and communication providers (ILECs and CLECs). As of March 31, 2017, Lightpath had over 8,500 locations connected to its fiber network. Our Lightpath advanced fiber optic network extends more than 6,800 route miles, which includes approximately 338,000 miles of fiber, throughout the New York metropolitan area.
For enterprise and larger commercial customers, Suddenlink offers high capacity data services, including wide area networking and dedicated data access and advanced services such as wireless mesh networks. Suddenlink also offers enterprise class telephone services which include traditional multi-line phone service over DOCSIS and trunking solutions via SIP for our Primary Rate Interface and SIP trunking applications. Similar to Lightpath, Suddenlink also offers FTTT services. These Suddenlink services are offered on a standalone basis or in bundles that are developed specifically for our commercial customers.
SMB Customers
Both our Optimum and Suddenlink segments provide broadband, pay television and telephony services to SMB customers. In addition to these services, we also offer managed services, including business e-mail, hosted private branch exchange, web space storage and network security monitoring for SMB customers. We also offer Optimum Voice for Business, providing for up to 24 voice lines for SMB customers and 20 business calling features at no additional charge. Optimum Voice for Business offers business trunking services with support for application programming interfaces. Optional add-on services, such as international calling, toll free calling and virtual receptionists, are also available for business customers.
Advertising Sales
As part of the agreements under which we acquire pay television programming, we typically receive an allocation of scheduled advertising time during such programming, generally two minutes per hour, into which our systems can insert commercials, subject, in some instances, to certain subject matter limitations. Our advertising sales infrastructure includes in-house production facilities, production and administrative employees and a locally-based sales force, and is part of Altice Media Solutions ("AMS"), the advertising sales division of Altice USA.
AMS offers data-driven television, digital and other multi-platform advertising to clients ranging from Fortune 500 brands to local businesses. AMS provides national and local businesses with television and digital advertising opportunities targeted within specific geographies, including in New
157
York City, the world's largest media and entertainment market as measured by 2014 revenue, and throughout the Suddenlink footprint. AMS offers clients opportunities to use interactive television products to reach their customers and provide a deeper level of audience engagement.
In several of the markets in which we operate, we have entered into agreements commonly referred to as interconnects with other cable operators to jointly sell local advertising, simplifying our clients' purchase of local advertising and expanding their geographic reach. In some of these markets, we represent the advertising sales efforts of other cable operators; in other markets, other cable operators represent us. For instance, AMS manages the New York Interconnect, a partnership between AMS and Comcast that provides national brands with television and digital advertising opportunities over a broader portion of the New York DMA than AMS's local offerings. New York Interconnect is the largest interconnect in the country, with a footprint of over 3.2 million households. In the larger DMAs in the Suddenlink footprint, we participate in a number of interconnects managed by others, such as the Houston and Dallas interconnects.
For the three months ended March 31, 2017, advertising sales accounted for approximately 4% and 3% of the revenue for our Optimum and Suddenlink segments, respectively, and accounted for approximately 4% of our consolidated revenue.
Data Analytics
The Advanced Data Analytics business, which was launched by Optimum in 2013, provides data-driven, audience-based advertising solutions to the media industry, including AMS, programmers and MVPDs. Total Audience Data, its flagship portfolio of products, consists of advanced analytics tools providing granular measurement of consumer groups, accurate hyper-local ratings and other insights into target audience behavior not available through traditional sample-based measurement services. These tools allow us and our clients to more precisely optimize our product offerings, target and deliver ads more efficiently, and provide accurate measurement to our clients and partners.
Our March 2017 acquisition of Audience Partners, a leading provider of data-driven, audience-based digital advertising solutions, expands the scope of targeted advertising solutions we offer from television to include digital, mobile and tablets. In addition, the acquisition expands our audience-based advertising services to include further advanced analytics tools within key and growing segments, including political, advocacy, healthcare, automotive, and programming. Altice N.V. recently announced an agreement to acquire Teads, a leading online video advertising marketplace, which we believe will further enhance our ability to offer data analytics and advertising solutions to our clients.
News 12 Networks
News 12 Networks is the largest and one of the most-watched 24-hour local news networks in the New York media market. Owned exclusively by us, the network consists of seven local news channels in the New York metropolitan area—the Bronx, Brooklyn, Connecticut, Hudson Valley, Long Island, New Jersey and Westchester—providing each with complete access to hyper-local breaking news, traffic, weather, sports, and more. In addition, News 12 Networks also includes five traffic and weather channels that offer constantly updated information; the award-winning News12.com, the premier destination for local news on the web; News 12 Interactive, channel 612 on Optimum TV, providing local news on demand; and News 12 To Go, the network's mobile app for phones and tablets. Since launching in 1986, News 12 Networks has been widely recognized by the news industry with numerous prestigious honors and awards, including over 230 Emmy Awards, plus multiple Edward R. Murrow Awards, NY Press Club Awards, and more. We derive revenue from our News 12 Networks for the sale of advertising and affiliation fees paid by cable operators. Advertising revenue is included in "Advertising" and affiliation fees charged for the programming are included in "Other."
158
Franchises
As of March 31, 2017, our systems operated in more than 1,300 communities pursuant to franchises, permits and similar authorizations issued by state and local governmental authorities. Franchise agreements typically require the payment of franchise fees and contain regulatory provisions addressing, among other things, service quality, cable service to schools and other public institutions, insurance and indemnity. Franchise authorities generally charge a franchise fee of not more than 5% of certain of our cable service revenues that are derived from the operation of the system within such locality. We generally pass the franchise fee on to our subscribers.
Franchise agreements are usually for a term of five to 15 years from the date of grant and most are 10 years. Franchise agreements are usually terminable only if the cable operator fails to comply with material provisions and then only after the franchising authority complies with substantive and procedural protections afforded by the franchise agreement and federal and state law. Prior to the scheduled expiration of most franchises, we generally initiate renewal proceedings with the granting authorities. This process usually takes less than three years but can take a longer period of time. The Communications Act of 1934, as amended (the "Communications Act"), which is the primary federal statute regulating interstate communications, provides for an orderly franchise renewal process in which granting authorities may not unreasonably withhold renewals. See "Regulation—Cable Television—Franchising." In connection with the franchise renewal process, many governmental authorities require the cable operator to make certain commitments, such as building out certain franchise areas, meeting customer service requirements and supporting and carrying public access channels.
Historically, we have been able to renew our franchises without incurring significant costs, although any particular franchise may not be renewed on commercially favorable terms or otherwise. We expect to renew or continue to operate under all or substantially all of these franchises. For more information regarding risks related to our franchises, see "Risk Factors—Risk Factors Relating to Regulatory and Legislative Matters—Our cable system franchises are subject to non-renewal or termination. The failure to renew a franchise in one or more key markets could adversely affect our business." Proposals to streamline cable franchising recently have been adopted at both the federal and state levels. For more information see "Regulation—Cable Television—Franchising."
Programming
We design our channel line-ups for each system according to demographics, programming contract requirements, market research, viewership, local programming preferences, channel capacity, competition, price sensitivity and local regulation. We believe offering a wide variety of programming influences a customer's decision to subscribe to and retain our pay television services. We obtain programming, including basic, expanded basic, digital, HD, VOD and broadband content, from a number of suppliers, including broadcast and cable networks.
We generally carry cable networks pursuant to written programming contracts, which continue for a fixed period of time, usually from three to five years, and are subject to negotiated renewal. Cable network programming is usually made available to us for a license fee, which is generally paid based on the number of customers who subscribe to the level of service that provides such programming. Such license fees may include "volume" discounts available for higher numbers of customers, as well as discounts for channel placement or service penetration. Where possible, we negotiate volume discount pricing structures. For home shopping channels, we receive a percentage of the revenue attributable to our customers' purchases, as well as, in some instances, incentives for channel placement.
We typically seek flexible distribution terms that would permit services to be made available in a variety of retail packages and on a variety of platforms and devices in order to maximize consumer choice. Suppliers typically insist that their most popular and attractive services be distributed to a minimum number or percentage of subscribers, which limits our ability to provide consumers full
159
purchasing flexibility. Suppliers also typically seek to control or limit the terms on which we are able to make their services available on various platforms and devices yet this has become more flexible each year.
Our cable programming costs have increased in excess of customary inflationary and cost-of-living type increases. We expect programming costs to continue to increase due to a variety of factors including annual increases imposed by stations and programmers and additional programming being provided to customers, including HD, digital and VOD programming. In particular, broadcast and sports programming costs have increased significantly over the past several years. In addition, contracts to purchase sports programming sometimes provide for optional additional programming to be available on a surcharge basis during the term of the contract. These increases have coincided with a significant increase in the quality of the programming, from high production value original cable series to enhanced camera and statistical data technology in sports broadcasts, and more flexible rights to make the content available on various platforms and devices.
We have programming contracts that have expired and others that will expire at or before the end of 2017. We will seek to renegotiate the terms of these agreements, but there can be no assurance that these agreements will be renewed on favorable or comparable terms. To the extent that we are unable to reach agreement with certain programmers on terms that we believe are reasonable, we have been, and may in the future be, forced to remove such programming channels from our line-up, which may result in a loss of customers. In our Suddenlink segment, we were unable to reach agreement with Viacom on acceptable economic terms for a long-term contract renewal, and effective October 1, 2014, all Viacom networks were removed from our channel lineups in our Suddenlink segment, and we launched alternative networks offered by other programmers under new long-term contracts. We and Viacom did not reach a new agreement to include certain Viacom networks in the Suddenlink channel lineup until May 2017. For more information, see "Risk Factors—Risk Factors Relating to Our Business—Programming and retransmission costs are increasing and we may not have the ability to pass these increases on to our subscribers. Disputes with programmers and the inability to retain or obtain popular programming can adversely affect our relationship with subscribers and lead to subscriber losses."
Sales and Marketing
Sales are managed centrally and multiple sales channels are leveraged to reach current and potential customers, including in-bound customer care centers, outbound telemarketing, stores, field technician sales and door-to-door sales. E-commerce is also managed centrally on behalf of the organization and is a growing and dynamic part of our business and is our fastest growing sales channel. For the three months ended March 31, 2017, 26% and 14% of our gross adds were via our online sales channel for Suddenlink and Optimum, respectively, compared to 16% and 4% for the three months ended March 31, 2016. We also use mass media, including broadcast television, digital media, radio, newspaper and outdoor advertising, to attract customers and direct them to our in-bound customer care centers or website. Our sales and service employees use a variety of sales tools as they work to match customers' needs with our best-in-class products, with a focus on building and enhancing customer relationships.
Because of our local presence and market knowledge, we invest heavily in targeted marketing. Our strategic focus is on building new customer relationships and bundling broadband, pay television and telephony services. Our promotional materials and message focus on the ease with which a customer can order our products and services, and highlight the differentiated connectivity and entertainment experience and the convenience of one call, one connection and one bill. Much of our advertising is developed centrally and customized for our regions. Among other factors, we monitor customer perceptions, marketing efforts and competition, to increase our responsiveness and the effectiveness of
160
our efforts. Our footprint has several large college markets where we market specialized products and services to students for MDUs, such as dormitories and apartment complexes.
We have separate dedicated sales teams for our SMB and enterprise offerings and dedicated service teams to support SMB and enterprise clients.
Altice Technical Services
The reorganization of our technical workforce into ATS, which is owned by Altice N.V., is modeled on Altice N.V.'s successful implementation of a similar strategy in its other operations. In most other markets in which Altice N.V. operates, it separates home installation, repair, outside plant maintenance and network construction elements of its operating companies into standalone services companies that provide these services to its operating companies and, in some cases, third parties. We and Altice N.V. believe this separation enables both businesses to be more focused and efficient in their core competencies, with Altice N.V.'s operating business enjoying financial savings and higher levels of customer satisfaction as a result of the tailored focus of the technical services business. In addition, we believe the installation, repair, outside plant maintenance and network construction services we receive from ATS will be of higher quality and at a lower cost than we could achieve without ATS, including for the construction of our new FTTH network.
Customer Experience
We believe customer service is the cornerstone of our business. Accordingly, we make a concerted effort to continually improve each customer's experience and have made significant investments in our people, processes and technology to enhance our customers' experience and to reduce the number of times customers need to contact us. The insights from operational metrics help us focus our improvement efforts. For example, we link internal sales incentives to early churn and product mix as opposed to more traditional criteria of new sales, in order to refocus our organization away from churn retention to churn prevention. The number of technical service calls handled by our representatives in March 2017 was 27% lower compared to March 2016 while the number of customer service calls and the number of service visits handled by our representatives was 23% and 20% lower, respectively, over the same period. See "Business—Our Business Strategy—Enhance the Customer Experience."
Our customer care centers are managed and operated locally, with the deployment and execution of end-to-end care strategies and initiatives conducted on a site-by-site basis. We have residential and commercial customer care centers located throughout our footprint, including in Newark, NJ; Jericho, NY; Bronx, NY; Melville, NY; Tyler, TX; Lubbock, TX; and Lake Havasu, AZ. Our customer care centers function as an integrated system and utilize software programs that provide increased efficiencies and limited wait-times for customers requiring support.
ATS' field technicians and schedulers utilize the same software programs for customers requiring in-person support. We provide service to our customers 24 hours a day, seven days a week, and we have systems that allow our customer care centers to be accessed and managed remotely in the event that systems functionality is temporarily lost, which provides our customers access to customer service with limited disruption.
We also utilize our customer portal to enable our customers to view and pay their bills online, obtain useful information and perform various equipment troubleshooting procedures. Our customers may also obtain support through our online chat, e-mail functionality and social media websites, including Twitter and Facebook.
161
Network Management
Our cable systems are generally designed with an HFC architecture that has proven to be highly flexible in meeting the increasing needs of our customers. We deliver our signals via laser-fed fiber optic cable from control centers known as headends and hubs to individual nodes. Each node is connected to the individual homes served by us. A primary benefit of this design is that it pushes fiber optics closer to our customers' homes, which allows us to subdivide our systems into smaller service groups and make capital investments only in service groups experiencing higher than average service growth.
As of March 31, 2017, approximately 96% of our basic pay television customers were served by systems with a capacity of at least 750 MHz and approximately 300 homes per node. Our Optimum network has been upgrated to nearly triple the maximum available broadband speeds and we have expanded our Gbps broadband service to approximately 60% of our Suddenlink footprint, compared to approximately 40% prior to the Suddenlink Acquisition. More than 99% of our residential broadband Internet customers are connected to our national backbone with a presence in major carrier access points in New York, Dallas, Chicago, San Jose, Washington D.C. and Phoenix. This presence allows us to avoid significant Internet transit costs by establishing peering relationships with major Internet service and content providers enabling direct connectivity with them at these access points.
Altice USA National Network Map
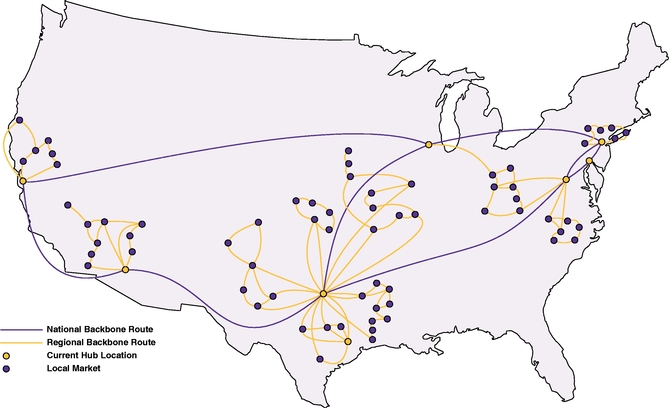
We also have a networking caching architecture that places highly viewed Internet traffic from the largest Internet-based content providers at the edge of the network closest to the customer to reduce bandwidth requirements across our national backbone, thus reducing operating expense. This collective network architecture also provides us with the capability to manage traffic across several Internet access points, thus helping to ensure Internet access redundancy and quality of service for our customers. Additionally, our national backbone connects most of our systems, which allows for an efficient and economical deployment of services from our centralized platforms that include telephone, VOD,
162
network DVR, common pay television content, broadband Internet, hosted business solutions, provisioning, e-mail and other related services.
We have also commenced a five-year plan to build a FTTH network, which will enable us to deliver more than 10 Gbps broadband speeds across our entire Optimum footprint and part of our Suddenlink footprint. We believe this FTTH network will be more resilient with reduced maintenance requirements, fewer service outages and lower power usage, which we expect will drive further structural cost efficiencies.
We have also focused on system reliability and disaster recovery as part of our national backbone and primary system strategy. For example, to help ensure a high level of reliability of our services, we implemented redundant power capability, as well as fiber route and carrier diversity in our networks serving most of our customers. With respect to disaster recovery, we invested in our telephone platform architecture for geo-redundancy to minimize downtime in the event of a disaster to any single facility. Additionally, we are working to implement a geo-redundant disaster recovery environment for our network operations center supporting both residential and business customers.
In addition, we have expanded and refined our bandwidth utilization in capacity constrained systems in order to meet demand for new and improved advanced services. A key component to reclaim bandwidth was the digital delivery of pay television channels that were previously distributed in analog through the launch of digital simulcast, which duplicates analog channels as digital channels. Additionally, the deployment of lower-cost digital customer premises equipment, such as HD digital transport adapters, enabled the use of more efficient digital channels instead of analog channels, thus allowing the reclamation of expanded basic analog bandwidth in the targeted systems. This reclaimed analog bandwidth could then be repurposed for other advanced services such as additional HDTV services and faster Internet access speeds. This technology has the added benefit of providing improved picture and sound quality to customers for most of their pay television programming.
Information Technology
Our IT systems consist of billing, customer relationship management, business and operational support and sales force management systems. We are updating and simplifying our IT infrastructure through further investments, focusing on cost efficiencies, improved system reliability, functionality and scalability and enhancing the ability of our IT infrastructure to meet our ongoing business objectives. Further, we have made significant progress in integrating and consolidating the IT platforms and systems and streamlining the processes of Optimum and Suddenlink, which has driven operating efficiencies. Additionally, through investment in our IT platforms and focus on process improvement, we have simplified and harmonized our service offering bundles, optimized our technical service delivery and improved customer service.
Suppliers
Customer Premise and Network Equipment
We purchase set-top boxes and other customer premise equipment from a limited number of vendors because each of our cable systems uses one or two proprietary technology architectures. We also buy HD, HD/DVRs and VOD equipment, routers, including the components of our new home communications hub, and other network equipment from a limited number of suppliers, including Altice Labs. See "Risk Factors—Risk Factors Relating to Our Business—We rely on network and information systems for our operations and a disruption or failure of, or defects in, those systems may disrupt our operations, damage our reputation with customers and adversely affect our results of operations."
163
Broadband and Telephone Connectivity
We deliver broadband and telephony services through our HFC network. We use circuits that are either owned by us or leased from third parties to connect to the Internet and the public switched telephone network. We pay fees for leased circuits based on the amount of capacity available to it and pay for Internet connectivity based on the amount of IP-based traffic received from and sent over the other carrier's network.
Competition
We operate in a highly competitive, consumer-driven industry and we compete against a variety of broadband, pay television and telephony providers and delivery systems, including broadband communications companies, wireless data and telephony providers, satellite delivered video signals, Internet-delivered video content and broadcast television signals available to residential and business customers in our service areas. We believe our leading market positions in our footprint, technologically advanced network infrastructure, including our FTTH build-out, our new home communications hub and our focus on enhancing the customer experience, consistent with the Altice Way, favorably position us to compete in our industry. See also "Risk Factors—Risk Factors Relating to Our Business—We operate in a highly competitive business environment which could materially adversely affect our business, financial condition, results of operations and liquidity."
Broadband Services Competition
Our broadband services face competition from broadband communications companies' DSL, FTTH and wireless broadband offerings as well as from a variety of companies that offer other forms of online services, including satellite-based broadband services. Current and future fixed and wireless Internet services, such as 3G, 4G and 5G fixed and wireless broadband services and Wi-Fi networks, and devices such as wireless data cards, tablets and smartphones, and mobile wireless routers that connect to such devices, may compete with our broadband services.
Pay Television Services Competition
We face intense competition from broadband communications companies with fiber-based networks, primarily Verizon, which has constructed a FTTH network plant that passes a significant number of households in our Optimum service area. We estimate that Verizon is currently able to sell a fiber-based pay television service, as well as broadband and VoIP services, to at least half of the households in our Optimum service area. In addition, Frontier offers pay television service in competition with us in most of our Connecticut service area.
We also compete with DBS providers, such as DirecTV (a subsidiary of AT&T Inc.) and DISH. DirecTV and DISH offer one-way satellite-delivered pre-packaged programming services that are received by relatively small and inexpensive receiving dishes. DirecTV has exclusive arrangements with the National Football League that give it access to programming that we cannot offer. AT&T also has an agreement to acquire Time Warner Inc., which owns a number of cable networks, including TBS, CNN and HBO, and Warner Bros. Entertainment, which produces television, film and home-video content. However, we believe cable-delivered VOD services, which include HD programming, offer a competitive advantage to DBS service because cable headends can provide two-way communication to deliver a large volume of programming which customers can access and control independently, whereas DBS technology can only make available a much smaller amount of programming with DVR-like customer control.
Our pay television services also face competition from a number of other sources, including companies that deliver movies, television shows and other pay television programming over broadband
164
Internet connections to televisions, computers, tablets and mobile devices, such as Hulu, iTunes, Amazon Prime, Netflix, YouTube, Playstation Vue, DirecTV Now and Sling TV.
Telephony Services Competition
Our telephony service competes with wireline, wireless and OTT phone providers, such as Vonage, Skype, GoogleTalk, Facetime, WhatsApp and magicJack, as well as companies that sell phone cards at a cost per minute for both national and international service. In addition, we compete with other forms of communication, such as text messaging on cellular phones, instant messaging, social networking services, video conferencing and email. The increase in the number of different technologies capable of carrying telephony services and the number of alternative communication options available to customers as well as the replacement of wireline services by wireless have intensified the competitive environment in which we operate our telephony services.
Business Services Competition
We operate in highly competitive business telecommunications market and compete primarily with local incumbent telephone companies, especially AT&T, CenturyLink, Frontier and Verizon, as well as from a variety of other national and regional business services competitors.
Advertising Sales Competition
We face intense competition for advertising revenue across many different platforms and from a wide range of local and national competitors. Advertising competition has increased and will likely continue to increase as new formats seek to attract the same advertisers. We compete for advertising revenue against, among others, local broadcast stations, national cable and broadcast networks, radio stations, print media and online advertising companies and content providers.
Properties
We own our headquarters building located in Bethpage, New York with approximately 558,000 square feet of space. In addition, we own or lease real estate throughout our operating areas where certain of our call centers, corporate facilities, business offices, earth stations, transponders, microwave towers, warehouses, headend equipment, hub sites, access studios and microwave receiving antennae are located.
Our principal physical assets consist of cable operating plant and equipment, including signal receiving, encoding and decoding devices, headend facilities, fiber optic transport networks, coaxial and distribution systems and equipment at or near customers' homes or places of business for each of the systems. The signal receiving apparatus typically includes a tower, antenna, ancillary electronic equipment and earth stations for reception of satellite signals. Headend facilities are located near the receiving devices. Our distribution system consists primarily of coaxial and fiber optic cables and related electronic equipment. Customer premise equipment consists of set-top devices, cable modems, Internet routers, wireless devices and media terminal adapters for telephone. Our cable plant and related equipment generally are attached to utility poles under pole rental agreements with local public utilities; although in some areas the distribution cable is buried in underground ducts or directly in trenches. The physical components of the cable systems require maintenance and periodic upgrading to improve system performance and capacity. In addition, we operate a network operations center that monitors our network 24 hours a day, seven days a week, helping to ensure a high quality of service and reliability for both our residential and commercial customers. We own most of our service vehicles.
We believe our properties, both owned and leased, are in good condition and are suitable and adequate for our operations.
165
Intellectual Property
We rely on our patents, copyrights, trademarks and trade secrets, as well as licenses and other agreements with our vendors and other parties, to use our technologies, conduct our operations and sell our products and services. We also rely on our access to the proprietary technology of Altice N.V., including Altice Labs. We believe we own or have the right to use all of the intellectual property that is necessary for the operation of our business as we currently conduct it.
Employees and Labor Relations
As of March 31, 2017, we had approximately 15,300 employees of which 217 were covered under collective bargaining agreements and an additional 96 were represented by a union. We believe our relations with employees are satisfactory.
Legal Proceedings
Cable Operations Litigation
In re Cablevision Consumer Litigation. Following expiration of the affiliation agreements for carriage of certain Fox broadcast stations and cable networks on October 16, 2010, News Corporation terminated delivery of the programming feeds to Optimum, and as a result, those stations and networks were unavailable on Optimum's cable television systems. On October 30, 2010, Optimum and Fox reached an agreement on new affiliation agreements for these stations and networks, and carriage was restored. Several purported class action lawsuits were subsequently filed on behalf of Optimum's customers seeking recovery for the lack of Fox programming. Those lawsuits were consolidated in an action before the U.S. District Court for the Eastern District of New York, and a consolidated complaint was filed in that court on February 22, 2011. Plaintiffs asserted claims for breach of contract, unjust enrichment, and consumer fraud, seeking unspecified compensatory damages, punitive damages and attorneys' fees. On March 28, 2012, the Court ruled on Optimum's motion to dismiss, denying the motion with regard to plaintiffs' breach of contract claim, but granting it with regard to the remaining claims, which were dismissed. On April 16, 2012, plaintiffs filed a second consolidated amended complaint, which asserts a claim only for breach of contract. Optimum's answer was filed on May 2, 2012. On October 10, 2012, plaintiffs filed a motion for class certification and on December 13, 2012, a motion for partial summary judgment. On March 31, 2014, the Court granted plaintiffs' motion for class certification, and denied without prejudice plaintiffs' motion for summary judgment. On May 30, 2014, the Court approved the form of class notice, and on October 7, 2014, approved the class notice distribution plan. The class notice distribution has been completed, and the opt-out period expired on February 27, 2015. Expert discovery commenced on May 5, 2014 and concluded on December 8 and 28, 2015, when the Court ruled on the pending expert discovery motions. On January 26, 2016, the Court approved a schedule for filing of summary judgment motions. Plaintiffs filed a motion for summary judgment on March 31, 2016. Optimum filed its own summary judgment motion on June 13, 2016. As of December 31, 2016, Optimum had an estimated liability associated with a potential settlement totaling $5.2 million. During the three months ended March 31, 2017, the Company recorded an additional liability of $0.8 million based on the ongoing negotiations with the plaintiffs. The parties have executed a binding term sheet memorializing a settlement agreement, including attorneys' fees, subject to entering into a long form agreement and Court approval. The amount ultimately paid in connection with a possible settlement could exceed the amount recorded.
Patent Litigation
Certain subsidiaries of the Company are named as defendants in certain lawsuits claiming infringement of various patents relating to various aspects of the Company's businesses. In certain of these cases other industry participants are also defendants. In certain of these cases the Company
166
expects that any potential liability would be the responsibility of the Company's and its subsidiaries' equipment vendors pursuant to applicable contractual indemnification provisions. The Company believes that the claims are without merit and intends to defend the actions vigorously, but is unable to predict the outcome of these lawsuits or reasonably estimate a range of possible loss.
Other Litigation
In addition to the matters discussed above and elsewhere in the prospectus, the Company is party to various lawsuits, some involving claims for substantial damages, in the ordinary course of business. Although the outcome of these other matters cannot be predicted and the impact of the final resolution of these other matters on the Company's results of operations in a particular subsequent reporting period is not known, management does not believe that the resolution of these other lawsuits will in the aggregate have a material adverse effect on the financial position of the Company or the ability of the Company to meet its financial obligations as they become due.
167
Our cable and related services are subject to a variety of federal, state and local law and regulations. The Communications Act, and the rules, regulations and policies of the FCC, as well as other federal and state laws governing cable television, communications, consumer protection, privacy and related matters, affect significant aspects of our cable system and services operations.
The following paragraphs describe the existing legal and regulatory requirements we believe are most significant to our cable system operations today. Our business can be dramatically impacted by changes to the existing regulatory framework, whether triggered by legislative, administrative or judicial rulings.
Cable Television
Franchising. The Communications Act requires cable operators to obtain a non-exclusive franchise from state or local franchising authorities to provide cable service. Although the terms of franchise agreements differ from jurisdiction to jurisdiction, they typically require payment of franchise fees and contain regulatory provisions addressing, among other things, use of the right of way, service quality, cable service to schools and other public institutions, insurance, indemnity and sales of assets or changes in ownership. State and local franchising authority, however, must be exercised consistent with the Communications Act, which sets limits on franchising authorities' powers, including limiting franchise fees to no more than 5% of gross revenues from the provision of cable service, prohibiting franchising authorities from requiring us to carry specific programming services, and protecting the renewal expectation of franchisees by limiting the factors a franchising authority may consider and requiring a due process hearing before denying renewal. Even when franchises are renewed, however, the franchise authority may, except where prohibited by applicable law, seek to impose new and more onerous requirements as a condition of renewal. Similarly, if a franchising authority's consent is required for the purchase or sale of a cable system, the franchising authority may attempt to impose more burdensome requirements as a condition for providing its consent. Cable franchises generally are granted for fixed terms and in many cases include monetary penalties for noncompliance. They may also be terminable if the franchisee fails to comply with material provisions.
The traditional cable franchising regime is undergoing significant change as a result of various federal and state actions. Several states have reduced or eliminated the role of local, municipal government in franchising in favor of state or system-wide franchises, and the trend has been toward consolidation of franchising authority at the state level, in part to accommodate the interests of new broadband and cable entrants over the last decade. At the same time, the FCC has adopted rules that streamline entry for new competitors (such as those affiliated with broadband communications companies) and reduce certain franchising burdens for these new entrants. The FCC adopted more modest relief for existing cable operators.
Pricing and Packaging. The Communications Act and the FCC's rules limit the scope of price regulation for cable television services. Among other limitations, franchising authorities may regulate rates for only "basic" cable service. In 2015, the FCC adopted an order (which is now under appeal) reversing its historic approach to this local rate regulation. Previously, rate regulation was in effect in a community unless and until a cable operator successfully petitioned the FCC for relief by showing the existence of "effective competition" (as defined under federal law) in the community. The FCC's 2015 Order reversed that presumption, barring franchise authority rate regulation absent an affirmative showing by the franchising authority that there is an absence of effective competition. As none of our franchise authorities have filed the necessary rate regulation certification, none of our pay television customers are currently subject to rate regulation. Our franchise authorities generally retain the right to certify an absence of effective competition in the future, but the 2015 Order (unless overturned) should make it more difficult for the franchise authorities to do so.
168
There have been frequent calls to impose further rate regulation on the cable industry. It is possible that Congress or the FCC may adopt new constraints on the retail pricing or packaging of cable programming. For example, there has been legislative and regulatory interest in requiring cable operators to offer historically bundled programming services on an à la carte basis. In addition, the FCC recently initiated a proceeding exploring how programming practices involving MVPDs affect the availability of diverse and independent programming. As we attempt to respond to a changing marketplace with competitive marketing and pricing practices, we may face regulations that impede our ability to compete.
Must-Carry/Retransmission Consent. Cable operators are required to carry, without compensation, programming transmitted by most local commercial and noncommercial broadcast television stations that elect "must carry" status.
Alternatively, local commercial broadcast television stations may elect "retransmission consent," giving up their must-carry right and instead negotiating with cable systems the terms on which the cable systems may carry the station's programming content. Cable systems generally may not carry a broadcast station that has elected retransmission consent without the station's consent. The terms of retransmission consent agreements frequently include the payment of compensation to the station.
Broadcast stations must elect "must carry" or retransmission consent every three years. A substantial number of local broadcast stations currently carried by our cable systems have elected to negotiate for retransmission consent. In the most recent retransmission consent negotiations, popular television stations have demanded substantial compensation increases, thereby increasing our operating costs.
Ownership Limitations. Federal regulation of the communications field traditionally included a host of ownership restrictions, which limited the size of certain media entities and restricted their ability to enter into competing enterprises. Through a series of legislative, regulatory, and judicial actions, most of these restrictions have been either eliminated or substantially relaxed. Changes in this regulatory area could alter the business environment in which we operate.
Set-Top Boxes. The Communications Act includes a provision that requires the FCC to take certain steps to support the development of a retail market for "navigation devices," such as cable set-top boxes. As a result, the FCC has adopted certain mandates, from time to time, to require cable operators to accommodate third party navigation devices, sometimes imposing substantial development and operating requirements on the industry. In 2016, the FCC undertook an additional rulemaking aimed at extending some of these mandates to require that MVPDs accommodate third party applications would allow access MVPD video content without the need for a set-top box and without using or accessing an MVPDs user interface. While that effort has not advanced, the FCC may in the future consider implementing similar measures to promote the competitive availability of retail set-top boxes or third party navigation options that could impact our customers' experience, our ability to capture user interactions to refine and enhance our services, and our ability to provide a consistent customer support environment.
PEG and Leased Access. Franchising authorities may require that we support the delivery and support for public, educational, or governmental ("PEG") channels on our cable systems. In addition to providing PEG channels, we must make a limited number of commercial leased access channels available to third parties (including parties with potentially competitive pay television services) at regulated rates. The FCC adopted revised rules several years ago mandating a significant reduction in the rates that operators can charge commercial leased access users. These rules were stayed, however, by a federal court, pending a cable industry appeal. This matter currently remains pending, and the revised rules are not yet in effect. Although commercial leased access activity historically has been
169
relatively limited, increased activity in this area could further burden the channel capacity of our cable systems.
Pole Attachments. The company makes extensive use of utility poles and conduit owned by other utilities to attach and install the facilities that are integral to our network and services. The Communications Act requires most utilities to provide cable systems with access to poles and conduits for access to attach such facilities at regulated rates. States (or, where states choose not to regulate, the FCC) regulate utility company rates for the rental of pole and conduit space used by companies, including operators like us, to provide cable, telecommunications services, and Internet access services, unless states establish their own regulations in this area. Many states in which we operate have elected to set their own pole attachment rules.
In 2011 and again in 2015, the FCC amended its pole attachment rules to promote broadband deployment. The 2011 order allows for new penalties in certain cases involving unauthorized attachments, but generally strengthens the cable industry's ability to access investor-owned utility poles on reasonable rates, terms and conditions. Additionally, the 2011 order reduces the federal rate formula previously applicable to "telecommunications" attachments to closely approximate the more favorable rate formula applicable to "cable" attachments. The 2015 Order (which is now under appeal) continues this rate reconciliation, effectively closing a remaining "loophole" that potentially allowed for significantly higher rates for telecommunications attachments in certain scenarios. Neither the 2011 order nor the 2015 Order directly affects the rate in states that self-regulate (rather than allowing the FCC to regulate) pole rates, but many of those states have substantially the same rate for cable and telecommunications attachments. Adverse changes to the pole attachment rate structure, rate, and classifications could significantly increase our annual pole attachment costs.
Program Access. The program access rules generally prohibit a cable operator from improperly influencing an affiliated satellite-delivered cable programming service to discriminate unfairly against an unaffiliated distributor where the purpose or effect of such influence is to significantly hinder or prevent the competitor from providing satellite-delivered cable programming. FCC rules also allow a competing distributor to bring a complaint against a cable-affiliated terrestrially-delivered programmer or its affiliated cable operator for alleged violations of this rule, and seek reformed terms of carriage as remedy.
Program Carriage. The FCC's program carriage rules prohibit us from requiring that an unaffiliated programmer grant us a financial interest or exclusive carriage rights as a condition of its carriage on our cable systems and prohibit us from unfairly discriminating against unaffiliated programmers in the terms and conditions of carriage on the basis of their nonaffiliation.
On October 12, 2011, Game Show Network ("GSN") filed a program carriage complaint against Optimum, alleging that we discriminated against it in the terms and conditions of carriage based on GSN's lack of affiliation with us. Although the Enforcement Bureau of the FCC recommended on October 15, 2015, that the administrative law judge adjudicating this dispute find in our favor because GSN had not satisfied its burden of proving that we discriminated against it on the basis of affiliation, the administrative law judge issued his initial decision in GSN's favor on November 23, 2016, requiring that we restore GSN to the expanded basic tier. We have appealed this decision to the FCC and are seeking to delay implementation of the remedy ordered by the administrative law judge pending resolution of the appeal. We believe GSN's claims are without merit and we are defending ourselves vigorously.
Exclusive Access to Multitenant Buildings. The FCC has prohibited cable operators from entering into or enforcing exclusive agreements with owners of multitenant buildings under which the operator is the only MVPD with access to the building.
170
CALM Act. The FCC's rules require us to ensure that all commercials carried on our cable service comply with specified volume standards.
Privacy and Data Security. In the course of providing our services, we collect certain information about our subscribers and their use of our services. We also collect certain information regarding potential subscribers and other individuals. Our collection, use, disclosure and other handling of information is subject to a variety of federal and state privacy requirements, including those imposed specifically on cable operators and telecommunications service providers by the Communications Act. We are also subject to data security obligations, as well as requirements to provide notice to individuals and governmental entities in the event of certain data security breaches, and such breaches, depending on their scope and consequences, may lead to litigation and enforcement actions with the potential of substantial monetary forfeitures or to adversely affect our brand.
As cable operators provide interactive and other advanced services, additional privacy and data security requirements may arise through legislation, regulation or judicial decisions. For example, the Video Privacy Protection Act of 1988 has been extended to cover online interactive services through which customers can buy or rent movies. In addition, Congress, the FTC, and other lawmakers and regulators are all considering whether to adopt additional measures that could impact the collection, use, and disclosure of subscriber information in connection with the delivery of advertising and other services to consumers customized to their interests. In October 2016, the FCC adopted new privacy and data security rules governing the use of customer information by broadband ISPs, including cable ISPs and providers of VoIP. These new rules permit the collection and use of non-sensitive customer information subject to the customers' ability to opt out, but require the customers' opt-in before access, use or disclosure of sensitive proprietary information. These new rules are more stringent than the FTC's privacy standards. The FCC suspended the data security portion of these rules in February. In March, both houses of Congress voted to overturn all of the rules. This legislation was signed by the President in April and it is now effective.
Federal Copyright Regulation. We are required to pay copyright royalty fees on a semi-annual basis to receive a statutory compulsory license to carry broadcast television content. These fees are subject to periodic audit by the content owners. The amount of a cable operator's royalty fee payments are determined by a statutory formula that takes into account various factors, including the amount of "gross receipts" received from subscribers for "basic" service, the number of "distant" broadcast signals carried and the characteristics of those distant signals (e.g., network, independent or noncommercial). Certain elements of the royalty formula are subject to adjustment from time to time, which can lead to increases in the amount of our semi-annual royalty payments. The U.S. Copyright Office, which administers the collection of royalty fees, has made recommendations to Congress for changes in or elimination of the statutory compulsory licenses for cable television carriage of broadcast signals and the U.S. Government Accountability Office is conducting a statutorily-mandated inquiry into whether the cable compulsory license should be phased out. Changes to copyright regulations could adversely affect the ability of our cable systems to obtain such programming, and could increase the cost of such programming. Similarly, we must obtain music rights for locally originated programming and advertising from the major music performing rights organizations. These licensing fees have been the source of litigation in the past, and we cannot predict with certainty whether license fee disputes may arise in the future.
Access for Persons with Disabilities. The FCC's rules require us to ensure that persons with disabilities can more fully access the programming we carry. We are required to provide closed captions and pass through video description to subscribers on some networks we carry, and to provide an easy means of activating closed captioning and to ensure the audio accessibility of emergency information navigation capabilities of our video offerings.
171
Other Regulation. We are subject to various other regulations, including those related to political broadcasting; home wiring; the blackout of certain network and syndicated programming; prohibitions on transmitting obscene programming; limitations on advertising in children's programming; and standards for emergency alerts, as well as telemarketing and general consumer protection laws and equal employment opportunity obligations. The FCC also imposes various technical standards on our operations. In the aftermath of Superstorm Sandy, the FCC and the states are examining whether new requirements are necessary to improve the resiliency of communications networks, potentially including cable networks. Each of these regulations restricts our business practices to varying degrees. The FCC can aggressively enforce compliance with its regulations and consumer protection policies, including the imposition of substantial monetary sanctions. It is possible that Congress or the FCC will expand or modify its regulations of cable systems in the future, and we cannot predict at this time how that might impact our business.
Broadband
Regulatory Classification. Broadband Internet access services were traditionally classified by the FCC as "information services" for regulatory purposes, a type of service that is subject to a lesser degree of regulation than "telecommunications services." In 2015, the FCC reversed this determination and classified broadband Internet access services as "telecommunications services." This reclassification has subjected our broadband Internet access service to greater regulation, although the FCC did not apply all telecommunications service obligations to broadband Internet access service. The 2015 Order has been upheld by a panel of United States Court of Appeals for the District of Columbia, although the order remains on appeal before that court sitting en banc. The 2015 Order could have a material adverse impact on our business as it may justify additional FCC regulation or support efforts by States to justify additional regulation of broadband Internet access services.
Net Neutrality. On February 26, 2015, the FCC adopted a new "Open Internet" framework that expanded disclosure requirements on ISPs, prohibited blocking, throttling, and paid prioritization of Internet traffic on the basis of the content, and imposed a "general conduct standard" that prohibits unreasonable interference with the ability of end users and edge providers to reach each other.
Access for Persons with Disabilities. The FCC's rules require us to ensure that persons with disabilities have access to "advanced communications services" ("ACS"), such as electronic messaging and interoperable video conferencing. They also require that certain pay television programming delivered via Internet Protocol include closed captioning and require entities distributing such programming to end users to pass through such captions and identify programming that should be captioned.
Other Regulation. The 2015 Order also subjected broadband providers' Internet traffic exchange rates and practices to potential FCC oversight and created a mechanism for third parties to file complaints regarding these matters. In addition, our provision of Internet services also subjects us to the limitations on use and disclosure of user communications and records contained in the Electronic Communications Privacy Act of 1986. Broadband Internet access service is also subject to other federal and state privacy laws applicable to electronic communications.
Additionally, providers of broadband Internet access services must comply with CALEA, which requires providers to make their services and facilities accessible for law enforcement intercept requests. Various other federal and state laws apply to providers of services that are accessible through broadband Internet access service, including copyright laws, telemarketing laws, prohibitions on obscenity, and a ban on unsolicited commercial e-mail, and privacy and data security laws. Online content we provide is also subject to some of these laws.
172
Other forms of regulation of broadband Internet access service currently being considered by the FCC, Congress or state legislatures include consumer protection requirements, cyber security requirements, consumer service standards, requirements to contribute to universal service programs and requirements to protect personally identifiable customer data from theft. Pending and future legislation in this area could adversely affect our operations as an Internet service provider and our relationship with our Internet customers.
Additionally, from time to time the FCC and Congress have considered whether to subject broadband Internet access services to the federal Universal Service Fund ("USF") contribution requirements. Any contribution requirements adopted for Internet access services would impose significant new costs on our broadband Internet service. At the same time, the FCC is changing the manner in which Universal Service funds are distributed. By focusing on broadband and wireless deployment, rather than traditional telephone service, the changes could assist some of our competitors in more effectively competing with our service offerings
VoIP Services
We provide telephony services using VoIP technology ("interconnected VoIP"). The FCC has adopted several regulations for interconnected VoIP services, as have several states, especially as it relates to core customer and safety issues such as e911, local number portability, disability access, outage reporting, universal service contributions, and regulatory reporting requirements. The FCC has not, however, formally classified interconnected VoIP services as either information services or telecommunications services. In this vacuum, some states have asserted more expansive rights to regulate interconnected VoIP services, while others have adopted laws that bar the state commission from regulating VoIP service.
Universal Service. Interconnected VoIP services must contribute to the USF used to subsidize communication services provided to low income households, to customers in rural and high cost areas, and to schools, libraries, and rural health care providers. The amount of universal service contribution required of interconnected VoIP service providers is based on a percentage of revenues earned from interstate and international services provided to end users. We allocate our end user revenues and remit payments to the universal service fund in accordance with FCC rules. The FCC has ruled that states may impose state universal service fees on interconnected VoIP providers.
Local Number Portability. The FCC requires interconnected VoIP service providers and their "numbering partners" to ensure that their customers have the ability to port their telephone numbers when changing providers. We also contribute to federal funds to meet the shared costs of local number portability and the costs of North American Numbering Plan Administration.
Intercarrier Compensation. In an October 2011 reform order and subsequent clarifying orders, the FCC revised the regime governing payments among providers of telephony services for the exchange of calls between and among different networks ("intercarrier compensation") to, among other things, explicitly include interconnected VoIP. In that Order, the FCC determined that intercarrier compensation for all terminating traffic, including VoIP traffic exchanged in TDM format, will be phased down over several years to a "bill-and-keep" regime, with no compensation between carriers for most terminating traffic by 2018.
Other Regulation. Interconnected VoIP service providers are required to provide enhanced 911 emergency services to their customers; protect customer proprietary network information from unauthorized disclosure to third parties; report to the FCC on service outages; comply with telemarketing regulations and other privacy and data security requirements; comply with disabilities access requirements and service discontinuance obligations; comply with call signaling requirements; and comply with CALEA standards. In August 2015, the FCC adopted new rules to improve the
173
resiliency of the communications network. Under the new rules, providers of telephony services, including interconnected VoIP service providers, must make available eight hours of standby backup power for consumers to purchase at the point of sale. The rules also require that providers inform new and current customers about service limitations during power outages and steps that consumers can take to address those risks.
Telephony Services
We operate traditional telecommunications services under the trade name Optimum Lightpath in various state subsidiaries, and those services are largely governed under rules established for CLECs under the Communications Act. The Communications Act entitles our CLEC subsidiaries to certain rights, but as telecommunications carriers, it also subjects them to regulation by the FCC and the states. Their designation as telecommunications carriers also results in other regulations that may affect them and the services they offer.
Interconnection and Intercarrier Compensation. The Communications Act requires telecommunications carriers to interconnect directly or indirectly with other telecommunications carriers. Under the FCC's intercarrier compensation rules, we are entitled, in some cases, to compensation from carriers when they use our network to terminate or originate calls and in other cases are required to compensate another carrier for using its network to originate or terminate traffic. The FCC and state regulatory commissions, including those in the states in which we operate, have adopted limits on the amounts of compensation that may be charged for certain types of traffic. As noted above, the FCC has determined that intercarrier compensation for all terminating traffic will be phased down over several years to a "bill-and-keep" regime, with no compensation between carriers for most terminating traffic by 2018.
Universal Service. Our CLEC subsidiaries are required to contribute to the USF. The amount of universal service contribution required of us is based on a percentage of revenues earned from interstate and international services provided to end users. We allocate our end user revenues and remit payments to the universal service fund in accordance with FCC rules. The FCC has ruled that states may impose state universal service fees on CLEC telecommunications services.
Other Regulation. Our CLEC subsidiaries' telecommunications services are subject to other FCC requirements, including protecting the use and disclosure of customer proprietary network information; meeting certain notice requirements in the event of service termination; compliance with disabilities access requirements; compliance with CALEA standards; outage reporting; and the payment of fees to fund local number portability administration and the North American Numbering Plan. As noted above, the FCC and states are examining whether new requirements are necessary to improve the resiliency of communications networks. Communications with our customers are also subject to FCC, FTC and state regulations on telemarketing and the sending of unsolicited commercial e-mail and fax messages, as well as additional privacy and data security requirements.
State Regulation. Our CLEC subsidiaries' telecommunications services are subject to regulation by state commissions in each state where we provide services. In order to provide our services, we must seek approval from the state regulatory commission or be registered to provide services in each state where we operate and may at times require local approval to construct facilities. Regulatory obligations vary from state to state and include some or all of the following requirements: filing tariffs (rates, terms and conditions); filing operational, financial, and customer service reports; seeking approval to transfer the assets or capital stock of the broadband communications company; seeking approval to issue stocks, bonds and other forms of indebtedness of the broadband communications company; reporting customer service and quality of service requirements; outage reporting; making contributions to state universal service support programs; paying regulatory and state Telecommunications Relay Service and E911 fees; geographic build-out; and other matters relating to competition.
174
Other Services
We may provide other services and features over our cable system, such as games and interactive advertising that may be subject to a range of federal, state and local laws such as privacy and consumer protection regulations. We also maintain various websites that provide information and content regarding our businesses. The operation of these websites is also subject to a similar range of regulations.
Environmental Regulations
Our business operations are subject to environmental laws and regulations, including regulations governing the use, storage, disposal of, and exposure to, hazardous materials, the release of pollutants into the environment and the remediation of contamination. In part as a result of the increasing public awareness concerning the importance of environmental regulations, these regulations have become more stringent over time. Amended or new regulations could impact our operations and costs.
175
Our current directors are Dexter Goei, Charles Stewart, Abdelhakim Boubazine and Lisa Rosenblum. The following table sets forth the names, ages as of March 31, 2017, and positions of the individuals who are expected to constitute our directors and executive officers as of our listing on the NYSE.
Name
|
Age | Position | ||
|---|---|---|---|---|
| Dexter Goei | 45 | Chairman, Chief Executive Officer and Director | ||
| Michel Combes | 55 | Director nominee | ||
| Dennis Okhuijsen | 46 | Director nominee | ||
| Jérémie Bonnin | 42 | Director nominee | ||
| Raymond Svider | 54 | Director nominee | ||
| Mark Mullen | 52 | Director nominee | ||
| Charles Stewart | 47 | Co-President and Chief Financial Officer | ||
| Abdelhakim Boubazine | 41 | Co-President and Chief Operating Officer | ||
| Lisa Rosenblum | 62 | Vice Chairman | ||
| David Connolly | 45 | Executive Vice President and General Counsel |
Dexter Goei has served as Chairman and Chief Executive Officer of Altice USA since 2016 and President of the Board of Directors of Altice N.V. since 2016. Mr. Goei joined the Altice Group as Chief Executive Officer in 2009, helping to lead its development and growth from a French cable operator to a multinational telecoms operator with fixed and mobile assets across 6 different territories serving both residential and enterprise clients. Prior to joining the Altice Group, Mr. Goei spent 15 years in investment banking first with JP Morgan and then Morgan Stanley in their Media & Communications Group in New York, Los Angeles and London. Prior to that, he was Co-Head of Morgan Stanley's European Media & Communications Group when he left to join Altice. Mr. Goei is a graduate of Georgetown University's School of Foreign Service with cum laude honors.
Michel Combes is expected to join Altice USA as a director immediately prior to our listing date on the NYSE. Mr. Combes has served as CEO of the Altice Group since 2016, having rejoined the Altice Group in August 2015 as COO after stepping down as a Non-Executive Board Member in May 2015. Previously, Mr. Combes was CEO of Alcatel-Lucent, European CEO of Vodafone and a non-executive director at Vodafone PLC, Chairman and CEO of TDF, CFO and Senior Executive Vice President of France Telecom, non-executive director and later chairman of the supervisory board of ASSYSTEM and director of ISS. Currently, Mr. Combes holds a position as member of the board of directors at Mobile TeleSystems PJSC and as non-executive director at HDL Development. Mr. Combes has more than 25 years of experience in the telecommunication industry. He is a graduate of the Ecole Polytechnique and the Paris Telecoms School.
Dennis Okhuijsen is expected to join Altice USA as a director immediately prior to our listing date on the NYSE. He joined the Altice Group in September 2012 as the CFO. Before joining the Altice Group, he was a Treasurer for Liberty Global since 2005. From 1993 until 1996 he was a senior accountant at Arthur Andersen. Mr. Okhuijsen joined UPC in 1996 where he was responsible for accounting, treasury and investor relations up to 2005. His experience includes raising and maintaining non-investment grade capital across both the loan markets as well as the bond/equity capital market. In his previous capacities he was also responsible for financial risk management, treasury and operational financing. He holds a Master of Business Economics of the Erasmus University Rotterdam.
Jérémie Bonnin is expected to join Altice USA as a director immediately prior to our listing date on the NYSE. He is the representative of A4 S.A. on the Altice N.V. board of directors and he is General Secretary of Altice N.V., which he joined in May 2005 as Corporate Finance director. Before joining Altice N.V., he was a Manager in the Transaction Services department at KPMG, which he
176
joined in 1998. Since his appointment at Altice N.V., he has been involved in all of the Altice Group's acquisitions which have increased its footprint (in France, Belgium, Luxembourg, Switzerland, Israel, the French Overseas Territories, the Dominican Republic, Portugal and the United States). He has a long track record of successful cross-border transactions, and in financial management within the telecom sector. Mr Bonnin received his engineering degree from the Institut d'Informatique d'Entreprises in France in 1998. He also graduated from the DECF in France (an equivalent to the CPA) in 1998.
Raymond Svider is expected to join Altice USA as a director immediately prior to our listing date on the NYSE. Mr. Svider is the Co-Chairman and a Managing Partner of BC Partners. He joined the firm in 1992 and is currently based in New York. Over the years, Mr. Svider has participated and led investments in a number of sectors including TMT, healthcare, industrials, business services, consumer and retail. He is currently Non-Executive Chairman of PetSmart, Chairman of the Board of Accudyne Industries, and also serves on the boards of Intelsat (NYSE "I") and Teneo Global. Mr. Svider previously served as a Director of Office Depot, Multiplan, Unity Media, Neuf Cegetel, Polyconcept, Neopost, Nutreco, UTL and Chantemur. Mr. Svider received an MBA from the University of Chicago and an MS in Engineering from both Ecole Polytechnique and Ecole Nationale Superieure des Telecommunications in France.
Mark Mullen is expected to join Altice USA as a director immediately prior to our listing date on the NYSE. Mr. Mullen is co-founder and Managing Director of Bonfire Ventures, founded in 2017. Mr. Mullen also founded Double M Partners in 2012 and has since served as Managing Partner. Both Bonfire and Double M manage early stage capital funds in Los Angeles. Mr. Mullen also founded Mull Capital in 2005, an evergreen fund that invests directly in startups and in other investment funds. All of the funds focus on investing in internet, media and technology with primary emphasis on business to business solutions, security and software. Prior to Double M Partners, Mr. Mullen served as COO of the City of Los Angeles (Economic Policy) and Senior Advisor to the then-Mayor Antonio Villaraigosa where he oversaw several of the City's assets including the LA International Airport (LAX), LA Convention Center, the Planning and Building & Safety Departments, as well as the Office of Small Business Services. From 1993-2007, Mr. Mullen ran the international M&A and private equity group for Daniels & Associates, an investment bank focused on the cable TV and broadband industry. Mr. Mullen was a senior partner of Daniels when it was acquired by RBC Capital Markets in 2007 where he stayed until 2010 as Managing Director. Mr. Mullen earned his BSBA with cum laude honors from the University of Denver in 1986 and earned his MBA in international business from the Thunderbird School of Global Management in 1992.
Charles Stewart has served as co-President and Chief Financial Officer of Altice USA since 2015. Mr. Stewart joined Altice USA after 21 years of corporate, finance and investment banking experience in the United States, Latin America and Europe. Most recently, Mr. Stewart served as Chief Executive Officer of Itau BBA International plc from 2013 to 2015, where he oversaw Itau-Unibanco's wholesale banking activities in Europe, the United States and Asia. Prior to that, he spent nineteen years at Morgan Stanley as an investment banker in various roles, including 9 years focusing on the U.S. cable, broadcast and publishing industries. Mr. Stewart also acted as Deputy Head of Investment Banking for EMEA and was a member of the global investment banking management committee. Mr. Stewart is a graduate of Yale University.
Abdelhakim Boubazine has served as co-President and Chief Operating Officer of Altice USA since 2016. He joined the Altice Group in 2014 as CEO of Altice in the Dominican Republic. There he oversaw cable television, broadband and mobile operations, serving more than 4 million customers. Prior to Altice, Mr. Boubazine was CEO of ERT, a company specializing in the design, construction and operation of the latest-generation cable and fiber networks in France, Belgium, Luxembourg and the French West Indies and which was one of the main sub-contractors of Altice in these regions. Prior to joining the telecommunications industry, he had an international career of more than 10 years in the
177
oil and gas industry, where he occupied various operations, business and senior management roles in Europe, Asia, North America, Africa and the Middle East. Mr. Boubazine holds an engineering degree from the École Centrale de Lyon and a master's degree in Theoretical Physics from the University of Strasbourg. He is also a post-graduate in Petroleum Engineering & Management from Imperial College of London.
Lisa Rosenblum is Vice Chairman of Altice USA. In this role, she is responsible for helping to shape corporate strategy on all legislative, regulatory and public policy activities and related business matters, as well as for establishing our presence with government, in the marketplace and the communities we serve. Most recently, Ms. Rosenblum served as Executive Vice President and General Counsel, with responsibility for all legal, government relations and public and community affairs for Altice USA. She joined Optimum in 1996, and prior to the Optimum Acquisition she held the position of Executive Vice President, Government and Public Affairs, where she was responsible for directing the company's local, state and federal government relations, as well as all legislative, regulatory and policy matters. Ms. Rosenblum currently serves on the Board of Directors of Citymeals-on-Wheels in New York City, an organization devoted to serving the elderly. Ms. Rosenblum holds a B.A., cum laude, from Yale University and a J.D. from the Connecticut School of Law, where she served as an editor of the Law Review.
David Connolly is Executive Vice President and General Counsel of Altice USA. In this role he is responsible for all legal affairs for Altice USA. Previously, Mr. Connolly was a Mergers & Acquisitions partner at Shearman & Sterling LLP, where he advised Altice N.V. on the Optimum Acquisition. While at Shearman & Sterling LLP, he represented multinational corporations, financial institutions and professional sports franchises in a wide variety of matters. Mr. Connolly holds a B.A. from the College of the Holy Cross and a J.D. from Fordham University School of Law.
Background and Experience of Nominated Directors
When considering whether each of our director nominees has the experience, qualifications, attributes and skills, taken as a whole, to assist our board of directors in satisfying its oversight responsibilities effectively in light of our business and structure, our board of directors focused primarily on the biographical information for Messrs. Combes, Okhuijsen, Bonnin, Svider and Mullen set forth above. Additionally, our board of directors considered each of our nominated directors' experience in successfully implementing and executing on the principles of the Altice Way coupled with their extensive industry expertise. Our board of directors also considered the accounting and financial backgrounds of Messrs. Combes, Okhuijsen, Bonnin, Svider and Mullen. Each of our director nominees possesses high ethical standards, acts with integrity and exercises careful, mature judgment. Each of them is committed to employing his skills and abilities to aid the long-term interests of our stakeholders and have each displayed leadership that is emblematic of the experience, qualifications and skills that we look for in our directors.
Composition and Meetings of our Board of Directors
Upon the completion of this offering our board of directors will consist of six members, two of whom qualify as "independent" under NYSE rules. We will have one vacancy on our board of directors upon the completion of this offering and intend to fill such vacancy with an independent director within one year of our listing date on the NYSE. Our amended and restated certificate of incorporation that will be in effect on the closing of this offering will provide that our board of directors must consist of no less than seven members and no more than twelve. Our amended and restated certificate of incorporation will give our board of directors the ability to increase or decrease the number of sitting directors within this range and to fill any vacancies or newly created directorships created if the number of directors is expanded. Any increase or decrease in the outer limits of this range requires approval by our stockholders.
178
Our amended and restated certificate of incorporation will require a majority of the number of directors then in office but not less than one third of the then authorized number of directors comprising the entire board to constitute a quorum, and such majority must include the director designated pursuant to the stockholders' agreement by A4 S.A. and the President of the Altice N.V. board of directors designated to our board of directors pursuant to the stockholders' agreement by Altice N.V. The stockholders' agreement will further provide that our board of directors will be required to invite a member of the Group Advisory Council of Altice N.V., to be designated by the Group Advisory Council of Altice N.V., to each board meeting in an observer capacity. The stockholders and registration rights agreement that we expect to enter into with Altice N.V., BCP and CPPIB in connection with this offering will also give each of the Sponsors the right to designate one non-voting board observer for so long as such Sponsor and certain of its affiliates own a certain percentage of the issued and outstanding shares of Class A and Class B common stock and there is no director who is a designee of such Sponsor on our board of directors. See "Certain Relationships and Related-Party Transactions—Stockholders' Agreement" and "—Stockholders and Registration Rights Agreement."
Controlled Company
We have been approved to list our Class A common stock on the NYSE. Because following this offering Altice N.V. will control shares representing a majority of the voting power of our outstanding common stock, we will be a "controlled company" under the NYSE corporate governance rules. As a controlled company, we are eligible for exemptions from some of the requirements of these rules, including:
- •
- the requirement that a majority of our board of directors consist of independent directors;
- •
- the requirement that we have a governance and nominating committee; and
- •
- the requirement that the compensation of our executive officers be determined, or recommended to our board of directors for determination, by a compensation committee comprised solely of independent directors with a written charter addressing the committees' purpose and responsibilities.
Consistent with these exemptions, upon listing with the NYSE we do not intend to have (i) a majority of independent directors on our board of directors; (ii) a fully independent compensation committee; or (iii) a nominating and governance committee. The responsibilities that would otherwise be undertaken by a nominating and governance committee will be undertaken by the full board of directors, or at its discretion, by a special committee established under the direction of the full board of directors.
Committees of the Board of Directors
The standing committees of our board of directors are as described below.
Audit Committee
The Audit Committee will initially be composed of Mr. Svider and Mr. Mullen. The Audit Committee will perform the duties set forth in its written charter, which will be available at our website upon consummation of this offering. The primary responsibilities of the Audit Committee will include:
- •
- overseeing management's establishment and maintenance of adequate systems of internal accounting, auditing and financial controls;
- •
- reviewing the effectiveness of our legal, regulatory compliance and risk management programs;
179
- •
- review certain related-party transactions in accordance with the Company's Related-Party Transaction Approval Policy;
- •
- overseeing our financial reporting process, including the filing of financial reports; and
- •
- selecting independent auditors, evaluating their independence and performance and approving audit fees and services performed by them.
The Audit Committee will initially be comprised of two directors, both of whom will be "independent" under the listing standards of the NYSE and the requirements of Rule 10A-3 under the Exchange Act. At least one member of our Audit Committee will be a "financial expert" within the meaning of SEC rules and regulations.
Compensation Committee
The Compensation Committee will initially be composed of Mr. Svider and Mr. Mullen. The Compensation Committee will perform the duties set forth in its written charter, which will be available at our website upon consummation of this offering. The primary responsibilities of the Compensation Committee will include:
- •
- ensuring our executive compensation programs are appropriately competitive, support organizational objectives and stockholder interests and
emphasize pay for performance linkage;
- •
- evaluating and approving compensation and setting performance criteria for compensation programs for our chief executive officer and other
executive officers; and
- •
- overseeing the implementation and administration of our compensation plans.
As a "controlled company," we will not be required to have a compensation committee comprised entirely of independent directors.
Director Compensation
Following the completion of this offering, compensation for our non-employee directors will be determined by our board of directors with the assistance of the Compensation Committee. The compensation of Mr. Svider will be paid to BCP. Directors who are also employees of the Company will not receive any compensation for their service as directors.
Compensation Committee Interlocks and Insider Participation
We expect that, at the time of the offering, other than Dexter Goei, who serves on the Board of Altice N.V., none of our executive officers will currently serve, or in the past year have served, as a member of the board of directors or compensation committee of any entity that has one or more executive officers serving on our board of directors or compensation committee.
Role of Our Board of Directors in Risk Oversight
One of the key functions of our board of directors is informed oversight of our risk management process. Our board of directors administers this oversight function directly, with support from the audit and compensation committees to be established upon the completion of this offering, each of which will address risks specific to its respective areas of oversight. In particular, our audit committee will have the responsibility to consider and discuss our major financial risk exposures and the steps our management takes to monitor and control these exposures, including guidelines and policies to govern the process by which risk assessment and management is undertaken. Our audit committee will also monitor compliance with legal and regulatory requirements, in addition to oversight of the performance of our internal audit function. Our compensation committee will assess and monitor whether any of our
180
compensation policies and programs has the potential to encourage excessive risk-taking. Board committees report to the full board as appropriate, including when a matter rises to the level of a material or enterprise-level risk. In addition, the board of directors receives detailed regular reports from members of our senior management and other personnel that include assessments and potential mitigation of the risks and exposures involved with their respective areas of responsibility.
Code of Ethics
We have adopted Standards of Business Conduct for all of our employees, including our principal executive officer, principal financial officer, principal accounting officer or controller, or persons performing similar functions. A copy of our Standards of Business Conduct will be available on our website upon consummation of this offering. Our Standards of Business Conduct is a "code of ethics" as defined in Item 406(b) of Regulation S-K. We will make any legally required disclosures regarding amendments to or waivers of provisions of our code of ethics on our website. The information on our website is not a part of this prospectus.
Corporate Governance Guidelines
Our board of directors has adopted corporate governance guidelines that serve as a flexible framework within which our board of directors and its committees operate. These guidelines cover a number of areas including the size and composition of the board, board membership criteria and director qualifications, director responsibilities, board agenda, role of the chief executive officer, meetings of independent directors, committee responsibilities and assignments, board member access to management and independent advisors, director communications with third parties, director compensation, director orientation and continuing education, evaluation of senior management and management succession planning. A copy of our corporate governance guidelines will be available on our website upon consummation of this offering. The information on our website is not part of this prospectus.
181
Compensation Discussion & Analysis
Overview
This section discusses the material components of our executive compensation program for each of our named executive officers. Our named executive officers are:
- •
- Dexter Goei, Chairman and Chief Executive Officer (CEO);
- •
- Charles Stewart, Co-President and Chief Financial Officer (CFO);
- •
- Abdelhakim Boubazine, Co-President and Chief Operating Officer (COO);
- •
- David Connolly, Executive Vice President, General Counsel; and
- •
- Lisa Rosenblum, Vice Chairman.
Messrs. Goei, Stewart and Boubazine are currently employed by Altice Management Americas, a subsidiary of Altice N.V., and provide services to Altice USA under a management agreement. Immediately prior to the completion of this offering, Messrs. Goei, Stewart and Boubazine will become employees of the Company. The compensation discussed in this section is the compensation paid to the named executive officers with respect to their service to Altice USA.
Executive Compensation Philosophy
The Company's executive compensation philosophy is based on the following principles:
- •
- provide total compensation that attracts, motivates and retains individuals with the knowledge, expertise and experience required for each
specific role;
- •
- deliver an appropriate proportion of the total compensation package through variable pay elements linked to performance over the short- and
long-term;
- •
- encourage and reward performance that will lead to long-term enhancement of stockholder value; and
- •
- take into account compensation practices in the markets in which we operate and compete for talent.
Determination of Compensation
Chief Executive Officer
The CEO's 2016 compensation was determined by the Altice N.V. board of directors, a board consisting of four executive board members and three non-executive board members and approved by Altice N.V. stockholders. The Altice N.V. board is counseled by the Altice N.V. Remuneration Committee, which consists of non-executive board members and is chaired by an independent non-executive board member. The Altice N.V. board generally sets elements of pay at levels it considers appropriate, taking into account various factors such as the nature of the role, the experience and performance of the individual, and local and sector market practice amongst peers of a similar size and scope to the Group.
Other Named Executive Officers
The compensation for all other named executive officers was set by Mr. Goei based on the compensation of individuals employed in the Altice Group in comparable positions and validated by the Altice Group Management Board.
182
Elements of Compensation
Base Salary
The named executive officers receive a base salary to compensate them for services provided to the Company. Base salary is intended to provide a fixed component of compensation reflecting various factors, such as the nature of the role and the experience and performance of the individual. As of December 31, 2016, Mr. Goei's annualized base salary was $471,900 (based on a Swiss Franc to U.S. Dollar conversion rate of 1.0187 as of December 31, 2016), Mr. Stewart's and Mr. Boubazine's annualized base salary was $500,000 each, and Mr. Connolly's and Ms. Rosenblum's annualized base salary was $400,000 each.
Annual Bonus
For 2016, each of our named executive officers was eligible to earn an annual performance-based cash bonus. In the case of Mr. Goei, 50% of his 2016 annual incentive was attributable to his Altice USA service. In the case of each of the other named executive officers, all of their respective 2016 annual incentive was attributable to Altice USA service.
Mr. Goei's 2016 annual incentive was comprised of two components: a formula-based award and a discretionary award. For the portion of Mr. Goei's annual incentive attributable to his Altice USA service, the 2016 formula-based target was $632,235, with a maximum payout opportunity equal to $948,353. Based on the metrics used to determine his annual incentive, which are set forth below, the resulting 2016 Altice USA annual formula-based incentive award for Mr. Goei was $792,823:
Performance Area
|
Weight | Performance Metrics | 2016 Performance Factor* |
||||||
|---|---|---|---|---|---|---|---|---|---|
Financial |
66.66 | % | Altice N.V. Revenue |
113.1 | % | ||||
|
Altice N.V. Adjusted EBITDA |
||||||||
|
Altice N.V. Adjusted EBITDA – Capex + change in working capital |
||||||||
Personal Goals |
33.33 | % | 150.0 | % | |||||
Total |
100.00 | % | 125.4 | % | |||||
- *
- The performance factor is the average of the actual results of the three financial metrics against established targets. A description of the performance metrics that are non-GAAP metrics are set forth in "—Description of Non-GAAP Financial Measures."
In addition, Mr. Goei received a discretionary award equal to $707,177 in recognition of his exceptional leadership in creating Altice USA through the integration of Suddenlink and Optimum and for his role in introducing the "Altice Way" (described below). Mr. Goei's aggregate 2016 annual incentive associated with his Altice USA service was $1,500,000.
Mr. Stewart and Mr. Boubazine's 2016 annual incentive was comprised of two components: a formula-based award and a discretionary award. The 2016 Altice USA annual incentive formula-based bonus target for Mr. Stewart and Mr. Boubazine was equal to 60% of annualized base salary (target equal to $300,000 each) with a maximum payout opportunity equal to 120% of annualized base salary (maximum payout of $600,000 each). Based on the metrics used to determine each of their annual
183
incentives, which are set forth below, the resulting 2016 Altice USA annual formula-based incentive award for each of Mr. Stewart and Mr. Boubazine was $428,400:
Performance Area
|
Weight | Performance Metrics | 2016 Performance Factor* |
||||||
|---|---|---|---|---|---|---|---|---|---|
Financial |
26.25 | % | Cequel Revenue | 116.0 | % | ||||
|
26.25 | % | Cequel Adjusted EBITDA | 232.3 | % | ||||
|
25.00 | % | Cequel Corporate Expense | 125.0 | % | ||||
Operational |
22.50 | % | Measurement of Business KPIs | 89.6 | % | ||||
Total |
100.00 | % | 142.8 | % | |||||
- *
- The performance factor is based on actual results of each financial metric against an established target. Corporate Expense refers to the portion of other Operating Expenses related to certain predefined departments which provide enterprise-wide administrative support to business operations (e.g., executive, legal, human resources, accounting, etc.). A description of the other financial metrics that are non-GAAP metrics is set forth in "—Description of Non-GAAP Financial Measures."
In addition, Mr. Stewart and Mr. Boubazine each received a discretionary bonus equal to 100% of their aforementioned calculated annual incentive bonuses ($428,400) in recognition of the extraordinary contribution each made to integrating the two legacy organizations, Suddenlink and Optimum, to form Altice USA and their successful introduction of the "Altice Way" through the introduction of operational efficiencies focused on the principles of simplifying and optimizing the organization, reinvesting in infrastructure and content, investing in sales and marketing initiatives, enhancing the customer experience and driving revenue and cash flow growth for Altice USA. In total, Mr. Boubazine's and Mr. Stewart's total 2016 annual incentive award was $856,800 each.
The 2016 Altice USA annual incentive bonus target for Mr. Connolly was equal to 60% of annualized base salary (target equal to $240,000), with a maximum payout opportunity equal to 120% of annualized base salary (maximum payout equal to $480,000). The annual incentive bonus target for Ms. Rosenblum was equal to 60% of base salary paid from June 21, 2016 (the date on which Altice's acquisition of Optimum occurred) through December 31, 2016 (target equal to $126,923), with a maximum payout opportunity equal to 120% of base salary paid during this period (maximum payout equal to $253,846). Based on the metrics used to determine each of their annual incentives, which are set forth below, the resulting 2016 Altice USA annual formula-based incentive award for Mr. Connolly was $315,360 and for Ms. Rosenblum was $166,777:
Performance Area
|
Weight | Performance Metrics | 2016 Performance Factor* |
||||||
|---|---|---|---|---|---|---|---|---|---|
Financial |
20 | % | Second Half Cablevision Revenue |
109.1 | % | ||||
|
20 | % | Second Half Cablevision Adjusted |
180.3 | % | ||||
|
EBITDA – Capex |
||||||||
|
40 | % | Second Half Cablevision Corporate Expense |
125.0 | % | ||||
Operational |
20 | % | Second Half Cablevision Weighted Average of |
117.5 | % | ||||
|
Non-corporate Business Results |
||||||||
Total |
100 | % | 131.4 | % | |||||
- *
- The performance factor is based on actual results of each financial metric against an established target. Corporate Expense refers to the portion of other Operating Expenses related to certain predefined departments which provide enterprise-wide administrative support to business operations (e.g., executive, legal, human resources, accounting, etc.). A description of the other financial metrics that are non-GAAP metrics is set forth in "—Description of Non-GAAP Financial Measures."
184
In addition, Mr. Connolly received a one-time sign-on payment of $500,000 to be paid in two installments. The first payment of $250,000 was made in December 2016 and the final payment is to be made in December 2017 subject to Mr. Connolly's continued employment with the Company.
Carry Unit Plan
On July 13, 2016, the Neptune Management Limited Partnership Carry Unit Plan (the "Carry Unit Plan") was created to provide participants, including our named executive officers, with an opportunity to participate in the long-term growth and financial success of our operations. Under the Carry Unit Plan, profits interests denominated in units of ownership (the "Units") of Neptune Management Limited Partnership (the "Partnership") were granted to participants. Approximately 260 million Units are authorized. As of April 30, 2017, the Partnership had granted, subject to vesting, approximately 230 million Units.
A profits interest gives the participant the right to share in specified future profits and appreciation in value that the participants of the Partnership may receive, including profits paid upon a sale of the investors' interests.
Economically, a profits interest is similar to a stock option granted on the stock of a corporation insofar as a participant realizes value only if the Partnership from which the profits interest is granted appreciates in value and/or has profits after the grant date.
All named executive officers hold Units in the amounts set forth below:
Name
|
# Units | Vesting Start Date | |||
|---|---|---|---|---|---|
Dexter Goei |
11,300,000 | 12/21/2015 (the date on which Altice's acquisition of Suddenlink occurred) |
|||
Charles Stewart |
10,000,000 | 12/21/2015 (the date on which Altice's acquisition of Suddenlink occurred) |
|||
Abdelhakim Boubazine |
10,000,000 | 12/21/2015 (the date on which Altice's acquisition of Suddenlink occurred) |
|||
David Connolly |
4,250,000 | 8/22/2016 (the date on which Mr. Connolly was hired) |
|||
Lisa Rosenblum |
6,000,000 | 6/21/2016 (the date on which Altice's acquisition of Optimum occurred) |
|||
These Units vest as follows: 50% of the Units vest on the second anniversary of the vesting start date; 25% of the Units vest on the third anniversary of the vesting start date; and 25% of the Units vest on the fourth anniversary of the vesting start date, in each case, generally subject to the named executive officer's continued employment with the Company or any of its affiliates.
Additionally, Mr. Goei received 10,000,000 performance-vesting Units that will vest based on the achievement of 2019 Altice USA financial targets of (x) consolidated net revenue and (y) (1) Adjusted EBITDA or (2) Adjusted EBITDA less capex (see "Summary Historical and Pro Forma Financial Data" for a reconciliation of Adjusted EBITDA and "—Description of Non-GAAP Financial Measures" for Adjusted EBITDA less capex). Mr. Goei's performance-vesting Units will be forfeited if performance is not met, unless otherwise determined by the Altice N.V. board of directors in its discretion. In 2017, Mr. Goei was granted 10,600,000 time-vesting Units, which are scheduled to cliff vest on January 31, 2020, generally subject to his continued employment with the Company or any of its affiliates. These Units are not included in the Summary Compensation Table or other tables presented below because they were granted in 2017.
An IPO of Altice USA will not result in accelerated vesting of the Units. Following the IPO, holders of vested Units may receive Class A common stock of Altice USA at the discretion of the Partnership. The amount received is expected to be calculated using the fair market value of Units and based on the then trading price of Class A common stock of Altice USA.
185
Benefits
The named executive officers are eligible to participate in the health and welfare benefit plans made available to the other benefits-eligible employees of the Company, including medical, dental, vision, life insurance and disability coverage.
The named executive officers are eligible to participate in the Company's Cablevision 401(k) Plan and may contribute into their plan accounts a percentage of their eligible pay on a before-tax basis and after-tax basis. The Company matches 100% of the first 4% of eligible pay contributed by participating employees. In addition, the Company may make an additional discretionary year-end contribution. Any discretionary year-end contribution, if approved by the Company, will be provided to all eligible participants who are active on the last day of the plan year and who complete 1,000 hours of service in such plan year. In 2016, the Company made a discretionary year-end contribution of 2% of eligible pay with respect to the 2016 plan year. Company contributions to the Cablevision 401(k) Plan are subject to vesting limitations for the first three years of employment.
The Company also sponsors the Cablevision Excess Savings Plan, a non-qualified deferred compensation plan. Effective December 31, 2016, the Excess Savings Plan was frozen to new participants and Company contributions. The Company maintains the Cablevision Cash Balance Pension Plan, a tax-qualified defined benefit plan, and the Cablevision Excess Cash Balance Plan, a non-qualified deferred compensation plan for participants whose benefits in the qualified plan are limited by applicable IRS limitations. Effective December 31, 2013, the Cablevision Cash Balance Pension Plan and the Cablevision Excess Cash Balance Plan were frozen to new participants and future benefit accruals, except for certain employees covered by a collective bargaining agreement for whom accruals were frozen as of April 15, 2015. Monthly interest credits continue to be made to participant accounts until distribution of the accounts following termination of employment. Ms. Rosenblum is the only named executive officer with an account balance in the Cablevision Excess Savings Plan or with an accrued benefit in the Cablevision Cash Balance Pension Plan or the Cablevision Excess Cash Balance Pension Plan. See the "Nonqualified Deferred Compensation Table" below for further information on the Cablevision Excess Savings Plan and the "Pension Benefits Table" below for further information on the Cablevision Cash Balance Pension Plan and the Cablevision Excess Cash Balance Pension Plan.
Perquisites
The Company provides certain perquisites to executive officers, which it has determined are appropriate for recruitment and retention, including personal use of Company-provided ground transportation and aircraft, primarily for commuting to and from the Company's Bethpage, NY headquarters. To the extent our employees use Company-provided transportation for commuting and other personal travel, they are imputed compensation for tax purposes. For 2016, the Company provided a tax gross up on imputed income related to commuting usage. The Company owns and operates two passenger helicopters to facilitate business travel of senior executives and had a lease for a fixed wing aircraft to facilitate international travel for Mr. Goei. The fixed wing aircraft lease ended in February 2017.
The Company provided reimbursement or payment of certain expenses incurred by Messrs. Goei, Boubazine and Stewart associated with their relocation to the United States, as well as certain expenses for Mr. Boubazine while he was an expatriate in the Dominican Republic. Mr. Stewart is receiving a monthly housing allowance during the period from January 2016 through December 2017. The Company purchases tickets for sporting and entertainment events for business use; on the occasion the tickets are unused, they are available for personal use by our employees, including the named executive officers. The named executive officers are also eligible to participate in the Altice USA Employee Product Benefit program, which provides all benefits-eligible employees who reside in the Suddenlink or Optimum footprint with discounted cable television, high-speed data and voice services. See "Summary Compensation Table" below for further information on the perquisites provided to our named executive officers during 2016.
186
Post-Termination Compensation
Our named executive officers have helped build the Company into the successful enterprise that it is today and we believe that post-termination benefits are integral to the Company's ability to attract and retain qualified executives. Our named executive officers were eligible for severance benefits in 2016 under the Cablevision's 2016 Severance Policy. All severance benefits payable under the severance policy would be conditioned on the employee executing a separation agreement with the Company, including, a release of claims and any other terms and conditions that the Company may require. For a description and quantification of the severance and other benefits payable to each of the named executive officers under the different circumstances of termination, please see "Severance Benefits" and "Payments on Termination or Change of Control" below.
Employment Agreements
None of the named executive officers have an employment agreement related to their service with Altice USA.
Tax Deductibility of Compensation
Section 162(m) of the Internal Revenue Code, as amended ("Section 162(m)"), establishes a $1 million limit on the amount that a publicly held corporation may deduct for compensation paid to the chief executive officer and the next three most highly paid named executive officers (other than the chief financial officer) in a taxable year. This limitation does not apply to any compensation that is considered "qualified performance-based compensation" ("QPBC") under Section 162(m), which is defined as compensation paid in connection with certain stock options or that is paid only if the individual's performance meets pre-established objective goals based on performance criteria established under a plan approved by stockholders. Because we do not currently have any publicly held common stock, the restrictions of Section 162(m) do not currently apply to us.
Summary Compensation Table
The table below summarizes the total compensation paid to or earned by each of our named executive officers for services to Altice USA for the year ending December 31, 2016.
Name and principal position
|
Year (1) |
Salary ($) |
Bonus ($) (3) |
Stock awards ($) (4) |
Non-equity incentive plan compensation ($) (5) |
Change in pension value and nonqualified deferred compensation earnings ($) |
All other compensation ($) (6) |
Total ($) |
||||||||||||||||
|---|---|---|---|---|---|---|---|---|---|---|---|---|---|---|---|---|---|---|---|---|---|---|---|---|
Dexter Goei |
2016 | 235,950 | 707,177 | 7,881,000 | 792,823 | — | 417,920 | 10,034,870 | ||||||||||||||||
Charles Stewart |
2016 | 490,385 | 428,400 | 3,700,000 | 428,400 | — | 830,028 | 5,877,213 | ||||||||||||||||
Abdelhakim Boubazine |
2016 | 417,262 | 428,400 | 3,700,000 | 428,400 | — | 464,382 | 5,438,444 | ||||||||||||||||
David Connolly |
2016 | 138,462 | 250,000 | 1,572,500 | 315,360 | — | 4,308 | 2,280,630 | ||||||||||||||||
Lisa Rosenblum |
2016 | 238,462 | — | 2,220,000 | 166,777 | 10,780 | 98,410 | 2,734,429 | ||||||||||||||||
- (1)
- All amounts cover Altice USA service only. For Mr. Goei Altice USA service began on June 28, 2016 (his appointment as CEO of Altice USA). Mr. Boubazine began providing services to Altice USA on February 1, 2016. For February and March, 50% of Mr. Boubazine's services were allocated to Altice USA. From April 1, 2016 through December 31, 2016, 100% of Mr. Boubazine's services were allocated to Altice USA.
187
Mr. Connolly's service began on August 22, 2016 (his hire date) and for Ms. Rosenblum, service began on June 21, 2016 (the date on which Altice's acquisition of Optimum occurred). Mr Stewart provided service for the full year.
- (2)
- Mr. Goei
received all salary in Swiss Francs. A Swiss Franc to U.S. Dollar conversion rate of 1.0187 as of December 31, 2016 was used.
- (3)
- Mr. Goei
($707,177), Mr. Stewart ($428,400) and Mr. Boubazine ($428,400) each received a special bonus in recognition of the extraordinary
contribution each made to the formation of Altice USA and the introduction of the Altice Way, as described in the section titled "Annual Bonus" in the Compensation Discussion & Analysis.
Mr. Connolly received a one-time sign-on payment ($250,000).
- (4)
- Represents
the grant date fair value of Units granted in 2016, as described in the section titled "Carry Unit Plan" in the Compensation Discussion & Analysis,
computed in accordance with FASB ASC Topic 718, excluding forfeiture assumptions. An option pricing model was used to determine the grant date fair value of the Units, which required the use of
certain subjective assumptions. Any changes to these assumptions could materially affect the grant date fair value computation. The time to liquidity event assumption (2.5 years) was based on
management's judgment. The equity volatility assumption of 60% was estimated using the historical weekly volatility of publicly traded comparable companies. The risk-free rate of 0.74% assumed in
valuing the Units was based on the U.S. Constant Maturity Treasury Rates for a period matching the expected time to liquidity event. The discount for lack of marketability of 20% was based on
Finnerty's (2012) average-strike put option model. No additional discount was applied to Mr. Goei's performance-vesting Units. The weighted average grant date fair value of the outstanding
units is $0.37 per Unit.
- (5)
- The
amounts reflect annual incentive awards paid in 2017 for performance in 2016, as described in the section titled "Annual Bonus" in the Compensation
Discussion & Analysis.
- (6)
- This table below shows the components of this column.
Name
|
401(k) Company Contribution (1) |
Excess Savings Plan Contribution (1) |
Transportation Tax gross up payment (2) |
Perquisites (3) |
Total | |||||||||||
|---|---|---|---|---|---|---|---|---|---|---|---|---|---|---|---|---|
Dexter Goei |
— | — | 3,583 | 414,337 | 417,920 | |||||||||||
Charles Stewart |
3,461 | — | 8,882 | 817,685 | 830,028 | |||||||||||
Abdelhakim Boubazine |
7,000 | — | 8,308 | 449,074 | 464,382 | |||||||||||
David Connolly |
4,308 | — | — | — | 4,308 | |||||||||||
Lisa Rosenblum |
5,300 | 14,854 | 10,759 | 67,497 | 98,410 | |||||||||||
- (1)
- This
column represents, for each individual, a matching contribution and/or Company discretionary contribution made by the Company on behalf of such individual under
the Company's 401(k) Plan or Excess Savings Plan, as applicable.
- (2)
- This
column represents amounts paid to executives to offset imputed income on commuter travel.
- (3)
- This column represents for each individual the following aggregate perquisites as described in the table below. In addition, the named executive officers are eligible to participate in the Altice USA Employee Product Benefit program, which provides all benefits-eligible employees who reside in the Suddenlink or Optimum footprint with discounted cable television, high-speed data and voice services. The Company purchases tickets for sporting and entertainment events for business use; on the occasion the tickets are
188
unused, they are available for personal use by our employees, including the named executive officers. There is no incremental cost to the Company for these benefits.
Name
|
Aircraft ($) (1) |
Housing Allowance ($) (2) |
Global Mobility and Relocation ($) (3) |
Ground Transportation ($) (4) |
Total | |||||||||||
|---|---|---|---|---|---|---|---|---|---|---|---|---|---|---|---|---|
Dexter Goei |
223,231 | — | 160,862 | * | 414,337 | |||||||||||
Charles Stewart |
103,932 | 500,005 | 185,123 | * | 817,685 | |||||||||||
Abdelhakim Boubazine |
67,477 | — | 291,836 | 89,761 | 449,074 | |||||||||||
David Connolly |
— | — | — | — | — | |||||||||||
Lisa Rosenblum |
47,552 | — | — | * | 67,497 | |||||||||||
- *
- Does
not exceed the greater of $25,000 or 10% of the total amount of perquisites of named executive officers.
- (1)
- This
column represents the incremental cost to the company for personal use of the Company's aircraft, primarily associated with commuting to and from the Company's
Bethpage, NY headquarters, and for a leased fixed wing aircraft for Mr. Goei's international business travel. The lease ended in February 2017. For the purposes of this disclosure, incremental
cost is valued based on the variable costs incurred by the Company and does not include costs that would have been incurred by the Company whether or not a particular trip was taken, such as lease and
insurance payments, pilot salaries, ordinary course maintenance and other overhead costs. The incremental cost of the personal use of the fixed wing aircraft, applicable solely to Mr. Goei, is
based on the variable hourly cost of the lease applied to the number of personal hours of usage.
- (2)
- This
column represents Mr. Stewart's housing allowance, which is paid on a monthly basis.
- (3)
- This
column represents assistance provided to support global mobility (including expatriate and relocation benefits). Benefits include temporary housing, visa
expenses, moving expense reimbursement, real estate broker fees, private health insurance, tuition, personal travel and social club costs. The following amounts included in this column were paid in
non-U.S. currency and were converted to U.S. Dollars at the following December 31, 2016 rates: $45,524 for Mr. Goei, converted from Swiss Francs using a Swiss Franc to U.S. Dollar
conversion rate of 1.0187; $66,346 for Mr. Stewart, converted from British Pounds using a British Pound to U.S. Dollar conversion rate of 0.81; and $77,389 for Mr. Boubazine, converted
from Dominican Pesos using a Dominican Peso to U.S. Dollar conversion rate of 46.6895.
- (4)
- This column reflects the incremental cost of providing our executive officers ground transportation for personal use, primarily for commuting to and from the Company's Bethpage, NY headquarters. For the purposes of this disclosure, incremental cost is valued, for the company vehicles, as a portion of the cost of the driver plus car lease, maintenance, fuel and other related costs, based on an estimated percentage of use, and for third party car services by the amount paid to the third party.
189
Grants of Plan-Based Awards
The table below presents information regarding awards granted in 2016 to each named executive officer under the Carry Unit Plan and the 2016 annual incentive programs in which the named executive officers participated.
| |
|
|
|
|
All other equity awards: Number of shares of stock or units (#) (3) |
|
||||||||||||
|---|---|---|---|---|---|---|---|---|---|---|---|---|---|---|---|---|---|---|
| |
|
|
|
Estimated future payouts under equity incentive plan awards |
Grant date fair value of equity and option awards ($) (4) |
|||||||||||||
| |
|
Estimated future payouts under non-equity incentive plan awards(1) |
||||||||||||||||
Name
|
Grant Date |
Target ($) |
Maximum ($) |
Target (#) (2) |
||||||||||||||
Dexter Goei |
— | 632,235 | 948,353 | — | — | — | ||||||||||||
|
07/13/16 | — | — | 10,000,000 | — | 3,700,000 | ||||||||||||
|
07/13/16 | — | — | — | 11,300,000 | 4,181,000 | ||||||||||||
Charles Stewart |
— | 300,000 | 600,000 | — | — | — | ||||||||||||
|
07/13/16 | — | — | — | 10,000,000 | 3,700,000 | ||||||||||||
Abdelhakim Boubazine |
— | 300,000 | 600,000 | — | — | — | ||||||||||||
|
07/13/16 | — | — | — | 10,000,000 | 3,700,000 | ||||||||||||
David Connolly |
— | 240,000 | 480,000 | — | — | — | ||||||||||||
|
08/26/16 | — | — | — | 4,250,000 | 1,572,500 | ||||||||||||
Lisa Rosenblum |
— | 120,000 | 240,000 | — | — | — | ||||||||||||
|
07/13/16 | — | — | — | 6,000,000 | 2,220,000 | ||||||||||||
- (1)
- These
columns show the target and maximum payouts under the 2016 bonus plan based on 2016 metrics and performance criteria described in the section titled "Annual
Bonus" in the Compensation Discussion & Analysis. This plan does not have a threshold payout. Payments were made in 2017 for 2016 performance and actual payments are reflected in the Non-Equity
Incentive Plan Column in the Summary Compensation Table.
- (2)
- Mr. Goei
received 10,000,000 performance-vesting Units that will vest sixty days after completion of the 2019 Audited Financial Statements based on meeting or
exceeding a set of 2019 financial performance criteria described in the section titled "Carry Unit Plan" in the Compensation Discussion & Analysis. This award does not have a threshold or
maximum payout. The calculation of the performance target will be based on 2019 Audited Financial Statements.
- (3)
- All
named executive officers received Units that vest as follows: 50% of the Units vest on the second anniversary of the vesting start date; 25% of the Units vest on
the third anniversary of the vesting start date; and 25% of the Units will vest on the fourth anniversary of the vesting start date. For grants made to Mr. Goei, Mr. Stewart, and
Mr. Boubazine, the vesting start date is December 21, 2015 (the date on which Altice's acquisition of Suddenlink occurred). For Ms. Rosenblum, the vesting start date is
June 21, 2016 (the date on which Altice's acquisition of Optimum occurred). For Mr. Connolly, the vesting start date is August 22, 2016 (his date of hire).
- (4)
- Represents the grant date fair value of Units granted in 2016, computed in accordance with FASB ASC Topic 718, excluding forfeiture assumptions. An option pricing model was used which requires subjective assumptions for which changes in these assumptions could materially affect the fair value of the Units outstanding. The time to liquidity event assumption (2.5 years) was based on management's judgment. The equity volatility assumption of 60% was estimated using the historical weekly volatility of publicly traded comparable companies. The risk-free rate of 0.74% assumed in valuing the Units was based on the U.S. Constant Maturity Treasury Rates for a period matching the expected time to liquidity event. The discount for lack of marketability of 20% was based on
190
Finnerty's (2012) average-strike put option model. No additional discount was applied to Mr. Goei's performance-vesting Units. The weighted average grant date fair value of the outstanding Units is $0.37 per share.
Outstanding Equity Awards at Fiscal Year-End
The table below presents (i) the number of Units granted under the Carry Unit Plan that have not yet vested and (ii) the market value of these Units for each named executive officer, in each case as of December 31, 2016. None of the named executive officers held options with respect to Altice USA as of December 31, 2016.
| |
Stock Awards | ||||||||||||
|---|---|---|---|---|---|---|---|---|---|---|---|---|---|
Name
|
Number of shares or units of stock that have not vested (#) (1) |
Market value of shares or units of stock that have not vested ($) (2) |
Equity inventive plan awards: Number of unearned shares, units or other rights that have not vested (#) (3) |
Equity incentive plan awards: Market or payout value of unearned shares, units or other rights that have not vested |
|||||||||
Dexter Goei |
11,300,000 | 19,888,000 | 10,000,000 | 17,600,000 | |||||||||
Charles Stewart |
10,000,000 | 17,600,000 | — | — | |||||||||
Abdelhakim Boubazine |
10,000,000 | 17,600,000 | — | — | |||||||||
David Connolly |
4,250,000 | 7,480,000 | — | — | |||||||||
Lisa Rosenblum |
6,000,000 | 10,560,000 | — | — | |||||||||
- (1)
- All
named executive officers received Units that vest as follows: 50% of the Units will vest on the second anniversary of the vesting start date; 25% of the Units
will vest on the third anniversary of the vesting start date; and 25% of the Units will vest on the fourth anniversary of the vesting start date. For grants made to Mr. Goei,
Mr. Stewart, and Mr. Boubazine, the vesting start date is December 21, 2015 (the date on which Altice's acquisition of Suddenlink occurred). For Ms. Rosenblum, the vesting
start date is June 21, 2016 (the date on which Altice's acquisition of Optimum occurred). For Mr. Connolly, the vesting start date is August 22, 2016 (his date of hire).
- (2)
- The
December 31, 2016 market value of Units is equal to the fair value computed in accordance with FASB ASC Topic 718, excluding forfeiture assumptions. An
option pricing model was used which requires subjective assumptions for which changes in these assumptions could materially affect the fair value of the Units outstanding. The time to liquidity event
assumption (1.3 years) was based on management's judgment. The equity volatility assumption of 45% was estimated using the historical weekly volatility of publicly traded comparable companies.
The risk-free rate of 0.95% assumed in valuing the Units was based on the U.S. Constant Maturity Treasury Rates for a period matching the expected time to liquidity event. The discount for lack of
marketability of 10% was based on Finnerty's (2012) average-strike put option model. No additional discount was applied to Mr. Goei's performance-vesting Units. The weighted average fair value
of the outstanding Units as of December 31, 2016 is $1.76 per Unit.
- (3)
- Mr. Goei received 10,000,000 Units that will vest sixty days after completion of the 2019 Audited Financial Statements based on meeting or exceeding a set of 2019 financial performance criteria described in the section titled "Carry Unit Plan" in the Compensation Discussion & Analysis. The calculation of the performance target will be based on 2019 Audited Financial Statements.
191
Pension Benefits Table
The table below shows the actuarial present value of accumulated benefits payable under our qualified and nonqualified defined benefit pension plans as of December 31, 2016 for Ms. Rosenblum, who is the sole named executive officer who is eligible to participate in such plans.
Name
|
Plan | Number of Years Credited Service (#) (1) |
Present Value of Accumulated Benefit ($) (2) |
Payments During Last Fiscal Year ($) |
||||||||
|---|---|---|---|---|---|---|---|---|---|---|---|---|
Lisa Rosenblum |
Cablevision Cash Balance Pension Plan | 20 | 301,890 | — | ||||||||
|
Cablevision Excess Cash Balance Plan | 20 | 357,910 | — | ||||||||
- (1)
- Years
of service are calculated based on elapsed time while a member of the plan. Actual elapsed time as an employee of Cablevision and Altice USA for
Ms. Rosenblum is 22 years.
- (2)
- Assumes Ms. Rosenblum will take a lump sum payment of benefits at retirement. The lump sum payment was determined by crediting the December 31, 2016 account balances with an assumed interest crediting rate of 2.57% until an assumed retirement age of 65. The present value of accumulated benefits was calculated using a discount rate of 3.85%.
Cablevision Cash Balance Pension Plan
The Cablevision Cash Balance Pension Plan is a tax-qualified defined benefit plan that was amended effective December 31, 2013 to freeze participation and benefit accruals for all legacy Cablevision employees except certain employees covered by a collective bargaining agreement. Effective April 15, 2015, the plan was further amended to freeze participation and benefit accruals for the remaining employees covered by the collective bargaining agreement. Ms. Rosenblum is the only named executive officer with an accrued benefit under the Cablevision Cash Balance Pension Plan.
A notional account is maintained for each participant under the plan, which is credited with monthly interest credits based on the average of the annual rate of interest on the 30-year U.S. Treasury Bonds for the months of September, October and November of the prior year. Monthly interest credits continue to be made to participant accounts until distribution of the accounts following termination of employment. All active participants are fully vested in their accounts. Upon retirement or other termination of employment with the Company, the participant may elect a distribution of the vested portion of the account. The normal form of benefit payment for an unmarried participant is a single life annuity and the normal form of benefit payment for a married participant is a 50% joint and survivor annuity. The participant, with spousal consent if applicable, can waive the normal form and elect to receive a single life annuity or a lump sum in an amount equal to the cash balance account.
Cablevision Excess Cash Balance Pension Plan
The Cablevision Excess Cash Balance Plan is a nonqualified deferred compensation plan that is intended to provide eligible participants, including Ms. Rosenblum, with the portion of their benefit that cannot be paid to them under the Cablevision Cash Balance Pension Plan due to Internal Revenue Code limits applicable to tax-qualified plans. Effective December 31, 2013, the Excess Cash Balance Plan was amended to freeze participation and future benefit accruals for all employees. Ms. Rosenblum is the only named executive officer with an accrued benefit under the Cablevision Excess Cash Balance Pension Plan.
The Company maintains a notional excess cash balance account for each eligible participant and credits each excess cash balance account monthly with interest at the same rate used under the Cablevision Cash Balance Pension Plan. Monthly interest credits continue to be made to participant
192
accounts until distribution of the accounts following termination of employment. All active participants are fully vested in their excess cash balance account. The excess cash balance account, to the extent vested, is paid in a lump sum to the participant as soon as practicable following his or her retirement or other termination of employment with the Company.
Nonqualified Deferred Compensation Table
The table below shows the contributions made, aggregate earnings, and account balance information under nonqualified deferred compensation plans for Ms. Rosenblum, who is the sole named executive officer who is eligible to participate in such plan.
Name
|
Plan | Executive Contributions in Last FY ($) (1) |
Registrant Contributions in Last FY ($)(2) |
Aggregate Earnings in Last FY ($) |
Aggregate Withdrawals/ Distributions ($) |
Aggregate Balance at Last FYE ($) |
||||||||||||
|---|---|---|---|---|---|---|---|---|---|---|---|---|---|---|---|---|---|---|
Lisa Rosenblum |
Cablevision Excess Savings Plan | 13,385 | 14,854 | 4,848 | — | 569,134 | ||||||||||||
- (1)
- This
amount represents a portion of Ms. Rosenblum's salary, which is included in the amount reported in the "Salary" column of the Summary Compensation Table,
that Ms. Rosenblum contributed to the plan.
- (2)
- These amounts are reported in the All Other Compensation Column in the Summary Compensation Table.
Cablevision Excess Savings Plan
The Cablevision Excess Savings Plan is a nonqualified deferred compensation plan that operates in conjunction with the Cablevision 401(k) Savings Plan. Effective December 31, 2016, the Excess Savings Plan was frozen (i.e., no future employee or Company contributions are permitted under the Plan for 2017 and thereafter). Participant notional account balances continue to be credited monthly with the rate of return earned by the stable value investment option available under the Cablevision 401(k) Savings Plan.
Ms. Rosenblum is the only named executive officer with an account balance in the Cablevision Excess Savings Plan. For 2016, Ms. Rosenblum, whose contributions to the 401(k) Plan were limited as a result of the Internal Revenue Code compensation limit or as a result of reaching the maximum 401(k) deferral limit ($24,000, if age 50 or over), continued to make pre-tax contributions under the Excess Savings Plan equal to 6% of her eligible pay. The Company made matching contributions equal to 100% of the first 4% of eligible pay contributed. In addition, for 2016, the Company made its final discretionary contribution equal to 2% of eligible pay in excess of the Internal Revenue Code compensation limit in the first quarter of 2017.
A participant is always fully vested in the participant's own contributions and vests in the Company contributions over three years from date of hire (subject to full vesting upon death, disability or retirement after attaining age 65). Distributions are made in a lump sum as soon as practicable after the participant's termination of employment with the Company.
Severance Benefits
In the event of certain termination events during 2016, eligible employees, including our named executive officers, would have been eligible to receive certain severance benefits under Cablevision's 2016 Severance Policy, which provided for severance benefits when a position was eliminated due to restructuring or reorganization. Severance amounts were based on two weeks of base salary for every completed year of service with a minimum 52 weeks of base salary for senior vice presidents and above.
193
Vice presidents and above who were aged 55 and over, had completed 10 years of service or more and were enrolled in the Company's health plans were eligible to receive an additional payment in the amount of 18 times the monthly COBRA rate for current coverage elected through the Company's health plans, grossed up for taxes. Bonus-eligible exempt employees, including the named executive officers would have been eligible to receive a prorated 2016 annual bonus based on actual 2016 plan performance if a qualifying termination of employment occurred after June 30, 2016.
Payments on Termination or Change of Control
The following tables summarize the estimated amounts payable to each named executive officer in the event of a termination from employment without cause or upon a change of control as of December 31, 2016.
In the event of termination for cause, voluntary termination, retirement, death or disability, none of the named executive officers would have been entitled to any severance payments as of December 31, 2016.
Benefits Payable as a Result of Termination of Employment by the Company without Cause
Name
|
Severance ($) (1) |
Benefit Continuation Payments ($) (2) |
Most Recent Bonus ($) (3) |
Total | |||||||||
|---|---|---|---|---|---|---|---|---|---|---|---|---|---|
Dexter Goei |
471,900 | — | 792,823 | 1,264,723 | |||||||||
Charles Stewart |
500,000 | — | 428,400 | 928,400 | |||||||||
Abdelhakim Boubazine |
500,000 | — | 428,400 | 928,400 | |||||||||
David Connolly |
400,000 | — | 315,360 | 715,360 | |||||||||
Lisa Rosenblum |
400,000 | 31,800 | 489,915 | 921,715 | |||||||||
- (1)
- Pursuant
to Cablevision's 2016 Severance Policy, each named executive officer is entitled to two weeks' base salary for each completed year of service, with a
minimum severance amount equal to one year's base salary.
- (2)
- According
to Cablevision's 2016 Severance Policy, based on years of service and age, Ms. Rosenblum would also have been entitled to a lump sum payment equal
to 18 times the monthly COBRA rates for medical, dental and vision coverage, grossed up for taxes, based on the levels of coverage she received as of December 31,
2016.
- (3)
- The amounts in this column reflect annual incentive awards for performance in 2016. Ms. Rosenblum's amount also includes her 2016 Cablevision bonus.
Benefits Payable upon a Change of Control Transaction
Name
|
Unvested Units ($) (1) |
|||
|---|---|---|---|---|
Dexter Goei |
37,488,000 | |||
Charles Stewart |
17,600,000 | |||
Abdelhakim Boubazine |
17,600,000 | |||
David Connolly |
7,480,000 | |||
Lisa Rosenblum |
10,560,000 | |||
- (1)
- The amounts in this column represent the value of the unvested Units held by each named executive officer as of December 31, 2016, with the value calculated as described in footnote 2 of
194
the "Outstanding Equity Awards at Fiscal Year-End" table. Pursuant to the terms of the Units as of December 31, 2016, all unvested Units automatically vest upon a Company Sale (as defined in the Unit award agreement).
2017 Short Term Incentive Plan
For 2017, our officers, including our named executive officers, are eligible to receive an annual cash bonus award for 2017 performance under our 2017 annual incentive program (the "2017 Bonus"). The 2017 Bonus was established by the Remuneration Committee of the Altice N.V. board of directors. Upon completion of this offering, the Altice USA Compensation Committee of our Board (the "Compensation Committee") will assume responsibility of administration of the 2017 Bonus and may amend, suspend or terminate the 2017 Bonus in whole or in part at any time. The Compensation Committee will make all determinations with respect to the 2017 Bonus awards, subject to Altice N.V. board of director's right to consent under the stockholders' agreement.
2017 Bonus awards are subject to the achievement of performance metrics established by the Remuneration Committee of the Altice N.V. board. The 2017 performance metrics are weighted one-third Altice N.V. performance and two-thirds Altice USA performance. The key performance metrics for 2017 are Altice N.V. Revenue, Adjusted EBITDA and Adjusted EBITDA less Capex and working capital and Altice USA Revenue, Adjusted EBITDA and Adjusted EBITDA less Capex and working capital (a description of the financial metrics that are non-GAAP metrics is set forth in "—Description of Non-GAAP Financial Measures"), corporate expense and the average of non-corporate business unit results. 2017 Bonus awards will be paid in 2018 after determination of the achievement of performance metrics. The maximum 2017 Bonus payable to any participant is 150% of the participant's target bonus and the Compensation Committee has the discretion to pay less than the maximum amount. The Compensation Committee has the authority, as part of the 2017 Bonus program, to provide for a discretionary bonus (no maximum) in addition to the 2017 Bonus in its sole discretion.
The amounts payable with respect to the 2017 Bonus are not determinable because the performance year has not yet ended and, even if the performance metric achievement was determinable, the Compensation Committee is permitted to use its discretion to determine each participant's annual bonus.
New Short Term Incentive Plan
In connection with the offering, we intend to adopt the Altice USA Short Term Incentive Compensation Plan (the "STIP"), subject to approval by our Board. Under the STIP, we may reward eligible employees by making a portion of their cash compensation dependent on the achievement of certain Company, Altice N.V., corporate, business unit and individual performance goals. Goals may be defined at the level of Altice USA or Altice N.V. A copy of the STIP is attached as an exhibit hereto and the following summary is qualified in its entirety by reference thereto.
Eligibility and Administration
The STIP provides for the grant of short-term cash incentive compensation awards to officers of the Company selected by our Board (or if delegated by our Board, the Compensation Committee; references to our Board in this "New Short Term Incentive Plan" section and in "—New Long Term Incentive Plan" include the Compensation Committee to the extent they have been delegated authority by our Board). The maximum award that may be granted to any participant in a plan year is $3 million.
The STIP will be administered by our Board, subject to the provision of the stockholders' agreement that requires prior written approval of Altice N.V. for the establishment and modification of certain remuneration arrangements. Subject to applicable law, the terms of the STIP and the
195
stockholders' agreement, our Board has the power to, among other things, select participants, grant awards in accordance with the STIP, determine the terms and conditions of any award, and make any other determination and take any other action that it deems necessary or desirable for the administration of the STIP. Our Board also has the power to delegate its administrative duties.
Section 162(m)
As described below under "New Long Term Incentive Plan—Summary of Federal U.S. Income Tax Consequences—Impact of Section 162(m) Deduction Limitation", we do not expect Section 162(m) to apply to awards under the STIP until the earliest to occur of (1) our annual stockholders' meeting at which members of our Board are to be elected that occurs after the close of the third calendar year following the year of this offering; (2) a material modification of the STIP; or (3) the expiration of the STIP. However, performance criteria may be used with respect to performance awards that are not intended to constitute QPBC. The performance criteria set forth in the STIP are the same as those set forth in the 2017 LTIP, as described below under "New Long Term Incentive Plan—Summary of Federal U.S. Income Tax Consequences—Impact of Section 162(m) Deduction Limitation." In order to constitute QPBC, in addition to certain other requirements, the relevant amounts must be payable only upon the attainment of pre-established, objective performance goals set by the Compensation Committee and linked to stockholder-approved performance criteria. The STIP sets forth the applicable performance criteria that may be used in making such awards, and the objectively determinable adjustments to the applicable performance criteria that may be used. Following the completion of each performance period, for QPBC, the Compensation Committee will determine the extent to which the performance targets have been achieved or exceeded. If the minimum performance targets are not achieved, no payment will be made with respect to awards intended to constitute QPBC.
Plan Amendment or Termination
Our Board may, at any time, amend, suspend or terminate the STIP in whole or in part, provided that no amendment that requires stockholder approval in order for the STIP to continue to comply with Section 162(m) will be effective unless approved by the requisite vote of our stockholders.
New Plan Benefits.
The benefits that will be awarded or paid under the STIP are not currently determinable. Awards granted under the STIP are within the discretion of our Board (subject to the prior written approval of Altice N.V. under the stockholders' agreement), and our Board has not determined future awards or who might receive them.
New Long Term Incentive Plan
In connection with the offering, we intend to adopt the Altice USA 2017 Long Term Incentive Plan (the "2017 LTIP"), subject to approval by our Board. Under the 2017 LTIP, we may grant awards of options, restricted shares, restricted share units, stock appreciation rights, performance stock, performance stock units and other awards. The purposes of the 2017 LTIP are to promote the long term success of Altice USA and its affiliates, Altice USA's integration within the Altice Group and to increase stockholder value by providing eligible individuals with incentives to contribute to the long term growth and profitability of the Company and the Altice Group and to assist the Company in attracting and retaining the best available personnel for positions of substantial responsibility. A copy of the 2017 LTIP is attached as an exhibit hereto and the following summary is qualified in its entirety by reference thereto.
196
Eligibility and Administration
Awards may be granted to officers, employees and consultants of the Company or any of its affiliates. The 2017 LTIP will be administered by our Board, subject to the provision of the stockholders' agreement that requires prior written approval of Altice N.V. for the establishment and modification of certain remuneration arrangements. Subject to applicable law, the terms of the 2017 LTIP and the stockholders' agreement, our Board will have full power and authority to, among other things, select eligible participants, to grant awards in accordance with the 2017 LTIP, to determine the number of shares subject to each award or the cash amount payable in connection with an award and determine the terms and conditions of each award, including, without limitation, those related to term, permissible methods of exercise, vesting, cancellation, forfeiture, payment, settlement, exercisability, performance periods, performance targets, and the effect or occurrence, if any, of a participant's termination of employment, separation from service or leave of absence with the Company or any of its affiliates or of a change of control.
Limitation on Awards and Shares Available.
The maximum aggregate number of shares that may be issued for all purposes under the 2017 LTIP will be 4% of the outstanding shares of Class A common stock immediately following the IPO (the "Plan Limit"). Shares issued pursuant to awards under the 2017 LTIP may be either authorized and unissued shares, shares held by the Company in its treasury, or a combination thereof. The number of shares remaining available for issuance shall be reduced by the number of shares subject to outstanding awards and, for awards that are not denominated by shares, by the number of shares actually delivered upon settlement or payment of the award. For purposes of determining the number of shares that remain available for issuance under the 2017 LTIP, the number of shares corresponding to awards under the 2017 LTIP that are forfeited or cancelled or otherwise expire for any reason without having been exercised or settled or that are settled through the issuance of consideration other than shares (including, without limitation, cash) shall be added back to the Plan Limit and again be available for the grant of awards; provided, however, that this provision will not be applicable with respect to (i) the cancellation of a stock appreciation right granted in tandem with an option upon the exercise of the option or (ii) the cancellation of an option granted in tandem with a stock appreciation right upon the exercise of the stock appreciation right. In addition, (i) the number of shares that are tendered by a participant or withheld by the Company to pay the exercise price of an award or to satisfy the tax withholding obligations in connection with the vesting, exercise or settlement of an award and (ii) the number of shares subject to an option or stock appreciation right but not issued or delivered as a result of the net settlement of such option or stock appreciation right shall be added back to the Plan Limit and again be available for the grant of awards. No participant may be granted under the 2017 LTIP in any fiscal year awards covering more than the number of shares equal to 50% of the Plan Limit.
Awards
Awards under the 2017 LTIP may consist of options, restricted shares, restricted share units, stock appreciation rights, performance stock, performance stock units and other awards. Any award may be granted singly or in combination or tandem with any other award, as our Board may determine. Our Board will set the vesting criteria applicable to an award, which, depending on the extent to which the criteria are met, will determine the extent to which the award becomes exercisable or the number of shares or the amount of cash that will be distributed or paid out to the participant with respect to the award. Our Board may set vesting criteria based upon the achievement of Company-wide, Altice N.V., business unit, or individual goals (including, but not limited to, continued employment or provision of services), or any other basis determined by our Board in its discretion. The terms and conditions of each award will be set forth in an award document in a form approved by our Board. The award
197
document will contain terms and conditions not inconsistent with the 2017 LTIP. Our Board may at any time following grant (i) accelerate the vesting, exercisability, lapse of restrictions, settlement or payment of any award, (ii) eliminate the restrictions and conditions applicable to an award or (iii) extend the post-termination exercise period of an outstanding award (subject to the limitations of Section 409A).
Summary of U.S. Federal Income Tax Consequences
The following summary of tax consequences to the Company and to 2017 LTIP participants is not intended to be used as tax guidance to participants in the 2017 LTIP. It relates only to U.S. federal income tax and does not address state, local or foreign income tax rules or other U.S. tax provisions, such as estate or gift taxes. Different tax rules may apply to specific participants and transactions under the 2017 LTIP, particularly in jurisdictions outside the United States. In addition, this summary is as of the date of this prospectus; federal income tax laws and regulations are frequently revised and may be changed again at any time. Therefore, each participant is urged to consult a tax advisor before exercising any award or before disposing of any shares acquired under the 2017 LTIP.
- •
- Stock Options and Stock Appreciation Rights. The grant of an option or
stock appreciation right will create no tax consequences for the participant or the Company. A participant will have no taxable income upon exercise of an incentive stock option, except that the
alternative minimum tax may apply. Upon exercise of an option other than an incentive stock option, a participant generally must recognize ordinary income equal to the fair market value of the shares
acquired minus the exercise price. When disposing of shares acquired by exercise of an incentive stock option before the end of the statutory incentive stock option holding periods, the participant
generally must recognize ordinary income equal to the lesser of (1) the fair market value of the shares at the date of exercise minus the exercise price or (2) the amount realized upon
the disposition of the shares minus the exercise price. Otherwise, a participant's disposition of shares acquired upon the exercise of an option (including an incentive stock option for which the
incentive stock option holding periods are met) generally will result in only capital gain or loss.
- •
- Other Awards. Other awards under the 2017 LTIP generally will result in
ordinary income to the participant at the later of the time of delivery of cash, shares, or other awards, or the time that the risk of forfeiture lapses.
- •
- Company Deduction. Except as discussed below, the Company is generally
entitled to a tax deduction equal to the amount recognized as ordinary income by the participant in connection with options, stock appreciation rights or other awards, but not for amounts the
participant recognizes as capital gain. Thus, the Company will not be entitled to any tax deduction with respect to an incentive stock option if the participant holds the shares for the incentive
stock option statutory holding periods.
- •
- Impact of Section 162(m) Deduction Limitation. Section 162(m) imposes a $1,000,000 cap on the compensation deduction that a public company may take in respect of compensation paid to its "covered employees" (which includes its chief executive officer and its next three most highly compensated employees other than its chief financial officer), but excludes from the calculation of amounts subject to this limitation any amounts that constitute QPBC. Under current tax law, we do not expect Section 162(m) to apply to awards under the 2017 LTIP until the earliest to occur of (1) our annual stockholders meeting at which members of our Board are to be elected that occurs after the close of the third calendar year following the year of this offering; (2) a material modification of the 2017 LTIP; (3) an exhaustion of the share supply under the 2017 LTIP; or (4) the expiration of the 2017 LTIP. However, performance criteria may still be used with respect to performance-based awards that are not intended to constitute QPBC.
In order to constitute QPBC, in addition to certain other requirements, the relevant amounts must be payable only upon the attainment of pre-established, objective performance goals set by
198
the Compensation Committee and linked to stockholder-approved performance criteria. The 2017 LTIP sets forth the applicable performance criteria that may be used in making such awards, and the objectively determinable adjustments to the applicable performance criteria that may be used. Performance targets applicable to awards intended to constitute QPBC will be related to measures of one or more of the criteria listed below. Such criteria may be determined by reference to the performance of the Company, Altice N.V., an affiliate or a business unit, product or service thereof or any combination of the foregoing. Such criteria may also be measured on a per customer, subscriber, homes passed, basic or diluted share basis or any combination of the foregoing and may reflect absolute performance, incremental performance or comparative performance to other companies (or their products or services) determined on a gross, net, GAAP or non-GAAP basis, with respect to one or more of the following: net or operating income or other measures of profit; measures of revenue; earnings before interest, taxes, depreciation and amortization (EBITDA); cash flow, free cash flow, adjusted operating cash flow and similar measures; return on equity, investment, assets or capital; gross or operating margins or savings; performance relative to budget, forecast or market expectations; market share or penetration, subscriber or customer acquisition or retention, ratings or viewership; operating metrics relating to sales, installations or customer service or satisfaction; capital spending management, network upgrades or product or service deployments; a specified increase in the fair market value of the Company's common stock or that of Altice N.V.; a specified increase in the private market value of the Company; the price of the Company's common stock or that of Altice N.V.; earnings per share; and/or total shareholder return.
Following the completion of each performance period, for QPBC, the Compensation Committee will determine the extent to which the performance targets have been achieved or exceeded. If the minimum performance targets for awards intended to constitute QPBC are not achieved, no payment will be made.
Changes in Capitalization
In the event of certain specified changes in capitalization set forth in the 2017 LTIP, the number and kind of shares of Class A common stock authorized for issuance under the 2017 LTIP and the individual limits described above in "Limitation on Awards and Shares Available" will be equitably adjusted in the manner deemed necessary by our Board to preserve, but not increase, the benefits or potential benefits intended to be made available under the 2017 LTIP. Unless otherwise determined by our Board, such adjusted awards will be subject to the same restrictions and vesting or settlement schedules to which the underlying awards are subject (subject to the limitations of Section 409A of the Internal Revenue Code).
Plan Amendment or Termination
Our Board has the authority to amend, suspend, or terminate the 2017 LTIP. Furthermore, no amendment, suspension or termination will be effective without the approval of the Company's stockholders if such approval is required under applicable laws, rules and regulations.
New Plan Benefits
The benefits that will be awarded or paid under the 2017 LTIP are not currently determinable. Awards granted under the 2017 LTIP are within the discretion of our Board (subject to the prior written approval of Altice N.V. under the stockholders' agreement), and our Board has not determined future awards or who might receive them.
199
Description of Non-GAAP Financial Measures
The Non-GAAP financial measures disclosed here are measures used as performance targets in 2016 compensation programs in which the named executive officers of the Company participate. The measures under the heading Altice N.V. relate to the performance of Altice N.V., which reports on an International Financial Reporting Standards basis.
Altice N.V. Measures
Adjusted EBITDA—operating income before interest, taxes, depreciation and amortization, non-recurring items and other adjustments (equity-based compensation expenses).
Adjusted EBITDA – Capex – change in working capital—Adjusted EBITDA as defined above less capital expenditures and change in working capital.
Altice USA, Cequel and Cablevision
Adjusted EBITDA—net income (loss) excluding income taxes, income (loss) from discontinued operations, other non-operating income or expenses, loss on extinguishment of debt and write-off of deferred financing costs, gain (loss) on interest rate swap contracts, gain (loss) on equity derivative contracts, gain (loss) on investments, interest expense (including cash interest expense), interest income, depreciation and amortization (including impairments), share-based compensation expense or benefit, restructuring expense or credits and transaction expenses.
Adjusted EBITDA – Capex—Adjusted EBITDA as defined above less capital expenditures.
Adjusted EBITDA – Capex – change in working capital—Adjusted EBITDA as defined above less capital expenditures and change in working capital.
200
PRINCIPAL AND SELLING STOCKHOLDERS
The following table presents certain information as of May 31, 2017 with respect to the beneficial ownership of our common stock, and as adjusted to give effect to the Organizational Transactions and sale of Class A common stock offered by us and the selling stockholders in this offering, assuming no exercise and full exercise of the underwriters' option to purchase additional shares of Class A common stock, by:
- •
- each of our current directors;
- •
- each of our named executive officers;
- •
- all of our directors and executive officers as a group;
- •
- each stockholder known by us to be the beneficial owner of more than 5% of our outstanding shares of our Class A common stock and
Class B common stock; and
- •
- each selling stockholder.
Beneficial ownership for the purposes of the following table is determined in accordance with the rules and regulations of the SEC. These rules generally provide that a person is the beneficial owner of securities if such person has or shares the power to vote or direct the voting thereof, or to dispose or direct the disposition thereof or has the right to acquire such powers within 60 days. All amounts in the following table, except for the shares to be sold in this offering, are estimated assuming an initial public offering price at the mid-point of the price range set forth on the cover page of this prospectus. Except as disclosed in the footnotes to this table and subject to applicable community property laws, we believe that each stockholder identified in the table possesses sole voting and investment power over all shares of common stock shown as beneficially owned by the stockholder. Unless otherwise indicated in the table or footnotes below, the address for each beneficial owner is c/o Altice USA, Inc., 1111 Stewart Avenue, Bethpage, New York 11714.
We have based the percentage ownership of our common stock before this offering on 234,681,978 shares of our Class A common stock and 490,318,022 shares of our Class B common stock outstanding based on an assumed initial public offering price of $29.00 and completion of the Organizational Transactions. For more information, see "Summary—Ownership and Organization—Organizational Transactions." Percentage ownership of our common stock after this offering (assuming no exercise of the underwriters' option to purchase additional shares of Class A common stock) also assumes the sale by us and the selling stockholders of 46,551,725 shares of Class A common stock in this offering. Percentage ownership of our common stock after this offering (assuming full exercise of the underwriters' option to purchase additional shares of Class A common stock) also assumes the sale by the Selling Stockholders of an additional 5,172,414 shares of Class A common stock.
201
| |
Shares Beneficially Owned Before this Offering(1) |
|
|
Shares Beneficially Owned After this Offering (Assuming No Exercise of Option) |
|
|
Shares Beneficially Owned After this Offering (Assuming Full Exercise of Option) |
|
||||||||||||||||||||||||||||||||||||||||||||
|---|---|---|---|---|---|---|---|---|---|---|---|---|---|---|---|---|---|---|---|---|---|---|---|---|---|---|---|---|---|---|---|---|---|---|---|---|---|---|---|---|---|---|---|---|---|---|---|---|---|---|---|---|
| |
% Total Voting Power Before this Offering |
|
% Total Voting Power After this Offering(2) (Assuming No Exercise of Option) |
Number of Shares Being Offered (Assuming Full Exercise of Option) |
% Total Voting Power After this Offering (Assuming Full Exercise of Option) |
|||||||||||||||||||||||||||||||||||||||||||||||
| |
Shares Being Offered (Assuming No Exercise of Option) |
|||||||||||||||||||||||||||||||||||||||||||||||||||
| |
Class A | Class B | Class A | Class B | Class A | Class B | ||||||||||||||||||||||||||||||||||||||||||||||
Name of Beneficial Owner
|
Number | % | Number | % | Number | % | Number | % | Number | % | Number | % | ||||||||||||||||||||||||||||||||||||||||
5% Stockholders |
||||||||||||||||||||||||||||||||||||||||||||||||||||
Altice Parties(1)(2)(6) |
63,661,064 | 27.1 | % | 490,318,022 | 100.0 | % | 98.6 | % | - | 63,661,064 | 25.8 | % | 490,318,022 | 100.0 | % | 98.5 | % | - | 63,661,064 | 25.8 | % | 490,318,022 | 100.0 | % | 98.5 | % | ||||||||||||||||||||||||||
CPPIB(4)(6) |
65,742,346 | 28.0 | % | - | 0.0 | % | 0.5 | % | 13,559,429 | 52,182,917 | 21.1 | % | - | 0.0 | % | 0.4 | % | 15,593,343 | 50,149,003 | 20.3 | % | - | 0.0 | % | 0.4 | % | ||||||||||||||||||||||||||
BC Partners(3)(6) |
101,445,919 | 43.2 | % | - | 0.0 | % | 0.8 | % | 20,923,330 | 80,522,589 | 32.6 | % | - | 0.0 | % | 0.6 | % | 24,061,830 | 77,384,089 | 31.4 | % | - | 0.0 | % | 0.6 | % | ||||||||||||||||||||||||||
Named Executive Officers, Directors and nominees(5)(6) |
||||||||||||||||||||||||||||||||||||||||||||||||||||
Dexter Goei(7) |
1,864,209 | 0.7 | % | — | 0.0 | % | 0.0 | % | — | 1,864,209 | 0.7 | % | — | 0.0 | % | 0.0 | % | — | 1,864,209 | 0.7 | % | — | 0.0 | % | 0.0 | % | ||||||||||||||||||||||||||
Charles Stewart |
18,643 | 0.0 | % | — | 0.0 | % | 0.0 | % | — | 18,643 | 0.0 | % | — | 0.0 | % | 0.0 | % | — | 18,643 | 0.0 | % | — | 0.0 | % | 0.0 | % | ||||||||||||||||||||||||||
Abdelhakim Boubazine |
932,105 | 0.3 | % | — | 0.0 | % | 0.0 | % | — | 932,105 | 0.3 | % | — | 0.0 | % | 0.0 | % | — | 932,105 | 0.3 | % | — | 0.0 | % | 0.0 | % | ||||||||||||||||||||||||||
Lisa Rosenblum |
18,643 | 0.0 | % | — | 0.0 | % | 0.0 | % | — | 18,643 | 0.0 | % | — | 0.0 | % | 0.0 | % | — | 18,643 | 0.0 | % | — | 0.0 | % | 0.0 | % | ||||||||||||||||||||||||||
David Connolly |
— | 0.0 | % | — | 0.0 | % | 0.0 | % | — | — | 0.0 | % | — | 0.0 | % | 0.0 | % | — | — | 0.0 | % | — | 0.0 | % | 0.0 | % | ||||||||||||||||||||||||||
Michel Combes |
— | 0.0 | % | — | 0.0 | % | 0.0 | % | — | — | 0.0 | % | — | 0.0 | % | 0.0 | % | — | — | 0.0 | % | — | 0.0 | % | 0.0 | % | ||||||||||||||||||||||||||
Dennis Okhuijsen |
— | 0.0 | % | — | 0.0 | % | 0.0 | % | — | — | 0.0 | % | — | 0.0 | % | 0.0 | % | — | — | 0.0 | % | — | 0.0 | % | 0.0 | % | ||||||||||||||||||||||||||
Jérémie Bonnin |
— | 0.0 | % | — | 0.0 | % | 0.0 | % | — | — | 0.0 | % | — | 0.0 | % | 0.0 | % | — | — | 0.0 | % | — | 0.0 | % | 0.0 | % | ||||||||||||||||||||||||||
Raymond Svider |
— | 0.0 | % | — | 0.0 | % | 0.0 | % | — | — | 0.0 | % | — | 0.0 | % | 0.0 | % | — | — | 0.0 | % | — | 0.0 | % | 0.0 | % | ||||||||||||||||||||||||||
Mark Mullen |
— | 0.0 | % | — | 0.0 | % | 0.0 | % | — | — | 0.0 | % | — | 0.0 | % | 0.0 | % | — | — | 0.0 | % | — | 0.0 | % | 0.0 | % | ||||||||||||||||||||||||||
All executive officers and directors as a group (10 persons)(6) |
2,833,600 | 1.0 | % | — | 0.0 | % | — | 2,833,600 | 1.0 | % | — | 0.0 | % | 0.0 | % | — | 2,833,600 | 1.0 | % | — | 0.0 | % | 0.0 | % | ||||||||||||||||||||||||||||
- *
- Less
than 0.1%
- (1)
- Mr. Drahi
is the sole indirect controlling shareholder of Next Alt S.à r.l. ("Next Alt"), a personal holding company. As of May 31,
2017, Next Alt is holder of 59.37% of the share capital and voting rights of Altice N.V. Altice N.V. maintains a one-tier board of four executive board members and three non-executive
board members. The executive board members are appointed by shareholders at the general meeting at the binding nomination of Next Alt. A4 S.A., which is controlled by the family of
Mr. Drahi, is an executive board member of Altice N.V. Altice N.V. owns an indirect controlling interest in CVC 3. Mr. Drahi and Altice N.V. may each be deemed to
beneficially own the 490,317,022 shares of Class B common stock owned by CVC 3. CVC 3 is also the sole member of Neptune Holding US GP LLC, which is the sole general partner of
Holding LP. As such, Mr. Drahi and Altice N.V. may each be deemed to beneficially own 56,879,232 shares of Class A common stock held by Holding LP. A4 S.A. owns
1,000 shares of Class A common stock and 1,000 shares of Class B common stock. In addition, Mr. Drahi is the sole controlling shareholder of Uppernext, which owns
6,780,831 shares of Class A common stock. Altice N.V. and A4 S.A. are parties to a stockholders agreement with the Company to be entered into at the closing of the IPO. For more
information, see "Related Party Transactions."
- (2)
- The
principal address for Next Alt, Uppernext and A4 S.A. is 3 boulevard Royal, L-2449 Luxembourg, Grand Duchy of Luxembourg; the principal address for
Altice N.V. and CVC 3 is Prins Bernhardplein 200, 1097 JB Amsterdam, The Netherlands; the principal address for Neptune Holding US GP LLC and Holding LP is
c/o Altice USA, Inc., 1111 Stewart Avenue, Bethpage, NY 11714.
- (3)
- CIE
Management IX Limited, which is an entity under common control with BC Partners LLP, is the ultimate general partner of, and has investment control over
the Class A common stock held by the funds commonly known as BC European Capital IX—1 LP through 11 LP and BC European Capital—Suddenlink
Co-Investment 1 through 6 LP, and has investment control over the Class A common stock held by BC European Capital IX Limited. CIE Management IX Limited is also the
ultimate control party of SuddenVision S.a.r.l., which will hold these shares after the consummation of the offering. CIE Management IX Limited may, therefore, be deemed to have shared
voting and investment power over Class A common stock beneficially owned by each of these entities. Because CIE Management IX Limited is managed by a board of directors, no individuals have
ultimate voting or investment control (as determined by Rule 13d-3) over the shares that may be deemed beneficially owned by CIE Management IX Limited. The principal address of CIE
Management IX Limited is Heritage Hall, Le Marchant Street, St. Peter Port, Guernsey, GY1 4HY, Channel Islands.
- (4)
- CPPIB
is overseen by a board of directors. None of the directors of the board of directors has sole voting or dispositive power with respect to the shares of our
common stock beneficially owned by CPPIB. The address of CPPIB is One Queen Street East, Suite 2500, Toronto, ON, M5C 2W5.
- (5)
- The
address for these persons is c/o Altice USA, Inc., 1111 Stewart Avenue, Bethpage, NY 11714.
- (6)
- Share
numbers for Class A and Class B common stock are based on an assumed initial public offering price of $29.00 per share, the mid-point of the
price range set forth on the cover of this prospectus. If the initial public offering price is $27.00 per share, the low end of the price range set forth on the cover of this prospectus, the shares
beneficially owned before this offering would be the following: Altice Parties would beneficially own 63,132,716 shares of Class A common stock and 489,905,782 shares of Class B common
stock, BCP would beneficially own 102,063,102 shares of Class A common stock, CPPIB would beneficially own 66,142,314 shares of Class A common stock and all executive officers and
directors as a group would beneficially own 2,808,234 shares of Class A common stock. If the initial public offering price is $31.00 per share, the high end of the price range set forth on the
cover of this prospectus, the shares beneficially owned before this offering would be the following: Altice Parties would beneficially own 64,121,237 shares of Class A common stock and
490,677,071 shares of Class B common stock, BCP would beneficially own 100,908,372 shares of Class A common stock, CPPIB would beneficially own 65,393,987 shares of Class A common
stock and all executive officers and directors as a group would beneficially own 2,855,692 shares of Class A common stock.
- (7)
- Mr. Goei holds his shares of Class A common stock through Vinluam S.a.r.l., SPF. The principal address for Vinluam S.a.r.l., SPF is 3, boulevard Royal, L-2449 Luxembourg, Grand Duchy of Luxembourg.
202
CERTAIN RELATIONSHIPS AND RELATED-PARTY TRANSACTIONS
Our Relationship with Altice N.V.
Altice N.V., through dedicated affiliates, applies a common approach, referred to as the Altice Way, to leveraging the Altice Group's core strategic, operational and technical capabilities in a coordinated, centralized manner for the benefit of its operating subsidiaries and to reorganize their processes and redeploy their resources in order to improve operational efficiency, foster innovation and create long-term value for stockholders.
This approach encompasses know-how, methodologies, best practices and services, developed by a team of specialists in affiliates of Altice N.V., to simplify organizations, streamline decision-making and redeploy physical, technical and financial resources for network investment and customer service, allowing its operating subsidiaries to focus on network improvements and customer experience enhancements. Altice N.V. implements this approach by focusing on a number of core principles, including: (1) improving network quality, upgrading and building high speed communications networks to ensure the reliability and flexibility of the services provided; (2) improving customer relationship management and maximizing customer experience, notably by leveraging efficient IT platforms, focusing on digitalization and simplifying processes; (3) leveraging the Altice Group's international media and content organization as part of Altice N.V.'s global ambition of convergence; (4) developing, launching and integrating new products, services and business models, including the creation of the next generation communications access and content convergence platforms with market-leading home hubs; (5) delivering to our customers the best news channels, the best sport content, the best documentary programs and creating the best series and movies; (6) delivering key technology services and market-leading research and development through Altice Labs, the Group's global research and development arm, promoting innovation and transforming technical knowledge into marketable competitive advantages (including the creation and monetization of world-class data analytics); (7) leveraging branding, sales and marketing strategies and synergies; and (8) selecting strategic suppliers and improving technical and commercial negotiations through centralized procurement leveraging the Altice Group's global scale.
In connection with Altice N.V.'s implementation of this approach at Altice USA, we have entered into, and will in the future enter into, transactions and agreements with our affiliates in the ordinary course of business, subject to compliance with our policy regarding related-party transactions, including relating to:
- •
- Our acquisition of software and network equipment such as routers, power supply and transceiver modules, including equipment to be used in our
new home communications hub;
- •
- Our procurement of services, such as for the design, development, integration, support and maintenance of the user interface software for our
new home communications hub; access to an international communications backbone, international carrier services and call termination services; and real estate and real estate services;
- •
- Our purchase of customer and technical service support and services and licensing of intellectual property, including patents, trademarks and
other rights; and
- •
- Our acquisition of content, including our agreement relating to i24 News, an international news channel majority owned by Altice N.V. in which we have a 25% investment in its U.S. business.
Altice Technical Services
ATS is a subsidiary of Altice N.V. specializing in the engineering, supply, construction and deployment of networks, in particular FTTH broadband networks, and the provision of network upgrade and maintenance services. ATS has developed end-to-end network construction and
203
maintenance control processes enabling network operators to optimize their operational risks and costs. Prior to the consummation of the offering, we will enter into an agreement pursuant to which ATS, through its U.S. affiliate, will provide a full range of services to Altice USA, including construction and maintenance of its networks, equipment sale and commercial and residential access installation with associated services such as, network access points installation, disconnection and maintenance, equipment warehousing, equipment warranty and repair and security services. ATS will sell to Altice USA the products related to such services, including optical links from the network head-end to the household, optical node, optical fiber and coaxial cables, distribution frames and connections and set-top boxes.
Management Advisory and Consulting Services
A subsidiary of Altice N.V. provides consulting, advisory and other services to us in connection with our acquisitions, divestitures, investments, capital raising, financial and business affairs for a quarterly fee. See Note 13 to our unaudited consolidated financial statements and Note 15 to our audited consolidated financial statements included elsewhere herein for more information. The subsidiary will assign the agreement under which it provides these services to us to Altice N.V. prior to the closing of this offering.
Stockholders' Agreement
In connection with this offering, we will to enter into a stockholders' agreement with Altice N.V. and A4 S.A. Pursuant to this agreement, Altice N.V. will have the right to nominate a majority of the members of our board of directors, one of which will be an individual designated by A4 S.A., and Altice N.V. will agree to vote its shares in favor of electing the individual designated by A4 S.A. If a director designated by Altice N.V. or by A4 S.A. resigns or is removed from the board of directors, as the case may be, only another director designated by Altice N.V. or by A4 S.A., as the case may be, may fill the vacancy. The stockholders' agreement will require us to obtain the consent of Altice N.V. before we may take certain actions specified therein. See "Description of Capital Stock—Stockholders' Agreement."
Stockholders and Registration Rights Agreement
In connection with this offering, we expect to enter into a stockholders and registration rights agreement with Altice N.V., BCP and CPPIB. This agreement will provide to Altice N.V. an unlimited number of "demand" registrations for the registration of the sale of our common stock in a minimum aggregate amount (the "Minimum Amount"), which is the lowest of (i) $100,000,000, (ii) one percent (1%) of the value of Shares (as defined in the stockholders and registration rights agreement) that are publicly traded as of the close of business on the most recent business day or (iii) such lesser amount as agreed by the Sponsors and Altice N.V. Additionally, the agreement will provide BCP and CPPIB each with one "demand" registration every twelve months, subject to an exception, and customary "piggyback" registration rights to Altice N.V., BCP and CPPIB. The stockholders and registration rights agreement will also provide that we will pay certain expenses relating to such registrations and indemnify Altice N.V., BCP and CPPIB against certain liabilities which may arise under the Securities Act. Each Sponsor will also have the right to, among other things, designate one non-voting observer to our board of directors for so long as such Sponsor and certain of its affiliates own at least 4% of the issued and outstanding shares of Class A and Class B common stock and there is no director who is a designee of such Sponsor on our board of directors. Subject to certain exceptions, each non-voting observer will be permitted to attend all meetings of our board of directors and the committees thereof.
204
Right of First Refusal
Any proposed sale of shares of common stock held by certain members of our management will be subject to a right of first refusal in favor of Altice N.V.
Notes Payable to Affiliates and Related Parties
In June 2016, in connection with Cablevision Acquisition, affiliates of the Sponsors and Altice N.V. purchased $875 million aggregate principal amount of Altice USA's 10.75% notes due 2023 and $875 million aggregate principal amount of Altice USA's 11.00% notes due 2024. Prior to the consummation of this offering, the notes held by the affiliates of the Sponsors (together with accrued and unpaid interest and applicable premium) will be converted into shares of the Company's Class A common stock and the notes held by an affiliate of Altice N.V. (together with accrued and unpaid interest and applicable premium) will be converted into shares of the Company's Class B common stock. See "Summary—Ownership and Organization—Organizational Transactions" for more information.
Our Policy Regarding Related-Party Transactions
All agreements and transactions between us, on the one hand, and affiliates of Altice N.V. on the other hand, will be subject to the Related-Party Transaction Approval Policy that our board of directors will adopt prior to the completion of this offering. Under this policy, the Audit Committee of the board consisting entirely of directors who have been determined by the board to be independent directors for purposes of the NYSE corporate governance standards reviews and approves or takes such other action as it may deem appropriate with respect to transactions involving the Company and its subsidiaries, on the one hand, and in which any director, officer, greater than 5% stockholder of the Company or any other "related person" as defined in Item 404 of Regulation S-K under the Securities Act ("Item 404") has or will have a direct or indirect material interest. This approval requirement covers any transaction that meets the related-party disclosure requirements of the SEC as set forth in Item 404. Under the Related-Party Transaction Approval Policy, the Audit Committee similarly oversees approval of transactions and arrangements between the Company and its subsidiaries, on the one hand, and Altice N.V. and its other subsidiaries, on the other hand, to the extent involving amounts in excess of the dollar threshold set forth in Item 404 (the "Item 404 Threshold").
The Related-Party Transaction Approval Policy provides that to simplify the administration of the approval process under the Related-Party Transaction Approval Policy, the Audit Committee may, where it deems it to be appropriate, establish guidelines for certain types of these transactions. The approval requirement will not apply to the implementation and administration of intercompany arrangements under the Related-Party Transaction Approval Policy, but covers any amendments, modifications, terminations or extensions involving amounts in excess of the Item 404 Threshold, as well as the handling and resolution of any disputes involving amounts in excess of the Item 404 Threshold. The Company's executive officers and directors who are also senior executives or directors of Altice N.V., as the case may be, may participate in the negotiation, execution, amendment, modification, or termination of intercompany arrangements subject to the Related-Party Transaction Approval Policy, as well as in any resolution of disputes under intercompany arrangements, on behalf of either or both of the Company and Altice N.V., as the case may be, under the direction of the Audit Committee when acting on behalf of the Company.
The Related-Party Transaction Approval Policy cannot be amended or terminated without the prior approval of a majority of the Audit Committee.
205
General
The following description of our capital stock and certain provisions of our amended and restated certificate of incorporation and amended and restated bylaws are summaries and are qualified by reference to the amended and restated certificate of incorporation and the amended and restated bylaws that will be in effect on the closing of this offering. Copies of these documents will be filed with the SEC as exhibits to our registration statement, of which this prospectus forms a part. The descriptions of the common stock and preferred stock reflect changes to our capital structure that will be in effect on the closing of this offering.
On the closing of this offering, our amended and restated certificate of incorporation will provide for three classes of common stock: Class A common stock, Class B common stock and Class C common stock. In addition, our amended and restated certificate of incorporation will authorize shares of undesignated preferred stock, the rights, preferences and privileges of which may be designated from time to time by our board of directors.
On the closing of this offering, our authorized capital stock will consist of 9,100,000,000 shares, all with a par value of $0.01 per share, of which:
- •
- 4,000,000,000 shares are designated Class A common stock;
- •
- 1,000,000,000 shares are designated Class B common stock;
- •
- 4,000,000,000 shares are designated Class C common stock; and
- •
- 100,000,000 shares are designated preferred stock.
Immediately following the Organizational Transactions but prior to the completion of this offering, we will have outstanding 725,000,000 shares of common stock. Upon consummation of this offering, there will be 246,750,944 shares of our Class A common stock issued and outstanding and 490,318,022 shares of our Class B common stock issued and outstanding.
Class A Common Stock, Class B Common Stock and Class C Common Stock
Voting Rights
Holders of our Class A common stock are entitled to one vote per share and holders of our Class B common stock are entitled to twenty-five votes per share on any matter submitted to a vote of our stockholders. Except as set forth below or as required by Delaware law, holders of shares of Class A common stock and Class B common stock will vote together as a single class on all matters (including the election of directors) submitted to a vote of our stockholders.
If we issue any shares of Class C common stock, they will not be entitled to any votes on any matter that is submitted to a vote of our stockholders, except as provided in our certificate of incorporation or as required by Delaware law. Delaware law would require the holders of Class A common stock, Class B common stock or Class C common stock to vote separately as a single class on a matter if we were to seek to:
- •
- amend our certificate of incorporation to increase the authorized number of shares of a class of stock (except as otherwise provided in the
certificate of incorporation) or increase or decrease the par value of a class of stock; or
- •
- amend our certificate of incorporation in a manner that altered or changed the powers, preferences, or special rights of a class of stock in a manner that affected them adversely.
206
As permitted by Delaware law, our amended and restated certificate of incorporation provides that the number of authorized shares of common stock or any class of common stock may be increased or decreased (but not below the number of shares of common stock then outstanding) by the affirmative vote of the holders of a majority of the voting power of the Class A common stock and Class B common stock, voting together as a single class.
Each of our directors and director nominees will stand for election at each of our annual meetings of stockholders. Our amended and restated certificate of incorporation does not provide for cumulative voting for the election of directors. Rather, a majority of the votes cast is required for a director or director nominee to be duly elected in any uncontested election. Because our stockholders do not have cumulative voting rights, stockholders holding a majority of the voting power of our capital stock will be able to elect all of our directors. Stockholders holding a majority of the voting power of our capital stock also will be able to remove each of our directors with or without cause. Pursuant to the stockholders' agreement we will enter into with Altice N.V. and A4 S.A. in connection with this offering, Altice N.V. will have the right to nominate a majority of the members of our board of directors, one of which will be an individual designated by A4 S.A., and Altice N.V. will agree to vote its shares in favor of electing the individual designated by A4 S.A. If a director designated by Altice N.V. or by A4 S.A. resigns or is removed from the board of directors, as the case may be, only another director designated by Altice N.V. or by A4 S.A., as the case may be, may fill the vacancy. See "—Stockholders' Agreement."
Our amended and restated certificate of incorporation also gives the holders of at least a majority of the voting power of our capital stock the right to act by written consent in lieu of a meeting and without notice.
Economic Rights
Except as otherwise expressly provided in our amended and restated certificate of incorporation or required by Delaware law, all shares of Class A common stock, Class B common stock and Class C common stock will have the same rights and privileges and rank equally, share ratably and be identical in all respects for all matters, including those described below.
Dividends and Distributions. Subject to preferences that may apply to any shares of preferred stock outstanding at the time, the holders of outstanding shares of Class A common stock, Class B common stock and Class C common stock will be entitled to share equally, on a per share basis, in any dividend or distribution of funds legally available if our board of directors, in its discretion, determines to declare and pay dividends and only then at the times and in the amounts that our board of directors may determine. In the event that a dividend is paid in the form of shares of our capital stock or rights to acquire or securities convertible into or exchangeable for shares of our capital stock, then, in the discretion of our board of directors, either (A) the holders of shares of Class A common stock, Class B common stock and Class C common stock shall receive the identical class of securities on an equal per share basis, or (B) (i) the holders of shares of Class A common stock shall receive Class A common stock, or securities convertible into or exchangeable for shares of Class A common stock or rights to acquire such securities, as the case may be; (ii) the holders of shares of Class B common stock shall receive Class B common stock, or securities convertible into or exchangeable for shares of Class B common stock or rights to acquire such securities, as the case may be; and (iii) the holders of shares of Class C common stock shall receive Class C common stock, or securities convertible into or exchangeable for shares of Class C common stock or rights to acquire such securities, as the case may be; in each such case in clause (B), in an equal amount per share.
207
Distributions of Another Corporation's Securities. Unless otherwise approved by the board of directors, where the securities of another corporation are distributed, they must only be distributed to holders of Class A common stock, Class B common stock and Class C common stock on the basis that:
- (a)
- the
holders of Class A common stock, Class B common stock and Class C common stock receive the identical class of securities; or
- (b)
- subject
to the remainder of this paragraph, the holders of Class A common stock, Class B common stock and Class C common stock each receive
different classes of securities; or
- (c)
- subject to the remainder of this paragraph, the holders of one or more class of common stock receive a different class of securities than the holders of all other classes of common stock,
in each case, on an equal per share basis and to holders of any shares of preferred stock outstanding at the time in accordance with the terms thereof.
To the extent that a dividend is declared and paid pursuant to paragraph (b) or (c), then the holders of Class B common stock shall receive the securities having the highest number of votes per share (or, in the case of convertible securities, the securities convertible into, exchangeable for or evidencing the right to purchase, the securities with the highest number of votes per share) and the holders of each other class of common stock shall receive the securities having the lesser number of votes per share (or, in the case of convertible securities, the securities convertible into, exchangeable for or evidencing the right to purchase, the securities with the lesser number of votes per share): (A) in each case, without regard to whether such voting rights differ to a greater or lesser extent than the corresponding differences in voting rights (and related differences in designation, conversion and rights to distributions) between the Class A common stock, the Class B common stock and the Class C common stock; and (B) provided that the different classes of securities (and, in the case of securities convertible into, exchangeable for or evidencing the right to purchase securities, the securities resulting from such conversion, exchange or purchase) do not differ in any respect other than with respect to their relative voting rights (and related differences in designation, conversion, redemption and rights to distributions).
To the extent that a dividend is declared and paid pursuant to paragraph (b) or (c), and in the event that the holders of Class A common stock receive a class of securities having different rights than those received by the holders of Class C common stock, then: (A) the rights of the different classes of securities (and, in the case of securities convertible into, exchangeable for or evidencing the right to purchase securities, the securities resulting from such conversion, exchange or purchase) may not differ in any respect other than with respect to their relative voting rights (and related differences in designation, conversion, redemption and rights to distributions); and (B) the relevant classes of securities shall be distributed to the holders of Class A common stock and Class C common stock such that the relative voting rights (and related differences in designation, conversion, redemption, rights to dividends in specie comprising securities and rights to distributions) of the class of securities (or, in the case of convertible securities, the securities convertible into, exchangeable for or evidencing the right to purchase, the securities resulting from such conversion, exchange or purchase) to be received by the holders of Class A common stock on the one hand and Class C common stock on the other hand corresponds to the extent practicable to the relative voting rights (and related differences in designation, conversion, redemption and rights to distributions) of the Class A common stock as compared to the Class C common stock.
Liquidation Rights. Upon our dissolution, liquidation or winding up, the assets legally available for distribution to our stockholders will be distributable ratably among the holders of our Class A common stock, Class B common stock and Class C common stock subject to prior satisfaction of all outstanding debt and liabilities and the preferential rights and payment of liquidation preferences, if any, on any outstanding shares of preferred stock unless different treatment of such class with respect to
208
distributions upon any such liquidation, dissolution or winding up is approved in advance by the affirmative vote of the holders of a majority of the voting power of the Class A common stock and Class B common stock, each voting separately as a class.
Equal Status. Except as expressly provided in our amended and restated certificate of incorporation or required by applicable law, shares of Class A common stock, Class B common stock and Class C common stock have the same rights and privileges and rank equally, share ratably and are identical in all respects as to all matters. In the event of (i) a consolidation or merger of us with or into any other entity; (ii) any tender offer or exchange offer by any person or entity pursuant to an agreement to which we are a party or that our board of directors recommends; or (iii) a sale by Altice N.V. or any of its subsidiaries that holds shares of our Class B common stock or, solely in the event shares of our Class B common stock have been distributed to Mr. Drahi, his heirs or entities or trusts directly or indirectly under his or their control or formed for his or their benefit or any affiliate of Mr. Drahi, his heirs or entities or trusts directly or indirectly under his or their control or formed for his or their benefit (together with Altice N.V. and any of its subsidiaries that hold such shares, the "Altice Holders"), a sale by Mr. Drahi, such heirs or such trusts or entities or such Affiliates, in one or a series of related transactions, whether to a single purchaser or purchasers constituting a "group" as defined in Section 13(d) of the Securities Exchange Act of 1934, of shares of Class B common stock representing (a) at least 40% of the votes entitled to be cast by all stockholders entitled to vote in an election of directors and (b) a greater number of votes than the Altice Holders collectively are entitled to cast immediately following such sale, the holders of Class A common stock, Class B common stock and Class C common stock shall be entitled to participate proportionately and to receive, or to elect to receive, the same form of consideration and the same amount of consideration on a per share basis. Notwithstanding the foregoing, if any securities consideration is paid, distributed or offered to holders of shares of Class A common stock, Class B common stock or Class C common stock in any such transaction, such consideration may differ only in terms of voting rights such that the holder of a share of Class B common stock shall receive or have the right to elect to receive the securities having the highest number of votes per share (or, in the case of convertible securities, the securities convertible into, exchangeable for or evidencing the right to purchase, the securities with the highest number of votes per share) and the holders of each other class of Common Stock shall receive or have the right to elect to receive the securities having the lesser number of votes per share (or, in the case of convertible securities, the securities convertible into, exchangeable for or evidencing the right to purchase, the securities with the lesser number of votes per share), and any securities that the holder of a share of Class C common stock shall receive or have the right to elect to receive shall either have no voting rights or the same voting rights as the securities that a holder of Class A common stock shall receive or have the right to elect to receive.
Subdivisions and Combinations. If we subdivide or combine in any manner outstanding shares of Class A common stock, Class B common stock, or Class C common stock, the outstanding shares of the other classes will be subdivided or combined in the same manner concurrently.
No Preemptive or Similar Rights
Our Class A common stock, Class B common stock and Class C common stock are not entitled to preemptive rights and are not subject to conversion or redemption provisions, except for the conversion provisions with respect to the Class B common stock and Class C common stock described below. Any one or more series of Preferred Stock will have only such preemptive or similar rights granted to the holders thereof by our board of directors.
Conversion and Transfers
Each share of Class B common stock is convertible at any time at the option of the holder into one share of Class A common stock.
209
Our amended and restated certificate of incorporation will not provide for the automatic conversion of shares of our Class B common stock upon transfer under any circumstances. As a result, the holders of Class B common stock will be free to transfer them without converting them into shares of our Class A common stock. Any shares of Class B common stock that are converted into Class A common stock may not be reissued. The disparate voting rights of the shares of our Class B common stock will not change upon transfer unless first converted into shares of Class A common stock.
Immediately prior to any conversion of all outstanding shares of Class B common stock into Class A common stock, the holders of majority of the voting power of the Class B common stock at the time of such conversion, may, in connection with such conversion, require that each share of Class C common stock shall automatically be converted into one share of Class A common stock on a date fixed by our board of directors, which date shall be no less than 61 days and no more than 180 days following the conversion of all outstanding shares of Class B common stock.
Preferred Stock
On the closing of this offering and under our amended and restated certificate of incorporation, our board of directors may, without further action by our stockholders, fix the rights, preferences, privileges and restrictions of up to an aggregate of 100,000,000 shares of preferred stock in one or more series and authorize their issuance. These rights, preferences and privileges could include dividend rights, conversion rights, voting rights, terms of redemption, liquidation preferences and the number of shares constituting any series or the designation of such series, any or all of which may be greater than the rights of our Class A common stock, Class B common stock or Class C common stock. Any issuance of our preferred stock could adversely affect the voting power of holders of our Class A common stock or Class B common stock, and the likelihood that such holders would receive dividend payments and payments on liquidation. In addition, the issuance of preferred stock could have the effect of delaying, deferring, or preventing a change of control or other corporate action. On the closing of this offering, no shares of preferred stock will be outstanding. We have no present plan to issue any shares of preferred stock.
Stockholders' Agreement
In connection with this offering, we will to enter into a stockholders' agreement with Altice N.V. and A4 S.A. Pursuant to this agreement, Altice N.V. will have the right to nominate a majority of the members of our board of directors, one of which will be an individual designated by A4 S.A., and Altice N.V. will agree to vote its shares in favor of electing the individual designated by A4 S.A. If a director designated by Altice N.V. or by A4 S.A. resigns or is removed from the board of directors, as the case may be, only another director designated by Altice N.V. or by A4 S.A., as the case may be, may fill the vacancy. Until the first date on which Altice N.V. and its affiliates other than us cease to beneficially own at least 20% of the voting power of our outstanding common stock, notwithstanding anything to the contrary in our amended and restated certificate of incorporation or bylaws, or in the governing documents of any of our subsidiaries, without the prior written approval of Altice N.V., we shall not (either directly or indirectly through an affiliate or otherwise or through one or a series of related transactions) take, or permit one of our subsidiaries to take, any of the following actions:
- (a)
- effect
or consummate a Change of Control (as defined in the stockholders' agreement) or publicly endorse a Change of Control (including by recommending any tender or
exchange offer that would result in a Change of Control) or enter into any agreement or arrangement to effect or consummate a Change of Control;
- (b)
- make any material change in the scope of our or our subsidiaries' business from the scope of our or our subsidiaries' business immediately prior to the completion of this offering;
210
- (c)
- acquire,
dispose of or spin off any securities, assets or liabilities other than acquisitions or dispositions of assets or liabilities in the ordinary course of
business consistent with past practice;
- (d)
- enter
into any joint venture, recapitalization, reorganization or other strategic alliance with any other Person (as defined in the stockholders' agreement);
- (e)
- issue
any Company Securities (as defined in the stockholders' agreement), except issuances pursuant to a compensation or similar plan approved by our board of
directors or a duly authorized committee thereof;
- (f)
- incur,
guarantee, assume, or refinance any indebtedness for borrowed money having a principal amount greater than $10 million (including debt obligations of
any other Person existing at the time such other Person merged with or into or became a subsidiary of, or substantially all of its business and assets were acquired by, by us or our subsidiary, and
debt obligations secured by a lien encumbering any asset acquired by us or any such subsidiary and including debt securities), or pledge or grant a security interest in any of our or our subsidiaries'
assets having a value of more than $10 million (other than debt obligations incurred in the ordinary course of business by us and our subsidiaries), or enter into any derivative transactions
involving a notional amount greater than $10 million;
- (g)
- redeem,
repurchase or otherwise acquire Company Common Stock (as defined in the stockholders' agreement) or any warrants, options, rights or securities convertible
into, exchangeable for or exercisable for, Company Common Stock, or redeem, repurchase or otherwise acquire or make any payment with respect to any share appreciation rights or phantom share plans
(other than repurchases of Company Common Stock from employees upon termination of employment pursuant to terms of duly approved equity grants or pursuant to a cashless exercise of equity grants) or
any re-pricing of duly approved equity awards;
- (h)
- amend
(or approve or recommend amendment of) our or any of our subsidiaries' certificates of incorporation or bylaws (or other similar organizational documents);
- (i)
- elect,
hire, replace or dismiss, or establish or modify the remuneration of, our Chief Executive Officer (or the equivalent successor position) (such person, the
"CEO"), Chief Financial Officer (or the equivalent successor position) (such person, the "CFO"), or Chief Operating Officer (or the equivalent successor position) (such person, the "COO"), in each
case, as elected or appointed by our board of directors;
- (j)
- elect,
hire, replace or dismiss, or establish or modify the remuneration of, any officer of the Company that directly reports to the CEO, CFO or COO;
- (k)
- establish
or modify the remuneration of directors on our board of directors;
- (l)
- decrease
or increase the number of directors serving on our board of directors;
- (m)
- approve
(or adopt) any of our operating and capital budgets for each fiscal year commencing with the fiscal year ended December 31, 2018, or any material
amendments thereto or deviations therefrom;
- (n)
- pay,
declare or set aside any sums or other property for the payment of dividends on any Company Common Stock or make any other distributions in respect of any
Company Common Stock or any warrants, options, rights or securities convertible into, exchangeable for or exercisable for, Company Common Stock;
- (o)
- other than as required by applicable law, form, or delegate authority to, any new committee or subcommittee thereof, of our board of directors, or delegate authority to any existing
211
- (p)
- commence
any liquidation, dissolution or voluntary bankruptcy, administration, recapitalization or reorganization in any form of transaction, make arrangements with
creditors, or consent to the entry of an order for relief in any involuntary case, or take the conversion of an involuntary case to a voluntary case, or consent to the appointment of or take
possession by a receiver, trustee or other custodian for all or substantially all of our or our subsidiaries' property, or otherwise seek the protection of any applicable bankruptcy or insolvency law;
- (q)
- amend,
modify or supplement (or approve or recommend amendment, modification or supplement of) the Related Party Transactions Policy; and
- (r)
- enter into any agreement or arrangement to do any of the foregoing.
committee or subcommittee thereof not set forth in the committee's charter or authorized by our board of directors prior to the completion of this offering;
Our amended and restated certificate of incorporation will also require the written approval of Altice N.V. before we may take the actions specified in paragraphs (a), (h) and (p).
Anti-Takeover Provisions
Certificate of Incorporation and Bylaws to be in Effect on the Closing of this Offering
A special meeting of stockholders may be called by a majority of our board of directors, the chair of our board of directors, stockholders holding a majority of the voting power of our capital stock or the director designated by A4 S.A. As described above in "Class A Common Stock, Class B Common Stock and Class C Common Stock—Voting Rights," our amended and restated certificate of incorporation will further provide for a tri-class common stock structure, as a result of which Altice N.V. generally will be able to control the outcome of all matters requiring stockholder approval, including the election of directors and significant corporate transactions, such as a merger or other sale of our company or its assets.
The foregoing provisions will make it more difficult for our existing stockholders, other than Altice N.V., to replace our board of directors as well as for another party to obtain control of us by replacing our board of directors. Because our board of directors will have the power to retain and discharge our officers, these provisions could also make it more difficult for existing stockholders or another party to effect a change in management. In addition, the authorization of undesignated preferred stock will make it possible for our board of directors to issue preferred stock with voting or other rights or preferences that could impede the success of any attempt to change our control.
Authorized but Unissued Shares
The authorized but unissued shares of common stock and preferred stock are available for future issuance without stockholder approval, subject to any limitations imposed by the listing standards of the NYSE. These additional shares may be used for a variety of corporate finance transactions, acquisitions and employee benefit plans. The existence of authorized but unissued and unreserved common stock and preferred stock could make more difficult or discourage an attempt to obtain control of us by means of a proxy contest, tender offer, merger or otherwise.
Section 203 of the DGCL
Section 203 of the DGCL generally prohibits a publicly-held Delaware corporation from engaging in a merger, asset sale or other transaction resulting in a financial benefit with any person who, together with affiliation and association, owns, or within the prior three years, did own, 15% or more of a corporation's voting stock. The prohibition continues for a period of three years after the date of the transaction in which the person became an owner of 15% or more of the corporation's voting stock
212
unless the transaction or the business combination is approved in a prescribed manner. The statute could prohibit or delay, defer or prevent a change in control with respect to Altice USA. However, by action of our board of directors we have waived the provisions of Section 203.
Choice of Forum
Our amended and restated bylaws will provide that the Court of Chancery of the State of Delaware (or, if the Court of Chancery does not have jurisdiction, another state or federal court located in the State of Delaware) shall be the exclusive forum for: (i) any derivative action or proceeding brought in our name or on our behalf; (ii) any action asserting a breach of fiduciary duty; (iii) any action asserting a claim against us arising under the DGCL; (iv) any action regarding our amended and restated certificate of incorporation or our amended and restated bylaws; or (v) any action asserting a claim against us that is governed by the internal affairs doctrine. Our amended and restated bylaws will permit our board of directors to approve the selection of an alternative forum.
Limitations of Liability and Indemnification
Our amended and restated certificate of incorporation will contain provisions indemnifying our directors and officers to the fullest extent permitted by law. In addition, as permitted by Delaware law, our amended and restated certificate of incorporation will provide that no director will be liable to us or our stockholders for monetary damages for breach of fiduciary duty as a director. The effect of this provision is to restrict our rights and the rights of our stockholders in derivative suits to recover monetary damages against a director for breach of fiduciary duty as a director, except for:
- •
- any breach of his or her duty of loyalty to us or our stockholders;
- •
- acts or omissions not in good faith which involve intentional misconduct or a knowing violation of law;
- •
- the payment of dividends or the redemption or purchase of stock in violation of Delaware law; or
- •
- any transaction from which the director derived an improper personal benefit.
This provision does not affect a director's liability under the federal securities laws.
To the extent our directors, officers and controlling persons will be indemnified under the provisions contained in our amended and restated certificate of incorporation, Delaware law or contractual arrangements against liabilities arising under the Securities Act, we have been advised that in the opinion of the SEC such indemnification is against public policy as expressed in the Securities Act and is therefore unenforceable.
Corporate Opportunities
The DGCL permits corporations to adopt provisions that renounce any interest or expectancy in, or any offer of an opportunity to participate in, specified business opportunities that are presented to the corporation or one or more of its officers, directors or stockholders. Our amended and restated certificate of incorporation that will be in effect on the closing of this offering recognizes that Mr. Drahi and certain directors, principals, officers, employees and/or other representatives of Altice N.V., A4 S.A. and their affiliates (each such director, principal, officer, employee and/or other representative, an "Altice Group Representative" and collectively, the "Altice Group Representatives") may serve as our directors, officers or agents and that Mr. Drahi, Altice N.V., A4 S.A., the Altice Group Representatives and their respective affiliates, and members of our board of directors designated by Altice N.V. and A4 S.A. pursuant to the stockholders' agreement (the "Designated Directors"), may now engage, may continue to engage and may in the future engage in the same or
213
similar activities or related lines of business as those in which we, directly or indirectly, may engage and/or other business activities that overlap with or compete with those in which we, directly or indirectly, may engage. In the amended and restated certificate of incorporation we have renounced our rights to certain business opportunities and the amended and restated certificate of incorporation provides that none of Mr. Drahi, Altice N.V., A4 S.A., any Altice Group Representative, any Designated Director, or their respective affiliates, have any duty to refrain from, directly or indirectly, engaging in the same or similar business activities or lines of businesses in which we or any of our affiliates engage or are reasonably likely to engage, or otherwise competing with us or any of our affiliates, or have any duty to communicate such opportunities to us, unless such opportunities arise in or are predominantly related to North America. The amended and restated certificate of incorporation further provides that, to the fullest extent permitted by law, none of Mr. Drahi, Altice N.V., A4 S.A., any Altice Group Representative, any Designated Director (including any Designated Director who serves as one of our officers) or any of the foregoing persons' affilates shall be liable to us or our stockholders for breach of any fiduciary duty solely because they engage in such activities.
Exchange Listing
Our Class A common stock has been approved for listing on the NYSE under the symbol "ATUS."
Transfer Agent and Registrar
On the closing of this offering, the transfer agent and registrar for our Class A common stock and Class B common stock will be American Stock Transfer & Trust Company, LLC.
214
DESCRIPTION OF CERTAIN INDEBTEDNESS
The following tables summarize certain indebtedness of the Company (dollars in thousands):
| |
|
|
|
Carrying Value | |||||||||||
|---|---|---|---|---|---|---|---|---|---|---|---|---|---|---|---|
| |
Maturity Date | Interest Rate |
Principal | March 31, 2017 |
December 31, 2016 |
||||||||||
CSC Holdings Restricted Group: |
|||||||||||||||
Revolving Credit Facility(a) |
$20,000 on October 9, 2020, remaining on November 30, 2021 |
4.16 | % | $ | 225,256 | $ | 196,407 | $ | 145,013 | ||||||
Term Loan Facility |
July 17, 2025 | 3.94 | % | 2,493,750 | 2,481,005 | 2,486,874 | |||||||||
Cequel: |
|||||||||||||||
Revolving Credit Facility(b) |
November 30, 2021 | — | — | — | — | ||||||||||
Term Loan Facility |
July 28, 2025 | 3.98 | % | 812,963 | 810,929 | 812,903 | |||||||||
| | | | | | | | | | | | | | | | |
|
$ | 3,531,969 | 3,488,341 | 3,444,790 | |||||||||||
| | | | | | | | | | | | | | | | |
| | | | | | | | | | | | | | | | |
| | | | | | | | | | | | | | | | |
Less: Current portion |
31,988 | 33,150 | |||||||||||||
| | | | | | | | | | | | | | | | |
Long-term debt |
$ | 3,456,353 | $ | 3,411,640 | |||||||||||
| | | | | | | | | | | | | | | | |
| | | | | | | | | | | | | | | | |
| | | | | | | | | | | | | | | | |
- (a)
- At
March 31, 2017, $90,023 of the revolving credit facility was restricted for certain letters of credit issued on behalf of the Company and $1,984,721 of the
facility was undrawn and available, subject to covenant limitations. Prior to the completion of this offering, we intend to borrow $500,000 under the CVC Revolving Credit Facility to partially fund
the Pre-IPO Distribution.
- (b)
- At March 31, 2017, $17,031 of the revolving credit facility was restricted for certain letters of credit issued on behalf of the Company and $332,969 of the facility was undrawn and available, subject to covenant limitations.
| |
|
|
|
|
Carrying Amount(a) | ||||||||||||
|---|---|---|---|---|---|---|---|---|---|---|---|---|---|---|---|---|---|
Issuer
|
Date Issued | Maturity Date | Interest Rate |
Principal Amount |
March 31, 2017 |
December 31, 2016 |
|||||||||||
CSC Holdings(b)(e) |
February 6, 1998 | February 15, 2018 | 7.875 | % | $ | 300,000 | $ | 308,118 | $ | 310,334 | |||||||
CSC Holdings(b)(e) |
July 21, 1998 | July 15, 2018 | 7.625 | % | 500,000 | 518,284 | 521,654 | ||||||||||
CSC Holdings(c)(e) |
February 12, 2009 | February 15, 2019 | 8.625 | % | 526,000 | 550,757 | 553,804 | ||||||||||
CSC Holdings(c)(e) |
November 15, 2011 | November 15, 2021 | 6.750 | % | 1,000,000 | 953,722 | 951,702 | ||||||||||
CSC Holdings(c)(e) |
May 23, 2014 | June 1, 2024 | 5.250 | % | 750,000 | 652,687 | 650,193 | ||||||||||
CSC Holdings(d) |
October 9, 2015 | January 15, 2023 | 10.125 | % | 1,800,000 | 1,775,500 | 1,774,750 | ||||||||||
CSC Holdings(d) |
October 9, 2015 | October 15, 2025 | 10.875 | % | 2,000,000 | 1,970,876 | 1,970,379 | ||||||||||
CSC Holdings(d) |
October 9, 2015 | October 15, 2025 | 6.625 | % | 1,000,000 | 985,769 | 985,469 | ||||||||||
CSC Holdings(f) |
September 23, 2016 | April 15, 2027 | 5.500 | % | 1,310,000 | 1,304,132 | 1,304,025 | ||||||||||
Cablevision(c)(e) |
September 23, 2009 | September 15, 2017 | 8.625 | % | 900,000 | 917,053 | 926,045 | ||||||||||
Cablevision(c)(e) |
April 15, 2010 | April 15, 2018 | 7.750 | % | 750,000 | 764,287 | 767,545 | ||||||||||
Cablevision(c)(e) |
April 15, 2010 | April 15, 2020 | 8.000 | % | 500,000 | 489,712 | 488,992 | ||||||||||
Cablevision(c)(e) |
September 27, 2012 | September 15, 2022 | 5.875 | % | 649,024 | 562,496 | 559,500 | ||||||||||
Cequel and Cequel Capital Senior Notes(a)(e) |
Oct. 25, 2012 Dec. 28, 2012 |
September 15, 2020 | 6.375 | % | 1,500,000 | 1,459,964 | 1,457,439 | ||||||||||
Cequel and Cequel Capital Senior Notes(a) |
May 16, 2013 Sept. 9, 2014 |
December 15, 2021 | 5.125 | % | 1,250,000 | 1,121,377 | 1,115,767 | ||||||||||
215
| |
|
|
|
|
Carrying Amount(a) | ||||||||||||
|---|---|---|---|---|---|---|---|---|---|---|---|---|---|---|---|---|---|
Issuer
|
Date Issued | Maturity Date | Interest Rate |
Principal Amount |
March 31, 2017 |
December 31, 2016 |
|||||||||||
Altice US Finance I Corporation Senior Secured Notes(b) |
June 12, 2015 | July 15, 2023 | 5.375 | % | 1,100,000 | 1,080,508 | 1,079,869 | ||||||||||
Cequel and Cequel Capital Senior Notes(c) |
June 12, 2015 | July 15, 2025 | 7.750 | % | 620,000 | 603,276 | 602,925 | ||||||||||
Altice US Finance I Corporation Senior Notes(d) |
April 26, 2016 | May 15, 2026 | 5.500 | % | 1,500,000 | 1,487,200 | 1,486,933 | ||||||||||
| | | | | | | | | | | | | | | | | | |
|
$ | 17,955,024 | 17,505,718 | 17,507,325 | |||||||||||||
| | | | | | | | | | | | | | | | | | |
| | | | | | | | | | | | | | | | | | |
| | | | | | | | | | | | | | | | | | |
Less: Current portion |
725,171 | 926,045 | |||||||||||||||
| | | | | | | | | | | | | | | | | | |
Long-term debt |
$ | 16,780,547 | $ | 16,581,280 | |||||||||||||
| | | | | | | | | | | | | | | | | | |
| | | | | | | | | | | | | | | | | | |
| | | | | | | | | | | | | | | | | | |
- (a)
- The
carrying amount of the notes is net of the unamortized deferred financing costs and/or discounts/premiums.
- (b)
- The
debentures are not redeemable by CSC Holdings prior to maturity.
- (c)
- Notes
are redeemable at any time at a specified "make-whole" price plus accrued and unpaid interest to the redemption date.
- (d)
- The
Company may redeem some or all of the 2023 Notes at any time on or after January 15, 2019, and some or all of the 2025 Notes and 2025 Guaranteed Notes at
any time on or after October 15, 2020, at the redemption prices set forth in the relevant indenture, plus accrued and unpaid interest, if any. The Company may also redeem up to 40% of each
series of the Cablevision Acquisition Notes using the proceeds of certain equity offerings before October 15, 2018, at a redemption price equal to 110.125% for the 2023 Notes, 110.875% for the
2025 Notes and 106.625% for the 2025 Guaranteed Notes, in each case plus accrued and unpaid interest. In addition, at any time prior to January 15, 2019, CSC Holdings may redeem some or all of
the 2023 Notes, and at any time prior to October 15, 2020, the Company may redeem some or all of the 2025 Notes and the 2025 Guaranteed Notes, at a price equal to 100% of the principal amount
thereof, plus a "make whole" premium specified in the relevant indenture plus accrued and unpaid interest.
- (e)
- The
carrying value of the notes was adjusted to reflect their fair value on the Cablevision Acquisition Date (aggregate reduction of $52,788).
- (f)
- The
2027 Guaranteed Notes are redeemable at any time on or after April 15, 2022 at the redemption prices set forth in the indenture, plus accrued and unpaid
interest, if any. In addition, up to 40% may be redeemed for each series of the 2027 Guaranteed Notes using the proceeds of certain equity offerings before October 15, 2019, at a redemption
price equal to 105.500%, plus accrued and unpaid interest.
- (g)
- Some
or all of these notes may be redeemed at any time on or after July 15, 2018, plus accrued and unpaid interest, if any. Up to 40% of the notes may be
redeemed using the proceeds of certain equity offerings before July 15, 2018, at a redemption price equal to 105.375%.
- (h)
- Some
or all of these notes may be redeemed at any time on or after July 15, 2020, plus accrued and unpaid interest, if any. Up to 40% of the notes may be
redeemed using the proceeds of certain equity offerings before July 15, 2018, at a redemption price equal to 107.750%.
- (i)
- Some or all of these notes may be redeemed at any time on or after May 15, 2021, plus accrued and unpaid interest, if any. Up to 40% of the notes may be redeemed using the proceeds of certain equity offerings before May 15, 2019, at a redemption price equal to 105.500%.
The following is a summary of provisions relating to our material indebtedness. The following summary does not purport to be complete and is subject to, and qualified in its entirety by reference to, the provisions of the corresponding agreements, including the definitions of certain terms therein that are not otherwise defined in this prospectus. Our Cablevision and Cequel businesses are each currently financed on a standalone basis and the relevant Cablevision and Cequel subsidiaries constitute
216
separate restricted groups for these debt financing purposes. We were in compliance with our debt covenants as of March 31, 2017.
Cablevision Credit Facilities
Overview
On October 9, 2015, Finco, which merged with and into CSC Holdings on June 21, 2016, entered into a senior secured credit facility, which currently provides U.S. dollar term loans in an aggregate principal amount of $3,000 million and U.S. dollar revolving loan commitments in an aggregate principal amount of $2,300 million, which are governed by a credit facilities agreement entered into by, inter alios, CSC Holdings, certain lenders party thereto and JPMorgan Chase Bank, N.A. as administrative agent and security agent (as amended, restated, supplemented or otherwise modified on June 20, 2016, June 21, 2016, July 21, 2016, September 9, 2016, December 9, 2016 and March 15, 2017, respectively, and as further amended, restated, supplemented or otherwise modified from time to time (the "CVC Credit Facilities Agreement")).
Interest Rate and Fees
Loans comprising each eurodollar borrowing or alternate base rate borrowing, as applicable, bear interest at a rate per annum equal to the adjusted LIBO rate or the alternate base rate, as applicable, plus the applicable margin, where the applicable margin is:
- •
- in respect of the CVC Term Loans, (i) with respect to any alternate base rate loan, 1.25% per annum and (ii) with respect to any
eurodollar loan, 2.25% per annum, and
- •
- in respect of CVC Revolving Credit Facility loans (i) with respect to any alternate base rate loan, 2.25% per annum and (ii) with respect to any eurodollar loan, 3.25% per annum.
Mandatory Prepayments
The CVC Credit Facilities Agreement requires CSC Holdings to prepay outstanding CVC Term Loans, subject to certain exceptions and deductions, with (i) 100% of the net cash proceeds of certain asset sales, subject to reinvestment rights and certain other exceptions; and (ii) commencing with the fiscal year ending December 31, 2017, a pari ratable share (based on the outstanding principal amount of the CVC Term Loans divided by the sum of the outstanding principal amount of all pari passu indebtedness and the CVC Term Loans) of 50% of annual excess cash flow, which will be reduced to 0% if the consolidated net senior secured leverage ratio of CSC Holdings is less than or equal to 4.5 to 1.
Voluntary Prepayments
Voluntary prepayments of the CVC Term Loans on or prior to October 17, 2017 which are either (x) in connection with a repricing transaction or (y) effecting any amendment of the CVC Term Loans resulting in a repricing transaction, are subject to a call premium payable to the administrative agent on behalf of the lenders of, in the case of (x) 1.00% of the principal amount of the CVC Term Loans so repaid and in the case of (y) a payment equal to 1.00% of the aggregate amount of the CVC Term Loans subject to such repricing transaction.
Amortization and Final Maturity
The maturity date of the CVC Term Loans is July 17, 2025. CSC Holdings is required to make scheduled quarterly payments each equal to 0.25% of the original principal amount of the CVC Term Loans, with the balance due on the maturity date. The maturity date for $2,280 million of the CVC
217
Revolving Credit Facility commitments is November 30, 2021. The maturity date for the remaining $20 million of CVC Revolving Credit Facility commitments is October 9, 2020.
Guarantees; Security
The obligations of CSC Holdings under the CVC Credit Facilities are guaranteed on a senior basis by each restricted subsidiary of CSC Holdings (other than CSC TKR, LLC and its subsidiaries, which own and operate our New Jersey cable systems) and will also be guaranteed by each future wholly-owned restricted subsidiary of CSC Holdings (other than immaterial subsidiaries), subject to certain limitations set forth in the CVC Credit Facilities documentation. The obligations under the CVC Credit Facilities (including any guarantees thereof) are secured on a first priority basis, subject to any liens permitted by the CVC Credit Facilities, by capital stock held by CSC Holdings or any guarantor in restricted subsidiaries of CSC Holdings, subject to certain exclusions and limitations as agreed with the agent.
Certain Covenants and Events of Default
The CVC Credit Facilities Agreement includes certain negative covenants which, among other things and subject to certain significant exceptions and qualifications, limit CSC Holdings' ability and the ability of its restricted subsidiaries to: (i) incur or guarantee additional indebtedness, (ii) make investments, (iii) create liens, (iv) sell assets and subsidiary stock, (v) pay dividends or make other distributions or repurchase or redeem our capital stock or subordinated debt, (vi) engage in certain transactions with affiliates, (vii) enter into agreements that restrict the payment of dividends by subsidiaries or the repayment of intercompany loans and advances; and (viii) engage in mergers or consolidations. In addition, the CVC Revolving Credit Facility includes a financial maintenance covenant solely for the benefit of the lenders under the CVC Revolving Credit Facility consisting of a maximum consolidated net senior secured leverage ratio of CSC Holdings and its restricted subsidiaries of 5.0 to 1.0. The financial covenant will be tested on the last day of any fiscal quarter (commencing on December 31, 2016) but only if on such day there are outstanding borrowings under the CVC Revolving Credit Facility (excluding any cash collateralized letters of credit and undrawn letters of credit not to exceed $15 million).
The CVC Credit Facilities Agreement also contains certain customary representations and warranties, affirmative covenants and events of default (including, among others, an event of default upon a change of control). If an event of default occurs, the lenders under the CVC Credit Facilities will be entitled to take various actions, including the acceleration of amounts due under the CVC Credit Facilities and all actions permitted to be taken by a secured creditor.
Cequel Credit Facilities
Overview
On June 12, 2015, Altice US Finance I Corporation entered into a senior secured credit facility which currently provides U.S. dollar term loans in an aggregate principal amount of $1,265 million and U.S. dollar revolving loan commitments in an aggregate principal amount of $350 million which are governed by a credit facilities agreement entered into by, inter alios, Altice US Finance I Corporation, certain lenders party thereto and JPMorgan Chase Bank, N.A. as administrative agent and security agent (as amended, restated, supplemented or otherwise modified on October 25, 2016, December 9, 2016 and March 15, 2017, and as further amended, restated, supplemented or modified from time to time, the "Cequel Credit Facilities Agreement").
218
Interest Rate and Fees
Loans comprising each eurodollar borrowing or alternate base rate borrowing, as applicable, bear interest at a rate per annum equal to the adjusted LIBO rate or the alternate base rate, as applicable, plus the applicable margin, where the applicable margin is:
- •
- in respect of the Cequel Term Loans, (i) with respect to any alternate base rate loan, 1.25% per annum and (ii) with respect to
any eurodollar loan, 2.25% per annum, and
- •
- in respect of Cequel Revolving Credit Facility loans (i) with respect to any alternate base rate loan, 2.25% per annum and (ii) with respect to any eurodollar loan, 3.25% per annum.
Mandatory Prepayments
The Cequel Credit Facilities Agreement requires Altice US Finance I Corporation to prepay outstanding Cequel Term Loans, subject to certain exceptions and deductions, with (i) 100% of the net cash proceeds of certain asset sales, subject to reinvestment rights and certain other exceptions; and (ii) a pari ratable share (based on the outstanding principal amount of the Cequel Term Loans divided by the sum of the outstanding principal amount of all pari passu indebtedness and the Cequel Term Loans) of 50% of annual excess cash flow, which will be reduced to 0% if the consolidated net senior secured leverage ratio is less than or equal to 4.5:1.
Voluntary Prepayments
Voluntary prepayments of the Cequel Term Loans on or prior to October 28, 2017 which are either (x) in connection with a repricing transaction or (y) effecting any amendment of the Cequel Term Loans resulting in a repricing transaction, are subject to a call premium payable to the administrative agent on behalf of the lenders of, in the case of (x) 1.00% of the principal amount of the Cequel Term Loans so repaid and in the case of (y) a payment equal to 1.00% of the aggregate amount of the Cequel Term Loans subject to such repricing transaction.
Amortization and Final Maturity
The maturity date of the Cequel Term Loans is July 28, 2025. Altice US Finance I Corporation is required to make scheduled quarterly payments each equal to 0.25% of the original principal amount of the Cequel Term Loans, with the balance due on the maturity date. The maturity date of the Cequel Revolving Credit Facility is November 30, 2021.
Guarantees; Security
The obligations of Altice US Finance I Corporation under the Cequel Credit Facilities are guaranteed on a senior basis by Cequel Communications Holdings II, LLC, Cequel and certain of the subsidiaries of Cequel and will also be guaranteed by each future wholly-owned subsidiary of Cequel (other than immaterial subsidiaries), subject to applicable guarantee limitations specified therein. The obligations under the Cequel Credit Facilities (including any guarantees thereof) and are secured by certain assets of Cequel Communications Holdings II, LLC and Cequel, including a share pledge over the share capital of Cequel and Altice US Finance I Corporation and substantially all of the assets of Cequel and the subsidiary guarantors (excluding real property and subject to certain other exceptions).
Certain Covenants and Events of Default
The Cequel Credit Facilities Agreement includes certain negative covenants that, among other things and subject to certain significant exceptions and qualifications, limit Cequel's ability and the ability of its restricted subsidiaries to: (i) incur or guarantee additional indebtedness, (ii) make investments, (iii) create liens, (iv) sell assets and subsidiary stock, (v) pay dividends or make other
219
distributions or repurchase or redeem our capital stock or subordinated debt, (vi) engage in certain transactions with affiliates, (vii) enter into agreements that restrict the payment of dividends by subsidiaries or the repayment of intercompany loans and advances; and (viii) engage in mergers or consolidations. In addition, the Cequel Credit Facilities Agreement includes a financial maintenance covenant solely for the benefit of the revolving lenders under the Cequel Credit Facilities Agreement consisting of a maximum consolidated net senior secured leverage ratio of Cequel and its restricted subsidiaries of 5.0 to 1.0. The financial covenant will be tested on the last day of any fiscal quarter but only if on such day there are outstanding borrowings under the Cequel Revolving Credit Facility (excluding any cash collateralized letters of credit).
The Cequel Credit Facilities Agreement also contains certain customary representations and warranties, affirmative covenants and events of default (including, among others, an event of default upon a change of control trigger event). If an event of default occurs, the lenders under the Cequel Credit Facilities will be entitled to take various actions, including the acceleration of amounts due under the Cequel Credit Facilities and all actions permitted to be taken by a secured creditor, subject to the Cequel First Lien Intercreditor Agreement.
Cablevision Bonds
Cablevision Notes
On September 23, 2009, Cablevision issued $900 million aggregate principal amount of its 85/8% Senior Notes due 2017 and 85/8% Series B Senior Notes due 2017 (together, the "Cablevision 2017 Senior Notes"). On April 17, 2017, Cablevision redeemed $500 million aggregate principal amount of its Cablevision 2017 Senior Notes with certain of the proceeds of the term loans incurred under the CVC Credit Facilities Agreement, reducing the aggregate principal amount of outstanding Cablevision 2017 Senior Notes to $400 million. The Cablevision 2017 Senior Notes mature on September 15, 2017. Interest on the Cablevision 2017 Senior Notes is payable semi-annually in cash on each March 15 and September 15.
On April 15, 2010, Cablevision issued $750 million aggregate principal amount of its 73/4% Senior Notes due 2018. The Cablevision 2018 Senior Notes mature on April 15, 2018. Interest on the Cablevision 2018 Senior Notes is payable semi-annually in cash on each April 15 and October 15.
On April 15, 2010, Cablevision issued $500 million aggregate principal amount of its 8% Senior Notes due 2020. The Cablevision 2020 Senior Notes mature on April 15, 2020. Interest on the Cablevision 2020 Senior Notes is payable semi-annually in cash on each April 15 and October 15.
On September 27, 2012, Cablevision issued $750 million aggregate principal amount of its 57/8% Senior Notes due 2022. The Cablevision 2022 Senior Notes mature on September 15, 2022. Interest on the Cablevision 2022 Senior Notes is payable semi-annually in cash on each March 15 and September 15.
At any time prior to their respective maturity dates, Cablevision may redeem some or all of the Cablevision Legacy Notes at a price equal to 100% of the principal amount of the Cablevision Legacy Notes plus a "make-whole" premium, together with accrued and unpaid interest, if any, to the date of redemption.
The Cablevision Legacy Notes are unsecured obligations of Cablevision and are not guaranteed by any of its subsidiaries or any other entity.
The indentures governing the Cablevision Legacy Notes contain certain negative covenants, agreements and events of default, including, among other things and subject to certain significant exceptions and qualifications, limitations on the ability of Cablevision and its restricted subsidiaries to (i) incur or guarantee additional indebtedness, (ii) make investments or other restricted payments,
220
(iii) create liens, (iv) pay dividends or make other distributions or repurchase or redeem our capital stock or subordinated debt, (v) engage in certain transactions with affiliates, (vi) enter into agreements that restrict the payment of dividends by subsidiaries or the repayment of intercompany loans and advances; and (vii) engage in mergers or consolidations.
CSC Holdings Notes
CSC Holdings Senior Guaranteed Notes
On October 9, 2015, Finco issued $1,000 million aggregate principal amount of its 65/8% Senior Guaranteed Notes due 2025. CSC Holdings assumed the obligations as issuer of the CSC 2025 Senior Guaranteed Notes upon the merger of Finco and CSC Holdings on June 21, 2016. The CSC 2025 Senior Guaranteed Notes mature on October 15, 2025. Interest on the CSC 2025 Senior Guaranteed Notes is payable semi-annually in cash on each January 15 and July 15. The CSC 2025 Senior Guaranteed Notes are redeemable, in whole or in part, at any time on or after October 15, 2020, at the applicable redemption prices specified in the indenture governing the CSC 2025 Senior Guaranteed Notes, together with accrued and unpaid interest, if any, to, but excluding, the date of redemption. At any time prior to October 15, 2018, CSC Holdings may redeem up to 40% of the original aggregate principal amount of the CSC 2025 Senior Guaranteed Notes with the proceeds of certain equity offerings at a redemption price of 106.625% of the principal amount of the CSC 2025 Senior Guaranteed Notes, together with accrued and unpaid interest, if any, to, but excluding, the date of redemption. At any time prior to October 15, 2020, CSC Holdings may also redeem some or all of the CSC 2025 Senior Guaranteed Notes at a price equal to 100% of the principal amount of the CSC 2025 Senior Guaranteed Notes plus a "make-whole" premium, together with accrued and unpaid interest, if any, to, but excluding, the date of redemption.
On September 23, 2016, CSC Holdings issued $1,310 million aggregate principal amount of its 51/2% Senior Guaranteed Notes due 2027. The CSC 2027 Senior Guaranteed Notes mature on April 15, 2027. Interest on the CSC 2027 Senior Guaranteed Notes is payable semi-annually in cash on each April 15 and October 15. The CSC 2027 Senior Guaranteed Notes are redeemable, in whole or in part, at any time on or after April 15, 2022, at the applicable redemption prices specified in the indenture governing the CSC 2027 Senior Guaranteed Notes, together with accrued and unpaid interest, if any, to, but excluding, the date of redemption. At any time prior to October 15, 2019, CSC Holdings may redeem up to 40% of the original aggregate principal amount of the CSC 2027 Senior Guaranteed Notes with the proceeds of certain equity offerings at a redemption price of 105.500% of the principal amount of the CSC 2027 Senior Guaranteed Notes, together with accrued and unpaid interest, if any, to, but excluding, the date of redemption. At any time prior to April 15, 2022, CSC Holdings may also redeem some or all of the CSC 2027 Senior Guaranteed Notes at a price equal to 100% of the principal amount of the Notes plus a "make-whole" premium, together with accrued and unpaid interest, if any, to, but excluding, the date of redemption.
The CSC Senior Guaranteed Notes are unsecured obligations of CSC Holdings and are guaranteed on a senior unsecured basis by each restricted subsidiary of CSC Holdings (other than CSC TKR, LLC and its subsidiaries, which own and operate our New Jersey cable systems) and will also be guaranteed by each future wholly-owned restricted subsidiary of CSC Holdings (other than immaterial subsidiaries), subject to certain limitations set forth in the indentures governing the CSC Senior Guaranteed Notes.
The indentures governing the CSC Senior Guaranteed Notes contain certain negative covenants, agreements and events of default, including, subject to certain significant exceptions and qualifications, limitations on the ability of CSC Holdings and its restricted subsidiaries to (i) incur or guarantee additional indebtedness, (ii) make investments, (iii) create liens, (iv) sell assets and subsidiary stock, (v) pay dividends or make other distributions or repurchase or redeem our capital stock or subordinated debt, (vi) engage in certain transactions with affiliates, (vii) enter into agreements that
221
restrict the payment of dividends by subsidiaries or the repayment of intercompany loans and advances, and (viii) engage in mergers or consolidations.
Upon the occurrence of an event constituting a change of control under the indentures governing the CSC Senior Guaranteed Notes, CSC Holdings must offer to repurchase all of the CSC Senior Guaranteed Notes at a price equal to 101% of their principal amount, plus accrued and unpaid interest, if any, to the repurchase date.
In certain instances in accordance with the terms of the respective indentures, CSC Holdings may be required to make an offer to repurchase the CSC Senior Guaranteed Notes at a purchase price equal to 100% of the principal amount thereof, plus accrued and unpaid interest, if any, with the excess proceeds from asset sales.
CSC Holdings Senior Notes
On February 6, 1998, CSC Holdings, as a successor issuer, issued $300 million aggregate principal amount of its 77/8% Senior Debentures due 2018. The CSC 77/8% 2018 Senior Debentures mature on February 15, 2018. Interest on the CSC 77/8% 2018 Senior Debentures is payable semi-annually in cash on each February 15 and August 15.
On July 21, 1998, CSC Holdings, as successor issuer, issued $500 million aggregate principal amount of its 75/8% Senior Debentures due 2018. The CSC 75/8% 2018 Senior Debentures mature on July 15, 2018. Interest on the CSC 75/8% 2018 Senior Debentures is payable semi-annually in cash on each January 15 and July 15.
On February 12, 2009, CSC Holdings, as a successor issuer, issued $526 million aggregate principal amount of its 85/8% Senior Notes due 2019 and 85/8% Series B Senior Notes due 2019. The CSC 2019 Senior Notes mature on February 15, 2019. Interest on the CSC 2019 Senior Notes is payable semi-annually in cash on each February 15 and August 15.
On November 15, 2011, CSC Holdings issued $1,000 million aggregate principal amount of its 63/4% Senior Notes due 2021 and 63/4% Series B Senior Notes due 2021. The CSC 2021 Senior Notes mature on November 15, 2021. Interest on the CSC 2021 Senior Notes is payable semi-annually in cash on each May 15 and November 15.
On May 23, 2014, CSC Holdings issued $750 million aggregate principal amount of its 51/4% Senior Notes due 2024 and 51/4% Series B Senior Notes due 2024. The CSC 2024 Senior Notes mature on June 1, 2024. Interest on the CSC 2024 Senior Notes is payable semi-annually in cash on each June 1 and December 1.
At any time prior to their respective maturity dates, CSC Holdings may redeem some or all of the CSC Legacy Notes at a price equal to 100% of the principal amount of the CSC Legacy Notes plus a "make-whole" premium, together with accrued and unpaid interest, if any, to the date of redemption.
On October 9, 2015, Finco, issued $1,800 million aggregate principal amount of its 101/8% Senior Notes due 2023 and $2,000 million 107/8% Senior Notes due 2025. CSC Holdings assumed the obligations as issuer of the CSC 2023 Senior Notes upon the merger of Finco and CSC Holdings on June 21, 2016. The CSC 2023 Senior Notes mature on January 15, 2023 and the CSC 2025 Senior Notes mature on October 15, 2025. Interest on the CSC New Senior Notes is payable semi-annually in cash on each January 15 and July 15. We intend to redeem $350 million principal amount of the CSC 2025 Senior Notes with the net proceeds from this offering and cash on hand.
The CSC 2023 Senior Notes are redeemable, in whole or in part, at any time on or after January 15, 2019, at the applicable redemption prices specified in the indenture governing the CSC 2023 Senior Notes, together with accrued and unpaid interest, if any, to, but excluding, the date of redemption. At any time prior to October 15, 2018, CSC Holdings may redeem up to 40% of the
222
original aggregate principal amount of the CSC 2023 Senior Notes with the proceeds of certain equity offerings at a redemption price of 110.125% of the principal amount of the CSC 2023 Senior Notes, together with accrued and unpaid interest, if any, to, but excluding, the date of redemption. At any time prior to January 15, 2019, CSC Holdings may also redeem some or all of the CSC 2023 Senior Notes at a price equal to 100% of the principal amount of the CSC 2023 Senior Notes plus a "make-whole" premium, together with accrued and unpaid interest, if any, to, but excluding, the date of redemption.
The CSC 2025 Senior Notes are redeemable, in whole or in part, at any time on or after October 15, 2020, at the applicable redemption prices specified in the indenture governing the CSC 2025 Senior Notes, together with accrued and unpaid interest, if any, to, but excluding, the date of redemption. At any time prior to October 15, 2018, CSC Holdings may redeem up to 40% of the original aggregate principal amount of the CSC 2025 Senior Notes with the proceeds of certain equity offerings at a redemption price of 110.875% of the principal amount of the CSC 2025 Senior Notes, together with accrued and unpaid interest, if any, to, but excluding, the date of redemption. At any time prior to October 15, 2020, CSC Holdings may also redeem some or all of the CSC 2025 Senior Notes at a price equal to 100% of the principal amount of the CSC 2025 Senior Notes plus a "make-whole" premium, together with accrued and unpaid interest, if any, to, but excluding, the date of redemption.
The CSC Senior Notes are unsecured obligations of CSC Holdings and are not guaranteed by any of its subsidiaries or any other entity.
The indentures governing the CSC Senior Notes contain certain negative covenants, agreements and events of default, including, subject to certain significant exceptions and qualifications, limitations on the ability of CSC Holdings and its restricted subsidiaries to (i) incur or guarantee additional indebtedness, (ii) make investments, (iii) create liens, (iv) sell assets and subsidiary stock, (v) pay dividends or make other distributions or repurchase or redeem our capital stock or subordinated debt, (vi) engage in certain transactions with affiliates, (vii) enter into agreements that restrict the payment of dividends by subsidiaries or the repayment of intercompany loans and advances; and (viii) engage in mergers or consolidations.
Upon the occurrence of an event constituting a change of control under the indenture governing the CSC New Senior Notes, CSC Holdings must offer to repurchase all of the CSC New Senior Notes at a price equal to 101% of their principal amount, plus accrued and unpaid interest, if any, to the repurchase date.
In certain instances in accordance with the terms of the indenture, CSC Holdings may be required to make an offer to repurchase the CSC New Senior Notes at a purchase price equal to 100% of the principal amount thereof, plus accrued and unpaid interest, if any, with the excess proceeds from asset sales.
Cequel Bonds
Cequel Senior Secured Notes
On June 12, 2015, Altice US Finance I Corporation issued $1,100 million aggregate principal amount of its 53/8% Senior Secured Notes due 2023 (the "Cequel 2023 Senior Secured Notes"). The Cequel 2023 Senior Secured Notes mature on July 15, 2023. Interest on the Cequel 2023 Senior Secured Notes is payable semi-annually in cash on each January 15 and July 15. The Cequel 2023 Senior Secured Notes are redeemable, in whole or in part, at any time on or after July 15, 2018, at the applicable redemption prices specified in the indenture governing the 2023 Senior Secured Notes, together with accrued and unpaid interest, if any, to, but excluding, the date of redemption. At any time prior to July 15, 2018, Altice US Finance I Corporation may redeem up to 40% of the original
223
aggregate principal amount of the Cequel 2023 Senior Secured Notes with the proceeds of certain equity offerings at a redemption price of 105.375% of the principal amount of the Cequel 2023 Senior Secured Notes, together with accrued and unpaid interest, if any, to, but excluding, the date of redemption. At any time prior to July 15, 2018, Altice US Finance I Corporation may also redeem some or all of the Cequel 2023 Senior Secured Notes at a price equal to 100% of the principal amount of the Cequel 2023 Senior Secured Notes plus a "make-whole" premium, together with accrued and unpaid interest, if any, to, but excluding, the date of redemption.
On April 26, 2016, Altice US Finance I Corporation issued $1,500 million aggregate principal amount of its 51/2% Senior Secured Notes due 2026 (the "Cequel 2026 Senior Secured Notes" and, together with the Cequel 2023 Senior Secured Notes, the "Cequel Senior Secured Notes"). The Cequel 2026 Senior Secured Notes mature on May 15, 2026. Interest on the Cequel 2026 Senior Secured Notes is payable semi-annually in cash on each May 15 and November 15. The Cequel 2026 Senior Secured Notes are redeemable, in whole or in part, at any time on or after May 15, 2021, at the applicable redemption prices specified in the indenture governing the 2026 Senior Secured Notes, together with accrued and unpaid interest, if any, to, but excluding, the date of redemption. At any time prior to May 15, 2019, Altice US Finance I Corporation may redeem up to 40% of the original aggregate principal amount of the Cequel 2026 Senior Secured Notes with the proceeds of certain equity offerings at a redemption price of 105.5% of the principal amount of the Cequel 2026 Senior Secured Notes, together with accrued and unpaid interest, if any, to, but excluding, the date of redemption. At any time prior to May 15, 2021, Altice US Finance I Corporation may also redeem some or all of the Cequel 2026 Senior Secured Notes at a price equal to 100% of the principal amount of the Cequel 2026 Senior Secured Notes plus a "make-whole" premium, together with accrued and unpaid interest, if any, to, but excluding, the date of redemption.
The obligations of Altice US Finance I Corporation under the Cequel Senior Secured Notes are guaranteed on a senior basis by Cequel Communications Holdings II, LLC, Cequel and certain subsidiaries of Cequel and are secured by certain assets of Cequel Communications Holdings II, LLC and Cequel, including a share pledge over the share capital of Cequel and Altice US Finance I Corporation, and substantially all of the assets of Cequel and the subsidiary guarantors (excluding real property and subject to certain other exceptions).
The indentures governing the Cequel Senior Secured Notes contain certain negative covenants, agreements and events of default, including, subject to certain significant exceptions and qualifications, limitations on the ability of Cequel and its restricted subsidiaries to (i) incur or guarantee additional indebtedness, (ii) make investments, (iii) create liens, (iv) sell assets and subsidiary stock, (v) pay dividends or make other distributions or repurchase or redeem our capital stock or subordinated debt, (vi) engage in certain transactions with affiliates, (vii) enter into agreements that restrict the payment of dividends by subsidiaries or the repayment of intercompany loans and advances, and (viii) engage in mergers or consolidations.
Upon the occurrence of an event constituting a change of control under the indentures governing the Cequel Senior Secured Notes, Altice US Finance I Corporation must offer to repurchase all of the Cequel Senior Secured Notes at a price equal to 101% of their principal amount, plus accrued and unpaid interest, if any, to the repurchase date.
In certain instances in accordance with the terms of the respective indentures, Altice US Finance I Corporation may be required to make an offer to repurchase the Cequel Senior Secured Notes at a purchase price equal to 100% of the principal amount thereof, plus accrued and unpaid interest, if any, with the excess proceeds from asset sales.
224
Cequel Senior Notes
On October 25, 2012, Cequel Capital Corporation and Cequel Communications Holdings I, LLC issued $500 million aggregate principal amount of their 63/8% Senior Notes due 2020 (the "Cequel 2020 Senior Notes"). On December 28, 2012, the Cequel Senior Notes Issuers issued an additional $1,000 million aggregate principal amount of their Cequel 2020 Senior Notes. On April 14, 2017, the Cequel Senior Notes Co-Issuers redeemed $450 million aggregate principal amount of their Cequel 2020 Senior Notes with certain of the proceeds of the term loans incurred under the Cequel Credit Facilities Agreement, reducing the aggregate principal amount of outstanding Cequel 2020 Senior Notes to $1,050 million. The Cequel 2020 Senior Notes mature on September 15, 2020. Interest on the Cequel 2020 Senior Notes is payable semi-annually in cash on each March 15 and September 15. The Cequel 2020 Senior Notes are redeemable, in whole or in part, at any time on or after September 15, 2015, at the applicable redemption prices specified in the indenture governing the Cequel 2020 Senior Notes, together with accrued and unpaid interest, if any, to the date of redemption. At any time prior to September 15, 2015, the Cequel Senior Notes Co-Issuers may redeem up to 40% of the original aggregate principal amount of the Cequel 2020 Senior Notes with the proceeds of certain equity offerings at a redemption price of 106.375% of the principal amount of the Cequel 2020 Senior Notes, together with accrued and unpaid interest, if any, to the date of redemption. At any time prior to September 15, 2015, the Cequel Senior Notes Co-Issuers may also redeem some or all of the Cequel 2020 Senior Notes at a price equal to 100% of the principal amount of the Cequel 2020 Senior Notes plus a "make-whole" premium, together with accrued and unpaid interest, if any, to the date of redemption.
On May 16, 2013, the Cequel Senior Notes Co-Issuers issued $750 million aggregate principal amount of their 51/8% Senior Notes due 2021. The Cequel 2021 Senior Notes mature on December 15, 2021. Interest on the Cequel 2021 Senior Notes is payable semi-annually in cash on each June 15 and December 15. The Cequel 2021 Senior Notes are redeemable, in whole or in part, at any time on or after June 15, 2016, at the applicable redemption prices specified in the indenture governing the Cequel 2021 Senior Notes, together with accrued and unpaid interest, if any, to, but excluding, the date of redemption. At any time prior to June 15, 2016, the Cequel Senior Notes Co-Issuers may redeem up to 40% of the original aggregate principal amount of the Cequel 2021 Senior Notes with the proceeds of certain equity offerings at a redemption price of 105.125% of the principal amount of the Cequel 2021 Senior Notes, together with accrued and unpaid interest, if any, to the date of redemption. At any time prior to June 15, 2016, the Cequel Senior Notes Co-Issuers may also redeem some or all of the Cequel 2021 Senior Notes at a price equal to 100% of the principal amount of the Cequel 2021 Senior Notes plus a "make-whole" premium, together with accrued and unpaid interest, if any, to the date of redemption.
On September 9, 2014, the Cequel Senior Notes Co-Issuers issued $500 million aggregate principal amount of their 51/8% Senior Notes due 2021. The Cequel 2021 Mirror Notes mature on December 15, 2021. Interest on the Cequel 2021 Mirror Notes is payable semi-annually in cash on each June 15 and December 15. The Cequel 2021 Mirror Notes are redeemable, in whole or in part, at any time on or after June 15, 2016, at the applicable redemption prices specified in the indenture governing the Cequel 2021 Mirror Notes, together with accrued and unpaid interest, if any, to the date of redemption. At any time prior to June 15, 2016, the Cequel Senior Notes Co-Issuers may redeem up to 40% of the original aggregate principal amount of the Cequel 2021 Mirror Notes with the proceeds of certain equity offerings at a redemption price of 105.125% of the principal amount of the Cequel 2021 Mirror Notes, together with accrued and unpaid interest, if any, to the date of redemption. At any time prior to June 15, 2016, the Cequel Senior Notes Co-Issuers may also redeem some or all of the Cequel 2021 Mirror Notes at a price equal to 100% of the principal amount of the Cequel 2021 Mirror Notes plus a "make-whole" premium, together with accrued and unpaid interest, if any, to the date of redemption.
225
On June 12, 2015, Altice US Finance II Corporation issued $300 million aggregate principal amount of its 73/4% Senior Notes due 2025. The Cequel Senior Notes Co-Issuers assumed the obligations as issuer of the Cequel 2025 Senior Notes on December 21, 2015. On May 23, 2016, the Cequel Senior Notes Co-Issuers issued an additional $320 million aggregate principal amount of the Cequel 2025 Senior Notes in exchange for debt securities originally issued by Altice US Finance S.A. The Cequel 2025 Senior Notes mature on July 15, 2025. Interest on the Cequel 2025 Senior Notes is payable semi-annually in cash on each January 15 and July 15. The Cequel 2025 Senior Notes are redeemable, in whole or in part, at any time on or after July 15, 2020, at the applicable redemption prices specified in the indenture governing the Cequel 2025 Senior Notes, together with accrued and unpaid interest, if any, to, but excluding, the date of redemption. At any time prior to July 15, 2018, the Cequel Senior Notes Co-Issuers may redeem up to 40% of the original aggregate principal amount of the Cequel 2025 Senior Notes with the proceeds of certain equity offerings at a redemption price of 107.750% of the principal amount of the Cequel 2025 Senior Notes, together with accrued and unpaid interest, if any, to, but excluding, the date of redemption. At any time prior to July 15, 2020, the Cequel Senior Notes Co-Issuers may also redeem some or all of the Cequel 2025 Senior Notes at a price equal to 100% of the principal amount of the Cequel 2025 Senior Notes plus a "make-whole" premium, together with accrued and unpaid interest, if any, to, but excluding, the date of redemption.
The Cequel Senior Notes are unsecured obligations of the Cequel Senior Notes Co-Issuers and are not guaranteed by any of their subsidiaries or any other entity.
The indentures governing the Cequel Senior Notes contain certain negative covenants, agreements and events of default, including, subject to certain significant exceptions and qualifications, limitations on the ability of the Cequel Senior Notes Co-Issuers and their restricted subsidiaries to (i) incur or guarantee additional indebtedness, (ii) make investments, (iii) create liens, (iv) sell assets and subsidiary stock, (v) pay dividends or make other distributions or repurchase or redeem our capital stock or subordinated debt, (vi) engage in certain transactions with affiliates, (vii) enter into agreements that restrict the payment of dividends by subsidiaries or the repayment of intercompany loans and advances, and (viii) engage in mergers or consolidations, in each case subject to certain exceptions.
Upon the occurrence of an event constituting a change of control under the respective indentures governing the Cequel Senior Notes, the Cequel Senior Notes Co-Issuers must offer to repurchase all of the Cequel Senior Notes at a price equal to 101% of their principal amount, plus accrued and unpaid interest, if any, to the repurchase date.
In certain instances in accordance with the terms of the respective indentures, the Cequel Senior Notes Co-Issuers may be required to make an offer to repurchase the Cequel Senior Notes at a purchase price equal to 100% of the principal amount thereof, plus accrued and unpaid interest, if any, with the excess proceeds from asset sales.
Cequel Intercreditor Agreement
On December 21, 2015, JPMorgan Chase Bank, N.A., as security agent and authorized representative of the secured parties under the Cequel Credit Facilities, and Deutsche Bank Trust Company Americas, as authorized representative of the holders of the Cequel 2023 Senior Secured Notes, entered into a first lien intercreditor agreement (the "Cequel First Lien Intercreditor Agreement") as to the relative priorities of their respective security interests in the shared collateral securing the indebtedness of Altice US Finance I Corporation. On May 20, 2016, Deutsche Bank Trust Company Americas acceded to the Cequel First Lien Intercreditor Agreement in its capacity as authorized representative of the holders of the Cequel 2026 Senior Secured Notes. The Cequel First Lien Intercreditor Agreement provides that notwithstanding the date, time, method, manner or order of grant, attachment or perfection of any liens on the shared collateral securing the Cequel Credit Facilities, Cequel 2023 Senior Secured Notes or Cequel 2026 Senior Secured Notes (or future first lien
226
obligations that become subject to the Cequel First Lien Intercreditor Agreement), the liens securing all such first lien obligations shall be of equal priority. The Cequel First Lien Intecreditor Agreement also provides for certain matters relating to the administration of security interests including, amongst other things, specifying the applicable authorized representative who has the right to direct the controlling security agent to take, or refrain from taking, certain actions with respect to the shared collateral, the automatic release of liens in favor of each series of first lien obligations in the event the controlling security agent exercises remedies against any shared collateral and certain agreements relating to debtor-in-possession financings (and liens on the shared collateral in connection with such financings) or the use of cash collateral constituting shared collateral in the event the issuer or a pledgor becomes subject to a bankruptcy case.
Other
Cablevision Collateralized Indebtedness Relating to Stock Monetizations
CSC Holdings and its consolidated subsidiaries have entered into derivative contracts to hedge their equity price risk and monetize the value of their shares of common stock of Comcast. These contracts, at maturity, are expected to offset declines in the fair value of these securities below the hedge price per share while allowing CSC Holdings and its consolidated subsidiaries to retain upside appreciation from the hedge price per share to the relevant cap price. If any one of these contracts is terminated prior to its scheduled maturity date due to the occurrence of an event specified in the contract, CSC Holdings and its consolidated subsidiaries would be obligated to repay the fair value of the collateralized indebtedness less the sum of the fair values of the underlying stock and equity collar, calculated at the termination date. As of March 31, 2017, CSC Holdings and its consolidated subsidiaries did not have an early termination shortfall relating to any of these contracts. The underlying stock and the equity collars are carried at fair value on CSC Holdings consolidated balance sheets and the collateralized indebtedness is carried at its principal value. See "Management's Discussion and Analysis of Financial Condition and Results of Operations—Quantitative and Qualitative Disclosures About Market Risk" for information on how CSC Holdings and its consolidated subsidiaries participate in changes in the market price of the stocks underlying these derivative contracts.
All of CSC Holdings monetization transactions are obligations of CSC Holdings wholly-owned subsidiaries. CSC Holdings provides guarantees of the subsidiaries' ongoing contract payment expense obligations and potential payments that could be due as a result of an early termination event. The guarantee exposure approximates the net sum of the fair value of the collateralized indebtedness less the sum of the fair values of the underlying stock and the equity collar. These derivative contracts were not designated as hedges for accounting purposes. All of CSC Holdings equity derivative contracts are carried at their current fair value on our consolidated balance sheets with changes in value reflected in our consolidated statements of income, and all of the counterparties to such transactions currently carry investment grade credit ratings.
Cequel Derivative Instruments
In June 2016, a subsidiary of Cequel entered into two fixed to floating interest rate swaps. One fixed to floating interest rate swap is converting $750 million from a fixed rate of 1.6655% to six-month LIBOR and a second tranche of $750 million from a fixed rate of 1.68% to six-month LIBOR. The objective of these swaps is to cover the exposure of the Cequel 2026 Senior Secured Notes to changes in the market interest rate. These swap contracts were not designated as hedges for accounting purposes. Accordingly, the changes in the fair value of these interest rate swap contracts are recorded through the statement of operations.
Letters of Credit
Certain lenders have issued standby and backstop letters of credit that are used by certain of our subsidiaries to guarantee their obligations in the ordinary course of business. As of March 31, 2017, we had approximately $107 million of outstanding letters of credit.
227
SHARES ELIGIBLE FOR FUTURE SALE
Prior to this offering, there has not been any public market for our Class A common stock and a significant public market for our Class A common stock may not develop or be sustained after this offering. We cannot predict what effect, if any, sales of shares of our Class A common stock or the availability of shares of our Class A common stock for sale will have on the prevailing market price of our Class A common stock from time to time. The number of shares of our Class A common stock available for future sale into the public markets is subject to legal and contractual restrictions, some of which are described below. The expiration of these restrictions will permit sales of substantial amounts of our Class A common stock in the public market or could create the perception that these sales could occur, which could adversely affect the market price for our Class A common stock and could make it more difficult for us to raise capital through the sale of our equity or equity-related securities at a time and price that we deem acceptable.
Upon the completion of this offering, we expect to have a total of 246,750,944 shares of our Class A common stock outstanding, and 490,318,022 shares of our Class B common stock outstanding. All of the shares of our Class A common stock sold in this offering will be freely tradable without restriction or further registration under the Securities Act, except for shares held by persons who may be deemed our "affiliates," as that term is defined under Rule 144 of the Securities Act. An "affiliate" is a person that directly or indirectly through one or more intermediaries, controls or is controlled by us or is under common control with us. The remaining outstanding shares of our Class A common stock and Class B common stock will be "restricted securities" within the meaning of Rule 144 and subject to certain restrictions on resale following the consummation of this offering. Restricted securities may be sold in the public market only if they are registered under the Securities Act or are sold pursuant to an exemption from registration such as Rule 144 or Rule 701, which are summarized below. Shares of our Class B common stock are convertible into an equivalent number of shares of our Class A common stock at the option of the holder at any time.
Rule 144
In general, pursuant to Rule 144 under the Securities Act in effect on the date of this prospectus, once we have been subject to public company reporting requirements for at least 90 days, a person who is not one of our affiliates at any time during the 90 days preceding a sale and who has beneficially owned the shares of our Class A common stock to be sold for at least six months, including the holding period of any prior owner other than our affiliates, would be entitled to sell those shares without complying with the manner of sale, volume limitation or notice provisions of Rule 144, subject to compliance with the public information requirements of Rule 144. In addition, under Rule 144, a person who is not one of our affiliates at any time during the 90 days preceding a sale, and who has beneficially owned the shares of our Class A common stock to be sold for at least one year, including the holding period of any prior owner other than our affiliates, would be entitled to sell those shares without regard to the requirements of Rule 144. Our affiliates or persons selling on behalf of our affiliates are entitled to sell, upon expiration of the lock-up agreements described below, within any three-month period beginning 90 days after the date of this prospectus, a number of shares that does not exceed the greater of:
- •
- 1.0% of the number of shares of Class A common stock then outstanding, which is approximately 2,467,509 shares of Class A common
stock upon the completion of this offering assuming the underwriters do not exercise their option to purchase additional shares of Class A common stock;
and
- •
- the average weekly trading volume of our Class A common stock on the NYSE during the four calendar weeks preceding each such sale, subject to certain restrictions.
228
Sales under Rule 144 by our affiliates or persons selling on behalf of our affiliates are also subject to manner of sale provisions and notice requirements and to the availability of current public information about us. Rule 144 also provides that affiliates relying on Rule 144 to sell shares of our Class A common stock that are not restricted shares must nonetheless comply with the same restrictions applicable to restricted shares, other than the holding period requirement.
Rule 701
Rule 701 generally allows a stockholder who purchased shares of our capital stock pursuant to a written compensatory plan or contract and who is not deemed to have been an affiliate of our company during the immediately preceding 90 days to sell these shares in reliance upon Rule 144, but without being required to comply with the public information, holding period, volume limitation, or notice provisions of Rule 144. Rule 701 also permits affiliates of our company to sell their Rule 701 shares under Rule 144 without complying with the holding period requirements of Rule 144. All holders of Rule 701 shares, however, are required by that rule to wait until 90 days after the date of this prospectus before selling those shares pursuant to Rule 701. Moreover, certain Rule 701 shares may be subject to lock-up agreements as described below and under the section titled "Underwriting" and will not become eligible for sale until the expiration of those agreements.
Directed Share Program
At our request, the underwriters have reserved up to 5% of the common stock being offered by this prospectus for sale at the initial public offering price to our directors and officers, our employees, employees of ATS and certain employees of Altice N.V. and its subsidiaries. The sales will be made by Morgan Stanley & Co. LLC, an underwriter of this offering, and its affiliates through a directed share program. We do not know if these persons will choose to purchase all or any portion of these reserved shares, but any purchases they do make will reduce the number of shares available to the general public. Any reserved shares not so purchased will be offered by the underwriters to the general public on the same terms as the other shares of common stock offered by this prospectus. Any shares purchased by our directors and officers in the directed share program will be subject to a 180-day lock-up period, and any shares purchased by other persons in our directed share program will be subject to a 35-day lock-up period.
Lock-up Agreements
We and our executive officers, directors, and holders of substantially all of our common stock have agreed with the underwriters, subject to certain exceptions, not to dispose of or hedge any of our or their common stock or securities convertible into or exchangeable for shares of common stock during the period from the date of this prospectus continuing through the date 180 days after the date of this prospectus, except with the prior written consent of J.P. Morgan Securities LLC and Morgan Stanley & Co. LLC. This agreement does not apply to any existing employee benefit plans. See "Shares Eligible for Future Sale" for a discussion of certain transfer restrictions.
Shares Issued Under Future Plans
We will file a registration statement on Form S-8 under the Securities Act to register Class A common stock issuable under our 2017 LTIP. Shares registered under any such registration statement would be available for sale in the public market following the effective date, unless such shares are subject to vesting restrictions with us, Rule 144 restrictions applicable to our affiliates or the lock-up agreements described above.
229
Stockholders and Registration Rights Agreement
In connection with this offering, we expect to enter into a stockholders and registration rights agreement with Altice N.V., BCP and CPPIB. This agreement will provide to Altice N.V. an unlimited number of "demand" registrations for the registration of the sale of our common stock in a Minimum Amount. Additionally, the agreement will provide BCP and CPPIB each with one "demand" registration every twelve months, subject to an exception, and customary "piggyback" registration rights to Altice N.V., BCP and CPPIB. The stockholders and registration rights agreement will also provide that we will pay certain expenses relating to such registrations and indemnify Altice N.V., BCP and CPPIB against certain liabilities which may arise under the Securities Act. See "Certain Relationships and Related-Party Transactions—Stockholders and Registration Rights Agreement."
Right of First Refusal
Any proposed sale of shares of common stock held by certain members of our management will be subject to a right of first refusal in favor of Altice N.V.
Equity Incentive Plans
For a description of our equity incentive plans, see "Executive Compensation."
230
MATERIAL U.S. FEDERAL INCOME TAX CONSEQUENCES TO NON-U.S. HOLDERS OF OUR COMMON STOCK
The following is a summary of the material U.S. federal income tax consequences to Non-U.S. Holders (as defined below) associated with the purchase, ownership and disposition of our Class A common stock, but does not purport to be a complete analysis of all the potential tax considerations relating thereto. This summary is based upon the provisions of the Internal Revenue Code of 1986, as amended (the "Code"), Treasury regulations promulgated thereunder ("Treasury Regulations"), administrative rulings and judicial decisions, all as of the date hereof. These authorities may be changed, possibly retroactively, and any changes may result in U.S. federal income tax consequences different from those set forth below. We have not sought any ruling from the Internal Revenue Service (the "IRS") with respect to the statements made and the conclusions reached in the following summary. The authorities on which this discussion is based are subject to various interpretations and there can be no assurance that the IRS or the courts will agree with such statements and conclusions.
This summary also does not address the tax considerations arising under the laws of any state, local or non-U.S. jurisdiction or under U.S. federal gift and estate tax laws, except to the limited extent set forth below. This summary is limited to persons who hold our Class A common stock as a capital asset for U.S. federal income tax purposes (within the meaning of section 1221 of the Code). In addition, because this section is a general summary, it does not address all aspects of taxation that may be relevant to particular stockholders in light of their personal investment or tax circumstances, or to certain types of stockholders that are subject to special treatment under the U.S. federal income tax laws, including, without limitation, brokers or dealers in securities, insurance companies, banks or other financial institutions, hybrid entities, regulated investment companies, real estate investment trusts, tax-exempt organizations or accounts, persons holding Class A common stock as a part of a hedging, integrated, conversion transaction, straddle or other risk reduction transaction, traders in securities that elect to use a mark-to-market method of accounting for their securities holdings, persons subject to the alternative minimum tax or the Medicare tax on net investment income, entities or arrangements treated as partnerships for U.S. federal income tax purposes or investors in such entities, persons who acquired our Class A common stock through the exercise of employee stock options or otherwise as compensation for services, certain former U.S. citizens or long-term residents, U.S. expatriates, "controlled foreign corporations" or "passive foreign investment companies" within the meaning of the Code, and persons deemed to sell our Class A common stock under the constructive sale provisions of the Code. If a partnership, including any entity or arrangement treated as a partnership for U.S. federal income tax purposes, holds shares of our Class A common stock, the U.S. federal income tax treatment of a partner in such partnership will generally depend upon the status of the partner and the activities of the partnership. Such partners and partnerships should consult their tax advisors regarding the tax consequences of the purchase, ownership or disposition of our Class A common stock.
Non-U.S. Holders are urged to consult their tax advisors with respect to the application of the U.S. federal income tax laws to their particular situations, as well as any tax consequences of the purchase, ownership and disposition of our Class A common stock arising under the U.S. federal estate or gift tax rules or under the laws of any state, local, non-U.S. or other taxing jurisdiction or under any applicable tax treaty.
Non-U.S. Holder Defined
As used in this discussion, the term "Non-U.S. Holder" means a beneficial owner of our Class A common stock that, for U.S. federal income tax purposes, is an individual, corporation, estate or trust and is not any of the following for U.S. federal income tax purposes:
- •
- an entity or arrangement treated as a partnership;
- •
- an individual who is a citizen or tax resident of the United States;
231
- •
- a corporation created or organized in the United States or under the laws of the United States or any state thereof or the District of
Columbia;
- •
- an estate whose income is subject to U.S. federal income tax regardless of its source; or
- •
- a trust (i) the administration of which is subject to the primary supervision of a U.S. court and that has one or more U.S. persons who have the authority to control all substantial decisions of the trust or (ii) that has a valid election in effect under applicable Treasury Regulations to be treated as a U.S. person.
Distributions
We do not anticipate making distributions on our common stock in the foreseeable future. However, if distributions of cash or property (other than certain pro rata stock distributions) are made to Non-U.S. Holders on shares of our Class A common stock, such distributions generally will constitute dividends for U.S. federal income tax purposes to the extent paid from our current or accumulated earnings and profits, as determined under U.S. federal income tax principles. To the extent those distributions exceed both our current and our accumulated earnings and profits, they will constitute a return of capital and will first reduce a Non-U.S. Holder's basis in our Class A common stock (determined separately with respect to each share of our Class A common stock), but not below zero, and then will be treated as gain from the sale of that Class A common stock as described below under "—Gain on Disposition of Our Class A Common Stock."
Except as described in the next paragraph and subject to the discussion of FATCA, any dividend paid to a Non-U.S. Holder generally will be subject to U.S. federal withholding tax either at a rate of 30% of the gross amount of the dividend or such lower rate as may be specified by an applicable income tax treaty. In order to receive a reduced treaty rate, the Non-U.S. Holder must provide the applicable withholding agent in a timely manner a properly completed IRS Form W-8BEN or W-8BEN-E, whichever is applicable, or other appropriate version of IRS Form W-8, certifying qualification for the reduced rate. A Non-U.S. Holder of shares of our Class A common stock eligible for a reduced rate of U.S. federal withholding tax pursuant to an income tax treaty may obtain a refund of any excess amounts withheld by filing an appropriate claim for refund with the IRS in a timely manner. If the Non-U.S. Holder holds the Class A common stock through a financial institution or other agent acting on the Non-U.S. Holder's behalf, the Non-U.S. Holder will be required to provide appropriate documentation to the agent, which then will be required to provide certification to the applicable withholding agent, either directly or through other intermediaries.
The withholding tax shall not apply to any dividend paid to a Non-U.S. Holder if such dividend is effectively connected with a U.S. trade or business conducted by such non-U.S. Holder. In order to claim this exemption, the Non-U.S. Holder must provide the applicable withholding agent with a properly completed IRS Form W-8ECI or other applicable IRS Form W-8 properly certifying such exemption. Such effectively connected dividends, although not subject to U.S. federal withholding tax, will generally be subject to U.S. federal income tax on a net income basis at applicable graduated U.S. federal income tax rates, subject to an applicable income tax treaty providing otherwise. In addition, dividends received by a Non-U.S. Holder that is treated as a corporation for U.S. federal income tax purposes that are effectively connected with such Non-U.S. Holder's conduct of a U.S. trade or business may also be subject to a "branch profits tax" at a rate of 30% or such lower rate as may be specified by an applicable income tax treaty.
232
Gain on Disposition of Our Class A Common Stock
Subject to the discussion of FATCA and backup withholding, Non-U.S. Holders generally will not be required to pay U.S. federal income tax, including by way of withholding, on any gain realized upon the sale or other disposition of our Class A common stock unless:
- •
- the gain is effectively connected with the Non-U.S. Holder's conduct of a U.S. trade or business, and if an applicable income tax treaty
requires, is attributable to a U.S. permanent establishment maintained by the Non-U.S. Holder in the United States;
- •
- the Non-U.S. Holder is an individual not entitled to the benefits of an income tax treaty who is present in the United States for a period or
periods aggregating 183 days or more during the calendar year in which the sale or disposition occurs and certain other conditions are met;
- •
- our Class A common stock constitutes a U.S. real property interest by reason of our status as a "United States real property holding corporation" (a "USRPHC") for U.S. federal income tax purposes at any time during the shorter of the five-year period preceding the Non-U.S. Holder's disposition of, or the Non-U.S. Holder's holding period for, our Class A common stock.
Generally, a corporation is a USRPHC if the fair market value of its U.S. real property interests (within the meaning of the Code and applicable Treasury Regulations) equals or exceeds 50% of the sum of the fair market value of its worldwide real property interests plus its other assets used or held for use in a trade or business. We believe that we are not currently a USRPHC and, based on our business plan and anticipated operations, do not expect to become a USRPHC in the future. However USRPHC status is an inherently factual determination that involves complex legal considerations. We have not sought an IRS ruling with respect to whether we are a USRPHC and we cannot give definitive assurance regarding our non-USRPHC status. Additionally, because the determination of whether we are a USRPHC depends on the fair market value of our U.S. real property interests relative to the fair market value of our other business assets, there can be no assurance that we will not become a USRPHC in the future. Even if we are or become a USRPHC, as long as our Class A common stock is regularly traded on an established securities market (within the meaning of the Code and applicable Treasury Regulations), such Class A common stock will not be treated as a U.S. real property interest in the hands of any Non-U.S. Holder who does not hold (actually or constructively) more than 5% of our Class A common stock at any time during the shorter of the five-year period preceding the Non-U.S. Holder's disposition of, or the Non-U.S. Holder's holding period for, our Class A common stock. Non-U.S. Holders should be aware that no prediction can be made as to whether our Class A common stock will be regularly traded on an established securities market (within the meaning of the Code and applicable Treasury Regulations).
Non-U.S. Holders described in the first bullet above will be required to pay tax on the net gain derived from the sale under regular graduated U.S. federal income tax rates, and a corporate Non-U.S. Holder described in the first bullet above also may be subject to the branch profits tax at a 30% rate, or such lower rate as may be specified by an applicable income tax treaty. Individual Non-U.S. Holders described in the second bullet above will be required to pay a flat 30% tax on the gain derived from the sale, which gain may be offset by U.S.-source capital losses for that year.
U.S. Federal Estate Taxes
Our Class A common stock beneficially owned or treated as beneficially owned by an individual who at the time of death is not a citizen or resident of the United States (as specifically defined for U.S. federal estate tax purposes), and certain lifetime transfers of an interest in Class A common stock made by such an individual, will be included in his or her gross estate for U.S. federal estate tax purposes and, therefore, may be subject to U.S. federal estate tax, unless an applicable estate tax treaty provides otherwise.
233
Backup Withholding and Information Reporting
Generally, we must report annually to the IRS the amount of dividends paid to a Non-U.S. Holder, the Non-U.S. Holder's name and address, and the amount of U.S. federal income tax withheld, if any. A similar report will be sent to the Non-U.S. Holder. These information reporting requirements apply even if withholding was not required because the dividends were effectively connected to the conduct of a Non-U.S. Holder's trade or business within the United States or withholding was reduced by an applicable income tax treaty. Pursuant to applicable income tax treaties or other agreements, the IRS may make these reports available to tax authorities in the Non-U.S. Holder's country of residence.
Payments of dividends on, or of proceeds from the disposition of, our Class A common stock made to Non-U.S. Holders may be subject to additional information reporting and backup withholding unless the Non-U.S. Holder establishes an exemption, for example, by properly certifying its non-U.S. status on an IRS Form W-8BEN or W-8BEN-E, whichever is applicable, or another appropriate version of IRS Form W-8. Notwithstanding the foregoing, backup withholding and information reporting may apply if the applicable withholding agent has actual knowledge, or reason to know, that a holder claiming to be a Non-U.S. Holder is a U.S. person.
U.S. information reporting and backup withholding generally will not apply to a payment of proceeds of a disposition of Class A common stock where the transaction is effected outside the United States through a non-U.S. office of a non-U.S. broker. However, information reporting requirements, but not backup withholding, generally will apply to such a payment if the broker is (i) a U.S. person; or (ii) a foreign person with certain U.S. connections, unless the broker has documentary evidence in its records that the holder is a Non-U.S. Holder and certain conditions are met or the holder otherwise establishes an exemption. Backup withholding is not an additional tax; rather, the U.S. federal income tax liability of persons subject to backup withholding will be reduced by the amount of tax withheld. If withholding results in an overpayment of taxes, a refund or credit may generally be obtained from the IRS, provided that the required information is furnished to the IRS in a timely manner. Non-U.S. Holders should consult their own tax advisors regarding the application of backup withholding in their particular circumstances and the availability of and procedure for obtaining an exemption from backup withholding under current Treasury Regulations.
FATCA
Legislation commonly known as FATCA (under Sections 1471 to 1474 of the Code) generally will impose a U.S. federal withholding tax of 30% on dividends on and the gross proceeds of a disposition of our Class A common stock paid to a "foreign financial institution" (as defined under FATCA and the applicable Treasury Regulations), unless such institution enters into an agreement with the U.S. government to withhold on certain payments and to collect and provide to the U.S. tax authorities substantial information regarding the U.S. account holders of such institution (which includes certain equity and debt holders of such institution, as well as certain account holders that are foreign entities with U.S. owners) or otherwise establishes an exemption. The legislation also generally will impose a U.S. federal withholding tax of 30% on dividends on and the gross proceeds of a disposition of our Class A common stock paid to a non-financial foreign entity unless such entity provides the applicable withholding agent with a certification identifying certain substantial direct and indirect U.S. owners of the entity, certifies that there are none or otherwise establishes an exemption. The withholding taxes described above will apply to any dividend payments on our Class A common stock and, after December 31, 2018, to payments of gross proceeds from dispositions of our Class A common stock. Under certain circumstances, a Non-U.S. Holder might be eligible for refunds or credits of such taxes. An intergovernmental agreement between the United States and an applicable foreign country may modify the requirements described in this paragraph. Prospective investors are urged to consult with their own tax advisors regarding the possible implications of this legislation on their investment in our Class A common stock.
234
We and the selling stockholders are offering the shares of Class A common stock described in this prospectus through a number of underwriters. J.P. Morgan Securities LLC, Morgan Stanley & Co. LLC, Citigroup Global Markets Inc. and Goldman Sachs & Co. LLC are acting as representatives of the underwriters. We and the selling stockholders have entered into an underwriting agreement with the underwriters. Subject to the terms and conditions of the underwriting agreement, we and the selling stockholders have agreed to sell to the underwriters, and each underwriter has severally agreed to purchase, at the public offering price less the underwriting discounts and commissions set forth on the cover page of this prospectus, the number of shares of Class A common stock listed next to its name in the following table:
Name
|
Number of shares |
|||
|---|---|---|---|---|
J.P. Morgan Securities LLC |
||||
Morgan Stanley & Co. LLC |
||||
Citigroup Global Markets Inc. |
||||
Goldman Sachs & Co. LLC |
||||
Merrill Lynch, Pierce, Fenner & Smith |
||||
Barclays Capital Inc. |
||||
BNP Paribas Securities Corp. |
||||
Credit Agricole Securities (USA) Inc. |
||||
Deutsche Bank Securities Inc. |
||||
RBC Capital Markets, LLC |
||||
Scotia Capital (USA) Inc. |
||||
SG Americas Securities LLC |
||||
TD Securities (USA) LLC |
||||
| | | | | |
Total |
46,551,725 | |||
The underwriters are committed to purchase all the shares of Class A common stock offered by us and the selling stockholders if they purchase any shares of Class A common stock. The underwriting agreement also provides that if an underwriter defaults, the purchase commitments of non-defaulting underwriters may also be increased or the offering may be terminated. The offering of the shares by the underwriters is subject to receipt and acceptance and subject to the underwriters' right to reject any order in whole or in part.
The underwriters propose to offer the shares of Class A common stock directly to the public at the initial public offering price set forth on the cover page of this prospectus and to certain dealers at that price less a concession not in excess of $ per share. After the initial public offering of the shares of Class A common stock, the offering price and other selling terms may be changed by the underwriters. Sales of the shares of Class A common stock made outside of the United States may be made by affiliates of the underwriters.
The underwriters have an option to buy up to 5,172,414 additional shares of Class A common stock from the selling stockholders to cover sales of Class A common stock by the underwriters which exceed the number of shares specified in the table above. The underwriters have 30 days from the date of this prospectus to exercise this option. If any shares of Class A common stock are purchased with this option, the underwriters will purchase shares of Class A common stock in approximately the same proportion as shown in the table above. If any additional shares of Class A common stock are purchased, the underwriters will offer the additional shares of Class A common stock on the same terms as those on which the shares of Class A common stock are being offered.
235
At our request, the underwriters have reserved up to 5% of the common stock being offered by this prospectus for sale at the initial public offering price to our directors and officers, our employees, employees of ATS and certain employees of Altice N.V. and its subsidiaries. The sales will be made by Morgan Stanley & Co. LLC, an underwriter of this offering, and its affiliates through a directed share program. We do not know if these persons will choose to purchase all or any portion of these reserved shares, but any purchases they do make will reduce the number of shares available to the general public. Any reserved shares not so purchased will be offered by the underwriters to the general public on the same terms as the other shares of common stock offered by this prospectus. Any shares purchased by our directors and officers in the directed share program will be subject to a 180-day lock-up period, and any shares purchased by other persons in our directed share program will be subject to a 35-day lock-up period.
The underwriting fee is equal to the public offering price per share of Class A common stock less the amount paid by the underwriters to us and the selling stockholders per share of Class A common stock. The underwriting fee is $ per share. The following table shows the per share and total underwriting discounts and commissions to be paid to the underwriters assuming both no exercise and full exercise of the underwriters' option to purchase additional shares of Class A common stock.
| |
Without option exercise |
With full option exercise |
|||||
|---|---|---|---|---|---|---|---|
Per Share |
$ | $ | |||||
Total |
$ | $ | |||||
We estimate that the total expenses of this offering, including registration, filing and listing fees, printing fees and legal and accounting expenses, but excluding the underwriting discounts and commissions, will be approximately $7.5 million. The underwriters have agreed to reimburse the Company for certain expenses related to the offering.
A prospectus in electronic format may be made available on the web sites maintained by one or more underwriters, or selling group members, if any, participating in the offering. The underwriters may agree to allocate a number of shares of Class A common stock to underwriters and selling group members for sale to their online brokerage account holders. Internet distributions will be allocated by the representatives to underwriters and selling group members that may make Internet distributions on the same basis as other allocations.
We and our executive officers, directors, and holders of substantially all of our common stock have agreed with the underwriters, subject to certain exceptions, not to dispose of or hedge any of our or their common stock or securities convertible into or exchangeable for shares of common stock during the period from the date of this prospectus continuing through the date 180 days after the date of this prospectus, except with the prior written consent of J.P. Morgan Securities LLC and Morgan Stanley & Co. LLC. This agreement does not apply to any existing employee benefit plans. See "Shares Eligible for Future Sale" for a discussion of certain transfer restrictions.
We and the selling stockholders have agreed to indemnify the several underwriters against certain liabilities, including liabilities under the Securities Act.
Our Class A common stock has been approved for listing on the NYSE under the symbol "ATUS."
In connection with this offering, the underwriters may engage in stabilizing transactions, which involves making bids for, purchasing and selling shares of Class A common stock in the open market for the purpose of preventing or retarding a decline in the market price of our Class A common stock while this offering is in progress. These stabilizing transactions may include making short sales of our Class A common stock, which involves the sale by the underwriters of a greater number of shares of
236
Class A common stock than they are required to purchase in this offering, and purchasing shares of Class A common stock on the open market to cover positions created by short sales. Short sales may be "covered" shorts, which are short positions in an amount not greater than the underwriters' option referred to above, or may be "naked" shorts, which are short positions in excess of that amount. The underwriters may close out any covered short position either by exercising their option, in whole or in part, or by purchasing shares of Class A common stock in the open market. In making this determination, the underwriters will consider, among other things, the price of shares of Class A common stock available for purchase in the open market compared to the price at which the underwriters may purchase shares of Class A common stock through the option to purchase additional shares of Class A common stock. A naked short position is more likely to be created if the underwriters are concerned that there may be downward pressure on the price of our Class A common stock in the open market that could adversely affect investors who purchase in this offering. To the extent that the underwriters create a naked short position, they will purchase shares of Class A common stock in the open market to cover the position.
The underwriters have advised us and the selling stockholders that, pursuant to Regulation M of the Securities Act, they may also engage in other activities that stabilize, maintain or otherwise affect the price of our Class A common stock, including the imposition of penalty bids. This means that if the representatives of the underwriters purchase Class A common stock in the open market in stabilizing transactions or to cover short sales, the representatives can require the underwriters that sold those shares of Class A common stock as part of this offering to repay the underwriting discount received by them.
These activities may have the effect of raising or maintaining the market price of the Class A common stock or preventing or retarding a decline in the market price of the Class A common stock, and, as a result, the price of the Class A common stock may be higher than the price that otherwise might exist in the open market. If the underwriters commence these activities, they may discontinue them at any time. The underwriters may carry out these transactions on the NYSE, in the OTC market or otherwise.
Prior to this offering, there has been no public market for the Class A common stock. The initial public offering price was determined by negotiations among us, the selling stockholders and the representatives of the underwriters. In determining the initial public offering price, we, the selling stockholders and the representatives of the underwriters considered a number of factors including:
- •
- the information set forth in this prospectus and otherwise available to the representatives;
- •
- our prospects and the history and prospects for the industry in which we compete;
- •
- an assessment of our management;
- •
- our prospects for future earnings;
- •
- the general condition of the securities markets at the time of this offering;
- •
- the recent market prices of, and demand for, publicly traded common stock of generally comparable companies;
and
- •
- other factors deemed relevant by the underwriters and us.
Neither we, the selling stockholders nor the underwriters can assure investors that an active trading market will develop for our Class A common stock, or that our Class A common stock will trade in the public market at or above the initial public offering price.
The underwriters and their respective affiliates are full service financial institutions engaged in various activities, which may include, amongst other things, securities trading, commercial and investment banking, financial advisory, investment management, investment research, principal
237
investment, hedging, financing and brokerage activities. Certain of the underwriters and their respective affiliates have, from time to time, performed, and may in the future perform, various financial advisory, investment banking and related services (including as initial purchasers of debt securities and/or arrangers of credit facilities) for the Altice Group, including the Company and its subsidiaries, for which they received or will receive customary fees and expenses. Affiliates of certain of the underwriters are agents and/or lenders under the CVC Credit Facilities Agreement and the Suddenlink Credit Facilities Agreement, as applicable, each as amended, restated, supplemented or otherwise modified from time to time. See "Description of Certain Indebtedness."
If any of the underwriters or their affiliates has a lending relationship with us, certain of those underwriters or their affiliates routinely hedge, certain other of those underwriters or their affiliates may hedge, and certain other of those underwriters or their affiliates are likely to hedge, their credit exposure to us consistent with their customary risk management policies. Typically, these underwriters and their affiliates would hedge such exposure by entering into transactions which consist of either the purchase of credit default swaps or the creation of short positions in our securities.
In the ordinary course of their various business activities, the underwriters and their respective affiliates may make or hold a broad array of investments and actively trade debt and equity securities (or related derivative securities) and financial instruments (including bank loans) for their own account and for the accounts of their customers, and such investments and securities activities may involve securities and/or instruments of the Company or its affiliates. In connection with this offering, any of the underwriters or their respective affiliates acting as investors for their own account may take up the shares and, in such capacity, may retain, purchase or sell such shares for their own accounts. The underwriters and their respective affiliates may also make investment recommendations and/or publish or express independent research views in respect of such securities or instruments and may at any time hold, or recommend to clients that they acquire, long and/or short positions in such securities and instruments.
Selling Restrictions
General
Other than in the United States, no action has been taken by us or the underwriters that would permit a public offering of the securities offered by this prospectus in any jurisdiction where action for that purpose is required. The securities offered by this prospectus may not be offered or sold, directly or indirectly, nor may this prospectus or any other offering material or advertisements in connection with the offer and sale of any such securities be distributed or published in any jurisdiction, except under circumstances that will result in compliance with the applicable rules and regulations of that jurisdiction. Outside of the United States, persons into whose possession this prospectus comes are advised to inform themselves about and to observe any restrictions imposed by any applicable laws and regulations outside of the United States relating to the offering and the distribution of this prospectus.
This prospectus does not constitute an offer to sell or a solicitation of an offer to buy any securities offered by this prospectus in any jurisdiction in which such an offer or a solicitation is unlawful.
United Kingdom
This document is only being distributed to and is only directed at (i) persons who are outside the United Kingdom or (ii) to investment professionals falling within Article 19(5) of the Financial Services and Markets Act 2000 (Financial Promotion) Order 2005 (the "FSMA Order") or (iii) high net worth entities, and other persons to whom it may lawfully be communicated, falling with Article 49(2)(a) to (d) of the FSMA Order (all such persons together being referred to as "relevant persons"). The securities are only available to, and any invitation, offer or agreement to subscribe, purchase or
238
otherwise acquire such securities will be engaged in only with, relevant persons. Any person who is not a relevant person should not act or rely on this document or any of its contents.
European Economic Area
In relation to each Member State of the European Economic Area which has implemented the Prospectus Directive (each, a "Relevant Member State"), from and including the date on which the European Union Prospectus Directive (the "EU Prospectus Directive") was implemented in that Relevant Member State (the "Relevant Implementation Date") an offer of securities described in this prospectus may not be made to the public in that Relevant Member State prior to the publication of a prospectus in relation to the shares which has been approved by the competent authority in that Relevant Member State or, where appropriate, approved in another Relevant Member State and notified to the competent authority in that Relevant Member State, all in accordance with the EU Prospectus Directive, except that, with effect from and including the Relevant Implementation Date, an offer of securities described in this prospectus may be made to the public in that Relevant Member State at any time:
- •
- to any legal entity which is a qualified investor as defined under the EU Prospectus Directive;
- •
- to fewer than 100 or, if the Relevant Member State has implemented the relevant provision of the 2010 PD Amending Directive, 150 natural or
legal persons (other than qualified investors as defined in the EU Prospectus Directive); or
- •
- in any other circumstances falling within Article 3(2) of the EU Prospectus Directive, provided that no such offer of securities described in this prospectus shall result in a requirement for the publication by us of a prospectus pursuant to Article 3 of the EU Prospectus Directive.
For the purposes of this provision, the expression an "offer of securities to the public" in relation to any securities in any Relevant Member State means the communication in any form and by any means of sufficient information on the terms of the offer and the securities to be offered so as to enable an investor to decide to purchase or subscribe for the securities, as the same may be varied in that Member State by any measure implementing the EU Prospectus Directive in that Member State. The expression "EU Prospectus Directive" means Directive 2003/71/EC (and any amendments thereto, including the 2010 PD Amending Directive, to the extent implemented in the Relevant Member State) and includes any relevant implementing measure in each Relevant Member State, and the expression "2010 PD Amending Directive" means Directive 2010/73/EU.
Switzerland
The shares may not be publicly offered in Switzerland and will not be listed on the SIX Swiss Exchange ("SIX") or on any other stock exchange or regulated trading facility in Switzerland. This document has been prepared without regard to the disclosure standards for issuance prospectuses under article. 652a or article. 1156 of the Swiss Code of Obligations or the disclosure standards for listing prospectuses under article. 27 ff. of the SIX Listing Rules or the listing rules of any other stock exchange or regulated trading venue in Switzerland.
Neither this document nor any other offering or marketing material relating to the shares or the offering may be publicly distributed or otherwise made publicly available in Switzerland. Neither this document nor any other offering or marketing material relating to the offering, the Company or the shares have been or will be filed with or approved by any Swiss regulatory authority. In particular, this document will not be filed with, and the offer of shares will not be supervised by, the Swiss Financial Market Supervisory Authority FINMA ("FINMA"), and the offer of shares has not been and will not be authorized under the Swiss Federal Act on Collective Investment Schemes ("CISA"). The investor
239
protection afforded to acquirers of interests in collective investment schemes under the CISA does not extend to acquirers of shares.
If you are located in Switzerland, 1) you understand that the investment in the shares is a private placement, 2) you may not and will not (i) publicly offer, sell, advertise, distribute or re-distribute, directly or indirectly, in or from Switzerland the shares and (ii) communicate, distribute or otherwise make available in Switzerland any solicitation for investments in the shares in any way that could constitute a public offering within the meaning of articles 1156 or 652a of the Swiss Code of Obligations ("CO") or of article 3 of the Federal Act on Collective Investment Schemes ("CISA"), 3) you have had access to all relevant information to make a fair investment decision and 4) you are aware of the risks related to an investment in the shares.
Canada
The Class A common stock may be sold only to purchasers purchasing, or deemed to be purchasing, as principal that are accredited investors, as defined in National Instrument 45-106 Prospectus Exemptions or subsection 73.3(1) of the Securities Act (Ontario), and are permitted clients, as defined in National Instrument 31-103 Registration Requirements, Exemptions and Ongoing Registrant Obligations. Any resale of shares of the Class A common stock must be made in accordance with an exemption from, or in a transaction not subject to, the prospectus requirements of applicable securities laws.
Securities legislation in certain provinces or territories of Canada may provide a purchaser with remedies for rescission or damages if this prospectus (including any amendment thereto) contains a misrepresentation, provided that the remedies for rescission or damages are exercised by the purchaser within the time limit prescribed by the securities legislation of the purchaser's province or territory. The purchaser should refer to any applicable provisions of the securities legislation of the purchaser's province or territory for particulars of these rights or consult with a legal advisor.
Japan
No registration pursuant to Article 4, paragraph 1 of the Financial Instruments and Exchange Law of Japan (Law No. 25 of 1948, as amended), or the FIEL, has been made or will be made with respect to the solicitation of the application for the acquisition of the shares of Class A common stock.
Accordingly, the shares of Class A common stock have not been, directly or indirectly, offered or sold and will not be, directly or indirectly, offered or sold in Japan or to, or for the benefit of, any resident of Japan (which term as used herein means any person resident in Japan, including any corporation or other entity organized under the laws of Japan) or to others for re-offering or re-sale, directly or indirectly, in Japan or to, or for the benefit of, any resident of Japan except pursuant to an exemption from the registration requirements, and otherwise in compliance with, the FIEL and the other applicable laws and regulations of Japan.
Hong Kong
Each underwriter has represented and agreed that:
- •
- it has not offered or sold and will not offer or sell in Hong Kong, by means of any document, any of our Class A common stock other than (i) to "professional investors" as defined in the Securities and Futures Ordinance (Cap. 571) of Hong Kong and any rules made under that Ordinance; or (ii) in other circumstances which do not result in the document being a
240
- •
- it has not issued or had in its possession for the purposes of issue, and will not issue or have in its possession for the purposes of issue, whether in Hong Kong or elsewhere, any advertisement, invitation or document relating to our Class A common stock, which is directed at, or the contents of which are likely to be accessed or read by, the public of Hong Kong (except if permitted to do so under the securities laws of Hong Kong) other than with respect to shares of our Class A common stock which are or are intended to be disposed of only to persons outside Hong Kong or only to "professional investors" as defined in the Securities and Futures Ordinance and any rules made under that Ordinance.
"prospectus" as defined in the Companies Ordinance (Cap. 32) of Hong Kong or which do not constitute an offer to the public within the meaning of that Ordinance; and
Singapore
This prospectus has not been registered as a prospectus with the Monetary Authority of Singapore. Accordingly, this prospectus and any other document or material in connection with the offer or sale, or invitation for subscription or purchase, of the shares may not be circulated or distributed, nor may the shares be offered or sold, or be made the subject of an invitation for subscription or purchase, whether directly or indirectly, to persons in Singapore other than (i) to an institutional investor under Section 274 of the Securities and Futures Act, Chapter 289 of Singapore, or the SFA, (ii) to a relevant person pursuant to Section 275(1), or any person pursuant to Section 275(1A), and in accordance with the conditions specified in Section 275 of the SFA or (iii) otherwise pursuant to, and in accordance with the conditions of, any other applicable provision of the SFA, in each case subject to compliance with conditions set forth in the SFA.
Where the shares are subscribed or purchased under Section 275 of the SFA by a relevant person which is:
- •
- a corporation (which is not an accredited investor (as defined in Section 4A of the SFA)) the sole business of which is to hold
investments and the entire share capital of which is owned by one or more individuals, each of whom is an accredited investor; or
- •
- a trust (where the trustee is not an accredited investor) whose sole purpose is to hold investments and each beneficiary of the trust is an
individual who is an accredited investor,
- •
- shares, debentures and units of shares and debentures of that corporation or the beneficiaries' rights and interest (howsoever described) in
that trust shall not be transferred within six months after that corporation or that trust has acquired the shares pursuant to an offer made under Section 275 of the SFA
except:
- •
- to an institutional investor (for corporations, under Section 274 of the SFA) or to a relevant person defined in Section 275(2)
of the SFA, or to any person pursuant to an offer that is made on terms that such shares, debentures and units of shares and debentures of that corporation or such rights and interest in that trust
are acquired at a consideration of not less than $200,000 (or its equivalent in a foreign currency) for each transaction, whether such amount is to be paid for in cash or by exchange of securities or
other assets, and further for corporations, in accordance with the conditions specified in Section 275 of the SFA;
- •
- where no consideration is or will be given for the transfer; or
- •
- where the transfer is by operation of law.
241
The validity of the common stock offered hereby will be passed upon for us by Shearman & Sterling LLP, New York, New York. Certain legal matters will be passed upon for us by Jenner & Block LLP, New York, New York and Mayer Brown LLP, New York, New York. Certain legal matters will be passed upon for the underwriters by Ropes & Gray LLP, Boston, Massachusetts.
The consolidated financial statements of Altice USA, Inc. as of December 31, 2016, and for the year ended December 31, 2016, have been included in this prospectus and the registration statement, of which this prospectus forms a part, in reliance upon the report (which contains emphasis of a matter paragraph relating to the formation of Altice USA and the inclusion of Cequel Corporation operating results for the full year of 2016) of KPMG LLP, an independent registered public accounting firm, appearing elsewhere herein, and upon the authority of said firm as experts in accounting and auditing.
The consolidated financial statements of Cablevision Systems Corporation as of December 31, 2015 and for the years ended December 31, 2015 and 2014 and the period from January 1, 2016 through June 20, 2016 have been included in this prospectus and the registration statement, of which this prospectus forms a part, in reliance upon the report of KPMG LLP, an independent registered public accounting firm, appearing elsewhere herein, and upon the authority of said firm as experts in accounting and auditing.
The consolidated financial statements of Cequel Corporation as of December 31, 2015 ("Successor") and 2014 ("Predecessor") and the related consolidated statements of operations and comprehensive (loss)/income, changes in stockholders' equity and of cash flows for the period from December 21, 2015 to December 31, 2015 ("Successor") and for the period from January 1, 2015 to December 20, 2015 and the year ended December 31, 2014 ("Predecessor") included in this prospectus have been so included in reliance on the reports of PricewaterhouseCoopers LLP, independent accountants, given on the authority of such firm as experts in accounting and auditing.
Independence
In connection with Altice USA's filing for an initial public offering of its common stock, we requested our independent auditor to affirm its independence relative to the rules and regulations of the Public Company Accounting Oversight Board (PCAOB) and the U.S. Securities and Exchange Commission (SEC).
KPMG LLP's (KPMG), our registered independent public accountants, independence evaluation procedures identified an engagement by a KPMG member firm that consisted of a service provided to an affiliate of Altice USA by a member firm of KPMG International Cooperative wherein the member firm performed a bookkeeping service, which included elements that are considered management functions under the SEC independence rules. This engagement was terminated in October, 2016. The KPMG member firm referenced above does not participate in the audit engagement and the services did not have any impact on the Company.
KPMG considered whether the matters noted above impacted its objectivity and ability to exercise impartial judgment with regard to its engagement as our auditors and have concluded that there has been no impairment of KPMG's objectivity and ability to exercise impartial judgment on all matters encompassed within its audits. After taking into consideration the facts and circumstances of the above matter and KPMG's determination, our audit committee also concluded that KPMG's objectivity and ability to exercise impartial judgment has not been impaired.
242
WHERE YOU CAN FIND MORE INFORMATION
We have filed a Registration Statement on Form S-1 with the SEC regarding this offering. This prospectus, which is part of the registration statement, does not contain all of the information included in the registration statement and you should refer to the registration statement and its exhibits to read that information. References in this prospectus to any of our contracts or other documents are not necessarily complete and you should refer to the exhibits attached to the registration statement for copies of the actual contract or document. Following the completion of this offering, we will be subject to the information reporting requirements of the Exchange Act and we will file reports, proxy statements and other information with the SEC.
You may read and copy the registration statement and the related exhibits, and the reports, proxy statements and other information we will file with the SEC, at the SEC's public reference room maintained at 100 F Street N.E., Room 1580, Washington, D.C. 20549. You can also request copies of those documents, upon payment of a duplicating fee, by writing to the SEC. Please call the SEC at 1-800-SEC-0330 for further information on the operation of the public reference room. The SEC also maintains an Internet site that contains reports, proxy and information statements and other information regarding issuers that file with the SEC. The site's Internet address is www.sec.gov.
243
F-1
F-2
ALTICE USA, INC. AND SUBSIDIARIES
CONSOLIDATED BALANCE SHEETS
(In thousands)
| |
Pro forma (See Note 1) |
|
|
|||||||
|---|---|---|---|---|---|---|---|---|---|---|
| |
Historical | |
||||||||
| |
December 31, 2016 |
|||||||||
ASSETS
|
March 31, 2017 | |||||||||
| |
(Unaudited) |
|
||||||||
Current Assets: |
||||||||||
Cash and cash equivalents |
$ | 313,747 | $ | 463,882 | $ | 486,792 | ||||
Restricted cash |
14,951 | 14,951 | 16,301 | |||||||
Accounts receivable, trade (less allowance for doubtful accounts of $9,717 and $11,677) |
307,080 | 307,080 | 349,626 | |||||||
Prepaid expenses and other current assets (including a prepayment to an affiliate of $9,441 in 2017) (See Note 13) |
104,163 | 104,163 | 88,151 | |||||||
Amounts due from affiliates |
28,384 | 28,384 | 22,182 | |||||||
Investment securities pledged as collateral |
601,938 | 601,938 | 741,515 | |||||||
Derivative contracts |
— | — | 352 | |||||||
| | | | | | | | | | | |
Total current assets |
1,370,263 | 1,520,398 | 1,704,919 | |||||||
Property, plant and equipment, net of accumulated depreciation of $1,405,384 and $1,039,297 |
6,391,270 | 6,391,270 | 6,597,635 | |||||||
Investment in affiliates |
3,384 | 3,384 | 5,606 | |||||||
Investment securities pledged as collateral |
1,012,750 | 1,012,750 | 741,515 | |||||||
Derivative contracts |
— | — | 10,604 | |||||||
Other assets |
49,073 | 49,073 | 48,545 | |||||||
Amortizable customer relationships, net of accumulated amortization of $791,505 and $580,276 |
5,134,379 | 5,134,379 | 5,345,608 | |||||||
Amortizable trade names, net of accumulated amortization of $108,883 and $83,397 |
957,900 | 957,900 | 983,386 | |||||||
Other amortizable intangibles, net of accumulated amortization of $4,397 and $3,093 |
22,435 | 22,435 | 23,650 | |||||||
Indefinite-lived cable television franchises |
13,020,081 | 13,020,081 | 13,020,081 | |||||||
Goodwill |
8,067,611 | 8,067,611 | 7,992,700 | |||||||
| | | | | | | | | | | |
Total Assets |
$ | 36,029,146 | $ | 36,179,281 | $ | 36,474,249 | ||||
| | | | | | | | | | | |
| | | | | | | | | | | |
| | | | | | | | | | | |
See accompanying notes to consolidated financial statements
F-3
ALTICE USA, INC. AND SUBSIDIARIES
CONSOLIDATED BALANCE SHEETS (Continued)
(In thousands)
| |
Pro forma (See Note 1) |
|
|
|||||||
|---|---|---|---|---|---|---|---|---|---|---|
| |
Historical | |
||||||||
| |
December 31, 2016 |
|||||||||
LIABILITIES AND STOCKHOLDERS' EQUITY
|
March 31, 2017 | |||||||||
| |
(Unaudited) |
|
||||||||
Current Liabilities: |
||||||||||
Accounts payable |
$ | 660,374 | $ | 660,374 | $ | 697,310 | ||||
Accrued liabilities: |
||||||||||
Interest |
331,309 | 481,444 | 576,778 | |||||||
Employee related costs |
247,565 | 247,565 | 260,019 | |||||||
Other accrued expenses |
257,422 | 257,422 | 333,522 | |||||||
Amounts due to affiliates |
350,855 | 11,155 | 127,363 | |||||||
Deferred revenue |
109,224 | 109,224 | 94,816 | |||||||
Liabilities under derivative contracts |
36,073 | 36,073 | 13,158 | |||||||
Collateralized indebtedness |
461,946 | 461,946 | 622,332 | |||||||
Credit facility debt |
31,988 | 31,988 | 33,150 | |||||||
Senior notes and debentures |
725,171 | 725,171 | 926,045 | |||||||
Capital lease obligations |
13,350 | 13,350 | 15,013 | |||||||
Notes payable |
4,150 | 4,150 | 5,427 | |||||||
| | | | | | | | | | | |
Total current liabilities |
3,229,427 | 3,039,862 | 3,704,933 | |||||||
Defined benefit plan obligations |
84,296 | 84,296 | 84,106 | |||||||
Notes payable to affiliates and related parties |
— | 1,750,000 | 1,750,000 | |||||||
Other liabilities |
161,076 | 161,076 | 113,485 | |||||||
Deferred tax liability |
7,606,359 | 7,606,359 | 7,966,815 | |||||||
Liabilities under derivative contracts |
113,654 | 113,654 | 78,823 | |||||||
Collateralized indebtedness |
831,756 | 831,756 | 663,737 | |||||||
Credit facility debt |
3,956,353 | 3,456,353 | 3,411,640 | |||||||
Senior notes and debentures |
16,780,547 | 16,780,547 | 16,581,280 | |||||||
Capital lease obligations |
10,194 | 10,194 | 13,142 | |||||||
Notes payable |
7,303 | 7,303 | 8,299 | |||||||
| | | | | | | | | | | |
Total liabilities |
32,780,965 | 33,841,400 | 34,376,260 | |||||||
| | | | | | | | | | | |
Commitments and contingencies |
||||||||||
Redeemable equity |
211,687 | 211,687 | 68,147 | |||||||
Stockholders' Equity: |
||||||||||
Preferred Stock, $0.01 par value, 100,000,000 shares authorized, no shares issued and outstanding on a pro forma basis (unaudited) |
— | — | — | |||||||
Class A common stock: $0.01 par value, 4,000,000,000 shares authorized, 234,681,978 issued and outstanding on a pro forma basis (unaudited) |
2,347 | — | — | |||||||
Class B common stock: $0.01 par value, 1,000,000,000 shares authorized, 490,318,022 issued and outstanding on a pro forma basis (unaudited) |
4,903 | — | — | |||||||
Class C common stock: $0.01 par value, 4,000,000,000 shares authorized, no shares issued and outstanding on a pro forma basis (unaudited) |
— | — | — | |||||||
Common Stock, $.01 par value, 1,000 shares authorized, 100 shares issued and outstanding as of March 31, 2017 and December 31, 2016 |
— | — | — | |||||||
Paid-in capital |
4,287,833 | 2,867,863 | 3,003,554 | |||||||
Accumulated deficit |
(1,261,092 | ) | (744,172 | ) | (975,978 | ) | ||||
| | | | | | | | | | | |
|
3,033,991 | 2,123,691 | 2,027,576 | |||||||
Accumulated other comprehensive income |
1,979 | 1,979 | 1,979 | |||||||
| | | | | | | | | | | |
Total stockholders' equity |
3,035,970 | 2,125,670 | 2,029,555 | |||||||
Noncontrolling interest |
524 | 524 | 287 | |||||||
| | | | | | | | | | | |
Total equity |
3,036,494 | 2,126,194 | 2,029,842 | |||||||
| | | | | | | | | | | |
|
$ | 36,029,146 | $ | 36,179,281 | $ | 36,474,249 | ||||
| | | | | | | | | | | |
| | | | | | | | | | | |
| | | | | | | | | | | |
See accompanying notes to consolidated financial statements.
F-4
ALTICE USA, INC. AND SUBSIDIARIES
CONSOLIDATED STATEMENTS OF OPERATIONS AND COMPREHENSIVE LOSS
(In thousands, except weighted average common share amounts)
| |
Three Months Ended | ||||||
|---|---|---|---|---|---|---|---|
| |
March 31, 2017 |
March 31, 2016 |
|||||
Revenue (including revenue from affiliates of $141 in 2017) (See Note 13) |
$ | 2,305,676 | $ | 627,589 | |||
| | | | | | | | |
Operating expenses: |
|||||||
Programming and other direct costs (including charges from affiliates of $735 in 2017) (See Note 13) |
758,352 | 189,595 | |||||
Other operating expenses (including charges from affiliates of $7,298 and $2,500) (See Note 13) |
613,437 | 175,265 | |||||
Restructuring and other expense |
76,929 | 7,569 | |||||
Depreciation and amortization (including impairments) |
608,724 | 200,900 | |||||
| | | | | | | | |
|
2,057,442 | 573,329 | |||||
| | | | | | | | |
Operating income |
248,234 | 54,260 | |||||
| | | | | | | | |
Other income (expense): |
|||||||
Interest expense (including interest to affiliates of $47,588 in 2017) (See Note 13) |
(433,294 | ) | (275,829 | ) | |||
Interest income |
232 | 6,415 | |||||
Gain on investments, net |
131,658 | — | |||||
Loss on equity derivative contracts, net |
(71,044 | ) | — | ||||
Gain on interest rate swap contracts |
2,342 | — | |||||
Other expense, net |
(224 | ) | 11 | ||||
| | | | | | | | |
|
(370,330 | ) | (269,403 | ) | |||
| | | | | | | | |
Loss before income taxes |
(122,096 | ) | (215,143 | ) | |||
Income tax benefit |
45,908 | 74,395 | |||||
| | | | | | | | |
Net loss |
(76,188 | ) | (140,748 | ) | |||
Net income attributable to noncontrolling interests |
(237 | ) | — | ||||
| | | | | | | | |
Net loss attributable to Altice USA, Inc. stockholders |
$ | (76,425 | ) | $ | (140,748 | ) | |
| | | | | | | | |
| | | | | | | | |
| | | | | | | | |
Comprehensive loss |
$ | (76,425 | ) | $ | (140,748 | ) | |
| | | | | | | | |
| | | | | | | | |
| | | | | | | | |
Basic and diluted net loss per share |
$ | (764 | ) | $ | (1,407 | ) | |
| | | | | | | | |
| | | | | | | | |
| | | | | | | | |
Basic and diluted weighted average common shares |
100 | 100 | |||||
| | | | | | | | |
| | | | | | | | |
| | | | | | | | |
See accompanying notes to consolidated financial statements.
F-5
ALTICE USA, INC. AND SUBSIDIARIES
CONSOLIDATED STATEMENT OF STOCKHOLDERS' EQUITY
(In thousands)
| |
Class A Common Stock |
Paid-in Capital |
Accumulated Deficit |
Accumulated Other Comprehensive Income |
Total Stockholders' Equity (Deficiency) |
Non- controlling Interest |
Total Equity (Deficiency) |
|||||||||||||||
|---|---|---|---|---|---|---|---|---|---|---|---|---|---|---|---|---|---|---|---|---|---|---|
Balance at January 1, 2017 |
$ | — | $ | 3,003,554 | $ | (975,978 | ) | $ | 1,979 | $ | 2,029,555 | $ | 287 | $ | 2,029,842 | |||||||
Net loss attributable to stockholders |
— | — | (76,425 | ) | — | (76,425 | ) | — | (76,425 | ) | ||||||||||||
Net income attributable to noncontrolling interests |
— | — | — | — | — | 237 | 237 | |||||||||||||||
Share-based compensation expense |
— | 7,848 | — | — | 7,848 | — | 7,848 | |||||||||||||||
Change in fair value of redeemable equity |
— | (143,539 | ) | — | — | (143,539 | ) | — | (143,539 | ) | ||||||||||||
Recognition of previously unrealized excess tax benefits related to share-based awards in connection with the adoption ASU 2016-09 |
— | — | 308,231 | — | 308,231 | — | 308,231 | |||||||||||||||
| | | | | | | | | | | | | | | | | | | | | | | |
Balance at March 31, 2017 |
$ | — | $ | 2,867,863 | $ | (744,172 | ) | $ | 1,979 | $ | 2,125,670 | $ | 524 | $ | 2,126,194 | |||||||
| | | | | | | | | | | | | | | | | | | | | | | |
| | | | | | | | | | | | | | | | | | | | | | | |
| | | | | | | | | | | | | | | | | | | | | | | |
See accompanying notes to consolidated financial statements.
F-6
ALTICE USA, INC. AND SUBSIDIARIES
CONSOLIDATED STATEMENT OF CASH FLOWS
(In thousands)
| |
Three Months Ended March 31, |
||||||
|---|---|---|---|---|---|---|---|
| |
2017 | 2016 | |||||
Cash flows from operating activities: |
|||||||
Net loss |
$ | (76,188 | ) | $ | (140,748 | ) | |
Adjustments to reconcile net loss to net cash provided by operating activities: |
|||||||
Depreciation and amortization (including impairments) |
608,724 | 200,889 | |||||
Equity in net loss of affiliates |
2,757 | — | |||||
Gain on investments, net |
(131,658 | ) | — | ||||
Loss on equity derivative contracts, net |
71,044 | — | |||||
Amortization of deferred financing costs and discounts (premiums) on indebtedness |
1,812 | 18,549 | |||||
Share-based compensation expense |
7,848 | — | |||||
Deferred income taxes |
(52,184 | ) | (76,941 | ) | |||
Provision for doubtful accounts |
15,694 | 4,811 | |||||
Change in assets and liabilities, net of effects of acquisitions and dispositions: |
|||||||
Accounts receivable, trade |
34,707 | 913 | |||||
Prepaid expenses and other assets |
(19,554 | ) | 1,703 | ||||
Amounts due from and due to affiliates |
(131,958 | ) | 2,479 | ||||
Accounts payable |
147,999 | 4,931 | |||||
Accrued liabilities |
(253,313 | ) | 138,011 | ||||
Deferred revenue |
11,257 | 1,025 | |||||
Liabilities related to interest rate swap contracts |
(2,342 | ) | — | ||||
| | | | | | | | |
Net cash provided by operating activities |
234,645 | 155,622 | |||||
| | | | | | | | |
Cash flows from investing activities: |
|||||||
Payment for acquisition, net of cash acquired |
(43,608 | ) | — | ||||
Capital expenditures |
(257,427 | ) | (66,204 | ) | |||
Proceeds related to sale of equipment, including costs of disposal |
596 | 398 | |||||
Increase in other investments |
(550 | ) | — | ||||
Additions to other intangible assets |
(183 | ) | — | ||||
| | | | | | | | |
Net cash used in investing activities |
(301,172 | ) | (65,806 | ) | |||
| | | | | | | | |
Cash flows from financing activities: |
|||||||
Proceeds from credit facility debt |
$ | 225,000 | $ | — | |||
Repayment of credit facility debt |
(183,288 | ) | (5,980 | ) | |||
Proceeds from collateralized indebtedness |
156,136 | — | |||||
Repayment of collateralized indebtedness and related derivative contracts |
(150,084 | ) | — | ||||
Principal payments on capital lease obligations |
(4,207 | ) | (3,965 | ) | |||
Additions to deferred financing costs |
(1,290 | ) | — | ||||
| | | | | | | | |
Net cash provided by financing activities |
42,267 | (9,945 | ) | ||||
| | | | | | | | |
Net increase in cash and cash equivalents |
(24,260 | ) | 79,871 | ||||
| | | | | | | | |
Cash, cash equivalents and restricted cash at beginning of year |
503,093 | 8,634,921 | |||||
| | | | | | | | |
Cash, cash equivalents and restricted cash at end of year |
$ | 478,833 | $ | 8,714,792 | |||
| | | | | | | | |
| | | | | | | | |
| | | | | | | | |
See accompanying notes to consolidated financial statements.
F-7
ALTICE USA, INC.
NOTES TO CONSOLIDATED FINANCIAL STATEMENTS
(Dollars in thousands, except per share amounts)
(Unaudited)
NOTE 1. DESCRIPTION OF BUSINESS AND RELATED MATTERS
The Company and Related Matters
Altice USA, Inc. ("Altice USA" or the "Company") was incorporated in Delaware on September 14, 2015. As of March 31, 2017, Altice USA is majority-owned by Altice N.V., a public company with limited liability (naamloze vennootshcap) under Dutch law ("Altice N.V.").
Altice N.V. acquired Cequel Corporation ("Cequel" or "Suddenlink") on December 21, 2015 and Cequel was contributed to Altice USA on June 9, 2016. Altice USA had no operations of its own other than the issuance of debt prior to the contribution of Cequel on June 9, 2016 by Altice N.V. The results of operations of Cequel for the three months ended March 31, 2016 have been included in the results of operations of Altice USA for the same period, as Cequel was under common control with Altice USA. Altice USA acquired Cablevision Systems Corporation ("Cablevision" or "Optimum") on June 21, 2016 and the results of operations of Cablevision are included with the results of operations of Cequel for the three months ended March 31, 2017.
The Company classifies its operations into two reportable segments: Cablevision, which operates in the New York metropolitan area, and Cequel, which principally operates in markets in the south-central United States.
Acquisition of Cablevision Systems Corporation
On June 21, 2016 (the "Cablevision Acquisition Date"), pursuant to the Agreement and Plan of Merger (the "Merger Agreement"), dated as of September 16, 2015, by and among Cablevision, Altice N.V., Neptune Merger Sub Corp., a wholly-owned subsidiary of Altice N.V. ("Merger Sub"), Merger Sub merged with and into Cablevision, with Cablevision surviving the merger (the "Cablevision Acquisition").
In connection with the Cablevision Acquisition, each outstanding share of the Cablevision NY Group Class A common stock, par value $0.01 per share, and Cablevision NY Group Class B common stock, par value $0.01 per share, and together with the Cablevision NY Group Class A common stock, the "Shares") other than (i) Shares owned by Cablevision, Altice N.V. or any of their respective wholly-owned subsidiaries, in each case not held on behalf of third parties in a fiduciary capacity, received $34.90 in cash without interest, less applicable tax withholdings (the "Cablevision Acquisition Consideration").
Pursuant to an agreement, dated December 21, 2015, by and among CVC 2 B.V., CIE Management IX Limited, for and on behalf of the limited partnerships BC European Capital IX-1 through 11 and Canada Pension Plan Investment Board, certain affiliates of BCP and CPPIB (the "Co-Investors") funded approximately $1,000,000 toward the payment of the aggregate Per Share Cablevision Acquisition Consideration, and indirectly acquired approximately 30% of the Shares of Cablevision.
Also in connection with the Cablevision Acquisition, outstanding equity-based awards granted under Cablevision's equity plans were cancelled and converted into cash based upon the $34.90 per Share Cablevision Acquisition price in accordance with the original terms of the awards. The total consideration for the outstanding CNYG Class A Shares, the outstanding CNYG Class B Shares, and the equity-based awards amounted to $9,958,323.
F-8
ALTICE USA, INC.
NOTES TO CONSOLIDATED FINANCIAL STATEMENTS (Continued)
(Dollars in thousands, except per share amounts)
(Unaudited)
NOTE 1. DESCRIPTION OF BUSINESS AND RELATED MATTERS (Continued)
In connection with the Cablevision Acquisition, in October 2015, Neptune Finco Corp. ("Finco"), an indirect wholly-owned subsidiary of Altice N.V. formed to complete the financing described herein and the merger with CSC Holdings, LLC ("CSC Holdings"), a wholly-owned subsidiary of Cablevision, borrowed an aggregate principal amount of $3,800,000 under a term loan facility (the "Term Credit Facility") and entered into revolving loan commitments in an aggregate principal amount of $2,000,000 (the "Revolving Credit Facility" and, together with the Term Credit Facility, the "Credit Facilities").
Finco also issued $1,800,000 aggregate principal amount of 10.125% senior notes due 2023 (the "2023 Notes"), $2,000,000 aggregate principal amount of 10.875% senior notes due 2025 (the "2025 Notes"), and $1,000,000 aggregate principal amount of 6.625% senior guaranteed notes due 2025 (the "2025 Guaranteed Notes") (collectively the "Cablevision Acquisition Notes").
On June 21, 2016, immediately following the Cablevision Acquisition, Finco merged with and into CSC Holdings, with CSC Holdings surviving the merger (the "CSC Holdings Merger"), and the Cablevision Acquisition Notes and the Credit Facilities became obligations of CSC Holdings.
On June 21, 2016, in connection with the Cablevision Acquisition, the Company issued notes payable to affiliates and related parties aggregating $1,750,000, of which $875,000 bear interest at 10.75% and $875,000 bear interest at 11%.
The Cablevision Acquisition was accounted for as a business combination in accordance with ASC Topic 805. Accordingly, the Company stepped up 100% of the assets and liabilities assumed to their fair value at the Cablevision Acquisition Date. See Note 3 for further details.
Acquisition of Cequel Corporation
On December 21, 2015, Altice N.V. acquired approximately 70% of the total outstanding equity interests in Cequel (the "Cequel Acquisition") from the direct and indirect stockholders of Cequel Corporation (the "Sellers"). The consideration for the acquired equity interests was based on a total equity valuation for 100% of the capital and voting rights of Cequel was $3,973,528 which includes $2,797,928 of cash consideration, $675,600 of retained equity held by entities affiliated with BC Partners and CPPIB and $500,000 funded by the issuance by an affiliate of Altice N.V. of a senior vendor note that was subscribed by entities affiliated with BC Partners and CPPIB. Following the closing of the Cequel Acquisition, entities affiliated with BC Partners and CPPIB retained a 30% equity interest in a parent entity of the Company. In addition, the carried interest plans of the Stockholders were cashed out whereby payments were made to participants in such carried interest plans, including certain officers and directors of Cequel.
In June 2016, Cequel was contributed to Altice USA. The accompanying consolidated financial statements include the operating results of Cequel for the three months ended March 31, 2017 and 2016 and the operating results of Cablevision for the three months ended March 31, 2017.
Pro forma Balance Sheet (unaudited)
The pro forma balance sheet as of March 31, 2017 reflects the accrual of $169,950 related to the cash distribution to the Company's stockholders made in April 2017, the accrual of $169,750 of the cash distribution and the payment of the $500,000 cash distribution to the Company's stockholders to be made prior to the pricing of the Company's initial offering of equity securities to the public
F-9
ALTICE USA, INC.
NOTES TO CONSOLIDATED FINANCIAL STATEMENTS (Continued)
(Dollars in thousands, except per share amounts)
(Unaudited)
NOTE 1. DESCRIPTION OF BUSINESS AND RELATED MATTERS (Continued)
("IPO"), which will be funded by borrowings of $500,000 under the CSC Holdings Revolving Credit Facility (as defined in Note 8) and $169,750 of cash on hand, and gives effect to the following organizational transactions that have not yet occurred and will be consummated in connection with the IPO:
- •
- the Company will amend and restate its certificate of incorporation to, among other things, provide for Class A common stock,
Class B common stock and Class C common stock;
- •
- the Co-Investors and an entity controlled by Mr. Drahi will exchange their indirect ownership interest in the Company for shares of the
Company's common stock;
- •
- Neptune Management LP ("Management LP") will redeem its Class B units for shares of the Company's common stock that it
receives from the redemption of its Class B units in Neptune Holding US LP;
- •
- the Company will convert $525,000 aggregate principal amount of notes issued by the Company to the Co-Investors (together with accrued and
unpaid interest and applicable premium) into shares of the Company's common stock at the initial public offering price;
- •
- $1,225 million aggregate principal amount of notes issued by the Company to a subsidiary of Altice N.V. (together with accrued and
unpaid interest and applicable premium) will be transferred to CVC 3 and then the Company will convert such notes into shares of the Company's common stock at the initial public offering price;
- •
- the Co-Investors, Neptune Holding US LP, an entity controlled by the family of Mr. Drahi and former Class B unitholders of
Management LP (including an entity controlled by Mr. Drahi) will exchange shares of the Company's common stock for new shares of the Company's Class A common stock; and
- •
- CVC 3 B.V., an indirect subsidiary of Altice N.V., and an entity controlled by the family of Mr. Drahi will exchange shares of the Company's common stock for new shares of the Company's Class B common stock.
The impact of the transactions discussed above to the pro forma balance sheet as of March 31, 2017 are detailed below:
Cash and cash equivalents
The pro forma amount reflects the payment of interest on the notes payable to affiliates and related parties of $150,135 accrued through March 31, 2017.
Credit facility debt
The pro forma amount reflects borrowings of $500,000 under the CSC Holdings revolving credit facility to fund the $500,000 cash distribution to be made prior to the pricing of the IPO.
Notes payable to affiliates and related parties
The pro forma amount reflects the conversion of notes payable to affiliates and related parties of $1,750,000 to shares of common stock of the Company.
F-10
ALTICE USA, INC.
NOTES TO CONSOLIDATED FINANCIAL STATEMENTS (Continued)
(Dollars in thousands, except per share amounts)
(Unaudited)
NOTE 1. DESCRIPTION OF BUSINESS AND RELATED MATTERS (Continued)
Accrued Interest
The pro forma amount reflects the payment of interest on the notes payable to affiliates and related parties of $150,135 accrued through March 31, 2017
Amounts due to affiliates
The pro forma amount reflects the accrual of the cash distribution to the Company's stockholders of $169,950 made in April 2017 and the $169,750 cash distribution to be made to the Company's stockholders prior to the pricing of the IPO.
Class A and Class B common stock
The pro forma amount reflects the issuance of shares of common stock in connection with the organizational transactions.
Paid in Capital
The pro forma amount reflects the conversion of notes payable to affiliates and related parties of $1,750,000, as well as the applicable premium of $516,920, to shares of common stock of the Company, net of the par value of common stock issued. The applicable premium of $516,920 is estimated as of the expected conversion date of June 21, 2017 using current risk free interest rates. Such amount is subject to change as a result of a change in the conversion date and/or changes in risk free interest rates. In addition, the pro forma amount reflects the cash distribution of $169,950 to the Company's stockholders made in April 2017, the cash distribution of $169,750 and the cash distribution of $500,000 to be made prior to the pricing of the IPO, and $6,469 related to the issuance of Class A and Class B common stock in connection with the organizational transactions.
Accumulated deficit
The pro forma amount reflects the applicable premium of $516,920 related to the conversion of notes payable to affiliates and related parties of $1,750,000. The applicable premium of $516,920 is estimated as of the expected conversion date of June 21, 2017 using current risk free interest rates. Such amount is subject to change as a result of a change in the conversion date and/or changes in risk free interest rates.
NOTE 2. SUMMARY OF SIGNIFICANT ACCOUNTING POLICIES
The accompanying unaudited consolidated financial statements of the Company have been prepared in accordance with U.S. generally accepted accounting principles ("GAAP") and with the instructions to Form 10-Q and Article 10 of Regulation S-X for interim financial information. Accordingly, these financial statements do not include all the information and notes required for complete annual financial statements.
The interim condensed consolidated financial statements should be read in conjunction with the audited consolidated financial statements and notes thereto included in the Company's Annual Report for the year ended December 31, 2016.
F-11
ALTICE USA, INC.
NOTES TO CONSOLIDATED FINANCIAL STATEMENTS (Continued)
(Dollars in thousands, except per share amounts)
(Unaudited)
NOTE 2. SUMMARY OF SIGNIFICANT ACCOUNTING POLICIES (Continued)
The financial statements presented in this report are unaudited; however, in the opinion of management, such financial statements include all adjustments, consisting solely of normal recurring adjustments, necessary for a fair presentation of the results for the periods presented.
The results of operations for the interim periods are not necessarily indicative of the results that might be expected for future interim periods or for the full year ending December 31, 2017.
The preparation of financial statements in conformity with GAAP requires management to make estimates and assumptions that affect the reported amounts of assets and liabilities and disclosure of contingent liabilities at the date of the financial statements and the reported amounts of revenue and expenses during the reporting period. Actual results could differ from those estimates.
Recently Adopted Accounting Pronouncement
In March 2016, the FASB issued ASU 2016-09, Compensation—Stock Compensation: Improvements to Employee Share-Based Payment Accounting, which provides simplification of income tax accounting for share-based payment awards. The new guidance became effective for the Company on January 1, 2017. Amendments related to the timing of when excess tax benefits are recognized, minimum statutory withholding requirements, forfeitures, and intrinsic value will be applied using the modified retrospective transition method. Amendments requiring recognition of excess tax benefits and tax deficiencies in the income statement and the practical expedient for estimating expected term were applied prospectively. The Company elected to apply the amendments related to the presentation of excess tax benefits on the statement of cash flows using the prospective transition method. In connection with the adoption on January 1, 2017, a deferred tax asset of approximately $308,231 for previously unrealized excess tax benefits was recognized with the offset recorded to accumulated deficit.
Recently Issued But Not Yet Adopted Accounting Pronouncements
In May 2014, the FASB issued ASU No. 2014-09, Revenue from Contracts with Customers, requiring an entity to recognize the amount of revenue to which it expects to be entitled for the transfer of promised goods or services to customers. ASU No. 2014-09 will replace most existing revenue recognition guidance in GAAP when it becomes effective and allows the use of either the retrospective or cumulative effect transition method. In August 2015, the FASB issued ASU No. 2015-14 that approved deferring the effective date by one year so that ASU No. 2014-09 would become effective for the Company on January 1, 2018. The FASB also approved, in July 2015, permitting the early adoption of ASU No. 2014-09, but not before the original effective date for the Company of January 1, 2017.
In December 2016, the FASB issued ASU No. 2016-20, Technical Corrections and Improvements to Topic 606, Revenue from Contracts with Customers, in order to clarify the Codification and to correct any unintended application of the guidance. These items are not expected to have a significant effect on the current accounting standard. The amendments in this update affect the guidance in ASU No. 2014-09, which is not yet effective. ASU No. 2014-09 will be effective, reflecting the one-year deferral, for interim and annual periods beginning after December 15, 2017 (January 1, 2018 for the Company). Early adoption of the standard is permitted but not before the original effective date. Companies can transition to the standard either retrospectively or as a cumulative-effect adjustment as of the date of adoption. The Company is in the process of evaluating the impact that the adoption of
F-12
ALTICE USA, INC.
NOTES TO CONSOLIDATED FINANCIAL STATEMENTS (Continued)
(Dollars in thousands, except per share amounts)
(Unaudited)
NOTE 2. SUMMARY OF SIGNIFICANT ACCOUNTING POLICIES (Continued)
ASU No. 2014-09 will have on its consolidated financial statements and selecting the method of transition to the new standard. We currently expect the adoption to impact the timing of the recognition of residential installation revenue and the recognition of commission expenses.
In August 2016, the FASB issued ASU No. 2016-15, Statement of Cash Flows (Topic 230): Classification of Certain Cash Receipts and Cash Payments which clarifies how entities should classify certain cash receipts and cash payments on the statement of cash flows. ASU No. 2016-15 also clarifies how the predominance principle should be applied when cash receipts and cash payments have aspects of more than one class of cash flows. The new guidance becomes effective for the Company on January 1, 2018 with early adoption permitted and will be applied retrospectively. The Company has not yet completed the evaluation of the effect that ASU No. 2016-15 will have on its consolidated financial statements.
In February 2016, the FASB issued ASU No. 2016-02, Leases, which increases transparency and comparability by recognizing a lessee's rights and obligations resulting from leases by recording them on the balance sheet as lease assets and lease liabilities. The new guidance becomes effective for the Company on January 1, 2019 with early adoption permitted and will be applied using the modified retrospective method. The Company is currently in the process of determining the impact that ASU No. 2016-02 will have on its consolidated financial statements.
In March 2017, the FASB issued ASU No. 2017-07 Compensation-Retirement Benefits (Topic 715). ASU No. 2017-07 requires that an employer disaggregate the service cost component from the other components of net benefit cost. It also provides guidance on how to present the service cost component and the other components of net benefit cost in the income statement and what component of net benefit cost is eligible for capitalization. ASU No. 2017-07 becomes effective for the Company on January 1, 2018 with early adoption permitted and will be applied retrospectively. The Company has not yet completed the evaluation of the effect that ASU No. 2017-07 will have on its consolidated financial statements.
Reclassifications
Certain reclassifications have been made to the 2016 financial statements to conform to the 2017 presentation.
Common Stock
The Company had 100 shares of common stock with a par value of $.01 issued and outstanding at March 31, 2017 and December 31, 2016.
Net Loss Per Share
Basic and diluted net loss per share have been computed by dividing the net loss by the weighted-average number of shares of common stock outstanding during the period. Diluted net loss per share excludes the effects of common stock equivalents as they are anti-dilutive.
F-13
ALTICE USA, INC.
NOTES TO CONSOLIDATED FINANCIAL STATEMENTS (Continued)
(Dollars in thousands, except per share amounts)
(Unaudited)
NOTE 3. BUSINESS COMBINATION
Altice Merger
As discussed in Note 1, the Company completed the Cablevision Acquisition on June 21, 2016. The acquisition was accounted for as a business combination in accordance with ASC Topic 805. Accordingly, the Company recorded the fair value of the assets and liabilities assumed at the date of acquisition.
The following table provides the preliminary allocation of the total purchase price of $9,958,323 to the identifiable tangible and intangible assets and liabilities of Cablevision based on preliminary fair value information currently available, which is subject to change within the measurement period (up to one year from the acquisition date). The remaining useful lives represent the period over which acquired tangible and intangible assets with a finite life are being depreciated or amortized.
| |
Estimates of Fair Values |
Estimated Useful Lives |
|||
|---|---|---|---|---|---|
Current assets |
$ | 1,923,071 | |||
Accounts receivable |
271,305 | ||||
Property, plant and equipment |
4,864,621 | 2 - 18 years | |||
Goodwill |
5,839,016 | ||||
Indefinite-lived cable television franchises |
8,113,575 | Indefinite-lived | |||
Customer relationships |
4,850,000 | 8 to 18 years | |||
Trade names |
1,010,000 | 12 years | |||
Amortizable intangible assets |
23,296 | 1 - 15 years | |||
Other non-current assets |
748,998 | ||||
Current liabilities |
(2,306,049 | ) | |||
Long-term debt |
(8,355,386 | ) | |||
Deferred income taxes. |
(6,834,769 | ) | |||
Other non-current liabilities |
(189,355 | ) | |||
| | | | | | |
Total |
$ | 9,958,323 | |||
| | | | | | |
| | | | | | |
| | | | | | |
The fair value of customer relationships and cable television franchises were valued using derivations of the "income" approach. The future expected earnings from these assets were discounted to their present value equivalent.
Trade names were valued using the relief from royalty method, which is based on the present value of the royalty payments avoided as a result of the company owning the intangible asset.
The basis for the valuation methods was the Company's projections. These projections were based on management's assumptions including among others, penetration rates for video, high speed data, and voice; revenue growth rates; operating margins; and capital expenditures. The assumptions are derived based on the Company's and its peers' historical operating performance adjusted for current and expected competitive and economic factors surrounding the cable industry. The discount rates used in the analysis are intended to reflect the risk inherent in the projected future cash flows generated by the respective intangible asset. The value is highly dependent on the achievement of the future financial results contemplated in the projections. The estimates and assumptions made in the valuation are inherently subject to significant uncertainties, many of which are beyond the Company's control, and
F-14
ALTICE USA, INC.
NOTES TO CONSOLIDATED FINANCIAL STATEMENTS (Continued)
(Dollars in thousands, except per share amounts)
(Unaudited)
NOTE 3. BUSINESS COMBINATION (Continued)
there is no assurance that these results can be achieved. The primary assumptions for which there is a reasonable possibility of the occurrence of a variation that would have significantly affected the value include the assumptions regarding revenue growth, programming expense growth rates, the amount and timing of capital expenditures and the discount rate utilized.
In establishing fair value for the vast majority of the acquired property, plant and equipment, the cost approach was utilized. The cost approach considers the amount required to replace an asset by constructing or purchasing a new asset with similar utility, then adjusts the value in consideration of physical depreciation, and functional and economic obsolescence as of the appraisal date. The cost approach relies on management's assumptions regarding current material and labor costs required to rebuild and repurchase significant components of our property, plant and equipment along with assumptions regarding the age and estimated useful lives of our property, plant and equipment.
The estimates of expected useful lives take into consideration the effects of contractual relationships, customer attrition, eventual development of new technologies and market competition.
Long-term debt assumed was valued using quoted market prices (Level 2). The carrying value of most other assets and liabilities approximated fair value as of the acquisition dates.
As a result of applying business combination accounting, the Company recorded goodwill, which represented the excess of organization value over amounts assigned to the other identifiable tangible and intangible assets arising from expectations of future operational performance and cash generation.
The following table presents the unaudited pro forma revenue and net loss for the three months ended March 31, 2016 as if the Cablevision Acquisition had occurred on January 1, 2016:
Revenue |
$ | 2,273,479 | ||
| | | | | |
| | | | | |
| | | | | |
Net loss |
$ | (190,141 | ) | |
| | | | | |
| | | | | |
| | | | | |
The pro forma results presented above include the impact of additional amortization expense related to the identifiable intangible assets recorded in connection with the Cablevision Acquisition, additional depreciation expense related to the fair value adjustment to property, plant and equipment and the incremental interest resulting from the issuance of debt to fund the acquisitions, net of the reversal of interest and amortization of deferred financing costs related to credit facilities that were repaid on the date of the Cablevision Acquisition and the accretion/ amortization of fair value adjustments associated with the long-term debt acquired.
Acquisition
In connection with the acquisition of an entity in the first quarter of 2017, the Company recorded goodwill of $74,854, which represents the excess of the purchase price of approximately $75,000 over the net book value of assets acquired, as the company has not yet completed its preliminary allocation of the purchase price. These values are subject to change within the measurement period (up to one year from the acquisition date).
F-15
ALTICE USA, INC.
NOTES TO CONSOLIDATED FINANCIAL STATEMENTS (Continued)
(Dollars in thousands, except per share amounts)
(Unaudited)
NOTE 4. GROSS VERSUS NET REVENUE RECOGNITION
In the normal course of business, the Company is assessed non-income related taxes by governmental authorities, including franchising authorities (generally under multi-year agreements), and collects such taxes from its customers. The Company's policy is that, in instances where the tax is being assessed directly on the Company, amounts paid to the governmental authorities and amounts received from the customers are recorded on a gross basis. That is, amounts paid to the governmental authorities are recorded as programming and other direct costs and amounts received from the customer are recorded as revenue. For the three months ended March 31, 2017 and 2016, the amount of franchise fees and certain other taxes and fees included as a component of revenue aggregated $64,986 and $12,088, respectively.
NOTE 5. SUPPLEMENTAL CASH FLOW INFORMATION
The Company considers the balance of its investment in funds that substantially hold securities that mature within three months or less from the date the fund purchases these securities to be cash equivalents. The carrying amount of cash and cash equivalents either approximates fair value due to the short-term maturity of these instruments or are at fair value.
The Company's non-cash investing and financing activities and other supplemental data were as follows:
| |
Three Months Ended | ||||||
|---|---|---|---|---|---|---|---|
| |
March 31, 2017 |
March 31, 2016 |
|||||
Non-Cash Investing and Financing Activities: |
|||||||
Continuing Operations: |
|||||||
Property and equipment accrued but unpaid |
$ | 61,170 | $ | 20,041 | |||
Supplemental Data: |
|||||||
Cash interest paid |
524,864 | 128,141 | |||||
Income taxes paid, net |
1,553 | — | |||||
NOTE 6. RESTRUCTURING COSTS
Restructuring
Beginning in the first quarter of 2016, the Company commenced its restructuring initiatives (the "2016 Restructuring Plan") that are intended to simplify the Company's organizational structure.
The following table summarizes the activity for the 2016 Restructuring Plan during 2017:
| |
Severance and Other Employee Related Costs |
Facility Realignment and Other Costs |
Total | |||||||
|---|---|---|---|---|---|---|---|---|---|---|
Accrual balance at December 31, 2016 |
$ | 102,119 | $ | 8,397 | $ | 110,516 | ||||
Restructuring charges |
76,440 | 311 | 76,751 | |||||||
Payments and other |
(25,354 | ) | (1,215 | ) | (26,569 | ) | ||||
| | | | | | | | | | | |
Accrual balance at March 31, 2017 |
$ | 153,205 | $ | 7,493 | $ | 160,698 | ||||
| | | | | | | | | | | |
| | | | | | | | | | | |
| | | | | | | | | | | |
In addition to the charges included in the table above, the Company recorded restructuring charges of $7,440 relating to the 2016 Restructuring Plan.
F-16
ALTICE USA, INC.
NOTES TO CONSOLIDATED FINANCIAL STATEMENTS (Continued)
(Dollars in thousands, except per share amounts)
(Unaudited)
NOTE 7. INTANGIBLE ASSETS
The following table summarizes information relating to the Company's acquired intangible assets as of March 31, 2017:
| |
Amortizable Intangible Assets | ||||||||||
|---|---|---|---|---|---|---|---|---|---|---|---|
| |
Gross Carrying Amount |
Accumulated Amortization |
Net Carrying Amount |
Estimated Useful Lives |
|||||||
Customer relationships |
$ | 5,925,884 | $ | (791,505 | ) | $ | 5,134,379 | 8 to 18 years | |||
Trade names |
1,066,783 | (108,883 | ) | 957,900 | 2 to 12 years | ||||||
Other amortizable intangibles |
26,832 | (4,397 | ) | 22,435 | 1 to 15 years | ||||||
| | | | | | | | | | | | |
|
$ | 7,019,499 | $ | (904,785 | ) | $ | 6,114,714 | ||||
| | | | | | | | | | | | |
| | | | | | | | | | | | |
| | | | | | | | | | | | |
Amortization expense for the three months ended March 31, 2017 and 2016 aggregated $238,019 and $111,935, respectively.
The following table summarizes information relating to the Company's acquired indefinite-lived intangible assets as of March 31, 2017:
| |
Cablevision | Cequel | Total | |||||||
|---|---|---|---|---|---|---|---|---|---|---|
Cable television franchises |
$ | 8,113,575 | $ | 4,906,506 | $ | 13,020,081 | ||||
Goodwill |
5,913,870 | 2,153,741 | 8,067,611 | |||||||
| | | | | | | | | | | |
Total |
$ | 14,027,445 | $ | 7,060,247 | $ | 21,087,692 | ||||
| | | | | | | | | | | |
| | | | | | | | | | | |
| | | | | | | | | | | |
The carrying amount of goodwill is presented below:
Gross goodwill as of January 1, 2017 |
$ | 7,992,700 | ||
Goodwill recorded in connection with acquisition in first quarter 2017 |
74,854 | |||
Adjustments to purchase accounting relating to Cablevision Acquisition |
57 | |||
| | | | | |
Net goodwill as of March 31, 2017 |
$ | 8,067,611 | ||
| | | | | |
| | | | | |
| | | | | |
NOTE 8. DEBT
CSC Holdings Credit Facilities
In connection with the Cablevision Acquisition, in October 2015, Neptune Finco Corp. ("Finco"), a wholly-owned subsidiary of the Company, which merged with and into CSC Holdings on June 21, 2016, entered into a senior secured credit facility, which currently provides U.S. dollar term loans currently in an aggregate principal amount of $3,000,000 (the "Term Loan Facility", and the term loans extended under the Term Loan Facility, the "CSC Holdings Term Loans") and U.S. dollar revolving loan commitments in an aggregate principal amount of $2,300,000 (the "Revolving Credit Facility" and, together with the Term Loan Facility, the "Credit Facilities"), which are governed by a credit facilities agreement entered into by, inter alios, CSC Holdings certain lenders party thereto and JPMorgan Chase Bank, N.A. as administrative agent and security agent (as amended, restated, supplemented or otherwise modified on June 20, 2016, June 21, 2016, July 21, 2016, September 9, 2016, December 9,
F-17
ALTICE USA, INC.
NOTES TO CONSOLIDATED FINANCIAL STATEMENTS (Continued)
(Dollars in thousands, except per share amounts)
(Unaudited)
NOTE 8. DEBT (Continued)
2016 and March 15, 2017, respectively, and as further amended, restated, supplemented or otherwise modified from time to time, the "Credit Facilities Agreement").
The amendment to the CSC Holdings Credit Facilities Agreement entered into on March 15, 2017 ("Extension Amendment") increased the Term Loan by $500,000 to $3,000,000 and the maturity date for this facility was extended to July 17, 2025. The closing of the Extension Amendment occurred in April 2017 and the proceeds were used to refinance the entire $2,493,750 principal amount of existing Term Loans and redeem $500,000 of the 8.625% Senior Notes due September 2017 issued by Cablevision. As a result of the refinancing, $500,000 of these Senior Notes was reclassified from current to long-term debt.
In January 2017, CSC Holdings borrowed $225,000 under its revolving credit facility and in February 2017 it made a repayment of $175,000 with cash on hand.
Under the Extension Amendment, the Company is required to make scheduled quarterly payments equal to 0.25% (or $7,500 of the principal amount of the Term Loan, with the remaining balance scheduled to be paid on July 17, 2025, beginning with the fiscal quarter ending September 30, 2017.
The Credit Facilities permit CSC Holdings to request revolving loans, swing line loans or letters of credit from the revolving lenders, swingline lenders or issuing banks, as applicable, thereunder, from time to time prior to October 9, 2020, unless the commitments under the Revolving Credit Facility have been previously terminated.
Loans comprising each eurodollar borrowing or alternate base rate borrowing, as applicable, bear interest at a rate per annum equal to the adjusted LIBO rate or the alternate base rate, as applicable, plus the applicable margin, where the applicable margin is:
- •
- in respect of the Term Loans, (i) with respect to any alternate base rate loan, 1.25% per annum and (ii) with respect to any
eurodollar loan, 2.25% per annum, and
- •
- in respect of Revolving Credit Facility loans (i) with respect to any alternate base rate loan, 2.25% per annum and (ii) with respect to any eurodollar loan, 3.25% per annum.
The Credit Facilities Agreement requires CSC Holdings to prepay outstanding Term Loans, subject to certain exceptions and deductions, with (i) 100% of the net cash proceeds of certain asset sales, subject to reinvestment rights and certain other exceptions; and (ii) commencing with the fiscal year ending December 31, 2017, a pari ratable share (based on the outstanding principal amount of the Term Loans divided by the sum of the outstanding principal amount of all pari passu indebtedness and the Term Loans) of 50% of annual excess cash flow, which will be reduced to 0% if the consolidated net senior secured leverage ratio of CSC Holdings is less than or equal to 4.5 to 1.
The obligations under the Credit Facilities are guaranteed by each restricted subsidiary of CSC Holdings (other than CSC TKR, LLC and its subsidiaries and certain excluded subsidiaries) (the "Initial Guarantors") and, subject to certain limitations, will be guaranteed by each future material wholly-owned restricted subsidiary of CSC Holdings. The obligations under the Credit Facilities (including any guarantees thereof) are secured on a first priority basis, subject to any liens permitted by
F-18
ALTICE USA, INC.
NOTES TO CONSOLIDATED FINANCIAL STATEMENTS (Continued)
(Dollars in thousands, except per share amounts)
(Unaudited)
NOTE 8. DEBT (Continued)
the Credit Facilities, by capital stock held by CSC Holdings or any guarantor in certain subsidiaries of CSC Holdings, subject to certain exclusions and limitations.
The Credit Facilities Agreement includes certain negative covenants which, among other things and subject to certain significant exceptions and qualifications, limit CSC Holdings' ability and the ability of its restricted subsidiaries to: (i) incur or guarantee additional indebtedness, (ii) make investments, (iii) create liens, (iv) sell assets and subsidiary stock, (v) pay dividends or make other distributions or repurchase or redeem our capital stock or subordinated debt, (vi) engage in certain transactions with affiliates, (vii) enter into agreements that restrict the payment of dividends by subsidiaries or the repayment of intercompany loans and advances; and (viii) engage in mergers or consolidations. In addition, the Revolving Credit Facility includes a financial maintenance covenant solely for the benefit of the lenders under the Revolving Credit Facility consisting of a maximum consolidated net senior secured leverage ratio of CSC Holdings and its restricted subsidiaries of 5.0 to 1.0. The financial covenant will be tested on the last day of any fiscal quarter (commencing on December 31, 2016) but only if on such day there are outstanding borrowings under the Revolving Credit Facility (including swingline loans but excluding any cash collateralized letters of credit and undrawn letters of credit not to exceed $15,000).
The Credit Facilities Agreement also contains certain customary representations and warranties, affirmative covenants and events of default (including, among others, an event of default upon a change of control). If an event of default occurs, the lenders under the Credit Facilities will be entitled to take various actions, including the acceleration of amounts due under the Credit Facilities and all actions permitted to be taken by a secured creditor.
CSC Holdings was in compliance with all of its financial covenants under the Credit Facilities as of March 31, 2017.
Cequel Credit Facilities
On June 12, 2015, Altice US Finance I Corporation entered into a senior secured credit facility which currently provides term loans in an aggregate principal amount of $1,265,000 (the "Term Loan Facility" and the term loans extended under the Term Loan Facility, the "Term Loans") and revolving loan commitments in an aggregate principal amount of $350,000 (the "Revolving Credit Facility" and, together with the Term Loan Facility, the "Credit Facilities") which are governed by a credit facilities agreement entered into by, inter alios, Altice US Finance I Corporation, certain lenders party thereto and JPMorgan Chase Bank, N.A. (as amended, restated, supplemented or otherwise modified on October 25, 2016, December 9, 2016 and March 15, 2017, and as further amended, restated, supplemented or modified from time to time, the "Credit Facilities Agreement").
The amendment to the Credit Facilities Agreement entered into on March 15, 2017 ("Extension Amendment") increased the Term Loan by $450,000 to $1,265,000 and the maturity date for this facility was extended to July 28, 2025. The closing of the Extension Amendment occurred in April 2017 and the proceeds were used to refinance the entire $812,963 principal amount of loans under the Term Loan and redeem $450,000 of the 6.375% Senior Notes due September 15, 2020.
F-19
ALTICE USA, INC.
NOTES TO CONSOLIDATED FINANCIAL STATEMENTS (Continued)
(Dollars in thousands, except per share amounts)
(Unaudited)
NOTE 8. DEBT (Continued)
Under the Extension Amendment, the Company is required to make scheduled quarterly payments equal to 0.25% (or $3,163) of the principal amount of the Term Loan, with the remaining balance scheduled to be paid on July 28, 2025, beginning with the fiscal quarter ending September 30, 2017.
Loans comprising each eurodollar borrowing or alternate base rate borrowing, as applicable, bear interest at a rate per annum equal to the adjusted LIBO rate or the alternate base rate, as applicable, plus the applicable margin, where the applicable margin is:
- •
- in respect of the Term Loans, (i) with respect to any alternate base rate loan, 1.25% per annum and (ii) with respect to any
eurodollar loan, 2.25% per annum, and
- •
- in respect of Revolving Credit Facility loans (i) with respect to any alternate base rate loan, 2.25% per annum and (ii) with respect to any eurodollar loan, 3.25% per annum.
The Credit Facilities Agreement requires Altice US Finance I Corporation to prepay outstanding Term Loans, subject to certain exceptions and deductions, with (i) 100% of the net cash proceeds of certain asset sales, subject to reinvestment rights and certain other exceptions; and (ii) a pari ratable share (based on the outstanding principal amount of the Term Loans divided by the sum of the outstanding principal amount of all pari passu indebtedness and the Term Loans) of 50% of annual excess cash flow, which will be reduced to 0% if the consolidated net senior secured leverage ratio is less than or equal to 4.5:1.
The debt under the Credit Facility is secured by a first priority security interest in the capital stock of Suddenlink and substantially all of the present and future assets of Suddenlink and its restricted subsidiaries, and is guaranteed by the Parent Guarantor, as well as all of Suddenlink's existing and future direct and indirect subsidiaries, subject to certain exceptions set forth in the Credit Facilities Agreement. The Credit Facilities Agreement contains customary representations, warranties and affirmative covenants. In addition, the Credit Facilities Agreement contains restrictive covenants that limit, among other things, the ability of Suddenlink and its subsidiaries to incur indebtedness, create liens, engage in mergers, consolidations and other fundamental changes, make investments or loans, engage in transactions with affiliates, pay dividends, and make acquisitions and dispose of assets. The Credit Facilities Agreement also contains a maximum senior secured leverage maintenance covenant of 5.0 times EBITDA as defined in the Credit Facilities Agreement. Additionally, the Credit Facilities Agreement contains customary events of default, including failure to make payments, breaches of covenants and representations, cross defaults to other indebtedness, unpaid judgments, changes of control and bankruptcy events. The lenders' commitments to fund amounts under the revolving credit facility are subject to certain customary conditions.
As of March 31, 2017, Cequel was in compliance with all of its financial covenants under the Cequel Credit Facilities Agreement.
F-20
ALTICE USA, INC.
NOTES TO CONSOLIDATED FINANCIAL STATEMENTS (Continued)
(Dollars in thousands, except per share amounts)
(Unaudited)
NOTE 8. DEBT (Continued)
The following table provides details of the Company's outstanding credit facility debt (net of unamortized financing costs and unamortized discounts):
| |
|
|
|
Carrying Value | |||||||||||
|---|---|---|---|---|---|---|---|---|---|---|---|---|---|---|---|
| |
Maturity Date | Interest Rate |
Principal | March 31, 2017 |
December 31, 2016 |
||||||||||
CSC Holdings Restricted Group: |
|||||||||||||||
Revolving Credit Facility(a) |
$20,000 on October 9, 2020, remaining on November 30, 2021 |
4.16 | % | $ | 225,256 | $ | 196,407 | $ | 145,013 | ||||||
Term Loan Facility |
July 17, 2025 | 3.94 | % | 2,493,750 | 2,481,005 | 2,486,874 | |||||||||
Cequel: |
|||||||||||||||
Revolving Credit Facility(b) |
November 30, 2021 | — | — | — | — | ||||||||||
Term Loan Facility |
July 28, 2025 | 3.98 | % | 812,963 | 810,929 | 812,903 | |||||||||
| | | | | | | | | | | | | | | | |
|
$ | 3,531,969 | 3,488,341 | 3,444,790 | |||||||||||
| | | | | | | | | | | | | | | | |
| | | | | | | | | | | | | | | | |
| | | | | | | | | | | | | | | | |
Less: Current portion |
31,988 | 33,150 | |||||||||||||
| | | | | | | | | | | | | | | | |
Long-term debt |
$ | 3,456,353 | $ | 3,411,640 | |||||||||||
| | | | | | | | | | | | | | | | |
| | | | | | | | | | | | | | | | |
| | | | | | | | | | | | | | | | |
- (a)
- At
March 31, 2017, $90,023 of the revolving credit facility was restricted for certain letters of credit issued on behalf of the Company and $1,984,721 of the
facility was undrawn and available, subject to covenant limitations.
- (b)
- At March 31, 2017, $17,031 of the revolving credit facility was restricted for certain letters of credit issued on behalf of the Company and $332,969 of the facility was undrawn and available, subject to covenant limitations.
F-21
ALTICE USA, INC.
NOTES TO CONSOLIDATED FINANCIAL STATEMENTS (Continued)
(Dollars in thousands, except per share amounts)
(Unaudited)
NOTE 8. DEBT (Continued)
Senior Guaranteed Notes and Senior Notes and Debentures
The following table summarizes the Company's senior guaranteed notes, senior secured notes and senior notes and debentures:
| |
|
|
|
|
Carrying Amount(a) | ||||||||||||
|---|---|---|---|---|---|---|---|---|---|---|---|---|---|---|---|---|---|
Issuer
|
Date Issued | Maturity Date | Interest Rate |
Principal Amount |
March 31, 2017 |
December 31, 2016 |
|||||||||||
CSC Holdings(b)(e) |
February 6, 1998 | February 15, 2018 | 7.875 | % | $ | 300,000 | $ | 308,118 | $ | 310,334 | |||||||
CSC Holdings(b)(e) |
July 21, 1998 | July 15, 2018 | 7.625 | % | 500,000 | 518,284 | 521,654 | ||||||||||
CSC Holdings(c)(e) |
February 12, 2009 | February 15, 2019 | 8.625 | % | 526,000 | 550,757 | 553,804 | ||||||||||
CSC Holdings(c)(e) |
November 15, 2011 | November 15, 2021 | 6.750 | % | 1,000,000 | 953,722 | 951,702 | ||||||||||
CSC Holdings(c)(e) |
May 23, 2014 | June 1, 2024 | 5.250 | % | 750,000 | 652,687 | 650,193 | ||||||||||
CSC Holdings(d) |
October 9, 2015 | January 15, 2023 | 10.125 | % | 1,800,000 | 1,775,500 | 1,774,750 | ||||||||||
CSC Holdings(d) |
October 9, 2015 | October 15, 2025 | 10.875 | % | 2,000,000 | 1,970,876 | 1,970,379 | ||||||||||
CSC Holdings(d) |
October 9, 2015 | October 15, 2025 | 6.625 | % | 1,000,000 | 985,769 | 985,469 | ||||||||||
CSC Holdings(f) |
September 23, 2016 | April 15, 2027 | 5.500 | % | 1,310,000 | 1,304,132 | 1,304,025 | ||||||||||
Cablevision(c)(e) |
September 23, 2009 | September 15, 2017 | 8.625 | % | 900,000 | 917,053 | 926,045 | ||||||||||
Cablevision(c)(e) |
April 15, 2010 | April 15, 2018 | 7.750 | % | 750,000 | 764,287 | 767,545 | ||||||||||
Cablevision(c)(e) |
April 15, 2010 | April 15, 2020 | 8.000 | % | 500,000 | 489,712 | 488,992 | ||||||||||
Cablevision(c)(e) |
September 27, 2012 | September 15, 2022 | 5.875 | % | 649,024 | 562,496 | 559,500 | ||||||||||
Cequel and Cequel Capital Senior Notes(a)(e) |
Oct. 25, 2012 Dec. 28, 2012 |
September 15, 2020 | 6.375 | % | 1,500,000 | 1,459,964 | 1,457,439 | ||||||||||
Cequel and Cequel Capital Senior Notes(a) |
May 16, 2013 Sept. 9, 2014 |
December 15, 2021 | 5.125 | % | 1,250,000 | 1,121,377 | 1,115,767 | ||||||||||
Altice US Finance I Corporation Senior Secured Notes(b) |
June 12, 2015 | July 15, 2023 | 5.375 | % | 1,100,000 | 1,080,508 | 1,079,869 | ||||||||||
Cequel and Cequel Capital Senior Notes(c) |
June 12, 2015 | July 15, 2025 | 7.750 | % | 620,000 | 603,276 | 602,925 | ||||||||||
Altice US Finance I Corporation Senior Notes(d) |
April 26, 2016 | May 15, 2026 | 5.500 | % | 1,500,000 | 1,487,200 | 1,486,933 | ||||||||||
| | | | | | | | | | | | | | | | | | |
|
$ | 17,955,024 | 17,505,718 | 17,507,325 | |||||||||||||
| | | | | | | | | | | | | | | | | | |
| | | | | | | | | | | | | | | | | | |
| | | | | | | | | | | | | | | | | | |
Less: Current portion |
725,171 | 926,045 | |||||||||||||||
| | | | | | | | | | | | | | | | | | |
Long-term debt |
$ | 16,780,547 | $ | 16,581,280 | |||||||||||||
| | | | | | | | | | | | | | | | | | |
| | | | | | | | | | | | | | | | | | |
| | | | | | | | | | | | | | | | | | |
- (a)
- The
carrying amount of the notes is net of the unamortized deferred financing costs and/or discounts/premiums.
- (b)
- The
debentures are not redeemable by CSC Holdings prior to maturity.
- (c)
- Notes
are redeemable at any time at a specified "make-whole" price plus accrued and unpaid interest to the redemption date.
- (d)
- The Company may redeem some or all of the 2023 Notes at any time on or after January 15, 2019, and some or all of the 2025 Notes and 2025 Guaranteed Notes at any time on or after October 15, 2020, at the redemption prices
F-22
ALTICE USA, INC.
NOTES TO CONSOLIDATED FINANCIAL STATEMENTS (Continued)
(Dollars in thousands, except per share amounts)
(Unaudited)
NOTE 8. DEBT (Continued)
set forth in the relevant indenture, plus accrued and unpaid interest, if any. The Company may also redeem up to 40% of each series of the Cablevision Acquisition Notes using the proceeds of certain equity offerings before October 15, 2018, at a redemption price equal to 110.125% for the 2023 Notes, 110.875% for the 2025 Notes and 106.625% for the 2025 Guaranteed Notes, in each case plus accrued and unpaid interest. In addition, at any time prior to January 15, 2019, CSC Holdings may redeem some or all of the 2023 Notes, and at any time prior to October 15, 2020, the Company may redeem some or all of the 2025 Notes and the 2025 Guaranteed Notes, at a price equal to 100% of the principal amount thereof, plus a "make whole" premium specified in the relevant indenture plus accrued and unpaid interest.
- (e)
- The
carrying value of the notes was adjusted to reflect their fair value on the Cablevision Acquisition Date (aggregate reduction of $52,788).
- (f)
- The
2027 Guaranteed Notes are redeemable at any time on or after April 15, 2022 at the redemption prices set forth in the indenture, plus accrued and unpaid
interest, if any. In addition, up to 40% may be redeemed for each series of the 2027 Guaranteed Notes using the proceeds of certain equity offerings before October 15, 2019, at a redemption
price equal to 105.500%, plus accrued and unpaid interest.
- (g)
- Some
or all of these notes may be redeemed at any time on or after July 15, 2018, plus accrued and unpaid interest, if any. Up to 40% of the notes may be
redeemed using the proceeds of certain equity offerings before July 15, 2018, at a redemption price equal to 105.375%.
- (h)
- Some
or all of these notes may be redeemed at any time on or after July 15, 2020, plus accrued and unpaid interest, if any. Up to 40% of the notes may be
redeemed using the proceeds of certain equity offerings before July 15, 2018, at a redemption price equal to 107.750%.
- (i)
- Some or all of these notes may be redeemed at any time on or after May 15, 2021, plus accrued and unpaid interest, if any. Up to 40% of the notes may be redeemed using the proceeds of certain equity offerings before May 15, 2019, at a redemption price equal to 105.500%.
The indentures under which the senior notes and debentures were issued contain various covenants. The Company was in compliance with all of its financial covenants under these indentures as of March 31, 2017
Notes Payable to Affiliates and Related Parties
On June 21, 2016, in connection with the Cablevision Acquisition, the Company issued notes payable to affiliates and related parties aggregating $1,750,000, of which $875,000 bear interest at 10.75% and are due on December 20, 2023 and $875,000 bear interest at 11% and are due on December 20, 2024. The Company may redeem all or, part of the notes at a redemption price equal to 100% of the principal amount thereof plus the applicable premium, as defined in the notes agreement, and accrued and unpaid interest. For the three months ended March 31, 2017, the Company recognized interest expense of $47,588 related to these notes payable and as of March 31, 2017 and December 31, 2016, the Company had accrued interest of $150,135 and $102,557, respectively, which is reflected in accrued interest in the Company's balance sheets.
F-23
ALTICE USA, INC.
NOTES TO CONSOLIDATED FINANCIAL STATEMENTS (Continued)
(Dollars in thousands, except per share amounts)
(Unaudited)
NOTE 8. DEBT (Continued)
Summary of Debt Maturities
The future maturities of debt payable by the Company under its various debt obligations outstanding as of March 31, 2017, including notes payable, collateralized indebtedness (see Note 9), and capital leases, are as follows:
Years Ending December 31,
|
Cablevision | Cequel | Altice USA | Total | |||||||||
|---|---|---|---|---|---|---|---|---|---|---|---|---|---|
2017 |
$ | 893,914 | $ | 6,905 | $ | — | 900,819 | ||||||
2018 |
2,106,493 | 13,040 | — | 2,119,533 | |||||||||
2019 |
562,194 | 12,830 | — | 575,024 | |||||||||
2020 |
530,824 | 1,512,713 | — | 2,043,537 | |||||||||
2021 |
1,572,897 | 1,262,723 | — | 2,835,620 | |||||||||
Thereafter |
10,367,774 | 3,976,975 | 1,750,000 | 16,094,749 | |||||||||
NOTE 9. DERIVATIVE CONTRACTS AND COLLATERALIZED INDEBTEDNESS
Prepaid Forward Contracts
The Company has entered into various transactions to limit the exposure against equity price risk on its shares of Comcast Corporation ("Comcast") common stock. The Company has monetized all of its stock holdings in Comcast through the execution of prepaid forward contracts, collateralized by an equivalent amount of the respective underlying stock. At maturity, the contracts provide for the option to deliver cash or shares of Comcast stock with a value determined by reference to the applicable stock price at maturity. These contracts, at maturity, are expected to offset declines in the fair value of these securities below the hedge price per share while allowing the Company to retain upside appreciation from the hedge price per share to the relevant cap price.
The Company received cash proceeds upon execution of the prepaid forward contracts discussed above which has been reflected as collateralized indebtedness in the accompanying consolidated balance sheets. In addition, the Company separately accounts for the equity derivative component of the prepaid forward contracts. These equity derivatives have not been designated as hedges for accounting purposes. Therefore, the net fair values of the equity derivatives have been reflected in the accompanying consolidated balance sheets as an asset or liability and the net increases or decreases in the fair value of the equity derivative component of the prepaid forward contracts are included in gain (loss) on derivative contracts in the accompanying consolidated statement of operations.
All of the Company's monetization transactions are obligations of its wholly-owned subsidiaries that are not part of the Restricted Group; however, CSC Holdings has provided guarantees of the subsidiaries' ongoing contract payment expense obligations and potential payments that could be due as a result of an early termination event (as defined in the agreements). If any one of these contracts were terminated prior to its scheduled maturity date, the Company would be obligated to repay the fair value of the collateralized indebtedness less the sum of the fair values of the underlying stock and equity collar, calculated at the termination date. As of March 31, 2017, the Company did not have an early termination shortfall relating to any of these contracts.
F-24
ALTICE USA, INC.
NOTES TO CONSOLIDATED FINANCIAL STATEMENTS (Continued)
(Dollars in thousands, except per share amounts)
(Unaudited)
NOTE 9. DERIVATIVE CONTRACTS AND COLLATERALIZED INDEBTEDNESS (Continued)
The Company monitors the financial institutions that are counterparties to its equity derivative contracts and it diversifies its equity derivative contracts among various counterparties to mitigate exposure to any single financial institution. All of the counterparties to such transactions carry investment grade credit ratings as of March 31, 2017.
Interest Rate Swap Contracts
In June 2016, the Company entered into two new fixed to floating interest rate swap contracts. One fixed to floating interest rate swap is converting $750,000 from a fixed rate of 1.6655% to six-month LIBO rate and a second tranche of $750,000 from a fixed rate of 1.68% to six-month LIBO rate. The objective of these swaps is to cover the exposure of the 2026 Senior Secured Notes to changes in the market interest rate. These swap contracts were not designated as hedges for accounting purposes. Accordingly, the changes in the fair value of these interest rate swap contracts are recorded through the statement of operations.
The Company does not hold or issue derivative instruments for trading or speculative purposes.
The following represents the location of the assets and liabilities associated with the Company's derivative instruments within the consolidated balance sheets:
| |
|
Asset Derivatives | Liability Derivatives | ||||||||||||
|---|---|---|---|---|---|---|---|---|---|---|---|---|---|---|---|
Derivatives Not Designated as Hedging Instruments |
Balance Sheet Location |
Fair Value at March 31, 2017 |
Fair Value at December 31, 2016 |
Fair Value at March 31, 2017 |
Fair Value at December 31, 2016 |
||||||||||
Prepaid forward contracts |
Derivative contracts, current | $ | — | $ | 352 | $ | 36,073 | $ | 13,158 | ||||||
Prepaid forward contracts |
Derivative contracts, long-term | — | 10,604 | 37,173 | — | ||||||||||
Interest rate swap contracts |
Liabilities under derivative contracts, long-term | — | — | 76,481 | 78,823 | ||||||||||
| | | | | | | | | | | | | | | | |
|
$ | — | $ | 10,956 | $ | 149,727 | $ | 91,981 | |||||||
| | | | | | | | | | | | | | | | |
| | | | | | | | | | | | | | | | |
| | | | | | | | | | | | | | | | |
Losses related to the Company's equity derivative contracts related to the Comcast common stock for the three months ended March 31, 2017 of $71,044, are reflected in loss on equity derivative contracts, net in the Company's consolidated statement of operations.
For the three months ended March 31, 2017, the Company recorded a gain on investments of $131,658, representing the net increase in the fair values of the investment securities pledged as collateral.
For the three months ended March 31, 2017, the Company recorded a gain on interest rate swap contracts of $2,342.
F-25
ALTICE USA, INC.
NOTES TO CONSOLIDATED FINANCIAL STATEMENTS (Continued)
(Dollars in thousands, except per share amounts)
(Unaudited)
NOTE 9. DERIVATIVE CONTRACTS AND COLLATERALIZED INDEBTEDNESS (Continued)
Settlements of Collateralized Indebtedness
The following table summarizes the settlement of the Company's collateralized indebtedness relating to Comcast shares that were settled by delivering cash equal to the collateralized loan value, net of the value of the related equity derivative contracts during the three months ended March 31, 2017:
Number of shares(a) |
5,337,750 | |||
| | | | | |
| | | | | |
| | | | | |
Collateralized indebtedness settled |
$ | (150,084 | ) | |
Derivative contracts settled |
— | |||
| | | | | |
|
(150,084 | ) | ||
Proceeds from new monetization contracts |
156,136 | |||
| | | | | |
Net cash receipt |
$ | 6,052 | ||
| | | | | |
| | | | | |
| | | | | |
- (a)
- Share amounts are adjusted for the 2 for 1 stock split in February 2017.
The cash to settle the collateralized indebtedness was obtained from the proceeds of new monetization contracts covering an equivalent number of Comcast shares. The terms of the new contracts allow the Company to retain upside participation in Comcast shares up to each respective contract's upside appreciation limit with downside exposure limited to the respective hedge price.
In April 2017, the Company settled collateralized indebtedness relating to 5,464,368 Comcast shares by delivering cash equal to the collateralized loan value obtained from the proceeds of a new monetization contract covering an equivalent number of Comcast shares. Accordingly, the consolidated balance sheet of the Company as of March 31, 2017 reflects the reclassification of $205,406 of investment securities pledged as collateral from a current asset to a long-term asset and $161,438 of collateralized indebtedness from a current liability to a long-term liability.
NOTE 10. FAIR VALUE MEASUREMENT
The fair value hierarchy is based on inputs to valuation techniques that are used to measure fair value that are either observable or unobservable. Observable inputs reflect assumptions market participants would use in pricing an asset or liability based on market data obtained from independent sources while unobservable inputs reflect a reporting entity's pricing based upon their own market assumptions. The fair value hierarchy consists of the following three levels:
- •
- Level I—Quoted prices for identical instruments in active markets.
- •
- Level II—Quoted prices for similar instruments in active markets; quoted prices for identical or similar instruments in
markets that are not active; and model-derived valuations whose inputs are observable or whose significant value drivers are observable.
- •
- Level III—Instruments whose significant value drivers are unobservable.
F-26
ALTICE USA, INC.
NOTES TO CONSOLIDATED FINANCIAL STATEMENTS (Continued)
(Dollars in thousands, except per share amounts)
(Unaudited)
NOTE 10. FAIR VALUE MEASUREMENT (Continued)
The following table presents for each of these hierarchy levels, the Company's financial assets and financial liabilities that are measured at fair value on a recurring basis:
| |
Fair Value Hierarchy |
March 31, 2017 |
December 31, 2016 |
||||||
|---|---|---|---|---|---|---|---|---|---|
Assets: |
|||||||||
Money market funds |
Level I | $ | 40,251 | $ | 100,139 | ||||
Investment securities pledged as collateral |
Level I | 1,614,688 | 1,483,030 | ||||||
Prepaid forward contracts |
Level II | — | 10,956 | ||||||
Liabilities: |
|||||||||
Prepaid forward contracts |
Level II | 73,246 | 13,158 | ||||||
Interest rate swap contracts |
Level II | 76,481 | 78,823 | ||||||
The Company's cash equivalents, investment securities and investment securities pledged as collateral are classified within Level I of the fair value hierarchy because they are valued using quoted market prices.
The Company's derivative contracts and liabilities under derivative contracts on the Company's balance sheets are valued using market-based inputs to valuation models. These valuation models require a variety of inputs, including contractual terms, market prices, yield curves, and measures of volatility. When appropriate, valuations are adjusted for various factors such as liquidity, bid/offer spreads and credit risk considerations. Such adjustments are generally based on available market evidence. Since model inputs can generally be verified and do not involve significant management judgment, the Company has concluded that these instruments should be classified within Level II of the fair value hierarchy.
Fair Value of Financial Instruments
The following methods and assumptions were used to estimate fair value of each class of financial instruments for which it is practicable to estimate:
Credit Facility Debt, Collateralized Indebtedness, Senior Notes and Debentures, Senior Secured Notes, Senior Guaranteed Notes, Notes Payable to Affiliates and Related Parties, and Notes Payable
The fair values of each of the Company's debt instruments are based on quoted market prices for the same or similar issues or on the current rates offered to the Company for instruments of the same remaining maturities. The fair value of notes payable is based primarily on the present value of the remaining payments discounted at the borrowing cost.
F-27
ALTICE USA, INC.
NOTES TO CONSOLIDATED FINANCIAL STATEMENTS (Continued)
(Dollars in thousands, except per share amounts)
(Unaudited)
NOTE 10. FAIR VALUE MEASUREMENT (Continued)
The carrying values, estimated fair values, and classification under the fair value hierarchy of the Company's financial instruments, excluding those that are carried at fair value in the accompanying consolidated balance sheets, are summarized as follows:
| |
|
March 31, 2017 | December 31, 2016 | ||||||||||||
|---|---|---|---|---|---|---|---|---|---|---|---|---|---|---|---|
| |
Fair Value Hierarchy |
Carrying Amount(a) |
Estimated Fair Value |
Carrying Amount(a) |
Estimated Fair Value |
||||||||||
Altice USA debt instruments: |
|||||||||||||||
Notes payable to affiliates and related parties |
Level II | $ | 1,750,000 | 1,849,190 | $ | 1,750,000 | $ | 1,837,876 | |||||||
CSC Holdings debt instruments: |
|||||||||||||||
Credit facility debt |
Level II | 2,677,412 | 2,719,006 | 2,631,887 | 2,675,256 | ||||||||||
Collateralized indebtedness |
Level II | 1,293,702 | 1,277,718 | 1,286,069 | 1,280,048 | ||||||||||
Senior guaranteed notes |
Level II | 2,289,901 | 2,408,603 | 2,289,494 | 2,416,375 | ||||||||||
Senior notes and debentures |
Level II | 6,729,944 | 7,722,769 | 6,732,816 | 7,731,150 | ||||||||||
Notes payable |
Level II | 11,453 | 11,039 | 13,726 | 13,260 | ||||||||||
Cablevision senior notes |
Level II | 2,733,548 | 2,912,588 | 2,742,082 | 2,920,056 | ||||||||||
Cequel debt instruments: |
|||||||||||||||
Cequel credit facility |
Level II | 810,929 | 812,963 | 812,903 | 815,000 | ||||||||||
Senior Secured Notes |
Level II | 2,567,708 | 2,673,250 | 2,566,802 | 2,689,750 | ||||||||||
Senior Notes |
Level II | 3,184,617 | 3,491,425 | 3,176,131 | 3,517,275 | ||||||||||
| | | | | | | | | | | | | | | | |
|
$ | 24,049,214 | $ | 25,878,551 | $ | 24,001,910 | $ | 25,896,046 | |||||||
| | | | | | | | | | | | | | | | |
| | | | | | | | | | | | | | | | |
| | | | | | | | | | | | | | | | |
- (a)
- Amounts are net of unamortized deferred financing costs and discounts.
The fair value estimates related to the Company's debt instruments presented above are made at a specific point in time, based on relevant market information and information about the financial instrument. These estimates are subjective in nature and involve uncertainties and matters of significant judgments and therefore cannot be determined with precision. Changes in assumptions could significantly affect the estimates.
NOTE 11. INCOME TAXES
The Company files a federal consolidated and certain state combined income tax returns with its 80% or more owned subsidiaries. In connection with the contribution of common stock of Cequel to the Company in 2015, Cequel joined the Company's federal consolidated group. Cablevision joined the Company's federal consolidated group on the Cablevision Acquisition Date.
The Company recorded income tax benefit of $45,908 for the three months ended March 31, 2017, reflecting an effective tax rate of 38%. Nondeductible share-based compensation expense resulted in tax expense of $3,140. Absent this item, the effective tax rate for the three months ended March 31, 2017 would have been 40%.
F-28
ALTICE USA, INC.
NOTES TO CONSOLIDATED FINANCIAL STATEMENTS (Continued)
(Dollars in thousands, except per share amounts)
(Unaudited)
NOTE 11. INCOME TAXES (Continued)
The Company recorded income tax benefit of $74,395 for the three months ended March 31, 2016, reflecting an effective tax rate of 35%. The effective tax rate for the three months ended March 31, 2016 was lower than expected primarily because there was no state income tax benefit on the pre-merger accrued interest at Finco. This resulted in reducing the income tax benefit recorded by $8,340.
On January 1, 2017, the Company adopted ASU 2016-09 using the prospective transition method with respect to the presentation of excess tax benefits in the statement of cash flows. In connection with the adoption, a deferred tax asset of $308,231 for previously unrealized excess tax benefits related to share-based payment awards was recognized with the offset recorded to accumulated deficit.
As of March 31, 2017, the Company's federal net operating losses ("NOLs") were approximately $2,986,000. The utilization of certain pre-merger NOLs of Cablevision and Cequel are limited pursuant to Internal Revenue Code Section 382. The Company does not expect such limitations to impact the ability to utilize the NOLs prior to their expiration.
NOTE 12. SHARE-BASED COMPENSATION
Certain employees of the Company and its affiliates received awards of units in a carry unit plan of Neptune Management LP, an entity which has an ownership interest in the Company. The awards generally vest as follows: 50% on the second anniversary of June 21, 2016 for Cablevision employees or December 21, 2015 for Cequel employees ("Base Date"), 25% on the third anniversary of the Base Date, and 25% on the fourth anniversary of the Base Date. Neptune Holding US GP LLC, the general partner of Neptune Management LP, has the right to repurchase (or to assign to an affiliate, including the Company, the right to repurchase) vested awards held by employees for sixty days following their termination. For performance-based awards under the plan, vesting occurs upon achievement or satisfaction of a specified performance condition. The Company considered the probability of achieving the established performance targets in determining the share-based compensation with respect to these awards at the end of each reporting period. The carry unit plan has 259,442,785 units authorized for issuance, of which 153,950,000 have been issued to employees of the Company and 65,700,000 have been issued to employees of Altice N.V. and affiliated companies as of March 31, 2017.
The Company measures the cost of employee services received in exchange for carry units based on the fair value of the award at grant date. An option pricing model was used which requires subjective assumptions for which changes in these assumptions could materially affect the fair value of the carry units outstanding. The time to liquidity event assumption was based on management's judgment. The equity volatility assumption of 60% was estimated using the historical weekly volatility of publicly traded comparable companies. The risk-free rate of 0.74% assumed in valuing the units was based on the U.S. Constant Maturity Treasury Rates for a period matching the expected time to liquidity event. The discount for lack of marketability of 20% was based on Finnerty's (2012) average-strike put option model. The weighted average grant date fair value of the outstanding units is $0.37 per unit and the fair value was $1.76 per unit as of December 31, 2016. For the year ended December 31, 2016, the Company recognized an expense of $14,368 related to the push down of share-based compensation related to the carry unit plan of which approximately $9,849 related to units
F-29
ALTICE USA, INC.
NOTES TO CONSOLIDATED FINANCIAL STATEMENTS (Continued)
(Dollars in thousands, except per share amounts)
(Unaudited)
NOTE 12. SHARE-BASED COMPENSATION (Continued)
granted to employees of the Company and $4,519 related to employees of Altice N.V. and affiliated companies allocated to the Company.
Beginning on the fourth anniversary of the Base Date, the holders of carry units have an annual opportunity (a sixty day period determined by the administrator of the plan) to sell their units back to Neptune Holding US GP LLC (or affiliate, including the Company, designated by Neptune Holding US GP). Accordingly, the carry units are presented as temporary equity on the consolidated balance at fair value. Adjustments to fair value at each reporting period are recorded in paid in capital.
The right of Neptune Holding US GP LLC to assign to an affiliate, including the Company, the right to repurchase an employee's vested units during the sixty-day period following termination, or to satisfy its obligation to repurchase an employee's vested units during annual sixty-day periods following the fourth anniversary of the Base Date, may be exercised by Neptune Holding US GP LLC in its discretion at the time a repurchase right or obligation arises. The carry unit plan requires the purchase price payable to the employee or former employee, as the case may be, to be paid in cash, a promissory note (with a term of not more than 3 years and bearing interest at the long-term applicable federal rate under Section 1274(d) of the Internal Revenue Code) or combination thereof, in each case as determined by Neptune Holding US GP LLC in its discretion at the time of the repurchase. Neptune Holding US GP LLC expects that vested units will be redeemed for shares of Class A common stock upon vesting.
The following assumptions were used to calculate the fair values of the carry unit awards granted in the first quarter of 2017:
Time to liquidity event |
0.3 years | |||
Discount for lack of marketability |
5 | % | ||
Risk-free rate |
0.76 | % | ||
Equity volatility assumption |
30 | % |
The following table summarizes activity relating to carry units:
| |
Number of Time Vesting Awards |
Number of Performance Based Vesting Awards |
Weighted Average Grant Date Fair Value |
|||||||
|---|---|---|---|---|---|---|---|---|---|---|
Balance, December 31, 2016 |
192,800,000 | 10,000,000 | $ | 0.37 | ||||||
Granted |
17,850,000 | — | 0.55 | |||||||
Forfeited |
(1,000,000 | ) | — | 0.37 | ||||||
| | | | | | | | | | | |
Balance, March 31, 2017 |
209,650,000 | 10,000,000 | 0.39 | |||||||
| | | | | | | | | | | |
| | | | | | | | | | | |
| | | | | | | | | | | |
Awards vested at March 31, 2017 |
— | — | ||||||||
| | | | | | | | | | | |
| | | | | | | | | | | |
| | | | | | | | | | | |
F-30
ALTICE USA, INC.
NOTES TO CONSOLIDATED FINANCIAL STATEMENTS (Continued)
(Dollars in thousands, except per share amounts)
(Unaudited)
NOTE 13. AFFILIATE AND RELATED PARTY TRANSACTIONS
Equity Method Investments
In July 2016, the Company completed the sale of a 75% interest in Newsday LLC to an employee of the Company. The Company retained the remaining 25% ownership interest. Effective July 7, 2016, the operating results of Newsday are no longer consolidated with those of the Company and the Company's 25% interest in the operating results of Newsday is recorded on the equity basis.
At March 31, 2017, the Company's 25% investment in Newsday Holdings LLC ("Newsday Holdings") and its 25% interest in I24NEWS, Altice N.V.'s 24/7 international news and current affairs channel, was $2,130 and $1,254, respectively, and are included in investments in affiliates on our consolidated balance sheet. The operating results of Newsday Holdings and I24NEWS are recorded on the equity basis. For the three months ended March 31, 2017, the Company recorded equity in net loss of Newsday and I24NEWS of $1,510 and $1,247, respectively.
Affiliate and Related Party Transactions
As the transactions discussed below were conducted between subsidiaries under common control, amounts charged for certain services may not have represented amounts that might have been received or incurred if the transactions were based upon arm's length negotiations.
The following table summarizes the revenue and charges related to services provided to or received from subsidiaries of Altice N.V. and Newsday:
| |
Three Months Ended March 31, |
||||||
|---|---|---|---|---|---|---|---|
| |
2017 | 2016 | |||||
Revenue |
$ | 141 | $ | — | |||
| | | | | | | | |
| | | | | | | | |
| | | | | | | | |
Operating expenses: |
|||||||
Programming and other direct costs |
$ | (735 | ) | $ | — | ||
Other operating expenses |
(7,298 | ) | (2,500 | ) | |||
| | | | | | | | |
Operating expenses, net |
(8,033 | ) | (2,500 | ) | |||
| | | | | | | | |
Interest expense(a) |
(47,588 | ) | — | ||||
| | | | | | | | |
Net charges |
$ | (55,480 | ) | $ | (2,500 | ) | |
| | | | | | | | |
| | | | | | | | |
| | | | | | | | |
Capital Expenditures |
$ | 892 | $ | — | |||
| | | | | | | | |
| | | | | | | | |
| | | | | | | | |
- (a)
- See Note 8 for a discussion of interest expense related to notes payable to affiliates and related parties of $47,588.
Revenue
The Company recognized revenue in connection with sale of advertising to Newsday.
F-31
ALTICE USA, INC.
NOTES TO CONSOLIDATED FINANCIAL STATEMENTS (Continued)
(Dollars in thousands, except per share amounts)
(Unaudited)
NOTE 13. AFFILIATE AND RELATED PARTY TRANSACTIONS (Continued)
Programming and other direct costs
Programming and other direct costs include costs incurred by the Company for the transport and termination of voice and data services provided by a subsidiary of Altice N.V.
Other operating expenses
A subsidiary of Altice N.V. provides certain executive services, including CEO, CFO and COO services, to the Company. Compensation under the terms of the agreement is an annual fee of $30,000 to be paid by the Company. Fees associated with this agreement recorded by the Company amounted to approximately $7,500 and $2,500 for the three months ended March 31, 2017 and 2016, respectively.
Other operating expenses includes a credit of $482 for transition services provided to Newsday.
Aggregate amounts that were due from and due to related parties are summarized below:
| |
March 31, 2017 |
December 31, 2016 |
|||||
|---|---|---|---|---|---|---|---|
Due from: |
|||||||
Altice US Finance S.A.(a) |
$ | 12,951 | $ | 12,951 | |||
Newsday(b) |
4,696 | 6,114 | |||||
Altice Management Americas(b) |
8,944 | 3,117 | |||||
Altice Technical Services(b) |
393 | — | |||||
I24(b) |
1,369 | — | |||||
Other Altice N.V. subsidiaries(b) |
31 | — | |||||
| | | | | | | | |
|
$ | 28,384 | $ | 22,182 | |||
| | | | | | | | |
| | | | | | | | |
| | | | | | | | |
Due to: |
|||||||
CVC 3BV(c) |
— | 71,655 | |||||
Neptune Holdings US LP(c) |
— | 7,962 | |||||
Altice Management International(d) |
7,500 | 44,121 | |||||
Newsday(b) |
185 | 275 | |||||
Other Altice N.V. subsidiaries(b) |
3,470 | 3,350 | |||||
| | | | | | | | |
|
$ | 11,155 | $ | 127,363 | |||
| | | | | | | | |
| | | | | | | | |
| | | | | | | | |
- (a)
- Represents
interest on senior notes paid by the Company on behalf of the affiliate.
- (b)
- Represents
amounts paid by the Company on behalf of the respective related party and the net amounts due from the related party for certain transition services
provided.
- (c)
- Represents
distributions payable to shareholders.
- (d)
- Represents amounts due for equipment purchases and software development services discussed above.
F-32
ALTICE USA, INC.
NOTES TO CONSOLIDATED FINANCIAL STATEMENTS (Continued)
(Dollars in thousands, except per share amounts)
(Unaudited)
NOTE 13. AFFILIATE AND RELATED PARTY TRANSACTIONS (Continued)
The table above does not include notes payable to affiliates and related parties of $1,750,000 and the related accrued interest of $150,135 and $102,557, as of March 31, 2017 and December 31, 2016, respectively, which is reflected in accrued interest in the Company's balance sheets. See discussion in Note 8.
During the three months ended March 31, 2017, the Company made a prepayment of $9,441 to Altice Technical Services for plant maintenance and is reflected in prepaid expenses and other current assets on the Company's balance sheet at March 31, 2017.
NOTE 14. COMMITMENTS AND CONTINGENCIES
Legal Matters
Cable Operations Litigation
In re Cablevision Consumer Litigation:
Following expiration of the affiliation agreements for carriage of certain Fox broadcast stations and cable networks on October 16, 2010, News Corporation terminated delivery of the programming feeds to the Company, and as a result, those stations and networks were unavailable on the Company's cable television systems. On October 30, 2010, the Company and Fox reached an agreement on new affiliation agreements for these stations and networks, and carriage was restored. Several purported class action lawsuits were subsequently filed on behalf of the Company's customers seeking recovery for the lack of Fox programming. Those lawsuits were consolidated in an action before the U. S. District Court for the Eastern District of New York, and a consolidated complaint was filed in that court on February 22, 2011. Plaintiffs asserted claims for breach of contract, unjust enrichment, and consumer fraud, seeking unspecified compensatory damages, punitive damages and attorneys' fees. On March 28, 2012, the Court ruled on the Company's motion to dismiss, denying the motion with regard to plaintiffs' breach of contract claim, but granting it with regard to the remaining claims, which were dismissed. On April 16, 2012, plaintiffs filed a second consolidated amended complaint, which asserts a claim only for breach of contract. The Company's answer was filed on May 2, 2012. On October 10, 2012, plaintiffs filed a motion for class certification and on December 13, 2012, a motion for partial summary judgment. On March 31, 2014, the Court granted plaintiffs' motion for class certification, and denied without prejudice plaintiffs' motion for summary judgment. On May 30, 2014, the Court approved the form of class notice, and on October 7, 2014, approved the class notice distribution plan. The class notice distribution has been completed, and the opt-out period expired on February 27, 2015. Expert discovery commenced on May 5, 2014, and concluded on December 8 and 28, 2015, when the Court ruled on the pending expert discovery motions. On January 26, 2016, the Court approved a schedule for filing of summary judgment motions. Plaintiffs filed a motion for summary judgment on March 31, 2016. The Company filed its own summary judgment motion on June 13, 2016. The motions for summary judgment have been denied with leave to re-file in the event the discussions between the parties are not successful. As of December 31, 2016, the Company had an estimated liability associated with a potential settlement totaling $5,200. During the three months ended March 31, 2017, the Company recorded an additional liability of $800 based on the ongoing negotiations with the plaintiffs. The parties have executed a binding term sheet memorializing a settlement agreement, including
F-33
ALTICE USA, INC.
NOTES TO CONSOLIDATED FINANCIAL STATEMENTS (Continued)
(Dollars in thousands, except per share amounts)
(Unaudited)
NOTE 14. COMMITMENTS AND CONTINGENCIES (Continued)
attorneys' fees, subject to entering into a long form agreement and Court approval. The amount ultimately paid in connection with a possible settlement could exceed the amount recorded.
Patent Litigation
Cablevision is named as a defendant in certain lawsuits claiming infringement of various patents relating to various aspects of the Company's businesses. In certain of these cases other industry participants are also defendants. In certain of these cases the Company expects that any potential liability would be the responsibility of the Company's equipment vendors pursuant to applicable contractual indemnification provisions. The Company believes that the claims are without merit and intends to defend the actions vigorously, but is unable to predict the outcome of these lawsuits or reasonably estimate a range of possible loss.
In addition to the matters discussed above, the Company is party to various lawsuits, some involving claims for substantial damages. Although the outcome of these other matters cannot be predicted and the impact of the final resolution of these other matters on the Company's results of operations in a particular subsequent reporting period is not known, management does not believe that the resolution of these other lawsuits will have a material adverse effect on the financial position of the Company or the ability of the Company to meet its financial obligations as they become due.
NOTE 15. SEGMENT INFORMATION
The Company classifies its operations into two reportable segments: Cablevision and Cequel. The Company's reportable segments are strategic business units that are managed separately. The Company evaluates segment performance based on several factors, of which the primary financial measure is business segment Adjusted EBITDA, a non-GAAP measure. The Company defines Adjusted EBITDA as net income (loss) excluding income taxes, income (loss) from discontinued operations, non-operating other income or expenses, loss on extinguishment of debt and write-off of deferred financing costs, gain (loss) on equity derivative contracts, gain (loss) on investments, interest expense (including cash interest expense), interest income, depreciation and amortization, share-based compensation expense or benefit, restructuring expense or credits and transaction expenses. The Company has presented the components that reconcile Adjusted EBITDA to operating income, an accepted GAAP measure for the three months ended March 31, 2017 and 2016 as follows:
| |
Three months ended March 31, 2017 | Three months ended March 31, 2016 |
|||||||||||
|---|---|---|---|---|---|---|---|---|---|---|---|---|---|
| |
Cablevision | Cequel | Total | Cequel | |||||||||
Operating income |
$ | 120,168 | $ | 128,066 | $ | 248,234 | $ | 54,260 | |||||
Share-based compensation |
5,082 | 2,766 | 7,848 | — | |||||||||
Restructuring and other expense |
58,647 | 18,282 | 76,929 | 7,569 | |||||||||
Depreciation and amortization |
443,176 | 165,548 | 608,724 | 200,900 | |||||||||
| | | | | | | | | | | | | | |
Adjusted EBITDA |
$ | 627,073 | $ | 314,662 | $ | 941,735 | $ | 262,729 | |||||
| | | | | | | | | | | | | | |
| | | | | | | | | | | | | | |
| | | | | | | | | | | | | | |
F-34
ALTICE USA, INC.
NOTES TO CONSOLIDATED FINANCIAL STATEMENTS (Continued)
(Dollars in thousands, except per share amounts)
(Unaudited)
NOTE 15. SEGMENT INFORMATION (Continued)
A reconciliation of reportable segment amounts to the Company's consolidated balances are as follows:
| |
Three Months Ended March 31, |
||||||
|---|---|---|---|---|---|---|---|
| |
2017 | 2016 | |||||
Operating income for reportable segments |
$ | 248,234 | $ | 54,260 | |||
Items excluded from operating income: |
|||||||
Interest expense |
(433,294 | ) | (275,829 | ) | |||
Interest income |
232 | 6,415 | |||||
Gain on investments, net |
131,658 | — | |||||
Loss on equity derivative contracts, net |
(71,044 | ) | — | ||||
Gain on interest rate swap contracts |
2,342 | — | |||||
Other income (expense), net |
(224 | ) | 11 | ||||
| | | | | | | | |
Loss before income taxes |
$ | (122,096 | ) | $ | (215,143 | ) | |
| | | | | | | | |
| | | | | | | | |
| | | | | | | | |
The following tables present the composition of revenue by segment for the three months ended March 31, 2017 and 2016:
| |
Three Months Ended March 31, 2017 | Three Months Ended March 31, 2016 |
|||||||||||
|---|---|---|---|---|---|---|---|---|---|---|---|---|---|
| |
Cablevision | Cequel | Total | Cequel | |||||||||
Residential: |
|||||||||||||
Pay TV |
$ | 789,387 | $ | 281,974 | $ | 1,071,361 | $ | 279,737 | |||||
Broadband |
381,969 | 229,800 | 611,769 | 196,690 | |||||||||
Telephony |
176,401 | 34,472 | 210,873 | 39,735 | |||||||||
Business services and wholesale |
228,685 | 90,906 | 319,591 | 84,404 | |||||||||
Advertising |
61,739 | 18,229 | 79,968 | 20,887 | |||||||||
Other |
6,620 | 5,494 | 12,114 | 6,136 | |||||||||
| | | | | | | | | | | | | | |
Total Revenue |
$ | 1,644,801 | $ | 660,875 | $ | 2,305,676 | $ | 627,589 | |||||
| | | | | | | | | | | | | | |
| | | | | | | | | | | | | | |
| | | | | | | | | | | | | | |
Capital expenditures for the three months ended March 31, 2017 and 2016 by reportable segment are presented below:
| |
Three Months Ended March 31, |
||||||
|---|---|---|---|---|---|---|---|
| |
2017 | 2016 | |||||
Cablevision |
$ | 184,399 | $ | — | |||
Cequel |
73,028 | 66,204 | |||||
| | | | | | | | |
|
$ | 257,427 | $ | 66,204 | |||
| | | | | | | | |
| | | | | | | | |
| | | | | | | | |
F-35
ALTICE USA, INC.
NOTES TO CONSOLIDATED FINANCIAL STATEMENTS (Continued)
(Dollars in thousands, except per share amounts)
(Unaudited)
NOTE 15. SEGMENT INFORMATION (Continued)
All revenues and assets of the Company's reportable segments are attributed to or located in the United States.
Total assets by segment are not provided as such amounts are not regularly reviewed by the chief operating decision maker for purposes of decision making regarding resource allocations.
NOTE 16. UNAUDITED PRO FORMA NET LOSS PER SHARE
The pro forma net loss per share data for the three months ended March 31, 2017 and 2016 is based on our historical statement of operations after giving effect to the issuance and sale of the shares of common stock in connection with the IPO, as well as the common stock to be issued in the organizational transactions discussed in Note 1, as if they occurred at the beginning of the period.
| |
Three Months Ended March 31, 2017 |
Three Months Ended March 31, 2016 |
|||||
|---|---|---|---|---|---|---|---|
| |
Basic and Diluted | Basic and Diluted | |||||
Numerator: |
|||||||
Net loss attributable to Altice USA, Inc. stockholders |
$ | (76,425 | ) | $ | (140,748 | ) | |
Denominator: |
|||||||
Weighted average shares of common stock outstanding—basic and diluted (in thousands) |
0.1 | 0.1 | |||||
Pro forma adjustment to reflect the assumed issuance of common stock (in thousands) |
737,069 | 737,069 | |||||
Weighted average shares of common stock outstanding used in computing the pro forma net income per share—basic and diluted (in thousands) |
737,069 | 737,069 | |||||
| | | | | | | | |
| | | | | | | | |
| | | | | | | | |
Pro forma net loss per share |
$ | (0.10 | ) | $ | (0.19 | ) | |
| | | | | | | | |
| | | | | | | | |
| | | | | | | | |
NOTE 17. SUBSEQUENT EVENTS
In April 2017, the Company made a cash distribution of $169,950 to the Company's stockholders.
F-36
Report of Independent Registered Public Accounting Firm
The
Board of Directors and Stockholders
Altice USA, Inc.:
We have audited the accompanying consolidated balance sheet of Altice USA, Inc. and subsidiaries (the Company) as of December 31, 2016 and the related consolidated statements of operations and comprehensive loss, stockholders' equity, and cash flows for the year ended December 31, 2016. These consolidated financial statements are the responsibility of the Company's management. Our responsibility is to express an opinion on these consolidated financial statements based on our audit.
We conducted our audit in accordance with the standards of the Public Company Accounting Oversight Board (United States). Those standards require that we plan and perform the audit to obtain reasonable assurance about whether the financial statements are free of material misstatement. An audit includes examining, on a test basis, evidence supporting the amounts and disclosures in the financial statements. An audit also includes assessing the accounting principles used and significant estimates made by management, as well as evaluating the overall financial statement presentation. We believe that our audit provides a reasonable basis for our opinion.
In our opinion, the consolidated financial statements referred to above present fairly, in all material respects, the financial position of the Company as of December 31, 2016, and the results of their operations and their cash flows for the year ended December 31, 2016, in conformity with U.S. generally accepted accounting principles.
As discussed in Note 1 to the consolidated financial statements, the Company was incorporated on September 14, 2015 and had no operations of its own other than the issuance of debt prior to the contribution of Cequel Corporation on June 9, 2016 by Altice N.V. The results of operations of Cequel Corporation for the year ended December 31, 2016 have been included in the results of operations of the Company for the same period as Cequel Corporation was under common control with the Company throughout 2016.
/s/ KPMG LLP
New
York, New York
April 10, 2017
F-37
ALTICE USA, INC. AND SUBSIDIARIES
CONSOLIDATED BALANCE SHEET
(In thousands)
ASSETS
|
December 31, 2016 |
|||
|---|---|---|---|---|
Current Assets: |
||||
Cash and cash equivalents |
$ | 486,792 | ||
Restricted cash |
16,301 | |||
Accounts receivable, trade (less allowance for doubtful accounts of $11,677) |
349,626 | |||
Prepaid expenses and other current assets |
88,151 | |||
Amounts due from affiliates |
22,182 | |||
Investment securities pledged as collateral |
741,515 | |||
Derivative contracts |
352 | |||
| | | | | |
Total current assets |
1,704,919 | |||
Property, plant and equipment, net of accumulated depreciation of $1,039,297 |
6,597,635 | |||
Investment in affiliates |
5,606 | |||
Investment securities pledged as collateral |
741,515 | |||
Derivative contracts |
10,604 | |||
Other assets |
48,545 | |||
Amortizable customer relationships, net of accumulated amortization of $580,276 |
5,345,608 | |||
Amortizable trade names, net of accumulated amortization of $83,397 |
983,386 | |||
Other amortizable intangibles, net of accumulated amortization of $3,093 |
23,650 | |||
Indefinite-lived cable television franchises |
13,020,081 | |||
Goodwill |
7,992,700 | |||
| | | | | |
Total Assets |
$ | 36,474,249 | ||
| | | | | |
| | | | | |
| | | | | |
See accompanying notes to consolidated financial statements.
F-38
ALTICE USA, INC. AND SUBSIDIARIES
CONSOLIDATED BALANCE SHEET (Continued)
(In thousands, except share and per share amounts)
LIABILITIES AND STOCKHOLDERS' EQUITY
|
December 31, 2016 |
|||
|---|---|---|---|---|
Current Liabilities: |
||||
Accounts payable |
$ | 697,310 | ||
Accrued liabilities: |
||||
Interest |
576,778 | |||
Employee related costs |
260,019 | |||
Other accrued expenses |
333,522 | |||
Amounts due to affiliates |
127,363 | |||
Deferred revenue |
94,816 | |||
Liabilities under derivative contracts |
13,158 | |||
Collateralized indebtedness |
622,332 | |||
Credit facility debt |
33,150 | |||
Senior notes and debentures |
926,045 | |||
Capital lease obligations |
15,013 | |||
Notes payable |
5,427 | |||
| | | | | |
Total current liabilities |
3,704,933 | |||
Defined benefit plan obligations |
84,106 | |||
Notes payable to affiliates and related parties |
1,750,000 | |||
Other liabilities |
113,485 | |||
Deferred tax liability |
7,966,815 | |||
Liabilities under derivative contracts |
78,823 | |||
Collateralized indebtedness |
663,737 | |||
Credit facility debt |
3,411,640 | |||
Senior notes and debentures |
16,581,280 | |||
Capital lease obligations |
13,142 | |||
Notes payable |
8,299 | |||
| | | | | |
Total liabilities |
34,376,260 | |||
| | | | | |
Commitments and contingencies |
||||
Redeemable equity |
68,147 | |||
Stockholders' Equity: |
||||
Common Stock, $.01 par value, 1,000 shares authorized, 100 shares issued and outstanding |
— | |||
Paid-in capital |
3,003,554 | |||
Accumulated deficit |
(975,978 | ) | ||
| | | | | |
|
2,027,576 | |||
Accumulated other comprehensive income |
1,979 | |||
| | | | | |
Total stockholders' equity |
2,029,555 | |||
Noncontrolling interest |
287 | |||
| | | | | |
Total equity |
2,029,842 | |||
| | | | | |
|
$ | 36,474,249 | ||
| | | | | |
| | | | | |
| | | | | |
See accompanying notes to consolidated financial statements.
F-39
ALTICE USA, INC. AND SUBSIDIARIES
CONSOLIDATED STATEMENT OF OPERATIONS
FOR THE YEAR ENDED DECEMBER 31, 2016
(In thousands, except per share amounts)
Revenue (including revenue from affiliates of $1,086) (See Note 15) |
$ | 6,017,212 | ||
| | | | | |
Operating expenses: |
||||
Programming and other direct costs (including charges from affiliates of $1,947) (See Note 15) |
1,899,994 | |||
Other operating expenses (including charges from affiliates of $18,854) (See Note 15) |
1,716,851 | |||
Restructuring and other expense |
240,395 | |||
Depreciation and amortization (including impairments) |
1,700,306 | |||
| | | | | |
|
5,557,546 | |||
| | | | | |
Operating income |
459,666 | |||
| | | | | |
Other income (expense): |
||||
Interest expense (including interest expense to affiliates and related parties of $112,712) (See Note 15) |
(1,456,541 | ) | ||
Interest income |
13,811 | |||
Gain on investments, net |
141,896 | |||
Loss on equity derivative contracts, net |
(53,696 | ) | ||
Loss on interest rate swap contracts |
(72,961 | ) | ||
Loss on extinguishment of debt and write-off of deferred financing costs |
(127,649 | ) | ||
Other income, net |
4,329 | |||
| | | | | |
|
(1,550,811 | ) | ||
| | | | | |
Loss before income taxes |
(1,091,145 | ) | ||
Income tax benefit |
259,666 | |||
| | | | | |
Net loss |
(831,479 | ) | ||
Net income attributable to noncontrolling interests |
(551 | ) | ||
| | | | | |
Net loss attributable to Altice USA, Inc. stockholders |
$ | (832,030 | ) | |
| | | | | |
| | | | | |
| | | | | |
Basic and diluted net loss per share |
$ | (8,320 | ) | |
| | | | | |
| | | | | |
| | | | | |
Basic and diluted weighted average common shares |
100 | |||
| | | | | |
| | | | | |
| | | | | |
See accompanying notes to consolidated financial statements.
F-40
ALTICE USA, INC. AND SUBSIDIARIES
CONSOLIDATED STATEMENT OF COMPREHENSIVE LOSS
FOR THE YEAR ENDED DECEMBER 31, 2016
(In thousands)
Net loss |
$ | (831,479 | ) | |
| | | | | |
Other comprehensive income (loss): |
||||
Defined benefit pension and postretirement plans (see Note 13): |
||||
Unrecognized actuarial gain |
3,452 | |||
Applicable income taxes |
(1,381 | ) | ||
| | | | | |
Unrecognized income arising during period, net of income taxes |
2,071 | |||
| | | | | |
Settlement income included in net periodic benefit cost |
(154 | ) | ||
Applicable income taxes |
62 | |||
| | | | | |
Settlement income included in net periodic benefit cost, net of income taxes |
(92 | ) | ||
| | | | | |
Other comprehensive income |
1,979 | |||
| | | | | |
Comprehensive loss |
(829,500 | ) | ||
Comprehensive income attributable to noncontrolling interests |
(551 | ) | ||
| | | | | |
Comprehensive loss attributable to Altice USA, Inc. stockholders |
$ | (830,051 | ) | |
| | | | | |
| | | | | |
| | | | | |
See accompanying notes to consolidated financial statements.
F-41
ALTICE USA, INC. AND SUBSIDIARIES
CONSOLIDATED STATEMENT OF STOCKHOLDERS' EQUITY
(In thousands)
| |
Class A Common Stock |
Paid-in Capital |
Accumulated Deficit |
Treasury Stock |
Accumulated Other Comprehensive Income |
Total Stockholders' Equity (Deficiency) |
Non- controlling Interest |
Total Equity (Deficiency) |
|||||||||||||||||
|---|---|---|---|---|---|---|---|---|---|---|---|---|---|---|---|---|---|---|---|---|---|---|---|---|---|
Balance at January 1, 2016 |
$ | — | $ | 2,252,028 | $ | (143,948 | ) | $ | — | $ | — | $ | 2,108,080 | $ | — | $ | 2,108,080 | ||||||||
Net loss attributable to stockholders |
— | — | (832,030 | ) | — | — | (832,030 | ) | — | (832,030 | ) | ||||||||||||||
Noncontrolling interests acquired |
— | — | — | — | — | — | (264 | ) | (264 | ) | |||||||||||||||
Net loss attributable to noncontrolling interests |
— | — | — | — | — | — | 551 | 551 | |||||||||||||||||
Pension liability adjustments, net of income taxes |
— | — | — | — | 1,979 | 1,979 | — | 1,979 | |||||||||||||||||
Share-based compensation expense |
— | 14,368 | — | — | — | 14,368 | — | 14,368 | |||||||||||||||||
Change in fair value of redeemable equity |
— | (68,148 | ) | — | — | — | (68,148 | ) | — | (68,148 | ) | ||||||||||||||
Contribution from stockholders |
— | 1,246,499 | — | — | — | 1,246,499 | — | 1,246,499 | |||||||||||||||||
Distributions to stockholders |
— | (445,176 | ) | — | — | — | (445,176 | ) | — | (445,176 | ) | ||||||||||||||
Excess tax benefit on share-based awards |
— | 31 | — | — | — | 31 | — | 31 | |||||||||||||||||
Tax impact related to the Newsday Holdings, LLC transactions |
— | 3,952 | — | — | — | 3,952 | — | 3,952 | |||||||||||||||||
| | | | | | | | | | | | | | | | | | | | | | | | | | |
Balance at December 31, 2016 |
$ | — | $ | 3,003,554 | $ | (975,978 | ) | $ | — | $ | 1,979 | $ | 2,029,555 | $ | 287 | $ | 2,029,842 | ||||||||
| | | | | | | | | | | | | | | | | | | | | | | | | | |
| | | | | | | | | | | | | | | | | | | | | | | | | | |
| | | | | | | | | | | | | | | | | | | | | | | | | | |
See accompanying notes to consolidated financial statements.
F-42
ALTICE USA, INC. AND SUBSIDIARIES
CONSOLIDATED STATEMENT OF CASH FLOWS
FOR THE YEAR ENDED DECEMBER 31, 2016
(In thousands)
Cash flows from operating activities: |
||||
Net loss |
$ | (831,479 | ) | |
Adjustments to reconcile net loss to net cash provided by operating activities: |
||||
Depreciation and amortization (including impairments) |
1,700,306 | |||
Impairment of assets included in restructuring charges |
2,445 | |||
Equity in net loss of affiliates |
1,132 | |||
Gain on sale of affiliate interests |
(206 | ) | ||
Gain on investments, net |
(141,896 | ) | ||
Loss on equity derivative contracts, net |
53,696 | |||
Loss on extinguishment of debt and write-off of deferred financing costs |
127,649 | |||
Amortization of deferred financing costs and discounts (premiums) on indebtedness |
27,799 | |||
Share-based compensation expense |
14,368 | |||
Amortization of actuarial losses, net of settlement gains, related to pension and postretirement plans |
3,298 | |||
Deferred income taxes |
(263,989 | ) | ||
Provision for doubtful accounts |
53,249 | |||
Excess tax benefits related to share-based awards |
(31 | ) | ||
Change in assets and liabilities, net of effects of acquisitions and dispositions: |
||||
Accounts receivable, trade |
(58,760 | ) | ||
Prepaid expenses and other assets |
65,808 | |||
Amounts due from and due to affiliates |
41,351 | |||
Accounts payable |
(11,814 | ) | ||
Accrued liabilities |
312,871 | |||
Deferred revenue |
9,835 | |||
Liabilities related to interest rate swap contracts |
78,823 | |||
| | | | | |
Net cash provided by operating activities |
1,184,455 | |||
| | | | | |
Cash flows from investing activities: |
||||
Payment for Cablevision Acquisition, net of cash acquired of $969,549 |
(8,988,774 | ) | ||
Capital expenditures |
(625,541 | ) | ||
Proceeds related to sale of equipment, including costs of disposal |
5,885 | |||
Proceeds from sale of affiliate interests |
13,825 | |||
Increase in other investments |
(4,608 | ) | ||
Additions to other intangible assets |
(106 | ) | ||
| | | | | |
Net cash used in investing activities |
(9,599,319 | ) | ||
| | | | | |
Cash flows from financing activities: |
||||
Proceeds from credit facility debt |
5,510,256 | |||
Repayment of credit facility debt |
(9,133,543 | ) | ||
Proceeds from issuance of notes payable to affiliates and related parties |
1,750,000 | |||
Proceeds from issuance of senior notes |
1,310,000 | |||
Proceeds from collateralized indebtedness |
179,388 | |||
Repayment of collateralized indebtedness and related derivative contracts |
(143,102 | ) | ||
Distributions to stockholders |
(365,559 | ) | ||
Principal payments on capital lease obligations |
(18,837 | ) | ||
Contributions from stockholders |
1,246,499 | |||
Additions to deferred financing costs |
(203,712 | ) | ||
Excess tax benefit related to share-based awards |
31 | |||
| | | | | |
Net cash provided by financing activities |
131,421 | |||
| | | | | |
Net increase in cash, cash equivalents and restricted cash |
(8,283,443 | ) | ||
| | | | | |
Cash, cash equivalents and restricted cash at beginning of year |
8,786,536 | |||
| | | | | |
Cash, cash equivalents and restricted cash at end of year |
$ | 503,093 | ||
| | | | | |
| | | | | |
| | | | | |
See accompanying notes to consolidated financial statements.
F-43
NOTES TO CONSOLIDATED FINANCIAL STATEMENTS
(Dollars in thousands, except share and per share amounts)
NOTE 1. DESCRIPTION OF BUSINESS, RELATED MATTERS AND BASIS OF PRESENTATION
The Company and Related Matters
Altice USA, Inc. ("Altice USA" or the "Company") was incorporated in Delaware on September 14, 2015. As of December 31, 2016, Altice USA is majority-owned by Altice N.V., a public company with limited liability (naamloze vennootshcap) under Dutch law ("Altice N.V.").
Altice N.V. acquired Cequel Corporation ("Cequel" or "Suddenlink") on December 21, 2015 and Cequel was contributed to Altice USA on June 9, 2016. Altice USA had no operations of its own other than the issuance of debt prior to the contribution of Cequel on June 9, 2016 by Altice N.V. The results of operations of Cequel for the year ended December 31, 2016 have been included in the results of operations of Altice USA for the same period, as Cequel was under common control with Altice USA throughout 2016. Altice USA acquired Cablevision Systems Corporation ("Cablevision" or "Optimum") on June 21, 2016.
In addition to the operating results of Cequel for the year ended December 31, 2016, the operating results of Altice USA include the operating results of Cablevision for the period from the date of acquisition, June 21, 2016 through December 31, 2016. In addition to the operating results of Cequel and Cablevision described above, Altice USA incurred net interest expense of $419,456. For the period from inception of Altice USA through December 31, 2015, the operating results of Altice USA include $157,192 of interest expense related to the indebtedness issued to fund the acquisition of Cablevision, discussed below, and the operating results of Cequel for the 10 day period, December 21, 2015 through December 31, 2015. The Company classifies its operations into two reportable segments: Cablevision, which operates in the New York metropolitan area, and Cequel, which principally operates in markets in the south-central United States.
Acquisition of Cablevision Systems Corporation
On June 21, 2016 (the "Cablevision Acquisition Date"), pursuant to the Agreement and Plan of Merger (the "Merger Agreement"), dated as of September 16, 2015, by and among Cablevision, Altice N.V., Neptune Merger Sub Corp., a wholly-owned subsidiary of Altice N.V. ("Merger Sub"), Merger Sub merged with and into Cablevision, with Cablevision surviving the merger (the "Cablevision Acquisition").
In connection with the Cablevision Acquisition, each outstanding share of the Cablevision NY Group Class A common stock, par value $0.01 per share, and Cablevision NY Group Class B common stock, par value $0.01 per share, and together with the Cablevision NY Group Class A common stock, the "Shares") other than (i) Shares owned by Cablevision, Altice N.V. or any of their respective wholly-owned subsidiaries, in each case not held on behalf of third parties in a fiduciary capacity, received $34.90 in cash without interest, less applicable tax withholdings (the "Cablevision Acquisition Consideration").
Pursuant to an agreement, dated December 21, 2015, by and among CVC 2 B.V., CIE Management IX Limited, for and on behalf of the limited partnerships BC European Capital IX-1 through 11 and Canada Pension Plan Investment Board, certain affiliates of BCP and CPPIB (the "Co-Investors") funded approximately $1,000,000 toward the payment of the aggregate Per Share Cablevision Acquisition Consideration, and indirectly acquired approximately 30% of the Shares of Cablevision.
F-44
NOTES TO CONSOLIDATED FINANCIAL STATEMENTS (Continued)
(Dollars in thousands, except share and per share amounts)
NOTE 1. DESCRIPTION OF BUSINESS, RELATED MATTERS AND BASIS OF PRESENTATION (Continued)
Also in connection with the Cablevision Acquisition, outstanding equity-based awards granted under Cablevision's equity plans were cancelled and converted into cash based upon the $34.90 per Share Cablevision Acquisition price in accordance with the original terms of the awards. The total consideration for the outstanding CNYG Class A Shares, the outstanding CNYG Class B Shares, and the equity-based awards amounted to $9,958,323.
In connection with the Cablevision Acquisition, in October 2015, Neptune Finco Corp. ("Finco"), an indirect wholly-owned subsidiary of Altice N.V. formed to complete the financing described herein and the merger with CSC Holdings, LLC ("CSC Holdings"), a wholly-owned subsidiary of Cablevision, borrowed an aggregate principal amount of $3,800,000 under a term loan facility (the "Term Credit Facility") and entered into revolving loan commitments in an aggregate principal amount of $2,000,000 (the "Revolving Credit Facility" and, together with the Term Credit Facility, the "Credit Facilities").
Finco also issued $1,800,000 aggregate principal amount of 10.125% senior notes due 2023 (the "2023 Notes"), $2,000,000 aggregate principal amount of 10.875% senior notes due 2025 (the "2025 Notes"), and $1,000,000 aggregate principal amount of 6.625% senior guaranteed notes due 2025 (the "2025 Guaranteed Notes") (collectively the "Cablevision Acquisition Notes").
On June 21, 2016, immediately following the Cablevision Acquisition, Finco merged with and into CSC Holdings, with CSC Holdings surviving the merger (the "CSC Holdings Merger"), and the Cablevision Acquisition Notes and the Credit Facilities became obligations of CSC Holdings.
On June 21, 2016, in connection with the Cablevision Acquisition, the Company issued notes payable to affiliates and related parties aggregating $1,750,000, of which $875,000 bear interest at 10.75% and $875,000 bear interest at 11%.
The Cablevision Acquisition was accounted for as a business combination in accordance with ASC Topic 805. Accordingly, the Company stepped up 100% of the assets and liabilities assumed to their fair value at the Cablevision Acquisition Date. See Note 3 for further details.
Acquisition of Cequel Corporation
On December 21, 2015, Altice N.V. acquired approximately 70% of the total outstanding equity interests in Cequel Corporation (the "Cequel Acquisition") from the direct and indirect stockholders of Cequel Corporation (the "Sellers"). The consideration for the acquired equity interests was based on a total equity valuation for 100% of the capital and voting rights of Cequel of $3,973,528 which includes $2,797,928 of cash consideration, $675,600 of retained equity held by entities affiliated with BC Partners and CPPIB and $500,000 funded by the issuance by an affiliate of Altice N.V. of a senior vendor note that was subscribed by entities affiliated with BC Partners and CPPIB. Following the closing of the Cequel Acquisition, entities affiliated with BC Partners and CPPIB retained a 30% equity interest in a parent entity of the Company. In addition, the carried interest plans of the Stockholders were cashed out whereby payments were made to participants in such carried interest plans, including certain officers and directors of Cequel.
The Cequel Acquisition was accounted for as a business combination in accordance with ASC Topic 805. Accordingly, the Company stepped up 100% of the assets and liabilities assumed to their fair value at the Cequel Acquisition Date. See Note 3 for further details.
F-45
NOTES TO CONSOLIDATED FINANCIAL STATEMENTS (Continued)
(Dollars in thousands, except share and per share amounts)
NOTE 1. DESCRIPTION OF BUSINESS, RELATED MATTERS AND BASIS OF PRESENTATION (Continued)
In June 2016, Cequel was contributed to Altice USA. The accompanying consolidated financial statements include the operating results of Cequel from January 1, 2016 through December 31, 2016 and the operating results of Cablevision from the Cablevision Acquisition Date through December 31, 2016.
Basis of Presentation
Principles of Consolidation
The accompanying consolidated financial statements include the accounts of the Company and its subsidiaries. All significant intercompany transactions and balances have been eliminated in consolidation.
Use of Estimates in Preparation of Financial Statements
The preparation of financial statements in conformity with U.S. generally accepted accounting principles ("GAAP") requires management to make estimates and assumptions that affect the reported amounts of assets and liabilities and disclosure of contingent liabilities at the date of the financial statements and the reported amounts of revenues and expenses during the reporting period. Actual results could differ from those estimates. See Note 11 for a discussion of fair value estimates.
NOTE 2. SUMMARY OF SIGNIFICANT ACCOUNTING POLICIES
Summary of Significant Accounting Policies
Revenue Recognition
The Company recognizes video, high-speed data, and voice services revenues as the services are provided to customers. Revenue received from customers who purchase bundled services at a discounted rate is allocated to each product in a pro-rata manner based on the individual product's selling price (generally, the price at which the product is regularly sold on a standalone basis). Installation revenue for the Company's video, consumer high-speed data and VoIP services is recognized as installations are completed, as direct selling costs have exceeded this revenue in all periods reported. Advertising revenues are recognized when commercials are aired.
Revenues derived from other sources are recognized when services are provided or events occur.
Multiple-Element Transactions
In the normal course of business, the Company may enter into multiple-element transactions where it is simultaneously both a customer and a vendor with the same counterparty or in which it purchases multiple products and/or services, or settles outstanding items contemporaneous with the purchase of a product or service from a single counterparty. The Company's policy for accounting for each transaction negotiated contemporaneously is to record each deliverable of the transaction based on its best estimate of selling price in a manner consistent with that used to determine the price to sell each deliverable on a standalone basis. In determining the fair value of the respective deliverable, the Company will utilize quoted market prices (as available), historical transactions or comparable transactions.
F-46
NOTES TO CONSOLIDATED FINANCIAL STATEMENTS (Continued)
(Dollars in thousands, except share and per share amounts)
NOTE 2. SUMMARY OF SIGNIFICANT ACCOUNTING POLICIES (Continued)
Gross Versus Net Revenue Recognition
In the normal course of business, the Company is assessed non-income related taxes by governmental authorities, including franchising authorities (generally under multi-year agreements), and collects such taxes from its customers. The Company's policy is that, in instances where the tax is being assessed directly on the Company, amounts paid to the governmental authorities and amounts received from the customers are recorded on a gross basis. That is, amounts paid to the governmental authorities are recorded as programming and other direct costs and amounts received from the customer are recorded as revenue. For the year ended December 31, 2016, the amount of franchise fees and certain other taxes and fees included as a component of revenue aggregated $154,732.
Technical and Operating Expenses
Costs of revenue related to sales of services are classified as "programming and other direct costs" in the accompanying consolidated statement of operations.
Programming Costs
Programming expenses related to the Company's video service represent fees paid to programming distributors to license the programming distributed to subscribers. This programming is acquired generally under multi-year distribution agreements, with rates usually based on the number of subscribers that receive the programming. If there are periods when an existing distribution agreement has expired and the parties have not finalized negotiations of either a renewal of that agreement or a new agreement for certain periods of time, the Company continues to carry and pay for these services until execution of definitive replacement agreements or renewals. The amount of programming expense recorded during the interim period is based on the Company's estimates of the ultimate contractual agreement expected to be reached, which is based on several factors, including previous contractual rates, customary rate increases and the current status of negotiations. Such estimates are adjusted as negotiations progress until new programming terms are finalized.
In addition, the Company has received, or may receive, incentives from programming distributors for carriage of the distributors' programming. The Company generally recognizes these incentives as a reduction of programming costs in "programming and other direct costs", generally over the term of the distribution agreement.
Advertising Expenses
Advertising costs are charged to expense when incurred and are reflected in "other operating expenses" in the accompanying consolidated statement of operations. Advertising costs amounted to $135,513 for the year ended December 31, 2016.
Share-Based Compensation
Share-based compensation cost relates to awards of units in a carried unit plan. For carried interest units, the Company measures share-based compensation cost at the grant date fair value and recognizes the expense over the requisite service period or when it is probable any related performance condition will be met. For carried interest units with graded vesting requirement, compensation cost is recognized on an accelerated method under the graded vesting method over the requisite service period
F-47
NOTES TO CONSOLIDATED FINANCIAL STATEMENTS (Continued)
(Dollars in thousands, except share and per share amounts)
NOTE 2. SUMMARY OF SIGNIFICANT ACCOUNTING POLICIES (Continued)
for the carried interest unit. Carried interest units that vest entirely at the end of the vesting requirement are expensed on a straight-line basis.
The Company estimates the fair value of carried interest units using an option pricing model. Key inputs that are used in applying the option pricing method are total equity value, equity volatility, risk free rate and time to liquidity event. The estimate of total equity value is determined using a combination of the income approach, which incorporates cash flow projections that are discounted at an appropriate rate, and the market approach, which involves applying a market multiple to the Company's projected operating results. The Company estimates volatility based on the historical equity volatility of comparable publicly-traded companies. Because there has been no public market for our equity prior to this offering, the estimates and assumptions the Company uses in the share-based compensation valuations are highly complex and subjective. Following the offering, such subjective valuations and estimates will no longer be necessary because we will rely on the market price of the Company's common stock to determine the fair value of share-based compensation awards. See Note 14 to the consolidated financial statements for additional information about our share-based compensation.
Income Taxes
The Company's provision for income taxes is based on current period income, changes in deferred tax assets and liabilities and changes in estimates with regard to uncertain tax positions. Deferred tax assets are subject to an ongoing assessment of realizability. The Company provides deferred taxes for the outside basis difference of its investment in partnerships.
Cash and Cash Equivalents
The Company's cash investments are placed with money market funds and financial institutions that are investment grade as rated by Standard & Poor's and Moody's Investors Service. The Company selects money market funds that predominantly invest in marketable, direct obligations issued or guaranteed by the United States government or its agencies, commercial paper, fully collateralized repurchase agreements, certificates of deposit, and time deposits.
The Company considers the balance of its investment in funds that substantially hold securities that mature within three months or less from the date the fund purchases these securities to be cash equivalents. The carrying amount of cash and cash equivalents either approximates fair value due to the short-term maturity of these instruments or are at fair value.
Accounts Receivable
Accounts receivable are recorded at net realizable value. The Company periodically assesses the adequacy of valuation allowances for uncollectible accounts receivable by evaluating the collectability of outstanding receivables and general factors such as historical collection experience, length of time individual receivables are past due, and the economic and competitive environment.
F-48
NOTES TO CONSOLIDATED FINANCIAL STATEMENTS (Continued)
(Dollars in thousands, except share and per share amounts)
NOTE 2. SUMMARY OF SIGNIFICANT ACCOUNTING POLICIES (Continued)
Investments
Investment securities and investment securities pledged as collateral are classified as trading securities and are stated at fair value with realized and unrealized holding gains and losses included in net income.
Long-Lived Assets and Amortizable Intangible Assets
Property, plant and equipment, including construction materials, are carried at cost, and include all direct costs and certain indirect costs associated with the construction of cable systems, and the costs of new equipment installations. Equipment under capital leases is recorded at the present value of the total minimum lease payments. Depreciation on equipment is calculated on the straight-line basis over the estimated useful lives of the assets or, with respect to equipment under capital leases and leasehold improvements, amortized over the shorter of the lease term or the assets' useful lives and reported in depreciation and amortization (including impairments) in the consolidated statements of operations.
The Company capitalizes certain internal and external costs incurred to acquire or develop internal-use software. Capitalized software costs are amortized over the estimated useful life of the software and reported in depreciation and amortization (including impairments).
Customer relationships, trade names and other intangibles established in connection with acquisitions that are finite-lived are amortized in a manner that reflects the pattern in which the projected net cash inflows to the Company are expected to occur, such as the sum of the years' digits method, or when such pattern does not exist, using the straight-line basis over their respective estimated useful lives.
The Company reviews its long-lived assets (property, plant and equipment, and intangible assets subject to amortization that arose from acquisitions) for impairment whenever events or circumstances indicate that the carrying amount of an asset may not be recoverable. If the sum of the expected cash flows, undiscounted and without interest, is less than the carrying amount of the asset, an impairment loss is recognized as the amount by which the carrying amount of the asset exceeds its fair value.
Goodwill and Indefinite-Lived Intangible Assets
Goodwill and the value of franchises, trademarks, and certain other intangibles acquired in purchase business combinations which have indefinite useful lives are not amortized. Rather, such assets are tested for impairment annually or upon the occurrence of a triggering event.
The Company assesses qualitative factors for its reporting units that carry goodwill. If the qualitative assessment results in a conclusion that it is more likely than not that the fair value of a reporting unit exceeds the carrying value, then no further testing is performed for that reporting unit.
When the qualitative assessment is not used, or if the qualitative assessment is not conclusive and it is necessary to calculate the fair value of a reporting unit, then the impairment analysis for goodwill is performed at the reporting unit level using a two-step approach. The first step of the goodwill impairment test is used to identify potential impairment by comparing the fair value of the reporting unit with its carrying amount, including goodwill utilizing an enterprise-value based premise approach. If the carrying amount of the reporting unit exceeds its fair value, the second step of the goodwill impairment test is performed to measure the amount of goodwill impairment loss, if any. The second
F-49
NOTES TO CONSOLIDATED FINANCIAL STATEMENTS (Continued)
(Dollars in thousands, except share and per share amounts)
NOTE 2. SUMMARY OF SIGNIFICANT ACCOUNTING POLICIES (Continued)
step of the goodwill impairment test compares the implied fair value of the reporting unit's goodwill with the carrying amount of that goodwill. If the carrying amount of the reporting unit's goodwill exceeds the implied fair value of that goodwill, an impairment loss is recognized in an amount equal to that excess. The implied fair value of goodwill is determined in the same manner as the amount of goodwill which would be recognized in a business combination.
The Company assesses qualitative factors to determine whether it is necessary to perform the one-step quantitative identifiable indefinite-lived intangible assets impairment test. This quantitative test is required only if the Company concludes that it is more likely than not that a unit of accounting's fair value is less than its carrying amount. When the qualitative assessment is not used, or if the qualitative assessment is not conclusive, the impairment test for other intangible assets not subject to amortization requires a comparison of the fair value of the intangible asset with its carrying value. If the carrying value of the indefinite-lived intangible asset exceeds its fair value, an impairment loss is recognized in an amount equal to that excess.
Deferred Financing Costs
Deferred financing costs are being amortized to interest expense using the effective interest method over the terms of the related debt.
Derivative Financial Instruments
The Company accounts for derivative financial instruments as either assets or liabilities measured at fair value. The Company uses derivative instruments to manage its exposure to market risks from changes in certain equity prices and interest rates and does not hold or issue derivative instruments for speculative or trading purposes. These derivative instruments are not designated as hedges, and changes in the fair values of these derivatives are recognized in the statement of operations as gains (losses) on derivative contracts.
Commitments and Contingencies
Liabilities for loss contingencies arising from claims, assessments, litigation, fines and penalties and other sources are recorded when the Company believes it is probable that a liability has been incurred and the amount of the contingency can be reasonably estimated.
Recently Adopted Accounting Pronouncements
In November 2016, the FASB issued ASU No. 2016-18, Statement of Cash Flows (Topic 230): Restricted Cash, which requires that the statement of cash flows disclose the change during the period in the total of cash, cash equivalents, restricted cash and restricted cash equivalents. Restricted cash should be included with cash and cash equivalents when reconciling the beginning-of-period and end-of period total amounts shown on the statement of cash flows. ASU No. 2016-18 provides specific guidance on the presentation of restricted cash in the statement of cash flows. The new guidance was adopted as of December 31, 2016.
In November 2015, the Financial Accounting Standards Board ("FASB") issued Accounting Standards Update ("ASU") No. 2015-17 (Topic 740), Balance Sheet Classification of Deferred Taxes. This ASU amends existing guidance to require the presentation of deferred tax liabilities and assets as
F-50
NOTES TO CONSOLIDATED FINANCIAL STATEMENTS (Continued)
(Dollars in thousands, except share and per share amounts)
NOTE 2. SUMMARY OF SIGNIFICANT ACCOUNTING POLICIES (Continued)
noncurrent within a classified statement of financial position. ASU No. 2015-17 was adopted by the Company in the fourth quarter 2016 and was applied prospectively to all deferred tax liabilities and assets.
In September 2015, the FASB issued ASU No. 2015-16, Simplifying the Accounting for Measurement-Period Adjustments, which requires that an acquirer recognize adjustments to provisional amounts that are identified during the measurement period in the reporting period in which the adjustment amounts are determined. Prior to the issuance of the standard, entities were required to retrospectively apply adjustments made to provisional amounts recognized in a business combination. ASU No. 2015-16 was adopted by the Company on January 1, 2016.
In April 2015, the FASB issued ASU No. 2015-05, Intangibles—Goodwill and Other—Internal-Use Software (Subtopic 350-40): Customer's Accounting for Fees Paid in a Cloud Computing Arrangement. ASU No. 2015-05 provides guidance to customers about whether a cloud computing arrangement includes a software license. If a cloud computing arrangement includes a software license, then the customer should account for the software license element of the arrangement consistent with the acquisition of other software licenses. If a cloud computing arrangement does not include a software license, the customer should account for the arrangement as a service contract. ASU No. 2015-05 was adopted by the Company on January 1, 2016 and did not have a material impact on the Company's consolidated financial statements.
In April 2015, the FASB issued ASU No. 2015-03, Simplifying the Presentation of Debt Issuance Costs, which requires debt issuance costs to be presented in the balance sheet as a direct deduction from the carrying value of the associated debt liability, consistent with the presentation of a debt discount. In August 2015, the FASB issued ASU No. 2015-15, Presentation and Subsequent Measurement of Debt Issuance Costs Associated with Line-of-Credit Arrangements, which clarifies the treatment of debt issuance costs from line-of-credit arrangements after adoption of ASU No. 2015-03. ASU No. 2015-15 clarifies that the Securities and Exchange Commission staff would not object to an entity deferring and presenting debt issuance costs as an asset and subsequently amortizing the deferred debt issuance costs ratably over the term of the line-of-credit arrangement, regardless of whether there are any outstanding borrowings on the line-of-credit arrangement. ASU No. 2015-03 was adopted by the Company on January 1, 2016.
In August 2014, the FASB issued ASU No. 2014-15, Disclosures of Uncertainties about an Entity's Ability to Continue as a Going Concern, which requires management to evaluate whether there are conditions or events that raise substantial doubt about the entity's ability to continue as a going concern, and to provide certain disclosures when it is probable that the entity will be unable to meet its obligations as they become due within one year after the date that the financial statements are issued. ASU No. 2014-15 was adopted by the Company for the annual period ended December 31, 2016.
In June 2014, the FASB issued ASU No. 2014-12, Compensation—Stock Compensation (Topic 718): Accounting for Share-Based Payments When the Terms of an Award Provide That a Performance Target Could Be Achieved After the Requisite Service Period. ASU No. 2014-12 requires that a performance target that affects vesting and that could be achieved after the requisite service period be treated as a performance condition. Entities may apply the amendments in this ASU either: (a) prospectively to all awards granted or modified after the effective date; or (b) retrospectively to all awards with performance targets that are outstanding as of the beginning of the earliest annual period presented in the financial statements and to all new or modified awards thereafter. ASU No. 2014-12
F-51
NOTES TO CONSOLIDATED FINANCIAL STATEMENTS (Continued)
(Dollars in thousands, except share and per share amounts)
NOTE 2. SUMMARY OF SIGNIFICANT ACCOUNTING POLICIES (Continued)
was adopted by the Company on January 1, 2016 on a prospective basis and did not have any impact on the Company's consolidated financial statements.
Recently Issued But Not Yet Adopted Accounting Pronouncements
In May 2014, the FASB issued ASU No. 2014-09, Revenue from Contracts with Customers, requiring an entity to recognize the amount of revenue to which it expects to be entitled for the transfer of promised goods or services to customers. ASU No. 2014-09 will replace most existing revenue recognition guidance in GAAP when it becomes effective and allows the use of either the retrospective or cumulative effect transition method. In August 2015, the FASB issued ASU No. 2015-14 that approved deferring the effective date by one year so that ASU No. 2014-09 would become effective for the Company on January 1, 2018. The FASB also approved, in July 2015, permitting the early adoption of ASU No. 2014-09, but not before the original effective date for the Company of January 1, 2017.
In December 2016, the FASB issued ASU No. 2016-20, Technical Corrections and Improvements to Topic 606, Revenue from Contracts with Customers, in order to clarify the Codification and to correct any unintended application of the guidance. These items are not expected to have a significant effect on the current accounting standard. The amendments in this update affect the guidance in ASU No. 2014-09, which is not yet effective. ASU No. 2014-09 will be effective, reflecting the one-year deferral, for interim and annual periods beginning after December 15, 2017 (January 1, 2018 for the Company). Early adoption of the standard is permitted but not before the original effective date. Companies can transition to the standard either retrospectively or as a cumulative-effect adjustment as of the date of adoption. The Company is in the process of evaluating the impact that the adoption of ASU No. 2014-09 will have on its consolidated financial statements and selecting the method of transition to the new standard. We currently expect the adoption to impact the timing of the recognition of residential installation revenue and the recognition of commission expenses.
In August 2016, the FASB issued ASU No. 2016-15, Statement of Cash Flows (Topic 230): Classification of Certain Cash Receipts and Cash Payments which clarifies how entities should classify certain cash receipts and cash payments on the statement of cash flows. ASU No. 2016-15 also clarifies how the predominance principle should be applied when cash receipts and cash payments have aspects of more than one class of cash flows. The new guidance becomes effective for the Company on January 1, 2018 with early adoption permitted and will be applied retrospectively. The Company has not yet completed the evaluation of the effect that ASU No. 2016-15 will have on its consolidated financial statements.
In March 2016, the FASB issued ASU 2016-09, Compensation—Stock Compensation: Improvements to Employee Share-Based Payment Accounting, which provides simplification of income tax accounting for share-based payment awards. The new guidance becomes effective for the Company on January 1, 2017 with early adoption permitted. Amendments related to the timing of when excess tax benefits are recognized, minimum statutory withholding requirements, forfeitures, and intrinsic value will be applied using the modified retrospective transition method. Amendments requiring recognition of excess tax benefits and tax deficiencies in the income statement and the practical expedient for estimating expected term will be applied prospectively. The Company may elect to apply the amendments related to the presentation of excess tax benefits on the statement of cash flows using either a prospective transition method or a retrospective transition method. In connection with the
F-52
NOTES TO CONSOLIDATED FINANCIAL STATEMENTS (Continued)
(Dollars in thousands, except share and per share amounts)
NOTE 2. SUMMARY OF SIGNIFICANT ACCOUNTING POLICIES (Continued)
adoption on January 1, 2017, a deferred tax asset of approximately $309,000 for previously unrealized excess tax benefits will be recognized with the offset recorded to accumulated deficit.
In February 2016, the FASB issued ASU 2016-02, Leases, which increases transparency and comparability by recognizing a lessee's rights and obligations resulting from leases by recording them on the balance sheet as lease assets and lease liabilities. The new guidance becomes effective for the Company on January 1, 2019 with early adoption permitted and will be applied using the modified retrospective method. The Company has not yet completed the evaluation of the effect that ASU No. 2016-02 will have on its consolidated financial statements.
In March 2017, the FASB issued ASU No. 2017-07 Compensation—Retirement Benefits (Topic 715). ASU No. 2017-07 requires that an employer disaggregate the service cost component from the other components of net benefit cost. It also provides guidance on how to present the service cost component and the other components of net benefit cost in the income statement and what component of net benefit cost is eligible for capitalization. ASU No. 2017-07 becomes effective for the Company on January 1, 2018 with early adoption permitted and will be applied retrospectively. The Company has not yet completed the evaluation of the effect that ASU No. 2017-07 will have on its consolidated financial statements.
Common Stock
At December 31, 2016, the Company had 100 shares of common stock with a par value of $.01 issued and outstanding.
Net Loss Per Share
Basic and diluted net loss per share have been computed by dividing the net loss by the weighted-average number of shares of common stock outstanding during the period. Diluted net loss per share excludes the effects of common stock equivalents as they are anti-dilutive.
Concentrations of Credit Risk
Financial instruments that may potentially subject the Company to a concentration of credit risk consist primarily of cash and cash equivalents and trade account receivables. The Company monitors the financial institutions and money market funds where it invests its cash and cash equivalents with diversification among counterparties to mitigate exposure to any single financial institution. The Company's emphasis is primarily on safety of principal and liquidity and secondarily on maximizing the yield on its investments. Management believes that no significant concentration of credit risk exists with respect to its cash and cash equivalents balances because of its assessment of the creditworthiness and financial viability of the respective financial institutions.
The Company did not have a single customer that represented 10% or more of its consolidated revenues for the year ended December 31, 2016, or 10% or more of its consolidated net trade receivables at December 31, 2016.
NOTE 3. BUSINESS COMBINATION
As discussed in Note 1, the Company completed the Cablevision Acquisition on June 21, 2016 and the Cequel Acquisition on December 21, 2015. The acquisitions were accounted for as a business combinations in accordance with ASC Topic 805. Accordingly, the Company recorded the fair value of the assets and liabilities assumed at the date of the acquisitions.
F-53
NOTES TO CONSOLIDATED FINANCIAL STATEMENTS (Continued)
(Dollars in thousands, except share and per share amounts)
NOTE 3. BUSINESS COMBINATION (Continued)
The following table provides the preliminary allocation of the total purchase price of $9,958,323 to the identifiable tangible and intangible assets and liabilities of Cablevision based on preliminary fair value information currently available, which is subject to change within the measurement period (up to one year from the acquisition date). The table also summarizes the allocation of the total purchase price of $3,973,528 to the identifiable tangible and intangible assets and liabilities based on fair value information in connection with the Cequel Acquisition. The remaining useful lives represent the period over which acquired tangible and intangible assets with a finite life are being depreciated or amortized.
| |
Cablevision | Cequel | ||||||||
|---|---|---|---|---|---|---|---|---|---|---|
| |
Preliminary Fair Values |
Estimated Useful Lives |
Fair Values | Estimated Useful Lives |
||||||
Current assets |
$ | 1,923,071 | $ | 161,874 | ||||||
Accounts receivable |
271,305 | 180,422 | ||||||||
Property, plant and equipment |
4,864,621 | 2 - 18 years | 2,107,220 | 3 - 13 years | ||||||
Goodwill |
5,838,959 | 2,153,741 | ||||||||
Cable television franchise rights |
8,113,575 | Indefinite-lived | 4,906,506 | Indefinite-lived | ||||||
Customer relationships |
4,850,000 | 8 to 18 years | 1,075,884 | 8 years | ||||||
Trade names |
1,010,000 | 12 years | 56,782 | 2 years | ||||||
Amortizable intangible assets |
23,296 | 1 - 15 years | 3,356 | 11 years | ||||||
Other non-current assets |
748,998 | 73,811 | ||||||||
Current liabilities |
(2,305,954 | ) | (534,662 | ) | ||||||
Long-term debt |
(8,355,386 | ) | (4,717,305 | ) | ||||||
Deferred income taxes |
(6,834,807 | ) | (1,492,017 | ) | ||||||
Other non-current liabilities |
(189,355 | ) | (2,084 | ) | ||||||
| | | | | | | | | | | |
Total |
$ | 9,958,323 | $ | 3,973,528 | ||||||
| | | | | | | | | | | |
| | | | | | | | | | | |
| | | | | | | | | | | |
The fair value of customer relationships and cable television franchises were valued using derivations of the "income" approach. The future expected earnings from these assets were discounted to their present value equivalent.
Trade names were valued using the relief from royalty method, which is based on the present value of the royalty payments avoided as a result of the company owning the intangible asset.
The basis for the valuation methods was the Company's projections. These projections were based on management's assumptions including among others, penetration rates for video, high speed data, and voice; revenue growth rates; operating margins; and capital expenditures. The assumptions are derived based on the Company's and its peers' historical operating performance adjusted for current and expected competitive and economic factors surrounding the cable industry. The discount rates used in the analysis are intended to reflect the risk inherent in the projected future cash flows generated by the respective intangible asset. The value is highly dependent on the achievement of the future financial results contemplated in the projections. The estimates and assumptions made in the valuation are inherently subject to significant uncertainties, many of which are beyond the Company's control, and there is no assurance that these results can be achieved. The primary assumptions for which there is a reasonable possibility of the occurrence of a variation that would have significantly affected the value include the assumptions regarding revenue growth, programming expense growth rates, the amount and timing of capital expenditures and the discount rate utilized.
F-54
NOTES TO CONSOLIDATED FINANCIAL STATEMENTS (Continued)
(Dollars in thousands, except share and per share amounts)
NOTE 3. BUSINESS COMBINATION (Continued)
In establishing fair value for the vast majority of the acquired property, plant and equipment, the cost approach was utilized. The cost approach considers the amount required to replace an asset by constructing or purchasing a new asset with similar utility, then adjusts the value in consideration of physical depreciation, and functional and economic obsolescence as of the appraisal date. The cost approach relies on management's assumptions regarding current material and labor costs required to rebuild and repurchase significant components of our property, plant and equipment along with assumptions regarding the age and estimated useful lives of our property, plant and equipment.
The estimates of expected useful lives take into consideration the effects of contractual relationships, customer attrition, eventual development of new technologies and market competition.
Long-term debt assumed was valued using quoted market prices (Level 2). The carrying value of most other assets and liabilities approximated fair value as of the acquisition dates.
As a result of applying business combination accounting, the Company recorded goodwill, which represented the excess of organization value over amounts assigned to the other identifiable tangible and intangible assets arising from expectations of future operational performance and cash generation.
The following table presents the unaudited pro forma revenue, loss from continuing operations and net loss for the year ended December 31, 2016 as if the Cablevision Acquisition had occurred on January 1, 2016:
Revenue |
$ | 9,154,816 | ||
| | | | | |
| | | | | |
| | | | | |
Net loss |
$ | (721,257 | ) | |
| | | | | |
| | | | | |
| | | | | |
The pro forma results presented above include the impact of additional amortization expense related to the identifiable intangible assets recorded in connection with the Cablevision Acquisition, additional depreciation expense related to the fair value adjustment to property, plant and equipment and the incremental interest resulting from the issuance of debt to fund the acquisitions, net of the reversal of interest and amortization of deferred financing costs related to credit facilities that were repaid on the date of the Cablevision Acquisition, the accretion/ amortization of fair value adjustments associated with the long-term debt acquired and the remeasurement of deferred taxes associated with the acquisition of Cablevision.
NOTE 4. SUPPLEMENTAL CASH FLOW INFORMATION
During 2016, the Company's non-cash investing and financing activities and other supplemental data were as follows:
Non-Cash Investing and Financing Activities: |
||||
Continuing Operations: |
||||
Property and equipment accrued but unpaid |
$ | 155,653 | ||
Distributions declared but not paid |
79,617 | |||
Notes payable to vendor |
12,449 | |||
Deferred financing costs accrued but unpaid |
2,570 | |||
Supplemental Data: |
||||
Cash interest paid |
1,092,114 | |||
Income taxes paid, net |
1,538 |
F-55
NOTES TO CONSOLIDATED FINANCIAL STATEMENTS (Continued)
(Dollars in thousands, except share and per share amounts)
NOTE 5. RESTRUCTURING AND OTHER EXPENSE
Restructuring
During 2016, the Company commenced its restructuring initiatives (the "2016 Restructuring Plan") that are intended to simplify the Company's organizational structure. The 2016 Restructuring Plan resulted in charges of $215,420 associated with the elimination of positions primarily in corporate, administrative and infrastructure functions across the Optimum and Suddenlink business segments and estimated charges of $11,157 associated with facility realignment and other costs.
The following table summarizes the activity for the 2016 Restructuring Plan:
| |
Severance and Other Employee Related Costs |
Facility Realignment and Other Costs |
Total | |||||||
|---|---|---|---|---|---|---|---|---|---|---|
Restructuring charges |
$ | 215,420 | $ | 11,157 | $ | 226,577 | ||||
Payments and other |
(113,301 | ) | (2,760 | ) | (116,061 | ) | ||||
| | | | | | | | | | | |
Accrual balance at December 31, 2016 |
$ | 102,119 | $ | 8,397 | $ | 110,516 | ||||
| | | | | | | | | | | |
| | | | | | | | | | | |
| | | | | | | | | | | |
In addition to the charges included in the table above, the Company recorded net restructuring credits of $27 relating to changes to the Company's previous estimates recorded in connection with the Company's prior restructuring plans.
Other Expense
The Company incurred transaction costs of $13,845 for the year ended December 31, 2016 related to the Cablevision Acquisition and Cequel Acquisition which are reflected in restructuring and other expense in the consolidated statement of operations.
NOTE 6. PROPERTY, PLANT AND EQUIPMENT
Costs incurred in the construction of the Company's cable systems, including line extensions to, and upgrade of, the Company's hybrid fiber/coaxial infrastructure, initial placement of the feeder cable to connect a customer that had not been previously connected, and headend facilities are capitalized. These costs consist of materials, subcontractor labor, direct consulting fees, and internal labor and related costs associated with the construction activities. The internal costs that are capitalized consist of salaries and benefits of the Company's employees and the portion of facility costs, including rent, taxes, insurance and utilities, that supports the construction activities. These costs are depreciated over the estimated life of the plant (10 to 25 years) and headend facilities (4 to 25 years). Costs of operating the plant and the technical facilities, including repairs and maintenance, are expensed as incurred.
Installation costs associated with the initial deployment of new customer premise equipment ("CPE") necessary to provide video, high-speed data or voice services are also capitalized. These costs include materials, subcontractor labor, internal labor, and other related costs associated with the connection activities. The departmental activities supporting the connection process are tracked through specific metrics, and the portion of departmental costs that is capitalized is determined through a time weighted activity allocation of costs incurred based on time studies used to estimate the average time spent on each activity. These installation costs are amortized over the estimated useful lives of the CPE necessary to provide video, high-speed data or voice services. In circumstances where CPE tracking is not available, the Company estimates the amount of capitalized installation costs based on whether or
F-56
NOTES TO CONSOLIDATED FINANCIAL STATEMENTS (Continued)
(Dollars in thousands, except share and per share amounts)
NOTE 6. PROPERTY, PLANT AND EQUIPMENT (Continued)
not the business or residence had been previously connected to the network. These installation costs are depreciated over their estimated useful life of 4-8 years. The portion of departmental costs related to disconnecting services and removing CPE from a customer, costs related to connecting CPE that has been previously connected to the network and repair and maintenance are expensed as incurred.
The estimated useful lives assigned to our property, plant and equipment are reviewed on an annual basis or more frequently if circumstances warrant and such lives are revised to the extent necessary due to changing facts and circumstances. Any changes in estimated useful lives are reflected prospectively.
Property, plant and equipment (including equipment under capital leases) as of December 31, 2016 consist of the following assets, which are depreciated or amortized on a straight-line basis over their estimated useful lives.
| |
|
Estimated Useful Lives(a) |
|||
|---|---|---|---|---|---|
Customer equipment |
$ | 871,049 | 3 to 5 years | ||
Headends and related equipment |
1,482,631 | 4 to 25 years | |||
Infrastructure |
3,740,494 | 3 to 25 years | |||
Equipment and software |
735,012 | 3 to 10 years | |||
Construction in progress (including materials and supplies) |
84,321 | ||||
Furniture and fixtures |
45,576 | 5 to 12 years | |||
Transportation equipment |
135,488 | 5 to 10 years | |||
Buildings and building improvements |
390,337 | 10 to 40 years | |||
Leasehold improvements |
104,309 | Term of lease | |||
Land |
47,715 | ||||
| | | | | | |
|
7,636,932 | ||||
Less accumulated depreciation and amortization |
(1,039,297 | ) | |||
| | | | | | |
|
$ | 6,597,635 | |||
| | | | | | |
| | | | | | |
| | | | | | |
- (a)
- The estimated useful lives presented reflect the period of depreciation and amortization for the purchase of assets in new condition and do not reflect the remaining useful lives of the assets at December 31, 2016.
For the year ended December 31, 2016, the Company capitalized certain costs aggregating $75,804, related to the acquisition and development of internal use software, which are included in the table above.
Depreciation expense on property, plant and equipment (including capital leases) for the year ended December 31, 2016 amounted to $1,046,896.
At December 31, 2016, the gross amount of buildings and equipment and related accumulated amortization recorded under capital leases were as follows:
Buildings and equipment |
$ | 53,833 | ||
Less accumulated amortization |
(6,306 | ) | ||
| | | | | |
|
$ | 47,527 | ||
| | | | | |
| | | | | |
| | | | | |
F-57
NOTES TO CONSOLIDATED FINANCIAL STATEMENTS (Continued)
(Dollars in thousands, except share and per share amounts)
NOTE 7. OPERATING LEASES
The Company leases certain office, production, and transmission facilities under terms of leases expiring at various dates through 2035. The leases generally provide for escalating rentals over the term of the lease plus certain real estate taxes and other costs or credits. Costs associated with such operating leases are recognized on a straight-line basis over the initial lease term. The difference between rent expense and rent paid is recorded as deferred rent. In addition, the Company rents space on utility poles for its operations. The Company's pole rental agreements are for varying terms, and management anticipates renewals as they expire. Rent expense, including pole rentals, for the year ended December 31, 2016 amounted to $65,881.
The minimum future annual payments for all operating leases (with initial or remaining terms in excess of one year) during the next five years and thereafter, including pole rentals from January 1, 2017 through December 31, 2021, at rates now in force are as follows:
2017 |
$ | 76,513 | ||
2018 |
70,242 | |||
2019 |
61,986 | |||
2020 |
56,953 | |||
2021 |
53,658 | |||
Thereafter |
142,655 |
NOTE 8. INTANGIBLE ASSETS
The following table summarizes information relating to the Company's acquired intangible assets as of December 31, 2016:
| |
Amortizable Intangible Assets | ||||||||||
|---|---|---|---|---|---|---|---|---|---|---|---|
| |
Gross Carrying Amount |
Accumulated Amortization |
Net Carrying Amount |
Estimated Useful Lives |
|||||||
Customer relationships |
$ | 5,925,884 | $ | (580,276 | ) | $ | 5,345,608 | 8 to 18 years | |||
Trade names |
1,066,783 | (83,397 | ) | 983,386 | 2 to 12 years | ||||||
Other amortizable intangibles |
26,743 | (3,093 | ) | 23,650 | 1 to 15 years | ||||||
| | | | | | | | | | | | |
|
$ | 7,019,410 | $ | (666,766 | ) | $ | 6,352,644 | ||||
| | | | | | | | | | | | |
| | | | | | | | | | | | |
| | | | | | | | | | | | |
Amortization expense for the year ended December 31, 2016 aggregated $653,410.
The following table sets forth the estimated amortization expense on intangible assets for the periods presented:
Estimated amortization expense |
||||
Year Ending December 31, 2017 |
$ | 928,597 | ||
Year Ending December 31, 2018 |
834,312 | |||
Year Ending December 31, 2019 |
758,189 | |||
Year Ending December 31, 2020 |
681,610 | |||
Year Ending December 31, 2021 |
604,456 |
F-58
NOTES TO CONSOLIDATED FINANCIAL STATEMENTS (Continued)
(Dollars in thousands, except share and per share amounts)
NOTE 8. INTANGIBLE ASSETS (Continued)
The following table summarizes information relating to the Company's acquired indefinite-lived intangible assets as of December 31, 2016:
| |
Optimum | Suddenlink | Total | |||||||
|---|---|---|---|---|---|---|---|---|---|---|
Cable television franchises |
$ | 8,113,575 | $ | 4,906,506 | $ | 13,020,081 | ||||
Goodwill |
5,838,959 | 2,153,741 | 7,992,700 | |||||||
| | | | | | | | | | | |
Total |
$ | 13,952,534 | $ | 7,060,247 | $ | 21,012,781 | ||||
| | | | | | | | | | | |
| | | | | | | | | | | |
| | | | | | | | | | | |
The carrying amount of goodwill is presented below:
Gross goodwill as of January 1, 2016 |
$ | 2,040,402 | ||
Goodwill recorded in connection with Cablevision Acquisition |
5,838,959 | |||
Adjustments to purchase accounting relating to Cequel Acquisition |
113,339 | |||
| | | | | |
Net goodwill as of December 31, 2016 |
$ | 7,992,700 | ||
| | | | | |
| | | | | |
| | | | | |
NOTE 9. DEBT
CSC Holdings Credit Facilities
In connection with the Cablevision Acquisition, in October 2015, Neptune Finco Corp. ("Finco"), a wholly-owned subsidiary of the Company formed to complete the financing described herein and the merger with CSC Holdings, borrowed an aggregate principal amount of $3,800,000 under a term loan facility (the "Term Credit Facility") and entered into revolving loan commitments in an aggregate principal amount of $2,000,000 (the "Revolving Credit Facility" and, together with the Term Credit Facility, the "Credit Facilities"). The Term Credit Facility was to mature on October 9, 2022 and the Revolving Credit Facility was to mature on October 9, 2020 (see discussion below regarding the extension amendments). In addition, on June 21, 2016 and July 21, 2016, the Company entered into incremental loan assumption agreements whereby the Revolving Credit Facility was increased by $70,000 and $35,000, respectively, to $2,105,000.
Finco also issued $1,800,000 aggregate principal amount of 10.125% senior notes due 2023 (the "2023 Notes"), $2,000,000 aggregate principal amount of 10.875% senior notes due 2025 (the "2025 Notes"), and $1,000,000 aggregate principal amount of 6.625% senior guaranteed notes due 2025 (the "2025 Guaranteed Notes") (collectively the "Cablevision Acquisition Notes").
On June 21, 2016, immediately following the Cablevision Acquisition, Finco merged with and into CSC Holdings, with CSC Holdings surviving the merger (the "CSC Holdings Merger"), and the Cablevision Acquisition Notes and the Credit Facilities became obligations of CSC Holdings. The 2025 Guaranteed Notes are guaranteed on a senior basis by each restricted subsidiary of CSC Holdings (other than CSC TKR, LLC and its subsidiaries, which own and operate the New Jersey cable television systems, Cablevision Lightpath, Inc. and any subsidiaries of CSC Holdings that are "Excluded Subsidiaries" under the indenture governing the 2025 Guaranteed Notes) (such subsidiaries, the "Initial Guarantors") and the obligations under the Credit Facilities are (i) guaranteed on a senior basis by each Initial Guarantor and (ii) secured on a first priority basis by capital stock held by CSC Holdings and the guarantors in certain subsidiaries of CSC Holdings, subject to certain exclusions and limitations.
F-59
NOTES TO CONSOLIDATED FINANCIAL STATEMENTS (Continued)
(Dollars in thousands, except share and per share amounts)
NOTE 9. DEBT (Continued)
Altice USA used the proceeds from the Term Credit Facility and the Cablevision Acquisition Notes, together with an equity contribution from Altice N.V. and its Co-Investors and existing cash at Cablevision, to (a) finance the Cablevision Acquisition, (b) refinance the credit agreement, dated as of April 17, 2013 (the "Previous Credit Facility"), among CSC Holdings, certain subsidiaries of CSC Holdings and the lenders party thereto ($2,030,699 outstanding at the date of the Cablevision Acquisition), (c) repay the senior secured credit agreement, dated as of October 12, 2012, among Newsday LLC, CSC Holdings, and the lenders party thereto (the "Previous Newsday Credit Facility") of $480,000, and (d) pay related fees and expenses.
The Credit Facilities permit CSC Holdings to request revolving loans, swing line loans or letters of credit from the revolving lenders, swingline lenders or issuing banks, as applicable, thereunder, from time to time prior to October 9, 2020, unless the commitments under the Revolving Credit Facility have been previously terminated.
There is also a commitment fee of 0.375% on undrawn amounts under the revolving credit facility.
On September 9, 2016, CSC Holdings entered into an amendment (the "Extension Amendment") to the Credit Facilities and the incremental loan assumption agreements dated June 21, 2016 and July 21, 2016 between CSC Holdings and certain lenders party thereto (the "Extending Lenders") pursuant to which each Extending Lender agreed to extend the maturity of its Term Credit Facility under the Credit Facilities to October 11, 2024 and to certain other amendments to the Credit Facilities. In October 2016, CSC Holdings used the net proceeds from the sale of $1,310,000 aggregate principal amount of 5.5% senior guaranteed notes due 2027 (the "2027 Guaranteed Notes") (after the deduction of fees and expenses) to prepay outstanding loans under the CSC Holdings Term Credit Facility that were not extended pursuant to the Extension Amendment. The total aggregate principal amount of the Term Credit Facility, after giving effect to the use of proceeds of the 2027 Guaranteed Notes, is $2,500,000 (the "Extended Term Loan"). The Extended Term Loan was effective on October 11, 2016. In connection with the prepayment of the Term Credit Facility, the Company wrote-off the deferred financing costs and the unamortized discount related to the existing term loan aggregating $102,894. Additionally, the Company recorded deferred financing costs and an original issue discount of $7,249 and $6,250, respectively, which are both being amortized to interest expense over the term of the Extended Term Loan.
On December 9, 2016, the Credit Facilities were amended to increase the availability under the Revolving Credit Facility from $2,105,000 to $2,300,000 and extend the maturity on $2,280,000 of this facility to November 30, 2021. The remaining $20,000 will mature on October 9, 2020.
The Credit Facilities require CSC Holdings to prepay outstanding term loans, subject to certain exceptions and deductions, with (i) 100% of the net cash proceeds of certain asset sales, subject to reinvestment rights and certain other exceptions, and (ii) commencing with the first full fiscal year after the consummation of the Cablevision Acquisition, a ratable share (based on the outstanding principal amount of the Extended Term Loan divided by the sum of the outstanding principal amount of all pari passu indebtedness and the Extended Term Loan) of 50% of the annual excess cash flow of CSC Holdings and its restricted subsidiaries, which will be reduced to 0% if the Consolidated Net Senior Secured Leverage Ratio of CSC Holdings is less than or equal to 4.5 to 1.
Under the Term Credit Facility, CSC Holdings was required to make and made scheduled quarterly payment of $9,500 beginning with the fiscal quarter ending September 30, 2016. Under the
F-60
NOTES TO CONSOLIDATED FINANCIAL STATEMENTS (Continued)
(Dollars in thousands, except share and per share amounts)
NOTE 9. DEBT (Continued)
Extended Term Loan, CSC Holdings is required to make scheduled quarterly payments equal to 0.25% of the principal amount of the Extended Term Loan, with the remaining balance scheduled to be paid on October 11, 2024, beginning with the fiscal quarter ending March 31, 2017.
The CSC Holdings Credit Facilities include negative covenants that are substantially similar to the negative covenants contained in the indentures under which the Cablevision Acquisition Notes were issued (see discussion below). The Credit Facilities include one financial maintenance covenant (solely for the benefit of the Revolving Credit Facility), consisting of a maximum Consolidated Net Senior Secured Leverage Ratio of 5.0 to 1, which will be tested on the last day of any fiscal quarter but only if on such day there are outstanding borrowings under the CSC Holdings Revolving Credit Facility (including swingline loans but excluding any cash collateralized letters of credit and undrawn letters of credit not to exceed $15,000). The CSC Holdings Credit Facilities contain customary representations, warranties and affirmative covenants. In addition, the CSC Holdings Credit Facilities contains restrictive covenants that limit, among other things, the ability of CSC Holdings and its subsidiaries to incur indebtedness, create liens, engage in mergers, consolidations and other fundamental changes, make investments or loans, engage in transactions with affiliates, pay dividends, and make acquisitions and dispose of assets. If an event of default occurs, the obligations under the CSC Holdings Credit Facilities may be accelerated.
CSC Holdings was in compliance with all of its financial covenants under the CSC Holdings Credit Facilities as of December 31, 2016.
Cequel Credit Facilities
In connection with the Cequel Acquisition, lenders holding (a) $290,000 of loans and commitments under the revolving credit facility under the old credit facility and (b) approximately $815,400 of loans under the term loan facility under the old credit facility consented to roll over, on a cashless basis, such lenders' loans and commitments under the old credit facility into loans and commitments of the same amount under a new credit facility (the "Cequel Credit Facility") made available to a subsidiary of Cequel effective upon the consummation of the Cequel Acquisition (the 'Cequel Credit Agreement"). Upon the closing of the Cequel Acquisition, the $290,000 of loans and commitments under the revolving credit facility under the old credit facility that lenders elected to rollover into the Cequel Credit Facility, plus $60,000 of new revolving commitments from other lenders, formed a new $350,000 revolving credit facility under the Cequel Credit Facility, and all remaining commitments under the then existing $500,000 revolving credit facility under the old credit facility were terminated.
The interest rate on the term loans outstanding under the Cequel Credit Facility equal the prime rate plus 2.25% or the LIBO rate plus 3.25%, with a LIBO rate floor of 1.00%, while the interest rate on the revolver loans equal the prime rate plus 2.25% or the LIBO rate plus 3.25%. The term loan facility requires quarterly repayments in annual amounts equal to 1.00% of the original principal amount, which commenced on March 31, 2016, with the remainder due at maturity. There is a commitment fee of 0.5% on undrawn amounts under the revolving credit facility.
The debt under the Cequel Credit Agreement is secured by a first priority security interest in the capital stock of Suddenlink, an indirect wholly-owned subsidiary of Cequel and substantially all of the present and future assets of Suddenlink and its restricted subsidiaries, and is guaranteed by the Cequel Communications Holdings II, LLC, an indirect wholly-owned subsidiary of Cequel (the "Parent
F-61
NOTES TO CONSOLIDATED FINANCIAL STATEMENTS (Continued)
(Dollars in thousands, except share and per share amounts)
NOTE 9. DEBT (Continued)
Guarantor") as well as all of Suddenlink's existing and future direct and indirect subsidiaries, subject to certain exceptions set forth in the Cequel Credit Agreement.
The Cequel Credit Agreement contains customary representations, warranties and affirmative covenants. In addition, the Cequel Credit Agreement contains restrictive covenants that limit, among other things, the ability of Suddenlink and its subsidiaries to incur indebtedness, create liens, engage in mergers, consolidations and other fundamental changes, make investments or loans, engage in transactions with affiliates, pay dividends, and make acquisitions and dispose of assets. The Cequel Credit Agreement also contains a maximum senior secured leverage maintenance covenant of 5.0 times EBITDA as defined in the Cequel Credit Agreement. Additionally, the Cequel Credit Agreement contains customary events of default, including failure to make payments, breaches of covenants and representations, cross defaults to other indebtedness, unpaid judgments, changes of control and bankruptcy events. The lenders' commitments to fund amounts under the revolving credit facility are subject to certain customary conditions.
Amendments to Cequel Credit Agreement
On October 25, 2016, an indirect wholly-owned subsidiary of Cequel entered into the First Amendment to the Cequel Credit Agreement, amending the credit agreement dated June 12, 2015, between the Company and certain lenders party thereto pursuant to which the applicable margin for the term loans outstanding under the Cequel Credit Facility was lowered by 25 basis points, the LIBO rate floor for the term loans outstanding under the Cequel Credit Facility was lowered by 25 basis points to 0.75% and the maturity date for the term loans outstanding under the Cequel Credit Facility was extended to January 15, 2025. The proceeds of $815,000 from the new term loan were used to repay the amount outstanding under the existing term loan of $809,327 and related fees and expenses. In connection with the extinguishment of the existing term loan, the Company recorded a loss on extinguishment of debt of $4,807, representing primarily the write-off of deferred financing costs related to the term loan. In connection with the First Amendment to the Cequel Credit Agreement, the Company recorded deferred financing costs of $2,092, which are being amortized to interest expense over the term of the loan.
On December 9, 2016, the Company entered into the Second Amendment to the Cequel Credit Agreement which extended the maturity on the revolver to November 30, 2021.
As of December 31, 2016, Cequel was in compliance with all of its financial covenants under the Cequel Credit Agreement.
F-62
NOTES TO CONSOLIDATED FINANCIAL STATEMENTS (Continued)
(Dollars in thousands, except share and per share amounts)
NOTE 9. DEBT (Continued)
The following table provides details of the Company's outstanding credit facility debt (net of unamortized financing costs and unamortized discounts):
| |
Maturity Date | Interest Rate |
Principal | Carrying Value(a) | ||||||||
|---|---|---|---|---|---|---|---|---|---|---|---|---|
CSC Holdings Restricted Group: |
||||||||||||
Revolving Credit Facility(b) |
November 30, 2021 | 4.07 | % | $ | 175,256 | $ | 145,013 | |||||
Term Credit Facility(c) |
October 11, 2024 | 3.88 | % | 2,500,000 | 2,486,874 | |||||||
Cequel: |
||||||||||||
Revolving Credit Facility(d) |
November 30, 2021 | — | — | — | ||||||||
Term Credit Facility |
January 15, 2025 | 3.88 | % | 815,000 | 812,903 | |||||||
| | | | | | | | | | | | | |
|
$ | 3,490,256 | 3,444,790 | |||||||||
| | | | | | | | | | | | | |
| | | | | | | | | | | | | |
| | | | | | | | | | | | | |
Less: Current portion |
33,150 | |||||||||||
| | | | | | | | | | | | | |
Long-term debt |
$ | 3,411,640 | ||||||||||
| | | | | | | | | | | | | |
| | | | | | | | | | | | | |
| | | | | | | | | | | | | |
- (a)
- The
unamortized discounts and deferred financing costs amounted to $45,466 at December 31, 2016.
- (b)
- Includes
$100,256 of credit facility debt incurred to finance the Cablevision Acquisition. See discussion above regarding the amendment to the revolving credit
facility entered into December 2016.
- (c)
- Represents
$3,800,000 principal amount of debt incurred to finance the Cablevision Acquisition, net of principal repayments made. See discussion above regarding the
Extension Amendment entered into September 2016.
- (d)
- At December 31, 2016, $17,031 of the revolving credit facility was restricted for certain letters of credit issued on behalf of the Company and $332,969 of the facility was undrawn and available, subject to covenant limitations.
During the twelve months ending December 31, 2017, the Company is required to make principal payments aggregating $25,000 under the CSC Holdings Term Credit Facility and $8,150 under the Cequel Term Credit Facility.
F-63
NOTES TO CONSOLIDATED FINANCIAL STATEMENTS (Continued)
(Dollars in thousands, except share and per share amounts)
NOTE 9. DEBT (Continued)
Senior Guaranteed Notes and Senior Notes and Debentures
The following table summarizes the Company's senior guaranteed notes, senior secured notes and senior notes and debentures as of December 31, 2016:
Issuer
|
Date Issued | Maturity Date | Interest Rate |
Principal Amount |
Carrying Amount(a) |
|||||||||
|---|---|---|---|---|---|---|---|---|---|---|---|---|---|---|
CSC Holdings(b)(e) |
February 6, 1998 | February 15, 2018 | 7.875 | % | $ | 300,000 | $ | 310,334 | ||||||
CSC Holdings(b)(e) |
July 21, 1998 | July 15, 2018 | 7.625 | % | 500,000 | 521,654 | ||||||||
CSC Holdings(c)(e) |
February 12, 2009 | February 15, 2019 | 8.625 | % | 526,000 | 553,804 | ||||||||
CSC Holdings(c)(e) |
November 15, 2011 | November 15, 2021 | 6.750 | % | 1,000,000 | 951,702 | ||||||||
CSC Holdings(c)(e) |
May 23, 2014 | June 1, 2024 | 5.250 | % | 750,000 | 650,193 | ||||||||
CSC Holdings(d) |
October 9, 2015 | January 15, 2023 | 10.125 | % | 1,800,000 | 1,774,750 | ||||||||
CSC Holdings(d) |
October 9, 2015 | October 15, 2025 | 10.875 | % | 2,000,000 | 1,970,379 | ||||||||
CSC Holdings(d) |
October 9, 2015 | October 15, 2025 | 6.625 | % | 1,000,000 | 985,469 | ||||||||
CSC Holdings(f) |
September 23, 2016 | April 15, 2027 | 5.500 | % | 1,310,000 | 1,304,025 | ||||||||
Cablevision(c)(e) |
September 23, 2009 | September 15, 2017 | 8.625 | % | 900,000 | 926,045 | ||||||||
Cablevision(c)(e) |
April 15, 2010 | April 15, 2018 | 7.750 | % | 750,000 | 767,545 | ||||||||
Cablevision(c)(e) |
April 15, 2010 | April 15, 2020 | 8.000 | % | 500,000 | 488,992 | ||||||||
Cablevision(c)(e) |
September 27, 2012 | September 15, 2022 | 5.875 | % | 649,024 | 559,500 | ||||||||
Cequel Communications Holdings I LLC and Cequel |
October 25, 2012 December 28, 2012 |
September 15, 2020 | 6.375 | % | 1,500,000 | 1,457,439 | ||||||||
Cequel Communications Holdings I LLC and Cequel |
May 16, 2013 September 9, 2014 |
December 15, 2021 | 5.125 | % | 1,250,000 | 1,115,767 | ||||||||
Altice US Finance I Corporation(g) |
June 12, 2015 | July 15, 2023 | 5.375 | % | 1,100,000 | 1,079,869 | ||||||||
Cequel Communications Holdings I LLC and Cequel Capital Corporation(h) |
June 12, 2015 | July 15, 2025 | 7.750 | % | 620,000 | 602,925 | ||||||||
Altice US Finance I Corporation(i) |
April 26, 2016 | May 15, 2026 | 5.500 | % | 1,500,000 | 1,486,933 | ||||||||
| | | | | | | | | | | | | | | |
|
$ | 17,955,024 | 17,507,325 | |||||||||||
| | | | | | | | | | | | | | | |
| | | | | | | | | | | | | | | |
| | | | | | | | | | | | | | | |
Less: Current portion |
926,045 | |||||||||||||
| | | | | | | | | | | | | | | |
Long-term debt |
$ | 16,581,280 | ||||||||||||
| | | | | | | | | | | | | | | |
| | | | | | | | | | | | | | | |
| | | | | | | | | | | | | | | |
- (a)
- The
carrying amount of the notes is net of the unamortized deferred financing costs and/or discounts/premiums of $447,699.
- (b)
- The
debentures are not redeemable by CSC Holdings prior to maturity.
- (c)
- Notes
are redeemable at any time at a specified "make-whole" price plus accrued and unpaid interest to the redemption date.
- (d)
- The Company may redeem some or all of the 2023 Notes at any time on or after January 15, 2019, and some or all of the 2025 Notes and 2025 Guaranteed Notes at any time on or after October 15, 2020, at the redemption prices set forth in the relevant indenture, plus accrued and unpaid interest, if any. The Company may also redeem up to 40% of each series of the Cablevision Acquisition Notes using the
F-64
NOTES TO CONSOLIDATED FINANCIAL STATEMENTS (Continued)
(Dollars in thousands, except share and per share amounts)
NOTE 9. DEBT (Continued)
proceeds of certain equity offerings before October 15, 2018, at a redemption price equal to 110.125% for the 2023 Notes, 110.875% for the 2025 Notes and 106.625% for the 2025 Guaranteed Notes, in each case plus accrued and unpaid interest. In addition, at any time prior to January 15, 2019, CSC Holdings may redeem some or all of the 2023 Notes, and at any time prior to October 15, 2020, the Company may redeem some or all of the 2025 Notes and the 2025 Guaranteed Notes, at a price equal to 100% of the principal amount thereof, plus a "make whole" premium specified in the relevant indenture plus accrued and unpaid interest.
- (e)
- The
carrying value of the notes was adjusted to reflect their fair value on the Cablevision Acquisition Date (aggregate reduction of $52,788).
- (f)
- The
2027 Guaranteed Notes are redeemable at any time on or after April 15, 2022 at the redemption prices set forth in the indenture, plus accrued and unpaid
interest, if any. In addition, up to 40% may be redeemed for each series of the 2027 Guaranteed Notes using the proceeds of certain equity offerings before October 15, 2019, at a redemption
price equal to 105.500%, plus accrued and unpaid interest.
- (g)
- Some
or all of these notes may be redeemed at any time on or after July 15, 2018, plus accrued and unpaid interest, if any. Up to 40% of the notes may be
redeemed using the proceeds of certain equity offerings before July 15, 2018, at a redemption price equal to 105.375%.
- (h)
- Some
or all of these notes may be redeemed at any time on or after July 15, 2020, plus accrued and unpaid interest, if any. Up to 40% of the notes may be
redeemed using the proceeds of certain equity offerings before July 15, 2018, at a redemption price equal to 107.750%.
- (i)
- Some or all of these notes may be redeemed at any time on or after May 15, 2021, plus accrued and unpaid interest, if any. Up to 40% of the notes may be redeemed using the proceeds of certain equity offerings before May 15, 2019, at a redemption price equal to 105.500%.
The indentures under which the senior notes and debentures were issued contain various covenants, which are generally less restrictive than those contained in the Credit Agreement. The Company was in compliance with all of its financial covenants under these indentures as of December 31, 2016.
CSC Holdings 5.5% Senior Guaranteed Notes due 2027
In September 2016, CSC Holdings issued $1,310,000 aggregate principal amount of 5.50% senior guaranteed notes due April 15, 2027. The 2027 Guaranteed Notes are senior unsecured obligations and rank pari passu in right of payment with all of the existing and future senior indebtedness, including the existing senior notes and the Credit Facilities and rank senior in right of payment to all of existing and future subordinated indebtedness.
As discussed above, in October 2016, CSC Holdings used the proceeds from the issuance of the 2027 Guaranteed Notes (after the deduction of fees and expenses) to prepay the outstanding loans under the Term Credit Facility that were not extended pursuant to the Extension Amendment. In connection with the issuance of the 2027 Guaranteed Notes, the Company incurred deferred financing costs of approximately $5,575, which are being amortized to interest expense over the term of the 2027 Guaranteed Notes.
Cablevision Acquisition Notes
The $1,000,000 principal amount of the 2025 Guaranteed Notes bear interest at a rate of 6.625% per annum and were issued at a price of 100.00%. Interest on the 2025 Guaranteed Notes is payable
F-65
NOTES TO CONSOLIDATED FINANCIAL STATEMENTS (Continued)
(Dollars in thousands, except share and per share amounts)
NOTE 9. DEBT (Continued)
semi-annually on January 15 and July 15, commencing on July 15, 2016. These 2025 Guaranteed Notes are guaranteed on a senior basis by the Initial Guarantors.
The $1,800,000 principal amount of the 2023 Notes and $2,000,000 principal amount of the 2025 Notes, bear interest at a rate of 10.125% and 10.875%, respectively, per annum and were issued at prices of 100.00%. Interest on the 2023 Notes and 2025 Notes is payable semi-annually on January 15 and July 15, which began on July 15, 2016.
Deferred financing costs of approximately $76,579 incurred in connection with the issuance of the Cablevision Acquisition Notes are being amortized to interest expense over the term of the Cablevision Acquisition Notes.
The indentures under which the Cablevision and CSC Holdings Senior Guaranteed Notes and Senior Notes and Debentures were issued contain certain covenants and agreements with respect to investment grade debt securities, including limitations on the ability of CSC Holdings and its restricted subsidiaries to (i) incur or guarantee additional indebtedness, (ii) make investments or other restricted payments, (iii) create liens, (iv) sell assets and subsidiary stock, (v) pay dividends or make other distributions or repurchase or redeem our capital stock or subordinated debt, (vi) engage in certain transactions with affiliates, (vii) enter into agreements that restrict the payment of dividends by subsidiaries or the repayment of intercompany loans and advances, and (viii) engage in mergers or consolidations, in each case subject to certain exceptions. The indentures also contain certain customary events of default. If an event of default occurs, the obligations under the Cablevision Acquisition Notes may be accelerated. As of December 31, 2016, Cablevision was in compliance with all of its financial covenants under the indentures under which the senior notes and debentures and guaranteed notes were issued.
Cequel Senior Secured Notes
On June 12, 2015, Altice US Finance I Corporation, an indirect subsidiary of Altice N.V., issued $1,100,000 principal amount of senior secured notes (the "2023 Senior Secured Notes"), the proceeds from which were placed in escrow to finance a portion of the purchase price for the Cequel Acquisition. The 2023 Senior Secured Notes bear interest at a rate of 5.375% per annum and were issued at a price of 100.00%. Interest on the 2023 Senior Secured Notes is payable semi-annually on January 15 and July 15 of each year. Following the consummation of the Cequel Acquisition and related transactions the equity interests in Altice US Finance I Corporation were contributed through one or more intermediary steps to Suddenlink, and the Senior Secured Notes were guaranteed by Cequel Communications Holdings II LLC, Suddenlink and certain of the subsidiaries of Suddenlink and are secured by certain assets of Cequel Communications Holdings II LLC, Suddenlink and its subsidiaries.
On April 26, 2016, Altice US Finance I Corporation issued $1,500,000 aggregate principal amount of senior secured notes (the "2026 Senior Secured Notes"). The proceeds from the sale were used to repay the $1,477,200 remaining balance under the Old Credit Facility and to pay related fees and expenses (see discussion above). The 2026 Senior Secured Notes mature on May 15, 2026 and bear interest at a rate of 5.50% annually. Interest on the 2026 Senior Secured Notes is payable semi-annually on May 15 and November 15 of each year, commencing on November 15, 2016. Deferred financing costs recorded in connection with the issuance of these notes amounted to $13,773 and are being amortized over the term of the notes.
F-66
NOTES TO CONSOLIDATED FINANCIAL STATEMENTS (Continued)
(Dollars in thousands, except share and per share amounts)
NOTE 9. DEBT (Continued)
Cequel Senior Notes
On June 12, 2015, Altice US Finance II Corporation, an indirect subsidiary of Altice N.V., issued $300,000 principal amount of the 2025 Senior Notes, the proceeds from which were placed in escrow, to finance a portion of the purchase price for the Cequel Acquisition. The 2025 Senior Notes were issued by the 2025 Senior Notes Issuer, an indirect subsidiary of Altice N.V., bear interest at a rate of 7.75% per annum and were issued at a price of 100.00%. Interest on the 2025 Senior Notes is payable semi-annually on January 15 and July 15 of each year. Following the consummation of the Cequel Acquisition and related transactions, the 2025 Senior Notes Issuer merged into Cequel, the 2025 Senior Notes became the obligations of Cequel and Cequel Capital Corporation became the co-issuer of the 2025 Senior Notes.
On June 12, 2015, Altice US Finance S.A., an indirect subsidiary of Altice N.V. issued $320,000 principal amount of the 7.75% Senior Notes due 2025 (the "Holdco Notes"), the proceeds from which were placed in escrow, to finance a portion of the purchase price for the Cequel Acquisition. The Holdco Notes bear interest at a rate of 7.75% per annum and were issued at a price of 98.275%. Interest on the Holdco Notes is payable semi-annually on January 15 and July 15 of each year. The Holdco Notes were automatically exchanged into an equal aggregate principal amount of 2025 Senior Notes at Cequel during the second quarter of 2016. The exchange resulted in a decrease to member's equity of approximately $315,352.
The Issuers have no ability to service interest or principal on the Notes, other than through any dividends or distributions received from Suddenlink. Suddenlink is restricted in certain circumstances, from paying dividends or distributions to the Issuers by the terms of the New Credit Agreement. However, the Cequel Credit Agreement permits Suddenlink to make dividends and distributions subject to satisfaction of certain conditions, including pro forma compliance with a maximum senior secured leverage ratio, and that no event of default has occurred and is continuing, or would be caused by the making of such dividends or other distributions, and based on, among other things, availability under a restricted payment basket. The 2020 Notes, the 2021 Notes and the 2025 Senior Notes are unsecured and are not guaranteed by any subsidiaries of the Original Issuers, including Suddenlink.
The Cequel Indentures contain certain covenants, agreements and events of default which are customary with respect to non-investment grade debt securities, including limitations on the Company's ability to incur additional indebtedness, pay dividends on or make other distributions or repurchase the Company's capital stock, make certain investments, enter into certain types of transactions with affiliates, create liens and sell certain assets or merge with or into other companies.
Notes Payable to Affiliates and Related Parties
On June 21, 2016, in connection with the Cablevision Acquisition, the Company issued notes payable to affiliates aggregating $1,750,000, of which $875,000 bear interest at 10.75% and are due on December 20, 2023 and $875,000 bear interest at 11% and are due on December 20, 2024. The Company may redeem all or, part of the notes at a redemption price equal to 100% of the principal amount thereof plus the applicable premium, as defined in the notes agreement, and accrued and unpaid interest. For the year ended December 31, 2016, the Company recognized interest expense of $102,557 related to these notes payable. As of December 31, 2016, the accrued interest related to these notes of $102,557 is reflected in accrued interest in the Company's balance sheet.
F-67
NOTES TO CONSOLIDATED FINANCIAL STATEMENTS (Continued)
(Dollars in thousands, except share and per share amounts)
NOTE 9. DEBT (Continued)
Summary of Debt Maturities
Total amounts payable by the Company under its various debt obligations outstanding as of December 31, 2016, including notes payable, collateralized indebtedness (see Note 10), and capital leases, during the next five years and thereafter, are as follows:
Years Ending December 31,
|
Cablevision | Cequel | Altice USA | Total | |||||||||
|---|---|---|---|---|---|---|---|---|---|---|---|---|---|
2017 |
$ | 1,719,180 | $ | 9,113 | $ | — | $ | 1,728,293 | |||||
2018 |
2,103,441 | 8,652 | — | 2,112,093 | |||||||||
2019 |
557,348 | 8,330 | — | 565,678 | |||||||||
2020 |
526,340 | 1,508,213 | — | 2,034,553 | |||||||||
2021 |
1,200,256 | 1,258,223 | — | 2,458,479 | |||||||||
Thereafter |
9,884,024 | 3,995,280 | 1,750,000 | 15,629,304 | |||||||||
NOTE 10. DERIVATIVE CONTRACTS AND COLLATERALIZED INDEBTEDNESS
Prepaid Forward Contracts
The Company has entered into various transactions to limit the exposure against equity price risk on its shares of Comcast Corporation ("Comcast") common stock. The Company has monetized all of its stock holdings in Comcast through the execution of prepaid forward contracts, collateralized by an equivalent amount of the respective underlying stock. At maturity, the contracts provide for the option to deliver cash or shares of Comcast stock with a value determined by reference to the applicable stock price at maturity. These contracts, at maturity, are expected to offset declines in the fair value of these securities below the hedge price per share while allowing the Company to retain upside appreciation from the hedge price per share to the relevant cap price.
The Company received cash proceeds upon execution of the prepaid forward contracts discussed above which has been reflected as collateralized indebtedness in the accompanying consolidated balance sheets. In addition, the Company separately accounts for the equity derivative component of the prepaid forward contracts. These equity derivatives have not been designated as hedges for accounting purposes. Therefore, the net fair values of the equity derivatives have been reflected in the accompanying consolidated balance sheets as an asset or liability and the net increases or decreases in the fair value of the equity derivative component of the prepaid forward contracts are included in gain (loss) on derivative contracts in the accompanying consolidated statement of operations.
All of the Company's monetization transactions are obligations of its wholly-owned subsidiaries that are not part of the Restricted Group; however, CSC Holdings has provided guarantees of the subsidiaries' ongoing contract payment expense obligations and potential payments that could be due as a result of an early termination event (as defined in the agreements). If any one of these contracts were terminated prior to its scheduled maturity date, the Company would be obligated to repay the fair value of the collateralized indebtedness less the sum of the fair values of the underlying stock and equity collar, calculated at the termination date. As of December 31, 2016, the Company did not have an early termination shortfall relating to any of these contracts.
F-68
NOTES TO CONSOLIDATED FINANCIAL STATEMENTS (Continued)
(Dollars in thousands, except share and per share amounts)
NOTE 10. DERIVATIVE CONTRACTS AND COLLATERALIZED INDEBTEDNESS (Continued)
The Company monitors the financial institutions that are counterparties to its equity derivative contracts and it diversifies its equity derivative contracts among various counterparties to mitigate exposure to any single financial institution. All of the counterparties to such transactions carry investment grade credit ratings as of December 31, 2016.
Interest Rate Swap Contracts
In June 2016, the Company entered into two new fixed to floating interest rate swap contracts. One fixed to floating interest rate swap is converting $750,000 from a fixed rate of 1.6655% to six-month LIBO rate and a second tranche of $750,000 from a fixed rate of 1.68% to six-month LIBO rate. The objective of these swaps is to cover the exposure of the 2026 Senior Secured Notes to changes in the market interest rate. These swap contracts were not designated as hedges for accounting purposes. Accordingly, the changes in the fair value of these interest rate swap contracts are recorded through the statement of operations.
The Company does not hold or issue derivative instruments for trading or speculative purposes.
The following represents the location of the assets and liabilities associated with the Company's derivative instruments within the consolidated balance sheets:
| |
|
Asset Derivatives |
Liability Derivatives |
||||||
|---|---|---|---|---|---|---|---|---|---|
Derivatives Not Designated as Hedging Instruments
|
Balance Sheet Location | Fair Value at December 31, 2016 |
Fair Value at December 31, 2016 |
||||||
Prepaid forward contracts |
Derivative contracts, current | $ | 352 | $ | 13,158 | ||||
Prepaid forward contracts |
Derivative contracts, long-term | 10,604 | — | ||||||
Interest rate swap contracts |
Liabilities under derivative contracts, long-term | — | 78,823 | ||||||
| | | | | | | | | | |
|
$ | 10,956 | $ | 91,981 | |||||
| | | | | | | | | | |
| | | | | | | | | | |
| | | | | | | | | | |
Unrealized and realized losses related to Company's equity derivative contracts related to the Comcast common stock for the year ended December 31, 2016 of $53,696, are reflected in loss on equity derivative contracts, net in the Company's consolidated statement of operations.
For the year ended December 31, 2016, the Company recorded a gain on investments of $141,538, representing the net increase in the fair values of all investment securities pledged as collateral.
For the year ended December 31, 2016, the Company recorded a net loss on interest rate swap contracts of $72,961.
F-69
NOTES TO CONSOLIDATED FINANCIAL STATEMENTS (Continued)
(Dollars in thousands, except share and per share amounts)
NOTE 10. DERIVATIVE CONTRACTS AND COLLATERALIZED INDEBTEDNESS (Continued)
Settlements of Collateralized Indebtedness
The following table summarizes the settlement of the Company's collateralized indebtedness relating to Comcast shares that were settled by delivering cash equal to the collateralized loan value, net of the value of the related equity derivative contracts.
Number of shares(a) |
5,337,750 | |||
| | | | | |
| | | | | |
| | | | | |
Collateralized indebtedness settled |
$ | (143,102 | ) | |
Derivative contracts settled |
— | |||
| | | | | |
|
(143,102 | ) | ||
Proceeds from new monetization contracts |
179,388 | |||
| | | | | |
Net cash receipt |
$ | 36,286 | ||
| | | | | |
| | | | | |
| | | | | |
- (a)
- Share amounts were adjusted for the 2 for 1 stock split in February 2017.
The cash was obtained from the proceeds of new monetization contracts covering an equivalent number of Comcast shares. The terms of the new contracts allow the Company to retain upside participation in Comcast shares up to each respective contract's upside appreciation limit with downside exposure limited to the respective hedge price.
In January 2017, the Company settled collateralized indebtedness relating to 5,337,750 Comcast shares (adjusted for the 2 for 1 stock split in February 2017) by delivering cash equal to the collateralized loan value obtained from the proceeds of a new monetization contract covering an equivalent number of Comcast shares. Accordingly, the consolidated balance sheet of the Company as of December 31, 2016 reflect the reclassification of $184,286 of investment securities pledged as collateral from a current asset to a long-term asset and $150,036 of collateralized indebtedness from a current liability to a long-term liability.
NOTE 11. FAIR VALUE MEASUREMENT
The fair value hierarchy is based on inputs to valuation techniques that are used to measure fair value that are either observable or unobservable. Observable inputs reflect assumptions market participants would use in pricing an asset or liability based on market data obtained from independent sources while unobservable inputs reflect a reporting entity's pricing based upon their own market assumptions. The fair value hierarchy consists of the following three levels:
- •
- Level I—Quoted prices for identical instruments in active markets.
- •
- Level II—Quoted prices for similar instruments in active markets; quoted prices for identical or similar instruments in
markets that are not active; and model-derived valuations whose inputs are observable or whose significant value drivers are observable.
- •
- Level III—Instruments whose significant value drivers are unobservable.
F-70
NOTES TO CONSOLIDATED FINANCIAL STATEMENTS (Continued)
(Dollars in thousands, except share and per share amounts)
NOTE 11. FAIR VALUE MEASUREMENT (Continued)
The following table presents for each of these hierarchy levels, the Company's financial assets and financial liabilities that are measured at fair value on a recurring basis:
| |
At December 31, 2016 (Successor) | ||||||||||||
|---|---|---|---|---|---|---|---|---|---|---|---|---|---|
| |
Level I | Level II | Level III | Total | |||||||||
Assets: |
|||||||||||||
Money market funds |
$ | 100,139 | $ | — | $ | — | $ | 100,139 | |||||
Investment securities pledged as collateral |
1,483,030 | — | — | 1,483,030 | |||||||||
Prepaid forward contracts |
— | 10,956 | — | 10,956 | |||||||||
Liabilities: |
|||||||||||||
Prepaid forward contracts |
— | 13,158 | — | 13,158 | |||||||||
Interest rate swap contracts |
78,823 | 78,823 | |||||||||||
The Company's cash equivalents, investment securities and investment securities pledged as collateral are classified within Level I of the fair value hierarchy because they are valued using quoted market prices.
The Company's derivative contracts and liabilities under derivative contracts on the Company's balance sheets are valued using market-based inputs to valuation models. These valuation models require a variety of inputs, including contractual terms, market prices, yield curves, and measures of volatility. When appropriate, valuations are adjusted for various factors such as liquidity, bid/offer spreads and credit risk considerations. Such adjustments are generally based on available market evidence. Since model inputs can generally be verified and do not involve significant management judgment, the Company has concluded that these instruments should be classified within Level II of the fair value hierarchy.
Fair Value of Financial Instruments
The following methods and assumptions were used to estimate fair value of each class of financial instruments for which it is practicable to estimate:
Credit Facility Debt, Collateralized Indebtedness, Senior Notes and Debentures, Senior Secured Notes, Senior Guaranteed Notes, Notes Payable to Affiliates and Related Parties, and Notes Payable
The fair values of each of the Company's debt instruments are based on quoted market prices for the same or similar issues or on the current rates offered to the Company for instruments of the same remaining maturities. The fair value of notes payable is based primarily on the present value of the remaining payments discounted at the borrowing cost.
F-71
NOTES TO CONSOLIDATED FINANCIAL STATEMENTS (Continued)
(Dollars in thousands, except share and per share amounts)
NOTE 11. FAIR VALUE MEASUREMENT (Continued)
The carrying values, estimated fair values, and classification under the fair value hierarchy of the Company's financial instruments, excluding those that are carried at fair value in the accompanying consolidated balance sheets, are summarized as follows:
| |
|
December 31, 2016 | |||||||
|---|---|---|---|---|---|---|---|---|---|
| |
Fair Value Hierarchy |
Carrying Amount(a) |
Estimated Fair Value |
||||||
Altice USA debt instruments: |
|||||||||
Notes payable to affiliates and related parties |
Level II | $ | 1,750,000 | $ | 1,837,876 | ||||
CSC Holdings debt instruments: |
|||||||||
Credit facility debt |
Level II | 2,631,887 | 2,675,256 | ||||||
Collateralized indebtedness(b) |
Level II | 1,286,069 | 1,280,048 | ||||||
Senior guaranteed notes |
Level II | 2,289,494 | 2,416,375 | ||||||
Senior notes and debentures(c) |
Level II | 6,732,816 | 7,731,150 | ||||||
Notes payable |
Level II | 13,726 | 13,260 | ||||||
Cablevision senior notes(d) |
Level II | 2,742,082 | 2,920,056 | ||||||
Cequel debt instruments: |
|||||||||
Cequel credit facility |
Level II | 812,903 | 815,000 | ||||||
Senior Secured Notes |
Level II | 1,079,869 | 1,152,250 | ||||||
Senior Notes |
Level II | 4,663,064 | 5,054,775 | ||||||
| | | | | | | | | | |
|
$ | 24,001,910 | $ | 25,896,046 | |||||
| | | | | | | | | | |
| | | | | | | | | | |
| | | | | | | | | | |
- (a)
- Amounts
are net of unamortized deferred financing costs and discounts.
- (b)
- The
total carrying value of the collateralized debt was reduced by $9,142 to reflect its fair value on the Cablevision Acquisition Date.
- (c)
- The
total carrying value of the senior notes and debentures assumed in connection with the Cablevision Acquisition was reduced by $39,713 to reflect the fair value
of the notes on the Cablevision Acquisition Date.
- (d)
- The total carrying value of the senior notes and debentures assumed in connection with the Cablevision Acquisition was reduced by $13,075 to reflect the fair value of the notes on the Cablevision Acquisition Date.
The fair value estimates related to the Company's debt instruments presented above are made at a specific point in time, based on relevant market information and information about the financial instrument. These estimates are subjective in nature and involve uncertainties and matters of significant judgments and therefore cannot be determined with precision. Changes in assumptions could significantly affect the estimates.
NOTE 12. INCOME TAXES
The Company files a federal consolidated and certain state combined income tax returns with its 80% or more owned subsidiaries. In connection with the contribution of common stock of Cequel to the Company, Cequel joined the Company's federal consolidated group. Cablevision joined the Company's federal consolidated group on the Cablevision Acquisition Date.
F-72
NOTES TO CONSOLIDATED FINANCIAL STATEMENTS (Continued)
(Dollars in thousands, except share and per share amounts)
NOTE 12. INCOME TAXES (Continued)
Income tax benefit attributable to the Company's continuing operations for the year ended December 31, 2016 consist of the following components:
Current expense (benefit): |
||||
Federal |
$ | (981 | ) | |
State |
5,310 | |||
| | | | | |
|
4,329 | |||
| | | | | |
Deferred benefit: |
||||
Federal |
(223,159 | ) | ||
State |
(40,830 | ) | ||
| | | | | |
|
(263,989 | ) | ||
| | | | | |
Tax benefit relating to uncertain tax positions |
(6 | ) | ||
| | | | | |
Income tax benefit |
$ | (259,666 | ) | |
| | | | | |
| | | | | |
| | | | | |
The income tax benefit attributable to the Company's continuing operations differs from the amount derived by applying the statutory federal rate to pretax income principally due to the effect of the following items:
| |
December 31, 2016 |
|||
|---|---|---|---|---|
Federal tax benefit at statutory rate |
$ | (381,901 | ) | |
State income taxes, net of federal impact |
(39,336 | ) | ||
Changes in the valuation allowance |
297 | |||
Changes in the state rates used to measure deferred taxes, net of federal impact |
153,239 | |||
Tax benefit relating to uncertain tax positions |
(120 | ) | ||
Non-deductible share-based compensation related to the carried unit plan |
5,029 | |||
Non-deductible Cablevision Acquisition transaction costs |
4,457 | |||
Other non-deductible expenses |
1,551 | |||
Research credit |
(400 | ) | ||
Other, net |
(2,482 | ) | ||
| | | | | |
Income tax benefit |
$ | (259,666 | ) | |
| | | | | |
| | | | | |
| | | | | |
As described in Note 1, in June, 2016, (i) Cequel was contributed to Altice USA and (ii) Altice USA completed the Cablevision Acquisition. Accordingly, in the second quarter of 2016, Cequel and Cablevision joined the federal consolidated and certain state combined income tax returns of Altice USA. As a result, the applicate tax rate used to measure deferred tax assets and liabilities of Cequel increased, resulting in a non-cash deferred income tax charge of $153,660.
In the fourth quarter of 2016, ASU 2015-17 was adopted with prospective application. Accordingly, all deferred tax assets and liabilities are presented as noncurrent in the consolidated balance sheet as of December 31, 2016.
F-73
NOTES TO CONSOLIDATED FINANCIAL STATEMENTS (Continued)
(Dollars in thousands, except share and per share amounts)
NOTE 12. INCOME TAXES (Continued)
The tax effects of temporary differences which give rise to significant portions of deferred tax assets or liabilities and the corresponding valuation allowance at December 31, 2016 are as follows.
| |
December 31, 2016 |
|||
|---|---|---|---|---|
NOLs and tax credit carry forwards |
$ | 971,728 | ||
Compensation and benefit plans |
93,939 | |||
Partnership investments |
113,473 | |||
Restructuring liability |
37,393 | |||
Other liabilities |
45,561 | |||
Liabilities under derivative contracts |
31,529 | |||
Interest deferred for tax purposes |
39,633 | |||
Other |
6,615 | |||
| | | | | |
Deferred tax asset |
1,339,871 | |||
Valuation allowance |
(3,125 | ) | ||
| | | | | |
Net deferred tax asset, noncurrent |
1,336,746 | |||
| | | | | |
Fixed assets and intangibles |
(9,065,635 | ) | ||
Investments |
(187,795 | ) | ||
Prepaid expenses |
(10,172 | ) | ||
Fair value adjustment- debt and deferred finance costs |
(30,535 | ) | ||
Other |
(9,424 | ) | ||
| | | | | |
Deferred tax liability, noncurrent |
(9,303,561 | ) | ||
| | | | | |
Total net deferred tax liability |
$ | (7,966,815 | ) | |
| | | | | |
| | | | | |
| | | | | |
The Cablevision Acquisition resulted in an ownership change under Internal Revenue Code ("IRC") Section 382 and certain state taxing authorities whereby Cablevision's federal net operating losses ("NOLs") immediately prior to the Cablevision Acquisition of $877,975 will be subject to certain limitations. The Cequel Acquisition resulted in a third ownership change with regard to Cequel NOLs. Utilization of Cequel NOLs of $1,709,263 are limited under IRC Section 382. The utilization of the NOLs will be determined based on the ordering rules required by the applicable taxing jurisdiction. Since the limitation amounts accumulate for future use to the extent they are not utilized in any given year, the Company believes its loss carryforwards should become fully available to offset future taxable income.
At December 31, 2016, the Company had consolidated federal NOLs of $3,078,119 expiring on various dates from 2019 through 2036. The Company has recorded a deferred tax asset related to $2,302,619 of such NOLs. A deferred tax asset has not been recorded for the remaining NOL of $775,500 as this portion relates to 'windfall' deductions on share-based awards that have not yet been realized. In connection with the adoption of ASU 2016-09 in the first quarter of 2017, the deferred tax asset for such windfall deductions will be recorded to accumulated deficit in the amount of approximately $309,000.
As of December 31, 2016, the Company has $43,215 of federal alternative minimum tax credit carry forwards which do not expire and $18,672 of research credits, expiring in varying amounts from 2023 through 2036.
F-74
NOTES TO CONSOLIDATED FINANCIAL STATEMENTS (Continued)
(Dollars in thousands, except share and per share amounts)
NOTE 12. INCOME TAXES (Continued)
Deferred tax assets have resulted primarily from the Company's future deductible temporary differences and NOLs. In assessing the realizability of deferred tax assets, management considers whether it is more likely than not that some portion or all of the deferred tax asset will not be realized. In evaluating the need for a valuation allowance, management takes into account various factors, including the expected level of future taxable income, available tax planning strategies and reversals of existing taxable temporary differences. If such estimates and related assumptions change in the future, the Company may be required to record additional valuation allowances against its deferred tax assets, resulting in additional income tax expense in the Company's consolidated statements of income. Management evaluates the realizability of the deferred tax assets and the need for additional valuation allowances quarterly. Pursuant to the Cablevision Acquisition and Cequel Acquisition, deferred tax liabilities resulting from the book fair value adjustment increased significantly and future taxable income that will result from the reversal of existing taxable temporary differences for which deferred tax liabilities are recognized is sufficient to conclude it is more likely than not that the Company will realize all of its gross deferred tax assets, except those deferred tax assets against which a valuation allowance has been recorded which relate to certain state NOLs.
In the normal course of business, the Company engages in transactions in which the income tax consequences may be uncertain. The Company's income tax returns are filed based on interpretation of tax laws and regulations. Such income tax returns are subject to examination by taxing authorities. For financial statement purposes, the Company only recognizes tax positions that it believes are more likely than not of being sustained. There is considerable judgment involved in determining whether positions taken or expected to be taken on the tax return are more likely than not of being sustained.
A reconciliation of the beginning and ending amount of unrecognized tax benefits associated with uncertain tax positions, excluding associated deferred tax benefits and accrued interest, is as follows:
Balance at January 1, 2016 |
$ | — | ||
Increase to tax position in connection with the Cablevision Acquisition |
4,031 | |||
Decreases related to prior year tax positions |
(6 | ) | ||
| | | | | |
Balance at December 31, 2016 |
$ | 4,025 | ||
| | | | | |
| | | | | |
| | | | | |
As of December 31, 2016, if all uncertain tax positions were sustained at the amounts reported or expected to be reported in the Company's tax returns, the elimination of the Company's unrecognized tax benefits, net of the deferred tax impact, would decrease income tax expense by $5,185.
In the second quarter of 2016, the Company changed its accounting policy on a prospective basis to present interest expense relating to uncertain tax positions as additional interest expense. In the period ended December 31, 2016, $309 of interest expense relating to uncertain tax position was recorded to interest expense.
The most significant jurisdictions in which the Company is required to file income tax returns include the states of New York, New Jersey and Connecticut and the City of New York, Texas and West Virginia. The State of New York is presently auditing income tax returns for years 2009 through 2011.
Management does not believe that the resolution of the ongoing income tax examination described above will have a material adverse impact on the financial position of the Company. Changes in the liabilities for uncertain tax positions will be recognized in the interim period in which the positions are effectively settled or there is a change in factual circumstances.
F-75
NOTES TO CONSOLIDATED FINANCIAL STATEMENTS (Continued)
(Dollars in thousands, except share and per share amounts)
NOTE 13. BENEFIT PLANS
Qualified and Non-qualified Defined Benefit Plans
Retirement Plans (collectively, the "Defined Benefit Plans")
The Company sponsors a non-contributory qualified defined benefit cash balance retirement plan (the "Pension Plan") for the benefit of non-union employees of Cablevision, as well as certain employees covered by a collective bargaining agreement in Brooklyn.
The Company maintains an unfunded non-contributory non-qualified defined benefit excess cash balance plan ("Excess Cash Balance Plan") covering certain current and former employees of Cablevision who participate in the Pension Plan, as well as an additional unfunded non-contributory, non-qualified defined benefit plan ("CSC Supplemental Benefit Plan") for the benefit of certain former officers and employees of Cablevision which provided that, upon retiring on or after normal retirement age, a participant receives a benefit equal to a specified percentage of the participant's average compensation, as defined. All participants were 100% vested in the CSC Supplemental Benefit Plan. The benefits related to the CSC Supplemental Plan were paid to participants in January 2017 and the plan was terminated.
Cablevision's Pension Plan and the Excess Cash Balance Plan are frozen and no employee of Cablevision who was not already a participant could participate in the plans and no further annual Pay Credits (a certain percentage of employees' eligible pay) are made. Existing account balances under the plans continue to be credited with monthly interest in accordance with the terms of the plans.
Plan Results for Defined Benefit Plans
Summarized below is the funded status and the amounts recorded on the Company's consolidated balance sheets for all of the Company's Defined Benefit Plans at December 31, 2016:
Change in projected benefit obligation: |
||||
Projected benefit obligation at beginning of year |
$ | 403,963 | ||
Service cost |
— | |||
Interest cost |
14,077 | |||
Actuarial gain |
(11,429 | ) | ||
Curtailments |
3,968 | |||
Benefits paid |
(28,062 | ) | ||
| | | | | |
Projected benefit obligation at end of year |
382,517 | |||
| | | | | |
Change in plan assets: |
||||
Fair value of plan assets at beginning of year |
297,846 | |||
Actual return on plan assets, net |
5,829 | |||
Employer contributions |
8,505 | |||
Benefits paid |
(28,062 | ) | ||
| | | | | |
Fair value of plan assets at end of year |
284,118 | |||
| | | | | |
Unfunded status at end of year |
$ | (98,399 | ) | |
| | | | | |
| | | | | |
| | | | | |
The accumulated benefit obligation for the Company's Defined Benefit Plans aggregated $382,517 at December 31, 2016.
F-76
NOTES TO CONSOLIDATED FINANCIAL STATEMENTS (Continued)
(Dollars in thousands, except share and per share amounts)
NOTE 13. BENEFIT PLANS (Continued)
The Company's net funded status relating to its Defined Benefit Plans at December 31, 2016, is as follows:
Defined Benefit Plans |
$ | (98,399 | ) | |
Less: Current portion related to nonqualified plans |
14,293 | |||
| | | | | |
Long-term defined benefit plan obligations |
$ | (84,106 | ) | |
| | | | | |
| | | | | |
| | | | | |
Components of the net periodic benefit cost, recorded in other operating expenses, for the Defined Benefit Plans for the year ended December 31, 2016, is as follows:
Service cost |
$ | — | ||
Interest cost |
6,946 | |||
Expected return on plan assets, net |
(4,022 | ) | ||
Curtailment loss |
231 | |||
Settlement income (reclassified from accumulated other comprehensive loss)(a) |
(154 | ) | ||
| | | | | |
Net periodic benefit cost |
$ | 3,001 | ||
| | | | | |
| | | | | |
| | | | | |
- (a)
- As a result of benefit payments to terminated or retired individuals exceeding the service and interest costs for the Pension Plan and the Excess Cash Balance Pension Plan during the period June 21, 2016 through December 31, 2016, the Company recognized a non-cash settlement loss that represented the acceleration of the recognition of a portion of the previously unrecognized actuarial losses recorded in accumulated other comprehensive loss on the Company's consolidated balance sheet relating to these plans.
Plan Assumptions for Defined Benefit Plans
Weighted-average assumptions used to determine net periodic cost (made at the beginning of the year) and benefit obligations (made at the end of the year) for the Defined Benefit Plans are as follows:
| |
Net Periodic Benefit Cost |
Benefit Obligations | |||||
|---|---|---|---|---|---|---|---|
| |
June 21, 2016 to December 31, 2016 |
December 31, 2016 | |||||
Discount rate(a) |
3.53 | % | 3.81 | % | |||
Rate of increase in future compensation levels |
— | % | — | % | |||
Expected rate of return on plan assets (Pension Plan only) |
3.97 | % | N/A | ||||
- (a)
- The discount rate of 3.53% for the period June 21, 2016 through December 31, 2016, represents the average of the quarterly discount rates used to remeasure the Company's projected benefit obligation and net periodic benefit cost in connection with the recognition of settlement losses discussed above.
The discount rate used by the Company in calculating the net periodic benefit cost for the Cash Balance Plan and the Excess Cash Balance Plan was determined based on the expected future benefit
F-77
NOTES TO CONSOLIDATED FINANCIAL STATEMENTS (Continued)
(Dollars in thousands, except share and per share amounts)
NOTE 13. BENEFIT PLANS (Continued)
payments for the plans and from the Towers Watson U.S. Rate Link: 40-90 Discount Rate Model. The model was developed by examining the yields on selected highly rated corporate bonds.
The Company's expected long-term return on Pension Plan assets is based on a periodic review and modeling of the plan's asset allocation structure over a long-term horizon. Expectations of returns and risk for each asset class are the most important of the assumptions used in the review and modeling and are based on comprehensive reviews of historical data, forward looking economic outlook, and economic/financial market theory. The expected long-term rate of return was chosen as a best estimate and was determined by (a) historical real returns, net of inflation, for the asset classes covered by the investment policy, and (b) projections of inflation over the long-term period during which benefits are payable to plan participants.
Pension Plan Assets and Investment Policy
The weighted average asset allocations of the Pension Plan at December 31, 2016 is as follows:
| |
Plan Assets | |||
|---|---|---|---|---|
Asset Class: |
||||
Mutual funds |
43 | % | ||
Fixed income securities |
55 | |||
Cash equivalents and other |
2 | |||
| | | | | |
|
100 | % | ||
| | | | | |
| | | | | |
| | | | | |
The Pension Plan's investment objectives reflect an overall low risk tolerance to stock market volatility. This strategy allows for the Pension Plan to invest in portfolios that would obtain a rate of return throughout economic cycles, commensurate with the investment risk and cash flow needs of the Pension Plan. The investments held in the Pension Plan are readily marketable and can be sold to fund benefit payment obligations of the plan as they become payable.
Investment allocation decisions are formally made by the Company's Benefit Committee, which takes into account investment advice provided by its external investment consultant. The investment consultant takes into account expected long-term risk, return, correlation, and other prudent investment assumptions when recommending asset classes and investment managers to the Company's Investment and Benefit Committee. The major categories of the Pension Plan assets are cash equivalents and bonds which are marked-to-market on a daily basis. Due to the Pension Plan's significant holdings in long-term government and non-government fixed income securities, the Pension Plan's assets are subjected to interest rate risk; specifically, a rising interest rate environment. Consequently, an increase in interest rates may cause a decrease to the overall liability of the Pension Plan thus creating a hedge against rising interest rates. In addition, a portion of the Pension Plan's bond portfolio is invested in foreign debt securities where there could be foreign currency risks associated with them, as well as in non-government securities which are subject to credit risk of the bond issuer defaulting on interest and/or principal payments.
F-78
NOTES TO CONSOLIDATED FINANCIAL STATEMENTS (Continued)
(Dollars in thousands, except share and per share amounts)
NOTE 13. BENEFIT PLANS (Continued)
Investments at Estimated Fair Value
The fair values of the assets of the Pension Plan at December 31, 2016 by asset class are as follows:
Asset Class
|
Level I | Level II | Level III | Total | |||||||||
|---|---|---|---|---|---|---|---|---|---|---|---|---|---|
Mutual funds |
$ | 121,356 | $ | — | $ | — | $ | 121,356 | |||||
Fixed income securities held in a portfolio: |
|||||||||||||
Foreign issued corporate debt |
— | 13,583 | — | 13,583 | |||||||||
U.S. corporate debt |
— | 48,046 | — | 48,046 | |||||||||
Government debt |
— | 4,810 | — | 4,810 | |||||||||
U.S. Treasury securities |
— | 77,285 | — | 77,285 | |||||||||
Asset-backed securities |
— | 14,065 | — | 14,065 | |||||||||
Other |
— | 247 | — | 247 | |||||||||
Cash equivalents(a) |
2,593 | 3,089 | — | 5,682 | |||||||||
| | | | | | | | | | | | | | |
Total(b) |
$ | 123,949 | $ | 161,125 | $ | — | $ | 285,074 | |||||
| | | | | | | | | | | | | | |
| | | | | | | | | | | | | | |
| | | | | | | | | | | | | | |
- (a)
- A
significant portion represents an investment in a short-term investment fund that invests primarily in securities of high quality and low risk.
- (b)
- Excludes cash and net payables relating to the purchase of securities that were not settled as of December 31, 2016.
The fair values of mutual funds and cash equivalents were derived from quoted market prices that the Pension Plan administrator has the ability to access.
The fair values of corporate and government debt, treasury securities and asset-back securities were derived from bids received from a vendor or broker not available in an active market that the Pension Plan administrator has the ability to access.
Benefit Payments and Contributions for Defined Benefit Plans
The following benefit payments are expected to be paid:
2017 |
$ | 45,899 | ||
2018 |
28,812 | |||
2019 |
27,565 | |||
2020 |
28,399 | |||
2021 |
25,692 | |||
2022 - 2026 |
120,664 |
The Company currently expects to contribute approximately $12,700 to the Pension Plan in 2017.
Defined Contribution Plans
The Company maintains the Cablevision 401(k) Savings Plan, a contributory qualified defined contribution plan for the benefit of non-union employees of Cablevision. Participants can contribute a percentage of eligible annual compensation and the Company will make a matching cash contribution
F-79
NOTES TO CONSOLIDATED FINANCIAL STATEMENTS (Continued)
(Dollars in thousands, except share and per share amounts)
NOTE 13. BENEFIT PLANS (Continued)
or discretionary contribution, as defined in the plan. In addition, the Company maintains an unfunded non-qualified excess savings plan for which the Company provides a matching contribution similar to the Cablevision 401(k) Savings Plan. Applicable employees of the Company are eligible for an enhanced employer matching contribution, as well as a year-end employer discretionary contribution to the Cablevision 401(k) Savings Plan and the Cablevision Excess Savings Plan.
The Company also maintains a 401(k) plan for employees of Cequel. Cequel employees that qualify for participation can contribute a percentage of eligible annual compensation and the Company will make a matching cash contribution, as defined in the plan.
The cost associated with these plans (including the enhanced employer matching and discretionary contributions) was $28,501 for the year ended December 31, 2016.
NOTE 14. EQUITY AND LONG-TERM INCENTIVE PLANS
Equity Plans
In July 2016, certain employees of the Company and its affiliates received awards of units in a carry unit plan of Neptune Management LP, an entity which has an ownership interest in the Company. The awards generally will vest as follows: 50% on the second anniversary of June 21, 2016 for Cablevision employees or December 21, 2015 for Cequel employees ("Base Date"), 25% on the third anniversary of the Base Date, and 25% on the fourth anniversary of the Base Date. Neptune Holding US GP LLC, the general partner of Neptune Management LP, has the right to repurchase (or to assign to an affiliate, including the Company, the right to repurchase) vested awards held by employees for sixty days following their termination. For the performance-based awards, vesting occurs upon achievement or satisfaction of a specified performance condition. The Company considered the probability of achieving the established performance targets in determining the equity-based compensation with respect to these awards at the end of each reporting period. The carried unit plan has 259,442,785 units authorized for issuance, of which 147,700,000 have been issued to employees of the Company and 55,100,000 have been issued to employees of Altice N.V. and affiliated companies.
The Company measures the cost of employee services received in exchange for carry units based on the fair value of the award at grant date. An option pricing model was used which requires subjective assumptions for which changes in these assumptions could materially affect the fair value of the carry units outstanding. The time to liquidity event assumption was based on management's judgment. The equity volatility assumption of 60% was estimated using the historical weekly volatility of publicly traded comparable companies. The risk-free rate of 0.74% assumed in valuing the units was based on the U.S. Constant Maturity Treasury Rates for a period matching the expected time to liquidity event. The discount for lack of marketability of 20% was based on Finnerty's (2012) average-strike put option model. The weighted average grant date fair value of the outstanding units is $0.37 per unit and the fair value was $1.76 per unit as of December 31, 2016. For the year ended December 31, 2016, the Company recognized an expense of $14,368 related to the push down of share-based compensation related to the carry unit plan of which approximately $9,849 related to units granted to employees of the Company and $4,519 related to employees of Altice N.V. and affiliated companies allocated to the Company.
Beginning on the fourth anniversary of the Base Date, the holders of carry units have an annual opportunity (a sixty day period determined by the administrator of the plan) to sell their units back to
F-80
NOTES TO CONSOLIDATED FINANCIAL STATEMENTS (Continued)
(Dollars in thousands, except share and per share amounts)
NOTE 14. EQUITY AND LONG-TERM INCENTIVE PLANS (Continued)
Neptune Holding US GP LLC (or affiliate, including the Company, designated by Neptune Holding US GP). Accordingly, the carried units are presented as temporary equity on the consolidated balance sheet at fair value. Adjustments to fair value at each reporting period are recorded in paid in capital.
The right of Neptune Holding US GP LLC to assign to an affiliate, including the Company, the right to repurchase an employee's vested units during the sixty-day period following termination, or to satisfy its obligation to repurchase an employee's vested units during annual sixty-day periods following the fourth anniversary of the Base Date, may be exercised by Neptune Holding US GP LLC in its discretion at the time a repurchase right or obligation arises. The carry unit plan requires the purchase price payable to the employee or former employee, as the case may be, to be paid in cash, a promissory note (with a term of not more than 3 years and bearing interest at the long-term applicable federal rate under Section 1274(d) of the Internal Revenue Code) or combination thereof, in each case as determined by Neptune Holding US GP LLC in its discretion at the time of the repurchase. Neptune Holding US GP LLC expects that vested units will be redeemed for shares of Class A common stock upon vesting.
NOTE 15. AFFILIATE AND RELATED PARTY TRANSACTIONS
Equity Method Investments
In July 2016, the Company completed the sale of a 75% interest in Newsday LLC to an employee of the Company. The Company retained the remaining 25% ownership interest. Effective July 7, 2016, the operating results of Newsday are no longer consolidated with those of the Company and the Company's 25% interest in the operating results of Newsday is recorded on the equity basis.
At December 31, 2016, the Company's investment in Newsday was $3,640 and is included in investments in affiliates on our consolidated balance sheet. For the period July 8, 2016 to December 31, 2016, the Company recorded equity in net loss of Newsday of $1,132.
In December 2016, the Company made an investment of $1,966 in I24NEWS, Altice N.V.'s 24/7 international news and current affairs channel, representing a 25% ownership interest, which is included in investments in affiliates on our consolidated balance sheet at December 31, 2016. The 75% interest is owned by a subsidiary of Altice N.V. The operating results of I24NEWS will be recorded on an equity basis upon commencement of operations in 2017.
Affiliate and Related Party Transactions
As the transactions discussed below were conducted between subsidiaries under common control, amounts charged for certain services may not have represented amounts that might have been received or incurred if the transactions were based upon arm's length negotiations.
F-81
NOTES TO CONSOLIDATED FINANCIAL STATEMENTS (Continued)
(Dollars in thousands, except share and per share amounts)
NOTE 15. AFFILIATE AND RELATED PARTY TRANSACTIONS (Continued)
The following table summarizes the revenue and charges related to services provided to or received from subsidiaries of Altice N.V. and Newsday for the year ended December 31, 2016:
Revenue |
$ | 1,086 | ||
| | | | | |
| | | | | |
| | | | | |
Operating expenses: |
||||
Programming and other direct costs |
$ | (1,947 | ) | |
Other operating expenses |
(18,854 | ) | ||
| | | | | |
Operating expenses, net |
(20,801 | ) | ||
| | | | | |
Interest expense(a) |
(112,712 | ) | ||
| | | | | |
Net charges |
$ | (132,427 | ) | |
| | | | | |
| | | | | |
| | | | | |
Capital Expenditures |
$ | 45,886 | ||
| | | | | |
| | | | | |
| | | | | |
- (a)
- See Note 9 for a discussion of interest expense related to notes payable to affiliates and related parties of $102,557, as well as for interest expense of $10,155 related to the Holdco Notes prior to the exchange.
Revenue
The Company recognized revenue in connection with sale of advertising to Newsday.
Programming and other direct costs
Programming and other direct costs includes costs incurred by the Company for the transport and termination of voice and data services provided by a subsidiary of Altice N.V.
Other operating expenses
A subsidiary of Altice N.V. provides certain executive services, including CEO, CFO and COO services, to the Company. Compensation under the terms of the agreement is an annual fee of $30,000 to be paid by the Company. Fees associated with this agreement recorded by the Company amounted to approximately $20,556 for the year ended December 31, 2016.
Other operating expenses includes advertising purchased from Newsday of $705 and IT consulting services of $182 provided by an Altice N.V. subsidiary, partially offset by a credit of $2,589 for transition services provided to Newsday.
Capital expenditures
The Company purchased equipment of $44,121 from Altice Management International and $1,025 from another Altice N.V. subsidiary. In addition, the Company acquired certain software development services that were capitalized from Altice Labs S.A. aggregating $740.
F-82
NOTES TO CONSOLIDATED FINANCIAL STATEMENTS (Continued)
(Dollars in thousands, except share and per share amounts)
NOTE 15. AFFILIATE AND RELATED PARTY TRANSACTIONS (Continued)
Aggregate amounts that were due from and due to related parties at December 31, 2016 is summarized below:
Due from: |
||||
Altice US Finance S.A.(a) |
$ | 12,951 | ||
Newsday(b) |
6,114 | |||
Altice Management Americas(b) |
3,117 | |||
| | | | | |
|
$ | 22,182 | ||
| | | | | |
| | | | | |
| | | | | |
Due to: |
||||
CVC 3BV(c) |
71,655 | |||
Neptune Holdings US LP(c) |
7,962 | |||
Altice Management International(d) |
44,121 | |||
Newsday(b) |
275 | |||
Other Altice subsidiaries(b) |
3,350 | |||
| | | | | |
|
$ | 127,363 | ||
| | | | | |
| | | | | |
| | | | | |
- (a)
- Represents
interest on senior notes paid by the Company on behalf of the affiliate.
- (b)
- Represents
amounts paid by the Company on behalf of the respective related party and/or the net amounts due from the related party for services provided.
- (c)
- Represents
distributions payable to shareholders.
- (d)
- Represents amounts due for equipment purchases and software development services discussed above.
The table above does not include notes payable to affiliates and related parties of $1,750,000 and the related accrued interest of $102,557 as December 31, 2016 which is reflected in accrued interest in the Company's balance sheet. See discussion in Note 9.
F-83
NOTES TO CONSOLIDATED FINANCIAL STATEMENTS (Continued)
(Dollars in thousands, except share and per share amounts)
NOTE 16. COMMITMENTS AND CONTINGENCIES
Commitments
Future cash payments and commitments required under arrangements pursuant to contracts entered into by the Company in the normal course of business as of December 31, 2016 are as follows:
| |
Payments Due by Period | |||||||||||||||
|---|---|---|---|---|---|---|---|---|---|---|---|---|---|---|---|---|
| |
Total | Year 1 | Years 2 - 3 | Years 4 - 5 | More than 5 years |
|||||||||||
Off balance sheet arrangements: |
||||||||||||||||
Purchase obligations(a) |
$ | 7,136,605 | $ | 2,396,634 | $ | 3,307,915 | $ | 1,394,318 | $ | 37,738 | ||||||
Guarantees(b) |
19,793 | 3,909 | 15,884 | — | — | |||||||||||
Letters of credit(c) |
114,251 | 220 | 14,297 | 99,734 | — | |||||||||||
| | | | | | | | | | | | | | | | | |
Total |
$ | 7,270,649 | $ | 2,400,763 | $ | 3,338,096 | $ | 1,494,052 | $ | 37,738 | ||||||
| | | | | | | | | | | | | | | | | |
| | | | | | | | | | | | | | | | | |
| | | | | | | | | | | | | | | | | |
- (a)
- Purchase
obligations primarily include contractual commitments with various programming vendors to provide video services to customers and minimum purchase
obligations to purchase goods or services. Future fees payable under contracts with programming vendors are based on numerous factors, including the number of subscribers receiving the programming.
Amounts reflected above related to programming agreements are based on the number of subscribers receiving the programming as of December 2016 multiplied by the per subscriber rates or the stated
annual fee, as applicable, contained in the executed agreements in effect as of December 31, 2016.
- (b)
- Includes
franchise and performance surety bonds primarily for the Company's cable television systems.
- (c)
- Represent letters of credit guaranteeing performance to municipalities and public utilities and payment of insurance premiums. Payments due by period for these arrangements represent the year in which the commitment expires although payments under these arrangements are required only in the event of nonperformance.
The table above does not include obligations for payments required to be made under multi-year franchise agreements based on a percentage of revenues generated from video service per year.
Many of the Company's franchise agreements and utility pole leases require the Company to remove its cable wires and other equipment upon termination of the respective agreements. The Company has concluded that the fair value of these asset retirement obligations cannot be reasonably estimated since the range of potential settlement dates is not determinable.
Legal Matters
Cable Operations Litigation
Marchese, et al. v. Cablevision Systems Corporation and CSC Holdings, LLC:
The Company is a defendant in a lawsuit filed in the U.S. District Court for the District of New Jersey by several present and former Cablevision subscribers, purportedly on behalf of a class of iO video subscribers in New Jersey, Connecticut and New York. After three versions of the complaint were dismissed without prejudice by the District Court, plaintiffs filed their third amended complaint on
F-84
NOTES TO CONSOLIDATED FINANCIAL STATEMENTS (Continued)
(Dollars in thousands, except share and per share amounts)
NOTE 16. COMMITMENTS AND CONTINGENCIES (Continued)
August 22, 2011, alleging that the Company violated Section 1 of the Sherman Antitrust Act by allegedly tying the sale of interactive services offered as part of iO television packages to the rental and use of set-top boxes distributed by Cablevision, and violated Section 2 of the Sherman Antitrust Act by allegedly seeking to monopolize the distribution of Cablevision compatible set-top boxes. Plaintiffs seek unspecified treble monetary damages, attorney's fees, as well as injunctive and declaratory relief. On September 23, 2011, the Company filed a motion to dismiss the third amended complaint. On January 10, 2012, the District Court issued a decision dismissing with prejudice the Section 2 monopolization claim, but allowing the Section 1 tying claim and related state common law claims to proceed. Cablevision's answer to the third amended complaint was filed on February 13, 2012. On December 7, 2015, the parties entered into a settlement agreement, which is subject to approval by the Court. On December 11, 2015, plaintiffs filed a motion for preliminary approval of the settlement, conditional certification of the settlement class, and approval of a class notice distribution plan. On March 10, 2016 the Court granted preliminary approval of the settlement and approved the class notice distribution plan. Class notice distribution and the claims submission process have now concluded. The Court granted final approval of the settlement on September 12, 2016, and the effective date of the settlement was October 24, 2016. The Company recorded an expense of $15,600 in connection with settlement. As of December 31, 2016, the Company has an estimated liability associated with the settlement of $6,100 representing the cost of benefits to class members that are reasonably expected to be provided and has paid out $9,500 in attorneys' fees.
In re Cablevision Consumer Litigation:
Following expiration of the affiliation agreements for carriage of certain Fox broadcast stations and cable networks on October 16, 2010, News Corporation terminated delivery of the programming feeds to the Company, and as a result, those stations and networks were unavailable on the Company's cable television systems. On October 30, 2010, the Company and Fox reached an agreement on new affiliation agreements for these stations and networks, and carriage was restored. Several purported class action lawsuits were subsequently filed on behalf of the Company's customers seeking recovery for the lack of Fox programming. Those lawsuits were consolidated in an action before the U. S. District Court for the Eastern District of New York, and a consolidated complaint was filed in that court on February 22, 2011. Plaintiffs asserted claims for breach of contract, unjust enrichment, and consumer fraud, seeking unspecified compensatory damages, punitive damages and attorneys' fees. On March 28, 2012, the Court ruled on the Company's motion to dismiss, denying the motion with regard to plaintiffs' breach of contract claim, but granting it with regard to the remaining claims, which were dismissed. On April 16, 2012, plaintiffs filed a second consolidated amended complaint, which asserts a claim only for breach of contract. The Company's answer was filed on May 2, 2012. On October 10, 2012, plaintiffs filed a motion for class certification and on December 13, 2012, a motion for partial summary judgment. On March 31, 2014, the Court granted plaintiffs' motion for class certification, and denied without prejudice plaintiffs' motion for summary judgment. On May 30, 2014, the Court approved the form of class notice, and on October 7, 2014, approved the class notice distribution plan. The class notice distribution has been completed, and the opt-out period expired on February 27, 2015. Expert discovery commenced on May 5, 2014, and concluded on December 8 and 28, 2015, when the Court ruled on the pending expert discovery motions. On January 26, 2016, the Court approved a schedule for filing of summary judgment motions. Plaintiffs filed a motion for summary judgment on March 31, 2016. The Company filed its own summary judgment motion on June 13, 2016. The parties are actively engaged in settlement discussions although financial terms have not yet been finalized. The
F-85
NOTES TO CONSOLIDATED FINANCIAL STATEMENTS (Continued)
(Dollars in thousands, except share and per share amounts)
NOTE 16. COMMITMENTS AND CONTINGENCIES (Continued)
motions for summary judgment have been denied with leave to re-file in the event the discussions between the parties are not successful. In the period ended June 21, 2016 to December 31, 2016, the Company recorded an estimated liability associated with a potential settlement totaling $5,200. The amount ultimately paid in connection with a possible settlement could exceed the amount recorded.
Patent Litigation
Cablevision is named as a defendant in certain lawsuits claiming infringement of various patents relating to various aspects of the Company's businesses. In certain of these cases other industry participants are also defendants. In certain of these cases the Company expects that any potential liability would be the responsibility of the Company's equipment vendors pursuant to applicable contractual indemnification provisions. The Company believes that the claims are without merit and intends to defend the actions vigorously, but is unable to predict the outcome of these lawsuits or reasonably estimate a range of possible loss.
In addition to the matters discussed above, the Company is party to various lawsuits, some involving claims for substantial damages. Although the outcome of these other matters cannot be predicted and the impact of the final resolution of these other matters on the Company's results of operations in a particular subsequent reporting period is not known, management does not believe that the resolution of these other lawsuits will have a material adverse effect on the financial position of the Company or the ability of the Company to meet its financial obligations as they become due.
NOTE 17. ALLOWANCE FOR DOUBTFUL ACCOUNTS
Activity related to the allowance for doubtful accounts for the year ended December 31, 2016:
| |
Balance at Beginning of Period |
Provision for Bad Debt |
Deductions/ Write-Offs and Other Charges |
Balance at End of Period |
|||||||||
|---|---|---|---|---|---|---|---|---|---|---|---|---|---|
Allowance for doubtful accounts |
$ | 1,051 | $ | 53,249 | $ | (42,623 | ) | $ | 11,677 | ||||
| | | | | | | | | | | | | | |
| | | | | | | | | | | | | | |
| | | | | | | | | | | | | | |
NOTE 18. SEGMENT INFORMATION
The Company classifies its operations into two reportable segments: Cablevision and Cequel. The Company's reportable segments are strategic business units that are managed separately. The Company evaluates segment performance based on several factors, of which the primary financial measure is business segment Adjusted EBITDA, a non-GAAP measure. The Company defines Adjusted EBITDA as net income (loss) excluding income taxes, income (loss) from discontinued operations, non-operating other income or expenses, loss on extinguishment of debt and write-off of deferred financing costs, gain (loss) on equity derivative contracts, gain (loss) on investments, interest expense (including cash interest expense), interest income, depreciation and amortization (including impairments), share-based compensation expense or benefit, restructuring expense or credits and transaction expenses. The
F-86
NOTES TO CONSOLIDATED FINANCIAL STATEMENTS (Continued)
(Dollars in thousands, except share and per share amounts)
NOTE 18. SEGMENT INFORMATION (Continued)
Company has presented the components that reconcile Adjusted EBITDA to operating income, an accepted GAAP measure for the year ended December 31, 2016.
| |
Cablevision | Cequel | Total | |||||||
|---|---|---|---|---|---|---|---|---|---|---|
Operating income |
$ | 74,865 | $ | 384,801 | $ | 459,666 | ||||
Share-based compensation |
9,164 | 5,204 | 14,368 | |||||||
Restructuring and other expense |
212,150 | 28,245 | 240,395 | |||||||
Depreciation and amortization (including impairments) |
963,665 | 736,641 | 1,700,306 | |||||||
| | | | | | | | | | | |
Adjusted EBITDA |
$ | 1,259,844 | $ | 1,154,891 | $ | 2,414,735 | ||||
| | | | | | | | | | | |
| | | | | | | | | | | |
| | | | | | | | | | | |
A reconciliation of reportable segment amounts to the Company's consolidated balances for the year ended December 31, 2016 is as follows:
Operating income for reportable segments |
$ | 459,666 | ||
Items excluded from operating income: |
||||
Interest expense |
(1,456,541 | ) | ||
Interest income |
13,811 | |||
Gain on investments, net |
141,896 | |||
Loss on equity derivative contracts, net |
(53,696 | ) | ||
Loss on interest rate swap contracts |
(72,961 | ) | ||
Loss on extinguishment of debt and write-off of deferred financing costs |
(127,649 | ) | ||
Other income, net |
4,329 | |||
| | | | | |
Loss before income taxes |
$ | (1,091,145 | ) | |
| | | | | |
| | | | | |
| | | | | |
The following table presents the composition of revenue by segment for the year ended December 31, 2016:
| |
Cablevision | Cequel | Total | |||||||
|---|---|---|---|---|---|---|---|---|---|---|
Revenue: |
||||||||||
Residential: |
||||||||||
Video |
$ | 1,638,691 | $ | 1,120,525 | $ | 2,759,216 | ||||
High-speed data |
782,615 | 834,414 | 1,617,029 | |||||||
Voice |
376,034 | 153,939 | 529,973 | |||||||
Business Services |
468,632 | 350,909 | 819,541 | |||||||
Advertising |
157,331 | 88,371 | 245,702 | |||||||
Other |
20,749 | 25,002 | 45,751 | |||||||
| | | | | | | | | | | |
Total Revenue |
$ | 3,444,052 | $ | 2,573,160 | $ | 6,017,212 | ||||
| | | | | | | | | | | |
| | | | | | | | | | | |
| | | | | | | | | | | |
F-87
NOTES TO CONSOLIDATED FINANCIAL STATEMENTS (Continued)
(Dollars in thousands, except share and per share amounts)
NOTE 18. SEGMENT INFORMATION (Continued)
Capital expenditures for the year ended December 31, 2016 by reportable segment are presented below:
Cablevision |
$ | 298,357 | ||
Cequel |
327,184 | |||
| | | | | |
|
$ | 625,541 | ||
| | | | | |
| | | | | |
| | | | | |
All revenues and assets of the Company's reportable segments are attributed to or located in the United States.
Total assets by segment are not provided as such amounts are not regularly reviewed by the chief operating decision maker for purposes of decision making regarding resource allocations.
NOTE 19. UNAUDITED PRO FORMA NET LOSS PER SHARE
The pro forma net loss per share data for the year ended December 31, 2016 is based on our historical statement of operations after giving effect to the issuance and sale of the shares of common stock in connection with the Company's initial offering of equity securities to the public ("IPO"), as well as the common stock to be issued in the organizational transactions discussed below, as if they occurred at the beginning of the period.
| |
Year Ended December 31, |
|||
|---|---|---|---|---|
| |
Basic and Diluted | |||
| |
(Unaudited) |
|||
Numerator: |
||||
Net loss attributable to Altice USA, Inc. stockholders |
$ | (832,030 | ) | |
Denominator: |
||||
Weighted average shares of common stock outstanding—basic and diluted (in thousands) |
0.1 | |||
Pro forma adjustment to reflect the issuance of common stock (in thousands) |
737,069 | |||
Weighted average shares of common stock outstanding used in computing the pro forma net income per share—basic and diluted (in thousands) |
737,069 | |||
| | | | | |
| | | | | |
| | | | | |
Pro forma net loss per share—basic and diluted |
$ | (1.13 | ) | |
| | | | | |
| | | | | |
| | | | | |
The following organizational transactions will be consummated in connection with the Company's IPO:
- •
- the Company will amend and restate its certificate of incorporation to, among other things, provide for Class A common stock,
Class B common stock and Class C common stock;
- •
- the Co-Investors and an entity controlled by Mr. Drahi will exchange their indirect ownership interest in the Company for shares of the Company's common stock;
F-88
NOTES TO CONSOLIDATED FINANCIAL STATEMENTS (Continued)
(Dollars in thousands, except share and per share amounts)
NOTE 19. UNAUDITED PRO FORMA NET LOSS PER SHARE (Continued)
- •
- Neptune Management LP ("Management LP") will redeem its Class B units for shares of the Company's common stock that it
receives from the redemption of its Class B units in Neptune Holding US LP;
- •
- the Company will convert $525,000 aggregate principal amount of notes issued by the Company to the Co-Investors (together with accrued and
unpaid interest and applicable premium) into shares of the Company's common stock at the initial public offering price;
- •
- $1,225 million aggregate principal amount of notes issued by the Company to a subsidiary of Altice N.V. (together with accrued and
unpaid interest and applicable premium) will be transferred to CVC 3 and then the Company will convert such notes into shares of the Company's common stock at the initial public offering price;
- •
- the Co-Investors, Neptune Holding US LP, an entity controlled by the family of Mr. Drahi and former Class B unitholders of
Management LP (including an entity controlled by Mr. Drahi) will exchange shares of the Company's common stock for new shares of the Company's Class A common stock; and
- •
- CVC 3 B.V., an indirect subsidiary of Altice N.V., and an entity controlled by the family of Mr. Drahi will exchange shares of the Company's common stock for new shares of the Company's Class B common stock.
NOTE 20. SUBSEQUENT EVENTS
In January 2017, CSC Holdings borrowed $225,000 under its revolving credit facility and in February 2017, made a repayment of $175,000 with cash on hand.
On March 15, 2017, CSC Holdings priced $3,000,000 of 8.25-year senior secured term loans with institutional investors. The new senior secured term loans will bear interest at 2.25% over LIBO rate. The closing of the new financing is subject to closing conditions and the proceeds will be used to refinance the entire $2,500,000 principal amount of loans under CSC Holdings Term Credit Facility that matures in October 2024 and redeem $500,000 of the 8.625% Senior Notes due September 2017 issued by Cablevision.
On March 15, 2017, Altice US Finance I Corporation priced $1,265,000 of 8.25-year senior secured term loans with institutional investors. The new senior secured term loans will bear interest at 2.25% over LIBO rate. The closing of the new financing is subject to closing conditions and the proceeds will be used to refinance the $815,000 principal amount of loans under the term loan facility that matures in January 2025 and redeem $450,000 of the 2020 Notes.
In April 2017, the Company made a cash distribution of $169,950 to the Company's stockholders.
F-89
Report of Independent Registered Public Accounting Firm
The
Board of Directors
Cablevision Systems Corporation:
We have audited the accompanying consolidated balance sheet of Cablevision Systems Corporation and subsidiaries (the Company) as of December 31, 2015 and the related consolidated statements of operations and comprehensive income (loss), stockholders' equity (deficiency), and cash flows for the period from January 1, 2016 to June 20, 2016, and the years ended December 31, 2015 and 2014. These consolidated financial statements are the responsibility of the Company's management. Our responsibility is to express an opinion on these consolidated financial statements based on our audits.
We conducted our audits in accordance with the standards of the Public Company Accounting Oversight Board (United States). Those standards require that we plan and perform the audit to obtain reasonable assurance about whether the financial statements are free of material misstatement. An audit includes examining, on a test basis, evidence supporting the amounts and disclosures in the financial statements. An audit also includes assessing the accounting principles used and significant estimates made by management, as well as evaluating the overall financial statement presentation. We believe that our audits provide a reasonable basis for our opinion.
In our opinion, the consolidated financial statements referred to above present fairly, in all material respects, the financial position of Cablevision Systems Corporation and subsidiaries as of December 31, 2015, and the results of their operations and their cash flows for the period from January 1, 2016 to June 20, 2016, and the years ended December 31, 2015 and 2014, in conformity with U.S. generally accepted accounting principles.
| /s/ KPMG LLP | ||
New York, New York April 10, 2017 |
F-90
CABLEVISION SYSTEMS CORPORATION AND SUBSIDIARIES
CONSOLIDATED BALANCE SHEET
December 31, 2015
(In thousands)
ASSETS
|
December 31, 2015 |
|||
|---|---|---|---|---|
Current Assets: |
||||
Cash and cash equivalents |
$ | 1,003,279 | ||
Restricted cash |
1,600 | |||
Accounts receivable, trade (less allowance for doubtful accounts of $6,039) |
266,383 | |||
Prepaid expenses and other current assets |
123,242 | |||
Amounts due from affiliates |
767 | |||
Deferred tax asset |
14,596 | |||
Investment securities pledged as collateral |
455,386 | |||
Derivative contracts |
10,333 | |||
| | | | | |
Total current assets |
1,875,586 | |||
Property, plant and equipment, net of accumulated depreciation of $9,625,348 |
3,017,015 | |||
Investment securities pledged as collateral |
756,596 | |||
Derivative contracts |
72,075 | |||
Other assets |
32,920 | |||
Amortizable customer relationships, net of accumulated amortization of $27,778 |
11,636 | |||
Other amortizable intangibles, net of accumulated amortization of $32,532 |
25,315 | |||
Trademarks and other indefinite-lived intangible assets |
7,250 | |||
Indefinite-lived cable television franchises |
731,848 | |||
Goodwill |
262,345 | |||
Deferred financing costs, net of accumulated amortization of $8,150 |
7,588 | |||
| | | | | |
|
$ | 6,800,174 | ||
| | | | | |
| | | | | |
| | | | | |
See accompanying notes to consolidated financial statements.
F-91
CABLEVISION SYSTEMS CORPORATION AND SUBSIDIARIES
CONSOLIDATED BALANCE SHEET (Continued)
(In thousands, except share and per share amounts)
LIABILITIES AND STOCKHOLDERS' DEFICIENCY
|
December 31, 2015 |
|||
|---|---|---|---|---|
Current Liabilities: |
||||
Accounts payable |
$ | 453,653 | ||
Accrued liabilities: |
||||
Interest |
119,005 | |||
Employee related costs |
344,091 | |||
Other accrued expenses |
169,899 | |||
Amounts due to affiliates |
29,729 | |||
Deferred revenue |
55,545 | |||
Liabilities under derivative contracts |
2,706 | |||
Credit facility debt |
562,898 | |||
Collateralized indebtedness |
416,621 | |||
Capital lease obligations |
20,350 | |||
Notes payable |
13,267 | |||
| | | | | |
Total current liabilities |
2,187,764 | |||
Defined benefit plan obligations |
99,228 | |||
Other liabilities |
165,768 | |||
Deferred tax liability |
704,835 | |||
Credit facility debt |
1,951,556 | |||
Collateralized indebtedness |
774,703 | |||
Senior notes and debentures |
5,801,011 | |||
Capital lease obligations |
25,616 | |||
Notes payable |
1,277 | |||
| | | | | |
Total liabilities |
11,711,758 | |||
| | | | | |
Commitments and contingencies |
||||
Stockholders' Deficiency: |
||||
Preferred Stock, $.01 par value, 50,000,000 shares authorized, none issued |
— | |||
CNYG Class A common stock, $.01 par value, 800,000,000 shares authorized, 304,196,703 shares issued and 222,572,210 shares outstanding |
3,042 | |||
CNYG Class B common stock, $.01 par value, 320,000,000 shares authorized, 54,137,673 shares issued and outstanding |
541 | |||
RMG Class A common stock, $.01 par value, 600,000,000 shares authorized, none issued |
— | |||
RMG Class B common stock, $.01 par value, 160,000,000 shares authorized, none issued |
— | |||
Paid-in capital |
792,351 | |||
Accumulated deficit |
(4,059,411 | ) | ||
| | | | | |
|
(3,263,477 | ) | ||
Treasury stock, at cost (81,624,493 CNYG Class A common shares) |
(1,610,167 | ) | ||
Accumulated other comprehensive loss |
(37,672 | ) | ||
| | | | | |
Total stockholders' deficiency |
(4,911,316 | ) | ||
Noncontrolling interest |
(268 | ) | ||
| | | | | |
Total deficiency |
(4,911,584 | ) | ||
| | | | | |
|
$ | 6,800,174 | ||
| | | | | |
| | | | | |
| | | | | |
See accompanying notes to consolidated financial statements.
F-92
CABLEVISION SYSTEMS CORPORATION AND SUBSIDIARIES
CONSOLIDATED STATEMENTS OF OPERATIONS
(In thousands, except per share amounts)
| |
January 1, 2016 to June 20, 2016 |
Year ended December 31, 2015 |
Year ended December 31, 2014 |
|||||||
|---|---|---|---|---|---|---|---|---|---|---|
Revenue (including revenue from affiliates of $2,088, $5,343 and $5,075, respectively) (See Note 16) |
$ | 3,137,604 | $ | 6,545,545 | $ | 6,508,557 | ||||
| | | | | | | | | | | |
Operating expenses: |
||||||||||
Programming and other direct costs (including charges from affiliates of $84,636, $176,909 and $179,144, respectively) (See Note 16) |
1,088,555 | 2,269,290 | 2,197,735 | |||||||
Other operating expenses (including charges (credits) from affiliates of $2,182, $5,372 and $3,878, respectively) (See Note 16) |
1,136,970 | 2,546,319 | 2,520,582 | |||||||
Restructuring and other expense |
22,223 | 16,213 | 2,480 | |||||||
Depreciation and amortization (including impairments) |
414,550 | 865,252 | 866,502 | |||||||
| | | | | | | | | | | |
|
2,662,298 | 5,697,074 | 5,587,299 | |||||||
| | | | | | | | | | | |
Operating income |
475,306 | 848,471 | 921,258 | |||||||
| | | | | | | | | | | |
Other income (expense): |
||||||||||
Interest expense |
(287,098 | ) | (585,764 | ) | (576,000 | ) | ||||
Interest income |
1,590 | 925 | 420 | |||||||
Gain (loss) on investments, net |
129,990 | (30,208 | ) | 129,659 | ||||||
Gain (loss) on equity derivative contracts, net |
(36,283 | ) | 104,927 | (45,055 | ) | |||||
Loss on extinguishment of debt and write-off of deferred financing costs |
— | (1,735 | ) | (10,120 | ) | |||||
Other expense, net |
4,855 | 6,045 | 4,988 | |||||||
| | | | | | | | | | | |
|
(186,946 | ) | (505,810 | ) | (496,108 | ) | ||||
| | | | | | | | | | | |
Income from continuing operations before income taxes |
288,360 | 342,661 | 425,150 | |||||||
Income tax expense |
(124,848 | ) | (154,872 | ) | (115,768 | ) | ||||
| | | | | | | | | | | |
Income from continuing operations, net of income taxes |
163,512 | 187,789 | 309,382 | |||||||
Income (loss) from discontinued operations, net of income taxes |
— | (12,541 | ) | 2,822 | ||||||
| | | | | | | | | | | |
Net income |
163,512 | 175,248 | 312,204 | |||||||
Net loss (income) attributable to noncontrolling interests |
236 | 201 | (765 | ) | ||||||
| | | | | | | | | | | |
Net income attributable to Cablevision Systems Corporation stockholders |
$ | 163,748 | $ | 175,449 | $ | 311,439 | ||||
| | | | | | | | | | | |
| | | | | | | | | | | |
| | | | | | | | | | | |
INCOME PER SHARE: |
||||||||||
Basic income (loss) per share attributable to Cablevision Systems Corporation stockholder(s): |
||||||||||
Income from continuing operations, net of income taxes |
$ | 0.60 | $ | 0.70 | $ | 1.17 | ||||
| | | | | | | | | | | |
| | | | | | | | | | | |
| | | | | | | | | | | |
Income (loss) from discontinued operations, net of income taxes |
$ | — | $ | (0.05 | ) | $ | 0.01 | |||
| | | | | | | | | | | |
| | | | | | | | | | | |
| | | | | | | | | | | |
Net income |
$ | 0.60 | $ | 0.65 | $ | 1.18 | ||||
| | | | | | | | | | | |
| | | | | | | | | | | |
| | | | | | | | | | | |
Basic weighted average common shares (in thousands) |
272,035 | 269,388 | 264,623 | |||||||
| | | | | | | | | | | |
| | | | | | | | | | | |
| | | | | | | | | | | |
Diluted income (loss) per share attributable to Cablevision Systems Corporation stockholder(s): |
||||||||||
Income from continuing operations, net of income taxes |
$ | 0.58 | $ | 0.68 | $ | 1.14 | ||||
| | | | | | | | | | | |
| | | | | | | | | | | |
| | | | | | | | | | | |
Income (loss) from discontinued operations, net of income taxes |
$ | — | $ | (0.05 | ) | $ | 0.01 | |||
| | | | | | | | | | | |
| | | | | | | | | | | |
| | | | | | | | | | | |
Net income |
$ | 0.58 | $ | 0.63 | $ | 1.15 | ||||
| | | | | | | | | | | |
| | | | | | | | | | | |
| | | | | | | | | | | |
Diluted weighted average common shares (in thousands) |
280,199 | 276,339 | 270,703 | |||||||
| | | | | | | | | | | |
| | | | | | | | | | | |
| | | | | | | | | | | |
Amounts attributable to Cablevision Systems Corporation stockholder(s): |
||||||||||
Income from continuing operations, net of income taxes |
$ | 163,748 | $ | 187,990 | $ | 308,617 | ||||
Income (loss) from discontinued operations, net of income taxes |
— | (12,541 | ) | 2,822 | ||||||
| | | | | | | | | | | |
Net income |
$ | 163,748 | $ | 175,449 | $ | 311,439 | ||||
| | | | | | | | | | | |
| | | | | | | | | | | |
| | | | | | | | | | | |
Cash dividends declared and paid per share of common stock |
$ | — | $ | 0.45 | $ | 0.60 | ||||
| | | | | | | | | | | |
| | | | | | | | | | | |
| | | | | | | | | | | |
See accompanying notes to consolidated financial statements.
F-93
CABLEVISION SYSTEMS CORPORATION AND SUBSIDIARIES
CONSOLIDATED STATEMENTS OF COMPREHENSIVE INCOME (LOSS)
(In thousands)
| |
January 1, 2016 to June 20, 2016 |
Year ended December 31, 2015 |
Year ended December 31, 2014 |
|||||||
|---|---|---|---|---|---|---|---|---|---|---|
Net income |
$ | 163,512 | $ | 175,248 | $ | 312,204 | ||||
| | | | | | | | | | | |
Other comprehensive income (loss): |
||||||||||
Defined benefit pension and postretirement plans (see Note 14): |
||||||||||
Unrecognized actuarial gain (loss) |
68 | 2,694 | (6,866 | ) | ||||||
Applicable income taxes |
(28 | ) | (1,106 | ) | 2,815 | |||||
| | | | | | | | | | | |
Unrecognized income (loss) arising during period, net of income taxes |
40 | 1,588 | (4,051 | ) | ||||||
| | | | | | | | | | | |
Amortization of actuarial losses, net included in net periodic benefit cost |
929 | 1,224 | 2,296 | |||||||
Applicable income taxes |
(388 | ) | (502 | ) | (941 | ) | ||||
| | | | | | | | | | | |
Amortization of actuarial losses, net included in net periodic benefit cost, net of income taxes |
541 | 722 | 1,355 | |||||||
| | | | | | | | | | | |
Settlement loss included in net periodic benefit cost |
1,655 | 3,822 | 5,347 | |||||||
Applicable income taxes |
(679 | ) | (1,569 | ) | (2,192 | ) | ||||
| | | | | | | | | | | |
Settlement loss included in net periodic benefit cost, net of income taxes |
976 | 2,253 | 3,155 | |||||||
| | | | | | | | | | | |
Other comprehensive income |
1,557 | 4,563 | 459 | |||||||
| | | | | | | | | | | |
Comprehensive income |
165,069 | 179,811 | 312,663 | |||||||
Comprehensive loss (income) attributable to noncontrolling interests |
236 | 201 | (765 | ) | ||||||
| | | | | | | | | | | |
Comprehensive income attributable to Cablevision Systems Corporation stockholder(s) |
$ | 165,305 | $ | 180,012 | $ | 311,898 | ||||
| | | | | | | | | | | |
| | | | | | | | | | | |
| | | | | | | | | | | |
See accompanying notes to consolidated financial statements.
F-94
CABLEVISION SYSTEMS CORPORATION AND SUBSIDIARIES
CONSOLIDATED STATEMENTS OF STOCKHOLDERS' EQUITY (DEFICIENCY)
(In thousands)
| |
CNYG Class A Common Stock |
CNYG Class B Common Stock |
Paid-in Capital |
Accumulated Deficit |
Treasury Stock |
Accumulated Other Comprehensive Income (Loss) |
Total Stockholders' Equity (Deficiency) |
Non- controlling Interest |
Total Equity (Deficiency) |
|||||||||||||||||||
|---|---|---|---|---|---|---|---|---|---|---|---|---|---|---|---|---|---|---|---|---|---|---|---|---|---|---|---|---|
Balance at January 1, 2014 |
$ | 2,925 | $ | 541 | $ | 885,601 | $ | (4,546,299 | ) | $ | (1,584,404 | ) | $ | (42,694 | ) | $ | (5,284,330 | ) | $ | 786 | $ | (5,283,544 | ) | |||||
Net income attributable to Cablevision Systems Corporation stockholders |
— | — | — | 311,439 | — | — | 311,439 | — | 311,439 | |||||||||||||||||||
Net income attributable to noncontrolling interests |
— | — | — | — | — | — | — | 1,007 | 1,007 | |||||||||||||||||||
Pension and postretirement plan liability adjustments, net of income taxes |
— | — | — | — | — | 459 | 459 | — | 459 | |||||||||||||||||||
Proceeds from exercise of options and issuance of restricted shares |
78 | — | 55,252 | — | — | — | 55,330 | — | 55,330 | |||||||||||||||||||
Recognition of equity-based stock compensation arrangements |
— | — | 44,335 | — | — | — | 44,335 | — | 44,335 | |||||||||||||||||||
Treasury stock acquired from forfeiture and acquisition of restricted shares |
— | — | 9 | — | (6,617 | ) | — | (6,608 | ) | — | (6,608 | ) | ||||||||||||||||
Excess tax benefit on share-based awards |
— | — | 336 | — | — | — | 336 | — | 336 | |||||||||||||||||||
Dividends on CNYG Class A and CNYG Class B common stock |
— | — | (162,806 | ) | — | — | — | (162,806 | ) | — | (162,806 | ) | ||||||||||||||||
Adjustments to noncontrolling interests |
— | — | 376 | — | — | — | 376 | (1,014 | ) | (638 | ) | |||||||||||||||||
| | | | | | | | | | | | | | | | | | | | | | | | | | | | | |
Balance at December 31, 2014 |
$ | 3,003 | $ | 541 | $ | 823,103 | $ | (4,234,860 | ) | $ | (1,591,021 | ) | $ | (42,235 | ) | $ | (5,041,469 | ) | $ | 779 | $ | (5,040,690 | ) | |||||
| | | | | | | | | | | | | | | | | | | | | | | | | | | | | |
| | | | | | | | | | | | | | | | | | | | | | | | | | | | | |
| | | | | | | | | | | | | | | | | | | | | | | | | | | | | |
See accompanying notes to consolidated financial statements.
F-95
CABLEVISION SYSTEMS CORPORATION AND SUBSIDIARIES
CONSOLIDATED STATEMENTS OF STOCKHOLDERS' EQUITY (DEFICIENCY) (Continued)
(In thousands)
| |
CNYG Class A Common Stock |
CNYG Class B Common Stock |
Paid-in Capital |
Accumulated Deficit |
Treasury Stock |
Accumulated Other Comprehensive Income (Loss) |
Total Stockholders' Equity (Deficiency) |
Non- controlling Interest |
Total Equity (Deficiency) |
|||||||||||||||||||
|---|---|---|---|---|---|---|---|---|---|---|---|---|---|---|---|---|---|---|---|---|---|---|---|---|---|---|---|---|
Balance at January 1, 2015 |
$ | 3,003 | $ | 541 | $ | 823,103 | $ | (4,234,860 | ) | $ | (1,591,021 | ) | $ | (42,235 | ) | $ | (5,041,469 | ) | $ | 779 | $ | (5,040,690 | ) | |||||
Net income attributable to Cablevision Systems Corporation stockholders |
— | — | — | 175,449 | — | — | 175,449 | — | 175,449 | |||||||||||||||||||
Net loss attributable to noncontrolling interests |
— | — | — | — | — | — | — | (146 | ) | (146 | ) | |||||||||||||||||
Pension and postretirement plan liability adjustments, net of income taxes |
— | — | — | — | — | 4,563 | 4,563 | — | 4,563 | |||||||||||||||||||
Proceeds from exercise of options and issuance of restricted shares |
39 | — | 18,648 | — | — | — | 18,687 | — | 18,687 | |||||||||||||||||||
Recognition of equity-based stock compensation arrangements |
— | — | 60,817 | — | — | — | 60,817 | — | 60,817 | |||||||||||||||||||
Treasury stock acquired from forfeiture and acquisition of restricted shares |
— | — | 5 | — | (19,146 | ) | — | (19,141 | ) | — | (19,141 | ) | ||||||||||||||||
Excess tax benefit on share-based awards |
— | — | 5,694 | — | — | — | 5,694 | — | 5,694 | |||||||||||||||||||
Dividends on CNYG Class A and CNYG Class B common stock |
— | — | (124,752 | ) | — | — | — | (124,752 | ) | — | (124,752 | ) | ||||||||||||||||
Adjustments to noncontrolling interests |
— | — | 8,836 | — | — | — | 8,836 | (901 | ) | 7,935 | ||||||||||||||||||
| | | | | | | | | | | | | | | | | | | | | | | | | | | | | |
Balance at December 31, 2015 |
$ | 3,042 | $ | 541 | $ | 792,351 | $ | (4,059,411 | ) | $ | (1,610,167 | ) | $ | (37,672 | ) | $ | (4,911,316 | ) | $ | (268 | ) | $ | (4,911,584 | ) | ||||
| | | | | | | | | | | | | | | | | | | | | | | | | | | | | |
| | | | | | | | | | | | | | | | | | | | | | | | | | | | | |
| | | | | | | | | | | | | | | | | | | | | | | | | | | | | |
See accompanying notes to consolidated financial statements.
F-96
CABLEVISION SYSTEMS CORPORATION AND SUBSIDIARIES
CONSOLIDATED STATEMENTS OF STOCKHOLDERS' EQUITY (DEFICIENCY) (Continued)
(In thousands)
| |
CNYG Class A Common Stock |
CNYG Class B Common Stock |
Paid-in Capital |
Accumulated Deficit |
Treasury Stock |
Accumulated Other Comprehensive Income (Loss) |
Total Stockholders' Equity (Deficiency) |
Non- controlling Interest |
Total Equity (Deficiency) |
|||||||||||||||||||
|---|---|---|---|---|---|---|---|---|---|---|---|---|---|---|---|---|---|---|---|---|---|---|---|---|---|---|---|---|
Balance at January 1, 2016 |
$ | 3,042 | $ | 541 | $ | 792,351 | $ | (4,059,411 | ) | $ | (1,610,167 | ) | $ | (37,672 | ) | $ | (4,911,316 | ) | $ | (268 | ) | $ | (4,911,584 | ) | ||||
Net income attributable to Cablevision Systems Corporation stockholders |
— | — | — | 163,748 | — | — | 163,748 | — | 163,748 | |||||||||||||||||||
Net loss attributable to noncontrolling interests |
— | — | — | — | — | — | — | (236 | ) | (236 | ) | |||||||||||||||||
Pension and postretirement plan liability adjustments, net of income taxes |
— | — | — | — | — | 1,557 | 1,557 | — | 1,557 | |||||||||||||||||||
Proceeds from exercise of options and issuance of restricted shares |
15 | — | 14,544 | — | — | — | 14,559 | — | 14,559 | |||||||||||||||||||
Recognition of equity-based stock compensation arrangements |
— | — | 24,997 | — | — | — | 24,997 | — | 24,997 | |||||||||||||||||||
Treasury stock acquired from forfeiture and acquisition of restricted shares |
— | — | 1 | — | (41,470 | ) | — | (41,469 | ) | — | (41,469 | ) | ||||||||||||||||
Tax withholding associated with shares issued for equity-based compensation |
(4 | ) | — | (6,030 | ) | — | — | — | (6,034 | ) | — | (6,034 | ) | |||||||||||||||
Excess tax benefit on share-based awards |
— | — | 82 | — | — | — | 82 | — | 82 | |||||||||||||||||||
Contributions from noncontrolling interests |
— | — | — | — | — | — | — | 240 | 240 | |||||||||||||||||||
| | | | | | | | | | | | | | | | | | | | | | | | | | | | | |
Balance at June 20, 2016 |
$ | 3,053 | $ | 541 | $ | 825,945 | $ | (3,895,663 | ) | $ | (1,651,637 | ) | $ | (36,115 | ) | $ | (4,753,876 | ) | $ | (264 | ) | $ | (4,754,140 | ) | ||||
| | | | | | | | | | | | | | | | | | | | | | | | | | | | | |
| | | | | | | | | | | | | | | | | | | | | | | | | | | | | |
| | | | | | | | | | | | | | | | | | | | | | | | | | | | | |
See accompanying notes to consolidated financial statements.
F-97
CABLEVISION SYSTEMS CORPORATION AND SUBSIDIARIES
CONSOLIDATED STATEMENTS OF CASH FLOWS
(In thousands)
| |
January 1, 2016 to June 20, 2016 |
Year ended December 31, 2015 |
Year ended December 31, 2014 |
|||||||
|---|---|---|---|---|---|---|---|---|---|---|
Cash flows from operating activities: |
||||||||||
Net income |
$ | 163,512 | $ | 175,248 | $ | 312,204 | ||||
Adjustments to reconcile net income to net cash provided by (used in) operating activities: |
||||||||||
Loss (income) from discontinued operations, net of income taxes |
— | 12,541 | (2,822 | ) | ||||||
Depreciation and amortization (including impairments) |
414,550 | 865,252 | 866,502 | |||||||
Loss (gain) on investments, net |
(129,990 | ) | 30,208 | (129,659 | ) | |||||
Loss (gain) on equity derivative contracts, net |
36,283 | (104,927 | ) | 45,055 | ||||||
Loss on extinguishment of debt and write-off of deferred financing costs |
— | 1,735 | 10,120 | |||||||
Amortization of deferred financing costs and discounts (premiums) on indebtedness |
11,673 | 23,764 | 22,887 | |||||||
Share-based compensation expense |
24,778 | 60,321 | 43,984 | |||||||
Settlement loss and amortization of actuarial losses related to pension and postretirement plans |
2,584 | 5,046 | 7,643 | |||||||
Deferred income taxes |
116,150 | 133,396 | 159,779 | |||||||
Provision for doubtful accounts |
13,240 | 35,802 | 47,611 | |||||||
Excess tax benefits related to share-based awards |
(82 | ) | (5,694 | ) | (336 | ) | ||||
Change in assets and liabilities, net of effects of acquisitions and dispositions: |
||||||||||
Accounts receivable, trade |
(18,162 | ) | (24,760 | ) | (42,446 | ) | ||||
Prepaid expenses and other assets |
(844 | ) | 38,860 | 44,488 | ||||||
Amounts due from and due to affiliates, net |
(5,082 | ) | 1,043 | (1,463 | ) | |||||
Accounts payable |
36,147 | 6,896 | 25,486 | |||||||
Accrued liabilities |
(160,937 | ) | 1,200 | (35,931 | ) | |||||
Deferred revenue |
(9,726 | ) | 2,156 | 5,169 | ||||||
| | | | | | | | | | | |
Net cash provided by operating activities |
494,094 | 1,258,087 | 1,378,271 | |||||||
| | | | | | | | | | | |
Cash flows from investing activities: |
||||||||||
Capital expenditures |
(330,131 | ) | (816,396 | ) | (891,678 | ) | ||||
Proceeds related to sale of equipment, including costs of disposal |
1,106 | 4,407 | 6,178 | |||||||
Decrease (increase) in other investments |
610 | (7,779 | ) | (1,369 | ) | |||||
Additions to other intangible assets |
(1,709 | ) | (8,035 | ) | (1,193 | ) | ||||
| | | | | | | | | | | |
Net cash used in investing activities |
(330,124 | ) | (827,803 | ) | (888,062 | ) | ||||
| | | | | | | | | | | |
Cash flows from financing activities: |
||||||||||
Repayment of credit facility debt |
(14,953 | ) | (260,321 | ) | (990,785 | ) | ||||
Proceeds from issuance of senior notes |
— | — | 750,000 | |||||||
Proceeds from collateralized indebtedness |
337,149 | 774,703 | 416,621 | |||||||
Repayment of collateralized indebtedness and related derivative contracts |
(281,594 | ) | (639,237 | ) | (342,105 | ) | ||||
Redemption and repurchase of senior notes, including premiums and fees |
— | — | (36,097 | ) | ||||||
Repayment of notes payable |
(1,291 | ) | (2,458 | ) | (2,306 | ) | ||||
Proceeds from stock option exercises |
14,411 | 18,727 | 55,355 | |||||||
Tax withholding associated with shares issued for equity-based awards |
(6,034 | ) | — | — | ||||||
Dividend distributions to common stockholders |
(4,066 | ) | (125,170 | ) | (160,545 | ) | ||||
Principal payments on capital lease obligations |
(11,552 | ) | (20,250 | ) | (15,481 | ) | ||||
Deemed repurchases of restricted stock |
(41,469 | ) | (19,141 | ) | (6,608 | ) | ||||
Additions to deferred financing costs |
— | (250 | ) | (14,273 | ) | |||||
Payment for purchase of noncontrolling interest |
— | (8,300 | ) | — | ||||||
Contributions from (distributions to) noncontrolling interests, net |
240 | (901 | ) | (1,014 | ) | |||||
Excess tax benefit related to share-based awards |
82 | 5,694 | 336 | |||||||
| | | | | | | | | | | |
Net cash used in financing activities |
(9,077 | ) | (276,904 | ) | (346,902 | ) | ||||
| | | | | | | | | | | |
Net increase in cash and cash equivalents from continuing operations |
154,893 | 153,380 | 143,307 | |||||||
| | | | | | | | | | | |
Cash flows of discontinued operations: |
||||||||||
Net cash used in operating activities |
(21,000 | ) | (484 | ) | (1,199 | ) | ||||
Net cash provided by (used in) investing activities |
— | (30 | ) | 6,081 | ||||||
| | | | | | | | | | | |
Net increase (decrease) in cash and cash equivalents from discontinued operations |
(21,000 | ) | (514 | ) | 4,882 | |||||
| | | | | | | | | | | |
Cash and cash equivalents at beginning of period |
1,003,279 | 850,413 | 702,224 | |||||||
| | | | | | | | | | | |
Cash and cash equivalents at end of period |
$ | 1,137,172 | $ | 1,003,279 | $ | 850,413 | ||||
| | | | | | | | | | | |
| | | | | | | | | | | |
| | | | | | | | | | | |
See accompanying notes to consolidated financial statements.
F-98
NOTES TO CONSOLIDATED FINANCIAL STATEMENTS
(Dollars in thousands, except share and per share amounts)
NOTE 1. DESCRIPTION OF BUSINESS, RELATED MATTERS AND BASIS OF PRESENTATION
The Company and Related Matters
Cablevision Systems Corporation ("Cablevision"), through its wholly-owned subsidiary CSC Holdings, LLC ("CSC Holdings,") and collectively with Cablevision, the "Company"), owns and operates cable systems and owns companies that provide regional news, local programming and advertising sales services for the cable television industry and Ethernet-based data, Internet, voice and video transport and managed services to the business market. The Company operates and reports financial information in one segment. Prior to the sale of a 75% interest in Newsday LLC on July 7, 2016, the Company consolidating the operating results of Newsday. Effective July 7, 2016, the operating results of Newsday are no longer consolidated with those of the Company and the Company's 25% interest in the operating results of Newsday is recorded on the equity basis (see Note 16).
Altice Merger
On June 21, 2016 (the "Merger Date"), pursuant to the Agreement and Plan of Merger (the "Merger Agreement"), dated as of September 16, 2015, by and among Cablevision, Altice N.V. ("Altice"), Neptune Merger Sub Corp., a wholly-owned subsidiary of Altice ("Merger Sub"), Merger Sub merged with and into Cablevision, with Cablevision surviving the merger (the "Merger").
In connection with the Merger, each outstanding share of the Cablevision NY Group Class A common stock, par value $0.01 per share ("CNYG Class A Shares"), and Cablevision NY Group Class B common stock, par value $0.01 per share ("CNYG Class B Shares", and together with the CNYG Class A Shares, the "Shares") other than (i) Shares owned by Cablevision, Altice or any of their respective wholly-owned subsidiaries, in each case not held on behalf of third parties in a fiduciary capacity, received $34.90 in cash without interest, less applicable tax withholdings (the "Merger Consideration").
Pursuant to an agreement, dated December 21, 2015, by and among CVC 2 B.V., CIE Management IX Limited, for and on behalf of the limited partnerships BC European Capital IX-1 through 11 and Canada Pension Plan Investment Board, certain affiliates of BCP and CPPIB (the "Co-Investors") funded approximately $1,000,000 toward the payment of the aggregate Merger Consideration, and indirectly acquired approximately 30% of the Shares of Cablevision.
Also in connection with the Merger, outstanding equity-based awards granted under Cablevision's equity plans were cancelled and converted into cash based upon the $34.90 per Share merger price in accordance with the original terms of the awards. The total consideration for the outstanding CNYG Class A Shares, the outstanding CNYG Class B Shares, and the equity-based awards amounted to $9,958,323.
In connection with the Merger, in October 2015, Neptune Finco Corp. ("Finco"), an indirect wholly-owned subsidiary of Altice formed to complete the financing described herein and the merger with CSC Holdings, borrowed an aggregate principal amount of $3,800,000 under a term loan facility (the "Term Credit Facility") and entered into revolving loan commitments in an aggregate principal amount of $2,000,000 (the "Revolving Credit Facility" and, together with the Term Credit Facility, the "Credit Facilities").
Finco also issued $1,800,000 aggregate principal amount of 10.125% senior notes due 2023 (the "2023 Notes"), $2,000,000 aggregate principal amount of 10.875% senior notes due 2025 (the "2025
F-99
NOTES TO CONSOLIDATED FINANCIAL STATEMENTS (Continued)
(Dollars in thousands, except share and per share amounts)
NOTE 1. DESCRIPTION OF BUSINESS, RELATED MATTERS AND BASIS OF PRESENTATION (Continued)
Notes"), and $1,000,000 aggregate principal amount of 6.625% senior guaranteed notes due 2025 (the "2025 Guaranteed Notes") (collectively the "Merger Notes").
On June 21, 2016, immediately following the Merger, Finco merged with and into CSC Holdings, with CSC Holdings surviving the merger (the "CSC Holdings Merger"), and the Merger Notes and the Credit Facilities became obligations of CSC Holdings.
The accompanying financial statements represent the operating results and cash flows of the Company for the period January 1, 2016 to June 20, 2016 (Predecessor) and for the years ended December 31, 2015 and 2014. The operating results of the Company for the period June 21, 2016 to December 31, 2016 (Successor) are incorporated in the consolidated financial statements of Altice USA, Inc.
Basis of Presentation
Principles of Consolidation
The accompanying consolidated financial statements of Cablevision include the accounts of Cablevision and its majority-owned subsidiaries. Cablevision has no business operations independent of CSC Holdings, whose operating results and financial position are consolidated into Cablevision. All significant intercompany transactions and balances between Cablevision and CSC Holdings and their respective consolidated subsidiaries are eliminated in consolidation.
Use of Estimates in Preparation of Financial Statements
The preparation of financial statements in conformity with U.S. generally accepted accounting principles ("GAAP") requires management to make estimates and assumptions that affect the reported amounts of assets and liabilities and disclosure of contingent liabilities at the date of the financial statements and the reported amounts of revenues and expenses during the reporting period. Actual results could differ from those estimates. See Note 12 for a discussion of fair value estimates.
Reclassifications
Certain reclassifications have been made in the consolidated financial statements in the 2014 and 2015 financial statements to conform to the 2016 presentation.
NOTE 2. SUMMARY OF SIGNIFICANT ACCOUNTING POLICIES
Summary of Significant Accounting Policies
Revenue Recognition
The Company recognizes video, high-speed data, and voice services revenues as the services are provided to customers. Revenue received from customers who purchase bundled services at a discounted rate is allocated to each product in a pro-rata manner based on the individual product's selling price (generally, the price at which the product is regularly sold on a standalone basis). Installation revenue for the Company's video, consumer high-speed data and VoIP services is recognized as installations are completed, as direct selling costs have exceeded this revenue in all periods reported. Advertising revenues are recognized when commercials are aired.
F-100
NOTES TO CONSOLIDATED FINANCIAL STATEMENTS (Continued)
(Dollars in thousands, except share and per share amounts)
NOTE 2. SUMMARY OF SIGNIFICANT ACCOUNTING POLICIES (Continued)
Revenues derived from other sources are recognized when services are provided or events occur.
Multiple-Element Transactions
In the normal course of business, the Company may enter into multiple-element transactions where it is simultaneously both a customer and a vendor with the same counterparty or in which it purchases multiple products and/or services, or settles outstanding items contemporaneous with the purchase of a product or service from a single counterparty. The Company's policy for accounting for each transaction negotiated contemporaneously is to record each deliverable of the transaction based on its best estimate of selling price in a manner consistent with that used to determine the price to sell each deliverable on a standalone basis. In determining the fair value of the respective deliverable, the Company will utilize quoted market prices (as available), historical transactions or comparable transactions.
Gross Versus Net Revenue Recognition
In the normal course of business, the Company is assessed non-income related taxes by governmental authorities, including franchising authorities (generally under multi-year agreements), and collects such taxes from its customers. The Company's policy is that, in instances where the tax is being assessed directly on the Company, amounts paid to the governmental authorities and amounts received from the customers are recorded on a gross basis. That is, amounts paid to the governmental authorities are recorded as programming and other direct costs and amounts received from the customer are recorded as revenue. For the period January 1, 2016 through June 20, 2016 and for the years ended December 31, 2015 and 2014, the amount of franchise fees and certain other taxes and fees included as a component of revenue aggregated $95,432, $199,701 and $178,630, respectively.
Technical and Operating Expenses
Costs of revenue related to sales of services are classified as "programming and other direct costs" in the accompanying consolidated statements of operations.
Programming Costs
Programming expenses related to the Company's video service represent fees paid to programming distributors to license the programming distributed to subscribers. This programming is acquired generally under multi-year distribution agreements, with rates usually based on the number of subscribers that receive the programming. There have been periods when an existing distribution agreement has expired and the parties have not finalized negotiations of either a renewal of that agreement or a new agreement for certain periods of time. In substantially all these instances, the Company continues to carry and pay for these services until execution of definitive replacement agreements or renewals. The amount of programming expense recorded during the interim period is based on the Company's estimates of the ultimate contractual agreement expected to be reached, which is based on several factors, including previous contractual rates, customary rate increases and the current status of negotiations. Such estimates are adjusted as negotiations progress until new programming terms are finalized.
In addition, the Company has received, or may receive, incentives from programming distributors for carriage of the distributors' programming. The Company generally recognizes these incentives as a
F-101
NOTES TO CONSOLIDATED FINANCIAL STATEMENTS (Continued)
(Dollars in thousands, except share and per share amounts)
NOTE 2. SUMMARY OF SIGNIFICANT ACCOUNTING POLICIES (Continued)
reduction of programming costs in "programming and other direct costs", generally over the term of the distribution agreement.
Advertising Expenses
Advertising costs are charged to expense when incurred and are reflected in "other operating expenses" in the accompanying consolidated statements of operations. Advertising costs amounted to $62,760, $160,671, and $156,228 for the period January 1, 2016 through June 20, 2016 and for the years ended December 31, 2015 and 2014, respectively.
Share-Based Compensation
Share-based compensation expense is based on the fair value of the portion of share-based payment awards that are ultimately expected to vest. For share-based compensation awards that can be settled in cash, the Company recognizes compensation expense based on the estimated fair value of the award at each reporting period.
For options and performance based option awards, Cablevision recognized compensation expense based on the estimated grant date fair value using the Black-Scholes valuation model. For options not subject to performance based vesting conditions, Cablevision recognized the compensation expense using a straight-line amortization method. For options subject to performance based vesting conditions, Cablevision recognized compensation expense based on the probable outcome of the performance criteria over the requisite service period for each tranche of awards.
For restricted shares, Cablevision recognized compensation expense using a straight-line amortization method based on the grant date price of CNYG Class A common stock over the vesting period. For restricted stock units granted to non-employee director which vested 100% on the date of grant, compensation expense was recognized on the date of grant based on the grant date price of CNYG Class A common stock.
For performance based restricted stock units ("PSUs") which cliff vested in three years, Cablevision recognized compensation expense on a straight-line basis over the vesting period based on the estimated number of shares of CNYG Class A common stock expected to be issued.
Income Taxes
The Company's provision for income taxes is based on current period income, changes in deferred tax assets and liabilities and changes in estimates with regard to uncertain tax positions. Deferred tax assets are subject to an ongoing assessment of realizability. The Company provides deferred taxes for the outside basis difference of its investment in partnerships. In the second quarter of 2016, the Company changed its accounting policy on a prospective basis to present interest expense relating to uncertain tax position as additional interest expense.
Cash and Cash Equivalents
The Company's cash investments are placed with money market funds and financial institutions that are investment grade as rated by Standard & Poor's and Moody's Investors Service. The Company selects money market funds that predominantly invest in marketable, direct obligations issued or
F-102
NOTES TO CONSOLIDATED FINANCIAL STATEMENTS (Continued)
(Dollars in thousands, except share and per share amounts)
NOTE 2. SUMMARY OF SIGNIFICANT ACCOUNTING POLICIES (Continued)
guaranteed by the United States government or its agencies, commercial paper, fully collateralized repurchase agreements, certificates of deposit, and time deposits.
The Company considers the balance of its investment in funds that substantially hold securities that mature within three months or less from the date the fund purchases these securities to be cash equivalents. The carrying amount of cash and cash equivalents either approximates fair value due to the short-term maturity of these instruments or are at fair value.
Accounts Receivable
Accounts receivable are recorded at net realizable value. The Company periodically assesses the adequacy of valuation allowances for uncollectible accounts receivable by evaluating the collectability of outstanding receivables and general factors such as historical collection experience, length of time individual receivables are past due, and the economic and competitive environment.
Investments
Investment securities and investment securities pledged as collateral are classified as trading securities and are stated at fair value with realized and unrealized holding gains and losses included in net income.
Long-Lived Assets and Amortizable Intangible Assets
Property, plant and equipment, including construction materials, are carried at cost, and include all direct costs and certain indirect costs associated with the construction of cable systems, and the costs of new equipment installations. Equipment under capital leases is recorded at the present value of the total minimum lease payments. Depreciation on equipment is calculated on the straight-line basis over the estimated useful lives of the assets or, with respect to equipment under capital leases and leasehold improvements, amortized over the shorter of the lease term or the assets' useful lives and reported in depreciation and amortization (including impairments) in the consolidated statements of operations.
The Company capitalizes certain internal and external costs incurred to acquire or develop internal-use software. Capitalized software costs are amortized over the estimated useful life of the software and reported in depreciation and amortization (including impairments).
Customer relationships, trade names and other intangibles established in connection with acquisitions that are finite-lived are amortized in a manner that reflects the pattern in which the projected net cash inflows to the Company are expected to occur, such as the sum of the years' digits method, or when such pattern does not exist, using the straight-line basis over their respective estimated useful lives.
The Company reviews its long-lived assets (property, plant and equipment, and intangible assets subject to amortization that arose from acquisitions) for impairment whenever events or circumstances indicate that the carrying amount of an asset may not be recoverable. If the sum of the expected cash flows, undiscounted and without interest, is less than the carrying amount of the asset, an impairment loss is recognized as the amount by which the carrying amount of the asset exceeds its fair value.
F-103
NOTES TO CONSOLIDATED FINANCIAL STATEMENTS (Continued)
(Dollars in thousands, except share and per share amounts)
NOTE 2. SUMMARY OF SIGNIFICANT ACCOUNTING POLICIES (Continued)
Goodwill and Indefinite-Lived Intangible Assets
Goodwill and the value of franchises, trademarks, and certain other intangibles acquired in purchase business combinations which have indefinite useful lives are not amortized. Rather, such assets are tested for impairment annually or upon the occurrence of a triggering event.
The Company assesses qualitative factors for its reporting units that carry goodwill. If the qualitative assessment results in a conclusion that it is more likely than not that the fair value of a reporting unit exceeds the carrying value, then no further testing is performed for that reporting unit.
When the qualitative assessment is not used, or if the qualitative assessment is not conclusive and it is necessary to calculate the fair value of a reporting unit, then the impairment analysis for goodwill is performed at the reporting unit level using a two-step approach. The first step of the goodwill impairment test is used to identify potential impairment by comparing the fair value of the reporting unit with its carrying amount, including goodwill utilizing an enterprise-value based premise approach. If the carrying amount of the reporting unit exceeds its fair value, the second step of the goodwill impairment test is performed to measure the amount of goodwill impairment loss, if any. The second step of the goodwill impairment test compares the implied fair value of the reporting unit's goodwill with the carrying amount of that goodwill. If the carrying amount of the reporting unit's goodwill exceeds the implied fair value of that goodwill, an impairment loss is recognized in an amount equal to that excess. The implied fair value of goodwill is determined in the same manner as the amount of goodwill which would be recognized in a business combination.
The Company assesses qualitative factors to determine whether it is necessary to perform the one-step quantitative identifiable indefinite-lived intangible assets impairment test. This quantitative test is required only if the Company concludes that it is more likely than not that a unit of accounting's fair value is less than its carrying amount. When the qualitative assessment is not used, or if the qualitative assessment is not conclusive, the impairment test for other intangible assets not subject to amortization requires a comparison of the fair value of the intangible asset with its carrying value. If the carrying value of the indefinite-lived intangible asset exceeds its fair value, an impairment loss is recognized in an amount equal to that excess.
Deferred Financing Costs
Deferred financing costs are being amortized to interest expense using the effective interest method over the terms of the related debt.
Derivative Financial Instruments
The Company accounts for derivative financial instruments as either assets or liabilities measured at fair value. The Company uses derivative instruments to manage its exposure to market risks from changes in certain equity prices and interest rates and does not hold or issue derivative instruments for speculative or trading purposes. These derivative instruments are not designated as hedges, and changes in the fair values of these derivatives are recognized in the statements of income as gains (losses) on derivative contracts.
F-104
NOTES TO CONSOLIDATED FINANCIAL STATEMENTS (Continued)
(Dollars in thousands, except share and per share amounts)
NOTE 2. SUMMARY OF SIGNIFICANT ACCOUNTING POLICIES (Continued)
Commitments and Contingencies
Liabilities for loss contingencies arising from claims, assessments, litigation, fines and penalties and other sources are recorded when the Company believes it is probable that a liability has been incurred and the amount of the contingency can be reasonably estimated.
Recently Adopted Accounting Pronouncements
In November 2015, the Financial Accounting Standards Board ("FASB") issued Accounting Standards Update ("ASU") No. 2015-17 (Topic 740), Balance Sheet Classification of Deferred Taxes. This ASU amends existing guidance to require the presentation of deferred tax liabilities and assets as noncurrent within a classified statement of financial position. ASU No. 2015-17 was adopted by the Company as of June 30, 2016 and was applied prospectively to all deferred tax liabilities and assets.
In September 2015, the FASB issued ASU No. 2015-16, Simplifying the Accounting for Measurement-Period Adjustments, which requires that an acquirer recognize adjustments to provisional amounts that are identified during the measurement period in the reporting period in which the adjustment amounts are determined. Prior to the issuance of the standard, entities were required to retrospectively apply adjustments made to provisional amounts recognized in a business combination. ASU No. 2015-16 was adopted by the Company on January 1, 2016.
In April 2015, the FASB issued ASU No. 2015-05, Intangibles—Goodwill and Other—Internal-Use Software (Subtopic 350-40): Customer's Accounting for Fees Paid in a Cloud Computing Arrangement. ASU No. 2015-05 provides guidance to customers about whether a cloud computing arrangement includes a software license. If a cloud computing arrangement includes a software license, then the customer should account for the software license element of the arrangement consistent with the acquisition of other software licenses. If a cloud computing arrangement does not include a software license, the customer should account for the arrangement as a service contract. ASU No. 2015-05 was adopted by the Company on January 1, 2016 and did not have a material impact on the Company's consolidated financial statements.
In April 2015, the FASB issued ASU No. 2015-03, Simplifying the Presentation of Debt Issuance Costs, which requires debt issuance costs to be presented in the balance sheet as a direct deduction from the carrying value of the associated debt liability, consistent with the presentation of a debt discount. In August 2015, the FASB issued ASU No. 2015-15, Presentation and Subsequent Measurement of Debt Issuance Costs Associated with Line-of-Credit Arrangements, which clarifies the treatment of debt issuance costs from line-of-credit arrangements after adoption of ASU No. 2015-03. ASU No. 2015-15 clarifies that the Securities and Exchange Commission staff would not object to an entity deferring and presenting debt issuance costs as an asset and subsequently amortizing the deferred debt issuance costs ratably over the term of the line-of-credit arrangement, regardless of whether there are any outstanding borrowings on the line-of-credit arrangement. ASU No. 2015-03 was adopted by the Company on January 1, 2016 representing a change in accounting principle and was applied retrospectively to all periods presented. Debt issuance costs, net for the Company of $67,119, as of December 31, 2015 were reclassified from deferred financing costs and presented as a reduction to debt in the consolidated balance sheets.
F-105
NOTES TO CONSOLIDATED FINANCIAL STATEMENTS (Continued)
(Dollars in thousands, except share and per share amounts)
NOTE 2. SUMMARY OF SIGNIFICANT ACCOUNTING POLICIES (Continued)
Debt issuance costs, net for the Company of $7,588 as of December 31, 2015 relating to its revolving credit facility were not impacted by the adoption of ASU No. 2015-03 and are reflected as long-term assets in the accompanying consolidated balance sheets.
In August 2014, the FASB issued ASU No. 2014-15, Disclosures of Uncertainties about an Entity's Ability to Continue as a Going Concern, which requires management to evaluate whether there are conditions or events that raise substantial doubt about the entity's ability to continue as a going concern, and to provide certain disclosures when it is probable that the entity will be unable to meet its obligations as they become due within one year after the date that the financial statements are issued. ASU No. 2014-15 was adopted by the Company on January 1, 2016.
In June 2014, the FASB issued ASU No. 2014-12, Compensation—Stock Compensation (Topic 718): Accounting for Share-Based Payments When the Terms of an Award Provide That a Performance Target Could Be Achieved After the Requisite Service Period. ASU No. 2014-12 requires that a performance target that affects vesting and that could be achieved after the requisite service period be treated as a performance condition. Entities may apply the amendments in this ASU either: (a) prospectively to all awards granted or modified after the effective date; or (b) retrospectively to all awards with performance targets that are outstanding as of the beginning of the earliest annual period presented in the financial statements and to all new or modified awards thereafter. ASU No. 2014-12 was adopted by the Company on January 1, 2016 on a prospective basis and did not have any impact on the Company's consolidated financial statements.
Recently Issued But Not Yet Adopted Accounting Pronouncements
In May 2014, the FASB issued ASU No. 2014-09, Revenue from Contracts with Customers, requiring an entity to recognize the amount of revenue to which it expects to be entitled for the transfer of promised goods or services to customers. ASU No. 2014-09 will replace most existing revenue recognition guidance in GAAP when it becomes effective and allows the use of either the retrospective or cumulative effect transition method. In August 2015, the FASB issued ASU No. 2015-14 that approved deferring the effective date by one year so that ASU No. 2014-09 would become effective for the Company on January 1, 2018. The FASB also approved, in July 2015, permitting the early adoption of ASU No. 2014-09, but not before the original effective date for the Company of January 1, 2017.
In December 2016, the FASB issued ASU No. 2016-20, Technical Corrections and Improvements to Topic 606, Revenue from Contracts with Customers, in order to clarify the Codification and to correct any unintended application of the guidance. These items are not expected to have a significant effect on the current accounting standard. The amendments in this update affect the guidance in ASU No. 2014-09, which is not yet effective. ASU No. 2014-09 will be effective, reflecting the one-year deferral, for interim and annual periods beginning after December 15, 2017 (January 1, 2018 for the Company). Early adoption of the standard is permitted but not before the original effective date. Companies can transition to the standard either retrospectively or as a cumulative-effect adjustment as of the date of adoption. The Company is in the process of evaluating the impact that the adoption of ASU No. 2014-09 will have on its consolidated financial statements and selecting the method of transition to the new standard. We currently expect the adoption to impact the timing of the recognition of residential installation revenue and the recognition of commission expenses.
F-106
NOTES TO CONSOLIDATED FINANCIAL STATEMENTS (Continued)
(Dollars in thousands, except share and per share amounts)
NOTE 2. SUMMARY OF SIGNIFICANT ACCOUNTING POLICIES (Continued)
In November 2016, the FASB issued ASU No. 2016-18, Statement of Cash Flows (Topic 230): Restricted Cash, which requires that the statement of cash flows disclose the change during the period in the total of cash, cash equivalents, restricted cash and restricted cash equivalents. Restricted cash should be included with cash and cash equivalents when reconciling the beginning-of-period and end-of period total amounts shown on the statement of cash flows. ASU No. 2016-18 provides specific guidance on the presentation of restricted cash in the statement of cash flows. The new guidance becomes effective for the Company on January 1, 2019 with early adoption permitted and will be applied retrospectively.
In August 2016, the FASB issued ASU No. 2016-15, Statement of Cash Flows (Topic 230): Classification of Certain Cash Receipts and Cash Payments which clarifies how entities should classify certain cash receipts and cash payments on the statement of cash flows. ASU No. 2016-15 also clarifies how the predominance principle should be applied when cash receipts and cash payments have aspects of more than one class of cash flows. The new guidance becomes effective for the Company on January 1, 2018 with early adoption permitted and will be applied retrospectively. The Company has not yet completed the evaluation of the effect that ASU No. 2016-15 will have on its consolidated financial statements.
In March 2016, the FASB issued ASU 2016-09, Compensation—Stock Compensation: Improvements to Employee Share-Based Payment Accounting, which provides simplification of income tax accounting for share-based payment awards. The new guidance becomes effective for the Company on January 1, 2017 with early adoption permitted. Amendments related to the timing of when excess tax benefits are recognized, minimum statutory withholding requirements, forfeitures, and intrinsic value will be applied using the modified retrospective transition method. Amendments requiring recognition of excess tax benefits and tax deficiencies in the income statement and the practical expedient for estimating expected term will be applied prospectively. The Company may elect to apply the amendments related to the presentation of excess tax benefits on the statement of cash flows using either a prospective transition method or a retrospective transition method. In connection with the adoption on January 1, 2017, a deferred tax asset of approximately $309,000 for previously unrealized excess tax benefits will be recognized with the offset recorded to accumulated deficit.
In February 2016, the FASB issued ASU 2016-02, Leases, which increases transparency and comparability by recognizing a lessee's rights and obligations resulting from leases by recording them on the balance sheet as lease assets and lease liabilities. The new guidance becomes effective for the Company on January 1, 2019 with early adoption permitted and will be applied using the modified retrospective method. The Company has not yet completed the evaluation of the effect that ASU No. 2016-02 will have on its consolidated financial statements.
Common Stock of Cablevision
Prior to the Merger, each holder of CNYG Class A common stock had one vote per share while holders of CNYG Class B common stock had ten votes per share. CNYG Class B shares could be converted to CNYG Class A common stock at anytime with a conversion ratio of one CNYG Class A common share for one CNYG Class B common share. CNYG Class A stockholders were entitled to elect 25% of Cablevision's Board of Directors. CNYG Class B stockholders had the right to elect the remaining members of Cablevision's Board of Directors. In addition, CNYG Class B stockholders were
F-107
NOTES TO CONSOLIDATED FINANCIAL STATEMENTS (Continued)
(Dollars in thousands, except share and per share amounts)
NOTE 2. SUMMARY OF SIGNIFICANT ACCOUNTING POLICIES (Continued)
parties to an agreement which had the effect of causing the voting power of these CNYG Class B stockholders to be cast as a block.
The following table provides details of Cablevision's shares of common stock through the Merger Date:
| |
Shares of Common Stock Outstanding |
||||||
|---|---|---|---|---|---|---|---|
| |
Class A Common Stock |
Class B Common Stock |
|||||
Balance at December 31, 2013 |
213,598,590 | 54,137,673 | |||||
| | | | | | | | |
Employee and non-employee director stock transactions(a) |
6,621,345 | — | |||||
| | | | | | | | |
Balance at December 31, 2014 |
220,219,935 | 54,137,673 | |||||
| | | | | | | | |
Employee and non-employee director stock transactions(a) |
2,352,275 | — | |||||
| | | | | | | | |
Balance at December 31, 2015 |
222,572,210 | 54,137,673 | |||||
| | | | | | | | |
Employee and non-employee director stock transactions(a) |
(185,276 | ) | — | ||||
| | | | | | | | |
Balance at June 20, 2016 |
222,386,934 | 54,137,673 | |||||
| | | | | | | | |
- (a)
- Primarily included issuances of common stock in connection with employee and non-employee director exercises of stock options and restricted shares granted to employees, offset by shares acquired by the Company in connection with the fulfillment of employees' statutory tax withholding obligation for applicable income and other employment taxes and forfeited employee restricted shares.
Dividends
Pursuant to the terms of the Merger Agreement, Cablevision was not permitted to declare and pay dividends or repurchase stock, in each case, without the prior written consent of Altice. In accordance with these terms, Cablevision did not declare dividends during the period January 1, 2016 through June 20, 2016.
During the period January 1, 2016 through June 20, 2016, Cablevision paid $4,066 related to restricted shares that vested in respect of dividends declared and accrued on the CNYG common stock in prior periods.
F-108
NOTES TO CONSOLIDATED FINANCIAL STATEMENTS (Continued)
(Dollars in thousands, except share and per share amounts)
NOTE 2. SUMMARY OF SIGNIFICANT ACCOUNTING POLICIES (Continued)
Prior to the Merger, the Board of Directors of Cablevision had declared and paid the following cash dividends to stockholders of record on both its CNYG Class A common stock and CNYG Class B common stock:
Declaration Date
|
Dividend per Share |
Record Date | Payment Date | ||||
|---|---|---|---|---|---|---|---|
August 6, 2015 |
$ | 0.15 | August 21, 2015 | September 10, 2015 | |||
May 1, 2015 |
$ | 0.15 | May 22, 2015 | June 12, 2015 | |||
February 24, 2015 |
$ | 0.15 | March 16, 2015 | April 3, 2015 | |||
November 5, 2014 |
$ | 0.15 | November 21, 2014 | December 12, 2014 | |||
July 29, 2014 |
$ | 0.15 | August 15, 2014 | September 5, 2014 | |||
May 6, 2014 |
$ | 0.15 | May 23, 2014 | June 13, 2014 | |||
February 25, 2014 |
$ | 0.15 | March 14, 2014 | April 3, 2014 | |||
Cablevision paid dividends aggregating $125,170 and $160,545 during the years ended December 31, 2015 and 2014, respectively, including accrued dividends on vested restricted shares of $3,935 and $1,548, respectively.
Cablevision's and CSC Holdings' indentures and CSC Holdings' credit agreement restrict the amount of dividends and distributions in respect of any equity interest that can be made.
Income (Loss) Per Share
Basic income per common share attributable to Cablevision stockholders was computed by dividing net income attributable to Cablevision stockholders by the weighted average number of common shares outstanding during the period. Diluted income per common share attributable to Cablevision stockholders reflected the dilutive effects of stock options, restricted stock and restricted stock units. For such awards that were performance based, the diluted effect was reflected upon the achievement of the performance criteria.
The following table presents a reconciliation of weighted average shares used in the calculations of the basic and diluted net income per share attributable to Cablevision stockholders:
| |
|
Years Ended December 31, |
||||||||
|---|---|---|---|---|---|---|---|---|---|---|
| |
January 1, 2016 to June 20, 2016 |
|||||||||
| |
2015 | 2014 | ||||||||
Basic weighted average shares outstanding |
272,035 | 269,388 | 264,623 | |||||||
Effect of dilution: |
||||||||||
Stock options |
4,444 | 3,532 | 3,247 | |||||||
Restricted stock |
3,720 | 3,419 | 2,833 | |||||||
| | | | | | | | | | | |
Diluted weighted average shares outstanding |
280,199 | 276,339 | 270,703 | |||||||
| | | | | | | | | | | |
| | | | | | | | | | | |
| | | | | | | | | | | |
Anti-dilutive shares (options whose exercise price exceeds the average market price of Cablevision's common stock during the period and certain restricted shares) totaling approximately 1,160,000, and 1,760,000 shares, were excluded from diluted weighted average shares outstanding for the years ended 2015 and 2014, respectively. There were no anti-dilutive shares excluded from diluted weighted average shares outstanding for the period January 1, 2016 to June 20, 2016. In addition,
F-109
NOTES TO CONSOLIDATED FINANCIAL STATEMENTS (Continued)
(Dollars in thousands, except share and per share amounts)
NOTE 2. SUMMARY OF SIGNIFICANT ACCOUNTING POLICIES (Continued)
approximately 1,772,000 performance based restricted stock units for the year ended December 31, 2015, and approximately 45,000 restricted shares for the year ended December 31, 2014, issued pursuant to the Company's former employee stock plan were also excluded from the diluted weighted average shares outstanding as the performance criteria on these awards had not yet been satisfied for the respective period.
Net income (loss) per share for Cablevision subsequent to the merger is not presented since Cablevision's common stock is no longer publicly traded.
Concentrations of Credit Risk
Financial instruments that may potentially subject the Company to a concentration of credit risk consist primarily of cash and cash equivalents and trade account receivables. The Company monitors the financial institutions and money market funds where it invests its cash and cash equivalents with diversification among counterparties to mitigate exposure to any single financial institution. The Company's emphasis is primarily on safety of principal and liquidity and secondarily on maximizing the yield on its investments. Management believes that no significant concentration of credit risk exists with respect to its cash and cash equivalents balances because of its assessment of the creditworthiness and financial viability of the respective financial institutions.
The Company did not have a single customer that represented 10% or more of its consolidated revenues for the period January 1, 2016 through June 20, 2016 and the years ended December 31, 2015 and 2014, or 10% or more of its consolidated net trade receivables at December 31, 2015.
NOTE 3. ALLOWANCE FOR DOUBTFUL ACCOUNTS
Activity related to the allowance for doubtful accounts:
| |
Balance at Beginning of Period |
Provision for Bad Debt |
Deductions/ Write- Offs and Other Charges |
Balance at End of Period |
|||||||||
|---|---|---|---|---|---|---|---|---|---|---|---|---|---|
Period from January 1, 2016 through June 20, 2016 |
|||||||||||||
Allowance for doubtful accounts |
$ | 6,039 | $ | 13,240 | $ | (12,378 | ) | $ | 6,901 | ||||
| | | | | | | | | | | | | | |
| | | | | | | | | | | | | | |
| | | | | | | | | | | | | | |
Year Ended December 31, 2015 |
|||||||||||||
Allowance for doubtful accounts |
$ | 12,112 | $ | 35,802 | $ | (41,875 | ) | $ | 6,039 | ||||
| | | | | | | | | | | | | | |
| | | | | | | | | | | | | | |
| | | | | | | | | | | | | | |
Year Ended December 31, 2014 |
|||||||||||||
Allowance for doubtful accounts |
$ | 14,614 | $ | 47,611 | $ | (50,113 | ) | $ | 12,112 | ||||
| | | | | | | | | | | | | | |
| | | | | | | | | | | | | | |
| | | | | | | | | | | | | | |
F-110
NOTES TO CONSOLIDATED FINANCIAL STATEMENTS (Continued)
(Dollars in thousands, except share and per share amounts)
NOTE 4. SUPPLEMENTAL CASH FLOW INFORMATION
The Company's non-cash investing and financing activities and other supplemental data were as follows:
| |
|
Years Ended December 31, |
||||||||
|---|---|---|---|---|---|---|---|---|---|---|
| |
January 1, 2016 to June 20, 2016 |
|||||||||
| |
2015 | 2014 | ||||||||
Non-Cash Investing and Financing Activities: |
||||||||||
Continuing Operations: |
||||||||||
Property and equipment accrued but unpaid |
$ | 68,356 | $ | 63,843 | $ | 48,824 | ||||
Notes payable to vendor |
— | 8,318 | 34,522 | |||||||
Capital lease obligations |
— | 19,987 | 30,603 | |||||||
Intangible asset obligations |
290 | 1,121 | 525 | |||||||
Non-Cash Investing and Financing Activities: |
||||||||||
Dividends payable on unvested restricted share awards |
— | 3,517 | 3,809 | |||||||
Supplemental Data: |
||||||||||
Continuing Operations: |
||||||||||
Cash interest paid |
258,940 | 560,361 | 550,241 | |||||||
Income taxes paid, net |
7,082 | 3,849 | 10,598 | |||||||
NOTE 5. RESTRUCTURING AND OTHER EXPENSE
Restructuring
The Company recorded net restructuring charges (credits) of $2,299, $(1,649), and $2,480, for the period January 1, 2016 through June 20, 2016 and for the years ended December 31, 2015 and 2014, respectively. The 2014 restructuring expense included a $3,280 charge relating to the elimination of certain positions at Newsday. The 2016 and 2015 restructuring expense (credit) primarily related to changes to the Company's previous estimates recorded in connection with the Company's prior restructuring plans.
Subsequent to the Altice Merger, the Company commenced its restructuring initiatives (the "2016 Restructuring Plan") that are intended to simplify the Company's organizational structure. The 2016 Restructuring Plan resulted in charges of $188,847 associated with the elimination of positions primarily in corporate, administrative and infrastructure functions across the Company and estimated charges of $10,410 associated with facility realignment and other costs.
Other Expense
In connection with the Altice Merger, the Company incurred transaction costs of $19,924 and $17,862 for the period January 1, 2016 through June 20, 2016 and for the year ended December 31, 2015, respectively, which are reflected in restructuring and other expense in the consolidated statements of operations. Subsequent to the Altice Merger, the Company incurred transaction costs of $12,920.
F-111
NOTES TO CONSOLIDATED FINANCIAL STATEMENTS (Continued)
(Dollars in thousands, except share and per share amounts)
NOTE 6. DISCONTINUED OPERATIONS
Loss from discontinued operations for the year ended December 31, 2015 amounted to $21,272 ($12,541, net of income taxes) and primarily reflects an expense of $21,000 ($12,380, net of income taxes) related to the settlement of a legal matter relating to Rainbow Media Holdings LLC, a business whose operations were previously discontinued (see Note 17).
Income from discontinued operations for the year ended December 31, 2014 amounted to $5,028 ($2,822, net of income taxes) and resulted primarily from the settlement of a contingency related to Montana property taxes related to Bresnan Cable, a business which was sold in 2013.
NOTE 7. PROPERTY, PLANT AND EQUIPMENT
Costs incurred in the construction of the Company's cable systems, including line extensions to, and upgrade of, the Company's hybrid fiber/coaxial infrastructure, initial placement of the feeder cable to connect a customer that had not been previously connected, and headend facilities are capitalized. These costs consist of materials, subcontractor labor, direct consulting fees, and internal labor and related costs associated with the construction activities. The internal costs that are capitalized consist of salaries and benefits of the Company's employees and the portion of facility costs, including rent, taxes, insurance and utilities, that supports the construction activities. These costs are depreciated over the estimated life of the plant (10 to 25 years) and headend facilities (4 to 25 years). Costs of operating the plant and the technical facilities, including repairs and maintenance, are expensed as incurred.
Costs associated with initial customer installations and the additions of network equipment necessary to enable advanced services are also capitalized. Costs capitalized as part of new customer installations include materials, subcontractor costs and internal direct labor costs, including service technicians and internal overhead costs incurred to connect the customer to the plant from the time of installation scheduling through the time service is activated and functioning. The internal direct labor cost capitalized is based on a combination of the actual and estimated time to complete the installation. Overhead capitalized consists mainly of employee benefits, such as payroll taxes and health insurance, directly associated with that portion of the capitalized labor and vehicle operating costs related to capitalizable activities. New connections are amortized over the estimated useful life of 5 years for customer wiring and feeder cable to the home. The portion of departmental costs related to disconnecting services, reconnection of a customer, and repair and maintenance are expensed as incurred.
The estimated useful lives assigned to our property, plant and equipment are reviewed on an annual basis or more frequently if circumstances warrant and such lives are revised to the extent necessary due to changing facts and circumstances. Any changes in estimated useful lives are reflected prospectively.
F-112
NOTES TO CONSOLIDATED FINANCIAL STATEMENTS (Continued)
(Dollars in thousands, except share and per share amounts)
NOTE 7. PROPERTY, PLANT AND EQUIPMENT (Continued)
Property, plant and equipment (including equipment under capital leases) consist of the following assets, which are depreciated or amortized on a straight-line basis over the estimated useful lives shown below:
| |
December 31, 2015 |
Estimated Useful Lives |
|||
|---|---|---|---|---|---|
Customer equipment |
$ | 1,952,336 | 3 to 5 years | ||
Headends and related equipment |
2,388,289 | 4 to 25 years | |||
Infrastructure |
5,639,226 | 3 to 25 years | |||
Equipment and software |
1,577,616 | 3 to 10 years | |||
Construction in progress (including materials and supplies) |
87,412 | ||||
Furniture and fixtures |
96,561 | 5 to 12 years | |||
Transportation equipment |
210,013 | 5 to 18 years | |||
Buildings and building improvements |
322,267 | 10 to 40 years | |||
Leasehold improvements |
354,136 | Term of lease | |||
Land |
14,507 | ||||
| | | | | | |
|
12,642,363 | ||||
Less accumulated depreciation and amortization |
(9,625,348 | ) | |||
| | | | | | |
| | | | | | |
| | | | | | |
|
$ | 3,017,015 | |||
| | | | | | |
| | | | | | |
| | | | | | |
During the period January 1, 2016 through June 20, 2016 and the years ended December 31, 2015 and 2014, the Company capitalized certain costs aggregating $58,409, $144,349, and $153,675 respectively, related to the acquisition and development of internal use software, which are included in the table above.
Depreciation expense on property, plant and equipment (including capital leases) for the period January 1, 2016 through June 20, 2016 and the years ended December 31, 2015 and 2014 amounted to $404,234, $857,440 and $852,451, respectively, (including impairment charges of $425 in 2014).
At December 31, 2015, the gross amount of equipment and related accumulated amortization recorded under capital leases was as follows:
| |
December 31, 2015 |
|||
|---|---|---|---|---|
Equipment |
$ | 90,099 | ||
Less accumulated amortization |
(28,119 | ) | ||
| | | | | |
|
$ | 61,980 | ||
| | | | | |
| | | | | |
| | | | | |
NOTE 8. OPERATING LEASES
The Company leases certain office, production, and transmission facilities under terms of leases expiring at various dates through 2035. The leases generally provide for escalating rentals over the term of the lease plus certain real estate taxes and other costs or credits. Costs associated with such operating leases are recognized on a straight-line basis over the initial lease term. The difference
F-113
NOTES TO CONSOLIDATED FINANCIAL STATEMENTS (Continued)
(Dollars in thousands, except share and per share amounts)
NOTE 8. OPERATING LEASES (Continued)
between rent expense and rent paid is recorded as deferred rent. In addition, the Company rents space on utility poles for its operations. The Company's pole rental agreements are for varying terms, and management anticipates renewals as they expire. Rent expense, including pole rentals, for the period January 1, 2016 through June 20, 2016 and the years ended December 31, 2015 and 2014 amounted to $41,573, $82,704 and $77,769, respectively.
The minimum future annual payments for all operating leases (with initial or remaining terms in excess of one year) during the next five years and thereafter, including pole rentals from January 1, 2017 through December 31, 2021, are as follows:
2017 |
$ | 57,853 | ||
2018 |
52,206 | |||
2019 |
44,908 | |||
2020 |
41,221 | |||
2021 |
38,697 | |||
Thereafter |
141,063 |
NOTE 9. INTANGIBLE ASSETS
The following table summarizes information relating to the Company's acquired intangible assets:
| |
December 31, 2015 | ||||||||||
|---|---|---|---|---|---|---|---|---|---|---|---|
| |
Gross Carrying Amount |
Accumulated Amortization |
Net Carrying Amount |
Estimated Useful Lives |
|||||||
Customer relationships |
$ | 39,414 | $ | (27,778 | ) | $ | 11,636 | 10 to 18 years | |||
Trade names |
— | — | — | ||||||||
Other amortizable intangibles |
57,847 | (32,532 | ) | 25,315 | 3 to 28 years | ||||||
| | | | | | | | | | | | |
|
$ | 97,261 | $ | (60,310 | ) | $ | 36,951 | ||||
| | | | | | | | | | | | |
| | | | | | | | | | | | |
| | | | | | | | | | | | |
Amortization expense for the period January 1, 2016 through June 20, 2016 and the years ended December 31, 2015 and 2014 amounted to $10,316, $7,812 and $8,220, respectively, excluding impairment charges of $5,831 in 2014.
The following table summarizes information relating to the Company's acquired indefinite-lived intangible assets:
| |
December 31, 2015 |
|||
|---|---|---|---|---|
Cable television franchises |
$ | 731,848 | ||
Trademarks and other assets |
7,250 | |||
Goodwill |
262,345 | |||
| | | | | |
Total |
$ | 1,001,443 | ||
| | | | | |
| | | | | |
| | | | | |
F-114
NOTES TO CONSOLIDATED FINANCIAL STATEMENTS (Continued)
(Dollars in thousands, except share and per share amounts)
NOTE 9. INTANGIBLE ASSETS (Continued)
The carrying amount of goodwill is presented below:
Gross goodwill as of December 31, 2015 (Predecessor) |
$ | 596,403 | ||
Accumulated impairment losses |
(334,058 | ) | ||
| | | | | |
Net goodwill as of June 20, 2016 |
$ | 262,345 | ||
| | | | | |
| | | | | |
| | | | | |
Impairment Charges
Goodwill and indefinite-lived intangible assets are tested annually for impairment or earlier upon the occurrence of certain events or substantive changes in circumstances.
The Company's impairment analysis as of December 31, 2014 resulted in pre-tax impairment charges of $200, related to the excess of the carrying value over the estimated fair value of the Newsday trademarks. Additionally, in 2014, the Company recorded impairment charges of $5,631, relating to the excess of the carrying value over the estimated fair values of Newsday's amortizing subscriber relationships and advertiser relationships, respectively. The decrease in fair values, which were determined based on discounted cash flows, resulted primarily from the decline in projected cash flows related to these assets. These pre-tax impairment charges are included in depreciation and amortization (including impairments).
No goodwill impairments were recorded for the period January 1, 2016 through June 20, 2016 and for the years ended December 31, 2015 and 2014, respectively.
NOTE 10. DEBT
Restricted Group Credit Facility
Prior to the Merger, CSC Holdings and certain of its subsidiaries (the "Restricted Subsidiaries") had a credit agreement (the "Previous Credit Facility") that provided for (1) a revolving credit facility of $1,500,000, (2) a Term A facility of $958,510, and (3) a Term B facility of $1,200,000.
Loans under the Previous Credit Facility bore interest as follows:
- •
- Revolving credit loans and Term A loans, either (i) the Eurodollar rate (as defined) plus a spread ranging from 1.50% to 2.25% based on
the cash flow ratio (as defined), or (ii) the base rate (as defined) plus a spread ranging from 0.50% to 1.25% based on the cash flow ratio;
- •
- Term B loans, either (i) the Eurodollar rate plus a spread of 2.50% or (ii) the base rate plus a spread of 1.50%.
There was a commitment fee of 0.30% on undrawn amounts under the revolving credit facility in connection with the Previous Credit Facility.
Repayment of Restricted Group Credit Facility Debt
In May 2014, CSC Holdings used the net proceeds from the issuance of the 2024 Notes (discussed below), as well as cash on hand, to make a $750,000 repayment on its outstanding Term B loan facility. In September 2014, CSC Holdings made a repayment of $200,000 on its outstanding Term B loan facility with cash on hand. In connection with these repayments, the Company recognized a loss on
F-115
NOTES TO CONSOLIDATED FINANCIAL STATEMENTS (Continued)
(Dollars in thousands, except share and per share amounts)
NOTE 10. DEBT (Continued)
extinguishment of debt of approximately $4,054 and wrote-off unamortized deferred financing costs related to this loan facility of approximately $5,564 for the year ended December 31, 2014.
In April 2015, CSC Holdings made a repayment of $200,000 on its outstanding Term B loan facility with cash on hand. In connection with the repayment, the Company recognized a loss on extinguishment of debt of $731 and wrote-off unamortized deferred financing costs related to this loan facility of $1,004 for the year ended December 31, 2015.
On June 21, 2016, in connection with the Merger, the Previous Credit Facility was repaid.
Newsday LLC Credit Facility
Newsday LLC ("Newsday") had a senior secured credit agreement (the "Newsday Credit Agreement"), which consisted of a $480,000 floating rate term loan. Interest under the Newsday Credit Agreement was calculated, at the election of Newsday, at either the Eurodollar rate or the base rate, plus 3.50% or 2.50%, respectively, as specified in the Newsday Credit Agreement. Borrowings under the Newsday Credit Agreement were guaranteed by CSC Holdings on a senior unsecured basis and certain of its subsidiaries that own interests in Newsday on a senior secured basis. The Newsday Credit Agreement was secured by a lien on the assets of Newsday and Cablevision senior notes with an aggregate principal amount of $611,455 owned by Newsday Holdings.
On June 21, 2016, in connection with the Merger, Newsday LLC repaid its outstanding indebtedness under the Newsday Credit Agreement.
The following table provides details of the Company's outstanding credit facility debt (net of unamortized financing costs and unamortized discounts):
| |
Maturity Date | Interest Rate |
Principal | December 31, 2015(a) |
|||||||||
|---|---|---|---|---|---|---|---|---|---|---|---|---|---|
Restricted Group: |
|||||||||||||
Term A loan facility(b) |
April 17, 2018 | 2.17 | % | $ | 886,621 | 885,105 | |||||||
Term B loan facility(b) |
April 17, 2020 | 2.92 | % | 1,159,031 | 1,150,227 | ||||||||
| | | | | | | | | | | | | | |
Restricted Group Credit Facilities debt |
$ | 2,035,332 | |||||||||||
| | | | | | | | | | | | | | |
| | | | | | | | | | | | | | |
| | | | | | | | | | | | | | |
- (a)
- The
unamortized discounts and deferred financing costs amounted to $11,200 at December 31, 2015,
- (b)
- In connection with the Merger, the Company repaid the then outstanding Term A and Term B loan facilities (see discussion above).
F-116
NOTES TO CONSOLIDATED FINANCIAL STATEMENTS (Continued)
(Dollars in thousands, except share and per share amounts)
NOTE 10. DEBT (Continued)
Senior Notes and Debentures
The following table summarizes the Company's senior notes and debentures as of December 31, 2015:
Issuer
|
Date Issued | Maturity Date | Interest Rate |
Principal Amount |
Carrying Amount(c) |
|||||||||
|---|---|---|---|---|---|---|---|---|---|---|---|---|---|---|
CSC Holdings(a) |
February 6, 1998 | February 15, 2018 | 7.875 | % | $ | 300,000 | $ | 299,091 | ||||||
CSC Holdings(a) |
July 21, 1998 | July 15, 2018 | 7.625 | % | 500,000 | 498,942 | ||||||||
CSC Holdings(b) |
February 12, 2009 | February 15, 2019 | 8.625 | % | 526,000 | 511,079 | ||||||||
CSC Holdings(b) |
November 15, 2011 | November 15, 2021 | 6.750 | % | 1,000,000 | 985,640 | ||||||||
CSC Holdings(b) |
May 23, 2014 | June 1, 2024 | 5.250 | % | 750,000 | 737,500 | ||||||||
Cablevision(b) |
September 23, 2009 | September 15, 2017 | 8.625 | % | 900,000 | 891,238 | ||||||||
Cablevision(b) |
April 15, 2010 | April 15, 2018 | 7.750 | % | 750,000 | 744,402 | ||||||||
Cablevision(b) |
April 15, 2010 | April 15, 2020 | 8.000 | % | 500,000 | 494,410 | ||||||||
Cablevision(b) |
September 27, 2012 | September 15, 2022 | 5.875 | % | 649,024 | 638,709 | ||||||||
| | | | | | | | | | | | | | | |
Total |
$ | 5,801,011 | ||||||||||||
| | | | | | | | | | | | | | | |
| | | | | | | | | | | | | | | |
| | | | | | | | | | | | | | | |
- (a)
- The
debentures are not redeemable by the Company prior to maturity.
- (b)
- The
Company may redeem some or all of the notes at any time at a specified "make-whole" price plus accrued and unpaid interest to the redemption date.
- (c)
- The carrying amount of the notes is net of the unamortized deferred financing costs and/or discounts/premiums.
The table above excludes (i) the principal amount of Cablevision 7.75% senior notes due 2018 of $345,238 and the principal amount of Cablevision 8.00% senior notes due 2020 of $266,217 held by Newsday at December 31, 2015 which are eliminated in the consolidated balance sheets of Cablevision.
Issuance of Debt Securities
In May 2014, CSC Holdings issued $750,000 aggregate principal amount of 5.25% senior notes due June 1, 2024 (the "2024 Notes"). The 2024 Notes are senior unsecured obligations and rank equally in right of payment with all of CSC Holdings' other existing and future unsecured and unsubordinated indebtedness. CSC Holdings used the net proceeds from the issuance of the 2024 Notes, as well as cash on hand, to make a $750,000 repayment on its outstanding Term B loan facility. In connection with the issuance of the 2024 Notes, the Company incurred deferred financing costs of approximately $14,273.
The indentures under which the Senior Notes and Debentures were issued contain certain covenants and agreements, including limitations on the ability of CSC Holdings and its restricted subsidiaries to (i) incur or guarantee additional indebtedness, (ii) make investments or other restricted payments, (iii) create liens, (iv) sell assets and subsidiary stock, (v) pay dividends or make other distributions or repurchase or redeem our capital stock or subordinated debt, (vi) engage in certain transactions with affiliates, (vii) enter into agreements that restrict the payment of dividends by subsidiaries or the repayment of intercompany loans and advances, and (viii) engage in mergers or
F-117
NOTES TO CONSOLIDATED FINANCIAL STATEMENTS (Continued)
(Dollars in thousands, except share and per share amounts)
NOTE 10. DEBT (Continued)
consolidations, in each case subject to certain exceptions. The indentures also contain certain customary events of default.
Repurchases of Cablevision Senior Notes
In January 2014, Cablevision repurchased with cash on hand $27,831 aggregate principal amount of its then outstanding 5.875% senior notes due September 15, 2022 (the "2022 Notes"). In October 2014, Cablevision repurchased with cash on hand an additional $9,200 aggregate principal amount of the 2022 Notes. In connection with these repurchases, Cablevision recorded a gain from the extinguishment of debt of $934, net of fees, and a write-off of approximately $1,436 of unamortized deferred financing costs associated with these notes.
Debt Transaction Subsequent to Merger
In connection with the Merger, in October 2015, Finco borrowed an aggregate principal amount of $3,800,000 under the Term Credit Facility and entered into revolving loan commitments in an aggregate principal amount of $2,000,000. The Term Credit Facility was to mature on October 9, 2022 and the Revolving Credit Facility was to mature on October 9, 2020 (see discussion below regarding the extension amendments). In addition, on June 21, 2016 and July 21, 2016, the Company entered into incremental loan assumption agreements whereby the Revolving Credit Facility was increased by $70,000 and $35,000, respectively, to $2,105,000.
Finco also issued $1,800,000 aggregate principal amount of the 2023 Notes, $2,000,000 aggregate principal amount of the 2025 Notes, and $1,000,000 aggregate principal amount of the 2025 Guaranteed Notes.
On June 21, 2016, immediately following the Merger, Finco merged with and into CSC Holdings, with CSC Holdings surviving the merger (the "CSC Holdings Merger"), and the Merger Notes and the Credit Facilities became obligations of CSC Holdings. The 2025 Guaranteed Notes are guaranteed on a senior basis by each restricted subsidiary of CSC Holdings (other than CSC TKR, LLC and its subsidiaries, which own and operate the New Jersey cable television systems, Cablevision Lightpath, Inc. and any subsidiaries of CSC Holdings that are "Excluded Subsidiaries" under the indenture governing the 2025 Guaranteed Notes) (such subsidiaries, the "Initial Guarantors") and the obligations under the Credit Facilities are (i) guaranteed on a senior basis by each Initial Guarantor and (ii) secured on a first priority basis by capital stock held by CSC Holdings and the guarantors in certain subsidiaries of CSC Holdings, subject to certain exclusions and limitations.
Altice used the proceeds from the Term Credit Facility and the Merger Notes, together with an equity contribution from Altice and its Co-Investors and existing cash at Cablevision, to (a) finance the Merger, (b) refinance the credit agreement, dated as of April 17, 2013 (the "Previous Credit Facility"), among CSC Holdings, certain subsidiaries of CSC Holdings and the lenders party thereto ($2,030,699 outstanding at Merger Date), (c) repay the senior secured credit agreement, dated as of October 12, 2012, among Newsday LLC, CSC Holdings, and the lenders party thereto (the "Previous Newsday Credit Facility") of $480,000 at Merger Debt, and (d) pay related fees and expenses.
The Credit Facilities permit CSC Holdings to request revolving loans, swing line loans or letters of credit from the revolving lenders, swingline lenders or issuing banks, as applicable, thereunder, from
F-118
NOTES TO CONSOLIDATED FINANCIAL STATEMENTS (Continued)
(Dollars in thousands, except share and per share amounts)
NOTE 10. DEBT (Continued)
time to time prior to October 9, 2020, unless the commitments under the Revolving Credit Facility have been previously terminated.
Loans comprising each Eurodollar Borrowing or ABR Borrowing, as applicable, bear interest at a rate per annum equal to the Adjusted LIBO Rate or the Alternate Base Rate, as applicable, plus the Applicable Margin, where the Applicable Margin means: in respect of revolving credit loans with respect to any Eurodollar Loan, 3.25% per annum and (ii) with respect to any ABR Loan, 2.25% per annum.
On September 9, 2016, CSC Holdings entered into an amendment (the "Extension Amendment") to the Credit Facilities and the incremental loan assumption agreements dated June 21, 2016 and July 21, 2016 between CSC Holdings and certain lenders party thereto (the "Extending Lenders") pursuant to which each Extending Lender agreed to extend the maturity of its Term Credit Facility under the Credit Facilities to October 11, 2024 and to certain other amendments to the Credit Facilities. In October 2016, CSC Holdings used the net proceeds from the sale of $1,310,000 aggregate principal amount of 5.5% senior guaranteed notes due 2027 (the "2027 Guaranteed Notes") (after the deduction of fees and expenses) to prepay outstanding loans under the Term Credit Facility that were not extended pursuant to the Extension Amendment. The total aggregate principal amount of the Term Credit Facility, after giving effect to the use of proceeds of the 2027 Guaranteed Notes, is $2,500,000 (the "Extended Term Loan"). The Extended Term Loan was effective on October 11, 2016. In connection with the prepayment of the Term Credit Facility, the Company wrote-off the deferred financing costs and the unamortized discount related to the existing term loan aggregating $102,894. Additionally, the Company recorded deferred financing costs and an original issue discount of $7,249 and $6,250, respectively, which are both being amortized to interest expense over the term of the Extended Term Loan.
On December 9, 2016, the Credit Facilities were amended to increase the availability under the Revolving Credit Facility from $2,105,000 to $2,300,000 and extend the maturity on $2,280,000 of this facility to November 30, 2021. The remaining $20,000 will mature on October 9, 2020. The Credit Facilities require CSC Holdings to prepay outstanding term loans, subject to certain exceptions and deductions, with (i) 100% of the net cash proceeds of certain asset sales, subject to reinvestment rights and certain other exceptions, and (ii) commencing with the first full fiscal year after the consummation of the Merger, a ratable share (based on the outstanding principal amount of the Extended Term Loan divided by the sum of the outstanding principal amount of all pari passu indebtedness and the Extended Term Loan) of 50% of the annual excess cash flow of CSC Holdings and its restricted subsidiaries, which will be reduced to 0% if the Consolidated Net Senior Secured Leverage Ratio of CSC Holdings is less than or equal to 4.5 to 1.
Under the Term Credit Facility, CSC Holdings was required to make and made scheduled quarterly payment of $9,500 beginning with the fiscal quarter ending September 30, 2016. Under the Extended Term Loan, CSC Holdings is required to make scheduled quarterly payments equal to 0.25% of the principal amount of the Extended Term Loan, with the remaining balance scheduled to be paid on October 11, 2024, beginning with the fiscal quarter ending March 31, 2017.
Interest will be calculated under the Extended Term Loan subject to a "floor" applicable to the Adjusted LIBO Rate of 0.75% per annum, and the Applicable Margin is (1) with respect to any ABR Loan, 2.00% per annum and (2) with respect to any Eurodollar Loan, 3.00% per annum. If the
F-119
NOTES TO CONSOLIDATED FINANCIAL STATEMENTS (Continued)
(Dollars in thousands, except share and per share amounts)
NOTE 10. DEBT (Continued)
Adjusted LIBO Rate for the Extended Term Loan is less than 0.75% for any given period, the interest rate is fixed at 3.75% per annum.
The Credit Facilities include negative covenants that are substantially similar to the negative covenants contained in the indentures under which the Merger Notes were issued (see discussion below). The Credit Facilities include one financial maintenance covenant (solely for the benefit of the Revolving Credit Facility), consisting of a maximum Consolidated Net Senior Secured Leverage Ratio of 5.0 to 1, which will be tested on the last day of any fiscal quarter but only if on such day there are outstanding borrowings under the Revolving Credit Facility (including swingline loans but excluding any cash collateralized letters of credit and undrawn letters of credit not to exceed $15,000). The Credit Facilities also contain certain customary representations and warranties, affirmative covenants and events of default (including, among others, an event of default upon a change of control). If an event of default occurs, the obligations under the Credit Facilities may be accelerated.
Total amounts payable by the Company under its various debt obligations outstanding, including the debt transaction subsequent to the merger discussed above and including notes payable, collateralized indebtedness, and capital leases, during the periods shown below, are as follows:
Years Ending December 31,
|
|
|||
|---|---|---|---|---|
2017 |
$ | 1,719,180 | ||
2018 |
2,103,441 | |||
2019 |
557,348 | |||
2020 |
526,340 | |||
2021 |
1,200,256 | |||
Thereafter |
9,884,024 | |||
NOTE 11. DERIVATIVE CONTRACTS AND COLLATERALIZED INDEBTEDNESS
The Company has entered into various transactions to limit the exposure against equity price risk on its shares of Comcast Corporation ("Comcast") common stock. The Company has monetized all of its stock holdings in Comcast through the execution of prepaid forward contracts, collateralized by an equivalent amount of the respective underlying stock. At maturity, the contracts provide for the option to deliver cash or shares of Comcast stock with a value determined by reference to the applicable stock price at maturity. These contracts, at maturity, are expected to offset declines in the fair value of these securities below the hedge price per share while allowing the Company to retain upside appreciation from the hedge price per share to the relevant cap price.
The Company received cash proceeds upon execution of the prepaid forward contracts discussed above which has been reflected as collateralized indebtedness in the accompanying consolidated balance sheets. In addition, the Company separately accounts for the equity derivative component of the prepaid forward contracts. These equity derivatives have not been designated as hedges for accounting purposes. Therefore, the net fair values of the equity derivatives have been reflected in the accompanying consolidated balance sheets as an asset or liability and the net increases or decreases in the fair value of the equity derivative component of the prepaid forward contracts are included in gain (loss) on derivative contracts in the accompanying consolidated statements of operations.
F-120
NOTES TO CONSOLIDATED FINANCIAL STATEMENTS (Continued)
(Dollars in thousands, except share and per share amounts)
NOTE 11. DERIVATIVE CONTRACTS AND COLLATERALIZED INDEBTEDNESS (Continued)
All of the Company's monetization transactions are obligations of its wholly-owned subsidiaries that are not part of the Restricted Group; however, CSC Holdings has provided guarantees of the subsidiaries' ongoing contract payment expense obligations and potential payments that could be due as a result of an early termination event (as defined in the agreements). If any one of these contracts were terminated prior to its scheduled maturity date, the Company would be obligated to repay the fair value of the collateralized indebtedness less the sum of the fair values of the underlying stock and equity collar, calculated at the termination date.
The Company monitors the financial institutions that are counterparties to its equity derivative contracts and it diversifies its equity derivative contracts among various counterparties to mitigate exposure to any single financial institution.
The following represents the location of the assets and liabilities associated with the Company's derivative instruments within the consolidated balance sheets:
| |
|
Asset Derivatives |
Liability Derivatives |
||||||
|---|---|---|---|---|---|---|---|---|---|
Derivatives Not Designated as Hedging Instruments |
Balance Sheet Location | Fair Value at December 31, 2015 |
|||||||
Prepaid forward contracts |
Current derivative contracts | $ | 10,333 | $ | 2,706 | ||||
Prepaid forward contracts |
Long-term derivative contracts | 72,075 | — | ||||||
| | | | | | | | | | |
|
$ | 82,408 | $ | 2,706 | |||||
| | | | | | | | | | |
| | | | | | | | | | |
| | | | | | | | | | |
Unrealized and realized gains (losses) related to Company's equity derivative contracts related to the Comcast common stock for the period January 1, 2016 through June 20, 2016 and the years ended December 31, 2015 and 2014 of $(36,283), $104,927, and $(45,055), respectively, are reflected in gain (loss) on equity derivative contracts, net in the Company's consolidated statements of operations.
For the period January 1, 2016 through June 20, 2016 and the years ended December 31, 2015 and 2014, the Company recorded a gain (loss) on investments of $129,510, $(33,935) and $129,832, respectively, representing the net increase (decrease) in the fair values of all investment securities pledged as collateral.
F-121
NOTES TO CONSOLIDATED FINANCIAL STATEMENTS (Continued)
(Dollars in thousands, except share and per share amounts)
NOTE 11. DERIVATIVE CONTRACTS AND COLLATERALIZED INDEBTEDNESS (Continued)
Settlements of Collateralized Indebtedness
The following table summarizes the settlement of the Company's collateralized indebtedness relating to Comcast shares that were settled by delivering cash equal to the collateralized loan value, net of the value of the related equity derivative contracts.
| |
January 1 to June 20, 2016 |
Year Ended December 31, 2015 |
|||||
|---|---|---|---|---|---|---|---|
Number of shares(a) |
10,802,118 | 26,815,368 | |||||
| | | | | | | | |
| | | | | | | | |
| | | | | | | | |
Collateralized indebtedness settled |
$ | (273,519 | ) | $ | (569,562 | ) | |
Derivative contracts settled |
(8,075 | ) | (69,675 | ) | |||
| | | | | | | | |
|
(281,594 | ) | (639,237 | ) | |||
Proceeds from new monetization contracts |
337,149 | 774,703 | |||||
| | | | | | | | |
Net cash receipt |
$ | 55,555 | $ | 135,466 | |||
| | | | | | | | |
| | | | | | | | |
| | | | | | | | |
- (a)
- Share amounts adjusted for the 2 for 1 stock split in February 2017.
The cash was obtained from the proceeds of new monetization contracts covering an equivalent number of Comcast shares. The terms of the new contracts allow the Company to retain upside participation in Comcast shares up to each respective contract's upside appreciation limit with downside exposure limited to the respective hedge price.
NOTE 12. FAIR VALUE MEASUREMENT
The fair value hierarchy is based on inputs to valuation techniques that are used to measure fair value that are either observable or unobservable. Observable inputs reflect assumptions market participants would use in pricing an asset or liability based on market data obtained from independent sources while unobservable inputs reflect a reporting entity's pricing based upon their own market assumptions. The fair value hierarchy consists of the following three levels:
- •
- Level I—Quoted prices for identical instruments in active markets.
- •
- Level II—Quoted prices for similar instruments in active markets; quoted prices for identical or similar instruments in
markets that are not active; and model-derived valuations whose inputs are observable or whose significant value drivers are observable.
- •
- Level III—Instruments whose significant value drivers are unobservable.
F-122
NOTES TO CONSOLIDATED FINANCIAL STATEMENTS (Continued)
(Dollars in thousands, except share and per share amounts)
NOTE 12. FAIR VALUE MEASUREMENT (Continued)
The following table presents for each of these hierarchy levels, the Company's financial assets and financial liabilities that are measured at fair value on a recurring basis:
| |
At December 31, 2015 | ||||||||||||
|---|---|---|---|---|---|---|---|---|---|---|---|---|---|
| |
Level I | Level II | Level III | Total | |||||||||
Assets: |
|||||||||||||
Money market funds |
$ | 922,765 | $ | — | $ | — | $ | 922,765 | |||||
Investment securities |
130 | — | — | 130 | |||||||||
Investment securities pledged as collateral |
1,211,982 | — | — | 1,211,982 | |||||||||
Prepaid forward contracts |
— | 82,408 | — | 82,408 | |||||||||
Liabilities: |
|||||||||||||
Prepaid forward contracts |
— | 2,706 | — | 2,706 | |||||||||
The Company's cash equivalents, investment securities and investment securities pledged as collateral are classified within Level I of the fair value hierarchy because they are valued using quoted market prices.
The Company's prepaid forward contracts reflected as derivative contracts and liabilities under derivative contracts on the Company's balance sheets are valued using market-based inputs to valuation models. These valuation models require a variety of inputs, including contractual terms, market prices, yield curves, and measures of volatility. When appropriate, valuations are adjusted for various factors such as liquidity, bid/offer spreads and credit risk considerations. Such adjustments are generally based on available market evidence. Since model inputs can generally be verified and do not involve significant management judgment, the Company has concluded that these instruments should be classified within Level II of the fair value hierarchy.
In addition, see Note 9 for a discussion of impairment charges related to nonfinancial assets not measured at fair value on a recurring basis.
Fair Value of Financial Instruments
The following methods and assumptions were used to estimate fair value of each class of financial instruments for which it is practicable to estimate:
Credit Facility Debt, Collateralized Indebtedness, Senior Notes and Debentures, Senior Guaranteed Notes and Notes Payable
The fair values of each of the Company's debt instruments are based on quoted market prices for the same or similar issues or on the current rates offered to the Company for instruments of the same remaining maturities. The fair value of notes payable is based primarily on the present value of the remaining payments discounted at the borrowing cost.
F-123
NOTES TO CONSOLIDATED FINANCIAL STATEMENTS (Continued)
(Dollars in thousands, except share and per share amounts)
NOTE 12. FAIR VALUE MEASUREMENT (Continued)
The carrying values, estimated fair values, and classification under the fair value hierarchy of the Company's financial instruments, excluding those that are carried at fair value in the accompanying consolidated balance sheets, are summarized as follows:
| |
|
December 31, 2015 | |||||||
|---|---|---|---|---|---|---|---|---|---|
| |
Fair Value Hierarchy |
Carrying Amount |
Estimated Fair Value |
||||||
Debt instruments: |
|||||||||
Credit facility debt |
Level II | $ | 2,514,454 | $ | 2,525,654 | ||||
Collateralized indebtedness |
Level II | 1,191,324 | 1,176,396 | ||||||
Senior notes and debentures |
Level II | 5,801,011 | 5,756,608 | ||||||
Notes payable |
Level II | 14,544 | 14,483 | ||||||
| | | | | | | | | | |
Total debt instruments |
$ | 9,521,333 | $ | 9,473,141 | |||||
| | | | | | | | | | |
| | | | | | | | | | |
| | | | | | | | | | |
The fair value estimates related to the Company's debt instruments and senior notes receivable presented above are made at a specific point in time, based on relevant market information and information about the financial instrument. These estimates are subjective in nature and involve uncertainties and matters of significant judgments and therefore cannot be determined with precision. Changes in assumptions could significantly affect the estimates.
NOTE 13. INCOME TAXES
Income tax expense attributable to the Company's continuing operations consists of the following components:
| |
January 1 to June 20, 2016 |
Year Ended December 31, 2015 |
Year Ended December 31, 2014 |
|||||||
|---|---|---|---|---|---|---|---|---|---|---|
Current expense: |
||||||||||
Federal |
$ | 6,473 | $ | 4,844 | $ | 6,122 | ||||
State |
1,917 | 15,869 | 2,788 | |||||||
| | | | | | | | | | | |
|
8,390 | 20,713 | 8,910 | |||||||
| | | | | | | | | | | |
Deferred (benefit) expense: |
||||||||||
Federal |
93,253 | 97,927 | 135,873 | |||||||
State |
22,897 | 35,469 | 23,906 | |||||||
| | | | | | | | | | | |
|
116,150 | 133,396 | 159,779 | |||||||
| | | | | | | | | | | |
Tax (benefit) expense relating to uncertain tax positions |
308 | 763 | (52,921 | ) | ||||||
| | | | | | | | | | | |
Income tax expense |
$ | 124,848 | $ | 154,872 | $ | 115,768 | ||||
| | | | | | | | | | | |
| | | | | | | | | | | |
| | | | | | | | | | | |
Income tax benefit attributable to discontinued operations for the year ended December 31, 2015 of $8,731 is comprised of current and deferred income tax benefit of $111 and $8,620, respectively. Income tax expense attributable to discontinued operations for the year ended December 31, 2014 of $2,206 is comprised of current and deferred income tax expense of $108 and $2,098, respectively.
F-124
NOTES TO CONSOLIDATED FINANCIAL STATEMENTS (Continued)
(Dollars in thousands, except share and per share amounts)
NOTE 13. INCOME TAXES (Continued)
The income tax (benefit) expense attributable to the Company's continuing operations differs from the amount derived by applying the statutory federal rate to pretax income principally due to the effect of the following items:
| |
January 1 to June 20, 2016 |
Year Ended December 31, 2015 |
Year Ended December 31, 2014 |
|||||||
|---|---|---|---|---|---|---|---|---|---|---|
Federal tax expense at statutory rate |
$ | 100,926 | $ | 119,931 | $ | 148,803 | ||||
State income taxes, net of federal impact |
14,825 | 18,874 | 19,059 | |||||||
Changes in the valuation allowance |
86 | (902 | ) | (344 | ) | |||||
Changes in the state rates used to measure deferred taxes, net of federal impact |
— | (1,006 | ) | (322 | ) | |||||
Tax expense (benefit) relating to uncertain tax positions |
178 | 574 | (52,914 | ) | ||||||
New York tax reform |
— | 16,334 | (2,050 | ) | ||||||
Non-deductible officers' compensation |
462 | 846 | 1,532 | |||||||
Non-deductible merger transaction costs |
9,392 | — | — | |||||||
Other non-deductible expenses |
1,337 | 3,099 | 3,697 | |||||||
Research credit |
(850 | ) | (2,630 | ) | (2,634 | ) | ||||
Adjustment to prior year tax expense |
— | (515 | ) | (192 | ) | |||||
Other, net |
(1,508 | ) | 267 | 1,133 | ||||||
| | | | | | | | | | | |
Income tax expense |
$ | 124,848 | $ | 154,872 | $ | 115,768 | ||||
| | | | | | | | | | | |
| | | | | | | | | | | |
| | | | | | | | | | | |
The tax effects of temporary differences which give rise to significant portions of deferred tax assets or liabilities and the corresponding valuation allowance at December 31, 2015 are as follows.
Deferred Tax Asset (Liability) |
||||
Current |
||||
NOLs and tax credit carry forwards |
$ | 76,007 | ||
Compensation and benefit plans |
80,831 | |||
Allowance for doubtful accounts |
2,196 | |||
Merger transaction costs |
7,332 | |||
Inventory |
7,135 | |||
Other |
26,216 | |||
| | | | | |
Deferred tax asset |
199,717 | |||
Valuation allowance |
(2,098 | ) | ||
| | | | | |
Net deferred tax asset, current |
197,619 | |||
| | | | | |
Investments |
(163,396 | ) | ||
Prepaid expenses |
(19,627 | ) | ||
| | | | | |
Deferred tax liability, current |
(183,023 | ) | ||
| | | | | |
Net deferred tax asset, current |
$ | 14,596 | ||
| | | | | |
F-125
NOTES TO CONSOLIDATED FINANCIAL STATEMENTS (Continued)
(Dollars in thousands, except share and per share amounts)
NOTE 13. INCOME TAXES (Continued)
Noncurrent |
||||
NOLs and tax credit carry forwards |
$ | 36,866 | ||
Compensation and benefit plans |
97,005 | |||
Partnership investments |
123,529 | |||
Investments |
9,798 | |||
Other |
9,201 | |||
| | | | | |
Deferred tax asset |
276,399 | |||
Valuation allowance |
(2,816 | ) | ||
| | | | | |
Net deferred tax asset, noncurrent |
273,583 | |||
| | | | | |
Fixed assets and intangibles |
(978,418 | ) | ||
| | | | | |
Deferred tax liability, noncurrent |
(978,418 | ) | ||
| | | | | |
Net deferred tax liability, noncurrent |
(704,835 | ) | ||
| | | | | |
Total net deferred tax liability |
$ | (690,239 | ) | |
| | | | | |
| | | | | |
| | | | | |
The Company used the 'with-and-without' approach to determine the recognition and measurement of excess tax benefits. Cash flows resulting from excess tax benefits were classified as cash flows from financing activities. Excess tax benefits are realized tax benefits from tax deductions for options exercised and restricted shares issued in excess of the deferred tax asset attributable to share-based compensation expense for such awards. The Company realized excess tax benefit of $82, $5,694 and $336 for the period January 1, 2016 through June 20, 2016, and for the years ended December 31, 2015 and 2014, respectively, resulting in an increase to paid-in-capital.
Deferred tax assets have resulted primarily from the Company's future deductible temporary differences and NOLs. In assessing the realizability of deferred tax assets, management considers whether it is more likely than not that some portion or all of the deferred tax asset will not be realized. The Company's ability to realize its deferred tax assets depends upon the generation of sufficient future taxable income and tax planning strategies to allow for the utilization of its NOLs and deductible temporary differences. If such estimates and related assumptions change in the future, the Company may be required to record additional valuation allowances against its deferred tax assets, resulting in additional income tax expense in the Company's consolidated statements of income. Management evaluates the realizability of the deferred tax assets and the need for additional valuation allowances quarterly. At this time, based on current facts and circumstances, management believes that it is more likely than not that the Company will realize benefit for its gross deferred tax assets, except those deferred tax assets against which a valuation allowance has been recorded which relate to certain state NOLs.
In the normal course of business, the Company engages in transactions in which the income tax consequences may be uncertain. The Company's income tax returns are filed based on interpretation of tax laws and regulations. Such income tax returns are subject to examination by taxing authorities. For financial statement purposes, the Company only recognizes tax positions that it believes are more likely than not of being sustained. There is considerable judgment involved in determining whether positions taken or expected to be taken on the tax return are more likely than not of being sustained.
F-126
NOTES TO CONSOLIDATED FINANCIAL STATEMENTS (Continued)
(Dollars in thousands, except share and per share amounts)
NOTE 13. INCOME TAXES (Continued)
A reconciliation of the beginning and ending amount of unrecognized tax benefits associated with uncertain tax positions, excluding associated deferred tax benefits and accrued interest, is as follows:
Balance at December 31, 2014 |
$ | 4,011 | ||
Increases related to prior year tax positions |
316 | |||
Increases related to prior year tax positions |
(88 | ) | ||
Increases related to current year tax positions |
3 | |||
Settlements paid in cash |
(220 | ) | ||
| | | | | |
Balance at December 31, 2015 |
4,022 | |||
Increases related to prior year tax positions |
3 | |||
Increases related to current year tax positions |
6 | |||
| | | | | |
Balance at June 20, 2016 |
$ | 4,031 | ||
| | | | | |
| | | | | |
| | | | | |
In the second quarter of 2016, the Company changed its accounting policy on a prospective basis to present interest expense relating to uncertain tax positions as additional interest expense. During the period ended June 20, 2016 and December 31, 2015, interest expense of $209 and $314 was included in income tax expense, respectively.
The most significant jurisdictions in which the Company is required to file income tax returns include the states of New York, New Jersey and Connecticut and the City of New York. The State of New York is presently auditing income tax returns for years 2009 through 2011.
Management does not believe that the resolution of the ongoing income tax examination described above will have a material adverse impact on the financial position of the Company. Changes in the liabilities for uncertain tax positions will be recognized in the interim period in which the positions are effectively settled or there is a change in factual circumstances.
NOTE 14. BENEFIT PLANS
Qualified and Non-qualified Defined Benefit Plans
Cablevision Retirement Plans (collectively, the "Defined Benefit Plans")
The Company sponsors a non-contributory qualified defined benefit cash balance retirement plan (the "Pension Plan") for the benefit of non-union employees other than those of Newsday, as well as certain employees covered by a collective bargaining agreement in Brooklyn.
The Company maintains an unfunded non-contributory non-qualified defined benefit excess cash balance plan ("Excess Cash Balance Plan") covering certain current and former employees of the Company who participate in the Pension Plan, as well as an additional unfunded non-contributory, non-qualified defined benefit plan ("CSC Supplemental Benefit Plan") for the benefit of certain former officers and employees of the Company which provided that, upon retiring on or after normal retirement age, a participant receives a benefit equal to a specified percentage of the participant's average compensation, as defined. All participants were 100% vested in the CSC Supplemental Benefit Plan. The benefits related to the CSC Supplemental Plan were paid to participants in January 2017 and the plan was terminated.
F-127
NOTES TO CONSOLIDATED FINANCIAL STATEMENTS (Continued)
(Dollars in thousands, except share and per share amounts)
NOTE 14. BENEFIT PLANS (Continued)
The Company amended the Pension Plan and the Excess Cash Balance Plan to freeze participation and future benefit accruals effective December 31, 2013 for all Company employees except those covered by a collective bargaining agreement in Brooklyn. Effective April 1, 2015, participation was frozen and future benefit accruals ceased for employees covered by a collective bargaining agreement in Brooklyn. Therefore, after April 1, 2015, no employee of the Company who was not already a participant could participate in the plans and no further annual Pay Credits (a certain percentage of employees' eligible pay) were made. Existing account balances under the plans continue to be credited with monthly interest in accordance with the terms of the plans.
Plan Results for Defined Benefit Plans
Summarized below is the funded status and the amounts recorded on the Company's consolidated balance sheets for all of the Company's Defined Benefit Plans at December 31, 2015:
Change in projected benefit obligation: |
||||
Projected benefit obligation at beginning of year |
$ | 430,846 | ||
Service cost |
344 | |||
Interest cost |
15,523 | |||
Actuarial (gain) loss |
(14,912 | ) | ||
Curtailments |
— | |||
Benefits paid |
(27,838 | ) | ||
| | | | | |
Projected benefit obligation at end of year |
403,963 | |||
| | | | | |
Change in plan assets: |
||||
Fair value of plan assets at beginning of year |
303,676 | |||
Actual return (loss) on plan assets, net |
(3,921 | ) | ||
Employer contributions |
25,929 | |||
Benefits paid |
(27,838 | ) | ||
| | | | | |
Fair value of plan assets at end of year |
297,846 | |||
| | | | | |
Unfunded status at end of year |
$ | (106,117 | ) | |
| | | | | |
| | | | | |
| | | | | |
The accumulated benefit obligation for the Company's Defined Benefit Plans aggregated $403,963 at December 31, 2015.
The Company's net funded status relating to its Defined Benefit Plans at December 31, 2015 are as follows:
Defined Benefit Plans |
$ | (106,117 | ) | |
Less: Current portion related to nonqualified plans |
6,889 | |||
| | | | | |
Long-term defined benefit plan obligations |
$ | (99,228 | ) | |
| | | | | |
| | | | | |
| | | | | |
F-128
NOTES TO CONSOLIDATED FINANCIAL STATEMENTS (Continued)
(Dollars in thousands, except share and per share amounts)
NOTE 14. BENEFIT PLANS (Continued)
Components of the net periodic benefit cost, recorded in other operating expenses, for the Defined Benefit Plans for the period January 1, 2016 to June 20, 2016 and for the years ended December 31, 2015 and 2014, are as follows:
| |
January 1, 2016 to June 20, 2016 |
Year ended December 31, 2015 |
Year ended December 31, 2014 |
|||||||
|---|---|---|---|---|---|---|---|---|---|---|
Service cost |
$ | — | $ | 344 | $ | 774 | ||||
Interest cost |
7,130 | 15,523 | 18,040 | |||||||
Expected return on plan assets, net |
(3,565 | ) | (8,297 | ) | (9,548 | ) | ||||
Recognized actuarial loss (reclassified from accumulated other comprehensive loss) |
(1,446 | ) | 1,294 | 2,364 | ||||||
Settlement (income) loss (reclassified from accumulated other comprehensive loss)(a) |
1,655 | 3,822 | 5,348 | |||||||
| | | | | | | | | | | |
Net periodic benefit cost |
$ | 3,774 | $ | 12,686 | $ | 16,978 | ||||
| | | | | | | | | | | |
| | | | | | | | | | | |
| | | | | | | | | | | |
- (a)
- As a result of benefit payments to terminated or retired individuals exceeding the service and interest costs for the Pension Plan and the Excess Cash Balance Pension Plan during the period January 1, 2016 through June 20, 2016, and years ended December 31, 2015 and 2014, the Company recognized a non-cash settlement loss that represented the acceleration of the recognition of a portion of the previously unrecognized actuarial losses recorded in accumulated other comprehensive loss on the Company's consolidated balance sheets relating to these plans.
Plan Assumptions for Defined Benefit Plans
Weighted-average assumptions used to determine net periodic cost (made at the beginning of the year) and benefit obligations (made at the end of the year) for the Defined Benefit Plans are as follows:
| |
Weighted-Average Assumptions | ||||||||||||
|---|---|---|---|---|---|---|---|---|---|---|---|---|---|
| |
Net Periodic Benefit Cost | |
|||||||||||
| |
Benefit Obligations December 31, 2015 |
||||||||||||
| |
January 1, 2016 to June 20, 2016 |
Year ended December 31, 2015 |
Year ended December 31, 2014 |
||||||||||
Discount rate(a) |
3.76 | % | 3.83 | % | 4.24 | % | 3.94 | % | |||||
Rate of increase in future compensation levels |
— | % | — | % | 3.50 | % | — | % | |||||
Expected rate of return on plan assets (Pension Plan only) |
3.97 | % | 4.03 | % | 4.53 | % | N/A | ||||||
- (a)
- The discount rates of 3.76%, 3.83%, and 4.24% for the period January 1, 2016 through June 20, 2016 , and years ended December 31, 2015 and 2014, respectively, represent the average of the quarterly discount rates used to remeasure the Company's projected benefit obligation and net periodic benefit cost in connection with the recognition of settlement losses discussed above.
The discount rate used by the Company in calculating the net periodic benefit cost for the Cash Balance Plan and the Excess Cash Balance Plan was determined based on the expected future benefit
F-129
NOTES TO CONSOLIDATED FINANCIAL STATEMENTS (Continued)
(Dollars in thousands, except share and per share amounts)
NOTE 14. BENEFIT PLANS (Continued)
payments for the plans and from the Towers Watson U.S. Rate Link: 40-90 Discount Rate Model. The model was developed by examining the yields on selected highly rated corporate bonds.
The Company's expected long-term return on Pension Plan assets is based on a periodic review and modeling of the plan's asset allocation structure over a long-term horizon. Expectations of returns and risk for each asset class are the most important of the assumptions used in the review and modeling and are based on comprehensive reviews of historical data, forward looking economic outlook, and economic/financial market theory. The expected long-term rate of return was chosen as a best estimate and was determined by (a) historical real returns, net of inflation, for the asset classes covered by the investment policy, and (b) projections of inflation over the long-term period during which benefits are payable to plan participants.
Pension Plan Assets and Investment Policy
The weighted average asset allocations of the Pension Plan at December 31, 2015 are as follows:
| |
Plan Assets at December 31, 2015 |
|||
|---|---|---|---|---|
Asset Class: |
||||
Mutual funds |
39 | % | ||
Fixed income securities |
61 | |||
Cash equivalents and other |
— | |||
| | | | | |
|
100 | % | ||
| | | | | |
| | | | | |
| | | | | |
The Pension Plan's investment objectives reflect an overall low risk tolerance to stock market volatility. This strategy allows for the Pension Plan to invest in portfolios that would obtain a rate of return throughout economic cycles, commensurate with the investment risk and cash flow needs of the Pension Plan. The investments held in the Pension Plan are readily marketable and can be sold to fund benefit payment obligations of the plan as they become payable.
Investment allocation decisions are formally made by the Altice USA Benefits Committee, which takes into account investment advice provided by its external investment consultant. The investment consultant takes into account expected long-term risk, return, correlation, and other prudent investment assumptions when recommending asset classes and investment managers to the Company's Investment and Benefit Committee. The major categories of the Pension Plan assets are cash equivalents and bonds which are marked-to-market on a daily basis. Due to the Pension Plan's significant holdings in long-term government and non-government fixed income securities, the Pension Plan's assets are subjected to interest rate risk; specifically, a rising interest rate environment. Consequently, an increase in interest rates may cause a decrease to the overall liability of the Pension Plan thus creating a hedge against rising interest rates. In addition, a portion of the Pension Plan's bond portfolio is invested in foreign debt securities where there could be foreign currency risks associated with them, as well as in non-government securities which are subject to credit risk of the bond issuer defaulting on interest and/or principal payments.
F-130
NOTES TO CONSOLIDATED FINANCIAL STATEMENTS (Continued)
(Dollars in thousands, except share and per share amounts)
NOTE 14. BENEFIT PLANS (Continued)
Investments at Estimated Fair Value
The fair values of the assets of the Pension Plan at December 31, 2015 by asset class are as follows:
Asset Class
|
Level I | Level II | Level III | Total | |||||||||
|---|---|---|---|---|---|---|---|---|---|---|---|---|---|
Mutual funds |
$ | 117,174 | $ | — | $ | — | $ | 117,174 | |||||
Fixed income securities held in a portfolio: |
|||||||||||||
Foreign issued corporate debt |
— | 12,825 | — | 12,825 | |||||||||
U.S. corporate debt |
— | 54,005 | — | 54,005 | |||||||||
Government debt |
— | 8,273 | — | 8,273 | |||||||||
U.S. Treasury securities |
— | 90,414 | — | 90,414 | |||||||||
Asset-backed securities |
— | 18,563 | — | 18,563 | |||||||||
Cash equivalents(a) |
893 | — | — | 893 | |||||||||
| | | | | | | | | | | | | | |
Total(b) |
$ | 118,067 | $ | 184,080 | $ | — | $ | 302,147 | |||||
| | | | | | | | | | | | | | |
| | | | | | | | | | | | | | |
| | | | | | | | | | | | | | |
- (a)
- Represents
an investment in a money market fund.
- (b)
- Excludes cash and net payables relating to the sale of securities that were not settled as of December 31, 2015.
The fair values of mutual funds and cash equivalents were derived from quoted market prices that the Pension Plan administrator has the ability to access.
The fair values of corporate and government debt, treasury securities and asset-back securities were derived from bids received from a vendor or broker not available in an active market that the Pension Plan administrator has the ability to access.
Defined Contribution Plans
The Company also maintains the Cablevision 401(k) Savings Plan, a contributory qualified defined contribution plan for the benefit of non-union employees of the Company. Employees can contribute a percentage of eligible annual compensation and the Company will make a matching cash contribution or discretionary contribution, as defined in the plan. In addition, the Company maintains an unfunded non-qualified excess savings plan for which the Company provides a matching contribution similar to the Cablevision 401(k) Savings Plan.
Applicable employees of the Company are eligible for an enhanced employer matching contribution, as well as a year-end employer discretionary contribution to the Cablevision 401(k) Savings Plan and the Cablevision Excess Savings Plan.
The cost associated with these plans (including the enhanced employer matching and discretionary contributions) was $26,964, $61,343 and $65,725 for the period January 1, 2016 through June 20, 2016, and years ended December 31, 2015 and 2014, respectively.
F-131
NOTES TO CONSOLIDATED FINANCIAL STATEMENTS (Continued)
(Dollars in thousands, except share and per share amounts)
NOTE 15. EQUITY AND LONG-TERM INCENTIVE PLANS
Equity Plans
In connection with the Merger, outstanding equity-based awards granted under the Company's equity plans were cancelled and converted into a right to receive cash based upon the $34.90 per Share merger price in accordance with the original terms of the awards. On the Merger Date, the Company had 11,880,700 stock options, 3,769,485 restricted shares, 1,724,940 restricted stock units issued to employees and 466,283 restricted stock units issued to non-employee directors outstanding. The aggregate payment was $439,167 and represents a portion of the merger consideration. Approximately $63,484 of compensation costs related to the acceleration of the vesting of these awards in connection with the Merger and the related employer payroll taxes of $7,929 were recorded on the black line and therefore are not reflected in either the Predecessor or Successor periods.
In March 2015, the Company's Board of Directors approved the Cablevision Systems Corporation 2015 Employee Stock Plan ("2015 Plan"), which was approved by Cablevision's stockholders at its annual stockholders meeting on May 21, 2015. Under the 2015 Plan, the Company was authorized to grant stock options, restricted shares, restricted stock units, stock appreciation rights, and other equity-based awards. As of December 31, 2015, 79,780 equity based awards had been granted under the 2015 Plan.
The Company also had an employee stock plan ("2006 Plan") under which it was authorized to grant incentive stock options, nonqualified stock options, restricted shares, restricted stock units, stock appreciation rights and other equity-based awards and a 2006 Stock Plan for Non-Employee Directors, whereby the Company was authorized to grant nonqualified stock options, restricted stock units and other equity-based awards. In 2015 and 2014, the Company granted its non-employee directors an aggregate of 73,056 and 66,421 restricted stock units, respectively. Total non-employee director restricted stock units outstanding as of December 31, 2015 were 466,283.
Since share-based compensation expense is based on awards that are ultimately expected to vest, such compensation expense was reduced for estimated forfeitures. Forfeitures were estimated based primarily on historical experience.
The following table presents the share-based compensation expense recognized by the Company as other operating expenses:
| |
January 1, 2016 to June 20, 2016 |
Year ended December 31, 2015 |
Year ended December 31, 2014 |
|||||||
|---|---|---|---|---|---|---|---|---|---|---|
Stock options |
$ | 3,848 | $ | 9,159 | $ | 7,573 | ||||
Restricted shares and restricted stock units |
20,930 | 51,162 | 36,411 | |||||||
| | | | | | | | | | | |
Share-based compensation related to equity classified awards |
24,778 | 60,321 | 43,984 | |||||||
| | | | | | | | | | | |
Other share-based compensation |
453 | 4,965 | — | |||||||
| | | | | | | | | | | |
Total share-based compensation |
$ | 25,231 | $ | 65,286 | $ | 43,984 | ||||
| | | | | | | | | | | |
| | | | | | | | | | | |
| | | | | | | | | | | |
An income tax benefit of $10,357, $26,718 and $17,801 was recognized in continuing operations resulting from share-based compensation expense for the period from January 1, 2016 through June 20, 2016 and years ended December 31, 2015 and 2014, respectively.
F-132
NOTES TO CONSOLIDATED FINANCIAL STATEMENTS (Continued)
(Dollars in thousands, except share and per share amounts)
NOTE 15. EQUITY AND LONG-TERM INCENTIVE PLANS (Continued)
Cash received from stock option exercises for the period January 1, 2016 through June 20, 2016, and years ended December 31, 2015 and 2014, respectively was $14,411, $18,727 and $55,355, respectively.
Valuation Assumptions—Stock Options
The Company calculated the fair value of each option award on the date of grant. The Company's computation of expected life was determined based on historical experience of similar awards, giving consideration to the contractual terms of the share-based awards and vesting schedules, or by using the simplified method (the average of the vesting period and option term), if applicable. The interest rate for periods within the contractual life of the stock option was based on interest yields for U.S. Treasury instruments in effect at the time of grant. The Company's computation of expected volatility was based on historical volatility of its common stock.
The following assumptions were used to calculate the fair values of stock option awards granted in the first quarter of 2015 and 2014:
| |
2015 | 2014 | |||||
|---|---|---|---|---|---|---|---|
Risk-free interest rate |
1.82 | % | 2.12 | % | |||
Expected life (in years) |
8 | 6.5 | |||||
Dividend yield |
3.63 | % | 3.79 | % | |||
Volatility |
39.98 | % | 42.80 | % | |||
Grant date fair value |
$ | 5.45 | $ | 5.27 | |||
Share-Based Payment Award Activity
The following table summarizes activity relating to Company employees who held Cablevision stock options for the period January 1, 2016 to June 20, 2016 and for the year ended December 31, 2015:
| |
|
|
|
Weighted Average Remaining Contractual Term (in years) |
|
|||||||||||
|---|---|---|---|---|---|---|---|---|---|---|---|---|---|---|---|---|
| |
Shares Under Option | |
|
|||||||||||||
| |
Weighted Average Exercise Price Per Share |
|
||||||||||||||
| |
Time Vesting Options |
Performance Based Vesting Options |
Aggregate Intrinsic Value(a) |
|||||||||||||
Balance, December 31, 2014 |
5,097,666 | 7,633,500 | $ | 14.41 | 7.17 | $ | 79,347 | |||||||||
Granted |
2,000,000 | — | 19.17 | |||||||||||||
Exercised |
(353,666 | ) | (1,024,283 | ) | 12.84 | |||||||||||
| | | | | | | | | | | | | | | | | |
Balance, December 31, 2015 |
6,744,000 | 6,609,217 | 15.28 | 6.80 | 221,900 | |||||||||||
Exercised |
(744,000 | ) | (728,517 | ) | 13.97 | |||||||||||
| | | | | | | | | | | | | | | | | |
Balance, June 20, 2016 |
6,000,000 | 5,880,700 | $ | 15.45 | ||||||||||||
| | | | | | | | | | | | | | | | | |
| | | | | | | | | | | | | | | | | |
| | | | | | | | | | | | | | | | | |
- (a)
- The aggregate intrinsic value is calculated as the difference between (i) the exercise price of the underlying award and (ii) the quoted price of CNYG Class A common stock on December 31, 2015, as indicated.
F-133
NOTES TO CONSOLIDATED FINANCIAL STATEMENTS (Continued)
(Dollars in thousands, except share and per share amounts)
NOTE 15. EQUITY AND LONG-TERM INCENTIVE PLANS (Continued)
Restricted Stock Award Activity
The following table summarizes activity relating to Company employees who held Cablevision restricted shares and restricted stock units for the period January 1, 2016 to June 20, 2016 and for the year ended December 31, 2015:
| |
Number of Restricted Shares |
Number of Performance Restricted Shares |
Number of Performance Based Restricted Stock Units ("PSU")(a) |
Weighted Average Fair Value Per Share at Date of Grant |
|||||||||
|---|---|---|---|---|---|---|---|---|---|---|---|---|---|
Unvested award balance, December 31, 2014 |
5,314,870 | 2,035,300 | — | $ | 15.46 | ||||||||
Granted |
1,747,870 | 584,400 | 1,851,700 | 19.43 | |||||||||
Vested |
(1,598,363 | ) | (739,600 | ) | — | 14.48 | |||||||
Awards forfeited |
(496,629 | ) | — | (79,270 | ) | 17.28 | |||||||
| | | | | | | | | | | | | | |
Unvested award balance, December 31, 2015 |
4,967,748 | 1,880,100 | 1,772,430 | 17.53 | |||||||||
Vested |
(2,239,167 | ) | (753,296 | ) | — | 15.35 | |||||||
Awards forfeited |
(85,900 | ) | — | (47,490 | ) | 18.38 | |||||||
| | | | | | | | | | | | | | |
Unvested award balance, June 20, 2016 |
2,642,681 | 1,126,804 | 1,724,940 | ||||||||||
| | | | | | | | | | | | | | |
| | | | | | | | | | | | | | |
| | | | | | | | | | | | | | |
- (a)
- The PSUs entitled the employee to shares of CNYG common stock up to 150% of the number of PSUs granted depending on the level of achievement of the specified performance criteria. If the minimum performance threshold was not met, no shares were issued. Accrued dividends were paid to the extent that a PSU vested and the related stock was issued.
During the first quarter of 2016, 2,992,463 Cablevision restricted shares issued to employees of the Company vested. To fulfill the employees' statutory minimum tax withholding obligations for the applicable income and other employment taxes, 1,248,875 of these shares, with an aggregate value of $41,469, were surrendered to the Company. During the year ended December 31, 2015, 2,337,963 Cablevision restricted shares issued to employees of the Company vested. To fulfill the employees' statutory minimum tax withholding obligations for the applicable income and other employment taxes, 1,004,950 of these shares, with an aggregate value of $19,141 were surrendered to the Company. These acquired shares had been classified as treasury stock.
Long-Term Incentive Plan Awards
In March 2011, the Company's Board of Directors approved the Cablevision Systems Corporation 2011 Cash Incentive Plan, which was approved by the Company's stockholders at its annual stockholders meeting in May 2011. The Company recorded expenses of $9,169, $27,170 and $43,892 for the period January 1, 2016 through June 20, 2016, and years ended December 31, 2015 and 2014, respectively, related to this plan.
Carried Unit Plan
Subsequent to the merger, in July 2016, certain employees of the Company and its affiliates received awards of units in a Carry Unit Plan of an entity which has an ownership interest in the
F-134
NOTES TO CONSOLIDATED FINANCIAL STATEMENTS (Continued)
(Dollars in thousands, except share and per share amounts)
NOTE 15. EQUITY AND LONG-TERM INCENTIVE PLANS (Continued)
Company's parent, Neptune Holding. The awards generally will vest as follows: 50% on the second anniversary of June 21, 2016 ("Base Date"), 25% on the third anniversary of the Base Date, and 25% on the fourth anniversary of the Base Date. Prior to the fourth anniversary, the Company has the right to repurchase vested awards held by employees upon their termination. The Carry Unit Plan has 259,442,785 units authorized for issuance, of which 102,500,000 have been issued to employees of the Company and 100,300,000 have been issued to employees of Altice and affiliated companies.
NOTE 16. AFFILIATE AND RELATED PARTY TRANSACTIONS
Equity Method Investments
In September 2015, the Company purchased the minority interest in Newsday Holdings LLC ("Newsday Holdings") held by Tribune Media Company ("Tribune") for approximately $8,300. As a result of this transaction, Newsday Holdings became a wholly-owned subsidiary of the Company. In addition, the indemnity provided by the Company to Tribune for certain taxes incurred by Tribune if Newsday Holdings or its subsidiary sold or otherwise disposed of Newsday assets in a taxable transaction or failed to maintain specified minimum outstanding indebtedness, was amended so that the restriction period lapsed on September 2, 2015.
Subsequent to the Merger, in July 2016, the Company completed the sale of a 75% interest in Newsday LLC. The Company retained the remaining 25% ownership interest.
In December 2016, the Company made an investment of $1,966 in I24NEWS, Altice's 24/7 international news and current affairs channel, representing a 25% ownership interest and the 75% interest is owned by a subsidiary of Altice.
Related Party Transactions
As the transactions discussed below were conducted between subsidiaries under common control, amounts charged for certain services may not have represented amounts that might have been received or incurred if the transactions were based upon arm's length negotiations.
Cablevision is controlled by Charles F. Dolan, certain members of his immediate family and certain family related entities (collectively the "Dolan Family"). Members of the Dolan Family are also the controlling stockholders of AMC Networks, The Madison Square Garden Company and MSG Networks Inc. ("MSG Networks").
F-135
NOTES TO CONSOLIDATED FINANCIAL STATEMENTS (Continued)
(Dollars in thousands, except share and per share amounts)
NOTE 16. AFFILIATE AND RELATED PARTY TRANSACTIONS (Continued)
The following table summarizes the revenue and charges (credits) related to services provided to or received from AMC Networks, Madison Square Garden Company and MSG Networks for the Predecessor periods:
| |
|
Years Ended December 31, |
||||||||
|---|---|---|---|---|---|---|---|---|---|---|
| |
January 1, 2016 to June 20, 2016 |
|||||||||
| |
2015 | 2014 | ||||||||
Revenue |
$ | 2,088 | $ | 5,343 | $ | 5,075 | ||||
| | | | | | | | | | | |
| | | | | | | | | | | |
| | | | | | | | | | | |
Operating expenses: |
||||||||||
Programming and other direct costs, net of credits |
$ | 84,636 | $ | 176,909 | $ | 179,144 | ||||
Other operating expenses, net of credits |
2,182 | 5,372 | 3,878 | |||||||
| | | | | | | | | | | |
Operating expenses, net |
86,818 | 182,281 | 183,022 | |||||||
| | | | | | | | | | | |
Net charges |
$ | 84,730 | $ | 176,938 | $ | 177,947 | ||||
| | | | | | | | | | | |
| | | | | | | | | | | |
| | | | | | | | | | | |
Revenue
The Company recognized revenue in connection with television advertisements and print advertising, as well as certain telecommunication services charged by its subsidiaries to AMC Networks, Madison Square Garden and MSG Networks. The Company and its subsidiaries, together with AMC Networks, Madison Square Garden and MSG Networks may have entered into agreements with third parties in which the amounts paid/received by AMC Networks, Madison Square Garden and MSG Networks, their subsidiaries, or the Company may have differed from the amounts that would have been paid/received if such arrangements were negotiated separately. Where subsidiaries of the Company have incurred a cost incremental to fair value and AMC Networks, Madison Square Garden and MSG Networks have received a benefit incremental to fair value from these negotiations, the Company and its subsidiaries charged AMC Networks, Madison Square Garden and MSG Networks for the incremental amount.
Programming and other direct costs
Programming and other direct costs included costs incurred by the Company for the carriage of the MSG Networks and Fuse program services (2014 period only), as well as for AMC, WE tv, IFC, Sundance Channel and BBC America (2015 period only) on the Company's cable systems. The Company also purchased certain programming signal transmission and production services from AMC Networks.
Other operating expenses (credits)
The Company, AMC Networks, Madison Square Garden and MSG Networks routinely entered into transactions with each other in the ordinary course of business. Such transactions included, but were not limited to, sponsorship agreements and cross-promotion arrangements. Additionally, amounts reflected in the tables were net of allocations to AMC Networks, Madison Square Garden and MSG Networks for services performed by the Company on their behalf. Amounts also included charges to the Company for services performed or paid by the affiliate on the Company's behalf.
F-136
NOTES TO CONSOLIDATED FINANCIAL STATEMENTS (Continued)
(Dollars in thousands, except share and per share amounts)
NOTE 16. AFFILIATE AND RELATED PARTY TRANSACTIONS (Continued)
Subsequent to the Merger, the Company continues to receive or provide services to these entities, but these entities are no longer related parties.
Transactions with Other Affiliates
During the period ended January 1, 2016 to June 20, 2016 and the years ended December 31, 2015 and 2014, the Company provided services to or incurred costs on behalf of certain related parties, including from time to time, the Dolan Family. All costs incurred on behalf of these related parties were reimbursed to the Company. Aggregate amounts that were due from and due to AMC Networks, Madison Square Garden and MSG Networks and other affiliates at December 31, 2015 (Predecessor) is summarized below:
| |
December 31, 2015 |
|||
|---|---|---|---|---|
Amounts due from affiliates |
$ | 767 | ||
Amounts due to affiliates |
29,729 | |||
NOTE 17. COMMITMENTS AND CONTINGENCIES
Legal Matters
Cable Operations Litigation
Marchese, et al. v. Cablevision Systems Corporation and CSC Holdings, LLC:
The Company is a defendant in a lawsuit filed in the U.S. District Court for the District of New Jersey by several present and former Cablevision subscribers, purportedly on behalf of a class of iO video subscribers in New Jersey, Connecticut and New York. After three versions of the complaint were dismissed without prejudice by the District Court, plaintiffs filed their third amended complaint on August 22, 2011, alleging that the Company violated Section 1 of the Sherman Antitrust Act by allegedly tying the sale of interactive services offered as part of iO television packages to the rental and use of set-top boxes distributed by Cablevision, and violated Section 2 of the Sherman Antitrust Act by allegedly seeking to monopolize the distribution of Cablevision compatible set-top boxes. Plaintiffs seek unspecified treble monetary damages, attorney's fees, as well as injunctive and declaratory relief. On September 23, 2011, the Company filed a motion to dismiss the third amended complaint. On January 10, 2012, the District Court issued a decision dismissing with prejudice the Section 2 monopolization claim, but allowing the Section 1 tying claim and related state common law claims to proceed. Cablevision's answer to the third amended complaint was filed on February 13, 2012. On December 7, 2015, the parties entered into a settlement agreement, which is subject to approval by the Court. On December 11, 2015, plaintiffs filed a motion for preliminary approval of the settlement, conditional certification of the settlement class, and approval of a class notice distribution plan. On March 10, 2016 the Court granted preliminary approval of the settlement and approved the class notice distribution plan.
Subsequent to the Merger, the class notice distribution and the claims submission process have now concluded. The Court granted final approval of the settlement on September 12, 2016 in the amount of $15,600, and the effective date of the settlement was October 24, 2016.
F-137
NOTES TO CONSOLIDATED FINANCIAL STATEMENTS (Continued)
(Dollars in thousands, except share and per share amounts)
NOTE 17. COMMITMENTS AND CONTINGENCIES (Continued)
In re Cablevision Consumer Litigation:
Following expiration of the affiliation agreements for carriage of certain Fox broadcast stations and cable networks on October 16, 2010, News Corporation terminated delivery of the programming feeds to the Company, and as a result, those stations and networks were unavailable on the Company's cable television systems. On October 30, 2010, the Company and Fox reached an agreement on new affiliation agreements for these stations and networks, and carriage was restored. Several purported class action lawsuits were subsequently filed on behalf of the Company's customers seeking recovery for the lack of Fox programming. Those lawsuits were consolidated in an action before the U. S. District Court for the Eastern District of New York, and a consolidated complaint was filed in that court on February 22, 2011. Plaintiffs asserted claims for breach of contract, unjust enrichment, and consumer fraud, seeking unspecified compensatory damages, punitive damages and attorneys' fees. On March 28, 2012, the Court ruled on the Company's motion to dismiss, denying the motion with regard to plaintiffs' breach of contract claim, but granting it with regard to the remaining claims, which were dismissed. On April 16, 2012, plaintiffs filed a second consolidated amended complaint, which asserts a claim only for breach of contract. The Company's answer was filed on May 2, 2012. On October 10, 2012, plaintiffs filed a motion for class certification and on December 13, 2012, a motion for partial summary judgment. On March 31, 2014, the Court granted plaintiffs' motion for class certification, and denied without prejudice plaintiffs' motion for summary judgment. On May 30, 2014, the Court approved the form of class notice, and on October 7, 2014, approved the class notice distribution plan. The class notice distribution has been completed, and the opt-out period expired on February 27, 2015. Expert discovery commenced on May 5, 2014, and concluded on December 8 and 28, 2015, when the Court ruled on the pending expert discovery motions. On January 26, 2016, the Court approved a schedule for filing of summary judgment motions. Plaintiffs filed a motion for summary judgment on March 31, 2016. The Company filed its own summary judgment motion on June 13, 2016. The parties are actively engaged in settlement discussions although financial terms have not yet been finalized.
Patent Litigation
Cablevision is named as a defendant in certain lawsuits claiming infringement of various patents relating to various aspects of the Company's businesses. In certain of these cases other industry participants are also defendants. In certain of these cases the Company expects that any potential liability would be the responsibility of the Company's equipment vendors pursuant to applicable contractual indemnification provisions. The Company believes that the claims are without merit and intends to defend the actions vigorously, but is unable to predict the outcome of these lawsuits or reasonably estimate a range of possible loss.
In addition to the matters discussed above, the Company is party to various lawsuits, some involving claims for substantial damages. Although the outcome of these other matters cannot be predicted and the impact of the final resolution of these other matters on the Company's results of operations in a particular subsequent reporting period is not known, management does not believe that the resolution of these other lawsuits will have a material adverse effect on the financial position of the Company or the ability of the Company to meet its financial obligations as they become due.
F-138
NOTES TO CONSOLIDATED FINANCIAL STATEMENTS (Continued)
(Dollars in thousands, except share and per share amounts)
NOTE 17. COMMITMENTS AND CONTINGENCIES (Continued)
Other Litigation
In April 2011, Thomas C. Dolan, a director and Executive Vice President, Strategy and Development, in the Office of the Chairman at Cablevision, filed a lawsuit against Cablevision and Rainbow Media Holdings LLC (which was subsequently dismissed as a party) in New York State Supreme Court. The lawsuit raised compensation-related claims related to events largely from 2005 to 2008. The matter was handled under the direction of an independent committee of the Board of Directors of Cablevision. In April 2015, the Court granted summary judgment in favor of the plaintiff on liability, with damages to be determined. On June 18, 2015, the Company filed a notice of appeal. On February 8, 2016, Cablevision and Thomas C. Dolan entered into a settlement pursuant to which the Company agreed to pay plaintiff $21,000 and plaintiff released all claims. A stipulation of dismissal with prejudice was approved and entered by the Court on February 8, 2016, and payment was made the same day. The appeal has also been withdrawn. The Company recorded an expense of $21,000 which is reflected in discontinued operations in the accompanying consolidated statements of operations for the year ended December 31, 2015 (see Note 6).
NOTE 18. INTERIM FINANCIAL INFORMATION (Unaudited)
The following is a summary of the Company's selected quarterly financial data for the years ended December 31, 2016 and 2015:
2016:
|
March 31, 2016 |
April 1 to June 20, 2016 |
|||||
|---|---|---|---|---|---|---|---|
Revenue |
$ | 1,645,890 | $ | 1,491,714 | |||
Operating expenses |
(1,394,635 | ) | (1,267,663 | ) | |||
| | | | | | | | |
Operating income |
$ | 251,255 | $ | 224,051 | |||
| | | | | | | | |
| | | | | | | | |
| | | | | | | | |
Net income |
$ | 94,311 | $ | 69,201 | |||
Net loss attributable to noncontrolling interests |
66 | 170 | |||||
| | | | | | | | |
Net income attributable to Cablevision Systems Corporation stockholders |
$ | 94,377 | $ | 69,371 | |||
| | | | | | | | |
| | | | | | | | |
| | | | | | | | |
Basic income per share attributable to Cablevision Systems Corporation stockholders: |
|||||||
Income from continuing operations, net of income taxes |
$ | 0.35 | $ | 0.25 | |||
| | | | | | | | |
| | | | | | | | |
| | | | | | | | |
Loss from discontinued operations, net of income taxes |
$ | — | $ | — | |||
| | | | | | | | |
| | | | | | | | |
| | | | | | | | |
Net income |
$ | 0.35 | $ | 0.25 | |||
| | | | | | | | |
| | | | | | | | |
| | | | | | | | |
Diluted income per share attributable to Cablevision Systems Corporation stockholders: |
|||||||
Income from continuing operations, net of income taxes |
$ | 0.34 | $ | 0.25 | |||
| | | | | | | | |
| | | | | | | | |
| | | | | | | | |
Loss from discontinued operations, net of income taxes |
$ | — | $ | — | |||
| | | | | | | | |
| | | | | | | | |
| | | | | | | | |
Net income |
$ | 0.34 | $ | 0.25 | |||
| | | | | | | | |
| | | | | | | | |
| | | | | | | | |
Amounts attributable to Cablevision Systems Corporation stockholders: |
|||||||
Income from continuing operations, net of income taxes |
$ | 94,377 | $ | 69,371 | |||
Loss from discontinued operations, net of income taxes |
— | — | |||||
| | | | | | | | |
Net income |
$ | 94,377 | $ | 69,371 | |||
| | | | | | | | |
| | | | | | | | |
| | | | | | | | |
F-139
NOTES TO CONSOLIDATED FINANCIAL STATEMENTS (Continued)
(Dollars in thousands, except share and per share amounts)
NOTE 18. INTERIM FINANCIAL INFORMATION (Unaudited) (Continued)
| |
Predecessor | |||||||||||||||
|---|---|---|---|---|---|---|---|---|---|---|---|---|---|---|---|---|
2015:
|
March 31, 2015 |
June 30, 2015 |
September 30, 2015 |
December 31, 2015 |
Total 2015 |
|||||||||||
Revenue |
$ | 1,622,352 | $ | 1,661,940 | $ | 1,624,828 | $ | 1,636,425 | $ | 6,545,545 | ||||||
Operating expenses |
(1,398,601 | ) | (1,417,476 | ) | (1,441,712 | ) | (1,439,285 | ) | (5,697,074 | ) | ||||||
| | | | | | | | | | | | | | | | | |
Operating income |
$ | 223,751 | $ | 244,464 | $ | 183,116 | $ | 197,140 | $ | 848,471 | ||||||
| | | | | | | | | | | | | | | | | |
| | | | | | | | | | | | | | | | | |
| | | | | | | | | | | | | | | | | |
Income from continuing operations, net of income taxes |
$ | 54,901 | $ | 75,676 | $ | 23,431 | $ | 33,781 | $ | 187,789 | ||||||
Income (loss) from discontinued operations, net of income taxes |
(10,502 | ) | — | (406 | ) | (1,633 | ) | (12,541 | ) | |||||||
| | | | | | | | | | | | | | | | | |
Net income |
44,399 | 75,676 | 23,025 | 32,148 | 175,248 | |||||||||||
Net loss (income) attributable to noncontrolling interests |
234 | (81 | ) | 78 | (30 | ) | 201 | |||||||||
| | | | | | | | | | | | | | | | | |
Net income attributable to Cablevision Systems Corporation stockholders |
$ | 44,633 | $ | 75,595 | $ | 23,103 | $ | 32,118 | $ | 175,449 | ||||||
| | | | | | | | | | | | | | | | | |
| | | | | | | | | | | | | | | | | |
| | | | | | | | | | | | | | | | | |
Basic income per share attributable to Cablevision Systems Corporation stockholders: |
||||||||||||||||
Income from continuing operations, net of income taxes |
$ | 0.21 | $ | 0.28 | $ | 0.09 | $ | 0.12 | $ | 0.70 | ||||||
| | | | | | | | | | | | | | | | | |
| | | | | | | | | | | | | | | | | |
| | | | | | | | | | | | | | | | | |
Income (loss) from discontinued operations, net of income taxes |
$ | (0.04 | ) | $ | — | $ | — | $ | (0.01 | ) | $ | (0.05 | ) | |||
| | | | | | | | | | | | | | | | | |
| | | | | | | | | | | | | | | | | |
| | | | | | | | | | | | | | | | | |
Net income |
$ | 0.17 | $ | 0.28 | $ | 0.09 | $ | 0.12 | $ | 0.65 | ||||||
| | | | | | | | | | | | | | | | | |
| | | | | | | | | | | | | | | | | |
| | | | | | | | | | | | | | | | | |
Diluted income per share attributable to Cablevision Systems Corporation stockholders: |
||||||||||||||||
Income from continuing operations, net of income taxes |
$ | 0.20 | $ | 0.27 | $ | 0.08 | $ | 0.12 | $ | 0.68 | ||||||
| | | | | | | | | | | | | | | | | |
| | | | | | | | | | | | | | | | | |
| | | | | | | | | | | | | | | | | |
Income (loss) from discontinued operations, net of income taxes |
$ | (0.04 | ) | $ | — | $ | — | $ | (0.01 | ) | $ | (0.05 | ) | |||
| | | | | | | | | | | | | | | | | |
| | | | | | | | | | | | | | | | | |
| | | | | | | | | | | | | | | | | |
Net income |
$ | 0.16 | $ | 0.27 | $ | 0.08 | $ | 0.12 | $ | 0.63 | ||||||
| | | | | | | | | | | | | | | | | |
| | | | | | | | | | | | | | | | | |
| | | | | | | | | | | | | | | | | |
Amounts attributable to Cablevision Systems Corporation stockholders: |
||||||||||||||||
Income from continuing operations, net of income taxes |
$ | 55,135 | $ | 75,595 | $ | 23,509 | $ | 33,751 | $ | 187,990 | ||||||
Income (loss) from discontinued operations, net of income taxes |
(10,502 | ) | — | (406 | ) | (1,633 | ) | (12,541 | ) | |||||||
| | | | | | | | | | | | | | | | | |
Net income |
$ | 44,633 | $ | 75,595 | $ | 23,103 | $ | 32,118 | $ | 175,449 | ||||||
| | | | | | | | | | | | | | | | | |
| | | | | | | | | | | | | | | | | |
| | | | | | | | | | | | | | | | | |
NOTE 19. BUSINESS COMBINATION
As discussed in Note 1, Cablevision completed the Merger on June 21, 2016. The Merger was accounted for as a business combination in accordance with ASC Topic 805. The following table provides the preliminary allocation of the total purchase price of $9,958,323 to the identifiable tangible
F-140
NOTES TO CONSOLIDATED FINANCIAL STATEMENTS (Continued)
(Dollars in thousands, except share and per share amounts)
NOTE 19. BUSINESS COMBINATION (Continued)
and intangible assets and liabilities of Cablevision based on preliminary fair value information currently available, which is subject to change within the measurement period (up to one year from the acquisition date).
| |
Estimates of Fair Values (As of December 31, 2016) |
Estimated Useful Lives |
|||
|---|---|---|---|---|---|
Current assets |
$ | 1,923,071 | |||
Accounts receivable |
271,305 | ||||
Property, plant and equipment |
4,864,621 | 2 - 18 years | |||
Goodwill |
5,838,959 | ||||
Indefinite-lived cable television franchises |
8,113,575 | Indefinite-lived | |||
Customer relationships |
4,850,000 | 8 to 18 years | |||
Trade names |
1,010,000 | 12 years | |||
Amortizable intangible assets |
23,296 | 1 - 15 years | |||
Other non-current assets |
748,998 | ||||
Current liabilities |
(2,305,954 | ) | |||
Long-term debt |
(8,355,386 | ) | |||
Deferred income taxes. |
(6,834,807 | ) | |||
Other non-current liabilities |
(189,355 | ) | |||
| | | | | | |
Total |
$ | 9,958,323 | |||
| | | | | | |
| | | | | | |
| | | | | | |
The fair value of identified intangible assets was estimated using derivations of the "income" approach. Customer relationships and cable television franchises were valued using the multiple period excess earnings method ("MPEEM") approach. The MPEEM approach quantifies the expected earnings of an asset by isolating earnings attributable to the asset from the overall business enterprise earnings and then removing a charge for those assets that contribute to the generation of the isolated earnings. The future expected earnings are discounted to their present value equivalent.
Trade names were valued using the relief from royalty method, which is based on the present value of the royalty payments avoided as a result of the company owning the intangible asset.
The basis for the valuation methods was the Company's projections. These projections were based on management's assumptions including among others, penetration rates for video, high speed data, and voice; revenue growth rates; operating margins; and capital expenditures. The assumptions are derived based on the Company's and its peers' historical operating performance adjusted for current and expected competitive and economic factors surrounding the cable industry. The discount rates used in the analysis are intended to reflect the risk inherent in the projected future cash flows generated by the respective intangible asset. The value is highly dependent on the achievement of the future financial results contemplated in the projections. The estimates and assumptions made in the valuation are inherently subject to significant uncertainties, many of which are beyond the Company's control, and there is no assurance that these results can be achieved. The primary assumptions for which there is a reasonable possibility of the occurrence of a variation that would have significantly affected the value include the assumptions regarding revenue growth, programming expense growth rates, the amount and timing of capital expenditures and the discount rate utilized.
F-141
NOTES TO CONSOLIDATED FINANCIAL STATEMENTS (Continued)
(Dollars in thousands, except share and per share amounts)
NOTE 19. BUSINESS COMBINATION (Continued)
In establishing fair value for the vast majority of the Company's property, plant and equipment, the cost approach was utilized. The cost approach considers the amount required to replace an asset by constructing or purchasing a new asset with similar utility, then adjusts the value in consideration of physical depreciation, and functional and economic obsolescence as of the appraisal date. The cost approach relies on management's assumptions regarding current material and labor costs required to rebuild and repurchase significant components of our property, plant and equipment along with assumptions regarding the age and estimated useful lives of our property, plant and equipment.
The estimates of expected useful lives take into consideration the effects of contractual relationships, customer attrition, eventual development of new technologies and market competition.
As a result of applying business combination accounting, the Company recorded goodwill, which represented the excess of organization value over amounts assigned to the other identifiable tangible and intangible assets arising from expectations of future operational performance and cash generation.
The following table sets forth the estimated amortization expense on the intangible assets recorded in the connection with the Merger for the years ending December 31:
Estimated amortization expense |
||||
Year Ending December 31, 2017 |
$ | 701,908 | ||
Year Ending December 31, 2018 |
655,409 | |||
Year Ending December 31, 2019 |
609,245 | |||
Year Ending December 31, 2020 |
562,613 | |||
Year Ending December 31, 2021 |
515,430 |
The unaudited pro forma revenue, loss from continuing operations and net loss for the years ended December 31, 2015, as if the Merger had occurred on January 1, 2015, are as follows:
Revenue |
$ | 6,545,545 | ||
| | | | | |
| | | | | |
| | | | | |
Loss from continuing operations |
$ | (740,115 | ) | |
| | | | | |
| | | | | |
| | | | | |
Net loss |
$ | (752,656 | ) | |
| | | | | |
| | | | | |
| | | | | |
The pro forma results presented above include the impact of additional interest expense related to the debt issued to finance the Merger. The pro forma results also reflect additional amortization expense related to the identifiable intangible assets recorded in connection with the Merger and additional depreciation expense related to the fair value adjustment to property, plant and equipment.
F-142
Report of Independent Auditors
To the Board of Directors of Cequel Corporation
We have audited the accompanying consolidated financial statements of Cequel Corporation and its subsidiaries (Predecessor), which comprise the consolidated balance sheet as of December 31, 2014, and the related consolidated statements of operations and comprehensive (loss)/income, of changes in stockholders' equity and of cash flows for the period from January 1, 2015 to December 20, 2015 and for the year ended December 31, 2014.
Management's Responsibility for the Consolidated Financial Statements
Management is responsible for the preparation and fair presentation of the consolidated financial statements in accordance with accounting principles generally accepted in the United States of America; this includes the design, implementation, and maintenance of internal control relevant to the preparation and fair presentation of consolidated financial statements that are free from material misstatement, whether due to fraud or error.
Auditors' Responsibility
Our responsibility is to express an opinion on the consolidated financial statements based on our audit. We conducted our audit in accordance with auditing standards generally accepted in the United States of America. Those standards require that we plan and perform the audit to obtain reasonable assurance about whether the consolidated financial statements are free from material misstatement.
An audit involves performing procedures to obtain audit evidence about the amounts and disclosures in the consolidated financial statements. The procedures selected depend on our judgment, including the assessment of the risks of material misstatement of the consolidated financial statements, whether due to fraud or error. In making those risk assessments, we consider internal control relevant to the Company's preparation and fair presentation of the consolidated financial statements in order to design audit procedures that are appropriate in the circumstances, but not for the purpose of expressing an opinion on the effectiveness of the Company's internal control. Accordingly, we express no such opinion. An audit also includes evaluating the appropriateness of accounting policies used and the reasonableness of significant accounting estimates made by management, as well as evaluating the overall presentation of the consolidated financial statements. We believe that the audit evidence we have obtained is sufficient and appropriate to provide a basis for our audit opinion.
Opinion
In our opinion, the consolidated financial statements referred to above present fairly, in all material respects, the financial position of Cequel Corporation and its subsidiaries (Predecessor) as of December 31, 2014, and results of operations and cash flows for the period from January 1, 2015 to December 20, 2015 and for the year ended December 31, 2014 in accordance with accounting principles generally accepted in the United States of America.
| /s/PricewaterhouseCoopers LLP | ||
St. Louis, Missouri March 30, 2016 |
F-143
Report of Independent Auditors
To the Board of Directors of Cequel Corporation
We have audited the accompanying consolidated financial statements of Cequel Corporation and its subsidiaries (Successor), which comprise the consolidated balance sheet as of December 31, 2015, and the related consolidated statements of operations and comprehensive (loss)/income, of changes in stockholders' equity and of cash flows for the period from December 21, 2015 to December 31, 2015.
Management's Responsibility for the Consolidated Financial Statements
Management is responsible for the preparation and fair presentation of the consolidated financial statements in accordance with accounting principles generally accepted in the United States of America; this includes the design, implementation, and maintenance of internal control relevant to the preparation and fair presentation of consolidated financial statements that are free from material misstatement, whether due to fraud or error.
Auditors' Responsibility
Our responsibility is to express an opinion on the consolidated financial statements based on our audit. We conducted our audit in accordance with auditing standards generally accepted in the United States of America. Those standards require that we plan and perform the audit to obtain reasonable assurance about whether the consolidated financial statements are free from material misstatement.
An audit involves performing procedures to obtain audit evidence about the amounts and disclosures in the consolidated financial statements. The procedures selected depend on our judgment, including the assessment of the risks of material misstatement of the consolidated financial statements, whether due to fraud or error. In making those risk assessments, we consider internal control relevant to the Company's preparation and fair presentation of the consolidated financial statements in order to design audit procedures that are appropriate in the circumstances, but not for the purpose of expressing an opinion on the effectiveness of the Company's internal control. Accordingly, we express no such opinion. An audit also includes evaluating the appropriateness of accounting policies used and the reasonableness of significant accounting estimates made by management, as well as evaluating the overall presentation of the consolidated financial statements. We believe that the audit evidence we have obtained is sufficient and appropriate to provide a basis for our audit opinion.
Opinion
In our opinion, the consolidated financial statements referred to above present fairly, in all material respects, the financial position of Cequel Corporation and its subsidiaries (Successor) as of December 31, 2015, and the results of their operations and their cash flows for the period from December 21, 2015 to December 31, 2015 in accordance with accounting principles generally accepted in the United States of America.
| /s/PricewaterhouseCoopers LLP | ||
St. Louis, Missouri March 30, 2016 |
F-144
Cequel Corporation
Consolidated Balance Sheets
(in thousands)
| |
Successor December 31, 2015 |
|
Predecessor December 31, 2014 |
||||||
|---|---|---|---|---|---|---|---|---|---|
ASSETS |
|||||||||
Cash and cash equivalents |
$ | 86,065 | $ | 154,931 | |||||
Accounts receivable, net of allowances of $1,051 and $15,567, respectively |
192,667 | 190,063 | |||||||
Deferred tax asset |
20,866 | 14,021 | |||||||
Prepaid expenses and other assets |
23,549 | 26,078 | |||||||
| | | | | | | | | | |
Total current assets |
323,147 | 385,093 | |||||||
Property, plant and equipment |
2,234,274 | 2,744,328 | |||||||
Less—accumulated depreciation |
(10,162 | ) | (967,156 | ) | |||||
| | | | | | | | | | |
Property, plant and equipment, net |
2,224,112 | 1,777,172 | |||||||
Deferred financing costs, net |
39,876 | 25,681 | |||||||
Intangible assets: |
|||||||||
Subscriber relationships, net |
1,054,728 | 164,073 | |||||||
Franchise rights, net |
4,984,589 | 3,068,543 | |||||||
Trade Names |
37,109 | 188,676 | |||||||
Goodwill |
2,040,402 | 1,543,103 | |||||||
| | | | | | | | | | |
Total intangible assets, net |
8,116,828 | 4,964,395 | |||||||
Other long-term assets |
10,468 | 12,019 | |||||||
| | | | | | | | | | |
Total assets |
$ | 10,714,431 | $ | 7,164,360 | |||||
| | | | | | | | | | |
| | | | | | | | | | |
| | | | | | | | | | |
LIABILITIES AND STOCKHOLDERS' EQUITY |
|||||||||
Liabilities: |
|||||||||
Accounts payable and accrued expenses |
$ | 217,781 | $ | 231,697 | |||||
Due to affiliates |
296 | 3,523 | |||||||
Deferred revenue |
157,764 | 148,251 | |||||||
Accrued interest |
93,594 | 48,429 | |||||||
Current portion of capital leases and other obligations |
10,126 | 13,169 | |||||||
Current portion of long-term debt |
105,129 | 24,422 | |||||||
| | | | | | | | | | |
Total current liabilities |
584,690 | 469,491 | |||||||
Long-term deferred revenue |
623 | 1,381 | |||||||
Long-term deferred tax liability |
1,546,301 | 286,430 | |||||||
Long-term portion of capital leases and other obligations |
2,813 | 13,372 | |||||||
Due to parent |
291,277 | — | |||||||
Long-term debt |
6,054,063 | 5,067,588 | |||||||
Other long-term liabilities |
247 | 278 | |||||||
| | | | | | | | | | |
Total liabilities |
$ | 8,480,014 | $ | 5,838,540 | |||||
Commitments and contingencies (Note 12) |
|||||||||
Stockholders' equity: |
|||||||||
Stockholders' equity |
2,252,028 | 1,430,848 | |||||||
Accumulated deficit |
(17,611 | ) | (105,028 | ) | |||||
| | | | | | | | | | |
Total stockholders' equity |
2,234,417 | 1,325,820 | |||||||
| | | | | | | | | | |
Total liabilities and stockholders' equity |
$ | 10,714,431 | $ | 7,164,360 | |||||
| | | | | | | | | | |
| | | | | | | | | | |
| | | | | | | | | | |
The accompanying notes are an integral part of these consolidated financial statements.
F-145
Cequel Corporation
Consolidated Statements of Operations and Comprehensive (Loss)/Income
(in thousands)
| |
Successor Period from December 21, 2015 to December 31, 2015 |
|
Predecessor Period from January 1, 2015 to December 20, 2015 |
Predecessor Year Ended December 31, 2014 |
||||||||
|---|---|---|---|---|---|---|---|---|---|---|---|---|
Revenues |
$ | 72,943 | $ | 2,347,369 | $ | 2,330,697 | ||||||
Costs and expenses: |
||||||||||||
Operating (excluding depreciation and amortization) |
26,586 | 872,308 | 930,085 | |||||||||
Selling, general and administrative |
39,166 | 889,960 | 546,386 | |||||||||
Depreciation and amortization |
23,533 | 531,561 | 594,459 | |||||||||
Loss on disposal of cable assets |
41 | 1,796 | 4,277 | |||||||||
| | | | | | | | | | | | | |
Total costs and expenses |
89,326 | 2,295,625 | 2,075,207 | |||||||||
(Loss)/income from operations |
(16,383 |
) |
51,744 |
255,490 |
||||||||
Interest expense, net |
(11,491 | ) | (237,319 | ) | (230,146 | ) | ||||||
| | | | | | | | | | | | | |
(Loss)/income before income taxes |
(27,874 | ) | (185,575 | ) | 25,344 | |||||||
Benefit/(provision) for income taxes |
10,263 | (29,301 | ) | (8,095 | ) | |||||||
| | | | | | | | | | | | | |
Net (loss)/income |
$ | (17,611 | ) | $ | (214,876 | ) | $ | 17,249 | ||||
| | | | | | | | | | | | | |
| | | | | | | | | | | | | |
| | | | | | | | | | | | | |
Comprehensive (loss)/income |
$ | (17,611 | ) | $ | (214,876 | ) | $ | 17,249 | ||||
| | | | | | | | | | | | | |
| | | | | | | | | | | | | |
| | | | | | | | | | | | | |
The accompanying notes are an integral part of these consolidated financial statements.
F-146
Cequel Corporation
Consolidated Statements of Cash Flows
(in thousands)
| |
Successor Period from December 21, 2015 to December 31, 2015 |
|
Predecessor Period from January 1, 2015 to December 20, 2015 |
Predecessor Year Ended December 31, 2014 |
||||||||
|---|---|---|---|---|---|---|---|---|---|---|---|---|
Cash flows from operating activities: |
||||||||||||
Net (loss)/income |
$ | (17,611 | ) | $ | (214,876 | ) | $ | 17,249 | ||||
Adjustments to reconcile net income (loss) to cash flows from operating activities: |
||||||||||||
Loss on disposal of cable assets |
41 | 1,766 | 4,277 | |||||||||
Depreciation and amortization |
23,533 | 531,562 | 594,459 | |||||||||
Non-cash interest expense |
1,444 | (1,184 | ) | (2,813 | ) | |||||||
Non-cash equity compensation expense |
— | 287,691 | 30,681 | |||||||||
Deferred income tax (benefit)/provision |
(10,418 | ) | 24,866 | 2,677 | ||||||||
Changes in assets and liabilities: |
||||||||||||
Accounts receivable, net |
(13,291 | ) | 31,508 | (945 | ) | |||||||
Prepaid expenses |
965 | 3,115 | 6,884 | |||||||||
Accounts payable and accrued expenses |
(23,080 | ) | 20,845 | 31,287 | ||||||||
Deferred revenue |
11,584 | (2,829 | ) | 1,598 | ||||||||
Accrued interest |
9,855 | (20,660 | ) | 945 | ||||||||
| | | | | | | | | | | | | |
Net cash provided by (used in) operating activities |
(16,978 | ) | 661,804 | 686,299 | ||||||||
Cash flows from investing activities: |
||||||||||||
Purchases of property, plant and equipment (Note 7) |
(30,582 | ) | (447,864 | ) | (420,605 | ) | ||||||
Acquisition of cable systems |
— | — | (46,720 | ) | ||||||||
Net proceeds from disposal of assets |
25 | 2,137 | 1,713 | |||||||||
Purchase of patent rights |
— | (4,003 | ) | — | ||||||||
Other |
— | — | (21 | ) | ||||||||
| | | | | | | | | | | | | |
Net cash used in investing activities |
(30,557 | ) | (449,730 | ) | (465,633 | ) | ||||||
Cash flows from financing activities: |
||||||||||||
Issuance of long-term debt |
— | — | 486,250 | |||||||||
Repayments of long-term debt |
(3,941 | ) | (18,317 | ) | (140,375 | ) | ||||||
Repayments of capital lease obligations |
(30 | ) | (13,065 | ) | (9,756 | ) | ||||||
Equity contributions |
— | 32,187 | — | |||||||||
Equity distributions |
— | (218 | ) | (600,319 | ) | |||||||
Cash paid for financing costs |
— | — | (6,241 | ) | ||||||||
| | | | | | | | | | | | | |
Net cash provided by (used in) financing activities |
(3,971 | ) | 587 | (270,441 | ) | |||||||
(Decrease)/Increase in cash and cash equivalents |
(51,506 | ) | 212,661 | (49,775 | ) | |||||||
Cash and cash equivalents, beginning of period |
137,571 | 154,931 | 204,706 | |||||||||
| | | | | | | | | | | | | |
Cash and cash equivalents, end of period |
$ | 86,065 | $ | 367,592 | $ | 154,931 | ||||||
| | | | | | | | | | | | | |
| | | | | | | | | | | | | |
| | | | | | | | | | | | | |
Supplemental cash flow disclosures: |
||||||||||||
Cash paid for interest |
$ | 884 | $ | 259,417 | $ | 232,248 | ||||||
| | | | | | | | | | | | | |
Cash paid for taxes |
$ | — | $ | 6,137 | $ | 5,851 | ||||||
| | | | | | | | | | | | | |
| | | | | | | | | | | | | |
| | | | | | | | | | | | | |
Non-cash transactions: |
||||||||||||
Other obligations (Note 9) |
$ | — | $ | — | $ | 14,876 | ||||||
| | | | | | | | | | | | | |
| | | | | | | | | | | | | |
| | | | | | | | | | | | | |
The accompanying notes are an integral part of these consolidated financial statements.
F-147
Cequel Corporation
Consolidated Statements of Changes in Stockholders' Equity
(in thousands)
| |
Stockholders' Equity |
Accumulated Deficit |
Total Stockholders' Equity |
|||||||
|---|---|---|---|---|---|---|---|---|---|---|
PREDECESSOR: |
||||||||||
Balance, December 31, 2014 |
$ | 1,430,848 | $ | (105,028 | ) | $ | 1,325,820 | |||
Net loss |
— | (214,876 | ) | (214,876 | ) | |||||
Non-cash equity compensation |
287,691 | — | 287,691 | |||||||
Equity contribution |
32,187 | — | 32,187 | |||||||
Equity distribution |
(218 | ) | — | (218 | ) | |||||
| | | | | | | | | | | |
Balance, December 20, 2015 |
$ | 1,750,508 | $ | (319,904 | ) | $ | 1,430,604 | |||
| | | | | | | | | | | |
SUCCESSOR: |
||||||||||
Balance, December 21, 2015 |
$ | 2,252,028 | $ | — | $ | 2,252,028 | ||||
Net loss |
— | (17,611 | ) | (17,611 | ) | |||||
| | | | | | | | | | | |
Balance, December 31, 2015 |
$ | 2,252,028 | $ | (17,611 | ) | $ | 2,234,417 | |||
| | | | | | | | | | | |
| | | | | | | | | | | |
| | | | | | | | | | | |
The accompanying notes are an integral part of these consolidated financial statements.
F-148
Cequel Corporation
Notes to Consolidated Financial Statements
December 31, 2015 and 2014
(dollars in thousands, except where otherwise indicated)
1. Organization
Cequel Corporation, a Delaware Corporation ("Cequel Corporation"), through its subsidiaries (together, the "Company") is a leading owner, operator and acquirer of broadband communication systems serving a diversified mix of markets. Cequel Communications Holdings I, LLC ("Cequel") is a wholly owned subsidiary of Cequel Communications Holdings, LLC, a Delaware limited liability company ("Cequel Holdings"), which is a wholly owned subsidiary of Cequel Corporation. Cequel Capital Corporation is a wholly owned subsidiary of Cequel (and together with Cequel, the "Issuers"). Cequel Communications, LLC, a Delaware limited liability company, doing business as Suddenlink Communications ("Suddenlink"), is an indirect wholly owned subsidiary of Cequel.
The Issuers are holding companies and conduct no operations. Accordingly, the Issuers depend on the cash flow of their subsidiaries in order to make payments on, or repay or refinance, the Notes, as defined herein. The terms of the Credit Agreement generally restrict Suddenlink and its restricted subsidiaries from making dividends and other distributions to the Issuers subject to satisfaction of certain conditions, including pro forma compliance with maximum senior secured leverage ratio, and that no event of default has occurred and is continuing, or would be caused by the making of such dividends or other distributions, and based on, among other things, availability under a restricted payment basket. However, the Credit Agreement permits Suddenlink to make dividends and distributions to Cequel for payment of regularly scheduled interest payments through maturity on indebtedness which was incurred by Cequel to refinance the Issuers' 8.625% Senior Notes due 2017 (the "2017 Notes"). The Issuers' 6.375% Senior Notes due 2020 (the "2020 Notes"), the Issuers' 5.125% Senior Notes due 2021, issued on May 16, 2013 (the "Initial 2021 Notes") and the Issuers' 5.125% Senior Notes due 2021, issued on September 9, 2014 (the "2021 Mirror Notes,") and the 2025 Senior Notes, as defined herein (collectively the 2020 Notes, the 2021 Notes and the 2025 Senior Notes, the "Senior Notes"), are unsecured and are not guaranteed by any subsidiaries of the Issuers, including Suddenlink.
On December 21, 2015, Altice N.V., a public company with limited liability (naamloze vennootshcap) under Dutch law ("Altice"), as successor in interest to Altice S.A., certain other direct or indirect wholly-owned subsidiaries of Altice (the "Purchasers"), acquired approximately 70% of the total outstanding equity interests in Cequel Corporation (the "Altice Acquisition") from the direct and indirect stockholders of Cequel Corporation (the "Sellers"). Prior to the date hereof, Cequel Corporation was directly or indirectly owned by investment funds advised by BC Partners Limited ("BCP"), CPPIB-Suddenlink LP, a wholly owned subsidiary of Canada Pension Plan Investment Board ("CPPIB" and together with BCP, the "Sponsors"), and IW4MK Carry Partnership LP (the "Management Holder" and together with the Sponsors, the "Stockholders"). The consideration for the acquired equity interests was based on a total equity valuation for 100% of the capital and voting rights of Cequel Corporation of $4,132.0 million, which includes $2,956.4 million of cash consideration, $675.6 million of retained equity held by the Sponsors and $500 million funded by the issuance by an affiliate of Altice of a senior vendor note that is subscribed by the Sponsors. Following the closing of the Altice Acquisition, the Sponsors retained equity interests in Cequel Corporation representing, in the aggregate, 30% of Cequel Corporation's outstanding capital stock on a post-closing basis. In addition, the carry interest plans of the Stockholders were cashed out based on an agreement between
F-149
Cequel Corporation
Notes to Consolidated Financial Statements (Continued)
December 31, 2015 and 2014
(dollars in thousands, except where otherwise indicated)
1. Organization (Continued)
the Sponsors and the Management Holder whereby payments were made to participants in such carry interest plans, including certain officers and directors of Cequel and Cequel Corporation.
2. Liquidity and Capital Resources
The Company has significant indebtedness and incurred net losses of $17.6 million and $214.9 million for the successor period from December 21, 2015 through December 31, 2015 and the predecessor period from January 1, 2015 through December 20, 2015, respectively, and generated net income of $17.2 million for the predecessor year ended December 31, 2014. The Company's net cash flows used in operating activities were $17.0 million for the successor period from December 21, 2015 through December 31, 2015, and net cash flows provided by operating activities were $661.8 million and $686.3 million for the predecessor period from January 1, 2015 through December 20, 2015 and the predecessor year ended December 31, 2014, respectively.
The Company requires significant cash to fund debt service requirements, capital expenditures and ongoing operations. The Company also has negative working capital, which is primarily due to the payment terms it has with its vendors. The Company has historically funded these requirements through cash flows from operating activities, borrowings under its $2.7 billion credit facility (the "Credit Facility"), sales of assets, issuances of debt, and cash on hand. However, the mix of funding sources changes from period to period. For the combined year ended December 31, 2015, the Company generated $627.5 million of cash flows from operating activities after paying cash interest of $260.3 million. In addition, the Company used $478.4 million for purchases of property, plant and equipment. For the year ended December 31, 2014, the Company generated $686.3 million of cash flows from operating activities after paying cash interest of $232.2 million. In addition, the Company used $420.6 million for purchases of property, plant and equipment in the year ended December 31, 2014.
The Company expects that cash on hand, cash flows from operating activities and available credit under its revolving credit facility will be adequate to meet its cash flow needs in 2016.
3. Summary of Significant Accounting Policies
Basis of Preparation of Consolidated Financial Statements
The consolidated financial statements have been prepared in accordance with generally accepted accounting principles in the United States of America ("GAAP"). The preparation of financial statements in conformity with GAAP requires management to make estimates and assumptions that affect the amounts reported in the consolidated financial statements and accompanying notes. All significant intercompany accounts and transactions have been eliminated in consolidation. However, in the opinion of management, such financial statements include all adjustments, which consist of only normal recurring adjustments, necessary for the fair statement of the results of the periods presented. Certain estimates and assumption have been made that affect the amounts reported in the consolidated financial statements and accompanying notes. Actual results could differ from those estimates.
F-150
Cequel Corporation
Notes to Consolidated Financial Statements (Continued)
December 31, 2015 and 2014
(dollars in thousands, except where otherwise indicated)
3. Summary of Significant Accounting Policies (Continued)
The financial information set forth in this report, unless otherwise set forth or as the context otherwise indicates, includes the accounts of Cequel and its subsidiaries for the period from December 21, 2015 to December 31, 2015 ("Successor"), and of Cequel and its subsidiaries for the period from January 1, 2015 through December 20, 2015 ("Predecessor"). Effective December 21, 2015, the Company applied business combination accounting which requires certain assets and liabilities to be reflected at fair value. For a summary of the application and valuation of business combination accounting, see Footnote 4.
Revenue Recognition
Revenue by service offering consisted of the following:
| |
Successor Period from December 21, 2015 to December 31, 2015 |
|
Predecessor Period from January 1, 2015 to December 20, 2015 |
Predecessor Year Ended December 31, 2014 |
||||||||
|---|---|---|---|---|---|---|---|---|---|---|---|---|
Video |
$ | 33,690 | $ | 1,107,718 | $ | 1,163,892 | ||||||
High-speed Internet |
27,789 | 845,514 | 748,842 | |||||||||
Telephone |
6,209 | 201,377 | 204,693 | |||||||||
Advertising sales |
2,079 | 85,587 | 101,197 | |||||||||
Other |
3,176 | 107,173 | 112,073 | |||||||||
| | | | | | | | | | | | | |
Total revenues |
$ | 72,943 | $ | 2,347,369 | $ | 2,330,697 | ||||||
| | | | | | | | | | | | | |
| | | | | | | | | | | | | |
| | | | | | | | | | | | | |
Video revenue includes subscriber fees received from residential and commercial customers for the Company's various tiers or packages of video programming services, related equipment and rental charges, fees collected on behalf of local franchising authorities and the Federal Communications Commission, as well as revenue from the sale of premium networks, transactional VOD (e.g., events and movies) and digital video recorder service. High-speed Internet revenue includes subscriber fees received from residential and commercial customers for the Company's high-speed Internet services and related equipment rental charges, and wholesale transport revenue, including amounts generated by the sale of point-to-point transport services offered to wireless telephone providers (i.e. cell tower backhaul) and other carriers. Telephone revenue includes subscriber fees received from residential and commercial customers for the Company's telephone services, as well as fees collected on behalf of governmental authorities. Advertising sales includes revenue generated from the sale of advertising time to national, regional and local customers. Other revenue includes revenue from the Company's security services, installation charges, revenue from tower services, including site development and construction, and other residential and commercial subscriber-related fees.
Revenue from video, high-speed Internet, telephone and security services are recognized in the period during which the related services are provided. Revenue received from customers who purchase bundled services at a discounted rate is allocated to each product in a pro-rata manner based on the individual product's selling price (generally, the price at which the product is regularly sold on a standalone basis). Installation revenue is recognized in the period the service is performed to the extent
F-151
Cequel Corporation
Notes to Consolidated Financial Statements (Continued)
December 31, 2015 and 2014
(dollars in thousands, except where otherwise indicated)
3. Summary of Significant Accounting Policies (Continued)
of direct selling costs, with the remaining amount deferred over the life of the customer relationship. The Company generally bills customers in advance for the services they have chosen to use and record such amounts as deferred revenue until the services are provided. Customer services paid for in advance are recorded as income when earned. Advertising sales are recognized in the period that the advertisements are broadcast.
Local or state government authorities impose franchise fees on the majority of the Company's systems ranging up to a federally mandated maximum of 5% of gross revenues as defined in the franchise agreements. Such fees are collected on a monthly basis from the Company's customers and are periodically remitted to franchise authorities. Because franchise fees are the Company's obligation, the Company presents them on a gross basis in revenue with a corresponding operating expense. Franchise fees reported on a gross basis in revenue amounted to approximately $1.4 million, $46.3 million and $47.8 million for the successor period from December 21, 2015 through December 31, 2015, the predecessor period from January 1, 2015 through December 20, 2015, and the predecessor year ended December 31, 2014, respectively.
Allowance for Doubtful Accounts
The allowance for doubtful accounts represents the Company's best estimate of uncollectible balances in the accounts receivable balance. The allowance is based on the number of days outstanding, customer balances, historical experience and other currently available information.
Concentrations of Credit Risk
Financial instruments that potentially subject the Company to concentrations of credit risk are primarily cash and accounts receivable. Concentration of credit risk with respect to the Company's cash balance is limited. The Company maintains or invests its cash with highly qualified financial institutions. With respect to the Company's receivables, credit risk is limited due to the large number of customers, individually small balances and short payment terms.
Programming Costs
The Company purchases certain analog, digital and premium programming provided by program suppliers whose compensation is typically based on a flat fee per customer at the negotiated rates included in the programming contracts. The cost of the right to provide network programming under such arrangements is recorded in operating expenses in the month the programming is distributed. Programming costs are paid each month based on calculations performed by the Company and are subject to adjustment based on periodic audits performed by the programmers. Net programming costs included in the operating costs line item in the accompanying consolidated statements of operations was $17.9 million, $594.2 million and $617.4 million for the successor period from December 21, 2015 through December 31, 2015, the predecessor period from January 1, 2015 through December 20, 2015, and the predecessor year ended December 31, 2014, respectively.
F-152
Cequel Corporation
Notes to Consolidated Financial Statements (Continued)
December 31, 2015 and 2014
(dollars in thousands, except where otherwise indicated)
3. Summary of Significant Accounting Policies (Continued)
Advertising Costs
The Company expenses advertising costs as incurred. Advertising expense, included in the selling, general and administrative expense line item in the accompanying consolidated statements of operations, was approximately $1.9 million, $62.7 million and $58.7 million for the successor period from December 21, 2015 through December 31, 2015, the predecessor period from January 1, 2015 through December 20, 2015, and the predecessor year ended December 31, 2014, respectively.
Equity Based Compensation
Prior to the Altice Acquisition, the general partners of the partnerships that held the shares of Cequel Corporation (collectively, the "Carry Interest Partnerships"), each adopted a separate carried interest plan (see Footnote 19). The Company measured the cost of employee services received in exchange for carried interest units based on the fair value of the award at each reporting period. The Company used the Monte Carlo Simulation Method to estimate the fair value of the awards. Because the Monte Carlo Simulation Method required the use of subjective assumptions, changes in these assumptions can materially affect the fair value of the carried interest units granted. The time to liquidity event assumption is based on management's judgment. The equity volatility assumption was estimated using the historical weekly volatility of publicly traded comparable companies. The risk-free rate assumed in valuing the units was based on the U.S. Constant Maturity Treasury Rates for a period matching the expected time to liquidity event. The Company's total equity value was estimated by a third party using a range of indicated business enterprise values. The plan was terminated on December 21, 2015, concurrent with the Altice Acquisition.
Income Taxes
The Company provides for estimated income taxes for amounts payable or refundable on current year income tax returns, as well as the estimated future tax effects attributable to temporary differences and carryforwards using existing guidance from the FASB. This guidance also requires that a valuation allowance be recorded against deferred tax assets when it is more likely than not that all or some portion of the deferred income tax asset will not be realized in the future. Significant management judgment is required in determining the provision for income taxes, deferred tax assets and liabilities and any valuation allowances recorded (See Footnote 16).
On September 15, 2014, the Company filed its U.S. Corporation Income Tax Return for the calendar year 2013 reflecting an adjustment to a previously filed position which effectively eliminated the Company's uncertain tax position. The elimination of the uncertain tax position resulted in a corresponding adjustment to the Company's net deferred tax liabilities and deferred tax assets which resulted in a net benefit to income taxes of $13.0 million for the period.
Cash and Cash Equivalents
For financial reporting purposes, the Company considers all highly liquid investments with original maturities at purchase of three months or less to be cash equivalents. These investments are carried at cost, which approximates market value.
F-153
Cequel Corporation
Notes to Consolidated Financial Statements (Continued)
December 31, 2015 and 2014
(dollars in thousands, except where otherwise indicated)
3. Summary of Significant Accounting Policies (Continued)
Property, Plant and Equipment
Property, plant and equipment are recorded at cost, including all material, labor and certain indirect costs associated with the construction of cable transmission and distribution facilities (or fair value at date of Acquisition). While the Company's capitalization is based on specific activities, once capitalized, costs are tracked by fixed asset category at the cable system level and not on a specific asset basis. For assets that are sold or retired, the estimated historical cost and related accumulated depreciation is removed. Costs associated with initial customer installations and the additions of network equipment necessary to enable advanced services are capitalized. Costs capitalized as part of initial customer installations include materials, labor and certain indirect costs. Indirect costs are associated with the activities of the Company's personnel who assist in connecting and activating the new service. Indirect costs include employee benefits and payroll taxes, direct variable costs associated with capitalizable activities, consisting of installation and construction vehicle costs, the cost of dispatch personnel and indirect costs directly attributable to capitalizable activities. Leasehold improvements are amortized over the shorter of their estimated life or the term of the related leases. Costs for repairs and maintenance are charged to operating expense as incurred, while plant and equipment replacements, including replacement of cable drops, are capitalized.
Depreciation is computed using the straight-line method over the following estimated useful lives of the assets:
Buildings and improvements |
3 - 20 years | |
Customer equipment and installations |
4 - 7 years | |
Capitalized leases |
3 - 15 years | |
Vehicles |
3 - 5 years | |
Broadband distribution systems |
4 - 25 years | |
Office furniture, tools and equipment |
2 - 7 years |
Capitalized Internal Costs
Costs capitalized as part of new customer installations include materials, subcontractor costs and internal direct labor costs, including service technicians and internal overhead costs incurred to connect the customer to the plant from the time of installation scheduling through the time service is activated and functioning. The internal direct labor cost capitalized is based on a combination of the actual and estimated time to complete the installation. Overhead capitalized consists mainly of employee benefits, such as payroll taxes and health insurance, directly associated with that portion of the capitalized labor and vehicle operating costs related to capitalizable activities. Capitalized internal payroll costs were approximately $1.2 million, $49.2 million and $46.2 million for the successor period from December 21, 2015 through December 31, 2015, the predecessor period from January 1, 2015 through December 20, 2015, and the predecessor years ended December 31, 2014, respectively. Related capitalized overhead were approximately $0.7 million, $28.7 million and $29.0 million for the successor period from December 21, 2015 through December 31, 2015, the predecessor period from January 1, 2015 through December 20, 2015, and the predecessor years ended December 31, 2014, respectively.
F-154
Cequel Corporation
Notes to Consolidated Financial Statements (Continued)
December 31, 2015 and 2014
(dollars in thousands, except where otherwise indicated)
3. Summary of Significant Accounting Policies (Continued)
Deferred Financing Costs
Deferred financing costs are being amortized to interest expense using the effective interest method over the terms of the related debt.
Franchises
Franchise rights are periodically reviewed to determine if each franchise has a finite life or an indefinite life in accordance with goodwill and other intangible asset financial accounting standards. Accordingly, the Company believes its franchises qualify for indefinite life treatment and are not amortized against earnings but instead are tested for impairment annually or more frequently as warranted by events or changes in circumstances (see Footnote 13). Costs incurred in negotiating and renewing broadband franchises are amortized on a straight-line basis over the life of the renewal period.
Accounting for Long-Lived and Intangible Assets
Long-lived Assets
Long-lived assets (e.g., property, plant and equipment) do not require that an annual impairment test be performed; instead, long-lived assets are tested for impairment upon the occurrence of a triggering event. Triggering events include the more likely than not disposal of a portion of such assets or the occurrence of an adverse change in the market involving the business employing the related assets. Once a triggering event has occurred, the impairment test is based on whether the intent is to hold the asset for continued use or to hold the asset for sale. If the intent is to hold the asset for continued use, the impairment test first requires a comparison of estimated undiscounted future cash flows generated by the asset group against the carrying value of the asset group. If the carrying value of the asset group exceeds the estimated undiscounted future cash flows, the asset would be deemed to be impaired. The impairment charge would then be measured as the difference between the estimated fair value of the asset and its carrying value. Fair value is generally determined by discounting the future cash flows associated with that asset. If the intent is to hold the asset for sale and certain other criteria are met (e.g., the asset can be disposed of currently, appropriate levels of authority have approved the sale, and there is an active program to locate a buyer), the impairment test involves comparing the asset's carrying value to its estimated fair value. To the extent the carrying value is greater than the asset's estimated fair value, an impairment charge is recognized for the difference. Significant judgments in this area involve determining whether a triggering event has occurred, determining the future cash flows for the assets involved and selecting the appropriate discount rate to be applied in determining estimated fair value. For the years ended December 31, 2015 and 2014, no triggering events have occurred and no impairment tests were performed.
Goodwill and Indefinite-lived Intangible Assets
Goodwill is tested annually for impairment during the fourth quarter or earlier upon occurrence of a triggering event. Accounting guidance related to goodwill impairment testing provides an option to first assess qualitative factors to determine whether it is more likely than not that the fair value of a
F-155
Cequel Corporation
Notes to Consolidated Financial Statements (Continued)
December 31, 2015 and 2014
(dollars in thousands, except where otherwise indicated)
3. Summary of Significant Accounting Policies (Continued)
reporting unit is less than its carrying amount. If the Company performs a qualitative assessment, various events and circumstances are considered when evaluating whether it is more likely than not that the fair value of a reporting unit is less than its carrying amount and whether the first step of the goodwill impairment test is necessary. If, after this qualitative assessment, the Company determines that it is not more likely than not that the fair value of a reporting unit is less than its carrying amount, then no further quantitative testing would be necessary.
If determined necessary as a result of the qualitative assessment described above, or if we do not perform the qualitative assessment as allowed under authoritative guidance from the FASB, goodwill impairment is determined using a two-step process. The first step involves a comparison of the estimated fair value of the Company to its carrying amount, including goodwill. In performing the first step, the Company determines the fair value using a discounted cash flow ("DCF") analysis corroborated by a market-based approach. Determining fair value requires the exercise of significant judgment, including judgment about appropriate discount rates, perpetual growth rates, the amount and timing of expected future cash flows, as well as relevant comparable company earnings multiples for the market-based approach. The cash flows employed in the DCF analyses are based on the Company's most recent budget and, for years beyond the budget, the Company's estimates, which are based on assumed growth rates. The discount rates used in the DCF analyses are intended to reflect the risks inherent in the future cash flows of the Company. If the estimated fair value of the Company exceeds its carrying amount, goodwill of the reporting unit is not impaired and the second step of the impairment test is not necessary. If the carrying amount of the Company exceeds its estimated fair value, then the second step of the goodwill impairment test must be performed. The second step of the goodwill impairment test compares the implied fair value of the goodwill with the goodwill carrying amount to measure the amount of impairment, if any. The implied fair value of goodwill is determined in the same manner as the amount of goodwill recognized in a business combination. In other words, the estimated fair value of the Company is allocated to all of the assets and liabilities of the Company (including any unrecognized intangible assets) as if the Company had been acquired in a business combination and the fair value of the Company was the purchase price paid. If the carrying amount of the Company's goodwill exceeds the implied fair value of that goodwill, an impairment charge is recognized in an amount equal to that excess.
Other intangible assets not subject to amortization, primarily cable franchise rights, are tested annually for impairment during the fourth quarter or earlier upon the occurrence of a triggering event. The impairment test for other intangible assets not subject to amortization involves a comparison of the estimated fair value of the intangible asset with its carrying value. If the carrying value of the asset group exceeds the estimated undiscounted cash flows, the asset would be deemed to be impaired. The impairment charge would then be measured as the difference between the estimated fair value of the asset and its carrying value. The estimates of fair value of intangible assets not subject to amortization are determined using Greenfield Discounted Cash Flow Method ("Greenfield Method"), which entails identifying the projected discrete cash flows related to such cable franchise rights and discounting them back to the valuation date. Significant judgments inherent in this analysis include the selection of appropriate discount rates, estimating the amount and timing of estimated future cash flows attributable to cable franchise rights and identification of appropriate terminal growth rate assumptions.
F-156
Cequel Corporation
Notes to Consolidated Financial Statements (Continued)
December 31, 2015 and 2014
(dollars in thousands, except where otherwise indicated)
3. Summary of Significant Accounting Policies (Continued)
The discount rates used in the Greenfield Method are intended to reflect the risk inherent in the projected future cash flows generated by the respective intangible assets.
For the Company's impairment analyses completed in the fourth quarters of 2015 and 2014 the Company did not perform a qualitative assessment for any of its six reporting units and instead began with the first step of the goodwill impairment analysis. The Company's impairment analyses for 2015 and 2014 indicated no impairment of its goodwill and other intangible assets not subject to amortization.
Asset Retirement Obligations
Accounting for asset retirement obligations requires that a liability be recognized for an asset retirement obligation in the period in which it is incurred if a reasonable estimate of fair value can be made. If a lease or franchise agreement is not renewed, certain of the Company's franchise agreements and leases contain provisions requiring the Company to remove equipment or restore facilities. The Company expects to continually renew its franchise agreements and has concluded that the related franchise right is an indefinite lived intangible asset. The Company could be required to incur substantial restoration or removal costs related to these franchise agreements in the unlikely event a franchise agreement containing such a provision were no longer expected to be renewed. The Company would record an estimated liability at the time that it became probable that a franchise agreement would not be renewed. The obligations related to the removal provisions contained in the Company's lease agreements or any disposal obligations related to the Company's operating assets are not material to the Company's consolidated financial condition or results of operation or are not estimable.
Fair Value of Financial Instruments
The carrying amounts of certain of the Company's financial instruments, including cash and cash equivalents, accounts receivable, accounts payable and other accrued liabilities, approximate fair value because of their short maturities (see Footnote 11).
Derivative Financial Instruments
Accounting for derivative financial instruments requires that all derivative instruments be recognized on the balance sheet at fair value. The Company's policy is to manage interest costs using a mix of fixed and variable rate debt. The Company does not hold or issue derivative instruments for trading or speculative purposes.
Recently Issued Accounting Pronouncements
In May 2014, the FASB issued Accounting Standards Update No. 2014-09, Revenue from Contracts with Customers ("ASU 2014-09"), which supersedes the revenue recognition requirements in ASC 605, Revenue Recognition. The new guidance stipulates that an entity should recognize revenue to depict the transfer of promised goods or services to customers in an amount that reflects the consideration to which the entity expects to be entitled in exchange for those goods or services. ASU 2014-09 is effective for annual reporting periods (including interim reporting periods within those
F-157
Cequel Corporation
Notes to Consolidated Financial Statements (Continued)
December 31, 2015 and 2014
(dollars in thousands, except where otherwise indicated)
3. Summary of Significant Accounting Policies (Continued)
periods) beginning after December 15, 2016. Early application is not permitted, and the standard permits the use of either the retrospective or cumulative effect transition method. The Company is evaluating the effect that ASU 2014-09 will have on its consolidated financial statements and related disclosures. In August 2015, the FASB issued Accounting Standards update No. 2015-14, Deferral of Effective Date, which deferred the effective date of ASU 2014-09 by one year to December 15, 2017 for interim and annual reporting periods beginning after that date. The FASB permitted early adoption of the standard, but not before the original effective date of December 15, 2016. The Company has not yet selected a transition method nor has it determined the effect of these standards on its ongoing operations or financial reporting.
In August 2014, the FASB issued Accounting Standards Update No. 2014-15, Disclosures of Uncertainties about an Entity's Ability to Continue as a Going Concern ("ASU 2014-15"), which requires management to evaluate whether there are conditions or events that raise substantial doubt about the entity's ability to continue as a going concern, and to provide certain disclosures when it is probable that the entity will be unable to meet its obligations as they become due within one year after the date that the financial statements are issued. ASU 2014-15 is effective for the annual period ended December 31, 2016 and for annual periods and interim periods thereafter, with early adoption permitted. The adoption of ASU 2014-15 is not expected to materially impact the Company's consolidated financial statements.
In April 2015, the FASB issued Accounting Standards Update No. 2015-03, Simplifying the Presentation of Debt Issuance Costs ("ASU 2015-03"). The new guidance stipulates that an entity should present debt issuance costs in the balance sheet as a direct deduction from the related debt liability rather than as an asset, and amortization of the costs should be reported as interest expense. ASU 2015-03 is effective for annual reporting periods (including interim reporting periods within those periods) beginning after December 15, 2015. Early application is permitted, and entities would apply the new guidance retrospectively to all prior periods. In August 2015, the FASB issued Accounting Standards Update No. 2015-15, Presentation and Subsequent Measurement of Debt Issuance Costs Associated with line-of-Credit Arrangements ("ASU 2015-15"), which provides additional guidance to ASU 2015-03 to address the presentation or subsequent measurement of debt issuance costs related to line-of-credit arrangements. ASU 2015-15 noted that the SEC staff would not object to an entity deferring and presenting debt issuance costs as an asset and subsequently amortizing the deferred debt issuance costs ratably over the term of the line-of-credit arrangement, regardless of whether there are any outstanding borrowings on the arrangement. The adoption of ASU 2015-03 and ASU 2015-15 is not expected to have a material impact on the Company's consolidated financial statements and related disclosures.
In September 2015, the FASB issued Accounting Standards Update No. 2015-16, Simplifying the Accounting for Measurement-Period Adjustments ("ASU 2015-16"), which requires that an acquirer recognize adjustments to provisional amounts that are identified during the measurement period in the reporting period in which the adjustment amounts are determined. Prior to the issuance of the standard, entities were required to retrospectively apply adjustments made to provisional amount recognized in a business combination. ASU 2015-16 is effective for fiscal years, and interim periods
F-158
Cequel Corporation
Notes to Consolidated Financial Statements (Continued)
December 31, 2015 and 2014
(dollars in thousands, except where otherwise indicated)
3. Summary of Significant Accounting Policies (Continued)
within those years, beginning after December 15, 2015, and early adoption is permitted. The adoption of ASU 2015-16 is not expected to materially impact the Company's consolidated financial statements.
In November 2015, the FASB issued Accounting Standards Update No. 2015-17, Balance Sheet Classification of Deferred Taxes ("ASU 2015-17"), which requires that all deferred tax assets and liabilities, along with any related valuation allowance, be classified as noncurrent on the balance sheet. ASU 2015-17 is effective for fiscal years, and interim periods within those years, beginning after December 15, 2016, and early adoption is permitted. The adoption of ASU 2015-17 is not expected to materially impact the Company's consolidated financial statements.
4. Altice Acquisition
On December 21, 2015, Altice N.V., a public company with limited liability (naamloze vennootshcap) under Dutch law ("Altice"), as successor in interest to Altice S.A., certain other direct or indirect wholly-owned subsidiaries of Altice (the "Purchasers"), acquired approximately 70% of the total outstanding equity interests in Cequel Corporation (the "Altice Acquisition") from the direct and indirect stockholders of Cequel Corporation (the "Sellers"). Prior to the date hereof, Cequel Corporation was directly or indirectly owned by investment funds advised by BC Partners Limited ("BCP"), CPPIB-Suddenlink LP, a wholly owned subsidiary of Canada Pension Plan Investment Board ("CPPIB" and together with BCP, the "Sponsors"), and IW4MK Carry Partnership LP (the "Management Holder" and together with the Sponsors, the "Stockholders"). The consideration for the acquired equity interests was based on a total equity valuation for 100% of the capital and voting rights of Cequel Corporation of $4,132.0 million, which includes $2,956.4 million of cash consideration, $675.6 million of retained equity held by the Sponsors and $500 million funded by the issuance by an affiliate of Altice of a senior vendor note that is subscribed by the Sponsors. Following the closing of the Altice Acquisition, the Sponsors retained equity interests in Cequel Corporation representing, in the aggregate, 30% of Cequel Corporation's outstanding capital stock on a post-closing basis. In addition, the carry interest plans of the Stockholders were cashed out based on an agreement between the Sponsors and the Management Holder whereby payments were made to participants in such carry interest plans, including certain officers and directors of Cequel and Cequel Corporation.
In connection with the Altice Acquisition, on June 12, 2015, affiliates of Altice issued (i) $320 million principal amount of senior holdco notes due 2025 (the "Holdco Notes"), (ii) $300 million principal amount of senior notes due 2025 (the "2025 Senior Notes") and (iii) $1.1 billion principal amount of senior secured notes due 2023 (the "Senior Secured Notes"), the proceeds from which were placed in escrow, to finance a portion of the purchase price for the Altice Acquisition. The Holdco Notes were issued by Altice US Finance S.A. (the "Holdco Notes Issuer"), an indirect subsidiary of Altice, bear interest at a rate of 7.75% per annum and were issued at a price of 98.275%. The 2025 Senior Notes were issued by Altice US Finance II Corporation (the "Senior Notes Issuer"), an indirect subsidiary of Altice, bear interest at a rate of 7.75% per annum and were issued at a price of 100.00%. The Senior Secured Notes were issued by Altice US Finance I Corporation (the "Senior Secured Notes Issuer"), an indirect subsidiary of Altice, bear interest at a rate of 5.375% per annum and were issued at a price of 100.00%. Interest on the Holdco Notes, the 2025 Senior Notes and the Senior Secured Notes is payable semi-annually on January 15 and July 15. The Holdco Notes
F-159
Cequel Corporation
Notes to Consolidated Financial Statements (Continued)
December 31, 2015 and 2014
(dollars in thousands, except where otherwise indicated)
4. Altice Acquisition (Continued)
will automatically exchange into an equal aggregate principal amount of 2025 Senior Notes once the 2025 Senior Notes Issuer builds sufficient restricted payment capacity and the ability to incur additional indebtedness in excess of the aggregate amount of the Holdco Notes. Following the consummation of the Altice Acquisition and related transactions, (i) the indirect parent of the Holdco Notes Issuer owned 70% of Cequel Corporation, (ii) the 2025 Senior Notes Issuer merged into Cequel, the Senior Notes became the obligations of Cequel and Cequel Capital Corporation became the co-issuer of the 2025 Senior Notes, and (iii) the equity interests in the Senior Secured Notes Issuer were contributed through one or more intermediary steps to Suddenlink, and the Senior Secured Notes were guaranteed by Cequel Communications Holdings II LLC, Suddenlink and certain of the subsidiaries of Suddenlink and are secured by certain assets of Cequel Communications Holdings II LLC, Suddenlink and its subsidiaries.
In connection with the Altice Acquisition, we received consent from holders of the 2020 Notes to, among other things, waive any obligation that the Issuers may have under the 2020 Indenture to repurchase the 2020 Notes as a result of the consummation of the Altice Acquisition and make certain related changes to the 2020 Indenture (the "Indenture Amendments"), and the Issuers entered into a first supplemental indenture to the 2020 Indenture with U.S. Bank National Association, as trustee (the "First Supplemental Indenture"), containing the Indenture Amendments. In exchange for this consent, we paid holders who consented to these amendments an aggregate fee of approximately $26.3 million at the closing of the Altice Acquisition, at which time the Indenture Amendments become effective.
In connection with the Altice Acquisition, we received consent from lenders under the credit and guaranty agreement, dated February 14, 2012, entered into by Cequel Communications, LLC, Cequel Communications Holdings II, LLC, certain subsidiaries of Cequel Communications, LLC and a syndicate of lenders, as amended, which provides for up to $2.7 billion of loans in the aggregate, consisting of a $2.2 billion term loan facility and a $500.0 million revolving credit facility (collectively, the "Existing Credit Facility"), to amend the definition of change of control and certain other related definitions therein so that the consummation of the Altice Acquisition did not constitute a change of control and corresponding event of default thereunder (the "Existing Credit Facility Amendments"), and we entered into a Second Amendment and Consent to the Existing Credit Facility (the "Second Amendment and Consent") with the lenders thereunder, containing, among other things, the Existing Credit Facility Amendments. In exchange for this consent, we paid lenders who consented to these amendments an aggregate fee of approximately $6.8 million.
In addition, lenders holding (a) $290.0 million of loans and commitments under the existing revolving credit facility under the Existing Credit Facility and (b) approximately $815.4 million of loans under the existing term loan facility under the Existing Credit Facility consented to roll over, on a cashless basis, such lenders' loans and commitments under the Existing Credit Facility into loans and commitments of the same amount under a new credit facility (the "New Credit Facility") made available to Altice US Finance I Corporation effective upon the consummation of the Altice Acquisition (the "Roll Consents"). The New Credit Facility will mature on December 21, 2022, or sooner if certain amounts of the 2020 Notes, the 2021 Notes or the Senior Secured Notes remain outstanding at certain future dates. Upon the closing of the Altice Acquisition, the $290.0 million of loans and commitments under the existing revolving credit facility under the Existing Credit Facility
F-160
Cequel Corporation
Notes to Consolidated Financial Statements (Continued)
December 31, 2015 and 2014
(dollars in thousands, except where otherwise indicated)
4. Altice Acquisition (Continued)
that lenders elected to rollover into the New Credit Facility, plus $60.0 million of new revolving commitments from other lenders, formed a new $350 million revolving credit facility under the New Credit Facility, and all remaining commitments under the then existing $500 million revolving credit facility under the Existing Credit Facility were terminated.
We applied business combination accounting for the Altice Acquisition. This resulted in the Company having a new accounting basis in the identifiable assets and liabilities and no retained earnings or accumulated losses. Accordingly, the consolidated financial statements on or after December 21, 2015 are not comparable to the consolidated financial statements prior to that date. The financial statements for the periods ended prior to December 20, 2015 do not include the effect of any changes in our corporate structure or changes in the fair value of assets and liabilities as a result of business combination accounting.
Business combination accounting provides, among other things, for a determination of the value to be assigned to the equity of the company as of a date selected for financial reporting purposes. The value of the Company was set forth at approximately $9.1 billion. The value was based upon the purchase price that the Purchasers paid to acquire the Company on December 21, 2015, and including liabilities assumed. Further, DCF analysis was completed for purchase price allocation purposes. A more detailed explanation of the DCF analysis is discussed below.
The basis for the DCF analysis was the Company's projections. These seven-year projections were based on management's assumptions including among others, penetration rates for basic and digital video, high speed Internet, and telephone; revenue growth rates; operating margins; and capital expenditures. The assumptions are derived based on the Company's and its peers' historical operating performance adjusted for current and expected competitive and economic factors surrounding the cable industry. The DCF analysis was completed using a discount rate of approximately 9.0% based on the Company's cost of equity and after-tax cost of debt and a perpetuity growth rate of 2.5%. The value is highly dependent on the achievement of the future financial results contemplated in the projections. The estimates and assumptions made in the valuation are inherently subject to significant uncertainties, many of which are beyond our control, and there is no assurance that these results can be achieved. The primary assumptions for which there is a reasonable possibility of the occurrence of a variation that would have significantly affected the value include the assumptions regarding revenue growth, programming expense growth rates, the amount and timing of capital expenditures and the discount
F-161
Cequel Corporation
Notes to Consolidated Financial Statements (Continued)
December 31, 2015 and 2014
(dollars in thousands, except where otherwise indicated)
4. Altice Acquisition (Continued)
rate utilized. The following table summarizes the estimates of the fair values of the assets acquired and liabilities assumed in the Altice Acquisition (dollars in millions):
| |
Amount Recognized as of December 21, 2015 |
|||
|---|---|---|---|---|
Current Assets |
$ | 156.2 | ||
Accounts Receivable |
179.4 | |||
Property, plant and equipment |
2,208.3 | |||
Goodwill ($538.9 million tax deductible) |
2,040.4 | |||
Intangible assets |
6,089.8 | |||
Other non-current assets |
62.1 | |||
Current liabilities |
(571.4 | ) | ||
Long-term debt |
(6,056.7 | ) | ||
Deferred income taxes |
(1,944.8 | ) | ||
Other non-current liabilities |
(4.0 | ) | ||
| | | | | |
Total |
$ | 2,159.3 | ||
| | | | | |
| | | | | |
| | | | | |
The significant assumptions related to the valuations of our assets and liabilities in connection with business combination accounting include the following:
Property, plant and equipment was given a preliminary fair value of $2.2 billion as of December 21, 2015. In establishing fair value for the vast majority of the Company's property, plant and equipment, the cost approach was utilized. The cost approach considers the amount required to replace an asset by constructing or purchasing a new asset with similar utility, then adjusts the value in consideration of physical depreciation, and functional and economic obsolescence as of the appraisal date. The cost approach relies on management's assumptions regarding current material and labor costs required to rebuild and repurchase significant components of our property, plant and equipment along with assumptions regarding the age and estimated useful lives of our property, plant and equipment.
The Company identified the following intangible assets to be valued: franchise and patent rights, trade names and subscriber relationships. Franchise rights were valued using the greenfield method and were given a preliminary value of $4,984.6 million as of December 21, 2015. Trade names were valued using a deviation of the income approach, known as the royalty savings method, and were given a preliminary value of $37.9 million as of December 21, 2015. Subscriber relationships were valued using a deviation of the excess earnings method and were given a preliminary value of $1,067.4 million as of December 21, 2015. (See Footnote 13)
Long-term debt was valued at fair value as of December 21, 2015 using quoted market prices (Level 2).
The carrying value of most other assets and liabilities approximated fair value as of December 21, 2015. The contractual value of accounts receivable as of December 21, 2015 is approximately $191.2 million, compared to a preliminary fair value of $179.4 million.
F-162
Cequel Corporation
Notes to Consolidated Financial Statements (Continued)
December 31, 2015 and 2014
(dollars in thousands, except where otherwise indicated)
4. Altice Acquisition (Continued)
As a result of applying business combination accounting, the Company recorded preliminary goodwill of $2.0 billion, which represented the excess of organization value over amounts assigned to the other identifiable tangible and intangible assets, arising from expectations of future operational performance and cash generation.
5. Acquisitions of Broadband Systems
On January 2, 2014, the Company consummated its acquisition of three cable systems from Northland Communications ("Northland"), for a purchase price of $40.6 million (the "Northland Acquisition"). The Northland Acquisition was funded by cash on hand. The Company incurred no acquisition related costs for the successor period from December 21, 2015 through December 31, 2015 and the predecessor period from January 1, 2015 through December 20, 2015, and incurred acquisition related costs of approximately $0.2 million for the predecessor year ended December 31, 2014, which are included in selling, general and administrative expense in the consolidated statements of operations.
The Company accounted for the Northland Acquisition in accordance with ASC Topic 805, and the operating results of Northland have been consolidated from the date of acquisition. The total estimated purchase price was allocated to the identifiable tangible and intangible assets acquired based on their fair values using Level 3 inputs (see Footnote 11). The excess of the estimated purchase price over those fair values was recorded as goodwill, which represents the value of expected synergies and other intangible assets that do not qualify for separate recognition. The fair value assigned to the identifiable tangible and intangible assets acquired are based upon a third party valuation using the assumptions developed by management and other information compiled by management.
The table below presents the final allocation of the purchase price to the assets acquired (in millions):
Total purchase price |
$ | 40.6 | ||||
| | | | | | | |
| | | | | | | |
| | | | | | | |
|
Estimated Useful Life
|
|||||
Property, plant and equipment |
1 - 15 years | $ | 11.3 | |||
Subscriber relationships |
7 years | 5.7 | ||||
Franchise rights |
Indefinite-lived | 16.7 | ||||
Goodwill (tax deductible) |
Indefinite-lived | 6.8 | ||||
Current assets |
0.1 | |||||
| | | | | | | |
Total allocated purchase price |
$ | 40.6 | ||||
| | | | | | | |
| | | | | | | |
| | | | | | | |
On October 1, 2014, the Company consummated its acquisition of two cable systems in Nevada from NewWave Communications ("New Wave") for $6.1 million using cash on hand.
The Company's consolidated statement of operations for the year ended December 31, 2014 includes $15.3 million of revenue and $3.1 million of net income, from the acquisition of Northland. In addition, the Company's consolidated statement of operations for the year ended December 31, 2014 includes $0.8 million of revenue and less than $0.1 million of net income from the acquisition of New Wave, which are considered to be immaterial to the Company's consolidated financial statements.
F-163
Cequel Corporation
Notes to Consolidated Financial Statements (Continued)
December 31, 2015 and 2014
(dollars in thousands, except where otherwise indicated)
6. Allowance for Doubtful Accounts
Allowance for doubtful accounts consisted of the following:
| |
Successor 2015 |
|
Predecessor 2015 |
Predecessor 2014 |
||||||||
|---|---|---|---|---|---|---|---|---|---|---|---|---|
Balance, beginning of period |
$ | — | $ | 15,567 | $ | 13,323 | ||||||
Charged to expense |
1,051 | 29,144 | 28,283 | |||||||||
Uncollected balances written off, net of recoveries |
— | (33,106 | ) | (26,039 | ) | |||||||
| | | | | | | | | | | | | |
Balance, end of period |
$ | 1,051 | $ | 11,605 | $ | 15,567 | ||||||
| | | | | | | | | | | | | |
| | | | | | | | | | | | | |
| | | | | | | | | | | | | |
7. Property, Plant and Equipment
Property, plant and equipment consisted of the following as of December 31:
| |
Successor 2015 |
Predecessor 2014 |
|||||
|---|---|---|---|---|---|---|---|
Land |
$ | 44,666 | $ | 24,396 | |||
Buildings and improvements |
112,085 | 99,933 | |||||
Capitalized leases |
2,547 | 17,605 | |||||
Vehicles |
25,324 | 58,523 | |||||
Broadband distribution systems |
2,005,783 | 2,415,462 | |||||
Office furniture, tools and equipment |
43,869 | 128,409 | |||||
| | | | | | | | |
Total Property, plant and equipment |
2,234,274 | 2,744,328 | |||||
Less: accumulated depreciation |
(10,162 | ) | (967,156 | ) | |||
| | | | | | | | |
Property, plant and equipment, net |
$ | 2,224,112 | $ | 1,777,172 | |||
| | | | | | | | |
| | | | | | | | |
| | | | | | | | |
Depreciation expense was $10.2 million, $465.2 million, and $480.3 million for the successor period from December 21, 2015 through December 31, 2015, the predecessor period from January 1, 2015 through December 20, 2015, and the predecessor year ended December 31, 2014, respectively.
During the successor period from December 21, 2015 through December 31, 2015, we acquired $26.0 million of property, plant and equipment. As reflected in our consolidated statement of cash flows, $30.6 million represents capital expenditures for which cash was paid during the year ended December 31, 2015. This amount includes $4.6 million of cash outflows related to the decrease in accounts payable and accrued expenses related to capital expenditures from $16.9 million as of December 20, 2015 to $12.3 million as of December 31, 2015.
During the predecessor period from January 1, 2015 through December 20, 2015, we acquired $444.0 million of property, plant and equipment. As reflected in our consolidated statement of cash flows, $447.9 million represents capital expenditures for which cash was paid during the year ended December 31, 2015. This amount includes $3.9 million of cash outflows related to the decrease in accounts payable and accrued expenses related to capital expenditures from $20.8 million as of December 31, 2014 to $16.9 million as of December 20, 2015.
F-164
Cequel Corporation
Notes to Consolidated Financial Statements (Continued)
December 31, 2015 and 2014
(dollars in thousands, except where otherwise indicated)
7. Property, Plant and Equipment (Continued)
During the predecessor year ended December 31, 2014, we acquired $417.3 million of property, plant and equipment. As reflected in our consolidated statement of cash flows, $420.6 million represents capital expenditures for which cash was paid during the predecessor year ended December 31, 2014. This amount includes $3.3 million of cash outflows related to the decrease in accounts payable and accrued expenses related to capital expenditures from $24.1 million as of December 31, 2013 to $20.8 million as of December 31, 2014.
For the successor period from December 21, 2015 through December 31, 2015, the predecessor period from January 1, 2015 through December 20, 2015, and the predecessor year ended December 31, 2014, the Company recorded a loss on the disposal of cable assets of less than $0.1 million, $1.8 million and $4.3 million, respectively.
8. Accounts Payable and Accrued Expenses
Accounts payable and accrued expenses as of December 31, 2015 and 2014 consist of the following:
| |
December 31, | ||||||
|---|---|---|---|---|---|---|---|
| |
Successor 2015 |
Predecessor 2014 |
|||||
Accounts payable—trade |
$ | 17,497 | $ | 20,265 | |||
Accounts payable and accrued expenses related to capital expenditures |
12,329 | 20,785 | |||||
Accrued liabilities: |
|||||||
Programming costs |
54,047 | 52,241 | |||||
Compensation and benefits |
43,498 | 40,048 | |||||
Taxes and insurance |
23,851 | 31,737 | |||||
Telephone and circuit costs |
7,271 | 15,907 | |||||
Franchise related fees |
15,399 | 15,789 | |||||
Pole rentals |
9,441 | 6,508 | |||||
Other |
34,448 | 28,417 | |||||
| | | | | | | | |
Total |
$ | 217,781 | $ | 231,697 | |||
| | | | | | | | |
| | | | | | | | |
| | | | | | | | |
9. Capital Lease and Other Obligations
Capital lease and other obligations consist of capital leases related to assets, facilities and multi-year vendor service agreements. The Company has financing agreements with original obligations totaling $43.0 million, of which $12.9 million was outstanding at December 31, 2015, that expire between December 2015 and January 2028.
F-165
Cequel Corporation
Notes to Consolidated Financial Statements (Continued)
December 31, 2015 and 2014
(dollars in thousands, except where otherwise indicated)
9. Capital Lease and Other Obligations (Continued)
The future principal payments of the Company's capital lease obligations as of December 31, 2015 are as follows (dollars in thousands):
Year
|
Amount | |||
|---|---|---|---|---|
2016 |
$ | 10,127 | ||
2017 |
865 | |||
2018 |
503 | |||
2019 |
180 | |||
2020 |
266 | |||
Thereafter |
1,001 | |||
| | | | | |
Total |
$ | 12,942 | ||
| | | | | |
| | | | | |
| | | | | |
In 2014, the Company entered into a three year capital lease commitment totaling approximately $14.1 million, of which $4.1 million was outstanding at December 31, 2015, and a five year capital lease commitment totaling approximately $0.8 million, of which $0.6 million was outstanding at December 31, 2015.
10. Long-Term Debt
Outstanding debt consisted of the following at December 31:
| |
Successor 2015(a) |
Predecessor 2014 |
|||||
|---|---|---|---|---|---|---|---|
Existing credit facility |
$ | 1,459,077 | $ | 2,327,948 | |||
New credit facility |
795,138 | — | |||||
6.375% Senior Notes due 2020 |
1,447,659 | 1,527,331 | |||||
5.125% Senior Notes due 2021(b) |
1,094,461 | 1,236,731 | |||||
5.375% Senior Secured Notes due 2023 |
1,089,036 | — | |||||
7.750% Senior Notes due 2025 |
273,821 | — | |||||
| | | | | | | | |
Total Debt |
6,159,192 | 5,092,010 | |||||
Less: Current portion |
(105,129 | ) | (24,422 | ) | |||
| | | | | | | | |
Long-Term Debt |
$ | 6,054,063 | $ | 5,067,588 | |||
| | | | | | | | |
| | | | | | | | |
| | | | | | | | |
- (a)
- On
December 21, 2015, we applied business combination accounting to adjust our debt to reflect fair value. Therefore, as of December 31, 2015, the
accreted values presented above generally represent the fair value at December 21, 2015, plus or minus the accretions to the balance sheet date of December 31, 2015.
- (b)
- Includes the Initial 2021 Notes and the 2021 Mirror Notes.
F-166
Cequel Corporation
Notes to Consolidated Financial Statements (Continued)
December 31, 2015 and 2014
(dollars in thousands, except where otherwise indicated)
10. Long-Term Debt (Continued)
Existing Credit Facility
On February 14, 2012, Suddenlink, Cequel Communications Holdings II, LLC ("Holdings II"), Cequel's direct subsidiary and the direct parent of Suddenlink, certain subsidiaries of Suddenlink and a syndicate of lenders entered into a Credit and Guaranty Agreement, (the "Existing Credit Agreement"), which provides for up to $2.7 billion of loans in the aggregate, consisting of a $2.2 billion term loan facility funded at closing and a $500.0 million revolving credit facility (collectively, the "Existing Credit Facility"). The revolving credit facility was scheduled to mature on February 14, 2017. The term loan facility is scheduled to mature on February 14, 2019. The interest rate on the term loans outstanding under the Existing Credit Agreement initially equaled the prime rate plus 1.75% or the LIBOR rate plus 2.75%, with a LIBOR floor of 0.75%, while the interest rate on the revolver loans initially equaled the prime rate plus 1.50% or the LIBOR rate plus 2.50%. The term loan facility requires quarterly repayments in annual amounts equal to 1.00% of the original principal amount, with the remainder due at maturity. The debt under the Existing Credit Agreement is secured by a first priority security interest in the capital stock of Suddenlink and substantially all of the present and future assets of Suddenlink and its restricted subsidiaries, and is guaranteed by Holdings II, as well as all of Suddenlink's existing and future direct and indirect subsidiaries, subject to certain exceptions set forth in the Existing Credit Agreement. The Existing Credit Agreement contains customary representations, warranties and affirmative covenants. In addition, the Existing Credit Agreement contains restrictive covenants that limit, among other things, the ability of Suddenlink and its subsidiaries to incur indebtedness, create liens, engage in mergers, consolidations and other fundamental changes, make investments or loans, engage in transactions with affiliates, pay dividends, and make acquisitions and dispose of assets. The Existing Credit Agreement also contains a maximum senior secured leverage maintenance covenant. Additionally, the Existing Credit Agreement contains customary events of default, including failure to make payments, breaches of covenants and representations, cross defaults to other indebtedness, unpaid judgments, changes of control and bankruptcy events. The lenders' commitments to fund amounts under the revolving credit facility are subject to certain customary conditions.
On April 30, 2014, the Company was required to make an excess cash flow recapture payment of $72.7 million in accordance with the terms of the Existing Credit Agreement. Lenders holding approximately 16.4% of the outstanding term loans under the Existing Credit Facility waived their right to receive this payment. Accordingly, the Company made an excess cash flow recapture payment of $60.8 million to the other lenders under the Existing Credit Facility and retained $11.9 million related to the waived excess cash flow recapture payment.
On December 29, 2014, the Company made a voluntary principal prepayment in the amount of $55.0 million, using cash on hand.
In connection with the Altice Acquisition, we received consent from lenders under the Existing Credit Facility to amend the definition of change of control and certain other related definitions therein so that the consummation of the Altice Acquisition did not constitute a change of control and corresponding event of default thereunder (the "Existing Credit Facility Amendments"), and we entered into a Second Amendment and Consent to the Existing Credit Facility (the "Second
F-167
Cequel Corporation
Notes to Consolidated Financial Statements (Continued)
December 31, 2015 and 2014
(dollars in thousands, except where otherwise indicated)
10. Long-Term Debt (Continued)
Amendment and Consent") with the lenders thereunder, containing, among other things, the Existing Credit Facility Amendments. In exchange for this consent, we paid lenders who consented to these amendments an aggregate fee of approximately $6.8 million.
Additionally, as of December 21, 2015, in connection with the formation of the New Credit Facility (as described below) the interest rate on the term loans outstanding under the Existing Credit Agreement was increased to the prime rate plus 1.8125% or the LIBOR rate plus 2.8125%, with a LIBOR floor of 1.00%, and the commitments under the then existing $500 million revolving credit facility under the Existing Credit Facility were terminated.
On April 29, 2016, the Company will be required to make an excess cash flow recapture payment of $80.7 million in accordance with the terms of the Existing Credit Agreement.
New Credit Facility
In connection with the Altice Acquisition, lenders holding (a) $290.0 million of loans and commitments under the existing revolving credit facility under the Existing Credit Facility and (b) approximately $815.4 million of loans under the existing term loan facility under the Existing Credit Facility consented to roll over, on a cashless basis, such lenders' loans and commitments under the Existing Credit Facility into loans and commitments of the same amount under the New Credit Facility made available to Altice US Finance I Corporation effective upon the consummation of the Altice Acquisition. The New Credit Facility will mature on December 21, 2022, or sooner if certain amounts of the 2020 Notes, the 2021 Notes or the Senior Secured Notes remain outstanding at certain future dates. Upon the closing of the Altice Acquisition, the $290.0 million of loans and commitments under the existing revolving credit facility under the Existing Credit Facility that lenders elected to rollover into the New Credit Facility, plus $60.0 million of new revolving commitments from other lenders, formed a new $350 million revolving credit facility under the New Credit Facility, and all remaining commitments under the then existing $500 million revolving credit facility under the Existing Credit Facility were terminated.
The revolving credit facility under the New Credit Facility is scheduled to mature on December 21, 2020. The New Credit Facility will mature on December 21, 2022, or sooner if certain amounts of the 2020 Notes, the 2021 Notes or the Senior Secured Notes remain outstanding at certain future dates. The interest rate on the term loans outstanding under the New Credit Agreement equal the prime rate plus 2.25% or the LIBOR rate plus 3.25%, with a LIBOR floor of 1.00%, while the interest rate on the revolver loans equal the prime rate plus 2.25% or the LIBOR rate plus 3.25%. The term loan facility requires quarterly repayments in annual amounts equal to 1.00% of the original principal amount, commencing on March 31, 2016, with the remainder due at maturity. The debt under the New Credit Agreement is secured by a first priority security interest in the capital stock of Suddenlink and substantially all of the present and future assets of Suddenlink and its restricted subsidiaries, and is guaranteed by Holdings II, as well as all of Suddenlink's existing and future direct and indirect subsidiaries, subject to certain exceptions set forth in the New Credit Agreement. The New Credit Agreement contains customary representations, warranties and affirmative covenants. In addition, the New Credit Agreement contains restrictive covenants that limit, among other things, the ability of
F-168
Cequel Corporation
Notes to Consolidated Financial Statements (Continued)
December 31, 2015 and 2014
(dollars in thousands, except where otherwise indicated)
10. Long-Term Debt (Continued)
Suddenlink and its subsidiaries to incur indebtedness, create liens, engage in mergers, consolidations and other fundamental changes, make investments or loans, engage in transactions with affiliates, pay dividends, and make acquisitions and dispose of assets. The New Credit Agreement also contains a maximum senior secured leverage maintenance covenant. Additionally, the New Credit Agreement contains customary events of default, including failure to make payments, breaches of covenants and representations, cross defaults to other indebtedness, unpaid judgments, changes of control and bankruptcy events. The lenders' commitments to fund amounts under the revolving credit facility are subject to certain customary conditions.
Senior Secured Notes
On June 12, 2015, affiliates of Altice issued $1.1 billion principal amount of Senior Secured Notes, the proceeds from which were placed in escrow to finance a portion of the purchase price for the Altice Acquisition. The Senior Secured Notes were issued by the Senior Secured Notes Issuer, an indirect subsidiary of Altice, bear interest at a rate of 5.375% per annum and were issued at a price of 100.00%. Interest on the Senior Secured Notes is payable semi-annually on January 15 and July 15. Following the consummation of the Altice Acquisition and related transactions the equity interests in the Senior Secured Notes Issuer were contributed through one or more intermediary steps to Suddenlink, and the Senior Secured Notes were guaranteed by Cequel Communications Holdings II LLC, Suddenlink and certain of the subsidiaries of Suddenlink and are secured by certain assets of Cequel Communications Holdings II LLC, Suddenlink and its subsidiaries.
Senior Notes
On September 9, 2014, the Issuers issued $500.0 million aggregate principal amount of the 2021 Mirror Notes. The proceeds from the sale, plus cash on hand, were used to make a distribution in the amount of $600 million to our parent (see Footnote 20) and pay related fees and expenses. The 2021 Mirror Notes mature on December 15, 2021. Interest is payable on the 2021 Mirror Notes semi-annually in cash on June 15 and December 15 of each year. The 2021 Mirror Notes have substantially the same terms as the Initial 2021 Notes.
On June 12, 2015, affiliates of Altice issued $300 million principal amount of the 2025 Senior Notes, the proceeds from which were placed in escrow, to finance a portion of the purchase price for the Altice Acquisition. The 2025 Senior Notes were issued by the 2025 Senior Notes Issuer, an indirect subsidiary of Altice, bear interest at a rate of 7.75% per annum and were issued at a price of 100.00%. Interest on the 2025 Senior Notes is payable semi-annually on January 15 and July 15. Following the consummation of the Altice Acquisition and related transactions, the 2025 Senior Notes Issuer merged into Cequel, the 2025 Senior Notes became the obligations of Cequel and Cequel Capital Corporation became the co-issuer of the 2025 Senior Notes.
On June 12, 2015, affiliates of Altice issued $320 million principal amount of the Holdco Notes, the proceeds from which were placed in escrow, to finance a portion of the purchase price for the Altice Acquisition. The Holdco Notes were issued by the Holdco Notes Issuer, an indirect subsidiary of Altice, bear interest at a rate of 7.75% per annum and were issued at a price of 100.00%. Interest on
F-169
Cequel Corporation
Notes to Consolidated Financial Statements (Continued)
December 31, 2015 and 2014
(dollars in thousands, except where otherwise indicated)
10. Long-Term Debt (Continued)
the Holdco Notes is payable semi-annually on January 15 and July 15 (See Footnote 17). The Holdco Notes will automatically exchange into an equal aggregate principal amount of 2025 Senior Notes once the 2025 Senior Notes Issuer builds sufficient restricted payment capacity and the ability to incur additional indebtedness in excess of the aggregate amount of the Holdco Notes. This automatic exchange is expected to take place during the second quarter of 2016.
The Issuers have no ability to service interest or principal on the Senior Notes, other than through any dividends or distributions received from Suddenlink. Suddenlink is restricted in certain circumstances, from paying dividends or distributions to the Issuers by the terms of the Credit Agreements. However, the Credit Agreements permit Suddenlink to make dividends and distributions subject to satisfaction of certain conditions, including pro forma compliance with a maximum senior secured leverage ratio, and that no event of default has occurred and is continuing, or would be caused by the making of such dividends or other distributions, and based on, among other things, availability under a restricted payment basket. The Senior Notes are unsecured and are not guaranteed by any subsidiaries of the Issuers, including Suddenlink.
The Indentures contain certain covenants, agreements and events of default which are customary with respect to non-investment grade debt securities, including limitations on our ability to incur additional indebtedness, pay dividends on or make other distributions or repurchase our capital stock, make certain investments, enter into certain types of transactions with affiliates, create liens and sell certain assets or merge with or into other companies.
The Company's debt agreements include restrictive covenants such as restrictions on additional indebtedness. The Credit Agreements also require the Company to satisfy a financial maintenance covenant. The Company was in compliance with those covenants as of December 31, 2015.
Loss on Extinguishment of Debt
The Company did not incur any losses on extinguishment of debt for the successor period from December 21, 2015 through December 31, 2015, the predecessor period from January 1, 2015 through December 20, 2015 and the predecessor year ended December 31, 2014.
F-170
Cequel Corporation
Notes to Consolidated Financial Statements (Continued)
December 31, 2015 and 2014
(dollars in thousands, except where otherwise indicated)
10. Long-Term Debt (Continued)
Future Principal Payments
The future maturities of long-term debt, excluding premiums and discounts, as of December 31, 2015 are as follows (dollars in thousands):
Year
|
Amount | |||
|---|---|---|---|---|
2016 |
$ | 105,129 | ||
2017 |
24,422 | |||
2018 |
24,422 | |||
2019 |
1,361,804 | |||
2020 |
1,508,657 | |||
Thereafter |
3,422,160 | |||
| | | | | |
Total debt |
$ | 6,446,594 | ||
| | | | | |
| | | | | |
| | | | | |
11. Fair Value of Financial Instruments
The Company has established a process for determining fair value of its financial assets and liabilities using available market information or other appropriate valuation methodologies. Fair value is based upon quoted market prices, where available. If such valuation methods are not available, fair value is based on internally or externally developed models using market-based or independently-sourced market parameters, where available. Fair value may be subsequently adjusted to ensure that those assets and liabilities are recorded at fair value. The use of different methodologies or assumptions to determine the fair value of certain financial instruments could result in a different fair value estimate as of the Company's reporting date.
Fair value guidance establishes a three-level hierarchy for disclosure of fair value measurements, based upon the transparency of inputs to the valuation of an asset or liability as of the measurement date, as follows:
- •
- Level 1—inputs to the valuation methodology are quoted prices (unadjusted) for identical assets or liabilities in active
markets.
- •
- Level 2—inputs to the valuation methodology include quoted prices for similar assets and liabilities in active markets, and
inputs that are observable for the asset and liability, either directly or indirectly, for substantially the full term of the financial instrument.
- •
- Level 3—inputs to the valuation methodology are unobservable and significant to the fair value measurement.
Financial Assets and Liabilities
The Company has estimated the fair value of its financial instruments as of December 31, 2015 and 2014 using available market information or other appropriate valuation methodologies. Considerable judgment, however, is required in interpreting market data to develop the estimates of
F-171
Cequel Corporation
Notes to Consolidated Financial Statements (Continued)
December 31, 2015 and 2014
(dollars in thousands, except where otherwise indicated)
11. Fair Value of Financial Instruments (Continued)
fair value. Accordingly the estimates presented in the accompanying consolidated financial statements are not necessarily indicative of the amounts the Company would realize in a current market exchange.
The carrying amounts of cash and cash equivalents, receivables, payables and other current assets and liabilities approximate fair value because of the short maturity of those instruments.
The estimated fair value of the Company's debt at December 31, 2015 and 2014 is based on quoted market prices for the debt and is classified within Level 2 of the valuation hierarchy. Unrealized gains or losses on debt do not result in the realization or expenditure of cash and are not recognized for financial reporting purposes.
A summary of the carrying value and fair value of the Company's debt at December 31, 2015 and 2014 is as follows:
| |
Successor December 31, 2015 |
|
|
||||||||||
|---|---|---|---|---|---|---|---|---|---|---|---|---|---|
| |
Predecessor December 31, 2014 |
||||||||||||
| |
Carrying Value(a) | |
|||||||||||
| |
Fair Value | Carrying Value | Fair Value | ||||||||||
Existing credit facility |
$ | 1,459,077 | $ | 1,455,231 | $ | 2,327,948 | 2,289,866 | ||||||
New credit facility |
795,138 | 797,096 | — | — | |||||||||
6.375% Senior Notes due 2020 |
1,447,659 | 1,451,250 | 1,527,331 | 1,560,000 | |||||||||
5.125% Senior Notes due 2021(b) |
1,094,461 | 1,118,750 | 1,236,731 | 1,225,000 | |||||||||
5.375% Senior Notes due 2023 |
1,089,036 | 1,102,750 | — | — | |||||||||
7.750% Senior Notes due 2025 |
273,821 | 276,000 | — | — | |||||||||
| | | | | | | | | | | | | | |
Total |
$ | 6,159,192 | $ | 6,201,077 | $ | 5,092,010 | $ | 5,074,866 | |||||
| | | | | | | | | | | | | | |
| | | | | | | | | | | | | | |
| | | | | | | | | | | | | | |
- (a)
- On
December 21, 2015, we applied business combination accounting to adjust our debt to reflect fair value. Therefore, as of December 31, 2015, the
accreted values presented above generally represent the fair value at December 21, 2015, plus or minus the accretions to the balance sheet date of December 31, 2015.
- (b)
- Includes the Initial 2021 Notes and the 2021 Mirror Notes.
Non-financial Assets and Liabilities
The Company's non-financial assets such as franchises, property, plant and equipment, and other intangible assets are not measured at fair value on a recurring basis; however, they are subject to fair value adjustments in certain circumstances, such as when there is evidence that an impairment may exist. No impairments were recorded for the successor period from December 21, 2015 through December 31, 2015, the predecessor period from January 1, 2015 through December 20, 2015, and the predecessor year ended December 31, 2014.
F-172
Cequel Corporation
Notes to Consolidated Financial Statements (Continued)
December 31, 2015 and 2014
(dollars in thousands, except where otherwise indicated)
12. Commitments and Contingencies
Contractual Obligations
The Company has obligations to make future payments for goods and services under certain contractual arrangements. These contractual obligations secure future rights to various assets and services to be used in the normal course of the Company's operations. For example, the Company is contractually committed to make minimum lease payments for the use of property under operating lease agreements. in accordance with applicable accounting rules, the future rights and obligations pertaining to firm commitments, such as operating lease obligations and certain purchase obligations under contracts, are not reflected as assets or liabilities in the consolidated balance sheet.
The following table summarizes the estimated timing and effect of the Company's payment obligations as of December 31, 2015 on the Company's liquidity and cash flows in future periods (dollars in millions):
| |
Total | 2016 | 2017 | 2018 | 2019 | 2020 | Thereafter | |||||||||||||||
|---|---|---|---|---|---|---|---|---|---|---|---|---|---|---|---|---|---|---|---|---|---|---|
Contractual Obligations: |
||||||||||||||||||||||
Operating lease obligations(1) |
$ | 27.9 | $ | 7.9 | $ | 6.0 | $ | 4.4 | $ | 3.6 | $ | 2.9 | $ | 3.1 | ||||||||
Other commitments(2) |
26.4 | 26.0 | 0.4 | — | — | — | — | |||||||||||||||
| | | | | | | | | | | | | | | | | | | | | | | |
Total contractual obligation |
$ | 54.3 | $ | 33.9 | $ | 6.4 | $ | 4.4 | $ | 3.6 | $ | 2.9 | $ | 3.1 | ||||||||
| | | | | | | | | | | | | | | | | | | | | | | |
| | | | | | | | | | | | | | | | | | | | | | | |
| | | | | | | | | | | | | | | | | | | | | | | |
- (1)
- The
Company leases certain site and office space under non-cancelable operating leases. Rent expense for site leases and office space was approximately
$0.2 million, $8.1 million and $7.6 million for the successor period from December 21, 2015 through December 31, 2015, the predecessor period from January 1,
2015 through December 20, 2015, and the predecessor year ended December 31, 2014, respectively.
- (2)
- Represents contractual obligations under programming and content purchase agreements and various other contractual obligations.
The following items are not included as contractual obligations due to various factors discussed below. However, the Company incurs these costs as part of its operations:
- •
- The Company rents utility poles used in its operations. Generally, pole rentals are cancelable on short notice, but the Company anticipates
that such rentals will recur. Rent expense for pole rental attachments was approximately $0.4 million, $13.9 million and $12.9 million for the successor period from
December 21, 2015 through December 31, 2015, the predecessor period from January 1, 2015 through December 20, 2015, and the predecessor year ended December 31, 2014,
respectively.
- •
- The Company pays franchise fees under multi-year franchise agreements based on a percentage of revenues generated from video service per year. Franchise fees and other franchise-related costs included in the accompanying consolidated statements of operations were $1.4 million, $46.2 million and $48.2 million for the successor period from December 21, 2015 through
F-173
Cequel Corporation
Notes to Consolidated Financial Statements (Continued)
December 31, 2015 and 2014
(dollars in thousands, except where otherwise indicated)
12. Commitments and Contingencies (Continued)
- •
- The Company has cable franchise agreements containing provisions requiring the construction of cable plant and the provision of services to customers within the franchise areas. In connection with these obligations under existing franchise agreements, the Company obtains letters of credit guaranteeing performance to municipalities and public utilities and payment of insurance premiums. Such letters of credit as of December 31, 2015 and 2014 totaled $21.2 million and $18.0 million, respectively, which reduced the availability under the $350.0 million and $500.0 million revolving credit facility, respectively, to approximately $328.8 million and $482.0 million, respectively. Payments under these arrangements are required only in the event of nonperformance. The Company does not expect that these contingent commitments will result in any amounts being paid within at least the next twelve months.
December 31, 2015, the predecessor period from January 1, 2015 through December 20, 2015, and the predecessor year ended December 31, 2014, respectively.
Litigation
The Company is a defendant or a co-defendant in several lawsuits involving alleged infringement of various patents relating to various aspects of its businesses. Other industry participants are also defendants in certain of these cases, and, in many cases, the Company expects that any potential liability would be the responsibility of the Company's equipment vendors pursuant to applicable contractual indemnification provisions.
In the event that a court ultimately determines that the Company infringed on any intellectual property rights, the Company may be subject to substantial damages and/or an injunction that could require the Company or the Company's vendors to modify certain products and services the Company offers to its customers, as well as negotiate royalty or license agreements with respect to the patents at issue. While the Company believes the lawsuits are without merit and intends to defend the actions vigorously, no assurance can be given that any adverse outcome would not be material to the Company's consolidated financial condition, results of operations, or liquidity. The Company cannot predict the outcome of any such claims nor can it reasonably estimate the range of possible loss.
From time to time, the Company is involved in other litigation and regulatory proceedings arising out of the Company's operations. Management believes that the Company is not currently a party to any other legal or regulatory proceedings, the adverse outcome of which, individually or in the aggregate, would materially adversely affect the Company's business, financial position, results of operations, or liquidity.
13. Intangible Assets
The Company does not amortize indefinite lived intangible assets. Accordingly, all franchises that qualify for indefinite life treatment are not amortized against earnings but instead are tested for impairment annually, or more frequently as warranted by events or changes in circumstances. Based on testing of impairment of indefinite lived intangible asset guidance, franchises are aggregated into essentially inseparable asset groups to conduct the valuations. The asset groups generally represent geographic clustering of the Company's broadband systems into groups by which such systems are
F-174
Cequel Corporation
Notes to Consolidated Financial Statements (Continued)
December 31, 2015 and 2014
(dollars in thousands, except where otherwise indicated)
13. Intangible Assets (Continued)
managed and by which the franchise rights are associated and tracked. Management believes such grouping represents the highest and best use of those assets for purposes of evaluating impairment of its franchises. The impairment test for intangible assets not subject to amortization involves a comparison of the estimated fair value of the intangible asset with its carrying value. The Company determines the fair value of the intangible asset using a DCF analysis, which utilizes significant unobservable inputs (Level 3) within the fair value hierarchy. Determining fair value requires the exercise of significant judgment, including judgment about appropriate discount rates, perpetual growth rates, the amount and timing of expected future cash flows, as well as relevant comparable company earnings multiples for the market-based approach.
The Company performs its impairment assessment of its goodwill at the same inseparable asset group level as franchises discussed above. The asset groups generally represent geographic clustering of the Company's broadband systems into groups by which such systems are managed and by which goodwill is tracked. The impairment test for goodwill involves a comparison of the estimated fair value to its carrying amount, including goodwill. The Company determines its fair value using a DCF analysis corroborated by a market-based approach, which utilize significant unobservable inputs (Level 3) within the fair value hierarchy.
On December 21, 2015, the Company applied business combination accounting and adjusted its franchise, goodwill and other intangible assets including trademarks and customer relationships to reflect fair value. As a result of applying business combination accounting, the Company recorded goodwill, which is tax deductible, of $2.04 billion, which represents the excess of organization value over amounts assigned to the other assets and liabilities (see Footnote 4).
The Company determined the estimated fair value utilizing an income approach model based on the present value of the estimated discrete future cash flows attributable to each of the intangible assets identified for each unit assuming a discount rate. This approach makes use of unobservable factors such as projected revenues, expenses, capital expenditures, and a discount rate applied to the estimated cash flows. The determination of the discount rate was based on a weighted average cost of capital approach, which uses a market participant's cost of equity and after-tax cost of debt and reflects the risks inherent in the cash flows.
The Company estimated discounted future cash flows using reasonable and appropriate assumptions including among others, penetration rates for basic and digital video, high speed Internet, and telephone, revenue growth rates, operating margins and capital expenditures. The assumptions are derived based on the Company's and its peers' historical operating performance adjusted for current and expected competitive and economic factors surrounding the cable industry. The estimates and assumptions made in the Company's valuations are inherently subject to significant uncertainties, many of which are beyond its control, and there is no assurance that these results can be achieved. The primary assumptions for which there is a reasonable possibility of the occurrence of a variation that would significantly affect the measurement value include the assumptions regarding revenue growth, programming expense growth rates, the amount and timing of capital expenditures and the discount rate utilized.
F-175
Cequel Corporation
Notes to Consolidated Financial Statements (Continued)
December 31, 2015 and 2014
(dollars in thousands, except where otherwise indicated)
13. Intangible Assets (Continued)
Franchises, for valuation purposes, are defined as the future economic benefits of the right to solicit and service potential customers (customer marketing rights), and the right to deploy and market new services, such as interactivity and telephone, to potential customers (service marketing rights). Franchises rights of $4.98 billion were recorded as a result of the application of business combination accounting. Franchises are expected to generate cash flows indefinitely and as such will continue to be tested for impairment annually.
Subscriber relationships, for valuation purposes, represent the value of the business relationship with existing customers (less the anticipated customer churn), and are calculated by projecting the discrete future after-tax cash flows from these customers, including the right to deploy and market additional services to these customers. The Company recorded $1.07 billion of customer relationships in connection with the application of business combination accounting. Subscriber relationships will be amortized on an accelerated method over a useful life of four years based on the period over which current customers are expected to generate cash flows.
The Company recorded $37.9 million in trade names in connection with the application of business combination accounting. The fair value of trade names was determined using the relief from royalty method which applies a fair royalty ratio to estimated revenue. Trade names will be amortized on an accelerated method over a useful life of 2 years based on the period over which the Company expects to continue to use each trade name.
The results of the Company's analysis of indefinite-lived intangible assets as of December 31, 2015 and 2014 indicated no impairment of the carrying value of those assets and no accumulated impairment of goodwill existed.
F-176
Cequel Corporation
Notes to Consolidated Financial Statements (Continued)
December 31, 2015 and 2014
(dollars in thousands, except where otherwise indicated)
13. Intangible Assets (Continued)
Indefinite-lived and finite-lived intangible assets are presented in the following table as of December 31:
| |
Successor 2015 | Predecessor 2014 | |||||||||||||||||
|---|---|---|---|---|---|---|---|---|---|---|---|---|---|---|---|---|---|---|---|
| |
Gross Carrying Amount |
Accumulated Amortization |
Net Carrying Amount |
Gross Carrying Amount |
Accumulated Amortization |
Net Carrying Amount |
|||||||||||||
Indefinite-lived |
|||||||||||||||||||
Franchise and Patent rights |
$ | 4,981,233 | $ | — | $ | 4,981,233 | $ | 3,068,487 | $ | — | $ | 3,068,487 | |||||||
Trade Names |
— | — | $ | — | 188,676 | — | $ | 188,676 | |||||||||||
Goodwill |
2,040,402 | — | 2,040,402 | 1,543,103 | — | 1,543,103 | |||||||||||||
| | | | | | | | | | | | | | | | | | | | |
Total |
$ | 7,021,635 | $ | — | $ | 7,021,635 | $ | 4,800,266 | $ | — | $ | 4,800,266 | |||||||
| | | | | | | | | | | | | | | | | | | | |
| | | | | | | | | | | | | | | | | | | | |
| | | | | | | | | | | | | | | | | | | | |
Finite-lived |
|||||||||||||||||||
Franchise and Patent rights |
$ | 3,356 | $ | — | $ | 3,356 | $ | 60 | $ | (4 | ) | $ | 56 | ||||||
Trade Names |
37,856 | (746 | ) | 37,110 | — | — | — | ||||||||||||
Subscriber relationships |
1,067,353 | (12,625 | ) | 1,054,728 | 499,076 | (335,003 | ) | 164,073 | |||||||||||
| | | | | | | | | | | | | | | | | | | | |
Total |
$ | 1,108,565 | $ | (13,371 | ) | $ | 1,095,194 | $ | 499,136 | $ | (335,007 | ) | $ | 164,129 | |||||
| | | | | | | | | | | | | | | | | | | | |
| | | | | | | | | | | | | | | | | | | | |
| | | | | | | | | | | | | | | | | | | | |
Amortization expense for franchise and patent rights represents the amortization related to patents rights and amortization related to franchises that did not qualify for indefinite-life treatment, including costs associated with franchise renewals. Franchise amortization expense for the successor period from December 21, 2015 through December 31, 2015 was less than $0.1 million. Franchise amortization expense for the predecessor period from January 1, 2015 through December 20, 2015 was $0.7 million, and franchise amortization expense for the predecessor year ended December 31, 2014, was less than $0.1 million. Trade names amortization expense was $0.7 million for the successor period from December 21, 2015 through December 31, 2015, and was zero for the predecessor period from January 1, 2015 through December 20, 2015, and the predecessor year ended December 31, 2014. Subscriber relationships amortization expense was $12.6 million, $65.7 million, $114.2 million for the successor period from December 21, 2015 through December 31, 2015, the predecessor period from January 1, 2015 through December 20, 2015, and the predecessor year ended December 31, 2014, respectively.
F-177
Cequel Corporation
Notes to Consolidated Financial Statements (Continued)
December 31, 2015 and 2014
(dollars in thousands, except where otherwise indicated)
13. Intangible Assets (Continued)
Below is a summary of the changes in the carrying value of the Company's goodwill for the years ended December 31, 2015 and 2014:
| |
Predecessor 2015 | Predecessor 2014 | |||||||||||||||||
|---|---|---|---|---|---|---|---|---|---|---|---|---|---|---|---|---|---|---|---|
| |
Gross Amount |
Accumulated Impairment Charge |
Carrying Value |
Gross Amount |
Accumulated Impairment Charge |
Carrying Value |
|||||||||||||
Balance, beginning of year |
$ | 1,543,103 | $ | — | $ | 1,543,103 | $ | 1,535,072 | $ | — | $ | 1,535,072 | |||||||
Goodwill recognized(a) |
— | — | — | 8,031 | — | 8,031 | |||||||||||||
| | | | | | | | | | | | | | | | | | | | |
Balance, end of period |
$ | 1,543,103 | $ | — | $ | 1,543,103 | $ | 1,543,103 | $ | — | $ | 1,543,103 | |||||||
| | | | | | | | | | | | | | | | | | | | |
| | | | | | | | | | | | | | | | | | | | |
| | | | | | | | | | | | | | | | | | | | |
- (a)
- Includes Goodwill recognized from the acquisitions
| |
Successor 2015 | |||||||||
|---|---|---|---|---|---|---|---|---|---|---|
| |
Gross Amount |
Accumulated Impairment Charge |
Carrying Value |
|||||||
Balance, beginning of period |
$ | 2,040,402 | $ | — | $ | 2,040,402 | ||||
| | | | | | | | | | | |
Balance, end of period |
$ | 2,040,402 | $ | — | $ | 2,040,402 | ||||
| | | | | | | | | | | |
| | | | | | | | | | | |
| | | | | | | | | | | |
The Company has upgraded the technological state of many of its broadband systems since the commencement of operations and has experience with local franchise authorities where the franchises exist and believes all franchises will be renewed indefinitely.
The following table sets forth the estimated amortization expense on intangible assets for the fiscal years ending December 31:
Year
|
Amount | |||
|---|---|---|---|---|
2016 |
$ | 93,577 | ||
2017 |
65,564 | |||
2018 |
30,420 | |||
2019 |
13,472 | |||
2020 |
273 | |||
Thereafter |
1,230 | |||
| | | | | |
Total |
$ | 204,536 | ||
| | | | | |
| | | | | |
| | | | | |
F-178
Cequel Corporation
Notes to Consolidated Financial Statements (Continued)
December 31, 2015 and 2014
(dollars in thousands, except where otherwise indicated)
14. Operating Expenses
Operating expenses by key expense components consisted of the following:
| |
|
|
|
|
||||||||
|---|---|---|---|---|---|---|---|---|---|---|---|---|
| |
Successor Period from December 21, 2015 through December 31, 2015 |
|
Predecessor Period from January 1, 2015 through December 20, 2015 |
|
||||||||
| |
|
Predecessor Year Ended December 31, |
||||||||||
| |
|
|||||||||||
| |
|
|||||||||||
| |
|
2014 | ||||||||||
| |
|
|||||||||||
Programming |
17,943 | 594,152 | 617,410 | |||||||||
High-speed Internet |
1,559 | 54,177 | 52,716 | |||||||||
Telephone |
823 | 26,934 | 54,295 | |||||||||
Plant and Operating |
6,261 | 197,045 | 205,664 | |||||||||
| | | | | | | | | | | | | |
Total Operating Expenses |
$ | 26,586 | $ | 872,308 | $ | 930,085 | ||||||
| | | | | | | | | | | | | |
| | | | | | | | | | | | | |
| | | | | | | | | | | | | |
Programming costs consist primarily of costs paid for programmers for basic, digital, premium, VOD and pay-per-view programming. High-speed Internet costs primarily consist of costs for bandwidth connectivity. Telephone costs primarily consist of costs for delivering telephone service to customers, such as subscriber line costs and regulatory fees. Plant and operating costs consist primarily of employee costs related to wages and benefits of technical personnel who maintain our cable network and provide customer support, outside labor costs, vehicle, utilities and pole rental expenses.
15. Selling, General and Administrative Expenses
Selling, general and administrative expenses by key expense components consisted of the following:
| |
Successor Period from December 21, 2015 through December 31, 2015 |
|
Predecessor Period from January 1, 2015 through December 20, 2015 |
Predecessor Year Ended December 31, 2014 |
||||||||
|---|---|---|---|---|---|---|---|---|---|---|---|---|
General and Administrative |
7,982 | 687,802 | 393,135 | |||||||||
Marketing |
2,873 | 95,547 | 91,237 | |||||||||
Corporate Overhead and Management Fees |
28,311 | 106,611 | 62,014 | |||||||||
| | | | | | | | | | | | | |
Total Selling, General and Administrative |
$ | 39,166 | $ | 889,960 | $ | 546,386 | ||||||
| | | | | | | | | | | | | |
| | | | | | | | | | | | | |
| | | | | | | | | | | | | |
General and administrative expenses consist primarily of wages and benefits for our call centers, customer service and support and administrative personnel; bad debt; billing; advertising; facilities costs; non-cash stock compensation expenses and other administrative expenses. Marketing costs represent the costs of marketing to our current and potential commercial and residential customers, including wages and benefits for our marketing departments and other labor costs. Corporate overhead and management fees primarily consist of wages and benefits for our corporate personnel, legal fees, accounting and audit fees and other corporate expenses.
F-179
Cequel Corporation
Notes to Consolidated Financial Statements (Continued)
December 31, 2015 and 2014
(dollars in thousands, except where otherwise indicated)
16. Income and Other Taxes
Components of the Company's current and deferred income tax (benefit)/provision for the years ended December 31, 2015 and 2014 were as follows:
| |
Successor Period from December 21, 2015 through December 31, 2015 |
|
Predecessor Period from January 1, 2015 through December 20, 2015 |
Predecessor Year Ended December 31, 2014 |
||||||||
|---|---|---|---|---|---|---|---|---|---|---|---|---|
Current Tax Expense: |
||||||||||||
Federal |
$ | — | $ | — | $ | — | ||||||
State |
155 | 4,435 | 5,418 | |||||||||
| | | | | | | | | | | | | |
Total Current |
155 | 4,435 | 5,418 | |||||||||
Deferred Tax (Benefit)/Expense: |
||||||||||||
Federal |
(9,794 | ) | 30,116 | 5,138 | ||||||||
State |
(624 | ) | (5,250 | ) | (2,461 | ) | ||||||
| | | | | | | | | | | | | |
Total Deferred |
(10,418 | ) | 24,866 | 2,677 | ||||||||
| | | | | | | | | | | | | |
Net (Benefit)/Provision for Income Taxes |
$ | (10,263 | ) | $ | 29,301 | $ | 8,095 | |||||
| | | | | | | | | | | | | |
| | | | | | | | | | | | | |
| | | | | | | | | | | | | |
The Company's (benefit)/provision for income taxes differs from the expected tax expense amount computed by applying the statutory federal income tax rate to the income/(loss) before income taxes as a result of the following:
| |
Successor Period from December 21, 2015 through December 31, 2015 |
|
Predecessor Period from January 1, 2015 through December 20, 2015 |
Predecessor Year Ended December 31, 2014 |
||||||||
|---|---|---|---|---|---|---|---|---|---|---|---|---|
Tax at U.S. statutory rate |
35.0 | % | 35.0 | % | 35.0 | % | ||||||
State taxes, net of benefit |
1.9 | (1.2 | ) | 17.1 | ||||||||
Uncertain tax position |
— | — | (51.2 | ) | ||||||||
Change in valuation allowance |
— | 0.4 | (1.3 | ) | ||||||||
Non-cash stock option expense |
— | (57.7 | ) | 45.6 | ||||||||
Return to provision |
— | — | (0.4 | ) | ||||||||
Change in state effective tax rate |
— | 5.4 | — | |||||||||
State income tax credits |
— | (0.1 | ) | (15.4 | ) | |||||||
Other, net |
(0.1 | ) | 2.4 | 2.5 | ||||||||
| | | | | | | | | | | | | |
Effective tax rate |
36.8 | % | (15.8 | )% | 31.9 | % | ||||||
| | | | | | | | | | | | | |
| | | | | | | | | | | | | |
| | | | | | | | | | | | | |
Deferred income taxes reflect the net tax effects of temporary differences between the carrying amounts of assets and liabilities for financial reporting purposes and the amounts used for income tax
F-180
Cequel Corporation
Notes to Consolidated Financial Statements (Continued)
December 31, 2015 and 2014
(dollars in thousands, except where otherwise indicated)
16. Income and Other Taxes (Continued)
purposes. Significant components of the Company's deferred tax assets and liabilities are as follows as of December 31:
| |
Successor 2015 |
Predecessor 2014 |
|||||
|---|---|---|---|---|---|---|---|
Deferred tax assets: |
|||||||
Net operating loss carryforwards |
$ | 631,216 | $ | 615,015 | |||
State income tax credits |
3,809 | 3,908 | |||||
Accrued expenses |
20,634 | 13,901 | |||||
Other |
888 | 1,058 | |||||
| | | | | | | | |
Total gross deferred tax assets |
656,547 | 633,882 | |||||
Less: valuation allowance |
(1,283 | ) | (2,042 | ) | |||
| | | | | | | | |
Net deferred tax asset |
655,264 | 631,840 | |||||
Deferred tax liabilities: |
|||||||
Book over tax basis of depreciable assets |
(385,437 | ) | (234,342 | ) | |||
Book over tax basis of amortizable assets |
(1,795,262 | ) | (669,907 | ) | |||
| | | | | | | | |
Gross deferred tax liabilities |
(2,180,699 | ) | (904,249 | ) | |||
| | | | | | | | |
Net deferred tax liabilities |
$ | (1,525,435 | ) | $ | (272,409 | ) | |
| | | | | | | | |
| | | | | | | | |
| | | | | | | | |
The Company has approximately $1,709.0 million and $1,653.8 million of federal net operating loss carryforwards in 2015 and 2014, respectively, which will expire at various dates through 2035. In addition, the Company has state net operating loss carryforwards, net of US Federal income taxes, of approximately $33.1 million and $36.2 million in 2015 and 2014, respectively, which will expire at various dates through 2035. At December 31, 2015 and 2014, the Company has a $1.3 million and $2.0 million, respectively, valuation allowance on state net operating loss carryforwards as it is more likely than not that a portion of the deferred tax asset will not be realized in the future. The net operating loss carryforwards are subject to certain limitations arising from changes in ownership rules under the Internal Revenue Code and state taxing authorities. The Company does not expect the limitations to impact the ability to utilize the losses prior to their expiration. The utilization of the net operating losses and the acquired net operating losses will be determined based on the ordering rules required by the applicable taxing jurisdiction.
The Company accounts for uncertain tax positions in accordance with the accounting guidance for such items. This guidance prescribes a recognition threshold that a tax position is required to meet before being recognized in the financial statements and provides guidance on de-recognition, measurement, classification, interest and penalties, accounting in interim periods, disclosure and transition issues. The Company recognizes income tax benefits for those income tax provisions determined more likely than not to be sustained upon examination, based on the technical merits of the positions. On September 15, 2014, the Company filed its consolidated US Corporate Income Tax Return for the calendar year 2013 reflecting an adjustment to a previously filed position which effectively eliminated the Company's uncertain tax position. The elimination of the uncertain tax
F-181
Cequel Corporation
Notes to Consolidated Financial Statements (Continued)
December 31, 2015 and 2014
(dollars in thousands, except where otherwise indicated)
16. Income and Other Taxes (Continued)
position resulted in a corresponding adjustment to the Company's net deferred tax liabilities and deferred tax assets which resulted in a net benefit to income taxes of $13.0 million for the year. The elimination of the uncertain tax position recognized in 2014 reduced the Company's effective tax rate by 51.2%. Changes in the Company's reserve for uncertain income tax positions, excluding the related accrual for interest and penalties are presented below:
| |
Successor Period from December 21, 2015 through December 31, 2015 |
|
Predecessor Period from January 1, 2015 through December 20, 2015 |
Predecessor Year Ended December 31, 2014 |
||||||||
|---|---|---|---|---|---|---|---|---|---|---|---|---|
Balance, beginning of period |
$ | — | $ | — | $ | 33,127 | ||||||
Additions for tax positions related to prior years |
— | — | — | |||||||||
Reductions for tax positions related to prior years |
— | — | (33,127 | ) | ||||||||
Additions for tax positions related to current year |
— | — | — | |||||||||
Reductions for tax positions related to current year |
— | — | — | |||||||||
Reductions due to settlements with taxing authorities |
— | — | — | |||||||||
Reductions due to expiration of statute of limitations |
— | — | — | |||||||||
| | | | | | | | | | | | | |
Balance, end of period |
$ | — | $ | — | $ | — | ||||||
| | | | | | | | | | | | | |
| | | | | | | | | | | | | |
| | | | | | | | | | | | | |
Tax years ending 2011 through 2014 remain subject to examination and assessment. By statute, the Company's use of certain carryforward attributes that were generated prior to 2010 will allow the Internal Revenue Service ("IRS") to subsequently examine those periods. During 2014, the IRS concluded its examination of the income tax return for a subsidiary of the Company, Cequel Holdings, for the tax years ending December 31, 2011 and November 15, 2012, resulting in no adjustments. In 2015, the Company reached a settlement with the IRS on the audit of the income tax return for the successor tax period ending December 31, 2012, resulting in no material adjustments to the Company's financial statements.
We adjust our tax reserve estimates periodically because of ongoing examinations by, and settlements with, the various taxing authorities, as well as changes in tax laws, regulations and precedent. We recognize interest and penalties related to uncertain tax positions in income tax expense. As of December 31, 2015, we have no accrued interest or penalties related to uncertain tax positions.
As of December 31, 2015, the Company does not currently have any uncertain tax positions, nor does it believe that any events or rulings will cause one, within the next twelve months. However, various events could cause the Company's current expectations to change in the future.
F-182
Cequel Corporation
Notes to Consolidated Financial Statements (Continued)
December 31, 2015 and 2014
(dollars in thousands, except where otherwise indicated)
17. Related Party Transactions
Prior to the consummation of the Altice Acquisition, pursuant to the Amended and Restated Cequel Communications Management Agreement, dated as of February 14, 2012, as amended (the "Management Agreement"), Cequel III, LLC ("Cequel III") provided certain executive, administrative and managerial services to the broadband systems owned by Cequel Holdings and its subsidiaries. Compensation under the terms of the agreement was an annual base fee of $5.3 million, set in 2006, paid quarterly in arrears. The base fee increased 5% annually on each anniversary date of the Management Agreement. The Cequel Holdings Board of Directors approved an additional incentive fee of $3.2 million and $1.4 million to Cequel III, LLC for the predecessor period from January 1, 2015 through December 20, 2015, and the predecessor year ended December 31, 2014, respectively. The Management Agreement was terminated upon consummation of the Altice Acquisition, so no incentive fees were approved during the successor period from December 21, 2015 through December 31, 2015.
Total compensation paid to Cequel III, LLC under the Management Agreement, which is included in the selling, general and administrative line in the accompanying consolidated statements of operations, was $11.0 million and $9.1 million for the predecessor period from January 1, 2015 through December 20, 2015, and the predecessor year ended December 31, 2014, respectively. The Management Agreement was terminated upon consummation of the Altice Acquisition, so no fees were paid to Cequel III during the successor period from December 21, 2015 through December 31, 2015. At December 31, 2014, the Company had approximately $4.8 million recorded as a payable to Cequel III, LLC, primarily related to management and incentive fees. No payables to Cequel III, LLC were recorded at December 31, 2015.
Pursuant to the Stockholders Agreement of CVC 2 B.V., a subsidiary of Altice and indirect owner of Cequel Corporation, dated as of December 21, 2015, Altice provides certain executive services, including CEO, CFO and COO services, to the Company. Compensation under the terms of the agreement is an annual fee of $10.0 million. At December 31, 2015, the Company had approximately $0.3 million recorded as a payable to Altice, related to services provided for the successor period from December 21, 2015 through December 31, 2015.
On December 21, the Holdco Notes Issuer loaned the proceeds of the Holdco Notes to the Company to consummate the Altice Acquisition. The intercompany loan was recorded as Due to Parent at the fair value of the related debt at the time of the transaction. Once the Senior Notes Issuer builds sufficient restricted payment capacity and the ability to incur additional indebtedness in excess of the aggregate amount of the Holdco Notes, the Holdco Notes will automatically exchange into an equal aggregate principal amount of 2025 Senior Notes and the intercompany loan will be eliminated.
18. Employee Benefit Plan
The Company's employees may participate in a 401(k) plan. Employees that qualify for participation can contribute up to 15% of their salary, on a pre-tax basis, subject to a maximum contribution limit as determined by the Internal Revenue Service. The Company matches 50% of the first 6% of participant contributions. The Company contributed approximately $0.2 million, $6.6 million and $5.9 million, to the 401(k) plan for successor period from December 21, 2015 through December 31, 2015, the predecessor period from January 1, 2015 through December 20, 2015, and the predecessor year ended December 31, 2014, respectively.
F-183
Cequel Corporation
Notes to Consolidated Financial Statements (Continued)
December 31, 2015 and 2014
(dollars in thousands, except where otherwise indicated)
19. Equity Based Compensation
Carried Interest Plan
Prior to the Altice Acquisition, the general partners of the partnerships that held the shares of Cequel Corporation (collectively, the "Carry Interest Partnerships"), each adopted separate carried interest plans (collectively, the "Carried Interest Plan"), pursuant to which participants were awarded profit interest units in those partnerships. The purpose of the Carried Interest Plan was to provide participation in Cequel Corporation's long-term success and growth as an incentive to our executives, key employees, directors and other individuals who were responsible for and contributed to our management, growth and profitability, and to attract, retain and reward such participants.
Pursuant to the Carried Interest Plan, each Carry Interest Partnership was permitted to issue no more than 1,000,000 carry units. The Carry Interest Partnerships issued an aggregate of approximately 996,500 carry units. The awarded carry units that were forfeited or canceled in accordance with the Carried Interest Plan were available, under certain terms and conditions, for reissue in subsequent awards. In certain instances following cessation of their services on behalf of us, the participants had put rights or the Carry Interest Partnerships had call rights, with respect to such participants' carry units.
The carry units were to vest in quarterly installments over four years. Certain adjustments to the vesting schedules and/or certain distributions could occur in respect of certain specified events in connection with the Carried Interest Plan, which included: (i) a sale or series of sales by one of the Sponsors to the other resulting in the transferring Sponsor owning less than 35% of its original total Sponsor ownership interest following such transaction, (ii) a sale or series of sales by the Sponsors to third parties resulting in the Sponsors together owning less than 35% of their aggregate original Sponsor ownership interests, (iii) a sale or series of sales by either BC Partners or CPPIB to third parties resulting in such Sponsor owning less than 35% of its original total Sponsor ownership interest, or (iv) a sale of substantially all of the assets of Cequel Corporation or a sale of substantially all of its shares.
The Carried Interest Plan entitled participants to receive certain percentages of net cash proceeds received by the Carry Interest Partnerships in connection with sales by the Carry Interest Partnerships of common stock of Cequel Corporation, distributions from Cequel Corporation or amounts received upon liquidation or dissolution of Cequel Corporation. The amounts were paid to participants once threshold amounts had been received by the Carry Interest Partnerships and paid to the Sponsors and Management Investors in Cequel Corporation, and the percentage of cash proceeds to which the participants are entitled increased as the return to the Sponsors and such Management Investors increased.
The Company measured the cost of employee services received in exchange for carry units based on the fair value of the award at each reporting period. The Company used the Monte Carlo Simulation Method to estimate the fair value of the awards. Because the Monte Carlo Simulation Method required the use of subjective assumptions, changes in these assumptions could have materially affected the fair value of the carried interest units granted. The time to liquidity event assumption was based on management's judgment. The equity volatility assumption were estimated using the historical
F-184
Cequel Corporation
Notes to Consolidated Financial Statements (Continued)
December 31, 2015 and 2014
(dollars in thousands, except where otherwise indicated)
19. Equity Based Compensation (Continued)
weekly volatility of publicly traded comparable companies. The risk-free rate assumed in valuing the units was based on the U.S. Constant Maturity Treasury Rates for a period matching the expected time to liquidity event. The Company's total equity value was estimated by a third party using a range of indicated business enterprise values. For the years ended December 31, 2015 and 2014, the Company recognized approximately $287.7 million and $30.7 million, respectively, related to the push down of non-cash compensation expense for employees of Cequel.
Concurrent with the Altice Acquisition, the Carried Interest Plan was cashed out based on an agreement between the Sponsors and the Management Holder whereby payments were made to participants in such Carried Interest Plan, including certain officers and directors of Cequel and Cequel Corporation, and the Carried Interest Plan was terminated.
20. Equity Distributions
On September 10, 2014, the Issuers used the proceeds from the sale of the 2021 Mirror Notes, plus $120.5 million of cash on hand, to make a distribution to Cequel Holdings in the amount of $600.0 million. Cequel Holdings then made a distribution to Cequel Corporation in the amount of $600.0 million. Cequel Corporation used this distribution to make a distribution in the amount of $600.0 million to holders of equity interests in Cequel Corporation.
In December 2015, $32.2 million was contributed to the Company to pay certain transaction fees and expenses related to the Altice Acquisition.
F-185
Cequel Corporation
Notes to Consolidated Financial Statements (Continued)
December 31, 2015 and 2014
(dollars in thousands, except where otherwise indicated)
21. Unaudited Quarterly Financial Data
The following table presents quarterly data for the periods presented on the consolidated statements of operations (unaudited):
| |
Quarter Ended | ||||||||||||
|---|---|---|---|---|---|---|---|---|---|---|---|---|---|
| |
March 31, | June 30, | September 30, | December 31, | |||||||||
Successor 2015(1) |
|||||||||||||
Revenues |
$ | — | $ | — | $ | — | $ | 72,943 | |||||
Loss from operations |
— | — | — | (16,383 | ) | ||||||||
Net loss |
— | — | — | (17,611 | ) | ||||||||
| | | | | | | | | | | | | | |
Predecessor 2015(2) |
|||||||||||||
Revenues |
$ | 588,250 | $ | 608,016 | $ | 605,112 | $ | 545,991 | |||||
Income/(loss) from operations |
79,029 | (19,792 | ) | 62,196 | (69,689 | ) | |||||||
Net income/(loss) |
8,994 | (277,397 | ) | 35,326 | 18,201 | ||||||||
Predecessor 2014 |
|||||||||||||
Revenues |
$ | 575,025 | $ | 579,942 | $ | 583,606 | $ | 592,124 | |||||
Income from operations |
68,249 | 55,394 | 57,259 | 74,588 | |||||||||
Net income/(loss) |
4,334 | (2,714 | ) | 9,671 | 5,958 | ||||||||
- (1)
- Successor
2015 consists of the period from December 21, 2015 through December 31, 2015.
- (2)
- Predecessor 2015 consists of the period from January 1, 2015 through December 20, 2015.
22. Subsequent Events
The Company has updated its review of subsequent events as of March 30, 2016 (the date available for issuance) noting no events that require disclosure.
F-186
PART II
INFORMATION NOT REQUIRED IN PROSPECTUS
Item 13. Other Expenses of Issuance.
The following table sets forth the various expenses, other than underwriting discounts and commissions, payable in connection with the offering contemplated by this registration statement. All of the fees set forth below are estimates except for the SEC registration fee, the FINRA fee and the stock exchange listing fee.
| |
Payable by the registrant | |||
|---|---|---|---|---|
SEC registration fee |
$ | 185,840 | ||
FINRA fee |
225,500 | |||
Stock exchange listing fee |
25,000 | |||
Printing expenses |
350,000 | |||
Legal fees and expenses |
3,500,000 | |||
Accounting fees and expenses |
2,500,000 | |||
Transfer Agent and Registrar fees |
11,000 | |||
Miscellaneous fees and expenses |
727,660 | |||
| | | | | |
Total |
$ | 7,500,000 | ||
| | | | | |
Item 14. Indemnification of Directors and Officers.
We are incorporated under the laws of the state of Delaware.
Section 145(a) of the DGCL provides that a corporation may indemnify any person who was or is a party or is threatened to be made a party to any threatened, pending or completed action, suit or proceeding, whether civil, criminal, administrative or investigative (other than an action by or in the right of the corporation) by reason of the fact that the person is or was a director, officer, employee or agent of the corporation, or is or was serving at the request of the corporation as a director, officer, employee or agent of another corporation, partnership, joint venture, trust or other enterprise, against expenses (including attorneys' fees), judgments, fines and amounts paid in settlement actually and reasonably incurred by the person in connection with such action, suit or proceeding if the person acted in good faith and in a manner the person reasonably believed to be in or not opposed to the best interests of the corporation, and, with respect to any criminal action or proceeding, had no reasonable cause to believe the person's conduct was unlawful.
Section 145(b) of the DGCL provides that a corporation may indemnify any person who was or is a party or is threatened to be made a party to any threatened, pending or completed action or suit by or in the right of the corporation to procure a judgment in its favor by reason of the fact that the person is or was a director, officer, employee or agent of the corporation, or is or was serving at the request of the corporation as a director, officer, employee or agent of another corporation, partnership, joint venture, trust or other enterprise, against expenses (including attorneys' fees) actually and reasonably incurred by the person in connection with the defense or settlement of such action or suit if the person acted in good faith and in a manner the person reasonably believed to be in or not opposed to the best interests of the corporation and except that no indemnification shall be made in respect of any claim, issue or matter as to which such person shall have been adjudged to be liable to the corporation unless and only to the extent that the Delaware Court of Chancery or the court in which such action or suit was brought shall determine upon application that, despite the adjudication of liability but in view of all of the circumstances of the case, such person is fairly and reasonably entitled to indemnity for such expenses which the Delaware Court of Chancery or such other court shall deem proper.
II-1
Section 145(c) of the DGCL provides that to the extent that a present or former director or officer of a corporation has been successful on the merits or otherwise in defense of any action, suit or proceeding referred to in subsections (a) and (b) of Section 145 of the DGCL, or in defense of any claim, issue or matter therein, such person shall be indemnified against expenses (including attorneys' fees) actually and reasonably incurred by such person in connection therewith.
Section 145(e) of the DGCL provides that expenses, including attorneys' fees, incurred by an officer or director of the corporation in defending any civil, criminal, administrative or investigative action, suit or proceeding may be paid by the corporation in advance of the final disposition of such action, suit or proceeding upon receipt of an undertaking by or on behalf of such director or officer to repay such amount if it shall ultimately be determined that such person is not entitled to be indemnified by the corporation as authorized in Section 145 of the DGCL. Such expenses, including attorneys' fees, incurred by former directors and officers or other persons serving at the request of the corporation as directors, officers, employees or agents of another corporation, partnership, joint venture, trust or other enterprise may be so paid upon such terms and conditions, if any, as the corporation deems appropriate.
Section 145(g) of the DGCL specifically allows a Delaware corporation to purchase liability insurance on behalf of its directors and officers and to insure against potential liability of such directors and officers regardless of whether the corporation would have the power to indemnify such directors and officers under Section 145 of the DGCL.
Section 102(b)(7) of the DGCL permits a Delaware corporation to include a provision in its certificate of incorporation eliminating or limiting the personal liability of directors to the corporation or its stockholders for monetary damages for breach of fiduciary duty as a director. This provision, however, may not eliminate or limit a director's liability (1) for breach of the director's duty of loyalty to the corporation or its stockholders, (2) for acts or omissions not in good faith or involving intentional misconduct or a knowing violation of law, (3) under Section 174 of the DGCL, or (4) for any transaction from which the director derived an improper personal benefit.
Section 145 of the DGCL makes provision for the indemnification of officers and directors in terms sufficiently broad to indemnify our officers and directors under certain circumstances from liabilities (including reimbursement for expenses incurred) arising under the Securities Act. Our amended and restated certificate of incorporation will provide, in effect, that, to the fullest extent and under the circumstances permitted by Section 145 of the DGCL, we will indemnify any and all of our officers and directors. Our certificate of incorporation also will relieve our directors from monetary damages to us or our stockholders for breach of such director's fiduciary duty as a director to the fullest extent permitted by the DGCL.
We have purchased insurance policies which, within the limits and subject to the terms and conditions thereof, cover certain expenses and liabilities that may be incurred by directors and officers in connection with proceedings that may be brought against them as a result of an act or omission committed or suffered while acting as our director or officer.
The form of Underwriting Agreement, to be entered into in connection with this offering and attached as Exhibit 1.1 hereto, provides for the indemnification by the Underwriters of us and our officers and directors for certain liabilities, including liabilities arising under the Securities Act, and affords certain rights of contribution with respect thereto.
II-2
Item 15. Recent Sales of Unregistered Securities.
In the three years preceding the filing of this registration statement, the registrant has issued the following securities that were not registered under the Securities Act:
On September 16, 2015, in connection with the Optimum Acquisition, Altice USA, Inc. (formerly known as Neptune Holding US Corp.) issued 100 shares of its common stock, par value $0.01 per share, to CVC 3 B.V., a Dutch private company with limited liability (besloten vennootschap), in a private placement under Section 4(a)(2) of the Securities Act, and in consideration for $1.00 paid to Altice USA, Inc. by CVC 3 B.V. for such shares.
On June 21, 2016, Altice USA issued $875 million aggregate principal amount of 10.75% notes due 2023 and $875 million aggregate principal amount of Altice USA's 11.00% notes due 2024. The transaction did not involve any underwriters or any public offering. The transaction was exempt from registration under the Securities Act, pursuant to Section 4(a)(2) of the Securities Act, as a transaction by an issuer not involving a public offering. No general solicitation was made by either Altice USA or any person acting on its behalf. The purchasers of the notes agreed that the securities would be subject to standard restrictions applicable to a private placement of securities under applicable state and federal securities laws and appropriate legends were affixed to the issued notes.
Prior to the completion of this offering, in connection with the Organizational Transactions, we are issuing shares of Class A common stock and Class B common stock in exchange for outstanding shares of the Company and in connection with the conversion of the notes payable to affiliates and related parties into shares of Class A common stock and Class B common stock. The issuance of such shares of common stock is not and will not be registered under the Securities Act and the shares are being issued to investors in reliance upon the exemption from the registration requirements of the Securities Act, as set forth in Section 4(a)(2) under the Securities Act.
Item 16. Exhibits and Financial Statement Schedules.
(a) Exhibits:
The exhibit index attached hereto is incorporated herein by reference.
(b) Financial statement schedules:
No financial statement schedules are provided because the information called for is not required or is shown in the financial statements or the notes thereto.
The undersigned hereby undertakes as follows:
(a) to provide to the underwriters at the closing specified in the underwriting agreement certificates in such denominations and registered in such names as required by the underwriters to permit prompt delivery to each purchaser.
(b) Insofar as indemnification for liabilities arising under the Securities Act of 1933 may be permitted to directors, officers and controlling persons of the registrant pursuant to the foregoing provisions or otherwise, the registrant has been advised that in the opinion of the Securities and Exchange Commission such indemnification is against public policy as expressed in the Act and is, therefore, unenforceable. In the event that a claim for indemnification against such liabilities (other than the payment by the registrant of expenses incurred or paid by a director, officer or controlling person of the registrant in the successful defense of any action, suit or proceeding) is asserted by such director, officer or controlling person in connection with the securities being registered, the registrant will, unless in the opinion of its counsel the matter has been settled by
II-3
controlling precedent, submit to a court of appropriate jurisdiction the question of whether such indemnification by it is against public policy as expressed in the Act, and will be governed by the final adjudication of such issue.
(c)(1) For purposes of determining any liability under the Securities Act of 1933, the information omitted from the form of prospectus filed as part of this registration statement in reliance upon Rule 430A and contained in a form of prospectus filed by us pursuant to Rule 424(b)(1) or (4) or 497(h) under the Securities Act shall be deemed to be part of this registration statement as of the time it was declared effective.
(2) For the purpose of determining any liability under the Securities Act of 1933, each post-effective amendment that contains a form of prospectus shall be deemed to be a new registration statement relating to the securities offered therein and the offering of such securities at that time shall be deemed to be the initial bona fide offering thereof.
II-4
Pursuant to the requirements of the Securities Act of 1933, the registrant has duly caused this registration statement to be signed on its behalf by the undersigned, thereunto duly authorized, in the city of Bethpage, State of New York, on June 16, 2017.
|
ALTICE USA, INC. | |||||
|
By: |
/s/ DAVID CONNOLLY |
||||
|
Name: | David Connolly | ||||
|
Title: | Executive Vice President and General Counsel | ||||
Pursuant to the requirements of the Securities Act of 1933, this registration statement has been signed on June 16, 2017 by the following persons in the capacities indicated.
Signature
|
Title
|
|||
|---|---|---|---|---|
| * Dexter Goei |
Chairman and Chief Executive Officer (Principal Executive Officer) | |||
* Charles Stewart |
Director, Co-President and Chief Financial Officer (Principal Financial Officer) |
|||
* Victoria Mink |
Senior Vice President and Chief Accounting Officer (Principal Accounting Officer) |
|||
* Abdelhakim Boubazine |
Director, Co-President and Chief Operating Officer |
|||
* Lisa Rosenblum |
Vice Chairman |
|||
*By: |
/s/ DAVID CONNOLLY David Connolly as Attorney-in-Fact |
|||
II-5
EXHIBIT INDEX
| Exhibit No. | Exhibit Description | ||
|---|---|---|---|
| 1.1 | ** | Form of Underwriting Agreement | |
| 3.1 | ** | Form of Amended and Restated Certificate of Incorporation | |
| 3.2 | ** | Form of Amended and Restated Bylaws of the Registrant | |
| 4.1 | † | Specimen Class A Common Stock Certificate | |
| 4.2 | ** | Form of Stockholders and Registration Rights Agreement by and among Altice USA, Inc. and the stockholders party thereto | |
| 4.3 | ** | Indenture, dated as of September 23, 2009, relating to Cablevision's 85/8% Senior Notes due 2017 and 85/8% Series B Senior Notes due 2017 | |
| 4.4 | ** | Indenture, dated as of April 2, 2010, relating to Cablevision's 73/4% Senior Notes due 2018 and 8% Senior Notes due 2020 | |
| 4.5 | ** | First Supplemental Indenture, dated as of April 15, 2010, to the Indenture, dated as of April 2, 2010, relating to Cablevision's 73/4% Senior Notes due 2018 and 8% Senior Notes due 2020 | |
| 4.6 | ** | Second Supplemental Indenture, dated as of September 27, 2012, to the Indenture dated as of April 2, 2010, relating to Cablevision's 57/8% Senior Notes due 2022 | |
| 4.7 | ** | Indenture, dated as of December 1, 1997, relating to CSC Holdings' 77/8% Senior Debentures due 2018 | |
| 4.8 | ** | Indenture, dated as of July 1, 1998, relating to CSC Holdings' 75/8% Senior Debentures due 2018 | |
| 4.9 | ** | Indenture, dated as of February 12, 2009, relating to CSC Holdings' 85/8% Senior Notes due 2019 and 85/8% Series B Senior Notes due 2019 | |
| 4.10 | ** | Indenture, dated as of November 15, 2011, relating to CSC Holdings' 63/4% Senior Notes due 2021 and 63/4% Series B Senior Notes due 2021 | |
| 4.11 | ** | Indenture, dated as of May 23, 2014, relating to CSC Holdings' 51/4% Senior Notes due 2024 and 51/4% Series B Senior Notes due 2024 | |
| 4.12 | ** | Indenture, dated as of October 9, 2015, relating to CSC Holdings' 101/8% Senior Notes due 2023 and 107/8% Senior Notes due 2025 | |
| 4.13 | ** | Supplemental Indenture, dated as of June 21, 2016, to Indenture dated as of October 9, 2015, relating to CSC Holdings' 101/8% Senior Notes due 2023 and 107/8% Senior Notes due 2025 | |
| 4.14 | ** | Indenture, dated as of October 9, 2015, relating to CSC Holdings' 65/8% Senior Guaranteed Notes due 2025 | |
| 4.15 | ** | Supplemental Indenture, dated as of June 21, 2016, to the Indenture dated as of October 9, 2015, relating to CSC Holdings' 65/8% Senior Guaranteed Notes due 2025 | |
| 4.16 | ** | Indenture, dated as of September 23, 2016, relating to CSC Holdings' 51/2% Senior Guaranteed Notes due 2027 | |
| 4.17 | ** | Indenture, dated as of June 12, 2015, relating to Altice US Finance I Corporation's 53/8% Senior Secured Notes due 2023 | |
II-6
| Exhibit No. | Exhibit Description | ||
|---|---|---|---|
| 4.18 | ** | Supplemental Indenture, dated as of December 21, 2015, to the Indenture, dated as of June 12, 2015, relating to Altice US Finance I Corporation's 53/8% Senior Secured Notes due 2023 | |
| 4.19 | ** | Notes Pledge and Security Agreement, dated as of December 21, 2015, by and between Cequel Communications Holdings II, LLC and JPMorgan Chase Bank, N.A. | |
| 4.20 | ** | Notes Pledge and Security Agreement, dated as of December 21, 2015, by and among the grantors party thereto and JPMorgan Chase Bank, N.A. | |
| 4.21 | ** | Trademark Security Agreement, dated as of December 21, 2015, by and among the grantors party thereto and JPMorgan Chase Bank, N.A. | |
| 4.22 | ** | Copyright Security Agreement, dated as of December 21, 2015, by and among the grantors party thereto and JPMorgan Chase Bank, N.A. | |
| 4.23 | ** | Indenture, dated as of April 26, 2016, relating to Altice US Finance I Corporation's 51/2% Senior Secured Notes due 2026 | |
| 4.24 | ** | Notes Pledge and Security Agreement, dated May 20, 2016, by and between Cequel Communications Holdings II, LLC and JPMorgan Chase Bank, N.A. | |
| 4.25 | ** | Notes Pledge and Security Agreement, dated May 20, 2016, by and among each of the grantors party thereto and JPMorgan Chase Bank, N.A. | |
| 4.26 | ** | Trademark Security Agreement, dated as of May 20, 2016, by and among the grantors party thereto and JPMorgan Chase Bank, N.A. | |
| 4.27 | ** | Copyright Security Agreement, dated as of May 20, 2016, by and among the grantors party thereto and JPMorgan Chase Bank, N.A. | |
| 4.28 | ** | Indenture, dated as of October 25, 2012 relating to Cequel Communications Holdings I, LLC's and Cequel Capital Corporation's 63/8% Senior Notes due 2020 | |
| 4.29 | ** | Indenture, dated as of May 16, 2013, relating to Cequel Communications Holdings I, LLC's and Cequel Capital Corporation's 51/8% Senior Notes due 2021 | |
| 4.30 | ** | Indenture, dated as of September 9, 2014, relating to Cequel Communications Holdings I, LLC's and Cequel Capital Corporation's 51/8% Senior Notes due 2021 | |
| 4.31 | ** | Indenture, dated as of June 12, 2015, relating to Cequel Communications Holdings I, LLC's and Cequel Capital Corporation's 73/4% Senior Notes due 2025 | |
| 4.32 | ** | Supplemental Indenture, dated as of December 21, 2015, to the Indenture, dated as of June 12, 2015, relating to Cequel Communications Holdings I, LLC's and Cequel Capital Corporation's 73/4% Senior Notes due 2025 | |
| 5.1 | ** | Opinion of Shearman & Sterling LLP | |
II-7
| Exhibit No. | Exhibit Description | ||
|---|---|---|---|
| 10.1 | ** | Credit Agreement, dated as of October 9, 2015, by and among CSC Holdings, LLC (as successor by merger to Neptune Finco Corp.), as borrower, certain lenders party thereto, JPMorgan Chase Bank, N.A., as administrative agent and security agent, Barclays Bank plc and BNP Paribas Securities Corp., as co-syndication agents, Credit Agricole Corporate and Investment Bank, Deutsche Bank Securities Inc., Royal Bank of Canada, Societe Generale, TD Securities (USA) LLC and the Bank of Nova Scotia, as co-documentation agents, and J.P. Morgan Securities LLC, Barclays Bank plc, BNP Paribas Securities Corp., Credit Agricole Corporate and Investment Bank, Deutsche Bank Securities Inc., Royal Bank of Canada, Societe Generale, TD Securities (USA) LLC and The Bank of Nova Scotia, as joint bookrunners and lead arrangers | |
| 10.2 | ** | First Amendment to Credit Agreement, dated as of June 20, 2016 | |
| 10.3 | ** | Incremental Loan Assumption Agreement, dated as of June 21, 2016 | |
| 10.4 | ** | Incremental Loan Assumption Agreement, dated as of July 21, 2016 | |
| 10.5 | ** | Second Amendment to Credit Agreement (Extension Amendment), dated as of September 9, 2016 | |
| 10.6 | ** | Third Amendment to Credit Agreement (Extension Amendment, Incremental Loan Assumption Agreement & Assignment and Acceptance), dated as of December 9, 2016 | |
| 10.7 | ** | Fourth Amendment to Credit Agreement (Incremental Loan Assumption Agreement & Refinancing Amendment), dated as of March 15, 2017 | |
| 10.8 | ** | Facility Guaranty, dated as of June 21, 2016, by and among the guarantors party thereto and JPMorgan Chase Bank, N.A. | |
| 10.9 | ** | Pledge Agreement, dated as of June 21, 2016, by and among CSC Holdings, LLC, certain pledgors party thereto and JPMorgan Chase Bank, N.A. | |
| 10.10 | ** | Credit Agreement, dated as of June 12, 2015, by and among Altice US Finance I Corporation, as borrower, certain lenders party thereto, JPMorgan Chase Bank, N.A., as administrative agent and security agent, and J.P. Morgan Securities LLC and BNP Paribas, as joint bookrunners and lead arrangers | |
| 10.11 | ** | First Amendment to Credit Agreement (Refinancing Amendment), dated as of October 25, 2016 | |
| 10.12 | ** | Second Amendment to Credit Agreement (Extension Amendment), dated as of December 9, 2016 | |
| 10.13 | ** | Third Amendment to Credit Agreement (Incremental Loan Assumption Agreement & Refinancing Amendment), dated as of March 15, 2017 | |
| 10.14 | ** | Loans Pledge and Security Agreement, dated as of December 21, 2015, by and between Cequel Communications Holdings II, LLC and JPMorgan Chase Bank, N.A. | |
| 10.15 | ** | Loans Pledge and Security Agreement, dated as of December 21, 2015, by and among the grantors party thereto and JPMorgan Chase Bank, N.A. | |
| 10.16 | ** | Facility Guaranty, dated as of December 21, 2015, by and among the guarantors party thereto and JPMorgan Chase Bank, N.A. | |
| 10.17 | ** | Trademark Security Agreement, dated as of December 21, 2015, by and among certain grantors thereunder and JPMorgan Chase Bank, N.A. | |
II-8
| Exhibit No. | Exhibit Description | ||
|---|---|---|---|
| 10.18 | ** | Copyright Security Agreement, dated as of December 21, 2015, by and between Cequel Communications, LLC and JPMorgan Chase Bank, N.A. | |
| 10.19 | ** | Form of Stockholders' Agreement by and among Altice USA, Inc., Altice N.V. and A4 S.A. | |
| 10.20 | ** | Altice USA 2017 Long Term Incentive Plan | |
| 10.21 | ** | Altice USA Short Term Incentive Compensation Plan | |
| 21.1 | ** | List of subsidiaries of the Registrant | |
| 23.1 | Consent of KPMG LLP | ||
| 23.2 | Consent of PricewaterhouseCoopers LLP | ||
| 23.3 | ** | Consent of Shearman & Sterling LLP (contained in its opinion filed as Exhibit 5.1 hereto) | |
| 24.1 | ** | Power of Attorney (contained in signature pages to this registration statement) | |
| 99.1 | ** | Rule 438 Consent of Michel Combes | |
| 99.2 | ** | Rule 438 Consent of Dennis Okhuijsen | |
| 99.3 | ** | Rule 438 Consent of Jérémie Bonnin | |
| 99.4 | ** | Rule 438 Consent of Raymond Svider | |
| 99.5 | ** | Rule 438 Consent of Mark Mullen | |
- **
- Previously
filed.
- †
- Shares of Class A common stock of the Company will be in an uncertificated form. Therefore, the Company is not filing a specimen Class A common stock certificate. Reference is made to Exhibits 3.1 and 3.2 hereto.
II-9