Attached files
UNITED STATES
SECURITIES AND EXCHANGE COMMISSION
WASHINGTON, D.C. 20549
FORM 10-K
ý | ANNUAL REPORT PURSUANT TO SECTION 13 OR 15(d) OF THE SECURITIES EXCHANGE ACT OF 1934 |
For the fiscal year ended April 1, 2017
OR
¨ | TRANSITION REPORT PURSUANT TO SECTION 13 OR 15(d) OF THE SECURITIES EXCHANGE ACT OF 1934 |
Commission File Number: 0-12853
ELECTRO SCIENTIFIC INDUSTRIES, INC.
(Exact name of registrant as specified in its charter)
Oregon | 93-0370304 | |
(State or other jurisdiction of incorporation or organization) | (I.R.S. Employer Identification No.) | |
13900 N.W. Science Park Drive, Portland, Oregon | 97229 | |
(Address of principal executive offices) | (Zip Code) | |
Registrant’s telephone number, including area code: 503-641-4141
Securities registered pursuant to Section 12(b) of the Act:
Title of each class | Name of each exchange on which registered | |
Common Stock, without par value | The NASDAQ Stock Market LLC | |
Securities registered pursuant to Section 12(g) of the Act: None
Indicate by check mark if the Registrant is a well-known seasoned issuer, as defined in Rule 405 of the Securities Act. Yes ¨ No ý
Indicate by check mark if the Registrant is not required to file reports pursuant Section 13 or Section 15(d) of the Act. Yes ¨ No ý
Indicate by check mark whether the Registrant (1) has filed all reports required to be filed by Section 13 or 15(d) of the Securities Exchange Act of 1934 during the preceding 12 months (or for such shorter period that the Registrant was required to file such reports), and (2) has been subject to such filing requirements for the past 90 days. Yes ý No ¨
Indicate by check mark whether the Registrant has submitted electronically and posted on its corporate Web site, if any, every Interactive Data File required to be submitted and posted pursuant to Rule 405 of Regulation S-T (§232.405 of this chapter) during the preceding 12 months (or for such shorter period that the Registrant was required to submit and post such files). Yes ý No ¨
Indicate by check mark if disclosure of delinquent filers pursuant to Item 405 of Regulation S-K (§229.405 of this chapter) is not contained herein, and will not be contained, to the best of Registrant’s knowledge, in definitive proxy or information statements incorporated by reference in Part III of this Form 10-K, or any amendment to this Form 10-K. ¨
Indicate by check mark whether the Registrant is a large accelerated filer, an accelerated filer, a non-accelerated filer, a smaller reporting company or an emerging growth company. See the definitions of “large accelerated filer”, “accelerated filer”, “smaller reporting company” and “emerging growth company” in Rule 12b-2 of the Exchange Act.
Large accelerated filer ¨ Accelerated filer ý Non-accelerated filer
¨ Smaller reporting company ¨ Emerging growth company ¨
If an emerging growth company, indicate by check mark if the registrant has elected not to use the extended transition period for complying with any new or revised financial accounting standards provided pursuant to Section 13(a) of the Exchange Act. ¨
Indicate by check mark whether the Registrant is a shell company (as defined in Rule 12b-2 of the Act). Yes ¨ No ý
The aggregate market value of the voting and non-voting common equity held by non-affiliates, computed by reference to the last sales price $5.64 as reported by the NASDAQ Stock Market, as of the last business day of the Registrant’s most recently completed second fiscal quarter October 1, 2016 was $185,926,091.
The number of shares outstanding of the Registrant’s Common Stock as of June 9, 2017 was 33,103,704 shares.
Documents Incorporated by Reference
The Registrant has incorporated into Part III of this Annual Report on Form 10-K, by reference, portions of its Proxy Statement for its 2017 Annual Meeting of Shareholders. The Registrant intends to file the Proxy Statement not later than 120 days after the end of the fiscal year covered by this Annual Report on Form 10-K.
ELECTRO SCIENTIFIC INDUSTRIES, INC.
2017 FORM 10-K ANNUAL REPORT
TABLE OF CONTENTS
Part I | ||
Part II | ||
Part III | ||
Part IV | ||
PART I
Forward-looking Statements
The statements contained in this report that are not statements of historical fact, including without limitation statements containing the words “believes”, “expects”, “projects”, “anticipates,” “plan,” “continue,” “will,” “may” and similar words, constitute forward-looking statements that are subject to a number of risks and uncertainties. Forward looking statements include any statements regarding anticipated sales, gross margins, our profitability in future periods, sources of our future revenue, the effect of new guidance on revenue recognition, our ability to complete our corporate restructuring and implement our new functional structure, future impairment of goodwill, our products’ ability to satisfy the needs of manufacturers, our relationships with suppliers and customers, trends that drive increases in applications for laser processing, the size and growth of our markets, our ability to leverage our differentiated capability in the market, overseas production capabilities, our ability to maintain and expand our core technologies and product applications, future payments of cash dividends and financing and working capital requirements and resources. From time to time, we may make other forward-looking statements. Investors are cautioned that such forward-looking statements involve estimates, assumptions, risks, and uncertainties and are subject to an inherent risk that actual results may differ materially. Factors that may cause or contribute to differences include those discussed below in Item 1A Risk Factors.
Item 1. Business
Fiscal Year
Our fiscal year consists of 52 or 53 week periods ending on the Saturday nearest March 31. Accordingly, our fiscal 2017 reporting period consisted of a 52-week period ending on April 1, 2017, our fiscal 2016 consisted of a 53-week period ending on April 2, 2016 and our fiscal 2015 reporting period consisted of a 52-week period ending on March 28, 2015. All references to years or quarters relate to fiscal years or fiscal quarters unless otherwise noted.
Business Overview
Electro Scientific Industries, Inc. and its subsidiaries (ESI, we, our, or the Company) is a leading supplier of innovative laser-based microfabrication solutions for industries reliant on microtechnologies. ESI's integrated solutions allow industrial designers and process engineers to control the power of laser light to transform materials in ways that differentiate their consumer electronics, wearable devices, semiconductor circuits and high-precision components for market advantage. Founded in 1944, ESI is headquartered in Portland, Oregon, with global operations and subsidiaries in Asia, Europe and North America.
Laser microfabrication is comprised of a set of precise micron-level processes, including drilling, scribing, dicing, singulation, cutting, ablating, trimming, and precision marking on multiple types of materials. These processes require application-specific laser systems that are able to meet our customers’ exacting performance and productivity requirements. Our laser-based systems are utilized in the production of flexible and rigid printed circuit boards (PCB), semiconductor devices, advanced semiconductor packaging, consumer electronics, electronic sensors, touch-panel glass, flat panel liquid crystal displays (LCDs), applications within the automotive, aerospace, medical and display end markets as well as other high value components and devices to enable functionality, increase performance and improve production yields.
Additionally, we produce high-capacity test and inspection equipment that is critical to the quality control process during the production of multilayer ceramic capacitors (MLCCs). Our equipment ensures that each component meets the electrical and physical tolerances required to perform properly.
In the second quarter of 2017, ESI acquired Visicon Technologies, Inc. (Visicon), which brings a portfolio of defect detection systems for the medical device and consumer electronics markets to ESI’s current product solutions.
Between the fourth quarter of 2015 and the third quarter of 2017, we operated in two segments, Component Processing and Micromachining. In the fourth quarter of 2017, based on the recommendation of our new CEO and in light of our efficiency and cost-saving efforts, the Company reorganized into a functional structure. As a result of this reorganization, we no longer have separate business units or separate general managers, and the CEO now allocates resources and evaluates performance on a company-wide basis. We now report as one segment. This single segment sells into a variety of end markets that we group into four major categories: 1) PCB, 2) Semiconductor, 3) Component Test, and 4) Industrial Machining. PCB includes Flex, high density interconnect (HDI), and packaging products targeting this market; Semiconductor includes all wafer-based products; Component Test includes our MLCC products and tooling; and Industrial Machining includes our machining and inspection tools that address a broader market including not just consumer electronics, but also automotive, aerospace, medical, and display end markets. See Note 25 "Product and Geographic Information" for further discussion.
3
Industry Overview
The PCB, semiconductor and other microelectronics industries are driven by demand for improved functionality in increasingly smaller and smarter consumer devices such as smart phones, tablets, wearable technologies, personal computers, mobile computing devices, video game systems and high-definition televisions. In addition to the consumer markets, semiconductor and other advanced technologies are being used in a broadening set of industrial markets and applications, including automotive, aerospace, medical and display.
These dynamics in turn are driving the microelectronics supply base for faster, smaller, more complex, less expensive and higher-quality electronic devices and sub-components. To achieve these improvements, manufacturers are forced to increase circuit densities and shrink feature geometries while increasing the interconnect flexibility. This drives our customer base to push the envelope in terms of materials, manufacturing processes, and topologies.
For example, smaller semiconductor devices are driving the need to shrink the physical dimensions of the semiconductor packages. As the physical dimensions of the package shrink, the ability to physically and electrically connect these devices becomes more challenging. The PCB manufacturers are forced to utilize new techniques such as HDI circuit boards on which connections are made. These HDI circuits require smaller, more accurate, and precisely tapered or shaped holes, known as vias, to create connections between layers and the interconnecting devices. In addition, integrated circuit (IC) designers are moving high level interconnect from the silicon die to the IC package (ICP) to reduce overall cost of the device as well as to improve overall signal integrity in the device. Another example of these trends are in the new display technologies which are driving the need for more complex flexible interconnect circuits. These trends require smaller, more accurate, and precisely tapered or shaped holes, known as vias, to create connections between layers and interconnecting devices. The continual trend toward smaller and smarter devices also requires the use of an increasing amount of flexible interconnect material between PCBs and other components. For example, new display technologies are driving the need for more complex flexible circuits.
In addition, new materials are being developed to help drive signal integrity improvements, temperature, and physical stability such as porous dielectrics and low-k films. We believe this trend may drive additional applications for laser processing, including scribing of next generation thin films.
Passive components, which do not utilize traditional semiconductor processing, are under the same pressure to improve performance while reducing size. This has resulted in an increase in the use of smaller passive components such as MLCCs. Manufacturers must test MLCCs electrically and optically to characterize performance and ensure reliability. Automated equipment to test these MLCCs in the manufacturing environment, like our high capacitance tester, can test and sort up to one million parts per hour on parts with dimensions as small as 0.4 by 0.2 millimeters.
Our business also includes specialized microfabrication applications. Many materials that can be cut, drilled, marked or joined using a mechanical process can be microfabricated with greater precision and accuracy using a laser-based solution. As consumer electronics and industrial products or devices become more compact, traditional mechanical processes will not be able to meet the stringent specifications demanded by producers. We believe the capabilities of laser-based solutions for microfabrication will enable our customers to continue to move beyond the limitations of mechanical processes and generate growth for us in the future.
Finally, the shrinkage in dimensions and requirement for accuracy in these processes and devices is increasing the need for micron-level inspection and defect detection as either a post-processing step or stand-alone measurement. During the year, we acquired Visicon, a technology leader in high accuracy and high throughput measurement and defect detection systems for the medical device and consumer electronic markets. We believe this technology is complementary to our core competencies, expands our presence in medical and potentially other industrial markets, and is highly leveraged to our existing products.
Our Solutions
We believe our products address the needs of PCB, semiconductor, and other micro-electronics and industrial manufacturers by providing them with a high return on their investment due to measurable production benefits such as lower cost of ownership, higher performance, continued miniaturization, greater reliability, and improved production yield.
Our core competencies enable us to design, manufacture, and market a variety of integrated laser-based solutions for microfabrication applications in high-volume manufacturing environments. These core competencies include a deep understanding of:
• | laser/material interaction; |
• | laser beam positioning; |
• | optics and illumination including image processing and optical character recognition; |
• | micron-level defect detection; |
4
• | high-speed motion control; |
• | small parts handling; |
• | proprietary laser technology including laser power control; and |
• | systems engineering. |
We combine this expertise with a thorough understanding of our customers’ processes and our manufacturing agility to respond rapidly to customer demand to develop and deliver integrated solutions and products that address multiple markets and applications.
Our customers manufacture components, interconnect/packaging devices, semiconductors, displays or other parts that serve a wide range of electronic applications. Our systems enable the manufacturing of these components and devices. The primary end-market applications for our customers are consumer electronics, including smart mobile devices such as smart phones and tablets, computers and semiconductors. These devices and applications are also utilized in a variety of other industries including automotive, aerospace, medical and display.
Our Strategy
Our strategy is to leverage our core competencies to be a cost of ownership leader in laser-based microfabrication for micro-technology industries, including PCB, semiconductor, microelectronics, and other industrial applications including automotive, aerospace, medical and display. These core competencies, combined with an understanding of our customers’ processes and the use of common platforms, enable us to address a broad range of laser-based applications and end markets within these industries. We intend to focus our efforts on businesses and applications where our differentiated capability enables us to be a market leader. The elements of our strategy are to (1) expand our addressable market by focusing on large, existing, near-adjacent applications in the growing laser-microfabrication market, (2) focus on areas where we have differentiated capability, (3) leverage proprietary laser technology to create competitive advantage, (4) strengthen marketing capability and broaden customer focus, (5) develop and leverage flexible platforms and technology for cost of ownership and time to market advantage in new applications and (6) lower breakeven point to increase earnings consistency over time.
Expand our addressable market by focusing on large, existing, near-adjacent applications in the growing laser microfabrication market
Growth in consumer electronics, smart phones, tablets, notebook computers and other smart devices is driving increased miniaturization and complexity of the underlying components and materials. These materials and components are being adopted in electronic devices, sensors, displays, and other technologies across many markets and industries. As a result, we believe there are many large, existing, near-adjacent opportunities for laser micromachining for both the devices themselves and components within them. Our strategy is to expand our addressable market in these near-adjacent applications where we can utilize our technology for a cost of ownership advantage for our customers. Our primary areas of focus are to defend and grow our presence in PCB and interconnect value-added laser processes, expand our industrial machining product and customer base beyond consumer electronics, and extend the reach of our existing product portfolio. For example, during 2017 we grew our position in flexible circuit manufacturing and introduced new products, capabilities, and price points with the introduction of our Lodestone and Redstone products. We continued to expand applications for Garnet, a flexible mid-range machining system targeted at broad industries beyond consumer electronics, such as defense, aerospace, and medical. We also acquired Visicon, which provides an established product set and customer relationships in the medical device industry. We believe our growth will be driven by overall growth in the market for electronic and other industrial devices, expanding the applications and customers we address, and growing our share in these adjacent markets.
Focus on markets where we can apply our differentiated capability
Following our reorganization this year, we have refocused our strategy to concentrate our efforts on markets where we can leverage our differentiated capability to provide high value to our customers. As a result, we will focus our investments on applications where laser machining adds more functional rather than purely aesthetic value. These capabilities can be applied to a broad set of industrial industries beyond consumer electronics including automotive, aerospace, medical and display. We believe this change is better aligned with our expertise and strengths and will help us better leverage our investments in resources and technology.
5
Leverage proprietary laser technology to create competitive advantage
ESI is a pioneer in laser-material interaction and has developed deep expertise in the use of multiple types of laser technology to develop customer solutions. We have invested in proprietary laser technology primarily through the acquisitions of Eolite Systems, and PyroPhotonics Lasers. The acquisition of Eolite provided us access to high power ultraviolet (UV) nanosecond and low-cost picosecond fiber lasers with a unique, scalable architecture. Combined with capability from our PyroPhotonics laser business, these lasers address multiple micromachining applications, including thin film processing, glass processing, material trimming, precision drilling, and organic and metal cutting. We intend to continue to utilize these lasers internally to provide differentiated capability and lower cost of ownership as well as provide potential additional commercial revenue for the Company. In 2017, we successfully ramped our Boreas laser, which provided key differentiation for our latest generation flexible drilling product, Gemstone. Our Boreas laser is our largest deployment of internally developed lasers for our own systems to date. Our strategy is to expand the utilization of these technologies to enable differentiated capability within our systems, lower cost, and generate incremental revenue and gross profit for the Company.
Strengthen marketing capability and broaden customer focus
The Company’s close collaboration with key customers who are leaders in their respective industries has enabled ESI to develop world-class technologies that meet the emerging needs of these demanding customers. Our strategy is to modify our approach to product development so we can meet needs across broader markets as opposed to a few key customers. We believe this new approach will enable our products to serve the needs of a far larger portion of the laser microfabrication market. Through our reorganization to a functional structure and recent hiring of Vice Presidents of Marketing and Sales & Service, we believe we will continue to strengthen our marketing capability and channel effectiveness.
Leverage flexible platforms and technology for cost of ownership and time to market advantage
Our key technological capabilities include laser-material interaction, laser beam positioning, optics and illumination, defect detection, high-speed motion control systems, small parts handling systems and systems integration. Our strategy is to incorporate these capabilities into a series of flexible platforms that have multiple common elements but are tailored to specific applications and to leverage our investment in these platforms to address multiple new applications and market opportunities. In addition, we believe that leveraging common platforms will increase efficiency in the Company through greater use of common parts, lower inventory requirements, shorter cycle times, and leveraged engineering investment across the Company. During 2016, we introduced several new platforms that with minimal modification can address a variety of laser micromachining applications.
Lower breakeven point to increase earnings consistency over time
Our business has historically been highly seasonal resulting in only short periods of profitability. As part of our reorganization plan, we intend to lower our cost structure and operating break-even point to improve overall profitability and increase consistency of earnings over time. As a result, we have closed our sites in Montreal, Canada; Napa, California; and Sunnyvale, California; initiated headcount reductions across all functions and geographies, begun to refocus and reprioritize our investments, and reorganized the Company into a functional, streamlined structure. In addition, we have made several changes to our executive management team. We believe the new functional structure will enable lower cost, increased accountability and improved decision-making capability. We expect this structure to largely be in place by the end of our second fiscal quarter of 2018.
Our Products
Printed Circuit Board
Our PCB products address multiple applications and materials on a broad set of substrates, panels, and continuous-feed reels primarily for the PCB and packaging industries. Our laser via drilling systems target electrical interconnect applications that require high accuracy and small via (hole) dimensions to create electrical connections between layers in flexible circuits, high-density circuit boards and IC packages. Our micro via drilling technology addresses the rapidly changing applications in IC packages, multichip modules and HDI circuit boards. Our UV laser processing systems employ state-of-the-art technology in lasers, optics and motion control. These products include single-beam and multi-beam systems that produce high-quality vias with the best-in-class placement accuracy for improved yield of packages and substrates.
These same technologies can be used to singulate individual PCBs (depaneling), rout copper openings on PCB material, precisely cut flexible circuit material, and mark individual packages or circuit boards.
6
Semiconductor
Our semiconductor manufacturing products address multiple applications that utilize laser energy to process materials on wafer-based substrates and semiconductor devices and packages. Applications include processing of silicon wafers, memory devices, mixed signal devices, hybrid circuits, sensors, and resistors.
The advent of 3D chip packaging technologies is driving the need for silicon wafers to become thinner in order to allow for stacking of wafers within the same packaging geometry. As wafers become thinner, they become more challenging to cut into discrete chips using traditional mechanical saws. During 2016 we introduced the UltrusTM platform that can scribe next-generation thin film materials that lend themselves to laser processing. As 3D technologies are developed, we believe the use of advanced laser technology will become increasingly important to productivity and performance.
Our semiconductor manufacturing products also include industry-leading wafer marking equipment, wafer and circuit trim tools, and LCD repair tools. Wafer marking equipment is used for serialization and wafer identification by both manufacturers of semiconductor wafers and within semiconductor factories. Wafer and circuit trim tools are laser systems that adjust the electrical performance of semiconductor devices or hybrid circuits by removing a precise amount of material from one or more circuit components. In addition, the Company continues to sell a limited number of memory yield improvement systems and related laser upgrades.
Our laser display repair systems are utilized to improve yields in the manufacture of flat panel displays. During production, individual pixels of a display may develop electrical defects that result in no light emission or the emission of only a steady white light. To correct these defects, flat panel display producers employ a laser repair process to isolate the electrical defects during production by cutting the inputs to the pixel. Our laser systems are primarily sold to the manufacturers of LCD and organic light emitting diode (OLED) repair tools as a key component of their products.
Component Test
Our component test products combine high-speed small parts handling technology with real-time control systems to provide highly automated, cost-effective inspection solutions for manufacturers of MLCCs and other passive components such as capacitor arrays, inductors, resistors, varistors and hybrid circuits. These components, produced in quantities of trillions of units per year, process analog, digital and high-frequency signals and are used extensively in nearly all electronic products. Our MLCC test systems employ high-speed handling and positioning techniques to precisely load, test and sort MLCCs based on their electrical energy storage capacity, or capacitance, and their electrical energy leakage, or dissipation factor. Our 35XX series is the most productive tester in the market today. Our latest AllegroTM model enables high-speed testing of the industry’s smallest metric 0402 capacitors used primarily in advanced cell phone and tablet designs. We also produce consumable products such as carrier plates and termination belts, both of which are used to hold MLCCs during the manufacturing and testing process.
Industrial Machining
Industrial machining products are comprised of laser systems that are used primarily by manufacturers of end devices across multiple industries to drill, cut or mark features on a variety of materials, generally on the casing or external surface of the end device. In addition, industrial machining products tend to serve markets that require fewer features, less stringent design requirements, and lower cost.
We offer several platforms that enable customers to perform precision drilling, scribing, cutting, etching, routing or marking on many different types of materials and devices including glass, metal, plastic, paint and ceramics. We also offer laser products for integration into customers' tools or processes that are useful for applications such as thin film processing, glass processing, material trimming, precision drilling, and organic and metal cutting.
In 2017, we acquired Visicon, a leading supplier of high-accuracy and high-throughput measurement and defect detection systems based in Napa, California. Visicon brings a strong portfolio of stand-alone defect detection systems for the medical device and consumer electronics markets. We believe this business provides complementary technology, expands our presence into the medical device market, and is highly leverageable into our consumer electronics customer base.
In addition, we offer laser ablation systems that ablate material for identification and analysis applications, including forensics, mineral analysis and research.
7
Customers
Our top ten customers for 2017, 2016 and 2015 accounted for approximately 47%, 51% and 40% of total net sales, respectively. Two customers, Sumitomo Corporation and Zhen Ding Technologies accounted for approximately 12% and 11%, respectively in 2017. One customer, Apple Inc. and its affiliates, accounted for approximately 15% in 2016. No single customer had more than 10% of net sales in 2015.
Sales, Marketing and Service
We sell our products worldwide through direct sales and service offices, value-added resellers and independent representatives located around the world. ESI has direct sales and service personnel in Oregon, California and several other states; China, Japan, Korea, Singapore and Taiwan in Asia; and France, Germany and the United Kingdom in Europe. We serve select customers in Asia, the Americas, Europe and additional countries through manufacturers’ representatives.
We have a substantial base of installed products in use by leading PCB, semiconductor, and microelectronics manufacturers. We emphasize strong working relationships with these customers to meet their needs for additional systems and to facilitate the successful development and sale of new products to these customers.
We generally employ service personnel wherever we have a significant installed base. We offer a variety of warranty, maintenance and parts replacement programs to support the requirements of our customers’ high-volume manufacturing environments.
Business Seasonality and Product Introductions
The Company has historically experienced higher net sales in the first half of the calendar year due in part to customers adding capacity in advance of seasonal holiday demand for electronic products. Additionally, new product introductions can significantly impact net sales, product costs and operating expenses. Neither historical seasonal patterns nor historical patterns of product introductions should be considered reliable indicators of the Company’s future pattern of product introductions, future net sales or financial performance.
Backlog
Backlog consists of purchase orders for products and spare parts that we expect to ship within the next 12 months and service contracts for performance generally within the next 24 months. Backlog does not include deferred system revenue. Backlog was $69.5 million at April 1, 2017 compared to $55.2 million at April 2, 2016, representing an increase of 26% primarily as a result of increased orders in the fourth quarter of 2017 compared to the fourth quarter of 2016. Our backlog is not necessarily indicative of sales for any specific future period, because of possible order cancellations or deferrals, shipping or acceptance delays, and backlog does not represent any assurance that we will realize a profit from filling the orders.
Research, Development and Technology
We believe that our ability to compete effectively and deliver customer solutions depends, in part, on our ability to maintain and expand our expertise in core technologies and product applications. Our primary core competencies and capabilities include:
• | laser/material interaction; |
• | laser beam positioning; |
• | optics and illumination including image processing and optical character recognition; |
• | micron-level defect detection; |
• | high-speed motion control; |
• | small parts handling; |
• | proprietary laser technology including laser power control; and |
• | systems engineering. |
We spend a considerable amount of our net sales proceeds to maintain and expand our expertise in core technologies and product applications. Our research and development expenditures for 2017, 2016 and 2015 were $31.7 million (20% of net sales), $32.4 million (18% of net sales) and $35.2 million (22% of net sales), respectively. We conduct our focused research and development efforts in our three-building complex in Portland, Oregon.
8
Competition
Our markets are dynamic, cyclical and highly competitive. The principal competitive factors in our markets are total cost of ownership, product performance, ease of use, reliability, service, technical support, product roadmap, price, proprietary technology, manufacturing responsiveness and relationships with customers. We believe that our products compete favorably with respect to these factors. Some of our competitors have greater financial, engineering and manufacturing resources and larger distribution networks than we do. Some of our customers or potential customers develop, or have the ability to develop, manufacturing equipment similar to our products. Competition in our markets may intensify and our technological advantages may be reduced or lost as a result of technological advances by competitors or customers or changes in electronic device processing technology.
Our PCB processing products primarily compete with laser systems provided by Via Mechanics, Ltd., EO Technics Co. Ltd., LPKF Laser & Electronics AG, Mitsubishi Electric Corporation, and Orbotech Ltd. Our semiconductor products primarily compete with InnoLas Systems GmbH and DISCO Corporation. Our component test products primarily compete with Laser Solutions, Inc., Quantel USA, Inc., HOYA Corporation, and Humo Laboratory Ltd. as well as component manufacturers that develop systems for internal use. Our industrial machining products primarily compete with laser systems provided by Han's Laser Technology Industry Group Co Ltd., HG Laser, and several Chinese and Korean companies who compete within their local markets. Our defect detection products primarily compete against providers of optical measuring machines such as Micro-Vu Corporation, OGP, and Werth, Inc., and systems integrators such as GDO and IMS Technology Services.
Manufacturing and Supply
Our primary production facilities are located in Singapore; Portland, Oregon; Klamath Falls, Oregon; and Wuhan, China. Our Singapore facility is our primary systems manufacturing facility and manufactures the vast majority of our systems and lasers. The Portland facility primarily provides advanced manufacturing and prototype capability. The Klamath Falls facility manufactures component test consumable products. The Wuhan facility is primarily used to manufacture our lower cost industrial machining products. Our Singapore and Wuhan operations are located in leased facilities. As we continue our efforts to streamline the organization and improve efficiencies, we expect a growing percentage of final systems will be shipped from Singapore and China.
We use qualified manufacturers to supply many components and sub-system modules for our products. Our systems use high-performance computers, peripherals, lasers and other components from various suppliers. Some of the components we use are obtained from a single source or a limited group of suppliers. An interruption in the supply of a particular component would have a temporary adverse impact on us. We believe our relationships with our suppliers are good.
Patents and Other Intellectual Property
We have a policy of seeking patents, when appropriate, on inventions relating to products and methods that are discovered or developed as part of our ongoing research, development and manufacturing activities. We owned 405 United States patents and 1,109 patents issued outside of the United States as of April 1, 2017. Additionally, as of April 1, 2017, we had 73 patent applications pending in the United States and 252 patent applications pending outside of the United States. Although our patents are important, we believe that the competitiveness of our products also depends on the technical competence and innovation of our employees.
We rely on copyright protection for our proprietary software. We also rely upon trade secret protection for our confidential and proprietary information. Others may independently develop substantially equivalent proprietary information and techniques, and we may be unable to meaningfully protect our trade secrets.
Employees
As of April 1, 2017, we employed 720 people of whom 683 were permanent and 37 were temporary. Many of our employees are highly skilled, and our success will depend in part upon our ability to attract and retain such employees, who are in great demand. We have never had a work stoppage or strike, and no employees are represented by a labor union or covered by a collective bargaining agreement. We consider our employee relations to be good.
Environmental Compliance
We do not expect compliance with international, federal, state and local provisions that have been enacted or adopted related to the discharge of materials into the environment or otherwise relating to protection of the environment to have a material effect on our capital expenditures, earnings or ability to compete in the marketplace.
9
Where You Can Find More Information
We file annual, quarterly and current reports, proxy statements and other information with the Securities and Exchange Commission (SEC) under the Securities Exchange Act of 1934 as amended (Exchange Act). You can inspect and copy our reports, proxy statements and other information filed with the SEC at the SEC’s Public Reference Room at 100 F Street, NE, Washington, D.C 20549. Please call the SEC at 1-800-SEC-0330 for further information on the Public Reference Room. The SEC maintains an Internet site at www.sec.gov where you can obtain most of our SEC filings. We also make available, free of charge on our website at www.esi.com, our annual report on Form 10-K, quarterly reports on Form 10-Q, current reports on Form 8-K, and amendments to those reports filed or furnished pursuant to Section 13(a) or 15(d) of the Exchange Act as soon as reasonably practicable after they are filed electronically with the SEC. The information found on our website is not part of this Form 10-K. You can also obtain copies of these reports by contacting Investor Relations at (503) 641-4141.
Item 1A. Risk Factors
The following risks and uncertainties should be read carefully with the other information included in this Annual Report. If any of the risks described below occur, our business, financial condition, operating results and cash flows could be materially and adversely affected. The risks and uncertainties described below are not the only ones we face. Additional risks and uncertainties not presently known to us or that we currently deem immaterial also may impair our business operations and financial results.
Risks Related to Our Competition and Customers
Volatility in our customers’ industries and capital spending can have a direct and material impact on our business.
Our business depends upon the capital equipment expenditures of manufacturers of microelectronics, PCB’s, semiconductors, computers, wireless communications and other electronic products. The capital equipment market for the production of those products has historically been characterized by cyclical variations in capital equipment supply and demand. These sometimes sudden and severe cycles may result from a number of factors, including overall consumer and industrial spending and demand for electronic products that drive manufacturer production, as well as their capacity utilization, timing of new product introductions and demand for customers’ products, inventory levels relative to demand and access to affordable capital. The timing, severity and duration of these market cycles are difficult to predict. As a result, our business can vary significantly from quarter to quarter or year to year.
Downturns particularly affect our profitability given the relative fixed cost structure of our business and the need to continually invest in product technology and support and service our products. For example, in the first and second quarters of fiscal 2017, we experienced a significant decline in orders due to reduced demand from PCB manufacturers that significantly impacted our results in the second and third fiscal quarters.
Our future success depends on our ability to expand into new markets.
Our future success depends in large part on our successful entry into new markets adjacent to our existing markets, such as high density interconnect, IC packaging, advanced wafer scribing, and other industrial and consumer electronics markets, including automotive, aerospace, medical and display. These markets are new to us and our success depends on our displacing entrenched competitors who are familiar with these markets and are known to customers. In many cases, we are attempting to enter or expand our presence in these new markets with newly introduced products that are not yet proven in the industry. In addition, in some cases we need to develop or expand our sales channels and customer relationships in order to execute on this strategy. We cannot provide assurance that we will succeed in gaining significant, or any, market share in these new markets. If we fail to successfully expand into these markets, we will have difficulty growing our business and may lose business to our competitors.
10
Substantial competition in markets in which we operate may result in price reductions, reduced profit margins and loss of market share.
We face substantial competition from established competitors throughout the world, some of which have greater financial, engineering, manufacturing and marketing resources than we do. Competitors with greater resources may better withstand periodic downturns, compete more effectively on the basis of price and technology, utilize better established sales channels and customer relationships, or more quickly enhance or develop new generations of products that compete with our products, in addition to other advantages. New companies may enter the markets in which we compete, or industry consolidation may occur, further increasing competition in those markets. We have also experienced new entrants to our markets offering aggressive price and payment terms in an attempt to gain market share. Some competitors, particularly in China, also develop low-cost products employing processes or technology developed by us. In addition, because we frequently price our products in U.S. dollars, a strong U.S. dollar can make our products less price-competitive outside of the United States to products priced in other currencies. We believe that to be competitive, we must continue to expend significant financial resources in order to invest in new product development and enhancements, among other things. We may not be able to compete successfully in the future and increased competition may result in price reductions, reduced profit margins and loss of market share.
Because our revenues largely depend on few customers, we have a greater degree of risk if we lose one of those customers or fail to win on new product cycles.
We depend on a few significant customers for a large portion of our revenues. In 2017, our top ten customers accounted for approximately 47% of total net sales. We anticipate that sales of our products to a relatively small number of customers will continue to account for a significant portion of our revenues. Consolidation between customers, changes in technologies or solutions used by customers, changes in products manufactured by customers or in end-user demand for those products, selection of suppliers other than us, customer bankruptcies or customer departures from their respective industries all may result in even fewer customers accounting for a high percentage of our revenue and reduced demand from any single major customer. Also, our level of sales to several of our top customers depends on our winning new designs and features each product cycle, and there is no guarantee of future business based on past design wins. Furthermore, none of our customers have any long-term obligation to continue to buy our products or services and may therefore delay, reduce or cease ordering our products or services at any time. The cancellation, reduction or deferral of purchases of our products by even a single customer could significantly reduce our revenues in any particular quarter. If we lose any of our significant customers or suffer a material reduction in their purchase orders, revenue could decline and our business, financial condition and results of operations could be materially and adversely affected.
Increased pressure on price may result in pricing concessions, extended payment terms and decreased margins.
We have experienced and continue to experience pricing pressure from both competitors and customers in the sale of our products. Pricing pressures typically have become more intense during cyclical downturns when competitors seek to maintain or increase market share, reduce inventory or introduce more technologically advanced or lower-cost products. In addition, we may agree to pricing concessions or extended payment terms with our customers in connection with expanding into new markets or gaining volume orders, or to improve our customer cost of ownership in highly competitive applications. Our business, financial condition, margins or results of operations may be materially and adversely affected by competitive pressure and price-based competition.
Because our revenues are largely based on the sale of a small quantity of product units, our operating results could fluctuate significantly from quarter to quarter.
We derive a substantial portion of our revenue from the sale of a relatively small quantity of products. Accordingly, our revenues, margins and other operating results could fluctuate significantly from quarter to quarter depending upon a variety of factors in addition to those described above, including:
• | the timing of orders and terms or acceptance of product shipments by our customers; |
• | the mix of products and services that we sell in a given quarter; |
• | timing and market acceptance of our new product introductions; and |
• | delays or problems in the planned introduction of new products, or in the performance of any such products following delivery to customers. |
As a result of these risks, we believe that quarter-to-quarter comparisons of our revenue and operating results may not be meaningful, and that these comparisons may not be an accurate indicator of our future performance.
11
Risks Related to Our Supply Chain and Production
Limitations on our ability to rapidly change our production capacity in a cost effective manner could result in lower gross margins during sudden downturns and an inability to meet demand in sudden upturns.
To meet rapid changes in demand, we must effectively manage our resources and production capacity. During periods of decreasing demand for our products, we must be able to appropriately align our cost structure with prevailing market conditions and effectively manage our supply chain. Our ability to timely and effectively reduce our costs in response to rapid downturns is limited by the fixed nature of many of our expenses in the near term, by our need to continue investing in product technology and support and service our products, and by our need to have sufficient production capacity and supply available to respond to sudden increases in demand. Conversely, when upturns occur, we may have difficulty rapidly and effectively increasing our manufacturing capacity or procuring sufficient materials to meet sudden increases in customer demand, which could result in the loss of business to our competitors and harm to our relationships with our customers. In addition, our manufacturing capability with Topwin in China has not been proven at the high volumes we anticipate for that facility. If we are not able to timely and cost effectively adapt to changes in our business environment, our business, financial condition or results of operations may be materially and adversely affected.
Our reliance on critical suppliers for key components could lead to production and service interruptions and shortages.
We use a wide range of components from numerous suppliers in the manufacture of our products, including custom electronic, laser, optical and mechanical components. We generally do not have guaranteed supply arrangements with our suppliers. We seek to reduce the risk of production and service interruptions and shortages of key parts by selecting and qualifying alternative suppliers for key parts, monitoring the financial stability of key suppliers and maintaining appropriate inventories of key parts. However, some key parts are available only from a single supplier or a limited group of suppliers in the short term. In addition, some of the lasers we use in our products are difficult to manufacture, and as a result we may not receive an adequate supply of lasers in a timely fashion to fill orders. Operations at our suppliers’ facilities are subject to disruption or discontinuation for a variety of reasons, including changes in business relationships, competition, financial difficulties, work stoppages, fire, natural disasters, customer prioritization or other causes. Any such disruption or discontinuation to our suppliers’ operations could interrupt or reduce our manufacturing activities and delay delivery of our products, any or all of which could materially and adversely affect our results of operations. This risk is particularly acute when we rely on a single or a limited group of suppliers. In addition, when markets recover from economic downturns, there is a heightened risk that one or more of our suppliers may not meet our increased demand requirements, adversely affecting our ability to fulfill orders and win business with our customers.
We may be unable to timely deliver certain products made by contract manufacturers.
We have arrangements with contract manufacturers to complete the manufacturing of certain of our product subcomponents. Any significant interruption in our contract manufacturers’ ability to provide quality manufacturing services to us as a result of contractual disputes with us or another party, labor disruptions, financial difficulties, natural disasters, delay or interruption in the receipt of inventory, or other causes could result in reduced manufacturing quality or delayed deliveries for certain of our products, any or all of which could materially and adversely affect our business. Additionally, should a contract manufacturer no longer be able to perform for any reason or we need to add a contract manufacturer, it may require substantial time and resources, including the potential of incurring substantial cost, to replace or add the associated manufacturing capabilities, which could materially and adversely affect our business.
We may incur charges for excess or obsolete inventory as a result of having to forecast product demand without firm orders.
To effectively compete, we must deliver products on schedules required by our customers. Management forecasts demand, both in type and amount of products, for us to timely meet customer delivery schedules. We use these forecasts to purchase inventory in advance of our receiving firm customer orders. We also order materials based on our technology roadmap, which represents management’s assessment of technology we will utilize in new product developments. Certain types of inventory, such as lasers and optical equipment, are particularly expensive and may only be used in the production of a single type of product. If actual demand is lower than forecast, we may have excessive working capital and slow-turning inventory. In addition, we may incur material charges for excess and obsolete inventory if we cannot sell the inventory. Also, if we alter our technology or product development strategy, we may have unusable inventory, which may also result in material accounting charges. For example, during 2017, we recorded approximately $1.7 million of charges in cost of sales for inventory written off associated with discontinued products.
12
Increasing regulations or environmental requirements on our product components could negatively affect our ability to sell our products or source materials.
Many countries, including the United States, China and those in the European Union, have implemented directives that restrict the sale of new electrical and electronic equipment containing certain hazardous substances and require disclosures if certain metals used in products are not from a conflict-free source. The directives could restrict our ability to sell our products in certain countries and affect sourcing at competitive prices and availability in sufficient quantities of certain minerals used in the manufacture of our products. In addition, our reputation could suffer if we are required to disclose that metals in our products are not from conflict-free sources.
Risks Related to Our Organization
Our significant international trade subjects us to greater risks.
International shipments accounted for 90% of net shipments in 2017, with 84% of our net shipments to customers in Asia. We expect that international shipments will continue to represent a significant percentage of net sales in the future. In addition, we obtain supplies through an international supply chain. Our non-U.S. sales and purchases are subject to risks inherent in international trade, many of which are outside our control and include the following:
• | periodic local or geographic economic downturns; |
• | price and currency exchange controls; |
• | fluctuation in the relative values of currencies; |
• | difficulty in repatriating money, whether as a result of tax laws or otherwise; |
• | difficulties protecting intellectual property; |
• | shipping delays and disruptions, including as a result of border controls; |
• | changes in trading policies, regulatory requirements, tariffs and other barriers, or the termination or renegotiation of existing trade agreements; and |
• | difficulties in managing a global enterprise, including staffing, collecting accounts receivable, and managing suppliers, distributors and representatives. |
Our success could be negatively impacted if we fail to effectively control, oversee and direct foreign subsidiaries and their operations.
We have significant foreign operations and subsidiaries, including manufacturing facilities in Singapore and China, research and application development facilities in Canada, France, China and Korea, and sales and service offices in various countries. Under our globalization strategy, we intend to increase our foreign operations in the future. Operating in multiple countries requires us to understand and comply with many different laws, infrastructures, ways of doing business, cultural customs and language. We are also more exposed to local labor disputes, potential corruption, and noncompliance with labor laws and other laws governing employees. Additionally, the human resources and the systems our foreign entities use can be vastly different. Having substantial international operations also increases the complexity of managing our financial reporting and internal controls and procedures, and effective communications across time zones. If we are unable to manage these risks effectively, it could negatively affect our operating performance and our reputation.
The complications associated with the implementation and modification of our globalization strategy may result in a substantial amount of management effort, cost and uncertainty.
We continue to implement and expand our globalization strategy, in which we are moving certain operational resources and capabilities to countries in Asia. As part of this strategy, we opened a manufacturing facility in Singapore in 2010, which is now our primary system manufacturing facility. We also acquired Topwin, a Chinese manufacturer of laser-based systems, in January 2015. In 2016, we opened an applications development center in Korea in order to increase responsiveness and access to local customers.
Our globalization strategy subjects us to a variety of complexities and risks, many of which may divert a substantial amount of management’s time. These risks include:
• | designing facilities we can scale for future expansion, replicating current processes and bringing new facilities up to full operation; |
• | unpredictable costs, redundancy costs and cost overruns for developing facilities and acquiring equipment; |
• | building local management teams, technical personnel and other staff for functions that we have not previously conducted outside of the United States; |
• | technical obstacles such as poor production or process yield and loss of quality control during the ramp of a new facility; |
• | re-qualifications and other procedures that our customers may require; |
13
• | our ability to bring up local suppliers to meet our quality and cycle-time needs; |
• | our ability to reduce costs in the United States; |
• | rapidly changing business conditions that may require us to change or abandon plans before we fully implement them; and |
• | challenges posed by distance and differences in language and culture. |
These and other factors could delay the continuing development, expansion and implementation of our strategy, as well as decrease our gross margins, delay shipments and deliveries, cause us to lose sales, require us to write off investments already made, damage our reputation and harm our business, financial condition and results of operations. If we decide to change our globalization strategy, we may incur charges for certain costs incurred. For example, the Company announced restructuring plans in 2015 and 2017 that led to the impairment of associated leasehold improvements and other assets for several of our facilities. The estimated future liability associated with these lease commitments was accrued net of estimated sublease rental income. However, to the extent the property is vacated or payments are not made by the sublessee, the Company will incur the full amounts of the ongoing lease obligation.
Our global operations expose us to a greater variety of natural disasters and political and social strife, each of which could directly impact our properties, operations and personnel.
Our business and operating results could be impacted, directly or indirectly, by natural disasters, outbreaks of infectious disease, military action, international conflicts, terrorist activities, civil unrest and associated political instability and policy changes. Many of our facilities, including our Portland, Oregon headquarters, are in areas with known earthquake risk. Some of these events or circumstances may also result in heightened security concerns with respect to domestic and international travel and commerce, which may further affect our business and operating results. In particular, we are subject to the following additional risks:
• | recent and potential future tightening of immigration and travel controls may adversely affect the residence status of non-U.S. engineers and other key technical employees in our U.S. facilities, our ability to attract, hire and retain new non-U.S. employees in such facilities or our ability to bring our non-U.S. employees into the United States for business related activities; |
• | more frequent instances of shipping delays; and |
• | our customers or suppliers may experience financial difficulties or cease operations. |
Our acquisition activities could result in operational disruptions, integration difficulties and other complications.
We may acquire or make significant investments in other businesses with complementary products, services or technologies, such as our January 2015 acquisition of Topwin and our August 2016 acquisition of Visicon Technologies, Inc. Acquisitions involve numerous risks, many of which are unpredictable and beyond our control, including:
• | increased costs in connection with integration of personnel, operations, technologies and products of the acquired businesses; |
• | difficulties in implementation of our enterprise resource planning (ERP) system into the acquired company’s operations; |
• | diversion of management’s attention from other operational matters; |
• | the potential loss of key employees of the acquired company; |
• | lack of synergy or inability to realize expected synergies resulting from the acquisition; |
• | the inability to successfully enter new markets expected to result from the acquisition; |
• | acquired assets becoming impaired as a result of technological advancements or worse-than-expected performance by the acquired company; |
• | establishing satisfactory internal controls and accounting practices at the acquired company; |
• | difficulties implementing internal manufacturing processes at the acquired company; |
• | achieving our anticipated financial and operational performance for the acquired company or the performance of the combined company following the transaction; and |
• | acquiring unanticipated liabilities for which we will not be indemnified. |
Furthermore, the accounting for an acquisition could result in significant charges resulting from amortization or write-off of intangible assets and goodwill we acquire. Our inability to effectively manage these risks or lower levels of revenue, profitability or cash flows for acquired businesses and assets could result in our inability to realize the anticipated benefits of an acquisition on a timely basis, or at all, and materially and adversely affect our business, financial condition and results of operations. In addition, all acquisition transaction costs must be expensed as incurred rather than capitalized, which may have a material adverse effect on our results of operations.
14
The means by which we finance an acquisition may also significantly affect our business or the value of our common stock. If we issue common stock to pay for an acquisition, the ownership percentage of our existing shareholders will be diluted and the value of the shares held by our existing shareholders could decrease. If we use cash on hand to pay for an acquisition, the payment could significantly reduce the cash that would be available to fund our operations or to use for other purposes. If we borrow funds in connection with an acquisition, we would be required to use cash to service the debt and to comply with financial and other covenants, which may reduce our flexibility.
Our business and reputation could be negatively impacted by cyber-attacks and other security breaches.
We electronically store sensitive data, including intellectual property, and our customers’ suppliers’ and business partners’ proprietary business information, and our employees’ personally identifiable information. The secure maintenance and transmission of this information is critical to our operations and business strategy. Despite our security measures, our information technology and infrastructure may be vulnerable to attacks by hackers or breached due to employee error, malfeasance or other actions. Any such breach could compromise our networks and the information stored there could be accessed, publicly disclosed, lost or stolen. Any such access, disclosure or other loss of information could result in legal claims or proceedings, liability under laws that protect the privacy of personal information, disrupt our operations and damage our reputation, which could adversely affect our business, revenues and competitive position.
Our success depends, in part, on hiring and retaining key personnel.
Our continued success depends in part upon the services of our key managerial, financial and technical personnel. The loss of key personnel, or our inability to attract, assimilate and retain qualified personnel, could result in the loss of customers, inhibit our ability to operate and grow our business and otherwise have a material adverse effect on our business and results of operations. We have previously had to, and may in the future have to, impose salary reductions on employees during economic downturns in an effort to maintain our financial position. On several occasions in recent years executives and other employees have received limited or no annual bonuses due to our financial performance relative to the performance parameters in our annual bonus plans. These events may have an adverse effect on employee loyalty and may make it more difficult for us to attract and retain key personnel. Competition for qualified personnel in the industries and locations in which we compete for talent is intense, and we may not be successful in attracting and retaining qualified personnel. We may incur significant costs in our efforts to recruit and retain key personnel, which could affect our financial position and results of operations.
In February 2016, we announced a reorganization and restructuring of the Company, which resulted in site closures in Montreal, Canada, Napa and Sunnyvale, California, and reductions in headcount in all functions and geographies. Additionally, we replaced key executives. These events may adversely disrupt operating activities, may negatively affect employee morale and loyalty, and may make it more difficult to retain or rehire key personnel.
Risks Related to Technology
We may be unable to keep up with rapid technological changes in our markets, which could result in customers purchasing less of our products.
The markets for our products are characterized by rapid technological change and innovation, frequent new product introductions, changes in customer requirements and evolving industry standards. Our future performance will depend on the successful development, introduction and market acceptance of new and enhanced products that address technological changes and the requirements of current and potential customers. The development of new, technologically advanced products is a complex and uncertain process, requiring high levels of innovation and highly skilled engineering and development personnel, as well as the accurate anticipation of technological and market trends. We may not be able to identify, develop, manufacture, market or support new or enhanced products on a timely basis, if at all. If our competitors introduce new or enhanced products, or alternative technologies, our customers may defer, change or cancel orders for our existing products or cease purchasing our products altogether. Further, our new products may not gain timely market acceptance, and we may not be able to respond effectively to product announcements by competitors, technology changes or emerging industry standards. If we are unable to develop new or enhanced products to address customer requirements, technology changes or new industry standards on a timely basis, if our new or enhanced products are not accepted by the market, or if our customers adopt alternative technologies, our business, financial condition and results of operations may be adversely affected due to loss of market share or due to concentrations in impacted areas.
15
Our industry requires continued investment in research and development, and we may fail to optimally allocate our resources in this area.
The intense competition in our industry requires us to continue to invest in research and development. If we fail to invest sufficiently in research and development, our products could become obsolete or less attractive to our current and potential customers. Because of our need to maintain our research and development spending levels, our operating margins could be materially decreased if our net sales decline. In addition, our emphasis on research and development and technological innovation could cause our operating costs to increase in the future, and research and development expenses to increase as a percentage of total operating expenses and as a percentage of net sales.
We may be unable to realize growth opportunities if we cannot strengthen our marketing and channel capabilities.
The laser microfabrication industry is comprised of broad sets of markets and applications and presents significant opportunities for growth. In order to access these growth opportunities, we are strengthening our approach from customer-centric to market-based. We have reorganized into a functional structure and hired a new Vice President of Marketing to drive improved process and disciplines across the organization. We believe our ability to successfully access and compete in these broader markets partially depends on our successful development of new marketing capabilities, sales and distribution channel access and customer relationships. Our inability to do so would limit our growth opportunities and profitability. In addition, any new strategy may cause disruption and ultimately prove unsuccessful.
Because our products are highly complex, we may experience quality control issues that could result in decreased sales and harm our reputation.
Our products are highly complex, and our extensive product development, manufacturing and testing processes may not be adequate to detect all defects, errors, failures and quality issues that could impact customer satisfaction or result in claims against us. Our strategy to leverage proprietary laser technology to create competitive advantage may increase the probability and impact of this risks. As a result, we may have to replace certain components or provide remediation in response to the discovery of defects in products after they are shipped. The occurrence of any defects, errors, failures or quality issues could result in cancellation of orders, product returns, diversion of our resources, legal actions by our customers and other losses to us or to our customers. These occurrences could also result in the loss of, or delay in, market acceptance of our products, loss of sales and increased expenses and warranty costs.
Risks Related to Legal Matters
Our business depends on proprietary rights that may be difficult to protect, and the loss of any proprietary rights could affect our ability to compete effectively.
Our success depends significantly upon the protection of our proprietary rights. We attempt to protect our proprietary rights through patents, copyrights, trademarks, maintenance of trade secrets and other measures, including entering into confidentiality agreements. Although we incur substantial costs to obtain and maintain patents and to defend our intellectual property rights, we may be unsuccessful in protecting these rights. Additionally, our proprietary rights may not provide the competitive advantages we expect, or other parties may challenge, invalidate or circumvent these rights.
We rely upon the laws of the United States and foreign countries where we develop, manufacture or sell our products to protect our proprietary rights. However, our efforts to protect our intellectual property may be less effective in some foreign countries where intellectual property rights are not as well protected as in the United States. For example, the patent prosecution and enforcement system within China is less mature than the systems in other jurisdictions and therefore we may be limited in our ability to enforce our rights. This disadvantage would likely be compounded by the challenge of any enforcement attempts by us as a foreign entity seeking protection against a Chinese company infringing on our proprietary rights in China. If we fail to adequately protect our intellectual property abroad, it could be easier for our competitors to sell competing products in foreign countries, which could result in reduced sales and gross margins.
Our products may subject us to intellectual property infringement claims that could increase our costs and restrict our ability to do business.
Several of our competitors hold patents covering a variety of technologies, applications and methods of use similar to some of those used in our products. Competitors or others have asserted in the past, and may assert in the future, infringement claims against our customers or us with respect to current or future products or uses. These assertions may result in costly litigation, and if claims of infringement are asserted against our customers, those customers may seek indemnification from us for damages or expenses they incur.
16
If we become subject to infringement claims, we will evaluate our position and consider the available alternatives, which may include seeking licenses to use the technology in question. These licenses, however, may not be available on satisfactory terms or at all. If we are not able to negotiate the necessary licenses on commercially reasonable terms, or successfully defend our position, our financial condition and results of operations could be materially and adversely affected.
As a global company, we are subject to adverse fluctuations in our effective taxes due to tax audits, changes in tax law, and certain preferential tax concessions.
Our tax liabilities may fluctuate from one period to the next because we operate in numerous tax jurisdictions with a broad range of income tax rates and regulations. Further, we are also periodically under audit by United States and foreign tax authorities and may have exposure to additional tax liabilities as a result. Although we believe our tax estimates are reasonable, the final outcome of tax audits and the impact of changes in tax laws or the interpretation of tax laws could result in material differences from what is reflected in historical income tax accruals. If additional taxes are assessed as a result of an examination, a material effect on our financial results, tax positions or cash flows could occur in the period or periods in which the determination is made.
Although many have remaining lives between 5 and 20 years, we have a number of tax losses and tax credits that are limited and subject to expiration. Due to a history of losses, we have recorded a valuation allowance against these items. Changes in statutory rates could impact any potential future realizable value associated with these attributes.
We benefit from a tax incentive program in Singapore pursuant to which we paid no Singapore income tax with respect to our manufacturing income. The initial incentive period ended on June 30, 2016 and we applied for and received a 5-year extension of the incentive program through June 2021 of its Singapore Pioneer incentive. The incentive is conditioned on achieving certain business and investment levels. If we do not achieve these criteria, we may lose the incentive benefits.
Risks Related to Financial Matters
If we cannot meet our liquidity needs, we may not have sufficient working capital to continue our business operations.
We may require greater working capital to operate than similar size businesses in many other industries. At April 1, 2017, we had working capital of $116 million, including $62 million in cash and short-term investments. Our operating cash flows were negative for most quarters since September 2013 through March 2017. If we have continued decreases in cash, increases in production levels, an increase in slow-moving or obsolete inventory, or a combination of these circumstances, among others, we may need additional working capital for receivables and inventory. In addition, most of our contracts to acquire inventory represent purchase commitments. As a result, if we experience lower than anticipated demand for our products, in many cases we could not avoid the cost of purchasing the associated inventory.
We have made an election to permanently reinvest foreign earnings related to manufacturing operations in Singapore and China. While there is no intent to do so, should these funds be required to be repatriated, a tax liability related to these earnings may be incurred, which could be significant.
While we have a credit facility in place, if we fail to meet the covenants in our credit facility or our lenders fail to fund, access to the facility may be limited or the facility may become unavailable altogether. Losses, such as those experienced in the second and third quarters of 2017, negatively impact our ability to maintain compliance with these covenants.
We have initiated restructuring activities, and as a result we have incurred and will continue to incur costs, some of which require cash outlays. To the extent actual costs exceed estimated costs, liquidity and results of operations could be materially and adversely affected.
If we have a material decrease in working capital, or require additional working capital to operate or require additional liquidity, and we do not have available credit or other funds and are unable to obtain financing on acceptable terms, or at all, our business and our ability to fully fund operations could be materially and adversely affected.
17
Our existing indebtedness may limit our business opportunities.
In the fourth quarter of 2017, we incurred $14.0 million of long-term indebtedness. This indebtedness is secured by our headquarters in Portland, Oregon. We also have a credit facility under which we may borrow up to a maximum of $30 million, subject to meeting certain availability requirements. This credit facility is secured by our non-real estate assets and nothing was outstanding under this agreement at June 1, 2017. We are required to comply with certain financial covenants under the debt agreements, including maintaining a certain level of earnings, a stated debt service coverage ratio and a specified level of certain types of liquid assets, as well as limiting our discretion to make capital expenditures or acquisitions. If we are unable to comply with the covenants in our debt agreements or make payments when due and the lender declares an event of default, the outstanding indebtedness would likely be immediately due and owing and the lenders could foreclose upon the collateral securing the debt.
Unfavorable currency exchange rate fluctuations could reduce our net sales abroad or cause us to incur losses on our forward exchange contracts.
Unfavorable currency fluctuations could require us to increase prices to foreign customers, which could result in lower net sales by us to those customers. Alternatively, if we do not adjust the prices for our products in response to unfavorable currency fluctuations, we could be forced to sell our products at a lower margin or at a net loss. In addition, some of our foreign sales are denominated in the currency of the country in which these products are sold and that currency could be less valuable at the time of receipt as a result of exchange rate fluctuations. From time to time, we enter into forward exchange contracts to hedge the value of accounts receivable primarily denominated in euros and other currencies. However, our efforts may not be adequate to protect us against significant currency fluctuations and such efforts may expose us to additional exchange rate risks, which could adversely affect our results of operations.
Our earnings may decline if we write off goodwill, intangible, and long-lived assets.
We held a total of $6.6 million in acquired intangible assets, net of accumulated amortization, and $3.0 million in goodwill at April 1, 2017. Consistent with the impairment recognized in the fourth quarter of 2017, events may occur or circumstances change such that the carrying value is not recoverable or it becomes more likely than not that the fair value of long-lived assets is reduced below the carrying value of the reporting unit, which could result in a further write-down of the fair-value of our assets. For example, the performance of our Topwin reporting unit did not meet expectations and, as a result, an impairment of goodwill and intangibles associated with that reporting unit was triggered in 2017, impacting consolidated earnings.
In addition, certain of our long-lived assets such as leasehold improvements, machinery, equipment, and loan and demo assets may experience impairment as a result of events such as the closure of sites, introduction of new products, decisions to exit certain products or markets, and changes in technology or changes in customer demand patterns. We depreciate long-lived assets and amortize intangible assets at levels we believe are adequate; however, an impairment of these assets could have a material adverse impact on our business, financial condition and results of operations. For example, due to the 2017 restructuring action, we impaired $1.4 million of leasehold improvements and related assets, impacting consolidated earnings.
An impairment of our investments could reduce our available liquidity.
Our investment portfolio is primarily comprised of commercial paper, debt securities issued by U.S. governmental agencies and money market securities. These investments are intended to be highly liquid and low risk. If the markets for these securities deteriorated for any reason, including as a result of a downgrade in the credit rating of U.S. government securities, the liquidity and value of these investments could be negatively affected, which could result in impairment charges and a material impact to our financial condition and results of operations. In addition, if our investments become illiquid or materially decrease in value, we may not have access to sufficient cash to meet or working capital and liquidity needs.
If we fail to maintain an effective system of internal controls, we may not be able to accurately report our financial results or prevent fraud and our stock price may be adversely affected.
Effective internal controls are necessary for us to provide reliable financial reports and effectively prevent fraud. If we cannot provide reliable financial reports or prevent fraud, our operating results could be harmed.
18
For example, in connection with our 2015 audit, we identified material weaknesses in our internal control over financial reporting related to the accounting and disclosure of complex, judgmental accounting matters and non-routine transactions. The matters involving internal controls and procedures that our management considered to be material weaknesses included the risk assessment, certain process and review level controls associated with complex and non-routine transactions affecting goodwill, disclosures related to acquisitions, disclosures related to operating segments, and presentation of service revenue and associated cost of sales on the statements of operations. Management believes that it identified and implemented additional controls that remediated these material weaknesses by the end of 2016. The requirements of Section 404 of the Sarbanes-Oxley Act are ongoing and also apply to future years. We expect that our internal control over financial reporting will continue to evolve as our business develops. Although we are committed to continue to improve our internal control processes and we will continue to diligently and vigorously review our internal control over financial reporting in order to ensure compliance with the Section 404 requirements, any control system, regardless of how well designed, operated and evaluated, can provide only reasonable, not absolute, assurance that its objectives will be met. Therefore, we cannot be certain that in the future additional material weaknesses or significant deficiencies will not exist or otherwise be discovered. If such weaknesses or deficiencies occur, they could result in misstatements of our results of operations, additional restatements of our consolidated financial statements, a decline in our stock price and investor confidence, or other material effects on our business, reputation, financial condition or liquidity.
Item 1B. Unresolved Staff Comments
None.
Item 2. Properties
Our executive and administrative headquarters, which houses our primary engineering and marketing functions, advanced manufacturing capability for new products, and manufacturing of select legacy products are located in a three-building complex with 197,838 square feet of space on 10.15 acres in Portland, Oregon. Additionally, our component test consumables are manufactured at a 53,000 square-foot plant on 31 acres in Klamath Falls, Oregon. We own all of these buildings. We believe the productive capacity of these facilities to be adequate and suitable for the requirements of our business for the foreseeable future.
Our primary system manufacturing facilities are located in leased facilities in Singapore. We lease approximately 26,000 square feet of facilities in Singapore where we manufacture the majority of our systems. We also lease an approximately 23,000 square foot facility in Sunnyvale, California that was historically used primarily for engineering, marketing and as a demonstration center for our microfabrication systems; however, these activities are being transitioned to our Portland facilities and are in the process of closing this site. During the year, we transitioned our Wuhan, China activities, primarily manufacturing, from an approximately 25,000 square-foot facility to an approximately 30,000 square-foot facility. Additionally, we lease other office and facility space in various locations throughout the United States and various foreign countries.
We lease approximately 32,500 square feet of facilities in Chelmsford, Massachusetts that have been used primarily for engineering and manufacture of our semiconductor systems products. However, as a part of the Company’s 2015 plan to streamline its manufacturing and development activities, the Company transitioned the manufacturing and development activities to other U.S. facilities during 2016. In the third quarter of 2016, we entered into a sublease for this property and the associated rental income partially offsets the Company's ongoing lease obligation.
Item 3. Legal Proceedings
In the ordinary course of business, we are involved in various legal matters, either asserted or unasserted, and investigations. In the opinion of management, ultimate resolution of these matters will not have a material effect on our consolidated financial position, results of operations or cash flows.
Item 4. Mine Safety Disclosures
Not Applicable.
19
PART II
Item 5. Market for Registrant’s Common Equity, Related Shareholder Matters and Issuer Purchases of Equity Securities
Common Stock Prices and Dividends
Our common stock trades on the NASDAQ Stock Market under the symbol ESIO. There were approximately 450 shareholders of record as of June 9, 2017, and on that date there were 33,103,704 common shares outstanding. The closing price on June 9, 2017 was $8.73 per share.
The following table shows the highest and lowest intraday sales prices for our common stock as reported on the NASDAQ Stock Market for the fiscal quarters indicated:
Fiscal 2017 | High | Low | |
Quarter 1 | $7.56 | $5.72 | |
Quarter 2 | 7.03 | 4.74 | |
Quarter 3 | 6.57 | 4.50 | |
Quarter 4 | 7.17 | 5.80 | |
Fiscal 2016 | High | Low | |
Quarter 1 | $6.30 | $5.26 | |
Quarter 2 | 5.67 | 4.09 | |
Quarter 3 | 5.46 | 4.36 | |
Quarter 4 | 7.44 | 4.87 | |
We have not paid any cash dividends on our common stock during the last two fiscal years. The Company currently intends to use earnings to invest in the growth of business, therefore we do not anticipate paying cash dividends in the foreseeable future.
Share Repurchase Program
In December 2011, the Board of Directors authorized a share repurchase program totaling $20.0 million to acquire shares of our outstanding common stock. The repurchases are to be made at management’s discretion in the open market or in privately negotiated transactions in compliance with applicable securities laws and other legal requirements and are subject to market conditions, share price and other factors.
The Company did not repurchase any shares during 2017 or 2016. In 2015, the Company repurchased 207,738 shares for $1.5 million under this authorization at an average price of $7.01 per share, calculated inclusive of commissions and fees. Cash used to settle repurchase transactions is reflected as a component of cash used in financing activities on the Consolidated Statements of Cash Flows. There is no fixed term for the repurchase program and $18.3 million still remains for future repurchases.
20
Stock Performance Graph
The graph below compares the cumulative 60-month total return to holders of Electro Scientific Industries, Inc. common stock with the cumulative total returns of the S&P 500 Index, S&P Information Technology Index, and Russell 2000 Index for the same period. The Russell 2000 Index has been added to our comparison as a replacement to the S&P 500 Index as we believe that the former is more representative of the Company's expected performance. Both indexes are included in the below graph for the transition period, going forward the S&P 500 Index will not be included in our comparison. The graph assumes that the value of the investment in ESI common stock and in each of the indices (including reinvestment of dividends) was $100.00 on March 31, 2012 and tracks it through April 1, 2017.
Historical stock price performance should not be relied upon as indicative of future stock price performance.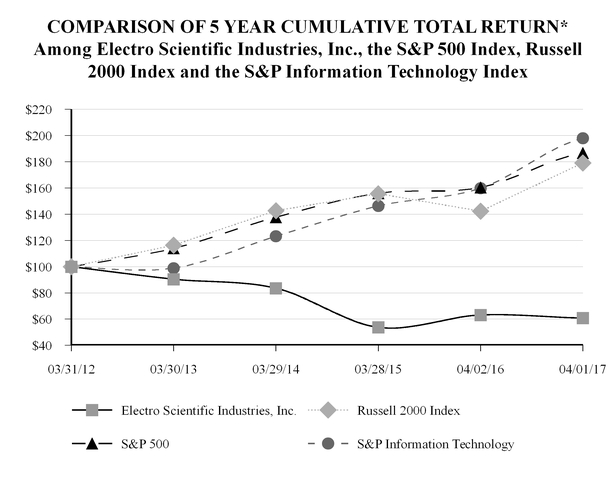
*$100 invested on 3/31/2012 in stock or 3/31/2012 in index, including reinvestment of dividends.
Indexes calculated on month-end basis.
Indexes calculated on month-end basis.
Cumulative Total Return | |||||||||||||||||
March 31, 2012 | March 30, 2013 | March 29, 2014 | March 28, 2015 | April 2, 2016 | April 1, 2017 | ||||||||||||
Electro Scientific Industries, Inc. | 100.00 | 90.46 | 83.54 | 53.79 | 63.13 | 60.86 | |||||||||||
Russell 2000 Index1 | 100.00 | 116.30 | 142.63 | 155.62 | 142.31 | 179.03 | |||||||||||
S&P 5002 | 100.00 | 113.96 | 137.77 | 156.00 | 160.35 | 186.71 | |||||||||||
S&P Information Technology Index2 | 100.00 | 98.88 | 123.16 | 146.31 | 159.86 | 197.98 | |||||||||||
1. Copyright © 2017 Russell Investments. All rights reserved.
2. Copyright © 2017 Standard and Poor's, a division of McGraw Hill Financial. All rights reserved.
21
Item 6. Selected Financial Data
(In thousands, except per share data) | 2017(1) | 2016(2) | 2015(3) | 2014(4) | 2013(5) | ||||||||||||||
Statement of Operations Data | |||||||||||||||||||
Net sales | $ | 161,023 | $ | 184,391 | $ | 159,118 | $ | 181,167 | $ | 216,625 | |||||||||
(Benefit from) provision for income taxes (6) | (23 | ) | (16 | ) | 234 | (92 | ) | 39,851 | |||||||||||
Net loss | (37,409 | ) | (12,257 | ) | (43,811 | ) | (38,334 | ) | (54,716 | ) | |||||||||
Net loss per share—basic and diluted | (1.15 | ) | (0.39 | ) | (1.43 | ) | (1.28 | ) | (1.86 | ) | |||||||||
Cash dividends paid per outstanding common share (7) | — | — | 0.24 | 0.32 | 2.32 | ||||||||||||||
Balance Sheet Data | |||||||||||||||||||
Cash and cash equivalents, restricted cash, short-term investments and auction rate securities | $ | 63,475 | $ | 57,665 | $ | 57,606 | $ | 106,905 | $ | 145,057 | |||||||||
Working capital | 115,603 | 126,658 | 124,593 | 164,835 | 194,406 | ||||||||||||||
Net property, plant and equipment | 21,619 | 24,543 | 25,858 | 27,930 | 27,894 | ||||||||||||||
Total assets | 224,745 | 220,100 | 221,240 | 270,209 | 322,208 | ||||||||||||||
Shareholders’ equity | 144,531 | 170,031 | 177,321 | 222,881 | 264,142 | ||||||||||||||
1. | Fiscal 2017 net loss included restructuring and impairments costs of $18.4 million, comprising primarily a non-cash goodwill impairment charge of $7.4 million to write down the fair value of Topwin acquisition goodwill, $2.3 million for intangible write-off related to Topwin acquisition and $8.6 million for restructuring costs related to 2017 corporate restructuring actions. Restructuring charges primarily consisted of $1.7 million of inventory write-off charges to cost of sales and $6.9 million of operating expenses for employee severance, leasehold improvements write-off and other facility costs. Fiscal 2017 also included $6.4 million of share-based compensation expense and, $2.2 million of purchase accounting amortization, which included compensation expense related to the purchase of Topwin (See Note 6 "Business Acquisitions" for discussion of compensation consideration related to the acquisition). |
2. | Fiscal 2016 operating expenses included $2.8 million for restructuring costs, which primarily consisted $1.4 million each of employee severance costs and charges for asset write-off and related items. Fiscal 2016 cost of sales included $ 1.4 million for inventory write-offs and $0.4 million of intangible write-offs related to discontinued products. Fiscal 2016 also included $4.2 million of charges for share-based compensation expense and $2.4 million of charges for purchase accounting amortization, which included $1.4 million for amortization of acquired intangible assets and $1.0 million of compensation expense related to the purchase of Topwin. |
3. | Fiscal 2015 included non-cash goodwill impairment charge of $7.9 million to write down the goodwill to its implied fair value as of March 28, 2015, $3.0 million for restructuring costs for the Chelmsford facility closure, which primarily consisted of $2.0 million for employee severance and related costs and $1.0 million for inventory write-offs. Fiscal 2015 also included $4.5 million of charges for share-based compensation expense, $4.3 million for impairment of a minority investment, $1.5 million for amortization of acquired intangible assets and a $0.6 million gain on liquidation of a foreign subsidiary. The Company also paid $9.0 million in cash for the Topwin acquisition during fiscal 2015. |
4. | Fiscal 2014 included $1.1 million for restructuring costs, which primarily consisted of $0.8 million charge towards obligations for our outgoing Chief Executive Officer and $0.2 million of charges related to asset write-offs. Fiscal 2014 also included $12.8 million of charges in cost of sales for inventory write-offs, $9.7 million for impairment of a minority equity investment, $6.1 million for share-based compensation expense, $2.9 million for amortization of acquired intangible assets, including $0.3 million of accelerated amortization, $1.3 million for net gain on sale of property and equipment, $0.6 million of accelerated depreciation on assets that will no longer be utilized and a $0.5 million of gain on acquisition of a semiconductor systems business. |
5. | Fiscal 2013 included $2.6 million for restructuring costs, which primarily consisted of $1.5 million of employee severance costs and $1.1 million of charges related to asset write-offs. Fiscal 2013 also included $21.0 million of charges in cost of sales for inventory write-offs, $8.1 million for share-based compensation expense, $4.8 million for amortization of acquired intangible assets, including $2.3 million of accelerated amortization, $1.2 million for net gain on sale of property and equipment, and a $15.3 million benefit for net legal settlement proceeds. |
6. | Fiscal 2013 included a charge of $46.9 million to increase the valuation allowance on deferred tax assets. |
7. | The Company paid cash dividends of $7.3 million, $9.6 million and $68.1 million during 2015, 2014 and 2013, respectively. No cash dividends were paid during 2017 or 2016. |
22
Item 7. Management’s Discussion and Analysis of Financial Condition and Results of Operations
Overview of Business
Electro Scientific Industries, Inc. and its subsidiaries (ESI, we, our, or the Company) is a leading supplier of innovative laser-based microfabrication solutions for industries reliant on microtechnologies. ESI's integrated solutions allow industrial designers and process engineers to control the power of laser light to transform materials in ways that differentiate their consumer electronics, wearable devices, semiconductor circuits and high-precision components for market advantage. Founded in 1944, ESI is headquartered in Portland, Oregon, with global operations and subsidiaries in Asia, Europe and North America.
Laser microfabrication is comprised of a set of precise micron-level processes, including drilling, scribing, dicing, singulation, cutting, ablating, trimming, and precision marking on multiple types of materials. These processes require application-specific laser systems that are able to meet our customers’ exacting performance and productivity requirements. Our laser-based systems are utilized in the production of flexible and rigid printed circuit boards (PCB), semiconductor devices, advanced semiconductor packaging, consumer electronics, electronic sensors, touch-panel glass, flat panel liquid crystal displays (LCDs), applications within the automotive, aerospace, medical and display end markets as well as other high value components and devices to enable functionality, increase performance and improve production yields.
Additionally, we produce high-capacity test and inspection equipment that is critical to the quality control process during the production of multilayer ceramic capacitors (MLCCs). Our equipment ensures that each component meets the electrical and physical tolerances required to perform properly.
Between the fourth quarter of 2015 and the third quarter of 2017, we operated in two segments, Component Processing and Micromachining. In the fourth quarter of 2017, based on the recommendation of our new CEO and in light of our efficiency and cost-saving efforts, the Company reorganized into a functional structure. As a result of this reorganization, we no longer have separate business units or separate general managers, and the CEO now allocates resources and evaluates performance on a company-wide basis. We now report as one segment. This single segment sells into a variety of end markets that we group into four major categories: 1) PCB, 2) Semiconductor, 3) Component Test, and 4) Industrial Machining. PCB includes Flex, high density interconnect (HDI), and packaging products targeting this market; Semiconductor includes all wafer-based products; Component Test includes our MLCC products and tooling; and Industrial Machining includes our machining and inspection tools that address a broader market including not just consumer electronics, but also automotive, aerospace, medical, and display end markets. See Note 25 "Product and Geographic Information" for further discussion.
Overview of Financial Results
Our fiscal year consists of 52 or 53 week periods ending on the Saturday nearest March 31. Accordingly, our fiscal 2017 reporting period consisted of a 52-week period ending on April 1, 2017, our fiscal 2016 reporting period consisted of a 53-week period ending on April 2, 2016 and our fiscal 2015 reporting period consisted of a 52-week period ending on March 28, 2015. All references to years or quarters relate to fiscal years or fiscal quarters unless otherwise noted.
Fiscal year and fourth quarter highlights:
• | 2017 bookings down $16.9 million, or 8%, from 2016, primarily on lower industrial machining and flex orders, however we ended the year with sequential quarter and year over year improvement in all of our markets; PCB, Semiconductor, Component Test, and Industrial Machining |
• | 2017 revenues down $23.4 million, or 13%, from 2016 on lower overall orders, and a $14.4 million increase in backlog |
• | 2017 gross margins down to 38.2% from 39.4% in 2016, primarily on lower revenues and 2017 impairment charges on previously acquired technology |
• | 2017 operating expenses up $14.0 million from 2016, primarily on impairment charges for goodwill, restructuring expenses, and incremental costs from the acquisition of Visicon; approximately $9.4 million of which was non-cash |
• | 2017 loss per share of $1.15 per share compared to $0.39 in 2016 |
• | 2017 operating cash usage was minimal at $0.8 million despite net losses, driven by non-cash charges and working capital improvements |
• | Secured $14 million, 10-year debt collateralized by our corporate facilities |
• | Renegotiated and extended our $30 million line of credit by one year to March of 2019 |
• | Initiated significant restructuring activity in the fourth quarter 2017, expected to be largely completed by end of first quarter 2018 |
23
In 2017, our business was significantly impacted by a pause in capacity purchases in our second and third quarters in our flex drilling market, and by slow adoption of our new products. Our flex market and overall business levels began to recover late in the third quarter and our order levels in the fourth quarter were at their highest in over five years driven by higher capacity purchases and new technologies. This pattern underscored the historical seasonal pattern in our business that has resulted in only short periods of profitability. As a result, in the fourth quarter of 2017 we initiated restructuring activities, which are expected to lower our cost structure and operating break-even point to improve overall profitability and increase consistency of earnings over time. We closed our sites in Montreal, Canada; Napa, California; and Sunnyvale, California; initiated headcount reductions across all functions and geographies, have begun to refocus and re-prioritize our investments, and have reorganized the company into a functional, streamlined structure. In addition, we have made several changes to our executive management team. We believe the new structure will enable lower cost, increased accountability and improved decision-making capability by re-balancing our cost structure to focus on areas of highest return. In conjunction with our change in focus, and as a result of lower than expected performance, we also impaired goodwill and intangible assets associated with our Topwin acquisition.
In the fourth quarter of 2017, we recorded a total of $18.4 million in charges related to the above mentioned restructuring activities and other impairments. Included in those charges are $8.3 million in restructuring costs, $7.4 million of goodwill and $2.3 million in intangible assets associated with Topwin. Approximately $13 million of these costs is non-cash activity. Looking forward, we expect an additional $4.0 to $6.5 million in restructuring costs, comprising primarily of non-cash charges related to assets as we re-prioritize our product portfolio and areas of investment. We expect the restructuring will result in reduced expenses by the end of the second quarter 2018, and a total annualized savings of $10 to $12 million.
Results of Operations
The following table presents results of operations data as a percentage of net sales for the years ended April 1, 2017, April 2, 2016 and March 28, 2015:
2017 | 2016 | 2015 | ||||||
Net sales: | 100.0 | % | 100.0 | % | 100.0 | % | ||
Cost of sales: | 61.8 | 60.6 | 65.6 | |||||
Gross profit | 38.2 | 39.4 | 34.4 | |||||
Selling, general and administration | 33.0 | 27.1 | 31.0 | |||||
Research, development and engineering | 19.7 | 17.6 | 22.1 | |||||
Restructuring costs | 4.3 | 1.5 | 1.3 | |||||
Impairment of goodwill | 4.6 | — | 5.0 | |||||
Operating loss | (23.4 | ) | (6.8 | ) | (25.0 | ) | ||
Other-than-temporary impairment of cost method investments | — | — | (2.7 | ) | ||||
Interest and other income, net | 0.2 | 0.1 | 0.3 | |||||
Loss before income taxes | (23.2 | ) | (6.7 | ) | (27.4 | ) | ||
(Benefit from) provision for income taxes | 0.1 | 0.1 | 0.1 | |||||
Net loss | (23.2 | )% | (6.6 | )% | (27.5 | )% | ||
Fiscal Year Ended April 1, 2017 Compared to Fiscal Year Ended April 2, 2016
Net Sales
In the fourth quarter of 2017, the Company transitioned from a multiple reportable segment structure to a single reportable segment. The following table presents net sales information by the four major market categories addressed by our single segment:
2017 | 2016 | ||||||||||||
(In thousands, except percentages) | Net Sales | % of Net Sales | Net Sales | % of Net Sales | |||||||||
Printed Circuit Board | $ | 88,771 | 55.1 | % | $ | 94,121 | 51.0 | % | |||||
Component Test | 22,381 | 13.9 | 19,901 | 10.8 | |||||||||
Semiconductor | 29,557 | 18.4 | 38,262 | 20.8 | |||||||||
Industrial Machining | 20,314 | 12.6 | 32,107 | 17.4 | |||||||||
Net Sales | $ | 161,023 | 100.0 | % | $ | 184,391 | 100.0 | % | |||||
24
Net sales for 2017 decreased $23.4 million or 12.7% from net sales for 2016.
PCB sales for 2017 decreased $5.4 million or 5.7% compared to 2016. This was primarily driven by decreases in flex via drilling system sales impacted by seasonality in the first half of the year and lower service sales.
Sales of products into the component test markets for 2017 increased $2.5 million or 12.5% compared to 2016, primarily driven by increased demand in the second half of the year due to stronger consumer electronics capacity buying.
Sales of products into semiconductor applications for 2017 decreased $8.7 million or 22.8% compared to 2016. This decrease was primarily driven by lower sales of legacy memory repair systems in 2017 compared to relatively strong demand in 2016 and a related decrease in service and laser spare sales, partially offset by increased laser sales into the LCD repair market.
Sales of products into industrial machining (IM) applications for 2017 decreased $11.8 million or 36.7% compared to 2016. This was primarily due to a $15 million decrease in sales of micromachining systems due to the project oriented nature of these markets and recent design wins have been modest in size compared to some sizable design wins in 2016. This decrease was partially offset by incremental system sales related to our Visicon acquisition and increased sales of lasers used in industrial machining applications.
The following table presents net sales information by geographic region:
2017 | 2016 | ||||||||||||
(In thousands, except percentages) | Net Sales | % of Net Sales | Net Sales | % of Net Sales | |||||||||
Asia | $ | 134,394 | 83.5 | % | $ | 152,259 | 82.6 | % | |||||
Americas | 16,378 | 10.2 | 21,206 | 11.5 | |||||||||
Europe | 10,251 | 6.4 | 10,926 | 5.9 | |||||||||
Net Sales | $ | 161,023 | 100.0 | % | $ | 184,391 | 100.0 | % | |||||
In 2017, net sales to Asia decreased by $17.9 million compared to 2016 primarily due to lower industrial machining system sales and lower service sales. These were partially offset by an increase in MLCC test systems and flex via drilling sales into China and southeast Asia.
Net sales to Americas decreased by $4.8 million primarily due to lower flex via drilling sales compared to 2016.
Europe sales remained flat, with semiconductor, flex via drilling and service as the major sources of sales.
Gross Profit
2017 | 2016 | ||||||||||||
(In thousands, except percentages) | Gross Profit | % of Sales | Gross Profit | % of Sales | |||||||||
Gross Profit | $ | 61,466 | 38.2 | % | $ | 72,703 | 39.4 | % | |||||
Gross profit was $61.5 million in 2017 compared to $72.7 million in 2016. Overall gross profit decreased primarily due to lower net sales and production volumes, and higher inventory write-off and intangible impairment charges.
Gross margin decreased to 38.2% in 2017 compared to 39.4% in 2016. The decrease in gross margin was primarily due to unfavorable absorption of fixed costs due to lower production volume and impairments of inventory and intangibles associated with Topwin (see Note 12."Acquired Intangible Assets" for further discussion). These decreases were partially offset by favorable mix with a higher proportion of relatively higher margin legacy memory repair products in 2016 and lower warranty costs.
25
Operating Expenses
2017 | 2016 | ||||||||||||
(In thousands, except percentages) | Expense | % of Net Sales | Expense | % of Net Sales | |||||||||
Selling, general and administration | $ | 52,698 | 33.0 | % | $ | 49,753 | 27.1 | % | |||||
Research, development and engineering | 31,719 | 19.7 | 32,400 | 17.6 | |||||||||
Impairment of goodwill | 7,445 | 4.6 | — | — | |||||||||
Restructuring costs | 6,935 | 4.3 | 2,824 | 1.5 | |||||||||
Acquisition and integration costs | 366 | 0.2 | 194 | 0.1 | |||||||||
Operating expenses | $ | 99,163 | 61.6 | % | $ | 85,171 | 46.2 | % | |||||
Selling, general and administration
Selling, general and administration (SG&A) expenses primarily consist of labor and other employee-related expenses including share-based compensation expense, travel expenses, professional fees, sales commissions and facilities costs. SG&A expenses for 2017 increased $2.9 million compared to 2016. This increase is comprised primarily of a $2.2 million increase in share based compensation expense and approximately $2.0 million increase in labor costs due to operating expenses related to the Visicon acquisition. The increase in share-based compensation expense was primarily due to higher overall grants in 2017, primarily relating to the CEO transition and changes in the executive team, compounded by higher grant date fair value in 2017 compared to 2016. These increases were partially offset by a $1.2 million decrease in consulting and travel expenses stemming from tighter management of discretionary spending.
Research, Development and Engineering
Research, development and engineering (RD&E) expenses are primarily comprised of labor and other employee-related expenses, professional fees, project materials, equipment and facilities costs. RD&E expenses for 2017 decreased $0.7 million compared to 2016. This decrease was primarily driven by a $1.2 million decrease in product material spending and consulting costs, as some of the new product platforms moved to production in 2017. Offsetting these decreases was a $0.4 million increase in labor and related costs due to the Visicon acquisition.
Impairment of goodwill
In 2017 all of the goodwill related to the Topwin acquisition was determined to be impaired. The impairment of goodwill was driven primarily by historical and projected financial performance lower than expectations and results of comparable companies, indicating a decline in value of the reporting unit. The value of the reporting unit was further negatively impacted by the re-evaluation of our product portfolio in connection with recently announced restructuring plans. This review resulted in the Company prioritizing away from some of the lower-cost systems that we planned for manufacturing at Topwin.
Restructuring Costs
2017
In the fourth quarter of 2017, we initiated a restructuring plan to improve business effectiveness and streamline operations and achieving a stated target profit level for the Company as a whole. As a part of the restructuring plan, the management team has been reorganized from a business unit to a functional structure; we closed facilities in Montreal, Canada; Napa, California; and Sunnyvale, California; we discontinued certain products; and we made select reductions in headcount across the Company. We expect the actions under this plan to be largely completed by the end of June 2017, except facilities charges which may extend beyond that time.
Restructuring costs of $6.9 million incurred in 2017 consisted of $6.3 million in charges for the 2017 restructuring event described above and $0.6 million related to previously announced plans for Chelmsford and Beijing site closures. The changes in workforce upon implementing the new functional organization structure resulted in $3.7 million of employee severance and related benefits. Our product-related decisions in the fourth quarter of 2017 and execution of site closures resulted in $1.4 million in asset write-offs and $0.9 million of expense related to lease obligations. See Note 26."Restructuring and Cost Management Plans" for further discussion.
26
2016
Restructuring costs for 2016 were $2.8 million, primarily related to the Chelmsford facility closure. In 2015, as a part of our plan to streamline manufacturing and development activities, the Company initiated a restructuring plan to close our assembly plant and development center located in Chelmsford, Massachusetts. Restructuring costs incurred in 2016 primarily related to $1.7 million of employee severance and related benefits, and $1.1 million of charges related to asset write-offs and net remaining lease obligations due to the closure of the Chelmsford, Massachusetts manufacturing plant in the third quarter of 2016. Accrued expenses related to the lease obligations will be carried until the end of the lease term in December 2019.
Share-Based Compensation
Operating expenses include $5.9 million and $3.8 million of share-based compensation expense for 2017 and 2016, respectively. The increase in share-based compensation expense was primarily due to higher overall grants in 2017, primarily relating to the CEO transition and changes in the executive team, compounded by higher grant date fair value in 2017 compared to 2016.
Non-operating Income and Expense, net
2017 | 2016 | ||||||||||||
(In thousands, except percentages) | Interest and Other Income, net | % of Net Sales | Interest and Other Income, net | % of Net Sales | |||||||||
Interest and other income, net | $ | 265 | 0.2 | % | $ | 195 | 0.1 | % | |||||
Total non-operating (expense) income | $ | 265 | 0.2 | % | $ | 195 | 0.1 | % | |||||
Interest and Other Income (Expense), net
Interest and other income (expense), net, consists of interest income and expense, market gains and losses on assets held in employees’ deferred compensation accounts, realized and unrealized foreign exchange gains and losses, bank charges, investment management fees, and other miscellaneous non-operating items. Interest and other income, net, was $0.3 million in 2017 compared to $0.2 million in 2016. This change was primarily attributable to a $0.2 million increase from settlement of Topwin acquisition escrow in 2017.
Income Taxes
2017 | 2016 | ||||||||||||
(In thousands, except percentages) | Income Tax Benefit | Effective Tax Rate | Income Tax Benefit | Effective Tax Rate | |||||||||
(Benefit from) Provision for income taxes | $ | (23 | ) | 0.1 | % | $ | (16 | ) | 0.1 | % | |||
The benefit from income taxes for 2017 was $23 thousand on a pretax loss of $37.4 million, an effective tax rate of 0.1%. For 2016, the benefit from income taxes was $16 thousand on a pretax loss of $12.3 million, an effective rate of 0.1%. The provision for income taxes is lower than the statutory rate primarily due to pre-tax losses and the valuation allowance currently maintained against net deferred tax assets. The majority of the income tax paid relates to foreign jurisdictions offset recognition of previously unrecognized tax benefits due to expiration of status of limitation and finalization of tax examinations in 2017. Our effective tax rate is subject to fluctuation based upon the mix of income and relative tax rates between jurisdictions, and the occurrence and timing of numerous discrete events such as changes in tax laws or their interpretations, extensions or expirations of research and experimentation credits, closure of tax years subject to examination, finalization of income tax returns, the relationship of fixed deductions to overall changes in estimated and actual pretax income or loss and the tax jurisdictions where income or loss is generated. Based on currently available information, we are not aware of any further discrete events which are likely to occur that would have a material effect on our financial position, expected cash flows or results of operations.
27
Fiscal Year Ended April 2, 2016 Compared to Fiscal Year Ended March 28, 2015
Net Sales
The following table presents net sales information by the four major market categories addressed by our single segment:
2016 | 2015 | ||||||||||||
(In thousands, except percentages) | Net Sales | % of Net Sales | Net Sales | % of Net Sales | |||||||||
Printed Circuit Board | $ | 94,121 | 51.0 | % | $ | 66,913 | 42.1 | % | |||||
Component Test | 19,901 | 10.8 | 19,099 | 12.0 | |||||||||
Semiconductor | 38,262 | 20.8 | 38,586 | 24.2 | |||||||||
Industrial Machining | 32,107 | 17.4 | 34,520 | 21.7 | |||||||||
Net Sales | $ | 184,391 | 100.0 | % | $ | 159,118 | 100.0 | % | |||||
Net sales for 2016 increased $25.3 million or 15.9% from net sales for 2015.
PCB sales for 2016 increased $27.2 million or 40.7% compared to 2015. The increase in PCB sales was primarily driven by higher demand for our flex via drilling products, in particular our new Gemstone system, and increased service sales.
Component test sales for 2016 increased $0.8 million or 4.2% compared to 2015. The increase was primarily driven due to modest reduction in backlog year over year for our component test systems.
Semiconductor sales for 2016 decreased $0.3 million or 0.8% compared to 2015. This decrease was primarily driven by $12.9 million decrease in sales of circuit trim, wafer trim and service activity, mostly offset by $10.0 million increase in sales of our legacy memory repair systems and $1.7 million from the initial sale of our Ultrus advanced scribing system.
IM sales for 2016 decreased $2.4 million or 7.0% compared to 2015, primarily as a result of lower service revenues and declines in our laser ablation products. This was however, partially offset by increased sales of our new Lumen series platform and the addition of Topwin.
The following table presents net sales information by geographic region:
2016 | 2015 | ||||||||||||
(In thousands, except percentages) | Net Sales | % of Net Sales | Net Sales | % of Net Sales | |||||||||
Asia | $ | 152,259 | 82.6 | % | $ | 124,049 | 78.0 | % | |||||
Americas | 21,206 | 11.5 | 18,067 | 11.4 | |||||||||
Europe | 10,926 | 5.9 | 17,002 | 10.7 | |||||||||
Net sales | $ | 184,391 | 100.0 | % | $ | 159,118 | 100.0 | % | |||||
In 2016, net sales to Asia increased by $28.2 million primarily due to higher shipments of flex via drilling systems into China and southeast Asia. Net sales to Americas increased by $3.1 million primarily due to the shipment of our new Ultrus advanced scribing system. Europe sales decreased by $6.1 million primarily due to decreased wafer and circuit trim sales, and lower laser ablation sales.
Gross Profit
2016 | 2015 | ||||||||||||
(In thousands, except percentages) | Gross Profit | % of Sales | Gross Profit | % of Sales | |||||||||
Gross profit | $ | 72,703 | 39.4 | % | $ | 54,681 | 34.4 | % | |||||
Gross profit was $72.7 million in 2016 compared to $54.7 million in 2015. Overall gross profit increased due to overall increases in production and sales volumes and lower manufacturing costs as we consolidated facilities and made lean improvements. These improvements were partially offset by higher warranty costs, and impairments of inventory and an intangible associated with discontinued products.
Gross margin increased to 39.4% in 2016 compared to 34.4% in 2015. The increase in gross margin was primarily due to favorable absorption of fixed costs due to higher production volume, decreased manufacturing costs, and favorable mix with a higher proportion of flex via drilling products, partially offset by higher warranty costs, and impairments of inventory and an intangible associated with discontinued products.
28
Operating Expenses
2016 | 2015 | ||||||||||||
(In thousands, except percentages) | Expense | % of Net Sales | Expense | % of Net Sales | |||||||||
Selling, general and administration | $ | 49,753 | 27.1 | % | $ | 48,525 | 31.0 | % | |||||
Research, development and engineering | 32,400 | 17.6 | 35,166 | 22.1 | |||||||||
Impairment of goodwill | — | — | 7,889 | 5.0 | |||||||||
Restructuring costs | 2,824 | 1.5 | 2,069 | 1.3 | |||||||||
Acquisition and integration costs | 194 | 0.1 | 776 | 0.5 | |||||||||
Operating expenses | $ | 85,171 | 46.2 | % | $ | 94,425 | 59.3 | % | |||||
Selling, general and administration
SG&A expenses primarily consist of labor and other employee-related expenses including share-based compensation expense, travel expenses, professional fees, sales commissions and facilities costs. SG&A expenses for 2016 increased $1.2 million compared to 2015. This increase was primarily attributable to increases in variable pay of approximately $1.0 million driven by improved attainment of incentive targets and $0.7 million increases related to increased travel, marketing and commissions costs due to higher business volumes. Share-based compensation increased $0.2 million and consisted of $0.9 million of expense related to business acquisition offset by $0.7 million of lower share-based compensation expense due to lower stock price on grant dates and increased forfeitures during the year. Offsetting the above were $0.9 million in labor and related savings due to the cost reduction initiatives and other savings from process efficiencies.
Research, Development and Engineering
RD&E expenses are primarily comprised of labor and other employee-related expenses, professional fees, project materials, equipment and facilities costs. RD&E expenses for 2016 decreased $2.8 million compared to 2015. This decrease was primarily due to lower labor, share-based compensation and related costs of $2.2 million due to the restructuring activities, lower expenses for patent legal fees of $0.4 million, and a decrease of $0.3 million in depreciation. These decreases were partially offset by increased variable pay costs of $0.4 million driven by improved attainment of incentive targets.
Impairment of goodwill
The annual review of goodwill for 2016 was performed with no impairment indicated.
In the fourth quarter of 2015 we realigned our products into two segments as a result of changes in our go-to-market strategies, common customer characteristics, and information utilized to manage our business. This reorganization required the Company to reassign its reported goodwill to its new reporting units based on the relative fair value of the respective reporting units. In performance of the annual review of goodwill for the newly formed reporting units, we determined that the carrying value of the component processing and micromachining reporting units exceeded their fair value, and hence we recorded an impairment charge of $7.9 million in the fourth quarter of 2015.
Restructuring Costs
In 2015, as a part of the Company’s plan to streamline its manufacturing and development activities, the Company initiated a restructuring plan to close the assembly plant and development center located in Chelmsford, Massachusetts. Restructuring costs of $2.8 million incurred in 2016 primarily related to $1.7 million of employee severance and related benefits, and $1.1 million of charges related to asset write-offs and remaining lease obligations, net of sublease income due to the closure of the Chelmsford, Massachusetts manufacturing plant in the third quarter of 2016.
Restructuring costs for 2015 were $2.1 million, primarily due to employee severance and related benefits for the Chelmsford restructuring plan.
Share-Based Compensation
The table of operating expenses shown above also includes $3.8 million and $3.9 million of share-based compensation expense for 2016 and 2015, respectively. Share-based compensation expense decreased in 2016 compared to 2015 primarily due to lower stock price on grant dates and increased forfeitures; partially offset by an increased number of time-based restricted stock unit awards granted. Additionally, we incurred $0.9 million of share-based compensation expense in 2016 related to the business acquisition.
29
Non-operating Income and Expense, net
2016 | 2015 | ||||||||||||
(In thousands, except percentages) | Interest and Other Income, net | % of Net Sales | Interest and Other Expense, net | % of Net Sales | |||||||||
Loss and other-than-temporary impairment of cost method investment | $ | — | — | % | $ | (4,263 | ) | (2.7 | )% | ||||
Interest and other income, net | 195 | 0.1 | 430 | 0.3 | |||||||||
Total non-operating (expense) income | $ | 195 | 0.1 | % | $ | (3,833 | ) | (2.4 | )% | ||||
Other-than-temporary impairment of cost method investment
We held $4.3 million in cost method investments in OmniGuide, Inc. in fiscal 2015 that were impaired in the fourth quarter of 2015 as OmniGuide's lender exercised its right to convert the outstanding obligations owed to it by OmniGuide into one hundred percent of OmniGuide's outstanding equity under the applicable financing agreements. No cost method investments were held by the Company at the end of 2015 and 2016.
Interest and Other Income (Expense), net
Interest and other income (expense), net, consists of interest income and expense, market gains and losses on assets held in employees’ deferred compensation accounts, realized and unrealized foreign exchange gains and losses, bank charges, investment management fees, and other miscellaneous non-operating items. Interest and other income, net was $0.2 million in 2016 compared to $0.4 million in 2015. This change was primarily attributable to a $0.2 million increase in financing costs associated with the establishment of our line of credit in 2016.
Income Taxes
2016 | 2015 | ||||||||||||
(In thousands, except percentages) | Income Tax Benefit | Effective Tax Rate | Income Tax Provision | Effective Tax Rate | |||||||||
(Benefit from) Provision for income taxes | $ | (16 | ) | 0.1 | % | $ | 234 | (0.5 | )% | ||||
The benefit from income taxes for 2016 was $16 thousand on a pretax loss of $12.3 million, an effective tax rate of 0.1%. For 2015, the provision for income taxes was $234 thousand on a pretax loss of $43.6 million, an effective rate of (0.5)%. The change is primarily due to income from foreign jurisdictions offset by a benefit arising from pretax losses in the Topwin subsidiary for 2016. The provision for income taxes is lower than the statutory rate primarily due to pre-tax losses and the valuation allowance currently maintained against net deferred tax assets. The majority of the income tax paid relates to foreign jurisdictions and the change was primarily a result of the level of income recognized in each foreign location. Our effective tax rate is subject to fluctuation based upon the mix of income and relative tax rates between jurisdictions, and the occurrence and timing of numerous discrete events such as changes in tax laws or their interpretations, extensions or expirations of research and experimentation credits, closure of tax years subject to examination, finalization of income tax returns, the relationship of fixed deductions to overall changes in estimated and actual pretax income or loss and the tax jurisdictions where income or loss is generated.
Financial Condition and Liquidity
At April 1, 2017, our principal sources of liquidity were cash and cash equivalents of $56.6 million, short-term investments of $5.7 million and accounts receivable of approximately $40.5 million, in addition to amounts available under our credit facility. At April 1, 2017, we had a current ratio of 2.99 and had no outstanding amounts under our credit facility. Working capital of $115.6 million decreased $11.1 million compared to the April 2, 2016 balance of $126.7 million, primarily due to an $8.6 million increase in accounts payable and accrued liabilities driven primarily by restructuring activities.
During 2017, the Company used $0.8 million in operating cash flows. The Company generated $2.6 million in investing cash flows, primarily due to $8.9 million proceeds from investments which were converted to cash on maturity, offset by $4.0 million spent on property and equipment (PP&E) purchases, and a $2.0 million spend for acquisition of Visicon in 2017. PP&E purchases comprised primarily of facilities improvements and purchase of test equipment for engineering operations. The Company paid $2.0 million in cash for acquisition of Visicon, with the remaining value paid through issuance of the Company's common stock. Cash provided by financing activities of $14.2 million primarily consisted of $13.7 million of net proceeds received for the mortgage of our Portland facilities.
30
As a result of restructuring activities, we have incurred and will continue to incur costs, some of which will be paid in cash. We expect restructuring activities to be largely complete by the end of the first quarter of 2018. The changes are expected to result in reduced expenses by the end of the second quarter of 2018.
On January 9, 2017, ESI Leasing, LLC (ESI Leasing), a wholly owned subsidiary of the Company, entered into a loan agreement (Loan Agreement) with First Technology Federal Credit Union (Lender). The Loan Agreement provides for a term loan from the Lender to ESI Leasing in the principal amount of $14 million (Loan). The interest rate of the Loan is fixed at 4.75% per annum, except that it may be increased if certain covenants under the Loan Agreement are not satisfied and after and during the continuation of an “Event of Default” as defined in the Loan Agreement. The Loan amortizes over a period of approximately 20 years, but the maturity date of the loan is January 1, 2027, meaning that, if ESI Leasing does not prepay or refinance the Loan, a significant portion of the principal of the Loan will become due on January 1, 2027. ESI Leasing will pay monthly principal and interest payments on the Loan totaling annual amounts of $1.1 million. The Company unconditionally guarantees the loan to ESI Leasing.
The Company is party to a loan and security agreement (Credit Facility) with Silicon Valley Bank (SVB), which was initially entered into on March 20, 2015 and amended on July 12, 2016. The Credit Facility provides for a senior secured asset-based revolving facility with availability up to $30 million, including a $15 million sublimit for letters of credit. The Credit Facility expires March 20, 2019. At April 1, 2017, the Company had no amounts outstanding under the Credit Facility, was in compliance with all covenants, and was not in default under the agreement. The commitment fee on the amount of unused credit was 0.3 percent. In the fourth quarter of 2017, the Company amended and extended the Credit Facility by one year. As amended, the Credit Facility allows for a greater level of losses over the next 12 months, but reduces the level of permitted acquisitions and purchases of capital equipment. If we fail to meet the covenants in our Credit Facility or our lenders fail to fund, access to the facility may be limited or the facility may become unavailable altogether. Losses, such as those experienced in the second and third quarters of 2017, negatively impact our ability to maintain compliance with these covenants. While we have a credit facility in place, if we fail to meet the covenants in our credit facility or our lenders fail to fund, access to the facility may be limited or the facility may become unavailable altogether. Losses, such as those experienced in the second and third quarters of 2017, negatively impact our ability to maintain compliance with these covenants.
We have made an election to permanently reinvest foreign earnings related to manufacturing operations in Singapore and China. While there is no intent to do so, should these funds be required to be repatriated, a tax liability related to these earnings may be incurred, which could be offset by other tax attributes.
In February 2015, the Board of Directors suspended the quarterly dividend which was adopted by the Company in December 2011. The Company paid dividends in the first three quarters of 2015 under the 2011 dividend policy in the aggregate amount of $0.24 per share. The Company has not paid any dividends in 2017 and 2016 and we do not anticipate paying cash dividends in the foreseeable future.
Our business requires greater levels of working capital than similar sized businesses in some other industries due to the value of the inventory we need to acquire to fill orders and the large accounts receivable we may hold due to the relatively high unit sales prices of our products. If orders increase we expect that working capital demands will also increase for some period before the associated cash flows are realized.
We believe that our existing cash, cash equivalents, short-term investments and our available credit facility are adequate to fund our operations, contractual and debt obligations for at least the next 12 months.
Contractual Obligations
The table below presents our estimates of future payments for contractual obligations. The actual payments may differ from these estimates due to changes in our business needs, cancellation provisions, and other factors. We cannot provide certainty regarding the timing of the payment schedule and the amounts of payments.
The following table summarizes our contractual obligations as of April 1, 2017, by the fiscal year in which they are due:
(In thousands) | Total | 2018 | 2019 | 2020 | 2021 | 2022 | Thereafter | ||||||||||||||||||||
Purchase commitments | $ | 28,631 | $ | 27,564 | $ | 449 | $ | 618 | $ | — | $ | — | $ | — | |||||||||||||
Operating leases | 5,126 | 2,732 | 1,895 | 484 | 15 | — | — | ||||||||||||||||||||
Debt payments | 21,526 | 1,086 | 1,086 | 1,086 | 1,086 | 1,086 | 16,096 | ||||||||||||||||||||
$ | 55,283 | $ | 31,382 | $ | 3,430 | $ | 2,188 | $ | 1,101 | $ | 1,086 | $ | 16,096 | ||||||||||||||
The operating lease amounts include the contractual facility lease obligations at our Napa, California; Sunnyvale, California; Montreal, Canada; and Chelmsford, Massachusetts plants. The above table excludes the estimated rental income, if any, from the sublease of these facilities.
31
This table does not include $10.7 million of unrecognized tax benefits due to the uncertainty with respect to the timing of future cash flows as of April 1, 2017. We are unable to make reasonably reliable estimates of the period of cash settlement with the respective taxing authorities and the total amounts of income tax payable and the timing of such tax payments may depend on the resolution of current and future tax examinations which cannot be reasonably estimated.
Critical Accounting Policies and Estimates
The preparation of our financial statements requires us to make estimates and judgments that affect the reported amounts of assets, liabilities, revenues and expenses. Our estimates are based on historical experience and on various assumptions that we believe to be reasonable under the circumstances. These estimates form the basis for judgments about the carrying values of assets and liabilities that are not readily apparent from other sources.
Our critical accounting policies and estimates include the following:
• | Revenue recognition; |
• | Inventory valuation; |
• | Accrued restructuring costs; |
• | Share-based compensation; |
• | Income taxes including the valuation of deferred tax assets; |
• | Valuation of long-lived assets; |
• | Valuation of goodwill; and |
• | Acquisition accounting. |
Revenue Recognition
We recognize revenue when persuasive evidence of an arrangement exists, delivery has occurred or the services have been rendered, the sales price is fixed or determinable and collection of the related receivable is reasonably assured. Title and risk of loss generally pass to the customer at the time of delivery of the product to a common carrier. Revenue is recognized upon such delivery, provided that fulfillment of acceptance criteria can be demonstrated prior to shipment. Where the acceptance criteria cannot be demonstrated prior to shipment, or in the case of substantially new products, revenue is deferred until acceptance has been received. This assessment is based, in part, upon the track record of acceptance for our products, and this track record could be impacted by configuration or reliability changes. To the extent a track record of acceptance is not deemed to exist, the timing of revenue recognition could be impacted. For multiple element arrangements, the relative fair values of any undelivered elements are deferred until the elements are delivered and acceptance criteria are met. Revenues are recorded net of taxes collected which are required to be submitted to government authorities. Installation services are not essential to the functionality of the delivered equipment and installation revenue is deferred until installation is complete. Historically, neither the costs of installation accrued nor the fair value of installation service revenue deferred has been material.
Revenues associated with sales to customers under local contracts in Japan are recognized upon title transfer, which generally occurs upon customer acceptance. Revenues related to spare parts and consumable sales are generally recognized upon shipment. Revenues related to maintenance and service contracts are generally recognized ratably over the duration of the contracts.
Inventory Valuation
We regularly evaluate the carrying value of inventory based on a combination of factors including, but not limited to, the following: product life cycle, forecasted sales or usage, historical usage rates, estimated service period, product end-of-life dates, estimated current and future market values, service inventory requirements and new product introductions. Purchasing requirements and alternative uses for the inventory are explored within these processes to mitigate inventory exposure. Inventory materials with quantities in excess of forecasted usage are reviewed quarterly for obsolescence. Obsolescence write-downs are typically caused by engineering change orders or product life cycle changes.
Research and development product costs are generally expensed as incurred. Engineering materials that are expected to provide future value are generally classified as raw materials inventory.
Finished goods are reviewed quarterly by product marketing and operating personnel to determine if inventory carrying value exceeds market selling prices. When necessary, we record inventory write-downs as an increase to cost of sales based on the above factors and take into account worldwide quantities on hand, product life cycle and forecasted demand in our analysis. Additionally, from time to time, we make strategic decisions to exit or alter product lines which may result in an inventory write-down. If circumstances related to our inventories change, our estimates of the value of inventory could materially change.
32
Accrued Restructuring Costs
We have engaged, and may continue to engage, in restructuring actions, which require us to make estimates in certain areas including expenses for severance and other employee separation costs. Because we have a history of paying severance benefits, expenses and liabilities associated with exit or disposal activities are recognized when probable and estimable. For further discussion on the restructuring activities and related charges in 2017, refer to our discussion of “Restructuring Costs” in the “Results of Operations” section above.
Share-Based Compensation
Our share-based compensation consists of stock-settled stock appreciation rights (SARs), restricted stock unit awards with a service condition (time-based RSUs), restricted stock unit awards with a performance condition (performance-based RSUs), restricted stock unit awards with a market condition (market-based RSUs) and an employee stock purchase plan.
The fair value of SARs and stock issued under the employee stock purchase plan is determined using the Black-Scholes model to estimate the fair value of awards on the date of grant. SARs grant the right to receive shares of the Company's stock equivalent to the increase in stock value of a specified number of shares over a specified period of time, divided by the stock price at the time of exercise. The fair value of time-based RSUs and performance-based RSUs are measured on the grant date based on the market value of the Company's common stock. The market-based RSUs must achieve the total shareholder return (TSR) measures in order for the awards to vest, and the grant date fair value of the awards is calculated using a Monte Carlo simulation model.
The use of the Black-Scholes and Monte Carlo simulation models to estimate the fair value of stock option, SAR and market-based RSU awards requires us to make assumptions regarding the risk-free interest rate, expected dividend yield, expected term and expected volatility over the expected term of the award. The assumptions used in calculating the fair value of share-based payment awards represent management’s best estimates based on our historical data, but these estimates involve inherent uncertainties and the recognition of expense could be materially different in the future.
Except performance-based RSUs, we recognize compensation expense for all share-based compensation awards, net of estimated forfeitures, on a straight-line basis over the requisite service period of the award. Expense for performance-based RSUs is recognized based on the probability of achievement of the performance criteria. Depending on the measures used in the performance award, the determination of achievement may be judgmental and could change from period to period depending on the assessment of probability of achievement, impacting the recognition of expense. The compensation cost for market-based RSUs is recognized over the related service period, even if the market condition is never satisfied. Compensation expense is only recognized on awards that are estimated to ultimately vest. Therefore, based on historical forfeiture rates and patterns, the estimated future forfeitures are factored into the compensation expense to be recognized over the vesting period. We update our forfeiture estimates at least annually and recognize any changes to accumulated compensation expense in the period of change. If actual forfeitures differ significantly from our estimates, our results of operations could be materially impacted.
Income Taxes
We are subject to income taxes in the United States and in numerous foreign jurisdictions and in the ordinary course of business, there are transactions and calculations where the ultimate tax determination is uncertain. We report a liability for unrecognized tax benefits resulting from uncertain tax positions taken or expected to be taken in a tax return. We recognize interest and penalties, if any, related to the unrecognized tax benefits in income tax expense.
When management determines that it is more likely than not that a deferred tax asset will not be fully realized, a valuation allowance is established to reduce deferred tax assets to the amount expected to be realized. Currently we have valuation allowances in place against many of our net deferred tax assets in the based on a history of cumulative losses in the related jurisdictions. The decision to establish a valuation allowance generally entails judgments regarding future taxable income and to the extent the actual experience differs from those estimations, tax expense and the value of net deferred items may be significantly impacted. The valuation allowance against our net deferred tax assets and attributes was $103.3 million and $93.9 million at April 1, 2017 and April 2, 2016, respectively.
Valuation of Long-Lived Assets, Excluding Goodwill
The assumptions and estimates used to determine fair value and remaining useful lives of our intangible and other long-lived assets are complex and subjective. They can be affected by various factors, including external factors such as industry and economic trends, and internal factors such as changes in our business strategy and our forecasts for specific product lines.
33
Identified Intangible Assets, Excluding Goodwill
We assess the recoverability of purchased finite-lived intangible assets whenever events or changes in circumstances indicate that an impairment may exist. Recoverability of finite-lived intangible assets is measured by comparing the carrying amount of the asset to the future undiscounted cash flows that the asset is expected to generate. If we determine that an individual asset is impaired, the amount of any impairment is measured as the difference between the carrying value and the fair value of the impaired asset. This determination is sensitive to multiple assumptions, and to the extent actual results vary from our estimates, the value of recorded assets may be negatively impacted.
Property, Plant and Equipment & Other Noncurrent Finite-Lived Assets
Property, plant and equipment and other non-current assets with finite lives are reviewed for impairment whenever events or circumstances indicate that the carrying amount of assets may not be recoverable. We evaluate recoverability of assets to be held and used by comparing the carrying amount of an asset to estimated future net undiscounted cash flows to be generated by the asset, which is a significant estimate. If this test indicates the asset may be impaired, the fair value is determined and an impairment is recognized in the amount by which the carrying amount of the assets exceeds the fair value.
Valuation of Goodwill
Goodwill is recorded when the purchase price for an acquisition exceeds the estimated fair value of the net tangible and identified intangible assets acquired. We perform an annual impairment assessment in the fourth quarter of each year, or more frequently if indicators of potential impairment exist, to determine whether the fair value of the reporting unit is less than its carrying value. The determination of whether potential impairment exists and the determination of fair value of the reporting unit both involve a considerable amount of judgment and estimation. These judgments and estimates include and are sensitive to many financial and valuation assumptions. Fair value is ultimately determined based on the value indicated by a cost, market, or income approach, or some weighting between the approaches. The determination of the best approach to use in a given instance requires judgment and the Company utilizes generally accepted valuation methods or other generally accepted methods, and, in many instances, engages specialist resources in making this determination. Key areas of estimation and judgment may include the selection of valuation approaches, identification and selection of comparable companies or transactions, projections of future performance, cost of capital, market characteristics, cost structure, impacts of synergies, estimates of terminal value, estimates of control premiums, among other factors. A significant deterioration or deviation between expectations and actual performance may trigger an impairment.
While the Company uses best estimates and assumptions as part of the valuation of goodwill, estimates are inherently uncertain. Any impairment resulting from a deviation from expectations or comparable companies is recorded in the period identified in the amount by which the carrying value of equity exceeds the fair value of equity.
Acquisition Accounting
The fair value of the consideration exchanged in an acquisition is allocated to tangible assets and identifiable intangible assets acquired and liabilities assumed at acquisition date fair value. Goodwill is measured as the excess of the consideration transferred over the net fair value of identifiable assets acquired and liabilities assumed. The accounting for an acquisition involves a considerable amount of judgment and estimation. Cost, income, market or a combination of approaches may be used to establish the fair value of consideration exchanged, assets acquired and liabilities assumed, depending on the nature of those items. The valuation approach is determined in accordance with generally accepted valuation methods or other generally accepted methods. Key areas of estimation and judgment may include may include the selection of valuation approaches, identification and selection of comparable companies or transactions, projections of future performance, cost of capital, market characteristics, cost structure, impacts of synergies, and estimates of terminal value, among other factors.
While the Company uses best estimates and assumptions as part of the purchase price allocation process to estimate the value of assets acquired and liabilities assumed, estimates are inherently uncertain and subject to refinement. During the measurement period, which may be up to one year from the acquisition date, the Company may record adjustments to the assets acquired and liabilities assumed, with a corresponding offset to goodwill, to the extent that adjustments are identified to the preliminary purchase price allocation. Upon conclusion of the measurement period, or final determination of the value of the assets acquired and liabilities assumed, whichever comes first, any subsequent adjustments are recorded to results from operations. Refer to Note 6, “Business Acquisitions” of Notes to the Consolidated Financial Statements for further discussion of purchase accounting, valuation methodology and assumptions.
34
Item 7A. Quantitative and Qualitative Disclosures about Market Risk
The primary objectives of our investment activities are to preserve principal and maintain liquidity to meet operating needs. To achieve these objectives, we maintain an investment portfolio of cash, cash equivalents, and investments in a variety of securities, including commercial paper, corporate bonds and U.S. government agency notes.
Interest Rate Risk
Our investment securities are subject to interest rate risk and will decline in value if interest rates increase. The majority of these securities are classified as available-for-sale securities; therefore, the impact on fair value of interest rate changes is reflected as a separate component of shareholders’ equity. Due to the short-term maturity of our investment portfolio, an immediate 10% change in interest rates would not have a material effect on the fair value of our invested assets.
Investment Risk
Our marketable securities are classified as available-for-sale securities measured at fair value. The market value of our investments is influenced by market risks, liquidity risk and the credit worthiness of underlying issuers of our investment. We strive to minimize the investment risk by investing in high quality securities and by utilizing experienced and high credit quality financial institutions to manage the investment portfolio.
Foreign Currency Exchange Rate Risk
The Company’s net investment exposure in foreign subsidiaries translated into U.S. dollars using the period-end exchange rates at April 1, 2017 and April 2, 2016 was approximately $56.4 million and $56.9 million, respectively. The potential loss in fair value resulting from a hypothetical 10% adverse change in foreign exchange rates would be approximately $5.6 million and $5.7 million at April 1, 2017 and April 2, 2016, respectively. Foreign exchange rate gains or losses on foreign investments as of April 1, 2017 were reflected as a cumulative translation adjustment, net of tax, and do not affect the Company’s results of operations. The table below summarizes our net investments by geographic area:
(In thousands) | 2017 | 2016 | |||||
Asia | $ | 55,500 | $ | 61,716 | |||
Europe | 6,133 | 719 | |||||
Americas (excluding United States) | (5,256 | ) | (5,537 | ) | |||
$ | 56,377 | $ | 56,898 | ||||
We purchase derivative financial instruments on a limited basis and do not use them for trading purposes. We do, however, use derivatives to manage well-defined foreign currency risks. We enter into forward exchange contracts to hedge the value of material non-functional currency monetary asset and liability balances. In general, these contracts have a duration of approximately one month and the counterparties are large, highly rated banks; therefore, the Company believes that the risk of loss as a result of nonperformance by the banks is minimal. The net effect of an immediate 10% change in exchange rates on the forward exchange contracts and the underlying hedged positions would not be material to our financial position or the results of our operations.
The table below summarizes, by currency, the notional amounts of our forward exchange contracts in U.S. dollars as of April 1, 2017 and April 2, 2016. The “bought” amounts represent the net U.S. dollar equivalents of commitments to purchase foreign currencies, and the “sold” amounts represent the net U.S. dollar equivalents of commitments to sell foreign currencies. The foreign currency amounts have been translated into a U.S. dollar equivalent value using the exchange rates at the reporting date.
Bought (Sold) | |||||||
(In thousands) | 2017 | 2016 | |||||
Japanese Yen | $ | 1,352 | $ | 5,079 | |||
Euro | 7,568 | 12,073 | |||||
New Taiwan Dollar | (686 | ) | (117 | ) | |||
Korean Won | 32 | 197 | |||||
British Pound | (1,992 | ) | (2,350 | ) | |||
Chinese Renminbi | 995 | (1,859 | ) | ||||
Singapore Dollar | 74 | 53 | |||||
$ | 7,343 | $ | 13,076 | ||||
35
Item 8. Financial Statements and Supplementary Data
REPORT OF INDEPENDENT REGISTERED PUBLIC ACCOUNTING FIRM
To the Board of Directors and Shareholders of
Electro Scientific Industries, Inc.
Portland, Oregon
We have audited the accompanying consolidated balance sheets of Electro Scientific Industries, Inc. and subsidiaries (the “Company”) as of April 1, 2017 and April 2, 2016, and the related consolidated statements of operations, comprehensive loss, shareholders’ equity, and cash flows for each of the two fiscal years in the period ended April 1, 2017. These financial statements are the responsibility of the Company’s management. Our responsibility is to express an opinion on these financial statements based on our audits. The consolidated financial statements of the Company for the fiscal year ended March 28, 2015, before the effects of the retrospective adjustments to the disclosures for a change in the composition of reportable segments discussed in Note 25 to the consolidated financial statements, were audited by other auditors whose report, dated June 26, 2015, expressed an unqualified opinion on those statements.
We conducted our audits in accordance with the standards of the Public Company Accounting Oversight Board (United States). Those standards require that we plan and perform the audit to obtain reasonable assurance about whether the financial statements are free of material misstatement. An audit includes examining, on a test basis, evidence supporting the amounts and disclosures in the financial statements. An audit also includes assessing the accounting principles used and significant estimates made by management, as well as evaluating the overall financial statement presentation. We believe that our audits provide a reasonable basis for our opinion.
In our opinion, the consolidated financial statements present fairly, in all material respects, the financial position of Electro Scientific Industries, Inc. and subsidiaries as of April 1, 2017 and April 2, 2016, and the results of their operations and their cash flows for each of the two fiscal years in the period ended April 1, 2017, in conformity with accounting principles generally accepted in the United States of America.
We also have audited the adjustments to the fiscal 2015 consolidated financial statements to retrospectively adjust the disclosures for a change in the composition of reportable segments in 2017, as discussed in Note 25 to the consolidated financial statements. Our procedures included (1) obtaining and assessing the Company’s underlying accounting analysis prepared by management and (2) reading the segment disclosure footnote and evaluating the adjustments for consistency with the conclusions reached in such analysis. In our opinion, such retrospective adjustments are appropriate and have been properly applied. However, we were not engaged to audit, review, or apply any procedures to the fiscal 2015 consolidated financial statements of the Company other than with respect to the retrospective adjustments and, accordingly, we do not express an opinion or any other form of assurance on the fiscal 2015 consolidated financial statements taken as a whole.
We also have audited, in accordance with the standards of the Public Company Accounting Oversight Board (United States), the Company’s internal control over financial reporting as of April 1, 2017, based on criteria established in Internal Control-Integrated Framework (2013) issued by the Committee of Sponsoring Organizations of the Treadway Commission and our report dated June 14, 2017 expressed an unqualified opinion on the Company’s internal control over financial reporting.
Portland, Oregon
June 14, 2017
36
REPORT OF INDEPENDENT REGISTERED PUBLIC ACCOUNTING FIRM
The Board of Directors and Shareholders
Electro Scientific Industries, Inc.:
We have audited, before the effects of the adjustments applied to the segment disclosures as more fully described in Note 25, the accompanying consolidated statements of operations, comprehensive loss, shareholders’ equity, and cash flows of Electro Scientific Industries, Inc. and subsidiaries for the year ended March 28, 2015. The 2015 financial statements before the effects of the adjustments applied to the segment disclosures as more fully described in Note 25 are not presented herein. These 2015 consolidated financial statements are the responsibility of the Company’s management. Our responsibility is to express an opinion on these consolidated financial statements based on our audit.
We conducted our audit in accordance with the standards of the Public Company Accounting Oversight Board (United States). Those standards require that we plan and perform the audit to obtain reasonable assurance about whether the financial statements are free of material misstatement. An audit includes examining, on a test basis, evidence supporting the amounts and disclosures in the financial statements. An audit also includes assessing the accounting principles used and significant estimates made by management, as well as evaluating the overall financial statement presentation. We believe that our audit provides a reasonable basis for our opinion.
In our opinion, the 2015 consolidated financial statements referred to above, before the effects of the adjustments applied to the segment disclosures as more fully described in Note 25, present fairly, in all material respects, the results of operations and cash flows of Electro Scientific Industries, Inc. and subsidiaries for the year ended March 28, 2015, in conformity with U.S. generally accepted accounting principles.
We were not engaged to audit, review, or apply any procedures to the adjustments applied to the segment disclosures as more fully described in Note 25 and, accordingly, we do not express an opinion or any other form of assurance about whether such adjustments are appropriate and have been properly applied. Those adjustments were audited by a successor auditor.
/s/KPMG LLP
Portland, Oregon
June 26, 2015
37
ELECTRO SCIENTIFIC INDUSTRIES, INC. AND SUBSIDIARIES
CONSOLIDATED BALANCE SHEETS
As of April 1, 2017 and April 2, 2016
(In thousands) | 2017 | 2016 | |||||
ASSETS | |||||||
Current assets: | |||||||
Cash and cash equivalents | $ | 56,642 | $ | 42,413 | |||
Short-term investments | 5,743 | 15,252 | |||||
Trade receivables, net of allowances of $603 and $1,039 | 40,494 | 42,770 | |||||
Inventories, net | 58,942 | 60,470 | |||||
Shipped systems pending acceptance | 5,713 | 1,181 | |||||
Other current assets | 6,180 | 5,340 | |||||
Total current assets | 173,714 | 167,426 | |||||
Non-current assets: | |||||||
Property, plant and equipment, net of accumulated depreciation of $112,075 and $107,910 | 21,619 | 24,543 | |||||
Deferred income taxes, net | 890 | 914 | |||||
Goodwill | 3,027 | 7,445 | |||||
Acquired intangible assets, net of accumulated amortization of $21,994 and $21,146 | 6,564 | 7,146 | |||||
Other assets | 18,931 | 12,626 | |||||
Total assets | $ | 224,745 | $ | 220,100 | |||
LIABILITIES AND SHAREHOLDERS' EQUITY | |||||||
Current liabilities: | |||||||
Accounts payable | $ | 21,213 | $ | 16,061 | |||
Accrued liabilities | 22,186 | 18,334 | |||||
Deferred revenue | 14,712 | 6,373 | |||||
Total current liabilities | 58,111 | 40,768 | |||||
Non-current liabilities: | |||||||
Long-term debt | 13,489 | — | |||||
Income taxes payable | 1,036 | 1,266 | |||||
Deferred income tax liability, net | 8 | 234 | |||||
Other liabilities | 7,570 | 7,801 | |||||
Total liabilities | 80,214 | 50,069 | |||||
Commitments and contingencies (Note 19) | |||||||
Shareholders’ equity: | |||||||
Preferred stock, without par value; 1,000 shares authorized; no shares issued | — | — | |||||
Common stock, without par value; 100,000 shares authorized; 33,260 and 31,613 issued and outstanding | 207,152 | 195,024 | |||||
Accumulated deficit | (61,407 | ) | (23,998 | ) | |||
Accumulated other comprehensive loss | (1,214 | ) | (995 | ) | |||
Total shareholders’ equity | 144,531 | 170,031 | |||||
Total liabilities and shareholders’ equity | $ | 224,745 | $ | 220,100 | |||
See Accompanying Notes to Consolidated Financial Statements
38
ELECTRO SCIENTIFIC INDUSTRIES, INC. AND SUBSIDIARIES
CONSOLIDATED STATEMENTS OF OPERATIONS
For the years ended April 1, 2017, April 2, 2016 and March 28, 2015
(In thousands, except per share amounts) | 2017 | 2016 | 2015 | ||||||||
Net sales: | |||||||||||
Systems | $ | 125,098 | $ | 142,957 | $ | 111,603 | |||||
Services | 35,925 | 41,434 | 47,515 | ||||||||
Total net sales | 161,023 | 184,391 | 159,118 | ||||||||
Cost of sales: | |||||||||||
Systems | 81,350 | 89,169 | 78,195 | ||||||||
Services | 18,207 | 22,519 | 26,242 | ||||||||
Total cost of sales | 99,557 | 111,688 | 104,437 | ||||||||
Gross profit | 61,466 | 72,703 | 54,681 | ||||||||
Operating expenses: | |||||||||||
Selling, general and administration | 52,698 | 49,753 | 48,525 | ||||||||
Research, development and engineering | 31,719 | 32,400 | 35,166 | ||||||||
Restructuring costs | 6,935 | 2,824 | 2,069 | ||||||||
Acquisition and integration costs | 366 | 194 | 776 | ||||||||
Impairment of goodwill | 7,445 | — | 7,889 | ||||||||
Net operating expenses | 99,163 | 85,171 | 94,425 | ||||||||
Operating loss | (37,697 | ) | (12,468 | ) | (39,744 | ) | |||||
Non-operating income (expense): | |||||||||||
Loss and other-than-temporary impairment of cost method investment | — | — | (4,263 | ) | |||||||
Interest and other income, net | 265 | 195 | 430 | ||||||||
Total non-operating income (expense) | 265 | 195 | (3,833 | ) | |||||||
Loss before income taxes | (37,432 | ) | (12,273 | ) | (43,577 | ) | |||||
(Benefit from) provision for income taxes | (23 | ) | (16 | ) | 234 | ||||||
Net loss | $ | (37,409 | ) | $ | (12,257 | ) | $ | (43,811 | ) | ||
Net loss per share—basic | $ | (1.15 | ) | $ | (0.39 | ) | $ | (1.43 | ) | ||
Net loss per share—diluted | $ | (1.15 | ) | $ | (0.39 | ) | $ | (1.43 | ) | ||
Weighted average number of shares—basic | 32,551 | 31,411 | 30,611 | ||||||||
Weighted average number of shares—diluted | 32,551 | 31,411 | 30,611 | ||||||||
Cash dividends paid per outstanding common share | $ | — | $ | — | $ | 0.24 | |||||
See Accompanying Notes to Consolidated Financial Statements
39
ELECTRO SCIENTIFIC INDUSTRIES, INC. AND SUBSIDIARIES
CONSOLIDATED STATEMENTS OF COMPREHENSIVE LOSS
For the years ended April 1, 2017, April 2, 2016 and March 28, 2015
(In thousands) | 2017 | 2016 | 2015 | ||||||||
Net loss | $ | (37,409 | ) | $ | (12,257 | ) | $ | (43,811 | ) | ||
Other comprehensive loss: | |||||||||||
Foreign currency translation adjustment, net of taxes of $0, $0 and $0 | (348 | ) | (922 | ) | (384 | ) | |||||
Accumulated other comprehensive income (loss) related to benefit plan obligation, net of taxes of ($74), ($21) and ($13) | 135 | (4 | ) | (25 | ) | ||||||
Net unrealized (loss) gain on available-for-sale securities, net of taxes of $0, $1 and ($5) | (6 | ) | 3 | (15 | ) | ||||||
Other comprehensive loss | (219 | ) | (923 | ) | (424 | ) | |||||
Comprehensive loss | $ | (37,628 | ) | $ | (13,180 | ) | $ | (44,235 | ) | ||
See Accompanying Notes to Consolidated Financial Statements
40
ELECTRO SCIENTIFIC INDUSTRIES, INC. AND SUBSIDIARIES
CONSOLIDATED STATEMENTS OF SHAREHOLDERS' EQUITY
For the years ended April 1, 2017, April 2, 2016 and March 28, 2015
Common Stock | Retained Earnings (Accumulated Deficit) | Accumulated Other Comprehensive Income (Loss) | Total Shareholders’ Equity | |||||||||||||||
(In thousands) | Shares | Amount | ||||||||||||||||
Balance at March 29, 2014 | 30,155 | $ | 183,193 | $ | 39,336 | $ | 352 | $ | 222,881 | |||||||||
Cash dividends paid ($0.24 per outstanding common share) | — | — | (7,266 | ) | — | (7,266 | ) | |||||||||||
Employee stock plans | 757 | 4,555 | — | — | 4,555 | |||||||||||||
Share repurchases | (208 | ) | (1,456 | ) | — | — | (1,456 | ) | ||||||||||
Business acquisition, equity interest (Note 6) | — | 2,842 | — | — | 2,842 | |||||||||||||
Net loss | — | — | (43,811 | ) | — | (43,811 | ) | |||||||||||
Other comprehensive loss | (424 | ) | (424 | ) | ||||||||||||||
Balance at March 28, 2015 | 30,704 | 189,134 | (11,741 | ) | (72 | ) | 177,321 | |||||||||||
Employee stock plans | 909 | 5,827 | — | — | 5,827 | |||||||||||||
Business acquisition (Note 6) | — | 63 | — | — | 63 | |||||||||||||
Net loss | — | — | (12,257 | ) | — | (12,257 | ) | |||||||||||
Other comprehensive loss | (923 | ) | (923 | ) | ||||||||||||||
Balance at April 2, 2016 | 31,613 | 195,024 | (23,998 | ) | (995 | ) | 170,031 | |||||||||||
Employee stock plans | 1,647 | 7,652 | — | — | 7,652 | |||||||||||||
Business acquisition (Note 6) | — | 4,476 | — | — | 4,476 | |||||||||||||
Net loss | — | — | (37,409 | ) | — | (37,409 | ) | |||||||||||
Other comprehensive loss | (219 | ) | (219 | ) | ||||||||||||||
Balance at April 1, 2017 | 33,260 | $ | 207,152 | $ | (61,407 | ) | $ | (1,214 | ) | $ | 144,531 | |||||||
See Accompanying Notes to Consolidated Financial Statements
41
ELECTRO SCIENTIFIC INDUSTRIES, INC. AND SUBSIDIARIES
CONSOLIDATED STATEMENTS OF CASH FLOWS
For the years ended April 1, 2017, April 2, 2016 and March 28, 2015
See Accompanying Notes to Consolidated Financial Statements
(In thousands) | 2017 | 2016 | 2015 | ||||||||
CASH FLOWS FROM OPERATING ACTIVITIES | |||||||||||
Net loss | $ | (37,409 | ) | $ | (12,257 | ) | $ | (43,811 | ) | ||
Adjustments to reconcile net loss to net cash provided by (used in) operating activities: | |||||||||||
Depreciation and amortization | 7,566 | 7,343 | 7,817 | ||||||||
Amortization of acquired intangible assets | 1,530 | 1,376 | 1,502 | ||||||||
Share-based compensation expense | 7,095 | 5,103 | 4,542 | ||||||||
(Recovery of) provision for doubtful accounts | (429 | ) | 329 | 53 | |||||||
Loss (gain) on sale of property and equipment, net | 1,323 | 862 | (6 | ) | |||||||
Impairment of acquired intangibles | 2,349 | — | — | ||||||||
Impairment of inventory | 2,440 | — | — | ||||||||
Loss and other-than-temporary impairment of cost method investment | — | — | 4,263 | ||||||||
Impairment of goodwill | 7,445 | — | 7,889 | ||||||||
Increase in deferred income taxes | (254 | ) | (877 | ) | (54 | ) | |||||
Changes in operating accounts, net of acquisitions: | |||||||||||
Decrease (increase) in trade receivables, net | 2,571 | 2,984 | (7,965 | ) | |||||||
(Increase) decrease in inventories | (6,252 | ) | (7,303 | ) | 1,091 | ||||||
(Increase) decrease in shipped systems pending acceptance | (4,532 | ) | 1,631 | (462 | ) | ||||||
(Increase) decrease in other current assets | (755 | ) | 1,154 | (200 | ) | ||||||
Increase (decrease) in accounts payable and accrued liabilities | 8,141 | 9,048 | (4,013 | ) | |||||||
Increase (decrease) in deferred revenue | 8,338 | (4,691 | ) | 1,861 | |||||||
Net cash (used in) provided by operating activities | (833 | ) | 4,702 | (27,493 | ) | ||||||
CASH FLOWS FROM INVESTING ACTIVITIES | |||||||||||
Purchase of investments | (464,893 | ) | (380,841 | ) | (414,705 | ) | |||||
Proceeds from sales and maturities of investments | 473,842 | 369,700 | 450,507 | ||||||||
Purchase of property, plant and equipment | (4,039 | ) | (3,693 | ) | (5,374 | ) | |||||
Proceeds from sale of property, plant and equipment | 7 | 232 | 154 | ||||||||
Decrease (increase) in other assets | (293 | ) | 790 | (2,638 | ) | ||||||
Cash paid for business acquisitions, net of cash acquired | (2,010 | ) | — | (7,737 | ) | ||||||
Net cash provided by (used in) investing activities | 2,614 | (13,812 | ) | 20,207 | |||||||
CASH FLOWS FROM FINANCING ACTIVITIES | |||||||||||
Proceeds from issuance of common stock | 1,398 | 1,362 | 1,863 | ||||||||
Net proceeds of long-term debt | 13,683 | — | — | ||||||||
Repayment of long-term debt | (77 | ) | — | — | |||||||
Payment of withholding taxes on stock-based compensation | (839 | ) | (638 | ) | (1,850 | ) | |||||
Cash dividends paid to shareholders | — | — | (7,266 | ) | |||||||
Share repurchases | — | — | (1,456 | ) | |||||||
Net cash provided by (used in) financing activities | 14,165 | 724 | (8,709 | ) | |||||||
Effect of exchange rate changes on cash | (627 | ) | (195 | ) | (1,472 | ) | |||||
NET CHANGE IN CASH, CASH EQUIVALENTS AND RESTRICTED CASH | 15,319 | (8,581 | ) | (17,467 | ) | ||||||
CASH, CASH EQUIVALENTS AND RESTRICTED CASH AT BEGINNING OF PERIOD | 42,413 | 50,994 | 68,461 | ||||||||
CASH, CASH EQUIVALENTS AND RESTRICTED CASH AT END OF PERIOD | $ | 57,732 | $ | 42,413 | $ | 50,994 | |||||
SUPPLEMENTAL CASH FLOW INFORMATION | |||||||||||
Cash paid for interest | $ | (121 | ) | $ | (57 | ) | $ | (109 | ) | ||
Cash paid for income taxes | (530 | ) | (806 | ) | (1,157 | ) | |||||
Income tax refunds received | 123 | 140 | 633 | ||||||||
Net increase in property, plant and equip. & other assets related to transfers from inventory | 5,985 | 3,866 | 1,091 | ||||||||
Non-cash additions to property, plant and equipment | 40 | 766 | 372 | ||||||||
42
ELECTRO SCIENTIFIC INDUSTRIES, INC.
NOTES TO CONSOLIDATED FINANCIAL STATEMENTS
1. The Company
Electro Scientific Industries, Inc. and its subsidiaries (ESI, we, our, or the Company) is a leading supplier of innovative laser-based microfabrication solutions for industries reliant on microtechnologies. ESI's integrated solutions allow industrial designers and process engineers to control the power of laser light to transform materials in ways that differentiate their consumer electronics, wearable devices, semiconductor circuits and high-precision components for market advantage. Founded in 1944, ESI is headquartered in Portland, Oregon, with global operations and subsidiaries in Asia, Europe and North America.
2. Summary of Significant Accounting Policies
Basis of Presentation
The accompanying consolidated financial statements include the accounts of Electro Scientific Industries, Inc. and its subsidiaries. All intercompany accounts and transactions have been eliminated.
The Company’s fiscal year consists of 52 or 53 week periods ending on the Saturday nearest March 31. Accordingly, the fiscal 2017 reporting period consisted of a 52-week period ending on April 1, 2017, the fiscal 2016 reporting period consisted of a 53-week period ending on April 2, 2016 and the fiscal 2015 reporting period consisted of a 52-week period ending on March 28, 2015. All references to years or quarters relate to fiscal years or fiscal quarters unless otherwise noted.
Estimates
The preparation of consolidated financial statements in conformity with accounting principles generally accepted in the United States (GAAP) requires management to make estimates and assumptions that affect the reported amounts of assets and liabilities and disclosure of commitments and contingencies at the date of the financial statements and the reported amounts of revenues and expenses during the reporting periods. Actual results may differ from those estimates.
Management believes that the estimates used are reasonable. Significant estimates made by management include: revenue recognition; inventory valuation; accrued restructuring costs; share-based compensation; income taxes, including the valuation of deferred tax assets; valuation of long-lived assets, including intangibles; valuation of goodwill and acquisition accounting.
Risks and Uncertainties
The Company uses financial instruments that potentially subject it to concentrations of credit risk. Such instruments include cash equivalents, available-for-sale marketable securities, trade receivables and financial instruments used in hedging activities. The Company invests cash in cash deposits, money market funds, commercial paper, certificates of deposit and readily marketable securities. Investments are placed with high credit quality financial institutions and the credit exposure from any one institution or instrument is minimized. See Note 5 “Fair Value Measurements” for further discussion on these investments.
The Company sells a significant portion of its products to a small number of large printed circuit board (PCB), semiconductor and microelectronics manufacturers. Our top ten customers for 2017, 2016 and 2015 accounted for approximately 47%, 51% and 40% of total net sales, respectively. Two customers, Sumitomo Corporation and Zhen Ding Technologies accounted for approximately 12% and 11% of net sales, respectively, in 2017. One customer, Apple Inc. and its affiliates, accounted for approximately 15% of net sales in 2016. No other customer individually accounted for more than 10% of total net sales in 2017, 2016 or 2015. The Company’s operating results may be adversely affected if orders and revenues from these key customers decline.
The Company uses qualified manufacturers to supply many components and sub-system modules of its products. The systems that the Company manufactures use high-performance computers, peripherals, lasers and other components from various suppliers. The Company obtains some of the components from a single source or a limited group of suppliers. An interruption in the supply of a particular component may have a temporary adverse impact on the Company’s operating results.
The Company’s operations involve a number of other risks and uncertainties including but not limited to those relating to the seasonality of the microelectronics and semiconductor markets, the effect of general economic conditions, rapid changes in technology and international operations.
Cash Equivalents and Investments
All highly liquid investments with a maturity of 90 days or less at the date of purchase are considered to be cash equivalents. Short-term investments reflect marketable securities that have maturities of less than one year or are subject to
43
immediate pre-payment or call provisions. These securities consist primarily of marketable debt securities and are classified as “available-for-sale securities” and recorded at fair market value. Unrealized gains and losses on investments are recorded as a component of accumulated other comprehensive income (loss). To determine whether any existing impairment is other-than-temporary and requires recognition of an impairment loss in the results of operations, the Company evaluates its marketable securities based on the nature of the investments and the Company’s intent and ability to hold the securities until the securities are no longer in an unrealized loss position.
Restricted Cash
Cash and cash equivalents that are restricted as to withdrawal or use under the terms of certain long-term contractual agreements are recorded in Other non-current assets on our balance sheet. The following table provides a reconciliation of cash, cash equivalents, and restricted cash as shown in the statement of cash flows:
(In thousands) | 2017 | |||
Cash and cash equivalents | $ | 56,642 | ||
Restricted cash included in other long-term assets | 1,090 | |||
Total cash, cash equivalents and restricted cash shown in the statement of cash flows | $ | 57,732 | ||
Accounts Receivable and Allowance for Doubtful Accounts
Trade receivables are stated at the amount the Company expects to collect and do not bear interest. Credit limits are established by reviewing the financial history and stability of each customer. Where appropriate, the Company obtains credit rating reports and financial statements of the customer to establish or modify credit limits. On certain foreign sales, letters of credit are obtained. The collectability of trade receivable balances is regularly evaluated based on a combination of factors such as customer reputation and credit-worthiness, past transaction history with the customer, current economic and industry trends, and changes in customer payment terms. If it is determined or estimated that a customer will be unable to fully meet its financial obligation, such as in the case of a bankruptcy filing or other material events impacting its business, a specific allowance for bad debt is recorded to reduce the related receivable to the amount expected to be recovered.
Accrued Restructuring Costs
The Company has engaged, and may continue to engage, in restructuring actions, which require it to make estimates in certain areas including expenses for severance and other employee separation costs. Because the Company has a history of paying severance benefits, expenses associated with exit or disposal activities are recognized when probable and estimable. Should the actual amounts differ from our estimates, the amount of the restructuring charges could be materially impacted. See Note 26 “Restructuring and Cost Management Plans” for further discussion.
Inventories
Inventories are principally valued at standard costs, which approximate the lower of cost (first-in, first-out) or market. Costs utilized for inventory valuation purposes include material, labor and manufacturing overhead. We regularly evaluate the carrying value of inventory based on a combination of factors including, but not limited to, the following: product life cycle, forecasted sales or usage, historical usage rates, estimated service period, product end-of-life dates, estimated current and future market values, service inventory requirements and new product introductions. Purchasing requirements and alternative uses for the inventory are explored within these processes to mitigate inventory exposure. Inventory materials with quantities in excess of forecasted usage are reviewed quarterly for obsolescence. Obsolescence write-downs are typically caused by engineering change orders or product life cycle changes.
Research and development product costs are generally expensed as incurred. Engineering materials that are expected to provide future value are generally classified as raw materials inventory.
Finished goods are reviewed quarterly by product marketing and operating personnel to determine if inventory carrying value exceeds market selling prices. When necessary, we record inventory write-downs as an increase to cost of sales based on the above factors and take into account worldwide quantities on hand, product life cycle and forecasted demand in our analysis.
Shipped Systems Pending Acceptance
Shipped systems pending acceptance relate to systems that have been ordered and shipped to the customer, but where revenue has been deferred in accordance with the Company’s revenue recognition policy. Shipped systems pending acceptance are recognized as cost of sales once all criteria for revenue recognition have been met and revenue is recorded. Shipped systems pending acceptance are valued at standard costs, which approximate the lower of cost (first-in, first-out) or market. Costs utilized in the valuation of shipped systems pending acceptance include material, labor and manufacturing overhead and exclude costs of installation.
44
Property, Plant and Equipment
Property, plant and equipment are stated at cost less accumulated depreciation and amortization. Depreciation and amortization are recognized using the straight-line basis over the estimated useful lives of the assets. Expenditures for maintenance, repairs and minor improvements are expensed as incurred. Major improvements and additions are capitalized. When assets are sold or retired, the cost and related accumulated depreciation and amortization are removed from the accounts and the resulting gain or loss is included as a component of operating expenses.
Long-Lived Assets
Long-lived assets, principally property, plant and equipment and identifiable long-lived intangibles, are reviewed for impairment whenever events or circumstances indicate that the carrying amount of the assets may not be recoverable. The Company evaluates the recoverability of assets to be held and used by comparing the carrying amount of an asset or asset group to estimated future net undiscounted cash flows generated by the asset. If such assets are considered to be impaired, the impairment recognized is measured as the amount by which the carrying amount of the assets exceeds the fair value of the assets.
The Company’s purchased patents are amortized over their estimated useful lives, generally nine to seventeen years.
Other purchased intangible assets with finite useful lives are carried at cost less accumulated amortization. Amortization expense is recognized on a straight-line basis over the estimated useful lives of the intangible assets, which range from one to ten years.
Acquisition Accounting
The fair value of the consideration exchanged in an acquisition is allocated to tangible assets and identifiable intangible assets acquired and liabilities assumed at acquisition date fair value. Goodwill is measured as the excess of the consideration transferred over the net fair value of identifiable assets acquired and liabilities assumed. The accounting for an acquisition involves a considerable amount of judgment and estimation. Cost, income, market or a combination of approaches may be used to establish the fair value of consideration exchanged, assets acquired and liabilities assumed, depending on the nature of those items. The valuation approach is determined in accordance with generally accepted valuation methods or other generally accepted methods. Key areas of estimation and judgment may include the selection of valuation approaches, identification and selection of comparable companies or transactions, projections of future performance, cost of capital, market characteristics, cost structure, impacts of synergies, and estimates of terminal value, among other factors.
While the Company uses best estimates and assumptions as part of the purchase price allocation process to estimate the value of assets acquired and liabilities assumed, estimates are inherently uncertain and subject to refinement. During the measurement period, which may be up to one year from the acquisition date, the Company may record adjustments to the assets acquired and liabilities assumed, with a corresponding offset to goodwill, to the extent that adjustments are identified to the preliminary purchase price allocation. Upon conclusion of the measurement period, or final determination of the value of the assets acquired and liabilities assumed, whichever comes first, any subsequent adjustments are recorded to results from operations. Refer to Note 6 “Business Acquisitions” for further discussion of purchase accounting, valuation methodology and assumptions.
Goodwill
The Company tests goodwill for impairment annually or more frequently if an event occurs or circumstances would indicate that it is more likely than not the fair value of the reporting unit is less than the carrying value. The date of the annual test of goodwill is the first day of the fourth quarter. The carrying value of the reporting unit is determined based on an allocation of the Company's assets and liabilities to the reporting unit using reasonable assumptions. An impairment is recorded in the period identified in the amount by which the carrying value of reporting unit exceeds the fair value of the reporting unit, up to the amount of goodwill recorded.
Other Assets
Other assets include consignment, demonstration (demo) and training equipment, long-term deposits, and non-current accounts receivable.
Consignment, demo and training equipment are recorded at the lower of standard costs or estimated market values, until the assets are sold.
45
Fair Value of Financial Instruments
The carrying amounts of financial instruments, including cash equivalents, accounts receivable, accounts payable, accrued liabilities and income taxes payable approximate fair value because of the nature of the underlying transactions and short-term maturities involved. Current and non-current marketable securities are recorded at fair value which is defined under FASB ASC Topic 820 “Fair Value Measurements and Disclosures” (ASC Topic 820). ASC Topic 820 establishes a three-tier fair value hierarchy, which prioritizes the inputs used in measuring fair value. These tiers include the following:
• | Level 1, defined as observable inputs such as quoted prices in active markets for identical assets or liabilities; |
• | Level 2, defined as inputs that are observable either directly or indirectly such as quoted prices for similar assets or liabilities in active markets, quoted prices for identical or similar assets or liabilities in markets that are not active and other inputs that can be corroborated by observable market data; and |
• | Level 3, defined as unobservable inputs in which little or no market data exists, therefore requiring an entity to develop its own assumptions. |
See Note 5 “Fair Value Measurements” for further discussion and disclosure of fair value on our financial assets and investments.
Derivative Financial Instruments
The Company’s primary objective for holding derivative financial instruments is to manage currency risk. The Company’s accounting policies for these instruments are based on whether they meet the Company’s criteria for designation as hedging transactions, either as cash flow or fair value hedges. A hedge of the exposure to variability in the cash flows of an asset or a liability, or of a forecasted transaction, is referred to as a cash flow hedge. A hedge of the exposure to changes in fair value of an asset or a liability, or of an unrecognized firm commitment, is referred to as a fair value hedge. The criteria for designating a derivative as a hedge include the instrument’s effectiveness in risk reduction and, in most cases, a one-to-one matching of the derivative instrument to its underlying transaction. The Company enters into foreign currency exchange contracts to offset the earnings impact relating to the variability in exchange rates on certain short-term monetary assets and liabilities denominated in non-functional currencies. The Company does not designate these foreign currency contracts as hedges. The change in fair value of these derivative instruments not designated as hedging instruments is reported each period in other income (expense), net, in our Consolidated Statement of Operations.
Revenue Recognition
The Company recognizes revenue when persuasive evidence of an arrangement exists, delivery has occurred or the services have been rendered, the sales price is fixed or determinable and collection of the related receivable is reasonably assured. Title and risk of loss generally pass to the customer at the time of delivery of the product to a common carrier. Revenue is recognized upon such delivery, provided that fulfillment of acceptance criteria can be demonstrated prior to shipment. Where the acceptance criteria cannot be demonstrated prior to shipment, as in the case of substantially new products, revenue is deferred until acceptance has been received. For multiple element arrangements, the relative fair value of any undelivered elements is deferred until the elements are delivered and acceptance criteria, if any, are met. Revenues are recorded net of taxes collected which are required to be submitted to government authorities. Installation services are not essential to the functionality of the delivered equipment and installation revenue is deferred as a separate deliverable until installation is complete. Neither accrued installation costs nor the fair value of installation service revenue deferred has been material.
Revenues associated with sales to customers under local contracts in Japan are recognized upon title transfer, which generally occurs upon customer acceptance. Revenues related to spare parts and consumable sales are generally recognized upon shipment. Revenues related to maintenance and service contracts are generally recognized ratably over the duration of the contracts.
Product Warranty
The Company evaluates obligations related to product warranties quarterly. A standard warranty is provided on most of our products over a specified period of time, generally 12 to 24 months, at no cost to our customers. Warranty charges are comprised of costs to service the warranty, including labor to repair the system and replacement parts for defective items, as well as other costs incidental to the repairs. Warranty charges are recorded net of any cost recoveries resulting from either successful repair of damaged parts or from warranties offered by the Company’s suppliers for defective components. Using historical data, the Company estimates average warranty cost per system or part type and records the provision for such charges as an element of cost of sales upon recognition of the related revenue. Additionally, the overall warranty accrual balance is separately analyzed using the remaining warranty periods outstanding on systems and items under warranty, and any resulting changes in estimates are recorded as an adjustment to cost of sales. If circumstances change, or if a significant change in warranty-related incidents occurs, the impact of the change in the warranty accrual could be material. Accrued product warranty is included on the Consolidated Balance Sheets as a component of accrued liabilities.
46
Research and Development
Research and development costs, which include labor and related employee expenses, patent maintenance fees, project materials costs, development tool placement and installation costs, project subcontractors, depreciation of engineering equipment, building costs and other administration expenses, are generally expensed as incurred. Engineering materials that are expected to provide future value are included in inventories.
Income Taxes
The Company accounts for income taxes under the asset and liability method. Under this method, deferred income taxes are recognized for the future tax consequences attributable to temporary differences between the financial statement and tax balances of existing assets and liabilities. Deferred tax assets and liabilities are measured using enacted tax rates expected to apply to taxable income in the years in which those assets and liabilities are expected to be recovered or settled. The effect on deferred taxes resulting from a change in tax rates is recognized in income in the period that includes the enactment date. When management determines that it is not more likely than not that a deferred tax asset will be fully realized, a valuation allowance is established to reduce deferred tax assets to the amount expected to be realized.
Comprehensive Income (Loss)
Comprehensive income (loss) includes net income (loss) and other comprehensive income (loss), which includes charges or credits to equity that are not the result of transactions with shareholders. Comprehensive income (loss) comprised primarily of cumulative foreign currency translation adjustments, benefit plan obligations and unrealized gains and losses on securities available for sale. The cumulative translation adjustment included in accumulated other comprehensive income (loss) at April 1, 2017 and April 2, 2016 was $1.2 million and $0.9 million, respectively.
Earnings Per Share
Basic earnings per share (EPS) is computed by dividing income available to common stockholders by the weighted average number of shares outstanding during the period. Diluted EPS also considers common stock equivalents, such as stock options, stock-settled stock appreciation rights (SARs), employee stock purchase plan (ESPP) shares and restricted stock units, to the extent that they are not antidilutive.
Share-Based Compensation
The Company recognizes expense related to the fair value of SARs and the 1990 Employee Stock Purchase Plan (ESPP) using the Black-Scholes model to estimate the fair value of awards on the date of grant. The fair value of time-based and performance-based restricted stock units (RSUs) are measured on the grant date based on the market value of the Company's common stock. The market-based RSUs must achieve the total shareholder return (TSR) measures in order for the awards to vest, and the grant date fair value of the awards is calculated using a Monte Carlo simulation model.
Except performance-based RSUs, the Company recognizes compensation expense for all share-based compensation awards, net of estimated forfeitures, on a straight-line basis over the requisite service period of the award. Expense for performance-based RSUs is recognized based on the probability of achievement of the performance criteria. The compensation cost for market-based RSUs is recognized over the related service period, even if the market condition is never satisfied.
Segment Reporting
The Company complies with ASC Topic 280 Segment Reporting (ASC Topic 280). ASC Topic 280, which is based on a management approach to segment reporting, establishes requirements to report selected segment information quarterly and to report annually entity-wide disclosures about products, major customers and the geographies in which the entity holds material assets and reports revenue. An operating segment is defined as a component that engages in business activities whose operating results are reviewed by the chief operating decision maker and for which discrete financial information is available. Based on the provisions of ASC Topic 280, the Company has determined that it operates in a single segment, a change in the fourth quarter of 2017 described in further detail in Note 25 "Product and Geographic Information". There is no difference between the accounting policies used for our business segment compared to those used on a consolidated basis.
Employee Benefit Plans
The Company has an employee savings plan under the provisions of Section 401(k) of the Internal Revenue Code. During 2017, 2016 and 2015, contributions to the plan by the Company were $0.8 million, $0.7 million and $0.6 million, respectively.
The Company has defined benefit retirement plans at certain of its foreign subsidiaries. The Company accounts for these plans based on the provisions of ASC Topic 715 Compensation-Retirement Benefits. These plans are immaterial to the financial statements of the Company taken as a whole.
47
3. Recent Accounting Pronouncements
Adopted accounting pronouncements:
In January 2017, the Financial Accounting Standards Board (FASB) issued Accounting Standards Update (ASU) 2017-04, Intangibles—Goodwill and Other (Topic 350): Simplifying the Test for Goodwill Impairment in order to simplify the accounting for goodwill impairment where step two was required in the past. In place of step two, companies will recognize an impairment loss equal to the amount by which the carrying value exceeds the implied fair value; not to exceed the total amount of goodwill allocated to the reporting unit. The Company elected to early adopt ASU 2017-04 on a prospective basis as of January 1, 2017, and incurred a non-cash Goodwill impairment charge of $7.4 million. See Note 11 "Goodwill" for more details.
In November 2016, the FASB issued ASU 2016-18, Statement of Cash Flows (Topic 230) Restricted Cash (a consensus of the FASB Emerging Issues Task Force), which provides specific guidance for classifying and presenting changes in restricted cash and restricted cash equivalents on the statement of cash flows due to transfers or transactions in order to reduce the diversity in practice. The Company elected to early adopt ASU 2016-18 and included restricted cash of $1.1 million in end of period cash, cash equivalents, and restricted cash in the statement of cash flows.
In August 2014, the FASB issued ASU 2014-15, Presentation of Financial Statements—Going Concern (Subtopic 205-40): Disclosure of Uncertainties about an Entity’s Ability to Continue as a Going Concern, which provides guidance on determining when and how to disclose going-concern uncertainties in the financial statements. The standard requires management to perform interim and annual assessments of an entity's ability to continue as a going concern within one year of the date of issuance of the entity's financial statements and provide certain disclosure if conditions or events raise substantial doubt about the entity's ability to continue as a going concern. The Company adopted ASU 2014-15 in the fourth quarter of 2017, and it did not have any effect on the Company's disclosures.
Recently issued accounting pronouncements not yet adopted
In May 2017, FASB issued ASU 2017-09, Compensation—Stock Compensation (Topic 718): Scope of Modification Accounting, which amends the scope of modification accounting surrounding share-based payment arrangements as issued in ASU 2016-09 by providing guidance on the various types of changes which would trigger modification accounting for share-based payment awards. ASU 2017-09 is effective for annual periods beginning after December 15, 2017, and interim periods within those annual periods, which would be the Company's fiscal year ending March 30, 2019. Early adoption is permitted, including adoption in any interim period, for public business entities for reporting periods for which financial statements have not yet been issued. While the Company does not expect the adoption of ASU 2017-09 to have a material effect on its business, the Company is still evaluating any potential impact that adoption of ASU 2017-09 may have on its financial position, results of operations or cash flows.
In March 2017, the FASB issued ASU 2017-07, Compensation—Retirement Benefits (Topic 715): Improving the Presentation of Net Periodic Pension Cost and Net Periodic Postretirement Benefit Cost, which requires companies to disaggregate the current-service-cost component from other components of net benefit cost and provides specific guidance for presentation in the income statement. ASU 2017-07 is effective for annual periods beginning after December 15, 2017, and interim periods within those annual periods, which would be the Company's fiscal year ending March 30, 2019. Early adoption is permitted as of the beginning of an annual period for which financial statements (interim or annual) have not been issued or made available for issuance. While the Company does not expect the adoption of ASU 2017-07 to have a material effect on its business, the Company is still evaluating any potential impact that adoption of ASU 2017-07 may have on its financial position, results of operations or cash flows.
In May 2014, the FASB issued ASU 2014-09, Revenue from Contracts with Customers: Topic 606 (ASU 2014-09), to supersede nearly all existing revenue recognition guidance under U.S. GAAP. The core principle of ASU 2014-09 is to recognize revenues when promised goods or services are transferred to customers in an amount that reflects the consideration that is expected to be received for those goods or services. In August 2015, the FASB issued ASU 2015-14, Revenue from Contracts with Customers: Deferral of the Effective Date, which deferred the effective date for implementation of ASU 2014-09 by one year, making the new guidance effective for annual reporting periods beginning after December 15, 2017, with early adoption permitted no earlier than the original effective date. The FASB has continued to issue ASU topics to further clarify ASU 2014-09. These have included ASU 2016-08, ASU 2016-10, ASU 2016-12, and ASU 2016-20. The effective date and transition requirements of these ASU topics are the same as the effective date and transition requirements of ASU 2015-14. The new standards are effective for the Company's fiscal year ending March 30, 2019, beginning with the first quarter of that fiscal year.
48
The new standard permits adoption by using either (i) a full retrospective approach for all periods presented in the period of adoption or (ii) a modified retrospective approach with the cumulative effect of initially applying the new standard recognized at the date of initial application and providing certain additional disclosures. The Company has not yet finalized which transition method will be used; however, at this time it expects to adopt the modified retrospective approach. The final determination of the transition method depends on a number of factors including the impact on comparability, the ability to support related disclosures, and the overall nature and significance of the associated changes to the financial statements. The Company has developed an implementation plan and assigned cross-functional internal resources to perform a comprehensive assessment of the new standard and its impact on the financial statements of the Company. This assessment is ongoing and includes identification, consideration, and quantification of the impact of the new standard on the Company's financial statements, accounting policies, processes, control environment and systems. The outcome of this evaluation will be the implementation of supporting processes and systems that enable timely and accurate reporting under the new standard as well as the determination of which transition method is most appropriate.
While the Company continues to assess all potential impacts under the new standard, a preliminary assessment would indicate that the new standard is unlikely to drive a significant change to the amount or timing of revenue recognition related to system sales or service contracts, the Company’s major revenue streams. The Company believes that certain aspects of the new guidance will require significant judgment, including identification of relevant performance obligations and quantification of the consideration to which the entity expects to be entitled in exchange for those goods or services. Further, in connection with the adoption of the standard, the Company expects to be required to capitalize certain costs, primarily commission expense to sales representatives, and amortize such costs over the period of performance for the underlying contracts. The Company is still evaluating the impact of capitalizing costs to execute a contract, which it expects to primarily affect commissions on service contracts as these contracts frequently have a duration approximating or exceeding one year; however, this impact is not expected to be significant. This preliminary assessment is based on the Company's hypothetical analysis of actual historical revenue transactions under the new guidance and presumes certain conclusions as it relates to accounting policies under the new standard. Due to the complexity of certain of our contracts, the actual revenue recognition treatment required under the new standard for these arrangements may be dependent on contract-specific terms and may vary from this overall expectation. The Company currently expects that necessary operational changes will be implemented prior to the adoption date. As the Company’s assessment of the new standard’s impacts is ongoing, including the areas described above, the Company cannot reasonably provide further estimates of the quantitative impacts to its financial statements at this time.
In October 2016, the FASB issued ASU 2016-16, Income Taxes (Topic 740): Intra-Entity Transfers of Assets Other Than Inventory, to improve and simplify the accounting for the income tax consequences of intra-entity transfers of assets other than inventory, requiring companies to recognize income tax consequences upon the transfer of the asset to a third party. ASU 2016-16 is effective for annual periods beginning after December 15, 2017, and interim periods within those annual periods, which would be the Company's fiscal year ending March 30, 2019. While the Company does not expect the adoption of ASU 2016-16 to have a material effect on its business, the Company is still evaluating any potential impact that adoption of ASU 2016-16 may have on its financial position, results of operations or cash flows.
In August 2016, the FASB issued ASU 2016-15, Statement of Cash Flows (Topic 230) Classification of Certain Cash Receipts and Cash Payments, which will make eight targeted changes to how cash receipts and cash payments are presented and classified in the statement of cash flows. While the Company does not expect the adoption of ASU 2016-15 to have a material effect on its business, the Company is still evaluating any potential impact that adoption of ASU 2016-15 may have on its financial position, results of operations or cash flows.
In March 2016, the FASB issued ASU 2016-09, Compensation – Stock Compensation – Improvements to Employee Share-Based Payment Accounting. ASU 2016-09 simplifies the accounting for several aspects of the accounting for share-based payment transactions, including the income tax consequences, classification of awards as either equity or liabilities and classification on the statement of cash flows. ASU 2016-09 is effective for annual periods beginning after December 15, 2016, and interim periods within those annual periods, which would be the Company's fiscal year ending March 31, 2018. While the Company does not expect the adoption of ASU 2016-09 to have a material effect on its business, the Company is still evaluating any potential impact that adoption of ASU 2016-09 may have on its financial position, results of operations or cash flows.
In February 2016, the FASB issued ASU 2016-02, Leases. ASU 2016-02 increases transparency and comparability among organizations by recognizing lease assets and lease liabilities on the balance sheet and requires disclosing key information about leasing arrangements. ASU 2016-02 is effective for annual periods beginning after December 15, 2018 and interim periods within those annual periods, which would be the Company's fiscal year ending March 28, 2020. The Company is still evaluating any potential impact that adoption of ASU 2016-02 may have on its financial position, results of operations or cash flows.
49
4. Share-Based Compensation
The Company's employee share-based compensation plans consist of its 2004 Stock Incentive Plan (the 2004 Plan) and the 1990 Employee Stock Purchase Plan (ESPP). The 2004 plan, as amended, has been approved to reserve a total of 4,750,000 shares of common stock for issuance to employees and directors of the Company. It allows for grants of stock options, stock appreciation rights, stock bonuses; RSUs including time-based, performance-based, and market-based RSU awards; and dividend equivalents. The ESPP, as approved, reserves 4,400,000 shares of common stock for issuance to participating employees.
Eligible employees may elect to contribute up to 15 percent of their base wage and commissions during each pay period, up to a maximum of 500 shares per purchase date. The ESPP provides for separate overlapping twenty-four month offerings starting every three months. Each offering has eight purchase dates occurring every three months on designated dates. The offerings under the ESPP commence on February 15, May 15, August 15 and November 15 of each calendar year. Any eligible employee may participate in only one offering at a time and may purchase shares only through payroll deductions permitted under the ESPP. At the end of each three-month purchase period, the purchase price is determined and the accumulated funds are used to automatically purchase shares of common stock. The purchase price per share is equal to 85 percent of the lower of the fair market value of the common stock on (a) the first day of the offering period or (b) the date of purchase. The ESPP also provides that if the fair market value of the common stock on the first day of the new offering period is less than or equal to the fair market value of the common stock on the first date of any ongoing offering, employees participating in any such ongoing offering will be automatically withdrawn from it and enrolled in the new offering.
SARs grant the right to receive shares of the Company's stock equivalent to the increase in stock value of a specified number of shares over a specified period of time, divided by the stock price at the time of exercise. RSU's grant the right to receive a set number of shares on the vest date, assuming all criteria have been met and continued service through the vest date. Time-based RSU's vest solely based on continued service through the vest date. Performance-based RSU's are earned based on specifically stated performance criteria in the grant agreement. Market-based RSUs must achieve the TSR measures based on the Company's stock performance relative to a stated index. See Note 2 "Summary of Significant Accounting Policies" for further discussion concerning the Company's policies for recognizing compensation expense for these awards.
Share-based compensation expense was included in the Company’s Consolidated Statements of Operations as follows:
(In thousands) | 2017 | 2016 | 2015 | ||||||||
Cost of sales | $ | 503 | $ | 445 | $ | 586 | |||||
Selling, general and administration | 5,197 | 3,004 | 2,847 | ||||||||
Research, development and engineering | 737 | 783 | 1,109 | ||||||||
Share-based compensation expense | $ | 6,437 | $ | 4,232 | $ | 4,542 | |||||
The total amount of net cash received from the stock plan awards was $0.5 million, $0.7 million and zero for 2017, 2016 and 2015, respectively. All stock plan awards are settled with newly issued shares.
No share-based compensation costs were capitalized during 2017, 2016 or 2015. As of April 1, 2017, the Company had $10.0 million of total unrecognized share-based compensation costs, net of estimated forfeitures, which are expected to be recognized over a weighted average period of 2.1 years.
Valuation Assumptions
The Black-Scholes pricing model is utilized to determine the fair value of SARs granted and ESPP issued. No SARs were granted in 2017.
The following weighted average assumptions were used in calculating the grant date fair value of SARs during the periods presented:
2017 | 2016 | 2015 | ||||||
Risk-free interest rate | — | % | 1.94 | % | 2.04 | % | ||
Expected dividend yield | — | % | — | % | 4.6 | % | ||
Expected lives | 0.0 years | 7.4 years | 7.0 years | |||||
Expected volatility | — | % | 47 | % | 47 | % | ||
50
The following weighted average assumptions were used to estimate the fair value of ESPP shares issued in the periods presented:
2017 | 2016 | 2015 | ||||||
Risk-free interest rate | 0.68 | % | 0.34 | % | 0.24 | % | ||
Expected dividend yield | — | % | — | % | 3.2 | % | ||
Expected lives | 1.1 years | 1.1 years | 1.1 years | |||||
Expected volatility | 45 | % | 35 | % | 41 | % | ||
The risk-free interest rates used are based on the U.S. Treasury yields over the expected terms. In December 2011, the Board of Directors adopted a dividend policy under which the Company made quarterly cash dividends payments. Accordingly, the Company paid a dividend of $0.08 per outstanding common share in first three quarters of 2015. In the fourth quarter of 2015, the Board of Directors suspended the quarterly dividend payment and, as such, no dividends were paid in that quarter or any quarter of 2016 or 2017. The expected dividend yield used is derived using a mathematical formula which uses the expected Company annual dividend rate over the expected term divided by the fair value of the Company’s common stock at the grant date.
The fair value of time-based RSUs and performance-based RSUs are measured on the grant date based on the market value of the Company's common stock. The market-based RSUs must achieve the TSR measures in order for the awards to vest, and the grant date fair value of the awards is calculated using a Monte Carlo simulation model. The assumptions used in the Monte Carlo simulation includes the risk free rate, expected divided yield, expected term, and possible future stock prices over the performance period based on historical stock and market prices.
At April 1, 2017, the Company had 7,345,334 shares of its common stock reserved for issuance under all of the above plans combined. Of those shares, 4,193,485 are subject to issuance under currently outstanding stock options, SARs and stock awards and 3,151,849 shares, including 285,414 shares available for issuance under the ESPP, and are available for future grants.
The total fair value of stock option and SARs awards granted and vested during the period, unvested restricted stock unit awards granted and vested during the period, the intrinsic value of stock options and SARs exercised during the period and the total grant date fair value were:
(In thousands, except per share data) | 2017 | 2016 | 2015 | ||||||||
Stock-Option and SAR Awards: | |||||||||||
Grant date fair value per share | $ | — | $ | 2.89 | $ | 2.12 | |||||
Total fair value of options and SARs granted | — | 1,350 | 1,291 | ||||||||
Total fair value of options and SARs vested | 820 | 336 | 409 | ||||||||
Total intrinsic value of options and SARs exercised | 17 | 1 | 18 | ||||||||
Unvested Restricted Stock Unit Awards: | |||||||||||
Grant date fair value per share | 6.71 | 5.52 | 6.80 | ||||||||
Total fair value of awards granted | 11,382 | 4,072 | 5,832 | ||||||||
Total fair value of awards vested | 3,693 | 4,324 | 7,532 | ||||||||
Employee Stock Purchase Plan: | |||||||||||
Grant date fair value per share | 1.40 | 1.22 | 1.72 | ||||||||
Total grant date fair value | 473 | 394 | 559 | ||||||||
51
Share-Based Payment Award Activity
Information with respect to stock option and SAR activity was as follows:
Shares | Weighted Average Exercise Price | Weighted Average Remaining Contractual Term (In years) | Aggregate Intrinsic Value (In thousands) | |||||||||
Outstanding at March 29, 2014 | 1,898,409 | $ | 15.27 | |||||||||
Granted | 634,523 | 6.91 | ||||||||||
Exercised | (8,250 | ) | 7.26 | |||||||||
Expired or forfeited | (295,636 | ) | 18.30 | |||||||||
Outstanding at March 28, 2015 | 2,229,046 | $ | 12.52 | 4.45 | $ | — | ||||||
Granted | 467,000 | 5.63 | ||||||||||
Exercised | (2,500 | ) | 6.71 | |||||||||
Expired or forfeited | (537,946 | ) | 16.53 | |||||||||
Outstanding at April 2, 2016 | 2,155,600 | $ | 10.03 | 5.35 | $ | 904 | ||||||
Granted | — | — | ||||||||||
Exercised | (22,500 | ) | 6.23 | |||||||||
Expired or forfeited | (191,097 | ) | 19.20 | |||||||||
Outstanding at April 1, 2017 | 1,942,003 | $ | 9.17 | 4.82 | $ | 634 | ||||||
Vested and expected to vest at April 1, 2017 | 1,928,853 | $ | 9.20 | 4.80 | $ | 619 | ||||||
Exercisable at April 1, 2017 | 1,385,837 | $ | 10.39 | 3.62 | $ | 167 | ||||||
Information with respect to unvested time-based restricted stock unit awards activity was as follows:
Shares | Weighted Average Grant Date Fair Value | Weighted Average Remaining Contractual Term (In years) | Aggregate Intrinsic Value (In thousands) | |||||||||
Outstanding at March 29, 2014 | 1,115,601 | $ | 11.47 | |||||||||
Awarded | 459,295 | 6.33 | ||||||||||
Vested | (672,930 | ) | 11.19 | |||||||||
Forfeited | (66,125 | ) | 9.82 | |||||||||
Outstanding at March 28, 2015 | 835,841 | $ | 8.90 | 1.91 | $ | 5,149 | ||||||
Awarded | 737,200 | 5.52 | ||||||||||
Vested | (360,349 | ) | 11.75 | |||||||||
Forfeited | (130,888 | ) | 7.66 | |||||||||
Outstanding at April 2, 2016 | 1,081,804 | $ | 6.77 | 1.93 | $ | 7,781 | ||||||
Awarded | 1,051,445 | 6.63 | ||||||||||
Vested | (483,239 | ) | 7.64 | |||||||||
Forfeited | (42,093 | ) | 6.67 | |||||||||
Outstanding at April 1, 2017 | 1,607,917 | $ | 6.41 | 2.04 | $ | 11,168 | ||||||
52
Information with respect to unvested performance-based and market-based restricted stock unit awards activity was as follows:
Shares | Weighted Average Grant Date Fair Value | Weighted Average Remaining Contractual Term (In years) | Aggregate Intrinsic Value (In thousands) | |||||||||
Outstanding at March 29, 2014 | 396,533 | $ | 10.33 | |||||||||
Awarded | 398,905 | 7.33 | ||||||||||
Vested(1) | (234 | ) | — | |||||||||
Forfeited | (201,500 | ) | 11.63 | |||||||||
Outstanding at March 28, 2015 | 593,704 | $ | 7.88 | 1.81 | $ | 3,657 | ||||||
Awarded | — | — | ||||||||||
Vested(1) | (5,592 | ) | 14.64 | |||||||||
Forfeited | (187,125 | ) | 10.84 | |||||||||
Outstanding at April 2, 2016 | 400,987 | $ | 6.93 | 1.00 | $ | 2,928 | ||||||
Awarded | 643,565 | 6.85 | ||||||||||
Vested(1) | — | — | ||||||||||
Forfeited | (400,987 | ) | 6.93 | |||||||||
Outstanding at April 1, 2017 | 643,565 | $ | 6.85 | 2.43 | $ | 4,409 | ||||||
(1) | Zero performance-based shares were earned in 2017, 2016 and 2015. |
Grants during 2017 presented in the above tables include 248,565 market-based RSUs and 229,445 time-based RSUs granted to the Company's newly appointed President and CEO. Additionally, the company granted 152,000 time-based RSUs and 90,000 performance-based RSUs to the employees of the Company who were hired as part of the Visicon acquisition during fiscal 2017 (see Note 6 "Business Acquisitions").
53
5. Fair Value Measurements
Financial Assets Measured at Fair Value
The Company’s fair value hierarchy for its financial assets measured at fair value on a recurring basis as of April 1, 2017 and April 2, 2016 was as follows (in thousands):
April 1, 2017 | Level 1 | Level 2 | Level 3 | Total | |||||||||||
Cash equivalents: | |||||||||||||||
Money market securities | $ | 22,395 | $ | — | $ | — | $ | 22,395 | |||||||
Commercial paper | — | 4,945 | — | 4,945 | |||||||||||
Total cash equivalents | $ | 22,395 | $ | 4,945 | $ | — | $ | 27,340 | |||||||
Short term investments - available for sale: | |||||||||||||||
Commercial paper | — | 5,743 | — | 5,743 | |||||||||||
Total short-term investments - available for sale | $ | — | $ | 5,743 | $ | — | $ | 5,743 | |||||||
Forward purchase or (sale) contracts: | |||||||||||||||
Japanese Yen | $ | — | $ | 9 | $ | — | $ | 9 | |||||||
New Taiwan Dollar | — | 20 | — | 20 | |||||||||||
Korean Won | — | 39 | — | 39 | |||||||||||
Euro | — | (96 | ) | — | (96 | ) | |||||||||
British Pound | — | 16 | — | 16 | |||||||||||
Chinese Renminbi | — | (5 | ) | — | (5 | ) | |||||||||
Singapore Dollar | — | (1 | ) | — | (1 | ) | |||||||||
Total forward contracts | $ | — | $ | (18 | ) | $ | — | $ | (18 | ) | |||||
Deferred compensation plan assets:* | |||||||||||||||
Mutual funds and exchange traded funds | $ | 845 | $ | — | $ | — | $ | 845 | |||||||
Money market securities | 2,213 | — | — | 2,213 | |||||||||||
Total deferred compensation plan assets | $ | 3,058 | $ | — | $ | — | $ | 3,058 | |||||||
*These investments represent assets held in trust for our deferred compensation plan
On January 9, 2017, ESI Leasing, LLC (ESI Leasing), a wholly owned subsidiary of the Company, entered into a loan agreement (Loan Agreement) with First Technology Federal Credit Union (Lender). The Loan Agreement provides for a term loan from the Lender to ESI Leasing in the principal amount of $14 million (Loan). The fair value of the Loan approximates the carrying value due to the recent financing and the relative stability of the interest rate environment since funding. See Note 21 "Debt" for further discussion.
54
April 2, 2016 | Level 1 | Level 2 | Level 3 | Total | |||||||||||
Cash equivalents: | |||||||||||||||
Money market securities | $ | 4,643 | $ | — | $ | — | $ | 4,643 | |||||||
Commercial paper | — | 12,140 | — | 12,140 | |||||||||||
Total cash equivalents | $ | 4,643 | $ | 12,140 | $ | — | $ | 16,783 | |||||||
Short term investments - available for sale: | |||||||||||||||
U.S. treasury fund | $ | 1,003 | $ | — | $ | — | $ | 1,003 | |||||||
Commercial paper | — | 997 | — | 997 | |||||||||||
Government agencies | — | 13,252 | — | 13,252 | |||||||||||
Total short-term investments - available for sale | $ | 1,003 | $ | 14,249 | $ | — | $ | 15,252 | |||||||
Forward purchase or (sale) contracts: | |||||||||||||||
Japanese Yen | $ | — | $ | (31 | ) | $ | — | $ | (31 | ) | |||||
New Taiwan Dollar | — | 5 | — | 5 | |||||||||||
Korean Won | — | 129 | — | 129 | |||||||||||
Euro | — | (367 | ) | — | (367 | ) | |||||||||
Chinese Renminbi | — | (1 | ) | — | (1 | ) | |||||||||
Singapore Dollar | — | 20 | — | 20 | |||||||||||
Total forward contracts | $ | — | $ | (245 | ) | $ | — | $ | (245 | ) | |||||
Deferred compensation plan assets:* | |||||||||||||||
Mutual funds and exchange traded funds | $ | 1,916 | $ | — | $ | — | $ | 1,916 | |||||||
Money market securities | 588 | — | — | 588 | |||||||||||
Total deferred compensation plan assets | $ | 2,504 | $ | — | $ | — | $ | 2,504 | |||||||
*These investments represent assets held in trust for our deferred compensation plan
For Level 1 assets, the Company utilized quoted prices in active markets for identical assets.
For Level 2 assets, exclusive of forward contracts, the Company utilized quoted prices in active markets for similar assets. For forward contracts, spot prices at April 1, 2017 and April 2, 2016 were utilized to calculate fair values.
During 2017 and 2016, there were no transfers between Level 1, 2 or 3 assets.
55
Investments
The Company’s investments at April 1, 2017 and April 2, 2016 were as follows (in thousands):
Unrealized | |||||||||||||||
April 1, 2017 | Cost | Gain | Loss | Fair Value | |||||||||||
Available-for-sale securities (current): | |||||||||||||||
Commercial paper | $ | 10,688 | $ | — | $ | — | $ | 10,688 | |||||||
Total investments (current) | $ | 10,688 | $ | — | $ | — | $ | 10,688 | |||||||
Available-for-sale securities (non-current): | |||||||||||||||
Mutual funds, exchange traded funds and money market securities* | $ | 2,974 | $ | 84 | $ | — | $ | 3,058 | |||||||
Total investments (non-current) | $ | 2,974 | $ | 84 | $ | — | $ | 3,058 | |||||||
Unrealized | |||||||||||||||
April 2, 2016 | Cost | Gain | Loss | Fair Value | |||||||||||
Available-for-sale securities (current): | |||||||||||||||
Commercial paper | $ | 13,137 | $ | — | $ | — | $ | 13,137 | |||||||
Government agencies | 13,247 | 5 | — | 13,252 | |||||||||||
Total investments (current) | $ | 26,384 | $ | 5 | $ | — | $ | 26,389 | |||||||
Available-for-sale securities (non-current): | |||||||||||||||
Mutual funds, exchange traded funds and money market securities* | 2,507 | — | (3 | ) | 2,504 | ||||||||||
Total investments (non-current) | $ | 2,507 | $ | — | $ | (3 | ) | $ | 2,504 | ||||||
*These investments represent assets held in trust for our deferred compensation plan
For purposes of determining gross realized gains and losses and reclassification out of accumulated other comprehensive income (loss), the cost of securities sold is based on specific identification. Net unrealized holding gains and losses on current available-for-sale securities included in accumulated other comprehensive income (loss) were insignificant as of April 1, 2017 and April 2, 2016.
Investments with underlying maturities within one year at April 1, 2017, including cash equivalents, totaled $10.7 million.
6. Business Acquisitions
Fiscal 2017
On August 1, 2016, the Company acquired all of the outstanding shares of Visicon Technologies, Inc. (Visicon), a leading supplier of high-accuracy and high-throughput measurement and defect detection systems based in Napa, California. The consideration under the merger agreement is subject to adjustment for indebtedness, seller's transaction expenses, working capital and other items.
Based on estimated closing working capital and other adjustments, the Company paid $2.0 million in cash and expects to issue 637,082 shares of ESI common stock, valued at approximately $4.5 million. The value of the common stock is based on the closing price of stock on August 1, 2016. Of the expected shares to be issued in connection with the agreement, 33,143 shares, adjusted for working capital changes, were reserved in escrow to serve as a source of payment for any purchase price adjustments or indemnity claims by the Company. The sellers have contractually agreed to limitations on the sale of the shares of common stock they receive in connection with the sale of Visicon; specifically, no shares were able to be sold for six months following closing, after which point twenty-five percent of the shares become salable each quarter thereafter. The shares issued as a part of this merger represented a non-cash investing activity of $4.5 million.
56
As of the reporting date, the Company had not yet finalized the valuation of assets acquired, liabilities assumed, and consideration transferred, and the amounts presented below represent provisional amounts based on best estimates. The purchase accounting is not final, pending final negotiation and settlement of amounts in escrow. The provisional amounts shown below may be revised if additional information regarding the fair value of the associated assets acquired, liabilities assumed and consideration transferred as of the acquisition date is identified. The total estimated purchase price of $6.5 million, net of cash acquired, was allocated to the underlying assets acquired and liabilities assumed based on estimated fair value, as shown in the following table:
(In thousands) | |||
Accounts receivable | $ | 391 | |
Inventory | 937 | ||
Prepaid expense and other current assets | 116 | ||
Property, plant and equipment | 641 | ||
Acquired intangibles | 3,300 | ||
Goodwill | 3,027 | ||
Other assets | 26 | ||
Accounts payable and other accrued liabilities | (1,946 | ) | |
Total purchase price, net of cash acquired | $ | 6,492 | |
The acquisition was expected to provide the Company with a portfolio of standalone defect detection systems for the medical device and consumer electronics markets. In addition to a standalone product portfolio and associated value streams, the Company believed the acquisition would provide complementary technology for integrated verification of laser machining, expand its presence into the medical device market, present an opportunity for enhanced vertical integration and result in synergies with the Company's current consumer electronics customer base.
The value of goodwill has not been finalized as the valuation of assets acquired and liabilities assumed and consideration transferred is not yet complete. None of the goodwill is expected to be deductible for tax purposes. The acquired intangible assets consisted primarily of approximately $2.1 million of developed technology. Identified intangible assets are expected to be amortized over their useful lives of one to six years.
In connection with the acquisition of Visicon, the Company is consolidating Visicon operations with ESI operations and streamlining manufacturing and development activities between Napa and existing ESI locations. Approximately $0.4 million in integration costs were incurred through 2017. These costs are included in Acquisition and integration costs in the Condensed Consolidated Statements of Operations, and include transaction fees, travel and other related costs.
The operating results of the acquired entity are included in the Company’s results of operations since the date of acquisition. Pro forma financial information has not been provided for the acquisition of Visicon as it is not material to the Company’s operations or financial position.
Fiscal 2015
On January 15, 2015, the Company acquired all of the outstanding shares of Wuhan Topwin Optoelectronics Technology Co., Ltd. (Topwin), a Chinese manufacturer of laser-based systems for $7.6 million in cash and 748,944 shares of ESI common stock issuable over a three year period, valued at approximately $2.9 million as of the acquisition date. Out of the $2.9 million in equity, one-half, or 374,472 shares, was contingent consideration and one-half, or 374,472 shares, was non-contingent to be issued over a three year period beginning June 30, 2015. The contingent consideration is based on the performance of Topwin, as evaluated against targets for net income for each year over a three year period. One-third of the contingent shares are issued after each year if the target is met for that year. However, failing to meet stated targets will result in none of the contingent shares being issued for that year. As of the acquisition date, the fair value of 374,472 shares of contingent consideration was estimated to be $0.4 million and the fair value of 374,472 shares of non-contingent consideration was estimated to be $2.5 million. The fair value of the non-contingent and contingent shares to be issued over the three year period was determined based on the estimated share price as of the issuance date derived through Monte Carlo simulation, discounted back to the acquisition date. The value of the contingent shares included an estimate of the probability of attainment of the net income targets. Analysis supporting the purchase price allocation included a valuation of assets and liabilities as of the closing date, an analysis of intangible assets and a detailed review of the opening balance sheet to determine other significant adjustments required to recognize assets and liabilities at fair value. Through the fourth quarter of 2017, zero and 212,217 shares of ESI common stock have been issued in connection with contingent and non-contingent consideration under the purchase agreement, respectively.
57
Additionally, the Company agreed to issue, on the same terms described above, up to approximately 513,328 shares valued at $2.0 million, which, together with cash amounts of $0.2 million, is treated as compensation to an employee in the Company who was also a former shareholder of Topwin. The compensation expense was to be recognized over a three year period. From acquisition through the fourth quarter of fiscal 2017, the Company has recognized $1.5 million in share-based compensation expense related to this agreement. From acquisition through the fourth quarter of fiscal 2017, zero and 145,427 shares of ESI common stock have been issued in connection with contingent and non-contingent components of compensation expense, respectively.
The total purchase price of approximately $10.5 million, net of cash acquired, was allocated to the underlying assets acquired and liabilities assumed based on their fair values, as shown in the following table:
(In thousands) | |||
Accounts receivable, net of allowances of $268 | $ | 454 | |
Inventory | 544 | ||
Prepaid expense and other current assets | 295 | ||
Property, plant and equipment | 23 | ||
Acquired intangibles | 3,618 | ||
Goodwill | 7,445 | ||
Accounts payable and other accrued liabilities | (1,859 | ) | |
Total purchase price, net of cash acquired | $ | 10,520 | |
The acquisition was expected to enable the Company to gain entry into the low total-cost-of-ownership solutions market in China and the goodwill of approximately $7.4 million recognized as a result of the acquisition was assigned to the Topwin reporting unit. The premium paid over the fair value of the individual assets acquired and liabilities assumed reflected the Company’s view that this acquisition was the result of a competitive bid process and provided the Company with innovative design and manufacturing capabilities for laser-based manufacturing solutions across a variety of complementary applications, together with direct access to the local China market, supply chain and opto-electronics knowledge center. None of the goodwill was expected to be deductible for tax purposes.
As a result of the acquisition, the Company recorded approximately $4.9 million of identifiable assets, including $3.6 million of identifiable intangible assets and $1.9 million of identifiable liabilities. The acquired intangible assets consisted primarily of $3.5 million of developed technology to be amortized over their useful lives, which ranged from one to ten years.
In 2017, the Company did not incur any Topwin acquisition-related costs while it incurred approximately $0.2 million in 2016. These costs are included in Acquisition and integration costs in the Condensed Consolidated Statements of Operations. The operating results of this acquisition are included in the Company’s results of operations since the date of acquisition. Pro forma financial information has not been provided for the acquisition of Topwin as it is not material to the Company’s operations and overall financial position.
In the first quarter of 2017, the Company entered into an agreement with former Topwin shareholders to settle claims against withheld shares. Pursuant to the purchase agreement and the subsequent settlement agreement, the Company’s obligation to issue shares with a future issuance date, which served as a source of indemnification, was terminated, representing the effective recovery of 63,114 shares. At the date of recovery the shares had a closing price of $6.30 per share and an original fair value of $446 thousand. As a result, the withheld shares which were initially accounted for as stock compensation were deemed to have been forfeited in the first quarter of 2017 and those shares representing contingent consideration and included as a component of purchase price were accounted for within equity. This subsequent recovery of shares issuable under the agreement represented a non-cash investing and financing activity.
In the second quarter of 2017, as a result of this same settlement agreement, all cash amounts held in escrow were released to the Company, representing the recovery of $430 thousand, slightly less than the original cash escrow of $450 thousand due to exchange rate losses. As a result of this recovery, amounts previously recognized as compensation costs were reversed in the current period and those amounts included as a component of purchase price were recognized as a non-operating gain in the second quarter of 2017, and classified accordingly on the statement of cash flows. The purchase price of Topwin was not adjusted for either the stock or cash escrow recoveries as the measurement period for purchase price accounting related to this acquisition had lapsed prior to the recovery of these amounts.
See Note 11 "Goodwill" for further discussion.
58
7. Trade Accounts Receivable
Trade accounts receivable at April 1, 2017 and April 2, 2016 consisted of the following:
(In thousands) | 2017 | 2016 | |||||
Current trade accounts receivable, net | $ | 40,494 | $ | 42,770 | |||
Non-current trade accounts receivable | 489 | 320 | |||||
$ | 40,983 | $ | 43,090 | ||||
Non-current trade accounts receivable are included in Other assets in the Condensed Consolidated Balance Sheets.
8. Inventories
The components of inventories at April 1, 2017 and April 2, 2016 were as follows:
(In thousands) | 2017 | 2016 | |||||
Raw materials and purchased parts | $ | 41,383 | $ | 38,957 | |||
Work-in-process | 13,829 | 14,270 | |||||
Finished goods | 3,730 | 7,243 | |||||
$ | 58,942 | $ | 60,470 | ||||
In 2017, 2016 and 2015, the Company recorded charges to cost of sales for inventory write-offs associated with discontinued products of $1.7 million, $1.4 million and $1.0 million, respectively. Additionally, in 2017, $0.9 million of inventory write-off was recorded for flood damaged inventory at the Company's Wuhan manufacturing facility.
See Note 26 "Restructuring and Cost Management Plans" for further discussion on discontinued product costs.
9. Other Current Assets
Other current assets at April 1, 2017 and April 2, 2016 consisted of the following:
(In thousands) | 2017 | 2016 | |||||
Prepaid expenses | $ | 3,646 | $ | 2,747 | |||
Value added tax receivable | 1,704 | 1,353 | |||||
Other | 830 | 1,240 | |||||
$ | 6,180 | $ | 5,340 | ||||
Included in "Other" Other current assets are non-trade receivables, income tax refund receivable and other similar items.
10. Property, Plant and Equipment, net
Property, plant and equipment as of April 1, 2017 and April 2, 2016 consisted of the following:
(In thousands) | Weighted Average Useful Life (in years) | 2017 | 2016 | ||||||
Land | n/a | $ | 2,152 | $ | 2,152 | ||||
Buildings and improvements | 18 | 36,204 | 36,487 | ||||||
Machinery and equipment | 5 | 59,099 | 57,986 | ||||||
Computer equipment and software | 5 | 36,239 | 35,828 | ||||||
133,694 | 132,453 | ||||||||
Less accumulated depreciation | (112,075 | ) | (107,910 | ) | |||||
$ | 21,619 | $ | 24,543 | ||||||
Depreciation expense totaled $6.9 million, $6.8 million and $7.2 million in 2017, 2016 and 2015, respectively. For the year ended April 1, 2017, the Company performed a review for impairment based on certain triggering events. As a result of this review, no impairments of property, plant and equipment were identified.
Additionally, in 2017 the Company recorded accelerated depreciation charges of $1.4 million associated with the 2017 restructuring actions. See Note 26 "Restructuring and Cost Management Plans" for further discussion.
59
11. Goodwill
The Company had approximately $3.0 million and $7.4 million of goodwill as of April 1, 2017 and April 2, 2016, respectively. The 2016 balance was associated with the Topwin acquisition and the 2017 balance was associated with the recent acquisition of Visicon (See Note 6 "Business Acquisitions" for further discussion). Purchase accounting was not finalized for the Visicon acquisition as of April 1, 2017. Therefore, the related amounts are provisional and may be revised if additional information regarding the fair value of the associated assets acquired and liabilities assumed as of the acquisition date is identified. Changes in these balances are shown below:
(In thousands) | 2017 | 2016 | |||||
Goodwill, beginning | $ | 7,445 | $ | 7,717 | |||
Purchase accounting adjustment - Topwin acquisition | — | (272 | ) | ||||
Recognized goodwill - Visicon acquisition (provisional) | 3,027 | — | |||||
Impaired goodwill - Topwin acquisition | (7,445 | ) | — | ||||
Goodwill, ending | $ | 3,027 | $ | 7,445 | |||
The Company tests goodwill for impairment annually or more frequently if an event occurs or circumstances would indicate that it is more likely than not the fair value of the reporting unit is less than the carrying value. The date of the annual test of goodwill is the first day of the fourth quarter. Accordingly, the Company performed a quantitative test for impairment of the recorded goodwill as of January 1, 2017.
As a result of this test, the estimated fair value of the reporting unit associated with the Topwin acquisition was determined to be less than the carrying value of the reporting unit, indicating a full impairment. This impairment was driven primarily by historical and projected financial performance lower than expectations of the Company and that of comparable companies. The value of the reporting unit was also negatively impacted by a re-evaluation of our product portfolio in connection with announced restructuring plans. This review resulted in the Company prioritizing away from some of the lower-cost systems that were planned for manufacturing at Topwin, impacting the value of the reporting unit.
The Company performed a qualitative test of goodwill associated with the Visicon acquisition and, in part due to the proximity to the acquisition date and the fact that purchase accounting is not yet finalized, the Company determined it is more likely than not the fair value is greater than the carrying value, indicating no impairment.
The fair value of the goodwill was determined using generally accepted valuation approaches. These approaches included a discounted cash flow model, a guideline transaction approach, and a guideline public company market multiples approach, each weighted according to the relevance of each approach. In supporting these valuations, management used assumptions based on the best information available. The loss from impairment of goodwill was recorded as a component of operating expenses in a separate line on the Consolidated Statements of Operations.
12. Acquired Intangible Assets, net
Acquired intangible assets as of April 1, 2017 and April 2, 2016 consisted of the following:
(In thousands, except years) | Weighted Average Useful Life (In years) | 2017 | 2016 | ||||||
Developed technology | 7.5 | $ | 18,646 | $ | 19,457 | ||||
Customer relationships | 5.3 | 3,914 | 3,154 | ||||||
Customer backlog | 1.0 | 1,270 | 1,341 | ||||||
Trade name and trademarks | 3.8 | 793 | 463 | ||||||
Fair value of below-market lease (non-current portion) | 3.8 | 310 | 310 | ||||||
Change of control agreements and non-compete agreements | 2.1 | 160 | 100 | ||||||
Patents | 13.3 | 3,465 | 3,467 | ||||||
28,558 | 28,292 | ||||||||
Less accumulated amortization | (21,994 | ) | (21,146 | ) | |||||
$ | 6,564 | $ | 7,146 | ||||||
On August 1, 2016, the Company acquired Visicon and, as part of that acquisition, recognized $3.3 million of identifiable intangible assets. The acquired intangible assets consisted primarily of approximately $2.1 million of developed technology. (See Note 6 "Business Acquisitions" for further discussion).
60
The Company performed a review of our acquired intangible assets in the fourth quarter of 2017, including a review for impairment based on certain triggering events of amortizing intangible assets. As a result, the Company recognized a $2.3 million impairment of intangibles associated with developed technology related to the Topwin reporting unit. This impairment was driven primarily by historical and projected financial performance lower than expectations of the Company and that of comparable companies. The value of intangibles was also negatively impacted by a re-evaluation of our product portfolio in connection with announced restructuring plans. This review resulted in the Company prioritizing away from some of the lower-cost systems that were planned for manufacturing at Topwin, impacting the value of the reporting unit. The Company determined that the carrying value was greater than the estimated fair value and that it was improbable that the carrying value of the related intangibles would be recovered. The impairment loss was recorded as a component of costs of sales in the Consolidated Statements of Operations.
Amortization expense for acquired intangible assets has been recorded in the Consolidated Statements of Operations as follows:
(In thousands) | 2017 | 2016 | 2015 | ||||||||
Cost of sales | $ | 1,133 | $ | 1,140 | $ | 1,095 | |||||
Selling, general and administration | 209 | 36 | 210 | ||||||||
Research, development and engineering | 188 | 200 | 197 | ||||||||
$ | 1,530 | $ | 1,376 | $ | 1,502 | ||||||
The estimated amortization expense for acquired intangible assets in future years is as follows (in thousands):
Year | Amortization | ||
2018 | $ | 1,433 | |
2019 | 1,439 | ||
2020 | 1,406 | ||
2021 | 1,228 | ||
2022 | 690 | ||
Future years | 368 | ||
$ | 6,564 | ||
13. Other Assets
Other assets consisted of the following as of April 1, 2017 and April 2, 2016:
(In thousands) | 2017 | 2016 | |||||
Consignment and demo equipment, net | $ | 11,011 | $ | 7,242 | |||
Long term deposits | 2,872 | 2,543 | |||||
Long term restricted cash | 1,090 | — | |||||
Non-current trade accounts receivable, net | 489 | 320 | |||||
Other non-current assets | 3,469 | 2,521 | |||||
$ | 18,931 | $ | 12,626 | ||||
Depreciation expense for demo equipment totaled $0.4 million in 2017, $0.5 million in 2016 and $0.6 million 2015. Included in Other non-current assets are long-term investments and other similar items.
61
14. Income Taxes
Net deferred tax assets and liabilities at April 1, 2017 and April 2, 2016 consisted of the following:
(In thousands) | 2017 | 2016 | |||||
Deferred tax assets and liabilities: | |||||||
Inventory valuation and warranty costs | $ | 11,246 | $ | 11,524 | |||
Receivables and other non-current assets | (274 | ) | (91 | ) | |||
Payroll-related accruals | 7,574 | 6,035 | |||||
Intangible assets and investments | (382 | ) | 865 | ||||
Accrued liabilities | 3,006 | 1,626 | |||||
Deferred revenue | 3,478 | 1,746 | |||||
Property, plant and equipment | 5,029 | 5,220 | |||||
Other comprehensive income | 456 | 219 | |||||
Tax loss and credit carryforwards, net of unrecognized tax benefits | 73,805 | 67,630 | |||||
Other assets | 259 | (219 | ) | ||||
Total deferred tax assets | 104,197 | 94,555 | |||||
Valuation allowance, non-current | (103,315 | ) | (93,875 | ) | |||
Net deferred tax assets | $ | 882 | $ | 680 | |||
The Company had approximately $84.7 million and $77.9 million in tax assets resulting from federal, state and foreign net operating losses and tax credits as of April 1, 2017 and April 2, 2016, respectively as follows:
(In thousands) | 2017 | 2016 | |||||
Federal net operating losses | $ | 35,566 | $ | 27,430 | |||
State net operating losses | 3,679 | 3,467 | |||||
Foreign operating losses and tax credits | 12,504 | 12,173 | |||||
Federal research credits | 22,590 | 21,336 | |||||
State research credits | 4,409 | 4,480 | |||||
Federal minimum tax credit | 935 | 990 | |||||
Federal capital losses | 5,015 | 8,022 | |||||
$ | 84,698 | $ | 77,898 | ||||
The federal and state net operating losses expire on various dates through fiscal 2037. The majority of the foreign tax credits expire on various dates through fiscal 2027. The federal and most of the state research credits expire on various dates through fiscal 2037. Certain state research credits and the federal minimum tax credits are available indefinitely. The state net operating losses and credits are reflected net of their federal tax impact.
A valuation allowance is required if it is more likely than not that all or a part of a deferred tax asset will not be realized in the future. A valuation allowance of $103.3 million and $93.9 million existed as of April 1, 2017 and April 2, 2016, respectively. The valuation allowance increased by $9.4 million in 2017 primarily due to continued net operating losses and tax credits.
62
The components of income before income taxes and the (benefit from) provision for income taxes, all from continuing operations, were as follows:
(In thousands) | 2017 | 2016 | 2015 | ||||||||
Income (loss) before income taxes: | |||||||||||
Domestic | $ | (32,646 | ) | $ | (13,385 | ) | $ | (39,656 | ) | ||
Foreign | (4,786 | ) | 1,112 | (3,921 | ) | ||||||
Total loss before income taxes | $ | (37,432 | ) | $ | (12,273 | ) | $ | (43,577 | ) | ||
Provision for (benefit from) income taxes: | |||||||||||
Current: | |||||||||||
U.S. federal and state | $ | (379 | ) | $ | 8 | $ | (983 | ) | |||
Foreign | 557 | 916 | 1,205 | ||||||||
Total current | 178 | 924 | 222 | ||||||||
Deferred: | |||||||||||
U.S. federal and state | — | — | 5 | ||||||||
Foreign | (201 | ) | (940 | ) | 7 | ||||||
Total deferred | (201 | ) | (940 | ) | 12 | ||||||
Total (benefit from) provision for income taxes | $ | (23 | ) | $ | (16 | ) | $ | 234 | |||
The portion of the tax benefit derived from stock-based compensation that is allocated as common stock was zero in 2017, 2016 and 2015.
A reconciliation of the Company’s effective tax rate to the United States federal statutory income tax rate was as follows:
2017 | 2016 | 2015 | ||||||
U.S. federal statutory income tax rate | 35.0 | % | 35.0 | % | 35.0 | % | ||
State income taxes, net of federal benefit | (0.3 | ) | (0.5 | ) | (1.1 | ) | ||
Tax credits | 4.2 | 17.1 | 4.2 | |||||
Domestic production and export tax incentives | (5.9 | ) | — | — | ||||
Non-U.S. income taxed at different rates | (0.9 | ) | 14.3 | 2.1 | ||||
Changes in unrecognized tax benefits | (0.3 | ) | (4.1 | ) | (2.4 | ) | ||
Change in valuation allowance | (25.0 | ) | (51.8 | ) | (32.3 | ) | ||
Stock compensation | (2.6 | ) | (10.2 | ) | (4.2 | ) | ||
Intangible write-off | (5.1 | ) | — | — | ||||
Other, net | 1.0 | 0.3 | (2.0 | ) | ||||
Effective tax rate | 0.1 | % | 0.1 | % | (0.7 | )% | ||
The Company operates globally but considers its significant tax jurisdictions to include Canada, China, France, Japan, Korea, Singapore, Taiwan, the United Kingdom and the United States. The Company currently benefits from a tax incentive program in Singapore pursuant to which we pay no Singapore income tax with respect to our manufacturing income. The incentive period ends on June 30, 2021.
The Company provides for income taxes on its foreign subsidiaries’ taxable income based on the effective income tax rate in each respective jurisdiction. The Company provides for deferred taxes on the undistributed earnings of a subsidiary, except to the extent that the income is intended to be indefinitely reinvested or remitted in a tax-free liquidation. The foreign jurisdictions where the Company is permanently reinvested include Singapore and China (Wuhan Topwin Optoelectronics Technology Co., Ltd.). The cumulative amount of earnings upon which U.S. income taxes have not been provided was $38.6 million and $37.0 million as of April 1, 2017 and April 2, 2016, respectively. If not reinvested, the liability related to these earnings would have been $13.4 million and $12.9 million as of April 1, 2017 and April 2, 2016, respectively, which may be offset by foreign tax credits or other tax attributes.
63
As of April 1, 2017, the following tax years remained subject to examination by the major tax jurisdictions indicated:
Major Jurisdictions | Open Tax Years |
Canada | 2011 and forward |
China | 2007 and forward |
France | 2014 and forward |
Japan | 2010 and forward |
Korea | 2012 and forward |
Singapore | 2013 and forward |
Taiwan | 2012 and forward |
United Kingdom | 2013 and forward |
United States | 2004 and forward |
A reconciliation of the beginning and ending amount of the consolidated liability for unrecognized income tax benefits for the years ended April 1, 2017, April 2, 2016 and March 28, 2015 was as follows:
(In thousands) | 2017 | 2016 | 2015 | ||||||||
Beginning unrecognized tax benefits balance | $ | 10,385 | $ | 9,654 | $ | 9,356 | |||||
Gross increases for tax positions of prior years | 62 | 731 | 849 | ||||||||
Gross decreases for tax positions of prior years | (242 | ) | — | (1,013 | ) | ||||||
Gross increases for tax positions for current year | 539 | — | 462 | ||||||||
Ending unrecognized tax benefits balance | $ | 10,744 | $ | 10,385 | $ | 9,654 | |||||
The unrecognized tax benefits were presented as long-term income taxes payable on the Consolidated Balance Sheets or netted against deferred tax assets, where applicable. If recognized, the net impact to the effective tax rate associated with the unrecognized tax benefits would be zero and $0.2 million as of April 1, 2017 and April 2, 2016, respectively. The Company records interest and penalties related to unrecognized tax benefits as tax expense. The interest and penalties were minimal in 2017, 2016 and 2015. The Company does not expect a decrease in unrecognized tax benefits within the next twelve months due to a lapse in statute of limitations. The Company also expects the annual increases to be consistent with prior years and does not anticipate any significant changes in unrecognized tax benefits in the next twelve months as the result of examinations.
15. Accrued Liabilities (current) & Other Liabilities (non-current)
Accrued liabilities (current) consisted of the following at April 1, 2017 and April 2, 2016:
(In thousands) | 2017 | 2016 | |||||
Payroll-related liabilities | $ | 6,335 | $ | 5,717 | |||
Restructuring and cost management amounts payable | 4,996 | 757 | |||||
Product warranty accrual | 3,394 | 3,666 | |||||
Purchase order commitments and receipts | 2,522 | 2,588 | |||||
Customer deposits | 1,242 | 1,731 | |||||
Professional fees payable | 734 | 1,052 | |||||
Current portion, long-term debt | 434 | — | |||||
Other current liabilities | 2,529 | 2,823 | |||||
$ | 22,186 | $ | 18,334 | ||||
Included in other liabilities above are accrued amounts for value-added taxes, income taxes, commissions payable to external representatives, freight and other similar items.
64
Other liabilities (non-current) consisted of the following:
(In thousands) | 2017 | 2016 | |||||
Deferred compensation | $ | 3,058 | $ | 2,504 | |||
Product warranty accrual | 2,080 | 2,068 | |||||
Other non-current liabilities | 2,432 | 3,229 | |||||
$ | 7,570 | $ | 7,801 | ||||
Other non-current liabilities include long-term deferred revenue, long-term deposits, and other similar items.
16. Product Warranty
The following is a reconciliation of the changes in the aggregate product warranty accrual for 2017, 2016 and 2015:
(In thousands) | 2017 | 2016 | 2015 | ||||||||
Product warranty accrual, beginning | $ | 5,734 | $ | 3,342 | $ | 4,215 | |||||
Warranty charges incurred, net | (8,297 | ) | (7,781 | ) | (6,468 | ) | |||||
Provision for warranty charges | 8,037 | 10,173 | 5,595 | ||||||||
Product warranty accrual, ending | $ | 5,474 | $ | 5,734 | $ | 3,342 | |||||
Net warranty charges incurred include labor charges and costs of replacement parts for system repairs under warranty. These costs are recorded net of any estimated cost recoveries resulting from either successful repair of damaged parts or from warranties offered by the Company’s suppliers for defective components. The provision for warranty charges reflects the estimate of future anticipated net warranty costs to be incurred for all products under warranty at fiscal year-end and is recorded to cost of sales. Of the total of $5.5 million and $5.7 million in product warranty accrual at April 1, 2017 and April 2, 2016, $2.1 million and $2.1 million, respectively are included in Other liabilities on the Condensed Consolidated Balance Sheets.
17. Deferred Revenue
The following is a reconciliation of the changes in deferred revenue for 2017, 2016 and 2015:
(In thousands) | 2017 | 2016 | 2015 | ||||||||
Deferred revenue, beginning | $ | 7,685 | $ | 12,376 | $ | 10,515 | |||||
Revenue deferred | 43,379 | 58,416 | 46,139 | ||||||||
Revenue recognized | (35,667 | ) | (63,107 | ) | (44,278 | ) | |||||
Deferred revenue, ending | $ | 15,397 | $ | 7,685 | $ | 12,376 | |||||
Of the total of $15.4 million and $7.7 million in deferred revenue at April 1, 2017 and April 2, 2016, $0.7 million and $1.3 million is non-current and is included in Other liabilities on the Condensed Consolidated Balance Sheets.
18. Derivative Financial Instruments
The Company enters into derivative financial instruments on a limited basis and does not use them for trading purposes. It does, however, use derivatives to manage well-defined foreign currency risks. The Company hedges material non-functional currency monetary asset and liability balances. Foreign exchange contract gains and losses are recognized at the end of each fiscal period in the Company’s results of operations. Such gains and losses are typically offset by the corresponding changes to the related underlying hedged item. Cash flows from derivative financial instruments are classified in the same category as the cash flows from the items hedged.
At April 1, 2017 and April 2, 2016, the Company had net forward exchange contracts to purchase foreign currencies totaling $7.3 million and $13.1 million, respectively. In general, these contracts have a duration of approximately one month and the counterparties are large, highly rated banks; therefore, the Company believes that the risk of loss as a result of nonperformance by the banks is minimal.
The table below summarizes, by currency, the notional amounts of forward exchange contracts in U.S. dollars as of April 1, 2017 and April 2, 2016. The “bought” amounts represent the net U.S. dollar equivalents of commitments to purchase foreign currencies, and the “sold” amounts represent the net U.S. dollar equivalents of commitments to sell foreign currencies. The foreign currency amounts have been translated into a U.S. dollar equivalent value using the exchange rates as of April 1, 2017 and April 2, 2016.
Bought (Sold) | |||||||
(In thousands) | 2017 | 2016 | |||||
Japanese Yen | $ | 1,352 | $ | 5,079 | |||
Euro | 7,568 | 12,073 | |||||
New Taiwan Dollar | (686 | ) | (117 | ) | |||
Korean Won | 32 | 197 | |||||
British Pound | (1,992 | ) | (2,350 | ) | |||
Chinese Renminbi | 995 | (1,859 | ) | ||||
Singapore Dollar | 74 | 53 | |||||
$ | 7,343 | $ | 13,076 | ||||
19. Commitments and Contingencies
The aggregate minimum commitment obligation under operating leases beyond April 1, 2017 was as follows (in thousands):
Year | Operating Leases | ||
2018 | $ | 2,732 | |
2019 | 1,895 | ||
2020 | 484 | ||
2021 | 15 | ||
2022 | — | ||
Thereafter | — | ||
$ | 5,126 | ||
The Company leases certain equipment, automobiles, manufacturing and office space under operating leases, which are non-cancelable and expire on various dates through fiscal 2021. Rental expense for all operating leases was $2.6 million, $2.5 million and $2.7 million in 2017, 2016 and 2015, respectively. The operating lease amounts include the contractual facility lease obligations at our Napa, California; Sunnyvale, California; Montreal, Canada; and Chelmsford, Massachusetts plants. The above table excludes the estimated rental income, if any, from the sublease of the facilities. See Note 26 "Restructuring and Cost Management Plans" for further discussion on these site closure activities.
The operations at Chelmsford manufacturing plant ceased in the third quarter of 2016 as a part of the Company’s plan to streamline its manufacturing and development activities. In the third quarter of 2016, we entered into a sublease for this property, and the associated contractual rental income of $0.5 million over the three year life of the lease is expected to partially
65
offset the Company's ongoing lease obligation. We also ceased operations at our Napa, California; Sunnyvale, California; and Montreal, Canada facilities in the fourth quarter of 2017.
The Company routinely enters into inventory purchase contracts which require purchase commitments. As a result, if we experience lower than anticipated demand for our products, in many cases we would not be able to avoid the cost of purchasing the associated inventory, which could negatively impact our results of operations and liquidity. The Company had purchase commitments of $28.6 million at April 1, 2017, of which $1.1 million represent long term purchase contracts.
20. Revolving Credit Facility
The Company is party to a loan and security agreement (Credit Facility) with Silicon Valley Bank (SVB), which was initially entered into on March 20, 2015 and amended on July 12, 2016. The Credit Facility provides for a senior secured asset-based revolving facility with availability up to $30 million, including a $15 million sublimit for letters of credit. In the fourth quarter of 2017, the Company amended and extended the Credit Facility by one year. With this extension, the Credit Facility expires March 20, 2019. At April 1, 2017, the Company had no amounts outstanding under the Credit Facility, was in compliance with all covenants, and was not in default under the agreement. The commitment fee on the amount of unused credit was 0.3 percent. As amended, the Credit Facility allows for a greater level of EBITDA losses over the next 12 months, but reduces the level of permitted acquisitions and purchases of capital equipment. If we fail to meet the covenants in our Credit Facility or our lenders fail to fund, access to the facility may be limited or the facility may become unavailable altogether. EBITDA losses, such as those experienced in the second and third quarters of 2017, negatively impact our ability to maintain compliance with these covenants.
21. Long-term Debt
On January 9, 2017, ESI Leasing, LLC (ESI Leasing), a wholly owned subsidiary of the Company, entered into a loan agreement (Loan Agreement) with First Technology Federal Credit Union (Lender). The Loan Agreement provides for a term loan from the Lender to ESI Leasing in the principal amount of $14 million (Loan). The interest rate of the Loan is fixed at 4.75% per annum, except that it may be increased if certain covenants under the Loan Agreement are not satisfied and after and during the continuation of an “Event of Default” as defined in the Loan Agreement. The Loan amortizes over a period of approximately 20 years, but the maturity date of the loan is January 1, 2027, meaning that, if ESI Leasing does not prepay or refinance the Loan, a significant portion of the principal of the Loan will become due on January 1, 2027. ESI Leasing will pay monthly principal and interest payments on the Loan totaling annual amounts of $1.1 million in each of the next 5 years and through the maturity of the loan. The Company unconditionally guarantees the loan to ESI Leasing.
Total debt currently outstanding on the Loan Agreement at the end of fiscal 2017 was:
(In thousands) | 2017 | 2016 | |||||
Total debt outstanding | $ | 13,923 | $ | — | |||
Less: Current portion, long-term debt | (434 | ) | — | ||||
Long-term debt | $ | 13,489 | $ | — | |||
Deferred debt issuance costs related to the above long-term debt as of April 1, 2017 were $337 thousand.
22. Loss Per Share
The following was a reconciliation of weighted average shares outstanding used in the calculation of basic and diluted earnings per share for 2017, 2016 and 2015:
66
(In thousands, except per share data) | 2017 | 2016 | 2015 | ||||||||
Net loss | $ | (37,409 | ) | $ | (12,257 | ) | $ | (43,811 | ) | ||
Weighted average shares used for basic earnings per share | 32,551 | 31,411 | 30,611 | ||||||||
Weighted average shares used for diluted earnings per share | 32,551 | 31,411 | 30,611 | ||||||||
Net loss per share: | |||||||||||
Net loss—basic | $ | (1.15 | ) | $ | (0.39 | ) | $ | (1.43 | ) | ||
Net loss—diluted | $ | (1.15 | ) | $ | (0.39 | ) | $ | (1.43 | ) | ||
Awards of options, SARs and unvested restricted stock units representing an additional 2.0 million, 2.3 million and 2.9 million shares of stock for 2017, 2016 and 2015, respectively, were not included in the calculation of diluted net earnings per share because their effect would have been antidilutive.
23. Shareholders’ Equity
Share Repurchase Program
In December 2011, the Board of Directors authorized a share repurchase program totaling $20.0 million to acquire shares of our outstanding common stock. The repurchases are to be made at management’s discretion in the open market or in privately negotiated transactions in compliance with applicable securities laws and other legal requirements and are subject to market conditions, share price and other factors.
The Company did not repurchase any shares during 2017 or 2016. In 2015, the Company repurchased 207,738 shares for $1.5 million under this authorization at an average price of $7.01 per share, calculated inclusive of commissions and fees. Cash used to settle repurchase transactions is reflected as a component of cash used in financing activities on the Consolidated Statements of Cash Flows. There is no fixed completion date for the repurchase program.
Dividends
In February 2015, the Board of Directors suspended the quarterly dividend which was adopted by the Company in December 2011. The Company did not pay dividends in 2017 or 2016, and paid aggregate dividends of $7.3 million in 2015.
24. Legal Proceedings
In the ordinary course of business, we are involved in various legal matters, either asserted or unasserted, and investigations. In the opinion of management, ultimate resolution of these matters will not have a material effect on our consolidated financial position, results of operations or cash flows.
25. Product and Geographic Information
Operating segments are defined as components of an enterprise about which separate financial information is available that is evaluated regularly by the chief operating decision maker in deciding how to allocate resources and in assessing performance. Our chief operating decision maker (CODM) is our Chief Executive Officer (CEO).
In the fourth quarter of 2017, primarily as a result of a change in CEO and ensuing restructuring and related efficiency and cost-saving efforts, the Company was reorganized into a functional structure, and internal reporting and decision-making authority was modified accordingly. The Company no longer has separate business units or separate general managers, and the CEO now allocates resources and evaluates performance on a company-wide basis, consistent with the revised functional structure. The change in the CODM combined with the change in organization and decision making-structures represented triggering events for a re-evaluation of our segment disclosures. Operating results, including measures of profit and loss, made available to and regularly reviewed by the CODM are now on a company-wide basis. As a result of these changes, we believe we now operate in a single segment, defined as a manufacturer of high-technology microfabrication and related equipment. This single segment, which also represents the consolidated entity, sells products into a variety of end markets that are grouped into four major categories for the purpose of providing an understanding of the principal end markets for the products manufactured by the Company, specifically: 1) Printed Circuit Board (PCB), 2) Semiconductor, 3) Component Test, and 4) Industrial Machining.
67
The following table presents net sales information by the four major market categories addressed by our single segment:
(In thousands) | 2017 | 2016 | |||||
Printed Circuit Board | $ | 88,771 | $ | 94,121 | |||
Component Test | 22,381 | 19,901 | |||||
Semiconductor | 29,557 | 38,262 | |||||
Industrial Machining | 20,314 | 32,107 | |||||
$ | 161,023 | $ | 184,391 | ||||
For 2015, sales into the Component Processing and Micromachining markets were $124.6 million and $34.5 million, respectively. As required, we have restated the segment disclosures on the basis of the revised definition of reportable segments described above. As we now operate as a single segment and our segment accounting is compliant with GAAP, our restated segment disclosures are the same as our consolidated results shown in the Consolidated Statements of Operations and Consolidated Balance Sheets.
Net sales by geographic area, based on the location of the end user, were as follows:
(In thousands) | 2017 | 2016 | 2015 | ||||||||
Asia | $ | 134,394 | $ | 152,259 | $ | 124,049 | |||||
Americas | 16,378 | 21,206 | 18,067 | ||||||||
Europe | 10,251 | 10,926 | 17,002 | ||||||||
$ | 161,023 | $ | 184,391 | $ | 159,118 | ||||||
Long-lived assets, exclusive of investments and restricted cash, by geographic area were as follows:
(In thousands) | 2017 | 2016 | |||||
Americas | $ | 32,234 | $ | 26,359 | |||
Asia | 8,111 | 17,318 | |||||
Europe | 5,648 | 5,579 | |||||
$ | 45,993 | $ | 49,256 | ||||
26. Restructuring and Cost Management Plans
2017 Corporate Restructuring:
In the fourth quarter of 2017, we initiated a restructuring plan to improve business effectiveness and streamline operations and achieving a stated target profit level for the Company as a whole. As a part of the restructuring plan, the management team has been reorganized from a business unit to a functional structure; we closed facilities in Montreal, Canada; Napa, California; and Sunnyvale, California; we discontinued certain products; and we made select reductions in headcount across the Company. We expect the actions under this plan to be largely completed by the end of June 2017, except facilities charges which may extend beyond that time. The original estimated completion date for the plan was the end of the first fiscal quarter of 2018 with a total estimated pre-tax cost of $6.5 million to $8.5 million.
Total expenses related to the plan were $7.6 million in 2017. Included in these expenses is approximately $1.7 million in cost of sales for inventory impairments. Inventory impairments are incremental to the original estimates as they were not estimable at that time those estimates were originally developed and are associated with products and materials that will be discontinued as a result of the restructuring actions. In operating expenses, restructuring costs of $5.9 million included employee severance and related costs, costs associated with leasehold improvement write-offs related to the abandoned facilities and other asset impairments. The current estimated completion date for the plan, excluding facilities costs, is the end of the first quarter of 2018, with an estimated future cost of $4.0 million to $6.5 million, of which approximately $0.7 million to $1.6 million is expected to be paid in cash. The table below shows the high end of this expectation range and includes restructuring actions taken after April 1, 2017 that are expected to impact future periods. The change in total estimated costs primarily relates to inventory write-offs stemming from the product portfolio program reviews.
68
The following table presents the total expected restructuring costs as of April 1, 2017 (in thousands):
Total Expected Costs for the Plan | Costs Recognized During the Year Ended April 1, 2017 | Remaining Costs to be Recognized Subsequent to April 1, 2017 | |||||||||
Employee severance and related personnel costs | $ | 4,388 | $ | 3,588 | $ | 800 | |||||
Site closure costs | 1,688 | 888 | 800 | ||||||||
Current asset impairments(1) | 6,069 | 1,669 | 4,400 | ||||||||
Non-current asset impairments | 1,876 | 1,376 | 500 | ||||||||
Other Costs | 66 | 66 | — | ||||||||
Total | $ | 14,087 | $ | 7,587 | $ | 6,500 | |||||
(1) Current asset impairments include inventory charges recorded in cost of sales.
The following table presents the amounts payable related to the 2017 Corporate Restructuring (in thousands):
Employee severance and related personnel costs | Site closure costs | Current asset impairments(1) | Non-current asset impairments | Other Costs | Total | ||||||||||||||||||
Balance as of April 2, 2016 | $ | — | $ | — | $ | — | $ | — | $ | — | $ | — | |||||||||||
Costs incurred | 3,588 | 888 | 1,669 | 1,376 | 66 | 7,587 | |||||||||||||||||
Cash payments | (341 | ) | — | — | — | (66 | ) | (407 | ) | ||||||||||||||
Non-cash items | — | — | (1,669 | ) | (1,376 | ) | — | (3,045 | ) | ||||||||||||||
Balance as of April 1, 2017 | $ | 3,247 | $ | 888 | $ | — | $ | — | $ | — | $ | 4,135 | |||||||||||
(1) Asset and facilities costs include inventory charges recorded in cost of sales.
Chelmsford Restructuring:
In March 2015, as a part of the plan to streamline manufacturing and development activities, the Company initiated a restructuring plan that included the closure of the assembly plant and development center located in Chelmsford, Massachusetts. The original estimated completion date of the plan was the end of fiscal 2016 at a total estimated pre-tax cost of $5.5 million.
Net restructuring costs related to the Chelmsford restructuring plan were $0.4 million in 2017, $2.8 million in 2016 and $3.0 million in 2015. Due to a change in the estimate of amounts to be received from the sub-lease of the Chelmsford facility, the Company increased the accrual by $0.4 million in the fourth quarter of 2017 in recognition of the increased lease obligation.
Included in the costs incurred over the life of the plan were impairments of leasehold improvements associated with the abandoned manufacturing facility, employee severance and related payments, inventory impairments associated with discontinued products and other wind-down costs. In fiscal 2017, the Company paid out $0.3 million in cash related to this restructuring plan.
The following table presents the amounts related to restructuring and cost management amounts payable (in thousands):
Restructuring & cost management amounts payable as of March 29, 2014 | $ | 1,050 | |
Cash payments and other adjustments | (985 | ) | |
Costs incurred | 1,932 | ||
Restructuring & cost management amounts payable as of March 28, 2015 | 1,997 | ||
Cash payments and other adjustments | (4,064 | ) | |
Costs incurred | 2,824 | ||
Restructuring & cost management amounts payable as of April 2, 2016 | 757 | ||
Cash payments and other adjustments | (297 | ) | |
Costs incurred | 401 | ||
Restructuring & cost management amounts payable as of April 1, 2017 | $ | 861 | |
69
Overall restructuring reserve:
As of April 1, 2017 and April 2, 2016, the amount of unpaid restructuring costs included in accrued liabilities on the Consolidated Balance Sheets were $5.0 million and $0.8 million, respectively. Included in the payable balance are amounts for severance and employee benefits, asset retirement obligation and net lease commitments.
70
27. Quarterly Financial Information (Unaudited)
(In thousands, except per share data) | 1st Quarter | 2nd Quarter | 3rd Quarter | 4th Quarter | |||||||||||
Year Ended April 1, 2017 | |||||||||||||||
Net sales | |||||||||||||||
Systems | $ | 38,200 | $ | 21,442 | $ | 25,427 | $ | 40,029 | |||||||
Services | 9,468 | 8,216 | 8,352 | 9,889 | |||||||||||
Total net sales | 47,668 | 29,658 | 33,779 | 49,918 | |||||||||||
Cost of sales: | |||||||||||||||
Systems | 22,422 | 14,146 | 17,283 | 27,499 | |||||||||||
Services | 4,438 | 4,532 | 5,048 | 4,189 | |||||||||||
Total cost of sales | 26,860 | 18,678 | 22,331 | 31,688 | |||||||||||
Gross profit | 20,808 | 10,980 | 11,448 | 18,230 | |||||||||||
Net (loss) income | (118 | ) | (9,675 | ) | (9,693 | ) | (17,923 | ) | |||||||
Basic net (loss) income per share | — | (0.30 | ) | (0.29 | ) | (0.54 | ) | ||||||||
Diluted net (loss) income per share | — | (0.30 | ) | (0.29 | ) | (0.54 | ) | ||||||||
Year Ended April 2, 2016 | |||||||||||||||
Net sales | |||||||||||||||
Systems | $ | 32,062 | $ | 35,570 | $ | 31,282 | $ | 44,043 | |||||||
Service | 11,029 | 10,902 | 12,060 | 7,443 | |||||||||||
Total net sales | 43,091 | 46,472 | 43,342 | 51,486 | |||||||||||
Cost of sales: | |||||||||||||||
Systems | 21,285 | 22,345 | 20,292 | 25,247 | |||||||||||
Service | 6,429 | 5,706 | 5,329 | 5,055 | |||||||||||
Total cost of sales | 27,714 | 28,051 | 25,621 | 30,302 | |||||||||||
Gross profit | 15,377 | 18,421 | 17,721 | 21,184 | |||||||||||
Net loss | (6,364 | ) | (3,260 | ) | (4,586 | ) | 1,953 | ||||||||
Basic net loss per share | (0.20 | ) | (0.10 | ) | (0.15 | ) | 0.06 | ||||||||
Diluted net loss per share | (0.20 | ) | (0.10 | ) | (0.15 | ) | 0.06 | ||||||||
The sum of the quarterly data presented in the table above for fiscal 2017 and 2016 may not equal annual results due to rounding.
1. | In the fourth quarter of 2017, gross profit included $2.3 million of charges for intangible write-off (See Note 12 "Acquired Intangible Assets") and $1.7 million of charges in inventory write-off related to discontinued products (See Note 26 "Restructuring and Cost Management Plans"). |
2. | In the fourth quarter of 2017, net operating expenses included a non-cash goodwill impairment charge of $7.4 million (See note Note 11 "Goodwill") and $6.6 million of restructuring charges related to the Q4 2017 Corporate restructuring plan (See note Note 26 "Restructuring and Cost Management Plans"). |
3. | In the fourth quarter of 2016, gross profit included $0.4 million of charges for intangible write-off related to discontinued products. |
4. | In each of the second, third and fourth quarters of 2016, net loss included $0.6 million, $1.9 million and $0.2 million of restructuring charges related to the Chelmsford, Massachusetts restructuring plan. Second quarter charge included $1.1 million of asset write-off due to the closure of the Chelmsford, Massachusetts manufacturing plant. |
5. | In the third quarter of 2016, gross profit included $1.4 million of charges for inventory write-offs related to discontinued products. |
Item 9. Changes in and Disagreements with Accountants on Accounting and Financial Disclosure
None.
71
Item 9A. Controls and Procedures
(a) Evaluation of Disclosure Controls and Procedures
We performed an evaluation of our disclosure controls and procedures in connection with preparation of this Annual Report on Form 10-K. This controls evaluation was performed under the supervision and with the participation of management, including our CEO and CFO. Disclosure controls are procedures that are designed to ensure that information required to be disclosed in our reports filed under the Securities Exchange Act of 1934 (the Exchange Act), such as this Annual Report on Form 10-K, is recorded, processed, summarized and reported within the time periods specified by the Securities and Exchange Commission (the SEC). Disclosure controls are also designed to ensure that such information is accumulated and communicated to our management, including the CEO and CFO, as appropriate to allow timely decisions regarding required disclosure.
Based on the controls evaluation, our CEO and CFO have concluded that, as of the end of the period covered by this Form 10-K, our disclosure controls and procedures were effective to provide reasonable assurance that information required to be disclosed in our Exchange Act reports is recorded, processed, summarized and reported within the time periods specified by the SEC, and that material information relating to the Company is made known to management, including the CEO and the CFO, particularly during the time when our periodic reports are being prepared.
(b) Management’s Report on Internal Control Over Financial Reporting
Our management is responsible for establishing and maintaining adequate internal control over financial reporting, as such term is defined in Exchange Act Rules 13a-15(f) and 15d-15(f). Under the supervision and with the participation of our management, including our CEO and CFO, we conducted an evaluation of the effectiveness of our internal control over financial reporting as of April 1, 2017 using the criteria established in Internal Control-Integrated Framework (2013) issued by the Committee of Sponsoring Organizations of the Treadway Commission (COSO). Based on this evaluation, our management has concluded that we maintained effective internal control over financial reporting as of April 1, 2017.
Deloitte & Touche LLP, an independent registered public accounting firm, who audited the 2017 consolidated financial statements included in this annual report on Form 10-K, has audited the effectiveness of our internal control over financial reporting as of April 1, 2017, as referenced in their report included in (d) below.
(c) Changes in Internal Control
There has been no change in our internal control over financial reporting that occurred during our last fiscal quarter that has materially affected or is reasonably likely to materially affect our internal control over financial reporting.
72
(d) Report of Independent Registered Public Accounting Firm
To the Board of Directors and Shareholders of
Electro Scientific Industries, Inc.
Portland, Oregon
We have audited the internal control over financial reporting of Electro Scientific Industries, Inc. and subsidiaries (the "Company") as of April 1, 2017, based on criteria established in Internal Control-Integrated Framework (2013) issued by the Committee of Sponsoring Organizations of the Treadway Commission. The Company's management is responsible for maintaining effective internal control over financial reporting and for its assessment of the effectiveness of internal control over financial reporting, included in the accompanying Management’s Report on Internal Control over Financial Reporting. Our responsibility is to express an opinion on the Company's internal control over financial reporting based on our audit.
We conducted our audit in accordance with the standards of the Public Company Accounting Oversight Board (United States). Those standards require that we plan and perform the audit to obtain reasonable assurance about whether effective internal control over financial reporting was maintained in all material respects. Our audit included obtaining an understanding of internal control over financial reporting, assessing the risk that a material weakness exists, testing and evaluating the design and operating effectiveness of internal control based on the assessed risk, and performing such other procedures as we considered necessary in the circumstances. We believe that our audit provides a reasonable basis for our opinion.
A company's internal control over financial reporting is a process designed by, or under the supervision of, the company's principal executive and principal financial officers, or persons performing similar functions, and effected by the company's board of directors, management, and other personnel to provide reasonable assurance regarding the reliability of financial reporting and the preparation of financial statements for external purposes in accordance with generally accepted accounting principles. A company's internal control over financial reporting includes those policies and procedures that (1) pertain to the maintenance of records that, in reasonable detail, accurately and fairly reflect the transactions and dispositions of the assets of the company; (2) provide reasonable assurance that transactions are recorded as necessary to permit preparation of financial statements in accordance with generally accepted accounting principles, and that receipts and expenditures of the company are being made only in accordance with authorizations of management and directors of the company; and (3) provide reasonable assurance regarding prevention or timely detection of unauthorized acquisition, use, or disposition of the company's assets that could have a material effect on the financial statements.
Because of the inherent limitations of internal control over financial reporting, including the possibility of collusion or improper management override of controls, material misstatements due to error or fraud may not be prevented or detected on a timely basis. Also, projections of any evaluation of the effectiveness of the internal control over financial reporting to future periods are subject to the risk that the controls may become inadequate because of changes in conditions, or that the degree of compliance with the policies or procedures may deteriorate.
In our opinion, the Company maintained, in all material respects, effective internal control over financial reporting as of April 1, 2017, based on the criteria established in Internal Control-Integrated Framework (2013) issued by the Committee of Sponsoring Organizations of the Treadway Commission.
We have also audited, in accordance with the standards of the Public Company Accounting Oversight Board (United States), the consolidated financial statements as of and for the year ended April 1, 2017 of the Company and our report dated June 14, 2017 expressed an unqualified opinion on those financial statements.
Portland, Oregon
June 14, 2017
Item 9B. Other Information
None.
73
PART III
Item 10. Directors, Executive Officers and Corporate Governance
The information required by this item, including information about the Company’s audit committee, is included under the headings “Proposal 1: Election of Directors,” “Board Committees,” “Executive Officers” and “Section 16(a) Beneficial Ownership Reporting Compliance” in our Proxy Statement for our 2017 Annual Meeting of Shareholders and is incorporated herein by reference.
The Company has adopted the ESI Code of Conduct, a code of ethics and business practices with which every person who works for the Company is expected to comply. In addition, the Company has adopted a Code of Ethics for Financial Managers applicable to the chief executive officer, principal financial officer, principal accounting officer or controller and any other person performing similar functions on behalf of the Company. The ESI Code of Conduct and Code of Ethics for Financial Managers are publicly available on the Company’s website under “Corporate Governance” in the Investors Section (at http://investors.esi.com/governance.cfm). This website address is intended to be an inactive, textual reference only; none of the materials on this website are part of this report. If any waiver is granted, including any implicit waiver, from a provision of the Code of Ethics for Financial Managers, the Company will disclose the nature of such waiver on that website or in a report on Form 8-K.
Item 11. Executive Compensation
The information required by this item is included under the headings “Board Compensation,” “Executive Compensation,” “Compensation Discussion and Analysis,” “Compensation Committee Report” and “Compensation Committee Interlocks and Insider Participation” in our Proxy Statement for our 2017 Annual Meeting of Shareholders and is incorporated herein by reference.
Item 12. Security Ownership of Certain Beneficial Owners and Management and Related Shareholder Matters
Certain information required by this item is included under the headings “Security Ownership of Certain Beneficial Owners and Management” and “Equity Compensation Plan Information” in our Proxy Statement for our 2017 Annual Meeting of Shareholders and is incorporated herein by reference.
Item 13. Certain Relationships and Related Transactions, and Director Independence
The information required by this item is included under “Certain Relationships and Related Transactions” and “Corporate Governance Guidelines and Independence” in our Proxy Statement for our 2017 Annual Meeting of Shareholders and is incorporated herein by reference.
Item 14. Principal Accounting Fees and Services
The information required by this item is included under “Proposal 4: Ratification of Independent Registered Public Accounting Firm - Principal Accounting Fees and Services” and “Pre-Approval Policy” in our Proxy Statement for our 2017 Annual Meeting of Shareholders and is incorporated herein by reference.
We have agreed to indemnify and hold KPMG LLP (KPMG) harmless against and from any and all legal costs and expenses incurred by KPMG in successful defense of any legal action or proceeding that arises as a result of KPMG’s consent to the incorporation by reference of its audit report on our past financial statements incorporated by reference into our registration statements on Form S-8.
74
PART IV
Item 15. Exhibits and Financial Statement Schedules
(a)(1) and (a)(2) Financial Statements and Schedules
The Consolidated Financial Statements, together with the reports thereon of our independent registered public accounting firm, are included on the pages indicated below:
Page | |
There are no schedules required to be filed herewith.
(a)(3) Exhibits (Open to be updated)
The following exhibits are filed herewith and this list is intended to constitute the exhibit index. An asterisk (*) beside the exhibit number indicates the exhibits containing a management contract, compensatory plan or arrangement, which are required to be identified in this report.
3.1 | Third Restated Articles of Incorporation, as amended. Incorporated by reference to Exhibit 3.1 of the Company's Annual Report on Form 10-K for the fiscal year ended April 3, 2010. | |
3.2 | 2009 Amended and Restated Bylaws, as amended. Incorporated by reference to Exhibit 3.1 of the Company’s Current Report on Form 8-K filed on March 26 2015. | |
10.1 | Amended and Restated Loan and Security Agreement, dated January 31, 2017, between the Company and Silicon Valley Bank. Incorporated by reference to Exhibit 10.1 of the Company’s Current Report on Form 8-K filed on February 1, 2017. | |
10.2 | First Amendment to Loan and Security Agreement, dated July 12, 2016, between the Company and Silicon Valley Bank. Incorporated by reference to Exhibit 10.1 of the Company’s Current Report on Form 8-K filed on July 14, 2016. | |
10.3 | Loan and Security Agreement, dated March 20, 2015, between the Company and Silicon Valley Bank. Incorporated by reference to Exhibit 10.1 of the Company’s Current Report on Form 8-k filed on March 23, 2015. | |
10.4 | Loan Agreement, dated January 9, 2017, between ESI Leasing, LLC and First Technology Federal Credit Union. Incorporated by reference to Exhibit 10.1 of the Company’s Current Report on Form 8-K filed on January 10, 2017. | |
10.5 | Promissory Note, dated January 9, 2017, by ESI Leasing, LLC in favor of First Technology Federal Credit Union. Incorporated by reference to Exhibit 10.2 of the Company’s Current Report on Form 8-K filed on January 10, 2017. | |
10.6 | Lease, dated January 9, 2017, between ESI Leasing, LLC and Electro Scientific Industries, Inc. Incorporated by reference to Exhibit 10.3 of the Company’s Current Report on Form 8-K filed on January 10, 2017. | |
10.7 | Deed of Trust, Assignment of Leases and Rents, Security Agreement, and Fixture Filing, dated January 9, 2017, by ESI Leasing, LLC in favor of WFG National Title Insurance Company, as trustee, for the benefit of First Technology Federal Credit Union. Incorporated by reference to Exhibit 10.4 of the Company’s Current Report. | |
10.8 | Unconditional Guaranty of Payment, dated January 9, 2017, by Electro Scientific Industries, Inc. in favor of First Technology Federal Credit Union. Incorporated by reference to Exhibit 10.5 of the Company’s Current Report on Form 8-K filed on January 10, 2017. | |
10.9 | * | Employment Agreement, dated August 19, 2016, between the Company and Michael Burger. Incorporated by reference to Exhibit 10.1 of the Company’s Current Report on Form 8-K filed on August 19, 2016. |
75
10.10 | * | 2004 Stock Incentive Plan, as amended. Incorporated by reference to Exhibit 10.1 of the Company’s Current Report on Form 8-K filed on August 22, 2016. |
10.11 | * | Retention Bonus Agreement, dated August 31, 2016, between Electro Scientific Industries, Inc. and Paul R Oldham. Incorporated by reference to Exhibit 10.1 of the Company’s Current Report on Form 8-K filed on September 2, 2016. |
10.12 | * | Form of Performance-Based Restricted Stock Unit Agreement for May 2016 awards. Incorporated by reference to Exhibit 10.5 to the Company’s Quarterly Report on Form 10-Q for the quarter ended October 1, 2016. |
10.13 | * | Time-Based Restricted Stock Unit Agreement between the Company and Michael Burger, dated as of October 3, 2016. Incorporated by reference to Exhibit 10.1 to the Company’s Quarterly Report on Form 10-Q for the quarter ended December 31, 2016. |
10.14 | * | Executive Separation and Release Agreement dated February 9, 2017 between Electro Scientific Industries. Inc. and Robert DeBakker. |
10.15 | * | Form of Change in Control Agreement between the Company and Edward Grady. Incorporated by reference to Exhibit 10.1 to the Company’s Quarterly Report on Form 10-Q for the quarter ended December 27, 2014 (December 2014 10-Q). |
10.16 | * | Form of Stock Settled Stock Appreciation Rights Agreement between the Company and Edward Grady (November 18, 2014 awards). Incorporated by reference to Exhibit 10.2 to the December 2014 10-Q. |
10.17 | * | Form of Performance-Based Restricted Stock Unit Award Agreement between the Company and Edward Grady (November 18, 2014). Incorporated by reference to Exhibit 10.3 to the December 2014 10-Q. |
10.18 | * | Form of Performance-Based Restricted Stock Unit Award Agreement between the Company and executives other than Edward Grady (November 18, 2014). Incorporated by reference to Exhibit 10.4 to the December 2014 10-Q. |
10.19 | * | Form of Performance-Based Restricted Stock Unit Agreement (May 2014 grants). Incorporated by reference to Exhibit 10 of the Company’s Quarterly Report on Form 10-Q for the quarter ended September 27, 2014. |
10.20 | * | 2004 Stock Incentive Plan, as amended. Incorporated by reference to Exhibit 10.2 of the Company’s Current Report on Form 8-K filed on August 25, 2014. |
10.21 | * | Deferred Compensation Plan 2008 Restatement. Incorporated by reference to Exhibit 10.14 of the Company’s Annual Report on Form 10-K for the fiscal year ended March 29, 2008 (2008 10-K). |
10.22 | * | Amendment No. 1 to Deferred Compensation Plan 2008 Restatement. Incorporated by reference to Exhibit 10.31 of the 2008 10-K. |
10.23 | * | Amendment No. 2 to Deferred Compensation Plan 2008 Restatement, dated February 16, 2012. Incorporated by reference to Exhibit 10.15 of the Company's Annual Report on Form 10-K for the fiscal year ended March 31, 2012 (2012 10-K). |
10.24 | * | Form of Amended and Restated Change in Control Agreement between the Company and each of Robert DeBakker, Paul Oldham and Bing Fai Wong. Incorporated by reference to Exhibit 10.1 of the Company’s Current Report on Form 8-K filed May 18, 2015. |
10.25 | * | Form of Restricted Stock Unit Agreement for directors. Incorporated by reference to Exhibit 10.4 of the Company's Current Report on Form 8-K filed July 25, 2006. |
10.26 | * | Form of Notice of Grant of Stock Options and Option Agreement and related Terms and Conditions (for awards made after February 2008). Incorporated by reference to Exhibit 10.27 of the 2008 10-K. |
10.27 | * | Form of Stock Appreciation Rights Agreement (for awards made prior to May 2010). Incorporated by reference to Exhibit 10.1 of the Company’s Quarterly Report on Form 10-Q for the fiscal quarter ended September 26, 2009. |
10.28 | * | Form of Indemnification Agreement for directors and certain officers. Incorporated by reference to Exhibit 10 of the Company’s Current Report on Form 8-K filed on February 17, 2010. |
10.29 | * | Form of Stock Appreciation Rights Agreement (for awards made on May 13, 2010). Incorporated by reference to Exhibit 10.34 of the Company's Annual Report on Form 10-K for the fiscal year ended April 22, 2011. |
10.30 | * | Form of Restricted Stock Units Award Agreement (for awards made on or after May 12, 2011). Incorporated by reference to Exhibit 10.40 of the 2012 10-K. |
10.31 | * | Separation and Release Agreement, dated November 9, 2015, between the Company and Kerry Mustoe. Incorporated by reference to Exhibit 10 of the Company's Current Report on Form 8-K filed on November 10, 2015. |
10.32 | * | Offer Letter, dated February 23, 2014, between Electro Scientific Industries, Inc. and Edward C. Grady. Incorporated by reference to Exhibit 10 of the Company’s Current Report on form 8-K filed February 27, 2014. |
10.33 | * | Form of Stock Appreciation Rights Agreement (for awards made between May 2011 and April 2015). Incorporated by reference to Exhibit 10.23 of the Company’s Annual Report on Form 10-K for the fiscal year ended April 2, 2016 (2016 10-K). |
76
10.34 | * | Form of Stock Appreciation Rights Agreement (for awards made after April 2015). Incorporated by reference to Exhibit 10.24 of the 2016 10-K. |
21 | Subsidiaries of the Company | |
23.1 | Consent of Independent Registered Public Accounting Firm - Deloitte & Touche LLP | |
23.2 | Consent of Independent Registered Public Accounting Firm - KPMG LLP | |
24.1 | Power of Attorney for Frederick A. Ball | |
24.2 | Power of Attorney for Richard H. Wills | |
24.3 | Power of Attorney for Edward C. Grady | |
24.4 | Power of Attorney for Laurence E. Cramer | |
24.5 | Power of Attorney for Raymond A. Link | |
24.6 | Power of Attorney for John Medica | |
31.1 | Certification of the Chief Executive Officer pursuant to Section 302 of the Sarbanes-Oxley Act of 2002. | |
31.2 | Certification of the Chief Financial Officer pursuant to Section 302 of the Sarbanes-Oxley Act of 2002. | |
32.1 | Certification of Chief Executive Officer pursuant to 18 U.S.C. Section 1350, as adopted pursuant to Section 906 of the Sarbanes-Oxley Act of 2002. | |
32.2 | Certification of Chief Financial Officer pursuant to 18 U.S.C. Section 1350, as adopted pursuant to Section 906 of the Sarbanes-Oxley Act of 2002. | |
101.INS | XBRL Instance Document | |
101.SCH | XBRL Taxonomy Extension Schema Document | |
101.CAL | XBRL Taxonomy Extension Calculation Linkbase Document | |
101.DEF | XBRL Taxonomy Extension Definition Linkbase Document | |
101.LAB | XBRL Taxonomy Extension Label Linkbase Document | |
101.PRE | XBRL Taxonomy Extension Presentation Linkbase Document | |
77
SIGNATURES
Pursuant to the requirements of Section 13 or 15(d) of the Securities Exchange Act of 1934, the Registrant has duly caused this report to be signed on its behalf by the undersigned, thereunto duly authorized.
Date: | June 14, 2017 | ELECTRO SCIENTIFIC INDUSTRIES, INC. | |
By: | /s/ MICHAEL D. BURGER | ||
Michael D. Burger | |||
President and Chief Executive Officer | |||
Pursuant to the requirements of the Securities Exchange Act of 1934, this report has been signed below by the following persons on behalf of the Registrant and in the capacities indicated on June 14, 2017.
Signature | Title | |
/s/ MICHAEL D. BURGER | President, Chief Executive Officer and Director (Principal Executive Officer) | |
Michael D. Burger | ||
/s/ PAUL OLDHAM | Senior Vice President of Administration, Chief Financial Officer and Corporate Secretary (Principal Financial Officer and Principal Accounting Officer) | |
Paul Oldham | ||
*FREDERICK A. BALL | Director | |
Frederick A. Ball | ||
*LAURENCE E. CRAMER | Director | |
Laurence E. Cramer | ||
*EDWARD C. GRADY | Director | |
Edward C. Grady | ||
*RAYMOND A. LINK | Director | |
Raymond A. Link | ||
*JOHN MEDICA | Director | |
John Medica | ||
*RICHARD H. WILLS | Chairman of the Board | |
Richard H. Wills | ||
* By: | /s/ PAUL OLDHAM | ||
Paul Oldham, Attorney-in-fact | |||
78