Attached files
| file | filename |
|---|---|
| 8-K - 8-K - Intrepid Potash, Inc. | a17-15107_18k.htm |
Exhibit 99.1
Essential Products for Success June 2017
This presentation includes forward looking statements. Forward-looking statements include statements about our future results of operations and financial position, our business strategy and plans, and our objectives for future operations, among other things. In some cases, you can identify these statements by forward-looking words, such as “estimate,” “expect,” “anticipate,” “project,” “plan,” “intend,” “believe,” “forecast,” “foresee,” “likely,” “may,” “should,” “goal,” “target,” “might,” “will,” “could,” “predict” and “continue.” Forward-looking statements are only predictions based on our current knowledge, expectations, and projections about future events. These forward-looking statements are subject to a number of risks, uncertainties and assumptions which include, but are not limited to, those listed under the heading “Risk Factors” in our most recent Annual Report on Form 10-K and any subsequent periodic filings with the Securities and Exchange Commission. Forward-looking statements are based on current plans, estimates and projections and are subject to inherent risks, uncertainties and other factors which could cause actual results to differ materially from the future results expressed or implied by such forward-looking statements. Any forward-looking statements made in this presentation speak only as of the date hereof. We do not intend to update or revise these forward-looking statements to reflect events or circumstances after the date of this presentation and do not assume any responsibility to do so. You are cautioned not to place undue reliance on any forward-looking statements. We caution you that these forward-looking statements are subject to all of the risks and uncertainties, most of which are difficult to predict and many of which are beyond our control, incident to the exploration, production and development of potash and other fertilizers and by-products. These risks include, but are not limited to, our ability to expand Trio® sales internationally and manage associated risks, our ability to successfully expand by-product and water sales, our ability to comply with debt covenants, changes in the price, demand or supply of potash, langbeinite and chemically similar products; declines or changes in agricultural production or fertilizer application rates; changes in reserve estimates; environmental risks; changes in government regulations, including environmental and mining regulations, the enforcement of those regulations and governmental policy changes; and declines in the use of potash products by agricultural industry participants and oil and gas companies. Should one or more of these risks or uncertainties occur, or should underlying assumptions prove incorrect, our actual results and plans could differ materially from those expressed in any forward-looking statements. Certain data and other market information used in this presentation are based on independent industry publications, government publications and other published independent sources. Although we believe these third-party sources are reliable as of their respective dates, we have not independently verified the accuracy or completeness of this information. The industry in which we operate is subject to a high degree of uncertainty and risk due to a variety of factors, which could cause our results to differ materially from those expressed in these third-party publications. Safe Harbor Safe Harbor 2
Diversified and Strategic Assets Variety of products, by-products, and markets Well located production provides domestic competitive advantage Essential Products Consistent need for balanced crop nutrients Fresh water and by-products enhance our assets Timing Improved balance sheet, liquidity, and strategic financial flexibility Alignment Members of the management team are substantial shareholders 3 IMPROVED FINANCIAL POSITION SUPPORTS INTREPID’S BUSINESS PLAN
Incorporated in 2007 and headquartered in Denver, Colorado The only US-based potash producer with approximately 400,000 tons of productive capacity Current potash production solely from lower-cost solar solution mines One of two global producers of langbeinite (Trio®), a low-chloride specialty crop nutrient containing potassium, magnesium and sulfate, with approximately 400,000 tons of productive capacity Opportunities to improve cash flows by growing high-margin by-products, such as salt, magnesium chloride, brines, and sales of water 4 INTREPID OVERVIEW
Diversified and strategic assets
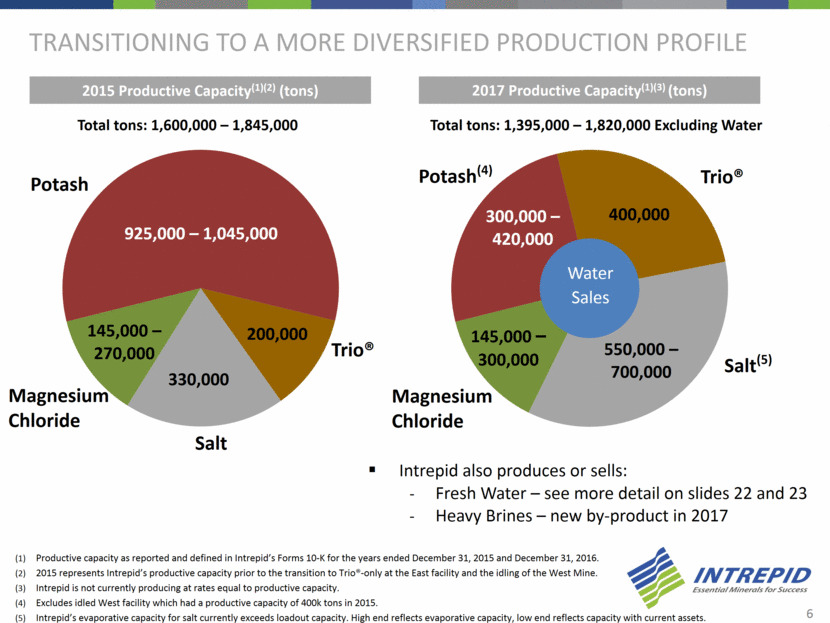
Transitioning to a more diversified production profile 2017 Productive Capacity(1)(3) (tons) 6 Potash(4) Trio® Salt(5) Magnesium Chloride Intrepid also produces or sells: Fresh Water – see more detail on slides 22 and 23 Heavy Brines – new by-product in 2017 2015 Productive Capacity(1)(2) (tons) Productive capacity as reported and defined in Intrepid’s Forms 10-K for the years ended December 31, 2015 and December 31, 2016. 2015 represents Intrepid’s productive capacity prior to the transition to Trio®-only at the East facility and the idling of the West Mine. Intrepid is not currently producing at rates equal to productive capacity. Excludes idled West facility which had a productive capacity of 400k tons in 2015. Intrepid’s evaporative capacity for salt currently exceeds loadout capacity. High end reflects evaporative capacity, low end reflects capacity with current assets. Total tons: 1,395,000 – 1,820,000 Excluding Water Water Sales Total tons: 1,600,000 – 1,845,000 300,000 – 420,000 400,000 550,000 – 700,000 145,000 – 300,000 925,000 – 1,045,000 200,000 330,000 145,000 – 270,000 Potash Trio® Salt Magnesium Chloride
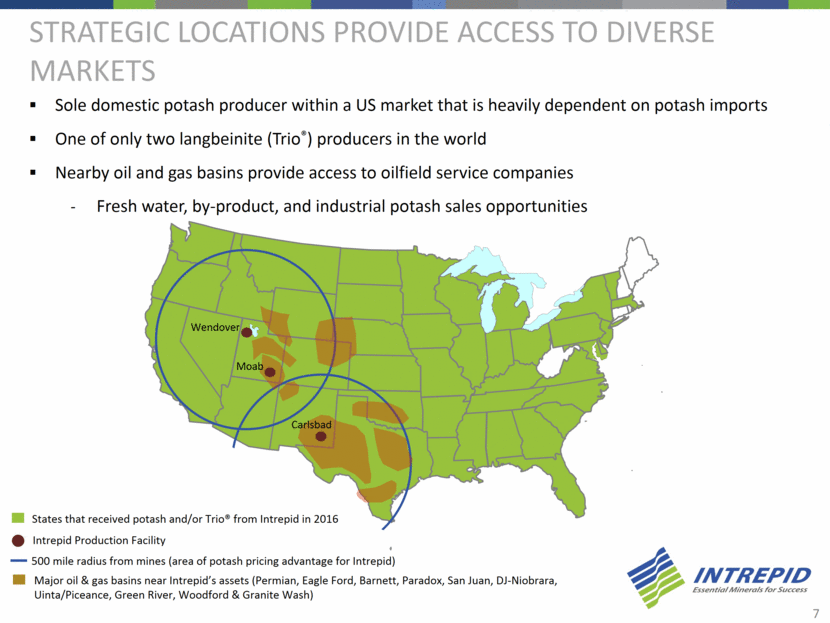
Strategic Locations provide access to Diverse markets Sole domestic potash producer within a US market that is heavily dependent on potash imports One of only two langbeinite (Trio®) producers in the world Nearby oil and gas basins provide access to oilfield service companies Fresh water, by-product, and industrial potash sales opportunities Intrepid Production Facility States that received potash and/or Trio® from Intrepid in 2016 500 mile radius from mines (area of potash pricing advantage for Intrepid) 7 Major oil & gas basins near Intrepid’s assets (Permian, Eagle Ford, Barnett, Paradox, San Juan, DJ-Niobrara, Uinta/Piceance, Green River, Woodford & Granite Wash) Wendover Moab Carlsbad
Essential products
Compelling Fundamentals for crop nutrients Global Population (bln) (1) Global Middle Class (bln) (2) +33% Food Production (Index) (3)(4) Nutrient Consumption (Mt NPK) (3) Arable Land/Person (ha/person) (3) Essential for Farmers to Increase Yields +60% +58% 9 Note: Percentage changes in the above graphs reflect the cumulative change over the respective timeframes shown Sources: United Nations Department of Economics and Social Affairs: The World Population Prospects: 2015 Revision OECD Development Center Working Papers No 295: The Emerging Middle Class in Developing Countries: 2010 Food and Agriculture Organization of the United Nations: World Agriculture towards 2030/2050: The 2012 Revision 2005 is indexed as 100 166 231 263 2005 2030 2050 1.8 3.2 4.9 2009 2020 2030 7.3 8.5 9.7 2015 2030 2050 100 138 160 2005 2030 2050 0.24 0.22 0.20 0.18 2009 2018 2030 2050
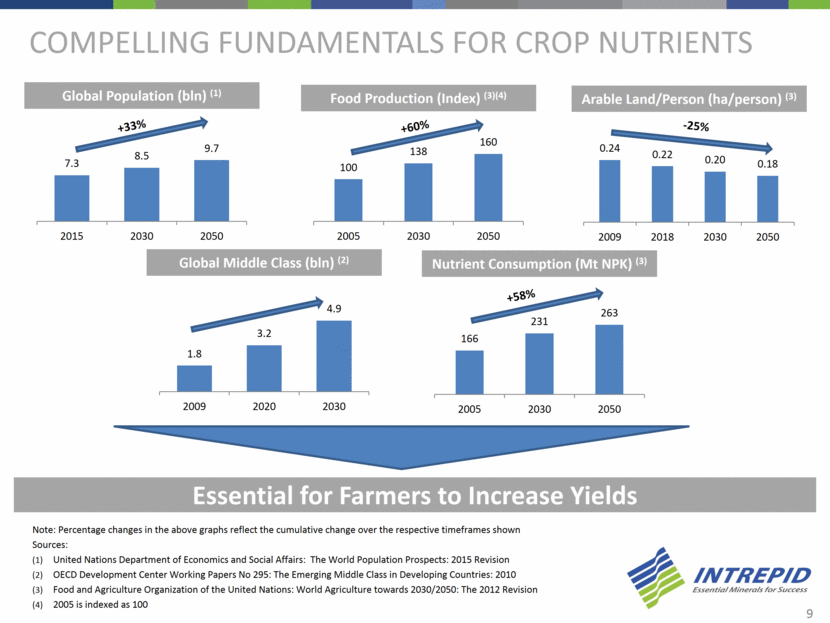
Global Production, Capacity & Price World Potash Production, Capacity & Consumption(1) 10 1986-2006 Price CAGR: 5% Industry supply-constrained in 2008, demonstrating true operational capacity Overcapacity Has Not Always Led To Oversupply Source: Fertecon Prices for Standard KCl FOB Vancouver (2) $0 $0 $0 $1 $1 $1 $1 - 10,000 20,000 30,000 40,000 50,000 60,000 70,000 80,000 90,000 100,000 1981 1982 1983 1984 1985 1986 1987 1988 1989 1990 1991 1992 1993 1994 1995 1996 1997 1998 1999 2000 2001 2002 2003 2004 2005 2006 2007 2008 2009 2010 2011 2012 2013 2014 2015 2016 2017F $ per short ton 000 tons KCl World Potash Production World Potash Capacity World Potash Consumption $0 $100 $200 $300 $400 $500 1981 1982 1983 1984 1985 1986 1987 1988 1989 1990 1991 1992 1993 1994 1995 1996 1997 1998 1999 2000 2001 2002 2003 2004 2005 2006 2007 2008 2009 2010 2011 2012 2013 2014 2015 2016 2017F Price per short ton
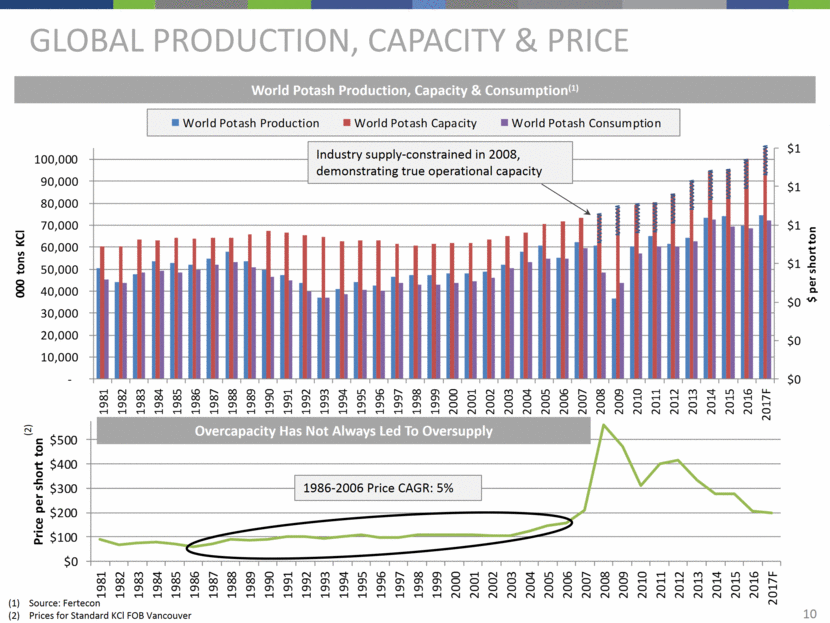
Sources : Fertecon, United States Department of Agriculture (USDA), NOAA National Climatic Data Center. Potash consumption is shown in marketing years (July – June) and includes MOP, SOP, and Mg-SOP, converted to KCl-equivalent tons based on K2O content. KCl equivalent consumption has remained relatively constant with an annual volatility of approximately 9.1 percent over the past 30 years. Corn acres planted in the U.S. in the years 2013 through 2017 were 95.4, 90.6, 88.0, 94.0, and 90.0 million acres. (2017 is March USDA forecast) 1982: Recession leads to lower consumption; payment-in-kind program reduces planted acres Major droughts/floods in Corn Belt Droughts Floods 2001- mid 2008: Global economic expansion leads to increased demand (2006 had delayed Chinese negotiations) U.S. Consumption Remains Steady & Robust U.S. Potash Consumption 11 $0 $2 $4 $6 $8 $10 $12 $14 $16 - 2,000 4,000 6,000 8,000 10,000 12,000 $ per Bushel KCl Equivalent Tons ('000) KCl Equivalent Tons Average Consumption Corn Price Soybean Price 9,363
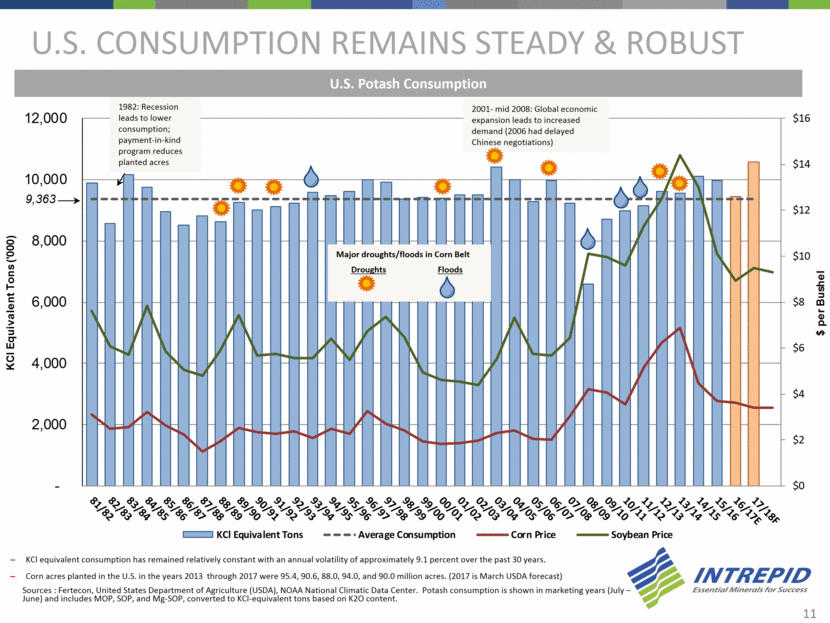
Solar Solution: Safe, low-cost, environmentally friendly production Inject brine into idled or created mine works Allow brine to circulate to dissolve the remaining potash Extract potash enriched brine and pump into solar evaporation pond Allow solar evaporation to occur; potash recrystallizes as water evaporates Harvest the potash from the evaporation ponds Mill the product and have it ready for our customers 12 No underground mining equipment or personnel required No natural gas or coal used to evaporate brine
Solar Solution Advantages Technologically-advanced mining and processing methods Improved recoveries Relatively lower production costs Environmentally friendly Only possible in arid climates Additional mill capacity at HB and Moab Opportunities to improve and increase production and efficiency: AMAX expansion Increase HB flooded area Additional pond expansion in Carlsbad Additional caverns in Moab Additional pond lining in Wendover 13
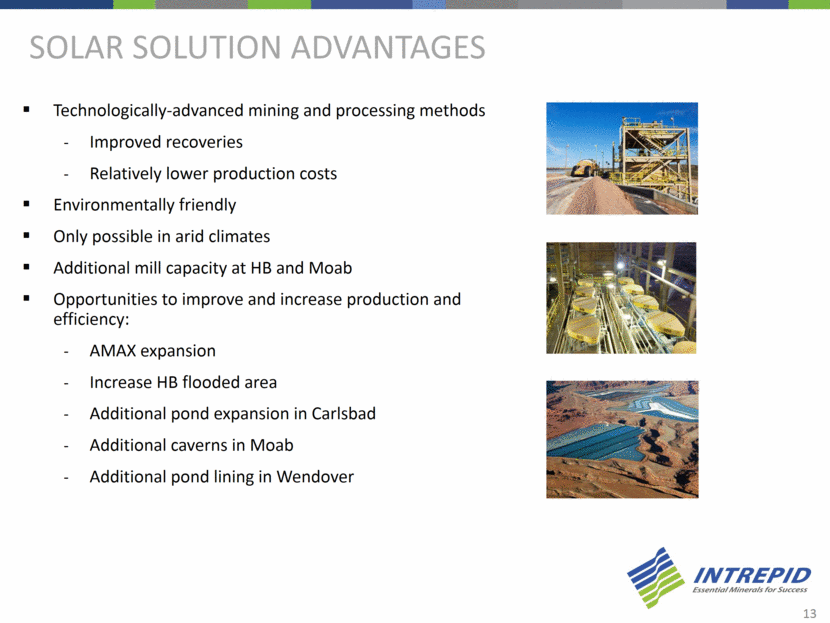
Includes: Barley Citrus Corn Cotton Hay Nuts Potatoes Rice Soybeans Tobacco Wheat Strong industrial sales opportunity pipeline in 2017 Selling into higher margin opportunities Flexibility to react to changes in demand Serving Diverse Markets FOR Potash Includes: Cattle Pet Food Pork Poultry Includes: Oil & Gas Flux White Potash Sales Mix (1) 14 Tons Sold Agricultural Feed Industrial Pro forma to subtract potash tons sold from our West mine, which was idled in July 2016 55% 50% 43% 82% 59% 33% 40% 42% 8% 28% 12% 10% 15% 10% 13% - 100,000 200,000 300,000 400,000 500,000 2013 2014 2015 2016 2017 based on current productive capacity and 5 year averages
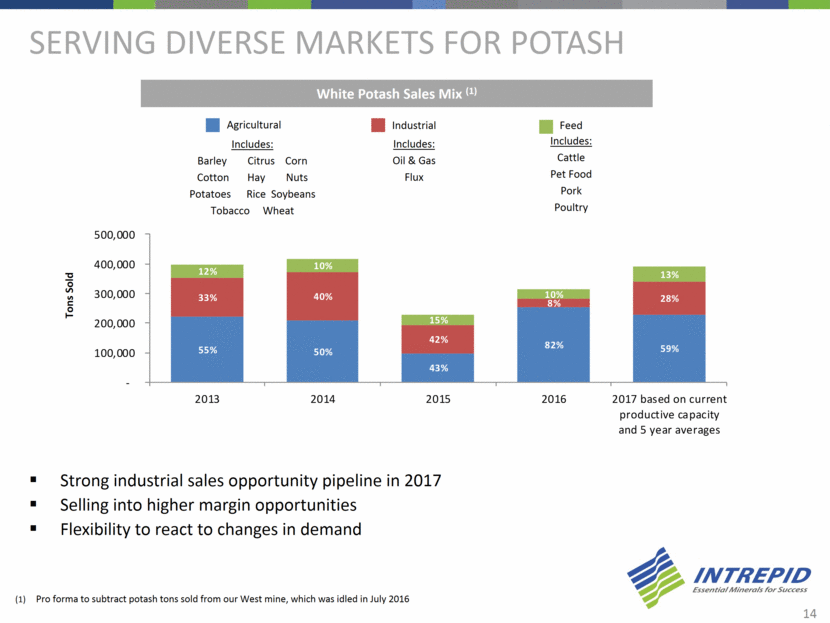
2016 advantage +30% (1) Average net realized sales price per ton is a non-GAAP financial measure calculated as potash gross sales less freight costs, divided by the number of tons sold in the period. Average net realized sales price advantage is a non-GAAP financial measure calculated by us as the difference between our average net realized sales price and the combined estimated average net realized sales prices of Potash Corporation of Saskatchewan Inc. (POT), The Mosaic Company (MOS), and Agrium Inc. (AGU) based on publicly available information and Intrepid estimates. See the non-GAAP reconciliations set forth in in Appendix B of this presentation for additional information. US Production: Potash Competitive Advantage Close-to-market strategy Freight advantage Diverse markets with premium pricing Strong customer relationships No NAFTA or other current tariff risks +20% or higher in 11 of last 12 years Potash Average Net Realized Sales Price Advantage (1) Provides more top-line potash revenue per ton than average of North American competitors 15 $162 $179 $194 $486 $541 $363 $472 $454 $382 $332 $339 $195 $240 $131 $136 $152 $398 $391 $303 $380 $399 $309 $249 $242 $150 $156 $0 $100 $200 $300 $400 $500 $600 2005 2006 2007 2008 2009 2010 2011 2012 2013 2014 2015 2016 Q1 2017 Intrepid Potash Average of North American Competitors
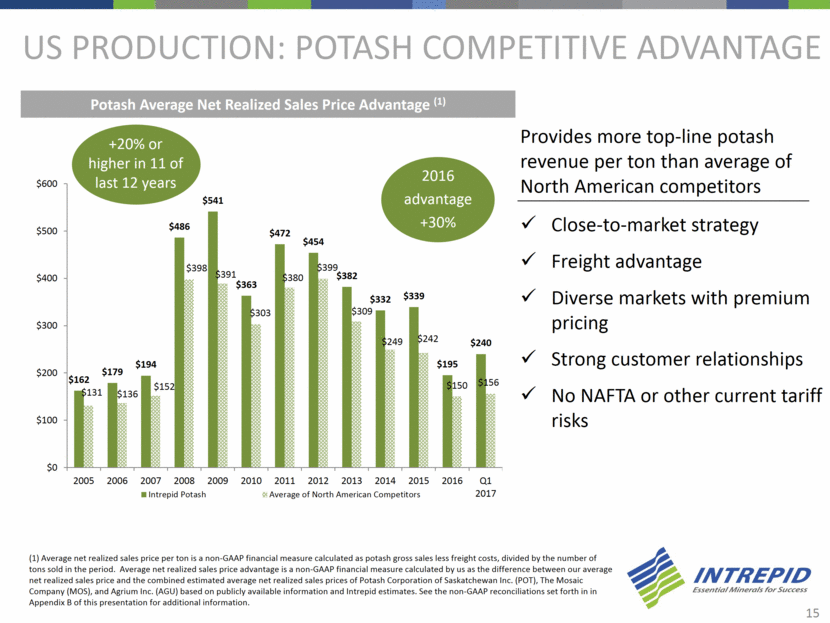
$ Per Short Ton Potash Prices Have Recently FIRMED Potash Price (FOB Cornbelt Warehouse) (1) 16 Source: Green Markets $0 $50 $100 $150 $200 $250 $300 $350 $400 $450
Growing our trio® market Potassium, Magnesium and Sulfur in one delivery mechanism Low-chloride potassium crop nutrient ideal for high-value crops Immediately available nutrients Strong solubility profile – delivers nutrients when the plants need them 100% macronutrients Organic – OMRI® listed and California Department of Food Agriculture approved for organic farming High magnesium content – ideal for magnesium deficient soils Trio® Marketing Benefits of Trio® Sales team has met customers in 20+ countries from mid-2016 through Q1 2017 Confirmed sales in 15 countries through Q1 2017 Reliable and responsive supplier Introductory pricing to displace incumbent products and encourage first-time use Room to improve freight economics Serve multiple growing markets 17
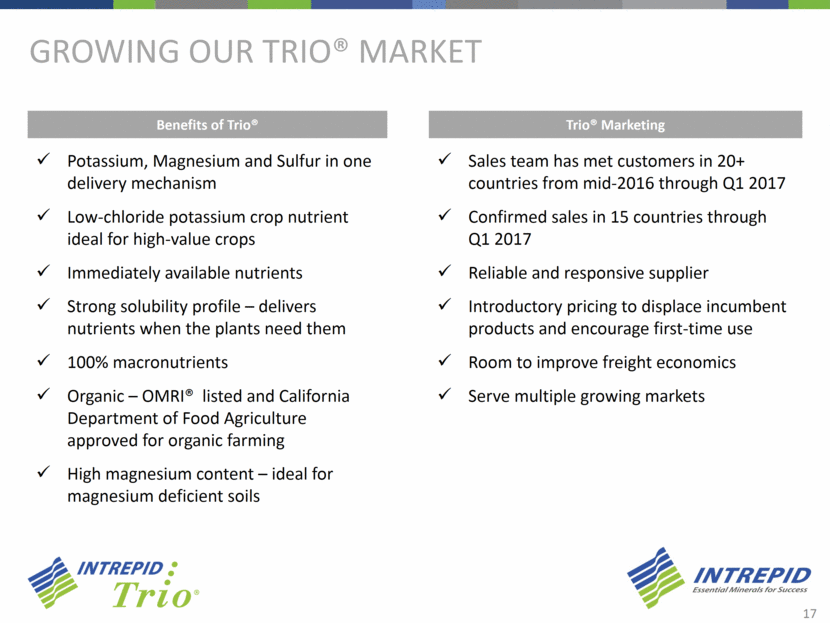
c Chloride Sensitive Crops Crops that do not like chloride and like the potassium, sulfur & magnesium in Trio Oranges Tobacco Onions Grapefruit Almonds Strawberries Cocoa Starch Potatoes Flowers Raspberries Chloride Partly Tolerant Crops Crops that can tolerate some chloride but need it applied before start of vegetative growth; may taste better with less chloride. Grapes Potatoes Bananas Tomatoes Spinach Pineapple Coffee Sunflower Chloride Tolerant Crops Traditional row crops in soils that need the sulfur and magnesium. Sandy soils with magnesium deficiencies. Corn Sugar Cane Cotton Palm Oil Soy Beans Wheat Rice Asparagus Trio® has diverse and growing markets Dragon Fruit Durian Combined 5 yr global production CAGR: 1.6% 5 yr CAGR: 2.6% 5 yr CAGR: 2.8% Production growth rates based on world production from 2009-2014 UN FAO statistics 2.4% 2.0% 1.7% 5.0% 4.2% 4.8% 1.9% 1.1% 2.2% 3.7% 0.8% 0.5% 2.7% 2.0% 3.9% 4.1% 0.2% 1.2% 4.6% 4.8% 5.8% 1.6% 6.5% 2.2% 1.2% 18
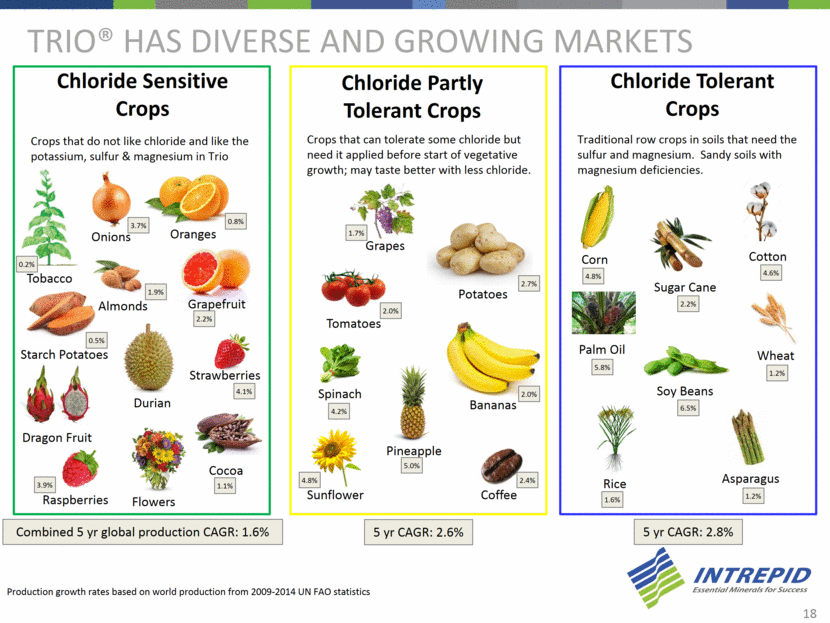
Recent price decreases have made Trio® more competitive in some row crop markets Aggressively expanding domestic warehouse footprint Only producer of OMRI® listed langbeinite Opportunities for Trio® in domestic market Chloride sensitive crops and magnesium deficient soils Row crops with magnesium deficient soils Chloride tolerant crops with mag deficient soils 19
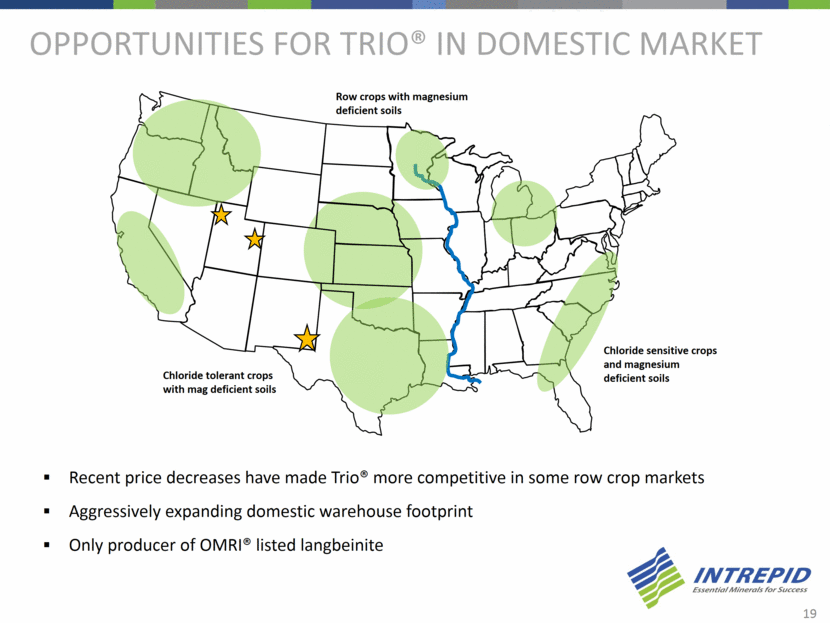
Trio® is well suited for magnesium-deficient soils Map source: Potassium Sulphates & Potassium Nitrate Market Outlook, 2012 Edition, CRU. Assuming Trio® commands 2% of the potassium market in Brazil (comparable to its market share in the US) We believe Trio®’s global addressable market is substantial Brazil alone could represent a ~300k – 500k ton per year market opportunity (1) Beyond Brazil, based on the same methodology, South and Central America together could represent an additional 150k – 300k ton per year potential market 20 Trio Nutrient Ratio 22% K 2 O, 11% Mg, 22% S K 2 O Mg S
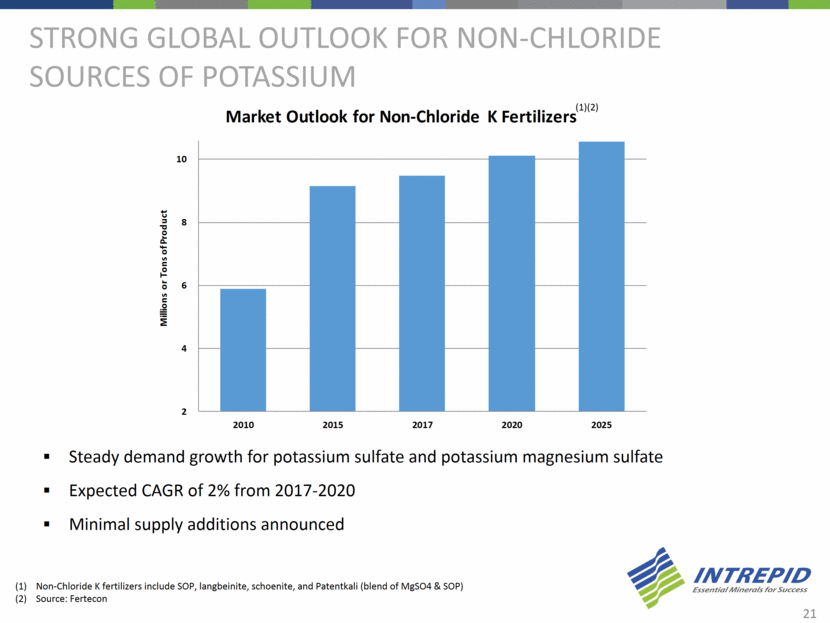
Steady demand growth for potassium sulfate and potassium magnesium sulfate Expected CAGR of 2% from 2017-2020 Minimal supply additions announced Non-Chloride K fertilizers include SOP, langbeinite, schoenite, and Patentkali (blend of MgSO4 & SOP) (2) Source: Fertecon Strong Global outlook for non-chloride sources of potassium (1)(2) 21 2 4 6 8 10 2010 2015 2017 2020 2025 Millions or Tons of Product Market Outlook for Non - Chloride K Fertilizers
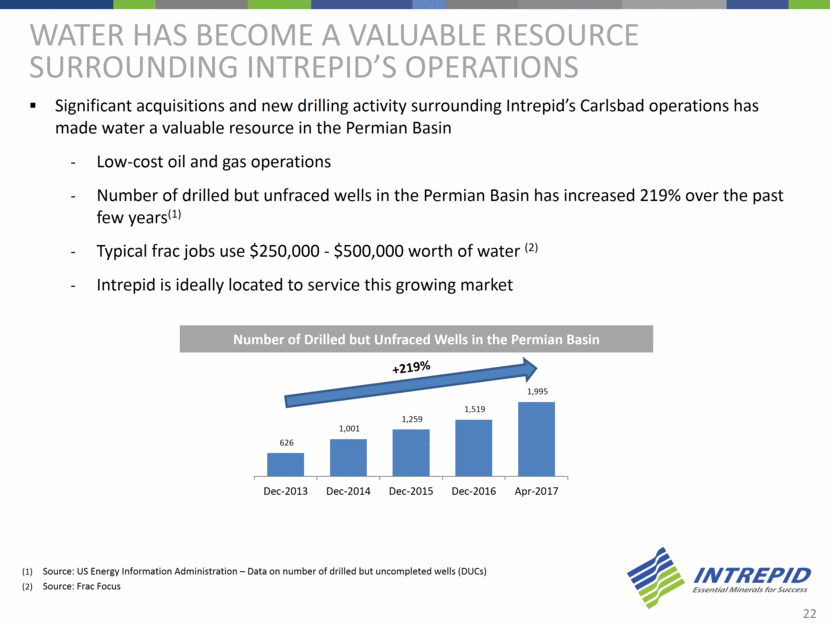
Significant acquisitions and new drilling activity surrounding Intrepid’s Carlsbad operations has made water a valuable resource in the Permian Basin Low-cost oil and gas operations Number of drilled but unfraced wells in the Permian Basin has increased 219% over the past few years(1) Typical frac jobs use $250,000 - $500,000 worth of water (2) Intrepid is ideally located to service this growing market Water has become a valuable resource Surrounding Intrepid’s operations Number of Drilled but Unfraced Wells in the Permian Basin 22 +219% Source: US Energy Information Administration – Data on number of drilled but uncompleted wells (DUCs) Source: Frac Focus 626 1,001 1,259 1,519 1,995 Dec-2013 Dec-2014 Dec-2015 Dec-2016 Apr-2017
Water presents a meaningful cash flow opportunity Intrepid owns over 30,000 acre feet of water rights that are well-located to service the oil & gas industry Well-capitalized, experienced companies involved in the Delaware sub-basin of the Permian basin operate in close proximity to our mines and water rights XTO (Exxon), Chevron, Occidental, Devon, Concho Multi-billion dollar drilling programs planned and announced Based on current sales, executed agreements, and announced activity, water sales could generate meaningful cash flow for several years Potential for $10-15 million in the next 9-12 months Goal of $20-30 million in sales in 2018, with strategy to continue to increase in future years $30 million of annual water sales would equate to about 10,000 acre feet of water @ $0.40/barrel(1) Less than 1/3 of Intrepid’s total water rights Exceptionally high margin potential Low variable costs Minimal capital investment required 23 1,000 acre feet = 7.76 million barrels of water or 21,260 barrels per day (365 days a year) Assuming price per barrel of $0.40, every 1,000 acre feet generated $3.1M of sales (10,000 acre feet = $31M of sales)
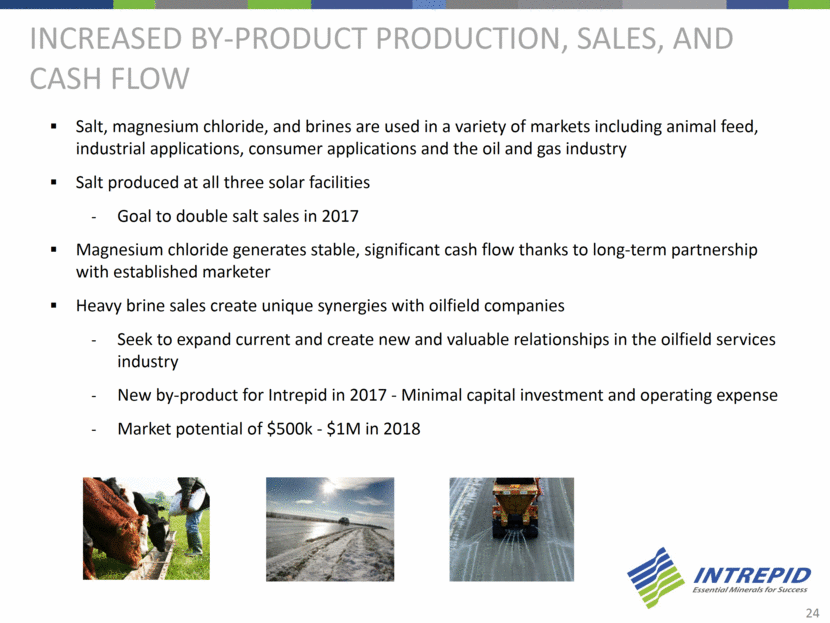
Increased by-product production, sales, and cash flow Salt, magnesium chloride, and brines are used in a variety of markets including animal feed, industrial applications, consumer applications and the oil and gas industry Salt produced at all three solar facilities Goal to double salt sales in 2017 Magnesium chloride generates stable, significant cash flow thanks to long-term partnership with established marketer Heavy brine sales create unique synergies with oilfield companies Seek to expand current and create new and valuable relationships in the oilfield services industry New by-product for Intrepid in 2017 - Minimal capital investment and operating expense Market potential of $500k - $1M in 2018 24
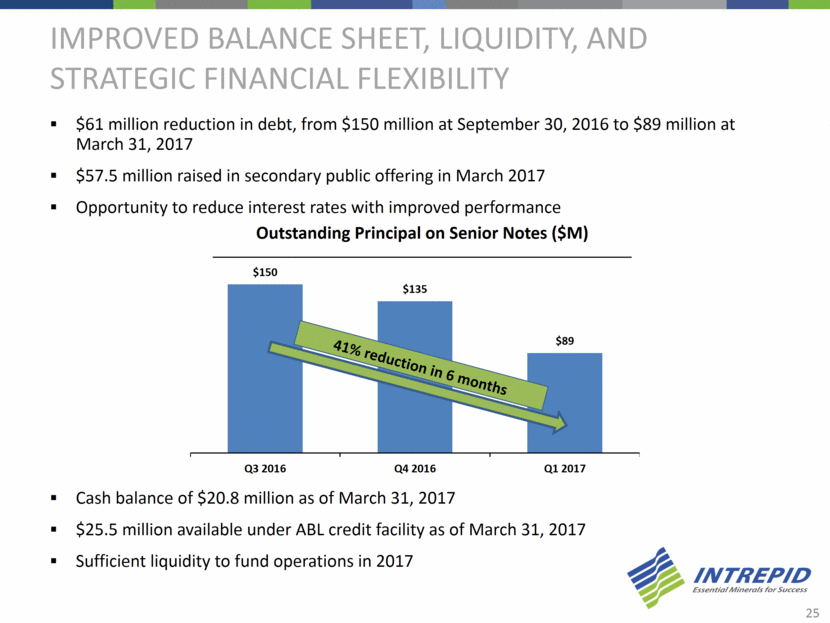
Improved Balance Sheet, liquidity, and strategic financial flexibility $61 million reduction in debt, from $150 million at September 30, 2016 to $89 million at March 31, 2017 $57.5 million raised in secondary public offering in March 2017 Opportunity to reduce interest rates with improved performance Outstanding Principal on Senior Notes ($M) Cash balance of $20.8 million as of March 31, 2017 $25.5 million available under ABL credit facility as of March 31, 2017 Sufficient liquidity to fund operations in 2017 41% reduction in 6 months 25
Continue to increase the diversity of the production profile Maintain operational discipline with a focus on continuous cost improvement Continue to optimize Trio® production and realize sales growth opportunities (international and domestic) Expand water and by-product sales by increasing customer base Capitalize on high-margin and accretive opportunities Improved balance sheet provides flexibility to explore potential acquisition opportunities and long-term partnerships Outlook and Initiatives for 2017 and Beyond 26
Appendix A

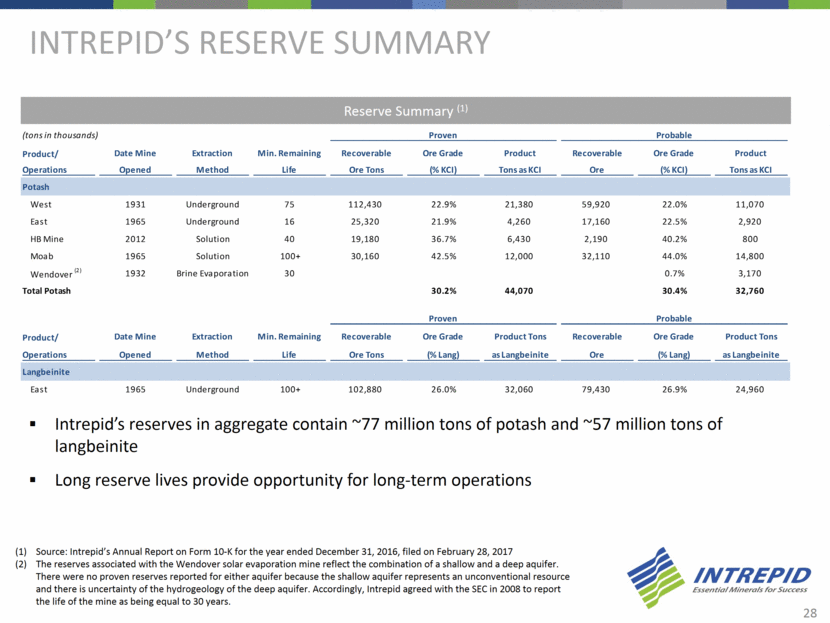
INTREPID’s reserve summary Reserve Summary (1) Intrepid’s reserves in aggregate contain ~77 million tons of potash and ~57 million tons of langbeinite Long reserve lives provide opportunity for long-term operations 28 Source: Intrepid’s Annual Report on Form 10-K for the year ended December 31, 2016, filed on February 28, 2017 (2) The reserves associated with the Wendover solar evaporation mine reflect the combination of a shallow and a deep aquifer. There were no proven reserves reported for either aquifer because the shallow aquifer represents an unconventional resource and there is uncertainty of the hydrogeology of the deep aquifer. Accordingly, Intrepid agreed with the SEC in 2008 to report the life of the mine as being equal to 30 years. (tons in thousands) Proven Probable Product/ Date Mine Extraction Min. Remaining Recoverable Ore Grade Product Recoverable Ore Grade Product Operations Opened Method Life Ore Tons (% KCI) Tons as KCI Ore (% KCI) Tons as KCI Potash West 1931 Underground 75 112,430 22.9% 21,380 59,920 22.0% 11,070 East 1965 Underground 16 25,320 21.9% 4,260 17,160 22.5% 2,920 HB Mine 2012 Solution 40 19,180 36.7% 6,430 2,190 40.2% 800 Moab 1965 Solution 100+ 30,160 42.5% 12,000 32,110 44.0% 14,800 Wendover (2) 1932 Brine Evaporation 30 0.7% 3,170 Total Potash 30.2% 44,070 30.4% 32,760 Proven Probable Product/ Date Mine Extraction Min. Remaining Recoverable Ore Grade Product Tons Recoverable Ore Grade Product Tons Operations Opened Method Life Ore Tons (% Lang) as Langbeinite Ore (% Lang) as Langbeinite Langbeinite East 1965 Underground 100+ 102,880 26.0% 32,060 79,430 26.9% 24,960
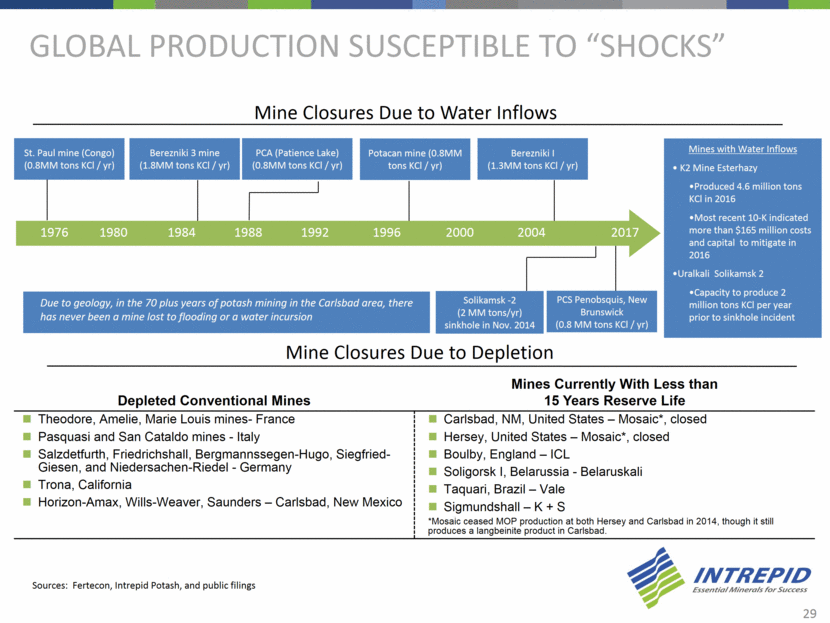
Depleted Conventional Mines Mines Currently With Less than 15 Years Reserve Life Theodore, Amelie, Marie Louis mines- France Pasquasi and San Cataldo mines - Italy Salzdetfurth, Friedrichshall, Bergmannssegen-Hugo, Siegfried-Giesen, and Niedersachen-Riedel - Germany Trona, California Horizon-Amax, Wills-Weaver, Saunders – Carlsbad, New Mexico Carlsbad, NM, United States – Mosaic*, closed Hersey, United States – Mosaic*, closed Boulby, England – ICL Soligorsk I, Belarussia - Belaruskali Taquari, Brazil – Vale Sigmundshall – K + S *Mosaic ceased MOP production at both Hersey and Carlsbad in 2014, though it still produces a langbeinite product in Carlsbad. Sources: Fertecon, Intrepid Potash, and public filings Mine Closures Due to Water Inflows PCA (Patience Lake) (0.8MM tons KCl / yr) Potacan mine (0.8MM tons KCl / yr) Mines with Water Inflows K2 Mine Esterhazy Produced 4.6 million tons KCl in 2016 Most recent 10-K indicated more than $165 million costs and capital to mitigate in 2016 Uralkali Solikamsk 2 Capacity to produce 2 million tons KCl per year prior to sinkhole incident St. Paul mine (Congo) (0.8MM tons KCl / yr) 1980 1984 1988 1996 2000 2017 2004 1992 1976 Berezniki I (1.3MM tons KCl / yr) Berezniki 3 mine (1.8MM tons KCl / yr) Mine Closures Due to Depletion Due to geology, in the 70 plus years of potash mining in the Carlsbad area, there has never been a mine lost to flooding or a water incursion Solikamsk -2 (2 MM tons/yr) sinkhole in Nov. 2014 Global Production susceptible to “shocks” PCS Penobsquis, New Brunswick (0.8 MM tons KCl / yr) 29
Appendix B
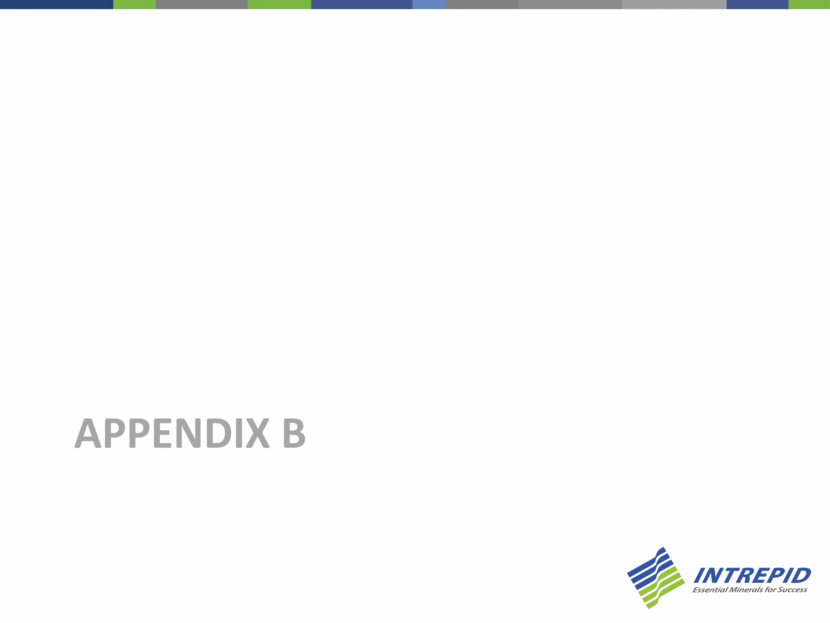
Financial Overview Adjusted EBITDA (in millions) * Adjusted Net Loss per Diluted Share* Adjusted Net Loss (in millions) * * Adjusted net loss, adjusted net loss per diluted share, and adjusted EBITDA are non-GAAP measures. See the non-GAAP reconciliations set forth later in this presentation for additional information. 31 Net Loss (in millions)
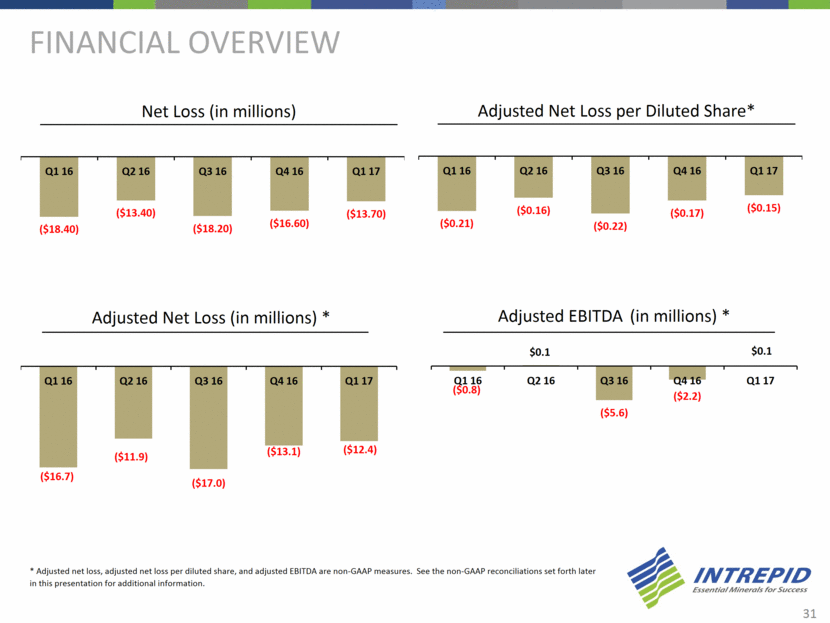
Historical Segment Information (1) Costs associated with abnormal production for the three months ended March 31, 2016 and June 30, 2016, include costs incurred in conjunction with the conversion of the East facility to Trio®-only production. (2) Depreciation, depletion and amortization incurred for potash and Trio® excludes depreciation, depletion and amortization amounts absorbed in or (relieved from) inventory. 32 (In thousands) Potash 2016 2017 Q1 Q2 Q3 Q4 Q1 Sales 53,695 $ 39,196 $ 35,357 $ 31,246 $ 27,220 $ Less: Freight costs 6,551 6,882 6,722 6,505 2,959 Warehousing and handling costs 2,154 2,132 2,072 2,081 1,512 Cost of goods sold 47,288 32,502 29,027 25,201 20,421 Lower-of-cost-or-market inventory adjustments 9,007 2,930 4,856 1,587 - Costs associated with abnormal production and other (1) 650 - - Gross Margin (Deficit) (11,955) $ (5,250) $ (7,320) $ (4,128) $ 2,328 $ Depreciation, depletion and amortization incurred (2) 12,233 $ 8,647 $ 8,090 $ 8,966 $ 7,563 $ Trio ® 2016 2017 Q1 Q2 Q3 Q4 Q1 Sales 19,582 $ 12,644 $ 8,286 $ 10,942 $ 21,112 $ Less: Freight costs 3,781 2,049 1,465 2,301 5,762 Warehousing and handling costs 510 406 544 1,107 1,258 Cost of goods sold 12,489 9,348 6,245 8,752 15,452 Lower-of-cost-or-market inventory adjustments - - 336 1,658 3,824 Costs associated with abnormal production and other (1) - 1,057 - - - Gross Margin (Deficit) 2,802 $ (216) $ (304) $ (2,876) $ (5,184) $ Depreciation, depletion and amortization incurred (2) 1,675 $ 879 $ 597 $ 686 $ 1,699 $
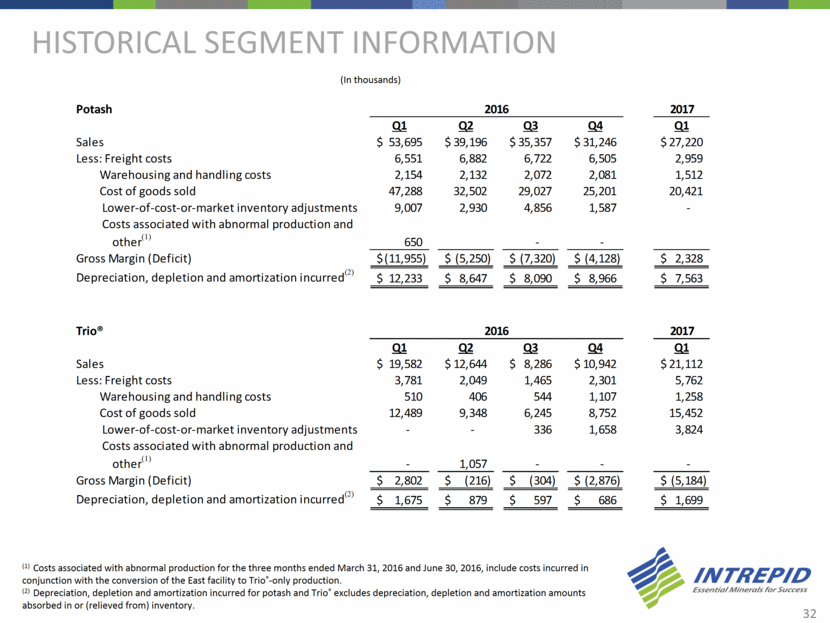
Historical Quarterly Production and Sales Note: One short ton equals 2,000 pounds. One metric tonne, which many international competitors use, equals 1,000 kilograms or 2,204.62 pounds. 33 In thousands of short tons 2016 2017 Q1 Q2 Q3 Q4 Q1 Production Volume Potash 215 116 52 110 118 Trio ® 44 71 85 79 71 Sales Volume Potash 218 168 161 134 101 Trio ® 50 33 25 38 76
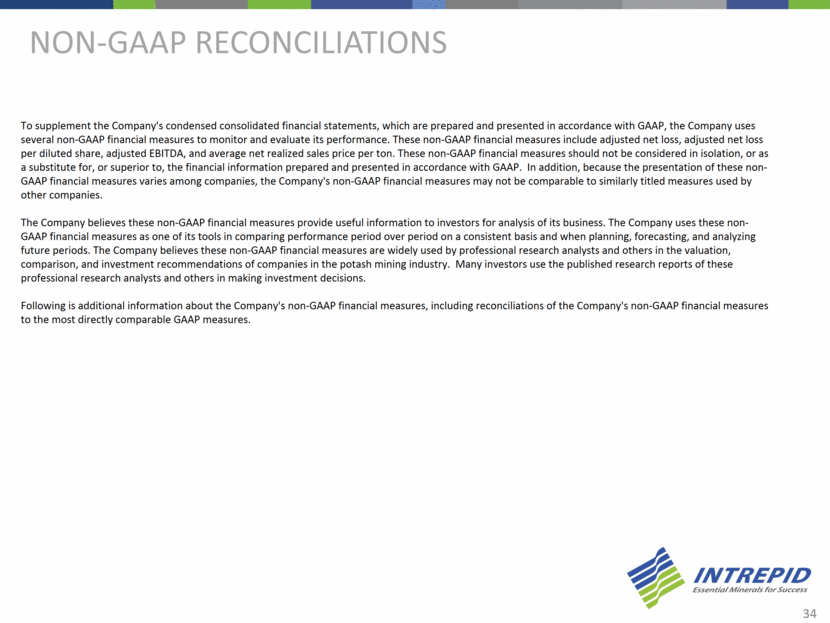
Non-GAAP Reconciliations To supplement the Company's condensed consolidated financial statements, which are prepared and presented in accordance with GAAP, the Company uses several non-GAAP financial measures to monitor and evaluate its performance. These non-GAAP financial measures include adjusted net loss, adjusted net loss per diluted share, adjusted EBITDA, and average net realized sales price per ton. These non-GAAP financial measures should not be considered in isolation, or as a substitute for, or superior to, the financial information prepared and presented in accordance with GAAP. In addition, because the presentation of these non-GAAP financial measures varies among companies, the Company's non-GAAP financial measures may not be comparable to similarly titled measures used by other companies. The Company believes these non-GAAP financial measures provide useful information to investors for analysis of its business. The Company uses these non-GAAP financial measures as one of its tools in comparing performance period over period on a consistent basis and when planning, forecasting, and analyzing future periods. The Company believes these non-GAAP financial measures are widely used by professional research analysts and others in the valuation, comparison, and investment recommendations of companies in the potash mining industry. Many investors use the published research reports of these professional research analysts and others in making investment decisions. Following is additional information about the Company's non-GAAP financial measures, including reconciliations of the Company's non-GAAP financial measures to the most directly comparable GAAP measures. 34
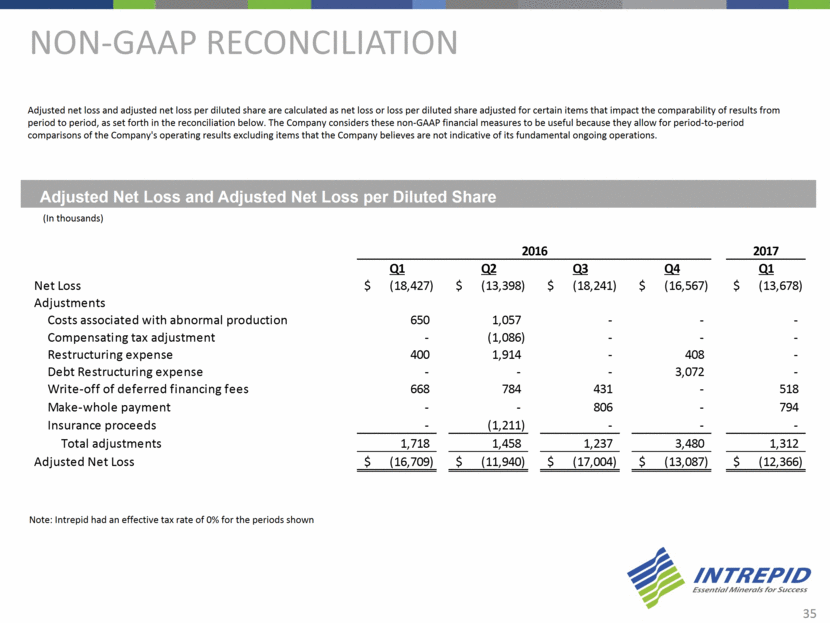
Adjusted net loss and adjusted net loss per diluted share are calculated as net loss or loss per diluted share adjusted for certain items that impact the comparability of results from period to period, as set forth in the reconciliation below. The Company considers these non-GAAP financial measures to be useful because they allow for period-to-period comparisons of the Company's operating results excluding items that the Company believes are not indicative of its fundamental ongoing operations. Adjusted Net Loss and Adjusted Net Loss per Diluted Share (In thousands) Non-GAAP Reconciliation 35 Note: Intrepid had an effective tax rate of 0% for the periods shown 2016 2017 Q1 Q2 Q3 Q4 Q1 Net Loss (18,427) $ (13,398) $ (18,241) $ (16,567) $ (13,678) $ Adjustments Costs associated with abnormal production 650 1,057 - - - Compensating tax adjustment - (1,086) - - - Restructuring expense 400 1,914 - 408 - Debt Restructuring expense - - - 3,072 - Write-off of deferred financing fees 668 784 431 - 518 Make-whole payment - - 806 - 794 Insurance proceeds - (1,211) - - - Total adjustments 1,718 1,458 1,237 3,480 1,312 Adjusted Net Loss (16,709) $ (11,940) $ (17,004) $ (13,087) $ (12,366) $
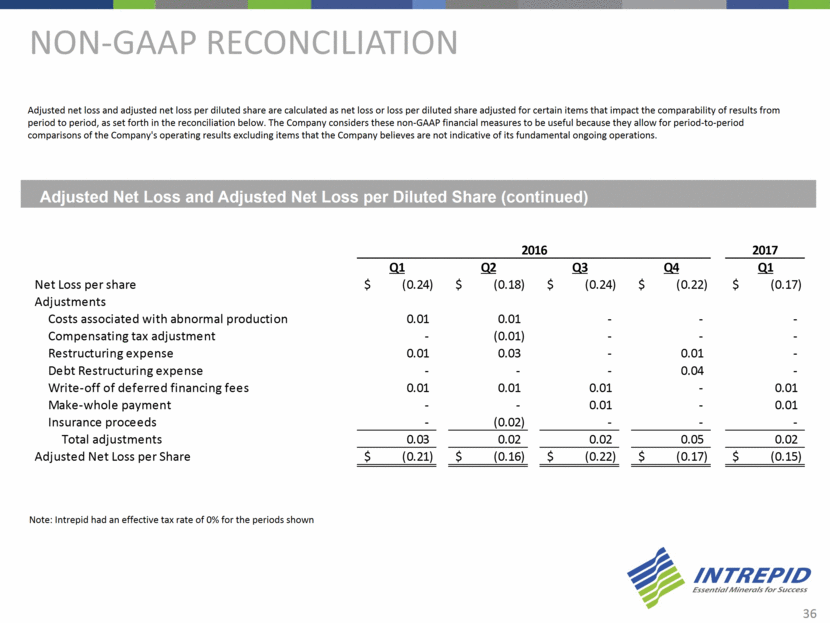
Adjusted net loss and adjusted net loss per diluted share are calculated as net loss or loss per diluted share adjusted for certain items that impact the comparability of results from period to period, as set forth in the reconciliation below. The Company considers these non-GAAP financial measures to be useful because they allow for period-to-period comparisons of the Company's operating results excluding items that the Company believes are not indicative of its fundamental ongoing operations. Adjusted Net Loss and Adjusted Net Loss per Diluted Share (continued) Non-GAAP Reconciliation 36 Note: Intrepid had an effective tax rate of 0% for the periods shown 2016 2017 Q1 Q2 Q3 Q4 Q1 Net Loss per share (0.24) $ (0.18) $ (0.24) $ (0.22) $ (0.17) $ Adjustments Costs associated with abnormal production 0.01 0.01 - - - Compensating tax adjustment - (0.01) - - - Restructuring expense 0.01 0.03 - 0.01 - Debt Restructuring expense - - - 0.04 - Write-off of deferred financing fees 0.01 0.01 0.01 - 0.01 Make-whole payment - - 0.01 - 0.01 Insurance proceeds - (0.02) - - - Total adjustments 0.03 0.02 0.02 0.05 0.02 Adjusted Net Loss per Share (0.21) $ (0.16) $ (0.22) $ (0.17) $ (0.15) $
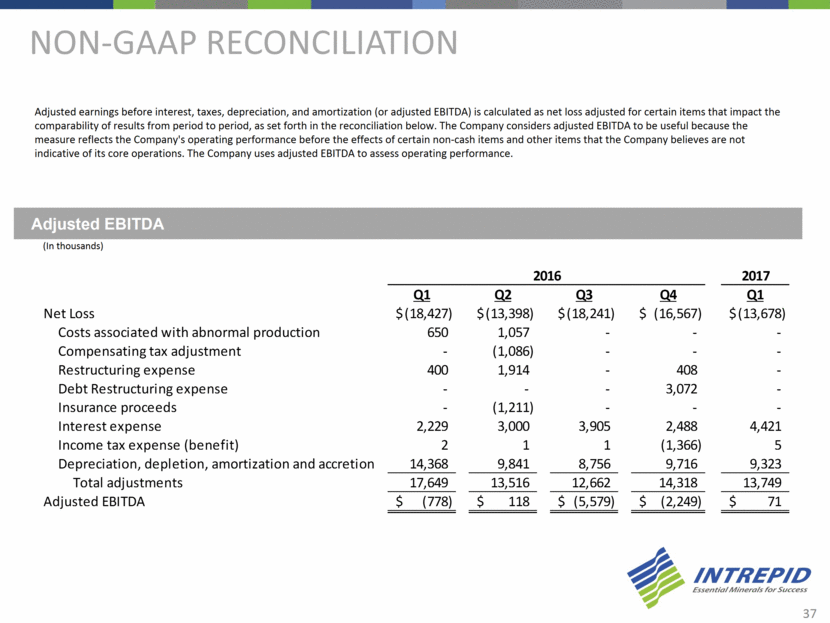
Adjusted EBITDA Adjusted earnings before interest, taxes, depreciation, and amortization (or adjusted EBITDA) is calculated as net loss adjusted for certain items that impact the comparability of results from period to period, as set forth in the reconciliation below. The Company considers adjusted EBITDA to be useful because the measure reflects the Company's operating performance before the effects of certain non-cash items and other items that the Company believes are not indicative of its core operations. The Company uses adjusted EBITDA to assess operating performance. Non-GAAP Reconciliation 37 (In thousands) 2016 2017 Q1 Q2 Q3 Q4 Q1 Net Loss (18,427) $ (13,398) $ (18,241) $ (16,567) $ (13,678) $ Costs associated with abnormal production 650 1,057 - - - Compensating tax adjustment - (1,086) - - - Restructuring expense 400 1,914 - 408 - Debt Restructuring expense - - - 3,072 - Insurance proceeds - (1,211) - - - Interest expense 2,229 3,000 3,905 2,488 4,421 Income tax expense (benefit) 2 1 1 (1,366) 5 Depreciation, depletion, amortization and accretion 14,368 9,841 8,756 9,716 9,323 Total adjustments 17,649 13,516 12,662 14,318 13,749 Adjusted EBITDA (778) $ 118 $ (5,579) $ (2,249) $ 71 $
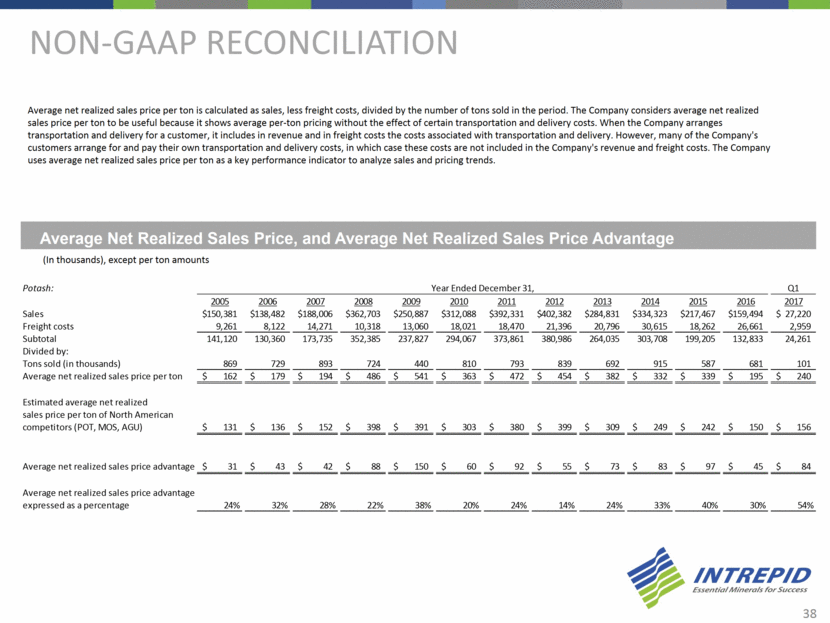
Average net realized sales price per ton is calculated as sales, less freight costs, divided by the number of tons sold in the period. The Company considers average net realized sales price per ton to be useful because it shows average per-ton pricing without the effect of certain transportation and delivery costs. When the Company arranges transportation and delivery for a customer, it includes in revenue and in freight costs the costs associated with transportation and delivery. However, many of the Company's customers arrange for and pay their own transportation and delivery costs, in which case these costs are not included in the Company's revenue and freight costs. The Company uses average net realized sales price per ton as a key performance indicator to analyze sales and pricing trends. Average Net Realized Sales Price, and Average Net Realized Sales Price Advantage (In thousands), except per ton amounts Non-GAAP Reconciliation 38 Potash: Q1 2005 2006 2007 2008 2009 2010 2011 2012 2013 2014 2015 2016 2017 Sales 150,381 $ 138,482 $ 188,006 $ 362,703 $ 250,887 $ 312,088 $ 392,331 $ 402,382 $ 284,831 $ 334,323 $ 217,467 $ 159,494 $ 27,220 $ Freight costs 9,261 8,122 14,271 10,318 13,060 18,021 18,470 21,396 20,796 30,615 18,262 26,661 2,959 Subtotal 141,120 130,360 173,735 352,385 237,827 294,067 373,861 380,986 264,035 303,708 199,205 132,833 24,261 Divided by: Tons sold (in thousands) 869 729 893 724 440 810 793 839 692 915 587 681 101 Average net realized sales price per ton 162 $ 179 $ 194 $ 486 $ 541 $ 363 $ 472 $ 454 $ 382 $ 332 $ 339 $ 195 $ 240 $ Estimated average net realized sales price per ton of North American competitors (POT, MOS, AGU) 131 $ 136 $ 152 $ 398 $ 391 $ 303 $ 380 $ 399 $ 309 $ 249 $ 242 $ 150 $ 156 $ Average net realized sales price advantage 31 $ 43 $ 42 $ 88 $ 150 $ 60 $ 92 $ 55 $ 73 $ 83 $ 97 $ 45 $ 84 $ Average net realized sales price advantage expressed as a percentage 24% 32% 28% 22% 38% 20% 24% 14% 24% 33% 40% 30% 54% Year Ended December 31,
For more information visit our website at www.intrepidpotash.com Investor Relations Contact: Brian Frantz Phone: 303.996.3023 Email: brian.frantz@intrepidpotash.com For more information visit our website at www.intrepidpotash.com Investor Relations Contact: Matt Preston Phone: 303.996.3048 Email: matt.preston@intrepidpotash.com
