Attached files
| file | filename |
|---|---|
| 8-K - 8-K - ENTERGY CORP /DE/ | a03117.htm |

ENTERGY STATISTICAL REPORT |
AND INVESTOR GUIDE |
2016 |
Our Vision: We Power Life |
Our Mission: We exist to operate a world-class energy business that creates sustainable value for our four stakeholders – owners, customers, employees and the communities in which we operate. |
Entergy Corporation is an integrated energy company engaged primarily in electric power production and retail distribution operations. Entergy owns and operates power plants with approximately 30,000 megawatts of electric generating capacity, including nearly 9,000 megawatts of nuclear power. Entergy delivers electricity to 2.9 million utility customers in Arkansas, Louisiana, Mississippi and Texas. Entergy has annual revenues of approximately $10.8 billion and nearly 13,000 employees. |
We have assembled the statistics and facts in this report to support your review and analysis of Entergy’s results over the last five years. This information is available in two electronic files, Excel and PDF in order to facilitate easier access and analysis. |
Entergy Investor Relations |
TABLE OF CONTENTS | Note: The Excel Tab labels correspond to the page numbers | |||
in the PDF version of the 2016 Statistical Report. | ||||
Excel Tab | Excel Tab | |||
ABOUT THIS PUBLICATION | Page 2 | Utility Securities Detail | Page 31 | |
FORWARD-LOOKING INFORMATION | Page 2 | Utility Long-Term Debt and Preferred Stock | Page 31 | |
REGULATION G COMPLIANCE | Page 2 | Entergy Arkansas, Inc. | Page 31 | |
ENTERGY AT A GLANCE | Pages 3 – 4 | Entergy Louisiana, LLC | Page 32 | |
Entergy Mississippi, Inc. | Page 33 | |||
ENTERGY CORPORATION AND SUBSIDIARIES | Entergy New Orleans, Inc. | Page 33 | ||
Selected Financial and Operating Data | Page 5 | Entergy Texas, Inc. | Page 34 | |
Selected Financial Data | Page 5 | System Energy Resources, Inc. | Page 34 | |
Utility Electric Operating Data | Page 5 | Utility Statistical Information | Page 35 | |
Entergy Wholesale Commodities Operating Data | Page 5 | Utility Total Capability | Page 35 | |
Employees | Page 5 | Utility Selected Operating Data | Page 35 | |
Owned and Leased Capability | Page 5 | Utility Consolidating Information | Page 36 | |
Consolidated Quarterly Financial Metrics | Page 6 | Entergy Arkansas, Inc. | Pages 37 – 38 | |
Consolidated Annual Financial Metrics | Page 6 | Entergy Louisiana, LLC | Pages 39 – 40 | |
Financial Results | Page 7 | Entergy Mississippi, Inc. | Pages 41 – 42 | |
GAAP to Non-GAAP Reconciliations: Consolidated Quarterly Results | Page 7 | Entergy New Orleans, Inc. | Pages 43 – 44 | |
GAAP to Non-GAAP Reconciliations: Utility, Parent & Other Quarterly Results | Page 7 | System Energy Resources, Inc. | Page 44 | |
Consolidated Quarterly Special Items | Pages 8 – 9 | Entergy Texas, Inc. | Pages 45 – 46 | |
GAAP to Non-GAAP Reconciliations: Consolidated Annual Results | Page 10 | Utility Nuclear Plant Statistics | Page 47 | |
Consolidated Annual Special Items | Pages 11 – 12 | Utility Regulatory Information | Page 48 | |
Consolidated Statements of Operations | Page 13 | State Regulatory Commissions | Page 48 | |
Consolidating Income Statement | Page 14 | Commission/Council Members | Page 48 | |
Consolidated Balance Sheets | Pages 15 – 16 | |||
Consolidating Balance Sheet | Pages 17 – 18 | ENTERGY WHOLESALE COMMODITIES | ||
Consolidated Statements of Cash Flow | Pages 19 – 20 | EWC Quarterly Financial Metrics | Page 49 | |
Cash Flow Information by Business | Page 20 | EWC Annual Financial Metrics | Page 49 | |
Consolidated Statements of Changes in Equity | Page 21 | EWC Quarterly Operational Metrics | Page 49 | |
Consolidated Statements of Comprehensive | Page 22 | EWC Annual Operational Metrics | Page 49 | |
Income | EWC Total Capacity | Page 49 | ||
Consolidated Capital Expenditures | Page 23 | EWC Nuclear Plant Statistics | Page 50 | |
Entergy Corporation Securities Detail | Page 23 | EWC Non-Nuclear Wholesale Assets | Page 50 | |
Entergy Corporation Long-Term Debt | Page 23 | Plant Statistics | ||
Securities Ratings (Outlook) | Page 23 | EWC Non-Nuclear Wholesale Assets | Page 50 | |
Preferred Member Interests | Page 23 | Plant Emissions | ||
EWC Nuclear Securities Detail | Page 51 | |||
UTILITY | EWC Non-Nuclear Wholesale Assets | Page 51 | ||
Utility Quarterly Financial Metrics | Page 24 | Securities Detail | ||
Utility Annual Financial Metrics | Page 24 | |||
Utility Securities Ratings (Outlook) | Page 24 | DEFINITIONS OF OPERATIONAL MEASURES AND | ||
Utility Historical Capital Expenditures | Page 24 | GAAP AND NON-GAAP FINANCIAL MEASURES | Page 52 | |
Utility Financial Results | Page 25 | |||
Utility Consolidating Income Statement | Page 25 | REG G RECONCILIATIONS | ||
Utility Consolidating Balance Sheet | Pages 26 – 27 | Financial Measures | Pages 53 – 66 | |
Utility Selected Annual Financial Metrics | Pages 28 – 30 | |||
INVESTOR INFORMATION | Page 67 | |||
ABOUT THIS PUBLICATION | |
This publication is unaudited and should be used in conjunction with Entergy’s | • uncertainty regarding the establishment of interim or permanent sites for |
2016 Annual Report to Shareholders and Form 10-K filed with the Securities | spent nuclear fuel and nuclear waste storage and disposal and the level of |
and Exchange Commission. It has been prepared for information purposes and | spent fuel and nuclear waste disposal fees charged by the U.S. |
is not intended for use in connection with any sale or purchase of, or any offer | government or other providers related to such sites |
to buy, any securities of Entergy Corporation or its subsidiaries. | • variations in weather and the occurrence of hurricanes and other storms |
and disasters, including uncertainties associated with efforts to remediate | |
FORWARD-LOOKING INFORMATION | the effects of hurricanes, ice storms, or other weather events and the recovery |
In this report and from time to time, Entergy Corporation makes statements concerning | of costs associated with restoration, including accessing funded storm reserves, |
its expectations, beliefs, plans, objectives, goals, strategies, and future | federal and local cost recovery mechanisms, securitization, and insurance |
events or performance. Such statements are “forward-looking statements” | • effects of climate change, including the potential for increases in sea |
within the meaning of the Private Securities Litigation Reform Act of 1995. | levels or coastal land and wetland loss |
Words such as “may,” “will,” “could,” “project,” “believe,” “anticipate,” “intend,” | • changes in the quality and availability of water supplies and the related |
“expect,” “estimate,” “continue,” “potential,” “plan,” “predict,” “forecast,” | regulation of water use and diversion |
and other similar words or expressions are intended to identify forward-looking | • Entergy’s ability to manage its capital projects and operation |
statements but are not the only means to identify these statements. Although Entergy | and maintenance costs |
believes that these forward-looking statements and the underlying assumptions are | • Entergy’s ability to purchase and sell assets at attractive prices |
reasonable, it cannot provide assurance that they will prove correct. Any | and on other attractive terms |
forward-looking statement is based on information current as of the date of this | • the economic climate, and particularly economic conditions in Entergy’s |
report and speaks only as of the date on which such statement is made. | Utility service area and the Northeast United States and events and |
Except to the extent required by the federal securities laws, Entergy undertakes | circumstances that could influence economic conditions in those areas, |
no obligation to publicly update or revise any forward-looking statements, | including power prices, and the risk that anticipated load growth |
whether as a result of new information, future events, or otherwise. | may not materialize |
Forward-looking statements involve a number of risks and uncertainties. | • the effects of Entergy’s strategies to reduce tax payments |
There are factors that could cause actual results to differ materially from those | • changes in the financial markets and regulatory requirements for the |
expressed or implied in the forward-looking statements, including those | issuance of securities, particularly as they affect access to |
factors discussed or incorporated by reference in (a) Item 1A. Risk Factors | capital and Entergy’s ability to refinance existing securities, execute |
in the 2016 Form 10-K, (b) Management’s Financial Discussion and Analysis | share repurchase programs, and fund investments and acquisitions |
in the 2016 Form 10-K, and (c) the following factors (in addition to others | • actions of rating agencies, including changes in the ratings of |
described elsewhere in this report and in subsequent securities filings): | debt and preferred stock, changes in general corporate ratings, |
• resolution of pending and future rate cases and negotiations, | and changes in the rating agencies’ ratings criteria |
including various performance-based rate discussions, | • changes in inflation and interest rates |
Entergy’s utility supply plan, and recovery of fuel and purchased power costs | • the effect of litigation and government investigations or proceedings |
• long-term risks and uncertainties associated with the termination of the System | • changes in technology, including with respect to new, developing, or |
Agreement in 2016, including the potential absence of federal authority to resolve | alternative sources of generation |
certain issues among the Utility operating companies and their retail regulators | • the effects, including increased security costs, of threatened or actual |
• regulatory and operating challenges and uncertainties and economic risks | terrorism, cyber-attacks or data security breaches, natural or man-made |
associated with the Utility operating companies’ participation in MISO, | electromagnetic pulses that affect transmission or generation infrastructure, |
including the effect of current or projected MISO market rules and | accidents, and war or a catastrophic event such as a nuclear accident or a |
market and system conditions in the MISO markets, the allocation of MISO system | natural gas pipeline explosion |
transmission upgrade costs, and the effect of planning decisions that MISO makes | • Entergy’s ability to attract and retain talented management and directors |
with respect to future transmission investments by the Utility operating companies | • changes in accounting standards and corporate governance |
• changes in utility regulation, including the beginning or end of retail and wholesale | • declines in the market prices of marketable securities and resulting funding |
competition, the ability to recover net utility assets and other potential stranded | requirements and the effects on benefits costs for Entergy’s defined benefit |
costs, and the application of more stringent transmission reliability requirements | pension and other postretirement benefit plans |
or market power criteria by the FERC or the U.S. Department of Justice | • future wage and employee benefit costs, including changes |
• changes in the regulation or regulatory oversight of Entergy’s nuclear generating | in discount rates and returns on benefit plan assets |
facilities and nuclear materials and fuel, including with respect to the planned, potential | • changes in decommissioning trust fund values or earnings or in the |
or actual shutdown of nuclear generating facilities owned or operated by | timing of, requirement for, or cost to decommission Entergy's nuclear plant |
Entergy Wholesale Commodities and the effects of new or existing safety or | sites and the implementation of decommissioning of such sites |
environmental concerns regarding nuclear power plants and nuclear fuel | following shutdown |
• resolution of pending or future applications, and related regulatory proceedings | • the decision to cease merchant power generation at all Entergy |
and litigation, for license renewals or modifications or other authorizations required | Wholesale Commodities nuclear power plants by as early as 2021, including |
of nuclear generating facilities and the effect of public and political opposition on | the implementation of the planned shutdown of Pilgrim, Palisades, |
these applications, regulatory proceedings and litigation | Indian Point 2, and Indian Point 3 |
• the performance of and deliverability of power from Entergy’s generation | • the effectiveness of Entergy’s risk management policies and procedures |
resources, including the capacity factors at its nuclear generating facilities | and the ability and willingness of its counterparties to satisfy their |
• the operation and maintenance of Entergy’s nuclear generating facilities require | financial and performance commitments |
the commitment of substantial human and capital resources that can result in | • factors that could lead to impairment of long-lived assets |
increased costs and capital expenditures | • the ability to successfully complete strategic transactions Entergy may |
• Entergy’s ability to develop and execute on a point of view regarding future | undertake, including mergers, acquisitions, or divestitures, regulatory or |
prices of electricity, natural gas, and other energy-related commodities | other limitations imposed as a result of any such strategic transaction |
• prices for power generated by Entergy’s merchant generating | and the success of the business following any such strategic transaction |
facilities and the ability to hedge, meet credit support requirements for hedges, | |
sell power forward or otherwise reduce the market price risk associated | REGULATION G COMPLIANCE |
with those facilities, including the Entergy Wholesale Commodities nuclear plants | Financial performance measures shown in this report include those |
• the prices and availability of fuel and power Entergy must purchase | calculated and presented in accordance with generally accepted |
for its Utility customers, and Entergy’s ability to meet credit support | accounting principles (GAAP), as well as those that are considered |
requirements for fuel and power supply contracts | non-GAAP measures. This report includes non-GAAP measures |
• volatility and changes in markets for electricity, natural gas, | of operational earnings; operational EPS; adjusted earnings; |
uranium, emissions allowances, and other energy-related commodities, | operational adjusted EBITDA; operational ROIC; operational ROE; |
and the effect of those changes on Entergy and its customers | operational return on average member's equity; operational non-fuel operation |
• changes in law resulting from federal or state energy legislation or | and maintenance expense; operational common dividend payout ratio; |
legislation subjecting energy derivatives used in hedging and risk | gross liquidity; net debt to net capital ratio; debt to capital ratio, excluding |
management transactions to governmental regulation | securitization debt; net debt to net capital ratio, excluding securitization debt; |
• changes in environmental laws and regulations or associated litigation, including | parent debt to total debt ratio, excluding securitization debt; |
requirements for reduced emissions of sulfur dioxide, nitrogen oxide, greenhouse | debt to operational adjusted EBITDA, excluding securitization debt; |
gases, mercury, particulate matter, heat, and other regulated air and water emissions, | operational FFO to debt ratio, excluding securitization debt; operational |
and changes in costs of compliance with environmental and other laws and regulations | net revenue when describing Entergy’s results of operations and financial |
• the effects of changes in federal, state or local laws and regulations, | performance. We have prepared reconciliations of these measures to the |
and other governmental actions or policies, including changes in | most directly comparable GAAP measures. Reconciliations can be found |
monetary, fiscal, tax, environmental, or energy policies | on pages 7, 10, and 53 – 66. |
ENTERGY AT A GLANCE | ||
BUSINESS SEGMENT AND LEGAL ENTITY STRUCTURE OVERVIEW | ||
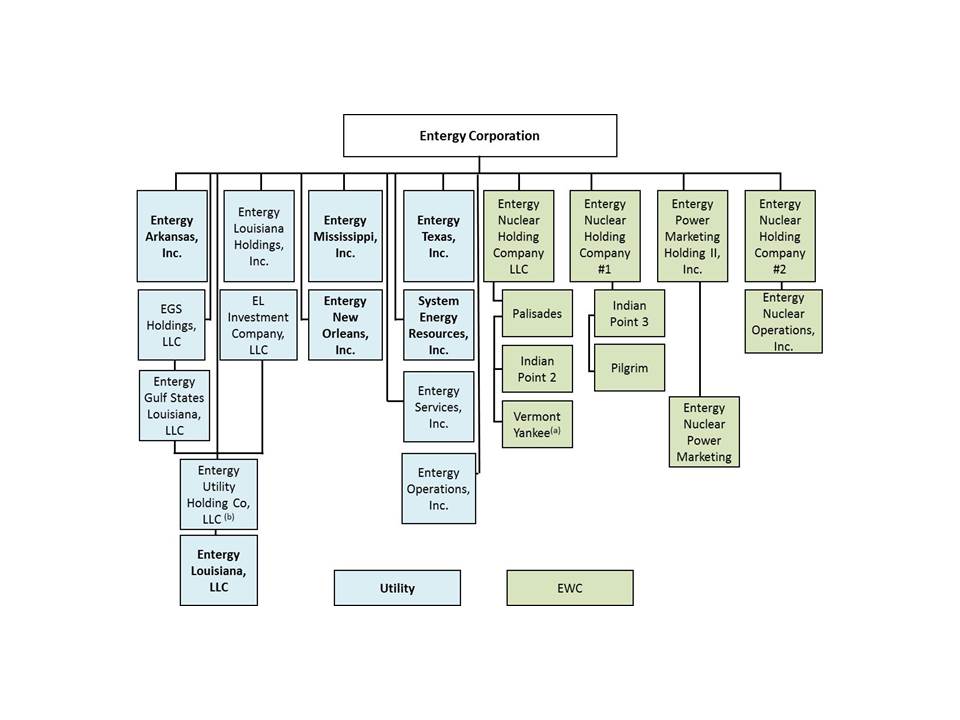
Above diagram represents business segment structure as of 5/31/17 and does not necessarily represent complete legal entity organization structure | ||
Only Entergy Wholesale Commodities plants with greater than 500 MWs of owned capacity are shown | ||
(a) Vermont Yankee plant ceased power production on 12/29/14 | ||
(b) Unaffiliated third parties own 21% | ||
2016 CORPORATE PROFILE | BUSINESS SEGMENTS | |
Entergy Corporation is a Fortune 500 integrated energy company | Entergy’s five year results in this report are presented in | |
engaged primarily in electric power production and retail | three business segments: | |
distribution operations. | ||
• Approximately 30,000 MW electric generating capacity | • Utility | |
• Nearly 9,000 MW nuclear power | • Parent and Other | |
• 2.9 million utility customers | • Entergy Wholesale Commodities | |
• Approximately $10.8 billion annual revenues | ||
• Nearly 13,000 employees | ||
• 77 electric generating units operated | ||
ENTERGY CORPORATION AND SUBSIDIARIES | ||
BUSINESS SEGMENTS (CONTINUED) | ||
UTILITY | ENTERGY WHOLESALE COMMODITIES (EWC) | |
Entergy’s utility companies generate, transmit, distribute, and sell | Entergy has announced the sale or closure of the EWC nuclear assets and the | |
electric power, and operate a small natural gas distribution business. | the sale of certain non-nuclear assets as part of Entergy's planned and | |
• Five electric utilities with 2.9 million customers | orderly exit from the merchant power business. | |
• Four states – Arkansas, Louisiana, Mississippi, Texas | ||
• 22,000 MW generating capacity | EWC owns, operates and decommissions nuclear plants in the northern | |
• Two gas utilities with 199,000 customers | United States and sells the electric power produced by its operating plants to | |
wholesale customers. EWC also provides services to other nuclear power plant | ||
ENTERGY ARKANSAS, INC. (EAI) | owners and owns interests in non-nuclear power plants that sell the electric power | |
Entergy Arkansas generates, transmits, distributes, and sells electric | produced by those plants to wholesale customers. | |
power to 707,000 retail customers in portions of Arkansas. | ||
• 4,406 MW nuclear-owned generating capacity in five units in northern U.S. as of | ||
ENTERGY LOUISIANA, LLC (ELL) | 12/31/16 | |
Entergy Louisiana generates, transmits, distributes, and sells electric | • Pilgrim Nuclear Power Station in Plymouth, Massachusetts | |
power to 1,072,000 retail customers in portions of Louisiana. Entergy | • James A. FitzPatrick Nuclear Power Plant in Oswego, New York | |
Louisiana also provides natural gas service to 93,000 customers in | • Indian Point Energy Center Units 2 and 3 in Buchanan, New York | |
the Baton Rouge, Louisiana area. | • Palisades Nuclear Plant in Covert, Michigan | |
• 394 net MW non-nuclear generating capacity | ||
ENTERGY MISSISSIPPI, INC. (EMI) | • 800 MW under management services contract | |
Entergy Mississippi generates, transmits, distributes, and sells electric | • Cooper Nuclear Station located near Brownville, Nebraska | |
power to 447,000 retail customers in portions of Mississippi. | ||
ENTERGY NEW ORLEANS, INC. (ENOI) | FitzPatrick was sold in early 2017. In 2018, Entergy plans to close | |
Entergy New Orleans generates, transmits, distributes, and sells | Palisades, followed by Pilgrim in 2019 and Indian Point Unit 2 in 2020 and Unit 3 | |
electric power to 198,000 retail customers in the city of New Orleans, | in 2021. | |
Louisiana. Entergy New Orleans also provides natural gas utility | ||
service to 106,000 customers in the city of New Orleans. | Vermont Yankee Nuclear Power Station was shutdown at the end of 2014. | |
Entergy has entered into an agreement to sell Vermont Yankee. The transaction | ||
ENTERGY TEXAS, INC. (ETI) | is expected to close by the end of 2018. | |
Entergy Texas generates, transmits, distributes, and sells electric power | ||
to 444,000 retail customers in portions of Texas. | ||
SYSTEM ENERGY RESOURCES, INC. (SERI) | ||
System Energy owns or leases 90% of the Grand Gulf 1 nuclear | ||
generating facility. System Energy sells energy and capacity from | ||
Grand Gulf 1 at wholesale to Entergy Arkansas (36%), Entergy Louisiana (14%), | ||
Entergy Mississippi (33%) and Entergy New Orleans (17%). | ||
UTILITY NUCLEAR PLANTS | ||
Entergy owns and operates five nuclear units at four plant sites to serve | ||
its regulated utility business: Arkansas Nuclear One (ANO) Units 1 and 2 | ||
near Russellville, Arkansas; Grand Gulf Nuclear Station in Port Gibson, | ||
Mississippi; River Bend Station in St. Francisville, Louisiana and | ||
Waterford 3 in Killona, Louisiana. | ||
SELECTED FINANCIAL AND OPERATING DATA | |||||||||||||||
SELECTED FINANCIAL DATA | |||||||||||||||
2016 | 2015 | 2014 | 2013 | 2012 | |||||||||||
GAAP MEASURES | |||||||||||||||
Operating Revenues ($ millions) | 10,846 | 11,513 | 12,495 | 11,391 | 10,302 | ||||||||||
As-Reported Net Income (Loss) Attributable to Entergy Corporation ($ millions) | (584 | ) | (177 | ) | 941 | 712 | 847 | ||||||||
As-Reported Earnings Per Share ($) | (3.26 | ) | (0.99 | ) | 5.22 | 3.99 | 4.76 | ||||||||
Common Dividend Paid Per Share ($) | 3.42 | 3.34 | 3.32 | 3.32 | 3.32 | ||||||||||
Common Dividend Payout Ratio – As-Reported (%) | (104 | ) | (339 | ) | 64 | 83 | 70 | ||||||||
NON-GAAP MEASURES | |||||||||||||||
Operational Earnings ($ millions) | 1,272 | 1,076 | 1,050 | 957 | 1,109 | ||||||||||
Operational Earnings Per Share ($) | 7.11 | 6.00 | 5.83 | 5.36 | 6.23 | ||||||||||
Special Items ($ millions) | (1,855 | ) | (1,252 | ) | (109 | ) | (245 | ) | (262 | ) | |||||
Special Items Per Share ($) | (10.37 | ) | (6.99 | ) | (0.61 | ) | (1.37 | ) | (1.47 | ) | |||||
Common Dividend Payout Ratio – Operational (%) | 48 | 56 | 57 | 62 | 53 | ||||||||||
UTILITY ELECTRIC OPERATING DATA | |||||||||||||||
2016 | 2015 | 2014 | 2013 | 2012 | |||||||||||
Retail Kilowatt-Hour Sales (millions) | 112,595 | 112,312 | 110,910 | 107,781 | 107,004 | ||||||||||
Peak Demand (megawatts) | 21,387 | 21,730 | 20,472 | 21,581 | 21,866 | ||||||||||
Retail Customers – Year End (thousands) | 2,868 | 2,845 | 2,818 | 2,800 | 2,778 | ||||||||||
ENTERGY WHOLESALE COMMODITIES OPERATING DATA | |||||||||||||||
2016 | 2015 | 2014 | 2013 | 2012 | |||||||||||
Billed Electric Energy Sales (gigawatt hours) | 35,881 | 39,745 | 44,424 | 45,127 | 46,178 | ||||||||||
EMPLOYEES | |||||||||||||||
2016 | 2015 | 2014 | 2013 | 2012 | |||||||||||
Total Employees – Year End | 13,513 | 13,579 | 13,393 | 13,808 | 14,625 | ||||||||||
OWNED AND LEASED CAPABILITY (MW)(a) | ||||||||||||||||
As of December 31, 2016 | ||||||||||||||||
EAI | ELL | EMI | ENOI | ETI | SERI | EWC(b)(c) | Total | |||||||||
Gas/Oil | 2,143 | 7,081 | 3,102 | 512 | 2,007 | — | 213 | 15,058 | ||||||||
Coal | 1,196 | 359 | 420 | — | 265 | — | 181 | 2,421 | ||||||||
Total Fossil | 3,339 | 7,440 | 3,522 | 512 | 2,272 | — | 394 | 17,479 | ||||||||
Nuclear | 1,818 | 2,132 | — | — | — | 1,272 | 4,406 | 9,628 | ||||||||
Hydro | 74 | — | — | — | — | — | — | 74 | ||||||||
Total | 5,231 | 9,572 | 3,522 | 512 | 2,272 | 1,272 | 4,800 | 27,181 | ||||||||
(a) Owned and Leased Capability is the dependable load carrying capability as demonstrated under actual operating conditions based on the primary fuel (assuming no curtailments) that each station was designed to utilize. | ||||||||||||||||
(b) Nuclear reflects Net MW in Operation. Net MW in Operation is the installed capacity owned and operated. Excludes management services contract for Cooper Nuclear Station. | ||||||||||||||||
(c) Fossil reflects nameplate rating of generating unit and excludes capacity under contract. | ||||||||||||||||
CONSOLIDATED ENTERGY CORPORATION AND SUBSIDIARIES DATA | ||||||||||||||||||||||
CONSOLIDATED QUARTERLY FINANCIAL METRICS | ||||||||||||||||||||||
2016 | 2015 | FY % | ||||||||||||||||||||
1Q | 2Q | 3Q | 4Q | FY | 1Q | 2Q | 3Q | 4Q | FY | CHANGE | ||||||||||||
GAAP MEASURES | ||||||||||||||||||||||
ROIC – As-Reported (%)(a) | 0.7 | 2.4 | 7.0 | (0.7 | ) | (0.7 | ) | 5.1 | 5.0 | 1.1 | 1.0 | 1.0 | (1.7 | ) | ||||||||
ROE – As-Reported (%)(a) | (2.5 | ) | 1.7 | 13.4 | (6.7 | ) | (6.7 | ) | 8.3 | 7.9 | (1.6 | ) | (1.8 | ) | (1.8 | ) | (4.9 | ) | ||||
Book Value per share | $52.38 | $54.54 | $56.21 | $45.12 | $45.12 | $56.45 | $56.58 | $51.33 | $51.89 | $51.89 | (6.77 | ) | ||||||||||
End of period shares outstanding (millions) | 178.7 | 178.9 | 179.1 | 179.1 | 179.1 | 179.5 | 179.5 | 178.4 | 178.4 | 178.4 | 0.7 | |||||||||||
Cash and cash equivalents ($ millions) | 1,092 | 996 | 1,307 | 1,188 | 1,188 | 1,181 | 910 | 1,041 | 1,351 | 1,351 | (163 | ) | ||||||||||
Revolver Capacity ($ millions) | 3,794 | 4,173 | 4,243 | 3,720 | 3,720 | 3,779 | 4,158 | 3,869 | 3,582 | 3,582 | 138 | |||||||||||
Commercial paper ($ millions) | 578 | 853 | 264 | 344 | 344 | 762 | 895 | 664 | 422 | 422 | (78 | ) | ||||||||||
Total Debt ($ millions) | 15,092 | 14,837 | 15,073 | 15,275 | 15,275 | 14,044 | 13,858 | 14,144 | 13,850 | 13,850 | 1,425 | |||||||||||
Securitization debt ($ millions) | 752 | 716 | 698 | 661 | 661 | 762 | 734 | 814 | 775 | 775 | (114 | ) | ||||||||||
Debt to Capital (%) | 60.9 | 59.6 | 59.4 | 64.8 | 64.8 | 57.4 | 57.0 | 60.2 | 59.1 | 59.1 | 5.7 | |||||||||||
Off-Balance Sheet Liabilities ($ millions) | ||||||||||||||||||||||
Debt of Joint Ventures – Entergy’s Share | 77 | 76 | 74 | 72 | 72 | 81 | 80 | 78 | 77 | 77 | (5 | ) | ||||||||||
Leases – Entergy’s Share | 359 | 359 | 359 | 397 | 397 | 422 | 422 | 422 | 359 | 359 | 38 | |||||||||||
Power Purchase Agreements Accounted for as Leases(b) | 195 | 195 | 195 | 166 | 166 | 224 | 224 | 224 | 195 | 195 | (29 | ) | ||||||||||
Total Off-Balance Sheet Liabilities | 631 | 630 | 628 | 635 | 635 | 727 | 726 | 724 | 631 | 631 | 4 | |||||||||||
NON-GAAP MEASURES | ||||||||||||||||||||||
ROIC – Operational (%)(a) | 5.8 | 7.5 | 7.9 | 7.2 | 7.2 | 5.6 | 5.4 | 5.6 | 6.3 | 6.3 | 0.9 | |||||||||||
ROE – Operational (%)(a) | 10.4 | 14.3 | 15.6 | 14.7 | 14.7 | 9.4 | 8.8 | 9.6 | 11.2 | 11.2 | 3.5 | |||||||||||
Total Gross Liquidity ($ millions) | 4,886 | 5,169 | 5,550 | 4,908 | 4,908 | 4,960 | 5,068 | 4,910 | 4,933 | 4,933 | (25 | ) | ||||||||||
Debt to Capital Ratio, Excluding Securitization Debt (%) | 59.7 | 58.4 | 58.3 | 63.8 | 63.8 | 56.0 | 55.6 | 58.7 | 57.7 | 57.7 | 6.1 | |||||||||||
Net Debt to Net Capital, Excluding Securitization Debt (%) | 57.8 | 56.6 | 55.9 | 61.8 | 61.8 | 53.7 | 53.9 | 56.7 | 55.0 | 55.0 | 6.8 | |||||||||||
Parent Debt to Total Debt, Excluding Securitization Debt (%) | 19.5 | 19.1 | 19.4 | 19.8 | 19.8 | 20.9 | 20.3 | 20.9 | 21.9 | 21.9 | (2.1 | ) | ||||||||||
Debt to Operational EBITDA, Excluding Securitization Debt (times) | 4.6 | 4.4 | 4.2 | 4.1 | 4.1 | 3.9 | 3.9 | 3.9 | 4.1 | 4.1 | — | |||||||||||
Operational FFO to Debt, Excluding Securitization Debt (%) | 21.0 | 21.1 | 21.1 | 18.8 | 18.8 | 28.2 | 28.4 | 25.4 | 25.7 | 25.7 | (6.9 | ) | ||||||||||
Totals may not foot due to rounding. | ||||||||||||||||||||||
(a) Rolling twelve months. | ||||||||||||||||||||||
(b) For further detail, see Note 10 on page 158 of the 2016 SEC Form 10-K. | ||||||||||||||||||||||
CONSOLIDATED ANNUAL FINANCIAL METRICS | ||||||||||||||||
2016 | 2015 | 2014 | 2013 | 2012 | ||||||||||||
GAAP MEASURES | ||||||||||||||||
ROIC – As-Reported (%) | (0.7 | ) | 1.0 | 5.6 | 4.7 | 5.5 | ||||||||||
ROE – As-Reported (%) | (6.7 | ) | (1.8 | ) | 9.6 | 7.6 | 9.3 | |||||||||
Book Value per share | $45.12 | $51.89 | $55.83 | $54.00 | $51.72 | |||||||||||
End of period shares outstanding (millions) | 179.1 | 178.4 | 179.2 | 178.4 | 177.8 | |||||||||||
Cash and cash equivalents ($ millions) | 1,188 | 1,351 | 1,422 | 739 | 533 | |||||||||||
Revolver Capacity ($ millions) | 3,720 | 3,582 | 3,592 | 3,977 | 3,462 | |||||||||||
Commercial paper ($ millions) | 344 | 422 | 484 | 1,045 | 665 | |||||||||||
Total Debt ($ millions) | 15,275 | 13,850 | 13,917 | 13,562 | 13,358 | |||||||||||
Securitization debt ($ millions) | 661 | 775 | 777 | 883 | 973 | |||||||||||
Debt to Capital (%) | 64.8 | 59.1 | 57.4 | 57.7 | 58.5 | |||||||||||
Off-Balance Sheet Liabilities ($ millions) | ||||||||||||||||
Debt of Joint Ventures – Entergy’s Share | 72 | 77 | 81 | 86 | 90 | |||||||||||
Leases – Entergy’s Share | 397 | 359 | 422 | 456 | 505 | |||||||||||
Power Purchase Agreements Accounted for as Leases(a) | 166 | 195 | 224 | 253 | 282 | |||||||||||
Total Off-Balance Sheet Liabilities | 635 | 631 | 727 | 795 | 877 | |||||||||||
NON-GAAP MEASURES | ||||||||||||||||
ROIC – Operational (%) | 7.2 | 6.3 | 6.1 | 5.8 | 6.6 | |||||||||||
ROE – Operational (%) | 14.7 | 11.2 | 10.7 | 10.2 | 12.2 | |||||||||||
Total Gross Liquidity ($ millions) | 4,908 | 4,933 | 5,014 | 4,716 | 3,995 | |||||||||||
Debt to Capital, Excluding Securitization Debt (%) | 63.8 | 57.7 | 56.0 | 56.1 | 56.6 | |||||||||||
Net Debt to Net Capital, Excluding Securitization Debt (%) | 61.8 | 55.0 | 53.2 | 54.6 | 55.6 | |||||||||||
Parent Debt to Total Debt, Excluding Securitization Debt (%) | 19.8 | 21.9 | 20.4 | 21.9 | 23.7 | |||||||||||
Debt to Operational EBITDA, Excluding Securitization Debt (times) | 4.1 | 4.1 | 3.7 | 4.0 | 4.1 | |||||||||||
Operational FFO to Debt, Excluding Securitization Debt (%) | 18.8 | 25.7 | 27.8 | 27.0 | 24.0 | |||||||||||
Totals may not foot due to rounding. | ||||||||||||||||
(a) For further detail, see Note 10 on page 158 of the 2016 SEC Form 10-K. | ||||||||||||||||
FINANCIAL RESULTS | ||||||||||||||||||||||
ENTERGY CORPORATION CONSOLIDATED QUARTERLY RESULTS – GAAP TO NON-GAAP RECONCILIATION | ||||||||||||||||||||||
2016 | 2015 | FY | ||||||||||||||||||||
(After-tax, per share in $) | 1Q | 2Q | 3Q | 4Q | FY | 1Q | 2Q | 3Q | 4Q | FY | CHANGE | |||||||||||
AS-REPORTED | ||||||||||||||||||||||
Utility | 1.09 | 2.09 | 2.47 | 0.67 | 6.34 | 1.24 | 1.11 | 2.01 | 1.75 | 6.12 | 0.22 | |||||||||||
Parent & Other | (0.25 | ) | (0.32 | ) | (0.35 | ) | (0.32 | ) | (1.24 | ) | (0.27 | ) | (0.26 | ) | (0.29 | ) | (0.33 | ) | (1.15 | ) | (0.09 | ) |
Entergy Wholesale Commodities | 0.44 | 1.39 | 0.04 | (10.23 | ) | (8.36 | ) | 0.68 | (0.02 | ) | (5.76 | ) | (0.86 | ) | (5.96 | ) | (2.40 | ) | ||||
CONSOLIDATED AS-REPORTED EARNINGS | 1.28 | 3.16 | 2.16 | (9.88 | ) | (3.26 | ) | 1.65 | 0.83 | (4.04 | ) | 0.56 | (0.99 | ) | (2.27 | ) | ||||||
LESS SPECIAL ITEMS | ||||||||||||||||||||||
Utility | — | — | — | — | — | — | — | — | — | — | — | |||||||||||
Parent & Other | — | — | — | — | — | — | — | — | — | — | — | |||||||||||
Entergy Wholesale Commodities | (0.07 | ) | 0.05 | (0.15 | ) | (10.19 | ) | (10.37 | ) | (0.03 | ) | — | (5.94 | ) | (1.02 | ) | (6.99 | ) | (3.38 | ) | ||
TOTAL SPECIAL ITEMS | (0.07 | ) | 0.05 | (0.15 | ) | (10.19 | ) | (10.37 | ) | (0.03 | ) | — | (5.94 | ) | (1.02 | ) | (6.99 | ) | (3.38 | ) | ||
OPERATIONAL | ||||||||||||||||||||||
Utility | 1.09 | 2.09 | 2.47 | 0.67 | 6.34 | 1.24 | 1.11 | 2.01 | 1.75 | 6.12 | 0.22 | |||||||||||
Parent & Other | (0.25 | ) | (0.32 | ) | (0.35 | ) | (0.32 | ) | (1.24 | ) | (0.27 | ) | (0.26 | ) | (0.29 | ) | (0.33 | ) | (1.15 | ) | (0.09 | ) |
Entergy Wholesale Commodities | 0.51 | 1.34 | 0.19 | (0.04 | ) | 2.01 | 0.71 | (0.02 | ) | 0.18 | 0.16 | 1.03 | 0.98 | |||||||||
CONSOLIDATED OPERATIONAL EARNINGS | 1.35 | 3.11 | 2.31 | 0.31 | 7.11 | 1.68 | 0.83 | 1.90 | 1.58 | 6.00 | 1.11 | |||||||||||
Weather Impact | (0.14 | ) | (0.09 | ) | 0.18 | 0.11 | 0.06 | 0.08 | (0.02 | ) | 0.16 | (0.03 | ) | 0.19 | (0.13 | ) | ||||||
SHARES OF COMMON STOCK OUTSTANDING | ||||||||||||||||||||||
($ millions) | ||||||||||||||||||||||
End of period | 178.7 | 178.9 | 179.1 | 179.1 | 179.1 | 179.5 | 179.5 | 178.4 | 178.4 | 178.4 | 0.7 | |||||||||||
Weighted average - diluted | 179.0 | 179.5 | 180.0 | 179.1 | 178.9 | 180.5 | 180.1 | 179.2 | 179.1 | 179.2 | (0.3 | ) | ||||||||||
Totals may not foot due to rounding. | ||||||||||||||||||||||
UTILITY, PARENT & OTHER QUARTERLY RESULTS – GAAP TO NON-GAAP RECONCILIATION | ||||||||||||||||||||||
2016 | 2015 | FY | ||||||||||||||||||||
($ millions) | 1Q | 2Q | 3Q | 4Q | FY | 1Q | 2Q | 3Q | 4Q | FY | CHANGE | |||||||||||
Utility as-reported earnings | 194.9 | 375.6 | 443.3 | 120.4 | 1,134.2 | 223.4 | 199.7 | 360.0 | 313.7 | 1,096.9 | 37.3 | |||||||||||
Parent & Other as-reported earnings (loss) | (44.0 | ) | (58.6 | ) | (62.8 | ) | (57.1 | ) | (222.5 | ) | (48.3 | ) | (46.8 | ) | (51.1 | ) | (59.5 | ) | (205.6 | ) | (16.9 | ) |
UP&O AS-REPORTED EARNINGS | 151.0 | 317.0 | 380.5 | 63.3 | 911.7 | 175.2 | 152.9 | 308.9 | 254.3 | 891.3 | 20.4 | |||||||||||
LESS: | ||||||||||||||||||||||
Special items | — | — | — | — | — | — | — | — | — | — | — | |||||||||||
Weather | (41.3 | ) | (26.6 | ) | 55.0 | 31.0 | 18.1 | 23.2 | (4.7 | ) | 47.6 | (9.9 | ) | 56.3 | (38.2 | ) | ||||||
Tax effect of weather (a) | 15.9 | 10.3 | (21.2 | ) | (12.0 | ) | (7.0 | ) | (8.9 | ) | 1.8 | (18.3 | ) | 3.8 | (21.7 | ) | 14.7 | |||||
Estimated weather impact (after-tax) | (25.4 | ) | (16.3 | ) | 33.8 | 19.1 | 11.1 | 14.3 | (2.9 | ) | 29.3 | (6.1 | ) | 34.6 | (23.5 | ) | ||||||
Customer sharing | — | (16.1 | ) | — | — | (16.1 | ) | — | — | — | (107.0 | ) | (107.0 | ) | 90.9 | |||||||
Tax effect of customer sharing (a) | — | 6.2 | — | — | 6.2 | — | — | — | 41.2 | 41.2 | (35.0 | ) | ||||||||||
Other income tax items | 6.0 | 132.4 | (6.6 | ) | (4.9 | ) | 126.9 | 23.0 | (0.4 | ) | — | 347.5 | 370.0 | (243.1 | ) | |||||||
Tax items, net of customer sharing | 6.0 | 122.5 | (6.6 | ) | (4.9 | ) | 117.0 | 23.0 | (0.4 | ) | — | 281.6 | 304.2 | (187.2 | ) | |||||||
UP&O ADJUSTED EARNINGS (LOSS) | 170.3 | 210.8 | 353.3 | 49.2 | 783.6 | 137.9 | 156.2 | 279.7 | (21.3 | ) | 552.5 | 231.1 | ||||||||||
(After-tax, per share in $) | ||||||||||||||||||||||
UP&O as-reported earnings | 0.84 | 1.77 | 2.12 | 0.35 | 5.10 | 0.97 | 0.85 | 1.72 | 1.42 | 4.97 | 0.13 | |||||||||||
LESS: | ||||||||||||||||||||||
Special items | — | — | — | — | — | — | — | — | — | — | — | |||||||||||
Weather | (0.14 | ) | (0.09 | ) | 0.18 | 0.11 | 0.06 | 0.08 | (0.02 | ) | 0.16 | (0.03 | ) | 0.19 | (0.13 | ) | ||||||
Tax items, net of customer sharing | 0.03 | 0.68 | (0.04 | ) | (0.03 | ) | 0.66 | 0.13 | — | — | 1.57 | 1.70 | (1.04 | ) | ||||||||
UP&O ADJUSTED EARNINGS (LOSS) | 0.95 | 1.18 | 1.98 | 0.27 | 4.38 | 0.76 | 0.87 | 1.56 | (0.12 | ) | 3.08 | 1.30 | ||||||||||
Totals may not foot due to rounding. | ||||||||||||||||||||||
(a) Income tax effect is calculated by multiplying the pre-tax amount by the estimated income tax rates that are expected to apply to those adjustments. | ||||||||||||||||||||||
FINANCIAL RESULTS | ||||||||||||||||||||||
ENTERGY CORPORATION CONSOLIDATED QUARTERLY SPECIAL ITEMS - BY ITEM TYPE | ||||||||||||||||||||||
Shown as Positive/(Negative) Impact on Earnings | ||||||||||||||||||||||
2016 | 2015 | FY | ||||||||||||||||||||
(Pre-tax except for income tax effects and total, $ millions) | 1Q | 2Q | 3Q | 4Q | FY | 1Q | 2Q | 3Q | 4Q | FY | CHANGE | |||||||||||
ENTERGY WHOLESALE COMMODITIES SPECIAL ITEMS | ||||||||||||||||||||||
EWC Nuclear plant impairments and costs associated with decisions to close or sell plants | (19.9 | ) | (19.0 | ) | (42.4 | ) | (2,828.5 | ) | (2,909.8 | ) | (7.2 | ) | (1.6 | ) | (1,644.0 | ) | (400.7 | ) | (2,053.5 | ) | (856.3 | ) |
Top Deer investment impairment | — | — | — | — | — | — | — | — | (36.8 | ) | (36.8 | ) | 36.8 | |||||||||
Gain on the sale of RISEC | — | — | — | — | — | — | — | — | 154.0 | 154.0 | (154.0 | ) | ||||||||||
DOE litigation awards for VY and FitzPatrick | — | 33.8 | — | — | 33.8 | — | — | — | — | — | 33.8 | |||||||||||
Income tax effect on adjustments items above (a) | 7.0 | (5.2 | ) | 15.0 | 1,003.9 | 1,020.7 | 2.5 | 0.6 | 580.3 | 100.4 | 683.8 | 336.9 | ||||||||||
Total | (12.9 | ) | 9.6 | (27.5 | ) | (1,824.6 | ) | (1,855.3 | ) | (4.6 | ) | (1.1 | ) | (1,063.7 | ) | (183.0 | ) | (1,252.4 | ) | (602.9 | ) | |
TOTAL SPECIAL ITEMS | (12.9 | ) | 9.6 | (27.5 | ) | (1,824.6 | ) | (1,855.3 | ) | (4.6 | ) | (1.1 | ) | (1,063.7 | ) | (183.0 | ) | (1,252.4 | ) | (602.9 | ) | |
2016 | 2015 | FY | ||||||||||||||||||||
(After-tax, per share in $) (b) | 1Q | 2Q | 3Q | 4Q | FY | 1Q | 2Q | 3Q | 4Q | FY | CHANGE | |||||||||||
ENTERGY WHOLESALE COMMODITIES SPECIAL ITEMS | ||||||||||||||||||||||
EWC Nuclear plant impairments and costs associated with decisions to close or sell plants | (0.07 | ) | (0.07 | ) | (0.15 | ) | (10.19 | ) | (10.49 | ) | (0.03 | ) | — | (5.94 | ) | (1.45 | ) | (7.42 | ) | (3.07 | ) | |
Top Deer investment impairment | — | — | — | — | — | — | — | — | (0.13 | ) | (0.13 | ) | 0.13 | |||||||||
Gain on the sale of RISEC | — | — | — | — | — | — | — | — | 0.56 | 0.56 | (0.56 | ) | ||||||||||
DOE litigation awards for VY and FitzPatrick | — | 0.12 | — | — | 0.12 | — | — | — | — | — | 0.12 | |||||||||||
Total | (0.07 | ) | 0.05 | (0.15 | ) | (10.19 | ) | (10.37 | ) | (0.03 | ) | — | (5.94 | ) | (1.02 | ) | (6.99 | ) | (3.38 | ) | ||
TOTAL SPECIAL ITEMS | (0.07 | ) | 0.05 | (0.15 | ) | (10.19 | ) | (10.37 | ) | (0.03 | ) | — | (5.94 | ) | (1.02 | ) | (6.99 | ) | (3.38 | ) | ||
Totals may not foot due to rounding. | ||||||||||||||||||||||
(a) Income tax effect is calculated by multiplying the pre-tax amount by the estimated income tax rate that is expected to apply. | ||||||||||||||||||||||
(b) EPS effect is calculated by multiplying the pre-tax amount by the estimated income tax rate that is expected to apply to each adjustment and then dividing by the fully diluted average shares outstanding for the period. | ||||||||||||||||||||||
FINANCIAL RESULTS | ||||||||||||||||||||||
ENTERGY CORPORATION CONSOLIDATED QUARTERLY SPECIAL ITEMS - BY INCOME STATEMENT LINE ITEM | ||||||||||||||||||||||
Shown as Positive/(Negative) Impact on Earnings | ||||||||||||||||||||||
2016 | 2015 | FY | ||||||||||||||||||||
(Pre-tax except for Income taxes and Total, $ millions) | 1Q | 2Q | 3Q | 4Q | FY | 1Q | 2Q | 3Q | 4Q | FY | CHANGE | |||||||||||
ENTERGY WHOLESALE COMMODITIES SPECIAL ITEMS | ||||||||||||||||||||||
Net revenue (a) | — | — | 7.5 | 33.3 | 40.7 | — | — | — | — | — | 40.7 | |||||||||||
Non-fuel O&M | (11.5 | ) | 22.7 | (29.3 | ) | (57.5 | ) | (75.6 | ) | (7.5 | ) | (1.6 | ) | (1.7 | ) | (6.2 | ) | (17.0 | ) | (58.6 | ) | |
Taxes other than income taxes | (1.0 | ) | (0.9 | ) | (1.8 | ) | (1.8 | ) | (5.5 | ) | 0.3 | — | (0.1 | ) | (0.5 | ) | (0.3 | ) | (5.2 | ) | ||
Asset write-offs and impairments | (7.4 | ) | (7.0 | ) | (18.8 | ) | (2,802.5 | ) | (2,835.6 | ) | — | — | (1,642.2 | ) | (394.0 | ) | (2,036.2 | ) | (799.4 | ) | ||
Gain on sale of asset | — | — | — | — | — | — | — | — | 154.0 | 154.0 | (154.0 | ) | ||||||||||
Miscellaneous net (other income) | — | — | — | — | — | — | — | — | (36.8 | ) | (36.8 | ) | 36.8 | |||||||||
Income taxes (b) | 7.0 | (5.2 | ) | 15.0 | 1,003.9 | 1,020.7 | 2.5 | 0.6 | 580.3 | 100.4 | 683.8 | 336.9 | ||||||||||
Total | (12.9 | ) | 9.6 | (27.5 | ) | (1,824.6 | ) | (1,855.3 | ) | (4.6 | ) | (1.1 | ) | (1,063.7 | ) | (183.0 | ) | (1,252.4 | ) | (602.9 | ) | |
TOTAL SPECIAL ITEMS | (12.9 | ) | 9.6 | (27.5 | ) | (1,824.6 | ) | (1,855.3 | ) | (4.6 | ) | (1.1 | ) | (1,063.7 | ) | (183.0 | ) | (1,252.4 | ) | (602.9 | ) | |
Totals may not foot due to rounding. | ||||||||||||||||||||||
(a) Operating revenue less fuel, fuel related expenses and purchased power. | ||||||||||||||||||||||
(b) Income taxes represents the income tax effect of the special items which were calculated using the estimated income tax rate that is expected to apply to each item. | ||||||||||||||||||||||
FINANCIAL RESULTS | ||||||||||
ENTERGY CORPORATION CONSOLIDATED ANNUAL RESULTS – GAAP TO NON-GAAP RECONCILIATION | ||||||||||
(After-tax, per share in $) | 2016 | 2015 | 2014 | 2013 | 2012 | |||||
AS-REPORTED | ||||||||||
Utility | 6.34 | 6.12 | 4.60 | 4.64 | 5.30 | |||||
Parent & Other | (1.24 | ) | (1.15 | ) | (1.00 | ) | (0.89 | ) | (0.77 | ) |
Entergy Wholesale Commodities | (8.36 | ) | (5.96 | ) | 1.62 | 0.24 | 0.23 | |||
CONSOLIDATED AS-REPORTED EARNINGS | (3.26 | ) | (0.99 | ) | 5.22 | 3.99 | 4.76 | |||
LESS SPECIAL ITEMS | ||||||||||
Utility | — | — | (0.04 | ) | (0.16 | ) | (0.21 | ) | ||
Parent & Other | — | — | — | 0.02 | — | |||||
Entergy Wholesale Commodities | (10.37 | ) | (6.99 | ) | (0.57 | ) | (1.23 | ) | (1.26 | ) |
TOTAL SPECIAL ITEMS | (10.37 | ) | (6.99 | ) | (0.61 | ) | (1.37 | ) | (1.47 | ) |
OPERATIONAL | ||||||||||
Utility | 6.34 | 6.12 | 4.64 | 4.80 | 5.51 | |||||
Parent & Other | (1.24 | ) | (1.15 | ) | (1.00 | ) | (0.91 | ) | (0.77 | ) |
Entergy Wholesale Commodities | 2.01 | 1.03 | 2.19 | 1.47 | 1.49 | |||||
CONSOLIDATED OPERATIONAL EARNINGS | 7.11 | 6.00 | 5.83 | 5.36 | 6.23 | |||||
Weather Impact | (0.06 | ) | 0.19 | 0.07 | — | (0.09 | ) | |||
Totals may not foot due to rounding. | ||||||||||
FINANCIAL RESULTS | ||||||||||
ENTERGY CORPORATION CONSOLIDATED ANNUAL SPECIAL ITEMS - BY ITEM TYPE | ||||||||||
Shown as Positive/(Negative) Impact on Earnings | ||||||||||
(Pre-tax except for income tax effects and total, $ millions) | 2016 | 2015 | 2014 | 2013 | 2012 | |||||
UTILITY SPECIAL ITEMS | ||||||||||
Transmission business spin-merge expenses | — | — | — | (35.7 | ) | (38.2 | ) | |||
HCM implementation expenses | — | — | (13.2 | ) | (33.1 | ) | — | |||
Income tax effect on Utility adjustments above | — | — | 5.6 | 39.9 | 1.0 | |||||
Total | — | — | (7.6 | ) | (29.0 | ) | (37.1 | ) | ||
PARENT & OTHER SPECIAL ITEMS | ||||||||||
Transmission business spin-merge expenses | — | — | — | 5.5 | (1.0 | ) | ||||
HCM implementation expenses | — | — | — | (3.0 | ) | — | ||||
Income tax effect on Parent & Other adjustments above | — | — | — | 1.2 | — | |||||
Total | — | — | — | 3.6 | (1.0 | ) | ||||
ENTERGY WHOLESALE COMMODITIES SPECIAL ITEMS | ||||||||||
EWC Nuclear plant impairments and costs associated with decisions to close or sell plants | (2,909.8 | ) | (2,053.5 | ) | (154.5 | ) | (343.1 | ) | (355.5 | ) |
Top Deer investment impairment | — | (36.8 | ) | — | — | — | ||||
Gain on the sale of RISEC | — | 154.0 | — | — | — | |||||
DOE litigation awards for VY and FitzPatrick | 33.8 | — | — | — | — | |||||
HCM implementation expenses | — | — | (3.4 | ) | (24.4 | ) | — | |||
Income tax effect on EWC adjustments above (a) | 1,020.7 | 683.8 | 56.1 | 147.7 | 132.1 | |||||
Total | (1,855.3 | ) | (1,252.4 | ) | (101.8 | ) | (219.8 | ) | (223.5 | ) |
TOTAL SPECIAL ITEMS | (1,855.3 | ) | (1,252.4 | ) | (109.4 | ) | (245.2 | ) | (261.6 | ) |
(After-tax, per share in $) (b) | 2016 | 2015 | 2014 | 2013 | 2012 | |||||
UTILITY SPECIAL ITEMS | ||||||||||
Transmission business spin-merge expenses | — | — | — | (0.05 | ) | (0.21 | ) | |||
HCM implementation expenses | — | — | (0.04 | ) | (0.11 | ) | — | |||
Total | — | — | (0.04 | ) | (0.16 | ) | (0.21 | ) | ||
PARENT & OTHER SPECIAL ITEMS | ||||||||||
Transmission business spin-merge expenses | — | — | — | 0.03 | — | |||||
HCM implementation expenses | — | — | — | (0.01 | ) | — | ||||
Total | — | — | — | 0.02 | — | |||||
ENTERGY WHOLESALE COMMODITIES SPECIAL ITEMS | ||||||||||
EWC Nuclear plant impairments and costs associated with decisions to close or sell plants | (10.49 | ) | (7.42 | ) | (0.56 | ) | (1.15 | ) | (1.26 | ) |
Top Deer investment impairment | — | (0.13 | ) | — | — | — | ||||
Gain on the sale of RISEC | — | 0.56 | — | — | — | |||||
DOE litigation awards for VY and FitzPatrick | 0.12 | — | — | — | — | |||||
HCM implementation expenses | — | — | (0.01 | ) | (0.08 | ) | — | |||
Total | (10.37 | ) | (6.99 | ) | (0.57 | ) | (1.23 | ) | (1.26 | ) |
TOTAL SPECIAL ITEMS | (10.37 | ) | (6.99 | ) | (0.61 | ) | (1.37 | ) | (1.47 | ) |
Totals may not foot due to rounding. | ||||||||||
(a) Income tax effect is calculated by multiplying the pre-tax amount by the estimated income tax rate that is expected to apply. | ||||||||||
(b) EPS effect is calculated by multiplying the pre-tax amount by the estimated income tax rate that is expected to apply to each adjustment and then dividing by the | ||||||||||
fully diluted average shares outstanding for the period. | ||||||||||
FINANCIAL RESULTS | ||||||||||
ENTERGY CORPORATION CONSOLIDATED ANNUAL SPECIAL ITEMS - BY INCOME STATEMENT LINE ITEM | ||||||||||
Shown as Positive/(Negative) Impact on Earnings | ||||||||||
(Pre-tax except for Income taxes and Total, $ millions) | 2016 | 2015 | 2014 | 2013 | 2012 | |||||
UTILITY SPECIAL ITEMS | ||||||||||
Net revenue (a) | — | — | — | 5.7 | — | |||||
Non-fuel O&M | — | — | (12.6 | ) | (64.0 | ) | (38.2 | ) | ||
Taxes other than income taxes | — | — | (0.6 | ) | (1.0 | ) | — | |||
Asset write-offs and impairments | — | — | — | (9.4 | ) | — | ||||
Income taxes (c) | — | — | 5.6 | 39.7 | 1.0 | |||||
Total | — | — | (7.6 | ) | (29.0 | ) | (37.1 | ) | ||
PARENT & OTHER SPECIAL ITEMS | ||||||||||
Non-fuel O&M | — | — | — | (0.3 | ) | (1.0 | ) | |||
Asset write-offs and impairments | — | — | — | (2.8 | ) | — | ||||
Income taxes (c) | — | — | — | 6.7 | — | |||||
Total | — | — | — | 3.6 | (1.0 | ) | ||||
ENTERGY WHOLESALE COMMODITIES SPECIAL ITEMS | ||||||||||
Net revenue (b) | 40.7 | — | — | — | — | |||||
Non-fuel O&M | (75.6 | ) | (17.0 | ) | (46.8 | ) | (37.1 | ) | — | |
Taxes other than income taxes | (5.5 | ) | (0.3 | ) | (3.6 | ) | (1.1 | ) | — | |
Asset write-offs and impairments | (2,835.6 | ) | (2,036.2 | ) | (107.5 | ) | (329.3 | ) | (355.5 | ) |
Gain on sale of asset | — | 154.0 | — | — | — | |||||
Miscellaneous net (other income) | — | (36.8 | ) | — | — | — | ||||
Income taxes (c) | 1,020.7 | 683.8 | 56.1 | 147.7 | 132.1 | |||||
Total | (1,855.3 | ) | (1,252.4 | ) | (101.8 | ) | (219.8 | ) | (223.5 | ) |
TOTAL SPECIAL ITEMS | (1,855.3 | ) | (1,252.4 | ) | (109.4 | ) | (245.2 | ) | (261.6 | ) |
Totals may not foot due to rounding. | ||||||||||
(a) Operating revenue less fuel, fuel related expenses and gas purchased for resale, purchased power and other regulatory charges (credits) – net. | ||||||||||
(b) Operating revenue less fuel, fuel related expenses and purchased power. | ||||||||||
(c) Income taxes represents the income tax effect of the special items which were calculated using the estimated income tax rate that is expected | ||||||||||
to apply to each item. | ||||||||||
(Page left blank intentionally) | |||||||||
FINANCIAL RESULTS | |||||||||||||||
CONSOLIDATED STATEMENTS OF OPERATIONS (unaudited) | |||||||||||||||
In thousands, except share data, for the years ended December 31, | 2016 | 2015 | 2014 | 2013 | 2012 | ||||||||||
OPERATING REVENUES: | |||||||||||||||
Electric | $ | 8,866,659 | $ | 9,308,678 | $ | 9,591,902 | $ | 8,942,360 | $ | 7,870,649 | |||||
Natural gas | 129,348 | 142,746 | 181,794 | 154,353 | 130,836 | ||||||||||
Competitive businesses | 1,849,638 | 2,061,827 | 2,721,225 | 2,294,234 | 2,300,594 | ||||||||||
Total | 10,845,645 | 11,513,251 | 12,494,921 | 11,390,947 | 10,302,079 | ||||||||||
OPERATING EXPENSES: | |||||||||||||||
Operation and maintenance: | |||||||||||||||
Fuel, fuel-related expenses, and gas purchased for resale | 1,809,200 | 2,452,171 | 2,632,558 | 2,445,818 | 2,036,835 | ||||||||||
Purchased power | 1,220,527 | 1,390,805 | 1,915,414 | 1,554,332 | 1,255,800 | ||||||||||
Nuclear refueling outage expenses | 208,678 | 251,316 | 267,679 | 256,801 | 245,600 | ||||||||||
Other operation and maintenance | 3,296,711 | 3,354,981 | 3,310,536 | 3,331,934 | 3,045,392 | ||||||||||
Asset write-offs, impairments, and related charges | 2,835,637 | 2,104,906 | 179,752 | 341,537 | 355,524 | ||||||||||
Decommissioning | 327,425 | 280,272 | 272,621 | 242,104 | 184,760 | ||||||||||
Taxes other than income taxes | 592,502 | 619,422 | 604,606 | 600,350 | 557,298 | ||||||||||
Depreciation and amortization | 1,347,187 | 1,337,276 | 1,318,638 | 1,261,044 | 1,144,585 | ||||||||||
Other regulatory charges (credits) – net | 94,243 | 175,304 | (13,772 | ) | 45,597 | 175,104 | |||||||||
Total | 11,732,110 | 11,966,453 | 10,488,032 | 10,079,517 | 9,000,898 | ||||||||||
Gain on sale of asset/business | — | 154,037 | — | 43,569 | — | ||||||||||
OPERATING INCOME (LOSS) | (886,465 | ) | (299,165 | ) | 2,006,889 | 1,354,999 | 1,301,181 | ||||||||
OTHER INCOME: | |||||||||||||||
Allowance for equity funds used during construction | 67,563 | 51,908 | 64,802 | 66,053 | 92,759 | ||||||||||
Interest and investment income | 145,127 | 187,062 | 147,686 | 199,300 | 127,776 | ||||||||||
Miscellaneous – net | (41,617 | ) | (95,997 | ) | (42,016 | ) | (59,762 | ) | (53,214 | ) | |||||
Total | 171,073 | 142,973 | 170,472 | 205,591 | 167,321 | ||||||||||
INTEREST EXPENSE: | |||||||||||||||
Interest expense | 700,545 | 670,096 | 661,083 | 629,537 | 606,596 | ||||||||||
Allowance for borrowed funds used during construction | (34,175 | ) | (26,627 | ) | (33,576 | ) | (25,500 | ) | (37,312 | ) | |||||
Total | 666,370 | 643,469 | 627,507 | 604,037 | 569,284 | ||||||||||
INCOME (LOSS) BEFORE INCOME TAXES | (1,381,762 | ) | (799,661 | ) | 1,549,854 | 956,553 | 899,218 | ||||||||
Income taxes | (817,259 | ) | (642,927 | ) | 589,597 | 225,981 | 30,855 | ||||||||
CONSOLIDATED NET INCOME (LOSS) | (564,503 | ) | (156,734 | ) | 960,257 | 730,572 | 868,363 | ||||||||
Preferred dividend requirements of subsidiaries | 19,115 | 19,828 | 19,536 | 18,670 | 21,690 | ||||||||||
NET INCOME (LOSS) ATTRIBUTABLE TO ENTERGY CORPORATION | $ | (583,618 | ) | $ | (176,562 | ) | $ | 940,721 | $ | 711,902 | $ | 846,673 | |||
Basic earnings (loss) per average common share | $ | (3.26 | ) | $ | (0.99 | ) | $ | 5.24 | $ | 3.99 | $ | 4.77 | |||
Diluted earnings (loss) per average common share | $ | (3.26 | ) | $ | (0.99 | ) | $ | 5.22 | $ | 3.99 | $ | 4.76 | |||
Basic average number of common shares outstanding | 178,885,660 | 179,176,356 | 179,506,151 | 178,211,192 | 177,324,813 | ||||||||||
Diluted average number of common shares outstanding | 178,885,660 | 179,176,356 | 180,296,885 | 178,570,400 | 177,737,565 | ||||||||||
FINANCIAL RESULTS | ||||||||||||
2016 CONSOLIDATING INCOME STATEMENT (unaudited) | ||||||||||||
ENTERGY | ||||||||||||
In thousands, except share data, for the year ended December 31, 2016. | UTILITY | PARENT & OTHER | EWC | CONSOLIDATED | ||||||||
OPERATING REVENUES: | ||||||||||||
Electric | $ | 8,866,758 | $ | (99 | ) | $ | — | $ | 8,866,659 | |||
Natural gas | 129,348 | — | — | 129,348 | ||||||||
Competitive businesses | — | — | 1,849,638 | 1,849,638 | ||||||||
Total | 8,996,106 | (99 | ) | 1,849,638 | 10,845,645 | |||||||
OPERATING EXPENSES: | ||||||||||||
Operation and maintenance: | ||||||||||||
Fuel, fuel-related expenses, and gas purchased for resale | 1,563,952 | (100 | ) | 245,348 | 1,809,200 | |||||||
Purchased power | 1,158,498 | 101 | 61,929 | 1,220,527 | ||||||||
Nuclear refueling outage expenses | 127,523 | — | 81,155 | 208,678 | ||||||||
Other operation and maintenance | 2,359,810 | 22,259 | 914,642 | 3,296,711 | ||||||||
Asset write-offs, impairments, and related charges | — | — | 2,835,637 | 2,835,637 | ||||||||
Decommissioning | 152,355 | — | 175,070 | 327,425 | ||||||||
Taxes other than income taxes | 497,510 | 718 | 94,274 | 592,502 | ||||||||
Depreciation and amortization | 1,145,688 | 1,646 | 199,852 | 1,347,187 | ||||||||
Other regulatory charges (credits) - net | 94,243 | — | — | 94,243 | ||||||||
Total | 7,099,579 | 24,624 | 4,607,907 | 11,732,110 | ||||||||
OPERATING INCOME (LOSS) | 1,896,527 | (24,723 | ) | (2,758,269 | ) | (886,465 | ) | |||||
OTHER INCOME: | ||||||||||||
Allowance for equity funds used during construction | 67,563 | — | — | 67,563 | ||||||||
Interest and investment income | 189,994 | (153,332 | ) | 108,466 | 145,127 | |||||||
Miscellaneous – net | (21,017 | ) | (7,874 | ) | (12,726 | ) | (41,617 | ) | ||||
Total | 236,540 | (161,206 | ) | 95,740 | 171,073 | |||||||
INTEREST EXPENSE: | ||||||||||||
Interest expense | 591,721 | 85,966 | 22,858 | 700,545 | ||||||||
Allowance for borrowed funds used during construction | (34,175 | ) | — | — | (34,175 | ) | ||||||
Total | 557,546 | 85,966 | 22,858 | 666,370 | ||||||||
INCOME (LOSS) BEFORE INCOME TAXES | 1,575,521 | (271,895 | ) | (2,685,387 | ) | (1,381,762 | ) | |||||
Income taxes | 424,388 | (49,384 | ) | (1,192,263 | ) | (817,259 | ) | |||||
CONSOLIDATED NET INCOME (LOSS) | 1,151,133 | (222,511 | ) | (1,493,124 | ) | (564,503 | ) | |||||
Preferred dividend requirements of subsidiaries | 16,928 | — | 2,188 | 19,115 | ||||||||
NET INCOME (LOSS) ATTRIBUTABLE TO ENTERGY CORPORATION | $ | 1,134,205 | $ | (222,511 | ) | $ | (1,495,312 | ) | $ | (583,618 | ) | |
Basic earnings (loss) per average common share | $ | 6.34 | $ | (1.24 | ) | $ | (8.36 | ) | $ | (3.26 | ) | |
Diluted earnings (loss) per average common share | $ | 6.34 | $ | (1.24 | ) | $ | (8.36 | ) | $ | (3.26 | ) | |
Totals may not foot due to rounding. | ||||||||||||
FINANCIAL RESULTS | |||||||||||||||
CONSOLIDATED BALANCE SHEETS (unaudited) | |||||||||||||||
In thousands, as of December 31, | 2016 | 2015 | 2014 | 2013 | 2012 | ||||||||||
ASSETS | |||||||||||||||
CURRENT ASSETS: | |||||||||||||||
Cash and cash equivalents: | |||||||||||||||
Cash | $ | 129,579 | $ | 63,497 | $ | 131,327 | $ | 129,979 | $ | 112,992 | |||||
Temporary cash investments | 1,058,265 | 1,287,464 | 1,290,699 | 609,147 | 419,577 | ||||||||||
Total cash and cash equivalents | 1,187,844 | 1,350,961 | 1,422,026 | 739,126 | 532,569 | ||||||||||
Securitization recovery trust account | — | — | — | — | 46,040 | ||||||||||
Accounts receivable: | |||||||||||||||
Customer | 654,995 | 608,491 | 596,917 | 670,641 | 568,871 | ||||||||||
Allowance for doubtful accounts | (11,924 | ) | (39,895 | ) | (35,663 | ) | (34,311 | ) | (31,956 | ) | |||||
Other | 158,419 | 178,364 | 220,342 | 195,028 | 161,408 | ||||||||||
Accrued unbilled revenues | 368,677 | 321,940 | 321,659 | 340,828 | 303,392 | ||||||||||
Total accounts receivable | 1,170,167 | 1,068,900 | 1,103,255 | 1,172,186 | 1,001,715 | ||||||||||
Deferred fuel costs | 108,465 | — | 155,140 | 116,379 | 150,363 | ||||||||||
Accumulated deferred income taxes | — | — | 27,783 | 175,073 | 306,902 | ||||||||||
Fuel inventory – at average cost | 179,600 | 217,810 | 205,434 | 208,958 | 213,831 | ||||||||||
Materials and supplies – at average cost | 698,523 | 873,357 | 918,584 | 915,006 | 928,530 | ||||||||||
Deferred nuclear refueling outage costs | 146,221 | 211,512 | 214,188 | 192,474 | 243,374 | ||||||||||
System agreement cost equalization | — | — | — | — | 16,880 | ||||||||||
Prepayments and other | 193,448 | 344,872 | 343,223 | 410,489 | 242,922 | ||||||||||
Total | 3,684,268 | 4,067,412 | 4,389,633 | 3,929,691 | 3,683,126 | ||||||||||
OTHER PROPERTY AND INVESTMENTS: | |||||||||||||||
Investment in affiliates – at equity | 198 | 4,341 | 36,234 | 40,350 | 46,738 | ||||||||||
Decommissioning trust funds | 5,723,897 | 5,349,953 | 5,370,932 | 4,903,144 | 4,190,108 | ||||||||||
Non-utility property – at cost (less accumulated depreciation) | 233,641 | 219,999 | 213,791 | 199,375 | 256,039 | ||||||||||
Other | 469,664 | 468,704 | 405,169 | 210,616 | 436,234 | ||||||||||
Total | 6,427,400 | 6,042,997 | 6,026,126 | 5,353,485 | 4,929,119 | ||||||||||
PROPERTY, PLANT AND EQUIPMENT: | |||||||||||||||
Electric | 45,191,216 | 44,467,159 | 44,881,419 | 42,935,712 | 41,944,567 | ||||||||||
Property under capital lease | 619,527 | 952,465 | 945,784 | 941,299 | 935,199 | ||||||||||
Natural gas | 413,224 | 392,032 | 377,565 | 366,365 | 353,492 | ||||||||||
Construction work in progress | 1,378,180 | 1,456,735 | 1,425,981 | 1,514,857 | 1,365,699 | ||||||||||
Nuclear fuel | 1,037,899 | 1,345,422 | 1,542,055 | 1,566,904 | 1,598,430 | ||||||||||
Total property, plant and equipment | 48,640,046 | 48,613,813 | 49,172,804 | 47,325,137 | 46,197,387 | ||||||||||
Less – accumulated depreciation and amortization | 20,718,639 | 20,789,452 | 20,449,858 | 19,443,493 | 18,898,842 | ||||||||||
Property, plant and equipment – net | 27,921,407 | 27,824,361 | 28,722,946 | 27,881,644 | 27,298,545 | ||||||||||
DEFERRED DEBITS AND OTHER ASSETS: | |||||||||||||||
Regulatory assets: | |||||||||||||||
Regulatory asset for income taxes - net | 761,280 | 775,528 | 836,064 | 849,718 | 742,030 | ||||||||||
Other regulatory assets (includes securitization property of | |||||||||||||||
$600,996 as of December 31, 2016, | |||||||||||||||
$714,044 as of December 31, 2015, $724,839 as | |||||||||||||||
of December 31, 2014, $822,218 as of December 31, 2013, | |||||||||||||||
and $914,751 as of December 31, 2012) | 4,769,913 | 4,704,796 | 4,968,553 | 3,893,363 | 5,025,912 | ||||||||||
Deferred fuel costs | 239,100 | 238,902 | 238,102 | 172,202 | 172,202 | ||||||||||
Goodwill | 377,172 | 377,172 | 377,172 | 377,172 | 377,172 | ||||||||||
Accumulated deferred income taxes | 117,885 | 54,903 | 48,351 | 62,011 | 37,748 | ||||||||||
Other | 1,606,009 | 561,610 | 807,508 | 771,004 | 821,485 | ||||||||||
Total | 7,871,359 | 6,712,911 | 7,275,750 | 6,125,470 | 7,176,549 | ||||||||||
TOTAL ASSETS | $ | 45,904,434 | $ | 44,647,681 | $ | 46,414,455 | $ | 43,290,290 | $ | 43,087,339 | |||||
FINANCIAL RESULTS | |||||||||||||||
CONSOLIDATED BALANCE SHEETS (unaudited) | |||||||||||||||
In thousands, as of December 31, | 2016 | 2015 | 2014 | 2013 | 2012 | ||||||||||
LIABILITIES AND EQUITY | |||||||||||||||
CURRENT LIABILITIES: | |||||||||||||||
Currently maturing long-term debt | $ | 364,900 | $ | 214,374 | $ | 899,375 | $ | 457,095 | $ | 718,516 | |||||
Notes payable and commercial paper | 415,011 | 494,348 | 598,407 | 1,046,887 | 796,002 | ||||||||||
Accounts payable | 1,285,577 | 1,071,798 | 1,166,431 | 1,173,313 | 1,217,180 | ||||||||||
Customer deposits | 403,311 | 419,407 | 412,166 | 370,997 | 359,078 | ||||||||||
Taxes accrued | 181,114 | 210,077 | 128,108 | 191,093 | 333,719 | ||||||||||
Accumulated deferred income taxes | — | — | 38,039 | 28,307 | 13,109 | ||||||||||
Interest accrued | 187,229 | 194,565 | 206,010 | 180,997 | 184,664 | ||||||||||
Deferred fuel costs | 102,753 | 235,986 | 91,602 | 57,631 | 96,439 | ||||||||||
Obligations under capital leases | 2,423 | 2,709 | 2,508 | 2,323 | 3,880 | ||||||||||
Pension and other postretirement liabilities | 76,942 | 62,513 | 57,994 | 67,419 | 95,900 | ||||||||||
System agreement cost equalization | — | — | — | — | 25,848 | ||||||||||
Other | 180,836 | 184,181 | 248,251 | 484,510 | 261,986 | ||||||||||
Total | 3,200,096 | 3,089,958 | 3,848,891 | 4,060,572 | 4,106,321 | ||||||||||
NON-CURRENT LIABILITIES: | |||||||||||||||
Accumulated deferred income taxes and taxes accrued | 7,495,290 | 8,306,865 | 9,133,161 | 8,724,635 | 8,311,756 | ||||||||||
Accumulated deferred investment tax credits | 227,147 | 234,300 | 247,521 | 263,765 | 273,696 | ||||||||||
Obligations under capital leases | 24,582 | 27,001 | 29,710 | 32,218 | 34,541 | ||||||||||
Other regulatory liabilities | 1,572,929 | 1,414,898 | 1,383,609 | 1,295,955 | 898,614 | ||||||||||
Decommissioning and asset retirement cost liabilities | 5,992,476 | 4,790,187 | 4,458,296 | 3,933,416 | 3,513,634 | ||||||||||
Accumulated provisions | 481,636 | 460,727 | 418,128 | 115,139 | 362,226 | ||||||||||
Pension and other postretirement liabilities | 3,036,010 | 3,187,357 | 3,638,295 | 2,320,704 | 3,725,886 | ||||||||||
Long-term debt (includes securitization bonds | |||||||||||||||
of $661,175 as of December 31, 2016, | |||||||||||||||
$774,696 as of December 31, 2015, $776,817 as of | |||||||||||||||
December 31, 2014, $883,013 as of December 31, 2013, | |||||||||||||||
and $973,480 as of December 31, 2012) | 14,467,655 | 13,111,556 | 12,386,710 | 12,022,993 | 11,805,155 | ||||||||||
Other | 1,121,619 | 449,856 | 557,649 | 583,667 | 577,910 | ||||||||||
Total | 34,419,344 | 31,982,747 | 32,253,079 | 29,292,492 | 29,503,418 | ||||||||||
Commitments and Contingencies | |||||||||||||||
Subsidiaries' preferred stock without sinking fund | 203,185 | 318,185 | 210,760 | 210,760 | 186,511 | ||||||||||
EQUITY: | |||||||||||||||
Common shareholders' equity: | |||||||||||||||
Common stock, $.01 par value, authorized 500,000,000 | |||||||||||||||
shares; issued 254,752,788 shares in 2015, 2014, 2013, | |||||||||||||||
2012, and 2011 | 2,548 | 2,548 | 2,548 | 2,548 | 2,548 | ||||||||||
Paid-in capital | 5,417,245 | 5,403,758 | 5,375,353 | 5,368,131 | 5,357,852 | ||||||||||
Retained earnings | 8,195,571 | 9,393,913 | 10,169,657 | 9,825,053 | 9,704,591 | ||||||||||
Accumulated other comprehensive income (loss) | (34,971 | ) | 8,951 | (42,307 | ) | (29,324 | ) | (293,083 | ) | ||||||
Less – treasury stock, at cost (75,623,363 shares in 2016, | |||||||||||||||
76,363,763 shares in 2015, 75,512,079 shares in 2014, | |||||||||||||||
76,381,936 shares in 2013, and 76,945,239 shares in 2012) | 5,498,584 | 5,552,379 | 5,497,526 | 5,533,942 | 5,574,819 | ||||||||||
Total common shareholders' equity | 8,081,809 | 9,256,791 | 10,007,725 | 9,632,466 | 9,197,089 | ||||||||||
Subsidiaries' preferred stock without sinking fund | — | — | 94,000 | 94,000 | 94,000 | ||||||||||
Total | 8,081,809 | 9,256,791 | 10,101,725 | 9,726,466 | 9,291,089 | ||||||||||
TOTAL LIABILITIES AND EQUITY | $ | 45,904,434 | $ | 44,647,681 | $ | 46,414,455 | $ | 43,290,290 | $ | 43,087,339 | |||||
FINANCIAL RESULTS | ||||||||||||
2016 CONSOLIDATING BALANCE SHEET (unaudited) | ||||||||||||
ENTERGY | ||||||||||||
In thousands, as of December 31, 2016. | UTILITY | PARENT & OTHER | EWC | CONSOLIDATED | ||||||||
ASSETS | ||||||||||||
CURRENT ASSETS: | ||||||||||||
Cash and cash equivalents: | ||||||||||||
Cash | $ | 123,956 | $ | 939 | $ | 4,684 | $ | 129,579 | ||||
Temporary cash investments | 622,953 | 7,453 | 427,859 | 1,058,265 | ||||||||
Total cash and cash equivalents | 746,909 | 8,392 | 432,543 | 1,187,844 | ||||||||
Notes receivable | — | (528,459 | ) | 528,459 | — | |||||||
Accounts receivable: | ||||||||||||
Customer | 482,302 | — | 172,693 | 654,995 | ||||||||
Allowance for doubtful accounts | (11,924 | ) | — | — | (11,924 | ) | ||||||
Associated companies | 22,892 | (24,532 | ) | 1,640 | — | |||||||
Other | 148,743 | — | 9,676 | 158,419 | ||||||||
Accrued unbilled revenues | 368,677 | — | — | 368,677 | ||||||||
Total accounts receivable | 1,010,690 | (24,532 | ) | 184,009 | 1,170,167 | |||||||
Deferred fuel costs | 108,465 | — | — | 108,465 | ||||||||
Fuel inventory – at average cost | 173,388 | — | 6,212 | 179,600 | ||||||||
Materials and supplies – at average cost | 645,682 | — | 52,841 | 698,523 | ||||||||
Deferred nuclear refueling outage costs | 128,577 | — | 17,644 | 146,221 | ||||||||
Prepayments and other | 161,495 | (8,629 | ) | 40,582 | 193,448 | |||||||
Total | 2,975,206 | (553,228 | ) | 1,262,290 | 3,684,268 | |||||||
OTHER PROPERTY AND INVESTMENTS: | ||||||||||||
Investment in affiliates – at equity | 1,390,786 | (1,390,674 | ) | 86 | 198 | |||||||
Decommissioning trust funds | 2,755,937 | — | 2,967,960 | 5,723,897 | ||||||||
Non-utility property – at cost (less accumulated depreciation) | 224,148 | (11 | ) | 9,504 | 233,641 | |||||||
Other | 466,599 | — | 3,065 | 469,664 | ||||||||
Total | 4,837,470 | (1,390,685 | ) | 2,980,615 | 6,427,400 | |||||||
PROPERTY, PLANT AND EQUIPMENT: | ||||||||||||
Electric | 44,173,933 | 3,690 | 1,013,593 | 45,191,216 | ||||||||
Property under capital lease | 619,527 | — | — | 619,527 | ||||||||
Natural gas | 413,224 | — | — | 413,224 | ||||||||
Construction work in progress | 1,334,169 | 631 | 43,380 | 1,378,180 | ||||||||
Nuclear fuel | 816,794 | — | 221,105 | 1,037,899 | ||||||||
Total property, plant and equipment | 47,357,647 | 4,321 | 1,278,078 | 48,640,046 | ||||||||
Less – accumulated depreciation and amortization | 20,290,630 | 197 | 427,812 | 20,718,639 | ||||||||
Property, plant and equipment – net | 27,067,017 | 4,124 | 850,266 | 27,921,407 | ||||||||
DEFERRED DEBITS AND OTHER ASSETS: | ||||||||||||
Regulatory assets: | ||||||||||||
Regulatory asset for income taxes - net | 761,280 | — | — | 761,280 | ||||||||
Other regulatory assets (includes securitization property of | ||||||||||||
$600,996 as of December 31, 2016) | 4,769,913 | — | — | 4,769,913 | ||||||||
Deferred fuel costs | 239,100 | — | — | 239,100 | ||||||||
Goodwill | 374,099 | — | 3,073 | 377,172 | ||||||||
Accumulated deferred income taxes | 15,415 | 40,309 | 62,161 | 117,885 | ||||||||
Other | 59,251 | 9,125 | 1,537,633 | 1,606,009 | ||||||||
Total | 6,219,058 | 49,434 | 1,602,867 | 7,871,359 | ||||||||
TOTAL ASSETS | $ | 41,098,751 | $ | (1,890,355 | ) | $ | 6,696,038 | $ | 45,904,434 | |||
Totals may not foot due to rounding. | ||||||||||||
FINANCIAL RESULTS | ||||||||||||
2016 CONSOLIDATING BALANCE SHEET (unaudited) | ||||||||||||
ENTERGY | ||||||||||||
In thousands, as of December 31, 2016. | UTILITY | PARENT & OTHER | EWC | CONSOLIDATED | ||||||||
LIABILITIES AND EQUITY | ||||||||||||
CURRENT LIABILITIES: | ||||||||||||
Currently maturing long-term debt | $ | 364,900 | $ | — | $ | — | $ | 364,900 | ||||
Notes payable and commercial paper: | ||||||||||||
Associated companies | — | (15,555 | ) | 15,555 | — | |||||||
Other | 70,686 | 344,325 | — | 415,011 | ||||||||
Accounts payable: | ||||||||||||
Associated companies | 24,338 | (46,062 | ) | 21,724 | — | |||||||
Other | 990,033 | 585 | 294,959 | 1,285,577 | ||||||||
Customer deposits | 403,311 | — | — | 403,311 | ||||||||
Taxes accrued | (27,752 | ) | 126,885 | 81,981 | 181,114 | |||||||
Interest accrued | 159,300 | 27,882 | 47 | 187,229 | ||||||||
Deferred fuel costs | 102,753 | — | — | 102,753 | ||||||||
Obligations under capital leases | 2,423 | — | — | 2,423 | ||||||||
Pension and other postretirement liabilities | 63,026 | — | 13,916 | 76,942 | ||||||||
Other | 138,880 | 1,943 | 40,013 | 180,836 | ||||||||
Total | 2,291,898 | 440,003 | 468,195 | 3,200,096 | ||||||||
NON-CURRENT LIABILITIES: | ||||||||||||
Accumulated deferred income taxes and taxes accrued | 8,132,129 | 8,898 | (645,737 | ) | 7,495,290 | |||||||
Accumulated deferred investment tax credits | 227,147 | — | — | 227,147 | ||||||||
Obligations under capital leases | 24,582 | — | — | 24,582 | ||||||||
Other regulatory liabilities | 1,572,929 | — | — | 1,572,929 | ||||||||
Decommissioning and asset retirement cost liabilities | 2,879,307 | — | 3,113,169 | 5,992,476 | ||||||||
Accumulated provisions | 480,474 | — | 1,162 | 481,636 | ||||||||
Pension and other postretirement liabilities | 2,299,122 | — | 736,888 | 3,036,010 | ||||||||
Long-term debt (includes securitization bonds | ||||||||||||
of $661,175 as of December 31, 2016) | 11,886,598 | 2,536,557 | 44,500 | 14,467,655 | ||||||||
Other | 686,140 | (391,127 | ) | 826,606 | 1,121,619 | |||||||
Total | 28,188,428 | 2,154,328 | 4,076,588 | 34,419,344 | ||||||||
Commitments and Contingencies | ||||||||||||
Subsidiaries' preferred stock without sinking fund | 178,936 | — | 24,249 | 203,185 | ||||||||
COMMON EQUITY: | ||||||||||||
Common shareholders' equity: | ||||||||||||
Common stock, $.01 par value, authorized 500,000,000 shares; | ||||||||||||
issued 254,752,788 shares in 2016 | 2,051,268 | (2,249,823 | ) | 201,103 | 2,548 | |||||||
Paid-in capital | 2,799,315 | 953,993 | 1,663,937 | 5,417,245 | ||||||||
Retained earnings | 5,834,123 | 2,189,728 | 171,720 | 8,195,571 | ||||||||
Accumulated other comprehensive income (loss) | (125,217 | ) | — | 90,246 | (34,971 | ) | ||||||
Less – treasury stock, at cost (75,623,363 shares in 2016) | 120,000 | 5,378,584 | — | 5,498,584 | ||||||||
Total | 10,439,489 | (4,484,686 | ) | 2,127,006 | 8,081,809 | |||||||
TOTAL LIABILITIES AND EQUITY | $ | 41,098,751 | $ | (1,890,355 | ) | $ | 6,696,038 | $ | 45,904,434 | |||
Totals may not foot due to rounding. | ||||||||||||
FINANCIAL RESULTS | |||||||||||||||
CONSOLIDATED STATEMENTS OF CASH FLOW (unaudited) | |||||||||||||||
In thousands, for the years ended December 31, | 2016 | 2015 | 2014 | 2013 | 2012 | ||||||||||
OPERATING ACTIVITIES: | |||||||||||||||
Consolidated net income (loss) | $ | (564,503 | ) | $ | (156,734 | ) | $ | 960,257 | $ | 730,572 | $ | 868,363 | |||
Adjustments to reconcile consolidated net income (loss) | |||||||||||||||
to net cash flow provided by operating activities: | |||||||||||||||
Depreciation, amortization, and decommissioning, including nuclear fuel amortization | 2,123,291 | 2,117,236 | 2,127,892 | 2,012,076 | 1,771,649 | ||||||||||
Deferred income taxes, investment tax credits, and non-current taxes accrued | (836,257 | ) | (820,350 | ) | 596,935 | 311,789 | (26,479 | ) | |||||||
Asset write-offs, impairments, and related charges | 2,835,637 | 2,104,906 | 123,527 | 341,537 | 355,524 | ||||||||||
Gain on sale of asset/business | — | (154,037 | ) | — | (43,569 | ) | — | ||||||||
Changes in working capital: | |||||||||||||||
Receivables | (96,975 | ) | 38,152 | 98,493 | (180,648 | ) | (14,202 | ) | |||||||
Fuel inventory | 38,210 | (12,376 | ) | 3,524 | 4,873 | (11,604 | ) | ||||||||
Accounts payable | 174,421 | (135,211 | ) | (12,996 | ) | 94,436 | (6,779 | ) | |||||||
Prepaid taxes and taxes accrued | (28,963 | ) | 81,969 | (62,985 | ) | (142,626 | ) | 55,484 | |||||||
Interest accrued | (7,335 | ) | (11,445 | ) | 25,013 | (3,667 | ) | 1,152 | |||||||
Deferred fuel costs | (241,896 | ) | 298,725 | (70,691 | ) | (4,824 | ) | (99,987 | ) | ||||||
Other working capital accounts | 31,197 | (113,701 | ) | 112,390 | (66,330 | ) | (151,989 | ) | |||||||
Changes in provisions for estimated losses | 20,905 | 42,566 | 301,871 | (248,205 | ) | (24,808 | ) | ||||||||
Changes in other regulatory assets | (48,469 | ) | 262,317 | (1,061,537 | ) | 1,105,622 | (398,428 | ) | |||||||
Changes in other regulatory liabilities | 158,031 | 61,241 | 87,654 | 397,341 | 170,421 | ||||||||||
Changes in pensions and other postretirement liabilities | (136,919 | ) | (446,418 | ) | 1,308,166 | (1,433,663 | ) | 644,099 | |||||||
Other | (421,676 | ) | 134,344 | (647,952 | ) | 314,505 | (192,131 | ) | |||||||
Net cash flow provided by operating activities | 2,998,699 | 3,291,184 | 3,889,561 | 3,189,219 | 2,940,285 | ||||||||||
INVESTING ACTIVITIES: | |||||||||||||||
Construction/capital expenditures | (2,780,222 | ) | (2,500,860 | ) | (2,119,191 | ) | (2,287,593 | ) | (2,674,650 | ) | |||||
Allowance for equity funds used during construction | 68,345 | 53,635 | 68,375 | 69,689 | 96,131 | ||||||||||
Nuclear fuel purchases | (314,706 | ) | (493,604 | ) | (537,548 | ) | (517,825 | ) | (557,960 | ) | |||||
Payment for purchase of plant | (949,329 | ) | — | — | (17,300 | ) | (456,356 | ) | |||||||
Proceeds from sale of assets and businesses | — | 487,406 | 10,100 | 147,922 | — | ||||||||||
Insurance proceeds received for property damages | 20,968 | 24,399 | 40,670 | — | — | ||||||||||
Changes in securitization account | 4,007 | (5,806 | ) | 1,511 | 155 | 4,265 | |||||||||
NYPA value sharing payment | — | (70,790 | ) | (72,000 | ) | (71,736 | ) | (72,000 | ) | ||||||
Payments to storm reserve escrow account | (1,544 | ) | (69,163 | ) | (276,057 | ) | (7,716 | ) | (8,957 | ) | |||||
Receipts from storm reserve escrow account | — | 5,916 | — | 260,279 | 27,884 | ||||||||||
Decrease (increase) in other investments | 9,055 | 571 | 46,983 | (82,955 | ) | 15,175 | |||||||||
Litigation proceeds for reimbursement of spent nuclear fuel storage costs | 169,085 | 18,296 | — | 21,034 | 109,105 | ||||||||||
Proceeds from nuclear decommissioning trust fund sales | 2,408,920 | 2,492,176 | 1,872,115 | 2,031,552 | 2,074,055 | ||||||||||
Investment in nuclear decommissioning trust funds | (2,484,627 | ) | (2,550,958 | ) | (1,989,446 | ) | (2,147,099 | ) | (2,196,489 | ) | |||||
Net cash flow used in investing activities | (3,850,048 | ) | (2,608,782 | ) | (2,954,488 | ) | (2,601,593 | ) | (3,639,797 | ) | |||||
FINANCING ACTIVITIES: | |||||||||||||||
Proceeds from the issuance of: | |||||||||||||||
Long-term debt | 6,800,558 | 3,502,189 | 3,100,069 | 3,746,016 | 3,478,361 | ||||||||||
Preferred stock of subsidiary | — | 107,426 | — | 24,249 | — | ||||||||||
Mandatorily redeemable preferred membership units of subsidiary | — | — | — | 51,000 | |||||||||||
Treasury stock | 33,114 | 24,366 | 194,866 | 24,527 | 62,886 | ||||||||||
Retirement of long-term debt | (5,311,324 | ) | (3,461,518 | ) | (2,323,313 | ) | (3,814,666 | ) | (3,130,233 | ) | |||||
Repurchase of common stock | — | (99,807 | ) | (183,271 | ) | — | — | ||||||||
Repurchase/redemptions of preferred stock | (115,283 | ) | (94,285 | ) | — | — | — | ||||||||
Changes in credit borrowings and commercial paper – net | (79,337 | ) | (104,047 | ) | (448,475 | ) | 250,889 | 687,675 | |||||||
Other | (6,872 | ) | (9,136 | ) | 23,579 | — | — | ||||||||
Dividends paid: | |||||||||||||||
Common stock | (611,835 | ) | (598,897 | ) | (596,117 | ) | (593,037 | ) | (589,209 | ) | |||||
Preferred stock | (20,789 | ) | (19,758 | ) | (19,511 | ) | (18,802 | ) | (22,329 | ) | |||||
Net cash flow provided by (used in) financing activities | 688,232 | (753,467 | ) | (252,173 | ) | (380,824 | ) | 538,151 | |||||||
Effect of exchange rates on cash and cash equivalents | — | — | — | (245 | ) | (508 | ) | ||||||||
Net increase (decrease) in cash and cash equivalents | (163,117 | ) | (71,065 | ) | 682,900 | 206,557 | (161,869 | ) | |||||||
Cash and cash equivalents at beginning of period | 1,350,961 | 1,422,026 | 739,126 | 532,569 | 694,438 | ||||||||||
Cash and cash equivalents at end of period | $ | 1,187,844 | $ | 1,350,961 | $ | 1,422,026 | $ | 739,126 | $ | 532,569 | |||||
FINANCIAL RESULTS | ||||||||||
CONSOLIDATED STATEMENTS OF CASH FLOW (unaudited) | ||||||||||
$ thousands, for the years ended December 31, | 2016 | 2015 | 2014 | 2013 | 2012 | |||||
SUPPLEMENTAL DISCLOSURE OF | ||||||||||
CASH FLOW INFORMATION: | ||||||||||
Cash paid during the period for: | ||||||||||
Interest – net of amount capitalized | 746,779 | 663,630 | 611,376 | 570,212 | 546,125 | |||||
Income taxes | 95,317 | 103,589 | 77,799 | 127,735 | 49,214 | |||||
CASH FLOW INFORMATION BY BUSINESS | ||||||||||
PARENT & | ENTERGY | |||||||||
For the years ended December 31, 2016, 2015, 2014, 2013, and 2012. | UTILITY | OTHER | EWC | CONSOLIDATED | ||||||
($ thousands) | ||||||||||
2016 | ||||||||||
Net cash flow provided by operating activities | 2,860,511 | (107,950 | ) | 246,138 | 2,998,699 | |||||
Net cash flow provided by (used in) investing activities | (3,671,452 | ) | (394 | ) | (178,202 | ) | (3,850,048 | ) | ||
Net cash flow provided by (used in) financing activities | 938,780 | 103,847 | (354,395 | ) | 688,232 | |||||
2015 | ||||||||||
Net cash flow provided by operating activities | 2,906,716 | (77,374 | ) | 461,842 | 3,291,184 | |||||
Net cash flow provided by (used in) investing activities | (2,565,963 | ) | 3,709 | (46,527 | ) | (2,608,782 | ) | |||
Net cash flow provided by (used in) financing activities | (695,099 | ) | 70,643 | (129,012 | ) | (753,467 | ) | |||
2014 | ||||||||||
Net cash flow provided by operating activities | 3,318,660 | (463,377 | ) | 1,034,278 | 3,889,561 | |||||
Net cash flow provided by (used in) investing activities | (2,635,690 | ) | 293,429 | (612,227 | ) | (2,954,488 | ) | |||
Net cash flow provided by (used in) financing activities | (260,772 | ) | 174,440 | (165,840 | ) | (252,173 | ) | |||
2013 | ||||||||||
Net cash flow provided by (used in) operating activities | 2,208,089 | 251,118 | 730,011 | 3,189,219 | ||||||
Net cash flow provided by (used in) investing activities | (1,989,855 | ) | (51 | ) | (611,689 | ) | (2,601,593 | ) | ||
Net cash flow provided by (used in) financing activities | (47,150 | ) | (251,132 | ) | (82,542 | ) | (380,824 | ) | ||
2012 | ||||||||||
Net cash flow provided by operating activities | 2,354,454 | (89,948 | ) | 675,779 | 2,940,285 | |||||
Net cash flow provided by (used in) investing activities | (3,070,785 | ) | (5,016 | ) | (563,996 | ) | (3,639,797 | ) | ||
Net cash flow provided by (used in) financing activities | 736,832 | 94,179 | (292,860 | ) | 538,151 | |||||
Totals may not foot due to rounding. | ||||||||||
FINANCIAL RESULTS | ||||||||||||||
CONSOLIDATED STATEMENTS OF CHANGES IN EQUITY (unaudited) | ||||||||||||||
Common Shareholders’ Equity | ||||||||||||||
($ thousands) | Subsidiaries’ Preferred Stock | Common Stock | Treasury Stock | Paid-in Capital | Retained Earnings | Accumulated Other Comprehensive Income (Loss) | Total | |||||||
Balance at December 31, 2011 | 94,000 | 2,548 | (5,680,468 | ) | 5,360,682 | 9,446,960 | (168,452 | ) | 9,055,270 | |||||
Consolidated net income (a) | 21,690 | — | — | — | 846,673 | — | 868,363 | |||||||
Other comprehensive loss | — | — | — | — | — | (124,631 | ) | (124,631 | ) | |||||
Common stock issuances related to stock plans | — | — | 105,649 | (2,830 | ) | — | — | 102,819 | ||||||
Common stock dividends declared | — | — | — | — | (589,042 | ) | — | (589,042 | ) | |||||
Preferred dividend requirements of subsidiaries (a) | (21,690 | ) | — | — | — | — | — | (21,690 | ) | |||||
Balance at December 31, 2012 | 94,000 | 2,548 | (5,574,819 | ) | 5,357,852 | 9,704,591 | (293,083 | ) | 9,291,089 | |||||
Consolidated net income (a) | 18,670 | — | — | — | 711,902 | — | 730,572 | |||||||
Other comprehensive income | — | — | — | — | — | 263,759 | 263,759 | |||||||
Common stock issuances related to stock plans | — | — | 40,877 | 10,279 | — | — | 51,156 | |||||||
Common stock dividends declared | — | — | — | — | (591,440 | ) | — | (591,440 | ) | |||||
Preferred dividend requirements of subsidiaries (a) | (18,670 | ) | — | — | — | — | — | (18,670 | ) | |||||
Balance at December 31, 2013 | 94,000 | 2,548 | (5,533,942 | ) | 5,368,131 | 9,825,053 | (29,324 | ) | 9,726,466 | |||||
Consolidated net income (a) | 19,536 | — | — | — | 940,721 | — | 960,257 | |||||||
Other comprehensive loss | — | — | — | — | — | (12,983 | ) | (12,983 | ) | |||||
Common stock repurchases | — | — | (183,271 | ) | — | — | — | (183,271 | ) | |||||
Common stock issuances related to stock plans | — | — | 219,687 | 7,222 | — | — | 226,909 | |||||||
Common stock dividends declared | — | — | — | — | (596,117 | ) | — | (596,117 | ) | |||||
Preferred dividend requirements of subsidiaries (a) | (19,536 | ) | — | — | — | — | — | (19,536 | ) | |||||
Balance at December 31, 2014 | 94,000 | 2,548 | (5,497,526 | ) | 5,375,353 | 10,169,657 | (42,307 | ) | 10,101,725 | |||||
Consolidated net income (loss) (a) | 19,828 | — | — | — | (176,562 | ) | — | (156,734 | ) | |||||
Other comprehensive income | — | — | — | — | — | 51,258 | 51,258 | |||||||
Common stock repurchases | — | — | (99,807 | ) | — | — | — | (99,807 | ) | |||||
Preferred stock repurchases/redemptions | (94,000 | ) | — | — | — | (285 | ) | — | (94,285 | ) | ||||
Common stock issuances related to stock plans | — | — | 44,954 | 28,405 | — | — | 73,359 | |||||||
Common stock dividends declared | — | — | — | — | (598,897 | ) | — | (598,897 | ) | |||||
Preferred dividend requirements of subsidiaries (a) | (19,828 | ) | — | — | — | — | — | (19,828 | ) | |||||
Balance at December 31, 2015 | — | 2,548 | (5,552,379 | ) | 5,403,758 | 9,393,913 | 8,951 | 9,256,791 | ||||||
Consolidated net income (loss) (a) | 19,115 | — | — | — | (583,618 | ) | — | (564,503 | ) | |||||
Other comprehensive loss | — | — | — | — | — | (43,922 | ) | (43,922 | ) | |||||
Common stock issuances related to stock plans | — | — | 53,795 | 13,487 | — | — | 67,282 | |||||||
Common stock dividends declared | — | — | — | — | (611,835 | ) | — | (611,835 | ) | |||||
Subsidiaries' capital stock redemptions | — | — | — | — | (2,889 | ) | — | (2,889 | ) | |||||
Preferred dividend requirements of subsidiaries (a) | (19,115 | ) | — | — | — | — | — | (19,115 | ) | |||||
Balance at December 31, 2016 | — | 2,548 | (5,498,584 | ) | 5,417,245 | 8,195,571 | (34,971 | ) | 8,081,809 | |||||
(a) Consolidated net income and preferred dividend requirements of subsidiaries for 2016, 2015, 2014, 2013 and 2012 include $19.1 million, $14.9 million, $12.9 million, $12.0 million and $15.0 million, respectively, of preferred dividends on subsidiaries’ preferred stock without sinking fund that is not presented as equity. | ||||||||||||||
FINANCIAL RESULTS | |||||||||||||||
CONSOLIDATED STATEMENTS OF COMPREHENSIVE INCOME (LOSS) (unaudited) | |||||||||||||||
In thousands, for the years ended December 31, | 2016 | 2015 | 2014 | 2013 | 2012 | ||||||||||
NET INCOME (LOSS) | $ | (564,503 | ) | $ | (156,734 | ) | $ | 960,257 | $ | 730,572 | $ | 868,363 | |||
Other comprehensive income (loss) | |||||||||||||||
Cash flow hedges net unrealized gain (loss) | |||||||||||||||
(net of tax expense (benefit) of ($55,298, $3,752, $96,141, ($87,940) and ($55,750) | |||||||||||||||
for 2016 to 2012, respectively) | (101,977 | ) | 7,852 | 179,895 | (161,682 | ) | (97,591 | ) | |||||||
Pension and other postretirement liabilities | |||||||||||||||
(net of tax expense (benefit) of ($3,952), $61,576, ($152,763), $220,899 and ($61,223) | |||||||||||||||
for 2016 to 2012, respectively) | (2,842 | ) | 103,185 | (281,566 | ) | 302,489 | (91,157 | ) | |||||||
Net unrealized investment gains (losses) | |||||||||||||||
(net of tax expense (benefit) of $57,277, ($45,904), $66,594, $118,878 and $61,104 | |||||||||||||||
for 2016 to 2012, respectively) | 62,177 | (59,138 | ) | 89,439 | 122,709 | 63,609 | |||||||||
Foreign currency translation | |||||||||||||||
(net of tax expense (benefit) of ($689), ($345), ($404), $131 and $275 | |||||||||||||||
for 2016 to 2012, respectively) | (1,280 | ) | (641 | ) | (751 | ) | 243 | 508 | |||||||
Other comprehensive income (loss) | (43,922 | ) | 51,258 | (12,983 | ) | 263,759 | (124,631 | ) | |||||||
COMPREHENSIVE INCOME (LOSS) | (608,425 | ) | (105,476 | ) | 947,274 | 994,331 | 743,732 | ||||||||
Preferred dividend requirements of subsidiaries | 19,115 | 19,828 | 19,536 | 18,670 | 21,690 | ||||||||||
COMPREHENSIVE INCOME (LOSS) ATTRIBUTABLE TO ENTERGY CORPORATION | $ | (627,540 | ) | $ | (125,304 | ) | $ | 927,738 | $ | 975,661 | $ | 722,042 | |||
CONSOLIDATED CAPITAL EXPENDITURES | |||||||||||||
HISTORICAL CAPITAL EXPENDITURES | |||||||||||||
($ millions) | 2016 | 2015 | 2014 | 2013 | 2012 | ||||||||
Utility | |||||||||||||
Generation | 1,728 | 692 | 594 | 820 | 1,579 | ||||||||
Transmission | 750 | 633 | 466 | 400 | 377 | ||||||||
Distribution | 771 | 727 | 656 | 653 | 780 | ||||||||
Other | 293 | 166 | 112 | 154 | 105 | ||||||||
Entergy Wholesale Commodities | 188 | 353 | 363 | 349 | 362 | ||||||||
Total Historical Capital Expenditures | 3,730 | 2,571 | 2,191 | 2,377 | 3,203 | ||||||||
ENTERGY CORPORATION SECURITIES DETAIL | |||||||||||
ENTERGY CORPORATION LONG-TERM DEBT | CURRENT OR | AS OF | |||||||||
MATURITY | FIRST CALL | FIRST CALL | DECEMBER 31, | ||||||||
CUSIP | RATE | DATE | DATE | PRICE | 2016 | 2015 | |||||
$3.5B Bank Credit Facility | 2.23% | 08/21 (b) | $ | 700 | $ | 835 | |||||
Commercial Paper (a) | 1.13% | 344 | 422 | ||||||||
29364GAF0 | 5.125% Notes | 5.125% | 09/20 | Now | MW (T+.40%) | 450 | 450 | ||||
29364GAG8 | 4.70% Notes | 4.7% | 01/17 | Now | MW (T+.50%) | — | 500 | ||||
29364GAH6 | 4.00% Notes | 4.0% | 07/22 | Now | MW (T+.30%) | 650 | 650 | ||||
29364GAJ2 | 2.95% Notes | 2.95% | 09/26 | Now | MW (T+.25%) | 750 | — | ||||
Total | $ | 2,894 | $ | 2,857 | |||||||
(a) Entergy Corporation has a commercial paper program with a program limit of up to $1.5 billion. | |||||||||||
(b) The maturity date was extended in August 2016. | |||||||||||
SECURITIES RATINGS (OUTLOOK) | ||||||
CORPORATE CREDIT | ||||||
As of 5/31/17 | MOODY’S | S&P | ||||
Entergy Corporation | Baa2 (stable) | BBB+ (positive) | ||||
AS OF | CALL PRICE PER SHARE | ||||||||||||
PREFERRED MEMBER INTERESTS | DECEMBER 31, | AS OF DECEMBER 31, | |||||||||||
CUSIP | DESCRIPTION | RATE | 2016 | 2015 | 2016 | ||||||||
Held by Entergy Louisiana: | |||||||||||||
None | Class A preferred non-voting membership interest units of Entergy Holdings Co. LLC | 10.00% | $ | 684 | $ | 684 | $100.00 | ||||||
(6,843,780 shares in 2016 and 2015) (a) | |||||||||||||
None | Class B preferred non-voting membership interest units of Entergy Holdings Co. LLC | 9.00% | 413 | 413 | $100.00 | ||||||||
(4,126,940 shares in 2016 and 2015) (a) | |||||||||||||
None | Class C preferred non-voting membership interest units of Entergy Holdings Co. LLC | 7.50% | 294 | 294 | $100.00 | ||||||||
(2,935,153 shares in 2016 and 2015) (a) | |||||||||||||
Preferred member interests | $ | 1,391 | $ | 1,391 | |||||||||
OTHER NON-CURRENT LIABILITIES: | |||||||||||||
None | Class A preferred non-voting membership interest units of Entergy Holdings Co. LLC | 10.00% | $ | 50 | $ | 50 | $100.00 | ||||||
(500,000 shares in 2016 and 2015) (a)(b) | |||||||||||||
Other non-current liabilities | $ | 50 | $ | 50 | |||||||||
Total | $ | 1,441 | $ | 1,441 | |||||||||
(a) Distributions are payable quarterly and have a liquidation price of $100 per unit. The preferred membership interests are callable at the option of Entergy Holdings Company LLC after ten years under the terms of the LLC agreement. | |||||||||||||
(b) On February 16, 2012, Entergy Gulf States Louisiana, L.L.C. sold 500,000 units of Class A preferred, non-voting, membership interest units of Entergy Holdings Company LLC. to a non-affiliated third party. This preferred membership interest is reflected in the Parent & Other disclosure segment in ‘Other Non-Current Liabilities’ on the balance sheet. | |||||||||||||
Totals may not foot due to rounding. | |||||||||||||
UTILITY SELECTED DATA | ||||||||||||||||||||||
UTILITY QUARTERLY FINANCIAL METRICS | ||||||||||||||||||||||
2016 | 2015 | FY % | ||||||||||||||||||||
1Q | 2Q | 3Q | 4Q | FY | 1Q | 2Q | 3Q | 4Q | FY | CHANGE | ||||||||||||
GAAP MEASURES | ||||||||||||||||||||||
As-Reported Net Income ($ millions) | 194.9 | 375.6 | 443.3 | 120.4 | 1,134.2 | 223.4 | 199.7 | 360.0 | 313.7 | 1,096.8 | 3.4 | |||||||||||
As-Reported Net Revenue ($ millions) | 1,375.1 | 1,524.2 | 1,859.1 | 1,421.1 | 6,179.5 | 1,410.5 | 1,487.6 | 1,750.2 | 1,180.6 | 5,828.9 | 6.0 | |||||||||||
As-Reported Non-Fuel O&M ($ millions) | 546.6 | 614.8 | 624.6 | 701.3 | 2,487.3 | 584.3 | 642.5 | 663.1 | 670.6 | 2,560.6 | (2.9 | ) | ||||||||||
ROIC – As-Reported (%)(a) | 6.6 | 7.5 | 7.7 | 6.8 | 6.8 | 5.9 | 5.9 | 6.0 | 7.0 | 7.0 | (2.9 | ) | ||||||||||
ROE – As-Reported (%)(a) | 11.2 | 12.9 | 13.3 | 11.3 | 11.3 | 9.4 | 9.3 | 9.6 | 11.9 | 11.9 | (5.0 | ) | ||||||||||
Debt to Capital Ratio (%) | 54.3 | 53.8 | 53.6 | 53.8 | 53.8 | 54.4 | 54.0 | 53.7 | 52.6 | 52.6 | 2.3 | |||||||||||
NON-GAAP MEASURES | ||||||||||||||||||||||
Operational Earnings ($ millions) | 1,068.4 | 1,244.3 | 1,327.5 | 1,134.2 | 1,134.2 | 856.8 | 845.2 | 894.0 | 1,096.9 | 1,096.9 | 3.4 | |||||||||||
Operational Net Revenue ($ millions) | 1,375.1 | 1,524.2 | 1,859.1 | 1,421.1 | 6,179.5 | 1,410.5 | 1,487.6 | 1,750.2 | 1,180.6 | 5,828.9 | 6.0 | |||||||||||
Operational Non-Fuel O&M ($ millions) | 546.6 | 614.8 | 624.6 | 701.3 | 2,487.3 | 584.3 | 642.5 | 663.1 | 670.6 | 2,560.6 | (2.9 | ) | ||||||||||
ROIC – Operational (%)(a) | 6.6 | 7.5 | 7.7 | 6.8 | 6.8 | 5.9 | 5.9 | 6.0 | 7.0 | 7.0 | (2.9 | ) | ||||||||||
ROE – Operational (%)(a) | 11.2 | 12.9 | 13.3 | 11.3 | 11.3 | 9.5 | 9.3 | 9.6 | 11.9 | 11.9 | (5.0 | ) | ||||||||||
Debt to Capital Ratio, excluding securitization debt (%) | 52.8 | 52.3 | 52.1 | 52.4 | 52.4 | 52.6 | 52.3 | 51.9 | 50.8 | 50.8 | 3.1 | |||||||||||
Net Debt to Net Capital Ratio, excluding securitization debt (%) | 51.3 | 51.2 | 50.6 | 50.7 | 50.7 | 50.7 | 50.5 | 49.8 | 49.2 | 49.2 | 3.0 | |||||||||||
(a) Rolling twelve months. Totals may not foot due to rounding. | ||||||||||||||||||||||
UTILITY ANNUAL FINANCIAL METRICS | ||||||||||||||||||||||
2016 | 2015 | 2014 | 2013 | 2012 | ||||||||||||||||||
GAAP MEASURES | ||||||||||||||||||||||
As-Reported Net Income ($ millions) | 1,134.2 | 1,096.9 | 829.1 | 828.9 | 943.0 | |||||||||||||||||
As-Reported Net Revenue ($ millions) | 6,179.5 | 5,828.9 | 5,734.7 | 5,523.8 | 4,968.6 | |||||||||||||||||
As-Reported Non-Fuel O&M ($ millions) | 2,487.3 | 2,560.6 | 2,394.6 | 2,388.9 | 2,190.4 | |||||||||||||||||
ROIC – As-Reported (%)(a) | 6.8 | 7.0 | 5.8 | 5.9 | 6.9 | |||||||||||||||||
ROE – As-Reported (%)(a) | 11.3 | 11.9 | 9.3 | 9.6 | 11.8 | |||||||||||||||||
Debt to Capital Ratio (%) | 53.8 | 52.6 | 54.9 | 53.8 | 54.6 | |||||||||||||||||
NON-GAAP MEASURES | ||||||||||||||||||||||
Operational Earnings ($ millions) | 1,134.2 | 1,096.9 | 836.7 | 857.8 | 980.1 | |||||||||||||||||
Operational Net Revenue ($ millions) | 6,179.4 | 5,828.9 | 5,734.7 | 5,518.1 | 4,968.6 | |||||||||||||||||
Operational Non-Fuel O&M ($ millions) | 2,487.3 | 2,560.6 | 2,382.0 | 2,324.9 | 2,152.2 | |||||||||||||||||
ROIC – Operational (%)(a) | 6.8 | 7.0 | 5.9 | 6.1 | 7.1 | |||||||||||||||||
ROE – Operational (%)(a) | 11.3 | 11.9 | 9.4 | 10.0 | 12.3 | |||||||||||||||||
Debt to Capital Ratio, excluding securitization debt (%) | 52.4 | 50.8 | 53.1 | 51.6 | 52.2 | |||||||||||||||||
Net Debt to Net Capital Ratio, excluding securitization debt (%) | 50.7 | 49.2 | 50.6 | 50.2 | 51.1 | |||||||||||||||||
UTILITY SECURITIES RATINGS (OUTLOOK) | ||||||||||
MORTGAGE BONDS | PREFERRED STOCK | |||||||||
As of 5/31/17 | MOODY’S | S&P | MOODY’S | S&P | ||||||
Entergy Arkansas, Inc. | A2 (stable) | A (positive) | Baa3 | BBB- | ||||||
Entergy Louisiana, LLC | A2 (stable) | A (positive) | n/a | n/a | ||||||
Entergy Mississippi, Inc. | A2 (stable) | A (positive) | Baa3 | BBB- | ||||||
Entergy New Orleans, Inc. | Baa2 (stable) | A (positive) | Ba3 | BBB- | ||||||
Entergy Texas, Inc. | Baa1 (stable) | A (positive) | n/a | n/a | ||||||
System Energy Resources, Inc. | Baa1 (stable) | A (positive) | n/a | n/a | ||||||
UTILITY HISTORICAL CAPITAL EXPENDITURES(a) | ||||||||||
($ millions) | 2016 | 2015 | 2014 | 2013 | 2012 | |||||
Entergy Arkansas | 904 | 625 | 535 | 489 | 615 | |||||
Entergy Louisiana | 1,505 | 845 | 758 | 978 | 1,071 | |||||
Entergy Mississippi | 310 | 236 | 180 | 168 | 378 | |||||
Entergy New Orleans | 328 | 86 | 62 | 89 | 86 | |||||
Entergy Texas | 338 | 320 | 196 | 182 | 181 | |||||
System Energy Resources | 88 | 70 | 64 | 52 | 450 | |||||
Other(b) | 69 | 36 | 33 | 69 | 60 | |||||
Total | 3,542 | 2,218 | 1,828 | 2,027 | 2,841 | |||||
(a) Historical capital expenditures include storm capital spending. | ||||||||||
(b) Corresponds to Entergy Services, Inc., Entergy Operations, Inc., and System Fuels, Inc. | ||||||||||
UTILITY FINANCIAL RESULTS | ||||||||||||||||||||||||
2016 UTILITY CONSOLIDATING INCOME STATEMENT (unaudited) | ||||||||||||||||||||||||
OTHER/ | ||||||||||||||||||||||||
In thousands, for the year ending December 31, 2016. | EAI | ELL | EMI | ENOI | ETI | SERI | ELIMINATIONS(a) | UTILITY | ||||||||||||||||
OPERATING REVENUES: | ||||||||||||||||||||||||
Electric | $ | 2,086,608 | $ | 4,126,343 | $ | 1,094,649 | $ | 586,820 | $ | 1,615,619 | $ | 548,291 | $ | (1,191,572 | ) | $ | 8,866,758 | |||||||
Natural gas | — | 50,705 | — | 78,643 | — | — | — | 129,348 | ||||||||||||||||
Total | 2,086,608 | 4,177,048 | 1,094,649 | 665,463 | 1,615,619 | 548,291 | (1,191,572 | ) | 8,996,106 | |||||||||||||||
OPERATING EXPENSES: | ||||||||||||||||||||||||
Operation and maintenance: | ||||||||||||||||||||||||
Fuel, fuel-related expenses, and gas purchased for resale | 325,036 | 804,433 | 95,090 | 40,489 | 271,968 | 27,416 | (480 | ) | 1,563,952 | |||||||||||||||
Purchased power | 233,350 | 890,058 | 297,902 | 299,551 | 616,597 | — | (1,178,960 | ) | 1,158,498 | |||||||||||||||
Nuclear refueling outage expenses | 56,650 | 51,361 | — | — | — | 19,512 | — | 127,523 | ||||||||||||||||
Other operation and maintenance | 706,573 | 923,779 | 250,443 | 117,471 | 220,566 | 153,064 | (12,086 | ) | 2,359,810 | |||||||||||||||
Decommissioning | 53,610 | 46,944 | — | — | — | 50,797 | 1,004 | 152,355 | ||||||||||||||||
Taxes other than income taxes | 93,109 | 165,665 | 94,482 | 48,078 | 70,973 | 25,195 | 8 | 497,510 | ||||||||||||||||
Depreciation and amortization | 264,215 | 451,290 | 136,214 | 51,737 | 107,026 | 136,195 | (989 | ) | 1,145,688 | |||||||||||||||
Other regulatory charges (credits) – net | 7,737 | 44,131 | (3,721 | ) | 8,258 | 82,879 | (45,041 | ) | — | 94,243 | ||||||||||||||
Total | 1,740,280 | 3,377,661 | 870,410 | 565,584 | 1,370,009 | 367,138 | (1,191,503 | ) | 7,099,579 | |||||||||||||||
OPERATING INCOME | 346,328 | 799,387 | 224,239 | 99,879 | 245,610 | 181,153 | (69 | ) | 1,896,527 | |||||||||||||||
OTHER INCOME: | ||||||||||||||||||||||||
Allowance for equity funds used during construction | 17,099 | 27,925 | 5,801 | 1,178 | 7,617 | 7,944 | — | 67,563 | ||||||||||||||||
Interest and investment income | 19,087 | 154,778 | 656 | 256 | 987 | 14,793 | (563 | ) | 189,994 | |||||||||||||||
Miscellaneous – net | (1,446 | ) | (11,597 | ) | (3,531 | ) | (3,144 | ) | (746 | ) | (556 | ) | — | (21,017 | ) | |||||||||
Total | 34,740 | 171,106 | 2,926 | (1,710 | ) | 7,858 | 22,181 | (563 | ) | 236,540 | ||||||||||||||
INTEREST EXPENSE: | ||||||||||||||||||||||||
Interest expense | 115,311 | 273,283 | 57,114 | 21,061 | 87,776 | 37,529 | (353 | ) | 591,721 | |||||||||||||||
Allowance for borrowed funds used during construction | (9,228 | ) | (14,571 | ) | (2,987 | ) | (446 | ) | (4,943 | ) | (2,000 | ) | — | (34,175 | ) | |||||||||
Total | 106,083 | 258,712 | 54,127 | 20,615 | 82,833 | 35,529 | (353 | ) | 557,546 | |||||||||||||||
INCOME BEFORE INCOME TAXES | 274,985 | 711,781 | 173,038 | 77,554 | 170,635 | 167,805 | (279 | ) | 1,575,521 | |||||||||||||||
Income taxes | 107,773 | 89,734 | 63,854 | 28,705 | 63,097 | 71,061 | 164 | 424,388 | ||||||||||||||||
NET INCOME | 167,212 | 622,047 | 109,184 | 48,849 | 107,538 | 96,744 | (443 | ) | 1,151,133 | |||||||||||||||
Preferred dividend requirements and other | 5,270 | — | 2,443 | 965 | — | — | 8,250 | 16,928 | ||||||||||||||||
EARNINGS APPLICABLE TO | ||||||||||||||||||||||||
COMMON STOCK/EQUITY | $ | 161,942 | $ | 622,047 | $ | 106,741 | $ | 47,884 | $ | 107,538 | $ | 96,744 | $ | (8,693 | ) | $ | 1,134,205 | |||||||
Totals may not foot due to rounding. | ||||||||||||||||||||||||
(a) Reflects other Entergy subsidiaries, including Entergy Utility Holding Company, LLC, Entergy Services, Inc., Entergy Operations, Inc. and the elimination of intercompany transactions. | ||||||||||||||||||||||||
UTILITY FINANCIAL RESULTS | ||||||||||||||||||||||||
2016 UTILITY CONSOLIDATING BALANCE SHEET (unaudited) | ||||||||||||||||||||||||
OTHER/ | ||||||||||||||||||||||||
In thousands, as of December 31, 2016. | EAI | ELL | EMI | ENOI | ETI | SERI | ELIMINATIONS(a) | UTILITY | ||||||||||||||||
ASSETS | ||||||||||||||||||||||||
CURRENT ASSETS: | ||||||||||||||||||||||||
Cash and cash equivalents: | ||||||||||||||||||||||||
Cash | $ | 20,174 | $ | 49,972 | $ | 16 | $ | 28 | $ | 1,216 | $ | 786 | $ | 51,764 | $ | 123,956 | ||||||||
Temporary cash investments | 335 | 163,878 | 76,818 | 103,040 | 4,965 | 245,077 | 28,840 | 622,953 | ||||||||||||||||
Total cash and cash equivalents | 20,509 | 213,850 | 76,834 | 103,068 | 6,181 | 245,863 | 80,604 | 746,909 | ||||||||||||||||
Securitization recovery trust account | 4,140 | — | — | 1,738 | 37,451 | (43,329 | ) | — | ||||||||||||||||
Accounts receivable: | ||||||||||||||||||||||||
Customer | 102,229 | 213,517 | 51,218 | 43,536 | 71,803 | — | — | 482,302 | ||||||||||||||||
Allowance for doubtful accounts | (1,211 | ) | (6,277 | ) | (549 | ) | (3,059 | ) | (828 | ) | — | — | (11,924 | ) | ||||||||||
Associated companies | 35,286 | 155,794 | 45,973 | 16,811 | 39,447 | 104,390 | (374,809 | ) | 22,892 | |||||||||||||||
Other | 58,153 | 54,186 | 12,006 | 5,926 | 14,756 | 3,637 | 79 | 148,743 | ||||||||||||||||
Accrued unbilled revenues | 100,193 | 159,176 | 51,327 | 18,254 | 39,727 | — | — | 368,677 | ||||||||||||||||
Total account receivable | 294,650 | 576,396 | 159,975 | 81,468 | 164,905 | 108,027 | (374,730 | ) | 1,010,690 | |||||||||||||||
Deferred fuel costs | 96,690 | — | 6,957 | 4,818 | — | — | — | 108,465 | ||||||||||||||||
Fuel inventory – at average cost | 32,760 | 50,738 | 50,872 | 1,841 | 37,177 | — | — | 173,388 | ||||||||||||||||
Materials and supplies – at average cost | 182,600 | 294,421 | 41,146 | 8,416 | 36,631 | 82,469 | — | 645,682 | ||||||||||||||||
Deferred nuclear refueling outage costs | 81,313 | 22,535 | — | — | — | 24,729 | — | 128,577 | ||||||||||||||||
Prepayments and other | 14,293 | 151,791 | 8,873 | 10,966 | 18,599 | 20,111 | (63,138 | ) | 161,495 | |||||||||||||||
Total | 726,955 | 1,309,731 | 344,657 | 212,315 | 300,944 | 481,199 | (400,593 | ) | 2,975,206 | |||||||||||||||
OTHER PROPERTY AND INVESTMENTS: | ||||||||||||||||||||||||
Investment in affiliates – at equity | — | 1,390,587 | — | — | 600 | — | (401 | ) | 1,390,786 | |||||||||||||||
Decommissioning trust funds | 834,735 | 1,140,707 | — | — | — | 780,496 | — | 2,755,937 | ||||||||||||||||
Non-utility property – at cost (less accumulated depreciation) | — | 217,494 | 4,608 | 1,016 | 376 | — | 654 | 224,148 | ||||||||||||||||
Storm reserve escrow account | — | 291,485 | — | 81,437 | — | — | (372,922 | ) | — | |||||||||||||||
Escrow accounts | — | — | 31,783 | — | — | — | (31,783 | ) | — | |||||||||||||||
Other | 7,912 | 28,844 | — | 7,160 | 18,801 | — | 403,882 | 466,599 | ||||||||||||||||
Total | 842,647 | 3,069,117 | 36,391 | 89,613 | 19,777 | 780,496 | (570 | ) | 4,837,470 | |||||||||||||||
PROPERTY, PLANT AND EQUIPMENT | ||||||||||||||||||||||||
Electric | 10,488,060 | 18,827,532 | 4,321,214 | 1,258,934 | 4,274,069 | 4,331,668 | 672,456 | 44,173,933 | ||||||||||||||||
Property under capital lease | 716 | — | 1,590 | — | — | 585,084 | 32,137 | 619,527 | ||||||||||||||||
Natural gas | — | 172,816 | — | 240,408 | — | — | — | 413,224 | ||||||||||||||||
Construction work in progress | 304,073 | 670,201 | 118,182 | 24,975 | 111,227 | 43,888 | 61,623 | 1,334,169 | ||||||||||||||||
Nuclear fuel | 307,352 | 249,807 | — | — | — | 259,635 | — | 816,794 | ||||||||||||||||
Total property, plant and equipment | 11,100,201 | 19,920,356 | 4,440,986 | 1,524,317 | 4,385,296 | 5,220,275 | 766,216 | 47,357,647 | ||||||||||||||||
Less – accumulated depreciation and amortization | 4,635,885 | 8,420,596 | 1,602,711 | 604,825 | 1,526,057 | 3,063,249 | 437,307 | 20,290,630 | ||||||||||||||||
Property, plant and equipment – net | 6,464,316 | 11,499,760 | 2,838,275 | 919,492 | 2,859,239 | 2,157,026 | 328,909 | 27,067,017 | ||||||||||||||||
DEFERRED DEBITS AND OTHER ASSETS: | ||||||||||||||||||||||||
Regulatory assets: | ||||||||||||||||||||||||
Regulatory asset for income taxes - net | 62,646 | 470,480 | 38,284 | — | 105,816 | 93,127 | (9,073 | ) | 761,280 | |||||||||||||||
Other regulatory assets (includes securitization property | ||||||||||||||||||||||||
of $600,996 as of December 31, 2016) | 1,428,029 | 1,168,058 | 342,213 | 268,106 | 740,156 | 411,212 | 412,139 | 4,769,913 | ||||||||||||||||
Deferred fuel costs | 66,898 | 168,122 | — | 4,080 | — | — | — | 239,100 | ||||||||||||||||
Goodwill | — | — | — | — | — | — | 374,099 | 374,099 | ||||||||||||||||
Accumulated deferred income taxes | — | — | — | — | — | — | 15,415 | 15,415 | ||||||||||||||||
Other | 14,626 | 16,003 | 2,320 | 963 | 7,149 | 4,652 | 13,538 | 59,251 | ||||||||||||||||
Total | 1,572,199 | 1,822,663 | 382,817 | 273,149 | 853,121 | 508,991 | 806,118 | 6,219,058 | ||||||||||||||||
TOTAL ASSETS | $ | 9,606,117 | $ | 17,701,271 | $ | 3,602,140 | $ | 1,494,569 | $ | 4,033,081 | $ | 3,927,712 | $ | 733,861 | $ | 41,098,751 | ||||||||
Totals may not foot due to rounding. | ||||||||||||||||||||||||
(a) Primarily reflects other Entergy subsidiaries, including Entergy Utility Holding Company, LLC, Entergy Services, Inc., Entergy Operations, Inc. and the elimination of intercompany transactions. | ||||||||||||||||||||||||
UTILITY FINANCIAL RESULTS | ||||||||||||||||||||||||
2016 UTILITY CONSOLIDATING BALANCE SHEET (unaudited) | ||||||||||||||||||||||||
OTHER/ | ||||||||||||||||||||||||
In thousands, as of December 31, 2016. | EAI | ELL | EMI | ENOI | ETI | SERI | ELIMINATIONS(a) | UTILITY | ||||||||||||||||
LIABILITIES AND EQUITY | ||||||||||||||||||||||||
CURRENT LIABILITIES: | ||||||||||||||||||||||||
Currently maturing long-term debt | $ | 114,700 | $ | 200,198 | $ | — | $ | — | $ | — | $ | 50,003 | $ | — | $ | 364,900 | ||||||||
Notes payable and commercial paper: | ||||||||||||||||||||||||
Associated companies | — | — | — | 2,104 | — | — | (2,104 | ) | — | |||||||||||||||
Other | — | 3,794 | — | — | — | 66,893 | — | 70,686 | ||||||||||||||||
Accounts payable: | ||||||||||||||||||||||||
Associated companies | 239,711 | 82,106 | 43,647 | 39,260 | 47,867 | 5,843 | (434,096 | ) | 24,338 | |||||||||||||||
Other | 185,153 | 358,741 | 80,227 | 35,920 | 77,342 | 50,558 | 202,092 | 990,033 | ||||||||||||||||
Customer deposits | 97,512 | 148,601 | 84,112 | 28,667 | 44,419 | — | — | 403,311 | ||||||||||||||||
Taxes accrued | 7,194 | — | 64,040 | — | 15,351 | — | (114,337 | ) | (27,752 | ) | ||||||||||||||
Interest accrued | 16,580 | 75,598 | 21,653 | 5,443 | 25,977 | 14,049 | — | 159,300 | ||||||||||||||||
Deferred fuel costs | — | 48,211 | — | — | 54,543 | — | — | 102,753 | ||||||||||||||||
Obligations under capital leases | — | — | — | — | — | — | 2,423 | 2,423 | ||||||||||||||||
Pension and other postretirement liabilities | — | — | — | — | — | — | 63,026 | 63,026 | ||||||||||||||||
Other | 36,557 | 80,013 | 9,554 | 11,415 | 9,388 | 2,957 | (11,004 | ) | 138,880 | |||||||||||||||
Total | 697,407 | 997,262 | 303,233 | 122,809 | 274,887 | 190,303 | (294,000 | ) | 2,291,898 | |||||||||||||||
NON-CURRENT LIABILITIES: | ||||||||||||||||||||||||
Accumulated deferred income taxes and taxes accrued | 2,186,623 | 2,691,118 | 861,331 | 334,953 | 1,027,647 | 1,112,865 | (82,408 | ) | 8,132,129 | |||||||||||||||
Accumulated deferred investment tax credits | 35,305 | 126,741 | 8,667 | 622 | 12,934 | 41,663 | 1,215 | 227,147 | ||||||||||||||||
Obligations under capital leases | — | — | — | — | — | — | 24,582 | 24,582 | ||||||||||||||||
Regulatory liability for income taxes - net | — | — | — | 9,074 | — | — | (9,074 | ) | — | |||||||||||||||
Other regulatory liabilities | 305,907 | 880,974 | — | — | 8,502 | 370,862 | 6,684 | 1,572,929 | ||||||||||||||||
Decommissioning and asset retirement cost liabilities | 924,353 | 1,082,685 | 8,722 | 2,875 | 6,470 | 854,202 | — | 2,879,307 | ||||||||||||||||
Accumulated provisions | 18,682 | 310,772 | 54,440 | 88,513 | 7,584 | — | 483 | 480,474 | ||||||||||||||||
Pension and other postretirement liabilities | 424,234 | 780,278 | 109,551 | 36,750 | 67,313 | 117,850 | 763,146 | 2,299,122 | ||||||||||||||||
Long-term debt (includes securitization bonds | ||||||||||||||||||||||||
of $661,175 as of December 31, 2016) | 2,715,085 | 5,612,593 | 1,120,916 | 428,467 | 1,508,407 | 501,129 | — | 11,886,598 | ||||||||||||||||
Long-term payable - associated companies | — | — | — | 18,423 | — | — | (18,423 | ) | — | |||||||||||||||
Gas system rebuild insurance proceeds | — | — | — | 447 | — | — | (447 | ) | — | |||||||||||||||
Other | 13,854 | 137,039 | 20,108 | 4,910 | 50,343 | 15 | 459,871 | 686,140 | ||||||||||||||||
Total | 6,624,043 | 11,622,200 | 2,183,735 | 925,034 | 2,689,200 | 2,998,586 | 1,145,629 | 28,188,428 | ||||||||||||||||
Commitments and Contingencies | ||||||||||||||||||||||||
Preferred stock without sinking fund | 31,350 | — | 20,381 | 19,780 | — | — | 107,425 | 178,936 | ||||||||||||||||
EQUITY: | ||||||||||||||||||||||||
Common stock or member's equity | 470 | 5,130,251 | 199,326 | 33,744 | 49,452 | 679,350 | (4,041,325 | ) | 2,051,268 | |||||||||||||||
Paid-in capital/capital stock expense and other | 790,243 | — | 167 | 171,544 | 481,994 | — | 1,355,367 | 2,799,315 | ||||||||||||||||
Retained earnings | 1,462,604 | — | 895,298 | 221,658 | 537,548 | 59,473 | 2,657,542 | 5,834,123 | ||||||||||||||||
Accumulated other comprehensive (loss) | — | (48,442 | ) | — | — | — | — | (76,775 | ) | (125,217 | ) | |||||||||||||
Less – treasury stock, at cost | — | — | — | — | — | — | 120,000 | 120,000 | ||||||||||||||||
Total | 2,253,317 | 5,081,809 | 1,094,791 | 426,946 | 1,068,994 | 738,823 | (225,191 | ) | 10,439,489 | |||||||||||||||
TOTAL LIABILITIES AND EQUITY | $ | 9,606,117 | $ | 17,701,271 | $ | 3,602,140 | $ | 1,494,569 | $ | 4,033,081 | $ | 3,927,712 | $ | 733,861 | $ | 41,098,751 | ||||||||
Totals may not foot due to rounding. | ||||||||||||||||||||||||
(a) Primarily reflects other Entergy subsidiaries, including Entergy Utility Holding Company, LLC, Entergy Services, Inc., Entergy Operations, Inc. and the elimination of intercompany transactions. | ||||||||||||||||||||||||
UTILITY FINANCIAL RESULTS | ||||||||||
UTILITY SELECTED ANNUAL FINANCIAL METRICS | ||||||||||
2016 | 2015 | 2014 | 2013 | 2012 | ||||||
ENTERGY ARKANSAS, INC. | ||||||||||
As-Reported Earnings ($ millions) | 161.9 | 67.4 | 114.5 | 155.1 | 145.5 | |||||
Less Special Items ($ millions) | — | — | (1.4 | ) | (2.8 | ) | (13.0 | ) | ||
Operational Earnings ($ millions) | 161.9 | 67.4 | 115.9 | 157.9 | 158.5 | |||||
GAAP MEASURES | ||||||||||
ROIC – As-Reported (%) | 4.8 | 2.9 | 4.0 | 5.4 | 5.5 | |||||
ROE – As-Reported (%) | 7.8 | 3.6 | 6.5 | 9.4 | 9.6 | |||||
Debt to Capital Ratio (%) | 55.3 | 56.8 | 58.1 | 56.4 | 55.8 | |||||
Total Debt ($ millions) | 2,831 | 2,642 | 2,689 | 2,380 | 2,139 | |||||
Total Preferred ($ millions) | 31 | 116 | 116 | 116 | 116 | |||||
Total Equity ($ millions) | 2,253 | 1,892 | 1,824 | 1,720 | 1,580 | |||||
NON-GAAP MEASURES | ||||||||||
ROIC – Operational (%) | 4.8 | 2.9 | 4.1 | 5.6 | 6.1 | |||||
ROE – Operational (%) | 7.8 | 3.6 | 6.5 | 9.6 | 10.5 | |||||
Total Debt, excluding securitization debt ($ millions) | 2,783 | 2,581 | 2,615 | 2,293 | 2,040 | |||||
Debt to Capital, excluding securitization debt (%) | 54.9 | 56.2 | 57.4 | 55.5 | 54.6 | |||||
Net Debt to Net Capital, excluding securitization debt (%) | 54.7 | 56.1 | 55.3 | 54.1 | 54.2 | |||||
ENTERGY LOUISIANA, LLC | ||||||||||
As-Reported Earnings ($ millions) | 622.0 | 440.9 | 438.2 | 406.3 | 432.3 | |||||
Less Special Items ($ millions) | — | — | (3.5 | ) | (9.1 | ) | (11.2 | ) | ||
Operational Earnings ($ millions) | 622.0 | 440.9 | 441.7 | 415.4 | 443.5 | |||||
GAAP MEASURES | ||||||||||
ROIC – As-Reported (%) | 7.6 | 6.3 | 6.4 | 6.1 | 6.8 | |||||
Return on Average Members’ Equity – As-Reported (%) | 12.7 | 9.8 | 10.2 | 9.4 | 10.6 | |||||
Debt to Capital Ratio (%) | 53.4 | 50.8 | 53.4 | 51.5 | 49.5 | |||||
Total Debt ($ millions) | 5,817 | 4,897 | 4,980 | 4,706 | 4,357 | |||||
Total Preferred ($ millions) | — | — | 110 | 110 | 110 | |||||
Total Equity ($ millions) | 5,082 | 4,794 | 4,316 | 4,364 | 4,455 | |||||
NON-GAAP MEASURES | ||||||||||
ROIC – Operational (%) | 7.7 | 6.4 | 6.5 | 6.3 | 7.1 | |||||
Return on Average Members’ Equity – Operational (%) | 12.7 | 9.8 | 10.3 | 9.6 | 10.9 | |||||
Total Debt, excluding securitization debt ($ millions) | 5,717 | 4,776 | 4,839 | 4,545 | 4,178 | |||||
Debt to Capital, excluding securitization debt (%) | 52.9 | 50.2 | 52.7 | 50.6 | 48.4 | |||||
Net Debt to Net Capital, excluding securitization debt (%) | 52.0 | 50.0 | 51.0 | 49.8 | 48.0 | |||||
UTILITY FINANCIAL RESULTS | ||||||||||
UTILITY SELECTED ANNUAL FINANCIAL METRICS (CONTINUED) | ||||||||||
2016 | 2015 | 2014 | 2013 | 2012 | ||||||
ENTERGY MISSISSIPPI, INC. | ||||||||||
As-Reported Earnings ($ millions) | 106.7 | 89.9 | 72.0 | 79.3 | 43.9 | |||||
Less Special Items ($ millions) | — | — | (1.2 | ) | (5.4 | ) | (7.5 | ) | ||
Operational Earnings ($ millions) | 106.7 | 89.9 | 73.2 | 84.7 | 51.4 | |||||
GAAP MEASURES | ||||||||||
ROIC – As-Reported (%) | 6.6 | 6.1 | 5.3 | 5.7 | 4.2 | |||||
ROE – As-Reported (%) | 10.1 | 9.1 | 7.5 | 8.7 | 5.1 | |||||
Debt to Capital (%) | 50.2 | 49.7 | 50.9 | 51.0 | 55.5 | |||||
Total Debt ($ millions) | 1,121 | 1,048 | 1,048 | 1,044 | 1,161 | |||||
Total Preferred ($ millions) | 20 | 50 | 50 | 50 | 50 | |||||
Total Equity ($ millions) | 1,095 | 1,012 | 962 | 952 | 880 | |||||
NON-GAAP MEASURES | ||||||||||
ROIC – Operational (%) | 6.6 | 6.1 | 5.4 | 5.9 | 4.5 | |||||
ROE – Operational (%) | 10.1 | 9.1 | 7.7 | 9.3 | 6.0 | |||||
Net Debt to Net Capital (%) | 48.4 | 45.9 | 49.3 | 51.0 | 54.4 | |||||
ENTERGY NEW ORLEANS, INC. | ||||||||||
As-Reported Earnings ($ millions) | 47.9 | 44.0 | 30.0 | 11.6 | 18.9 | |||||
Less Special Items ($ millions) | — | — | (0.4 | ) | (2.9 | ) | (0.9 | ) | ||
Operational Earnings ($ millions) | 47.9 | 44.0 | 30.4 | 14.5 | 19.8 | |||||
GAAP MEASURES | ||||||||||
ROIC – As-Reported (%) | 7.7 | 8.7 | 7.6 | 4.5 | 6.2 | |||||
ROE – As-Reported (%) | 12.3 | 15.2 | 13.8 | 5.8 | 10.0 | |||||
Debt to Capital (%) | 50.1 | 48.1 | 55.1 | 56.9 | 55.2 | |||||
Total Debt ($ millions) | 449 | 343 | 304 | 298 | 266 | |||||
Total Preferred ($ millions) | 20 | 20 | 20 | 20 | 20 | |||||
Total Equity ($ millions) | 427 | 350 | 228 | 206 | 196 | |||||
NON-GAAP MEASURES | ||||||||||
ROIC – Operational (%) | 8.6 | 9.5 | 7.7 | 5.0 | 6.4 | |||||
ROE – Operational (%) | 12.3 | 15.2 | 14.0 | 7.2 | 10.5 | |||||
Net debt to net capital, excluding securitization debt | 36.9 | 30.0 | 51.3 | 53.9 | 54.4 | |||||
ENTERGY TEXAS, INC. | ||||||||||
As-Reported Net Income ($ millions) | 107.5 | 69.6 | 74.8 | 57.9 | 42.0 | |||||
Less Special Items ($ millions) | — | — | (1.1 | ) | (8.8 | ) | (5.0 | ) | ||
Operational Net Income ($ millions) | 107.5 | 69.6 | 75.9 | 66.7 | 46.6 | |||||
GAAP MEASURES | ||||||||||
ROIC – As-Reported (%) | 6.4 | 5.0 | 5.3 | 4.6 | 4.0 | |||||
ROE – As-Reported (%) | 10.6 | 7.5 | 8.4 | 6.6 | 4.8 | |||||
Debt to Capital (%) | 58.5 | 60.2 | 62.2 | 63.5 | 65.2 | |||||
Total Debt ($ millions) | 1,508 | 1,452 | 1,469 | 1,545 | 1,604 | |||||
Total Preferred ($ millions) | — | — | — | — | — | |||||
Total Equity ($ millions) | 1,069 | 961 | 892 | 887 | 854 | |||||
NON-GAAP MEASURES | ||||||||||
ROIC – Operational (%) | 7.8 | 6.5 | 7.1 | 6.8 | 5.8 | |||||
ROE – Operational (%) | 10.6 | 7.5 | 8.5 | 7.7 | 5.3 | |||||
Total Debt, excluding securitization debt ($ millions) | 2,148 | 955 | 907 | 921 | 919 | |||||
Debt to Capital, excluding securitization debt (%) | 50.2 | 49.8 | 50.4 | 50.9 | 51.8 | |||||
Net Debt to Net Capital, excluding securitization debt (%) | 50.1 | 49.8 | 49.6 | 49.6 | 50.1 | |||||
UTILITY FINANCIAL RESULTS | ||||||||||
UTILITY SELECTED ANNUAL FINANCIAL METRICS (CONTINUED) | ||||||||||
2016 | 2015 | 2014 | 2013 | 2012 | ||||||
SYSTEM ENERGY RESOURCES, INC. | ||||||||||
As-Reported Net Income ($ millions) | 96.7 | 111.3 | 96.3 | 113.7 | 111.9 | |||||
Less Special Items ($ millions) | — | — | — | — | — | |||||
Operational Net Income ($ millions) | 96.7 | 111.3 | 96.3 | 113.7 | 111.9 | |||||
GAAP MEASURES | ||||||||||
ROIC – As-Reported (%) | 8.8 | 9.3 | 8.2 | 8.3 | 8.5 | |||||
ROE – As-Reported (%) | 12.7 | 13.5 | 11.0 | 13.3 | 13.7 | |||||
Debt to Capital (%) | 45.5 | 42.3 | 45.5 | 46.2 | 49.5 | |||||
Total Debt ($ millions) | 618 | 573 | 727 | 751 | 815 | |||||
Total Preferred ($ millions) | — | — | — | — | — | |||||
Total Equity ($ millions) | 739 | 781 | 871 | 876 | 833 | |||||
NON-GAAP MEASURES | ||||||||||
ROIC – Operational (%) | 8.8 | 9.3 | 8.2 | 8.3 | 8.5 | |||||
ROE – Operational (%) | 12.7 | 13.5 | 11.0 | 13.3 | 13.7 | |||||
Net Debt to Net Capital (%) | 33.5 | 30.5 | 36.7 | 41.6 | 46.8 | |||||
UTILITY SECURITIES DETAIL | |||||||||||||
UTILITY LONG-TERM DEBT AND PREFERRED STOCK | |||||||||||||
ENTERGY ARKANSAS, INC. | |||||||||||||
FIRST | CURRENT OR | ||||||||||||
BONDS: | MATURITY | CALL | FIRST CALL | AS OF DECEMBER 31, | |||||||||
CUSIP | TYPE* | RATE | DATE | DATE | PRICE | 2016 | 2015 | ||||||
($ millions) | |||||||||||||
29364DAQ3 | 3.75% Series | M | 3.75% | 02/21 | Now | MW (T + .20%) | $ | 350 | $ | 350 | |||
29364DAR1 | 3.05% Series | M | 3.05% | 06/23 | Now | MW (T + .20%) | 250 | 250 | |||||
29364DAS9 | 3.7% Series | M | 3.70% | 06/24 | Now | MW (T + .15%) | 375 | 375 | |||||
29364DAL4 | 5.66% Series | M | 5.66% | 02/25 | Now | MW (T + .20%) | — | 175 | |||||
29364DAJ9 | 5.9% Series | M | 5.9% | 06/33 | Now | 100% | — | 100 | |||||
29364DAK6 | 6.38% Series | M | 6.38% | 11/34 | Now | 100% | — | 60 | |||||
29364D779 | 5.75% Series | M | 5.75% | 11/40 | 11/1/2015 | 100% | — | 225 | |||||
29364DAT7 | 4.95% Series | M | 4.95% | 12/44 | Now | MW (T + .30%) | 250 | 250 | |||||
29364D761 | 4.90% Series | M | 4.9% | 12/52 | 12/1/2017 | 100% | 200 | 200 | |||||
29364D753 | 4.75% Series | M | 4.75% | 06/63 | 6/1/18 | 100% | 125 | 125 | |||||
29364DAU4 | 3.5% Series | M | 3.50% | 04/26 | Now | MW (T + .20%) | 380 | — | |||||
29364D100 | 4.88% Series | M | 4.88% | 09/66 | 9/1/2021 | 100% | 410 | — | |||||
472712ES3 | 1.55% Series – Jefferson County | G(a,d) | 1.55% | 2017 | Non-Call Life | 55 | 55 | ||||||
453424BT9 | 2.38% Series – Independence County | G(a,d) | 2.38% | 2021 | Non-Call Life | 45 | 45 | ||||||
Total bonds | 2,440 | 2,210 | |||||||||||
OTHER LONG-TERM DEBT: | |||||||||||||
3.23% Series J – Variable Interest Entity Note Payable | 3.23% | 07/16 | — | 55 | |||||||||
2.62% Series K – Variable Interest Entity Note Payable | 2.62% | 12/17 | 60 | 60 | |||||||||
3.65% Series L – Variable Interest Entity Note Payable | 3.65% | 07/21 | 90 | 90 | |||||||||
3.17% Series M – Variable Interest Entity Note Payable | 3.17% | 12/23 | 40 | — | |||||||||
29365YAA1 | 2.30% Series Senior Secured – Securitization Bond | 2.30% | 08/21 | 50 | 63 | ||||||||
Long-Term United States Department of Energy Obligation(b) | 182 | 181 | |||||||||||
Unamortized Premium and Discount – Net | 1 | (3 | ) | ||||||||||
Unamortized Debt Issuance Costs | (34 | ) | (29 | ) | |||||||||
Other | 2 | 2 | |||||||||||
TOTAL LONG-TERM DEBT | 2,830 | 2,630 | |||||||||||
Less Amount Due Within One Year | 115 | 55 | |||||||||||
Long-Term Debt Excluding Amount Due Within One Year | $ | 2,715 | $ | 2,575 | |||||||||
Fair Value of Long-Term Debt(c) | $ | 2,624 | $ | 2,498 | |||||||||
*M = Mortgage Bond; G = Governmental Bond | |||||||||||||
Weighted-average annualized coupon rate | 3.9% | 4.3% | |||||||||||
(a) Consists of pollution control revenue bonds and environmental revenue bonds. | |||||||||||||
(b) Pursuant to the Nuclear Waste Policy Act of 1982, Entergy’s nuclear owner/licensee subsidiaries have contracts with the DOE for spent nuclear fuel disposal service. The contracts include a one-time fee for generation prior to April 7, 1983. Entergy Arkansas is the only Entergy company that generated electric power with nuclear fuel prior to that date and includes the one-time fee, plus accrued interest, in long-term debt. | |||||||||||||
(c) The fair value excludes long-term DOE obligations of $182 million at Entergy Arkansas and includes debt due within one year. Fair values are classified as Level 2 in the fair value hierarchy (see pgs. 212 - 220 of 2016 10K) and are based on prices derived from inputs such as benchmark yields and reported trades. | |||||||||||||
(d) The bonds are secured by a series of collateral first mortgage bonds. | |||||||||||||
Totals may not foot due to rounding. | |||||||||||||
SHARES AUTHORIZED | CALL | ||||||||||||||
AND OUTSTANDING | PRICE PER SHARE | ||||||||||||||
PREFERRED STOCK: | AS OF DECEMBER 31, | AS OF DECEMBER 31, | AS OF DECEMBER 31, | ||||||||||||
CUSIP | RATE | 2016 | 2015 | 2016 | 2015 | 2016 | |||||||||
($ millions) | |||||||||||||||
Without sinking fund: | |||||||||||||||
Cumulative, $100 par value: | |||||||||||||||
29364D209 | 4.32% Series | 4.32% | 70,000 | 70,000 | $ | 7 | $ | 7 | $ 103.65 | ||||||
29364D506 | 4.72% Series | 4.72% | 93,500 | 93,500 | 9 | 9 | 107.00 | ||||||||
29364D308 | 4.56% Series | 4.56% | 75,000 | 75,000 | 8 | 8 | 102.83 | ||||||||
29364D407 | 4.56% 1965 Series | 4.56% | 75,000 | 75,000 | 8 | 8 | 102.50 | ||||||||
29364D605 | 6.08% Series | 6.08% | — | 100,000 | — | 10 | — | ||||||||
Cumulative, $25 par value: | |||||||||||||||
29364D787 | 6.45% Series(a) | 6.45% | — | 3,000,000 | 75 | — | |||||||||
Total without sinking fund | 313,500 | 3,413,500 | $ | 31 | $ | 116 | |||||||||
(a) Series is callable at par. | |||||||||||||||
Totals may not foot due to rounding. | |||||||||||||||
UTILITY LONG-TERM DEBT AND PREFERRED STOCK | |||||||||||||
ENTERGY LOUISIANA, LLC | |||||||||||||
CURRENT OR | |||||||||||||
BONDS: | MATURITY | FIRST CALL | FIRST CALL | AS OF DECEMBER 31, | |||||||||
CUSIP | TYPE* | RATE | DATE | DATE | PRICE | 2016 | 2015 | ||||||
($ millions) | |||||||||||||
29364WAJ7 | 6.50% Series | M | 6.5% | 09/18 | Now | MW (T + .40%) | $ | 300 | $ | 300 | |||
29365PAN2 | 6.00% Series | M | 6.0% | 05/18 | Now | MW (T + .40%) | 375 | 375 | |||||
29365PAQ5 | 3.95% Series | M | 3.95% | 10/20 | Now | MW (T + .25%) | 250 | 250 | |||||
29364WAN8 | 4.8% Series | M | 4.8% | 05/21 | Now | MW (T + .25%) | 200 | 200 | |||||
29364WAR9 | 3.30% Series | M | 3.3% | 12/22 | Now | MW (T + .25%) | 200 | 200 | |||||
29364WAS7 | 4.05% Series | M | 4.05% | 09/23 | Now | MW (T + .20%) | 325 | 325 | |||||
29365PAP7 | 5.59% Series | M | 5.59% | 10/24 | Now | MW (T + .40%) | 300 | 300 | |||||
29364WAK4 | 5.40% Series | M | 5.4% | 11/24 | Now | MW (T + .35%) | 400 | 400 | |||||
29365PAR3 | 3.78% Series | M | 3.78% | 04/25 | Now | MW (T + .20%) | 110 | 110 | |||||
29364WAU2 | 3.78% Series | M | 3.78% | 04/25 | Now | MW (T + .20%) | 190 | 190 | |||||
29364WAM0 | 4.44% Series | M | 4.44% | 01/26 | Now | MW (T + .30%) | 250 | 250 | |||||
29364LAL6 | 6.2% Series | M | 6.2% | 07/33 | Now | 100% | — | 240 | |||||
29364LAT9 | 6.18% Series | M | 6.18% | 03/35 | Now | 100% | — | 85 | |||||
29364W306 | 6.0% Series | M | 6.0% | 03/40 | 3/15/15 | 100% | — | 118 | |||||
29364W405 | 5.875% Series | M | 5.875% | 06/41 | 11/23/15 | 100% | — | 150 | |||||
29364WAT5 | 5.0% Series | M | 5.0% | 07/44 | Now | MW (T + .25%) | 170 | 170 | |||||
29364WAV0 | 4.95% Series | M | 4.95% | 01/45 | Now | MW (T + .30%) | 450 | 250 | |||||
29364W504 | 5.25% Series | M | 5.25% | 07/52 | 7/1/17 | 100% | 200 | 200 | |||||
29364W603 | 4.7% Series | M | 4.7% | 06/63 | 6/1/18 | 100% | 100 | 100 | |||||
29364WAY4 | 2.4% Series | M | 2.4% | 10/26 | Now | MW (T + .15%) | 400 | — | |||||
29364WAW8 | 3.25% Series | M | 3.3% | 04/28 | Now | MW (T + .25%) | 425 | — | |||||
29364WAX6 | 3.05% Series | M | 3.1% | 06/31 | Now | MW (T + .25%) | 325 | — | |||||
29364W108 | 4.88% Series | M | 4.9% | 09/66 | 9/1/21 | 100% | 270 | — | |||||
5463984Y1 | 3.375% Series – Louisiana Public Facilities Authority | G(a,c) | 3.4% | 9/1/28 | 3/1/21 | 100% | 84 | — | |||||
5463984Z8 | 3.5% Series – Louisiana Public Facilities Authority | G(a,c) | 3.5% | 6/1/30 | 6/1/21 | 100% | 115 | — | |||||
546398J82 | 5.0% Series – Louisiana Public Facilities Authority | G(a,c) | 5.0% | 2030 | 12/1/15 | 100% | — | 115 | |||||
546398J90 | 5.0% Series – Louisiana Public Facilities Authority | G(a,c) | 5.0% | 2028 | 9/1/15 | 100% | — | 84 | |||||
Total bonds | 5,439 | 4,412 | |||||||||||
OTHER LONG-TERM DEBT: | |||||||||||||
3.30% Series F – Variable Interest Entity Note Payable | 3.30% | 03/16 | — | 20 | |||||||||
3.25% Series G – Variable Interest Entity Note Payable | 3.25% | 07/17 | 25 | 25 | |||||||||
3.25% Series Q – Variable Interest Entity Note Payable | 3.25% | 07/17 | 75 | 75 | |||||||||
3.38% Series R – Variable Interest Entity Note Payable | 3.38% | 08/20 | 70 | 70 | |||||||||
3.92% Series H – Variable Interest Entity Note Payable | 3.92% | 02/21 | 40 | 40 | |||||||||
3.22% Series I – Variable Interest Entity Note Payable | 3.22% | 12/23 | 20 | — | |||||||||
Credit Facility – weighted average rate 1.38% | 1.38% | 06/16 | — | 1 | |||||||||
29366AAA2 | 2.04% Series Senior Secured - Securitization Bond | 2.04% | 06/21 | 101 | 123 | ||||||||
Waterford 3 Lease Obligation 8.09% | 8.09% | 57 | 109 | ||||||||||
Waterford Series Collateral Trust Mortgage notes | 07/17 | 43 | — | ||||||||||
Unamortized Premium and Discount – Net | (15 | ) | (5 | ) | |||||||||
Unamortized Debt Issuance Costs | (49 | ) | (40 | ) | |||||||||
Other | 7 | 7 | |||||||||||
TOTAL LONG-TERM DEBT | 5,813 | 4,836 | |||||||||||
Less Amount Due Within One Year | 200 | 29 | |||||||||||
Long-Term Debt Excluding Amount Due Within One Year | $ | 5,613 | $ | 4,807 | |||||||||
Fair Value of Long-Term Debt(b) | $ | 5,929 | $ | 5,019 | |||||||||
*M = Mortgage Bond; G = Governmental Bond | |||||||||||||
Weighted-average annualized coupon rate | 5.3% | 4.9% | |||||||||||
(a) Consists of pollution control revenue bonds and environmental revenue bonds. | |||||||||||||
(b) The fair value excludes lease obligations of $57 million at Entergy Louisiana, and includes debt due within one year. Fair values are classified as Level 2 in the fair value hierarchy (see pgs. 212 - 220 of 2016 10K) and are based on prices derived from inputs such as benchmark yields and reported trades. | |||||||||||||
(c) The bonds are secured by a series of collateral first mortgage bonds. | |||||||||||||
Totals may not foot due to rounding. | |||||||||||||
UTILITY LONG-TERM DEBT AND PREFERRED STOCK | |||||||||||||
ENTERGY MISSISSIPPI, INC. | |||||||||||||
FIRST | |||||||||||||
BONDS: | MATURITY | CALL | CURRENT OR | AS OF DECEMBER 31, | |||||||||
CUSIP | TYPE* | RATE | DATE | DATE | FIRST CALL PRICE | 2016 | 2015 | ||||||
($ millions) | |||||||||||||
29364NAQ1 | 3.25% Series | M | 3.25% | 06/16 | Now | MW (T + .25%) | $ | — | $ | 125 | |||
29364NAP3 | 6.64% Series | M | 6.64% | 07/19 | Now | MW (T + .50%) | 150 | 150 | |||||
29364NAR9 | 3.10% Series | M | 3.10% | 07/23 | Now | MW (T + .25%) | 250 | 250 | |||||
29364NAS7 | 3.75% Series | M | 3.75% | 07/24 | Now | MW (T + .15%) | 100 | 100 | |||||
29364N876 | 6.0% Series | M | 6.00% | 11/32 | Now | 100% | — | 75 | |||||
29364NAL2 | 6.25% Series | M | 6.25% | 04/34 | Now | MW (T + .25%) | — | 100 | |||||
29364N843 | 6.20% Series | M | 6.20% | 04/40 | 4/15/15 | 100% | — | 80 | |||||
29364N835 | 6.00% Series | M | 6.00% | 05/51 | 5/1/16 | 100% | — | 150 | |||||
29364NAT5 | 2.85% Series | M | 2.85% | 06/28 | Now | MW (T + .20%) | 375 | — | |||||
29364N108 | 4.90% Series | M | 4.90% | 10/66 | 10/1/21 | 100% | 260 | — | |||||
453424BS1 | 4.90% Series – Independence County | G(a,c) | 4.90% | 2022 | 6/2/14 | 101% | — | 30 | |||||
Total bonds | 1,135 | 1,060 | |||||||||||
OTHER LONG-TERM DEBT: | |||||||||||||
Unamortized Premium and Discount – Net | (1 | ) | (1 | ) | |||||||||
Unamortized Debt Issuance Cost | (13 | ) | (14 | ) | |||||||||
TOTAL LONG-TERM DEBT | 1,121 | 1,045 | |||||||||||
Less Amount Due Within One Year | — | 125 | |||||||||||
Long-Term Debt Excluding Amount Due Within One Year | $ | 1,121 | $ | 920 | |||||||||
Fair Value of Long-Term Debt(b) | $ | 1,086 | $ | 1,087 | |||||||||
*M = Mortgage Bond; G = Governmental Bond | |||||||||||||
Weighted-average annualized coupon rate | 4.0% | 4.9% | |||||||||||
(a) Consists of pollution control revenue bonds and environmental revenue bonds. | |||||||||||||
(b) The fair value includes debt due within one year. Fair values are classified as Level 2 in the fair value hierarchy (see pgs. 212 - 220 of 2016 10K) and are based on prices derived from inputs such as benchmark yields and reported trades. | |||||||||||||
(c) The bonds are secured by a series of collateral first mortgage bonds. | |||||||||||||
Totals may not foot due to rounding. | |||||||||||||
SHARES AUTHORIZED | |||||||||||||||||
AND OUTSTANDING | CALL PRICE PER SHARE | ||||||||||||||||
PREFERRED STOCK: | AS OF DECEMBER 31, | AS OF DECEMBER 31, | AS OF DECEMBER 31, | ||||||||||||||
CUSIP | RATE | 2016 | 2015 | 2016 | 2015 | 2016 | |||||||||||
($ millions) | |||||||||||||||||
Without sinking fund: | |||||||||||||||||
Cumulative, $100 par value: | |||||||||||||||||
29364N207 | 4.36% Series | 4.36% | $ | 59,920 | $ | 59,920 | $ | 6 | $ | 6 | $ 104.00 | ||||||
29364N306 | 4.56% Series | 4.56% | 43,887 | 43,887 | 4 | 4 | 107.00 | ||||||||||
29364N405 | 4.92% Series | 4.92% | 100,000 | 100,000 | 10 | 10 | 102.88 | ||||||||||
Cumulative, $25 par value: | |||||||||||||||||
29364N850 | 6.25% Series | 6.25% | — | 1,200,000 | — | 30 | — | ||||||||||
Total without sinking fund | $ | 203,807 | $ | 1,403,807 | $ | 20 | $ | 50 | |||||||||
ENTERGY NEW ORLEANS, INC. | |||||||||||||
FIRST | |||||||||||||
BONDS: | MATURITY | CALL | CURRENT OR | AS OF DECEMBER 31, | |||||||||
CUSIP | TYPE* | RATE | DATE | DATE | FIRST CALL PRICE | 2016 | 2015 | ||||||
($ millions) | |||||||||||||
29364PAM5 | 5.10% Series | M | 5.1% | 12/20 | Now | MW (T + .35%) | $ | 25 | $ | 25 | |||
29364PAN3 | 3.9% Series | M | 3.9% | 07/23 | Now | MW (T + .30%) | 100 | 100 | |||||
29364PAK9 | 5.6% Series | M | 5.6% | 09/24 | Now | 100% | — | 33 | |||||
29364PAJ2 | 5.65% Series | M | 5.65% | 09/29 | Now | 100% | — | 38 | |||||
29364P509 | 5.0% Series | M | 5.0% | 12/52 | 12/1/17 | 100% | 30 | 30 | |||||
29364PAP8 | 4.0% Series | M | 4.0% | 06/26 | Now | MW (T + .35%) | 85 | — | |||||
29364P103 | 5.5% Series | M | 5.5% | 04/66 | 4/1/21 | 100% | 110 | — | |||||
Total bonds | 350 | 226 | |||||||||||
OTHER LONG-TERM DEBT: | |||||||||||||
29277VAA4 | 2.67% Series Senior Secured - Securitization Bond | 2.7% | 06/27 | 87 | 99 | ||||||||
Payable to Entergy Louisiana | 11/35 | 21 | 26 | ||||||||||
Unamortized Premium and Discount – Net | — | — | |||||||||||
Unamortized Debt Issuance Cost | (9 | ) | (7 | ) | |||||||||
TOTAL LONG-TERM DEBT | 449 | 344 | |||||||||||
Less Amount Due Within One Year | 2 | 5 | |||||||||||
Long-Term Debt Excluding Amount Due Within One Year | $ | 447 | $ | 339 | |||||||||
Fair Value of Long-Term Debt(a) | $ | 455 | $ | 351 | |||||||||
*M = Mortgage; G = Governmental | |||||||||||||
Weighted-average annualized coupon rate | 4.2% | 4.1% | |||||||||||
(a) The fair value includes debt due within one year. Fair values are classified as Level 2 in the fair value hierarchy (see pgs. 212 - 220 of 2016 10K) and are based on prices derived from inputs such as benchmark yields and reported trades. | |||||||||||||
Totals may not foot due to rounding. | |||||||||||||
SHARES AUTHORIZED | ||||||||||||||||
AND OUTSTANDING | CALL PRICE PER SHARE | |||||||||||||||
PREFERRED STOCK: | AS OF DECEMBER 31, | AS OF DECEMBER 31, | AS OF DECEMBER 31, | |||||||||||||
CUSIP | RATE | 2016 | 2015 | 2016 | 2015 | 2016 | ||||||||||
($ millions) | ||||||||||||||||
Without sinking fund: | ||||||||||||||||
Cumulative, $100 par value: | ||||||||||||||||
29364P301 | 4.75% Series | 4.75% | 77,798 | 77,798 | $ | 8 | $ | 8 | $ | 105 | ||||||
29364P202 | 4.36% Series | 4.36% | 60,000 | 60,000 | 6 | 6 | 104.58 | |||||||||
29364P400 | 5.56% Series | 5.56% | 60,000 | 60,000 | 6 | 6 | 102.59 | |||||||||
Total without sinking fund | 197,798 | 197,798 | $ | 20 | $ | 20 | ||||||||||
Totals may not foot due to rounding. | ||||||||||||||||
UTILITY LONG-TERM DEBT AND PREFERRED STOCK | |||||||||||||
ENTERGY TEXAS, INC. | |||||||||||||
FIRST | AS OF | ||||||||||||
BONDS: | MATURITY | CALL | CURRENT OR | DECEMBER 31, | |||||||||
CUSIP | TYPE* | RATE | DATE | DATE | FIRST CALL PRICE | 2016 | 2015 | ||||||
($ millions) | |||||||||||||
29365TAA2 | 7.125% Series | M | 7.125% | 02/19 | Now | MW (T + .50%) | $ | 500 | $ | 500 | |||
29365TAC8 | 4.1% Series | M | 4.1% | 09/21 | Now | MW (T + .35%) | 75 | 75 | |||||
29365TAD6 | 5.15% Series | M | 5.15% | 06/45 | 6/25/16 | MW (T + .35%) | 250 | 250 | |||||
29365T104 | 5.625% Series | M | 5.625% | 06/64 | 6/19/16 | 100% | 135 | 135 | |||||
29365TAE4 | 2.55% Series | M | 2.550% | 06/21 | Now | MW (T + .20%) | 125 | — | |||||
Total bonds | 1,085 | 960 | |||||||||||
OTHER LONG-TERM DEBT: | |||||||||||||
29365QAB6 | 5.79% Series Senior Secured, Series A - Securitization Bond | 5.79% | 10/18 | 24 | 50 | ||||||||
29365KAB9 | 3.65% Series Senior Secured, Series A - Securitization Bond | 3.65% | 08/19 | 75 | 117 | ||||||||
29365QAC4 | 5.93% Series Senior Secured, Series A - Securitization Bond | 5.93% | 06/22 | 114 | 114 | ||||||||
29365KAC7 | 4.38% Series Senior Secured - Securitization Bond | 4.38% | 11/23 | 219 | 219 | ||||||||
Unamortized Premium and Discount – Net | (2 | ) | (2 | ) | |||||||||
Unamortized Debt Issuance Costs | (11 | ) | (11 | ) | |||||||||
Other | 4 | 5 | |||||||||||
TOTAL LONG-TERM DEBT | 1,508 | 1,452 | |||||||||||
Less Amount Due Within One Year | — | — | |||||||||||
Long-Term Debt Excluding Amount Due Within One Year | $ | 1,508 | $ | 1,452 | |||||||||
Fair Value of Long-Term Debt(a) | $ | 1,600 | $ | 1,591 | |||||||||
*M = Mortgage Bond; G = Governmental Bond | |||||||||||||
Weighted-average annualized coupon rate | 5.5% | 5.7% | |||||||||||
(a) The fair value includes debt due within one year. Fair values are classified as Level 2 in the fair value hierarchy (see pgs. 212 - 220 of 2016 10K) and are based on prices derived from inputs such as benchmark yields and reported trades. | |||||||||||||
Totals may not foot due to rounding. | |||||||||||||
SYSTEM ENERGY RESOURCES, INC. | |||||||||||||
BONDS: | MATURITY | FIRST CALL | CURRENT OR | AS OF DECEMBER 31, | |||||||||
CUSIP | TYPE* | RATE | DATE | DATE | FIRST CALL PRICE | 2016 | 2015 | ||||||
($ millions) | |||||||||||||
605277AB8 | 5.875% Series – Mississippi Business Finance Corp. | G(a) | 5.875% | 2022 | Now | 100% | $ | 134 | $ | 156 | |||
871911AS2 | 4.10% Series | M | 4.1% | 04/23 | Now | MW (T + 0.40%) | 250 | 250 | |||||
Total bonds | 384 | 406 | |||||||||||
OTHER LONG-TERM DEBT: | |||||||||||||
4.02% Series H – Variable Interest Entity Note Payable | 4.02% | 02/17 | 50 | 50 | |||||||||
3.78% Series I – Variable Interest Entity Note Payable | 3.78% | 10/18 | 85 | 85 | |||||||||
361561AA1 | Grand Gulf Lease Obligation 5.13% | 5.13% | 34 | 34 | |||||||||
Unamortized Premium and Discount – Net | (1 | ) | (1 | ) | |||||||||
Unamortized Debt Issuance Costs | (2 | ) | (2 | ) | |||||||||
TOTAL LONG-TERM DEBT | 551 | 573 | |||||||||||
Less Amount Due Within One Year | 50 | — | |||||||||||
Long-Term Debt Excluding Amount Due Within One Year | $ | 501 | $ | 573 | |||||||||
Fair Value of Long-Term Debt(b) | $ | 530 | $ | 553 | |||||||||
*M = Mortgage Bond; G = Governmental Bond | |||||||||||||
Weighted-average annualized coupon rate | 4.5% | 4.1% | |||||||||||
(a) Consists of pollution control revenue bonds and environmental revenue bonds. | |||||||||||||
(b) The fair value excludes lease obligations of $34 million at System Energy and includes debt due within one year. Fair values are classified as Level 2 in the fair value hierarchy (see pgs. 212 - 220 of 2016 10K) and are based on prices derived from inputs such as benchmark yields and reported trades. | |||||||||||||
Totals may not foot due to rounding. | |||||||||||||
UTILITY STATISTICAL INFORMATION | ||||||||||
UTILITY TOTAL CAPABILITY | ||||||||||
OWNED & | ||||||||||
OPERATED | LEASED | OPERATED | ||||||||
As of December 31, 2016 | PLANTS | UNITS | (MW)(a) | (MW)(b) | ||||||
Plants that use fuel type: | ||||||||||
Gas/Oil | 24 | 52 | 14,847 | 15,158 | ||||||
Coal | 3 | 5 | 2,240 | 3,868 | ||||||
Petroleum Coke | 1 | 2 | — | 204 | ||||||
Total Fossil | 28 | 59 | 17,087 | 19,230 | ||||||
Hydro | 3 | 7 | 74 | 153 | ||||||
Nuclear | 4 | 5 | 5,222 | 5,359 | ||||||
Total Capability | 35 | 71 | 22,383 | 24,742 | ||||||
All plants that have units with multiple fuel types are in the Gas & Oil plant count. | ||||||||||
(a) Owned and Leased Capability is the dependable load carrying capability as demonstrated under actual operating conditions based on the | ||||||||||
primary fuel (assuming no curtailments) that each station was designed to utilize. | ||||||||||
(b) Certain Entergy subsidiaries jointly own electric generating facilities with affiliates or third parties, which Entergy operates for the | ||||||||||
participating parties. | ||||||||||
UTILITY SELECTED OPERATING DATA | ||||||||||
2016 | 2015 | 2014 | 2013 | 2012 | ||||||
SOURCES OF ENERGY (GWh) | ||||||||||
Net Generation: | ||||||||||
Gas & Oil | 51,976 | 43,732 | 34,158 | 30,364 | 31,011 | |||||
Coal | 9,164 | 8,263 | 13,970 | 13,567 | 13,320 | |||||
Nuclear | 35,871 | 39,682 | 40,986 | 38,676 | 37,714 | |||||
Hydro | 184 | 144 | 142 | 131 | 108 | |||||
Total Net Generation | 97,195 | 91,821 | 89,256 | 82,739 | 82,153 | |||||
Purchased Power: | ||||||||||
Affiliated Companies | — | — | — | 349 | 713 | |||||
Non-affiliated Companies | 31,251 | 34,047 | 35,291 | 33,994 | 32,982 | |||||
Total Purchased Power | 31,251 | 34,047 | 35,291 | 34,343 | 33,695 | |||||
Total Sources of Energy | 128,446 | 125,868 | 124,547 | 117,081 | 115,850 | |||||
USES OF ENERGY (GWh) | ||||||||||
Electric Energy Sales: | ||||||||||
Residential | 35,112 | 36,068 | 35,932 | 35,169 | 34,664 | |||||
Commercial | 29,197 | 29,348 | 28,827 | 28,547 | 28,724 | |||||
Industrial | 45,739 | 44,382 | 43,723 | 41,653 | 41,181 | |||||
Governmental | 2,547 | 2,514 | 2,428 | 2,412 | 2,435 | |||||
Total Retail | 112,595 | 112,312 | 110,910 | 107,781 | 107,004 | |||||
Sales for Resale | 11,054 | 9,274 | 9,462 | 3,020 | 3,200 | |||||
Unbilled Energy | 406 | (96 | ) | (485 | ) | 530 | 15 | |||
Total Electric Energy Sales | 124,055 | 121,490 | 119,887 | 111,331 | 110,219 | |||||
Line Losses and Company Usage | 4,391 | 4,378 | 4,660 | 5,750 | 5,631 | |||||
Total Uses of Energy | 128,446 | 125,868 | 124,547 | 117,081 | 115,850 | |||||
Electric Energy Sales (Weather Adjusted)(GWh): | ||||||||||
Residential | 35,362 | 35,413 | 35,188 | 35,143 | 35,357 | |||||
Commercial | 28,767 | 29,022 | 28,907 | 28,573 | 28,596 | |||||
Industrial | 45,739 | 44,382 | 43,723 | 41,653 | 41,181 | |||||
Governmental | 2,540 | 2,509 | 2,430 | 2,413 | 2,426 | |||||
Total Weather Adjusted Sales | 112,408 | 111,326 | 110,248 | 107,782 | 107,560 | |||||
Peak Demand (MW) | 21,387 | 21,730 | 20,472 | 21,581 | 21,866 | |||||
Operational Summer Capacity at Peak (MW) | 24,656 | 24,504 | 24,367 | 23,802 | 23,407 | |||||
Annual System Load Factor (%) | 63 | 61 | 65 | 62 | 60 | |||||
Retail Electric Sales Growth Rate (%) | 0.3 | 1.3 | 2.9 | 0.7 | (1.5 | ) | ||||
Retail Electric Sales Weather-Adjusted Growth Rate (%) | 1.0 | 1.0 | 2.3 | 0.2 | 1.9 | |||||
Regional Gross Domestic Product Rate (%) | 0.5 | 1.6 | 1.6 | 0.8 | 1.0 | |||||
National Gross Domestic Product Rate (%) | 2.0 | 1.6 | 3.3 | 1.6 | 1.3 | |||||
Average Fuel Cost (cents/KWh) | ||||||||||
Natural Gas | 2.44 | 2.65 | 4.36 | 4.12 | 3.15 | |||||
Nuclear Fuel | 0.63 | 0.85 | 0.89 | 0.92 | 0.85 | |||||
Coal | 2.65 | 2.85 | 2.63 | 2.70 | 2.60 | |||||
Purchased Power | 3.71 | 3.39 | 5.14 | 4.32 | 3.58 | |||||
Certain prior year data has been reclassified to conform with current year presentation. | ||||||||||
Totals may not foot due to rounding. | ||||||||||
UTILITY STATISTICAL INFORMATION | ||||||||||||||||||
2016 CONSOLIDATING UTILITY ELECTRIC STATISTICAL INFORMATION | ||||||||||||||||||
EAI | ELL | EMI | ENOI | ETI | SERI | ELIMINATIONS | UTILITY | % | ||||||||||
ELECTRIC OPERATING REVENUES ($ thousands) | ||||||||||||||||||
Residential | 789,472 | 1,195,721 | 458,547 | 231,274 | 612,660 | — | — | 3,287,674 | 37 | % | ||||||||
Commercial | 495,455 | 930,024 | 374,426 | 205,846 | 356,057 | — | — | 2,361,809 | 27 | % | ||||||||
Industrial | 445,525 | 1,350,484 | 133,951 | 32,787 | 364,614 | — | — | 2,327,361 | 26 | % | ||||||||
Governmental | 18,456 | 66,530 | 38,265 | 69,126 | 24,373 | — | — | 216,750 | 2 | % | ||||||||
Total Retail | 1,748,908 | 3,542,759 | 1,005,189 | 539,033 | 1,357,704 | — | — | 8,193,594 | 92 | % | ||||||||
Sales for Resale | 167,149 | 418,060 | 31,408 | 32,843 | 218,007 | 548,372 | (1,179,613 | ) | 236,225 | 3 | % | |||||||
Other | 170,551 | 165,524 | 58,052 | 14,944 | 39,908 | (81 | ) | (11,958 | ) | 436,939 | 5 | % | ||||||
Total | 2,086,608 | 4,126,343 | 1,094,649 | 586,820 | 1,615,619 | 548,291 | (1,191,571 | ) | 8,866,758 | 100 | % | |||||||
SOURCES OF ENERGY (GWh) | ||||||||||||||||||
Net Generation: | ||||||||||||||||||
Gas & Oil | 8,327 | 26,210 | 7,852 | 1,792 | 7,795 | — | — | 51,976 | 41 | % | ||||||||
Coal | 4,457 | 1,599 | 1,926 | — | 1,182 | — | — | 9,164 | 7 | % | ||||||||
Nuclear | 13,420 | 17,152 | — | — | — | 5,299 | — | 35,871 | 28 | % | ||||||||
Hydro | 184 | — | — | — | — | — | — | 184 | — | |||||||||
Total Net Generation | 26,388 | 44,961 | 9,778 | 1,792 | 8,977 | 5,299 | — | 97,195 | 76 | % | ||||||||
Purchased Power: | ||||||||||||||||||
Affiliated Companies | 1,938 | 6,033 | 2,150 | 3,865 | 6,048 | — | (20,034 | ) | — | — | ||||||||
Non-affiliated Companies | 2,315 | 14,685 | 3,353 | 1,535 | 9,363 | — | 31,251 | 24 | % | |||||||||
Total Purchased Power | 4,253 | 20,718 | 5,503 | 5,400 | 15,411 | — | (20,034 | ) | 31,251 | 24 | % | |||||||
Total Sources of Energy | 30,641 | 65,679 | 15,281 | 7,192 | 24,388 | 5,299 | (20,034 | ) | 128,446 | 100 | % | |||||||
USES OF ENERGY (GWh) | ||||||||||||||||||
Electric Energy Sales: | ||||||||||||||||||
Residential | 7,618 | 13,810 | 5,617 | 2,231 | 5,836 | — | — | 35,112 | 31 | % | ||||||||
Commercial | 5,988 | 11,478 | 4,894 | 2,268 | 4,570 | — | — | 29,197 | 26 | % | ||||||||
Industrial | 6,795 | 28,517 | 2,493 | 441 | 7,493 | — | — | 45,739 | 41 | % | ||||||||
Governmental | 237 | 794 | 439 | 794 | 283 | — | — | 2,547 | 2 | % | ||||||||
Total Retail | 20,638 | 54,599 | 13,443 | 5,734 | 18,182 | — | — | 112,595 | 100 | % | ||||||||
Sales for Resale | 8,724 | 9,035 | 1,021 | 1,212 | 5,711 | 5,384 | (20,034 | ) | 11,054 | — | ||||||||
Unbilled Energy | 156 | 206 | 57 | 3 | (16 | ) | — | — | 406 | — | ||||||||
Total Electric Energy Sales | 29,518 | 63,840 | 14,521 | 6,949 | 23,877 | 5,384 | (20,034 | ) | 124,055 | — | ||||||||
Line Losses and Company Usage | 1,123 | 1,839 | 760 | 243 | 511 | (85 | ) | — | 4,391 | — | ||||||||
Total Uses of Energy | 30,641 | 65,679 | 15,281 | 7,192 | 24,388 | 5,299 | (20,034 | ) | 128,446 | — | ||||||||
AVERAGE ELECTRIC REVENUE (cents/KWh) | ||||||||||||||||||
Residential | 10.36 | 8.66 | 8.16 | 10.37 | 10.50 | — | — | 9.36 | — | |||||||||
Commercial | 8.27 | 8.10 | 7.65 | 9.08 | 7.79 | — | — | 8.09 | — | |||||||||
Industrial | 6.56 | 4.74 | 5.37 | 7.43 | 4.87 | — | — | 5.09 | — | |||||||||
Governmental | 7.79 | 8.38 | 8.72 | 8.71 | 8.61 | — | — | 8.51 | — | |||||||||
NUMBER OF RETAIL ELECTRIC CUSTOMERS | ||||||||||||||||||
(as of December 31, 2016) | ||||||||||||||||||
Residential | 589,048 | 923,383 | 374,119 | 177,993 | 388,143 | — | — | 2,452,686 | 85% | |||||||||
Commercial | 93,183 | 129,989 | 64,274 | 16,425 | 48,276 | — | — | 352,147 | 12% | |||||||||
Industrial | 23,922 | 10,768 | 4,028 | 2,117 | 5,417 | — | — | 46,252 | 2% | |||||||||
Governmental | 727 | 7,927 | 5,055 | 1,860 | 2,162 | — | — | 17,731 | 1% | |||||||||
Total Retail Customers | 706,880 | 1,072,067 | 447,476 | 198,395 | 443,998 | — | — | 2,868,816 | 100% | |||||||||
Totals may not foot due to rounding. | ||||||||||||||||||
UTILITY STATISTICAL INFORMATION | ||||||||||
ENTERGY ARKANSAS, INC. | ||||||||||
2016 | 2015 | 2014 | 2013 | 2012 | ||||||
ELECTRIC OPERATING REVENUES ($ thousands) | ||||||||||
Residential | 789,472 | 823,983 | 754,513 | 772,059 | 765,564 | |||||
Commercial | 495,455 | 515,145 | 461,238 | 469,367 | 472,046 | |||||
Industrial | 445,525 | 477,217 | 424,151 | 432,852 | 439,467 | |||||
Governmental | 18,456 | 19,821 | 18,314 | 19,206 | 19,787 | |||||
Total Retail | 1,748,908 | 1,836,166 | 1,658,216 | 1,693,484 | 1,696,864 | |||||
Sales for Resale | 167,149 | 323,571 | 412,805 | 429,141 | 369,322 | |||||
Other | 170,551 | 93,827 | 101,370 | 67,534 | 60,818 | |||||
Total Electric Operating Revenues | 2,086,608 | 2,253,564 | 2,172,391 | 2,190,159 | 2,127,004 | |||||
SOURCES OF ENERGY (GWh) | ||||||||||
Net Generation: | ||||||||||
Gas & Oil | 8,327 | 5,768 | 3,508 | 3,200 | 1,889 | |||||
Coal | 4,457 | 4,423 | 7,753 | 7,481 | 7,179 | |||||
Nuclear | 13,420 | 13,838 | 14,476 | 11,946 | 15,493 | |||||
Hydro | 184 | 144 | 142 | 131 | 108 | |||||
Total Net Generation | 26,388 | 24,172 | 25,879 | 22,758 | 24,669 | |||||
Purchased Power: | ||||||||||
Affiliated Companies | 1,938 | 3,797 | 3,319 | 4,017 | 2,940 | |||||
Non-affiliated Companies | 2,315 | 4,408 | 3,324 | 4,608 | 4,130 | |||||
Total Purchased Power | 4,253 | 8,205 | 6,643 | 8,625 | 7,070 | |||||
Total Sources of Energy | 30,641 | 32,378 | 32,522 | 31,383 | 31,739 | |||||
USES OF ENERGY (GWh) | ||||||||||
Electric Energy Sales: | ||||||||||
Residential | 7,618 | 8,016 | 8,070 | 7,921 | 7,859 | |||||
Commercial | 5,988 | 6,020 | 5,934 | 5,929 | 6,046 | |||||
Industrial | 6,795 | 6,889 | 6,808 | 6,769 | 6,925 | |||||
Governmental | 237 | 235 | 238 | 241 | 257 | |||||
Total Retail | 20,638 | 21,160 | 21,050 | 20,860 | 21,087 | |||||
Sales for Resale | 8,724 | 10,219 | 10,301 | 8,929 | 9,019 | |||||
Unbilled Energy | 156 | (119 | ) | (98 | ) | 100 | 13 | |||
Total Electric Energy Sales | 29,518 | 31,260 | 31,253 | 29,889 | 30,119 | |||||
Line Losses and Company Usage | 1,123 | 1,118 | 1,269 | 1,494 | 1,620 | |||||
Total Uses of Energy | 30,641 | 32,378 | 32,522 | 31,383 | 31,739 | |||||
AVERAGE ELECTRIC REVENUE (cents/KWh) | ||||||||||
Residential | 10.36 | 10.28 | 9.35 | 9.75 | 9.74 | |||||
Commercial | 8.27 | 8.56 | 7.77 | 7.92 | 7.81 | |||||
Industrial | 6.56 | 6.93 | 6.23 | 6.39 | 6.35 | |||||
Governmental | 7.79 | 8.43 | 7.69 | 7.97 | 7.70 | |||||
NUMBER OF RETAIL ELECTRIC CUSTOMERS | ||||||||||
(as of December 31) | ||||||||||
Residential | 589,048 | 587,634 | 585,896 | 585,157 | 583,882 | |||||
Commercial | 93,183 | 92,248 | 91,005 | 90,354 | 89,618 | |||||
Industrial | 23,922 | 24,303 | 23,996 | 24,198 | 21,295 | |||||
Governmental | 727 | 735 | 692 | 686 | 681 | |||||
Total Retail Customers | 706,880 | 704,920 | 701,589 | 700,395 | 695,476 | |||||
Totals may not foot due to rounding. | ||||||||||
UTILITY STATISTICAL INFORMATION | |||||||||||||||||||||||
ENTERGY ARKANSAS, INC. | |||||||||||||||||||||||
GENERATION PORTFOLIO | |||||||||||||||||||||||
PLANT | TOTAL PLANT – 2016 | ||||||||||||||||||||||
OWNED & | AVG BTU | TOTAL | |||||||||||||||||||||
LEASED | PER KWH | Emissions | NET | EXPENSES | PRODUCTION | ||||||||||||||||||
COMMERCIAL | CAPABILITY | NET | SO2 | NOx | CO2 | Hg | GENERATION | PER NET | EXPENSE | ||||||||||||||
PLANT | UNIT | OWNERSHIP | OPERATION | (MW)(a) | FUEL TYPE | PURPOSE | GENERATION(d) | (tons) | (tons) | (tons) | (lbs) | TECHNOLOGY(b) | (MWH) | MWH | ($ thousands) | ||||||||
Cecil Lynch | 2 | 100% | 1949 | — | Gas/Oil | Retired | — | — | — | — | |||||||||||||
3 | 100% | 1954 | — | Gas/Oil | Retired | ||||||||||||||||||
Harvey Couch | 1 | 100% | 1943 | — | Gas/Oil | Retired | — | — | — | — | |||||||||||||
2 | 100% | 1954 | — | Gas/Oil | Retired | ||||||||||||||||||
Lake Catherine | 1 | 100% | 1950 | — | Gas/Oil | Retired | |||||||||||||||||
2 | 100% | 1950 | — | Gas/Oil | Retired | ||||||||||||||||||
3 | 100% | 1953 | — | Gas/Oil | Retired | ||||||||||||||||||
4 | 100% | 1970 | 520 | Gas/Oil | Peaking | 11,299 | 1.1 | 529 | 226,530 | 339,765 | 81.5 | 27,704 | |||||||||||
Hamilton Moses | 1 | 100% | 1951 | — | Gas/Oil | Retired | — | — | — | — | |||||||||||||
2 | 100% | 1951 | — | Gas/Oil | Retired | ||||||||||||||||||
Mabelvale | 1 | 100% | 1970 | — | Gas/Oil | Retired | — | 5 | 101,669.2 | 508 | |||||||||||||
2 | 100% | 1970 | — | Gas/Oil | Retired | ||||||||||||||||||
3 | 100% | 1970 | — | Gas/Oil | Retired | ||||||||||||||||||
4 | 100% | 1970 | — | Gas/Oil | Retired | ||||||||||||||||||
Robert Ritchie | 1 | 100% | 1961 | — | Gas/Oil | Retired | — | — | — | — | |||||||||||||
3 | 100% | 1970 | — | Gas/Oil | Retired | — | — | — | — | ||||||||||||||
Ouachita | 1 | 100% | 2002 | 256 | Gas | Intermediate | 7,307 | 3 | 61 | 538,485 | Dry LNB, SCR | 2,689,274 | 26.8 | 71,972 | |||||||||
2 | 100% | 2002 | 253 | Gas | Intermediate | 3 | 70 | 536,163 | Dry LNB, SCR | ||||||||||||||
Hot Spring | 1 | 100% | 2002 | 609 | Gas | Intermediate | 7,395 | 6 | 86 | 1,213,128 | Dry LNB, SCR | 2,936,301 | 27.3 | 80,189 | |||||||||
Independence | 1 | 31.5% | 1983 | 263 | Coal | Base | 10,392 | 3,400 | 1,560 | 1,241,599 | 15 | OFA, ESP, ACI | 1,220,591 | 28.3 | 34,512 | ||||||||
White Bluff | 1 | 57% | 1980 | 465 | Coal | Base | 10,761 | 4,551 | 2,633 | 1,702,209 | 26 | OFA, ESP, ACI | 3,270,090 | 34.1 | 111,480 | ||||||||
2 | 57% | 1981 | 468 | Coal | Base | 5,901 | 2,907 | 2,131,143 | 33 | OFA, ESP, ACI | |||||||||||||
Cecil Lynch | Diesel | 100% | 1967 | — | Oil | Retired | — | — | — | — | |||||||||||||
Carpenter | 1 | 100% | 1932 | 31 | Hydro | Peaking | — | 141,579 | 10.7 | 1,522 | |||||||||||||
2 | 100% | 1932 | 31 | Hydro | Peaking | ||||||||||||||||||
Remmel | 1 | 100% | 1925 | 4 | Hydro | Peaking | — | 43,943 | 18.8 | 825 | |||||||||||||
2 | 100% | 1925 | 4 | Hydro | Peaking | ||||||||||||||||||
3 | 100% | 1925 | 4 | Hydro | Peaking | ||||||||||||||||||
Union Power Station | 2 | 100% | 2003 | 507 | Gas | Intermediate | 7,354 | 5 | 122 | 1,249,025 | Dry LNB, SCR | 2,374,273 | 23.1 | 54,960 | |||||||||
Arkansas | |||||||||||||||||||||||
Nuclear One | 1 | 100% | 1974 | 833 | Nuclear PWR(c) | Base | 10,377 | 13,420,015 | 27.0 | 362,050 | |||||||||||||
2 | 100% | 1980 | 985 | Nuclear PWR(c) | Base | ||||||||||||||||||
Total | 5,231 | 13,870 | 7,968 | 8,838,242 | 74 | 28,435,835 | 28.2 | 745,723 | |||||||||||||||
(a) Owned and Leased Capability is the dependable load carrying capability as demonstrated under actual operating conditions based on the primary fuel (assuming no curtailments) that each station was designed to utilize. | |||||||||||||||||||||||
(b) Installed NOx and particulate matter emission control devices as stated in the EPA Monitoring Plan and operational: Combustion Modification/ Fuel Reburning (Combus Mod / Fuel Reburn), Dry Low NOx Burners (Dry LNB), Electrostatic Precipitator (ESP), Low NOx Burners with Closed-coupled Overfire Air (LNB w/ Closed-coupled OFA), Low NOx Burners with Separated Overfire Air (LNB w/ Sep OFA), Low NOx Burner with Overfire Air (LNB w/ OFA), Overfire Air (OFA), Selective Catalytic Reduction (SCR) or Steam Injection and Activated Carbon Injection (ACI). Currently have no SO2, or CO2 control equipment operating on any unit. | |||||||||||||||||||||||
(c) PWR = Pressurized Water Reactor. | |||||||||||||||||||||||
(d) The nuclear heat rate as reflected in the FERC Form 1 is calculated by obtaining the thermal generation in MWhs from the plant multiplied by the industry standard of 3.4126 to obtain the MMBtu equivalency | |||||||||||||||||||||||
Total may not foot due to rounding. | |||||||||||||||||||||||
UTILITY STATISTICAL INFORMATION | ||||||||||
ENTERGY LOUISIANA, LLC | ||||||||||
2016 | 2015 | 2014 | 2013 | 2012 | ||||||
ELECTRIC OPERATING REVENUES ($ thousands) | ||||||||||
Residential | 1,195,721 | 1,292,903 | 1,358,221 | 1,303,928 | 1,075,768 | |||||
Commercial | 930,024 | 987,464 | 1,044,352 | 1,002,987 | 831,592 | |||||
Industrial | 1,350,484 | 1,418,773 | 1,569,202 | 1,457,013 | 1,122,991 | |||||
Governmental | 66,530 | 67,560 | 69,212 | 67,234 | 56,462 | |||||
Total Retail | 3,542,759 | 3,766,700 | 4,040,987 | 3,831,162 | 3,086,813 | |||||
Sales for Resale | 418,060 | 442,172 | 506,478 | 369,316 | 413,297 | |||||
Other | 165,524 | 152,652 | 121,349 | 139,795 | 119,498 | |||||
Total Electric Operating Revenues | 4,126,343 | 4,361,524 | 4,668,814 | 4,340,273 | 3,619,608 | |||||
SOURCES OF ENERGY (GWh) | ||||||||||
Net Generation: | ||||||||||
Gas & Oil | 26,210 | 22,450 | 16,421 | 12,873 | 15,303 | |||||
Coal | 1,599 | 1,462 | 1,995 | 2,006 | 2,033 | |||||
Nuclear | 17,152 | 15,301 | 17,311 | 16,955 | 15,659 | |||||
Hydro | — | — | — | — | — | |||||
Total Net Generation | 44,961 | 39,213 | 35,727 | 31,834 | 32,995 | |||||
Purchased Power: | ||||||||||
Affiliated Companies | 6,033 | 10,001 | 9,863 | 13,291 | 12,063 | |||||
Non-affiliated Companies | 14,685 | 15,241 | 17,132 | 15,115 | 15,589 | |||||
Total Purchased Power | 20,718 | 25,242 | 26,995 | 28,406 | 27,652 | |||||
Total Sources of Energy | 65,679 | 64,455 | 62,722 | 60,240 | 60,647 | |||||
USES OF ENERGY (GWh) | ||||||||||
Electric Energy Sales: | ||||||||||
Residential | 13,810 | 14,399 | 14,415 | 14,026 | 13,879 | |||||
Commercial | 11,478 | 11,700 | 11,555 | 11,402 | 11,399 | |||||
Industrial | 28,517 | 27,713 | 27,025 | 25,734 | 25,306 | |||||
Governmental | 794 | 756 | 732 | 723 | 707 | |||||
Total Retail | 54,599 | 54,568 | 53,727 | 51,885 | 51,291 | |||||
Sales for Resale | 9,035 | 8,270 | 7,291 | 6,147 | 7,432 | |||||
Unbilled Energy | 206 | 10 | (197 | ) | 268 | 43 | ||||
Total Electric Energy Sales | 63,840 | 62,848 | 60,821 | 58,300 | 58,766 | |||||
Line Losses and Company Usage | 1,839 | 1,607 | 1,901 | 1,940 | 1,881 | |||||
Total Uses of Energy | 65,679 | 64,455 | 62,722 | 60,240 | 60,647 | |||||
AVERAGE ELECTRIC REVENUE (cents/KWh) | ||||||||||
Residential | 8.66 | 8.98 | 9.42 | 9.30 | 7.75 | |||||
Commercial | 8.10 | 8.44 | 9.04 | 8.80 | 7.30 | |||||
Industrial | 4.74 | 5.12 | 5.81 | 5.66 | 4.44 | |||||
Governmental | 8.38 | 8.94 | 9.46 | 9.30 | 7.99 | |||||
NUMBER OF RETAIL ELECTRIC CUSTOMERS | ||||||||||
(as of December 31) | ||||||||||
Residential | 923,383 | 916,095 | 927,579 | 922,438 | 915,710 | |||||
Commercial | 129,989 | 129,343 | 129,654 | 128,496 | 127,125 | |||||
Industrial | 10,768 | 10,629 | 10,805 | 10,533 | 10,293 | |||||
Governmental | 7,927 | 7,892 | 7,607 | 7,549 | 7,502 | |||||
Total Retail Customers | 1,072,067 | 1,063,959 | 1,075,645 | 1,069,016 | 1,060,630 | |||||
Totals may not foot due to rounding. | ||||||||||
UTILITY STATISTICAL INFORMATION | ||||||||||||||||||||||
ENTERGY LOUISIANA, LLC | ||||||||||||||||||||||
GENERATION PORTFOLIO | ||||||||||||||||||||||
PLANT | TOTAL PLANT – 2016 | |||||||||||||||||||||
OWNED & | AVG BTU | TOTAL | ||||||||||||||||||||
LEASED | PER KWH | Emissions | NET | EXPENSES | PRODUCTION | |||||||||||||||||
COMMERCIAL | CAPABILITY | NET | SO2 | NOx | CO2 | Hg | GENERATION | PER NET | EXPENSE | |||||||||||||
PLANT | UNIT | OWNERSHIP | OPERATION | (MW)(a) | FUEL TYPE | PURPOSE | GENERATION(d) | (tons) | (tons) | (tons) | (lbs) | TECHNOLOGY(b) | (MWH) | MWH | ($ thousands) | |||||||
Acadia | 2 | 100% | 2002 | 551 | Gas | Intermediate | 7,303 | 8 | 119 | 1,521,589 | SCR | 3,565,954 | 24.0 | 85,743 | ||||||||
Buras | 8 | 100% | 1971 | 12 | Gas/Oil | Peaking | 17,810 | 8,856 | 132.4 | 1,172 | ||||||||||||
Little Gypsy | 1 | 100% | 1961 | — | Gas/Oil | Retired | 11,071 | 2,521,700 | 36.3 | 91,633 | ||||||||||||
2 | 100% | 1966 | 412 | Gas/Oil | Intermediate | 4 | 1,439 | 868,627 | Reburn | |||||||||||||
3 | 100% | 1969 | 516 | Gas/Oil | Intermediate | 4 | 3,263 | 795,218 | Reburn | |||||||||||||
Monroe | 10 | 100% | 1961 | — | Gas | Retired | — | — | — | |||||||||||||
11 | 100% | 1965 | — | Gas | Retired | |||||||||||||||||
12 | 100% | 1968 | — | Gas | Retired | |||||||||||||||||
Ninemile Point | 1 | 100% | 1951 | — | Gas/Oil | Retired | 10,517 | 5,028,689 | 33.1 | 166,589 | ||||||||||||
2 | 100% | 1953 | — | Gas/Oil | Retired | |||||||||||||||||
3 | 100% | 1955 | — | Gas/Oil | Retired | 31 | 19,610 | |||||||||||||||
4 | 100% | 1971 | 675 | Gas/Oil | Intermediate | 8 | 6,145 | 1,580,860 | ||||||||||||||
5 | 100% | 1973 | 761 | Gas/Oil | Intermediate | 7 | 5,688 | 1,471,767 | ||||||||||||||
6 | 100% | 2014 | 560 | Gas/Oil | Intermediate | 6,822 | 8 | 177 | 1,531,044 | SCR, Steam Injection | 4,189,984 | 23.8 | 99,833 | |||||||||
Perryville | 1 | 100% | 2002 | 536 | Gas | Intermediate | 7,151 | 7 | 154 | 1,349,230 | Dry LNB, SCR | 3,196,662 | 24.9 | 79,676 | ||||||||
2 | 100% | 2001 | 155 | Gas | Peaking | 9 | 24,408 | Dry LNB | ||||||||||||||
Sterlington | 6 | 100% | 1958 | — | Gas/Oil | Retired | 12,226 | 3,216 | 374.1 | 1,203 | ||||||||||||
7 | 100% | 1974 | 53 | Gas/Oil | Peaking | 9 | 2,223 | |||||||||||||||
Waterford | 1 | 100% | 1975 | 410 | Gas/Oil | Intermediate | 11,159 | 1 | 322 | 210,832 | Low NOx Cell Burner, Combus Mod/Fuel Reburn | 871,906 | 45.7 | 39,887 | ||||||||
2 | 100% | 1975 | 411 | Gas/Oil | Intermediate | 2 | 590 | 341,923 | Low NOx Cell Burner, Combus Mod/Fuel Reburn | |||||||||||||
4 | 100% | 2009 | 33 | Oil | Peaking | 1 | 3 | 3,666 | Steam Injection | |||||||||||||
LA Station 2 | 10 | 100% | 1950 | — | Gas | Reserve | — | — | — | 312 | ||||||||||||
11 | 100% | 1950 | — | Gas | Reserve | |||||||||||||||||
12 | 100% | 1953 | — | Gas | Reserve | |||||||||||||||||
Willow Glen | 1 | 100% | 1960 | — | Gas/Oil | Retired | 10,918 | 117,544 | 85.4 | 10,043 | ||||||||||||
2 | 100% | 1964 | — | Gas/Oil | Reserve | 11 | 12,932 | |||||||||||||||
3 | 100% | 1968 | — | Gas | Retired | ESP | ||||||||||||||||
4 | 100% | 1973 | — | Gas/Oil | Reserve | 130 | 60,849 | |||||||||||||||
5 | 100% | 1976 | — | Gas/Oil | Retired | |||||||||||||||||
Roy S. Nelson | 3 | 100% | 1960 | — | Gas/Oil | Retired | 11,473 | 347,340 | 50.5 | 17,556 | ||||||||||||
4 | 100% | 1970 | 425 | Gas/Oil | Reserve | 1 | 268 | 241,397 | Combus Mod/Fuel Reburn | |||||||||||||
Calcasieu | 1 | 100% | 2000 | 142 | Gas | Peaking | 10,379 | 1 | 151 | 190,518 | Dry LNB | 425,664 | 53.0 | 22,553 | ||||||||
2 | 100% | 2001 | 157 | Gas | Peaking | 51 | 84,306 | Dry LNB | ||||||||||||||
Ouachita | 3 | 100% | 2002 | 250 | Gas | Intermediate | 7,284 | 3 | 65 | 487,760 | Dry LNB, SCR | 1,223,924 | 26.9 | 32,984 | ||||||||
Roy S. Nelson | 6 | 40% | 1982 | 221 | Coal | Base | 12,065 | 3,419 | 1,065 | 1,137,569 | 15 | LNB w/ Sep OFA, ESP, ACI | 893,784 | 38.7 | 34,556 | |||||||
Big Cajun 2 | 3 | 24% | 1983 | 138 | Coal | Base | 11,119 | 2,519 | 459 | 834,107 | 6 | LNB w/ OFA, ESP, ACI | 711,717 | 34.6 | 24,609 | |||||||
River Bend | 1 | 100% | 1986 | 967 | Nuclear BWR(c) | Base | 10,940 | 7,055,069 | 27.6 | 194,597 | ||||||||||||
Waterford | 3 | 100% | 1985 | 1,165 | Nuclear PWR(c) | Base | 10,784 | 10,096,757 | 22.5 | 227,650 | ||||||||||||
Union Power Station | 3 | 100% | 2003 | 510 | Gas | Intermediate | 7,326 | 6 | 93 | 956,555 | Dry LNB, SCR | 4,830,125 | 24.0 | 115,861 | ||||||||
4 | 100% | 2003 | 511 | Gas | Intermediate | 6 | 104 | 1,044,321 | Dry LNB, SCR | |||||||||||||
Total | 9,572 | 6,005 | 20,346 | 14,771,311 | 21 | 45,088,889 | 27.6 | 1,246,457 | ||||||||||||||
(a) Owned and Leased Capability is the dependable load carrying capability as demonstrated under actual operating conditions based on the primary fuel (assuming no curtailments) that each station was designed to utilize. | ||||||||||||||||||||||
(b) Installed NOx and particulate matter emission control devices as stated in the EPA Monitoring Plans and operational: Combustion Modification/ Fuel Reburning (Combus Mod / Fuel Reburn), Dry Low NOx Burners (Dry LNB), Electrostatic Precipitator (ESP), Low NOx Burners with Closed-coupled Overfire Air (LNB w/ Closed-coupled OFA), Low NOx Burners with Separated Overfire Air (LNB w/ Sep OFA), Low NOx Burner with Overfire Air (LNB w/ OFA), Overfire Air (OFA), Selective Catalytic Reduction (SCR) or Steam Injection and Activated Carbon Injection (ACI). Currently have no SO2 or CO2 control equipment operating on any unit. | ||||||||||||||||||||||
(c) BWR = Boiling Water Reactor; PWR = Pressurized Water Reactor. | ||||||||||||||||||||||
(d) The nuclear heat rate as reflected in the FERC Form 1 is calculated by obtaining the thermal generation in MWhs from the plant multiplied by the industry standard of 3.4126 to obtain the MMBtu equivalency | ||||||||||||||||||||||
Totals may not foot due to rounding. | ||||||||||||||||||||||
UTILITY STATISTICAL INFORMATION | ||||||||||
ENTERGY MISSISSIPPI, INC. | ||||||||||
2016 | 2015 | 2014 | 2013 | 2012 | ||||||
ELECTRIC OPERATING REVENUES ($ thousands) | ||||||||||
Residential | 458,547 | 565,514 | 585,371 | 526,618 | 453,707 | |||||
Commercial | 374,426 | 465,517 | 480,754 | 432,240 | 381,346 | |||||
Industrial | 133,951 | 163,651 | 174,615 | 155,742 | 140,460 | |||||
Governmental | 38,265 | 46,537 | 46,863 | 41,967 | 36,289 | |||||
Total Retail | 1,005,189 | 1,241,219 | 1,287,604 | 1,156,567 | 1,011,802 | |||||
Sales for Resale | 31,408 | 85,387 | 166,238 | 116,514 | 46,962 | |||||
Other | 58,052 | 70,379 | 70,351 | 61,459 | 61,601 | |||||
Total Electric Operating Revenues | 1,094,649 | 1,396,985 | 1,524,193 | 1,334,540 | 1,120,366 | |||||
SOURCES OF ENERGY (GWh) | ||||||||||
Net Generation: | ||||||||||
Gas & Oil | 7,852 | 6,232 | 6,113 | 7,240 | 6,305 | |||||
Coal | 1,926 | 1,297 | 2,747 | 2,597 | 2,605 | |||||
Nuclear | — | — | — | — | — | |||||
Hydro | — | — | — | — | — | |||||
Total Net Generation | 9,778 | 7,529 | 8,860 | 9,837 | 8,910 | |||||
Purchased Power: | ||||||||||
Affiliated Companies | 2,150 | 4,812 | 4,114 | 4,818 | 4,415 | |||||
Non-affiliated Companies | 3,353 | 3,470 | 3,780 | 1,428 | 1,393 | |||||
Total Purchased Power | 5,503 | 8,282 | 7,894 | 6,246 | 5,808 | |||||
Total Sources of Energy | 15,281 | 15,811 | 16,754 | 16,083 | 14,718 | |||||
USES OF ENERGY (GWh) | ||||||||||
Electric Energy Sales: | ||||||||||
Residential | 5,617 | 5,661 | 5,672 | 5,629 | 5,550 | |||||
Commercial | 4,894 | 4,913 | 4,821 | 4,815 | 4,915 | |||||
Industrial | 2,493 | 2,283 | 2,297 | 2,265 | 2,400 | |||||
Governmental | 439 | 433 | 414 | 409 | 408 | |||||
Total Retail | 13,443 | 13,290 | 13,204 | 13,118 | 13,273 | |||||
Sales for Resale | 1,021 | 1,679 | 2,850 | 1,847 | 497 | |||||
Unbilled Energy | 57 | (72 | ) | (32 | ) | 19 | 24 | |||
Total Electric Energy Sales | 14,521 | 14,897 | 16,022 | 14,984 | 13,794 | |||||
Line Losses and Company Usage | 760 | 914 | 732 | 1,099 | 924 | |||||
Total Uses of Energy | 15,281 | 15,811 | 16,754 | 16,083 | 14,718 | |||||
AVERAGE ELECTRIC REVENUE (cents/KWh) | ||||||||||
Residential | 8.16 | 9.99 | 10.32 | 9.36 | 8.17 | |||||
Commercial | 7.65 | 9.48 | 9.97 | 8.98 | 7.76 | |||||
Industrial | 5.37 | 7.17 | 7.60 | 6.88 | 5.85 | |||||
Governmental | 8.72 | 10.75 | 11.31 | 10.26 | 8.91 | |||||
NUMBER OF RETAIL ELECTRIC CUSTOMERS | ||||||||||
(as of December 31) | ||||||||||
Residential | 374,119 | 372,194 | 370,265 | 369,686 | 368,660 | |||||
Commercial | 64,274 | 63,890 | 63,306 | 62,867 | 63,083 | |||||
Industrial | 4,028 | 3,959 | 3,847 | 3,752 | 3,598 | |||||
Governmental | 5,055 | 5,009 | 4,962 | 4,864 | 4,419 | |||||
Total Retail Customers | 447,476 | 445,052 | 442,380 | 441,169 | 439,760 | |||||
Totals may not foot due to rounding. | ||||||||||
UTILITY STATISTICAL INFORMATION | |||||||||||||||||||||
ENTERGY MISSISSIPPI, INC. | |||||||||||||||||||||
GENERATION PORTFOLIO | |||||||||||||||||||||
PLANT | TOTAL PLANT – 2016 | ||||||||||||||||||||
OWNED & | AVG BTU | TOTAL | |||||||||||||||||||
LEASED | PER KWH | Emissions | NET | EXPENSES | PRODUCTION | ||||||||||||||||
COMMERCIAL | CAPABILITY | NET | SO2 | NOx | CO2 | Hg | GENERATION | PER NET | EXPENSE | ||||||||||||
PLANT | UNIT | OWNERSHIP | OPERATION | (MW)(a) | FUEL TYPE | PURPOSE | GENERATION | (tons) | (tons) | (tons) | (lbs) | TECHNOLOGY(b) | (MWH) | MWH | ($ thousands) | ||||||
Attala | 1 | 100% | 2001 | 457 | Gas | Intermediate | 7,126 | 6 | 118 | 1,257,874 | — | Dry LNB, SCR | 3,063,102 | 23.8 | 73,037 | ||||||
Hinds | 1 | 100% | 2001 | 454 | Gas | Intermediate | 7,039 | 7 | 120 | 1,342,373 | — | Dry LNB, SCR | 3,272,819 | 23.4 | 76,432 | ||||||
Baxter Wilson | 1 | 100% | 1967 | 547 | Gas/Oil | Peaking | 11,184 | 1 | 67 | 35,862 | — | 630,508 | 63.5 | 40,029 | |||||||
2 | 100% | 1971 | 678 | Gas/Oil | Peaking | 2 | 1,484 | 392,845 | — | Combus Mod/Fuel Reburn | |||||||||||
Delta | 1 | 100% | 1953 | — | Gas/Oil | Retired | — | — | — | — | — | ||||||||||
2 | 100% | 1953 | — | Gas/Oil | Retired | — | |||||||||||||||
Gerald Andrus | 1 | 100% | 1975 | 732 | Gas/Oil | Peaking | 11,520 | 2 | 764 | 439,693 | — | OFA | 641,278 | 47.5 | 30,470 | ||||||
Natchez | 1 | 100% | 1951 | — | Gas/Oil | Retired | — | — | — | — | — | ||||||||||
Rex Brown | 1 | 100% | 1948 | — | Gas | Retired | 11,908 | — | 277,548 | 49.1 | 13,635 | ||||||||||
3 | 100% | 1951 | 24 | Gas/Oil | Peaking | — | 9 | 11,927 | — | ||||||||||||
4 | 100% | 1959 | 202 | Gas/Oil | Peaking | 1 | 557 | 241,933 | — | ||||||||||||
5 | 100% | 1968 | 9 | Oil | Peaking | — | |||||||||||||||
Independence | 1 | 25% | 1983 | 209 | Coal | Base | 10,691 | 2,698 | 1,238 | 985,364 | 12 | OFA, ESP, ACI | 1,930,165 | 29.7 | 57,362 | ||||||
2 | 25% | 1984 | 211 | Coal | Base | 2,944 | 1,228 | 1,073,396 | 18 | OFA, ESP, ACI | |||||||||||
Total | 3,522 | 5,661 | 5,585 | 5,781,267 | 30 | 9,815,419 | 29.6 | 290,965 | |||||||||||||
(a) Owned and Leased Capability is the dependable load carrying capability as demonstrated under actual operating conditions based on the primary fuel (assuming no curtailments) that each station was designed to utilize. | |||||||||||||||||||||
(b) Installed NOx and particulate matter emission control devices as stated in the EPA Monitoring Plan and operational: Combustion Modification/ Fuel Reburning (Combus Mod / Fuel Reburn), Dry Low NOx Burners (Dry LNB), Electrostatic Precipitator (ESP), Low NOx Burners with Closed-coupled Overfire Air (LNB w/ Closed-coupled OFA), Low NOx Burners with Separated Overfire Air (LNB w/ Sep OFA), Low NOx Burner with Overfire Air (LNB w/ OFA), Overfire Air (OFA), Selective Catalytic Reduction (SCR) or Steam Injection and Activated Carbon Injection (ACI). Currently have no SO2, or CO2 control equipment operating on any unit. | |||||||||||||||||||||
Totals may not foot due to rounding. | |||||||||||||||||||||
UTILITY STATISTICAL INFORMATION | ||||||||||
ENTERGY NEW ORLEANS, INC. | ||||||||||
2016 | 2015 | 2014 | 2013 | 2012 | ||||||
ELECTRIC OPERATING REVENUES ($ thousands) | ||||||||||
Residential | 231,274 | 219,788 | 228,913 | 221,007 | 194,628 | |||||
Commercial | 205,846 | 186,272 | 195,900 | 193,391 | 173,453 | |||||
Industrial | 32,787 | 30,523 | 33,022 | 35,178 | 31,607 | |||||
Governmental | 69,126 | 64,634 | 67,761 | 68,273 | 64,341 | |||||
Total Retail | 539,033 | 501,217 | 525,596 | 517,849 | 464,029 | |||||
Sales for Resale | 32,843 | 66,114 | 81,700 | 27,472 | 44,732 | |||||
Other | 14,944 | 16,991 | 17,792 | 19,310 | 14,146 | |||||
Total Electric Operating Revenues | 586,820 | 584,322 | 625,088 | 564,631 | 522,907 | |||||
SOURCES OF ENERGY (GWh) | ||||||||||
Net Generation: | ||||||||||
Gas & Oil | 1,792 | 1,742 | 2,003 | 1,500 | 2,344 | |||||
Coal | — | — | — | — | — | |||||
Nuclear | — | — | — | — | — | |||||
Hydro | — | — | — | — | — | |||||
Total Net Generation | 1,792 | 1,742 | 2,003 | 1,500 | 2,344 | |||||
Purchased Power: | ||||||||||
Affiliated Companies | 3,865 | 4,358 | 3,344 | 3,915 | 3,385 | |||||
Non-affiliated Companies | 1,535 | 1,478 | 1,818 | 926 | 924 | |||||
Total Purchased Power | 5,400 | 5,836 | 5,162 | 4,841 | 4,309 | |||||
Total Sources of Energy | 7,192 | 7,578 | 7,165 | 6,341 | 6,653 | |||||
USES OF ENERGY (GWh) | ||||||||||
Electric Energy Sales: | ||||||||||
Residential | 2,231 | 2,301 | 2,262 | 2,152 | 2,060 | |||||
Commercial | 2,268 | 2,257 | 2,181 | 2,130 | 2,105 | |||||
Industrial | 441 | 463 | 455 | 484 | 487 | |||||
Governmental | 794 | 825 | 783 | 778 | 806 | |||||
Total Retail | 5,734 | 5,846 | 5,681 | 5,544 | 5,458 | |||||
Sales for Resale | 1,212 | 1,655 | 1,397 | 531 | 1,013 | |||||
Unbilled Energy | 3 | 30 | (35 | ) | 28 | (2 | ) | |||
Total Electric Energy Sales | 6,949 | 7,531 | 7,043 | 6,103 | 6,469 | |||||
Line Losses and Company Usage | 243 | 47 | 122 | 238 | 184 | |||||
Total Uses of Energy | 7,192 | 7,578 | 7,165 | 6,341 | 6,653 | |||||
AVERAGE ELECTRIC REVENUE (cents/KWh) | ||||||||||
Residential | 10.37 | 9.55 | 10.12 | 10.27 | 9.45 | |||||
Commercial | 9.08 | 8.25 | 8.98 | 9.08 | 8.24 | |||||
Industrial | 7.43 | 6.59 | 7.26 | 7.27 | 6.49 | |||||
Governmental | 8.71 | 7.83 | 8.65 | 8.78 | 7.98 | |||||
NUMBER OF RETAIL ELECTRIC CUSTOMERS | ||||||||||
(as of December 31) | ||||||||||
Residential | 177,993 | 176,223 | 173,067 | 170,202 | 167,207 | |||||
Commercial | 16,425 | 16,356 | 16,080 | 15,854 | 15,591 | |||||
Industrial | 2,117 | 2,246 | 2,206 | 2,255 | 2,205 | |||||
Governmental | 1,860 | 1,886 | 1,888 | 1,827 | 1,845 | |||||
Total Retail Customers | 198,395 | 196,711 | 193,241 | 190,138 | 186,848 | |||||
Totals may not foot due to rounding. | ||||||||||
On Sept. 1, 2015, ELL transferred its Algiers assets to ENOI. The effect of the Algiers transfer has been retrospectively applied to ENOI's data presented above. | ||||||||||
UTILITY STATISTICAL INFORMATION | |||||||||||||||||||
ENTERGY NEW ORLEANS, INC. | |||||||||||||||||||
GENERATION PORTFOLIO | |||||||||||||||||||
PLANT | TOTAL PLANT – 2016 | ||||||||||||||||||
OWNED & | AVG BTU | TOTAL | |||||||||||||||||
LEASED | PER KWH | Emissions | NET | EXPENSES | PRODUCTION | ||||||||||||||
COMMERCIAL | CAPABILITY | NET | SO2 | NOx | CO2 | Hg | GENERATION | PER NET | EXPENSE | ||||||||||
PLANT | UNIT | OWNERSHIP | OPERATION | (MW)(a) | FUEL TYPE | PURPOSE | GENERATION | (tons) | (tons) | (tons) | (lbs) | TECHNOLOGY(b) | (MWH) | MWH | ($ thousands) | ||||
Michoud | 1 | 100% | 1957 | — | Gas/Oil | Retired | 11,499 | ||||||||||||
2 | 100% | 1963 | — | Gas/Oil | Retired | 24 | 11,828 | — | |||||||||||
3 | 100% | 1967 | — | Gas/Oil | Retired | 4 | 4,142 | — | Combus Mod/Fuel Reburn | ||||||||||
Union Power Station | 1 | 100% | 2003 | 512 | Gas | Intermediate | 6,925 | 4 | 78 | 760,640 | Dry LNB, SCR | 1,775,833 | 28.0 | 49,735 | |||||
Total | 512 | 4 | 106 | 776,610 | 1,775,833 | 28.0 | 49,735 | ||||||||||||
(a) Owned and Leased Capability is the dependable load carrying capability as demonstrated under actual operating conditions based on the primary fuel (assuming no curtailments) that each station was designed to utilize. | |||||||||||||||||||
(b) Installed NOx and particulate matter emission control devices as stated in the EPA Monitoring Plan and operational: Combustion Modification/ Fuel Reburning (Combus Mod / Fuel Reburn), Dry Low NOx Burners (Dry LNB), Electrostatic Precipitator (ESP), Low NOx Burners with Closed-coupled Overfire Air (LNB w/ Closed-coupled OFA), Low NOx Burners with Separated Overfire Air (LNB w/ Sep OFA), Low NOx Burner with Overfire Air (LNB w/ OFA), Overfire Air (OFA), Selective Catalytic Reduction (SCR) or Steam Injection and Activated Carbon Injection (ACI). Currently have no SO2, or CO2 control equipment operating on any unit. | |||||||||||||||||||
Totals may not foot due to rounding. | |||||||||||||||||||
SYSTEM ENERGY RESOURCES, INC. | |||||||||||||
2016 | 2015 | 2014 | 2013 | 2012 | |||||||||
ELECTRIC OPERATING REVENUES ($ thousands) | 548,291 | 632,405 | 664,364 | 735,089 | 622,118 | ||||||||
SOURCES OF ENERGY (GWh) | |||||||||||||
Net Generation: | |||||||||||||
Gas & Oil | — | — | — | — | |||||||||
Coal | — | — | — | — | |||||||||
Nuclear | 5,299 | 10,543 | 9,199 | 9,775 | 6,562 | ||||||||
Hydro | — | — | — | — | |||||||||
Total Net Generation | 5,299 | 10,543 | 9,199 | 9,775 | 6,562 | ||||||||
Purchased Power | — | — | — | — | |||||||||
Total Sources of Energy | 5,299 | 10,543 | 9,199 | 9,775 | 6,562 | ||||||||
USES OF ENERGY (GWh) | |||||||||||||
Electric Energy Sales | 5,384 | 10,547 | 9,219 | 9,794 | 6,602 | ||||||||
Unbilled Energy | — | — | — | — | — | ||||||||
Line Losses and Company Usage | (85 | ) | (4 | ) | (20 | ) | (19 | ) | (40 | ) | |||
Total Uses of Energy | 5,299 | 10,543 | 9,199 | 9,775 | 6,562 | ||||||||
Totals may not foot due to rounding. | |||||||||||||
SYSTEM ENERGY RESOURCES, INC. | |||||||||||||||||
GENERATION PORTFOLIO | |||||||||||||||||
PLANT | TOTAL PLANT – 2016 | ||||||||||||||||
OWNED & | AVG BTU | TOTAL | |||||||||||||||
LEASED | PER KWH | Emissions | NET | EXPENSES | PRODUCTION | ||||||||||||
COMMERCIAL | CAPABILITY | NET | SO2 | NOx | CO2 | Hg | GENERATION | PER NET | EXPENSE | ||||||||
PLANT | UNIT | OWNERSHIP | OPERATION | (MW)(a) | FUEL TYPE | PURPOSE | GENERATION(c) | (tons) | (tons) | (tons) | (lbs) | TECHNOLOGY | (MWH) | MWH | ($ thousands) | ||
Grand Gulf | 1 | 90% | 1985 | 1,272 | Nuclear BWR(b) | Base | 10,671 | — | — | — | — | 5,383,561 | 29.9 | 160,760 | |||
Total | 1,272 | 5,383,561 | 29.9 | 160,760 | |||||||||||||
(a) Owned and Leased Capability is the dependable load carrying capability as demonstrated under actual operating conditions based on the primary fuel (assuming no curtailments) that each station was designed to utilize. Reflects estimate of the rerate for recovered performance (~ 55 MW) and uprate (~ 178 MW) completed in 2012. Approved Summer 2013 rating is 1,409 MW. | |||||||||||||||||
(b) BWR = Boiling Water Reactor. | |||||||||||||||||
(c) The nuclear heat rate as reflected in the FERC Form 1 is calculated by obtaining the thermal generation in MWhs from the plant multiplied by the industry standard of 3.4126 to obtain the MMBtu equivalency | |||||||||||||||||
Totals may not foot due to rounding. | |||||||||||||||||
UTILITY STATISTICAL INFORMATION | ||||||||||
ENTERGY TEXAS, INC. | ||||||||||
2016 | 2015 | 2014 | 2013 | 2012 | ||||||
ELECTRIC OPERATING REVENUES ($ thousands) | ||||||||||
Residential | 612,660 | 632,667 | 654,064 | 596,396 | 553,107 | |||||
Commercial | 356,057 | 369,155 | 383,662 | 327,299 | 325,342 | |||||
Industrial | 364,614 | 372,217 | 421,913 | 324,767 | 299,441 | |||||
Governmental | 24,373 | 25,356 | 26,266 | 23,535 | 22,940 | |||||
Total Retail | 1,357,704 | 1,399,395 | 1,485,905 | 1,271,997 | 1,200,830 | |||||
Sales for Resale | 218,007 | 273,469 | 338,976 | 416,285 | 348,783 | |||||
Other | 39,908 | 34,339 | 27,101 | 40,517 | 31,883 | |||||
Total Electric Operating Revenues | 1,615,619 | 1,707,203 | 1,851,982 | 1,728,799 | 1,581,496 | |||||
SOURCES OF ENERGY (GWh) | ||||||||||
Net Generation: | ||||||||||
Gas & Oil | 7,795 | 7,539 | 6,113 | 5,551 | 5,170 | |||||
Coal | 1,182 | 1,081 | 1,475 | 1,483 | 1,503 | |||||
Nuclear | — | — | — | — | — | |||||
Hydro | — | — | — | — | — | |||||
Total Net Generation | 8,977 | 8,620 | 7,588 | 7,034 | 6,673 | |||||
Purchased Power: | ||||||||||
Affiliated Companies | 6,048 | 6,235 | 5,859 | 5,538 | 5,754 | |||||
Non-affiliated Companies | 9,363 | 9,751 | 9,750 | 12,381 | 11,423 | |||||
Total Purchased Power | 15,411 | 15,986 | 15,609 | 17,919 | 17,177 | |||||
Total Sources of Energy | 24,388 | 24,607 | 23,197 | 24,953 | 23,850 | |||||
USES OF ENERGY (GWh) | ||||||||||
Electric Energy Sales: | ||||||||||
Residential | 5,836 | 5,889 | 5,810 | 5,726 | 5,604 | |||||
Commercial | 4,570 | 4,548 | 4,471 | 4,402 | 4,396 | |||||
Industrial | 7,493 | 7,036 | 7,140 | 6,404 | 6,066 | |||||
Governmental | 283 | 276 | 277 | 282 | 278 | |||||
Total Retail | 18,182 | 17,749 | 17,698 | 16,814 | 16,344 | |||||
Sales for Resale | 5,711 | 6,107 | 4,963 | 6,999 | 6,530 | |||||
Unbilled Energy | (16 | ) | 55 | (123 | ) | 115 | (64 | ) | ||
Total Electric Energy Sales | 23,877 | 23,911 | 22,538 | 23,928 | 22,810 | |||||
Line Losses and Company Usage | 511 | 696 | 659 | 1,025 | 1,040 | |||||
Total Uses of Energy | 24,388 | 24,607 | 23,197 | 24,953 | 23,850 | |||||
AVERAGE ELECTRIC REVENUE (cents/KWh) | ||||||||||
Residential | 10.50 | 10.74 | 11.26 | 10.42 | 9.87 | |||||
Commercial | 7.79 | 8.12 | 8.58 | 7.44 | 7.40 | |||||
Industrial | 4.87 | 5.29 | 5.91 | 5.07 | 4.94 | |||||
Governmental | 8.61 | 9.19 | 9.48 | 8.35 | 8.25 | |||||
NUMBER OF RETAIL ELECTRIC CUSTOMERS | ||||||||||
(as of December 31) | ||||||||||
Residential | 388,143 | 379,838 | 373,436 | 368,347 | 364,997 | |||||
Commercial | 48,276 | 47,003 | 46,371 | 45,825 | 45,247 | |||||
Industrial | 5,417 | 5,435 | 5,415 | 5,143 | 4,932 | |||||
Governmental | 2,162 | 2,377 | 2,334 | 2,310 | 2,271 | |||||
Total Retail Customers | 443,998 | 434,653 | 427,556 | 421,625 | 417,447 | |||||
Totals may not foot due to rounding. | ||||||||||
UTILITY STATISTICAL INFORMATION | ||||||||||||||||||
ENTERGY TEXAS, INC. | ||||||||||||||||||
GENERATION PORTFOLIO | ||||||||||||||||||
PLANT | TOTAL PLANT – 2016 | |||||||||||||||||
OWNED & | AVG BTU | TOTAL | ||||||||||||||||
LEASED | PER KWH | Emissions | NET | EXPENSES | PRODUCTION | |||||||||||||
COMMERCIAL | CAPABILITY | NET | SO2 | NOx | CO2 | Hg | GENERATION | PER NET | EXPENSE | |||||||||
PLANT | UNIT | OWNERSHIP | OPERATION | (MW)(a) | FUEL TYPE | PURPOSE | GENERATION | (tons) | (tons) | (tons) | (lbs) | TECHNOLOGY(b) | (MWH) | MWH | ($ thousands) | |||
Roy S. Nelson | 6 | 30% | 1982 | 164 | Coal | Base | 12,065 | 2,527 | 787 | 840,812 | 4 | LNB w/ Dep OFA, ESP, ACI | 660,627 | 39.0 | 25,788 | |||
Big Cajun 2 | 3 | 18% | 1983 | 101 | Coal | Base | 11,118 | 1,862 | 339 | 616,514 | 4 | LNB w/ OFA, ESP, ACI | 526,055 | 34.5 | 18,165 | |||
Lewis Creek | 1 | 100% | 1970 | 250 | Gas/Oil | Intermediate | 10,616 | 4 | 123 | 621,705 | SCR | 2,365,136 | 31.2 | 73,908 | ||||
2 | 100% | 1971 | 250 | Gas/Oil | Intermediate | 2 | 169 | 793,729 | SCR | |||||||||
Sabine | 1 | 100% | 1962 | 212 | Gas/Oil | Intermediate | 11,095 | 2 | 672 | 435,160 | 5,466,869 | 33.9 | 185,379 | |||||
2 | 100% | 1962 | — | Gas/Oil | Retired | — | 46 | 40,071 | Combus Mod/Fuel Reburn | |||||||||
3 | 100% | 1966 | 387 | Gas/Oil | Intermediate | 4 | 577 | 779,689 | LNB w/ Sep OFA | |||||||||
4 | 100% | 1974 | 459 | Gas | Intermediate | 6 | 1,381 | 1,244,678 | Combus Mod/Fuel Reburn | |||||||||
5 | 100% | 1979 | 449 | Gas/Oil | Intermediate | 5 | 727 | 922,914 | LNB w/ Closed-coupled OFA | |||||||||
Total | 2,272 | 4,412 | 4,821 | 6,295,272 | 8 | 9,018,687 | 33.6 | 303,241 | ||||||||||
(a) Owned and Leased Capability is the dependable load carrying capability as demonstrated under actual operating conditions based on the primary fuel (assuming no curtailments) that each station was designed to utilize. | ||||||||||||||||||
(b) Installed NOx and particulate matter emission control devices as stated in the EPA Monitoring Plan and operational: Combustion Modification/ Fuel Reburning (Combus Mod / Fuel Reburn), Dry Low NOx Burners (Dry LNB), Electrostatic Precipitator (ESP), Low NOx Burners with Closed-coupled Overfire Air (LNB w/ Closed-coupled OFA), Low NOx Burners with Separated Overfire Air (LNB w/ Sep OFA), Low NOx Burner with Overfire Air (LNB w/ OFA), Overfire Air (OFA), Selective Catalytic Reduction (SCR) or Steam Injection and Activated Carbon Injection (ACI). Currently have no SO2, or CO2 control equipment operating on any unit. | ||||||||||||||||||
Totals may not foot due to rounding. | ||||||||||||||||||
UTILITY STATISTICAL INFORMATION | ||||||||||
UTILITY NUCLEAR PLANT STATISTICS | ||||||||||
The following table shows plant performance for 2012 – 2016 based on 18/24 month operating cycle. | ||||||||||
CAPABILITY FACTOR (%) | 2016 | 2015 | 2014 | 2013 | 2012 | |||||
ANO | 82.8 | 90.8 | 89.8 | 79.5 | 93.7 | |||||
Grand Gulf | 71.3 | 88.6 | 84.4 | 74.6 | 77.3 | |||||
River Bend | 83.0 | 89.2 | 92.6 | 90.0 | 90.3 | |||||
Waterford 3 | 87.9 | 88.0 | 92.9 | 80.7 | 85.6 | |||||
Entergy Southeast Average | 81.5 | 89.5 | 89.9 | 80.8 | 88.1 | |||||
Industry Average | 92.7 | 92.0 | 90.4 | 89.1 | 86.8 | |||||
The following table shows plant performance for 2016 and averages for four three-year periods. | ||||||||||
PRODUCTION COST ($/MWh) (a) | 2016 | 2013-2015 | 2012-2014 | 2011-2013 | 2010–2012 | |||||
ANO | 27.0 | 24.8 | 23.2 | 22.4 | 20.6 | |||||
Grand Gulf | 30.2 | 23.9 | 26.2 | 24.9 | 23.1 | |||||
River Bend | 27.5 | 27.2 | 26.0 | 25.7 | 24.6 | |||||
Waterford 3 | 22.6 | 25.7 | 25.1 | 24.0 | 22.2 | |||||
Entergy Southeast Average | 26.4 | 25.2 | 24.9 | 24.0 | 22.3 | |||||
(a) Fuel and non-fuel operation and maintenance expenses according to accounting standards that directly relate to the production of electricity per MWh; excludes special items. | ||||||||||
INDIVIDUAL PLANT INFORMATION | ||||||||||
ANO | GRAND GULF | RIVER BEND | WATERFORD 3 | |||||||
UNIT 1 | UNIT 2 | |||||||||
Owner | Entergy Arkansas | Entergy Arkansas | System Energy - 90% Cooperative Energy - 10% | Entergy Louisiana | Entergy Louisiana | |||||
Commercial Operation Date | December 74 | March 80 | July 85 | June 86 | September 85 | |||||
License Expiration Date | 5/20/34 | 7/17/38 | 11/1/44 | 8/29/25 | 12/18/24 | |||||
Architect/Engineer | Bechtel Power | Bechtel Power | Bechtel Power | Stone & Webster | Ebasco | |||||
Reactor Manufacturer | Babcox & Wilcox | Combustion Engineering | General Electric | General Electric | Combustion Engineering | |||||
Reactor Type | PWR | PWR | BWR | BWR | PWR | |||||
Turbine Generator Manufacturer | Westinghouse | General Electric | Kraftwerk Union | General Electric | Westinghouse | |||||
Owned and Leased Capability (MW)(a) | 833 | 985 | 1,272 | 967 | 1,165 | |||||
Refueling Data: | ||||||||||
Last Date | 9/24/16 – | 3/29/17 – | 2/19/16 – | 1/28/17 – | 4/15/17 – | |||||
12/14/16 | TBD (d) | 3/28/16 | 3/13/17 | 6/2/17 | ||||||
Number of Days | 82 | TBD (d) | 39 | 44 | 48 | |||||
Next Scheduled Refueling | Spring 18 | Fall 18 | Spring 18 | Spring 19 | Spring 19 | |||||
2016 Capability Factor (%) | 84.0 | 81.5 | 71.3 | 83.0 | 87.9 | |||||
($ in millions as of December 31, 2016) | ||||||||||
Net Book Value | 1,369(b) | 1,758 | 1,418(c) | 2,207 | ||||||
Decommissioning Trust Fair Values | 835(b) | 780 | 713(c) | 428 | ||||||
Decommissioning Liability | 912(b) | 854 | 485(c) | 566 | ||||||
(a) Owned and Leased Capability is the dependable load carrying capability as demonstrated under actual operating conditions based on the primary fuel (assuming no curtailments) that each station was designed to utilize. | ||||||||||
(b) ANO Units 1 and 2 are reported together. | ||||||||||
(c) 30% of River Bend is not subject to rate regulation by the Public Utility Commission of Texas, the Louisiana Public Service Commission, nor various municipal authorities, and is included in non-utility property on the balance sheet. The decommissioning trust fund balance and decommissioning liability include amounts for the 30% not subject to rate regulation. | ||||||||||
(d) As of 5/31/17, ANO Units 2 outage was still in process. | ||||||||||
UTILITY REGULATORY INFORMATION | |||||
STATE REGULATORY COMMISSIONS | |||||
ARKANSAS | LOUISIANA | MISSISSIPPI | NEW ORLEANS | TEXAS | |
Commission | Arkansas Public | Louisiana | Mississippi | New Orleans | Public Utility |
Service | Public Service | Public Service | City Council | Commission | |
Commission | Commission | Commission | of Texas | ||
Number of Commissioners | 3 | 5 | 3 | 7 | 3 |
Method of Selection | Appointed by | Elected | Elected | Elected | Appointed by |
Governor | Governor | ||||
Term of Office | 6 years – | 6 years – | 4 years – | 4 years – | 6 years – |
staggered | staggered | concurrent | concurrent | staggered | |
(2 term limit) | |||||
Chair/President | Appointed by | Selected by | Rotates every | Rotates annually | Appointed by |
Governor | peers – 1 year | 1 - 2 years, as | from the | Governor | |
term | determined by members | at-large positions | |||
COMMISSION/COUNCIL MEMBERS | |||||
CURRENT | |||||
PARTY | SERVICE BEGAN | TERM ENDS | |||
ARKANSAS | |||||
Ted J. Thomas – Chairperson | Republican | 1/15 | 1/21 | ||
Kimberly A. O'Guinn | Republican | 1/17 | 1/23 | ||
Elana C. Wills | Nonpartisan | 1/11 | 1/19 | ||
LOUISIANA | |||||
Eric Skrmetta - Chairperson | Republican | 1/09 | 12/20 | ||
Damon J. Baldone | Democrat | 6/17 | 12/17 | ||
Lambert C. Boissiere, III | Democrat | 1/05 | 12/22 | ||
Foster L. Campbell, Jr. | Democrat | 1/03 | 12/22 | ||
Mike Francis | Republican | 11/16 | 12/22 | ||
MISSISSIPPI | |||||
Brandon Presley – Chairperson | Democrat | 1/08 | 12/19 | ||
Cecil Brown – Vice-Chairperson | Democrat | 1/16 | 12/19 | ||
Sam Britton | Republican | 1/16 | 12/19 | ||
NEW ORLEANS | |||||
Jason Rogers Williams - Chairperson of Utility Committee | Democrat | 5/14 | 5/18 | ||
Jared Brossett | Democrat | 5/14 | 5/18 | ||
LaToya Cantrell | Democrat | 12/12 | 5/18 | ||
James Gray II | Democrat | 12/12 | 5/18 | ||
Susan Guidry | Democrat | 5/10 | 5/18 | ||
Stacy Head | Democrat | 5/06 | 5/18 | ||
Nadine Ramsey | Democrat | 5/14 | 5/18 | ||
TEXAS | |||||
Kenneth W. Anderson Jr. | Republican | 9/08 | 8/17 | ||
Brandy Marty Marquez | Republican | 8/13 | 9/19 | ||
Vacant | N/A | N/A | N/A | ||
As of 6/1/2017 | |||||
ENTERGY WHOLESALE COMMODITIES | ||||||||||||||||||||||
EWC QUARTERLY FINANCIAL METRICS ($ millions) | ||||||||||||||||||||||
2016 | 2015 | FY | ||||||||||||||||||||
1Q | 2Q | 3Q | 4Q | FY | 1Q | 2Q | 3Q | 4Q | FY | CHANGE | ||||||||||||
GAAP MEASURES | ||||||||||||||||||||||
As-Reported Earnings | 79.0 | 250.3 | 7.7 | (1,832.3 | ) | (1,495.3 | ) | 122.9 | (4.1 | ) | (1,032.0 | ) | (154.7 | ) | (1,067.8 | ) | (427.5 | ) | ||||
NON-GAAP MEASURES | ||||||||||||||||||||||
Operational Adjusted EBITDA | 219 | 58 | 135 | 68 | 480 | 254 | 62 | 129 | 70 | 515 | (35 | ) | ||||||||||
Operational Earnings | 91.9 | 240.7 | 35.2 | (7.7 | ) | 360.0 | 127.5 | (3.0 | ) | 31.7 | 28.3 | 184.6 | 175.4 | |||||||||
EWC ANNUAL FINANCIAL METRICS ($ millions) | ||||||||||||||||
2016 | 2015 | 2014 | 2013 | 2012 | ||||||||||||
GAAP MEASURES | ||||||||||||||||
As-Reported Earnings | (1,495.3 | ) | (1,067.8 | ) | 292.3 | 42.9 | 40.4 | |||||||||
NON-GAAP MEASURES | ||||||||||||||||
Operational Adjusted EBITDA | 480 | 515 | 950 | 553 | 618 | |||||||||||
Operational Earnings | 360.0 | 184.6 | 394.1 | 262.7 | 263.9 | |||||||||||
EWC QUARTERLY OPERATIONAL METRICS | |||||||||||||||||||||||||||||||
2016 | 2015 | FY | |||||||||||||||||||||||||||||
1Q | 2Q | 3Q | 4Q | FY | 1Q | 2Q | 3Q | 4Q | FY | % CHANGE | |||||||||||||||||||||
Owned Capacity (MW) (a) | 4,880 | 4,880 | 4,880 | 4,800 | 4,800 | 5,463 | 5,463 | 5,463 | 4,880 | 4,880 | (2)% | ||||||||||||||||||||
GWh billed | 9,246 | 7,866 | 9,372 | 9,397 | 35,881 | 9,592 | 9,578 | 10,440 | 10,135 | 39,745 | (10)% | ||||||||||||||||||||
As-reported net revenue ($ millions) | 466 | 293 | 396 | 387 | 1,542 | 527 | 350 | 410 | 379 | 1,666 | (7)% | ||||||||||||||||||||
Operational net revenue ($ millions) | 466 | 293 | 388 | 354 | 1,501 | 527 | 350 | 410 | 379 | 1,666 | (10)% | ||||||||||||||||||||
EWC Nuclear | |||||||||||||||||||||||||||||||
Capacity Factor | 90% | 76% | 90% | 91% | 87% | 90% | 89% | 92% | 94% | 91% | (4)% | ||||||||||||||||||||
GWh billed | 8,688 | 7,308 | 8,674 | 8,881 | 33,551 | 8,618 | 8,555 | 9,125 | 9,561 | 35,859 | (6)% | ||||||||||||||||||||
Production cost per MWh (b) | $ | 21.91 | $ | 23.06 | $ | 23.77 | $ | 23.00 | $ | 22.93 | $ | 25.61 | $ | 26.21 | $ | 26.90 | $ | 22.63 | $ | 25.30 | (9)% | ||||||||||
As-reported net revenue ($ millions) | 464 | 290 | 396 | 382 | 1,533 | 511 | 336 | 395 | 371 | 1,613 | (5)% | ||||||||||||||||||||
Operational net revenue ($ millions) | 464 | 290 | 388 | 349 | 1,492 | 511 | 336 | 395 | 371 | 1,613 | (8)% | ||||||||||||||||||||
Totals may not foot due to rounding. | |||||||||||||||||||||||||||||||
(a) Rhode Island State Energy Center (583 MW) was sold in December 2015 and investment in wind generation (80 MW) was sold in November 2016. | |||||||||||||||||||||||||||||||
(b) Fuel and non-fuel O&M expenses according to accounting standards that directly relate to the production of electricity per MWh (based on net generation), excluding special items. | |||||||||||||||||||||||||||||||
EWC ANNUAL OPERATIONAL METRICS | |||||||||||||||||||||
2016 | 2015 | 2014 | 2013 | 2012 | |||||||||||||||||
Owned Capacity (MW) (a) | 4,800 | 4,880 | 6,068 | 6,068 | 6,612 | ||||||||||||||||
GWh billed | 35,881 | 39,745 | 44,424 | 45,127 | 46,178 | ||||||||||||||||
As-reported net revenue ($ millions) | 1,542 | 1,666 | 2,224 | 1,802 | 1,854 | ||||||||||||||||
Operational net revenue ($ millions) | 1,501 | 1,666 | 2,224 | 1,802 | 1,854 | ||||||||||||||||
EWC Nuclear | |||||||||||||||||||||
Capacity Factor | 87% | 91% | 91% | 89% | 89% | ||||||||||||||||
GWh billed | 33,551 | 35,859 | 40,253 | 40,167 | 41,042 | ||||||||||||||||
Production cost per MWh (b) | $ | 22.93 | $ | 25.30 | $ | 26.44 | $ | 26.35 | $ | 26.19 | |||||||||||
As-reported net revenue ($ millions) | 1,533 | 1,613 | 2,166 | 1,737 | 1,957 | ||||||||||||||||
Operational net revenue ($ millions) | 1,492 | 1,613 | 2,166 | 1,737 | 1,957 | ||||||||||||||||
Totals may not foot due to rounding. | |||||||||||||||||||||
(a) Vermont Yankee (605 MW) ceased power production on 12/29/14, RISEC (583 MW) was sold in December 2015 and investment in wind generation (80 MW) was sold in November 2016. | |||||||||||||||||||||
(b) Fuel and non-fuel O&M expenses according to accounting standards that directly relate to the production of electricity per MWh (based on net generation), excluding special items. | |||||||||||||||||||||
EWC TOTAL CAPACITY | ||||||||||||
OPERATED (a) | OWNED CAPACITY | |||||||||||
As of December 31, 2016 | PLANTS | UNITS | MW | MW | % | |||||||
Gas/Oil | — | — | — | 213 | 4 | |||||||
Coal | — | — | — | 181 | 4 | |||||||
Total Fossil | — | — | — | 394 | 8 | |||||||
Nuclear (b) | 5 | 6 | 5,206 | 4,406 | 92 | |||||||
Total Capacity | 5 | 6 | 5,206 | 4,800 | 100 | |||||||
(a) Operated capacity includes management services contracts and excludes units operated by Entergy’s utility companies. | ||||||||||||
(b) Includes FitzPatrick, which was sold on 3/31/17. | ||||||||||||
ENTERGY WHOLESALE COMMODITIES | |||||||||||
EWC NUCLEAR PLANT STATISTICS | |||||||||||
PILGRIM | |||||||||||
INDIAN POINT | PALISADES | NUCLEAR | |||||||||
ENERGY CENTER | NUCLEAR | POWER | |||||||||
UNIT 2 | UNIT 3 | PLANT | STATION (a) | ||||||||
Entergy Purchase Date | 9/6/01 | 11/21/00 | 4/11/07 | 7/13/99 | |||||||
Commercial Operation Date | August 74 | August 76 | December 71 | December 72 | |||||||
License Expiration Date | 9/28/13 (b) | 12/12/15 (b) | 3/24/31 | 6/8/32 | |||||||
Architect/Engineer | United Engineers & Constructors | United Engineers & Constructors | Combustion Engineering | Bechtel Power | |||||||
Reactor Manufacturer | Westinghouse | Westinghouse | Combustion Engineering | General Electric | |||||||
Reactor Type | PWR | PWR | PWR | BWR | |||||||
Turbine Generator Manufacturer | General Electric | Westinghouse | Westinghouse | General Electric | |||||||
Net MWs in Operation (MW) | 1,028 | 1,041 | 811 | 688 | |||||||
Refueling Data: | |||||||||||
Last Date | 3/7/16 – | 3/13/17 – | 4/23/17 – | 4/9/17 – | |||||||
6/16/16 | 5/18/17 | 5/20/17 | 5/22/17 | ||||||||
Number of Days | 102 | 66 | 27 | 43 | |||||||
Next Scheduled Refueling | Spring 18 | Spring 19 | |||||||||
2016 Capacity Factor | 67% | 99% | 99% | 91% | |||||||
Net Book Value of Plant and Related Assets | 214 | 215 | 201 | 72 | |||||||
($ in millions as of December 31, 2016) | |||||||||||
Capacity Zone (ICAP/UCAP) | NYISO Lower Hudson Valley | NYISO Lower Hudson Valley | MISO | NEPOOL | |||||||
Nearest Market Hub | Zone G (c) | Zone G (c) | Indiana | Mass Hub | |||||||
(a) Shutdown of Pilgrim is planned for 5/31/19. | |||||||||||
(b) Indian Point Unit 2 began operating under timely renewal on 9/28/13; Unit 3 began operating under timely renewal on 12/13/15. | |||||||||||
(c) Indian Point physically located in NYISO Zone H. | |||||||||||
EWC NUCLEAR PLANT ADDITIONAL INFORMATION | |||||||||||
PALISADES | PILGRIM | ||||||||||
INDIAN POINT | NUCLEAR | NUCLEAR | VERMONT | ||||||||
UNIT 1 | UNIT 2 | UNIT 3 | PLANT | STATION | YANKEE | ||||||
Decommissioning Trust Asset | 443 | 564 | 785 | 412 | 960 | 584 (a) | |||||
Decommissioning Liability | 208 | 653 | 641 | 538 (b) | 602 | 471 | |||||
($ in millions as of December 31, 2016) | |||||||||||
Planned closing date | n/a (c) | 4/30/20 | 4/30/21 | 10/1/18 | 5/31/19 | n/a (d) | |||||
(a) Vermont Yankee trust asset includes site restoration trust fund. | |||||||||||
(b) Includes $38 million for Big Rock Point. | |||||||||||
(c) Indian Point 1 has been shut down and in safe storage since the 1970s. | |||||||||||
(d) Vermont Yankee plant ceased power production on 12/29/14. | |||||||||||
EWC NON-NUCLEAR WHOLESALE ASSETS PLANT STATISTICS | |||||||||||
NERC | COMMERCIAL | OWNERSHIP | NET | TOTAL | FUEL TYPE | ||||||
PLANT | REGION | OPERATION | INTEREST | MW | MW | TECHNOLOGY | |||||
Independence – Unit 2 | SERC | 1983 | 14% | 121 | 842 | Coal | |||||
Nelson 6 | SERC | 1982 | 11% | 60 | 550 | Coal | |||||
RS Cogen | SERC | 2002 | 50% | 213 | 425 | CCGT Cogen | |||||
Total | 394 | 1,817 | |||||||||
EWC NON-NUCLEAR WHOLESALE ASSETS PLANT EMISSIONS | |||||||||||
Emissions | |||||||||||
PLANT | PURPOSE | SO2 (tons) | NOx (tons) | Co2 (tons) | Hg (lbs) | TECHNOLOGY (a) | |||||
Independence – Unit 2 | Base | 1,693 | 706 | 616,988 | 10 | OFA, ESP, ACI | |||||
Nelson 6 | Base | 885 | 288 | 308,062 | 4 | LNB w Sep OFA, ESP, ACI | |||||
RS Cogen | Base | 5 | 402 | 909,345 | — | Dry LNB/SCR | |||||
(a) Installed NOx and particulate matter emission control devices as stated in the EPA Monitoring Plans and operational: Overfire Air (OFA), Electrostatic Precipitator (ESP), Activated Carbon Injection (ACI), Low NOx Burners with Separated Overfire Air (LNB w/ Sep OFA), Dry Low NOx Burners (Dry LNB), and Selective Catalytic Reduction (SCR) or Steam Injection. Currently have no SO2 or CO2 control equipment operating on any unit. | |||||||||||
Totals may not foot due to rounding. | |||||||||||
ENTERGY WHOLESALE COMMODITIES | |||||||||||||||||
EWC NUCLEAR SECURITIES DETAIL | |||||||||||||||||
LONG-TERM DEBT: | |||||||||||||||||
NOTE TO NEW YORK POWER AUTHORITY (NYPA) RELATING TO THE PURCHASE OF FITZPATRICK AND INDIAN POINT 3 | |||||||||||||||||
ADDITIONAL LTD | TOTAL ENDING | TOTAL | |||||||||||||||
INTEREST | RELATED TO | INTEREST | LONG-TERM | INTEREST | |||||||||||||
($ thousands) | LONG-TERM DEBT(a) | EXPENSE | PURCHASE OF IP2 | EXPENSE | DEBT | EXPENSE | |||||||||||
2010 | 137,026 | 7,255 | 18,945 | 1,173 | 155,971 | 8,428 | |||||||||||
2011 | 123,669 | 6,643 | 9,694 | 750 | 133,363 | 7,393 | |||||||||||
2012 | 109,681 | 6,012 | — | 305 | 109,681 | 6,317 | |||||||||||
2013 | 95,011 | 5,331 | — | — | 95,011 | 5,331 | |||||||||||
2014 | 79,638 | 4,627 | — | — | 79,638 | 4,627 | |||||||||||
2015 | 29,262 | 2,972 | — | — | 29,262 | 2,972 | |||||||||||
2016 | — | 887 | — | — | — | 887 | |||||||||||
In August 2016, Entergy entered into a trust transfer agreement with NYPA to transfer the decommissioning trust funds and decommissioning liabilities for the Indian Point 3 | |||||||||||||||||
and FitzPatrick plants to Entergy. As part of the trust transfer agreement, the original decommissioning agreements were amended, and the Entergy subsidiaries' obligation | |||||||||||||||||
to make additional license extension payments to NYPA was eliminated. | |||||||||||||||||
Totals may not foot due to rounding. | |||||||||||||||||
EWC NON-NUCLEAR WHOLESALE ASSETS | |||||||||||||||||
EWC NON-NUCLEAR WHOLESALE ASSETS SECURITIES DETAIL | |||||||||||||||||
DEBT: | |||||||||||||||||
OUTSTANDING AS OF DECEMBER 31, | |||||||||||||||||
ENTERGY’S SHARE | |||||||||||||||||
($ millions) | 2016 | 2015 | MATURITY | RATE | |||||||||||||
RS Cogen Senior Project Debt | |||||||||||||||||
Bank Portion(a) | $13 | $19 | 10/17/18 | LIBOR + 2.25% | |||||||||||||
Institutional Portion | $38 | $38 | 10/15/22 | Fixed 8.73% | |||||||||||||
RS Cogen Subordinated Debt(b) | $22 | $20 | 10/17/17 | LIBOR + 4.50% | |||||||||||||
(a) RS Cogen spread on bank portion increases over time from 1.375% to 2.375%. | |||||||||||||||||
(b) Debt outstanding includes Entergy's portion of accrued but unpaid interest on Entergy's portion of the RS Cogen subordinated debt since the project went into default | |||||||||||||||||
on the subordinated credit facility in 2008. | |||||||||||||||||
VERMONT YANKEE CREDIT FACILITY | |||||||||||||||||
OUTSTANDING AS OF DECEMBER 31, | RATE | 2016 | 2015 | ||||||||||||||
2.17% | 44.5 | 12 | |||||||||||||||
SHARES OUTSTANDING | |||||||||||||||||
PREFERRED STOCK: | AS OF DECEMBER 31, | AS OF DECEMBER 31, | |||||||||||||||
($ millions) | RATE | 2016 | 2015 | 2016 | 2015 | ||||||||||||
Without Sinking Fund: | |||||||||||||||||
Entergy Finance Holding, Inc. | 8.75%(a) | 250,000 | 250,000 | $ | 24 | $ | 24 | ||||||||||
Authorized 250,000 shares, $100 par value, cumulative | |||||||||||||||||
Total without sinking fund | 250,000 | 250,000 | $ | 24 | $ | 24 | |||||||||||
(a) Dollar amount outstanding is net of $751 thousand of preferred stock issuance costs. | |||||||||||||||||
DEFINITIONS OF OPERATIONAL MEASURES AND GAAP AND NON-GAAP FINANCIAL MEASURES | |
OPERATIONAL MEASURES | |
Owned capacity (MW) | Installed capacity owned and operated by EWC; investment in wind generation was sold in November 2016 |
Production cost per MWh | Fuel and non-fuel O&M expenses according to accounting standards that directly relate to the production of electricity per MWh (based on net generation), excluding special items |
Billed electric energy sales (GWh billed) | Total number of GWh billed to customers and financially-settled instruments (does not include amounts from investment in wind generation that was accounted for under the equity method of accounting and which was sold in November 2016) |
Capability factor | The percentage of the maximum energy generation a plant is capable of supplying to the grid, limited only by factors within control of plant management; a high capability factor indicates effective plant programs and practices to minimize unplanned energy losses and to optimize planned outages |
Capacity factor | Normalized percentage of the period that the nuclear plants generate power |
Refueling outage days | Number of days lost for a scheduled refueling and maintenance outage during the period |
Financial measures defined below include measures prepared in accordance with generally accepted accounting principles (GAAP), as well as non-GAAP measures. | |
Non-GAAP measures are included in this report in order to provide metrics that remove the effect of less routine financial impacts from commonly used financial metrics. | |
FINANCIAL MEASURES – GAAP | |
As-reported non-fuel O&M | Operation and maintenance expenses excluding fuel, fuel-related expenses and gas purchased for resale and purchased power |
As-reported net revenue | Operating revenue less fuel, fuel related expenses and gas purchased for resale, purchased power and other regulatory charges (credits) – net |
Return on average invested capital (ROIC) – as-reported | 12-months rolling net income attributable to Entergy Corporation or subsidiary adjusted for preferred dividends and tax-effected interest expense divided by average invested capital |
Return on average common equity (ROE) – as-reported | 12-months rolling net income attributable to Entergy Corporation or subsidiary divided by average common equity |
Return on average member's equity – as-reported | 12-months rolling attributable to Entergy Corporation or subsidiary divided by average member's equity |
Book value per share | End of period common equity divided by end of period shares outstanding |
Common dividend payout – as-reported | Common dividend paid per share divided by earnings per share |
Revolver capacity | Amount of undrawn capacity remaining on corporate and subsidiary revolvers, including Entergy Nuclear Vermont Yankee |
Total debt | Sum of short-term and long-term debt, notes payable and commercial paper and capital leases on the balance sheet |
Debt of joint ventures - Entergy’s share | Entergy's share of debt issued by business joint ventures at EWC |
Leases - Entergy’s share | Operating leases held by subsidiaries capitalized at implicit interest rate |
Debt to capital | Total debt divided by total capitalization |
Securitization debt | Debt associated with securitization bonds issued to recover storm costs from hurricanes Rita, Ike and Gustav at Entergy Texas and Hurricane Isaac at Entergy New Orleans; the 2009 ice storm at Entergy Arkansas; and investment recovery of costs associated with the cancelled Little Gypsy repowering project at Entergy Louisiana |
FINANCIAL MEASURES – NON-GAAP | |
Operational earnings | As-reported net income attributable to Entergy Corporation or subsidiary adjusted to exclude the effects of special items |
Operational adjusted EBITDA | Earnings before interest, depreciation and amortization and income taxes excluding decommissioning expense and other than temporary impairment losses on decommissioning trust fund assets, excluding effects of special items; for Entergy consolidated, also excludes AFUDC-equity funds and subtracts securitization proceeds |
Adjusted earnings | As-reported net income attributable to Entergy Corporation or subsidiary excluding effects of special items and weather and normalizing for income tax |
Operational net revenue | Operating revenue less fuel, fuel related expenses and gas purchased for resale, purchased power and other regulatory charges (credits) – net excluding the effects of special items |
Operational non-fuel O&M | Operation and maintenance expenses excluding fuel, fuel-related expenses and gas purchased for resale and purchased power excluding the effects of special items |
Common dividend payout – operational | Common dividend paid per share divided by operational earnings per share |
Return on average invested capital (ROIC) – operational | 12-months rolling operational net income attributable to Entergy Corporation or subsidiary adjusted for preferred dividends and tax-effected interest expense divided by average invested capital |
Return on average common equity (ROE) – operational | 12-months rolling operational net income attributable to Entergy Corporation or subsidiary divided by average common equity |
Return on average member's equity – operational | 12-months rolling operational net income attributable to Entergy Corporation or subsidiary divided by average member's equity |
Gross liquidity | Sum of cash and revolver capacity |
Debt to capital, excluding securitization debt | Total debt divided by total capitalization, excluding securitization debt |
Net debt to net capital, excluding securitization debt | Total debt less cash and cash equivalents divided by total capitalization less cash and cash equivalents, excluding securitization debt |
Parent debt to total debt, excluding securitization debt | End of period Entergy Corporation debt, including amounts drawn on credit revolver and commercial paper facilities, as a percent of total debt excluding securitization debt |
Debt to operational EBITDA, excluding securitization debt | End of period total debt excluding securitization debt divided by 12-months rolling operational adjusted EBITDA |
Operational FFO | Funds from operations; net cash flow provided by operations less AFUDC-borrowed funds, working capital items in operating cash flow (receivables, fuel inventory, accounts payable, prepaid taxes and taxes accrued, interest accrued and other working capital accounts) and securitization regulatory charge, excluding effects of special items |
Operational FFO to debt, excluding securitization debt | 12-months rolling operational FFO as a percentage of end of period total debt excluding securitization debt |
REG G RECONCILIATIONS | ||||||||||
CONSOLIDATED FINANCIAL MEASURES – RECONCILIATION OF GAAP TO NON-GAAP MEASURES | ||||||||||
2012-2016 | ||||||||||
($ millions) | 2016 | 2015 | 2014 | 2013 | 2012 | |||||
As-reported net income (loss) attributable to Entergy Corporation (A) | (584 | ) | (177 | ) | 941 | 712 | 847 | |||
Preferred dividends | 19 | 20 | 20 | 19 | 22 | |||||
Tax-effected interest expense | 410 | 396 | 386 | 371 | 350 | |||||
As-reported net income (loss) attributable to Entergy Corporation | ||||||||||
adjusted for preferred dividends and tax-effected interest expense (B) | (155 | ) | 239 | 1,347 | 1,102 | 1,219 | ||||
Special items (C) | (1,855 | ) | (1,253 | ) | (109 | ) | (245 | ) | (262 | ) |
Operational earnings adjusted for preferred | ||||||||||
dividends and tax-effected interest expense (B-C) | 1,700 | 1,492 | 1,456 | 1,347 | 1,481 | |||||
Operational earnings (A-C) | 1,271 | 1,076 | 1,050 | 957 | 1,109 | |||||
Average invested capital (D) | 23,492 | 23,827 | 23,864 | 23,167 | 22,180 | |||||
Average common equity (E) | 8,669 | 9,632 | 9,820 | 9,415 | 9,079 | |||||
($ per share) | ||||||||||
As-Reported earnings per share (N) | (3.26 | ) | (0.99 | ) | 5.22 | 3.99 | 4.76 | |||
Operational earnings per share (O) | 7.11 | 6.00 | 5.83 | 5.36 | 6.23 | |||||
Common dividend paid per share (P) | 3.42 | 3.34 | 3.32 | 3.32 | 3.32 | |||||
(%) | ||||||||||
ROIC – As-Reported (B/D) | (0.7 | ) | 1.0 | 5.6 | 4.8 | 5.5 | ||||
ROIC – Operational ((B-C)/D) | 7.2 | 6.3 | 6.1 | 5.8 | 6.7 | |||||
ROE – As-Reported (A/E) | (6.7 | ) | (1.8 | ) | 9.6 | 7.6 | 9.3 | |||
ROE – Operational ((A-C)/E) | 14.7 | 11.2 | 10.7 | 10.2 | 12.2 | |||||
Common dividend payout – As-Reported % (P/N) | (105 | ) | (339 | ) | 64 | 83 | 70 | |||
Common dividend payout – Operational % (P/O) | 48 | 56 | 57 | 62 | 53 | |||||
Calculations may differ due to rounding. | ||||||||||
REG G RECONCILIATIONS | ||||||||||||||||
CONSOLIDATED FINANCIAL MEASURES – RECONCILIATION OF GAAP TO NON-GAAP MEASURES | ||||||||||||||||
1Q15-4Q16 | ||||||||||||||||
($ millions) | 1Q16 | 2Q16 | 3Q16 | 4Q16 | 1Q15 | 2Q15 | 3Q15 | 4Q15 | ||||||||
As-reported net income (loss) attributable to Entergy Corporation (A) | (245 | ) | 174 | 1,285 | (584 | ) | 838 | 797 | (156 | ) | (177 | ) | ||||
Preferred dividends | 20 | 21 | 21 | 19 | 20 | 20 | 19 | 20 | ||||||||
Tax-effected interest expense | 398 | 404 | 407 | 410 | 389 | 391 | 396 | 396 | ||||||||
As-reported net income (loss) attributable to Entergy Corporation | ||||||||||||||||
adjusted for preferred dividends and tax-effected interest expense (B) | 173 | 599 | 1,713 | (155 | ) | 1,247 | 1,208 | 259 | 239 | |||||||
Special items (C) | (1,261 | ) | (1,250 | ) | (212 | ) | (1,855 | ) | (105 | ) | (95 | ) | (1,085 | ) | (1,253 | ) |
Operational earnings adjusted for preferred | ||||||||||||||||
dividends and tax-effected interest expense (B-C) | 1,434 | 1,849 | 1,925 | 1,700 | 1,352 | 1,303 | 1,344 | 1,492 | ||||||||
Operational earnings (A-C) | 1,016 | 1,424 | 1,497 | 1,271 | 943 | 892 | 929 | 1,076 | ||||||||
Average invested capital (D) | 24,627 | 24,617 | 24,443 | 23,492 | 24,298 | 24,190 | 23,819 | 23,827 | ||||||||
Average common equity (E) | 9,747 | 9,958 | 9,613 | 8,669 | 10,041 | 10,110 | 9,653 | 9,632 | ||||||||
(%) | ||||||||||||||||
ROIC – As-Reported (B/D) | 0.7 | 2.4 | 7.0 | (0.7 | ) | 5.1 | 5.0 | 1.1 | 1.0 | |||||||
ROIC – Operational ((B-C)/D) | 5.8 | 7.5 | 7.9 | 7.2 | 5.6 | 5.4 | 5.6 | 6.3 | ||||||||
ROE – As-Reported (A/E) | (2.5 | ) | 1.7 | 13.4 | (6.7 | ) | 8.3 | 7.9 | (1.6 | ) | (1.8 | ) | ||||
ROE – Operational ((A-C)/E) | 10.4 | 14.3 | 15.6 | 14.7 | 9.4 | 8.8 | 9.6 | 11.2 | ||||||||
Calculations may differ due to rounding. | ||||||||||||||||
REG G RECONCILIATIONS | ||||||||||
CONSOLIDATED FINANCIAL MEASURES – RECONCILIATION OF GAAP TO NON-GAAP MEASURES | ||||||||||
2012-2016 | ||||||||||
($ millions) | 2016 | 2015 | 2014 | 2013 | 2012 | |||||
Total debt (A) | 15,275 | 13,850 | 13,917 | 13,562 | 13,358 | |||||
Less securitization debt (B) | 661 | 775 | 777 | 883 | 973 | |||||
Total debt, excluding securitization debt (A-B) | 14,614 | 13,075 | 13,140 | 12,679 | 12,385 | |||||
Less cash and cash equivalents (C) | 1,188 | 1,351 | 1,422 | 739 | 533 | |||||
Net debt, excluding securitization debt (A-B-C) | 13,426 | 11,724 | 11,718 | 11,940 | 11,852 | |||||
Total capitalization (D) | 23,560 | 23,425 | 24,229 | 23,499 | 22,836 | |||||
Less securitization debt (E) | 661 | 775 | 777 | 883 | 973 | |||||
Total capitalization, excluding securitization debt (D-E) | 22,899 | 22,650 | 23,452 | 22,616 | 21,863 | |||||
Less cash and cash equivalents (F) | 1,188 | 1,351 | 1,422 | 739 | 533 | |||||
Net capitalization, excluding securitization debt (D-E-F) | 21,711 | 21,299 | 22,030 | 21,877 | 21,330 | |||||
(%) | ||||||||||
Debt to capital (A/D) | 64.8 | 59.1 | 57.4 | 57.7 | 58.5 | |||||
Debt to capital, excluding securitization debt ((A-B)/D-E)) | 63.8 | 57.7 | 56.0 | 56.1 | 56.6 | |||||
Net debt to net capital, excluding securitization debt ((A-B-C)/(D-E-F)) | 61.8 | 55.0 | 53.2 | 54.6 | 55.6 | |||||
Revolver capacity (G) | 3,720 | 3,582 | 3,592 | 3,977 | 3,462 | |||||
Gross liquidity (C+G) | 4,908 | 4,933 | 5,014 | 4,716 | 3,995 | |||||
Entergy Corporation notes: | ||||||||||
Due September 2015 | — | — | 550 | 550 | 550 | |||||
Due January 2017 | — | 500 | 500 | 500 | 500 | |||||
Due September 2020 | 450 | 450 | 450 | 450 | 450 | |||||
Due July 2022 | 650 | 650 | — | — | — | |||||
Due September 2026 | 750 | — | — | — | — | |||||
Total parent long-term debt (H) | 1,850 | 1,600 | 1,500 | 1,500 | 1,500 | |||||
Revolver draw (I) | 700 | 835 | 695 | 255 | 795 | |||||
Commercial paper (J) | 344 | 422 | 484 | 1,045 | 665 | |||||
Total parent debt (H)+(I)+(J) | 2,894 | 2,857 | 2,679 | 2,800 | 2,960 | |||||
Parent debt to total debt, excluding securitization debt % ((H)+(I)+(J))/(A-B) | 19.8 | 21.9 | 20.4 | 22.1 | 23.9 | |||||
Calculations may differ due to rounding. | ||||||||||
REG G RECONCILIATIONS | ||||||||||||||||
CONSOLIDATED FINANCIAL MEASURES – RECONCILIATION OF GAAP TO NON-GAAP MEASURES | ||||||||||||||||
1Q15-4Q16 | ||||||||||||||||
($ millions) | 1Q16 | 2Q16 | 3Q16 | 4Q16 | 1Q15 | 2Q15 | 3Q15 | 4Q15 | ||||||||
Total debt (A) | 15,092 | 14,837 | 15,073 | 15,275 | 14,044 | 13,858 | 14,144 | 13,850 | ||||||||
Less securitization debt (B) | 752 | 716 | 698 | 661 | 762 | 734 | 814 | 775 | ||||||||
Total debt, excluding securitization debt (A-B) | 14,340 | 14,121 | 14,375 | 14,614 | 13,282 | 13,124 | 13,330 | 13,075 | ||||||||
Less cash and cash equivalents (C) | 1,092 | 996 | 1,307 | 1,188 | 1,181 | 910 | 1,041 | 1,351 | ||||||||
Net debt, excluding securitization debt (A-B-C) | 13,248 | 13,125 | 13,068 | 13,426 | 12,101 | 12,214 | 12,289 | 11,724 | ||||||||
Total capitalization (D) | 24,771 | 24,913 | 25,375 | 23,560 | 24,483 | 24,321 | 23,512 | 23,425 | ||||||||
Less securitization debt (E) | 752 | 716 | 698 | 661 | 762 | 734 | 814 | 775 | ||||||||
Total capitalization, excluding securitization debt (D-E) | 24,019 | 24,197 | 24,677 | 22,899 | 23,721 | 23,587 | 22,698 | 22,650 | ||||||||
Less cash and cash equivalents (F) | 1,092 | 996 | 1,307 | 1,188 | 1,181 | 910 | 1,041 | 1,351 | ||||||||
Net capitalization, excluding securitization debt (D-E-F) | 22,927 | 23,201 | 23,370 | 21,711 | 22,540 | 22,677 | 21,657 | 21,299 | ||||||||
(%) | ||||||||||||||||
Debt to capital (A/D) | 60.9 | 59.6 | 59.4 | 64.8 | 57.4 | 57.0 | 60.2 | 59.1 | ||||||||
Debt to capital, excluding securitization debt ((A-B)/D-E)) | 59.7 | 58.4 | 58.3 | 63.8 | 56.0 | 55.6 | 58.7 | 57.7 | ||||||||
Net debt to net capital ratio, excluding securitization debt ((A-B-C)/(D-E-F)) | 57.8 | 56.6 | 55.9 | 61.8 | 53.7 | 53.9 | 56.7 | 55.0 | ||||||||
Revolver capacity (G) | 3,794 | 4,173 | 4,243 | 3,720 | 3,779 | 4,158 | 3,869 | 3,582 | ||||||||
Gross liquidity (C+G) | 4,886 | 5,169 | 5,550 | 4,908 | 4,960 | 5,068 | 4,910 | 4,933 | ||||||||
Entergy Corporation notes: | ||||||||||||||||
Due September 2015 | — | — | — | — | 550 | 550 | — | — | ||||||||
Due January 2017 | 500 | 500 | 500 | — | 500 | 500 | 500 | 500 | ||||||||
Due September 2020 | 450 | 450 | 450 | 450 | 450 | 450 | 450 | 450 | ||||||||
Due July 2022 | 650 | 650 | 650 | 650 | — | — | 650 | 650 | ||||||||
Due September 2026 | — | — | 750 | 750 | ||||||||||||
Total parent long-term debt (H) | 1,600 | 1,600 | 2,350 | 1,850 | 1,500 | 1,500 | 1,600 | 1,600 | ||||||||
Revolver draw (I) | 616 | 240 | 180 | 700 | 508 | 271 | 525 | 835 | ||||||||
Commercial paper (J) | 578 | 853 | 264 | 344 | 762 | 895 | 664 | 422 | ||||||||
Total parent debt (H)+(I)+(J) | 2,794 | 2,693 | 2,794 | 2,894 | 2,770 | 2,666 | 2,789 | 2,857 | ||||||||
Parent debt to total debt, excluding securitization debt % ((H)+(I)+(J))/(A-B) | 19.5 | 19.1 | 19.4 | 19.8 | 20.9 | 20.3 | 20.9 | 21.9 | ||||||||
Calculations may differ due to rounding. | ||||||||||||||||
REG G RECONCILIATIONS | ||||||||||
CONSOLIDATED FINANCIAL MEASURES – RECONCILIATION OF GAAP TO NON-GAAP MEASURES | ||||||||||
2012-2016 | ||||||||||
($ millions) | 2016 | 2015 | 2014 | 2013 | 2012 | |||||
Total debt (A) | 15,275 | 13,850 | 13,917 | 13,562 | 13,358 | |||||
Less securitization debt (B) | 661 | 775 | 777 | 883 | 973 | |||||
Total debt, excluding securitization debt (C) | 14,614 | 13,075 | 13,140 | 12,679 | 12,385 | |||||
As-reported consolidated net income, rolling 12 months | (565 | ) | (157 | ) | 960 | 731 | 868 | |||
Add back: interest expense, rolling 12 months | 666 | 643 | 628 | 604 | 569 | |||||
Add back: income tax expense, rolling 12 months | (817 | ) | (643 | ) | 590 | 226 | 31 | |||
Add back: depreciation and amortization, rolling 12 months | 1,347 | 1,337 | 1,319 | 1,261 | 1,145 | |||||
Add back: regulatory charges (credits), rolling 12 months | 94 | 175 | (14 | ) | 46 | 175 | ||||
Subtract: securitization proceeds, rolling 12 months | 132 | 137 | 130 | 127 | 132 | |||||
Subtract: interest and investment income, rolling 12 months | 145 | 187 | 148 | 199 | 128 | |||||
Subtract: AFUDC - equity funds, rolling 12 months | 68 | 52 | 65 | 66 | 93 | |||||
Add back: decommissioning expense, rolling 12 months | 327 | 280 | 273 | 242 | 185 | |||||
Adjusted EBITDA, rolling 12 months (D) | 707 | 1,259 | 3,413 | 2,718 | 2,620 | |||||
Add back: special item for transmission business spin-merge expenses, rolling 12 months (pre-tax) | — | — | — | 36 | 39 | |||||
Add back: special item for HCM implementation expenses, rolling 12 months (pre-tax) | — | — | 16 | 60 | — | |||||
Add back: special item resulting from EWC Nuclear plant impairments and costs associated with decisions to close or sell plants (pre-tax) | 2,910 | 2,054 | 154 | 343 | 356 | |||||
Add back: Top Deer investment impairment, rolling 12 months (pre-tax) | — | 37 | — | — | — | |||||
Add back: special item for gain on the sale of RISEC, rolling 12 months (pre-tax) | — | (154 | ) | — | — | — | ||||
Add back: special item for DOE litigation awards for VY and FitzPatrick, rolling 12 months (pre-tax) | (34 | ) | — | — | — | — | ||||
Operational adjusted EBITDA, rolling 12 months (E) | 3,583 | 3,196 | 3,583 | 3,157 | 3,015 | |||||
Debt to operational adjusted EBITDA, excluding securitization debt (times) (C)/(E) | 4.1 | 4.1 | 3.7 | 4.0 | 4.1 | |||||
Net cash flow provided by operating activities, rolling 12 months (F) | 2,999 | 3,291 | 3,890 | 3,189 | 2,940 | |||||
AFUDC borrowed funds used during construction, rolling 12 months (G) | (34 | ) | (27 | ) | (34 | ) | (26 | ) | (37 | ) |
Working capital items in net cash flow provided by operating activities, rolling 12 months: | ||||||||||
Receivables | (97 | ) | 38 | 98 | (181 | ) | (14 | ) | ||
Fuel inventory | 38 | (12 | ) | 4 | 5 | (12 | ) | |||
Accounts payable | 174 | (135 | ) | (13 | ) | 94 | (7 | ) | ||
Prepaid taxes and taxes accrued | (29 | ) | 82 | (63 | ) | (143 | ) | 55 | ||
Interest accrued | (7 | ) | (11 | ) | 25 | (4 | ) | 1 | ||
Other working capital accounts | 31 | (114 | ) | 112 | (66 | ) | (152 | ) | ||
Securitization regulatory charge | 114 | 107 | 97 | 93 | 94 | |||||
Total (H) | 224 | (45 | ) | 260 | (202 | ) | (35 | ) | ||
FFO, rolling 12 months (F)+(G)-(H) | 2,741 | 3,309 | 3,596 | 3,365 | 2,938 | |||||
Add back: special item for transmission business spin-merge expenses, rolling 12 months (pre-tax) | — | — | — | 36 | 37 | |||||
Add back: special item for HCM implementation expenses, rolling 12 months (pre-tax) | — | — | 51 | 24 | — | |||||
Add back: special item resulting from EWC Nuclear plant impairments and costs associated with decisions to close or sell plants (pre-tax) | 6 | 55 | 7 | 4 | — | |||||
Operational FFO, rolling 12 months (I) | 2,747 | 3,364 | 3,654 | 3,429 | 2,975 | |||||
Operational FFO to debt, excluding securitization debt % (I)/(C) | 18.8 | 25.7 | 27.8 | 27.0 | 24.0 | |||||
Calculations may differ due to rounding. | ||||||||||
REG G RECONCILIATIONS | ||||||||||||||||
CONSOLIDATED FINANCIAL MEASURES – RECONCILIATION OF GAAP TO NON-GAAP MEASURES | ||||||||||||||||
1Q15-4Q16 | ||||||||||||||||
($ millions) | 1Q16 | 2Q16 | 3Q16 | 4Q16 | 1Q15 | 2Q15 | 3Q15 | 4Q15 | ||||||||
Total debt (A) | 15,092 | 14,837 | 15,073 | 15,275 | 14,044 | 13,858 | 14,144 | 13,850 | ||||||||
Less securitization debt (B) | 752 | 716 | 698 | 661 | 762 | 734 | 814 | 775 | ||||||||
Total debt, excluding securitization debt (C) | 14,340 | 14,121 | 14,375 | 14,614 | 13,282 | 13,124 | 13,330 | 13,075 | ||||||||
As-reported consolidated net income, rolling 12 months | (245 | ) | 194 | 1,306 | (565 | ) | 857 | 817 | (156 | ) | (157 | ) | ||||
Add back: interest expense, rolling 12 months | 647 | 658 | 661 | 666 | 632 | 636 | 644 | 643 | ||||||||
Add back: income tax expense, rolling 12 months | (653 | ) | (1,002 | ) | (377 | ) | (817 | ) | 523 | 494 | (35 | ) | (643 | ) | ||
Add back: depreciation and amortization, rolling 12 months | 1,340 | 1,335 | 1,340 | 1,347 | 1,322 | 1,331 | 1,333 | 1,337 | ||||||||
Add back: regulatory charges (credits), rolling 12 months | 166 | 185 | 196 | 94 | (7 | ) | 10 | 29 | 175 | |||||||
Subtract: securitization proceeds, rolling 12 months | 136 | 137 | 140 | 132 | 129 | 130 | 134 | 137 | ||||||||
Subtract: interest and investment income, rolling 12 months | 152 | 158 | 157 | 145 | 181 | 196 | 186 | 187 | ||||||||
Subtract: AFUDC - equity funds, rolling 12 months | 59 | 61 | 62 | 68 | 61 | 59 | 56 | 52 | ||||||||
Add back: decommissioning expense, rolling 12 months | 279 | 287 | 303 | 327 | 277 | 278 | 279 | 280 | ||||||||
Adjusted EBITDA, rolling 12 months (D) | 1,187 | 1,301 | 3,070 | 707 | 3,233 | 3,181 | 1,718 | 1,259 | ||||||||
Add back: special item for HCM implementation expenses, rolling 12 months (pre-tax) | — | — | — | — | 11 | 4 | 3 | — | ||||||||
Add back: special item resulting from EWC Nuclear plant impairments and costs associated with decisions to close or sell plants (pre-tax) | 2,066 | 2,084 | 482 | 2,910 | 152 | 143 | 1,673 | 2,054 | ||||||||
Add back: special item for DOE litigation awards for VY and FitzPatrick | — | (34 | ) | (34 | ) | (34 | ) | — | — | — | — | |||||
Add back: Top Deer investment impairment, rolling 12 months (pre-tax) | 37 | 37 | 37 | — | — | — | — | 37 | ||||||||
Add back: special item for gain on the sale of RISEC, rolling 12 months (pre-tax) | (154 | ) | (154 | ) | (154 | ) | — | — | — | — | (154 | ) | ||||
Operational adjusted EBITDA, rolling 12 months (E) | 3,136 | 3,234 | 3,401 | 3,583 | 3,396 | 3,328 | 3,394 | 3,196 | ||||||||
Debt to operational adjusted EBITDA, excluding securitization debt (times) (C)/(E) | 4.6 | 4.4 | 4.2 | 4.1 | 3.9 | 3.9 | 3.9 | 4.1 | ||||||||
Net cash flow provided by operating activities, rolling 12 months (F) | 3,213 | 3,205 | 3,194 | 2,999 | 3,733 | 3,699 | 3,348 | 3,291 | ||||||||
AFUDC borrowed funds used during construction, rolling 12 months (G) | (30 | ) | (31 | ) | (32 | ) | (34 | ) | (33 | ) | (30 | ) | (29 | ) | (27 | ) |
Working capital items in net cash flow provided by operating activities, rolling 12 months: | ||||||||||||||||
Receivables | 92 | 81 | (10 | ) | (97 | ) | 72 | 45 | (5 | ) | 38 | |||||
Fuel inventory | 1 | 1 | 24 | 38 | (35 | ) | (32 | ) | (34 | ) | (12 | ) | ||||
Accounts payable | (49 | ) | 15 | 55 | 174 | (200 | ) | (164 | ) | (63 | ) | (135 | ) | |||
Prepaid taxes and taxes accrued | 134 | 108 | 3 | (29 | ) | (51 | ) | (43 | ) | 25 | 82 | |||||
Interest accrued | 4 | (2 | ) | 9 | (7 | ) | 7 | 5 | (5 | ) | (11 | ) | ||||
Other working capital accounts | (118 | ) | (111 | ) | (59 | ) | 31 | 137 | 104 | (17 | ) | (114 | ) | |||
Securitization regulatory charge | 106 | 107 | 111 | 114 | 97 | 99 | 104 | 107 | ||||||||
Total (H) | 170 | 199 | 133 | 224 | 27 | 14 | 5 | (45 | ) | |||||||
FFO, rolling 12 months (F)+(G)-(H) | 3,013 | 2,975 | 3,029 | 2,741 | 3,673 | 3,655 | 3,314 | 3,309 | ||||||||
Add back: special item for HCM implementation expenses, rolling 12 months (pre-tax) | — | — | — | — | 23 | 15 | 11 | — | ||||||||
Add back: special item resulting from EWC Nuclear plant impairments and costs associated with decisions to close or sell plants (pre-tax) | 4 | 6 | 6 | 6 | 56 | 57 | 56 | 55 | ||||||||
Operational FFO, rolling 12 months (I) | 3,017 | 2,981 | 3,035 | 2,747 | 3,752 | 3,727 | 3,381 | 3,364 | ||||||||
Operational FFO to debt, excluding securitization debt % (I)/(C) | 21.0 | 21.1 | 21.1 | 18.8 | 28.2 | 28.4 | 25.4 | 25.7 | ||||||||
Calculations may differ due to rounding. | ||||||||||||||||
REG G RECONCILIATIONS | ||||||||||
UTILITY FINANCIAL MEASURES – RECONCILIATION OF GAAP TO NON-GAAP MEASURES | ||||||||||
2012-2016 | ||||||||||
($ millions) | 2016 | 2015 | 2014 | 2013 | 2012 | |||||
As-reported earnings applicable to common stock/equity (A) | 1,134.2 | 1,096.9 | 829.1 | 828.9 | 943.0 | |||||
Preferred dividends | 16.9 | 17.6 | 17.3 | 17.3 | 17.3 | |||||
Tax-effected interest expense | 343.4 | 334.6 | 327.5 | 313.1 | 293.1 | |||||
As-reported earnings applicable to common stock/equity adjusted for | ||||||||||
preferred dividends and tax-effected interest expense (B) | 1,494.6 | 1,449.1 | 1,173.9 | 1,159.3 | 1,253.4 | |||||
Utility special items | ||||||||||
Transmission business spin-merge expenses | — | — | — | (8.7 | ) | (37.1 | ) | |||
HCM implementation expenses | — | — | (7.6 | ) | (20.3 | ) | — | |||
Total special items (C) | — | — | (7.6 | ) | (29.0 | ) | (37.1 | ) | ||
Operational earnings adjusted for preferred | ||||||||||
dividends and tax-effected interest expense (B-C) | 1,494.6 | 1,449.1 | 1,181.5 | 1,188.3 | 1,290.6 | |||||
Operational earnings (A-C) | 1,134.2 | 1,096.9 | 836.7 | 857.8 | 980.1 | |||||
As-reported Utility net revenue (D) | 6,179.4 | 5,828.9 | 5,734.7 | 5,523.8 | 4,968.6 | |||||
Utility special items included in net revenue | ||||||||||
Transmission business spin-merge expenses | — | — | — | 5.7 | — | |||||
Total special items included in net revenue (E) | — | — | — | 5.7 | — | |||||
Operational Utility net revenue (D-E) | 6,179.4 | 5,828.9 | 5,734.7 | 5,518.1 | 4,968.6 | |||||
As-reported Utility non-fuel O&M (F) | 2,487.3 | 2,560.6 | 2,394.6 | 2,388.9 | 2,190.4 | |||||
Utility special items included in non-fuel O&M | ||||||||||
Transmission business spin-merge expenses | — | — | 12.6 | 28.3 | 38.2 | |||||
HCM implementation expenses | — | — | — | 35.7 | — | |||||
Total special items included in non-fuel O&M (G) | — | — | 12.6 | 64.0 | 38.2 | |||||
Operational Utility non-fuel O&M (F-G) | 2,487.3 | 2,560.6 | 2,382.0 | 2,324.9 | 2,152.2 | |||||
Average invested capital (H) | 21,896 | 20,642 | 20,213 | 19,488 | 18,154 | |||||
Average common equity (I) | 10,008 | 9,241 | 8,904 | 8,599 | 7,991 | |||||
Gross debt (J) | 12,349 | 10,955 | 11,163 | 10,674 | 10,325 | |||||
Less securitization debt (K) | 661 | 775 | 777 | 883 | 974 | |||||
Gross debt, excluding securitization debt (J-K) | 11,688 | 10,180 | 10,386 | 9,791 | 9,352 | |||||
Less cash and cash equivalents (L) | 747 | 619 | 973 | 551 | 380 | |||||
Net debt, excluding securitization debt (J-K-L) | 10,941 | 9,561 | 9,413 | 9,240 | 8,971 | |||||
Total capitalization (M) | 22,968 | 20,825 | 20,350 | 19,857 | 18,902 | |||||
Less securitization debt (K) | 661 | 775 | 777 | 883 | 974 | |||||
Total capitalization, excluding securitization debt (M-K) | 22,307 | 20,050 | 19,573 | 18,974 | 17,929 | |||||
Less cash and cash equivalents (L) | 747 | 619 | 973 | 551 | 380 | |||||
Net capitalization, excluding securitization debt (M-K-L) | 21,560 | 19,431 | 18,600 | 18,423 | 17,548 | |||||
(%) | ||||||||||
ROIC – As-Reported (B/H) | 6.8 | 7.0 | 5.8 | 5.9 | 6.9 | |||||
ROIC – Operational ((B-C)/H) | 6.8 | 7.0 | 5.9 | 6.1 | 7.1 | |||||
ROE – As-Reported (A/I) | 11.3 | 11.9 | 9.3 | 9.6 | 11.8 | |||||
ROE – Operational ((A-C)/I) | 11.3 | 11.9 | 9.4 | 10.0 | 12.3 | |||||
Debt to capital (J/M) | 53.8 | 52.6 | 54.9 | 53.8 | 54.6 | |||||
Debt to capital, excluding securitization debt ((J-K)/(M-K)) | 52.4 | 50.8 | 53.1 | 51.6 | 52.2 | |||||
Net debt to net capital, excluding securitization debt ((J-K-L)/(M-K-L)) | 50.7 | 49.2 | 50.6 | 50.2 | 51.1 | |||||
Calculations may differ due to rounding. | ||||||||||
REG G RECONCILIATIONS | ||||||||||||||||
UTILITY FINANCIAL MEASURES – RECONCILIATION OF GAAP TO NON-GAAP MEASURES | ||||||||||||||||
1Q15-4Q16 | ||||||||||||||||
($ millions) | 1Q16 | 2Q16 | 3Q16 | 4Q16 | 1Q15 | 2Q15 | 3Q15 | 4Q15 | ||||||||
As-reported earnings applicable to common stock/equity (A) | 194.9 | 375.6 | 443.3 | 120.4 | 223.4 | 199.7 | 360.0 | 313.7 | ||||||||
Less special items (B) | — | — | — | — | — | — | — | — | ||||||||
Operational earnings (A-B) | 194.9 | 375.6 | 443.3 | 120.4 | 223.4 | 199.7 | 360.0 | 313.7 | ||||||||
As-reported earnings applicable to common stock/equity-rolling 12 months (C) | 1,068.4 | 1,244.3 | 1,327.5 | 1,134.2 | 851.5 | 843.4 | 892.5 | 1,096.9 | ||||||||
Preferred dividends | 18.0 | 18.4 | 18.7 | 16.9 | 17.3 | 17.3 | 17.2 | 17.6 | ||||||||
Tax-effected interest expense | 335.2 | 339.4 | 342.3 | 343.4 | 331.2 | 335.4 | 336.9 | 334.6 | ||||||||
As-Reported earnings applicable to common stock/equity, rolling | ||||||||||||||||
12 months adjusted for preferred dividends and tax-effected | 1,421.6 | 1,602.1 | 1,688.5 | 1,494.5 | 1,200.0 | 1,196.1 | 1,246.6 | 1,449.1 | ||||||||
interest expense (D) | ||||||||||||||||
Special items in prior quarters | — | — | — | — | (5.3 | ) | (1.8 | ) | (1.5 | ) | — | |||||
Special items in current quarter | — | — | — | — | — | — | — | — | ||||||||
Total special items (E) | — | — | — | — | (5.3 | ) | (1.8 | ) | (1.5 | ) | — | |||||
Operational earnings, rolling 12 months adjusted for preferred | ||||||||||||||||
dividends and tax-effected interest expense (D-E) | 1,421.6 | 1,602.1 | 1,688.5 | 1,494.5 | 1,205.3 | 1,197.9 | 1,248.1 | 1,449.1 | ||||||||
Operational earnings, rolling 12 months (C-E) | 1,068.4 | 1,244.3 | 1,327.5 | 1,134.2 | 856.8 | 845.2 | 894.0 | 1,096.9 | ||||||||
As-reported Utility net revenue (F) | 1,375.1 | 1,524.2 | 1,859.1 | 1,421.1 | 1,410.5 | 1,487.6 | 1,750.2 | 1,180.6 | ||||||||
Utility special items included in net revenue | ||||||||||||||||
Transmission business spin-merge expenses | ||||||||||||||||
Total special items included in net revenue (G) | — | — | — | — | — | — | — | — | ||||||||
Operational Utility net revenue (F-G) | 1,375.1 | 1,524.2 | 1,859.1 | 1,421.1 | 1,410.5 | 1,487.6 | 1,750.2 | 1,180.6 | ||||||||
As-reported Utility non-fuel O&M (H) | 546.6 | 614.8 | 624.6 | 701.3 | 584.3 | 642.5 | 663.1 | 670.6 | ||||||||
Utility special items included in non-fuel O&M | ||||||||||||||||
Transmission business spin-merge expenses | — | — | — | — | — | — | — | — | ||||||||
HCM implementation expenses | — | — | — | — | — | — | — | — | ||||||||
Total special items included in non-fuel O&M (I) | — | — | — | — | — | — | — | — | ||||||||
Operational Utility non-fuel O&M (H-I) | 546.6 | 614.8 | 624.6 | 701.3 | 584.3 | 642.5 | 663.1 | 670.6 | ||||||||
Average invested capital (J) | 21,466 | 21,421 | 21,788 | 21,777 | 20,462 | 20,425 | 20,723 | 20,587 | ||||||||
Average common equity (K) | 9,535 | 9,619 | 9,958 | 10,008 | 9,038 | 9,093 | 9,325 | 9,241 | ||||||||
Gross debt (L) | 12,211 | 12,057 | 12,251 | 12,349 | 11,195 | 11,111 | 11,274 | 10,955 | ||||||||
Less securitization debt (M) | 752 | 716 | 698 | 661 | 762 | 734 | 814 | 775 | ||||||||
Gross debt, excluding securitization debt (L-M) | 11,459 | 11,341 | 11,553 | 11,688 | 10,433 | 10,377 | 10,460 | 10,180 | ||||||||
Less cash and cash equivalents (N) | 663 | 492 | 708 | 747 | 774 | 734 | 830 | 619 | ||||||||
Net debt, excluding securitization debt (L-M-N) | 10,796 | 10,849 | 10,845 | 10,941 | 9,659 | 9,643 | 9,630 | 9,561 | ||||||||
Total capitalization (O) | 22,470 | 22,417 | 22,854 | 22,968 | 20,579 | 20,562 | 20,983 | 20,825 | ||||||||
Less securitization debt (M) | 752 | 716 | 698 | 661 | 762 | 734 | 814 | 775 | ||||||||
Total capitalization, excluding securitization debt (O-M) | 21,718 | 21,701 | 22,156 | 22,307 | 19,817 | 19,828 | 20,169 | 20,050 | ||||||||
Less cash and cash equivalents (N) | 663 | 492 | 708 | 747 | 774 | 734 | 830 | 619 | ||||||||
Net capitalization, excluding securitization debt (O-M-N) | 21,055 | 21,209 | 21,448 | 21,560 | 19,043 | 19,094 | 19,339 | 19,431 | ||||||||
(%) | ||||||||||||||||
ROIC – As-Reported (D/J) | 6.6 | 7.5 | 7.7 | 6.8 | 5.9 | 5.9 | 6.0 | 7.0 | ||||||||
ROIC – Operational ((D-E)/J) | 6.6 | 7.5 | 7.7 | 6.8 | 5.9 | 5.9 | 6.0 | 7.0 | ||||||||
ROE – As-Reported (C/K) | 11.2 | 12.9 | 13.3 | 11.3 | 9.4 | 9.3 | 9.6 | 11.9 | ||||||||
ROE – Operational ((C-E)/K) | 11.2 | 12.9 | 13.3 | 11.3 | 9.5 | 9.3 | 9.6 | 11.9 | ||||||||
Debt to capital ratio (L/O) | 54.3 | 53.8 | 53.6 | 53.8 | 54.4 | 54.0 | 53.7 | 52.6 | ||||||||
Debt to capital, excluding securitization debt ((L-M)/(O-M)) | 52.8 | 52.3 | 52.1 | 52.4 | 52.6 | 52.3 | 51.9 | 50.8 | ||||||||
Net debt to net capital, excluding securitization debt ((L-M-N)/(O-M-N)) | 51.3 | 51.2 | 50.6 | 50.7 | 50.7 | 50.5 | 49.8 | 49.2 | ||||||||
Calculations may differ due to rounding. | ||||||||||||||||
REG G RECONCILIATIONS | ||||||||||
ENTERGY ARKANSAS FINANCIAL MEASURES – RECONCILIATION OF GAAP TO NON-GAAP MEASURES | ||||||||||
2012-2016 | ||||||||||
($ millions) | 2016 | 2015 | 2014 | 2013 | 2012 | |||||
As-reported earnings applicable to common stock (A) | 161.9 | 67.4 | 114.5 | 155.1 | 145.5 | |||||
Preferred dividends | 5.3 | 6.9 | 6.9 | 6.9 | 6.9 | |||||
Tax-effected interest expense | 65.3 | 60.3 | 55.5 | 54.3 | 49.5 | |||||
As-reported earnings applicable to common stock adjusted for | ||||||||||
preferred dividends and tax-effected interest expense (B) | 232.5 | 134.6 | 176.9 | 216.3 | 201.9 | |||||
Special items | ||||||||||
Transmission business spin-merge expenses | — | — | — | (0.4 | ) | (13.0 | ) | |||
HCM implementation expenses | — | — | (1.4 | ) | (2.4 | ) | — | |||
Total special items (C) | — | — | (1.4 | ) | (2.8 | ) | (13.0 | ) | ||
Operational earnings adjusted for preferred | ||||||||||
dividends and tax-effected interest expense (B-C) | 232.5 | 134.6 | 178.3 | 219.1 | 214.9 | |||||
Operational earnings (A-C) | 161.9 | 67.4 | 115.9 | 157.9 | 158.5 | |||||
Average invested capital (D) | 4,883 | 4,640 | 4,423 | 4,026 | 3,645 | |||||
Average invested capital, excluding securitization (E) | 4,828 | 4,572 | 4,343 | 3,933 | 3,540 | |||||
Average common equity (F) | 2,072 | 1,858 | 1,772 | 1,650 | 1,512 | |||||
Gross debt (G) | 2,831 | 2,642 | 2,689 | 2,380 | 2,139 | |||||
Less securitization debt (H) | 48 | 61 | 74 | 87 | 99 | |||||
Gross debt, excluding securitization debt (G-H) | 2,783 | 2,581 | 2,615 | 2,293 | 2,040 | |||||
Less cash and cash equivalents (I) | 21 | 9 | 219 | 127 | 35 | |||||
Net debt, excluding securitization debt (G-H-I) | 2,762 | 2,572 | 2,396 | 2,166 | 2,006 | |||||
Total capitalization (J) | 5,115 | 4,650 | 4,630 | 4,216 | 3,835 | |||||
Less securitization debt (K) | 48 | 61 | 74 | 87 | 99 | |||||
Total capitalization, excluding securitization debt (J-K) | 5,067 | 4,589 | 4,556 | 4,129 | 3,736 | |||||
Less cash and cash equivalents (L) | 21 | 9 | 219 | 127 | 35 | |||||
Net capitalization, excluding securitization debt (J-K-L) | 5,046 | 4,580 | 4,337 | 4,002 | 3,702 | |||||
(%) | ||||||||||
ROIC – As-Reported (B/D) | 4.8 | 2.9 | 4.0 | 5.4 | 5.5 | |||||
ROIC – Operational ((B-C)/E) | 4.8 | 2.9 | 4.1 | 5.6 | 6.1 | |||||
ROE – As-Reported (A/F) | 7.8 | 3.6 | 6.5 | 9.4 | 9.6 | |||||
ROE – Operational ((A-C)/F) | 7.8 | 3.6 | 6.5 | 9.6 | 10.5 | |||||
Debt to capital (G/J) | 55.3 | 56.8 | 58.1 | 56.4 | 55.8 | |||||
Debt to capital, excluding securitization debt ((G-H)/(J-K)) | 54.9 | 56.2 | 57.4 | 55.5 | 54.6 | |||||
Net debt to net capital, excluding securitization debt ((G-H-I)/(J-K-L)) | 54.7 | 56.1 | 55.3 | 54.1 | 54.2 | |||||
Calculations may differ due to rounding. | ||||||||||
REG G RECONCILIATIONS | ||||||||||
ENTERGY TEXAS – RECONCILIATION OF GAAP TO NON-GAAP MEASURES | ||||||||||
2012-2016 | ||||||||||
($ millions) | 2016 | 2015 | 2014 | 2013 | 2012 | |||||
As-reported net income (A) | 107.5 | 69.6 | 74.8 | 57.9 | 42.0 | |||||
Preferred dividends | — | — | — | — | — | |||||
Tax-effected interest expense | 51.0 | 50.7 | 53.0 | 54.7 | 57.2 | |||||
As-reported net income adjusted for preferred | ||||||||||
dividends and tax-effected interest expense (B) | 158.5 | 120.3 | 127.8 | 112.6 | 99.2 | |||||
Special items | ||||||||||
Transmission business spin-merge expenses | — | — | — | (3.2 | ) | (4.6 | ) | |||
HCM implementation expenses | — | — | (1.1 | ) | (5.6 | ) | — | |||
Total special items (C) | — | — | (1.1 | ) | (8.8 | ) | (4.6 | ) | ||
Operational earnings adjusted for preferred | ||||||||||
dividends and tax-effected interest expense (B-C) | 158.5 | 120.3 | 128.9 | 121.4 | 103.8 | |||||
Operational earnings (A-C) | 107.5 | 69.6 | 75.9 | 66.7 | 46.6 | |||||
Average invested capital (D) | 2,495 | 2,387 | 2,396 | 2,445 | 2,509 | |||||
Average invested capital, excluding securitization debt (E) | 2,032 | 1,858 | 1,803 | 1,790 | 1,795 | |||||
Average common equity (F) | 1,015 | 927 | 889 | 871 | 877 | |||||
Gross debt (G) | 1,508 | 1,452 | 1,469 | 1,545 | 1,604 | |||||
Less securitization debt (H) | 429 | 497 | 562 | 624 | 685 | |||||
Gross debt, excluding securitization debt (G-H) | 1,079 | 955 | 907 | 921 | 919 | |||||
Less cash and cash equivalents (I) | 6 | 2 | 30 | 47 | 60 | |||||
Net debt, excluding securitization debt (G-H-I) | 1,073 | 953 | 877 | 874 | 859 | |||||
Total capitalization (J) | 2,577 | 2,413 | 2,361 | 2,432 | 2,458 | |||||
Less securitization debt (K) | 429 | 497 | 562 | 624 | 685 | |||||
Total capitalization, excluding securitization debt (J-K) | 2,148 | 1,916 | 1,799 | 1,808 | 1,773 | |||||
Less cash and cash equivalents (L) | 6 | 2 | 30 | 47 | 60 | |||||
Net capitalization, excluding securitization debt (J-K-L) | 2,142 | 1,914 | 1,769 | 1,761 | 1,713 | |||||
(%) | ||||||||||
ROIC – As-Reported (B/D) | 6.4 | 5.0 | 5.3 | 4.6 | 4.0 | |||||
ROIC – Operational ((B-C)/E) | 7.8 | 6.5 | 7.1 | 6.8 | 5.8 | |||||
ROE – As-Reported (A/F) | 10.6 | 7.5 | 8.4 | 6.6 | 4.8 | |||||
ROE – Operational ((A-C)/F) | 10.6 | 7.5 | 8.5 | 7.7 | 5.3 | |||||
Debt to capital (G/J) | 58.5 | 60.2 | 62.2 | 63.5 | 65.2 | |||||
Debt to capital, excluding securitization debt ((G-H)/(J-K)) | 50.2 | 49.8 | 50.4 | 50.9 | 51.8 | |||||
Net debt to net capital, excluding securitization debt ((G-H-I)/(J-K-L)) | 50.1 | 49.8 | 49.6 | 49.6 | 50.1 | |||||
Calculations may differ due to rounding. | ||||||||||
REG G RECONCILIATIONS | ||||||||||
ENTERGY LOUISIANA FINANCIAL MEASURES – RECONCILIATION OF GAAP TO NON-GAAP MEASURES (a) | ||||||||||
2012-2016 | ||||||||||
($ millions) | 2016 | 2015 | 2014 | 2013 | 2012 | |||||
As-reported earnings applicable to common equity (A) | 622.0 | 440.9 | 438.2 | 406.3 | 432.3 | |||||
Preferred dividends | — | 5.7 | 7.8 | 7.8 | 7.8 | |||||
Tax-effected interest expense | 159.4 | 153.5 | 140.9 | 134.6 | 122.1 | |||||
As-reported earnings applicable to common equity adjusted for | ||||||||||
preferred dividends and tax-effected interest expense (B) | 781.4 | 600.1 | 586.9 | 548.7 | 562.2 | |||||
Special items | ||||||||||
Transmission business spin-merge expenses | — | — | — | (4.0 | ) | (11.2 | ) | |||
HCM implementation expenses | — | — | (3.5 | ) | (5.1 | ) | — | |||
Total special items (C) | — | — | (3.5 | ) | (9.1 | ) | (11.2 | ) | ||
Operational earnings adjusted for preferred | ||||||||||
dividends and tax-effected interest expense (B-C) | 781.4 | 600.1 | 590.4 | 557.8 | 573.4 | |||||
Operational earnings (A-C) | 622.0 | 440.9 | 441.7 | 415.4 | 443.5 | |||||
Average invested capital (D) | 10,266 | 9,481 | 9,235 | 8,977 | 8,257 | |||||
Average invested capital, excluding securitization (E) | 10,156 | 9,350 | 9,084 | 8,806 | 8,066 | |||||
Average members’ equity (F) | 4,910 | 4,487 | 4,282 | 4,335 | 4,066 | |||||
Gross debt (G) | 5,817 | 4,897 | 4,980 | 4,706 | 4,357 | |||||
Less securitization debt (H) | 99 | 121 | 141 | 162 | 179 | |||||
Gross debt, excluding securitization debt (G-H) | 5,718 | 4,776 | 4,839 | 4,545 | 4,178 | |||||
Less cash and cash equivalents (I) | 214 | 35 | 321 | 140 | 66 | |||||
Net debt, excluding securitization debt (G-H-I) | 5,504 | 4,741 | 4,518 | 4,405 | 4,112 | |||||
Total capitalization (J) | 10,898 | 9,634 | 9,327 | 9,143 | 8,811 | |||||
Less securitization debt (K) | 99 | 121 | 141 | 162 | 179 | |||||
Total capitalization, excluding securitization debt (J-K) | 10,799 | 9,513 | 9,186 | 8,981 | 8,632 | |||||
Less cash and cash equivalents (L) | 214 | 35 | 321 | 140 | 66 | |||||
Net capitalization, excluding securitization debt (J-K-L) | 10,585 | 9,478 | 8,865 | 8,841 | 8,566 | |||||
(%) | ||||||||||
ROIC – As-Reported (B/D) | 7.6 | 6.3 | 6.4 | 6.1 | 6.8 | |||||
ROIC – Operational ((B-C)/E) | 7.7 | 6.4 | 6.5 | 6.3 | 7.1 | |||||
Return on average members’ equity – As-Reported (A/F) | 12.7 | 9.8 | 10.2 | 9.4 | 10.6 | |||||
Return on average members’ equity – Operational ((A-C)/F) | 12.7 | 9.8 | 10.3 | 9.6 | 10.9 | |||||
Debt to capital (G/J) | 53.4 | 50.8 | 53.4 | 51.5 | 49.5 | |||||
Debt to capital ratio, excluding securitization debt ((G-H)/(J-K)) | 52.9 | 50.2 | 52.7 | 50.6 | 48.4 | |||||
Net debt to net capital, excluding securitization debt ((G-H-I)/(J-K-L)) | 52.0 | 50.0 | 51.0 | 49.8 | 48.0 | |||||
Calculations may differ due to rounding. | ||||||||||
(a) On Sept. 1, 2015, ELL transferred its Algiers assets to ENOI. The effect of the Algiers transfer has been retrospectively applied to ENOI's but not ELL's financial data presented in this report. | ||||||||||
REG G RECONCILIATIONS | ||||||||||
ENTERGY MISSISSIPPI FINANCIAL MEASURES – RECONCILIATION OF GAAP TO NON-GAAP MEASURES | ||||||||||
2012-2016 | ||||||||||
($ millions) | 2016 | 2015 | 2014 | 2013 | 2012 | |||||
As-reported earnings applicable to common stock (A) | 106.7 | 89.9 | 72.0 | 79.3 | 43.9 | |||||
Preferred dividends | 2.4 | 2.8 | 2.8 | 2.8 | 2.8 | |||||
Tax-effected interest expense | 33.3 | 34.6 | 34.3 | 35.4 | 34.0 | |||||
As-reported earnings applicable to common stock adjusted for preferred | ||||||||||
dividends and tax-effected interest expense (B) | 142.4 | 127.3 | 109.1 | 117.5 | 80.8 | |||||
Special items | ||||||||||
Transmission business spin-merge expenses | — | — | — | (0.9 | ) | (7.5 | ) | |||
HCM implementation expenses | — | — | (1.2 | ) | (4.5 | ) | — | |||
Total special items (C) | — | — | (1.2 | ) | (5.4 | ) | (7.5 | ) | ||
Operational earnings adjusted for preferred | ||||||||||
dividends and tax-effected interest expense (B-C) | 142.4 | 127.3 | 110.3 | 122.9 | 88.3 | |||||
Operational earnings (A-C) | 106.7 | 89.9 | 73.2 | 84.7 | 51.4 | |||||
Average invested capital (D) | 2,174 | 2,086 | 2,053 | 2,068 | 1,946 | |||||
Average common equity (E) | 1,053 | 987 | 957 | 916 | 858 | |||||
Gross debt (F) | 1,121 | 1,048 | 1,048 | 1,044 | 1,161 | |||||
Less cash and cash equivalents (G) | 77 | 146 | 62 | — | 53 | |||||
Net debt (F-G) | 1,044 | 902 | 986 | 1,044 | 1,108 | |||||
Total capitalization (H) | 2,236 | 2,110 | 2,061 | 2,046 | 2,091 | |||||
Less cash and cash equivalents (I) | 77 | 146 | 62 | — | 53 | |||||
Net capitalization (H-I) | 2,159 | 1,964 | 1,999 | 2,046 | 2,038 | |||||
(%) | ||||||||||
ROIC – As-Reported (B/D) | 6.6 | 6.1 | 5.3 | 5.7 | 4.2 | |||||
ROIC – Operational ((B-C)/D) | 6.6 | 6.1 | 5.4 | 5.9 | 4.5 | |||||
ROE – As-Reported (A/E) | 10.1 | 9.1 | 7.5 | 8.7 | 5.1 | |||||
ROE – Operational ((A-C)/E) | 10.1 | 9.1 | 7.7 | 9.3 | 6.0 | |||||
Debt to capital (F/H) | 50.2 | 49.7 | 50.9 | 51.0 | 55.5 | |||||
Net debt to net capital ((F-G)/(H-I)) | 48.4 | 45.9 | 49.3 | 51.0 | 54.4 | |||||
Calculations may differ due to rounding. | ||||||||||
ENTERGY NEW ORLEANS FINANCIAL MEASURES – RECONCILIATION OF GAAP TO NON-GAAP MEASURES (a) | ||||||||||
2012-2016 | ||||||||||
($ millions) | 2016 | 2015 | 2014 | 2013 | 2012 | |||||
As-reported earnings applicable to common stock (A) | 47.9 | 44.0 | 30.0 | 11.6 | 18.9 | |||||
Preferred dividends | 1.0 | 1.0 | 1.0 | 1.0 | 0.9 | |||||
Tax-effected interest expense | 12.7 | 10.3 | 9.8 | 9.9 | 8.3 | |||||
As-reported earnings applicable to common stock adjusted for preferred | ||||||||||
dividends and tax-effected interest expense (B) | 61.6 | 55.3 | 40.8 | 22.5 | 28.1 | |||||
Special items | ||||||||||
Transmission business spin-merge expenses | — | — | — | (0.1 | ) | (0.9 | ) | |||
HCM implementation expenses | — | — | (0.4 | ) | (2.7 | ) | — | |||
Total special items (C) | — | — | (0.4 | ) | (2.9 | ) | (0.9 | ) | ||
Operational earnings adjusted for preferred | ||||||||||
dividends and tax-effected interest expense (B-C) | 61.6 | 55.3 | 41.2 | 25.2 | 29.0 | |||||
Operational earnings (A-C) | 47.9 | 44.0 | 30.4 | 14.5 | 19.8 | |||||
Average invested capital (D) | 804 | 632 | 538 | 503 | 455 | |||||
Average invested capital, excluding securitization (E) | 714 | 584 | 538 | 503 | 455 | |||||
Average common equity (F) | 388 | 289 | 217 | 201 | 188 | |||||
Gross debt (G) | 449 | 343 | 304 | 298 | 266 | |||||
Less securitization debt (H) | 85 | 96 | — | — | — | |||||
Gross debt, excluding securitization debt (G-H) | 364 | 247 | 304 | 298 | 266 | |||||
Less cash and cash equivalents (I) | 103 | 89 | 42 | 33 | 9 | |||||
Net debt, excluding securitization debt (G-H-I) | 261 | 158 | 262 | 265 | 257 | |||||
Total capitalization (J) | 896 | 713 | 551 | 524 | 481 | |||||
Less securitization debt (K) | 85 | 96 | — | — | — | |||||
Total capitalization, excluding securitization debt (J-K) | 811 | 617 | 551 | 524 | 481 | |||||
Less cash and cash equivalents (L) | 103 | 89 | 42 | 33 | 9 | |||||
Net capitalization, excluding securitization debt (J-K-L) | 708 | 528 | 509 | 491 | 472 | |||||
(%) | ||||||||||
ROIC – As-Reported (B/D) | 7.7 | 8.7 | 7.6 | 4.5 | 6.2 | |||||
ROIC – Operational ((B-C)/E) | 8.6 | 9.5 | 7.7 | 5.0 | 6.4 | |||||
ROE – As-Reported (A/F) | 12.3 | 15.2 | 13.8 | 5.8 | 10.0 | |||||
ROE – Operational ((A-C)/F) | 12.3 | 15.2 | 14.0 | 7.2 | 10.5 | |||||
Debt to capital (G/J) | 50.1 | 48.1 | 55.1 | 56.9 | 55.2 | |||||
Debt to capital, excluding securitization debt ((G-H)/(J-K)) | 44.9 | 40.0 | 55.1 | 56.9 | 55.2 | |||||
Net debt to net capital, excluding securitization debt ((G-H-I)/(J-K-L)) | 36.9 | 30.0 | 51.3 | 53.9 | 54.4 | |||||
Calculations may differ due to rounding. | ||||||||||
(a) On Sept. 1, 2015, ELL transferred its Algiers assets to ENOI. The effect of the Algiers transfer has been retrospectively applied to ENOI's but not ELL's financial data presented in this report. | ||||||||||
REG G RECONCILIATIONS | ||||||||||
SYSTEM ENERGY RESOURCES FINANCIAL MEASURES – RECONCILIATION OF GAAP TO NON-GAAP MEASURES | ||||||||||
2012-2016 | ||||||||||
($ millions) | 2016 | 2015 | 2014 | 2013 | 2012 | |||||
As-reported net income (A) | 96.7 | 111.3 | 96.3 | 113.7 | 111.9 | |||||
Preferred dividends | — | — | — | — | — | |||||
Tax-effected interest expense | 21.9 | 26.7 | 35.1 | 23.0 | 23.4 | |||||
As-reported net income adjusted for preferred | ||||||||||
dividends and tax-effected interest expense (B) | 118.6 | 138.0 | 131.4 | 136.7 | 135.3 | |||||
Special items | ||||||||||
Transmission business spin-merge expenses | — | — | — | — | — | |||||
HCM implementation expenses | — | — | — | — | — | |||||
Total special items (C) | — | — | — | — | — | |||||
Operational earnings adjusted for preferred | ||||||||||
dividends and tax-effected interest expense (B-C) | 118.6 | 138.0 | 131.4 | 136.7 | 135.3 | |||||
Operational earnings (A-C) | 96.7 | 111.3 | 96.3 | 113.7 | 111.9 | |||||
Average invested capital (D) | 1,355 | 1,476 | 1,612 | 1,637 | 1,592 | |||||
Average common equity (E) | 760 | 826 | 873 | 854 | 817 | |||||
Gross debt (F) | 618 | 573 | 727 | 751 | 815 | |||||
Less cash and cash equivalents (G) | 246 | 231 | 223 | 127 | 84 | |||||
Net debt (F-G) | 372 | 342 | 504 | 624 | 731 | |||||
Total capitalization (H) | 1,357 | 1,354 | 1,598 | 1,627 | 1,648 | |||||
Less cash and cash equivalents (I) | 246 | 231 | 223 | 127 | 84 | |||||
Net capitalization (H-I) | 1,111 | 1,123 | 1,375 | 1,500 | 1,564 | |||||
(%) | ||||||||||
ROIC – As-Reported (B/D) | 8.8 | 9.3 | 8.2 | 8.3 | 8.5 | |||||
ROIC – Operational ((B-C)/D) | 8.8 | 9.3 | 8.2 | 8.3 | 8.5 | |||||
ROE – As-Reported (A/E) | 12.7 | 13.5 | 11.0 | 13.3 | 13.7 | |||||
ROE – Operational ((A-C)/E) | 12.7 | 13.5 | 11.0 | 13.3 | 13.7 | |||||
Debt to capital (F/H) | 45.5 | 42.3 | 45.7 | 46.2 | 49.5 | |||||
Net debt to net capital ((F-G)/(H-I)) | 33.5 | 30.5 | 36.9 | 41.6 | 46.8 | |||||
Calculations may differ due to rounding. | ||||||||||
REG G RECONCILIATIONS | ||||||||||
ENTERGY WHOLESALE COMMODITIES FINANCIAL AND OPERATIONAL METRICS – RECONCILIATION OF GAAP TO NON-GAAP MEASURES | ||||||||||
2012-2016 | ||||||||||
($ millions) | 2016 | 2015 | 2014 | 2013 | 2012 | |||||
As-reported net income (loss) attributable to Entergy Corporation (A) | (1,495.3 | ) | (1,067.8 | ) | 292.3 | 42.9 | 40.4 | |||
Less special items (B) | (1,855.3 | ) | (1,252.4 | ) | (101.8 | ) | (219.8 | ) | (223.5 | ) |
Operational earnings (A-B) | 360.0 | 184.6 | 394.1 | 262.7 | 263.9 | |||||
Net income (loss) | (1,493 | ) | (1,066 | ) | 295 | 43 | 40 | |||
Add back: interest expense | 23 | 27 | 17 | 16 | 18 | |||||
Add back: income tax expense | (1,192 | ) | (610 | ) | 177 | (77 | ) | 61 | ||
Add back: depreciation and amortization | 200 | 239 | 276 | 216 | 176 | |||||
Subtract: interest and investment income | 108 | 149 | 114 | 138 | 105 | |||||
Add back: decommissioning expense | 175 | 138 | 142 | 125 | 72 | |||||
Adjusted EBITDA | (2,396 | ) | (1,421 | ) | 792 | 185 | 262 | |||
Add back pre-tax special items for: | ||||||||||
HCM implementation expenses | — | — | 3 | 24 | — | |||||
Nuclear plant impairments and costs associated with decisions to close or sell plants | 2,910 | 2,054 | 154 | 343 | 356 | |||||
Top Deer investment impairment | — | 37 | — | — | — | |||||
Gain on sale of Rhode Island State Energy Center | — | (154 | ) | — | — | — | ||||
DOE litigation awards for Vermont Yankee and FitzPatrick | (34 | ) | — | — | — | — | ||||
Operational adjusted EBITDA | 480 | 515 | 950 | 553 | 618 | |||||
EWC As-reported net revenue (C) | 1,542 | 1,666 | 2,224 | 1,802 | 1,854 | |||||
EWC Special items included in net revenue: | ||||||||||
Items associated with decisions to close or sell plants | 41 | — | — | — | — | |||||
Total (D) | 41 | — | — | — | — | |||||
EWC Operational net revenue (C-D) | 1,501 | 1,666 | 2,224 | 1,802 | 1,854 | |||||
EWC Nuclear As-reported net revenue (E) | 1,533 | 1,613 | 2,166 | 1,737 | 1,957 | |||||
EWC Nuclear Special items included in net revenue: | ||||||||||
Items associated with decisions to close or sell plants | 41 | — | — | — | — | |||||
Total (F) | 41 | — | — | — | — | |||||
EWC Nuclear Operational net revenue (E-F) | 1,492 | 1,613 | 2,166 | 1,737 | 1,957 | |||||
Calculations may differ due to rounding. | ||||||||||
ENTERGY WHOLESALE COMMODITIES FINANCIAL AND OPERATIONAL METRICS – RECONCILIATION OF GAAP TO NON-GAAP MEASURES | ||||||||||||||||
1Q15-4Q16 | ||||||||||||||||
($ millions) | 1Q16 | 2Q16 | 3Q16 | 4Q16 | 1Q15 | 2Q15 | 3Q15 | 4Q15 | ||||||||
As-reported net income (loss) attributable to Entergy Corporation (G) | 79.0 | 250.3 | 7.7 | (1,832.3 | ) | 122.9 | (4.1 | ) | (1,032.0 | ) | (154.7 | ) | ||||
Less special items (H) | (12.9 | ) | 9.6 | (27.5 | ) | (1,824.6 | ) | (4.6 | ) | (1.1 | ) | (1,063.7 | ) | (183.0 | ) | |
Operational earnings (G-H) | 91.9 | 240.7 | 35.2 | (7.7 | ) | 127.5 | (3.0 | ) | 31.7 | 28.3 | ||||||
Net income (loss) | 80 | 251 | 8 | (1,832 | ) | 123 | (4 | ) | (1,032 | ) | (154 | ) | ||||
Add back: interest expense | 6 | 6 | 5 | 5 | 6 | 6 | 7 | 8 | ||||||||
Add back: income tax expense | 52 | (235 | ) | 6 | (1,016 | ) | 70 | (3 | ) | (555 | ) | (123 | ) | |||
Add back: depreciation and amortization | 56 | 46 | 53 | 45 | 62 | 64 | 60 | 53 | ||||||||
Subtract: interest and investment income | 27 | 34 | 27 | 21 | 50 | 36 | 29 | 33 | ||||||||
Add back: decommissioning expense | 31 | 39 | 47 | 58 | 35 | 33 | 33 | 36 | ||||||||
Adjusted EBITDA | 199 | 73 | 93 | (2,761 | ) | 247 | 60 | (1,515 | ) | (213 | ) | |||||
Add back pre-tax special items for: | ||||||||||||||||
Nuclear plant impairments and costs associated with decisions to close or sell plants | 20 | 19 | 42 | 2,829 | 7 | 2 | 1,644 | 401 | ||||||||
Top Deer investment impairment | — | — | — | — | — | — | — | 37 | ||||||||
Gain on sale of Rhode Island State Energy Center | — | — | — | — | — | — | — | (154 | ) | |||||||
DOE litigation awards for Vermont Yankee and FitzPatrick | — | (34 | ) | — | — | — | — | — | — | |||||||
Operational adjusted EBITDA | 219 | 58 | 135 | 68 | 254 | 62 | 129 | 70 | ||||||||
EWC As-reported net revenue (I) | 466 | 293 | 396 | 387 | 527 | 350 | 410 | 379 | ||||||||
EWC Special items included in net revenue: | ||||||||||||||||
Items associated with decisions to close or sell plants | — | — | 8 | 33 | — | — | — | — | ||||||||
Total (J) | — | — | 8 | 33 | — | — | — | — | ||||||||
EWC Operational net revenue (I-J) | 466 | 293 | 388 | 354 | 527 | 350 | 410 | 379 | ||||||||
EWC Nuclear As-reported net revenue (K) | 464 | 290 | 396 | 382 | 511 | 336 | 395 | 371 | ||||||||
EWC Nuclear Special items included in net revenue: | ||||||||||||||||
Items associated with decisions to close or sell plants | — | — | 8 | 33 | — | — | ||||||||||
Total (L) | — | — | 8 | 33 | — | — | — | — | ||||||||
EWC Nuclear Operational net revenue (K-L) | 464 | 290 | 388 | 349 | 511 | 336 | 395 | 371 | ||||||||
Calculations may differ due to rounding. | ||||||||||||||||
ENTERGY CORPORATION AND SUBSIDIARIES | ||||||||||||
INVESTOR NEWS | ENTERGY COMMON STOCK PRICES | |||||||||||
Entergy’s quarterly earnings results, webcasts, presentations, dividend | The high and low trading prices for each quarterly period in 2016 and 2015 | |||||||||||
action and other news and information of investor interest may be obtained | were as follows (in dollars): | |||||||||||
by visiting the investor information page on Entergy’s corporate website at | 2016 | 2015 | ||||||||||
entergy.com and the Investor Relations mobile web app at iretr.com, or by calling | QUARTER | HIGH | LOW | HIGH | LOW | |||||||
Entergy's Investor Relations information line at 1-888-ENTERGY (368-3749). | 1 | 79.72 | 65.38 | 90.33 | 73.88 | |||||||
2 | 81.36 | 72.67 | 79.84 | 69.06 | ||||||||
INVESTOR RELATIONS | 3 | 82.09 | 75.99 | 74.09 | 61.27 | |||||||
Securities analysts, portfolio managers, and other members of the financial | 4 | 76.56 | 66.71 | 70.67 | 63.90 | |||||||
community may contact: | ||||||||||||
David Borde | DIVIDEND PAYMENTS | |||||||||||
Vice President, Investor Relations | The Board of Directors declares dividends quarterly and sets the record and | |||||||||||
Telephone: 504-576-5668 | payment dates. Subject to Board discretion, those dates for 2017 are: | |||||||||||
E–mail: dborde@entergy.com | ||||||||||||
DECLARATION DATE | RECORD DATE | PAYMENT DATE | ||||||||||
SHAREHOLDER ACCOUNT INFORMATION | January 27 | February 9 | March 1 | |||||||||
Wells Fargo Shareowner Services is Entergy’s transfer agent, | April 5 | May 11 | June 1 | |||||||||
registrar, dividend disbursing agent, and dividend reinvestment | July 28 | August 10 | September 1 | |||||||||
and stock purchase plan agent. Shareholders of record with | October 27 | November 9 | December 1 | |||||||||
questions about lost certificates, lost or missing dividend checks | ||||||||||||
or notifications of change of address should contact: | Quarterly dividend payments (in cents-per-share): | |||||||||||
Wells Fargo Shareowner Services | ||||||||||||
P.O. Box 64874 | QUARTER | 2017 | 2016 | 2015 | 2014 | 2013 | ||||||
St. Paul, MN 55164-0874 | 1 | 87 | 85 | 83 | 83 | 83 | ||||||
Phone: 1-855-854-1360 | 2 | 87 | 85 | 83 | 83 | 83 | ||||||
Internet: www.shareholderonline.com | 3 | 85 | 83 | 83 | 83 | |||||||
4 | 87 | 85 | 83 | 83 | ||||||||
CORPORATE GOVERNANCE | ||||||||||||
Entergy’s Corporate Governance Guidelines, Board Committee Charters | PREFERRED STOCK DIVIDEND PAYMENTS | |||||||||||
for the Corporate Governance, Audit, and Personnel Committees, and | The board of directors for each preferred stock issuer declares preferred | |||||||||||
Entergy’s Code of Entegrity and other ethics policies may be accessed | dividends quarterly and sets the record and payment dates. Subject to | |||||||||||
electronically by selecting the investor information page on Entergy’s | their discretion, those dates for 2017 and 2018 are: | |||||||||||
corporate website at entergy.com. | ||||||||||||
UTILITY OPERATING COMPANY | RECORD DATE | PAYMENT DATE | ||||||||||
ADDITIONAL INFORMATION | Entergy Arkansas, Inc. | 12/19/16 | 1/3/17 | |||||||||
For copies of the above Corporate Governance documents, Entergy’s | 3/20/17 | 4/3/17 | ||||||||||
10-K and 10-Q reports filed with the Securities and Exchange | 6/21/17 | 7/3/17 | ||||||||||
Commission, or for other investor information, call 1-888-ENTERGY | 9/20/17 | 10/2/17 | ||||||||||
or write to: | 12/13/17 | 1/2/18 | ||||||||||
Entergy Corporation | 3/21/18 | 4/2/18 | ||||||||||
Investor Relations | 6/20/18 | 7/2/18 | ||||||||||
P.O. Box 61000 | 9/19/18 | 10/1/18 | ||||||||||
New Orleans, LA 70161 | Entergy Mississippi, Inc. | 1/20/17 | 2/1/17 | |||||||||
4/19/17 | 5/1/17 | |||||||||||
COMMON STOCK INFORMATION | 7/19/17 | 8/1/17 | ||||||||||
The company’s common stock is listed on the New York and Chicago | 10/23/17 | 11/1/17 | ||||||||||
exchanges under the symbol “ETR” (CUSIP 29364G103). The Entergy | 1/22/18 | 2/1/18 | ||||||||||
share price is reported daily in the financial press under “Entergy” in | 4/18/18 | 5/1/18 | ||||||||||
most listings of New York Stock Exchange securities. Entergy common | 7/20/18 | 8/1/17 | ||||||||||
stock is a component of the following indices: S&P 500, S&P Utilities | 10/22/18 | 11/1/18 | ||||||||||
Index, Philadelphia Utility Index and the NYSE Composite Index, | Entergy New Orleans, Inc. | 12/19/16 | 1/3/17 | |||||||||
among others. | 3/20/17 | 4/3/17 | ||||||||||
6/21/17 | 7/3/17 | |||||||||||
As of Jan. 31, 2017, there were 180,118,291 shares of Entergy | 9/20/17 | 10/2/17 | ||||||||||
common stock outstanding. Shareholders of record totaled | 12/13/17 | 1/2/18 | ||||||||||
27,382, and approximately 161,735 investors held Entergy stock in | 3/21/18 | 4/2/18 | ||||||||||
“street name” through a broker. | 6/20/18 | 7/2/18 | ||||||||||
9/19/18 | 10/1/18 | |||||||||||
CERTIFICATIONS | ||||||||||||
In May 2016, Entergy’s Chief Executive Officer certified to the | ||||||||||||
New York Stock Exchange that he was not aware of any violation | ||||||||||||
of the NYSE corporate governance listing standards. Also, Entergy | ||||||||||||
filed certifications regarding the quality of the company’s public | ||||||||||||
disclosure, required by Section 302 of the Sarbanes-Oxley Act of | ||||||||||||
2002, as exhibits to our Annual Report on Form 10-K for the fiscal year | ||||||||||||
ended Dec. 31, 2016. | ||||||||||||