Attached files
| file | filename |
|---|---|
| 8-K - 8-K - CITIZENS FINANCIAL GROUP INC/RI | d408381d8k.htm |
  Morgan Stanley Financials Conference June 13, 2017 Don McCree Vice Chairman, Head of Commercial Banking Exhibit 99.1 |
 Forward-looking statements and use of key performance metrics and Non-GAAP financial measures
2 This document contains forward-looking statements within the Private Securities Litigation Reform Act of 1995. Any statement that does not describe historical or current facts is a forward-looking statement. These statements often include the words “believes,” “expects,” “anticipates,” “estimates,” “intends,” “plans,” “goals,” “targets,” “initiatives,” “potentially,” “probably,” “projects,” “outlook” or similar expressions or future conditional verbs such as “may,” “will,” “should,” “would,” and “could.” Forward-looking statements are based upon the current beliefs and expectations of management, and on information currently available to management. Our statements speak as of the date hereof, and we do not assume any obligation to update these statements or to update the reasons why actual results could differ from those contained in such statements in light of new information or future events. We caution you, therefore, against relying on any of these forward-looking statements. They are neither statements of historical fact nor guarantees or assurances of future performance. While there is no assurance that any list of risks and uncertainties or risk factors is complete, important factors that could cause actual results to differ materially from those in the forward-looking statements include the following, without limitation: negative economic conditions that adversely affect the general economy, housing prices, the job market, consumer confidence and spending habits which may affect, among other things, the level of nonperforming assets, charge-offs and provision expense; the rate of growth in the economy and employment levels, as well as general business and economic conditions; our ability to implement our strategic plan, including the cost savings and efficiency components, and achieve our indicative performance targets; our ability to remedy regulatory deficiencies and meet supervisory requirements and expectations; liabilities and business restrictions resulting from litigation and regulatory investigations; our capital and liquidity requirements (including under regulatory capital standards, such as the Basel III capital standards) and our ability to generate capital internally or raise capital on favorable terms; the effect of the current low interest rate environment or changes in interest rates on our net interest income, net interest margin and our mortgage originations, mortgage servicing rights and mortgages held for sale; changes in interest rates and market liquidity, as well as the magnitude of such changes, which may reduce interest margins, impact funding sources and affect the ability to originate and distribute financial products in the primary and secondary markets; the effect of changes in the level of checking or savings account deposits on our funding costs and net interest margin; financial services reform and other current, pending or future legislation or regulation that could have a negative effect on our revenue and businesses, including the Dodd-Frank Act and other legislation and regulation relating to bank products and services; a failure in or breach of our operational or security systems or infrastructure, or those of our third party vendors or other service providers, including as a result of cyber attacks; and management’s ability to identify and manage these and other risks. In addition to the above factors, we also caution that the amount and timing of any future common stock dividends or share
repurchases will depend on our financial condition, earnings, cash needs, regulatory constraints, capital requirements (including requirements of our subsidiaries), and any other factors that our board of directors deems relevant
in making such a determination. Therefore, there can be no assurance that we will pay any dividends to holders of our common stock, or as to the amount of any such dividends.
More information about factors that could cause actual results to differ
materially from those described in the forward-looking statements can be found under “Risk Factors” in Part I, Item 1A in our Annual Report on Form 10-K for the year ended December 31, 2016, filed with the United States Securities and Exchange Commission on February 24,
2017. Key
Performance
Metrics and Non-GAAP Financial Measures and Reconciliations Key Performance Metrics: Our management team uses key performance metrics (KPMs) to gauge our performance and progress over time in achieving our strategic and operational goals and also in comparing our performance against our peers. We have established the following financial targets, in addition to others, as KPMs, which are utilized by our management in measuring our progress against financial goals and as a tool in helping assess performance for compensation purposes. These KPMs can largely be found in our periodic reports which are filed with the Securities and Exchange Commission, and are supplemented from time to time with additional information in connection with our quarterly earnings releases. Our key performance metrics include: Return on average tangible common equity (ROTCE); Return on average total tangible assets (ROTA); Efficiency ratio; Operating leverage; and Common equity tier 1 capital ratio (U.S. Basel III fully phased-in basis). In establishing goals for these KPMs, we determined that they would be measured on a management-reporting basis, or an operating basis, which we refer to externally as “Adjusted” or “Underlying” results. We believe that these “Adjusted” or “Underlying” results provide the best representation of our financial progress towards these goals as they exclude items that our management does not consider indicative of our on-going financial performance. KPMs that contain “Adjusted” or “Underlying” results are considered non-GAAP financial measures. Non-GAAP Financial Measures: This document contains non-GAAP financial measures. The tables in the appendix present reconciliations of our non-GAAP measures. These reconciliations exclude “Adjusted” or “Underlying” items, which are included, where applicable, in the financial results presented in accordance with GAAP. “Adjusted” or “Underlying” results, which are non-GAAP measures, exclude certain items, as applicable, that may occur in a reporting period which management does not consider indicative of on-going financial performance. The non-GAAP measures presented in the following tables include reconciliations to the most directly comparable GAAP measures and are: “noninterest income”, “total revenue”, “noninterest expense”, “pre-provision profit”, “income before income tax expense”, “income tax expense”, “effective income tax rate”, “net income”, “net income available to common stockholders”, “other income”, “salaries and employee benefits”, “outside services”, “amortization of software expense”, “other operating expense”, “net income per average common share”, “return on average common equity” and “return on average total assets”. We believe these non-GAAP measures provide useful information to investors because these are among the measures used by our management team to evaluate our operating performance and make day-to-day operating decisions. In addition, we believe our “Adjusted” or “Underlying” results in any period reflect our operational performance in that period and, accordingly, it is useful to consider our GAAP results and our “Adjusted” or “Underlying” results together. We believe this presentation also increases comparability of period-to-period results. Other companies may use similarly titled non-GAAP financial measures that are calculated differently from the way we calculate such measures. Accordingly, our non-GAAP financial measures may not be comparable to similar measures used by other companies. We caution investors not to place undue reliance on such non-GAAP measures, but instead to consider them with the most directly comparable GAAP measure. Non-GAAP financial measures have limitations as analytical tools, and should not be considered in isolation, or as a substitute for our results as reported under GAAP. |
 Summary Part of a solid franchise with leading positions Committed to uptiering leadership and talent Delivering a track record of growth Focused on broadening and deepening client relationships Producing continued momentum in fee income & deposit growth With stable asset quality Driving continuous improvement mindset to gain additional efficiencies and
improve returns
3 1 2 3 4 5 6 7 |
 Solid franchise with leading positions in attractive markets Dimension (1) Rank (2) Assets: $150.3 billion #12 Loans: $108.1 billion (4) #11 Deposits: $112.1 billion #12 nationally; Top 5 rank in 9/10 markets (3) Branches: ~1,200 #11 ATM network: ~3,200 #7 Mortgage: $15.4 billion #13 nationally (5) Education: $7.2 billion Top 4 rank nationally (6) HELOC: $14.0 billion Top 5 rank: 9/9 markets (7) Middle market lead/ joint lead bookrunner #5 (8) Leading deposit market share of 12.0% in top 10 MSAs (3) – #2 deposit market share in New England Relatively diverse economies/affluent demographics Serve 5 million+ individuals, institutions and companies ~17,500 colleagues Retail presence in 11 states Source: SNL Financial. Data as of 12/31/2016, unless otherwise noted.
1) CFG data as of March 31, 2017. 2) Ranking based on 03/31/2017 data, unless otherwise noted; excludes non-retail depository institutions, includes U.S.
subsidiaries of foreign banks. 3)
Source: FDIC, June 2016. Excludes “non-retail banks” as
defined by SNL Financial. The scope of “non-retail banks” is subject to the discretion of SNL Financial, but typically includes: industrial bank and non-depository trust charters, institutions with more than 20% brokered deposits (of total deposits), institutions with more than 20% credit card loans (of total loans), institutions deemed not to broadly participate in the banking services market and other non-retail
competitor banks. 4)
Excludes held for sale.
5) Inside Mortgage Finance Publications, Inc. Copyright © 2017. Bank-only origination rank.
6) CFG estimate, based on published company reports, where available; private student loan origination data as of 12/31/2016.
7)
According to Equifax; origination volume as of 4Q16.
8) Thomson Reuters LPC, Loan syndications 1Q17 ranking based on number of deals for Overall Middle Market (defined as Borrower
Revenues < $500MM and Deal Size < $500MM). Rank for
1Q17 deals represents management adjustments for deals not captured by league table rankings. Buffalo, NY: #5 Albany, NY: #3 Pittsburgh, PA: #2 Cleveland, OH: #4 Manchester, NH: #1 Boston, MA: #2 Rochester, NY: #5 Philadelphia, PA: #5 Detroit, MI: #8 Providence, RI: #1 Top 5 deposit market share in 9 of 10 largest MSAs (3) Complemented by select national businesses 4 1 |
 Robust product offerings and balanced business mix Corporate Banking Commercial Real Estate Franchise Finance Asset Finance PE/Sponsor Finance Healthcare/Technology/ Oil & Gas/Not-for-Profit verticals Capital Markets Global Markets Mergers and Acquisitions Treasury Solutions Commercial Deposit Services Retail Deposit Services Mobile/Online Banking Credit/Debit Card Wealth Management Home Equity loans/lines Mortgage Auto Education Finance Business Banking Unsecured & Installment Lending Consumer Commercial Deep client relationships + Extensive product set Targeting 50/50 Mix Period-end loans and leases (1) Drive cross sell and wallet share and deepen and enhance client relationships through behavioral-based thought leadership 1) Reflects loans and leases and loans and leases held for sale in our operating segments (Consumer and Commercial Banking). Excludes
non-core loans held in Other. Non-core assets are
primarily loans inconsistent with our strategic goals, generally as a result of geographic location, industry, product type or risk level. $106 billion 1Q17 $74 billion 2009 1 5 64% 36% Commercial Consumer 54% 46% Commercial Consumer |
 Commercial Banking key lines of business and products Northeast Jerry Sargent 35 years’ experience CFG 17 years Mid Atlantic Dan Fitzpatrick 30 years’ experience CFG 8 years $8.0B portfolio (1) $6.1B portfolio (1) Corporate Banking Steve Woods 32 years’ experience, CFG – 10 years 1) Period-end loans outstanding as of 3/31/2017. 2) Represents credit clients 3/1/17. 3) Period-end loans and leases outstanding as of 3/31/2017. Capital and Global Markets Ted Swimmer 25 years’ experience, CFG – 6 years Asset Finance Marc Paulhus 36 years’ experience CFG 13 years Business Capital Chris Carmosino 31 years’ experience CFG 10 years $4.7B portfolio (3) Product specialists; leverage our coverage bankers $1.2B portfolio (1) Asset-based focus Product specialists; leverage our coverage bankers Capital Markets Ted Swimmer 25 years’ experience, CFG 6 years 2016 fees:~$129MM Key products Debt & equity capital markets, M&A advisory Global Markets Tony Bedikian 22 years’ experience, CFG 3 years 2016 fees: ~$88MM Key products Foreign exchange, interest rate management Commercial Real Estate Treasury Solutions Mike Cummins 25 years’ experience, CFG 2 years 2016 fees: ~$158MM Key products Cash management, deposits, corporate credit cards, trade finance, letters of credit Treasury Solutions Franchise Finance Dave Farwell 26 years’ experience CFG 16 years $5.3B portfolio (1) CRE Gary Magnuson 35 years’ experience, CFG 25 years $10.2B portfolio (1) Key products Construction lines of credit, term loans, REIT finance Fee income-oriented businesses Southeast Brian Peters 30 years’ experience CFG <1 year Metro NYC Chapin Bates 35 years’ experience CFG <1 year $1.5B portfolio (1) $530MM portfolio (1) Midwest Offer Accepted $3.4B portfolio (1) National Sales Manager Mark Valentino 10 years’ experience CFG 2 years Pipeline management Sales territory design Industry Verticals Dan Fitzpatrick 30 years’ experience CFG 8 years $4.7B portfolio (1) 6 2 |
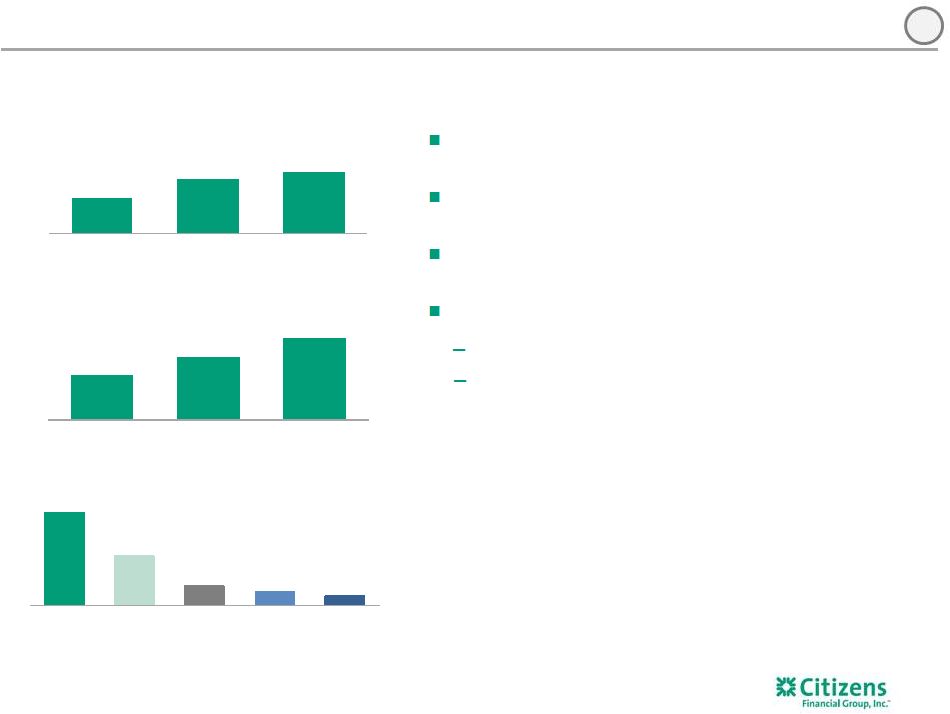
 Commercial Banking – Solid track record of delivering growth Note: Loan and deposit balances represent average balances. Loans exclude loans held for sales.
1) Includes Business Capital, Government & Professional Banking, Corporate Finance & Global Markets, Treasury Solutions, Corporate and Commercial Banking Admin. 2) Source: Barlow Research 2016 Voice of the Customer Survey, Top-2 box score, all Citizens Commercial Banking respondents
(n=606). 3)
Thomson Reuters LPC, Loan syndications 4Q16 ranking based on number of
deals for Overall Middle Market (defined as Borrower Revenues < $500MM and Deal Size < $500MM) as of 12/31/2016. $ billions Driving revenue improvement Strong loan growth Results reflect continued investment in talent, and enhanced product and
advisory capabilities
(1) $ millions 94% Barlow Overall Customer Satisfaction (2) 96% Relationship Manager Satisfaction (2) Top 10 Middle Market Syndications (3) 22% annual growth Lead-left or joint-lead relationships (3) Recognition 7 $43.8 $45.9 $46.5 $46.9 $48.0 1Q16 2Q16 3Q16 4Q16 1Q17 Middle Market CRE Asset Finance & Other Mid-corporate Franchise Finance Industry Verticals ~17% $399 $436 $450 $469 $480 1Q16 2Q16 3Q16 4Q16 1Q17 Net interest income Noninterest income Deposits $24.8 $25.1 $27.8 $29.4 $29.0 3 |
 8 Commercial Banking Segment Highlights 1) Please see important information on Key Performance Metrics and Non-GAAP Financial Measures at the beginning and end of this
presentation for an explanation of our use of these metrics
and non-GAAP financial measures and their reconciliation to GAAP financial measures. 2) Includes held for sale. 3) Excludes Business Banking, retail cards and non-core. 4) Operating segments are allocated capital on a risk-adjusted basis considering economic and regulatory capital requirements. We
approximate that regulatory capital is equivalent to
a sustainable target level for tier 1 common equity and then allocate that approximation to the segments based on economic capital. Positive operating leverage has driven 37% growth in pre-provision profit YoY 35% YoY growth in net income, driving improvement in ROTCE, efficiency ratio (1) Continued strong momentum in fee income driven by Capital Markets and Treasury Solutions Prudent balance sheet growth with 10% increase in loans and 17% increase in deposits YoY 1Q17 change from $s in millions 1Q17 4Q16 1Q16 4Q16 1Q16 $ % $ % Net interest income 346 $ 347 $ 300 $ (1) $ — % 46 $ 15 % Noninterest income 134 122 99 12 10 35 35 Total revenue 480 469 399 11 2 81 20 Noninterest expense 190 187 187 3 2 3 2 Pre-provision profit 290 282 212 8 3 78 37 Provision for credit losses 19 20 9 (1) (5) 10 111 Income before income tax expense 271 262 203 9 3 68 33 Income tax expense 91 90 70 1 1 21 30 Net income 180 $ 172 $ 133 $ 8 $ 5 % 47 $ 35 % Average balances $s in billions Total loans and leases (2) 48.2 $ 47.0 $ 43.9 $ 1.1 $ 2 % 4.3 $ 10 % Total deposits 29.0 $ 29.4 $ 24.8 $ (0.4) $ (1) % 4.1 $ 17 % Credit metrics Net charge-offs % (3) 0.16% 0.17% 0.08% (1) bps 7 bps Nonperforming loans % (3) 0.73% 0.67% 0.68% 5 bps 5 bps Key performance metrics ROTCE (1,4) 13.2% 12.9% 11.2% 24 bps 199 bps ROTA 1.5% 1.4% 1.2% 6 bps 30 bps Efficiency ratio (1) 40% 40% 47% (3) bps (694) bps 3 |
 4 Strong client-centric foundation that differentiates on service, expertise and expanding capabilities Targeting prudent client acquisition, especially in growth markets of Midwest, NYC metro and Southeast Thoughtful client selection and expanded product set expected to drive more lead relationships Driving deeper share of wallet with existing relationships Adding more product sales specialists Increasing coverage sophistication; digital FX process has 1,000+ clients receiving customized currency updates, tracking dashboard in place, salesforce
mobile being deployed in 2017
19% 10% 4% 3% 2% Northeast Mid Atlantic Mid West Metro NYC Southeast Broadening & deepening client relationships Capitalizing on strong satisfaction and share in core markets while developing growth markets 9 1) Source: Barlow Research Voice of Customer Survey (all non-CRE clients).
2) Middle Market credit clients and MCIV clients (not including Foreign Corporate) as of 9/30/2015. Products = corporate investing,
deposits, debt capital markets, cash management, corporate
card, equity capital markets, foreign exchange, international cash management, interest rate protection, loans, leases, standby letters of credit, trade and wealth management. 3) Defined as number of Commercial Banking regional credit clients as percentage of total regional prospects as assigned by
Salesforce.com. Source: Company Risk Data Mart (credit
client data) as of 12/31/2016 and Salesforce.com as of 4/5/2017. Dun and
Bradstreet data used for the following states in Midwest region: IN, WI, MN. 90% 93% 94% 2014 2015 2016 Corporate Banking overall client satisfaction (1) Corporate Banking product penetration by role 3+ products cross-sold (2) .
Corporate Banking Client Share by Region
(3) 51% 73% 95% Participant JLA Lead left |
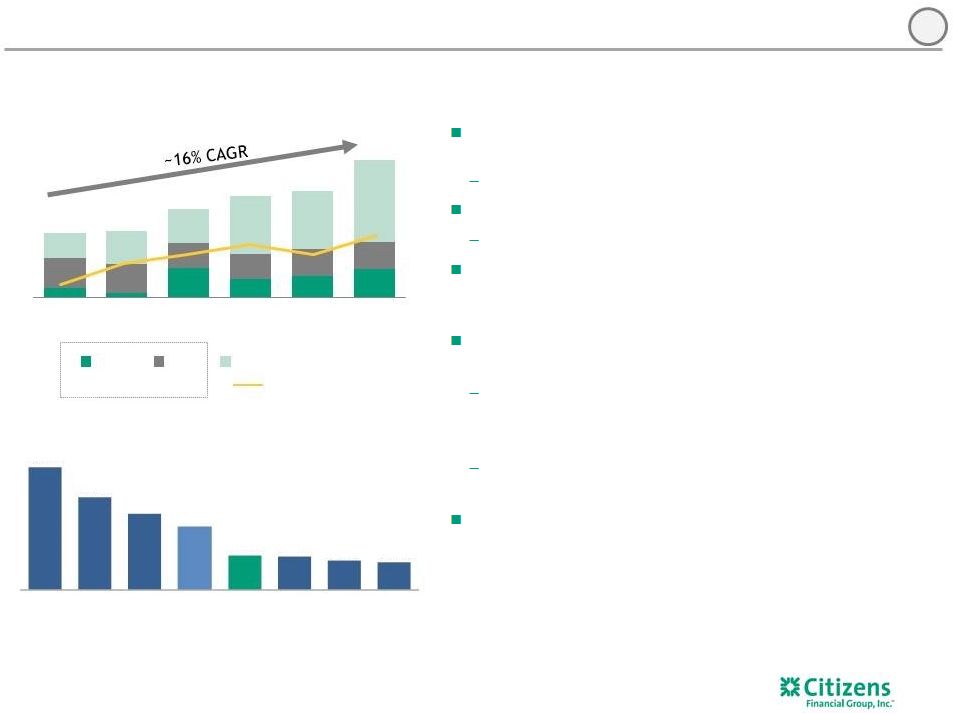 Corporate finance professionals (3) key to solutions-oriented model Added 20 professionals in prior 36 months Continue to build on strong success in loan syndications Maintain top ten or better league table status Expanded IRP and FX capabilities in Global Markets contributed to more than $11 million of incremental noninterest income YoY Opportunity to drive improved client penetration by further enhancing advisory and fixed income capabilities Addition of broker-dealer capabilities drove ~300% YoY increase in bond underwriting and M&A advisory fees in 1Q17 Western Reserve Partners acquisition closed May 2017; added 30+ M&A professionals (4) Continue to improve cross sell to credit-only clients Each 0.1% of Capital Markets fees/loans improvement could drive an estimated ~$50 million in annual fee income 1) Syndication transactions where CFG is the Lead Left or Joint Lead Arranger.
2) Source: SNL. Capital Markets fees defined as trading revenue, investment banking, advisory and underwriting fees. FY 2016 Average
Commercial loans defined as the average of quarter-end
balances. Peers includes BBT, CMA, KEY, MTB, RF and STI.
3) Corporate finance bankers defined as client-facing professionals within Citizens Financial Capital Markets (Director level and
above) focused on generating ideas/structures for clients
that result in revenues/fees.
4) Includes employees affiliated with WRP Valuation Services. Leveraging strong expertise and solutions-based orientation with
expanding capabilities
Continued growth opportunities in Global and Capital Markets
Capital and Global Markets fee income
Capital Markets revenue potential
(2) (FY 2016 Capital Markets fees/FY 2016 Average Commercial loans) $ millions Lead deals (1) 10 1.23% 0.93% 0.76% 0.64% 0.35% 0.33% 0.30% 0.28% RegionalRegionalRegional Peer 1 Peer 2 Peer 3 Peer Average CFG RegionalRegionalRegional Peer 4 Peer 5 Peer 6 79 109 121 136 122 149 $102 $105 $140 $161 $167 $217 2011 2012 2013 2014 2015 2016 Capital Markets IRP FX Global Markets 5 |
 Recent investments in platform, products and customer-facing talent providing underlying momentum Enhancing client digital experience with launch of continued upgrades across platform Continued enhancements in product set across spectrum of treasury and deposits solutions (Cash Concentration, Escrow, SmartSafe, Int. ACH) Improved go-to-market strategy and client-facing model
with uptiered sales organization
Executing traditional process improvement routines
Card and cash management onboarding efforts improving
client experience and time to revenue
Opportunity to drive improved cross-sell/client
penetration Differentiated product offerings for client
segments, including Franchise Finance and CRE
Refined segmentation strategies to capture more
Mid-corporate and Industry Verticals
clients Enhance focus on deposit-rich
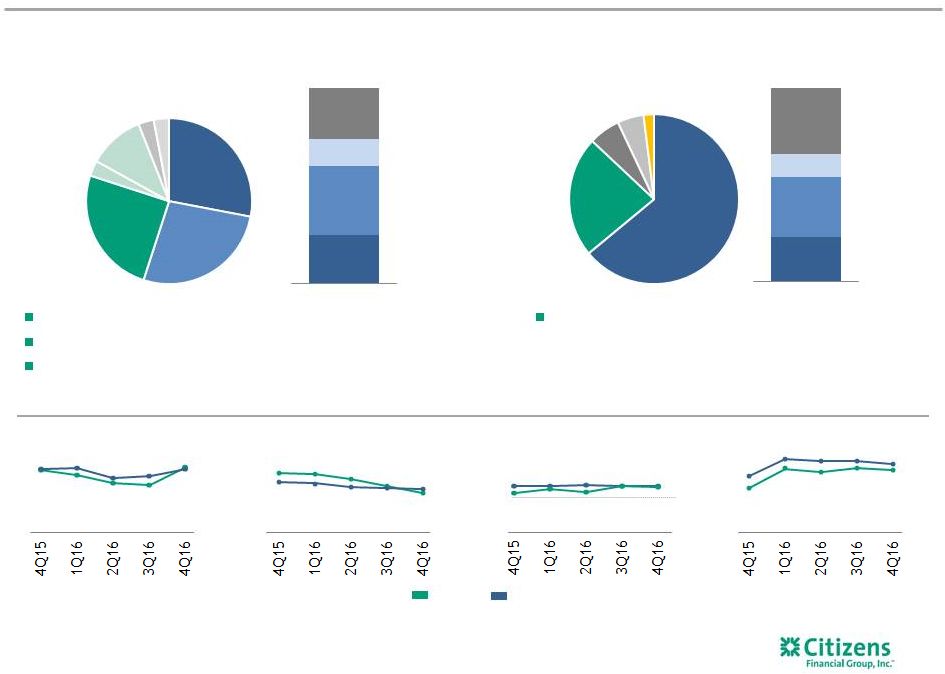
sectors Increased U.S. TS revenue market share from ~0.92%
to ~1.26%
over 2014 to 2016 (2) Look to continue to gain market share through deeper penetration of existing client base and improved cross-sell
for new credit originations
Treasury Solutions & Deposits
Improving our offering with focus on digital experience, product
enhancement, sales effectiveness and client
service Treasury
Solutions
Commercial
Banking
fees (1) $ millions Commercial Banking Deposits 1) Cash Management includes Trade Fees. Cards includes Sponsorship Management. Excludes Standby Letters of Credit not included in
Treasury Solutions previous to 2016. 2)
Source: Company data and Novantus; estimate of 2016 market share of ~$40 billion revenue, NII and fees market based on benchmarks and public filings. Treasury Solutions revenue includes Treasury Management, Accounts Receivable, Payables, Procurement and related Risk and Financial Control activities.
2015 estimated growth rates based on fee income
only. 11
2012 2013 2014 2015 2016 Cash Management Cards $104 $103 $106 $113 $127 ~9% ~4% CAGR $24.8B $25.1B $27.8B $29.4B $29.0B 1Q16 2Q16 3Q16 4Q16 1Q17 Deposit costs 0.17% 0.20% 0.25% 0.25% 0.32% Noninterest bearing deposits Regular savings Term other Checking with interest Money market 5 |
 5.3% 6.1% 5.4% 2014 2015 2016 18% 18% 19% 2014 2015 2016 We continue to smartly grow our balance sheet Good loan growth with rising yields Return on loan book regulatory capital improving (2) Commercial stressed losses as a % of loans have remained relatively stable (3) $ billions 1) Full-year average balances. 2) Reflects after-tax return calculated as loan interest income/regulatory capital assuming a CET1 target of 10.5%. Loans include
small business and non-core loans. 3)
Commercial loan losses as a percentage of the weighted-average
commercial and industrial and commercial real estate loan books based on FRB’s modeling under FBR Severely Adverse Scenario 9-quarter horizon for 2014, 2015 and 2016. 5% 5% Total commercial loans (1) 12 $40.9 $44.8 $49.2 2.86% 2.78% 3.01% 2014 2015 2016 Loan yield 20% 6 |
 Strong commitment to driving improving returns & efficiency Leveraging each colleague for process improvement Rigorously managing the balance sheet Prospecting priorities established by new National Sales Manager Head of Portfolio Management presides on Capital Allocation Committee Proactively managing out lower-returning accounts; ongoing review in place Efficiently organizing around client experience and time to revenue Leveraging bankers with deep product and industry expertise Formation of Commercial Priority Services for end-to-end experience Delivering scalability via digital platforms Loan, IRP and FX platforms Sales tools and improving MIS Robotics, electronic signature Embedding a culture of efficiency and continuous improvement Efficiency Ratio (1) ROTCE (1) and ROTA (1) 13 1Q16 2Q16 3Q16 4Q16 1Q17 ROTCE ROTA 1.2% 1.4% 1.4% 1.4% 1.5% 11.2% 13.0% 12.5% 12.9% 13.2% 46.7% 42.9% 40.2% 39.8% 39.8% 1Q16 2Q16 3Q16 4Q16 1Q17 7 1) Please see important information on Key Performance Metrics and Non-GAAP Financial Measures at the beginning and end of this
presentation for an explanation of our use of these metrics
and non-GAAP financial measures and their reconciliation to GAAP financial measures. Operating segments are allocated capital on a risk-adjusted basis considering economic and regulatory capital requirements. We
approximate that regulatory capital is equivalent to a
sustainable target level for common equity tier 1 and then allocate that approximation to the segments based on economic capital.
|
 Key messages Commercial Banking continues to deliver strong growth, reflecting expansion of
the franchise
Financial results paced by strong loan and deposit growth and build out
of fee-based businesses
Client satisfaction remains high; comprehensive approach to adding and
maintaining quality relationships
Asset quality is stable with portfolio growth in line with risk
appetite Mindset of continuous improvement underpinned by a
strong, customer-centric culture
14 |
 Appendix |
 At Citizens, continue to smartly grow our balance sheet Good loan growth with rising yields Return on loan book regulatory capital improving (2) Stress losses as a % of loans declining (3) Total loans $94 $108 (1) $ billions $99 16 2014 2015 2016 16% 10% 21% 21% 23% 2014 2015 2016 5.8% 5.1% 4.8% 2014 2015 2016 17% 1) Period-end loan balances; includes held-for sale. 2) Reflects after-tax return calculated as loan interest income/regulatory capital assuming a CET1 target of 10.5%.
3) Total loan losses as a percentage of the total loan book based on FRB Severely Adverse Scenario 9-quarter horizon for 2014, 2015 and 2016. Loan yield 3.34% 3.34% 3.58% |
 $56.0 billion 4Q16 retail portfolio 1) Source: Company data. Portfolio balances loan category, NCO and NPL data, FICO score, LTV ratio, loan term, lien position, risk
rating, property type, industry sector and geographic
stratifications as of December 31, 2016, as applicable.
2) Footprint defined as 11-state branch footprint (CT, DE, MA, MI, NH, NJ, NY, OH, PA, RI & VT) and contiguous states where
CFG maintains offices (IL, IN, KY, MD & ME).
3) Source: SNL Financial. Product view - regulatory reporting basis. Peer banks include CMA, BBT, FITB, KEY, MTB, PNC, RF, STI and USB. NPL% equals nonaccrual loans plus 90+ days past due and still-accruing loans (excluding FDIC “covered” loans and loans guaranteed by the U.S.
government) as a % of total. $51.7 billion
4Q16 commercial portfolio
Mid-
Atlantic
Midwest
New England
Leases
C&I
CRE Mid-Atlantic Midwest New England Diversified and granular loan mix Weighted-average FICO score of 759 82% collateralized 73% of the consumer real estate portfolio is secured by a 1 lien
Highly granular and diversified portfolio in terms of
geography, industry, asset class and rating
Home
Equity
Indirect
Auto Residential Mortgage Education Finance Credit Cards Other Non-Core Business Banking Retail NCO% Retail NPL% Commercial NPL% Commercial NCO% Out of footprint (1,2) CFG Peers
CFG vs. Peers
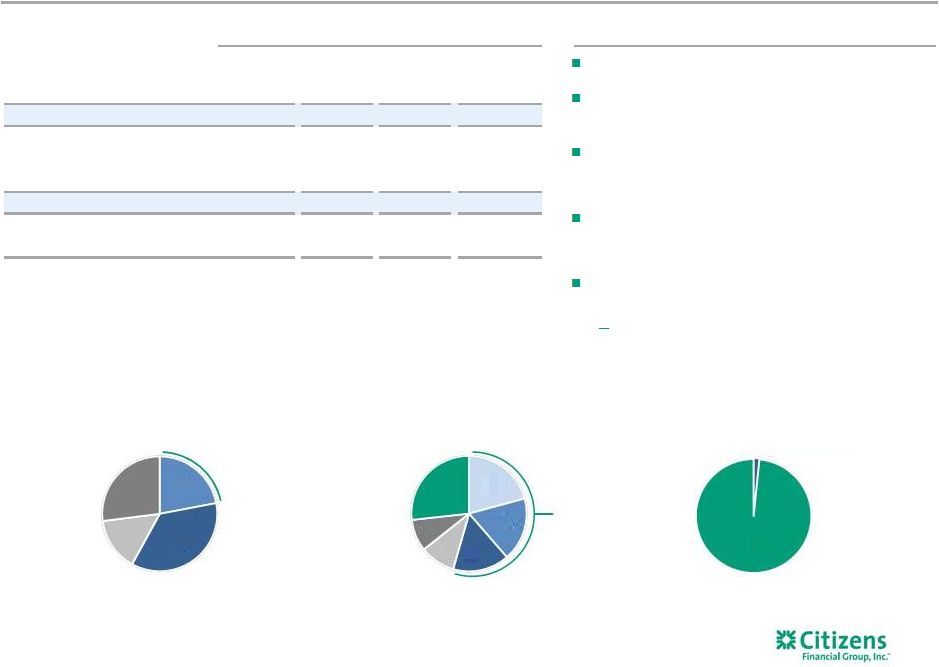
(3) Non-Core Out of footprint (1,2) 17 0.5% 0.5% 0.4% 0.6% 0.6% 0.5% 0.6% 0.5% 0.4% 0.6% 1.5% 1.5% 1.4% 1.2% 1.1% 1.3% 1.3% 1.2% 1.2% 1.2% 0.2% 0.2% 0.2% 0.2% 0.2% 0.0% 0.1% 0.2% 0.2% 0.1% 0.6% 1.0% 0.9% 0.9% 0.9% 0.3% 0.8% 0.7% 0.8% 0.7% 26% 14% 35% 25% 28% 27% 25% 3% 11% 3% 3% 34% 12% 31% 23% 64% 23% 6% 5% 2% st |
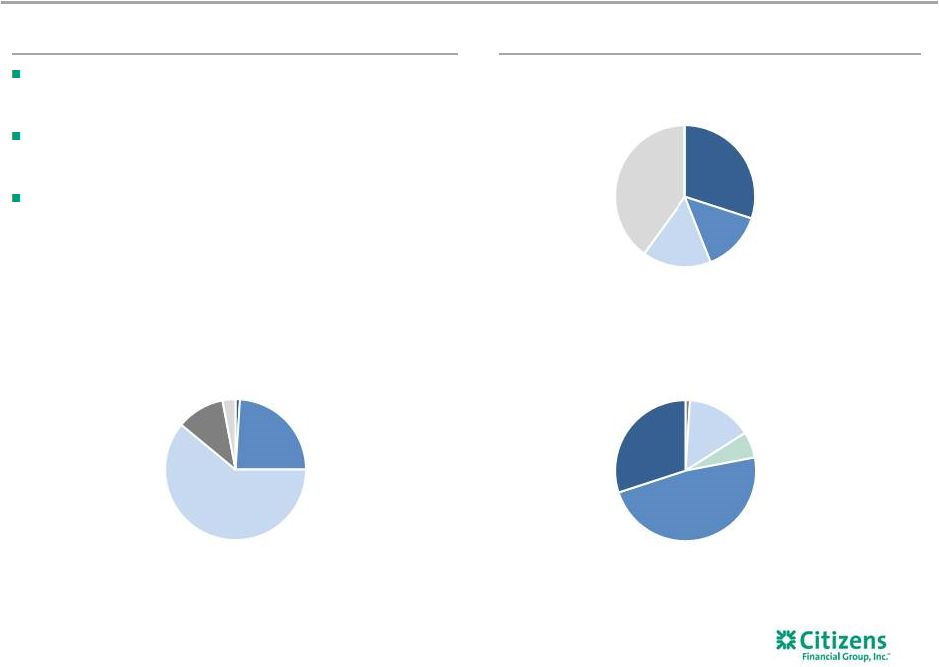
 Core commercial portfolio overview Asset quality relatively stable and has reached pre-crisis levels Overall credit risk is moderate and compares well with peers — $22.9 billion Shared National Credit portfolio as of 4Q16 — $10.0 billion Commercial Real Estate business portfolio as of 4Q16 Quality of new originations compares favorably to overall portfolio Highlights by Industry Sector (1) Rating agency-equivalent risk rating (5) 1) By industry SIC code 2) Comprises exposure to companies at risk from impact of declining oil prices
3) All Other stratifies over an additional 14 industry classifications with the largest portion representing no more than 1.47% of the
total portfolio 4)
Includes non oil-price sensitive industries such as Water Supply,
Sewer Systems, Refuse Systems and Sanitary Systems
5) Portfolio balances as of December 31, 2016. FICO score, LTV ratio, loan term, lien position, risk rating, property type, industry
sector and geographic stratifications current as of
December 31, 2016, as applicable 4Q16 $50.6 billion core
commercial portfolio Real Estate
All Other
(3) Food & Beverage Healthcare Business Services Machinery & Equipment Transportation Technology Banking & Financial Services Restaurants Oil & Gas (2) Entertainment Education services Chemicals Metals & Mining Healthcare products Lessors Automotive All other energy (4) Retailers 4% 3% 3% 3% 3% 8% 9% 9% 11% 11% 57% 58% 58% 62% 62% 26% 26% 27% 23% 23% 5% 3% 3% 1% 1% $46.2B $48.0B $49.6B $49.4B $50.6B 4Q15 1Q16 2Q16 3Q16 4Q16 AAA to A- BBB+ to BBB- BB+ to BB- B+ to B B- and Lower 18 20% 7% 6% 6% 6% 5% 5% 4% 4% 4% 3% 3% 3% 3% 2% 2% 2% 2% 2% 11% |
 Commercial Real Estate line of business overview Continued progress in uptiering portfolio to larger, more well-capitalized institutional and upper middle market borrowers – Investment Grade-Equivalent Risk- Rated portfolio up ~$257 million since 4Q15 76% of the portfolio is Project-Secured lending, 57% represented by income- producing projects and 22% Real Estate Investment Trusts, with a particular focus on mid-caps Approximately 2% land financing 4Q16 $10.0 billion Commercial Real Estate Line of Business by Facility Type Income producing REIT corporate facilities Construction Unsecured (excl. REITs) Other Land by Property Type Office Multi- family Industrial Land Healthcare Retail Non-CRE Collateral Highlights By Geography (1) 1) Portfolio balances as of December 31, 2016. FICO score, LTV ratio, loan term, lien position, risk rating, property type, industry
sector and geographic stratifications current as of
December 31, 2016, as applicable. Hospitality
Other CRE collateral
Unsecured
Rating agency-equivalent risk rating
19 23% 11% 22% 44% New England Midwest Mid-Atlantic Other 32% 20% 1% 17% 2% 7% 8% 2% 7% 4% 57% 1% 21% 2% 17% 2% 2% 2% 2% 1% 1% 9% 12% 12% 12% 10% 58% 57% 56% 59% 60% 30% 28% 29% 27% 28% 1% 1% 1% 1% 1% $8.7B $9.0B $9.5B $9.8B $10.0B 4Q15 1Q16 2Q16 3Q16 4Q16 AAA to A - BBB+ to BBB - BB+ to BB - B+ to B B- and Lower |
 Shared National Credit portfolio overview Investment grade-equivalent risk rating Highlights by Segment by Geography Out of footprint CA 7% TX 6% VA 4% FL 3% GA 2% TN 2% NC 1% WI 1% CO 1% DC 1% Other 12% BBB+ to BBB- AAA to A- BB+ to BB- B+ to B B- and Lower Midwest Mid-Atlantic Out of Footprint Northeast Mid-corporate & Specialties Corporate Finance Middle Market CRE Asset Finance 4Q16 $22.9 billion SNC portfolio Shared National Credits (SNC) $22.9 billion in outstanding balances Well-diversified portfolio with $12 million average outstanding balance Lead or Joint Lead Agent status on 31% of the portfolio (1) 1) As of 4Q16. Lead or Joint Lead status includes Administrative Arranger and Joint Leader Arranger roles.
20 1% 24% 61% 11% 3% 1% 15% 6% 48% 30% 30% 14% 16% 40% |
 $s in millions
Total O/S Utilized % Criticized % Nonaccrual status Less price-sensitive total 752 $ 61% 4% 2 $
Upstream 268 72% Oilfield Services 297 72% Reserve-based lending (RBL) 348 58% More price-sensitive total 914 66% 54% 158 Total Oil & Gas 1,666 $ 64% 31% 160 $ Total Oil & Gas ex. Aircraft 1,340 $ 58% 39% 158 $ Oil & Gas portfolio overview Highlights Total loans outstanding (2) Oil & Gas portfolio by Sub-sector (2) Oil & Gas portfolio by rating agency-equivalent risk rating (2) 4Q16 Oil & Gas outstandings (1) Well-diversified portfolio with ~100 clients Includes $326 million of corporate aircraft leases arising from Asset Finance Nonperforming loans down $33 million from 3Q16, largely reflecting pay downs on RBL portfolio Existing RBL commitments declined by 7% due to 4Q16 borrowing base redeterminations and restructuring activity Oil and gas portfolio loan loss reserves of $52 million as of 12/31/16 Reserves to total more price-sensitive loans of 7% remained stable with 3Q16 (3) 21 Oil & Gas B- and lower BBB+ to BBB- BB+ to BB- B+ to B 22% investment grade 22% 36% 15% 27% ~$900 million more sensitive to declining oil prices Midstream Integrated Downstream Reserve- based lending (RBL) Upstream, Non-RBL Oil Field Services 21% 18% 16% 10% 9% 26% All other loans 1.6% 98.4% 1) Includes Downstream, Integrated and Midstream sub-categories. 2) Portfolio balances, risk rating and industry sector stratifications as of December 31,
2016. 3) Reserves/(More price-sensitive Oil & Gas portfolio outstandings - leases
secured by aircraft ($129 million)). |
 Key performance metrics, Non-GAAP financial measures and reconciliations
$s in millions, except share, per share and ratio data
1Q17 4Q16 3Q16 2Q16 1Q16 $ % $ % Noninterest income, adjusted: Noninterest income (GAAP) $379 $377 $435 $355 $330 $2 1 % $49 15 % Less: Notable items — — 67 — — — — — — Noninterest income, adjusted (non-GAAP) $379 $377 $368 $355 $330 $2 1 % $49 15 % Total revenue, adjusted: Total revenue (GAAP) A $1,384 $1,363 $1,380 $1,278 $1,234 $21 2 % $150 12 % Less: Notable items — — 67 — — — — — — Total revenue, adjusted (non-GAAP) B $1,384 $1,363 $1,313 $1,278 $1,234 $21 2 % $150 12 % Noninterest expense, adjusted: Noninterest expense (GAAP) C $854 $847 $867 $827 $811 $7 1 % $43 5 % Less: Notable items — — 36 — — — — — — Noninterest expense, adjusted (non-GAAP) D $854 $847 $831 $827 $811 $7 1 % $43 5 % Pre-provision profit: Total revenue (GAAP) A $1,384 $1,363 $1,380 $1,278 $1,234 $21 2 % $150 12 % Noninterest expense (GAAP) C 854 847 867 827 811 7 1 43 5 Pre-provision profit (GAAP) $530 $516 $513 $451 $423 $14 3 % $107 25 % Pre-provision profit, adjusted: Total revenue, adjusted (non-GAAP) B $1,384 $1,363 $1,313 $1,278 $1,234 $21 2 % $150 12 % Less: Noninterest expense, adjusted (non-GAAP) D 854 847 831 827 811 7 1 43 5 Pre-provision profit, adjusted (non-GAAP) $530 $516 $482 $451 $423 $14 3 % $107 25 % Income before income tax expense, adjusted: Income before income tax expense (GAAP) $434 $414 $427 $361 $332 $20 5 % $102 31 % Less: Income before income tax expense (benefit) related to notable items
—
—
31 — — — — — — Income before income tax expense, adjusted (non-GAAP) $434 $414 $396 $361 $332 $20 5 % $102 31 % Income tax expense and effective income tax rate, adjusted: Income tax expense (GAAP) $114 $132 $130 $118 $109 ($18) (14%) $5 5 % Less: Income tax expense (benefit) related to notable items — — 12 — — — — — — Income tax expense, adjusted (non-GAAP) $114 $132 $118 $118 $109 ($18) (14%) $5 5 % Net income, adjusted: Net income (GAAP) E $320 $282 $297 $243 $223 $38 13 % $97 43 % Add: Notable items, net of income tax expense (benefit) — — (19) — — — — — — Net income, adjusted (non-GAAP) F $320 $282 $278 $243 $223 $38 13 % $97 43 % Net income available to common stockholders, adjusted: Net income available to common stockholders (GAAP) G $313 $282 $290 $243 $216 $31 11% $97 45 % Add: Notable items, net of income tax expense (benefit) — — (19) — — — — — — Net income available to common stockholders, adjusted (non-GAAP)
H $313 $282 $271 $243 $216 $31 11 % $97 45 % 4Q16 1Q16 QUARTERLY TRENDS 1Q17 Change 22 |
 Key performance metrics, Non-GAAP financial measures and reconciliations
$s in millions, except share, per share and ratio data
23 1Q17 4Q16 3Q16 2Q16 1Q16 $/bps % $/bps % Operating leverage: Total revenue (GAAP) A $1,384 $1,363 $1,380 $1,278 $1,234 $21 1.54 % $150 12.16 % Less: Noninterest expense (GAAP) C 854 847 867 827 811 7 0.83 43 5.30 Operating leverage 0.71 % 6.86 % Operating leverage, adjusted: Total revenue, adjusted (non-GAAP) B $1,384 $1,363 $1,313 $1,278 $1,234 $21 1.54 % $150 12.16 % Less: Noninterest expense, adjusted (non-GAAP) D 854 847 831 827 811 7 0.83 43 5.30 Operating leverage, adjusted (non-GAAP) 0.71 % 6.86 % Efficiency ratio and efficiency ratio, adjusted: Efficiency ratio C/A 61.68 % 62.18 % 62.88 % 64.71 % 65.66 % (50) bps (398) bps Efficiency ratio, adjusted (non-GAAP) D/B 61.68 62.18 63.31 64.71 65.66 (50) bps (398) bps Return on average common equity and return on average common equity, adjusted:
Average common equity (GAAP)
I $19,460 $19,645 $19,810 $19,768 $19,567 ($185) (1%) ($107) (1%) Return on average common equity G/I 6.52 % 5.70 % 5.82 % 4.94 % 4.45 % 82 bps 207 bps Return on average common equity, adjusted (non-GAAP) H/I 6.52 5.70 5.44 4.94 4.45 82 bps 207 bps Return on average tangible common equity and return on average tangible common equity, adjusted:
Average common equity (GAAP)
I $19,460 $19,645 $19,810 $19,768 $19,567 ($185) (1%) ($107) (1%) Less: Average goodwill (GAAP) 6,876 6,876 6,876 6,876 6,876 — — — — Less: Average other intangibles (GAAP) — 1 1 2 3 (1) (100) (3) (100) Add: Average deferred tax liabilities related to goodwill (GAAP) 531 523 509 496 481 8 2 50 10 Average tangible common equity J $13,115 $13,291 $13,442 $13,386 $13,169 ($176) (1%) ($54) —% Return on average tangible common equity G/J 9.68 % 8.43 % 8.58 % 7.30 % 6.61 % 125 bps 307 bps Return on average tangible common equity, adjusted (non-GAAP)
H/J 9.68 8.43 8.02 7.30 6.61 125 bps 307 bps Return on average total assets and return on average total assets, adjusted:
Average total assets (GAAP)
K $148,786 $147,315 $144,399 $142,179 $138,780 $1,471 1 % $10,006 7 % Return on average total assets E/K 0.87 % 0.76 % 0.82 % 0.69 % 0.65 % 11 bps 22 bps Return on average total assets, adjusted (non-GAAP) F/K 0.87 0.76 0.77 0.69 0.65 11 bps 22 bps Return on average total tangible assets and return on average total tangible assets, adjusted:
Average total assets (GAAP)
K $148,786 $147,315 $144,399 $142,179 $138,780 $1,471 1 % $10,006 7 % Less: Average goodwill (GAAP) 6,876 6,876 6,876 6,876 6,876 — — — — Less: Average other intangibles (GAAP) — 1 1 2 3 (1) (100) (3) (100) Add: Average deferred tax liabilities related to goodwill (GAAP) 531 523 509 496 481 8 2 50 10 Average tangible assets L $142,441 $140,961 $138,031 $135,797 $132,382 $1,480 1 % $10,059 8 % Return on average total tangible assets E/L 0.91 % 0.79 % 0.86 % 0.72 % 0.68 % 12 bps 23 bps Return on average total tangible assets, adjusted (non-GAAP) F/L 0.91 0.79 0.80 0.72 0.68 12 bps 23 bps QUARTERLY TRENDS 1Q17 Change 4Q16 1Q16 |
 Key performance metrics, Non-GAAP financial measures and reconciliations
$s in millions, except share, per share and ratio data
24 1Q17 4Q16 3Q16 2Q16 1Q16 $/bps % $/bps % Tangible book value per common share: Common shares - at end of period (GAAP) M 509,515,646 511,954,871 518,148,345 529,094,976 528,933,727 (2,439,225) —% (19,418,081) (4%) Common stockholders' equity (GAAP) $19,600 $19,499 $19,934 $19,979 $19,718 $101 1 ($118) (1) Less: Goodwill (GAAP) 6,876 6,876 6,876 6,876 6,876 — — — — Less: Other intangible assets (GAAP) — 1 1 2 3 (1) (100) (3) (100) Add: Deferred tax liabilities related to goodwill (GAAP) 534 532 519 507 494 2 — 40 8 Tangible common equity N $13,258 $13,154 $13,576 $13,608 $13,333 $104 1 % ($75) (1%) Tangible book value per common share N/M $26.02 $25.69 $26.20 $25.72 $25.21 $0.33 1 % $0.81 3 % Net income per average common share - basic and diluted, adjusted: Average common shares outstanding - basic (GAAP) O 509,451,450 512,015,920 519,458,976 528,968,330 528,070,648 (2,564,470) (1%) (18,619,198) (4%) Average common shares outstanding - diluted (GAAP) P 511,348,200 513,897,085 521,122,466 530,365,203 530,446,188 (2,548,885) — (19,097,988) (4) Net income available to common stockholders (GAAP) G $313 $282 $290 $243 $216 $31 11 $97 45 Net income per average common share - basic (GAAP) G/O 0.61 0.55 0.56 0.46 0.41 0.06 11 0.20 49 Net income per average common share - diluted (GAAP) G/P 0.61 0.55 0.56 0.46 0.41 0.06 11 0.20 49 Net income available to common stockholders, adjusted (non-GAAP)
H 313 282 271 243 216 31 11 97 45 Net income per average common share - basic, adjusted (non-GAAP) H/O 0.61 0.55 0.52 0.46 0.41 0.06 11 0.20 49 Net income per average common share - diluted, adjusted (non-GAAP) H/P 0.61 0.55 0.52 0.46 0.41 0.06 11 0.20 49 Pro forma U.S. Basel III fully phased-in common equity tier 1 capital ratio
: Common equity tier 1 capital (regulatory) $13,941 $13,822 $13,763 $13,768 $13,570 Less: Change in DTA and other threshold deductions (GAAP) — — — 1 1 Pro forma U.S. Basel III fully phased-in common equity tier 1 capital
Q $13,941 $13,822 $13,763 $13,767 $13,569 Risk-weighted assets (regulatory general risk weight approach)
$124,881
$123,857
$121,612
$119,492
$116,591
Add: Net change in credit and other risk-weighted assets
(regulatory) 247
244 228 228 232 Pro forma U.S. Basel III standardized approach risk-weighted assets
R $125,128 $124,101 $121,840 $119,720 $116,823 Pro forma U.S. Basel III fully phased-in common equity tier 1 capital ratio
1 Q/R 11.1 % 11.1 % 11.3 % 11.5 % 11.6 % QUARTERLY TRENDS 1Q17 Change 4Q16 1Q16 1 U.S. Basel III ratios assume certain definitions impacting qualifying U.S. Basel III capital, which otherwise will phase in through
2019, are fully phased-in. Ratios also reflect the required US Standardized methodology for calculating RWAs, effective January 1, 2015. 1 |
 Key performance metrics, Non-GAAP financial measures and reconciliations
$s in millions, except share, per share and ratio data
1Q17 4Q16 3Q16 2Q16 1Q16 $ % $ % Other income, adjusted Other income (GAAP) $24 $25 $87 $15 $20 ($1) (4%) $4 20 % Less: Notable items — — 67 — — — — — — Other income, adjusted (non-GAAP) $24 $25 $20 $15 $20 ($1) (4%) $4 20 % Salaries and employee benefits, adjusted: Salaries and employee benefits (GAAP) $444 $420 $432 $432 $425 $24 6 % $19 4 % Less: Notable items — — 11 — — — — — — Salaries and employee benefits, adjusted (non-GAAP) $444 $420 $421 $432 $425 $24 6 % $19 4 % Outside services, adjusted: Outside services (GAAP) $91 $98 $102 $86 $91 ($7) (7%) $— —% Less: Notable items — — 8 — — — — — — Outside services, adjusted (non-GAAP) $91 $98 $94 $86 $91 ($7) (7%) $— —% Occupancy, adjusted: Occupancy (GAAP) $82 $77 $78 $76 $76 $5 6 % $6 8 % Less: Notable items — — — — — — — — — Occupancy, adjusted (non-GAAP) $82 $77 $78 $76 $76 $5 6 % $6 8 % Equipment expense, adjusted: Equipment expense (GAAP) $67 $69 $65 $64 $65 ($2) (3%) $2 3 % Less: Notable items — — — — — — — — — Equipment expense, adjusted (non-GAAP) $67 $69 $65 $64 $65 ($2) (3%) $2 3 % Amortization of software, adjusted: Amortization of software (GAAP) $44 $44 $46 $41 $39 $— —% $5 13 % Less: Notable items — — 3 — — — — — — Amortization of software, adjusted (non-GAAP) $44 $44 $43 $41 $39 $— —% $5 13 % Other operating expense, adjusted: Other operating expense (GAAP) $126 $139 $144 $128 $115 ($13) (9%) $11 10 % Less: Notable items — — 14 — — — — — — Other operating expense, adjusted (non-GAAP) $126 $139 $130 $128 $115 ($13) (9%) $11 10 % 4Q16 1Q16 QUARTERLY TRENDS 1Q17 Change 25 |
 Key performance metrics, Non-GAAP financial measures and reconciliations
$s in millions, except share, per share and ratio data
2016 2015 2014 $ % Noninterest income, adjusted: Noninterest income (GAAP) $1,497 $1,422 $1,678 $75 5 % Less: Special items — — 288 — — Less: Notable items 67 — — 67 100 Noninterest income, adjusted (non-GAAP) $1,430 $1,422 $1,390 $8 1 % Total revenue, adjusted: Total revenue (GAAP) A $5,255 $4,824 $4,979 $431 9 % Less: Special items — — 288 — — Less: Notable items 67 — — 67 100 Total revenue, adjusted (non-GAAP) B $5,188 $4,824 $4,691 $364 8 % Noninterest expense, adjusted: Noninterest expense (GAAP) C $3,352 $3,259 $3,392 $93 3 % Less: Restructuring charges and special items — 50 169 (50) (100) Less: Notable items 36 — — 36 100 Noninterest expense, adjusted (non-GAAP) D $3,316 $3,209 $3,223 $107 3 % Pre-provision profit, adjusted: Total revenue, adjusted (non-GAAP) $5,188 $4,824 $4,691 $364 8 % Less: Noninterest expense, adjusted (non-GAAP) 3,316 3,209 3,223 107 3 Pre-provision profit, adjusted (non-GAAP) $1,872 $1,615 $1,468 $257 16 % Income before income tax expense, adjusted: Income before income tax expense (GAAP) E $1,534 $1,263 $1,268 $271 21 % Less: Income before income tax expense (benefit) related to restructuring charges
and special items
—
(50) 119 50 100 Less: Income before income tax expense (benefit) related to notable items
31 — — 31 100 Income before income tax expense, adjusted (non-GAAP) F $1,503 $1,313 $1,149 $190 14 % Income tax expense, adjusted: Income tax expense (GAAP) G $489 $423 $403 $66 16 % Less: Income tax expense (benefit) related to restructuring charges and special
items — (19) 44 19 100 Less: Income tax expense (benefit) related to notable items 12 — — 12 100 Income tax expense, adjusted (non-GAAP) H $477 $442 $359 $35 8 % Net income, adjusted: Net income (GAAP) I $1,045 $840 $865 $205 24 % Add: Restructuring charges and special items, net of income tax expense (benefit)
—
31 (75) (31) (100) Add: Notable items, net of income tax expense (benefit) (19) — — (19) (100) Net income, adjusted (non-GAAP) J $1,026 $871 $790 $155 18 % Net income available to common stockholders, adjusted: Net income available to common stockholders (GAAP) K $1,031 $833 $865 $198 24 % Add: Restructuring charges and special items, net of income tax expense (benefit)
—
31 (75) (31) (100) Add: Notable items, net of income tax expense (benefit) (19) — — (19) (100) Net income available to common stockholders, adjusted (non-GAAP)
L $1,012 $864 $790 $148 17 % Effective income tax rate, adjusted: Effective income tax rate G/E 31.88% 33.52% (164) bps Effective income tax rate, adjusted: H/F 31.74 33.67 (193) bps FULL YEAR 2016 Change 2015 26 |
 Key performance metrics, Non-GAAP financial measures and reconciliations
$s in millions, except share, per share and ratio data
2016 2015 2014 $/bps % Operating leverage: Total revenue (GAAP) A $5,255 $4,824 $431 8.93 % Less: Noninterest expense (GAAP) C 3,352 3,259 93 2.85 Operating leverage 6.08 % Operating leverage, adjusted: Total revenue, adjusted (non-GAAP) B $5,188 $4,824 $364 7.55 % Less: Noninterest expense, adjusted (non-GAAP) D 3,316 3,209 107 3.33 Operating leverage, adjusted (non-GAAP) 4.22 % Efficiency ratio and efficiency ratio, adjusted: Efficiency ratio C/A 63.80 % 67.56 % 68.12 % (376) bps Efficiency ratio, adjusted (non-GAAP) D/B 63.92 66.52 68.70 (260) bps Return on average common equity and return on average common equity,
adjusted: Average common equity (GAAP) M $19,698 $19,354 $19,399 $344 2 % Return on average common equity K/M 5.23 % 4.30 % 4.46 % 93 bps Return on average common equity, adjusted (non-GAAP) L/M 5.14 4.46 4.07 68 bps Return on average tangible common equity and return on average tangible
common equity, adjusted:
Average common equity (GAAP)
M $19,698 $19,354 $19,399 $344 2 % Less: Average goodwill (GAAP) 6,876 6,876 6,876 — — Less: Average other intangibles (GAAP) 2 4 7 (2) (50) Add: Average deferred tax liabilities related to goodwill (GAAP) 502 445 377 57 13 Average tangible common equity N $13,322 $12,919 $12,893 $403 3 % Return on average tangible common equity K/N 7.74 % 6.45 % 6.71 % 129 bps Return on average tangible common equity, adjusted (non-GAAP)
L/N 7.60 6.69 6.13 91 bps Return on average total assets and return on average total assets, adjusted:
Average total assets (GAAP)
O $143,183 $135,070 $127,624 $8,113 6 % Return on average total assets I/O 0.73 % 0.62 % 0.68 % 11 bps Return on average total assets, adjusted (non-GAAP) J/O 0.72 0.64 0.62 % 8 bps Return on average total tangible assets and return on average total tangible
assets, adjusted:
Average total assets (GAAP)
O $143,183 $135,070 $127,624 $8,113 6 % Less: Average goodwill (GAAP) 6,876 6,876 6,876 — — Less: Average other intangibles (GAAP) 2 4 7 (2) (50) Add: Average deferred tax liabilities related to goodwill (GAAP) 502 445 377 57 13 Average tangible assets P $136,807 $128,635 $121,118 $8,172 6 % Return on average total tangible assets I/P 0.76 % 0.65 % 0.71 % 11 bps Return on average total tangible assets, adjusted (non-GAAP) J/P 0.75 0.68 0.65 7 bps FULL YEAR 2016 Change 2015 27 |
 Key performance metrics, Non-GAAP financial measures and reconciliations
$s in millions, except share, per share and ratio data
2016 2015 2014 $/bps % Tangible book value per common share: Common shares - at end of period (GAAP) Q 511,954,871 527,774,428 545,884,519 (15,819,557) (3%) Common stockholders' equity (GAAP) $19,499 $19,399 $19,268 $100 1 Less: Goodwill (GAAP) 6,876 6,876 6,876 — — Less: Other intangible assets (GAAP) 1 3 6 (2) (67) Add: Deferred tax liabilities related to goodwill (GAAP) 532 480 420 52 11 Tangible common equity R $13,154 $13,000 $12,806 $154 1 % Tangible book value per common share R/Q $25.69 $24.63 $23.46 $1.06 4 % Net income per average common share - basic and diluted, adjusted:
Average common shares outstanding - basic (GAAP)
S 522,093,545 535,599,731 556,674,146 (13,506,186) (3%) Average common shares outstanding - diluted (GAAP) T 523,930,718 538,220,898 557,724,936 (14,290,180) (3) Net income available to common stockholders (GAAP) K $1,031 $833 $865 $198 24 Net income per average common share - basic (GAAP) K/S 1.97 1.55 1.55 0.42 27 Net income per average common share - diluted (GAAP) K/T 1.97 1.55 1.55 0.42 27 Net income available to common stockholders, adjusted (non-GAAP)
L 1,012 864 790 148 17 Net income per average common share - basic, adjusted (non-GAAP)
L/S 1.94 1.61 1.42 0.33 20 Net income per average common share - diluted, adjusted (non-GAAP)
L/T 1.93 1.61 1.42 0.32 20 FULL YEAR 2016 Change 2015 28 |
 Key performance metrics, Non-GAAP financial measures and reconciliations
$s in millions, except share, per share and ratio data
Consumer Commercial Other Consolidated Consumer Commercial Other Consolidated Consumer Commercial Other Consolidated Net income available to common stockholders: Net income (loss) (GAAP) A $95 $180 $45 $320 $92 $172 $18 $282 $92 $162 $43 $297 Less: Preferred stock dividends — — 7 7 — — — — — — 7 7 Net income available to common stockholders B $95 $180 $38 $313 $92 $172 $18 $282 $92 $162 $36 $290 Return on average tangible common equity: Average common equity (GAAP) $5,460 $5,528 $8,472 $19,460 $5,275 $5,278 $9,092 $19,645 $5,190 $5,172 $9,448 $19,810 Less: Average goodwill (GAAP) — — 6,876 6,876 — — 6,876 6,876 — — 6,876 6,876 Average other intangibles (GAAP) — — — — — — 1 1 — — 1 1 Add: Average deferred tax liabilities related to goodwill (GAAP) — — 531 531 — — 523 523 — — 509 509 Average tangible common equity C $5,460 $5,528 $2,127 $13,115 $5,275 $5,278 $2,738 $13,291 $5,190 $5,172 $3,080 $13,442 Return on average tangible common equity B/C 7.06 % 13.18 % NM 9.68 % 6.97 % 12.94 % NM 8.43 % 7.04 % 12.50 % NM 8.58 % Return on average total tangible assets: Average total assets (GAAP) $58,660 $49,243 $40,883 $148,786 $58,066 $48,024 $41,225 $147,315 $56,689 $47,902 $39,808 $144,399 Less: Average goodwill (GAAP) — — 6,876 6,876 — — 6,876 6,876 — — 6,876 6,876 Average other intangibles (GAAP) — — — — — — 1 1 — — 1 1 Add: Average deferred tax liabilities related to goodwill (GAAP) — — 531 531 — — 523 523 — — 509 509 Average tangible assets D $58,660 $49,243 $34,538 $142,441 $58,066 $48,024 $34,871 $140,961 $56,689 $47,902 $33,440 $138,031 Return on average total tangible assets A/D 0.66 % 1.48 % NM 0.91 % 0.63 % 1.42 % NM 0.79 % 0.64 % 1.35 % NM 0.86 % Efficiency ratio: Noninterest expense (GAAP) E $647 $190 $17 $854 $649 $187 $11 $847 $650 $181 $36 $867 Net interest income (GAAP) 638 346 21 1,005 639 347 — 986 621 327 (3) 945 Noninterest income (GAAP) 220 134 25 379 227 122 28 377 229 123 83 435 Total revenue (GAAP) F $858 $480 $46 $1,384 $866 $469 $28 $1,363 $850 $450 $80 $1,380 Efficiency ratio E/F 75.41 % 39.80 % NM 61.68 % 74.90 % 39.83 % NM 62.18 % 76.46 % 40.21 % NM 62.88 % 2017 2016 2016 THREE MONTHS ENDED MAR 31, THREE MONTHS ENDED DEC 31, THREE MONTHS ENDED SEPT 30, Consumer Commercial Other Consolidated Consumer Commercial Other Consolidated Net income available to common stockholders: Net income (loss) (GAAP) A $90 $164 ($11) $243 $71 $133 $19 $223 Less: Preferred stock dividends — — — — — — 7 7 Net income available to common stockholders B $90 $164 ($11) $243 $71 $133 $12 $216 Return on average tangible common equity: Average common equity (GAAP) $5,110 $5,040 $9,618 $19,768 $5,089 $4,790 $9,688 $19,567 Less: Average goodwill (GAAP) — — 6,876 6,876 — — 6,876 6,876 Average other intangibles (GAAP) — — 2 2 — — 3 3 Add: Average deferred tax liabilities related to goodwill (GAAP) — — 496 496 — — 481 481 Average tangible common equity C $5,110 $5,040 $3,236 $13,386 $5,089 $4,790 $3,290 $13,169 Return on average tangible common equity B/C 7.09 % 13.04 % NM 7.30 % 5.59 % 11.19 % NM 6.61 % Return on average total tangible assets: Average total assets (GAAP) $55,660 $47,388 $39,131 $142,179 $55,116 $45,304 $38,360 $138,780 Less: Average goodwill (GAAP) — — 6,876 6,876 — — 6,876 6,876 Average other intangibles (GAAP) — — 2 2 — — 3 3 Add: Average deferred tax liabilities related to goodwill (GAAP) — — 496 496 — — 481 481 Average tangible assets D $55,660 $47,388 $32,749 $135,797 $55,116 $45,304 $31,962 $132,382 Return on average total tangible assets A/D 0.65 % 1.39 % NM 0.72 % 0.52 % 1.18 % NM 0.68 % Efficiency ratio: Noninterest expense (GAAP) E $632 $186 $9 $827 $616 $187 $8 $811 Net interest income (GAAP) 602 314 7 923 581 300 23 904 Noninterest income (GAAP) 219 122 14 355 208 99 23 330 Total revenue (GAAP) F $821 $436 $21 $1,278 $789 $399 $46 $1,234 Efficiency ratio E/F 76.98 % 42.88 % NM 64.71 % 78.08 % 46.74 % NM 65.66 % THREE MONTHS ENDED JUNE 30, THREE MONTHS ENDED MAR 31, 2016 2016 29 |
 Key performance metrics, Non-GAAP financial measures and reconciliations
$s in millions, except share, per share and ratio data
1Q17 4Q16 1Q16 $/bps % $/bps % Income before income tax expense (GAAP) A $434 $414 $332 $20 4.8 % $102 30.7 % Income tax expense and effective income tax rate, underlying: Income tax expense (GAAP) B $114 $132 $109 ($18) (13.6)% $5 4.6 % Less: Settlement of certain state tax matters (23) — — (23) (100.0) (23) (100.0) Income tax expense, underlying C $137 $132 $109 $5 3.8 % $28 25.7 % Effective income tax rate (GAAP) B/A 26.36 % 31.90 % 32.87 % (554) bps (651) bps Effective income tax rate, underlying C/A 31.56 31.90 32.87 (34) bps (131) bps Net income, underlying: Net income (GAAP) D $320 $282 $223 $38 13.5 % $97 43.5 % Less: Settlement of certain state tax matters 23 — — 23 100.0 23 100.0 Net income, underlying E $297 $282 $223 $15 5.3 % $74 33.2 % Net income available to common stockholders, underlying: Net income available to common stockholders (GAAP) F $313 $282 $216 $31 11.0 % $97 44.9 % Less: Settlement of certain state tax matters 23 — — 23 100.0 23 100.0 Net income available to common stockholders, underlying G $290 $282 $216 $8 2.8 % $74 34.3 % Return on average common equity and return on average common equity, underlying:
Average common equity (GAAP)
H $19,460 $19,645 $19,567 ($185) (0.9)% ($107) (0.5)% Return on average common equity F/H 6.52 % 5.70 % 4.45 % 82 bps 207 bps Return on average common equity, underlying G/H 6.05 5.70 4.45 35 bps 160 bps Return on average tangible common equity and return on average tangible common equity, underlying:
Average common equity (GAAP)
H $19,460 $19,645 $19,567 ($185) (0.9)% ($107) (0.5)% Less: Average goodwill (GAAP) 6,876 6,876 6,876 — — — — Less: Average other intangibles (GAAP) — 1 3 (1) (100.0) (3) (100.0) Add: Average deferred tax liabilities related to goodwill (GAAP) 531 523 481 8 1.5 50 10.4 Average tangible common equity I $13,115 $13,291 $13,169 ($176) (1.3)% ($54) (0.4)% Return on average tangible common equity F/I 9.68 % 8.43 % 6.61 % 125 bps 307 bps Return on average tangible common equity, underlying G/I 8.98 8.43 6.61 55 bps 237 bps Return on average total assets and return on average total assets, underlying:
Average total assets (GAAP)
J $148,786 $147,315 $138,780 $1,471 1.0 % $10,006 7.2 % Return on average total assets D/J 0.87 % 0.76 % 0.65 % 11 bps 22 bps Return on average total assets, underlying E/J 0.81 0.76 0.65 5 bps 16 bps Return on average total tangible assets and return on average total tangible assets, underlying:
Average total assets (GAAP)
J $148,786 $147,315 $138,780 $1,471 1.0 % $10,006 7.2 % Less: Average goodwill (GAAP) 6,876 6,876 6,876 — — — — Less: Average other intangibles (GAAP) — 1 3 (1) (100.0) (3) (100.0) Add: Average deferred tax liabilities related to goodwill (GAAP) 531 523 481 8 1.5 50 10.4 Average tangible assets K $142,441 $140,961 $132,382 $1,480 1.0 % $10,059 7.6 % Return on average total tangible assets D/K 0.91 % 0.79 % 0.68 % 12 bps 23 bps Return on average total tangible assets, underlying E/K 0.85 0.79 0.68 6 bps 17 bps Net income per average common share - basic and diluted, underlying:
Average common shares outstanding - basic (GAAP)
L 509,451,450 512,015,920 528,070,648 (2,564,470) (0.5)% (18,619,198) (3.5)% Average common shares outstanding - diluted (GAAP) M 511,348,200 513,897,085 530,446,188 (2,548,885) (0.5) (19,097,988) (3.6) Net income available to common stockholders (GAAP) F $313 $282 $216 $31 11.0 $97 44.9 Net income per average common share - basic (GAAP) F/L 0.61 0.55 0.41 0.06 10.9 0.20 48.8 Net income per average common share - diluted (GAAP) F/M 0.61 0.55 0.41 0.06 10.9 0.20 48.8 Net income available to common stockholders, underlying G 290 282 216 8 2.8 74 34.3 Net income per average common share - basic, underlying
G/L 0.57 0.55 0.41 0.02 3.6 0.16 39.0 Net income per average common share - diluted, underlying
G/M 0.57 0.55 0.41 0.02 3.6 0.16 39.0 QUARTERLY TRENDS 1Q17 Change 4Q16 1Q16 30 |
 Key performance metrics, Non-GAAP financial measures and reconciliations
$s in millions, except share, per share and ratio data
MAR. 31, DEC. 31, SEP. 30, JUNE 30, MAR. 31, DEC. 31, SEP. 30, JUNE 30, MAR. 31, DEC. 31, SEP. 30, JUNE 30, MAR. 31, DEC. 31, SEP. 30, 2017 2016 2016 2016 2016 2015 2015 2015 2015 2014 2014 2014 2014 2013 2013 Total revenue, adjusted: Total revenue (GAAP) A $1,384 $1,363 $1,380 $1,278 $1,234 $1,232 $1,209 $1,200 $1,183 $1,179 $1,161 $1,473 $1,166 $1,158 $1,153 Less: Special items — — — — — — — — — — — 288 — — — Less: Notable items — — 67 — — — — — — — — — — — — Total revenues, adjusted (non-GAAP) B $1,384 $1,363 $1,313 $1,278 $1,234 $1,232 $1,209 $1,200 $1,183 $1,179 $1,161 $1,185 $1,166 $1,158 $1,153 Noninterest expense, adjusted: Noninterest expense (GAAP) C $854 $847 $867 $827 $811 $810 $798 $841 $810 $824 $810 $948 $810 $818 $788 Less: Restructuring charges and special items — — — — — — — 40 10 33 21 115 — 26 — Less: Notable items — — 36 — — — — — — — — — — — — Noninterest expense, adjusted (non-GAAP) D $854 $847 $831 $827 $811 $810 $798 $801 $800 $791 $789 $833 $810 $792 $788 Efficiency ratio and efficiency ratio, adjusted: Efficiency ratio C/A 62 % 62% 63 % 65% 66% 66 % 66% 70 % 68% 70% 70 % 64% 69 % 71 % 68% Efficiency ratio, adjusted (non-GAAP) D/B 62 62 63 65 66 66 66 67 68 67 68 70 69 68 68 Net income, adjusted: Net income (GAAP) E $320 $282 $297 $243 $223 $221 $220 $190 $209 $197 $189 $313 $166 $152 $144 Add: Restructuring charges and special items, net of income tax expense (benefit)
—
—
—
—
—
—
—
25 6 20 13 (108) — 17 — Add: Notable items, net of income tax expense (benefit) — — (19) — — — — — — — — — — — — Net income, adjusted (non-GAAP) F $320 $282 $278 $243 $223 $221 $220 $215 $215 $217 $202 $205 $166 $169 $144 Net income per average common share - diluted, and net income per average common share - diluted,
adjusted Net income available to common stockholders
(GAAP) G
$313 $282 $290 $243 $216 $221 $213 $190 $209 $197 $189 $313 $166 $152 $144 Add: Restructuring charges and special items, net of income tax expense (benefit)
—
—
—
—
—
—
—
25 6 20 13 (108) — 17 — Add: Notable items, net of income tax expense (benefit) — — (19) — — — — — — — — — — — — Net income available to common stockholders, adjusted (non-GAAP)
H $313 $282 $271 $243 $216 $221 $213 $215 $215 $217 $202 $205 $166 $169 $144 Average common shares outstanding - diluted (GAAP) P 511,348,200 513,897,085 521,122,466 530,365,203 530,446,188 530,275,673 533,398,158 539,909,366 549,798,717 550,676,298 560,243,747 559,998,324 559,998,324 559,998,324 559,998,324 Net income per average common share - diluted G/P $0.61 $0.55 $0.56 $0.46 $0.41 $0.42 $0.40 $0.35 $0.38 $0.36 $0.34 $0.56 $0.30 $0.27 $0.26 Net income per average common share - diluted, adjusted (non-GAAP)
H/P 0.61 0.55 0.52 0.46 0.41 0.42 0.40 0.40 0.39 0.39 0.36 0.37 0.30 0.30 0.26 Return on average tangible common equity and return on average tangible common equity, adjusted:
Average common equity (GAAP)
$19,460
$19,645
$19,810
$19,768
$19,567
$19,359
$19,261
$19,391
$19,407
$19,209
$19,411
$19,607
$19,370
$19,364
$19,627
Less: Average goodwill (GAAP)
6,876 6,876 6,876 6,876 6,876 6,876 6,876 6,876 6,876 6,876 6,876 6,876 6,876 6,876 6,876 Less: Average other intangibles (GAAP) — 1 1 2 3 3 4 5 5 6 6 7 7 8 9 Add: Average deferred tax liabilities related to goodwill (GAAP) 531 523 509 496 481 468 453 437 422 403 384 369 351 342 325 Average tangible common equity J $13,115 $13,291 $13,442 $13,386 $13,169 $12,948 $12,834 $12,947 $12,948 $12,730 $12,913 $13,093 $12,838 $12,822 $13,067 Return on average tangible common equity G/J 9.68 % 8.43 % 8.58 % 7.30 % 6.61 % 6.75 % 6.60 % 5.90 % 6.53 % 6.12 % 5.81 % 9.59 % 5.24 % 4.71 % 4.34 % Return on average tangible common equity, adjusted (non-GAAP)
H/J 9.68 8.43 8.02 7.30 6.61 6.75 6.60 6.67 6.73 6.76 6.22 6.28 5.24 5.24 4.34 Return on average total tangible assets and return on average total tangible assets, adjusted:
Average total assets (GAAP)
K $148,786 $147,315 $144,399 $142,179 $138,780 $136,298 $135,103 $135,521 $133,325 $130,671 $128,691 $127,148 $123,904 $120,393 $117,386 Less: Average goodwill (GAAP) 6,876 6,876 6,876 6,876 6,876 6,876 6,876 6,876 6,876 6,876 6,876 6,876 6,876 6,876 6,876 Less: Average other intangibles (GAAP) — 1 1 2 3 3 4 5 5 6 6 7 7 8 9 Add: Average deferred tax liabilities related to goodwill (GAAP) 531 523 509 496 481 468 453 437 422 403 384 369 351 342 325 Average tangible assets L $142,441 $140,961 $138,031 $135,797 $132,382 $129,887 $128,676 $129,077 $126,866 $124,192 $122,193 $120,634 $117,372 $113,851 $110,826 Return on average total tangible assets E/L 0.91 % 0.79 % 0.86 % 0.72 % 0.68 % 0.67 % 0.68 % 0.59 % 0.67 % 0.63 % 0.61 % 1.04 % 0.57 % 0.53 % 0.52 % Return on average total tangible assets, adjusted (non-GAAP) F/L 0.91 0.79 0.80 0.72 0.68 0.67 0.68 0.67 0.69 0.69 0.66 0.68 0.57 0.59 0.52 FOR THE THREE MONTHS ENDED 31 |
 |