Attached files
| file | filename |
|---|---|
| EX-99.1 - EX-99.1 - GOLDEN ENTERTAINMENT, INC. | d408030dex991.htm |
| 8-K - 8-K - GOLDEN ENTERTAINMENT, INC. | d408030d8k.htm |
Exhibit 99.2

GOLDEN ENTERTAINMENTTM
CASINOS DISTRIBUTED GAMING
INVESTOR PRESENTATION JUNE 2017
AMERCIAN CASINO & ENTERTAINMENT
PROPERTIES LLC
Forward Looking Statements and Financial Information
GOLDEN ENTERTAINMENTTM
CASINOS DISTRIBUTED GAMING
Forward-Looking Statements
This presentation contains forward-looking statements regarding
future events and our future results, including statements regarding the proposed acquisition of the outstanding membership interests of American Casino & Entertainment Properties, LLC (the “Transaction”) and the ability to
consummate the proposed Transaction, that are subject to the safe harbors created under the Securities Act of 1933 and the Securities Exchange Act of 1934. Forward-looking statements can generally be identified by the use of words such as
“anticipate,” “believe,” “continue,” “could,” “estimate,” “expect,” “forecast,” “intend,” “may,” “plan,” “project,” “potential,”
“seek,” “should,” “think,” “will,” “would” and similar expressions, or they may use future dates. Forward-looking statements in this presentation include, without limitation, statements regarding:
the planned completion of the Transaction; the benefits of the Transaction; estimated future financial and operating results, including the Company’s, American’s and the pro forma combined companies’ 2017 net revenues, 2017 EBITDA and
run-rate synergies, and the expected accretive effect of the Transaction on the Company’s operating results including its cash flows and earnings per share; the Company’s plans, objectives, expectations and intentions; and the expected
timing of completion of the Transaction. It is important to note that the Company’s goals and expectations are not predictions of actual performance. These forward-looking statements are subject to assumptions, risks and uncertainties that may
change at any time, and readers are therefore cautioned that actual results could differ materially from those expressed in any forward-looking statements. Factors that could cause actual results to differ include, among other things: the ability to
obtain required regulatory approvals for the Transaction (including the approval of gaming and antitrust authorities necessary to complete the Transaction), the timing of obtaining such approvals and the risk that such approvals may result in the
imposition of conditions that could materially adversely affect the Company, American and the expected benefits of the Transaction; the risk that a condition to closing of the Transaction may not be satisfied on a timely basis or at all, the failure
of the Transaction to close for any other reason and the risk of liability to the Company in connection therewith; access to available financing (including financing for the acquisition) on a timely basis and on reasonable terms; the effects of
disruption caused by the Transaction making it more difficult for the Company to execute its operating plan effectively or to maintain relationships with employees, vendors and other business partners; failure to realize the anticipated cost
savings, synergies and other benefits of the Transaction; stockholder litigation in connection with the Transaction; the Company’s ability to successfully integrate American’s businesses, and other acquired businesses; changes in national,
regional and local economic, political and market conditions; legislative and regulatory matters (including the cost of compliance or failure to comply with applicable laws and regulations); increases in gaming taxes and fees in the jurisdictions in
which the Company operates; litigation; increased competition; the Company’s ability to renew its distributed gaming contracts; reliance on key personnel (including our Chief Executive Officer, Chief Operating Officer and Chief Strategy and
Financial Officer); the level of the Company’s indebtedness and the Company’s ability to comply with covenants in its debt facilities; terrorist incidents; natural disasters; severe weather conditions; the effects of environmental and
structural building conditions; the effects of disruptions to the Company’s information technology and other systems and infrastructure; factors affecting the gaming, entertainment and hospitality industries generally; and other risks and
uncertainties discussed in the Company’s filings with the SEC, including the “Risk Factors” section of the Company’s Annual Report on Form 10-K for the year ended December 31, 2016. The Company undertakes no obligation to
update any forward-looking statements as a result of new information, future developments or otherwise. All forward-looking statements in this presentation are qualified in their entirety by this cautionary statement.
Financial Information and Non-GAAP Financial Measures
All information presented for quarterly
or annualized periods, including for the last twelve months (“LTM”) ended March 31, 2017, is unaudited. This presentation includes non-GAAP financial measures to supplement financial information presented on a GAAP basis. Golden
believes these measures are appropriate to enhance an overall understanding of Golden’s and American’s past financial performance and the combined companies’ prospects for the future. Golden defines adjusted EBITDA as earnings before
interest and other non-operating income (expense), income taxes, depreciation and amortization, preopening expenses, transaction expenses, share-based compensation expenses, executive severance and sign-on bonuses, impairments and other gains and
losses. However, the presentation of this additional information is not meant to be considered in isolation or as a substitute for measures of financial performance prepared in accordance with GAAP. Reconciliations of Golden’s adjusted EBITDA
for each of 2016 and LTM ended March 31, 2017 to the most comparable GAAP financial information are set forth in Appendix A to the Company’s Investor Presentation dated May 2017, which is located in the Investors section of the
Company’s website at www.goldenent.com and is incorporated herein by reference.
PAGE 1
Acquisition Highlights
GOLDEN ENTERTAINMENTTM
CASINOS DISTRIBUTED GAMING
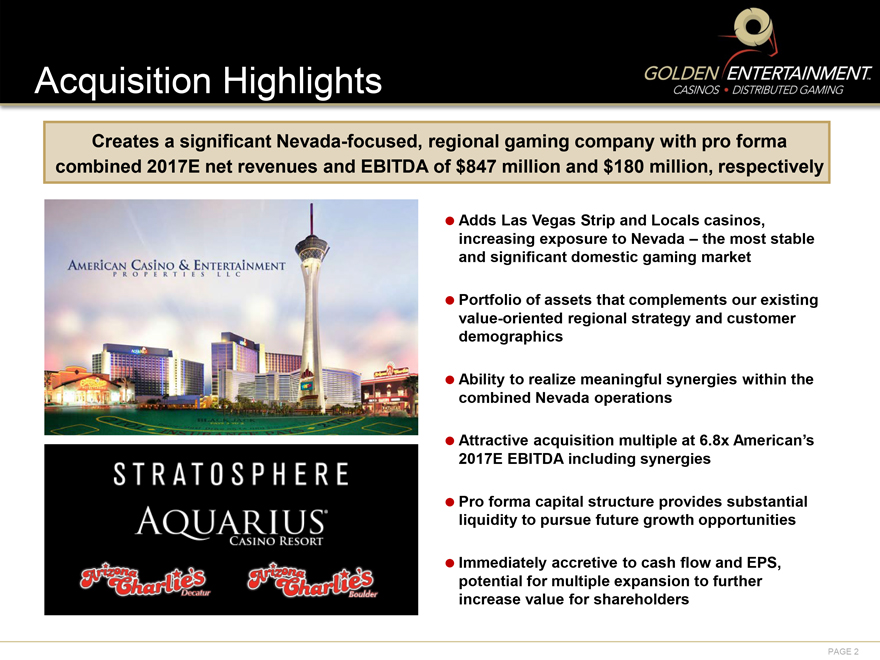
Creates a significant Nevada-focused, regional gaming company with pro forma combined 2017E net revenues and EBITDA of $847 million and $180 million, respectively
AMERCIAN CASINO & ENTERTAINMENT
PROPERTIES LLC
STRATOSPHERE
AQUARIUS
CASINO RESORT
ARIZONA CHARLIE’S
DECATUR
ARIZONA CHARLIE’S
BOULDER
Adds Las Vegas Strip and Locals casinos, increasing exposure to Nevada – the most
stable and significant domestic gaming market
Portfolio of assets that complements our existing value-oriented regional strategy and customer demographics
Ability to realize meaningful synergies within the combined Nevada operations
Attractive acquisition multiple at 6.8x American’s 2017E EBITDA including synergies
Pro forma capital structure provides substantial liquidity to pursue future growth opportunities
Immediately accretive to cash flow and EPS, potential for multiple expansion to further increase value for shareholders
PAGE 2
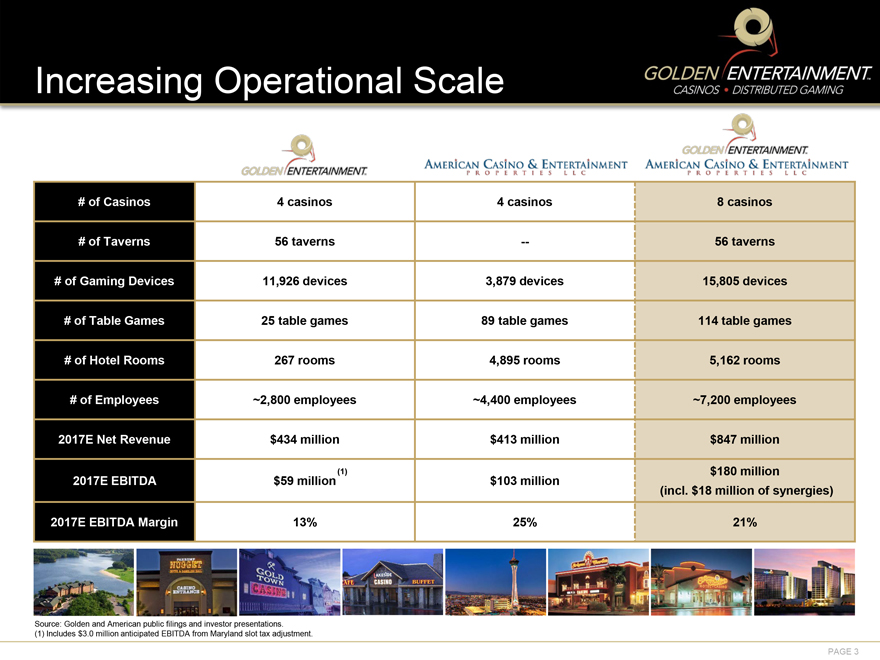
Increasing Operational Scale
GOLDEN ENTERTAINMENTTM
CASINOS DISTRIBUTED GAMING
GOLDEN ENTERTAINMENT
AMERICAN CASINO & ENTERTAINMENT PROPERTIES LLC
GOLDEN ENTERTAINMENT AMERICAN CASINO & ENTERTAINMENT PROPERTIES LLC
# of Casinos 4 casinos
4 casinos 8 casinos
# of Taverns 56 taverns -- 56 taverns
# of Gaming Devices
11,926 devices 3,879 devices 15,805 devices
# of Table Games 25 table games 89 table games 114 table games
# of Hotel Rooms 267 rooms 4,895 rooms 5,162 rooms
# of Employees ~2,800 employees ~4,400
employees ~7,200 employees
2017E Net Revenue $434 million $413 million $847 million
2017E EBITDA $59 million(1) $103 million $180 million (incl. $18 million of synergies)
2017E
EBITDA Margin 13% 25% 21%
Source: Golden and American public filings and investor presentations.
(1) Includes $3.0 million anticipated EBITDA from Maryland slot tax adjustment.
PAGE 3
NUGGET CASINO ENTRANCE
GOLD TOWN CASINO
CAFE LAKESIDE CASINO BUFFET
HOTEL CASINO
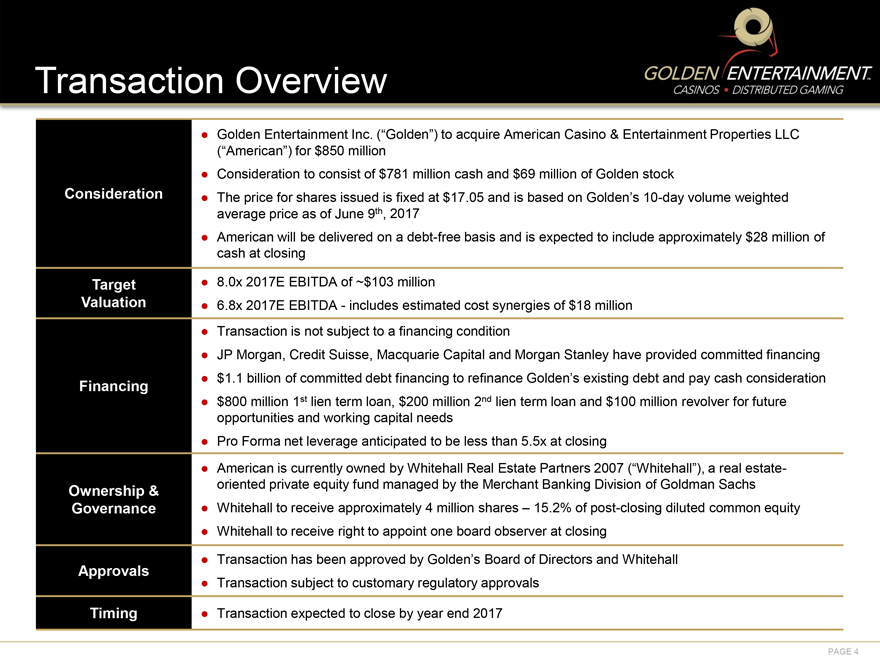
Transaction Overview
GOLDEN ENTERTAINMENTTM
CASINOS DISTRIBUTED GAMING
Golden Entertainment Inc. (“Golden”) to acquire American Casino & Entertainment Properties LLC (“American”) for $850 million
Consideration to consist of $781 million cash and $69 million of Golden stock
Consideration
The price for shares issued is fixed at $17.05 and is based on Golden’s 10-day volume weighted average price as of June 9th, 2017
American will be delivered on a debt-free basis and is expected to include approximately $28 million of cash at closing
8.0x 2017E EBITDA of ~$103 million
Target Valuation
6.8x 2017E EBITDA - includes estimated cost synergies of $18 million
Transaction is not
subject to a financing condition
JP Morgan, Credit Suisse, Macquarie Capital and Morgan Stanley have provided committed financing
Financing
$1.1 billion of committed debt financing to refinance Golden’s existing debt
and pay cash consideration
$800 million 1st lien term loan, $200 million 2nd lien term loan and $100 million revolver for future opportunities and working capital
needs
Pro Forma net leverage anticipated to be less than 5.5x at closing
American is currently owned by Whitehall Real Estate Partners 2007 (“Whitehall”), a real estate-oriented private equity fund managed by the Merchant
Banking Division of Goldman Sachs
Ownership & Governance
Whitehall to
receive approximately 4 million shares – 15.2% of post-closing diluted common equity
Whitehall to receive right to appoint one board observer at closing
Transaction has been approved by Golden’s Board of Directors and Whitehall
Approvals
Transaction subject to customary regulatory approvals
Timing
Transaction expected to close by year end 2017
PAGE 4
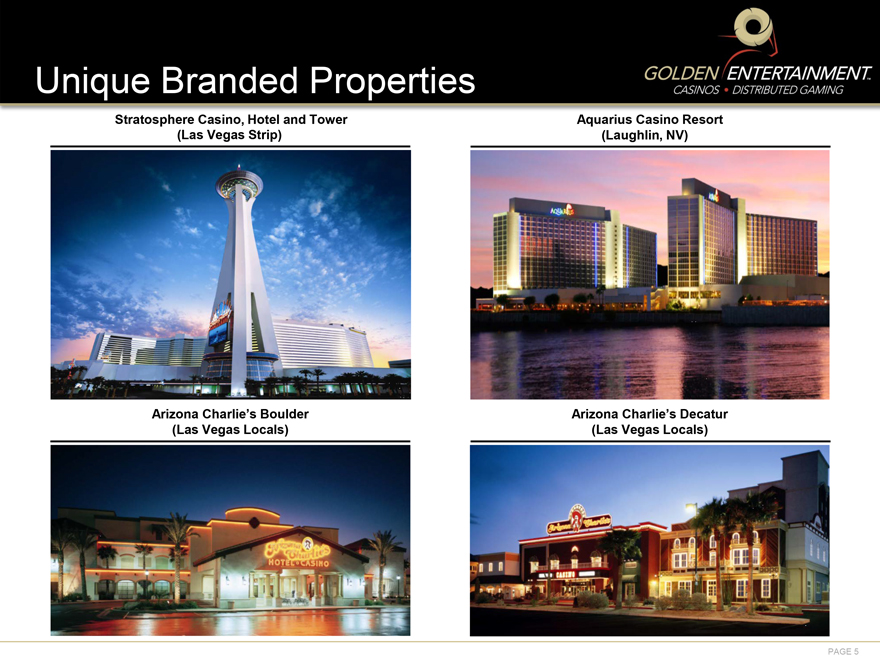
Unique Branded Properties
GOLDEN ENTERTAINMENTTM
CASINOS DISTRIBUTED GAMING
Stratosphere Casino, Hotel and Tower
Aquarius Casino Resort
(Las Vegas Strip)
(Laughlin, NV)
Arizona Charlie’s Boulder
Arizona Charlie’s Decatur
(Las Vegas Locals)
(Las Vegas Locals)
PAGE 5

Compelling Southern
Nevada Casino Presence
GOLDEN ENTERTAINMENTTM
CASINOS DISTRIBUTED GAMING
Cross-marketing and other operational synergies
Johnnie 95 95 160 95 156 15 Crystal Valley of Fire Dry Lake 167 178 160 564 93 515 15 95 165 164 95 15 95 15 15 95 95 Kelso
Indian Springs Moapa V PAHRUMP NUGGET HOTEL CASINO PAHRUMP, NV Pahrump GOLD TOWN CASINO PAHRUMP, NV LAKESIDE CASINO & RV PARK PAHRUMP, NV Las Vegas Arizona Charlies Decatur
STRATOSPHERE HOTEL CASINO TOWER Arizona Charlies Boulder Nopah Range Wilderness Area Charleston View Mountain Springs Henderson Boulder City Sloan Canyon National Conservation Area Willow Beach Goodsprings Nelson Nevada California Valjean Renoville
Mountain Pass Searchlight Halloran Springs Ivanpah Hart Baker Cima Palm Gardens Zzyzk Elora Crucero Mojave AQUARIUS CASINO RESORT Laughlin - Golden Property - American Property Primm Calada
Stratosphere Strip presence with excess real estate 15 Downtown Las Vegas 515 Las Vegas Boulevard STRATOSPHERE HOTEL CASINO TOWER Lucky Dragon Sahara Avenue Palace Station SLS
Circus Circus Westgate Las Vegas Convention Center Encore Wynn Treasure Island Palazzo The Mirage Venetian Harrah’s Rio Gold Coast Caesars Palace Quad Flamingo Cromwell Palms Bally’s Bellagio Paris Cosmopolitan Planet Hollywood Hard Rock
Aria / CityCenter Monte Carlo Orleans New York New York MGM Grand Excalibur Tropicana Luxor Mandalay Bay PAGE 6
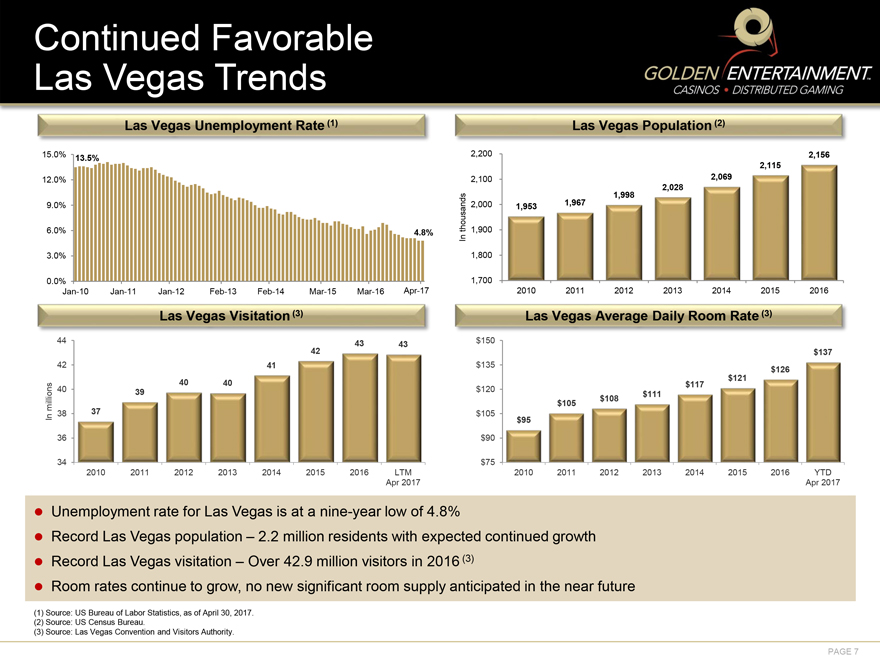
Continued Favorable Las Vegas Trends
GOLDEN ENTERTAINMENTTM
CASINOS DISTRIBUTED GAMING
Las Vegas Unemployment Rate (1)
Las Vegas Population (2)
15.0% 13.5% 2,200 2,156 2,115 12.0% 2,100 2,069 2,028 1,998 9.0% In thousands 2,000 1,953 1,967 6.0% 4.8% 1,900 3.0% 1,800 0.0% 1,700 Jan-10 Jan-11 Jan-12 Feb-13 Feb-14 Mar-15
Mar-16 Apr-17 2010 2011 2012 2013 2014 2015 2016 Las Vegas Visitation (3) Las Vegas Average Daily Room Rate (3) 44 43 43 $150 42 $137 42 41 $135 $126 40 40 $117 $121 40 39 $120 $111 In millions $105 $108 38 37 $105 $95 36 $90 34 $75 2010 2011 2012
2013 2014 2015 2016 LTM Apr 2017 2010 2011 2012 2013 2014 2015 2016 YTD Apr 2017
Unemployment rate for Las Vegas is at a nine-year low of 4.8%
Record Las Vegas population – 2.2 million residents with expected continued growth
Record Las Vegas visitation – Over 42.9 million visitors in 2016 (3)
Room rates continue to grow, no new significant room supply anticipated in the near future
(1) Source: US Bureau of Labor Statistics, as of April 30, 2017.
(2) Source: US
Census Bureau.
(3) Source: Las Vegas Convention and Visitors Authority.
PAGE
7
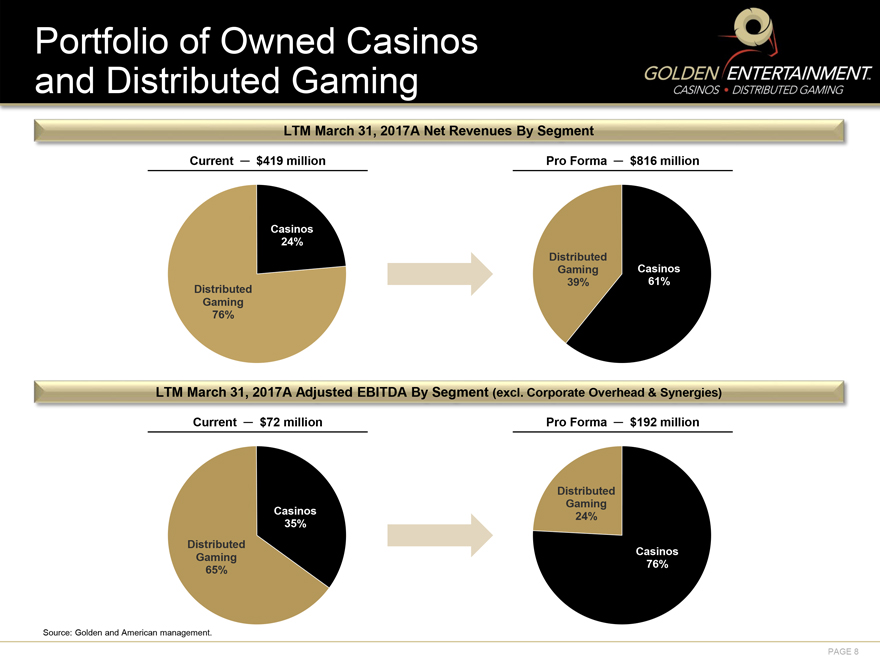
Portfolio of Owned Casinos and Distributed Gaming
GOLDEN ENTERTAINMENT TM
CASINOS DISTRIBUTED GAMING
LTM March 31, 2017A Net Revenues By Segment
Current - $419 million Pro Forma - $816 million
Casinos 24%
Distributed Gaming
Casinos
Distributed 39% 61%
Gaming 76%
LTM March 31, 2017A Adjusted
EBITDA By Segment (excl. Corporate Overhead & Synergies)
Current - $72 million
Pro Forma - $192 million
Distributed Gaming Casinos
24% 35%
Distributed Gaming Casinos
65% 76%
Source: Golden and American management.
PAGE 8
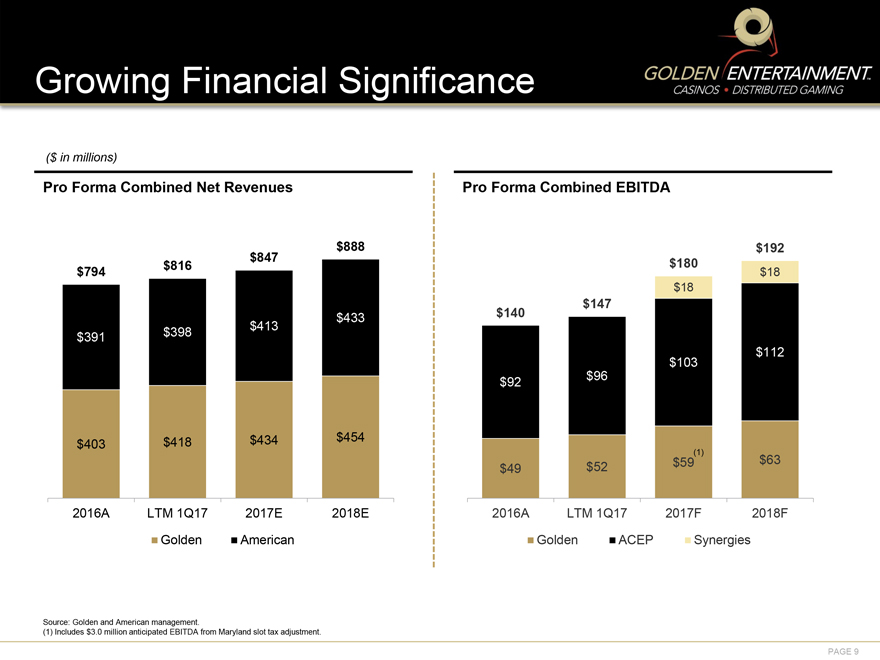
Growing Financial Significance
GOLDEN ENTERTAINMENT TM
CASINOS DISTRIBUTED GAMING
($ in millions)
Pro Forma Combined Net Revenues
$888 $847
$794 $816
$433 $391
$398 $413
$403 $418
$434 $454
2016A LTM 1Q17 2017E 2018E
Golden American
Pro Forma Combined EBITDA
$192 $180
$18 $18 $140 $147
$112 $103 $92 $96
$49 $52 $59(1) $63
2016A LTM 1Q17 2017F 2018F
Golden ACEP Synergies
Source: Golden and American management.
(1) Includes $3.0 million anticipated EBITDA from Maryland slot tax adjustment.
PAGE 9
Potential Multiple Expansion
GOLDEN ENTERTAINMENT TM
CASINOS DISTRIBUTED GAMING
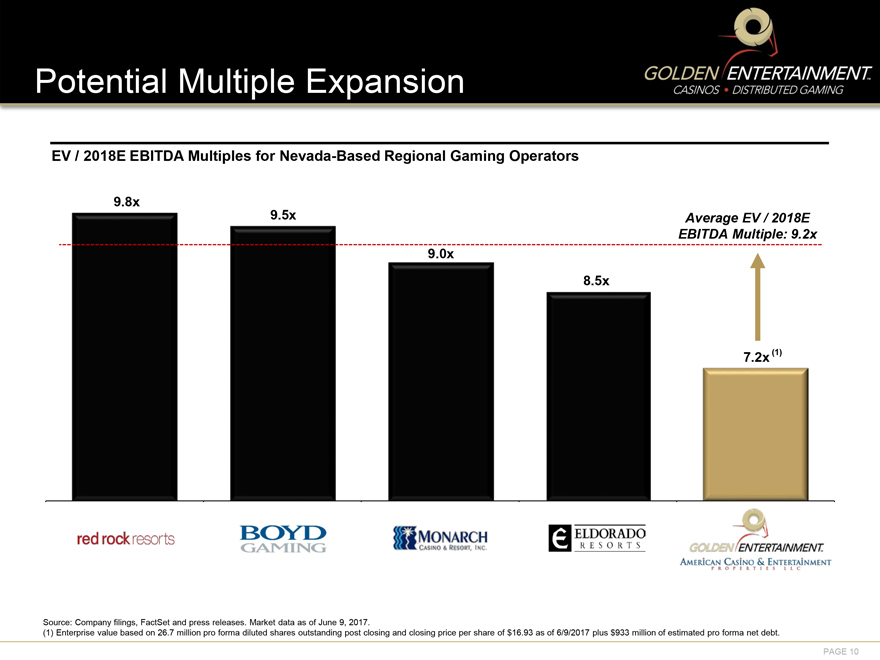
EV / 2018E EBITDA Multiples for Nevada-Based Regional Gaming Operators
9.8x 9.5x Average EV /
2018E EBITDA Multiple: 9.2x
9.0x 8.5x 7.2x (1)
Red Rock Resorts BOYD GAMING
MONARCH CASINO & RESORT, INC. ELDORADO RESORTS GOLDEN ENTERTAINMENTTM AMERICAN CASINO & ENTERTAINMENT PROPERTIES LLC
Source: Company filings, FactSet and
press releases. Market data as of June 9, 2017.
(1) Enterprise value based on 26.7 million pro forma diluted shares outstanding post closing and closing price
per share of $16.93 as of 6/9/2017 plus $933 million of estimated pro forma net debt. PAGE 10
GOLDEN ENTERTAINMENT TM CASINOS DISTRIBUTED GAMING
A APPENDIX Property Overviews
Stratosphere Casino, Hotel & Tower
GOLDEN ENTERTAINMENTTM
CASINOS DISTRIBUTED GAMING
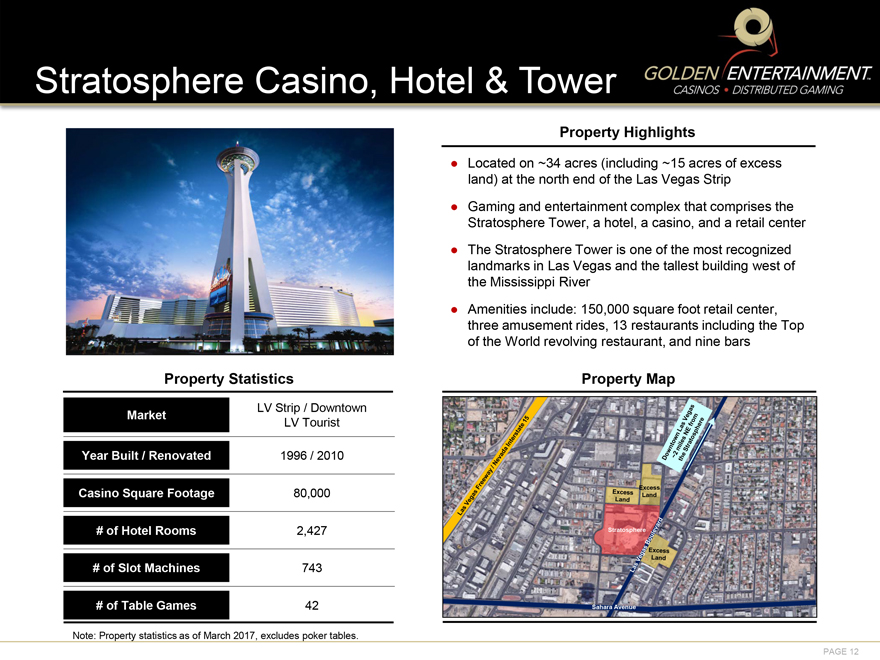
Property Highlights
Located on ~34 acres (including ~15 acres of excess land) at the north end
of the Las Vegas Strip
Gaming and entertainment complex that comprises the Stratosphere Tower, a hotel, a casino, and a retail center
The Stratosphere Tower is one of the most recognized landmarks in Las Vegas and the tallest building west of the Mississippi River
Amenities include: 150,000 square foot retail center, three amusement rides, 13 restaurants including the Top of the World revolving restaurant, and nine bars
Property Statistics Property Map
LV Strip / Downtown
Market
LV Tourist
Year Built / Renovated 1996 / 2010
Casino Square Footage 80,000
# of Hotel Rooms 2,427
# of Slot Machines 743
# of Table Games 42
Note: Property statistics as of March 2017, excludes poker tables.
PAGE 12
Las Vegas Freeway / Nevada Interstate 15 Excess Land Excess Land
Downtown Las Vegas ~2 miles NE from the Stratosphere Stratosphere Las Vegas Boulevard Excess Land Sahara Avenue
Arizona Charlie’s Decatur
GOLDEN ENTERTAINMENTTM
CASINOS DISTRIBUTED GAMING
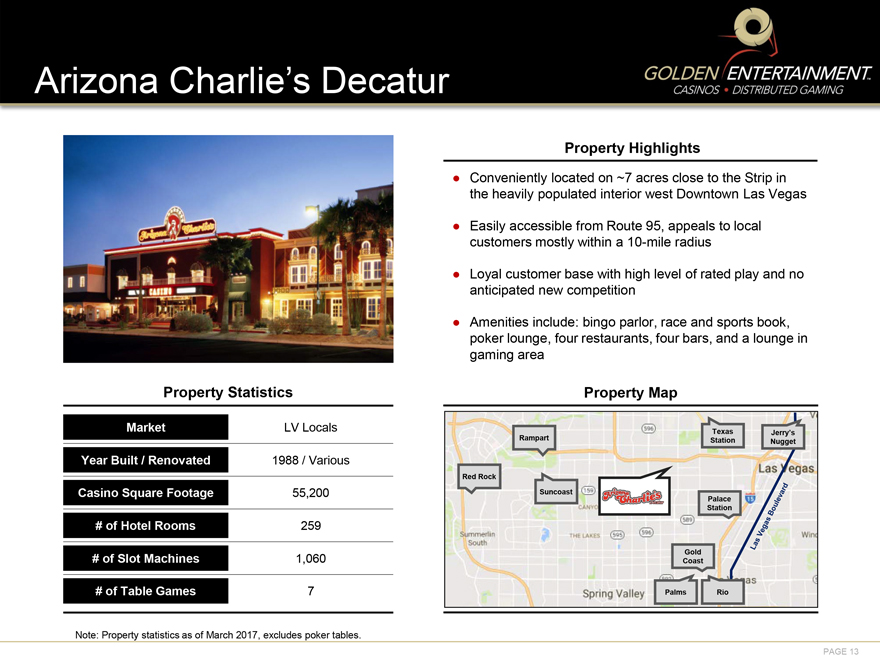
Property Highlights
Conveniently located on ~7 acres close to the Strip in the heavily
populated interior west Downtown Las Vegas
Easily accessible from Route 95, appeals to local customers mostly within a 10-mile radius
Loyal customer base with high level of rated play and no anticipated new competition
Amenities
include: bingo parlor, race and sports book, poker lounge, four restaurants, four bars, and a lounge in gaming area
Property Statistics Property Map
Market LV Locals
Year Built / Renovated 1988 / Various
Casino Square Footage 55,200
# of Hotel Rooms 259
# of Slot Machines 1,060
# of Table Games 7
Note: Property statistics as of March 2017, excludes poker tables.
PAGE 13
Rampart
Texas Station
Jerry’s Nugget
Red Rock
Suncoast
Palace Station
Gold Coast
Palms
Rio
Arizona Charlie’s Decatur
596 Las Vegas 159 15 CANYO Summerlin South THE LAKES 595 596 589 Las Vegas Boulevard Spring Valley
Arizona Charlie’s Boulder
GOLDEN ENTERTAINMENT TM
CASINOS DISTRIBUTED GAMING
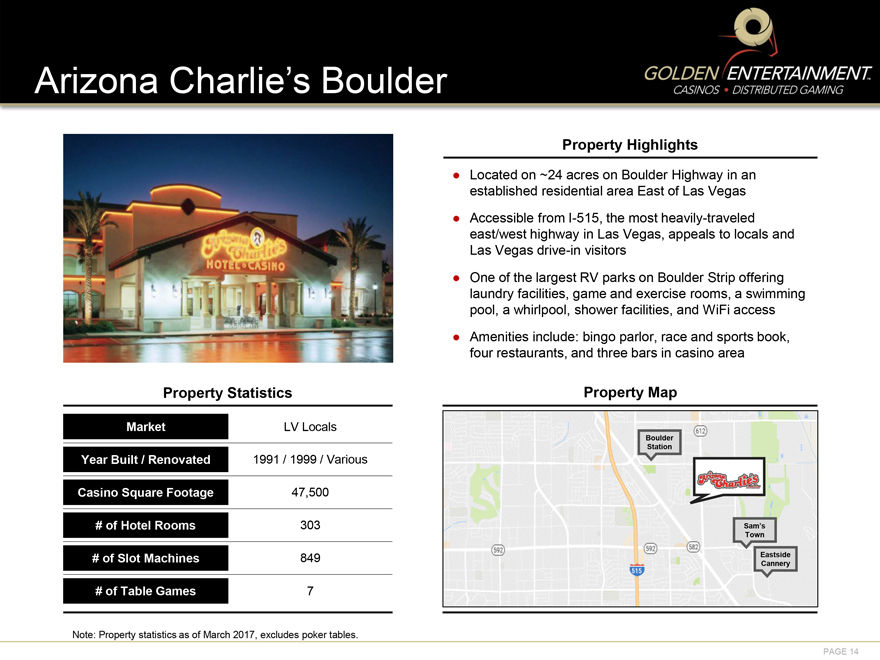
Property Highlights
Located on ~24 acres on Boulder Highway in an established residential area
East of Las Vegas
Accessible from I-515, the most heavily-traveled east/west highway in Las Vegas, appeals to locals and Las Vegas drive-in visitors
One of the largest RV parks on Boulder Strip offering laundry facilities, game and exercise rooms, a swimming pool, a whirlpool, shower facilities, and WiFi access
Amenities include: bingo parlor, race and sports book, four restaurants, and three bars in casino area
Property Statistics Property Map
Market LV Locals
Boulder Station
Year Built / Renovated 1991 / 1999 / Various
Casino Square Footage 47,500
# of Hotel Rooms 303 Sam’s Town
# of Slot Machines 849 Eastside Cannery
# of Table Games 7
612 592 592 582 515 Arizona Charlie’s Boulder
Note: Property statistics as of March 2017,
excludes poker tables.
PAGE 14
Aquarius Casino Resort
GOLDEN ENTERTAINMENT TM
CASINOS DISTRIBUTED GAMING
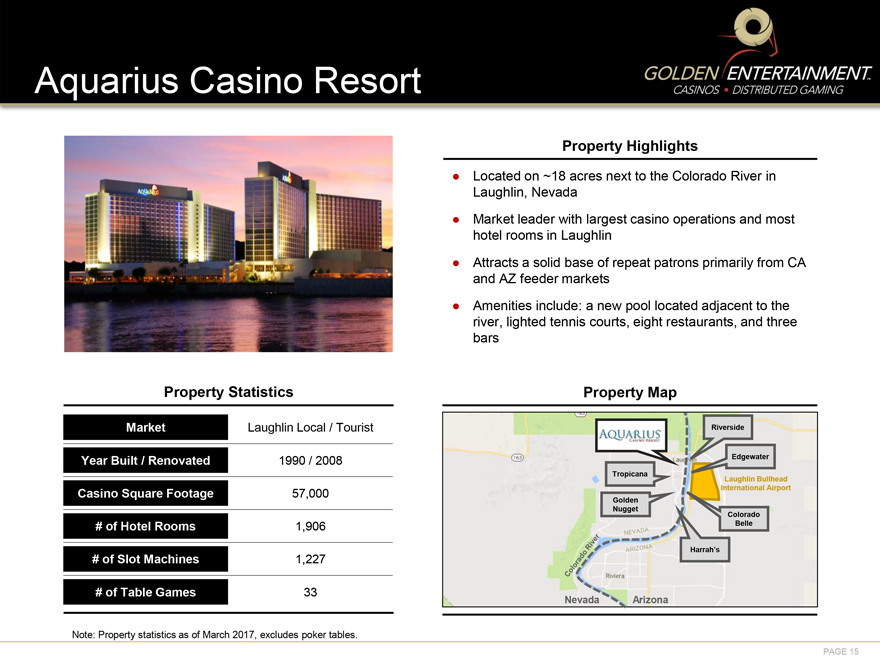
Property Highlights
Located on ~18 acres next to the Colorado River in Laughlin, Nevada
Market leader with largest casino operations and most hotel rooms in Laughlin
Attracts a solid base of repeat patrons primarily from CA and AZ feeder markets
Amenities include: a new pool located adjacent to the river, lighted tennis courts, eight restaurants, and three bars
Property Statistics Property Map
Market Laughlin Local / Tourist Riverside
Year Built / Renovated 1990 / 2008 Edgewater
Tropicana
Laughlin Bullhead
Casino Square Footage 57,000 International Airport
Golden Nugget
Colorado
# of Hotel Rooms 1,906 Belle
Harrah’s
# of Slot Machines 1,227
# of Table Games 33
AQUARIUS CASINO RESORT Colorado River NEVADA ARIZONA Riviera 163
Nevada Arizona
Note: Property statistics as of March 2017, excludes poker tables.
PAGE 15