Attached files
| file | filename |
|---|---|
| 8-K - CURRENT REPORT - Western New England Bancorp, Inc. | wneb-8k_060817.htm |
Western New England Bancorp, Inc. 8-K
Exhibit 99. 1

Local banking is better than ever. Investor Presentation June 2017

Forward - Looking Statements We may, from time to time, make written or oral “forward - looking statements” within the meaning of the Private Securities Litigation Reform Act of 1995 , including statements contained in our filings with the Securities and Exchange Commission (the “SEC”), our reports to shareholders and in other communications by us . This presentation contains “forward - looking statements” which may be identified by the use of such words as “believe,” “expect,” “anticipate,” “should,” “planned,” “estimated,” and “potential . ” Examples of forward looking statements include, but are not limited to, estimates with respect to our financial condition, results of operation and business that are subject to various factors which could cause actual results to differ materially from these estimates . These factors include, but are not limited to : • changes in the interest rate environment that reduce margins ; • changes in the regulatory environment ; • the highly competitive industry and market area in which we operate ; • general economic conditions, either nationally or regionally, resulting in, among other things, a deterioration in credit quality ; • changes in business conditions and inflation ; • changes in credit market conditions ; • changes in the securities markets which affect investment management revenues ; • increases in Federal Deposit Insurance Corporation deposit insurance premiums and assessments could adversely affect our financial condition ; • changes in technology used in the banking business ; • the soundness of other financial services institutions which may adversely affect our credit risk ; • certain of our intangible assets may become impaired in the future ; • our controls and procedures may fail or be circumvented ; • new lines of business or new products and services, which may subject us to additional risks ; • changes in key management personnel which may adversely impact our operations ; • the effect on our operations of governmental legislation and regulation, including changes in accounting regulation or standards, the nature and timing of the adoption and effectiveness of new requirements under the Dodd - Frank Act Wall Street Reform and Consumer Protection Act of 2010 , Basel guidelines, capital requirements and other applicable laws and regulations ; • severe weather, natural disasters, acts of war or terrorism and other external events which could significantly impact our business ; and • other factors detailed from time to time in our SEC filings . Although we believe that the expectations reflected in such forward - looking statements are reasonable, actual results may differ materially from the results discussed in these forward - looking statements . You are cautioned not to place undue reliance on these forward - looking statements, which speak only as of the date hereof . We do not undertake any obligation to republish revised forward - looking statements to reflect events or circumstances after the date hereof or to reflect the occurrence of unanticipated events . 2

Overview of Western New England Bancorp 3 ▪ Assets : $2.1 billion ▪ Loans: $1.6 billion ▪ Deposits: $1.5 billion ▪ Core Net Income: $3.8 million ▪ Shareholders ’ Equity: $245.8 million ▪ Market Capitalization: $312.5 million ▪ P/TBV: 136.4% ▪ P/LTM Core EPS: 24.2x ▪ Dividend Yield: 1.2% ▪ 21 branches across a wide service area in western Massachusetts and northern Connecticut ▪ NASDAQ: WNEB ▪ Russell 2000 index eligible Balance sheet data as of March 31, 2017; market data as of May 26, 2017
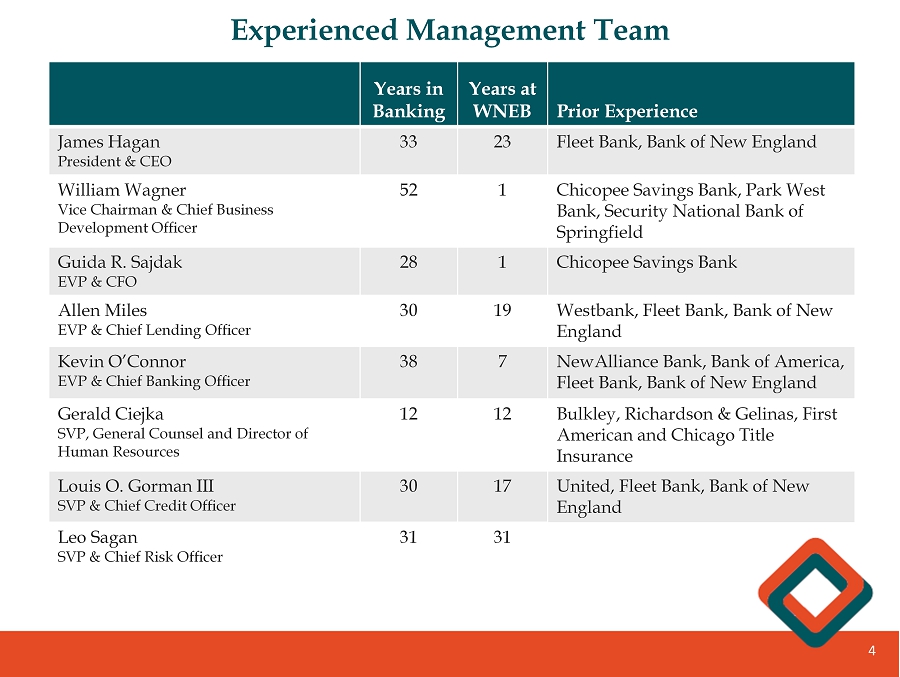
Years in Banking Years at WNEB Prior Experience James Hagan President & CEO 33 23 Fleet Bank, Bank of New England William Wagner Vice Chairman & Chief Business Development Officer 52 1 Chicopee Savings Bank, Park West Bank, Security National Bank of Springfield Guida R. Sajdak EVP & CFO 28 1 Chicopee Savings Bank Allen Miles EVP & Chief Lending Officer 30 19 Westbank, Fleet Bank, Bank of New England Kevin O’Connor EVP & Chief Banking Officer 38 7 NewAlliance Bank, Bank of America, Fleet Bank, Bank of New England Gerald Ciejka SVP, General Counsel and Director of Human Resources 12 12 Bulkley , Richardson & Gelinas , First American and Chicago Title Insurance Louis O. Gorman III SVP & Chief Credit Officer 30 17 United, Fleet Bank, Bank of New England Leo Sagan SVP & Chief Risk Officer 31 31 Experienced Management Team 4

Growth - Oriented Strategy 5 ▪ Executing a growth - oriented strategy that is focused on increasing commercial lending, increasing deposit relationships, and broadening our product lines and services that complements our existing commitment to high - quality customer service. In connection with our overall growth strategy, we seek to: ▪ grow our commercial and industrial and commercial real estate loan portfolios by targeting businesses in our primary market areas of western Massachusetts and northern Connecticut as a means to increase the yield on and diversify our loan portfolio and build transactional deposit account relationships; ▪ focus on expanding our retail banking franchise and increase the number of households served within our market area; and ▪ supplement the commercial focus by growing the residential loan portfolio to diversify risk and deepen customer relationships. ▪ Strengthening our balance sheet with less reliance on investment securities and non - core funding sources ▪ Improved profitability and operating efficiency ▪ Efficient capital management – regulatory capital well in excess of regulatory minimums, allows for continued capital deployment through organic growth, dividends, and share repurchases as buyback opportunities are presented
Acquisition of Chicopee Bancorp 6 ▪ Completed the Chicopee acquisition on October 21, 2016 ▪ Renamed the holding company Western New England Bancorp, Inc. (“WNEB ”) to reflect the broadened reach and market focus ▪ First in - market merger in Hampden County in over 25 years, creating the largest community bank in the county with 17 branches and a significant #2 deposit market share. Solid #4 deposit market share in Springfield MSA ▪ Systems conversion successfully completed in December 2016 ▪ Integration of retail lending and the creation of a powerful commercial lending team ▪ Larger lending limit and capabilities of broader institution ▪ Broader platform to cross - sell fee income opportunities, including mortgage banking and wealth management ▪ Established Westfield Financial Management Services

Attractive Market Demographics 7 _______ Source: SNL Financial based on deposit market share as of June 30, 2016 Springfield MSA Hampden County Hampshire County Hartford County Population (2017) 634,548 472,757 161,791 895,271 Median HH Income $54,693 $52,159 $62,428 $70,395 # Businesses 23,844 17,250 6,594 39,051 Market Deposits (millions) $13,800.9 $9,500.5 $4,300.4 $35,941.6 WNEB Deposits (millions) $1,411.4 $1,374.8 $36.6 $57.0 Branches 19 17 2 2 Market Share Rank: All Banks 4 2 13 22 Community Banks 2 1 9 11

14.58 14.48 14.10 13.48 11.42 11.29 9.12 5.36 3.88 3.58 2.79 Largest Community Bank in Hampden County 8 ________ Source: SNL Financial as of June 30, 2016 Note: Two Westfield branches are located in Hartford County, CT outside of Springfield MSA 2016 RankInstitution (ST) # of Branches Deposits in Market ($000) Market Share (%) 1Toronto-Dominion Bank 16 1,385,273 14.58 Western New England Bancorp (MA) 17 1,374,845 14.48 2Bank of America Corp. (NC) 14 1,339,422 14.10 3PeoplesBancorp MHC (MA) 14 1,281,144 13.48 4United Financial Bancorp (CT) 15 1,084,528 11.42 5Berkshire Hills Bancorp Inc. (MA) 16 1,073,012 11.29 6Westfield Financial, Inc. (MA) 11 866,086 9.12 7Chicopee Bancorp Inc. (MA) 6 508,759 5.36 8Country Bank for Savings (MA) 5 368,614 3.88 9Citizens Financial Group Inc. (RI) 15 340,177 3.58 10KeyCorp (OH) 8 265,390 2.79 Total For Institutions In Market 140 9,500,512
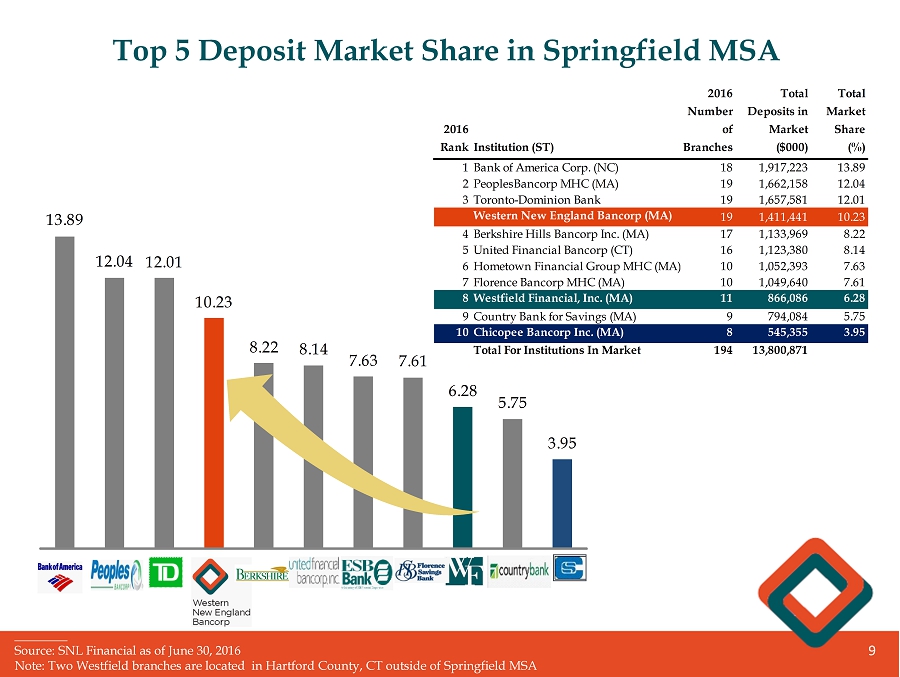
13.89 12.04 12.01 10.23 8.22 8.14 7.63 7.61 6.28 5.75 3.95 Top 5 Deposit Market Share in Springfield MSA 9 ________ Source: SNL Financial as of June 30, 2016 Note: Two Westfield branches are located in Hartford County, CT outside of Springfield MSA 2016 RankInstitution (ST) 2016 Number of Branches 2016 Total Deposits in Market ($000) 2016 Total Market Share (%) 1Bank of America Corp. (NC) 18 1,917,223 13.89 2PeoplesBancorp MHC (MA) 19 1,662,158 12.04 3Toronto-Dominion Bank 19 1,657,581 12.01 Western New England Bancorp (MA) 19 1,411,441 10.23 4Berkshire Hills Bancorp Inc. (MA) 17 1,133,969 8.22 5United Financial Bancorp (CT) 16 1,123,380 8.14 6Hometown Financial Group MHC (MA) 10 1,052,393 7.63 7Florence Bancorp MHC (MA) 10 1,049,640 7.61 8Westfield Financial, Inc. (MA) 11 866,086 6.28 9Country Bank for Savings (MA) 9 794,084 5.75 10Chicopee Bancorp Inc. (MA) 8 545,355 3.95 Total For Institutions In Market 194 13,800,871

_______ Source: westernmassedc.com; masslive.com; reuters.com; SNL Financial Springfield, MA Economic “Mini - Revival” New England’s “Knowledge Corridor” The Greater Springfield - Hartford metropolitan area has been dubbed the “Knowledge Corridor” • Academic Powerhouse : Home to 29 universities and liberal arts colleges, and numerous highly regarded hospitals • Major Market : Second largest population in New England (1.7 million people) • Business Hub : Diverse and robust business sectors with over 50,000 businesses total Approximately 4,700 businesses are based within the city of Springfield, employing more than 73,000 workers, making Springfield the economic hub of the region The regional impact from the Springfield economic development initiatives: • China Railway Rolling Stock Corporation new manufacturing plant will assemble ~285 new cars for Boston’s subway system in $566mm contract; CRRC also won $1.3bn bid to build rail cars for the Chicago Transit Authority; and recently won bids with Philadelphia and Los Angeles transit systems • MGM Casino will be located in downtown Springfield with typical casino amenities and accommodations. The $950 million project is underway • Springfield Union Station, an $88 million project, will become a main transportation center in the region supporting Amtrak in addition to regional and state - supported trains • North Main Street Reconstruction to include sidewalks, traffic signals and street lights to the Chicopee city line Major Employers in the “Knowledge Corridor” Springfield MSA and the “Knowledge Corridor ” 10

Increasing Profitability 11 First quarter of 2017 first full quarter with Chicopee 2015Y 2016Y 2017Q1 0.42 0.54 0.74 Core ROAA (%) 2015Y 2016Y 2017Q1 4.10 4.94 6.28 Core ROAE (%) ________ Core EPS, ROAA and ROAE excludes tax benefits in 2017 and merger costs, net of tax, in 2016 and 2017. See Appendix for reconciliation of non - GAAP to GAAP financial measures 2015Y 2016Y 2016Q1 2017Q1 $0.33 $0.41 $0.12 $0.13 Core Earnings per Share Avg. diluted shares (000) 17,304 29,878

Improved Operating Efficiency 12 First quarter of 2017 first full quarter with Chicopee 2015Y 2016Y 2017Q1 75.34 72.60 63.70 Efficiency Ratio (%)

Strengthening Balance Sheet Mix 13 2015Y 2016Y 2017Q1 $818,213 $1,566,410 $1,599,607 Loans 61.1 75.5 76.7 55 60 65 70 75 80 2015Y 2016Y 3/31/2017 Loans / Assets (%) $ in thousands 90.9 103.2 105.2 85 90 95 100 105 110 2015Y 2016Y 3/31/2017 Loans / Deposits (%)

2015Y 2016Y 2017Q1 56% 62% 63% 44% 38% 37% Deposit Mix Core Deposits Time Deposits Strengthening Balance Sheet Mix 14 2015Y 2016Y 2017Q1 $900,363 $1,518,071 $1,521,219 Deposits $ in thousands

Loan and Deposit Composition 15 Residential 34% CRE & Multifamily 45% C&I 14% Home Equity 6% Other Consumer 1% Loan Mix Deposit Mix Non - Interest Bearing 21% Interest - Bearing DDA 6% MMDA & Savings 36% Time Deposits 37% As of March 31, 2017

Net Interest Margin 16 2015Y 2016Y 2017Q1 2.53 2.70 3.08 Net Interest Margin (%) Strengthened balance sheet mix results in improved NIM NIM, exclusive of purchase accounting adjustments, was 2.68% and 2.94% for 2016Y and 2017Q1, respectively

Strong Regulatory Capital and Growing Valuation 17 TCE / TA Leverage Ratio Tier 1 Ratio Total Risk Based Ratio 10.4 11.2 16.2 17.2 10.7 12.2 14.5 15.1 11.1 11.7 15.0 15.6 12/31/2015 12/31/2016 3/31/2017 2015Y 2016Y 3/31/2017 $139,466 $220,211 $228,973 $153,449 $284,055 $323,176 Tangible Common Equity Market Value Regulatory Capital Equity and Market Value

Competitive Shareholder Returns 18 47.4% 43.9% 35.4% 3 - Year Total Return Total return includes stock price appreciation and dividends paid through May 26, 2017 (10) 0 10 20 30 40 50 60 WNEB SNL U.S. Bank and Thrift S&P 500

Investment Considerations 19 ▪ Largest community bank in Hampden County and one of the largest in the Springfield MSA ; taking advantage of dislocation and opportunity with our core customer base ▪ Enhanced branch network provides greater density in attractive markets with significant retail and commercial opportunities ▪ Successful integration of the Chicopee acquisition resulted in an institution with larger lending limit and enhanced suite of products and services ▪ Broader platform to cross - sell fee income opportunities, including mortgage banking and wealth management ▪ Strong market position in the Springfield MSA, which is currently experiencing a “mini - revival” ▪ Acquisition resulted in improved profitability and operating efficiency

20 Appendix

Reconciliation of Non - GAAP to GAAP Financial Measures 21 ________ Core ROAA and ROAE excludes tax benefits in 2017 and merger costs, net of tax, in 2016 and 2017 March 31, December 31, March 31, December 31, 2017 2016 2016 2016 2015 Net Income: Net income, as presented 5,103$ 1,852$ 1,964$ 4,834$ 5,715$ Merger related expenses, net of tax (1) 293 1,523 112 3,274 - Tax benefits impact (1,632) - - - - Net income, exclusive of merger related expenses and tax benefits 3,764$ 3,375$ 2,076$ 8,108$ 5,715$ Diluted EPS: Diluted EPS, as presented 0.17$ 0.07$ 0.11$ 0.24$ 0.33$ Merger related expense impact 0.01 0.05 0.01 0.17 - Tax benefits impact (0.05) - - - - Diluted EPS, exclusive of merger related expense and tax benefits impact 0.13$ 0.12$ 0.12$ 0.41$ 0.33$ Return on Average Assets: Return on average assets, as presented 1.00% 0.38% 0.58% 0.32% 0.42% Merger related expense impact 0.06 0.31 0.03 0.22 - Tax benefits impact (0.32) - - - - Return on average assets, exclusive of merger related expense impact 0.74% 0.69% 0.61% 0.54% 0.42% Return on Average Equity: Return on average equity, as presented 8.51% 3.18% 5.61% 2.95% 4.10% Merger related expense impact 0.49 2.61 0.33 1.99 - Tax benefits impact (2.72) - - - - Return on average equity, exclusive of merger related expense impact 6.28% 5.79% 5.94% 4.94% 4.10% GAAP efficiency ratio 66.17% 81.95% 74.54% 82.01% 75.49% Merger related expense impact (2.47) (14.58) (1.63) (9.41) (0.15) Efficiency ratio as presented 63.70% 67.37% 72.91% 72.60% 75.34% (1) Assumed tax rate for deductible expenses of 34.1% at March 31, 2017 and 34.7% for 2016 periods. Three Months Ended Efficiency Ratio: Year Ended $ in thousands