Attached files
| file | filename |
|---|---|
| 8-K - 8-K - EXA CORP | d410051d8k.htm |
Exhibit 99.1
EXA INVESTOR PRESENTATION
June 2017
Safe Harbor Statement Today’s presentation includes forward-looking statements intended to qualify for the Safe Harbor from liability established by the Private Securities Litigation Reform Act of 1995. These forward-looking statements, including statements regarding our financial expectations, demand for our solutions and growth in our markets, are subject to risks, uncertainties and other factors that could cause actual results to differ materially from those suggested by our forward-looking statements. These factors include, but are not limited to, the risk factors described in our Annual Report on Form 10-K for the year ended January 31, 2017, as filed with the SEC on March 22, 2017. Forward-looking information in this presentation represents our outlook as of today, and we do not undertake any obligation to update these forward-looking statements. During today’s presentation we may refer to our Adjusted EBITDA. This is a non-GAAP financial measure that has been adjusted for certain non-cash and other items, and that is not computed in accordance with generally accepted accounting principles. The GAAP measure most comparable to Adjusted EBITDA is our net income (loss). A reconciliation of our historical Adjusted EBITDA to our net income (loss) is included in our Form 10-K filed with the SEC. © Exa Corporation—Public 2 2 © Exa Corporation. All rights reserved.
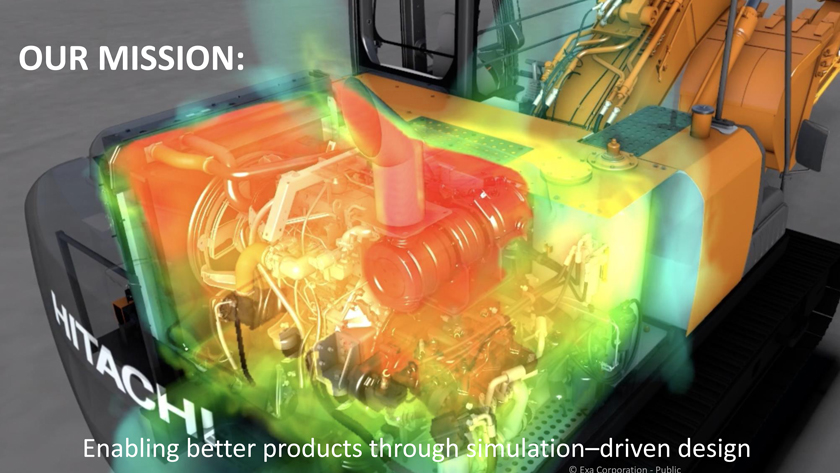
OUR MISSION:
Enabling
better products through simulation–driven design
© Exa Corporation—Public
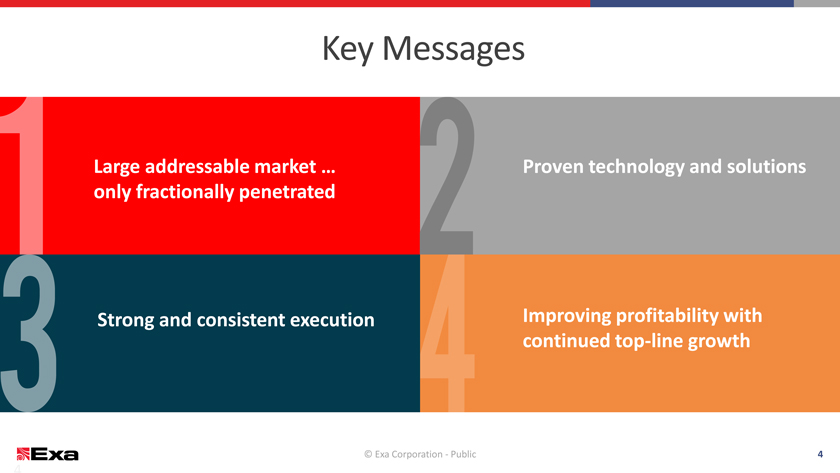
Key Messages
Large
addressable market … Proven technology and solutions
only fractionally penetrated
Strong and consistent execution
Improving profitability with
continued top-line growth
© Exa
Corporation—Public 4
4 © Exa Corporation. All rights reserved.
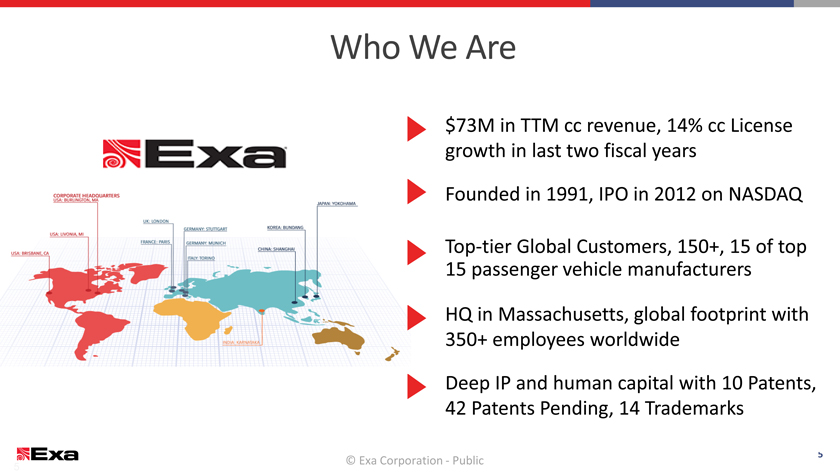
Who We Are
$73M in TTM cc
revenue, 14% cc License
growth in last two fiscal years
Founded in 1991, IPO
in 2012 on NASDAQ
op-tier Global Customers, 150+, 15 of top
passenger vehicle manufacturers
HQ in Massachusetts, global footprint with
350+ employees worldwide
Deep IP and human capital with 10 Patents,
42 Patents Pending, 14 Trademarks
© Exa Corporation. All rights reserved. 5
© Exa Corporation—Public
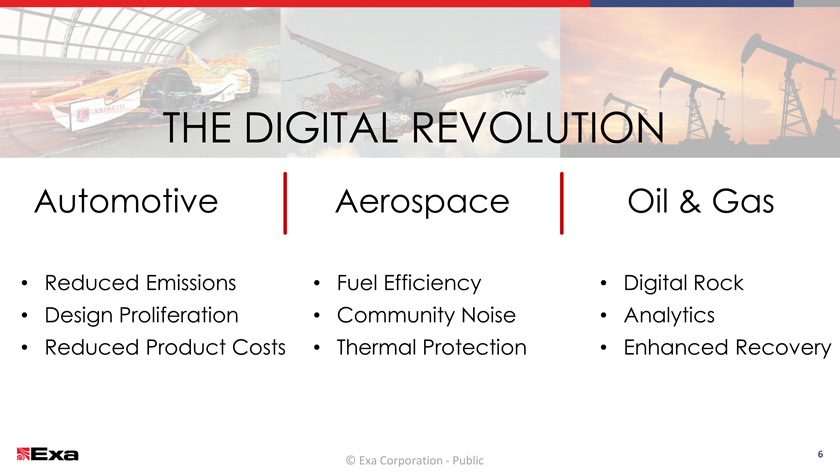
THE DIGITAL REVOLUTION
Automotive Aerospace Oil & Gas
Reduced
Emissions Fuel Efficiency Digital Rock
Design Proliferation Community
Noise Analytics
Reduced Product Costs Thermal Protection Enhanced Recovery
© Exa Corporation—Public
6
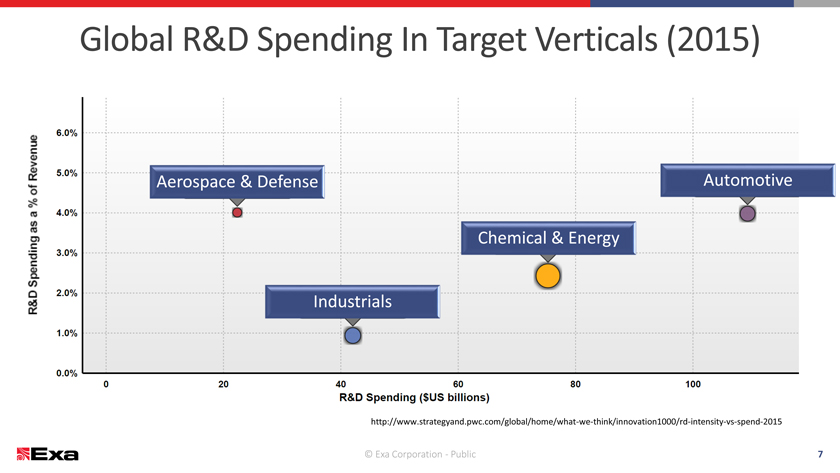
Global R&D Spending In Target Verticals (2015)
Aerospace & Defense
Automotive
Chemical & Energy
Industrials
http://www.strategyand.pwc.com/global/home/what-we-think/innovation1000/rd-intensity-vs-spend-2015
© Exa Corporation—Public
7
GROUND TRANSPORTATION
© Exa Corporation—Public
8
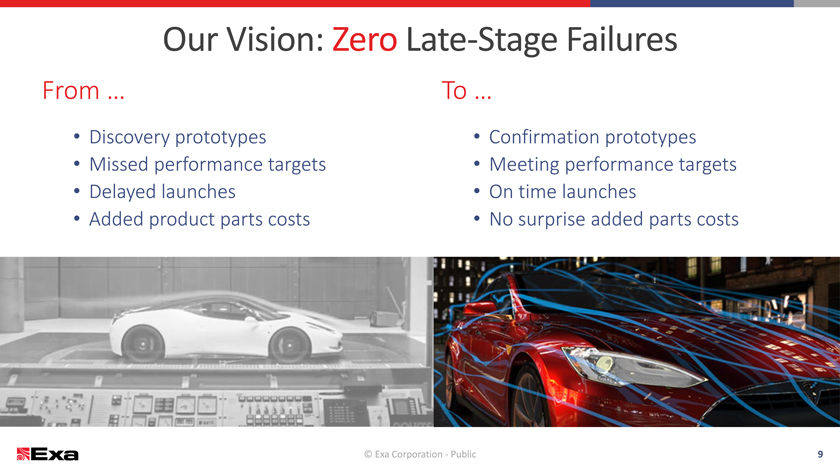
Our Vision: Zero Late-Stage Failures
From … To …
Discovery prototypes Confirmation prototypes
Missed performance targets Meeting performance targets
Delayed launches On
time launches
Added product parts costs No surprise added parts costs
©
Exa Corporation—Public 9
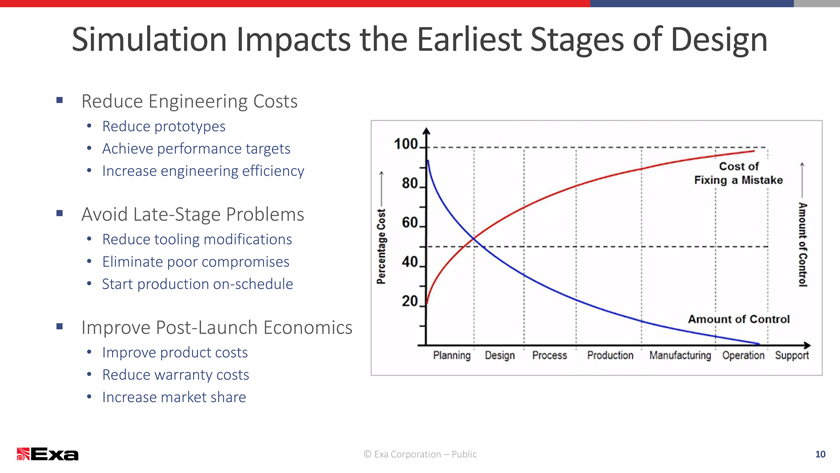
Simulation Impacts the Earliest Stages of Design
Reduce Engineering Costs
Reduce prototypes
Achieve performance targets
Increase engineering efficiency
Avoid Late-Stage Problems
Reduce tooling modifications
Eliminate poor compromises
Start production
on-schedule
Improve Post-Launch Economics
Improve product costs
Reduce warranty costs
Increase market share
© Exa Corporation – Public
10
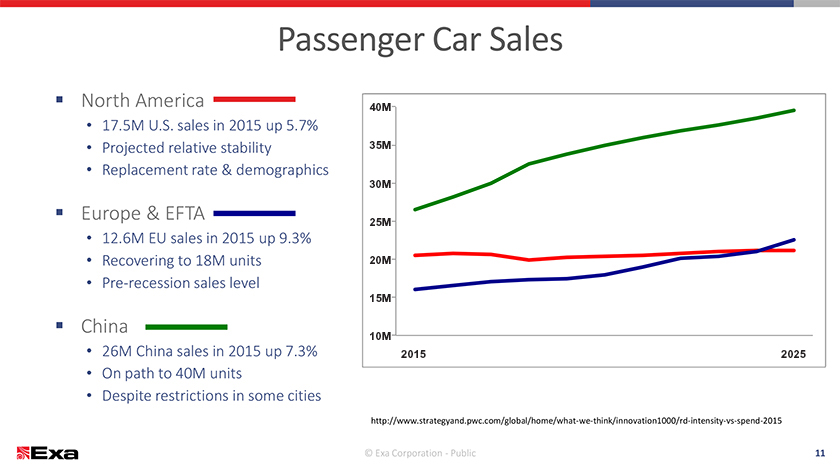
Passenger Car Sales
North
America
40M
17.5M U.S. sales in 2015 up 5.7%
Projected relative stability 35
Replacement rate & demographics
30M
Europe & EFTA
25M
12.6M EU sales in 2015 up 9.3%
Recovering to 18M units 20 20
Pre-recession sales
level
15 15M
China
10 10M
26M China sales in 2015 up 7.3% 2015 2015 2025
On path to 40M units
Despite restrictions in some cities
http://www.strategyand.pwc.com/global/home/what-we-think/innovation1000/rd-intensity-vs-spend-2015
© Exa Corporation—Public
11
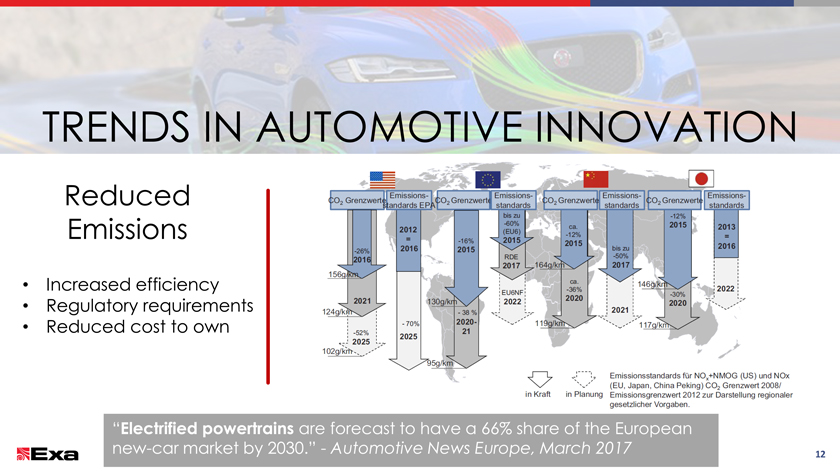
TRENDS IN AUTOMOTIVE INNOVATION
Reduced
Emissions
Increased efficiency
Regulatory requirements
Reduced cost to own
“Electrified powertrains are forecast to have a 66% share of the
European
new-car market by 2030.”—Automotive News Europe, March 2017 12
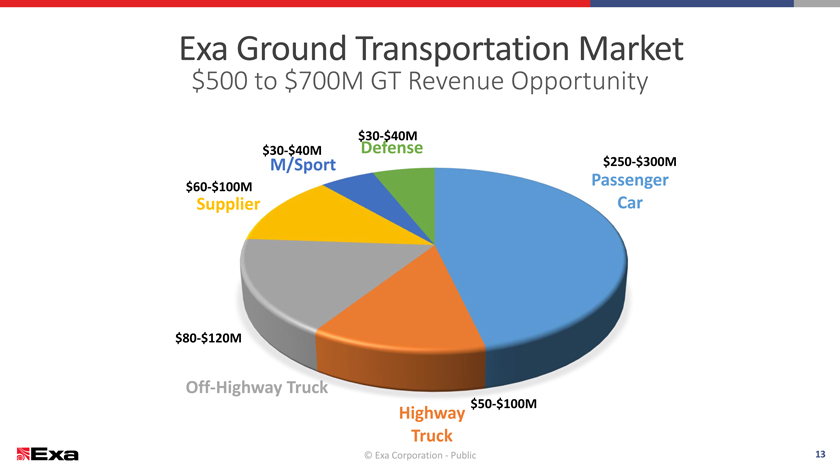
Exa Ground Transportation Market
$500 to $700M GT Revenue Opportunity
$30-$40M
$30-$40M Defense
M/Sport $250-$300M
$60-$100M Passenger
Supplier Car
$80-$120M
Off-Highway Truck
$50-$100M
Highway Truck
© Exa Corporation—Public 13
AEROSPACE
© Exa
Corporation—Public
14

Total Aircraft Noise
© Exa Corporation – Public

Supersonic Jet
© Exa
Corporation – Public
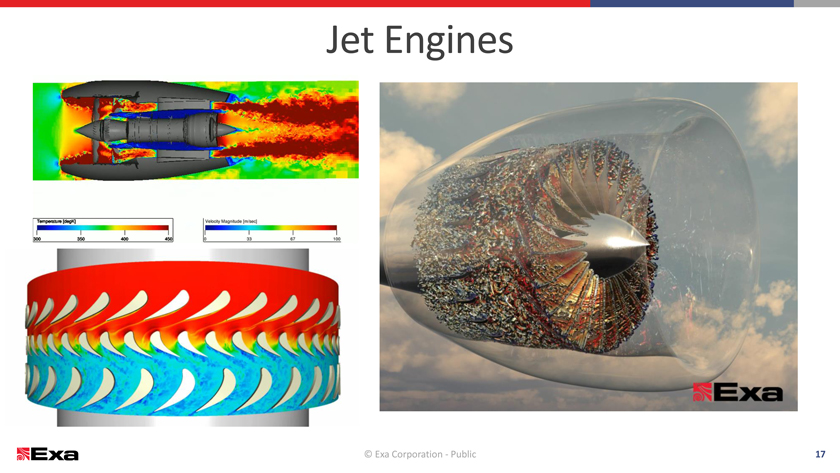
Jet Engines
© Exa
Corporation—Public 17
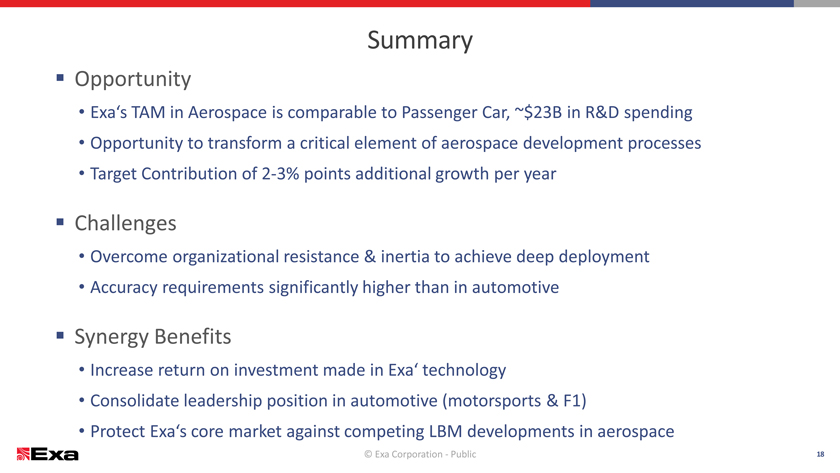
Summary
Opportunity
Exa‘s TAM in Aerospace is comparable to Passenger Car, ~$23B in R&D spending
Opportunity to transform a critical element of aerospace development processes
Target
Contribution of 2-3% points additional growth per year
Challenges
Overcome organizational resistance & inertia to achieve deep deployment
Accuracy
requirements significantly higher than in automotive
Synergy Benefits
Increase return on investment made in Exa‘ technology
Consolidate
leadership position in automotive (motorsports & F1)
Protect Exa‘s core market against competing LBM developments in aerospace
© Exa Corporation—Public
18
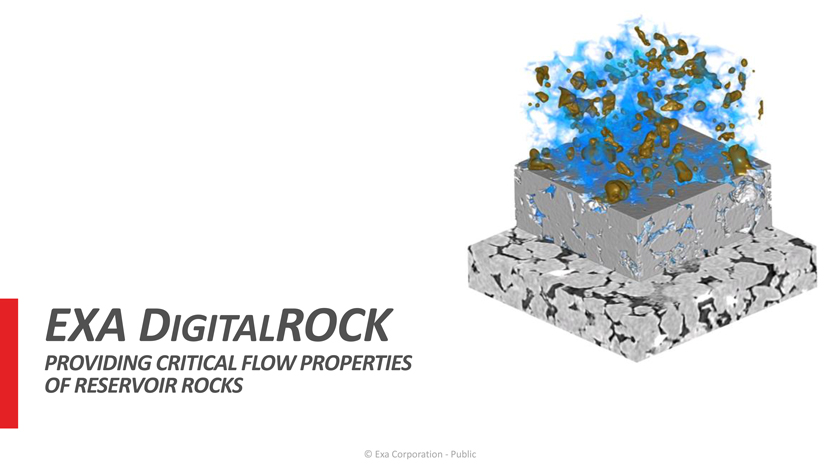
EXA DIGITALROCK
PROVIDING
CRITICAL FLOW PROPERTIES OF RESERVOIR ROCKS
© Exa Corporation—Public
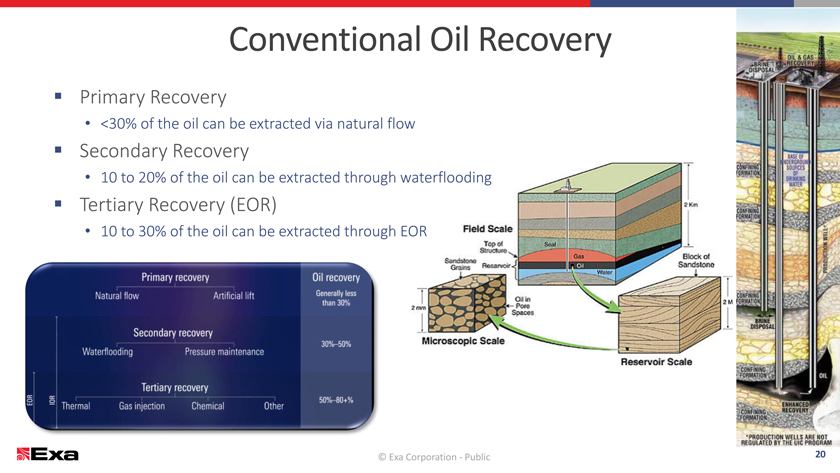
Conventional Oil Recovery
Primary Recovery
<30% of the oil can be extracted via natural flow
Secondary Recovery
10 to 20% of the oil can be extracted through
Tertiary Recovery (EOR)
10 to 30% of the oil can be extracted through
© Exa © Exa Corporation Corporation —Public —Public 20
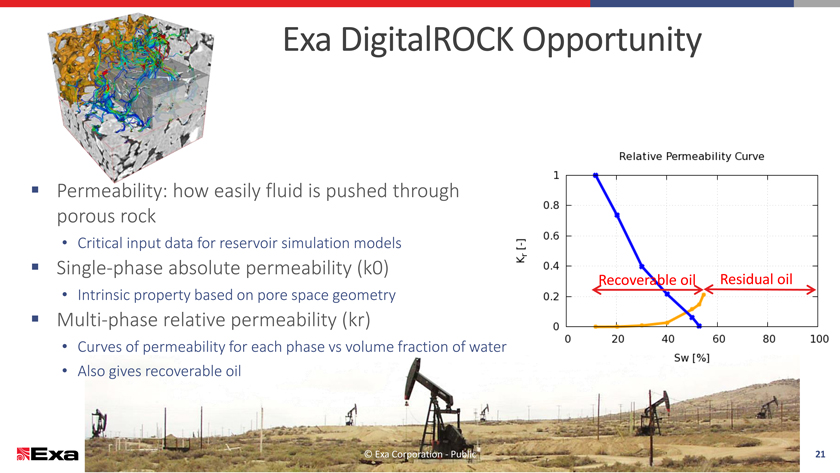
Exa DigitalROCK Opportunity
Permeability: how easily fluid is pushed through
porous
rock
Critical input data for reservoir simulation models
Single-phase absolute permeability (k0)
Recoverable oilResidual oil
Intrinsic property based on pore space geometry
Multi-phase relative permeability (kr)
Curves of permeability for each phase vs volume fraction of water
Also gives
recoverable oil
© Exa Corporation—Public 21
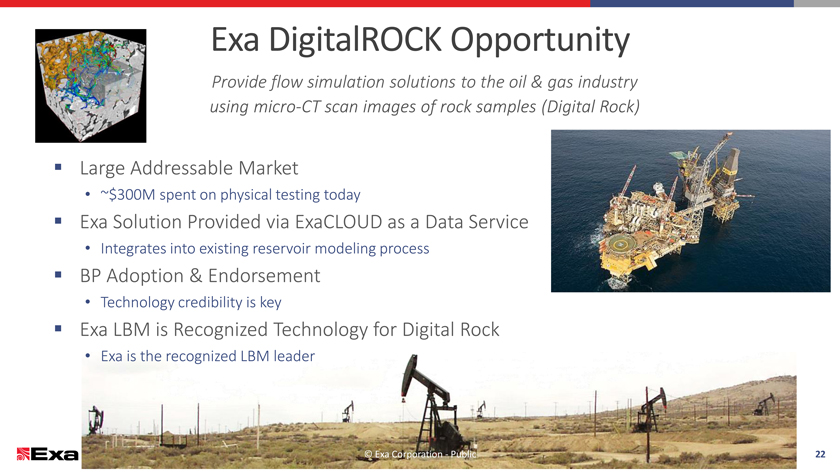
Exa DigitalROCK Opportunity
Provide flow simulation solutions to the oil & gas industry using micro-CT scan images of rock samples (Digital
Rock)
Large Addressable Market
~$300M spent on physical testing today
Exa Solution Provided via ExaCLOUD as a Data Service
Integrates into existing
reservoir modeling process
BP Adoption & Endorsement
Technology
credibility is key
Exa LBM is Recognized Technology for Digital Rock
Exa is
the recognized LBM leader
© Exa Corporation—Public 22
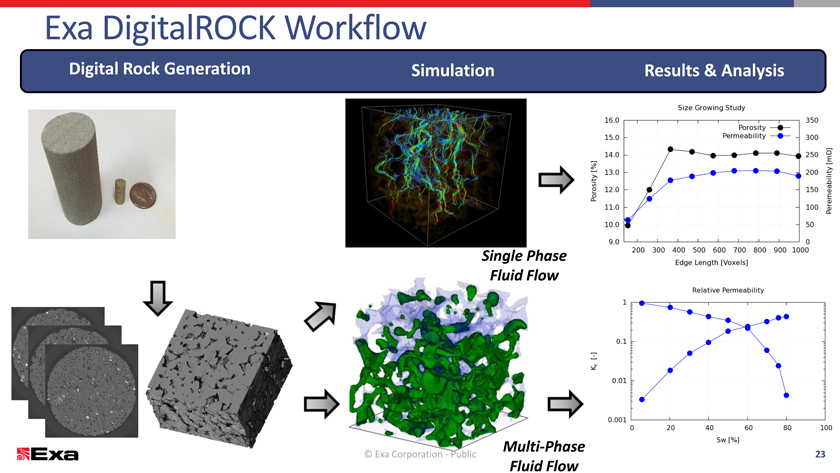
Exa DigitalROCK Workflow
Digital Rock Generation Simulation Results & Analysis
Single Phase
Fluid Flow
Multi-Phase
© Exa Corporation—Public 23
Fluid Flow
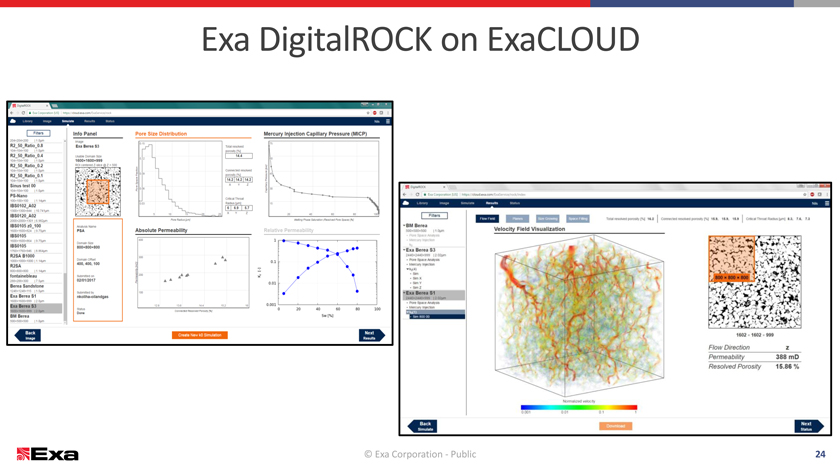
Exa DigitalROCK on ExaCLOUD
© Exa Corporation—Public 24
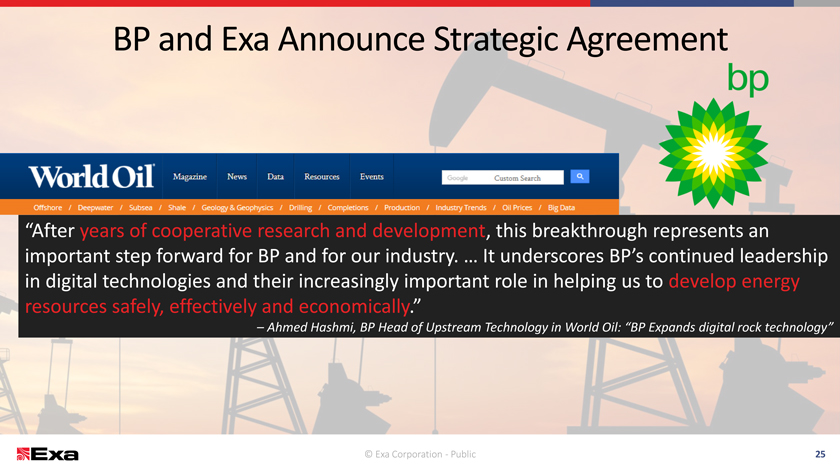
BP and Exa Announce Strategic Agreement
“After years of cooperative research and development, this breakthrough represents an important step forward for BP and for our industry. … It underscores BP’s
continued leadership in digital technologies and their increasingly important role in helping us to develop energy
resources safely, effectively and
economically.”
– Ahmed Hashmi, BP Head of Upstream Technology in World Oil: “BP Expands digital rock technology”
© Exa Corporation—Public
25
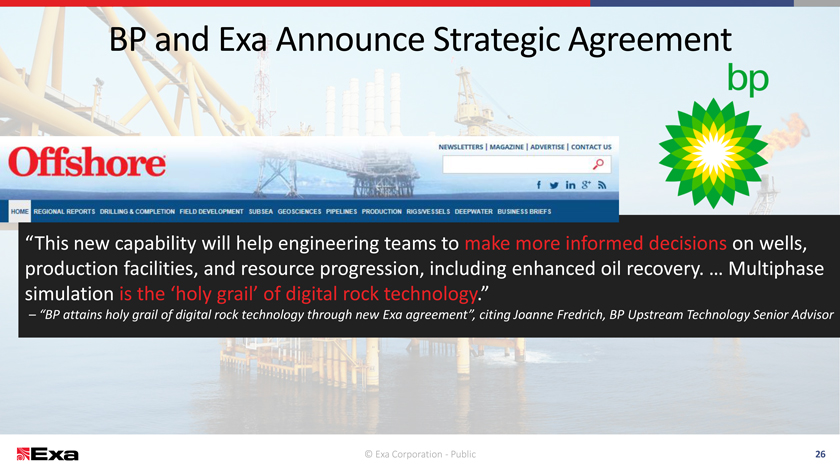
BP and Exa Announce Strategic Agreement
“This new capability will help engineering teams to make more informed decisions on wells, production facilities, and resource progression, including enhanced oil recovery.
… Multiphase simulation is the ‘holy grail’ of digital rock technology.”
– “BP attains holy grail of digital rock technology through
new Exa agreement”, citing Joanne Fredrich, BP Upstream Technology Senior Advisor
© Exa Corporation—Public
26
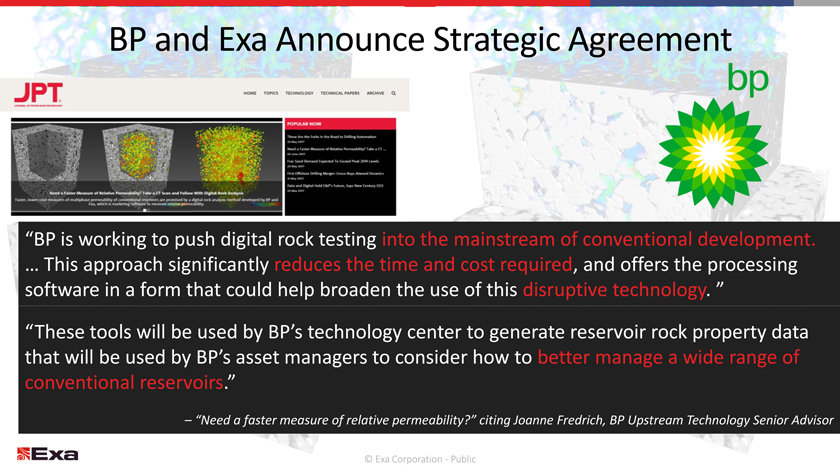
BP and Exa Announce Strategic Agreement
“BP is working to push digital rock testing into the mainstream of conventional development.
… This approach significantly reduces the time and cost required, and offers the processing software in a form that could help broaden the use of this disruptive technology.
”
“These tools will be used by BP’s technology center to generate reservoir rock property data that will be used by BP’s asset managers to
consider how to better manage a wide range of conventional reservoirs.”
– “Need a faster measure of relative permeability?” citing Joanne
Fredrich, BP Upstream Technology Senior Advisor
© Exa Corporation—Public
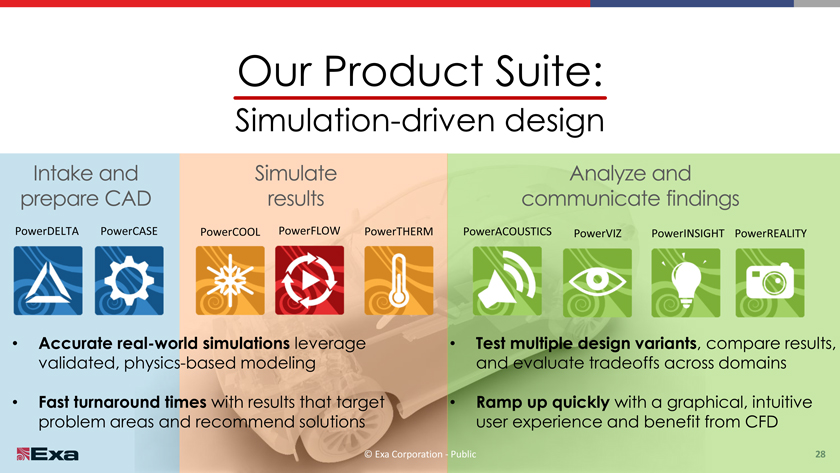
Our Product Suite:
Simulation-driven design
Intake and Simulate
prepare CAD results
PowerDELTA PowerCASE PowerCOOLPowerFLOWPowerTHERM
[Graphic Appears Here]
Accurate real-world simulations leverage validated,
physics-based modeling
Fast turnaround times with results that target problem areas and recommend solutions
[Graphic Appears Here]
Test multiple design variants, compare results, and evaluate tradeoffs
across domains
Ramp up quickly with a graphical, intuitive user experience and benefit from CFD
© Exa Corporation – Public 28
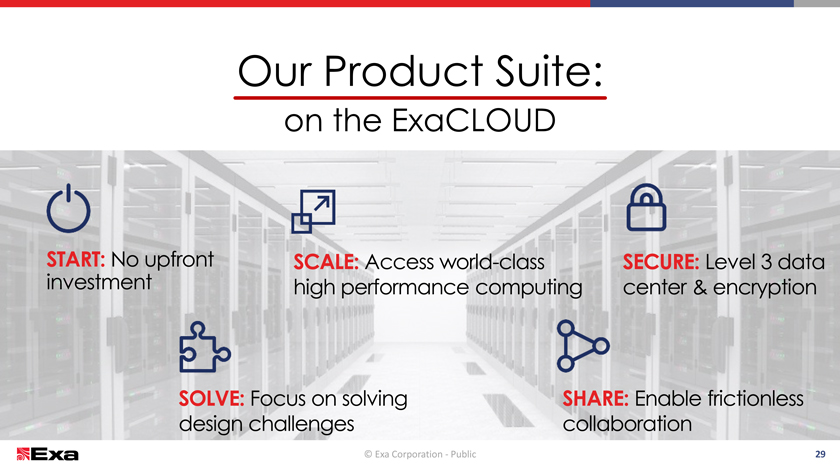
Our Product Suite:
on the
ExaCLOUD
START: No upfront SCALE: Access world-class SECURE: Level 3 data
investment high performance computing center & encryption
SOLVE: Focus on solving SHARE: Enable frictionless
design challenges
collaboration
© Exa Corporation—Public 29
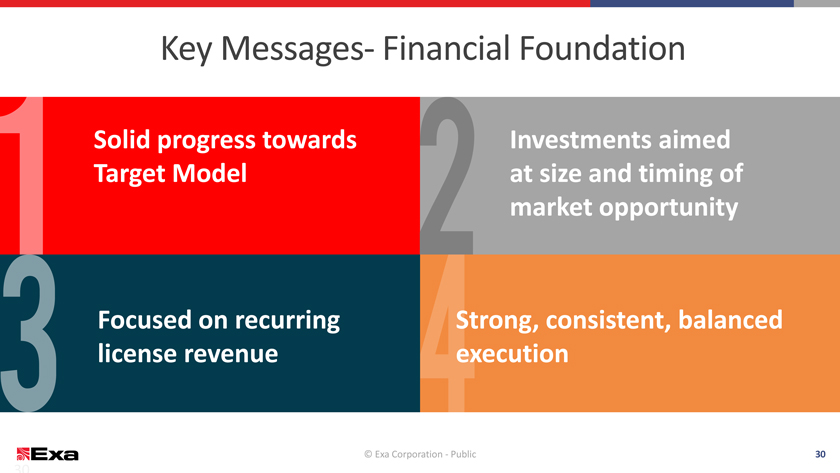
Key Messages- Financial Foundation
Solid progress towards Investments aimed
Target
Model at size and timing of
market opportunity
Focused
on recurring Strong, consistent, balanced
license revenue execution
© Exa Corporation—Public 30
30 © Exa Corporation. All rights reserved.
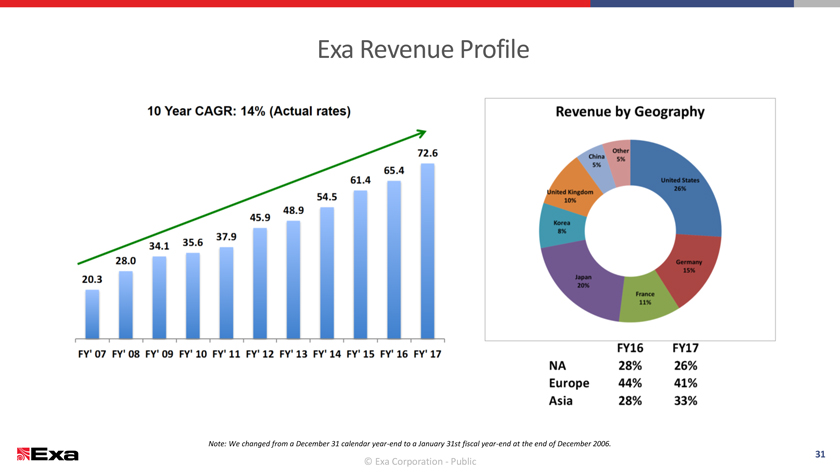
Exa Revenue Profile
Note:
We changed from a December 31 calendar year-end to a January 31st fiscal year-end at the end of December 2006.
32
© Exa© Corporation. Exa Corporation All rights—Public
reserved.
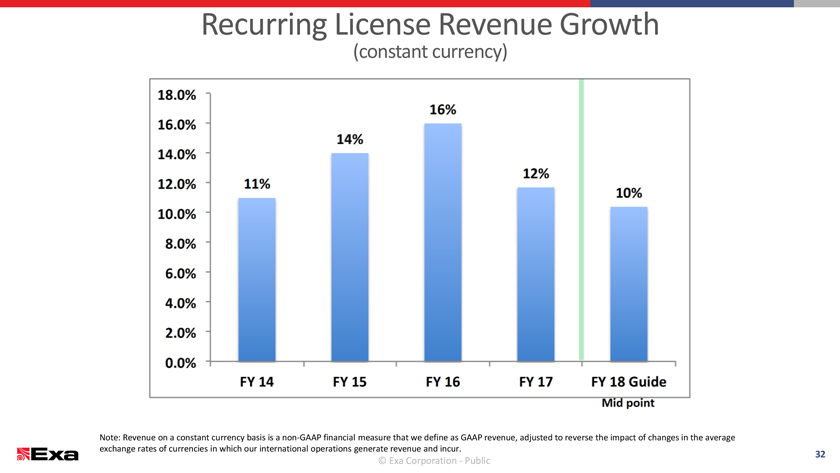
Recurring License Revenue Growth
(constant currency)
Note: Revenue on a constant currency basis is a non-GAAP financial measure that we define as GAAP revenue, adjusted to reverse the impact of changes in the average exchange rates of currencies in which our international operations generate revenue and incur.
© Exa Corporation. All rights reserved. 32
© Exa
Corporation—Public
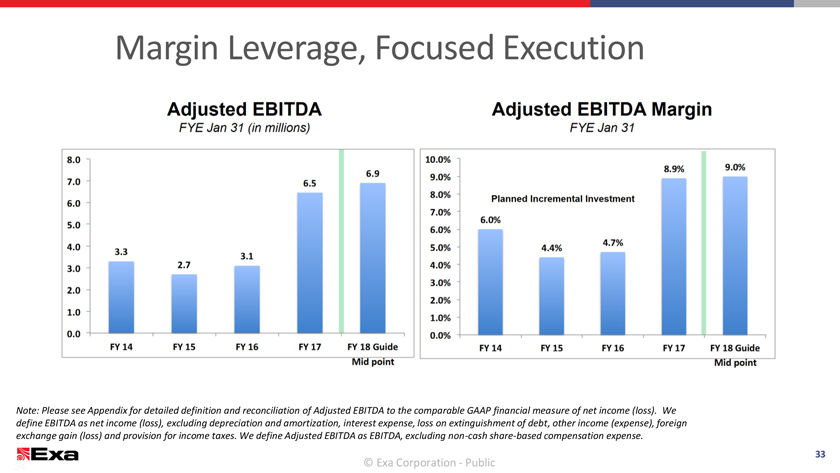
Margin Leverage, Focused Execution
Note: Please see Appendix for detailed definition and reconciliation of Adjusted EBITDA to the comparable GAAP financial measure of net income (loss). We define EBITDA as net
income (loss), excluding depreciation and amortization, interest expense, loss on extinguishment of debt, other income (expense), foreign exchange gain (loss) and provision for income taxes. We define Adjusted EBITDA as EBITDA, excluding non-cash share-based compensation expense.
© Exa Corporation © Exa Corporation . All rights - Public reserved. 34
33
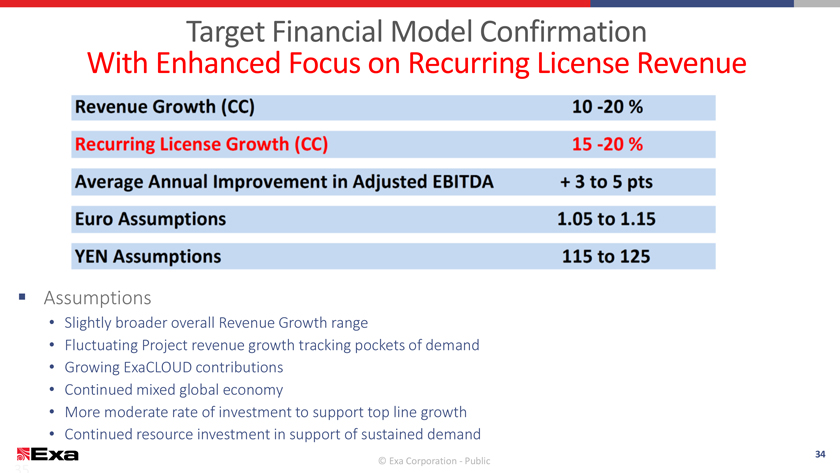
Target Financial Model Confirmation
With Enhanced Focus on Recurring License Revenue
Assumptions
Slightly broader overall Revenue Growth range
Fluctuating Project revenue growth tracking
pockets of demand
Growing ExaCLOUD contributions
Continued mixed global
economy
More moderate rate of investment to support top line growth
Continued
resource investment in support of sustained demand
© Exa Corporation. All rights reserved. 34
© Exa Corporation—Public
35
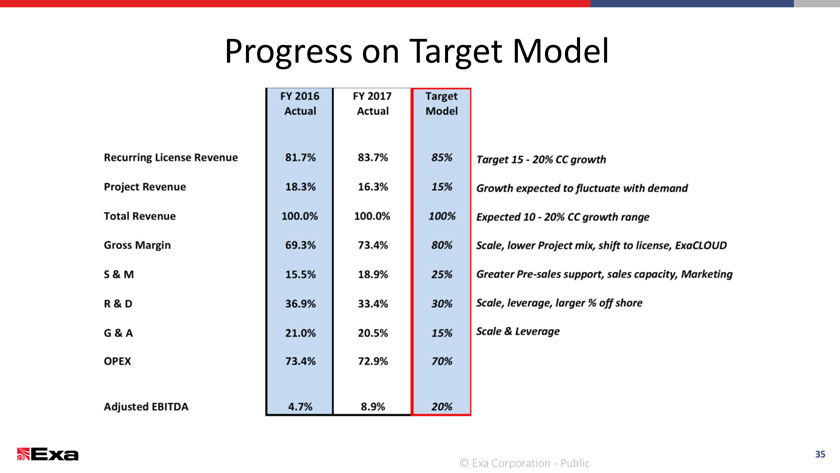
Progress on Target Model
© Exa Corporation—Public 36
Summary
Strong and
expanding market opportunity Significant deployment expansion runway Competitive technical advantage Strong customer base Extended market reach via ExaCLOUD Recurring License growth momentum Considerable margin expansion opportunity
© Exa Corporation—Public
36
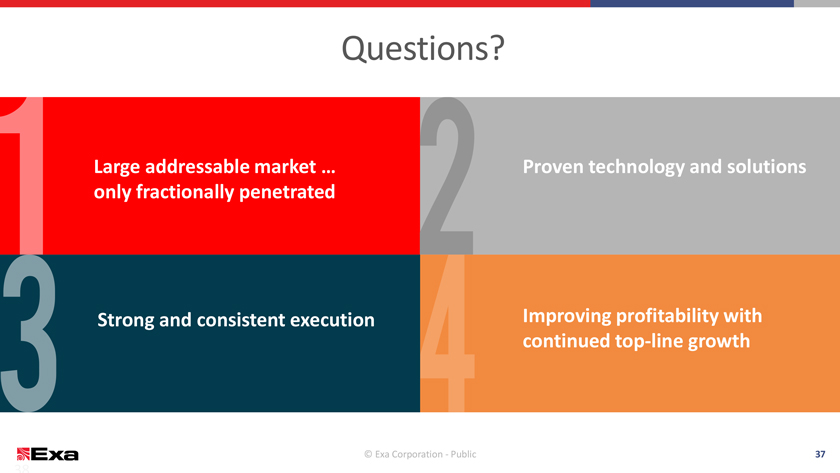
Questions?
Large
addressable market … Proven technology and solutions
only fractionally penetrated
Strong and consistent execution
[Graphic Appears Here]
Improving profitability with
continued top-line growth
© Exa Corporation—Public 38
38 © Exa Corporation. All rights
reserved.

THANK YOU
© Exa
Corporation—Public

Appendix
© Exa
Corporation—Public
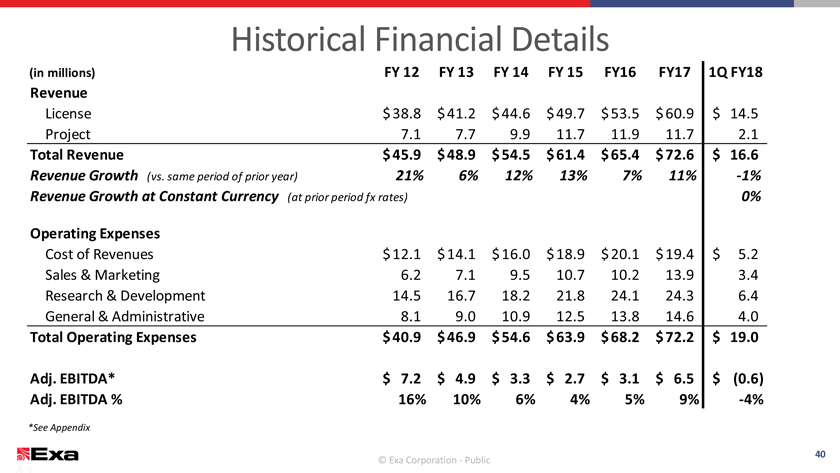
Historical Financial Details
(in millions) FY 12 FY 13FY 14FY 15FY16FY171Q FY18
Revenue
License $ 38.8
$41.2$44.6$ 49.7$53.5$ 60.9$14.5
Project 7.17.79.911.711.911.72.1
Total Revenue $ 45.9 $48.9$54.5$ 61.4$65.4$ 72.6$16.6
Revenue Growth
(vs. same period of prior year) 21% 6%12%13%7%11%-1%
Revenue Growth at Constant Currency (at prior period fx rates)
0%
Operating Expenses
Cost of
Revenues $ 12.1 $14.1$16.0$ 18.9$20.1$ 19.4$5.2
Sales & Marketing 6.27.19.510.710.213.93.4
Research & Development 14.5 16.718.221.824.124.36.4
General & Administrative 8.19.010.912.513.814.64.0
Total Operating Expenses $ 40.9 $46.9$54.6$ 63.9$68.2$ 72.2$19.0
Adj.
EBITDA* $7.2$4.9$3.3$2.7$3.1$ 6.5$(0.6)
Adj. EBITDA % 16% 10%6%4%5%9%-4%
*See Appendix
© Exa Corporation. © Exa Corporation All
rights—Public reserved. 41
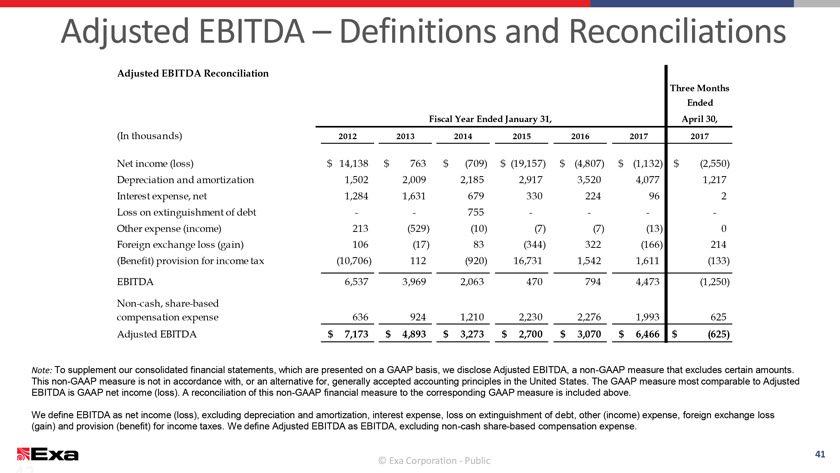
Adjusted EBITDA – Definitions and Reconciliations
Adjusted EBITDA Reconciliation
Three Months
Ended
Fiscal Year Ended January 31,April 30,
(In thousands) 2012 201320142015201620172017
Net income
(loss) $ 14,138 $763$(709)$(19,157)$ (4,807)$ (1,132)$(2,550)
Depreciation and amortization 1,502
2,0092,1852,9173,5204,0771,217
Interest expense, net 1,284 1,631679330224962
Loss on extinguishment of debt - -755----
Other expense
(income) 213 (529)(10)(7)(7)(13)0
Foreign exchange loss (gain) 106 (17)83(344)322(166)214
(Benefit) provision for income tax (10,706) 112(920)16,7311,5421,611(133)
EBITDA 6,537 3,9692,0634707944,473(1,250)
Non-cash, share-based
compensation expense 636 9241,2102,2302,2761,993625
Adjusted EBITDA $ 7,173 $4,893$3,273$2,700$ 3,070$ 6,466$(625)
Note: To supplement our consolidated financial statements, which are presented on a GAAP basis, we disclose Adjusted EBITDA, a non-GAAP
measure that excludes certain amounts. This non-GAAP measure is not in accordance with, or an alternative for, generally accepted accounting principles in the United States. The GAAP measure most comparable to
Adjusted EBITDA is GAAP net income (loss). A reconciliation of this non-GAAP financial measure to the corresponding GAAP measure is included above.
We define EBITDA as net income (loss), excluding depreciation and amortization, interest expense, loss on extinguishment of debt, other (income) expense, foreign exchange loss
(gain) and provision (benefit) for income taxes. We define Adjusted EBITDA as EBITDA, excluding non-cash share-based compensation expense.
All rights reserved. 42
© Exa Corporation—Public