Attached files
| file | filename |
|---|---|
| EX-99.1 - EXHIBIT 99.1 - Mahwah Bergen Retail Group, Inc. | ex99-1q3fy17.htm |
| 8-K - 8-K - Mahwah Bergen Retail Group, Inc. | a8-kcoverq3fy17.htm |

Q3 FY17 Earnings Release
Supplemental Material
June 8, 2017
Safe Harbor Statement
2
This presentation contains forward-looking statements within the meaning of the Private Securities Litigation Reform
Act of 1995. Forward-looking statements are based on current expectations and are indicated by words or phrases
such as “anticipate, “estimate,” “expect,” “project,” “plan,” “we believe,” “will,” “would,” “guidance,” and similar
words or phrases, and involve known and unknown risks, uncertainties and other factors which may cause actual
results, performance or achievements to be materially different from the future results, performance or
achievements expressed in or implied by such forward-looking statements.
Detailed information concerning those risks and uncertainties are readily available in the Company’s filings with the
U.S. Securities and Exchange Commission. We undertake no obligation to publicly update or revise any forward-
looking statements, whether as a result of new information, future events or otherwise.
Where indicated, certain financial information herein has been presented on a non-GAAP basis. This basis adjusts for
non-recurring items that management believes are not indicative of the Company’s underlying operating
performance. These measures may not be directly comparable to similar measures used by other companies and
should not be considered a substitute for performance measures in accordance with GAAP such as operating income
and net income. Additionally, a reconciliation of the projected non-GAAP EPS, which are forward-looking non-GAAP
financial measures, to the most directly comparable GAAP financial measures, is not provided because the Company
is unable to provide such reconciliation without unreasonable effort. The inability to provide a reconciliation is due to
the uncertainty and inherent difficulty predicting the occurrence, the financial impact and the periods in which the
non-GAAP adjustments may be recognized. These GAAP measures may include the impact of such items as
restructuring charges, acquisition and integration related expenses, asset impairments and the tax effect of all such
items. As previously stated, the Company has historically excluded these items from non-GAAP financial measures.
The Company currently expects to continue to exclude these items in future disclosures of non-GAAP financial
measures and may also exclude other items that may arise (collectively, “non-GAAP adjustments”). The decisions and
events that typically lead to the recognition of non-GAAP adjustments, such as actions under the Company's Change
for Growth program, or acquisition and integration expenses, are inherently unpredictable as to if or when they may
occur. For the same reasons, the Company is unable to address the probable significance of the unavailable
information, which could be material to future results. Reference should be made to today’s earnings release for the
nature of such adjustments and for a reconciliation of such non-GAAP measures to the Company’s financial results
prepared in accordance with GAAP.
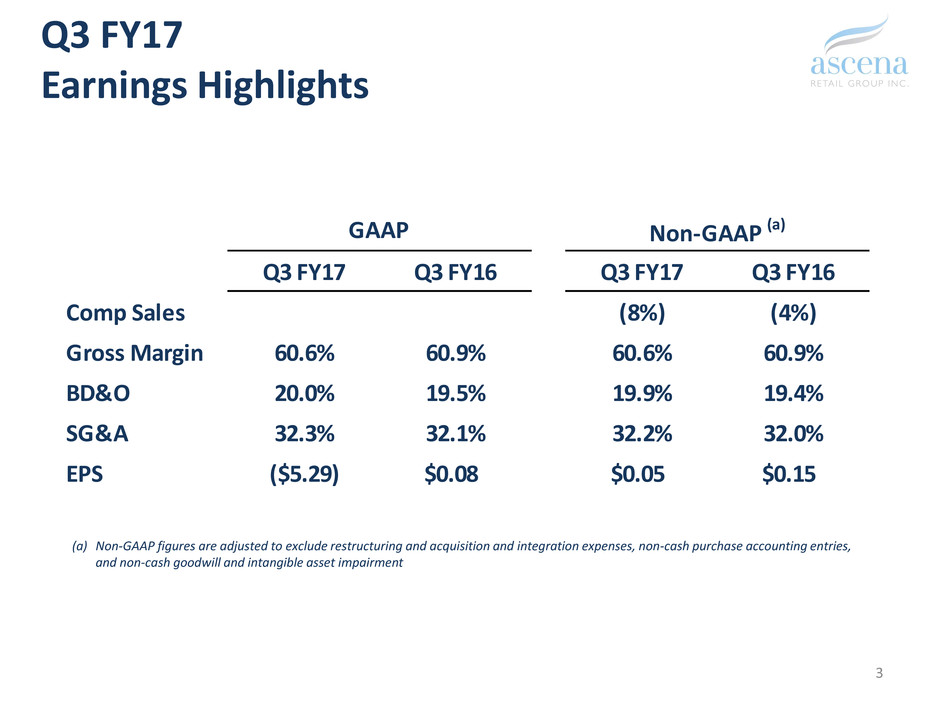
Q3 FY17
Earnings Highlights
3
(a) Non-GAAP figures are adjusted to exclude restructuring and acquisition and integration expenses, non-cash purchase accounting entries,
and non-cash goodwill and intangible asset impairment
Q3 FY17 Q3 FY16 Q3 FY17 Q3 FY16
Comp Sales (8%) (4%)
Gross Margin 60.6% 60.9% 60.6% 60.9%
BD&O 20.0% 19.5% 19.9% 19.4%
SG&A 32.3% 32.1% 32.2% 32.0%
EPS ($5.29) $0.08 $0.05 $0.15
GAAP Non-GAAP (a)
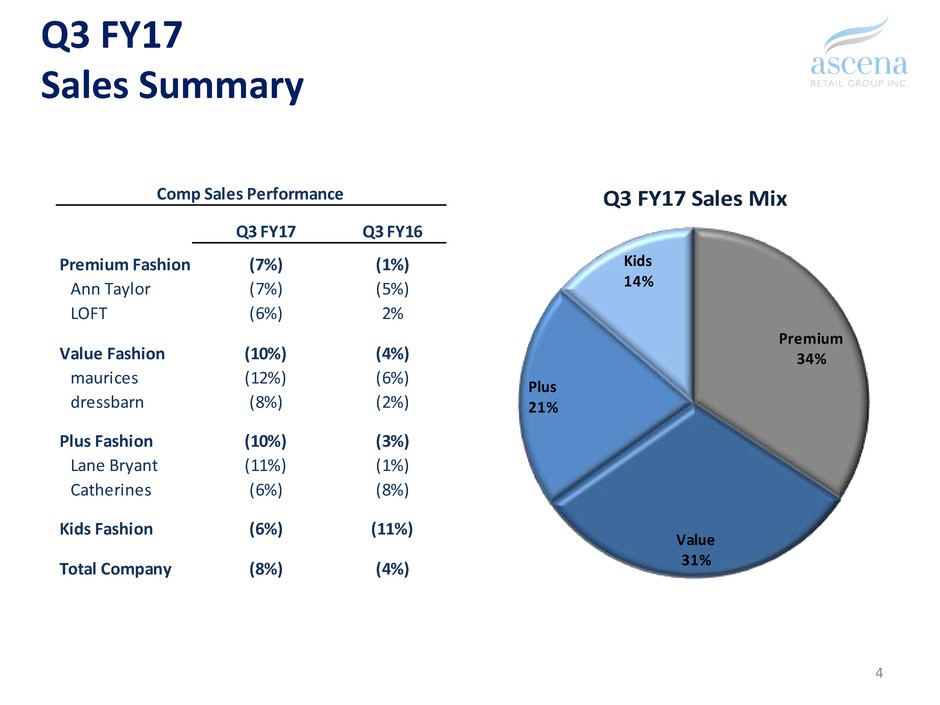
Q3 FY17
Sales Summary
4
Q3 FY17 Q3 FY16
Premium Fashion (7%) (1%)
Ann Taylor (7%) (5%)
LOFT (6%) 2%
Value Fashion (10%) (4%)
maurices (12%) (6%)
dressbarn (8%) (2%)
Plus Fashion (10%) (3%)
Lane Bryant (11%) (1%)
Catherines (6%) (8%)
Kids Fashion (6%) (11%)
Total Company (8%) (4%)
Comp Sales Performance
Premium
34%
Value
31%
Plus
21%
Kids
14%
Q3 FY17 Sales Mix
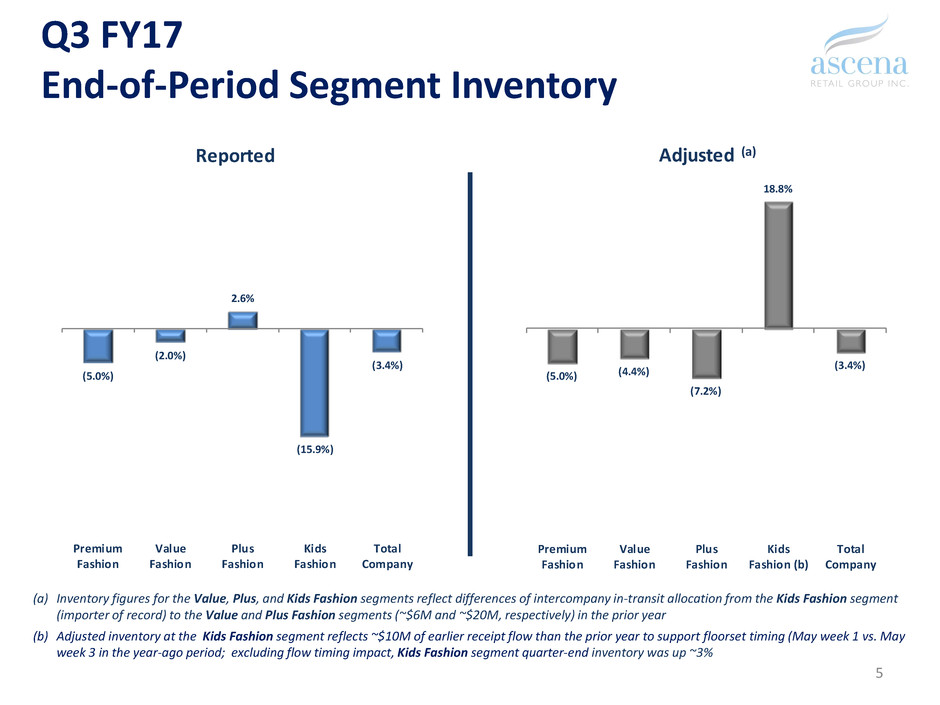
Q3 FY17
End-of-Period Segment Inventory
5
(a) Inventory figures for the Value, Plus, and Kids Fashion segments reflect differences of intercompany in-transit allocation from the Kids Fashion segment
(importer of record) to the Value and Plus Fashion segments (~$6M and ~$20M, respectively) in the prior year
(b) Adjusted inventory at the Kids Fashion segment reflects ~$10M of earlier receipt flow than the prior year to support floorset timing (May week 1 vs. May
week 3 in the year-ago period; excluding flow timing impact, Kids Fashion segment quarter-end inventory was up ~3%
(5.0%)
(2.0%)
2.6%
(15.9%)
(3.4%)
Premium
Fashion
Value
Fashion
Plus
Fashion
Kids
Fashion
Total
Company
Reported
(5.0%) (4.4%)
(7.2%)
18.8%
(3.4%)
Premium
Fashion
Value
Fashion
Plus
Fashion
Kids
Fashion (b)
Total
Company
Adjusted (a)
Q3 FY17
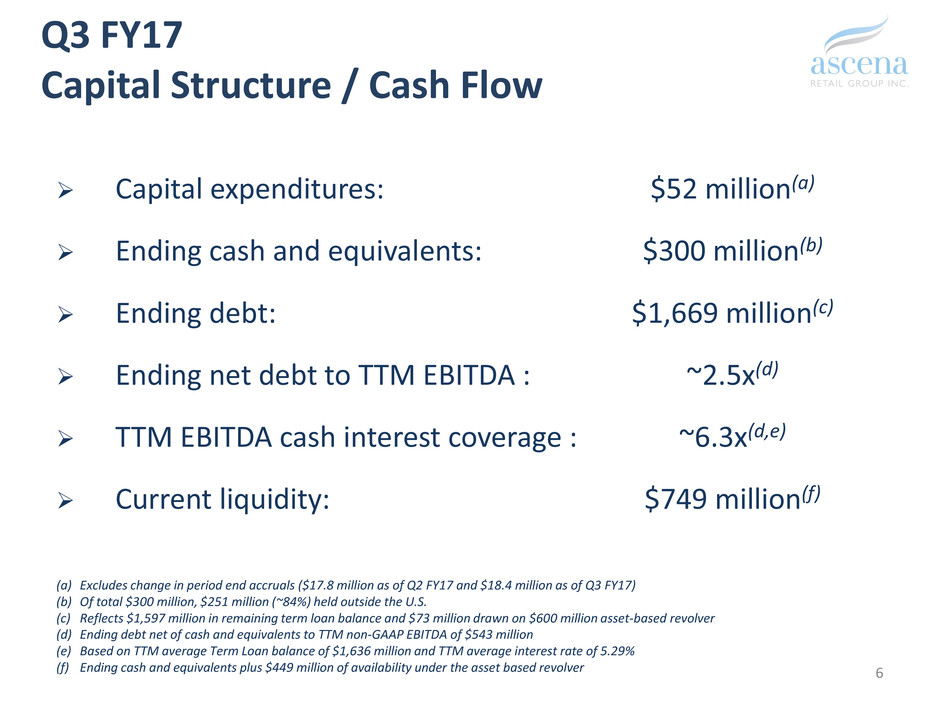
Capital Structure / Cash Flow
Capital expenditures: $52 million(a)
Ending cash and equivalents: $300 million(b)
Ending debt: $1,669 million(c)
Ending net debt to TTM EBITDA : ~2.5x(d)
TTM EBITDA cash interest coverage : ~6.3x(d,e)
Current liquidity: $749 million(f)
6
(a) Excludes change in period end accruals ($17.8 million as of Q2 FY17 and $18.4 million as of Q3 FY17)
(b) Of total $300 million, $251 million (~84%) held outside the U.S.
(c) Reflects $1,597 million in remaining term loan balance and $73 million drawn on $600 million asset-based revolver
(d) Ending debt net of cash and equivalents to TTM non-GAAP EBITDA of $543 million
(e) Based on TTM average Term Loan balance of $1,636 million and TTM average interest rate of 5.29%
(f) Ending cash and equivalents plus $449 million of availability under the asset based revolver
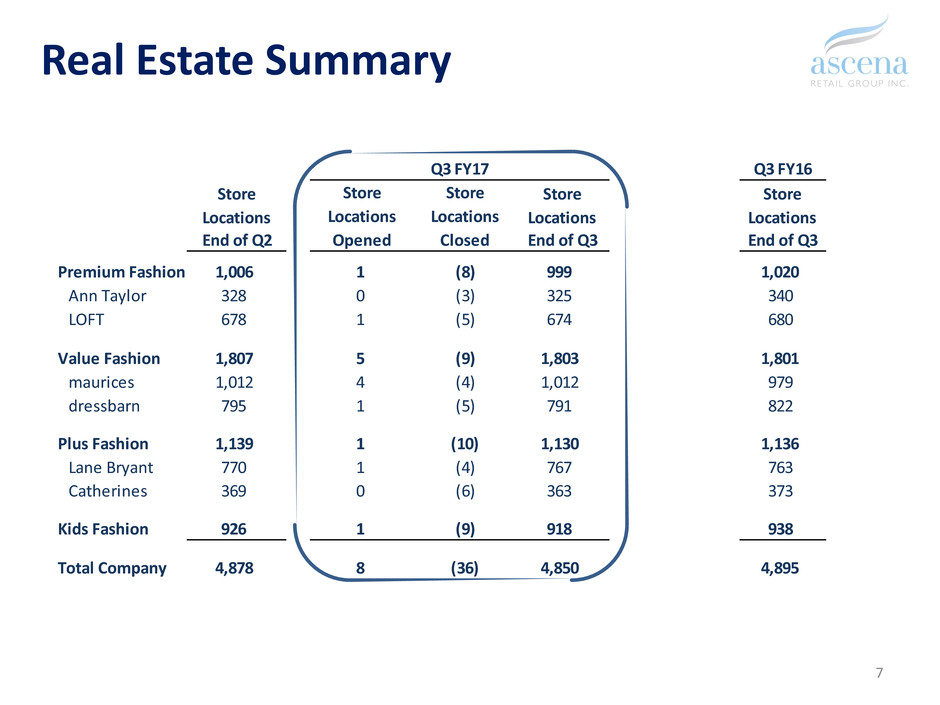
Real Estate Summary
7
Q3 FY16
Store
Locations
Store
Locations
Store
Locations
End of Q2 End of Q3 End of Q3
Premium Fashion 1,006 1 (8) 999 1,020
Ann Taylor 328 0 (3) 325 340
LOFT 678 1 (5) 674 680
Value Fashion 1,807 5 (9) 1,803 1,801
maurices 1,012 4 (4) 1,012 979
dressbarn 795 1 (5) 791 822
Plus Fashion 1,139 1 (10) 1,130 1,136
L ne Bryant 770 1 (4) 767 763
Catherines 369 0 (6) 363 373
Kids Fashion 926 1 (9) 918 938
Total Company 4,878 8 (36) 4,850 4,895
Q3 FY17
Store
Locations
Opened
Store
Locations
Closed
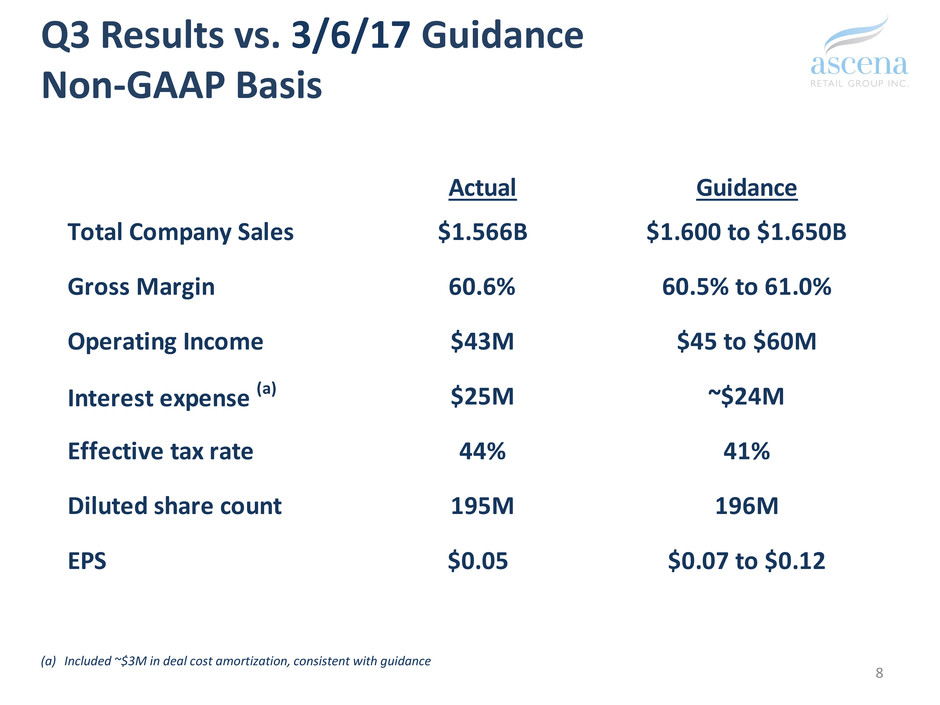
(a) Included ~$3M in deal cost amortization, consistent with guidance
Q3 Results vs. 3/6/17 Guidance
Non-GAAP Basis
8
Actual Guidance
Total Company Sales $1.566B $1.600 to $1.650B
Gross Margin 60.6% 60.5% to 61.0%
Operating Income $43M $45 to $60M
Interest expense (a) $25M ~$24M
Effective tax rate 44% 41%
Diluted share count 195M 196M
EPS $0.05 $0.07 to $0.12
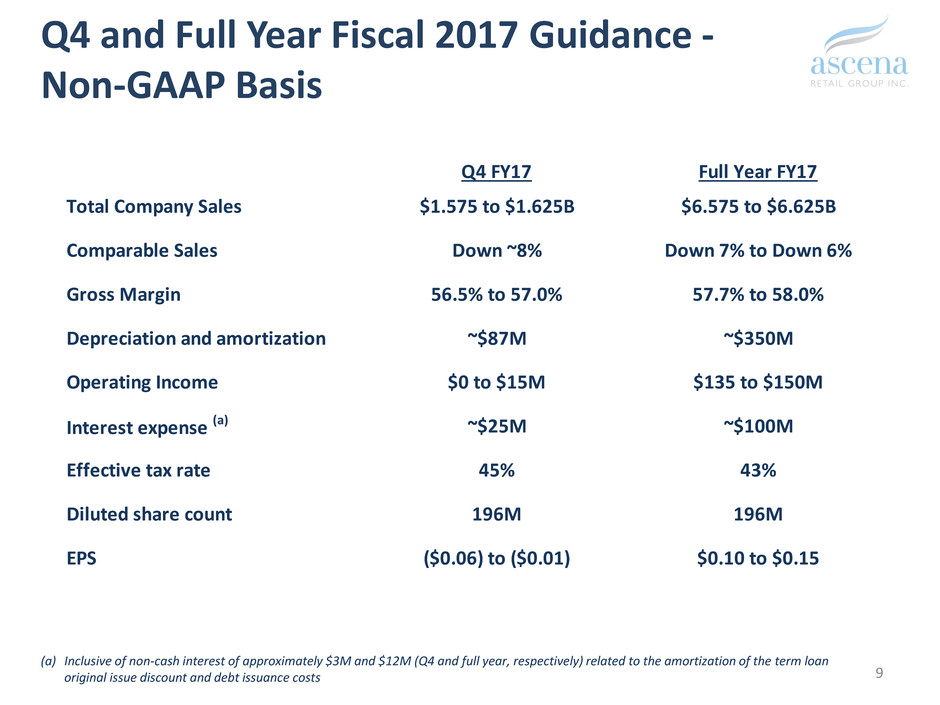
(a) Inclusive of non-cash interest of approximately $3M and $12M (Q4 and full year, respectively) related to the amortization of the term loan
original issue discount and debt issuance costs
Q4 and Full Year Fiscal 2017 Guidance -
Non-GAAP Basis
9
Q4 FY17 Full Year FY17
Total Company Sales $1.575 to $1.625B $6.575 to $6.625B
Comparable Sales Down ~8% Down 7% to Down 6%
Gross Margin 56.5% to 57.0% 57.7% to 58.0%
Depreciation and amortization ~$87M ~$350M
Operating Income $0 to $15M $135 to $150M
Interest expense (a) ~$25M ~$100M
Effective tax rate 45% 43%
Diluted share count 196M 196M
EPS ($0.06) to ($0.01) $0.10 to $0.15
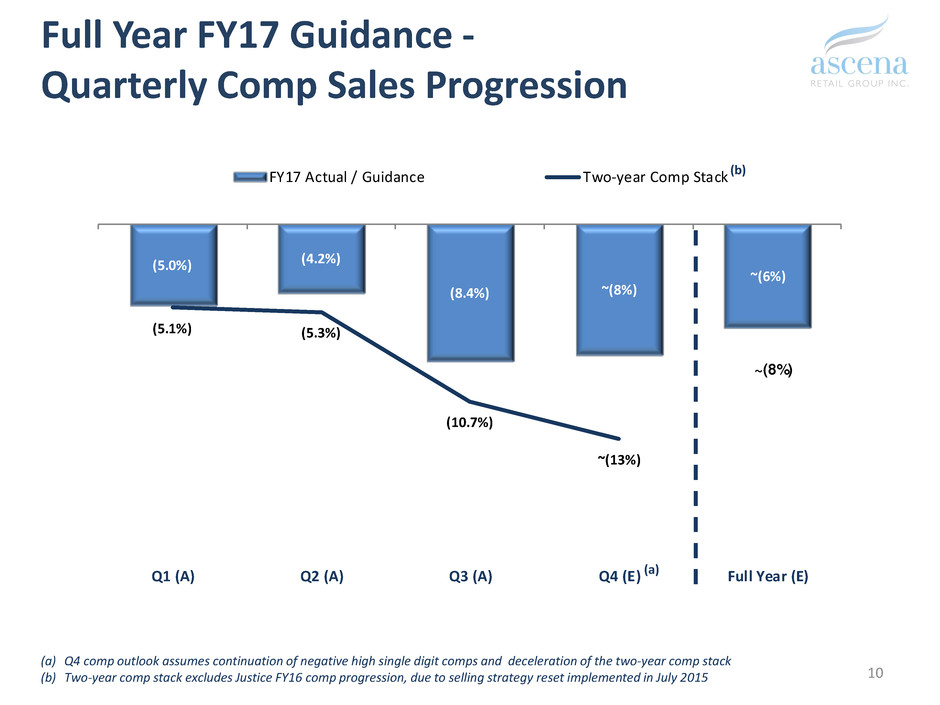
Full Year FY17 Guidance -
Quarterly Comp Sales Progression
(a) Q4 comp outlook assumes continuation of negative high single digit comps and deceleration of the two-year comp stack
(b) Two-year comp stack excludes Justice FY16 comp progression, due to selling strategy reset implemented in July 2015 10
(5.0%) (4.2%)
(8.4%) ~(8%)
~(6%)
(5.1%) (5.3%)
(10.7%)
~(13%)
Q1 (A) Q2 (A) Q3 (A) Q4 (E) Full Year (E)
FY17 Actual / Guidance Two-year Comp Stack
~(8%)
(b)
(a)

Anticipated Platform Savings
11
$235M
$300M(a)
(a) Represents top of the $250M - $300M range
$M FY15 FY16 FY17 FY18 FY19 FY20 Total
ANN Synergies
SG&A Non-merch procurement 9.3 24.4 17.7 51.4
Supply chain
BD&O Distribution / fulfillment 12.9 5.2 1.7 19.9
COGS Transportation / logistics 25.7 13.6 4.1 43.4
Organizational efficiency
SG&A Duplicative management teams 14.0 4.9 18.9
SG&A Employment benefit realignment 3.1 3.9 3.7 3.7 14.3
SG&A Public company costs 2.1 2.1
ANN Cost Savings
SG&A SG&A optimization 7.4 27.6 35.0
COGS COGS initiative 25.0 25.0 50.0
Total ANN Savings 7.4 56.1 96.9 65.1 9.4 0.0 235.0
Change for Growth
Operating model
SG&A Front office efficiencies 25.0 35.0 0.0 60.0
SG&A Corporate efficiencies 5.0 15.0 20.0 40.0
SG&A Non-merch procurement 17.0 30.0 45.0 8.0 100.0
BD&O Real estate 5.0 15.0 15.0 15.0 50.0
SG&A IT efficiencies 5.0 35.0 10.0 50.0
Total Change For Growth 0.0 0.0 52.0 100.0 115.0 33.0 300.0
Total Platform Savings 7.4 56.1 148.9 165.1 124.4 33.0 535.0
Total Cumulative Achieved Savings 7.4 63.5 212.4 377.6 502.0 535.0 535.0

Fleet Optimization Update
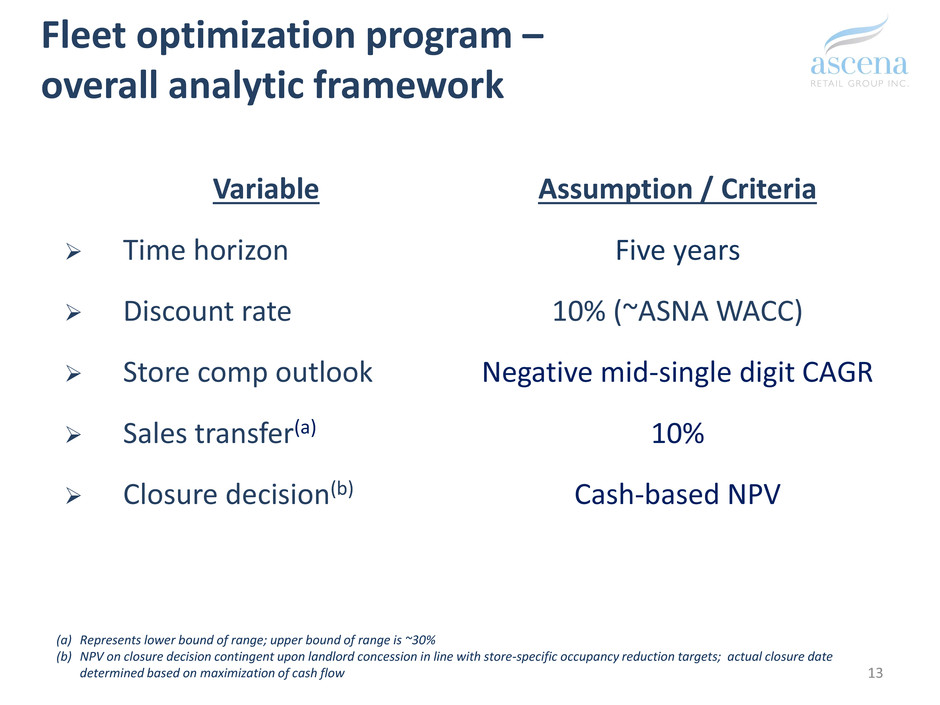
Fleet optimization program –
overall analytic framework
Variable
Time horizon
Discount rate
Store comp outlook
Sales transfer(a)
Closure decision(b)
Assumption / Criteria
Five years
10% (~ASNA WACC)
Negative mid-single digit CAGR
10%
Cash-based NPV
(a) Represents lower bound of range; upper bound of range is ~30%
(b) NPV on closure decision contingent upon landlord concession in line with store-specific occupancy reduction targets; actual closure date
determined based on maximization of cash flow 13

Fleet optimization program –
overall program store opportunity
Cumulative financial opportunity across 667 stores comprised of:
– Rent concessions: cumulative addressable program store occupancy expense of ~$110M
• Aligning occupancy expense rate of program stores with balance of chain represents ~$30M opportunity
• Additional target concessions of $20M needed to close overall contribution gap to balance of chain, due to lower
program store selling productivity, and resulting higher store expense rate
– Working capital: $55M tied up in program stores, supporting ~$550M in annual sales
– Improved productivity: lower bound 10% sales transfer to remaining store network
14
19.6%
14.3%
Program Stores Balance of Fleet
Occupancy Rate
(% of sales)
32.2%
21.4%
Program Stores Balance of Fleet
Store Expense Rate
(% of sales)
*
* Store Expense driven primarily by store payroll

Fleet optimization program –
additional considerations
Overall program store population will flex up or down over time based on:
– General store traffic environment
– Landlord participation in rent reduction program
– Realized sales transfer to remaining store network
– Sector demand consolidation (local market and brand-specific)
Current population of 667 program stores* classified as follows:
– Hard close (100% exit); 268 stores
– Rent relief / close (binary decision - exit unless pre-determined rent concession and
lease term is achieved from landlord); 399 stores
Balance of program benefit between EBITDA and working capital will be
determined by ultimate number of closures, and achievement level of rent
reduction program targets
Actual store closure dates will be based on maximizing free cash flow at the
individual store level
15
* Identified program stores each have lease action dates that occur before July 2019; 71 stores have been closed since inception of
program activity, which started in January 2017 following consolidation of brand real estate teams into single ASNA team
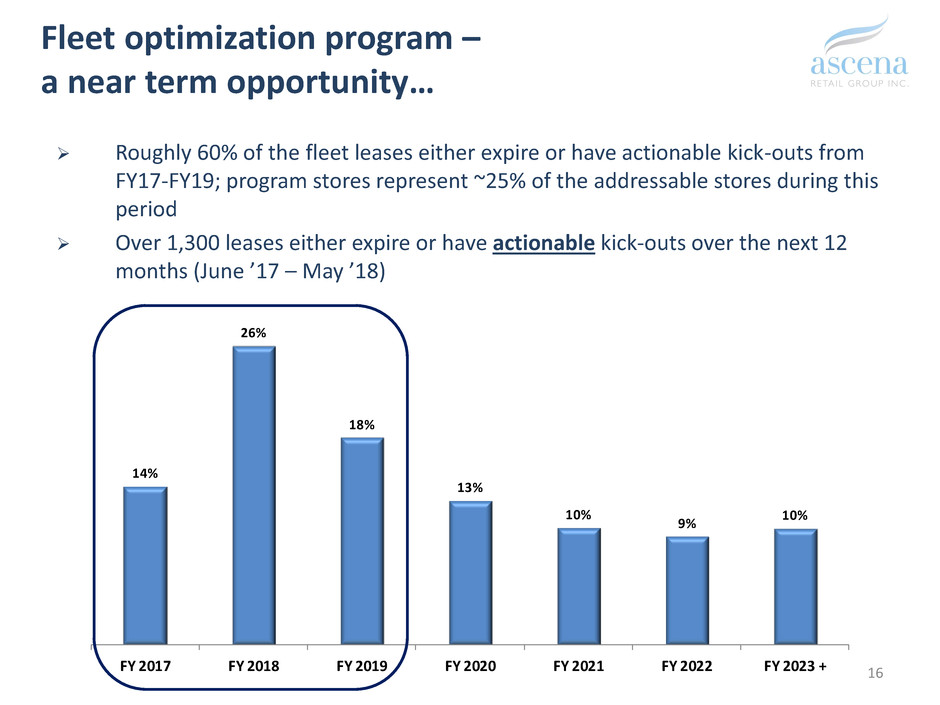
Fleet optimization program –
a near term opportunity…
Roughly 60% of the fleet leases either expire or have actionable kick-outs from
FY17-FY19; program stores represent ~25% of the addressable stores during this
period
Over 1,300 leases either expire or have actionable kick-outs over the next 12
months (June ’17 – May ’18)
16
14%
26%
18%
13%
10%
9%
10%
FY 2017 FY 2018 FY 2019 FY 2020 FY 2021 FY 2022 FY 2023 +
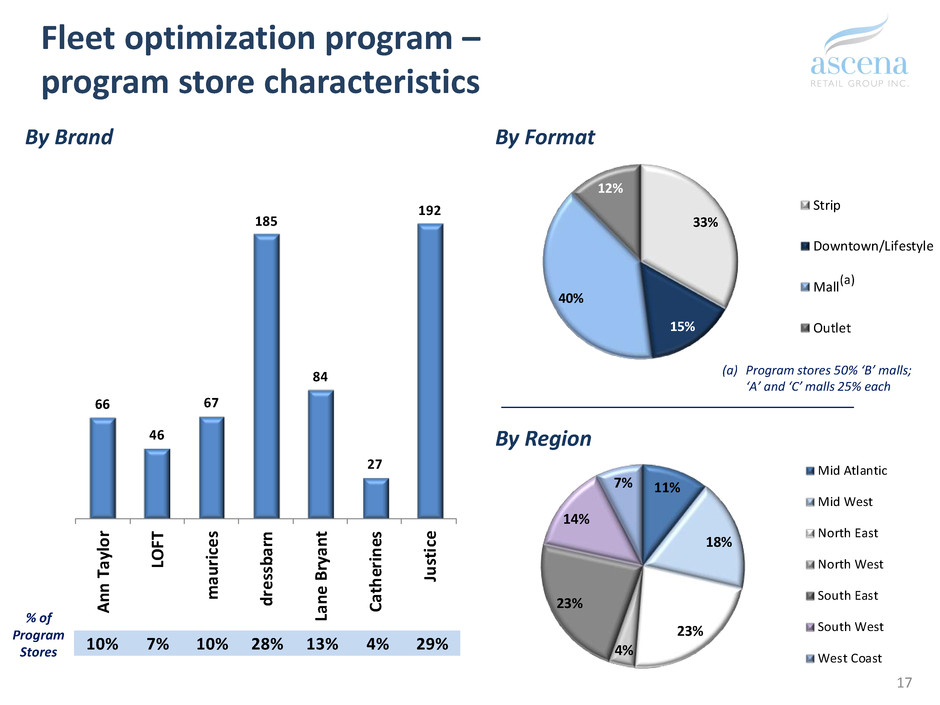
Fleet optimization program –
program store characteristics
11%
18%
23%
4%
23%
14%
7%
Mid Atlantic
Mid West
North East
North West
South East
South West
West Coast
By Region
33%
15%
40%
12%
Strip
Downtown/Lifestyle
Mall
Outlet
By Format
(a)
(a) Program stores 50% ‘B’ malls;
‘A’ and ‘C’ malls 25% each
10% 7% 10% 28% 13% 4% 29%
66
46
67
185
84
27
192
A
n
n
T
a
y
lo
r
L
O
F
T
m
a
u
ri
c
e
s
d
re
ss
b
a
rn
L
a
n
e
B
ry
a
n
t
C
a
th
e
ri
n
e
s
Ju
st
ic
e
By Brand
% of
Program
Stores
17

Fleet optimization program –
store closure sensitivity
Expected EBITDA benefit from combination of:
– Occupancy savings (from rent reduction at program stores that remain open) and
– Increased store productivity (sales transfer from closed store to remaining fleet)
Most favorable outcome represented by 100% rent concession target
achievement scenario
– Annual EBITDA benefit range depends on level of landlord participation
– Lower bound sales transfer rate of 10% used to develop Sales Transfer / Productivity
estimates until transfer model results are validated with actual closures; analytic
model suggests transfer rate up to ~30%
18
0% 30% 40% 50% 60% 100%
St re Closure Count 667 547 507 468 428 268
An u l EBITDA benefit -
N go iated Occupancy Reduction ($M)
$0 $15 $20 $25 $30 $50
Annual EBITDA benefit -
Sales Transfer / Productivity ($M)
$25 $21 $19 $18 $16 $7
One time benefit -
Working Capital Release
$56 $46 $42 $39 $36 $16
Rent Concession Achievement (% of target)
