Attached files
| file | filename |
|---|---|
| 8-K - FORM 8-K - Wellesley Bancorp, Inc. | v468623_8k.htm |
Exhibit 99.1
I NVESTOR P RESENTATION M AY 2017 NASDAQ: WEBK WWW . WELLESLEYBANK . COM
This presentation contains certain “forward - looking statements” within the meaning of the U . S . Private Securities Litigation Reform Act of 1995 about the Company and the Bank . Forward - looking statements include statements regarding anticipated future events and can be identified by the fact that they do not relate strictly to historical or current facts . They often include words such as “believe,” “expect,” “anticipate,” “estimate,” and “intend” or future or conditional verbs such as “will ,” “ would,” “should,” “could,” or “may . ” Forward - looking statements, by their nature, are subject to significant assumptions, risks and uncertainties . Certain factors that could cause actual results to differ materially from expected results include increased competitive pressures, changes in the interest rate environment, general economic conditions or conditions within the securities markets, and legislative and regulatory changes that could adversely affect the business in which the Company and the Bank are engaged . More detailed information regarding these factors is included in our filings with the U . S . Securities and Exchange Commission, including in the “Risk Factors” section of our Annual Report on Form 10 - K for the year ended December 31 , 2016 . In addition, it should be noted that our forward - looking statements speak only as of the date of this presentation . We do not undertake to update our forward - looking statements to reflect the impact of events or circumstances that may arise after the date on which such statements are made . Forward Looking Statements and Associated Risk Factors
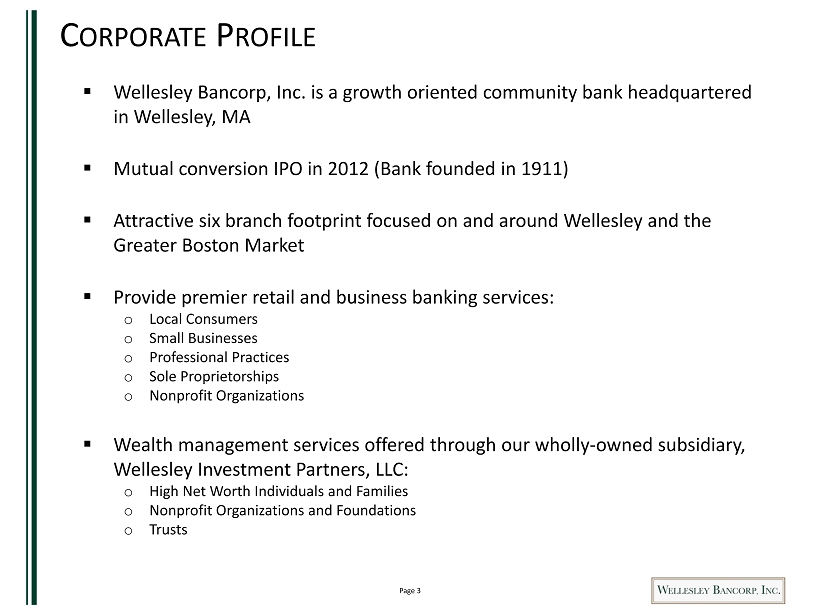
Page 3 C ORPORATE P ROFILE ▪ Wellesley Bancorp, Inc. is a growth oriented community bank headquartered in Wellesley, MA ▪ Mutual conversion IPO in 2012 (Bank founded in 1911) ▪ Attractive six branch footprint focused on and around Wellesley and the Greater Boston Market ▪ Provide premier retail and business banking services: o Local Consumers o Small Businesses o Professional Practices o Sole Proprietorships o Nonprofit Organizations ▪ Wealth management services offered through our wholly - owned subsidiary, Wellesley Investment Partners, LLC: o High Net Worth Individuals and Families o Nonprofit Organizations and F oundations o Trusts
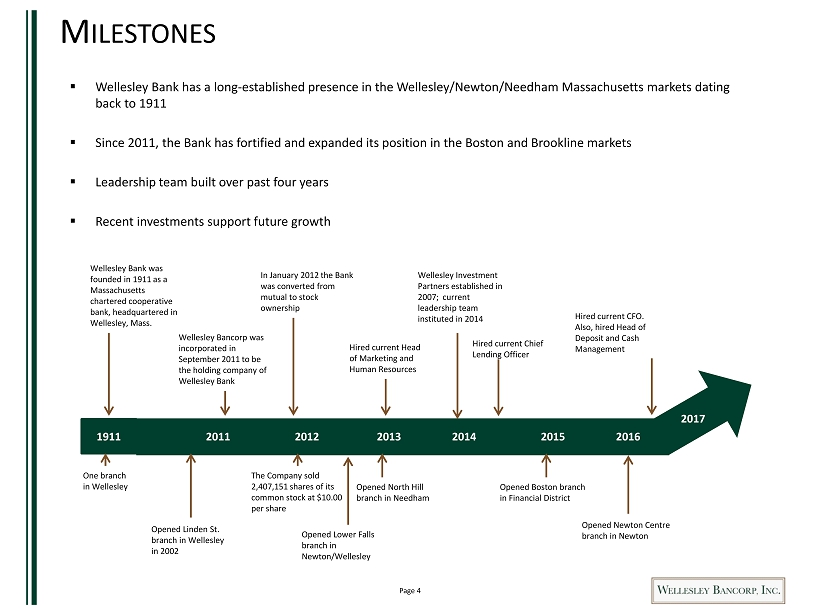
Page 4 ▪ Wellesley Bank has a long - established presence in the Wellesley/Newton/Needham Massachusetts markets dating back to 1911 ▪ Since 2011, the Bank has fortified and expanded its position in the Boston and Brookline markets ▪ Leadership team built over past four years ▪ Recent investments support future growth M ILESTONES Wellesley Bank was founded in 1911 as a Massachusetts chartered cooperative bank, headquartered in Wellesley, Mass. One branch in Wellesley 2011 2012 2013 2014 2015 2016 2017 Wellesley Bancorp was incorporated in September 2011 to be the holding company of Wellesley Bank In January 2012 the Bank was converted from mutual to stock ownership The Company sold 2,407,151 shares of its common stock at $10.00 per share Opened Linden St. branch in Wellesley in 2002 Opened North Hill branch in Needham Opened Lower Falls branch in Newton/Wellesley Opened Boston branch in Financial District Opened Newton Centre branch in Newton Wellesley Investment Partners established in 2007 ; current leadership team instituted in 2014 Hired current Head of Marketing and Human Resources Hired current Chief Lending Officer Hired current CFO. Also, hired Head of Deposit and Cash Management 1911
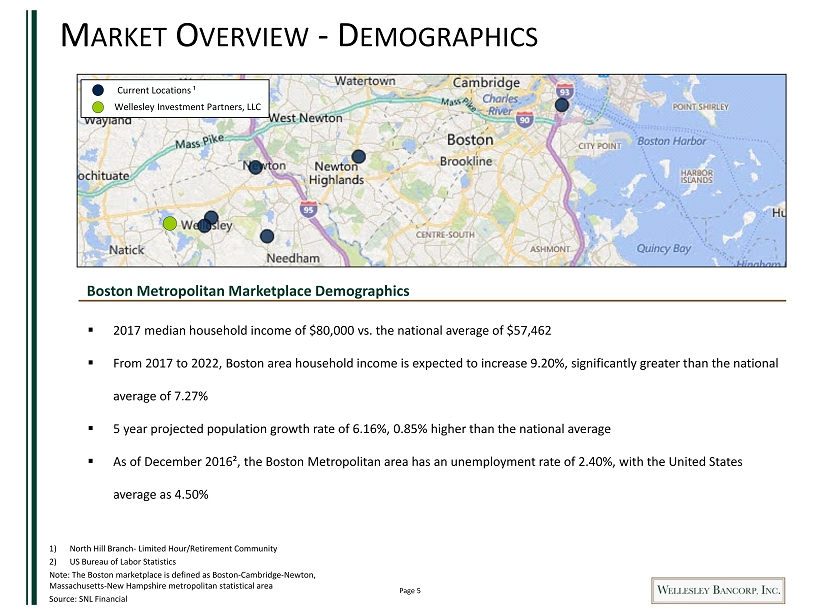
Page 5 Current Locations ¹ Wellesley Investment Partners, LLC M ARKET O VERVIEW - D EMOGRAPHICS 1) North Hill Branch - Limited Hour/Retirement Community 2) US Bureau of Labor Statistics Note: The Boston marketplace is defined as Boston - Cambridge - Newton, Massachusetts - New Hampshire metropolitan statistical area Source: SNL Financial Boston Metropolitan Marketplace Demographics ▪ 2017 median household income of $80,000 vs. the national average of $57,462 ▪ From 2017 to 2022, Boston area household income is expected to increase 9.20%, significantly greater than the national average of 7.27% ▪ 5 year projected population growth rate of 6.16%, 0.85% higher than the national average ▪ As of December 2016², the Boston Metropolitan area has an unemployment rate of 2.40%, with the United States average as 4.50%
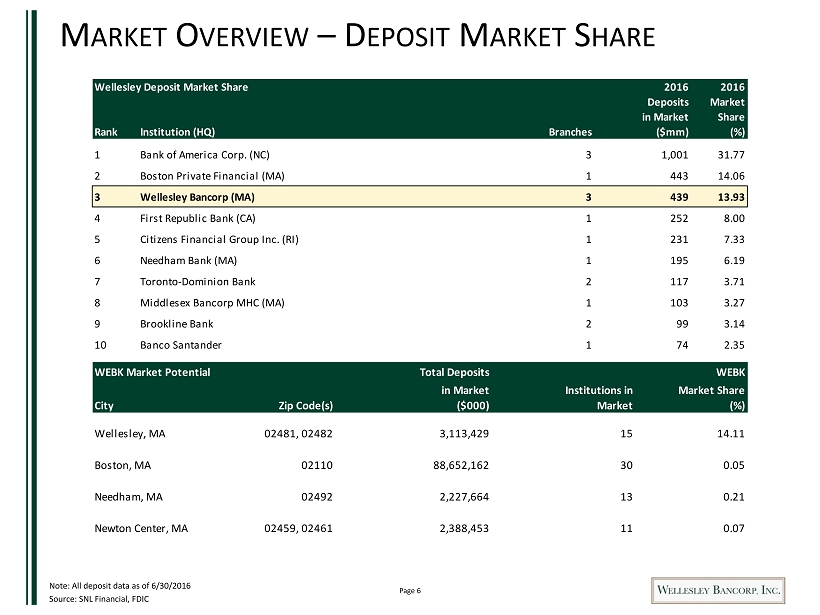
Page 6 M ARKET O VERVIEW – D EPOSIT M ARKET S HARE Note: All deposit data as of 6/30/2016 Source: SNL Financial, FDIC WEBK Market Potential Total Deposits WEBK in Market Institutions in Market Share City Zip Code(s) ($000) Market (%) Wellesley, MA 02481, 02482 3,113,429 15 14.11 Boston, MA 02110 88,652,162 30 0.05 Needham, MA 02492 2,227,664 13 0.21 Newton Center, MA 02459, 02461 2,388,453 11 0.07 Wellesley Deposit Market Share 2016 2016 Deposits Market in Market Share Rank Institution (HQ) Branches ($mm) (%) 1 Bank of America Corp. (NC) 3 1,001 31.77 2 Boston Private Financial (MA) 1 443 14.06 3 Wellesley Bancorp (MA) 3 439 13.93 4 First Republic Bank (CA) 1 252 8.00 5 Citizens Financial Group Inc. (RI) 1 231 7.33 6 Needham Bank (MA) 1 195 6.19 7 Toronto-Dominion Bank 2 117 3.71 8 Middlesex Bancorp MHC (MA) 1 103 3.27 9 Brookline Bank 2 99 3.14 10 Banco Santander 1 74 2.35
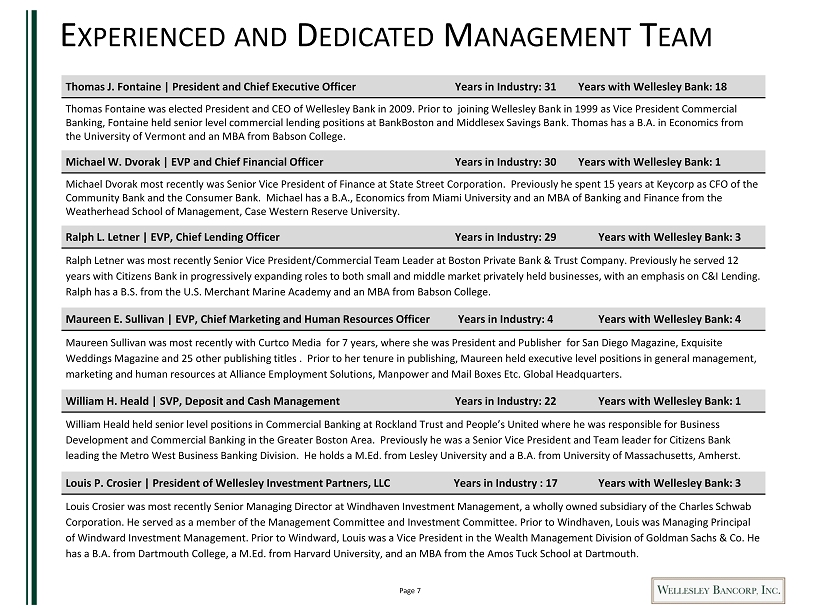
Page 7 Thomas J. Fontaine | President and Chief Executive Officer Years in Industry: 31 Years with Wellesley Bank: 18 Thomas Fontaine was elected President and CEO of Wellesley Bank in 2009. Prior to joining Wellesley Bank in 1999 as Vice President Commercial Banking, Fontaine held senior level commercial lending positions at BankBoston and Middlesex Savings Bank. Thomas has a B.A. in Economics from the University of Vermont and an MBA from Babson College. Michael W. Dvorak | EVP and Chief Financial Officer Years in Industry: 30 Years with Wellesley Bank: 1 Michael Dvorak most recently was Senior Vice President of Finance at State Street Corporation. Previously he spent 15 years at Keycorp as CFO of the Community Bank and the Consumer Bank. Michael has a B.A., Economics from Miami University and an MBA of Banking and Finance fro m the Weatherhead School of Management, Case Western Reserve University. Ralph L. Letner | EVP , Chief Lending Officer Years in Industry: 29 Years with Wellesley Bank: 3 Ralph Letner was most recently Senior Vice President/Commercial Team Leader at Boston Private Bank & Trust Company. Previously he served 12 years with Citizens Bank in progressively expanding roles to both small and middle market privately held businesses, with an emp hasis on C&I Lending. Ralph has a B.S. from the U.S. Merchant Marine Academy and an MBA from Babson College. Maureen E. Sullivan | EVP, Chief Marketing and Human Resources Officer Years in Industry: 4 Years with Wellesley Bank: 4 Maureen Sullivan was most recently with Curtco Media for 7 years, where she was President and Publisher for San Diego Magazine, Exquisite Weddings Magazine and 25 other publishing titles . Prior to her tenure in publishing , Maureen held executive level positions in general management, marketing and human resources at Alliance Employment Solutions, Manpower and Mail Boxes Etc. Global Headquarters. William H. Heald | SVP, Deposit and Cash Management Years in Industry: 22 Years with Wellesley Bank: 1 William Heald held senior level positions i n Commercial Banking at Rockland Trust and People’s United where he was responsible for Business Development and Commercial Banking in the Greater Boston Area. Previously he was a Senior Vice President and Team leader for Ci tizens Bank leading the Metro West Business Banking Division. He holds a M.Ed. from Lesley University and a B.A. from University of Mass ach usetts, Amherst. Louis P. Crosier | President of Wellesley Investment Partners, LLC Years in Industry : 17 Years with Wellesley Bank: 3 Louis Crosier was most recently Senior Managing Director at Windhaven Investment Management, a wholly owned subsidiary of the Charles Schwab Corporation . He served as a member of the Management Committee and Investment Committee. Prior to Windhaven, Louis was Managing Principa l of Windward Investment Management. Prior to Windward, Louis was a Vice President in the Wealth Management Division of Goldman Sa chs & Co. He has a B.A. from Dartmouth College, a M.Ed. from Harvard University, and an MBA from the Amos Tuck School at Dartmouth. E XPERIENCED AND D EDICATED M ANAGEMENT T EAM
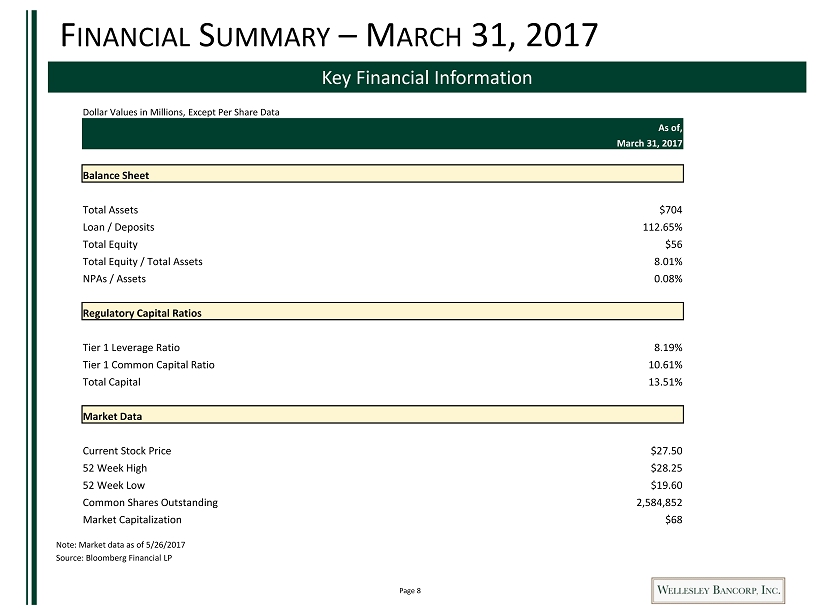
Page 8 F INANCIAL S UMMARY – M ARCH 31 , 2017 Note: Market data as of 5/26/2017 Source: Bloomberg Financial LP Key Financial Information Dollar Values in Millions, Except Per Share Data As of, March 31, 2017 Balance Sheet Total Assets $704 Loan / Deposits 112.65% Total Equity $56 Total Equity / Total Assets 8.01% NPAs / Assets 0.08% Regulatory Capital Ratios Tier 1 Leverage Ratio 8.19% Tier 1 Common Capital Ratio 10.61% Total Capital 13.51% Market Data Current Stock Price $27.50 52 Week High $28.25 52 Week Low $19.60 Common Shares Outstanding 2,584,852 Market Capitalization $68

Page 9 H ISTORICAL S TOCK P RICE P ERFORMANCE Stock Price and Volume Since 1/25/2012 Note: Market data as of 5/26/2017 Source: Bloomberg Financial LP * Source: SNL, as of 6/5/2017 0 10,000 20,000 30,000 40,000 50,000 60,000 70,000 80,000 90,000 100,000 0.00 5.00 10.00 15.00 20.00 25.00 30.00 1/25/2012 7/25/2012 1/25/2013 7/25/2013 1/25/2014 7/25/2014 1/25/2015 7/25/2015 1/25/2016 7/25/2016 1/25/2017 Volume -# Shares Price -$/Share Total Return 1/25/2012 - 5/26/2017 178.80% Statistics Average Price $18.78 Volume Weighted Avg. Price $17.26 Avg. Daily Trading Volume 3,057 Valuation Price / LTM EPS 21.3x Price / TBV 121.00% Institutional Ownership * 20.53% Insider Ownership * 19.23%
Page 10 B USINESS S TRATEGY AND V ISION ▪ We are creating a different brand by focusing on premier banking and wealth management with an intense focus on organic growth ▪ We start by hiring great bankers and wealth managers who are motivated to create appropriate financial solutions for our clients ▪ We pride ourselves in having an entrepreneurial spirit, where we stay open to new ideas and make quick, sound decisions that make sense ▪ We have deep understanding of our markets through our collective partnerships with our communities o Company volunteers provide leadership and support to many non profit and civic organizations o The Bank invests in our communities through loans and investments o The Foundation gives back to our communities through charitable contributions ▪ We strive to create and maintain long - term partnerships with our clients o Core deposit focus o Real estate solutions for residents and businesses o Commercial and Industrial growth emphasis o Wealth management solutions for high net worth individuals and families, private foundations and endowments through our wholly owned subsidiary, Wellesley Investment Partners, LLC ▪ Our execution will drive long - term shareholder value Become the leading premier bank and investment firm in our marketplace
Page 11 O UR B USINESS M ODEL ▪ Recruit experienced, local bankers and wealth advisors who want to “make a difference” for their community and thrive in an entrepreneurial environment ▪ Provide for a seamless client experience across traditional banking products, services, and wealth management ▪ Strive for a leaner operation, while maintaining high value to customers at a reasonable cost ▪ Realize organizational efficiencies as we grow o Leverage technology with sophisticated vendors o Maintain a solid credit culture and minimize servicing and collection expense o Experienced labor focused on relationships, efficiency and risk management o Outsource selected functions ▪ Optimize our physical presence in our communities o Accessible and inviting branches, but not abundant o Capable and secure mobile and internet banking o Premier service that helps the client explore options and develop solutions ▪ Execution is key Facilitate growth and enhance customer experience across all products

Page 12 H ISTORICAL P ROFITABILITY 1.Peer group defined in addendum Note: WEBK completed a conversion IPO on 1/26/2012 Data for 2017Q1 represents performance over the last twelve months Source: SNL Financial Net Interest Margin (%) Diluted Earnings per Share ROAE (%) ROAA (%) Wellesley Bank Peer Group¹ ` 4.07 3.94 3.63 3.54 3.37 3.31 3.17 3.15 3.66 3.53 3.40 3.34 3.38 3.43 3.31 3.32 0.30 1.30 2.30 3.30 4.30 5.30 6.30 2010Y 2011Y 2012Y 2013Y 2014Y 2015Y 2016Y 2017Q1 0.84 0.74 0.33 0.55 0.36 0.46 0.46 0.47 0.64 0.61 0.52 0.50 0.50 0.52 0.73 0.67 0.00 0.10 0.20 0.30 0.40 0.50 0.60 0.70 0.80 0.90 2010Y 2011Y 2012Y 2013Y 2014Y 2015Y 2016Y 2017Q1 0.97 0.77 1.14 1.24 1.29 0.53 0.64 0.63 0.65 0.70 0.78 1.07 1.14 0 0.2 0.4 0.6 0.8 1 1.2 1.4 2010Y 2011Y 2012Y 2013Y 2014Y 2015Y 2016Y 2017Q1 11.17 9.39 2.61 5.09 3.71 5.21 5.38 5.58 5.32 6.29 4.92 4.85 4.58 4.53 5.51 6.97 0.00 2.00 4.00 6.00 8.00 10.00 12.00 2010Y 2011Y 2012Y 2013Y 2014Y 2015Y 2016Y 2017Q1

Page 13 W EALTH M ANAGEMENT O PPORTUNITY Source: SNL Financial Noninterest Income Breakdown ▪ AUM: $328 million at 3/31/2017 ▪ Discretionary: $261 million ▪ Non - Discretionary: $67 million ▪ From March, 2011 to March, 2017, WEBK’s wealth management fee income has a compound annual growth rate of 51.8% ▪ Exceptional leadership team assembled and led by Louis Crosier beginning in 4 th quarter of 2014 Twelve Months ending March 31, 2017 ( Dollar values in thousands) Customer Service Fees $110 5.83% Mortgage Banking Activities $292 15.48% Gain on Sale of Securities, Net $16 0.85% Income on BOLI $229 12.14% Wealth Management fees $1,066 56.52% Miscellaneous $173 9.17% Total Noninterest Income $1,886 100.00% 87 127 276 415 412 632 1,066 - 200 400 600 800 1,000 1,200 3/2011 3/2012 3/2013 3/2014 3/2015 3/2016 3/2017 Wealth Management Fees 12 Months Ending, ( In thousands $)
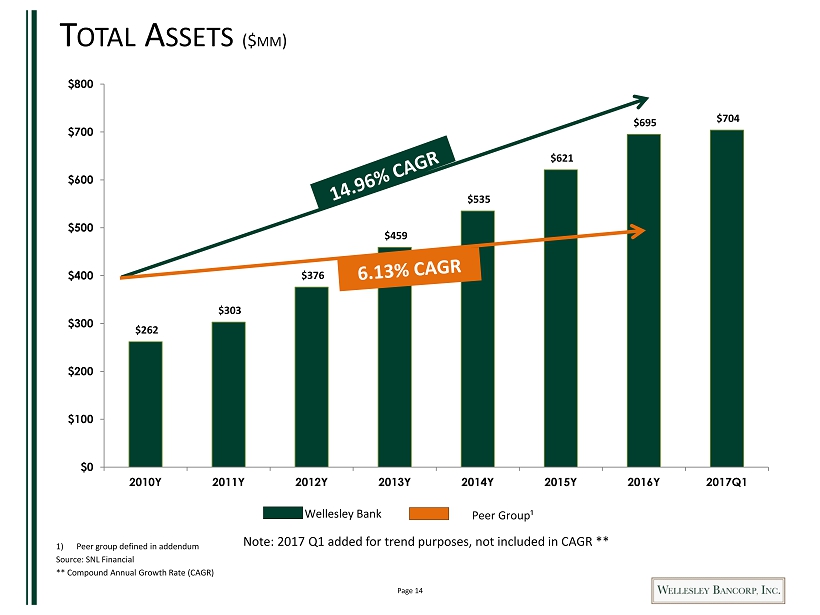
Page 14 $262 $303 $376 $459 $535 $621 $695 $704 $0 $100 $200 $300 $400 $500 $600 $700 $800 2010Y 2011Y 2012Y 2013Y 2014Y 2015Y 2016Y 2017Q1 T OTAL A SSETS ($ MM ) Wellesley Bank Peer Group¹ Note: 2017 Q1 added for trend purposes, not included in CAGR ** 1) Peer group defined in addendum Source: SNL Financial ** Compound Annual Growth Rate (CAGR)
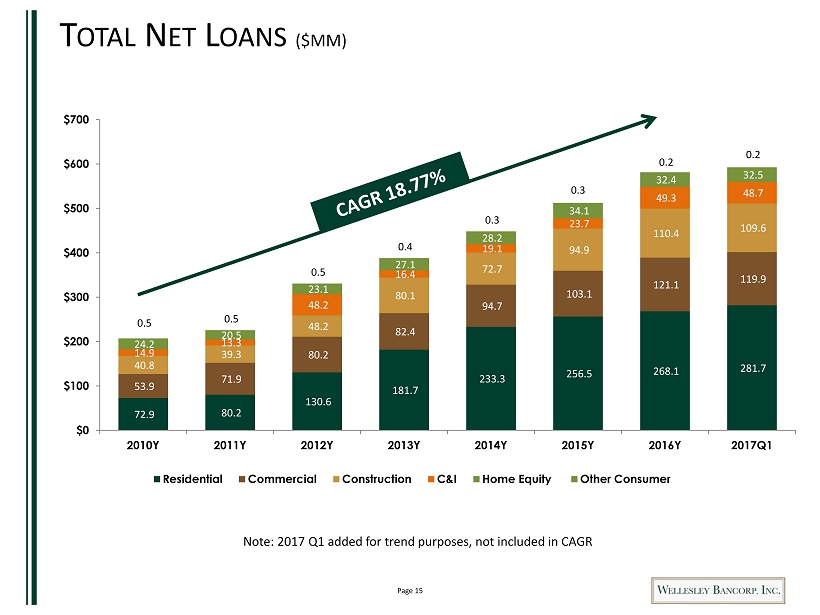
Page 15 72.9 80.2 130.6 181.7 233.3 256.5 268.1 281.7 53.9 71.9 80.2 82.4 94.7 103.1 121.1 119.9 40.8 39.3 48.2 80.1 72.7 94.9 110.4 109.6 14.9 13.3 48.2 16.4 19.1 23.7 49.3 48.7 24.2 20.5 23.1 27.1 28.2 34.1 32.4 32.5 0.5 0.5 0.5 0.4 0.3 0.3 0.2 0.2 $0 $100 $200 $300 $400 $500 $600 $700 2010Y 2011Y 2012Y 2013Y 2014Y 2015Y 2016Y 2017Q1 Residential Commercial Construction C&I Home Equity Other Consumer T OTAL N ET L OANS ($MM) Note: 2017 Q1 added for trend purposes, not included in CAGR
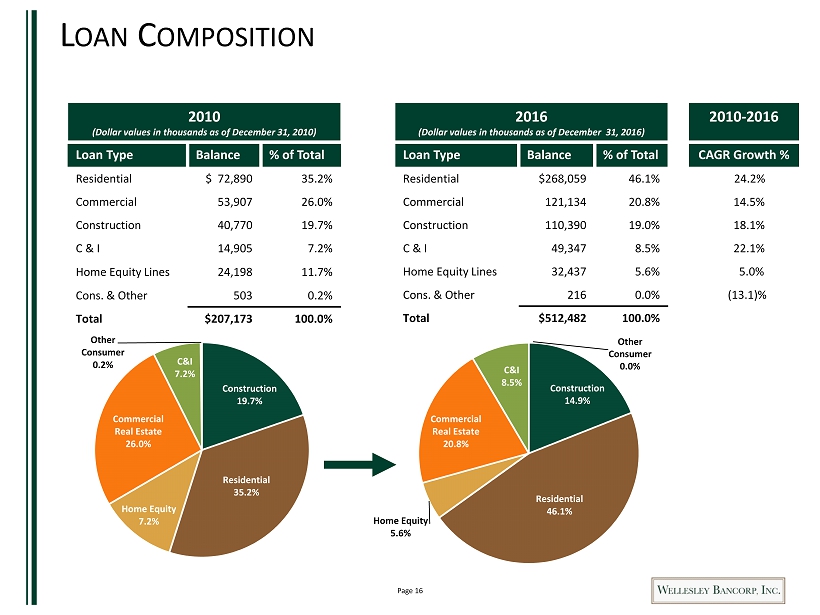
Page 16 2010 (Dollar values in thousands as of December 31, 2010) Loan Type Balance % of Total Residential $ 72,890 35.2% Commercial 53,907 26.0% Construction 40,770 19.7% C & I 14,905 7.2% Home Equity Lines 24,198 11.7% Cons. & Other 503 0.2% Total $207,173 100.0% Construction 19.7% Residential 35.2% Home Equity 7.2% Commercial Real Estate 26.0% C&I 7.2 % Other Consumer 0.2% L OAN C OMPOSITION 2016 (Dollar values in thousands as of December 31, 2016) Loan Type Balance % of Total Residential $268,059 46.1% Commercial 121,134 20.8% Construction 110,390 19.0% C & I 49,347 8.5% Home Equity Lines 32,437 5.6% Cons. & Other 216 0.0% Total $512,482 100.0% 2010 - 2016 CAGR Growth % 24.2% 14.5% 18.1% 22.1% 5.0% (13.1)% Construction 14.9% Residential 46.1% Home Equity 5.6% Commercial Real Estate 20.8% C&I 8.5 % Other Consumer 0.0%
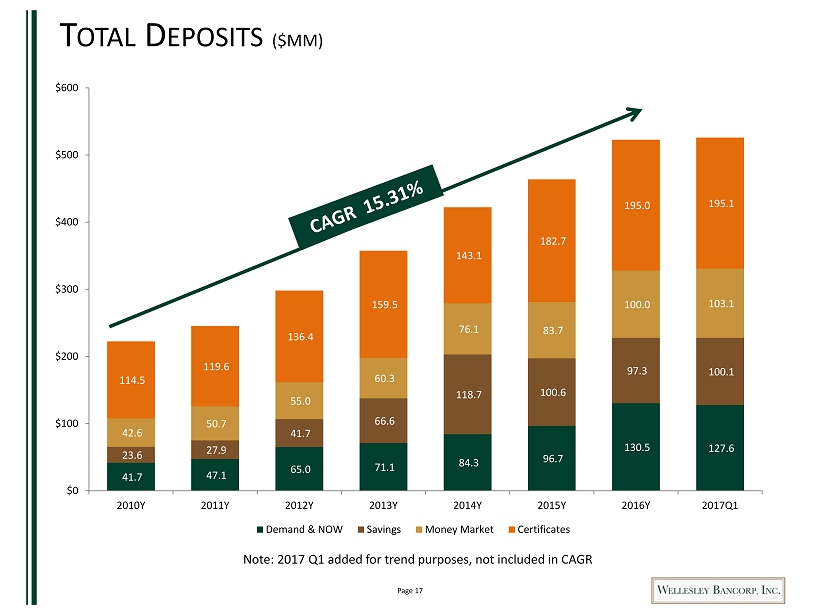
Page 17 41.7 47.1 65.0 71.1 84.3 96.7 130.5 127.6 23.6 27.9 41.7 66.6 118.7 100.6 97.3 100.1 42.6 50.7 55.0 60.3 76.1 83.7 100.0 103.1 114.5 119.6 136.4 159.5 143.1 182.7 195.0 195.1 $0 $100 $200 $300 $400 $500 $600 2010Y 2011Y 2012Y 2013Y 2014Y 2015Y 2016Y 2017Q1 Demand & NOW Savings Money Market Certificates T OTAL D EPOSITS ($MM) Note: 2017 Q1 added for trend purposes, not included in CAGR

Page 18 D EPOSIT C OMPOSITION 2010 (Dollar values in thousands as of December 31, 2010) Deposit Type Balance % of Total Demand & NOW $ 41,722 18.2% Savings 23,642 10.3% Money Market 48,367 21.2% Certificates 114,509 50.2% Total $228,240 100.0% 2016 (Dollar values in thousands as of December 31, 2016) Deposit Type Balance % of Total Demand & NOW $ 130,527 25.0% Savings 97,310 18.6% Money Market 99,964 19.1% Certificates 195,009 37.3% Total $ 522,810 100.0% 2010 - 2016 CAGR Growth % 20.9% 26.6% 12.9% 9.3% Core Deposits as % of Total: 60.6% MRQ Cost of Int. Bearing Deposits: 1.34% MRQ Cost of Int. Bearing Deposits: 0.79% Core Deposits as % of Total: 49.8% Demand & NOW 25 % Savings 19% Money Market 19% CDs 38 % Demand & NOW 18 % Savings 11% Money Market 21% CDs 50 % Significant Shift to Core Deposit Funding With Strong Growth in Transaction Accounts

Page 19 C APITAL R ATIO C OMPARISON As of March 31, 2017 11.77% 9.08% 11.77% 12.79% 10.61% 8.19% 10.61% 13.51% 0.00% 2.00% 4.00% 6.00% 8.00% 10.00% 12.00% 14.00% 16.00% TCE /TA Leverage Ratio Tier 1 Ratio RBC Ratio Wellesley Bank Wellesley Bancorp
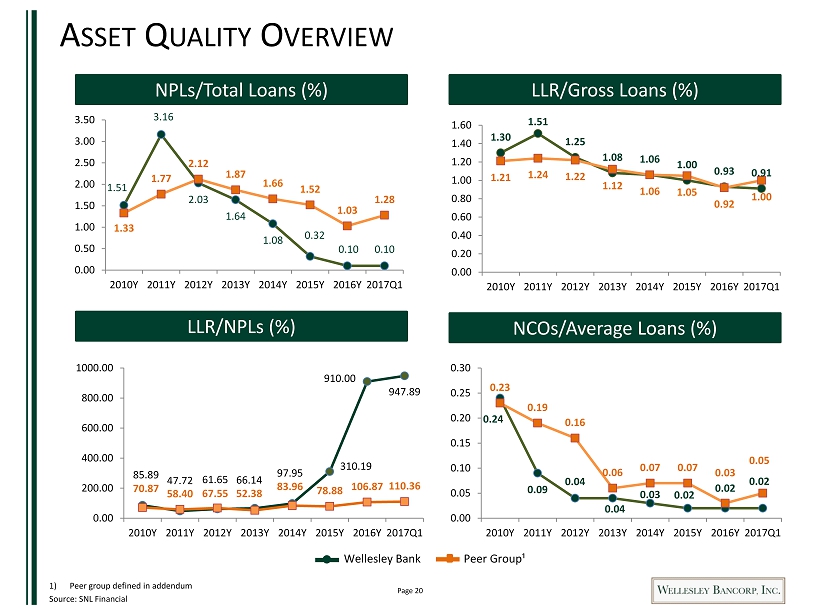
Page 20 A SSET Q UALITY O VERVIEW 1) Peer group defined in addendum Source: SNL Financial NPLs/Total Loans (%) LLR/Gross Loans (%) NCOs/Average Loans (%) LLR/NPLs (%) Wellesley Bank Peer Group¹ ` 1.51 3.16 2.03 1.64 1.08 0.32 0.10 0.10 1.33 1.77 2.12 1.87 1.66 1.52 1.03 1.28 0.00 0.50 1.00 1.50 2.00 2.50 3.00 3.50 2010Y 2011Y 2012Y 2013Y 2014Y 2015Y 2016Y 2017Q1 1.30 1.51 1.25 1.08 1.06 1.00 0.93 0.91 1.21 1.24 1.22 1.12 1.06 1.05 0.92 1.00 0.00 0.20 0.40 0.60 0.80 1.00 1.20 1.40 1.60 2010Y 2011Y 2012Y 2013Y 2014Y 2015Y 2016Y 2017Q1 85.89 47.72 61.65 66.14 97.95 310.19 910.00 947.89 70.87 58.40 67.55 52.38 83.96 78.88 106.87 110.36 0.00 200.00 400.00 600.00 800.00 1000.00 2010Y 2011Y 2012Y 2013Y 2014Y 2015Y 2016Y 2017Q1 0.24 0.09 0.04 0.04 0.03 0.02 0.02 0.02 0.23 0.19 0.16 0.06 0.07 0.07 0.03 0.05 0.00 0.05 0.10 0.15 0.20 0.25 0.30 2010Y 2011Y 2012Y 2013Y 2014Y 2015Y 2016Y 2017Q1
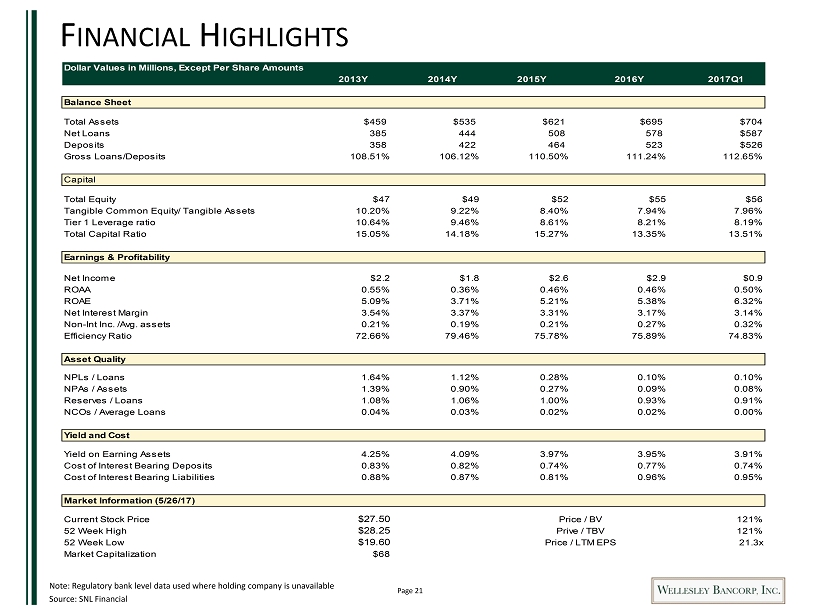
Page 21 F INANCIAL H IGHLIGHTS Note: Regulatory bank level data used where holding company is unavailable Source: SNL Financial Dollar Values in Millions, Except Per Share Amounts 2013Y 2014Y 2015Y 2016Y 2017Q1 Balance Sheet Total Assets $459 $535 $621 $695 $704 Net Loans 385 444 508 578 $587 Deposits 358 422 464 523 $526 Gross Loans/Deposits 108.51% 106.12% 110.50% 111.24% 112.65% Capital Total Equity $47 $49 $52 $55 $56 Tangible Common Equity/ Tangible Assets 10.20% 9.22% 8.40% 7.94% 7.96% Tier 1 Leverage ratio 10.64% 9.46% 8.61% 8.21% 8.19% Total Capital Ratio 15.05% 14.18% 15.27% 13.35% 13.51% Earnings & Profitability Net Income $2.2 $1.8 $2.6 $2.9 $0.9 ROAA 0.55% 0.36% 0.46% 0.46% 0.50% ROAE 5.09% 3.71% 5.21% 5.38% 6.32% Net Interest Margin 3.54% 3.37% 3.31% 3.17% 3.14% Non-Int Inc. /Avg. assets 0.21% 0.19% 0.21% 0.27% 0.32% Efficiency Ratio 72.66% 79.46% 75.78% 75.89% 74.83% Asset Quality NPLs / Loans 1.64% 1.12% 0.28% 0.10% 0.10% NPAs / Assets 1.39% 0.90% 0.27% 0.09% 0.08% Reserves / Loans 1.08% 1.06% 1.00% 0.93% 0.91% NCOs / Average Loans 0.04% 0.03% 0.02% 0.02% 0.00% Yield and Cost Yield on Earning Assets 4.25% 4.09% 3.97% 3.95% 3.91% Cost of Interest Bearing Deposits 0.83% 0.82% 0.74% 0.77% 0.74% Cost of Interest Bearing Liabilities 0.88% 0.87% 0.81% 0.96% 0.95% Market Information (5/26/17) Current Stock Price $27.50 121% 52 Week High $28.25 121% 52 Week Low $19.60 21.3x Market Capitalization $68 Price / BV Prive / TBV Price / LTM EPS
Page 22 I NVESTMENT C ONSIDERATIONS ▪ Attractive Price/TBV valuation 121% ▪ Well positioned in economically attractive markets to generate core organic growth along with a growing wealth management platform ▪ Experienced management team ▪ Insider commitment: 28% ownership including ESOP, exercisable options and Wellesley Bank Charitable Foundation ▪ Clear understanding of risks, opportunities and challenges Note: Data as of 5/26/17
Page 23 C ULTURE S TATEMENT At Wellesley Bank , it is all about the people: our employees, our community and most importantly our clients. It’s about hiring great people and treating them well, which in turn is a direct reflection on how we treat our clients. We pride ourselves in having an entrepreneurial spirit, where we continue to evolve, stay open to ideas and make quick sound decisions that make sense. The foundation of our bank is built on integrity, community and exceptional client service, where everyone is treated fairly and with respect. We continue to seek excellence, success and satisfaction in our work at Wellesley Bank . The Bank and directors are dedicated to providing an environment that enables all employees to attain these goals.
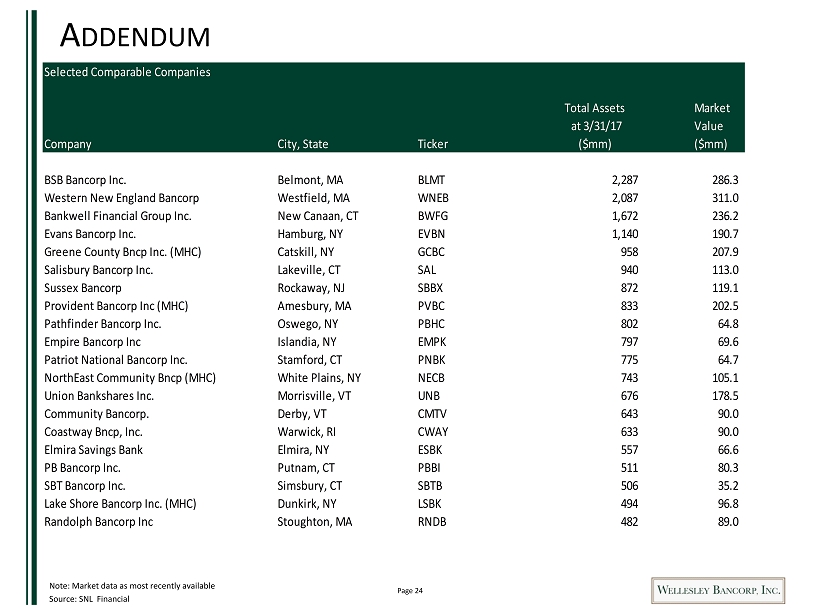
Page 24 A DDENDUM Note: Market data as most recently available Source: SNL Financial Selected Comparable Companies Total Assets Market at 3/31/17 Value Company City, State Ticker ($mm) ($mm) BSB Bancorp Inc. Belmont, MA BLMT 2,287 286.3 Western New England Bancorp Westfield, MA WNEB 2,087 311.0 Bankwell Financial Group Inc. New Canaan, CT BWFG 1,672 236.2 Evans Bancorp Inc. Hamburg, NY EVBN 1,140 190.7 Greene County Bncp Inc. (MHC) Catskill, NY GCBC 958 207.9 Salisbury Bancorp Inc. Lakeville, CT SAL 940 113.0 Sussex Bancorp Rockaway, NJ SBBX 872 119.1 Provident Bancorp Inc (MHC) Amesbury, MA PVBC 833 202.5 Pathfinder Bancorp Inc. Oswego, NY PBHC 802 64.8 Empire Bancorp Inc Islandia, NY EMPK 797 69.6 Patriot National Bancorp Inc. Stamford, CT PNBK 775 64.7 NorthEast Community Bncp (MHC) White Plains, NY NECB 743 105.1 Union Bankshares Inc. Morrisville, VT UNB 676 178.5 Community Bancorp. Derby, VT CMTV 643 90.0 Coastway Bncp, Inc. Warwick, RI CWAY 633 90.0 Elmira Savings Bank Elmira, NY ESBK 557 66.6 PB Bancorp Inc. Putnam, CT PBBI 511 80.3 SBT Bancorp Inc. Simsbury, CT SBTB 506 35.2 Lake Shore Bancorp Inc. (MHC) Dunkirk, NY LSBK 494 96.8 Randolph Bancorp Inc Stoughton, MA RNDB 482 89.0