Attached files
UNITED STATES
SECURITIES AND EXCHANGE COMMISSION
Washington, D.C. 20549
Form 10-K
(Mark One)
| ☑ |
ANNUAL REPORT PURSUANT TO SECTION 13 OR 15(d) OF THE SECURITIES EXCHANGE ACT OF 1934
|
FOR THE FISCAL YEAR ENDED DECEMBER 31, 2016
OR
| ☐ |
TRANSITION REPORT PURSUANT TO SECTION 13 OR 15(d) OF THE SECURITIES EXCHANGE ACT OF 1934
|
FOR THE TRANSITION PERIOD FROM TO____
COMMISSION FILE NUMBER 1-11151
U.S. PHYSICAL THERAPY, INC.
(EXACT NAME OF REGISTRANT AS SPECIFIED IN ITS CHARTER)
|
NEVADA
|
76-0364866
|
|
|
(STATE OR OTHER JURISDICTION OF INCORPORATION OR ORGANIZATION)
|
(I.R.S. EMPLOYER IDENTIFICATION NO.)
|
|
|
1300 WEST SAM HOUSTON PARKWAY SOUTH,
SUITE 300,
HOUSTON, TEXAS
|
77042
|
|
|
(ADDRESS OF PRINCIPAL EXECUTIVE OFFICES)
|
(ZIP CODE)
|
|
REGISTRANT’S TELEPHONE NUMBER, INCLUDING AREA CODE: (713) 297-7000
SECURITIES REGISTERED PURSUANT TO SECTION 12(b) OF THE EXCHANGE ACT:
|
Title of Each Class
|
Name of Each Exchange on Which Registered
|
|
|
Common Stock, $.01 par value
|
New York Stock Exchange
|
SECURITIES REGISTERED PURSUANT TO SECTION 12(g) OF THE EXCHANGE ACT: NONE
Indicate by check mark if the registrant is a well-known seasoned issuer, as defined in Rule 405 of the Securities Act. Yes ☐ No ☑
Indicate by check mark if the registrant is not required to file reports pursuant to Section 13 or 15(d) of the Act. Yes ☐ No ☑
Indicate by check mark whether the registrant (1) has filed all reports required to be filed by Section 13 or 15(d) of the Exchange Act during the preceding 12 months (or for such shorter period that the registrant was required to file such reports), and (2) has been subject to such filing requirements for the past 90 days. Yes ☐ No ☑
Indicate by check mark whether the registrant has submitted electronically and posted on its corporate Website, if any, every Interactive Data File required to be submitted and posted pursuant to Rule 405 of Regulation S-T during the preceding 12 months (or for such shorter period that the registrant was required to submit and post such files). Yes ☑ No ☐
Indicate by check mark if disclosure of delinquent filers pursuant to Item 405 of Regulation S-K is not contained herein, and will not be contained, to the best of registrant’s knowledge, in definitive proxy or information statements incorporated by reference in Part III of this Form 10-K or any amendment to this Form 10-K. ☑
Indicate by check mark whether the registrant is a large accelerated filer, an accelerated filer, a non-accelerated filer, or a smaller reporting company. See the definitions of “large accelerated filer,” “accelerated filer” and “smaller reporting company” in Rule 12b-2 of the Exchange Act.
|
Large accelerated filer
|
☐
|
Accelerated filer
|
☑
|
|
Non-accelerated filer
|
☐ (Do not check if a smaller reporting company)
|
Smaller reporting company
|
☐
|
Indicate by check mark whether the registrant is a shell company (as defined in Rule 12b-2 of the Exchange Act). Yes ☐ No ☑
If an emerging growth company, indicate by check mark if the registrant has elected not to use the extended transition period for complying with any new or revised financial accounting standards provided pursuant to Section 13(a) of the Exchange Act. ☐
The aggregate market value of the shares of the registrant’s common stock held by non-affiliates of the registrant at June 30, 2016 was $547,917,000 based on the closing sale price reported on the NYSE for the registrant’s common stock on June 30, 2016, the last business day of the registrant’s most recently completed second fiscal quarter. For purposes of this computation, all executive officers, directors and 5% or greater beneficial owners of the registrant were deemed to be affiliates. Such determination should not be deemed an admission that such executive officers, directors and beneficial owners are, in fact, affiliates of the registrant.
As of June 6, 2017, the number of shares outstanding of the registrant’s common stock, par value $.01 per share, was: 12,581,237.
DOCUMENTS INCORPORATED BY REFERENCE
|
DOCUMENT
|
PART OF FORM 10-K
|
|
|
None
|
Explanatory Note
This Annual Report on Form 10-K includes the restatement of certain of our previously issued consolidated financial statements and selected financial data. It also amends previously filed management’s discussion and analysis of financial condition and results of operations and other disclosures for the periods presented in this Annual Report on Form 10-K. As indicated in Note 1, Organization, Nature of Operations and Basis of Presentation – Restatement of Prior Financial Statements, in the Notes to Consolidated Financial Statements and as additionally disclosed in our current report on Form 8-K filed March 16, 2017, prior to issuing the 2016 annual financial statements, we determined we had previously incorrectly accounted for the non-controlling interests which were mandatorily redeemable. See Footnote 2 – Significant Accounting Policies – Mandatorily Redeemable Non-Controlling Interests – for a description of the accounting for mandatorily redeemable non-controlling interests. We determined this correction was material to previously issued annual and quarterly consolidated financial statements. The Company, in this Annual Report on Form 10-K for the year ended December 31, 2016, restated the following:
| · |
Consolidated Financial Statements
|
| · |
for the balance sheet as of December 31, 2015; and
|
| · |
the statements of net income, cash flows and equity for the periods ended December 31, 2015 and 2014, which will include a cumulative adjustment to the beginning balances as of January 1, 2014.
|
| · |
Selected Financial Data for the years ended December 31, 2015, 2014, 2013 and 2012.
|
| · |
Unaudited quarterly financial information for the quarters ended September 30, 2016, June 30, 2016, March 31, 2016, December 31, 2015, September 30, 2015, June 30, 2015 and March 31, 2015.
|
| · |
Management’s discussion and analysis of financial condition and results of operations as of and for the years ended December 31, 2015 and 2014.
|
We believe that presenting all of the amended and restated information, as detailed above, in this Annual Report on Form 10-K allows investors to review all pertinent data in a single report. In addition, our quarterly reports on Form 10-Q to be filed during 2017 will include the 2016 comparable prior quarter and year-to-date periods. We have not filed and do not intend to file amendments to (i) our previously filed Quarterly Reports on Form 10-Q or (ii) previously filed Annual Reports on Form 10-K. Accordingly, investors should rely only on the financial information and other disclosures regarding previous periods in this Annual Report on Form 10-K or in future filings with the SEC (as applicable), and not on any previously issued or filed reports, earnings releases or similar communications related to the quarterly periods ended September 30, 2016, June 30, 2016 and March 31, 2016 and related to the quarters within and the years ended December 31, 2015, 2014, 2013 and 2012.
The combined impact of the adjustments and specified line items regarding the restatement is set forth in Note 1, Organization, Nature of Operations and Basis of Presentation – Restatement of Prior Financial Statements, in the Notes to Consolidated Financial Statements of this Annual Report on Form 10-K. The following items of this Annual Report on Form 10-K are impacted as a result of the restatement.
| Part I. Item 1. |
Business
|
| Part I, Item 1A. |
Risk Factors
|
| Part II, Item 6. |
Selected Financial Data
|
| Part II, Item 7. |
Management’s Discussion and Analysis of Financial Condition and Results of Operations
|
| Part II, Item 8. |
Financial Statements and Supplementary Data
|
| Part II, Item 9A. |
Controls and Procedures
|
|
Page
|
||
|
PART I
|
||
|
Item 1.
|
4
|
|
|
Item 1A.
|
13
|
|
|
Item 1B.
|
19
|
|
|
Item 2.
|
19
|
|
|
Item 3.
|
19
|
|
|
Item 4.
|
19
|
|
|
PART II
|
||
|
Item 5.
|
20
|
|
|
Item 6.
|
22
|
|
|
Item 7.
|
23
|
|
|
Item 7A.
|
34
|
|
|
Item 8.
|
35
|
|
|
42
|
||
|
Item 9.
|
82
|
|
|
Item 9A.
|
82
|
|
|
Item 9B.
|
83
|
|
|
PART III
|
||
|
Item 10.
|
83
|
|
|
Item 11.
|
86
|
|
|
Item 12.
|
97
|
|
|
Item 13.
|
100
|
|
|
Item 14.
|
100
|
|
|
PART IV
|
||
|
Item 15.
|
101
|
|
|
106
|
||
FORWARD-LOOKING STATEMENTS
We make statements in this report that are considered to be forward-looking statements within the meaning given such term under Section 21E of the Securities Exchange Act of 1934, as amended (the “Exchange Act”). These statements contain forward-looking information relating to the financial condition, results of operations, plans, objectives, future performance and business of our Company. These statements (often using words such as “believes”, “expects”, “intends”, “plans”, “appear”, “should” and similar words) involve risks and uncertainties that could cause actual results to differ materially from those we project. Included among such statements are those relating to opening new clinics, availability of personnel and the reimbursement environment. The forward-looking statements are based on our current views and assumptions and actual results could differ materially from those anticipated in such forward-looking statements as a result of certain risks, uncertainties, and factors, which include, but are not limited to:
| · |
the risk that the restatement of prior financial statements due to the correction in the accounting method for redeemable non-controlling interests could adversely affect the Company’s ability to make timely filings with the Securities and Exchange Commission;
|
| · |
cost, risks and uncertainties associated with the Company’s recent restatement of its prior financial statements due to the correction of its accounting methodology for redeemable non-controlling partnership interests, and including any pending and future claims or proceedings relating to such matters;
|
| · |
changes as the result of government enacted national healthcare reform;
|
| · |
changes in Medicare rules and guidelines and reimbursement or failure of our clinics to maintain their Medicare certification status;
|
| · |
revenue we receive from Medicare and Medicaid being subject to potential retroactive reduction;
|
| · |
business and regulatory conditions including federal and state regulations;
|
| · |
governmental and other third party payor inspections, reviews, investigations and audits;
|
| · |
compliance with federal and state laws and regulations relating to the privacy of individually identifiable patient information, and associated fines and penalties for failure to comply;
|
| · |
legal actions; which could subject us to increased operating costs and uninsured liabilities;
|
| · |
changes in reimbursement rates or payment methods from third party payors including government agencies and deductibles and co-pays owed by patients;
|
| · |
revenue and earnings expectations;
|
| · |
general economic conditions;
|
| · |
availability and cost of qualified physical therapists;
|
| · |
personnel productivity and retaining key personnel;
|
| · |
competitive, economic or reimbursement conditions in our markets which may require us to reorganize or close certain clinics and thereby incur losses and/or closure costs including the possible write-down or write-off of goodwill and other intangible assets;
|
| · |
acquisitions, purchase of non-controlling interests (minority interests) and the successful integration of the operations of the acquired businesses;
|
| · |
maintaining adequate internal controls;
|
| · |
maintaining necessary insurance coverage;
|
| · |
our ability to design and maintain effective internal control over financial reporting and remediate the material weakness in internal control over financial reporting related to our accounting for redeemable non-controlling partnership interests;
|
| · |
availability, terms, and use of capital; and
|
| · |
weather and other seasonal factors.
|
Many factors are beyond our control. Given these uncertainties, you should not place undue reliance on our forward-looking statements. Please see the other sections of this report and our other periodic reports filed with the Securities and Exchange Commission (the “SEC”) for more information on these factors. Our forward-looking statements represent our estimates and assumptions only as of the date of this report. Except as required by law, we are under no obligation to update any forward-looking statement, regardless of the reason the statement may no longer be accurate.
PART I
GENERAL
Our company, U.S. Physical Therapy, Inc. (the “Company”), through its subsidiaries, operates outpatient physical therapy clinics that provide pre-and post-operative care and treatment for orthopedic-related disorders, sports-related injuries, preventative care, rehabilitation of injured workers and neurological-related injuries. We primarily operate through subsidiary clinic partnerships in which we generally own a 1% general partnership interest and a 49% through 99% limited partnership interest and the managing therapist(s) of the clinics owns the remaining limited partnership interest in the majority of the clinics (hereinafter referred to as “Clinic Partnerships”). To a lesser extent, we operate some clinics through wholly-owned subsidiaries under profit sharing arrangements with therapists (hereinafter referred to as “Wholly-Owned Facilities”). Unless the context otherwise requires, references in this Annual Report on Form 10-K to “we”, “our” or “us” includes the Company and all of its subsidiaries.
Our strategy is to develop outpatient physical therapy clinics and to acquire single and multi-clinic outpatient physical therapy practices on a national basis. At December 31, 2016, we operated 540 clinics in 42 states. The average age of the 540 clinics in operation at December 31, 2016 was 9.3 years. There were 423 clinics operated under Clinic Partnerships and the remaining clinics were operated as Wholly-Owned Facilities or through management arrangements. Of the 540 clinics, we developed 327 and acquired an interest in 213. Our highest concentration of clinics are in the following states: Texas, Tennessee, Michigan, Virginia, Washington, Maryland, Georgia, Oregon, Pennsylvania and Wisconsin. In addition to our 540 clinics, at December 31, 2016, we also managed 20 physical therapy practices for unrelated physician groups and hospitals.
During the last three years, we completed the following multi-clinic acquisitions:
| Acquisition |
Date
|
% Interest Acquired
|
Number of Clinics
|
|||||||
|
|
2016 | |||||||||
|
February 2016 Acquisition
|
February 29
|
55
|
%
|
8
|
||||||
|
November 2016 Acquisition
|
November 30
|
60
|
%
|
12
|
||||||
|
|
2015 | |||||||||
|
January 2015 Acquisition
|
January 31
|
60
|
%
|
9
|
||||||
|
April 2015 Acquisition
|
April 30
|
70
|
%
|
3
|
||||||
|
June 2015 Acquisition
|
June 30
|
70
|
%
|
4
|
||||||
|
December 2015 Acquisition
|
December 31
|
59
|
%
|
4
|
||||||
|
2014
|
||||||||||
|
April 2014 Acquisition
|
April 30
|
70
|
%
|
13
|
||||||
|
August 2014 Acquisition
|
August 1
|
100
|
%
|
3
|
||||||
In addition to the multi-clinic acquisitions, we acquired two single clinic practices in separate transactions during 2016. During 2015, we acquired a 60% interest in a single clinic practice and, during 2014, we acquired four individual clinics in separate transactions.
The Company continues to seek to attract for employment physical therapists who have established relationships with physicians and other referral sources by offering these therapists a competitive salary and incentives based on the profitability of the clinic that they manage. The Company also looks for therapists with whom to establish new, de novo clinics to be owned jointly by the Company and such therapists; in these situations, the therapist is offered the opportunity to co-invest in the new clinic and also receives a competitive salary for managing the clinic. For multi-site clinic practices in which a controlling interest is acquired by the Company, the prior owners typically continue on as employees to manage the clinic operations, retaining a non-controlling ownership interest in the clinics and receiving a competitive salary for managing the clinic operations. In addition, we have developed satellite clinic facilities as part of existing Clinic Partnerships and Wholly-Owned facilities, with the result that a substantial number of Clinic Partnerships and Wholly-Owned facilities operate more than one clinic location. In 2017, we intend to continue to acquire clinic practices and continue to focus on developing new clinics and on opening satellite clinics where appropriate along with increasing our patient volume through marketing and new programs.
Therapists at our clinics initially perform a comprehensive evaluation of each patient, which is then followed by a treatment plan specific to the injury as prescribed by the patient’s physician. The treatment plan may include a number of procedures, including therapeutic exercise, manual therapy techniques, ultrasound, electrical stimulation, hot packs, iontophoresis, education on management of daily life skills and home exercise programs. A clinic’s business primarily comes from referrals by local physicians. The principal sources of payment for the clinics’ services are managed care programs, commercial health insurance, Medicare/Medicaid and workers’ compensation insurance.
We were re-incorporated in April 1992 under the laws of the State of Nevada and have operating subsidiaries organized in various states in the form of limited partnerships, limited liability companies and wholly-owned corporations. This description of our business should be read in conjunction with our financial statements and the related notes contained in Item 8 in this Annual Report on Form 10-K. Our principal executive offices are located at 1300 West Sam Houston Parkway South, Suite 300, Houston, Texas 77042. Our telephone number is (713) 297-7000. Our website is www.usph.com.
OUR CLINICS
Most of our clinics are operated by Clinic Partnerships in which we own the general partnership interest and a majority of the limited partnership interests. The managing healthcare practitioner of the clinics usually owns a portion of the limited partnership interests. Generally, the therapist partners have no interest in the net losses of Clinic Partnerships, except to the extent of their capital accounts. Since we also develop satellite clinic facilities of existing clinics, most Clinic Partnerships consist of more than one clinic location. As of December 31, 2016, through wholly-owned subsidiaries, we owned a 1% general partnership interest in all the Clinic Partnerships. Our limited partnership interests range from 49% to 99% in the Clinic Partnerships, but with respect to the majority of our Clinic Partnerships, we own a limited partnership interest of 64%. For the vast majority of the Clinic Partnerships, the managing healthcare practitioner is a physical therapist who owns the remaining limited partnership interest in the Clinic Partnership.
For our Clinic Partnership agreements related to those that we acquired a majority interest, generally, the prior management continues to own a 10% to 50% interest. For our Clinic Partnership agreements related to our developed clinics, the therapist partner typically begins with a 20% interest in their Clinic Partnership earnings which increases by 3% at the end of each year thereafter up to a maximum interest of 35%.
Typically, each therapist partner or director, including those employed by Clinic Partnerships in which we acquired a majority interest, enters into an employment agreement for a term of up to five years with their Clinic Partnership. Each agreement typically provides for a covenant not to compete during the period of his or her employment and for up to two years thereafter. Under each employment agreement, the therapist partner receives a base salary and may receive a bonus based on the net revenues or profits generated by their Clinic Partnership or specific clinic. In the case of Clinic Partnerships, the therapist partner receives earnings distributions based upon their ownership interest. Upon termination of employment, we typically have the right, but not the obligation, to purchase the therapist’s partnership interest in de novo Clinic Partnerships. In connection with most of our acquired clinics, in the event that a limited minority partner’s employment ceases and certain requirements are met as detailed in the respective limited partnership agreements, we have agreed to repurchase that individual’s non-controlling interest at a predetermined multiple of earnings performance as detailed in the respective agreements.
Each Clinic Partnership maintains an independent local identity, while at the same time enjoying the benefits of national purchasing, negotiated third-party payor contracts, centralized support services and management practices. Under a management agreement, one of our subsidiaries provides a variety of support services to each clinic, including supervision of site selection, construction, clinic design and equipment selection, establishment of accounting systems and billing procedures and training of office support personnel, processing of accounts payable, operational direction, auditing of regulatory compliance, payroll, benefits administration, accounting services, legal services, quality assurance and marketing support.
Our typical clinic occupies approximately 1,600 to 3,000 square feet of leased space in an office building or shopping center. We attempt to lease ground level space for patient ease of access to our clinics. We also attempt to make the decor in our clinics less institutional and more aesthetically pleasing than traditional hospital clinics.
Typical minimum staff at a clinic consists of a licensed physical therapist and an office manager. As patient visits grow, staffing may also include additional physical therapists, occupational therapists, therapy assistants, aides, exercise physiologists, athletic trainers and office personnel. Therapy services are performed under the supervision of a licensed therapist.
We provide services at our clinics on an outpatient basis. Patients are usually treated for approximately one hour per day, two to three times a week, typically for two to six weeks. We generally charge for treatment on a per procedure basis. Medicare patients are charged based on prescribed time increments and Medicare billing standards. In addition, our clinics will develop, when appropriate, individual maintenance and self-management exercise programs to be continued after treatment. We continually assess the potential for developing new services and expanding the methods of providing our existing services in the most efficient manner while providing high quality patient care.
FACTORS INFLUENCING DEMAND FOR THERAPY SERVICES
We believe that the following factors, among others, influence the growth of outpatient physical therapy services:
Economic Benefits of Therapy Services. Purchasers and providers of healthcare services, such as insurance companies, health maintenance organizations, businesses and industries, continuously seek cost savings for traditional healthcare services. We believe that our therapy services provide a cost-effective way to prevent short-term disabilities from becoming chronic conditions and to speed recovery from surgery and musculoskeletal injuries.
Earlier Hospital Discharge. Changes in health insurance reimbursement, both public and private, have encouraged the earlier discharge of patients to reduce costs. We believe that early hospital discharge practices foster greater demand for outpatient physical therapy services.
Aging Population. In general, the elderly population has a greater incidence of disability compared to the population as a whole. As this segment of the population continues to grow, we believe that demand for rehabilitation services will expand.
MARKETING
We focus our marketing efforts primarily on physicians, including orthopedic surgeons, neurosurgeons, physiatrists, internal medicine physicians, podiatrists, occupational medicine physicians and general practitioners. In marketing to the physician community, we emphasize our commitment to quality patient care and regular communication with physicians regarding patient progress. We employ personnel to assist clinic directors in developing and implementing marketing plans for the physician community and to assist in establishing relationships with health maintenance organizations, preferred provider organizations, industry, case managers and insurance companies.
SOURCES OF REVENUE
Payor sources for clinic services are primarily managed care programs, commercial health insurance, Medicare/Medicaid and workers’ compensation insurance. Commercial health insurance, Medicare and managed care programs generally provide coverage to patients utilizing our clinics after payment by the patients of normal deductibles and co-insurance payments. Workers’ compensation laws generally require employers to provide, directly or indirectly through insurance, costs of medical rehabilitation for their employees from work-related injuries and disabilities and, in some jurisdictions, mandatory vocational rehabilitation, usually without any deductibles, co-payments or cost sharing. Treatments for patients who are parties to personal injury cases are generally paid from the proceeds of settlements with insurance companies or from favorable judgments. If an unfavorable judgment is received, collection efforts are generally not pursued against the patient and the patient’s account is written-off against established reserves. Bad debt reserves relating to all receivable types are regularly reviewed and adjusted as appropriate. The following table shows our payor mix for the years ended:
|
December 31, 2016
|
December 31, 2015
|
December 31, 2014
|
||||||||||||||||||||||
|
Payor
|
Net Patient
Revenue |
Percentage
|
Net Patient
Revenue |
Percentage
|
Net Patient
Revenue |
Percentage
|
||||||||||||||||||
|
(Net Patient Revenues in Thousands)
|
||||||||||||||||||||||||
|
Managed Care Program
|
$
|
84,784
|
24.3
|
%
|
$
|
73,555
|
22.7
|
%
|
$
|
67,139
|
22.5
|
%
|
||||||||||||
|
Commercial Health Insurance
|
94,861
|
27.2
|
%
|
91,845
|
28.3
|
%
|
87,890
|
29.4
|
%
|
|||||||||||||||
|
Medicare/Medicaid
|
89,743
|
25.7
|
%
|
79,321
|
24.5
|
%
|
69,857
|
23.4
|
%
|
|||||||||||||||
|
Workers' Compensation Insurance
|
56,478
|
16.2
|
%
|
60,087
|
18.5
|
%
|
57,643
|
19.3
|
%
|
|||||||||||||||
|
Other
|
22,973
|
6.6
|
%
|
19,485
|
6.0
|
%
|
16,480
|
5.4
|
%
|
|||||||||||||||
|
Total
|
$
|
348,839
|
100.0
|
%
|
$
|
324,293
|
100.0
|
%
|
$
|
299,009
|
100.0
|
%
|
||||||||||||
Our business depends to a significant extent on our relationships with commercial health insurers, health maintenance organizations, preferred provider organizations and workers’ compensation insurers. In some geographical areas, our clinics must be approved as providers by key health maintenance organizations and preferred provider plans to obtain payments. Failure to obtain or maintain these approvals would adversely affect financial results.
During the year ended December 31, 2016, approximately 27.6% of our visits and 23.4% of our net patient revenues were from patients with Medicare program coverage. To receive Medicare reimbursement, a facility (Medicare Certified Rehabilitation Agency) or the individual therapist (Physical/Occupational Therapist in Private Practice) must meet applicable participation conditions set by the Department of Health and Human Services (“HHS”) relating to the type of facility, equipment, recordkeeping, personnel and standards of medical care, and also must comply with all state and local laws. HHS, through Centers for Medicare & Medicaid Services (“CMS”) and designated agencies, periodically inspects or surveys clinics/providers for approval and/or compliance. We anticipate that our newly developed and acquired clinics will become certified as Medicare providers or will be enrolled as a group of physical/occupation therapists in a private practice. Failure to obtain or maintain this certification would adversely affect financial results.
The Medicare program reimburses outpatient rehabilitation providers based on the Medicare Physician Fee Schedule (‘‘MPFS’’). For services provided in 2017 through 2019, a 0.5% increase will be applied each year to the fee schedule payment rates, subject to an adjustment beginning in 2019 under the Merit-Based Incentive Payment System (“MIPS”). For services provided in 2020 through 2025, a 0.0% percent update will be applied each year to the fee schedule payment rates, subject to adjustments under MIPS and any alternative payment models (“APMs”). Beginning in 2019, payments under the fee schedule are subject to adjustment based on performance in MIPS, which measures performance based on certain quality metrics, resource use, and meaningful use of electronic health records. Under the MIPS requirements a provider's performance is assessed according to established performance standards and used to determine an adjustment factor that is then applied to the professional's payment for a year. Each year from 2019 through 2024 professionals who receive a significant share of their revenues through an APM (such as accountable care organizations or bundled payment arrangements) that involves risk of financial losses and a quality measurement component will receive a 5% bonus. The bonus payment for APM participation is intended to encourage participation and testing of new APMs and to promote the alignment of incentives across payors. The specifics of the MIPS and APM adjustments beginning in 2019 and 2020, respectively, will be subject to future notice and comment rule-making.
The Budget Control Act of 2011 increased the federal debt ceiling in connection with deficit reductions over the next ten years, and requires automatic reductions in federal spending by approximately $1.2 trillion. Payments to Medicare providers are subject to these automatic spending reductions, subject to a 2% cap. On April 1, 2013, a 2% reduction to Medicare payments was implemented. The Bipartisan Budget Act of 2015, enacted on November 2, 2015, extends the 2% reductions to Medicare payments through fiscal year 2025.
As a result of the Balanced Budget Act of 1997, the formula for determining the total amount paid by Medicare in any one year for outpatient physical therapy, occupational therapy, and/or speech-language pathology services provided to any Medicare beneficiary (i.e., the ‘‘Therapy Cap’’ or ‘‘Limit’’) was established. Based on the statutory definitions which constrained how the Therapy Cap would be applied, there is one Limit for Physical Therapy and Speech Language Pathology Services combined, and one Limit for Occupational Therapy. For 2016, the annual Limit on outpatient therapy services was $1,960 for Physical and Speech Language Pathology Services combined and $1,960 for Occupational Therapy Services. Effective January 1, 2017, the annual Limit on outpatient therapy services is $1,980 for combined Physical Therapy and Speech Language Pathology services and $1,980 for Occupational Therapy services. Historically, these Therapy Caps applied to outpatient therapy services provided in all settings, except for services provided in departments of hospitals. However, the Protecting Access to Medicare Act of 2014, and prior legislation, extended the Therapy Caps to services furnished in hospital outpatient department settings. The application of these annual limits to hospital outpatient department settings will sunset on December 31, 2017 unless Congress extends it.
In the Deficit Reduction Act of 2005, Congress implemented an exceptions process to the annual Limit for therapy expenses for therapy services above the annual Limit. Therapy services above the annual Limit that are medically necessary satisfy an exception to the annual Limit and such claims are payable by the Medicare program. The MACRA extended the exceptions process for outpatient therapy caps through December 31, 2017. Unless Congress extends the exceptions process further, the therapy caps will apply to all outpatient therapy services beginning January 1, 2018, except those services furnished and billed by outpatient hospital departments. For any claim above the annual Limit, the claim must contain a modifier indicating that the services are medically necessary and justified by appropriate documentation in the medical record.
Furthermore, under the Middle Class Tax Relief and Job Creation Act of 2012 (‘‘MCTRA’’), since October 1, 2012, patients who met or exceeded $3,700 in therapy expenditures during a calendar year have been subject to a manual medical review to determine whether applicable payment criteria are satisfied. The $3,700 threshold is applied to Physical Therapy and Speech Language Pathology Services; a separate $3,700 threshold is applied to the Occupational Therapy. The Medicare Access and CHIP Reauthorization Act of 2015 (‘‘MACRA’’) extends the manual medical review process through December 31, 2017.
CMS adopted a multiple procedure payment reduction (‘‘MPPR’’) for therapy services in the final update to the MPFS for calendar year 2011. The MPPR applied to all outpatient therapy services paid under Medicare Part B — occupational therapy, physical therapy and speech-language pathology. Under the policy, the Medicare program pays 100% of the practice expense component of the Relative Value Unit (‘‘RVU’’) for the therapy procedure with the highest practice expense RVU, then reduces the payment for the practice expense component for the second and subsequent therapy procedures or units of service furnished during the same day for the same patient, regardless of whether those therapy services are furnished in separate sessions. Since 2013, the practice expense component for the second and subsequent therapy service furnished during the same day for the same patient was reduced by 50%. In addition, the MCTRA directed CMS to implement a claims-based data collection program to gather additional data on patient function during the course of therapy in order to better understand patient conditions and outcomes. All practice settings that provide outpatient therapy services are required to include this data on the claim form. Since 2013, therapists have been required to report new codes and modifiers on the claim form that reflect a patient’s functional limitations and goals at initial evaluation, periodically throughout care, and at discharge. Reporting of these functional limitation codes and modifiers are required on the claim for payment.,
Statutes, regulations, and payment rules governing the delivery of therapy services to Medicare beneficiaries are complex and subject to interpretation. We believe that we are in compliance in all material respects with all applicable laws and regulations and is not aware of any pending or threatened investigations involving allegations of potential wrongdoing that would have a material effect on the our financial statements as of December 31, 2016. Compliance with such laws and regulations can be subject to future government review and interpretation, as well as significant regulatory action including fines, penalties, and exclusion from the Medicare program. For 2016, net revenue from Medicare accounts for approximately $81.8 million.
REGULATION AND HEALTHCARE REFORM
Numerous federal, state and local regulations regulate healthcare services and those who provide them. Some states into which we may expand have laws requiring facilities employing health professionals and providing health-related services to be licensed and, in some cases, to obtain a certificate of need (that is, demonstrating to a state regulatory authority the need for, and financial feasibility of, new facilities or the commencement of new healthcare services). Only one of the states in which we currently operate requires a certificate of need for the operation of our physical therapy business functions. Our therapists and/or clinics, however, are required to be licensed, as determined by the state in which they provide services. Failure to obtain or maintain any required certificates, approvals or licenses could have a material adverse effect on our business, financial condition and results of operations.
Regulations Controlling Fraud and Abuse. Various federal and state laws regulate financial relationships involving providers of healthcare services. These laws include Section 1128B(b) of the Social Security Act (42 U.S. C. § 1320a-7b[b]) (the “Fraud and Abuse Law”), under which civil and criminal penalties can be imposed upon persons who, among other things, offer, solicit, pay or receive remuneration in return for (i) the referral of patients for the rendering of any item or service for which payment may be made, in whole or in part, by a Federal health care program (including Medicare and Medicaid); or (ii) purchasing, leasing, ordering, or arranging for or recommending purchasing, leasing, ordering any good, facility, service, or item for which payment may be made, in whole or in part, by a Federal health care program (including Medicare and Medicaid). We believe that our business procedures and business arrangements are in compliance with these provisions. However, the provisions are broadly written and the full extent of their specific application to specific facts and arrangements to which we are a party is uncertain and difficult to predict. In addition, several states have enacted state laws similar to the Fraud and Abuse Law, which may be more restrictive than the federal Fraud and Abuse Law.
The Office of the Inspector General (“OIG”) of HHS has issued regulations describing compensation financial arrangements that fall within a “Safe Harbor” and, therefore, are not viewed as illegal remuneration under the Fraud and Abuse Law. Failure to fall within a Safe Harbor does not mean that the Fraud and Abuse Law has been violated; however, the OIG has indicated that failure to fall within a Safe Harbor may subject an arrangement to increased scrutiny under a “facts and circumstances” test.
The OIG also has issued special fraud alerts and special advisory bulletins to remind the provider community of the importance and application of certain aspects of the Fraud and Abuse Law. One of the OIG special fraud alerts related to the rental of space in physician offices by persons or entities to which the physicians refer patients. The OIG’s stated concern in these arrangements is that rental payments may be disguised kickbacks to the physician-landlords to induce referrals. We rent clinic space for a few of our clinics from referring physicians and have taken the steps that we believe are necessary to ensure that all leases comply to the extent possible and applicable with the space rental Safe Harbor to the Fraud and Abuse Law.
One of the OIG’s special advisory bulletins addressed certain complex contractual arrangements for the provision of items and services. This special advisory bulletin identified several characteristics commonly exhibited by suspect arrangements, the existence of one or more of which could indicate a prohibited arrangement to the OIG. Generally, the indicia of a suspect contractual joint venture as identified by the special advisory bulletin and an associated OIG advisory opinion include the following:
| • |
New Line of Business. A provider in one line of business (“Owner”) expands into a new line of business that can be provided to the Owner’s existing patients, with another party who currently provides the same or similar item or service as the new business (“Manager/Supplier”).
|
| • |
Captive Referral Base. The arrangement predominantly or exclusively serves the Owner’s existing patient base (or patients under the control or influence of the Owner).
|
| • |
Little or No Bona Fide Business Risk. The Owner’s primary contribution to the venture is referrals; it makes little or no financial or other investment in the business, delegating the entire operation to the Manager/Supplier, while retaining profits generated from its captive referral base.
|
| • |
Status of the Manager/Supplier. The Manager/Supplier is a would-be competitor of the Owner’s new line of business and would normally compete for the captive referrals. It has the capacity to provide virtually identical services in its own right and bill insurers and patients for them in its own name.
|
| • |
Scope of Services Provided by the Manager/Supplier. The Manager/Supplier provides all, or many, of the new business’ key services.
|
| • |
Remuneration. The practical effect of the arrangement, viewed in its entirety, is to provide the Owner the opportunity to bill insurers and patients for business otherwise provided by the Manager/Supplier. The remuneration from the venture to the Owner (i.e., the profits of the venture) takes into account the value and volume of business the Owner generates.
|
| • |
Exclusivity. The arrangement bars the Owner from providing items or services to any patients other than those coming from Owner and/or bars the Manager/Supplier from providing services in its own right to the Owner’s patients.
|
Due to the nature of our business operations, many of our management service arrangements exhibit one or more of these characteristics. However, the we believe we have taken steps regarding the structure of such arrangements as necessary to sufficiently distinguish them from these suspect ventures, and to comply with the requirements of the Fraud and Abuse Law. However, if the OIG believes we have entered into a prohibited contractual joint venture, it could have an adverse effect on our business, financial condition and results of operations.
Although the business of managing physician-owned physical therapy facilities is regulated by the Fraud and Abuse Law, the manner in which we contract with such facilities often falls outside the complete scope of available Safe Harbors. We believe our arrangements comply with the Fraud and Abuse Law, even though federal courts provide limited guidance as to the application of the Fraud and Abuse Law to these arrangements. If our management contracts are held to violate the Fraud and Abuse Law, it could have an adverse effect on our business, financial condition and results of operations.
Stark Law. Provisions of the Omnibus Budget Reconciliation Act of 1993 (42 U.S.C. § 1395nn) (the “Stark Law”) prohibit referrals by a physician of “designated health services” which are payable, in whole or in part, by Medicare or Medicaid, to an entity in which the physician or the physician’s immediate family member has an investment interest or other financial relationship, subject to several exceptions. Unlike the Fraud and Abuse Law, the Stark Law is a strict liability statute. Proof of intent to violate the Stark Law is not required. Physical therapy services are among the “designated health services”. Further, the Stark Law has application to our management contracts with individual physicians and physician groups, as well as, any other financial relationship between us and referring physicians, including medical advisor arrangements and any financial transaction resulting from a clinic acquisition. The Stark Law also prohibits billing for services rendered pursuant to a prohibited referral. Several states have enacted laws similar to the Stark Law. These state laws may cover all (not just Medicare and Medicaid) patients. As with the Fraud and Abuse Law, we consider the Stark Law in planning our clinics, establishing contractual and other arrangements with physicians, marketing and other activities, and believe that our operations are in substantial compliance with the Stark Law. If we violate the Stark Law or any similar state laws, our financial results and operations could be adversely affected. Penalties for violations include denial of payment for the services, significant civil monetary penalties, and exclusion from the Medicare and Medicaid programs.
HIPAA. In an effort to further combat healthcare fraud and protect patient confidentially, Congress included several anti-fraud measures in the Health Insurance Portability and Accountability Act of 1996 (“HIPAA”). HIPAA created a source of funding for fraud control to coordinate federal, state and local healthcare law enforcement programs, conduct investigations, provide guidance to the healthcare industry concerning fraudulent healthcare practices, and establish a national data bank to receive and report final adverse actions. HIPAA also criminalized certain forms of health fraud against all public and private payors. Additionally, HIPAA mandates the adoption of standards regarding the exchange of healthcare information in an effort to ensure the privacy and electronic security of patient information and standards relating to the privacy of health information. Sanctions for failing to comply with HIPAA include criminal penalties and civil sanctions. In February of 2009, the American Recovery and Reinvestment Act of 2009 (“ARRA”) was signed into law. Title XIII of ARRA, the Health Information Technology for Economic and Clinical Health Act (“HITECH”), provided for substantial Medicare and Medicaid incentives for providers to adopt electronic health records (“EHRs”) and grants for the development of health information exchange (“HIE”). Recognizing that HIE and EHR systems will not be implemented unless the public can be assured that the privacy and security of patient information in such systems is protected, HITECH also significantly expanded the scope of the privacy and security requirements under HIPAA. Most notable are the mandatory breach notification requirements and a heightened enforcement scheme that includes increased penalties, and which now apply to business associates as well as to covered entities. In addition to HIPAA, a number of states have adopted laws and/or regulations applicable in the use and disclosure of individually identifiable health information that can be more stringent than comparable provisions under HIPAA.
We believe that our operations comply with applicable standards for privacy and security of protected healthcare information. We cannot predict what negative effect, if any, HIPAA/HITECH or any applicable state law or regulation will have on our business.
Other Regulatory Factors. Political, economic and regulatory influences are fundamentally changing the healthcare industry in the United States. Congress, state legislatures and the private sector continue to review and assess alternative healthcare delivery and payment systems. Potential alternative approaches could include mandated basic healthcare benefits, controls on healthcare spending through limitations on the growth of private health insurance premiums and Medicare and Medicaid spending, the creation of large insurance purchasing groups, and price controls. Legislative debate is expected to continue in the future and market forces are expected to demand only modest increases or reduced costs. For instance, managed care entities are demanding lower reimbursement rates from healthcare providers and, in some cases, are requiring or encouraging providers to accept capitated payments that may not allow providers to cover their full costs or realize traditional levels of profitability. We cannot reasonably predict what impact the adoption of federal or state healthcare reform measures or future private sector reform may have on our business.
COMPETITION
The healthcare industry, including the physical therapy business, is highly competitive. The physical therapy business is highly fragmented with no company having a significant market share nationally. We believe that we are currently the fourth largest national outpatient rehabilitation provider.
Competitive factors affecting our business include quality of care, cost, treatment outcomes, convenience of location, and relationships with, and ability to meet the needs of, referral and payor sources. Our clinics compete, directly or indirectly, with many types of healthcare providers including the physical therapy departments of hospitals, private therapy clinics, physician-owned therapy clinics, and chiropractors. We may face more intense competition if consolidation of the therapy industry continues.
We believe that our strategy of providing key therapists in a community with an opportunity to participate in ownership or clinic profitability provides us with a competitive advantage by helping to ensure the commitment of local management to the success of the clinic.
We also believe that our competitive position is enhanced by our strategy of locating our clinics, when possible, on the ground floor of buildings and shopping centers with nearby parking, thereby making the clinics more easily accessible to patients. We offer convenient hours. We also attempt to make the decor in our clinics less institutional and more aesthetically pleasing than traditional hospital clinics.
ENFORCEMENT ENVIRONMENT
In recent years, federal and state governments have launched several initiatives aimed at uncovering behavior that violates the federal civil and criminal laws regarding false claims and fraudulent billing and coding practices. Such laws require providers to adhere to complex reimbursement requirements regarding proper billing and coding in order to be compensated for their services by government payors. Our compliance program requires adherence to applicable law and promotes reimbursement education and training; however, a determination that our clinics’ billing and coding practices are false or fraudulent could have a material adverse effect on us.
As a result of our participation in the Medicare and Medicaid programs, we are subject to various governmental inspections, reviews, audits and investigations to verify our compliance with these programs and applicable laws and regulations. In addition, our Corporate Integrity Agreement requires annual audits to be performed by an independent review organization on a small sample of our clinics, the results of which are reported to the federal government. See “-Compliance Program – Corporate Integrity Agreement”. Managed care payors may also reserve the right to conduct audits. An adverse inspection, review, audit or investigation could result in: refunding amounts we have been paid; fines penalties and/or revocation of billing privileges for the affected clinics; expansion of the scope of our Corporate Integrity Agreement; exclusion from participation in the Medicare or Medicaid programs or one or more managed care payor network; or damage to our reputation.
We and our clinics are subject to federal and state laws prohibiting entities and individuals from knowingly and willfully making claims to Medicare, Medicaid and other governmental programs and third party payors that contain false or fraudulent information. The federal False Claims Act encourages private individuals to file suits on behalf of the government against healthcare providers such as us. As such suits are generally filed under seal with a court to allow the government adequate time to investigate and determine whether it will intervene in the action, the implicated healthcare providers often are unaware of the suit until the government has made its determination and the seal is lifted. Violations or alleged violations of such laws, and any related lawsuits, could result in (i) exclusion from participation in Medicare, Medicaid and other federal healthcare programs, or (ii) significant financial or criminal sanctions, resulting in the possibility of substantial financial penalties for small billing errors that are replicated in a large number of claims, as each individual claim could be deemed a separate violation. In addition, many states also have enacted similar statutes, which may include criminal penalties, substantial fines, and treble damages.
COMPLIANCE PROGRAM
Our Compliance Program. Our ongoing success depends upon our reputation for quality service and ethical business practices. We operate in a highly regulated environment with many federal, state and local laws and regulations. We take a proactive interest in understanding and complying with the laws and regulations that apply to our business.
Our Board of Directors (the “Board”) has adopted a Code of Business Conduct and Ethics and a set of Corporate Governance Guidelines to clarify the ethical standards under which the Board and management carry out their duties. In addition, the Board has created a Compliance Committee of the Board (“Compliance Committee”) whose purpose is to assist the Board in discharging their oversight responsibilities with respect to compliance with federal and state laws and regulations relating to healthcare.
We have issued an Ethics and Compliance Manual and created compliance training materials, hand-outs and an on-line testing program. These tools were prepared to ensure that every employee of our Company and subsidiaries has a clear understanding of our mutual commitment to high standards of professionalism, honesty, fairness and compliance with the law in conducting business. These standards are administered by our Chief Compliance Officer (“CO”), who has the responsibility for the day-to-day oversight, administration and development of our compliance program. The CO, internal and external counsel, management and the Compliance Committee review our policies and procedures for our compliance program from time to time in an effort to improve operations and to ensure compliance with requirements of standards, laws and regulations and to reflect the on-going compliance focus areas which have been identified by management, counsel or the Compliance Committee. We also have established systems for reporting potential violations, educating our employees, monitoring and auditing compliance and handling enforcement and discipline.
Committees. Our Compliance Committee, appointed by the Board, consists of five independent directors. The Compliance Committee has general oversight of our Company’s compliance with the legal and regulatory requirements regarding healthcare operations. The Compliance Committee relies on the expertise and knowledge of management, the CO and other compliance and legal personnel. The CO regularly communicates with the Chairman of the Compliance Committee. The Compliance Committee meets at least four times a year or more frequently as necessary to carry out its responsibilities and reports regularly to the Board regarding its actions and recommendations.
We also have an Internal Compliance Committee, which is comprised of Company leaders in the areas of operations, clinical services, finance, human resources, legal, information technology and credentialing. The Internal Compliance Committee has the responsibility for evaluating and assessing Company areas of risk relating to compliance with federal and state healthcare laws, and generally to assist the CO. The Internal Compliance Committee meets at least four times a year or more frequently as necessary to carry out its responsibilities. In addition, management has appointed a team to address our Company’s compliance with HIPAA. The HIPAA team consists of a security officer and employees from our legal, information systems, finance, operations, compliance, business services and human resources departments. The team prepares assessments and makes recommendations regarding operational changes and/or new systems, if needed, to comply with HIPAA.
Each clinic certified as a Medicare Rehabilitation Agency has a formally appointed governing body composed of a member of our management and the director/administrator of the clinic. The governing body retains legal responsibility for the overall conduct of the clinic. The members confer regularly and discuss, among other issues, clinic compliance with applicable laws and regulations. In addition, there are Professional Advisory Committees which serve as Infection Control Committees. These committees meet in the facilities and function as advisors.
We have in place a Risk Management Committee consisting of, among others, the CO, our General Counsel. other legal and compliance department personnel and the Corporate Vice President of Administration. This committee reviews and monitors all employee and patient incident reports and provides clinic personnel with actions to be taken in response to the reports.
Reporting Violations. In order to facilitate our employees’ ability to report in confidence, anonymously and without retaliation any perceived improper work-related activities, accounting irregularities and other violations of our compliance program, we have set up an independent national compliance hotline. The compliance hotline is available to receive confidential reports of wrongdoing Monday through Friday (excluding holidays), 24 hours a day. The compliance hotline is staffed by experienced third party professionals trained to utilize utmost care and discretion in handling sensitive issues and confidential information. The information received is documented and forwarded timely to the CO, who, together with the Compliance Committee, has the power and resources to investigate and resolve matters of improper conduct.
Educating Our Employees. We utilize numerous methods to train our employees in compliance related issues. The directors/administrators of each clinic are responsible for conducting the initial training sessions on compliance with existing employees. Training is based on our Ethics and Compliance Manual, inclusive of HIPAA information, and our compliance training materials. The directors/administrators also provide periodic “refresher” training for existing employees and one-on-one comprehensive training with new hires. The corporate compliance group responds to questions from clinic personnel and conducts frequent teleconference meetings, webinars and training sessions on a variety of compliance related topics.
When a clinic opens, the Company provides a package of compliance materials containing manuals and detailed instructions for meeting Medicare Conditions of Participation Standards and other compliance requirements. During follow up training with the director/administrator of the clinic, compliance department staff explain various details regarding requirements and compliance standards. Compliance staff will remain in contact with the director/administrator while the clinic is implementing compliance standards and will provide any assistance required. All new office managers receive training (including Medicare, regulatory and corporate compliance, insurance billing, charge entry and transaction posting and coding, daily, weekly and monthly accounting reports) from the training staff at the corporate office. The corporate compliance group will assist in continued compliance, including guidance to the clinic staff with regard to Medicare certifications, state survey requirements and responses to any inquiries from regulatory agencies.
Monitoring and Auditing Clinic Operational Compliance. We have in place audit programs and other procedures to monitor and audit clinic operational compliance with applicable policies and procedures. We employ internal auditors who, as part of their job responsibilities, conduct periodic audits of each clinic. Most clinics are audited at least once every 24 months and additional focused audits are performed as deemed necessary. During these audits, particular attention is given to compliance with Medicare and internal policies, Federal and state laws and regulations, third party payor requirements, and patient chart documentation, billing, reporting, record keeping, collections and contract procedures. The audits typically are conducted on site and include interviews with the employees involved in management, operations, billing and accounts receivable.
Formal audit reports are prepared and reviewed with corporate management and the Compliance Committee. Each clinic director/administrator receives a letter instructing them of any corrective measures required. Each clinic director/administrator then works with the compliance team and operations to ensure such corrective measures are achieved.
Handling Enforcement and Discipline. It is our policy that any employee who fails to comply with compliance program requirements or who negligently or deliberately fails to comply with known laws or regulations specifically addressed in our compliance program should be subject to disciplinary action up to and including discharge from employment. The Compliance Committee, compliance staff, human resources staff and management investigate violations of our compliance program and impose disciplinary action as considered appropriate.
Corporate Integrity Agreement. The Company also performs certain additional compliance related functions pursuant to the Corporate Integrity Agreement (“Corporate Integrity Agreement” or “CIA”) that the Company entered into with the OIG. The CIA, which became effective as of December 21, 2015, outlines certain specific requirements relating to compliance oversight and program implementation, as well as periodic reporting. In addition, pursuant to the CIA, an independent review organization annually will perform a Medicare billing and coding audit on a small group of randomly selected Company clinics. The Company’s Compliance Program has been modified so as to comply with the requirements of the CIA. The term of the CIA is five years.
The CIA was entered into as part of the settlement by one of the Company’s Subsidiaries with the U. S. Department of Justice related to certain Medicare billings that occurred between 2007 and 2009 at a single outpatient physical therapy clinic. The settlement resolved claims relating to whether certain physical therapy services provided to a limited number of Medicare patients at the clinic satisfied all of the criteria for payment by the Medicare program, including proper supervision of physical therapist assistants. The Subsidiary paid $718,000 in 2015 to resolve the matter, and the Subsidiary and the Company entered into the CIA. The Subsidiary no longer conducts any business.
EMPLOYEES
At December 31, 2016, we employed approximately 3,800 people, of which 2,600 were full-time employees. At that date, no Company employees were governed by collective bargaining agreements or were members of a union. We consider our relations with our employees to be good.
In the states in which our current clinics are located, persons performing designated physical therapy services are required to be licensed by the state. Based on standard employee screening systems in place, all persons currently employed by us who are required to be licensed are licensed. We are not aware of any federal licensing requirements applicable to our employees.
AVAILABLE INFORMATION
This Annual Report on Form 10-K includes the restatement of certain of our previously issued consolidated financial statements and selected financial data. It also amends previously filed management’s discussion and analysis of financial condition and results of operations and other disclosures for the periods presented in this Annual Report on Form 10-K. As indicated in Note 1, Organization, Nature of Operations and Basis of Presentation – Restatement of Prior Financial Statements, in the Notes to Consolidated Financial Statements and as additionally disclosed in our current report on Form 8-K filed March 16, 2017, prior to issuing the 2016 annual financial statements, we determined we had previously incorrectly accounted for the non-controlling interests which were mandatorily redeemable. See Footnote 2 – Significant Accounting Policies – Mandatorily Redeemable Non-Controlling Interests – for a description of the accounting for mandatorily redeemable non-controlling interests. We determined this correction was material to previously issued annual and quarterly consolidated financial statements. The Company, in this Annual Report on Form 10-K for the year ended December 31, 2016, restated the following:
| · |
Consolidated Financial Statements
|
| · |
for the balance sheet as of December 31, 2015; and
|
| · |
the statements of net income, cash flows and equity for the periods ended December 31, 2015 and 2014, which will include a cumulative adjustment to the beginning balances as of January 1, 2014.
|
| · |
Selected Financial Data for the years ended December 31, 2015, 2014, 2013 and 2012.
|
| · |
Unaudited quarterly financial information for the quarters ended September 30, 2016, June 30, 2016, March 31, 2016, December 31, 2015, September 30, 2015, June 30, 2015 and March 31, 2015.
|
|
·
|
Management’s discussion and analysis of financial condition and results of operations as of and for the years ended December 31, 2015 and 2014.
|
Our business, operations and financial condition are subject to various risks. Some of these risks are described below, and readers of this Annual Report on Form 10-K should take such risks into account in evaluating our Company or making any decision to invest in us. This section does not describe all risks applicable to our Company, our industry or our business, and it is intended only as a summary of material factors affecting our business.
Risks related to our business and operations
We have identified a material weakness in our internal control over financial reporting which resulted in a material misstatement in our previously issued consolidated financial statements and a failure to meet our reporting obligations.
We have identified a material weakness in our internal control over financial reporting relating to the accounting for mandatorily redeemable non-controlling interest. As a result of such weakness, we concluded that our disclosure controls and procedures and internal controls over financial reporting were not effective and had to restate certain prior consolidated financial statements. This contributed to a delay in the filing of this Annual Report. For further information regarding this matter, refer to Item 9A – Controls and Procedures.
Unless remediated, this material weakness could result in additional material misstatements to our interim or annual consolidated financial statements and disclosures that may not be prevented or detected on a timely basis. In addition, we may experience delays or be unable to meet our reporting obligations or to comply with SEC rules and regulations, which could result in investigations and sanctions by regulatory authorities. Management’s ongoing assessment of disclosure controls and procedures as well as internal control over financial reporting may in the future identify additional weaknesses and conditions that need to be addressed. Any failure to improve our disclosure controls and procedures or internal controls over financial reporting to address identified weaknesses in the future, if they were to occur, could prevent us from maintaining accurate accounting records and discovering material accounting errors. Our Company could suffer damage to its business and reputation arising from the correction in accounting method for redeemable non-controlling partnership interests, including claims or proceedings relating to such matters. Any of these results could adversely affect our business and the value of our common stock.
Failure to maintain effective internal control over our financial reporting could have an adverse effect on our ability to report our financial results on a timely and accurate basis.
We are required to produce our consolidated financial statements in accordance with the requirements of accounting principles generally accepted in the United States of America. Effective internal control over financial reporting is necessary for us to provide reliable financial reports, to help mitigate the risk of fraud and to operate successfully. We are required by federal securities laws to document and test our internal control procedures in order to satisfy the requirements of the Sarbanes-Oxley Act of 2002, which requires annual management assessments of the effectiveness of our internal control over financial reporting.
Testing and maintaining our internal control over financial reporting can be expensive and divert our management’s attention from other matters that are important to our business. We may not be able to conclude on an ongoing basis that we have effective internal control over financial reporting in accordance with applicable law, or our independent registered public accounting firm may not be able to issue an unqualified attestation report if we conclude that our internal control over financial reporting is not effective. If we fail to maintain effective internal control over financial reporting, or our independent registered public accounting firm is unable to provide us with an unqualified attestation report on our internal control, we could be required to take costly and time-consuming corrective measures, be required to restate the affected historical financial statements, be subjected to investigations and/or sanctions by federal and state securities regulators, and be subjected to civil lawsuits by security holders. Any of the foregoing could also cause investors to lose confidence in our reported financial information and in our company and would likely result in a decline in the market price of our stock and in our ability to raise additional financing if needed in the future.
Healthcare reform legislation may affect our business.
In recent years, many legislative proposals have been introduced or proposed in Congress and in some state legislatures that would affect major changes in the healthcare system, either nationally or at the state level. At the federal level, Congress has continued to propose or consider healthcare budgets that substantially reduce payments under the Medicare programs. See “Business- Sources of Revenue” in Item 1 for more information. The ultimate content, timing or effect of any healthcare reform legislation and the impact of potential legislation on us is uncertain and difficult, if not impossible, to predict. That impact may be material to our business, financial condition or results of operations.
Our operations are subject to extensive regulation.
The healthcare industry is subject to extensive federal, state and local laws and regulations relating to:
| • |
facility and professional licensure/permits, including certificates of need;
|
| • |
conduct of operations, including financial relationships among healthcare providers, Medicare fraud and abuse, and physician self-referral;
|
| • |
addition of facilities and services; and
|
| • |
billing and payment for services.
|
In recent years, there have been heightened coordinated civil and criminal enforcement efforts by both federal and state government agencies relating to the healthcare industry. We believe we are in substantial compliance with all laws, but differing interpretations or enforcement of these laws and regulations could subject our current practices to allegations of impropriety or illegality or could require us to make changes in our methods of operations, facilities, equipment, personnel, services and capital expenditure programs and increase our operating expenses. If we fail to comply with these extensive laws and government regulations, we could become ineligible to receive government program reimbursement, suffer civil or criminal penalties or be required to make significant changes to our operations. In addition, we could be forced to expend considerable resources responding to an investigation or other enforcement action under these laws or regulations. For a more complete description of certain of these laws and regulations, see “Business—Regulation and Healthcare Reform” and “Business – Compliance” in Item 1.
The healthcare industry is subject to extensive federal, state and local laws and regulations relating to (1) facility and professional licensure, including certificates of need, (2) conduct of operations, including financial relationships among healthcare providers, Medicare fraud and abuse and physician self-referral, (3) addition of facilities and services and enrollment of newly developed facilities in the Medicare program, (4) payment for services and (5) safeguarding protected health information.
Both federal and state regulatory agencies inspect, survey and audit our facilities to review our compliance with these laws and regulations. While our facilities intend to comply with the existing licensing, Medicare certification requirements and accreditation standards, there can be no assurance that these regulatory authorities will determine that all applicable requirements are fully met at any given time. A determination by any of these regulatory authorities that a facility is not in compliance with these requirements could lead to the imposition of requirements that the facility takes corrective action, assessment of fines and penalties, or loss of licensure or Medicare certification of accreditation. These consequences could have an adverse effect on our Company.
The Company’s CIA imposes certain compliance related functions and reporting obligations on the Company. In addition, the CIA requires the Company to engage an independent review organization to conduct annual audits of randomly selected Company clinics in order to review compliance with federal requirements relating to the proper billing and coding for claims. While our facilities intend to comply with the federal requirements for properly coding and billing claims for reimbursement, there can be no assurance that these audits will determine that all applicable requirements are fully met at the clinics that are reviewed. In addition, a failure to fully comply with the requirements of the CIA may subject the Company to the assessment of fines and penalties, or exclusion from participation in the Medicare program. These consequences could have an adverse effect on our Company.
Decreases in Medicare reimbursement rates, implementation of annual caps, and payment reductions applied to the second and subsequent therapy services may adversely affect our financial results.
The Medicare program reimburses outpatient rehabilitation providers based on the Medicare Physician Fee Schedule (‘‘MPFS’’). For services provided in 2017 through 2019, a 0.5% increase will be applied each year to the fee schedule payment rates, subject to an adjustment beginning in 2019 under the Merit-Based Incentive Payment System (“MIPS”). For services provided in 2020 through 2025, a 0.0% percent update will be applied each year to the fee schedule payment rates, subject to adjustments under MIPS and any alternative payment models (“APMs”). Beginning in 2019, payments under the fee schedule are subject to adjustment based on performance in MIPS, which measures performance based on certain quality metrics, resource use, and meaningful use of electronic health records. Under the MIPS requirements a provider's performance is assessed according to established performance standards and used to determine an adjustment factor that is then applied to the professional's payment for a year. Each year from 2019 through 2024 professionals who receive a significant share of their revenues through an APM (such as accountable care organizations or bundled payment arrangements) that involves risk of financial losses and a quality measurement component will receive a 5% bonus. The bonus payment for APM participation is intended to encourage participation and testing of new APMs and to promote the alignment of incentives across payors. The specifics of the MIPS and APM adjustments beginning in 2019 and 2020, respectively, will be subject to future notice and comment rule-making.
The Budget Control Act of 2011 increased the federal debt ceiling in connection with deficit reductions over the next ten years, and requires automatic reductions in federal spending by approximately $1.2 trillion. Payments to Medicare providers are subject to these automatic spending reductions, subject to a 2% cap. On April 1, 2013, a 2% reduction to Medicare payments was implemented. The Bipartisan Budget Act of 2015, enacted on November 2, 2015, extends the 2% reductions to Medicare payments through fiscal year 2025.
As a result of the Balanced Budget Act of 1997, the formula for determining the total amount paid by Medicare in any one year for outpatient physical therapy, occupational therapy, and/or speech-language pathology services provided to any Medicare beneficiary (i.e., the ‘‘Therapy Cap’’ or ‘‘Limit’’) was established. Based on the statutory definitions which constrained how the Therapy Cap would be applied, there is one Limit for Physical Therapy and Speech Language Pathology Services combined, and one Limit for Occupational Therapy. For 2016, the annual Limit on outpatient therapy services was $1,960 for Physical and Speech Language Pathology Services combined and $1,960 for Occupational Therapy Services. Effective January 1, 2017, the annual Limit on outpatient therapy services is $1,980 for combined Physical Therapy and Speech Language Pathology services and $1,980 for Occupational Therapy services. Historically, these Therapy Caps applied to outpatient therapy services provided in all settings, except for services provided in departments of hospitals. However, the Protecting Access to Medicare Act of 2014, and prior legislation, extended the Therapy Caps to services furnished in hospital outpatient department settings. The application of these annual limits to hospital outpatient department settings will sunset on December 31, 2017 unless Congress extends it.
In the Deficit Reduction Act of 2005, Congress implemented an exceptions process to the annual Limit for therapy expenses for therapy services above the annual Limit. Therapy services above the annual Limit that are medically necessary satisfy an exception to the annual Limit and such claims are payable by the Medicare program. The MACRA extended the exceptions process for outpatient therapy caps through December 31, 2017. Unless Congress extends the exceptions process further, the therapy caps will apply to all outpatient therapy services beginning January 1, 2018, except those services furnished and billed by outpatient hospital departments. For any claim above the annual Limit, the claim must contain a modifier indicating that the services are medically necessary and justified by appropriate documentation in the medical record.
Furthermore, under the Middle Class Tax Relief and Job Creation Act of 2012 (‘‘MCTRA’’), since October 1, 2012, patients who met or exceeded $3,700 in therapy expenditures during a calendar year have been subject to a manual medical review to determine whether applicable payment criteria are satisfied. The $3,700 threshold is applied to Physical Therapy and Speech Language Pathology Services; a separate $3,700 threshold is applied to the Occupational Therapy. The Medicare Access and CHIP Reauthorization Act of 2015 (‘‘MACRA’’) extends the manual medical review process through December 31, 2017.
CMS adopted a multiple procedure payment reduction (‘‘MPPR’’) for therapy services in the final update to the MPFS for calendar year 2011. The MPPR applied to all outpatient therapy services paid under Medicare Part B — occupational therapy, physical therapy and speech-language pathology. Under the policy, the Medicare program pays 100% of the practice expense component of the Relative Value Unit (‘‘RVU’’) for the therapy procedure with the highest practice expense RVU, then reduces the payment for the practice expense component for the second and subsequent therapy procedures or units of service furnished during the same day for the same patient, regardless of whether those therapy services are furnished in separate sessions. Since 2013, the practice expense component for the second and subsequent therapy service furnished during the same day for the same patient was reduced by 50%. In addition, the MCTRA directed CMS to implement a claims-based data collection program to gather additional data on patient function during the course of therapy in order to better understand patient conditions and outcomes. All practice settings that provide outpatient therapy services are required to include this data on the claim form. Since 2013, therapists have been required to report new codes and modifiers on the claim form that reflect a patient’s functional limitations and goals at initial evaluation, periodically throughout care, and at discharge. Reporting of these functional limitation codes and modifiers are required on the claim for payment.
Statutes, regulations, and payment rules governing the delivery of therapy services to Medicare beneficiaries are complex and subject to interpretation. We believe that we are in compliance in all material respects with all applicable laws and regulations and is not aware of any pending or threatened investigations involving allegations of potential wrongdoing that would have a material effect on our financial statements as of December 31, 2016. Compliance with such laws and regulations can be subject to future government review and interpretation, as well as significant regulatory action including fines, penalties, and exclusion from the Medicare program. For 2016, net revenue from Medicare accounts for approximately $81.8 million.
Given the history of frequent revisions to the Medicare program and its reimbursement rates and rules, we may not continue to receive reimbursement rates from Medicare that sufficiently compensate us for our services or, in some instances, cover our operating costs. Limits on reimbursement rates or the scope of services being reimbursed could have a material adverse effect on our revenue, financial condition and results of operations. Additionally, any delay or default by the federal or state governments in making Medicare and/or Medicaid reimbursement payments could materially and, adversely, affect our business, financial condition and results of operations.
Revenue we receive from Medicare and Medicaid is subject to potential retroactive reduction.
Payments we receive from Medicare and Medicaid can be retroactively adjusted after examination during the claims settlement process or as a result of post-payment audits. Payors may disallow our requests for reimbursement, or recoup amounts previously reimbursed, based on determinations by the payors or their third-party audit contractors that certain costs are not reimbursable because either adequate or additional documentation was not provided or because certain services were not covered or deemed to not be medically necessary. Significant adjustments, recoupments or repayments of our Medicare or Medicaid revenue, and the costs associated with complying with investigative audits by regulatory and governmental authorities, could adversely affect our financial condition and results of operations.
Additionally, from time to time we become aware, either based on information provided by third parties and/or the results of internal audits, of payments from payor sources that were either wholly or partially in excess of the amount that we should have been paid for the service provided. Overpayments may result from a variety of factors, including insufficient documentation supporting the services rendered or medical necessity of the services or other failures to document the satisfaction of the necessary conditions of payment. We are required by law in most instances to refund the full amount of the overpayment after becoming aware of it, and failure to do so within requisite time limits imposed by the law could lead to significant fines and penalties being imposed on us. Furthermore, our initial billing of and payments for services that are unsupported by the requisite documentation and satisfaction of any other conditions of payment, regardless of our awareness of the failure at the time of the billing or payment, could expose us to significant fines and penalties. We, and/or certain of our operating companies, could also be subject to exclusion from participation in the Medicare or Medicaid programs in some circumstances as well, in addition to any monetary or other fines, penalties or sanctions that we may incur under applicable federal and/or state law. Our repayment of any such amounts, as well as any fines, penalties or other sanctions that we may incur, could be significant and could have a material and adverse effect on our results of operations and financial condition.
From time to time we are also involved in various external governmental investigations, audits and reviews. Reviews, audits and investigations of this sort can lead to government actions, which can result in the assessment of damages, civil or criminal fines or penalties, or other sanctions, including restrictions or changes in the way we conduct business, loss of licensure or exclusion from participation in government programs. Failure to comply with applicable laws, regulations and rules could have a material and adverse effect on our results of operations and financial condition. Furthermore, becoming subject to these governmental investigations, audits and reviews can also require us to incur significant legal and document production expenses as we cooperate with the government authorities, regardless of whether the particular investigation, audit or review leads to the identification of underlying issues.
As a result of increased post-payment reviews of claims we submit to Medicare for our services, we may incur additional costs and may be required to repay amounts already paid to us.
We are subject to regular post-payment inquiries, investigations and audits of the claims we submit to Medicare for payment for our services. These post-payment reviews have increased as a result of government cost-containment initiatives. These additional post-payment reviews may require us to incur additional costs to respond to requests for records and to pursue the reversal of payment denials, and ultimately may require us to refund amounts paid to us by Medicare that are determined to have been overpaid.
For a further description of this and other laws and regulations involving governmental reimbursements, see “Business—Sources of Revenue” and “—Regulation and Healthcare Reform” in Item 1.
An economic downturn, state budget pressures, sustained unemployment and continued deficit spending by the federal government may result in a reduction in reimbursement and covered services.
An economic downturn could have a detrimental effect on our revenues. Historically, state budget pressures have translated into reductions in state spending. Given that Medicaid outlays are a significant component of state budgets, we can expect continuing cost containment pressures on Medicaid outlays for our services in the states in which we operate. In addition, an economic downturn, coupled with sustained unemployment, may also impact the number of enrollees in managed care programs as well as the profitability of managed care companies, which could result in reduced reimbursement rates.
The existing federal deficit, as well as deficit spending by federal and state governments as the result of adverse developments in the economy or other reasons, can lead to continuing pressure to reduce governmental expenditures for other purposes, including government-funded programs in which we participate, such as Medicare and Medicaid. Such actions in turn may adversely affect our results of operations.
We depend upon reimbursement by third-party payors.
Substantially all of our revenues are derived from private and governmental third-party payors. In 2016, approximately 74.3% of our revenues were derived collectively from managed care plans, commercial health insurers, workers’ compensation payors, and other private pay revenue sources while approximately 25.7% of our revenues were derived from Medicare and Medicaid. Initiatives undertaken by industry and government to contain healthcare costs affect the profitability of our clinics. These payors attempt to control healthcare costs by contracting with healthcare providers to obtain services on a discounted basis. We believe that this trend will continue and may limit reimbursement for healthcare services. If insurers or managed care companies from whom we receive substantial payments were to reduce the amounts they pay for services, our profit margins may decline, or we may lose patients if we choose not to renew our contracts with these insurers at lower rates. In addition, in certain geographical areas, our clinics must be approved as providers by key health maintenance organizations and preferred provider plans. Failure to obtain or maintain these approvals would adversely affect our financial results.
In recent years, through legislative and regulatory actions, the federal government has made substantial changes to various payment systems under the Medicare program. See “Business—Sources of Revenue” in Item 1 for more information. President Obama signed into law comprehensive reforms to the healthcare system, including changes to Medicare reimbursement. Additional reforms or other changes to these payment systems may be proposed or adopted, either by the U.S. Congress or by CMS, including bundled payments, outcomes-based payment methodologies and a shift away from traditional fee-for-service reimbursement. If revised regulations are adopted, the availability, methods and rates of Medicare reimbursements for services of the type furnished at our facilities could change. Some of these changes and proposed changes could adversely affect our business strategy, operations and financial results.
We face inspections, reviews, audits and investigations under federal and state government programs and contracts. These audits could have adverse findings that may negatively affect our business.
As a result of our participation in the Medicare and Medicaid programs, we are subject to various governmental inspections, reviews, audits and investigations to verify our compliance with these programs and applicable laws and regulations. Managed care payors may also reserve the right to conduct audits. An adverse inspection, review, audit or investigation could result in:
| • |
refunding amounts we have been paid pursuant to the Medicare or Medicaid programs or from managed care payors;
|
| • |
state or federal agencies imposing fines, penalties and other sanctions on us;
|
| • |
temporary suspension of payment for new patients to the facility or agency;
|
| • |
decertification or exclusion from participation in the Medicare or Medicaid programs or one or more managed care payor networks;
|
| • |
expansion of the scope of our Corporate Integrity Agreement;
|
| • |
damage to our reputation;
|
| • |
the revocation of a facility’s or agency’s license; and
|
| • |
loss of certain rights under, or termination of, our contracts with managed care payors.
|
If adverse inspections, reviews, audits or investigations occur and any of the results noted above occur, it could have a material adverse effect on our business and operating results.
Our facilities are subject to extensive federal and state laws and regulations relating to the privacy of individually identifiable information.
HIPAA required the HHS to adopt standards to protect the privacy and security of individually identifiable health-related information. The department released final regulations containing privacy standards in 2000 and published revisions to the final regulations in 2002. The privacy regulations extensively regulate the use and disclosure of individually identifiable health-related information. The regulations also provide patients with significant rights related to understanding and controlling how their health information is used or disclosed. The security regulations require healthcare providers to implement administrative, physical and technical practices to protect the security of individually identifiable health information that is maintained or transmitted electronically. HITECH, which was signed into law in 2009, enhanced the privacy, security and enforcement provisions of HIPAA by, among other things establishing security breach notification requirements, allowing enforcement of HIPAA by state attorneys general, and increasing penalties for HIPAA violations. Violations of HIPAA or HITECH could result in civil or criminal penalties.
In addition to HIPAA, there are numerous federal and state laws and regulations addressing patient and consumer privacy concerns, including unauthorized access or theft of personal information. State statutes and regulations vary from state to state. Lawsuits, including class actions and action by state attorneys general, directed at companies that have experienced a privacy or security breach also can occur.
The Company and its clinics have established policies and procedures in an effort to ensure compliance with these privacy related requirements. However, if there is a breach, we may be subject to various penalties and damages and may be required to incur costs to mitigate the impact of the breach on affected individuals.
We may be adversely affected by a cyber-attack that could compromise our information technologies, which may cause a violation of HIPAA or HITECH.
In the normal course of business, our information technology systems hold sensitive patient information including patient demographic data, eligibility for various medical plans including Medicare and Medicaid and protected health information, which is subject to HIPAA and HITECH. We maintain our information technology systems with safeguards protecting against cyber-attacks, including passive intrusion protection, firewalls and virus detection software. However, these safeguards do not ensure that a significant cyber-attack could not occur. A cyber-attack that bypasses our information technology security systems could cause the loss of protected health information, or other data subject to privacy laws, the loss of proprietary business information, or a material disruption to our information technology business systems resulting in a material adverse effect on our business, financial condition, and results of operations or cash flows. In addition, our future results could be adversely affected due to the theft, destruction, loss, misappropriation or release of protected health information, other confidential data or proprietary business information, operational or business delays resulting from the disruption of information technology systems and subsequent clean-up and mitigation activities, negative publicity resulting in reputation or brand damage with clients, members, or industry peers, or regulatory action taken as a result of such incident.
We depend upon the cultivation and maintenance of relationships with the physicians in our markets.
Our success is dependent upon referrals from physicians in the communities our clinics serve and our ability to maintain good relations with these physicians and other referral sources. Physicians referring patients to our clinics are free to refer their patients to other therapy providers or to their own physician owned therapy practice. If we are unable to successfully cultivate and maintain strong relationships with physicians and other referral sources, our business may decrease and our net operating revenues may decline.
We depend upon our ability to recruit and retain experienced physical therapists.
Our revenue generation is dependent upon referrals from physicians in the communities our clinics serve, and our ability to maintain good relations with these physicians. Our therapists are the front line for generating these referrals and we are dependent on their talents and skills to successfully cultivate and maintain strong relationships with these physicians. If we cannot recruit and retain our base of experienced and clinically skilled therapists, our business may decrease and our net operating revenues may decline. Periodically, we have clinics in isolated communities that are temporarily unable to operate due to the unavailability of a therapist who satisfies our standards.
Our revenues may fluctuate due to weather.
We have a significant number of clinics in states that normally experience snow and ice during the winter months. Also, a significant number of our clinics are located in states along the Gulf Coast and Atlantic Coast which are subject to periodic winter storms, hurricanes and other severe storm systems. Periods of severe weather may cause physical damage to our facilities or prevent our staff or patients from traveling to our clinics, which may cause a decrease in our net operating revenues.
We operate in a highly competitive industry.
We encounter competition from local, regional or national entities, some of which have superior resources or other competitive advantages. Intense competition may adversely affect our business, financial condition or results of operations. For a more complete description of this competitive environment, see “Business—Competition” in Item 1. An adverse effect on our business, financial condition or results of operations may require us to write-down goodwill.
We may incur closure costs and losses.
The competitive, economic or reimbursement conditions in our markets in which we operate may require us to reorganize or to close certain clinics. In the event a clinic is reorganized or closed, we may incur losses and closure costs. The closure costs and losses may include, but are not limited to, lease obligations, severance, and write-down or write-off of goodwill and other intangible assets.
Future acquisitions may use significant resources, may be unsuccessful and could expose us to unforeseen liabilities.
As part of our growth strategy, we intend to continue pursuing acquisitions of outpatient physical therapy clinics. Acquisitions may involve significant cash expenditures, potential debt incurrence and operational losses, dilutive issuances of equity securities and expenses that could have an adverse effect on our financial condition and results of operations. Acquisitions involve numerous risks, including:
| • |
the difficulty and expense of integrating acquired personnel into our business;
|
| • |
the diversion of management’s time from existing operations;
|
| • |
the potential loss of key employees of acquired companies;
|
| • |
the difficulty of assignment and/or procurement of managed care contractual arrangements; and
|
| • |
the assumption of the liabilities and exposure to unforeseen liabilities of acquired companies, including liabilities for failure to comply with healthcare regulations.
|
Issuance of shares in connection with financing transactions or under stock incentive plans will dilute current stockholders.
Pursuant to our stock incentive plans, our Compensation Committee of the Board, consisting solely of independent directors, is authorized to grant stock awards to our employees, directors and consultants. Shareholders will incur dilution upon the exercise of any outstanding stock awards or the grant of any restricted stock. In addition, if we raise additional funds by issuing additional common stock, or securities convertible into or exchangeable or exercisable for common stock, further dilution to our existing stockholders will result, and new investors could have rights superior to existing stockholders.
The number of shares of our common stock eligible for future sale could adversely affect the market price of our stock.
At December 31, 2016, we had reserved approximately 566,000 shares for future equity grants. 216,000 shares of common stock pursuant to our equity plans are registered for sale or resale on currently effective registration statements and have been approved by stockholders. The remaining 350,000 shares have been approved by the stockholders and will be register for sale or resale in 2017. We may issue additional restricted securities or register additional shares of common stock under the Securities Act of 1933, as amended (the “Securities Act”), in the future. The issuance of a significant number of shares of common stock upon the exercise of stock options or the availability for sale, or sale, of a substantial number of the shares of common stock eligible for future sale under effective registration statements, under Rule 144 or otherwise, could adversely affect the market price of the common stock.
Provisions in our articles of incorporation and bylaws could delay or prevent a change in control of our company, even if that change would be beneficial to our stockholders.
Certain provisions of our articles of incorporation and bylaws may delay, discourage, prevent or render more difficult an attempt to obtain control of our company, whether through a tender offer, business combination, proxy contest or otherwise. These provisions include the charter authorization of “blank check” preferred stock and a restriction on the ability of stockholders to call a special meeting.
We received comment letters from the SEC Staff regarding our historical accounting for mandatorily redeemable non-controlling interests. We responded to the Staff’s letters and have had several discussions with them. The financial statements included in the Annual Report have been restated to reflect our interpretation and application of the technical accounting requirements associated with mandatorily redeemable non-controlling interests.
We lease the properties used for our clinics under non-cancelable operating leases with terms ranging from one to five years, with the exception of the property for one clinic which we own. We intend to lease the premises for any new clinic locations except in rare instances where leasing is not a cost-effective alternative. Our typical clinic occupies 1,600 to 3,000 square feet.
We also lease our executive offices located in Houston, Texas, under a non-cancelable operating lease expiring in April 2022. We currently occupy approximately 39,452 square feet of space (including allocations for common areas) at our executive offices.
We are involved in litigation and other proceedings arising in the ordinary course of business. On March 31, 2017, an alleged shareholder of the Company filed a putative class action lawsuit in the United States District Court for the Southern District of New York against the Company, chief executive officer Christopher J. Reading, chief financial officer Lawrance C. McAfee and corporate controller, Jon C. Bates, alleging, inter alia, that the defendants misstated or omitted to state material information concerning the Company’s historical accounting for redeemable non-controlling interests of acquired partnerships, in alleged violation of Sections 10(b) and 20(a) of the Exchange Act. The complaint seeks a declaration that the action is a proper class action under Rule 23 of the Federal Rules of Civil Procedure, unspecified compensatory damages in an amount to be determined at trial and interest, costs and expenses. The proceeding is in its initial stages and the defendants have not yet answered, moved against or otherwise responded to the complaint, though they intend to defend themselves vigorously.
While the ultimate outcome of lawsuits or other proceedings cannot be predicted with certainty, we do not believe the impact of existing lawsuits or other proceedings will have a material impact on our business, financial condition or results of operations.
Not Applicable.
PART II
|
MARKET FOR REGISTRANT’S COMMON EQUITY, RELATED STOCKHOLDER MATTERS AND ISSUER PURCHASES OF EQUITY SECURITIES.
|
PRICE QUOTATIONS
Our common stock has traded on the New York Stock Exchange (“NYSE”) since August 14, 2012 under the symbol “USPH.” Prior to that, our common stock was traded on the Nasdaq Global Select Market under the symbol “USPH”. As of June 6, 2017, there were 68 holders of record of our outstanding common stock. The table below indicates the high and low sales prices of our common stock reported for the periods presented.
|
2016
|
2015
|
|||||||||||||||
|
Quarter
|
High
|
Low
|
High
|
Low
|
||||||||||||
|
First
|
$
|
54.35
|
$
|
45.62
|
$
|
50.79
|
$
|
38.17
|
||||||||
|
Second
|
61.31
|
46.39
|
55.22
|
43.13
|
||||||||||||
|
Third
|
64.89
|
57.76
|
56.37
|
42.59
|
||||||||||||
|
Fourth
|
72.65
|
51.96
|
55.75
|
43.18
|
||||||||||||
On March 28, 2017, the Board of Directors declared a dividend of $0.20 per share on all shares of common stock issued and outstanding to those shareholders of record on April 17, 2017 and, on May 25, 2017, the Board of Directors declared a dividend of $0.20 per share on all shares of common stock issued and outstanding to those shareholders of record on June 16, 2017. The dividend declared on March 28, 2017 was paid on May 5, 2017 and the one declared on May 25, 2017 will be paid on July 7, 2017. During 2016, we paid a regular quarterly dividend of $0.17 per share totaling $0.68 per share, which amounted to a total of aggregate cash payments of dividends to holders of our common stock in 2016 of approximately $8.5 million. During 2015, we paid a quarterly dividend of $0.15 per share totaling $0.60 per share for 2015, which amounted to a total of aggregate cash payments of dividends to holders of our common stock in 2015 of approximately $7.4 million. We are currently restricted from paying dividends in excess of $15,000,000 in any fiscal year on our common stock under the Credit Agreement (as defined in ‘‘Item 7. Management’s Discussion and Analysis of Financial Condition and Results of Operations — Liquidity and Capital Resources’’).
FIVE YEAR PERFORMANCE GRAPH
The performance graph and related description shall not be deemed incorporated by reference into any filing under the Securities Act or under the Exchange Act, except to the extent that the Company specifically incorporates this information by reference. In addition, the performance graph and the related description shall not be deemed “soliciting material” or “filed” with the SEC or subject to Regulation 14A or 14C.
Prior to August 14, 2012, our common stock traded on the Nasdaq Global Select Market. On August 14, 2012, our common stock began trading on NYSE. The following performance graph compares the cumulative total stockholder return of our common stock to The NYSE Composite Index and the NYSE Health Care Index for the period from December 31, 2011 through December 31, 2016. The graph assumes that $100 was invested in our common stock and the common stock of each of the companies listed on The NYSE Composite Index and The NYSE Health Care Index on December 31, 2011 and that any dividends were reinvested.
Comparison of Five Years Cumulative Total Return for the Year Ended December 31, 2016
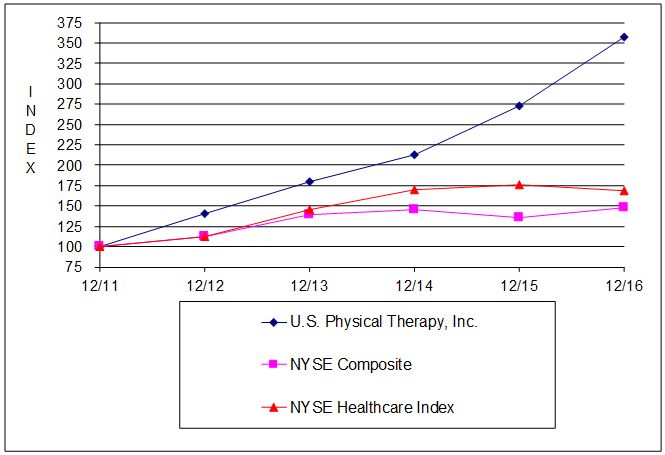
|
12/11
|
12/12
|
12/13
|
12/14
|
12/15
|
12/16
|
|
|
U. S. Physical Therapy, Inc.
|
100
|
140
|
179
|
213
|
273
|
357
|
|
NYSE Composite
|
100
|
113
|
139
|
145
|
136
|
148
|
|
NYSE Healthcare Index
|
100
|
112
|
145
|
170
|
176
|
169
|
Prior to issuing the 2016 annual financial statements, the Company determined it had accounted for redeemable non-controlling interests incorrectly. Accordingly, the Company has restated prior periods included in the selected financial data below to reflect the correction in the appropriate periods. For more information on this matter, see Footnote 1 – Organization, Nature of Operations and Basis of Presentation – Restatement of Prior Financial Statements and Footnote 2 – Significant Accounting Policies – Mandatorily Redeemable Non-controlling interests – in the accompanying financial statements for a details of the restatement and a description of the accounting for redeemable non-controlling interests.
The following restated selected financial data from continuing operations should be read in conjunction with the description of our critical accounting policies set forth in “Management’s Discussion and Analysis of Results of Operations and Financial Condition” and the Consolidated Financial Statements and Notes included herein.
|
For the Years Ended December 31,
|
||||||||||||||||||||
|
2016
|
2015
|
2014
|
2013
|
2012
|
||||||||||||||||
|
(as restated)
|
(as restated)
|
(as restated)
|
(as restated)
|
|||||||||||||||||
|
($ in thousands, except per share data)
|
||||||||||||||||||||
|
Net revenues
|
$
|
356,546
|
$
|
331,302
|
$
|
305,074
|
$
|
264,058
|
$
|
249,651
|
||||||||||
|
Operating income
|
$
|
49,533
|
$
|
47,294
|
$
|
45,768
|
$
|
38,770
|
$
|
38,406
|
||||||||||
|
Interest expense
|
||||||||||||||||||||
|
Mandatorily redeemable non-controlling interests - change in redemption value
|
$
|
6,169
|
$
|
2,670
|
$
|
2,978
|
$
|
1,222
|
$
|
4,171
|
||||||||||
|
Mandatorily redeemable non-controlling interests - earnings allocable
|
$
|
4,057
|
$
|
3,538
|
$
|
3,388
|
$
|
2,642
|
$
|
2,356
|
||||||||||
|
Debt and other
|
$
|
1,252
|
$
|
1,031
|
$
|
1,088
|
$
|
538
|
$
|
557
|
||||||||||
|
Total interest expense
|
$
|
11,478
|
$
|
7,239
|
$
|
7,454
|
$
|
4,402
|
$
|
7,084
|
||||||||||
|
Net income
|
$
|
26,268
|
$
|
26,489
|
$
|
25,314
|
$
|
22,981
|
$
|
21,690
|
||||||||||
|
Net income attributable to non-controlling interests
|
$
|
5,717
|
$
|
5,874
|
$
|
6,183
|
$
|
5,869
|
$
|
6,072
|
||||||||||
|
Net income attributable to USPH shareholders
|
$
|
20,551
|
$
|
20,615
|
$
|
19,131
|
$
|
17,112
|
$
|
15,618
|
||||||||||
|
Per share net income attributable to USPH shareholders:
|
||||||||||||||||||||
|
Basic
|
$
|
1.64
|
$
|
1.66
|
$
|
1.57
|
$
|
1.42
|
$
|
1.32
|
||||||||||
|
Diluted
|
$
|
1.64
|
$
|
1.66
|
$
|
1.57
|
$
|
1.42
|
$
|
1.31
|
||||||||||
|
Dividends declared and paid per common share
|
$
|
0.68
|
$
|
0.60
|
$
|
0.48
|
$
|
0.40
|
$
|
0.76
|
||||||||||
|
On December 31,
|
||||||||||||||||||||
| 2016 | 2015 | 2014 | 2013 |
2012
|
||||||||||||||||
|
(as restated)
|
(as restated)
|
(as restated)
|
(as restated)
|
|||||||||||||||||
|
($ in thousands)
|
||||||||||||||||||||
|
Total assets.
|
$
|
351,231
|
$
|
303,757
|
$
|
268,377
|
$
|
247,436
|
$
|
195,015
|
||||||||||
|
Mandatorily redeemable non-controlling interests
|
$
|
69,190
|
$
|
45,974
|
$
|
40,371
|
$
|
38,004
|
$
|
26,572
|
||||||||||
|
Long-term debt, less current portion
|
$
|
50,596
|
$
|
48,335
|
$
|
34,734
|
$
|
40,650
|
$
|
17,575
|
||||||||||
|
Working capital
|
$
|
41,347
|
$
|
41,193
|
$
|
29,347
|
$
|
26,488
|
$
|
29,015
|
||||||||||
|
Current ratio
|
2.68
|
3.17
|
2.15
|
2.14
|
2.78
|
|||||||||||||||
EXECUTIVE SUMMARY
Our Business. We operate outpatient physical therapy clinics that provide pre- and post-operative care and treatment for a variety of orthopedic-related disorders and sports-related injuries, neurologically-related injuries and rehabilitation of injured workers. At December 31, 2016, we operated 540 clinics in 42 states. The average age of our clinics at December 31, 2016 was 9.3 years.
During 2016, 2015 and 2014, we completed the following multi-clinic acquisitions:
| Acquisition |
Date
|
% Interest
Acquired
|
Number of
Clinics
|
|||||||
|
2016
|
||||||||||
|
February 2016 Acquisition
|
February 29
|
55
|
%
|
8
|
||||||
|
November 2016 Acquisition
|
November 30
|
60
|
%
|
12
|
||||||
|
2015
|
||||||||||
|
January 2015 Acquisition
|
January 31
|
60
|
%
|
9
|
||||||
|
April 2015 Acquisition
|
April 30
|
70
|
%
|
3
|
||||||
|
June 2015 Acquisition
|
June 30
|
70
|
%
|
4
|
||||||
|
December 2015 Acquisition
|
December 31
|
59
|
%
|
4
|
||||||
|
2014
|
||||||||||
|
April 2014 Acquisition
|
April 30
|
70
|
%
|
13
|
||||||
|
August 2014 Acquisition
|
August 1
|
100
|
% |
3
|
||||||
In addition to the multi-clinic acquisitions, we acquired two single clinic practices in separate transactions during 2016. During 2015, we acquired a 60% interest in a single clinic practice and, during 2014, we acquired four individual clinics in separate transactions.
The results of operations of the clinics we acquired have been included in our consolidated financial statements since the date of the respective acquisition.
In addition to our owned clinics, we also manage physical therapy facilities for third parties. As of December 31, 2016, we had 20 physician or hospital owned facilities under management.
Recent Restatement of Our Historical Financial Statements. In connection with the preparation of our 2016 annual financial statements, we determined that our historical accounting for redeemable non-controlling interests of acquired partnerships was incorrect. This error was the result of an incorrect interpretation of technical accounting guidance concerning the classification of instruments as liabilities or equity. Specifically, we recently determined that, under applicable accounting guidance, the redemption feature included in the partnership agreements should be considered a mandatorily redeemable financial instrument. Accordingly, such interests should be accounted for as a liability, and not as temporary equity. This error did not affect any of our partnership agreements for de novo clinics as those agreements do not contain a redemption feature.
As a result of the restatement, we determined that a material weakness existed in our internal control over financial reporting. We have taken steps to remediate the material weakness, which relates to our accounting for, and reporting of, non-controlling interests, by engaging in a further analysis of the applicable technical accounting requirements and developing specific policies and procedures to evaluate our compliance with such requirements when we acquire future partnerships. See Item 9A. – Controls and Procedures – for further discussion.
Although, the accounting error caused us to be in technical violation of our Amended Credit Agreement dated December 5, 2013, we were able to obtain the necessary waivers and amendments, as applicable. As of the date of the filing of this Annual Report, we are in compliance with all our covenants thereunder.
CRITICAL ACCOUNTING POLICIES
Critical accounting policies are those that have a significant impact on our results of operations and financial position involving significant estimates requiring our judgment. Our critical accounting policies are:
Revenue Recognition. Revenues are recognized in the period in which services are rendered. Net patient revenues (patient revenues less estimated contractual adjustments) are reported at the estimated net realizable amounts from insurance companies, third-party payors, patients and others for services rendered. The Company has agreements with third-party payors that provide for payments to the Company at contracted amounts different from its established rates. The allowance for estimated contractual adjustments is based on terms of payor contracts and historical collection and write-off experience.
Contractual Allowances. Contractual allowances result from the differences between the rates charged for services performed and expected reimbursements by both insurance companies and government sponsored healthcare programs for such services. Medicare regulations and the various third party payors and managed care contracts are often complex and may include multiple reimbursement mechanisms payable for the services provided in our clinics. We estimate contractual allowances based on our interpretation of the applicable regulations, payor contracts and historical calculations. Each month the Company estimates its contractual allowance for each clinic based on payor contracts and the historical collection experience of the clinic and applies an appropriate contractual allowance reserve percentage to the gross accounts receivable balances for each payor of the clinic. Based on our historical experience, calculating the contractual allowance reserve percentage at the payor level is sufficient to allow us to provide the necessary detail and accuracy with our collectability estimates. However, the services authorized and provided and related reimbursement are subject to interpretation that could result in payments that differ from our estimates. Payor terms are periodically revised necessitating continual review and assessment of the estimates made by management. Our billing system may not capture the exact change in our contractual allowance reserve estimate from period to period. Therefore, in order to assess the accuracy of our revenues and hence our contractual allowance reserves, our management regularly compares its cash collections to corresponding net revenues measured both in the aggregate and on a clinic-by-clinic basis. In the aggregate, the historical difference between net revenues and corresponding cash collections has generally reflected a difference within approximately 1% of net revenues. Additionally, analysis of subsequent period’s contractual write-offs on a payor basis reflects a difference within approximately 1% between the actual aggregate contractual reserve percentage as compared to the estimated contractual allowance reserve percentage associated with the same period end balance. As a result, we believe that a reasonable likely change in the contractual allowance reserve estimate would not be more than 1% at December 31, 2016. For purposes of demonstrating the sensitivity of this estimate on the Company’s financial condition, a one percent increase or decrease in our aggregate contractual allowance reserve percentage would decrease or increase, respectively, net patient revenue by approximately $901,450 for the year ended December 31, 2016. Management believes the changes in the estimate of the contractual allowance reserve for the periods ended December 31, 2016, 2015 and 2014 have not been material to the statement of operations.
The following table sets forth information regarding our patient accounts receivable as of the dates indicated (in thousands):
|
December 31,
|
||||||||
|
2016
|
2015
|
|||||||
|
Gross patient accounts receivable
|
$
|
90,145
|
$
|
84,584
|
||||
|
Less contractual allowances
|
49,513
|
46,909
|
||||||
|
Subtotal - accounts receivable
|
40,632
|
37,675
|
||||||
|
Less allowance for doubtful accounts
|
1,792
|
1,444
|
||||||
|
Net patient accounts receivable
|
$
|
38,840
|
$
|
36,231
|
||||
The following table presents our patient accounts receivable aging by payor class as of the dates indicated (in thousands):
|
December 31, 2016
|
December 31, 2015
|
|||||||||||||||||||||||
|
Payor
|
Current to
120 Days |
120+ Days
|
Total
|
Current to
120 Days |
120+ Days
|
Total
|
||||||||||||||||||
|
Managed Care/ Commercial Plans
|
$
|
13,906
|
$
|
1,939
|
$
|
15,845
|
$
|
12,936
|
$
|
1,381
|
$
|
14,317
|
||||||||||||
|
Medicare/Medicaid
|
8,252
|
1,201
|
9,453
|
7,380
|
1,107
|
8,487
|
||||||||||||||||||
|
Workers Compensation*
|
7,550
|
1,107
|
8,657
|
7,945
|
1,144
|
9,089
|
||||||||||||||||||
|
Self-pay
|
2,709
|
2,469
|
5,178
|
2,296
|
1,504
|
3,800
|
||||||||||||||||||
|
Other**
|
1,212
|
287
|
1,499
|
1,165
|
817
|
1,982
|
||||||||||||||||||
|
Totals
|
$
|
33,629
|
$
|
7,003
|
$
|
40,632
|
$
|
31,722
|
$
|
5,953
|
$
|
37,675
|
||||||||||||
| * |
Workers compensation is paid by state administrators or their designated agents.
|
| ** |
Other includes primarily litigation claims and, to a lesser extent, vehicular insurance claims.
|
Reimbursement for Medicare beneficiaries is based upon a fee schedule published by HHS. For a more complete description of our third party revenue sources, see “Business—Sources of Revenue” in Item 1.
Provision for Doubtful Accounts. We determine our provision for doubtful accounts based on the specific agings and payor classifications at each clinic. We review the accounts receivable aging and rely on prior experience with particular payors to determine an appropriate reserve for doubtful accounts. Historically, clinics that have a large number of aged accounts generally have less favorable collection experience, and thus, require a higher allowance. Accounts that are ultimately determined to be uncollectible are written off against our bad debt provision. The amount of our aggregate provision for doubtful accounts is regularly reviewed for adequacy in light of current and historical experience.
Accounting for Income Taxes. We account for income taxes under the asset and liability method. Deferred tax assets and liabilities are recognized for the future tax consequences attributable to differences between the financial statement carrying amounts of existing assets and liabilities and their respective tax bases and operating loss and tax credit carryforwards. Deferred tax assets and liabilities are measured using enacted tax rates expected to apply to taxable income in the years in which those temporary differences are expected to be recovered or settled. The effect on deferred tax assets and liabilities of a change in tax rates is recognized in income in the period that includes the enactment date. The Company recognizes the financial statement benefit of a tax position only after determining that the relevant tax authority would more likely than not sustain the position following an audit. For tax positions meeting the more-likely-than-not threshold, the amount to be recognized in the financial statements is the largest benefit that has a greater than 50 percent likelihood of being realized upon ultimate settlement with the relevant tax authority.
We do not believe that we have any significant uncertain tax positions at December 31, 2016, nor is this expected to change within the next twelve months due to the settlement and expiration of statutes of limitation.
We did not have any accrued interest or penalties associated with any unrecognized tax benefits nor was any interest expense recognized during the twelve months ended December 31, 2016 and 2015.
Carrying Value of Long-Lived Assets. Our property and equipment, intangible assets and goodwill (collectively, our “long-lived assets”) comprise a significant portion of our total assets. The accounting standards require that we periodically, and upon the occurrence of certain events, assess the recoverability of our long-lived assets. If the carrying value of our property and equipment exceeds their undiscounted cash flows, we are required to write the carrying value down to estimated fair value.
Goodwill. The fair value of goodwill and other intangible assets with indefinite lives are tested for impairment annually and upon the occurrence of certain events, and are written down to fair value if considered impaired. We evaluate goodwill for impairment on at least an annual basis (in the third quarter) by comparing the fair value of its reporting units to the carrying value of each reporting unit including related goodwill. We operate a one segment business which is made up of various clinics within partnerships. The partnerships are components of regions and are aggregated to that operating segment level for the purpose of determining reporting units when performing the annual goodwill impairment test. In 2016 and 2015, we had six regions.
An impairment loss generally would be recognized when the carrying amount of the net assets of a reporting unit, inclusive of goodwill and other intangible assets, exceeds the estimated fair value of the reporting unit. The estimated fair value of a reporting unit is determined using two factors: (i) earnings prior to taxes, depreciation and amortization for the reporting unit multiplied by a price/earnings ratio used in the industry and (ii) a discounted cash flow analysis. A weight is assigned to each factor and the sum of each weight times the factor is considered the estimated fair value. For 2016, the factors (i.e., price/earnings ratio, discount rate and residual capitalization rate) were updated to reflect current market conditions. The evaluation of goodwill in 2016, 2015 and 2014 did not result in any goodwill amounts that were deemed impaired.
Mandatorily Redeemable Non-Controlling Interests – The non-controlling interests that are reflected as mandatorily redeemable non-controlling interests in the consolidated financial statements are subject to Required Redemption (as defined in Footnote 5 – Mandatorily Redeemable Non-Controlling Interest), whether currently exercisable or not, and which currently, or in the future, require that the Company purchase the non-controlling interest of those owners at a predetermined formula based on a multiple of trailing twelve months earnings performance as defined in the respective limited partnership agreements. The Required Redemption is triggered at such time as both of the following events have occurred: 1) termination of the holder’s employment with NewCo (as defined in Footnote 5 – Mandatorily Redeemable Non-Controlling Interest), regardless of the reason for such termination, and 2) the passage of specified number of years after the closing of the transaction, typically three to five years, as defined in the applicable limited partnership agreement.
On the date the Company acquires a controlling interest in a partnership and the limited partnership agreement contains a Required Redemption, the fair value of the non-controlling interest is recorded in the long-term liabilities section of the consolidated balance sheet under the caption – Mandatorily redeemable non-controlling interests. Then, in each reporting period thereafter until purchased by the Company, the redeemable non-controlling interest is adjusted to its current Redemption Amount (as defined in Footnote 5 – Mandatorily Redeemable Non-Controlling Interest). The Company reflects any adjustment in the Redemption Amount of the mandatorily redeemable non-controlling interest in its consolidated financial statements of net income by recording the change in the redemption value and any earnings to other income and expense in the caption - Interest expense – mandatorily redeemable non-controlling interests – change in redemption value or Interest expense – mandatorily redeemable non-controlling interests – allocable earnings, respectively. See Note 5 – Mandatorily Redeemable Non-Controlling Interest for further details.
SELECTED OPERATING AND FINANCIAL DATA
The following table and discussion relates to continuing operations unless otherwise noted. The defined terms with their respective description used in the following discussion are listed below:
|
2016
|
Year ended December 31, 2016
|
|
2015
|
Year ended December 31, 2015
|
|
2014
|
Year ended December 31, 2014
|
|
New Clinics
|
Clinics opened or acquired during the year ended December 31, 2016
|
|
Mature Clinics
|
Clinics opened or acquired prior to January 1, 2016
|
|
2015 New Clinics
|
Clinics opened or acquired during the year ended December 31, 2015
|
|
2015 Mature Clinics
|
Clinics opened or acquired prior to January 1, 2015
|
|
2014 New Clinics.
|
Clinics opened or acquired during the year ended December 31, 2014
|
|
2014 Mature Clinics
|
Clinics opened or acquired prior to January 1, 2014
|
|
2013 New Clinics
|
Clinics opened or acquired during the year ended December 31, 2013
|
The following table presents selected operating and financial data, used by management as key indicators of our operating performance:
|
For the Years Ended December 31,
|
||||||||||||
|
2016
|
2015
|
2014
|
||||||||||
|
Number of clinics, at the end of period
|
540
|
508
|
489
|
|||||||||
|
Working Days
|
255
|
255
|
255
|
|||||||||
|
Average visits per day per clinic
|
25.0
|
24.1
|
22.9
|
|||||||||
|
Total patient visits
|
3,316,729
|
3,080,166
|
2,818,815
|
|||||||||
|
Net patient revenue per visit
|
$
|
105.18
|
$
|
105.28
|
$
|
106.08
|
||||||
RESULTS OF OPERATIONS
FISCAL YEAR 2016 COMPARED TO FISCAL 2015
| • |
Net revenues rose 7.6 % to $356.5 million for 2016 from $331.3 million for 2015 primarily due to increases in net patient revenues which are discussed in detail below.
|
| • |
Net income attributable to USPH shareholders prior to interest expense – mandatorily redeemable non-controlling interest – change in redemption value (“operating results”) was $24.3 million in 2016, or $1.94 per diluted share, and $22.2 million in 2015, or $1.79 per diluted share. The following table details this computation:
|
|
For the Year Ended
|
||||||||
|
December 31, 2016
|
December 31, 2015
|
|||||||
|
(as restated)
|
||||||||
|
Net income attributable to USPH shareholders
|
$
|
20,551
|
$
|
20,615
|
||||
|
Adjustments:
|
||||||||
|
Interest expense MRNCI * - change in redemption value, net of tax
|
3,748
|
1,622
|
||||||
|
Operating results
|
$
|
24,299
|
$
|
22,237
|
||||
* Mandatorily redeemable non-controlling interest
The above table reconciles net income attributable to USPH shareholders calculated in accordance with GAAP to operating results. Operating results is defined as USPH’s net income attributable to common shareholders prior to interest expense – mandatorily redeemable non-controlling interests – change in redemption value, net of tax. Management uses operating results, which eliminates this non-cash item that can be subject to volatility, as one of the principal measures to evaluate and monitor financial performance period over period. Management believes that operating results is useful information for investors to use in comparing the Company's period-to-period results as well as for comparing with other similar businesses since most do not have mandatorily redeemable instruments and therefore have different liability and equity structures. Operating results is not a measure of financial performance under GAAP and should not be considered in isolation or as an alternative to, or substitute for, net income attributable to USPH shareholders presented in the consolidated financial statements.
Net Patient Revenues
| • |
Net patient revenues increased to $348.8 million for 2016 from $324.3 million for 2015, an increase of $24.5 million, or 7.6%. The increase in net patient revenues of $24.5 million consisted of an increase of $12.8 million from New Clinics and $11.7 million from Mature Clinics of which $15.1 million was related to 2015 New Clinics offset by a decrease of $3.4 million related to 2015 Mature Clinics. During 2016, we acquired two multi-clinic groups for a total of 20 clinics. The net patient revenues from these multi-clinic groups are included in our results of operations since the respective date of their acquisition. See above table under “—Executive Summary” detailing our multi-clinic acquisitions.
|
| • |
Total patient visits increased to 3,316,800 for 2016 from 3,080,200 for 2015. The growth in patient visits was attributable to 102,800 visits in New Clinics primarily due to the acquisitions in 2016 and an increase of 133,800 visits for Mature Clinics primarily due to 2015 New Clinics.
|
| • |
The average net patient revenue per visit slightly decreased to $105.18 in 2016 from $105.28 in 2015.
|
Net patient revenues are based on established billing rates less allowances and discounts for patients covered by contractual programs and workers’ compensation. Net patient revenues reflect contractual and other adjustments, which we evaluate monthly, relating to patient discounts from certain payors. Payments received under these programs are based on predetermined rates and are generally less than the established billing rates of the clinics.
Other Revenues
Other revenues, consisting primarily of management fees, increased by $0.7 million, from $7.0 million in 2015 to $7.7 million in 2016.
Clinic Operating Costs
Clinic operating costs were $274.5 million, or 77.0% of net revenues, for 2016 and $252.9 million, or 76.3% of net revenues, for 2015. The increase was attributable to $10.9 million in operating costs for New Clinics, an increase in operating costs of $11.2 million for 2015 New Clinics, due to a full year of activity (see table detailing acquisition dates above under – “Executive Summary”), and an decrease of $0.5 million for 2014 Mature Clinics. Each component of clinic operating costs is discussed below:
Clinic Operating Costs—Salaries and Related Costs
Salaries and related costs increased to $198.5 million for 2016 from $180.5 million for 2015, an increase of $18.0 million, or 10.0%. Approximately $7.6 million of the increase was attributable to New Clinics, $8.0 million of the increase was due to a higher costs at various 2015 New Clinics due to a full year of activity and higher costs of $2.4 million at 2014 Mature Clinics. Salaries and related costs as a percentage of net revenues was 55.7% for 2016 and 54.5% for 2015.
Clinic Operating Costs—Rent, Clinic Supplies, Contract Labor and Other
Rent, clinic supplies, contract labor and other costs increased to $71.9 million for 2016 from $68.0 million for 2015, an increase of $3.9 million, or 5.6%. For 2016, New Clinics accounted for approximately $3.1 million of the increase and 2015 New Clinics accounted for approximately $3.2 million of the increase due to a full year of activity. Rent, clinic supplies, contract labor and other costs for 2015 Mature Clinics decreased $2.4 million in 2016 as compared to 2015. Rent, clinic supplies, contract labor and other costs as a percent of net revenues was 20.2% for 2016 and 20.5% for 2015.
Clinic Operating Costs—Provision for Doubtful Accounts
The provision for doubtful accounts for net patient receivables was $4.0 million for 2016 and $4.2 million for 2015. As a percentage of net patient revenues, the provision for doubtful accounts was 1.1% for 2016 and 1.3% for 2015.
Our provision for doubtful accounts as a percentage of total patient accounts receivable was 4.4% at December 31, 2016 and 3.8% at December 31, 2015. The provision for doubtful accounts at the end of each period is based on a detailed, clinic-by-clinic review of overdue accounts and is regularly reviewed in the aggregate in light of historical experience.
The average accounts receivable days outstanding were 36 days for December 31, 2016 and for December 31, 2015. Net patient receivables in the amount of $3.6 million and $4.4 million were written-off in 2016 and 2015, respectively.
Closure Costs
For 2016 and 2015, closure costs amounted to $131,000 and $211,000, respectively.
Gross Margin
In 2016, the gross margin (net revenues less total clinic operating costs) increased by 4.7% to $82.0 million from $78.4 million in 2015. The gross margin percentage for 2016 was 23.0% as compared to 23.7% for 2015.
Corporate Office Costs
Corporate office costs, consisting primarily of salaries, benefits and equity based compensation of corporate office personnel and directors, rent, insurance costs, depreciation and amortization, travel, legal, compliance, professional, marketing and recruiting fees, were $32.5 million for 2016 and $31.1 million for 2015. The dollar increase is primarily due to increases in salaries, benefits and equity based compensation. Corporate office costs as a percentage of net revenues were 9.1% for 2016 and 9.4% in 2015.
Interest Expense – mandatorily redeemable non-controlling interest – change in redemption value.
Interest Expense – mandatorily redeemable non-controlling interest – change in redemption value increased to $6.2 million for the year 2016 from $2.7 million in 2015. This increase is due to the increased earnings performance of the underlying businesses. The change in redemption value is based on the redemption amount (which is derived from a formula based on a specified multiple times the underlying business’ trailing twelve months of earnings before interest, taxes, depreciation, amortization and our internal management fee) at the end of the reporting period compared to the end of the previous period.
Interest Expense – mandatorily redeemable non-controlling interest – earnings allocable.
Interest Expense – mandatorily redeemable non-controlling interest – earnings allocable represent the portion of earnings allocable to the holders of the mandatorily redeemable non-controlling interest. This expense increased to $4.1 million in 2016 as compared to $3.5 million in 2015. The increase is the result of new business acquisitions and increased performance of existing businesses.
Interest Expense – debt and other
Interest expense – debt and other was $1.3 million for 2016 and $1.0 million for 2015. At December 31, 2016, $46.0 million was outstanding under our Credit Agreement. See “—Liquidity and Capital Resources” below for a discussion of the terms of our Amended Credit Agreement (as defined below under “—Liquidity and Capital Resources”).
Provision for Income Taxes
The provision for income taxes was $11.9 million for 2016 and $13.7 million for 2015. We accrued state and federal income taxes at an effective tax rate (provision for taxes divided by the difference between income before taxes and net income attributable to non-controlling interest) of 36.6% for 2016 and 39.8% for 2015. The 2016 provision for taxes includes a reduction of $1.0 million due to the adoption of new Financial Accounting Standards Board guidance relevant to stock compensation accounting provisions. This guidance amends how excess tax benefits should be classified. Under the guidance, excess tax benefits will be a component of the income tax provision/benefit in the period in which they occur. The reconciliation of the 2015 federal and state returns to our book provision was $34,000 which is included in the 2016 provision. The 2015 tax provision includes an additional $147,000 due to reconciliation of the 2014 federal and state returns to our book provision.
Net Income Attributable to Non-controlling Interests
Net income attributable to non-controlling interests was $5.7 million in 2016 and $5.9 million in 2015.
FISCAL YEAR 2015 COMPARED TO FISCAL 2014
| • |
Net revenues rose 8.6 % to $331.3 million for 2015 from $305.1 million for 2014 primarily due to increases in net patient revenues which are discussed in detail below.
|
| • |
Net income attributable to USPH shareholders prior to interest expense – mandatorily redeemable non-controlling interest – increase in redemption value was $22.2 million in 2015, or $1.79 per diluted share, and $20.9 million in 2014, or $1.69 per diluted share. The following table details this computation:
|
|
|
For the Year Ended
|
|||||||
|
|
December 31, 2015
|
December 31, 2014
|
||||||
|
|
(as restated)
|
(as restated)
|
||||||
|
Net income attributable to USPH shareholders
|
$
|
20,615
|
$
|
19,131
|
||||
|
|
||||||||
|
Adjustments:
|
||||||||
|
Interest expense MRNCI * - change in redemption value, net of tax
|
1,622
|
1,809
|
||||||
|
Operating results
|
$
|
22,237
|
$
|
20,940
|
||||
* Mandatorily redeemable non-controlling interest
The above table reconciles net income attributable to USPH shareholders calculated in accordance with GAAP to operating results. Operating results is defined as USPH’s net income attributable to common shareholders prior to interest expense – mandatorily redeemable non-controlling interests – change in redemption value, net of tax. Management uses operating results, which eliminates this non-cash item that can be subject to volatility, as one of the principal measures to evaluate and monitor financial performance period over period. Management believes that operating results is useful information for investors to use in comparing the Company's period-to-period results as well as for comparing with other similar businesses since most do not have mandatorily redeemable instruments and therefore have different liability and equity structures. Operating results is not a measure of financial performance under GAAP and should not be considered in isolation or as an alternative to, or substitute for, net income attributable to USPH shareholders presented in the consolidated financial statements.
Net Patient Revenues
| • |
Net patient revenues increased to $324.3 million for 2015 from $299.0 million for 2014, an increase of $25.3 million, or 8.5%. The increase in net patient revenues of $25.3 million consisted of an increase of $15.2 million from New Clinics and $10.1 million from Mature Clinics of which $10.3 million was related to 2014 New Clinics offset by a small decrease of $0.2 million related to 2014 Mature Clinics. During 2015, we acquired four multi-clinic groups for a total of 20 clinics. The net patient revenues from these multi-clinic groups are included in our results of operations since the respective date of their acquisition. See above table under ‘‘—Executive Summary’’ detailing our multi-clinic acquisitions.
|
| • |
Total patient visits increased to 3,080,200 for 2015 from 2,818,800 for 2014. The growth in patient visits was attributable to 150,200 visits in New Clinics primarily due to the acquisitions in 2015 and an increase of 111,200 visits for Mature Clinics primarily due to 2014 New Clinics.
|
| • |
The average net patient revenue per visit decreased to $105.28 in 2015 from $106.08 in 2014.
|
Net patient revenues are based on established billing rates less allowances and discounts for patients covered by contractual programs and workers’ compensation. Net patient revenues reflect contractual and other adjustments, which we evaluate monthly, relating to patient discounts from certain payors. Payments received under these programs are based on predetermined rates and are generally less than the established billing rates of the clinics.
Other Revenues
Other revenues, consisting primarily of management fees, increased by $0.9 million, from $6.1 million in 2014 to $7.0 million in 2015. On December 31, 2015, we managed 21 third-party physical therapy facilities versus 16 on December 31, 2014.
Clinic Operating Costs
Clinic operating costs were $252.9 million, or 76.3% of net revenues, for 2015 and $228.9 million, or 75.0% of net revenues, for 2014. The increase was attributable to $13.9 million in operating costs for 2015 New Clinics, an increase in operating costs of $8.1 million for 2014 New Clinics and an increase of $2.0 million for 2014 Mature Clinics primarily resulting from 2013 New Clinics. Each component of clinic operating costs is discussed below.
Clinic Operating Costs—Salaries and Related Costs
Salaries and related costs increased to $180.5 million for 2015 from $163.4 million for 2014, an increase of $17.1 million, or 10.5%. Approximately $9.9 million of the increase was attributable to 2015 New Clinics and $5.6 million of the increase was due to a higher costs at various 2014 New Clinics due to a full year of activity (see table detailing acquisition dates above under ‘‘-Executive Summary’’) and higher costs of $1.6 million at 2014 Mature Clinics. Salaries and related costs as a percentage of net revenues was 54.5% for 2015 and 53.6% for 2014.
Clinic Operating Costs—Rent, Clinic Supplies, Contract Labor and Other
Rent, clinic supplies, contract labor and other costs increased to $68.0 million for 2015 from $61.2 million for 2014, an increase of $6.8 million, or 11.2%. For 2015, 2015 New Clinics accounted for approximately $3.8 million of the increase and 2014 New Clinics accounted for approximately $2.5 million of the increase due to a full year of activity. Rent, clinic supplies, contract labor and other costs for 2014 Mature Clinics increased $0.5 million in 2015 as compared to 2014. Rent, clinic supplies, contract labor and other costs as a percent of net revenues was 20.5% for 2015 and 20.1% for 2014.
Clinic Operating Costs—Provision for Doubtful Accounts
The provision for doubtful accounts for net patient receivables was $4.2 million for 2015 and $4.1 million for 2014. As a percentage of net patient revenues, the provision for doubtful accounts was 1.3% for 2015 and 1.4% for 2014.
Our provision for doubtful accounts as a percentage of total patient accounts receivable was 3.8% at December 31, 2015 and 4.8% at December 31, 2014. The provision for doubtful accounts at the end of each period is based on a detailed, clinic-by-clinic review of overdue accounts and is regularly reviewed in the aggregate in light of historical experience..
The average accounts receivable days outstanding were 36 days for December 31, 2015 and 39 days for December 31, 2014. Net patient receivables in the amount of $3.9 million and $4.4 million were written-off in 2015 and 2014, respectively.
Closure Costs
For 2015 and 2014, closure costs amounted to $211,000 and $169,000, respectively.
Gross Margin
In 2015, the gross margin (net revenues less total clinic operating costs) increased by 2.9% to $78.4 million from $76.2 million in 2014. The gross margin percentage for 2015 was 23.7% as compared to 25.0% for 2014.
Corporate Office Costs
Corporate office costs, consisting primarily of salaries, benefits and equity based compensation of corporate office personnel and directors, rent, insurance costs, depreciation and amortization, travel, legal, compliance, professional, marketing and recruiting fees, were $31.1 million for 2015 and $30.4 million for 2014. The dollar increase is primarily due to increases in salaries, benefits and equity based compensation. Corporate office costs as a percentage of net revenues were 9.4% for 2015 and 10.0% in 2014.
Interest Expense – mandatorily redeemable non-controlling interest – change in redemption value.
Interest Expense – mandatorily redeemable non-controlling interest – change in redemption value was $2.7 million for the year 2015 and $3.0 million in 2014. The change in redemption value is based on the redemption amount (which is derived from a formula based on a specified multiple of the underlying business’ trailing twelve months of earnings before interest, taxes, depreciation, amortization and our internal management fee) at the end of the reporting period compared to the end of the previous period.
Interest Expense – mandatorily redeemable non-controlling interest – earnings allocable.
Interest Expense – mandatorily redeemable non-controlling interest – earnings allocable represent the portion of earnings allocable to the holders of the mandatorily redeemable non-controlling interest. This expense increased to $3.5 million in 2015 as compared to $3.4 million in 2014. The increase is the result of new business acquisitions and increased performance of existing businesses.
Interest Expense – debt and other
Interest expense on debt remained relatively the same in 2015 and 2014. Interest expense was $1.0 million for 2015 and $1.1 million for 2014. At December 31, 2015, $44.0 million was outstanding under our Credit Agreement. See ‘‘—Liquidity and Capital Resources’’ below for a discussion of the terms of our Amended Credit Agreement (as defined below under ‘‘—Liquidity and Capital Resources’’).
Provision for Income Taxes
The provision for income taxes was $13.6 million for 2015 and $13.0 million for 2014. We accrued state and federal income taxes at an effective tax rate (provision for taxes divided by the difference between income before taxes and net income attributable to non-controlling interest) of 39.8% for 2015 and 40.5% for 2014. The 2015 provision for taxes includes an additional $147,000 due to reconciliation of the 2014 federal and state returns to our book provision and an additional $223,000 in 2014 for the 2013 reconciliation.
Net Income Attributable to Non-controlling Interests
Net income attributable to non-controlling interests was $5.9 million in 2015 and $6.2 million in 2014.
LIQUIDITY AND CAPITAL RESOURCES
We believe that our business is generating sufficient cash flow from operating activities to allow us to meet our short-term and long-term cash requirements, other than those with respect to future significant acquisitions. At December 31, 2016, we had $20.0 million in cash and cash equivalents compared to $15.8 million at December 31, 2015. Although the start-up costs associated with opening new clinics and our planned capital expenditures are significant, we believe that our cash and cash equivalents and availability under our Amended Credit Agreement are sufficient to fund the working capital needs of our operating subsidiaries, future clinic development and acquisitions and investments through at least December 2017. Significant acquisitions would likely require financing under our Amended Credit Agreement.
Effective December 5, 2013, we entered into an Amended and Restated Credit Agreement with a commitment for a $125.0 million revolving credit facility with a maturity date of November 30, 2018. This agreement was amended in August 2015, January 2016 and March 2017 (hereafter referred to as “Amended Credit Agreement”). The Amended Credit Agreement is unsecured and has loan covenants, including requirements that the Company comply with a consolidated fixed charge coverage ratio and consolidated leverage ratio. Proceeds from the Amended Credit Agreement may be used for working capital, acquisitions, purchases of the Company’s common stock, dividend payments to the Company’s common stockholders, capital expenditures and other corporate purposes. The pricing grid which is based on the Company’s consolidated leverage ratio with the applicable spread over LIBOR ranging from 1.5% to 2.5% or the applicable spread over the Base Rate ranging from 0.1% to 1%. Fees under the Amended Credit Agreement include an unused commitment fee ranging from 0.1% to 0.25% depending on the Company’s consolidated leverage ratio and the amount of funds outstanding under the Amended Credit Agreement. On December 31, 2016, $46.0 million was outstanding under our Amended Credit Agreement resulting in $79.0 million of availability. As of the date of the filing of this Annual Report, we were in compliance with all of the covenants thereunder.
The increase in cash and cash equivalents of $4.3 million from December 31, 2016 to December 31, 2015 was due primarily to $51.1 million provided by operations and $2.0 million net proceeds from our Amended Credit Agreement. The major uses of cash for investing and financing activities included: purchase of businesses ($23.6 million), distributions to non-controlling interests ($10.3 million), payments of cash dividends to our shareholders ($8.5 million), purchases of fixed assets ($8.3 million), acquisitions of non-controlling interests ($1.9 million) and payments on notes payable ($0.8 million).
On November 30, 2016, we acquired a 60% interest in a 12 clinic physical therapy practice. The purchase price for the 60% interest was $11.0 million in cash and $0.5 million in a seller note that is payable in two principal installments of $250,000 each, plus accrued interest, in November 2017 and 2018. On February 29, 2016, we acquired a 55% interest in an eight-clinic physical therapy practice. The purchase price for the 55% interest was $13.2 million in cash and $0.5 million in a seller note that was payable in two principal installments totaling $250,000 each, plus accrued interest. The first installment was paid in February 2017 and the next installment is due February 2018.
On December 31, 2015, we acquired a 59% interest in a four-clinic practice for $4.6 million in cash and $400,000 in seller notes that were payable in two principal installments of an aggregate of $200,000 each, plus accrued interest. The first installment was paid in December 2016 and the next installment is due in December 2017. On June 30, 2015, we acquired a 70% interest in a four-clinic physical therapy practice. The purchase price was $3.6 million in cash and $0.7 million in seller notes that are payable plus accrued interest, in June 2018. On April 30, 2015, we acquired a 70% interest in a three-clinic physical therapy practice. The purchase price was $4.7 million in cash and $150,000 in a seller note that was payable in two principal installments of $75,000 each, plus accrued interest. The first installment was paid in April 2016 and the next installment is due in April 2017. On January 31, 2015, we acquired a 60% interest in a nine-clinic physical therapy practice. The purchase price for the 60% interest was $6.7 million in cash and $0.5 million in a seller note that is payable in two principal installments of $250,000 each, plus accrued interest. The installments were paid in January 2016 and 2017. In addition to the multi-clinic acquisitions, on August 31, 2015, we acquired a 60% interest in a single physical therapy clinic for $150,000 in cash and $50,000 in a seller note that was paid plus accrued interest in August 2016.
Historically, we have generated sufficient cash from operations to fund our development activities and to cover operational needs. We plan to continue developing new clinics and making additional acquisitions in selected markets. We have from time to time purchased the non-controlling interests of limited partners in our Clinic Partnerships. We may purchase additional non-controlling interests in the future. Generally, any acquisition or purchase of non-controlling interests is expected to be accomplished using a combination of cash and financing. Any large acquisition would likely require financing.
We make reasonable and appropriate efforts to collect accounts receivable, including applicable deductible and co-payment amounts. Claims are submitted to payors daily, weekly or monthly in accordance with our policy or payor’s requirements. When possible, we submit our claims electronically. The collection process is time consuming and typically involves the submission of claims to multiple payors whose payment of claims may be dependent upon the payment of another payor. Claims under litigation and vehicular incidents can take a year or longer to collect. Medicare and other payor claims relating to new clinics awaiting CMS approval initially may not be submitted for six months or more. When all reasonable internal collection efforts have been exhausted, accounts are written off prior to sending them to outside collection firms. With managed care, commercial health plans and self-pay payor type receivables, the write-off generally occurs after the account receivable has been outstanding for 120 days or longer.
We have future obligations for debt repayments, employment agreements and future minimum rentals under operating leases. The obligations as of December 31, 2016 are summarized as follows (in thousands):
|
Total
|
2017
|
2018
|
2019
|
2020
|
2021
|
Thereafter
|
||||||||||||||||||||||
|
Credit Agreement
|
$
|
46,000
|
$
|
-
|
$
|
46,000
|
$
|
-
|
$
|
-
|
$
|
-
|
$
|
-
|
||||||||||||||
|
Notes Payable
|
5,823
|
1,227
|
2,750
|
1,846
|
-
|
-
|
-
|
|||||||||||||||||||||
|
Interest Payable
|
288,298
|
162,465
|
120,739
|
5,094
|
-
|
-
|
-
|
|||||||||||||||||||||
|
Employee Agreements
|
40,827
|
24,601
|
11,070
|
2,430
|
1,548
|
1,178
|
-
|
|||||||||||||||||||||
|
Operating Leases
|
96,433
|
30,376
|
23,907
|
17,041
|
15,164
|
6,850
|
3,095
|
|||||||||||||||||||||
|
$
|
477,381
|
$
|
218,669
|
$
|
204,466
|
$
|
26,411
|
$
|
16,712
|
$
|
8,028
|
$
|
3,095
|
|||||||||||||||
In addition to the above obligations, as of December 31, 2016, we have mandatorily redeemable non-controlling interests in the consolidated financial statements which consist of those owners who have certain redemption rights, whether currently exercisable or not, and which currently, or in the future, require that the Company purchase the non-controlling interest of those owners at a predetermined formula based on a multiple of trailing twelve months earnings performance as defined in the respective limited partnership agreements amounting to $69.2 million. The redemption rights are triggered at such time as both of the following events have occurred: 1) termination of the owner’s employment, regardless of the reason for such termination, and 2) the passage of specified number of years after the closing of the transaction, typically three to five years, as defined in the limited partnership agreement.
We generally enter into various notes payable as a means of financing our acquisitions. Our present outstanding notes payable relate only to certain of the acquisitions of businesses and non-controlling interests and settlement of mandatorily redeemable non-controlling interests. At December 31, 2016, our remaining outstanding balance on these notes aggregated $5.8 million. Generally, the notes are payable in equal annual installments of principal over two years plus any accrued and unpaid interest. See above table for a detail of future principal payments. Interest accrues at various interest rates ranging from 3.25% to 4.0% per annum, subject to adjustment. In addition, we assumed leases with remaining terms of 1 month to 6 years for the operating facilities.
In conjunction with the above mentioned acquisitions, in the event that a limited minority partner’s employment ceases, typically after three to five years, from the original date the interest was acquired, we have agreed to repurchase that individual’s non-controlling interest (mandatorily redeemable non-controlling interests) at a predetermined multiple of earnings before interest, taxes, depreciation, amortization and certain intercompany charges.
As of December 31, 2016, we have accrued $3.9 million related to credit balances and overpayments due to patients and payors. This amount is expected to be paid in 2017.
From September 2001 through December 31, 2008, our Board of Directors (“Board”) authorized us to purchase, in the open market or in privately negotiated transactions, up to 2,250,000 shares of our common stock. In March 2009, the Board authorized the repurchase of up to 10% or approximately 1,200,000 shares of our common stock (“March 2009 Authorization”). Our Amended Credit Agreement permits share repurchases of up to $15,000,000, subject to compliance with covenants. We are required to retire shares purchased under the March 2009 Authorization.
There is no expiration date for the share repurchase program. As of December 31, 2016, there are currently an additional estimated 213,675 shares (based on the closing price of $70.20 on December 31, 2016) that may be purchased from time to time in the open market or private transactions depending on price, availability and our cash position. We did not purchase any shares of our common stock during the year ended December 31, 2016.
Off Balance Sheet Arrangements
With the exception of operating leases for our executive offices and clinic facilities discussed in Note 15 to our consolidated financial statements included in Item 8, we have no off-balance sheet debt or other off-balance sheet financing arrangements.
FACTORS AFFECTING FUTURE RESULTS
The risks related to our business and operations include:
| · |
the risk that the restatement of prior financial statements due to the correction in the accounting method for redeemable non-controlling interests could adversely affect the Company’s ability to make timely filings with the Securities and Exchange Commission;
|
| · |
cost, risks and uncertainties associated with the Company’s recent restatement of its prior financial statements due to the correction of its accounting methodology for redeemable non-controlling partnership interests, and including any pending and future claims or proceedings relating to such matters;
|
| · |
changes in Medicare rules and guidelines and reimbursement or failure of our clinics to maintain their Medicare certification or enrollment status;
|
| · |
revenue we receive from Medicare and Medicaid being subject to potential retroactive reduction;
|
| · |
business and regulatory conditions including federal and state regulations;
|
| · |
governmental and other third party payor inspections, reviews, investigations and audits;
|
| · |
compliance with federal and state laws and regulations relating to the privacy of individually identifiable patient information, and associated fines and penalties for failure to comply;
|
| · |
legal actions, which could subject us to increased operating costs and uninsured liabilities;
|
| · |
changes in reimbursement rates or payment methods from third party payors including government agencies and deductibles and co-pays owed by patients;
|
| · |
revenue and earnings expectations;
|
| · |
general economic conditions;
|
| · |
availability and cost of qualified physical therapists;
|
| · |
personnel productivity and retaining key personnel;
|
| · |
competitive, economic or reimbursement conditions in our markets which may require us to reorganize or close certain clinics and thereby incur losses and/or closure costs including the possible write-down or write-off of goodwill and other intangible assets;
|
| · |
acquisitions, purchase of non-controlling interests (minority interests) and the successful integration of the operations of the acquired businesses;
|
| · |
our ability to design and maintain effective internal control over financial reporting and remediate the material weakness in internal control over financial reporting related to our accounting for redeemable non-controlling partnership interests;
|
| · |
maintaining necessary insurance coverage;
|
| · |
availability, terms, and use of capital; and
|
| · |
weather and other seasonal factors.
|
See also Risk Factors in Item 1A of this Annual Report on Form 10-K.
We do not maintain any derivative instruments such as interest rate swap arrangements, hedging contracts, futures contracts or the like. Our only indebtedness as of December 31, 2016 was the outstanding balance of seller notes of $5.8 million and an outstanding balance on our Amended Credit Agreement of $46.0 million. The outstanding balance under our Amended Credit Agreement is subject to fluctuating interest rates. A 1% change in the interest rate would yield an additional $460,000 of interest expense. See Note 9 to our consolidated financial statements included in Item 8.
U.S. PHYSICAL THERAPY, INC. AND SUBSIDIARIES
INDEX TO CONSOLIDATED FINANCIAL STATEMENTS AND RELATED INFORMATION
|
36
|
|
|
38
|
|
|
39
|
|
|
40
|
|
|
41
|
|
|
42
|
Board of Directors and Shareholders
U.S. Physical Therapy, Inc.
We have audited the accompanying consolidated balance sheets of US Physical Therapy, Inc. (a Nevada corporation) and subsidiaries (the “Company”) as of December 31, 2016 and 2015, and the related consolidated statements of net income, equity, and cash flows for each of the three years in the period ended December 31, 2016. Our audits of the basic consolidated financial statements included the financial statement schedule listed in the index appearing under Item 15(a)(2). These financial statements and financial statement schedule are the responsibility of the Company’s management. Our responsibility is to express an opinion on these financial statements and financial statement schedule based on our audits.
We conducted our audits in accordance with the standards of the Public Company Accounting Oversight Board (United States). Those standards require that we plan and perform the audit to obtain reasonable assurance about whether the financial statements are free of material misstatement. An audit includes examining, on a test basis, evidence supporting the amounts and disclosures in the financial statements. An audit also includes assessing the accounting principles used and significant estimates made by management, as well as evaluating the overall financial statement presentation. We believe that our audits provide a reasonable basis for our opinion.
In our opinion, the consolidated financial statements referred to above present fairly, in all material respects, the financial position of US Physical Therapy, Inc. and subsidiaries as of December 31, 2016 and 2015, and the results of its operations and its cash flows for each of the three years in the period ended December 31, 2016 in conformity with accounting principles generally accepted in the United States of America. Also in our opinion, the related financial statement schedule, when considered in relation to the basic consolidated financial statements taken as a whole, presents fairly, in all material respects, the information set forth therein.
As discussed in Note 1, the 2015 and 2014 consolidated financial statements have been restated to correct an error.
We also have audited, in accordance with the standards of the Public Company Accounting Oversight Board (United States), the Company’s internal control over financial reporting as of December 31, 2016, based on criteria established in the 2013 Internal Control—Integrated Framework issued by the Committee of Sponsoring Organizations of the Treadway Commission (COSO), and our report dated June 7, 2017 expressed an adverse opinion.
/s/ GRANT THORNTON LLP
Houston, Texas
June 7, 2017
REPORT OF INDEPENDENT REGISTERED PUBLIC ACCOUNTING FIRM
Board of Directors and Shareholders
U.S. Physical Therapy, Inc.
We have audited the internal control over financial reporting of US Physical Therapy, Inc. (a Nevada corporation) and subsidiaries (the “Company”) as of December 31, 2016, based on criteria established in the 2013 Internal Control—Integrated Framework issued by the Committee of Sponsoring Organizations of the Treadway Commission (COSO). The Company’s management is responsible for maintaining effective internal control over financial reporting and for its assessment of the effectiveness of internal control over financial reporting, included in the accompanying Management’s Report on Internal Control over Financial Reporting (“Management’s Report”). Our responsibility is to express an opinion on the Company’s internal control over financial reporting based on our audit.
We conducted our audit in accordance with the standards of the Public Company Accounting Oversight Board (United States). Those standards require that we plan and perform the audit to obtain reasonable assurance about whether effective internal control over financial reporting was maintained in all material respects. Our audit included obtaining an understanding of internal control over financial reporting, assessing the risk that a material weakness exists, testing and evaluating the design and operating effectiveness of internal control based on the assessed risk, and performing such other procedures as we considered necessary in the circumstances. We believe that our audit provides a reasonable basis for our opinion.
A company’s internal control over financial reporting is a process designed to provide reasonable assurance regarding the reliability of financial reporting and the preparation of financial statements for external purposes in accordance with generally accepted accounting principles. A company’s internal control over financial reporting includes those policies and procedures that (1) pertain to the maintenance of records that, in reasonable detail, accurately and fairly reflect the transactions and dispositions of the assets of the company; (2) provide reasonable assurance that transactions are recorded as necessary to permit preparation of financial statements in accordance with generally accepted accounting principles, and that receipts and expenditures of the company are being made only in accordance with authorizations of management and directors of the company; and (3) provide reasonable assurance regarding prevention or timely detection of unauthorized acquisition, use, or disposition of the company’s assets that could have a material effect on the financial statements.
Because of its inherent limitations, internal control over financial reporting may not prevent or detect misstatements. Also, projections of any evaluation of effectiveness to future periods are subject to the risk that controls may become inadequate because of changes in conditions, or that the degree of compliance with the policies or procedures may deteriorate.
A material weakness is a deficiency, or combination of control deficiencies, in internal control over financial reporting, such that there is a reasonable possibility that a material misstatement of the company’s annual or interim financial statements will not be prevented or detected on a timely basis. The following material weakness has been identified and included in management’s assessment. The Company identified a material weakness related to the accounting for redeemable non-controlling interests. The Company’s business combination/purchase accounting controls related to the accounting for redeemable non-controlling interests were not designed effectively to ensure that the Company correctly interpreted and applied technical accounting requirements concerning the classification of such interests in the consolidated financial statements.
In our opinion, because of the effect of the material weakness described above on the achievement of the objectives of the control criteria, the Company has not maintained effective internal control over financial reporting as of December 31, 2016, based on criteria established in the 2013 Internal Control—Integrated Framework issued by COSO.
We also have audited, in accordance with the standards of the Public Company Accounting Oversight Board (United States), the consolidated financial statements of the Company as of and for the year ended December 31, 2016. The material weakness identified above was considered in determining the nature, timing, and extent of audit tests applied in our audit of the 2016 consolidated financial statements, and this report does not affect our report dated June 7, 2017, which expressed an unqualified opinion on those financial statements.
/s/ GRANT THORNTON LLP
Houston, Texas
June 7, 2017
U.S. PHYSICAL THERAPY, INC. AND SUBSIDIARIES
(In thousands, except share data)
|
December 31, 2016
|
December 31, 2015
|
|||||||
|
ASSETS
|
(as restated)
|
|||||||
|
Current assets:
|
||||||||
|
Cash and cash equivalents
|
$
|
20,047
|
$
|
15,778
|
||||
|
Patient accounts receivable, less allowance for doubtful accounts of $1,792 and $1,444, respectively
|
38,840
|
36,231
|
||||||
|
Accounts receivable - other, less allowance for doubtful accounts of $-0- and $198, respectively
|
2,649
|
2,388
|
||||||
|
Other current assets
|
4,428
|
5,803
|
||||||
|
Total current assets
|
65,964
|
60,200
|
||||||
|
Fixed assets:
|
||||||||
|
Furniture and equipment
|
48,426
|
44,749
|
||||||
|
Leasehold improvements
|
26,765
|
25,160
|
||||||
|
Fixed assets, gross
|
75,191
|
69,909
|
||||||
|
Less accumulated depreciation and amortization
|
56,018
|
53,255
|
||||||
|
Fixed assets, net
|
19,173
|
16,654
|
||||||
|
Goodwill
|
226,806
|
195,373
|
||||||
|
Other identifiable intangible assets, net
|
38,060
|
30,296
|
||||||
|
Other assets
|
1,228
|
1,234
|
||||||
|
Total assets
|
$
|
351,231
|
$
|
303,757
|
||||
|
LIABILITIES AND SHAREHOLDERS’ EQUITY
|
||||||||
|
Current liabilities:
|
||||||||
|
Accounts payable - trade
|
$
|
1,634
|
$
|
1,636
|
||||
|
Accrued expenses
|
21,756
|
16,596
|
||||||
|
Current portion of notes payable
|
1,227
|
775
|
||||||
|
Total current liabilities
|
24,617
|
19,007
|
||||||
|
Notes payable
|
4,596
|
4,335
|
||||||
|
Revolving line of credit
|
46,000
|
44,000
|
||||||
|
Mandatorily redeemable non-controlling interests
|
69,190
|
45,974
|
||||||
|
Deferred taxes
|
15,736
|
15,508
|
||||||
|
Deferred rent
|
1,575
|
1,395
|
||||||
|
Other long-term liabilities
|
829
|
1,228
|
||||||
|
Total liabilities
|
162,543
|
131,447
|
||||||
|
Commitments and contingencies
|
||||||||
|
U.S. Physical Therapy, Inc. ("USPH") shareholders’ equity:
|
||||||||
|
Preferred stock, $.01 par value, 500,000 shares authorized, no shares issued and outstanding
|
-
|
-
|
||||||
|
Common stock, $.01 par value, 20,000,000 shares authorized, 14,732,699 and 14,635,874 shares issued, respectively
|
147
|
146
|
||||||
|
Additional paid-in capital
|
68,687
|
64,238
|
||||||
|
Retained earnings
|
150,342
|
138,301
|
||||||
|
Treasury stock at cost, 2,214,737 shares
|
(31,628
|
)
|
(31,628
|
)
|
||||
|
Total USPH shareholders’ equity
|
187,548
|
171,057
|
||||||
|
Non-controlling interests
|
1,140
|
1,253
|
||||||
|
Total USPH shareholders' equity and non-controlling interests
|
188,688
|
172,310
|
||||||
|
Total liabilities, USPH shareholders' equity and non-controlling interests
|
$
|
351,231
|
$
|
303,757
|
||||
See notes to consolidated financial statements.
U.S. PHYSICAL THERAPY, INC. AND SUBSIDIARIES
(In thousands, except per share data)
|
Year Ended
|
||||||||||||
|
December 31, 2016
|
December 31, 2015
|
December 31, 2014
|
||||||||||
|
(as restated)
|
(as restated)
|
|||||||||||
|
Net patient revenues
|
$
|
348,839
|
$
|
324,293
|
$
|
299,009
|
||||||
|
Other revenues
|
7,707
|
7,009
|
6,065
|
|||||||||
|
Net revenues
|
356,546
|
331,302
|
305,074
|
|||||||||
|
Clinic operating costs:
|
||||||||||||
|
Salaries and related costs
|
198,495
|
180,514
|
163,417
|
|||||||||
|
Rent, clinic supplies, contract labor and other
|
71,868
|
68,046
|
61,209
|
|||||||||
|
Provision for doubtful accounts
|
4,040
|
4,170
|
4,112
|
|||||||||
|
Closure costs
|
131
|
211
|
169
|
|||||||||
|
Total clinic operating costs
|
274,534
|
252,941
|
228,907
|
|||||||||
|
Gross margin
|
82,012
|
78,361
|
76,167
|
|||||||||
|
Corporate office costs
|
32,479
|
31,067
|
30,399
|
|||||||||
|
Operating income
|
49,533
|
47,294
|
45,768
|
|||||||||
|
Interest and other income, net
|
93
|
81
|
18
|
|||||||||
|
Interest expense
|
||||||||||||
|
Mandatorily redeemable non-controlling interests - change in redemption value
|
(6,169
|
)
|
(2,670
|
)
|
(2,978
|
)
|
||||||
|
Mandatorily redeemable non-controlling interests - earnings allocable
|
(4,057
|
)
|
(3,538
|
)
|
(3,388
|
)
|
||||||
|
Debt and other
|
(1,252
|
)
|
(1,031
|
)
|
(1,088
|
)
|
||||||
|
Total interest expense
|
(11,478
|
)
|
(7,239
|
)
|
(7,454
|
)
|
||||||
|
Income before taxes
|
38,148
|
40,136
|
38,332
|
|||||||||
|
Provision for income taxes
|
11,880
|
13,647
|
13,018
|
|||||||||
|
Net income
|
26,268
|
26,489
|
25,314
|
|||||||||
|
Less: net income attributable to non-controlling interests
|
(5,717
|
)
|
(5,874
|
)
|
(6,183
|
)
|
||||||
|
Net income attributable to USPH shareholders
|
$
|
20,551
|
$
|
20,615
|
$
|
19,131
|
||||||
|
Basic and diluted earnings per share attributable to USPH shareholders
|
$
|
1.64
|
$
|
1.66
|
$
|
1.57
|
||||||
|
Shares used in computation - basic
|
12,500
|
12,392
|
12,217
|
|||||||||
|
Shares used in computation - diluted
|
12,500
|
12,392
|
12,221
|
|||||||||
|
Dividends declared per common share
|
$
|
0.68
|
$
|
0.60
|
$
|
0.48
|
||||||
See notes to consolidated financial statements.
U.S. PHYSICAL THERAPY, INC. AND SUBSIDIARIES
(In thousands)
|
U.S.Physical Therapy, Inc.
|
||||||||||||||||||||||||||||||||||||
|
Common Stock
|
Additional
|
Retained
|
Treasury Stock
|
Total Shareholders’
|
Non-Controlling
|
|||||||||||||||||||||||||||||||
|
Shares
|
Amount
|
Paid-In Capital
|
Earnings
|
Shares
|
Amount
|
Equity
|
Interests
|
Total
|
||||||||||||||||||||||||||||
|
(In thousands)
|
||||||||||||||||||||||||||||||||||||
|
Balance January 1, 2014, as reported
|
14,316
|
$
|
143
|
$
|
40,569
|
$
|
119,206
|
(2,215
|
)
|
$
|
(31,628
|
)
|
$
|
128,290
|
$
|
22,727
|
$
|
151,017
|
||||||||||||||||||
|
Correction of prior years cumulative error
|
-
|
-
|
13,970
|
(7,329
|
)
|
-
|
-
|
6,641
|
(21,424
|
)
|
(14,783
|
)
|
||||||||||||||||||||||||
|
Adjusted Balance January 1, 2014, as restated
|
14,316
|
$
|
143
|
$
|
54,539
|
$
|
111,877
|
(2,215
|
)
|
$
|
(31,628
|
)
|
$
|
134,931
|
$
|
1,303
|
$
|
136,234
|
||||||||||||||||||
|
Proceeds from exercise of stock options
|
21
|
1
|
43
|
-
|
-
|
-
|
44
|
-
|
44
|
|||||||||||||||||||||||||||
|
Net tax benefit from exercise of stock options
|
-
|
-
|
948
|
-
|
-
|
-
|
948
|
-
|
948
|
|||||||||||||||||||||||||||
|
Issuance of restricted stock
|
150
|
1
|
-
|
-
|
-
|
-
|
1
|
-
|
1
|
|||||||||||||||||||||||||||
|
Compensation expense - restricted stock
|
-
|
-
|
3,363
|
-
|
-
|
-
|
3,363
|
-
|
3,363
|
|||||||||||||||||||||||||||
|
Acquisitions of non-controlling interests, as restated
|
-
|
-
|
(94
|
)
|
-
|
-
|
-
|
(94
|
)
|
(35
|
)
|
(129
|
)
|
|||||||||||||||||||||||
|
Distributions to non-controlling interest partners, as restated
|
-
|
-
|
-
|
-
|
-
|
-
|
-
|
(5,963
|
)
|
(5,963
|
)
|
|||||||||||||||||||||||||
|
Dividends payable to USPT shareholders
|
-
|
-
|
-
|
(5,873
|
)
|
-
|
(5,873
|
)
|
-
|
(5,873
|
)
|
|||||||||||||||||||||||||
|
Net income, as restated
|
-
|
-
|
-
|
19,131
|
-
|
-
|
19,131
|
6,183
|
25,314
|
|||||||||||||||||||||||||||
|
Balance December 31, 2014, as restated
|
14,487
|
$
|
145
|
$
|
58,799
|
$
|
125,135
|
(2,215
|
)
|
$
|
(31,628
|
)
|
$
|
152,451
|
$
|
1,488
|
$
|
153,939
|
||||||||||||||||||
|
Proceeds from exercise of stock options
|
1
|
1
|
4
|
-
|
-
|
-
|
5
|
-
|
5
|
|||||||||||||||||||||||||||
|
Net tax benefit from exercise of stock options
|
-
|
-
|
947
|
-
|
-
|
-
|
947
|
-
|
947
|
|||||||||||||||||||||||||||
|
Issuance of restricted stock
|
148
|
-
|
-
|
-
|
-
|
-
|
-
|
-
|
-
|
|||||||||||||||||||||||||||
|
Compensation expense - restricted stock
|
-
|
-
|
4,491
|
-
|
-
|
-
|
4,491
|
-
|
4,491
|
|||||||||||||||||||||||||||
|
Transfer of compensation liability for certain stock issued pursuant to long-term incentive plans
|
-
|
-
|
446
|
-
|
-
|
-
|
446
|
-
|
446
|
|||||||||||||||||||||||||||
|
Acquisitions and sales of non-controlling interests, as restated
|
-
|
-
|
(449
|
)
|
-
|
-
|
-
|
(449
|
)
|
(217
|
)
|
(666
|
)
|
|||||||||||||||||||||||
|
Distributions to non-controlling interest partners, as restated
|
-
|
-
|
-
|
-
|
-
|
-
|
-
|
(5,892
|
)
|
(5,892
|
)
|
|||||||||||||||||||||||||
|
Dividends payable to USPT shareholders
|
-
|
-
|
-
|
(7,449
|
)
|
-
|
-
|
(7,449
|
)
|
-
|
(7,449
|
)
|
||||||||||||||||||||||||
|
Net income, as restated
|
-
|
-
|
-
|
20,615
|
-
|
-
|
20,615
|
5,874
|
26,489
|
|||||||||||||||||||||||||||
|
Balance December 31, 2015, as restated
|
14,636
|
$
|
146
|
$
|
64,238
|
$
|
138,301
|
(2,215
|
)
|
$
|
(31,628
|
)
|
$
|
171,057
|
$
|
1,253
|
$
|
172,310
|
||||||||||||||||||
|
Issuance of restricted stock
|
97
|
1
|
-
|
-
|
-
|
-
|
1
|
-
|
1
|
|||||||||||||||||||||||||||
|
Cancellation of restricted stock
|
-
|
-
|
-
|
-
|
-
|
-
|
-
|
-
|
-
|
|||||||||||||||||||||||||||
|
Compensation expense - equity-based awards
|
-
|
-
|
4,962
|
-
|
-
|
-
|
4,962
|
-
|
4,962
|
|||||||||||||||||||||||||||
|
Transfer of compensation liability for certain stock issued pursuant to long-term incentive plans
|
-
|
-
|
211
|
-
|
-
|
-
|
211
|
-
|
211
|
|||||||||||||||||||||||||||
|
Acquisitions of non-controlling interests, net
|
-
|
-
|
(533
|
)
|
-
|
-
|
-
|
(533
|
)
|
(112
|
)
|
(645
|
)
|
|||||||||||||||||||||||
|
Adjustment for prior year acquisitions of non-controlling interest - tax true up
|
-
|
-
|
(191
|
)
|
-
|
-
|
-
|
(191
|
)
|
-
|
(191
|
)
|
||||||||||||||||||||||||
|
Dividends payable to USPT shareholders
|
-
|
-
|
-
|
(8,510
|
)
|
-
|
-
|
(8,510
|
)
|
-
|
(8,510
|
)
|
||||||||||||||||||||||||
|
Distributions to non-controlling interest partners, as restated
|
-
|
-
|
-
|
-
|
-
|
-
|
-
|
(5,718
|
)
|
(5,718
|
)
|
|||||||||||||||||||||||||
|
Net income
|
-
|
-
|
-
|
20,551
|
-
|
-
|
20,551
|
5,717
|
26,268
|
|||||||||||||||||||||||||||
|
Balance December 31, 2016
|
14,733
|
$
|
147
|
$
|
68,687
|
$
|
150,342
|
(2,215
|
)
|
$
|
(31,628
|
)
|
$
|
187,548
|
$
|
1,140
|
$
|
188,688
|
||||||||||||||||||
See notes to consolidated financial statements.
U.S. PHYSICAL THERAPY, INC. AND SUBSIDIARIES
(In thousands)
|
Year Ended
|
||||||||||||
|
December 31, 2016
|
December 31, 2015
|
December 31, 2014
|
||||||||||
|
OPERATING ACTIVITIES
|
(as restated)
|
(as restated)
|
||||||||||
|
Net income including non-controlling interests
|
$
|
26,268
|
$
|
26,489
|
$
|
25,314
|
||||||
|
Adjustments to reconcile net income including non-controlling interests to net cash provided by operating activities:
|
||||||||||||
|
Depreciation and amortization
|
8,779
|
7,952
|
6,740
|
|||||||||
|
Provision for doubtful accounts
|
4,040
|
4,170
|
4,112
|
|||||||||
|
Equity-based awards compensation expense
|
4,962
|
4,491
|
3,363
|
|||||||||
|
Loss on sale of fixed assets
|
152
|
84
|
35
|
|||||||||
|
Excess tax benefit from equity-based awards
|
-
|
(947
|
)
|
(948
|
)
|
|||||||
|
Deferred income tax
|
2,979
|
5,953
|
5,106
|
|||||||||
|
Other
|
-
|
180
|
135
|
|||||||||
|
Changes in operating assets and liabilities:
|
||||||||||||
|
Increase in patient accounts receivable
|
(3,275
|
)
|
(5,519
|
)
|
(5,388
|
)
|
||||||
|
(Increase) decrease in accounts receivable - other
|
(400
|
)
|
(852
|
)
|
341
|
|||||||
|
(Increase) decrease in other assets
|
(1,399
|
)
|
(1,375
|
)
|
1,155
|
|||||||
|
Increase (decrease) in accounts payable and accrued expenses
|
2,994
|
(7,011
|
)
|
1,868
|
||||||||
|
Increase in mandatorily redeemable non-controlling interests
|
5,598
|
2,509
|
2,936
|
|||||||||
|
Increase (decrease) in other liabilities
|
352
|
1,396
|
(3,378
|
)
|
||||||||
|
Net cash provided by operating activities
|
51,050
|
37,520
|
41,391
|
|||||||||
|
INVESTING ACTIVITIES
|
||||||||||||
|
Purchase of fixed assets
|
(8,260
|
)
|
(6,263
|
)
|
(5,167
|
)
|
||||||
|
Purchase of businesses, net of cash acquired
|
(23,623
|
)
|
(18,965
|
)
|
(12,270
|
)
|
||||||
|
Acquisitions of non-controlling interests
|
(670
|
)
|
(968
|
)
|
(227
|
)
|
||||||
|
Proceeds on sale of fixed assets, net
|
61
|
71
|
47
|
|||||||||
|
Net cash used in investing activities
|
(32,492
|
)
|
(26,125
|
)
|
(17,617
|
)
|
||||||
|
FINANCING ACTIVITIES
|
||||||||||||
|
Distributions to non-controlling interests
|
(5,718
|
)
|
(5,892
|
)
|
(5,963
|
)
|
||||||
|
Cash dividends to shareholders - funded
|
(8,510
|
)
|
(7,449
|
)
|
(5,873
|
)
|
||||||
|
Proceeds from revolving line of credit
|
168,000
|
103,000
|
134,300
|
|||||||||
|
Payments on revolving line of credit
|
(166,000
|
)
|
(93,500
|
)
|
(139,800
|
)
|
||||||
|
Payments to settle mandatorily redeemable non-controlling interests
|
(1,262
|
)
|
(6,115
|
)
|
(5,233
|
)
|
||||||
|
Principal payments on notes payable
|
(800
|
)
|
(884
|
)
|
(825
|
)
|
||||||
|
Tax benefit from equity-based awards
|
-
|
947
|
948
|
|||||||||
|
Other
|
1
|
5
|
45
|
|||||||||
|
Net cash used in financing activities
|
(14,289
|
)
|
(9,888
|
)
|
(22,401
|
)
|
||||||
|
Net increase in cash and cash equivalents
|
4,269
|
1,507
|
1,373
|
|||||||||
|
Cash and cash equivalents - beginning of period
|
15,778
|
14,271
|
12,898
|
|||||||||
|
Cash and cash equivalents - end of period
|
$
|
20,047
|
$
|
15,778
|
$
|
14,271
|
||||||
|
SUPPLEMENTAL DISCLOSURES OF CASH FLOW INFORMATION
|
||||||||||||
|
Cash paid during the period for:
|
||||||||||||
|
Income taxes
|
$
|
10,584
|
$
|
7,779
|
$
|
9,253
|
||||||
|
Interest
|
$
|
784
|
$
|
884
|
$
|
1,103
|
||||||
|
Non-cash investing and financing transactions during the period:
|
||||||||||||
|
Purchase of business - seller financing portion
|
$
|
1,000
|
$
|
1,800
|
$
|
400
|
||||||
|
Acquisition of non-controlling interest - seller financing portion
|
$
|
387
|
$
|
-
|
$
|
-
|
||||||
|
Payment to settle redeemable non-controlling interest - financing portion
|
$
|
127
|
$
|
3,077
|
$
|
67
|
||||||
|
Receivable from sale of non-controlling interests
|
$
|
(138
|
)
|
$
|
-
|
$
|
-
|
|||||
See notes to consolidated financial statements.
U.S. PHYSICAL THERAPY, INC. AND SUBSIDIARIES
DECEMBER 31, 2016, 2015 and 2014
1. Organization, Nature of Operations and Basis of Presentation
U.S. Physical Therapy, Inc. and its subsidiaries (together, the “Company”) operate outpatient physical therapy clinics that provide pre-and post-operative care and treatment for orthopedic-related disorders, sports-related injuries, preventative care, rehabilitation of injured workers and neurological-related injuries. As of December 31, 2016 the Company owned and/or operated 540 clinics in 42 states. The clinics’ business primarily originates from physician referrals. The principal sources of payment for the clinics’ services are managed care programs, commercial health insurance, Medicare/Medicaid, workers’ compensation insurance and proceeds from personal injury cases. In addition to the Company’s ownership and operation of outpatient physical therapy clinics, it also manages physical therapy facilities for third parties, such as physicians and hospitals, with 20 such third-party facilities under management as of December 31, 2016.
The consolidated financial statements include the accounts of U.S. Physical Therapy, Inc. and its subsidiaries. All significant intercompany transactions and balances have been eliminated. The Company primarily operates through subsidiary clinic partnerships, in which the Company generally owns a 1% general partnership interest and a 49% to 99% limited partnership interest. The managing therapist of each clinic owns the remaining limited partnership interest in the majority of the clinics (hereinafter referred to as “Clinic Partnership”). To a lesser extent, the Company operates some clinics through wholly-owned subsidiaries under profit sharing arrangements with therapists (hereinafter referred to as “Wholly-Owned Facilities”).
During the last three years, the Company completed the following multi-clinic acquisitions:
|
|
Date |
% Interest Acquired
|
Number of Clinics
|
|||||||
|
2016
|
||||||||||
|
February 2016 Acquisition
|
February 29
|
55
|
%
|
8
|
||||||
|
November 2016 Acquisition
|
November 30
|
60
|
%
|
12
|
||||||
|
2015
|
||||||||||
|
January 2015 Acquisition
|
January 31
|
60
|
%
|
9
|
||||||
|
April 2015 Acquisition
|
April 30
|
70
|
%
|
3
|
||||||
|
June 2015 Acquisition
|
June 30
|
70
|
%
|
4
|
||||||
|
December 2015 Acquisition
|
December 31
|
59
|
%
|
4
|
||||||
|
2014
|
||||||||||
|
April 2014 Acquisition
|
April 30
|
70
|
%
|
13
|
||||||
|
August 2014 Acquisition
|
August 1
|
100
|
%
|
3
|
||||||
In addition to the multi-clinic acquisitions, the Company acquired two single clinic practices in separate transactions during 2016. During 2015, the Company acquired a 60% interest in a single clinic practice and, during 2014, the Company acquired four individual clinics in separate transactions.
Clinic Partnerships
For non-acquired Clinic Partnerships, the earnings and liabilities attributable to the non-controlling interest, typically owned by the managing therapist, directly or indirectly, are recorded within the statements of net income and balance sheets as non-controlling interests. For acquired Clinic Partnerships, the earnings and liabilities attributable to the non-controlling interest are recorded within the statements of net income line item: Interest expense – mandatorily redeemable non-controlling interests and in the balance sheet line item: Mandatorily redeemable non-controlling interests.
Wholly-Owned Facilities
For Wholly-Owned Facilities with profit sharing arrangements, an appropriate accrual is recorded for the amount of profit sharing due the clinic partners/directors. The amount is expensed as compensation and included in clinic operating costs—salaries and related costs. The respective liability is included in current liabilities—accrued expenses on the balance sheets.
Restatement of Prior Financial Statements
Prior to issuing the 2016 annual financial statements, the Company determined it had previously incorrectly accounted for the non-controlling interests which were mandatorily redeemable. See Footnote 2 – Significant Accounting Policies – Mandatorily Redeemable Non-Controlling Interests – for a description of the accounting for mandatorily redeemable non-controlling interests. Management determined this correction was material to previously issued annual and quarterly consolidated financial statements. The Company, in this Annual Report on Form 10-K for the year ended December 31, 2016, is correcting its consolidated financial statements for the balance sheet as of December 31, 2015 and the statements of net income, cash flows and equity for the years ended December 31, 2015 and 2014, which includes a cumulative adjustment to the beginning balances as of January 1, 2014 (reported balances as of December 31, 2013). In addition, any prior information within footnotes, including quarterly data affected by this correction, is restated within the financial statements in this report.
The following schedules present the impact of this correction on the Company’s previously reported consolidated balance sheet for the year ended December 31, 2015 and the consolidated statements of net income for the years ended December 31, 2015 and 2014 (in thousands, except share and per share data):
Consolidated Balance Sheet on December 31, 2015:
|
Description
|
As Reported
|
Adjustment
|
As Restated
|
|||||||||
|
Goodwill
|
$
|
171,457
|
$
|
23,916
|
$
|
195,373
|
||||||
|
Total assets
|
$
|
279,913
|
$
|
23,844
|
$
|
303,757
|
||||||
|
MRNCI (1)
|
-
|
$
|
45,974
|
$
|
45,974
|
|||||||
|
Deferred taxes (liability)
|
$
|
8,355
|
$
|
7,153
|
$
|
15,508
|
||||||
|
Total liabilities
|
$
|
77,960
|
$
|
53,487
|
$
|
131,447
|
||||||
|
RNCI (2)
|
$
|
8,843
|
$
|
(8,843
|
)
|
-
|
||||||
|
Additional paid-in capital
|
$
|
45,251
|
$
|
18,987
|
$
|
64,238
|
||||||
|
Retained earnings
|
$
|
149,016
|
$
|
(10,715
|
)
|
$
|
138,301
|
|||||
|
Total liabilities and equity
|
$
|
279,913
|
$
|
23,844
|
$
|
303,757
|
||||||
| (1) |
Mandatorily redeemable non-controlling interests
|
| (2) |
Redeemable non-controlling interests
|
Consolidated Statement of Net Income for the Year Ended December 31, 2015:
|
Description
|
As Reported
|
Adjustment
|
As Restated
|
|||||||||
|
Interest expense
|
||||||||||||
|
MRNCI (1) – changes in redemption value
|
-
|
$
|
2,670
|
$
|
2,670
|
|||||||
|
MRNCI (1) – earnings allocable
|
-
|
$
|
3,538
|
$
|
3,538
|
|||||||
|
Total interest expense
|
$
|
1,031
|
$
|
6,208
|
$
|
7,239
|
||||||
|
Net income before taxes
|
$
|
46,344
|
$
|
(6,208
|
)
|
$
|
40,136
|
|||||
|
Provision for income taxes
|
$
|
14,653
|
$
|
(1,006
|
)
|
$
|
13,647
|
|||||
|
Net income
|
$
|
31,691
|
$
|
(5,202
|
)
|
$
|
26,489
|
|||||
|
Less: net income attributable to non-controlling interests
|
$
|
9,412
|
$
|
(3,538
|
)
|
$
|
5,874
|
|||||
|
Net income attributable to USPH shareholders
|
$
|
22,279
|
$
|
(1,664
|
)
|
$
|
20,615
|
|||||
|
Earnings per share
|
$
|
1.77
|
$
|
(0.11
|
)
|
$
|
1.66
|
|||||
| (1) |
See above.
|
Consolidated Statement of Net Income for the Year Ended December 31, 2014:
|
Description
|
As Reported
|
Adjustment
|
As Restated
|
|||||||||
|
Interest expense
|
||||||||||||
|
MRNCI (1) – change in redemption value
|
-
|
$
|
2,978
|
$
|
2,978
|
|||||||
|
MRNCI (1) – earnings allocable
|
-
|
$
|
3,388
|
$
|
3,388
|
|||||||
|
Total interest expense
|
$
|
1,088
|
$
|
6,366
|
$
|
7,454
|
||||||
|
Net income before taxes
|
$
|
44,698
|
$
|
(6,366
|
)
|
$
|
38,332
|
|||||
|
Provision for income taxes
|
$
|
14,274
|
$
|
(1,256
|
)
|
$
|
13,018
|
|||||
|
Net income
|
$
|
30,424
|
$
|
(5,110
|
)
|
$
|
25,314
|
|||||
|
Less: net income attributable to non-controlling interests
|
$
|
9,571
|
$
|
(3,388
|
)
|
$
|
6,183
|
|||||
|
Net income attributable to USPH shareholders
|
$
|
20,853
|
$
|
(1,722
|
)
|
$
|
19,131
|
|||||
|
Earnings per share
|
$
|
1.62
|
$
|
(0.05
|
)
|
$
|
1.57
|
|||||
| (1) |
See above.
|
The following schedules present the impact of this correction on the Company’s previously reported consolidated statements of cash flows for the years ended December 31, 2015 and 2014:
Consolidated Statement of Cash Flows for the Year Ended December 31, 2015:
|
Description
|
As Reported
|
Adjustment
|
As Restated
|
|||||||||
|
Net income
|
$
|
31,691
|
$
|
(5,202
|
)
|
$
|
26,489
|
|||||
|
Deferred taxes
|
$
|
7,001
|
$
|
(1,048
|
)
|
$
|
5,953
|
|||||
|
(Increase) decrease in other assets
|
$
|
(1,477
|
)
|
$
|
102
|
$
|
(1,375
|
)
|
||||
|
(Decrease) increase in accounts payable and accrued expenses
|
$
|
(7,013
|
)
|
$
|
2
|
$
|
(7,011
|
)
|
||||
|
Increase in mandatorily redeemable non-controlling interest
|
$
|
-
|
$
|
2,509
|
$
|
2,509
|
||||||
|
(Decrease) increase in other liabilities
|
$
|
1,482
|
$
|
(86
|
)
|
$
|
1,396
|
|||||
|
Net cash provided by operating activities
|
$
|
41,243
|
$
|
(3,723
|
)
|
$
|
37,520
|
|||||
|
Acquisitions of non-controlling interests
|
$
|
(7,083
|
)
|
$
|
6,115
|
$
|
(968
|
)
|
||||
|
Net cash used in investing activities
|
$
|
(32,240
|
)
|
$
|
6,115
|
$
|
(26,125
|
)
|
||||
|
Distributions to non-controlling interests (including redeemable non-controlling interests)
|
$
|
(9,632
|
)
|
$
|
9,632
|
$
|
-
|
|||||
|
Distributions to non-controlling interests
|
$
|
-
|
$
|
(5,892
|
)
|
$
|
(5,892
|
) | ||||
|
Payments to settle mandatorily redeemable non-controlling interests
|
$
|
-
|
$
|
(6,115
|
)
|
$
|
(6,115
|
)
|
||||
|
Other
|
$
|
22
|
$
|
(17
|
)
|
$
|
5
|
|||||
|
Net cash used in financing activities
|
$
|
(7,496
|
)
|
$
|
(2,392
|
)
|
$
|
(9,888
|
)
|
|||
Consolidated Statement of Cash Flows for the Year Ended December 31, 2014:
|
Description
|
As Reported
|
Adjustment
|
As Restated
|
|||||||||
|
Net income
|
$
|
30,424
|
$
|
(5,110
|
)
|
$
|
25,314
|
|||||
|
Deferred taxes
|
$
|
6,275
|
$
|
(1,169
|
)
|
$
|
5,106
|
|||||
|
(Increase) decrease in other assets
|
$
|
(2,493
|
)
|
$
|
3,648
|
$
|
1,155
|
|||||
|
Increase in mandatorily redeemable non-controlling interest
|
$
|
-
|
$
|
2,936
|
$
|
2,936
|
||||||
|
(Decrease) increase in other liabilities
|
$
|
730
|
$
|
(4,108
|
)
|
$
|
(3,378
|
)
|
||||
|
Net cash provided by operating activities
|
$
|
45,194
|
$
|
(3,803
|
)
|
$
|
41,391
|
|||||
|
Acquisitions of non-controlling interests
|
$
|
(5,490
|
)
|
$
|
5,263
|
$
|
(227
|
)
|
||||
|
Net cash used in investing activities
|
$
|
(22,880
|
)
|
$
|
5,263
|
$
|
(17,617
|
)
|
||||
|
Distributions to non-controlling interests (including redeemable non-controlling interests)
|
$
|
(9,913
|
)
|
$
|
9,913
|
$
|
-
|
|||||
|
Distributions to non-controlling interests
|
$
|
-
|
$
|
(5,963
|
)
|
$
|
(5,963
|
) | ||||
|
Payments to settle mandatorily redeemable non-controlling interests
|
$
|
-
|
$
|
(5,233
|
)
|
$
|
(5,233
|
)
|
||||
|
Other
|
$
|
222
|
$
|
(177
|
)
|
$
|
45
|
|||||
|
Net cash used in financing activities
|
$
|
(20,941
|
)
|
$
|
(1,460
|
)
|
$
|
(22,401
|
)
|
|||
2. Significant Accounting Policies
Cash Equivalents
The Company maintains its cash and cash equivalents at financial institutions. The combined account balances at several institutions typically exceed Federal Deposit Insurance Corporation (“FDIC”) insurance coverage and, as a result, there is a concentration of credit risk related to amounts on deposit in excess of FDIC insurance coverage. Management believes that this risk is not significant.
Long-Lived Assets
Fixed assets are stated at cost. Depreciation is computed on the straight-line method over the estimated useful lives of the related assets. Estimated useful lives for furniture and equipment range from three to eight years and for software purchased from three to seven years. Leasehold improvements are amortized over the shorter of the related lease term or estimated useful lives of the assets, which is generally three to five years.
Impairment of Long-Lived Assets and Long-Lived Assets to Be Disposed Of
The Company reviews property and equipment and intangible assets with finite lives for impairment upon the occurrence of certain events or circumstances that indicate the related amounts may be impaired. Assets to be disposed of are reported at the lower of the carrying amount or fair value less costs to sell.
Goodwill
Goodwill represents the excess of the amount paid and fair value of the non-controlling interests over the fair value of the acquired business assets, which include certain identifiable intangible assets. Historically, goodwill has been derived from acquisitions and, prior to 2009, from the purchase of some or all of a particular local management’s equity interest in an existing clinic. Effective January 1, 2009, if the purchase price of a non-controlling interest by the Company exceeds or is less than the book value at the time of purchase, any excess or shortfall is recognized as an adjustment to additional paid-in capital.
The fair value of goodwill and other identifiable intangible assets with indefinite lives are tested for impairment annually and upon the occurrence of certain events, and are written down to fair value if considered impaired. The Company evaluates goodwill for impairment on at least an annual basis (in its third quarter) by comparing the fair value of its reporting units to the carrying value of each reporting unit including related goodwill. The Company operates a one segment business which is made up of various clinics within partnerships. The partnerships are components of regions and are aggregated to the operating segment level for the purpose of determining the Company’s reporting units when performing its annual goodwill impairment test. In 2016, 2015 and 2014, there were six regions.
An impairment loss generally would be recognized when the carrying amount of the net assets of a reporting unit, inclusive of goodwill and other identifiable intangible assets, exceeds the estimated fair value of the reporting unit. The estimated fair value of a reporting unit is determined using two factors: (i) earnings prior to taxes, depreciation and amortization for the reporting unit multiplied by a price/earnings ratio used in the industry and (ii) a discounted cash flow analysis. A weight is assigned to each factor and the sum of each weight times the factor is considered the estimated fair value. For 2016, the factors (i.e., price/earnings ratio, discount rate and residual capitalization rate) were updated to reflect current market conditions. The evaluation of goodwill in 2016, 2015 and 2014 did not result in any goodwill amounts that were deemed impaired.
The Company has not identified any triggering events occurring after the testing date that would impact the impairment testing results obtained. Factors which could result in future impairment charges include but are not limited to:
|
•
|
cost, risks and uncertainties associated with the Company’s recent restatement of its prior financial statements due to the correction of its accounting methodology for redeemable non-controlling partnership interests, and including any pending and future claims or proceedings relating to such matters;
|
| • |
changes as the result of government enacted national healthcare reform;
|
| • |
changes in Medicare rules and guidelines and reimbursement or failure of our clinics to maintain their Medicare certification or enrollment status;
|
| • |
revenue we receive from Medicare and Medicaid being subject to potential retroactive reduction;
|
| • |
business and regulatory conditions including federal and state regulation;
|
| • |
governmental and other third party payor inspections, reviews, investigations and audits;
|
| • |
compliance with federal and state laws and regulations relating to the privacy of individually identifiable patient information and associated fines and penalties for failure to comply;
|
| • |
legal actions, which could subject us to increased operating costs and uninsured liabilities;
|
| • |
changes in reimbursement rates or payment methods from third party payors including government agencies and deductibles and co-pays owed by patients;
|
| • |
revenue and earnings expectations;
|
| • |
general economic conditions;
|
| • |
availability and cost of qualified physical and occupational therapists;
|
| • |
personnel productivity and retaining key personnel;
|
| • |
competitive, economic or reimbursement conditions in our markets which may require us to reorganize or close certain operations and thereby incur losses and/or closure costs including the possible write-down or write-off of goodwill and other intangible assets;
|
| • |
acquisitions, purchases of non-controlling interests (minority interests) and the successful integration of the operations of the acquired business;
|
| • |
maintaining necessary insurance coverage;
|
| • |
availability, terms, and use of capital; and
|
| • |
weather and other seasonal factors.
|
The Company will continue to monitor for any triggering events or other indicators of impairment.
Mandatorily Redeemable Non-Controlling Interests –
The non-controlling interests that are reflected as mandatorily redeemable non-controlling interests in the consolidated financial statements consist of those owners who have certain redemption rights, whether currently exercisable or not, and which currently, or in the future, require that the Company purchase the non-controlling interest of those owners at a predetermined formula based on a multiple of trailing twelve months earnings performance as defined in the respective limited partnership agreements. The redemption rights are triggered at such time as both of the following events have occurred: 1) termination of the owner’s employment, regardless of the reason for such termination, and 2) the passage of specified number of years after the closing of the transaction, typically three to five years, as defined in the limited partnership agreement.
On the date the Company acquires a controlling interest in a partnership and the limited partnership agreement contains mandatory redemption rights, the fair value of the non-controlling interest is recorded in the long-term liabilities section of the consolidated balance sheet under the caption – Mandatorily redeemable non-controlling interests. Then, in each reporting period thereafter until purchased by the Company, the redeemable non-controlling interest is adjusted to its then current redemption value, based on the predetermined formula defined in the respective partnership agreement. The Company reflects any adjustment in the redemption value and any earnings attributable to the mandatorily redeemable non-controlling interest in its consolidated statements of net income by recording the adjustments and earnings to other income and expense in the captions - Interest expense – mandatorily redeemable non-controlling interests – change in redemption value and Interest expense – mandatorily redeemable non-controlling interests – earnings allocable.
Non-Controlling Interests
The Company recognizes non-controlling interests as equity in the consolidated financial statements separate from the parent entity’s equity. The amount of net income attributable to non-controlling interests is included in consolidated net income on the face of the statements of net income. Changes in a parent entity’s ownership interest in a subsidiary that do not result in deconsolidation are treated as equity transactions if the parent entity retains its controlling financial interest. The Company recognizes a gain or loss in net income when a subsidiary is deconsolidated. Such gain or loss is measured using the fair value of the non-controlling equity investment on the deconsolidation date.
When the purchase price of a non-controlling interest by the Company exceeds the book value at the time of purchase, any excess or shortfall is recognized as an adjustment to additional paid-in capital. Additionally, operating losses are allocated to non-controlling interests even when such allocation creates a deficit balance for the non-controlling interest partner.
Revenue Recognition
Revenues are recognized in the period in which services are rendered. Net patient revenues (patient revenues less estimated contractual adjustments) are reported at the estimated net realizable amounts from third-party payors, patients and others for services rendered. The Company has agreements with third-party payors that provide for payments to the Company at amounts different from its established rates. The allowance for estimated contractual adjustments is based on terms of payor contracts and historical collection and write-off experience.
The Company determines allowances for doubtful accounts based on the specific agings and payor classifications at each clinic. The provision for doubtful accounts is included in clinic operating costs in the statements of net income. Patient accounts receivable, which are stated at the historical carrying amount net of contractual allowances, write-offs and allowance for doubtful accounts, includes only those amounts the Company estimates to be collectible.
Medicare Reimbursement
The Medicare program reimburses outpatient rehabilitation providers based on the Medicare Physician Fee Schedule (‘‘MPFS’’). The MPFS rates have historically been subject to an automatic annual update based on a formula, called the sustainable growth rate (‘‘SGR’’) formula. The use of the SGR formula would have resulted in calculated automatic reductions in rates in every year since 2002; however, for each year through September 30, 2015, Centers for Medicare & Medicaid Services (‘‘CMS’’) or Congress has taken action to prevent the implementation of SGR formula reductions. On April 16, 2015, the Medicare Access and CHIP Reauthorization Act of 2015 (‘‘MACRA’’) was signed into law, eliminating the SGR formula and the associated annual automatic rate reductions. For services provided between January 1, 2015 and June 30, 2015 a 0% payment update was applied to the Medicare physician fee schedule payment rates; for services provided between July 1, 2015 and December 31, 2015 a 0.5% increase was applied to the fee schedule payment rates; for services provided in 2016 a 0.3% decrease is being applied to the fee schedule payment rates, and for 2017 through 2019, a 0.5% increase will be applied each year to the fee schedule payment rates, unless further adjusted by CMS. The payment adjustments proposed by CMS for 2017 is a .08% reduction. In addition, the MACRA promotes the development of new payment models that focus on quality and outcomes.
The Budget Control Act of 2011 increased the federal debt ceiling in connection with deficit reductions over the next ten years, and requires automatic reductions in federal spending by approximately $1.2 trillion. Payments to Medicare providers are subject to these automatic spending reductions, subject to a 2% cap. On April 1, 2013, a 2% reduction to Medicare payments was implemented. The Bipartisan Budget Act of 2015, enacted on November 2, 2015, extends the 2% reductions to Medicare payments through fiscal year 2025.
As a result of the Balanced Budget Act of 1997, the formula for determining the total amount paid by Medicare in any one year for outpatient physical therapy, occupational therapy, and/or speech-language pathology services provided to any Medicare beneficiary (i.e., the ‘‘Therapy Cap’’ or ‘‘Limit’’) was established. Based on the statutory definitions which constrained how the Therapy Cap would be applied, there is one Limit for Physical Therapy and Speech Language Pathology Services combined, and one Limit for Occupational Therapy. For 2016, the annual Limit on outpatient therapy services is $1,960 for Physical and Speech Language Pathology Services combined and $1,960 for Occupational Therapy Services. Historically, these Therapy Caps applied to outpatient therapy services provided in all settings, except for services provided in departments of hospitals. However, the Protecting Access to Medicare Act of 2014, and prior legislation, extended the Therapy Caps to services furnished in hospital outpatient department settings. The application of these annual limits to hospital outpatient department settings will sunset on December 31, 2017 unless Congress extends it.
In the Deficit Reduction Act of 2005, Congress implemented an exceptions process to the annual Limit for therapy expenses for therapy services above the annual Limit. Therapy services above the annual Limit that are medically necessary satisfy an exception to the annual Limit and such claims are payable by the Medicare program. The MACRA extended the exceptions process for outpatient therapy caps through December 31, 2017. Unless Congress extends the exceptions process further, the therapy caps will apply to all outpatient therapy services beginning January 1, 2018, except those services furnished and billed by outpatient hospital departments. For any claim above the annual Limit, the claim must contain a modifier indicating that the services are medically necessary and justified by appropriate documentation in the medical record.
Furthermore, under the Middle Class Tax Relief and Job Creation Act of 2012 (‘‘MCTRA’’), since October 1, 2012, patients who met or exceeded $3,700 in therapy expenditures during a calendar year have been subject to a manual medical review to determine whether applicable payment criteria are satisfied. The $3,700 threshold is applied to Physical Therapy and Speech Language Pathology Services; a separate $3,700 threshold is applied to the Occupational Therapy. The MACRA directed CMS to modify the manual medical review process such that those reviews will no longer apply to all claims exceeding the $3,700 threshold and instead will be determined on a targeted basis based on a variety of factors that CMS considers appropriate. The new factors apply to exception requests for which CMS did not conduct a medical review by July 15, 2015.
CMS adopted a multiple procedure payment reduction (‘‘MPPR’’) for therapy services in the final update to the MPFS for calendar year 2011. The MPPR applied to all outpatient therapy services paid under Medicare Part B — occupational therapy, physical therapy and speech-language pathology. Under the policy, the Medicare program pays 100% of the practice expense component of the Relative Value Unit (‘‘RVU’’) for the therapy procedure with the highest practice expense RVU, then reduces the payment for the practice expense component for the second and subsequent therapy procedures or units of service furnished during the same day for the same patient, regardless of whether those therapy services are furnished in separate sessions. Since 2013, the practice expense component for the second and subsequent therapy service furnished during the same day for the same patient was reduced by 50%. In addition, the MCTRA directed CMS to implement a claims-based data collection program to gather additional data on patient function during the course of therapy in order to better understand patient conditions and outcomes. All practice settings that provide outpatient therapy services are required to include this data on the claim form. Since 2013, therapists have been required to report new codes and modifiers on the claim form that reflect a patient’s functional limitations and goals at initial evaluation, periodically throughout care, and at discharge, CMS has rejected claims if the required data is not included in the claim.
The Physician Quality Reporting System, or ‘‘PQRS,’’ is a CMS reporting program that uses a combination of incentive payments and payment reductions to promote reporting of quality information by ‘‘eligible professionals.’’ Although physical therapists, occupational therapists and qualified speech-language therapists are generally able to participate in the PQRS program, therapy professionals for whose services we bill through our certified rehabilitation agencies cannot participate because the Medicare claims processing systems currently cannot accommodate institutional providers such as certified rehabilitation agencies. Eligible professionals, such as those of our therapy professionals for whose services we bill using their individual Medicare provider numbers, who do not satisfactorily report data on quality measures will be subject to a 2% reduction in their Medicare payment in 2016 and 2017. As required under the MACRA, the PQRS program will be replaced with the Merit-Based Incentive Payment System (MIPS) on January 1, 2017. Physical therapists and occupational therapists are not required to participate in the MIPS program until January 1, 2019 or later, as determined by CMS.
Statutes, regulations, and payment rules governing the delivery of therapy services to Medicare beneficiaries are complex and subject to interpretation. The Company believes that it is in compliance in all material respects with all applicable laws and regulations and is not aware of any pending or threatened investigations involving allegations of potential wrongdoing that would have a material effect on the Company’s financial statements as of September 30, 2016. Compliance with such laws and regulations can be subject to future government review and interpretation, as well as significant regulatory action including fines, penalties, and exclusion from the Medicare program. For the year ended December 31, 2016, net revenue from Medicare accounts for approximately $81.8 million.
Management Contract Revenues
Management contract revenues are derived from contractual arrangements whereby the Company manages a clinic for third party owners. The Company does not have any ownership interest in these clinics. Typically, revenues are determined based on the number of visits conducted at the clinic and recognized when services are performed. Costs, typically salaries for the Company’s employees, are recorded when incurred. Management contract revenues are included in “other revenues” in the accompanying Consolidated Statements of Net Income.
Contractual Allowances
Contractual allowances result from the differences between the rates charged for services performed and expected reimbursements by both insurance companies and government sponsored healthcare programs for such services. Medicare regulations and the various third party payors and managed care contracts are often complex and may include multiple reimbursement mechanisms payable for the services provided in Company clinics. The Company estimates contractual allowances based on its interpretation of the applicable regulations, payor contracts and historical calculations. Each month the Company estimates its contractual allowance for each clinic based on payor contracts and the historical collection experience of the clinic and applies an appropriate contractual allowance reserve percentage to the gross accounts receivable balances for each payor of the clinic. Based on the Company’s historical experience, calculating the contractual allowance reserve percentage at the payor level is sufficient to allow the Company to provide the necessary detail and accuracy with its collectability estimates. However, the services authorized and provided and related reimbursement are subject to interpretation that could result in payments that differ from the Company’s estimates. Payor terms are periodically revised necessitating continual review and assessment of the estimates made by management. The Company’s billing system does not capture the exact change in its contractual allowance reserve estimate from period to period in order to assess the accuracy of its revenues and hence its contractual allowance reserves. Management regularly compares its cash collections to corresponding net revenues measured both in the aggregate and on a clinic-by-clinic basis. In the aggregate, historically the difference between net revenues and corresponding cash collections has generally reflected a difference within approximately 1% of net revenues. Additionally, analysis of subsequent period’s contractual write-offs on a payor basis reflects a difference within approximately 1% between the actual aggregate contractual reserve percentage as compared to the estimated contractual allowance reserve percentage associated with the same period end balance. As a result, the Company believes that a change in the contractual allowance reserve estimate would not likely be more than 1% at December 31, 2016.
Income Taxes
Income taxes are accounted for under the asset and liability method. Deferred tax assets and liabilities are recognized for the future tax consequences attributable to differences between the financial statement carrying amounts of existing assets and liabilities and their respective tax bases and operating loss and tax credit carryforwards. Deferred tax assets and liabilities are measured using enacted tax rates expected to apply to taxable income in the years in which those temporary differences are expected to be recovered or settled. The effect on deferred tax assets and liabilities of a change in tax rates is recognized in income in the period that includes the enactment date.
The Company recognizes the financial statement benefit of a tax position only after determining that the relevant tax authority would more likely than not sustain the position following an audit. For tax positions meeting the more-likely-than-not threshold, the amount to be recognized in the financial statements is the largest benefit that has a greater than 50 percent likelihood of being realized upon ultimate settlement with the relevant tax authority.
The Company did not have any accrued interest or penalties associated with any unrecognized tax benefits nor was any interest expense recognized during the twelve months ended December 31, 2016 and 2015. The Company will book any interest or penalties, if required, in interest and/or other income/expense as appropriate.
On September 13, 2013, the U.S. Treasury Department and the I.R.S. issued final regulations that address costs incurred in acquiring, producing, or improving tangible property (the “Tangible Property Regulations”). The Tangible Property Regulations are generally effective for tax years beginning on or after January 1, 2014, and may be adopted in earlier years. The Company adopted the tax treatment of expenditures to improve tangible property and the capitalization of inherently facilitative costs to acquire tangible property as of January 1, 2014. Historically, the Company has treated the expenditures to improve tangible property and the capitalization of inherently facilitative costs to acquire tangible property similar for tax and book. The impact of these changes were not material to the Company's consolidated financial statements.
Fair Values of Financial Instruments
The carrying amounts reported in the balance sheets for cash and cash equivalents, accounts receivable, accounts payable and notes payable approximate their fair values due to the short-term maturity of these financial instruments. The carrying amount under the Amended Credit Agreement (as defined in Note 9) approximates its fair value. The interest rate on the Credit Agreement, which is tied to the Eurodollar Rate, is set at various short-term intervals, as detailed in the Credit Agreement.
Segment Reporting
Operating segments are components of an enterprise for which separate financial information is available that is evaluated regularly by chief operating decision makers in deciding how to allocate resources and in assessing performance. The Company identifies operating segments based on management responsibility and believes it meets the criteria for aggregating its operating segments into a single reporting segment.
Use of Estimates
In preparing the Company’s consolidated financial statements, management makes certain estimates and assumptions, especially in relation to, but not limited to, goodwill impairment, allowance for receivables, tax provision and contractual allowances, that affect the amounts reported in the consolidated financial statements and related disclosures. Actual results may differ from these estimates.
Self-Insurance Program
The Company utilizes a self-insurance plan for its employee group health insurance coverage administered by a third party. Predetermined loss limits have been arranged with the insurance company to minimize the Company’s maximum liability and cash outlay. Accrued expenses include the estimated incurred but unreported costs to settle unpaid claims and estimated future claims. Management believes that the current accrued amounts are sufficient to pay claims arising from self-insurance claims incurred through December 31, 2016.
Restricted Stock
Restricted stock issued to employees and directors is subject to continued employment or continued service on the board, respectively. Generally, restrictions on the stock granted to employees lapse in equal annual installments on the following four anniversaries of the date of grant. For those shares granted to directors, the restrictions will lapse in equal quarterly installments during the first year after the date of grant. For those granted to executive officers, the restriction will lapse in equal quarterly installments during the four years following the date of grant. Compensation expense for grants of restricted stock is recognized based on the fair value per share on the date of grant amortized over the vesting period. The restricted stock issued is included in basic and diluted shares for the earnings per share computation.
Recently Adopted Accounting Guidance
In September 2015, the FASB issued changes to the accounting for measurement-period adjustments related to business combinations. Currently, an acquiring entity is required to retrospectively adjust the balance sheet amounts of the acquiree recognized at the acquisition date with a corresponding adjustment to goodwill during the measurement period, as well as revise comparative information for prior periods presented within financial statements as needed, including revising income effects, such as depreciation and amortization, as a result of changes made to the balance sheet amounts of the acquiree. Such adjustments are required when new information is obtained about facts and circumstances that existed as of the acquisition date that if known, would have affected the measurement of the amounts initially recognized or would have resulted in the recognition of additional assets or liabilities. The measurement period is the period after the acquisition date during which the acquirer may adjust the balance sheet amounts recognized for a business combination (generally up to one year from the date of acquisition). The changes eliminate the requirement to make such retrospective adjustments, and, instead require the acquiring entity to record these adjustments in the reporting period they are determined. Additionally, the changes require the acquiring entity to present separately on the face of the income statement or disclose in the notes to the financial statements the portion of the amount recorded in current-period income by line item that would have been recorded in previous reporting periods if the adjustment to the balance sheet amounts had been recognized as of the acquisition date. These changes became effective for the Company on January 1, 2016. This change did not have a material impact on its consolidated financial statements.
In March 2016, the FASB issued guidance to simplify some provisions in stock compensation accounting. The guidance amends how excess tax benefits and a company’s payments to cover tax bills for the recipients’ shares should be classified. Prior to this guidance, excess tax benefits were recorded in additional paid-in capital, but will now become a component of the income tax provision/benefit in the period in which they occur. This guidance allows companies to estimate the number of stock awards expected to vest and revises the withholding requirements for classifying stock awards as equity. For public business entities, this guidance is effective for fiscal years starting after December 15, 2016, including interim periods within those fiscal years but early adoption is allowed. The Company adopted this accounting treatment in the fourth quarter of 2016. The adoption increased earnings, by decreasing the tax provision, by $1.0 million, or $0.09 per share, for the full fiscal year 2016. The election to record forfeitures in the period they occur is consistent with the Company’s past approach, due to the immateriality of past forfeitures, and the Company believes the effect to be immaterial on the consolidated financial statements.
Recently Issued Accounting Guidance
In February 2016, the FASB issued amended accounting guidance which replaced most existing lease accounting guidance under U. S. generally accepted accounting principles. Among other changes, the amended guidance requires that a right-to-use asset, which is an asset that represents the lessee’s right to use, and a lease liability, which is a lessee’s obligation to make lease payments arising for a lease measured on a discounted basis, be recognized on the balance sheet by lessees for those leases with a term of greater than 12 months. The amended guidance is effective for reporting periods beginning after December 15, 2018; however, early adoption is permitted. Entities are required to use a modified retrospective approach for leases that exist or are entered into after the beginning of the earliest comparative period in the financial statements. Since the Company leases all but one of its clinic facilities, it has been evaluating various lease management systems to capture the necessary information and the impact that this amended accounting guidance will have on its consolidated financial statements.
Subsequent Event
The Company has evaluated events occurring after the balance sheet date for possible disclosure as a subsequent event through the date that these consolidated financial statements were issued. In January 2017, the Company acquired a 70% interest in a physical therapy practice that owns and operates 17 clinics and manages an additional 8 clinics. The purchase price for the 70% interest was $11.4 million. In March 2017, the Company acquired a 55% interest in a company which is a provider of workforce performance solutions. The purchase price for the 55% interest was $6.6 million. In May 2017, the Company acquired a 70% interest in a physical therapy practice that owns and operates 4 clinics. The purchase price for the 70% interest was $2.5 million.
Although the restatement of prior financial statements caused the Company to be in violation of our Amended Credit Agreement dated December 5, 2013, the Company was able to obtain necessary waivers and amendments, as applicable. On March 30, 2017, the Company entered into a Third Amendment to Amended and Restated Credit Agreement and Limited Waiver with its lenders. As of the date of this report, the Company is in compliance with the covenants in the Amended and Restated Credit Agreement.
3. Acquisitions of Businesses
During 2016, 2015 and 2014, the Company completed the following multi-clinic acquisitions of physical therapy practices:
|
|
Date |
% Interest Acquired
|
Number of Clinics
|
|||||||
|
|
2016 | |||||||||
|
February 2016 Acquisition
|
February 29
|
55
|
%
|
8
|
||||||
|
November 2016 Acquisition
|
November 30
|
60
|
%
|
12
|
||||||
|
2015
|
||||||||||
|
January 2015 Acquisition
|
January 31
|
60
|
%
|
9
|
||||||
|
April 2015 Acquisition
|
April 30
|
70
|
%
|
3
|
||||||
|
June 2015 Acquisition
|
June 30
|
70
|
%
|
4
|
||||||
|
December 2015 Acquisition
|
December 31
|
59
|
%
|
4
|
||||||
|
|
2014 | |||||||||
|
April 2014 Acquisition
|
April 30
|
70
|
%
|
13
|
||||||
|
August 2014 Acquisition
|
August 1
|
100
|
%
|
3
|
||||||
In addition to the multi-clinic acquisitions, the Company acquired two single clinic practices in separate transactions during 2016. During 2015, the Company acquired a 60% interest in a single clinic practice and, during 2014, the Company acquired four individual clinics in separate transactions.
On November 30, 2016, the Company acquired a 60% interest in a 12 clinic physical therapy practice. The purchase price for the 60% interest was $11.0 million in cash and $0.5 million in a seller note that is payable in two principal installments of $250,000 each, plus accrued interest, in November 2017 and 2018. On February 29, 2016, the Company acquired a 55% interest in an eight-clinic physical therapy practice. The purchase price for the 55% interest was $13.2 million in cash and $0.5 million in a seller note that is payable in two principal installments of $250,000 each, plus accrued interest, in February 2017 and 2018. During 2016, two subsidiaries of the Company each acquired a single clinic therapy practice for an aggregate purchase price of $75,000.
The purchase price for the 2016 acquisitions has been preliminarily allocated as follows (in thousands):
|
Cash paid, net of cash acquired
|
$
|
23,623
|
||
|
Seller notes
|
1,000
|
|||
|
Total consideration
|
$
|
24,623
|
||
|
Estimated fair value of net tangible assets acquired:
|
||||
|
Total current assets
|
$
|
1,712
|
||
|
Total non-current assets
|
1,202
|
|||
|
Total liabilities
|
(398
|
)
|
||
|
Net tangible assets acquired
|
$
|
2,516
|
||
|
Referral relationships
|
4,919
|
|||
|
Non-compete
|
847
|
|||
|
Tradename
|
3,802
|
|||
|
Goodwill
|
31,419
|
|||
|
Fair value of non-controlling interest
|
(18,880
|
)
|
||
|
$
|
24,623
|
On December 31, 2015, the Company acquired a 59% interest in a four-clinic physical therapy practice. The purchase price was $4.6 million in cash and $400,000 in seller notes payable that were payable in two principal installments of an aggregate of $200,000 each, plus accrued interest. The first payment was paid in December 2016 and the second installment is due December 2017. On June 30, 2015, the Company acquired a 70% interest in a four-clinic physical therapy practice. The purchase price was $3.6 million in cash and $0.7 million in seller notes that are payable plus accrued interest, in June 2018. On April 30, 2015, the Company acquired a 70% interest in a three-clinic physical therapy practice. The purchase price was $4.7 million in cash and $150,000 in a seller note that was payable in two principal installments of $75,000 each, plus accrued interest. The first payment was paid in April 2016 and the second installment is due in April 2017. On January 31, 2015, the Company acquired a 60% interest in a nine-clinic physical therapy practice.
The purchase price for the 60% interest was $6.7 million in cash and $0.5 million in a seller note that is payable in two principal installments of $250,000 each, plus accrued interest. This note was paid in full in January 2017. In addition to the multi-clinic acquisitions, on August 31, 2015, the Company acquired a 60% interest in a single physical therapy clinic for $150,000 in cash and $50,000 in a seller note payable that is payable plus accrued interest was paid in August 2016.
The purchase prices for the 2015 acquisitions have been allocated as follows (in thousands):
|
Cash paid, net of cash acquired
|
$
|
18,965
|
||
|
Seller notes
|
1,800
|
|||
|
Total consideration
|
$
|
20,765
|
||
|
Estimated fair value of net tangible assets acquired:
|
||||
|
Total current assets
|
$
|
1,952
|
||
|
Total non-current assets
|
1,068
|
|||
|
Total liabilities
|
(1,067
|
)
|
||
|
Net tangible assets acquired
|
$
|
1,953
|
||
|
Referral relationships
|
3,655
|
|||
|
Non-compete
|
594
|
|||
|
Tradename
|
3,417
|
|||
|
Goodwill
|
23,437
|
|||
|
Fair value of non-controlling interest
|
(12,291
|
)
|
||
|
$
|
20,765
|
The purchase price for the 70% interest in the April 2014 Acquisition was $10.6 million in cash and a $400,000 seller note, that was paid in two principal installments totaling $200,000 each, plus accrued interest, in April 2015 and 2016. The purchase price for the August 2014 Acquisition was $1.0 million in cash. In addition, during 2014, the Company acquired three individual clinic practices for an aggregate of $595,000.
The purchase prices for the 2014 acquisitions have been allocated as follows (in thousands):
|
Cash paid, net of cash acquired
|
$
|
12,270
|
||
|
Seller notes
|
400
|
|||
|
Total consideration
|
$
|
12,670
|
||
|
Estimated fair value of net tangible assets acquired:
|
||||
|
Total current assets
|
$
|
1,213
|
||
|
Total non-current assets
|
1,051
|
|||
|
Total liabilities
|
(406
|
)
|
||
|
Net tangible assets acquired
|
$
|
1,858
|
||
|
Referral relationships
|
280
|
|||
|
Non-compete
|
330
|
|||
|
Tradename
|
1,600
|
|||
|
Goodwill
|
13,327
|
|||
|
Fair value of non-controlling interest
|
(4,725
|
)
|
||
|
$
|
12,670
|
The purchase prices plus the fair value of the non-controlling interests for the acquisitions in 2015 and 2014 were allocated to the fair value of the assets acquired, inclusive of identifiable intangible assets, i.e. trade names, referral relationships and non-compete agreements, and liabilities assumed based on the fair values at the acquisition date, with the amount exceeding the fair values being recorded as goodwill. For the acquisitions in 2016, the Company is in the process of completing its formal valuation analysis to identify and determine the fair value of tangible and identifiable intangible assets acquired and the liabilities assumed. Thus, the final allocation of the purchase price may differ from the preliminary estimates used at December 31, 2016 based on additional information obtained and completion of the valuation of the identifiable intangible assets. Changes in the estimated valuation of the tangible assets acquired, the completion of the valuation of identifiable intangible assets and the completion by the Company of the identification of any unrecorded pre-acquisition contingencies, where the liability is probable and the amount can be reasonably estimated, will likely result in adjustments to goodwill.
For the acquisitions in 2015 and 2014, the values assigned to the referral relationships and non-compete agreements are being amortized to expense equally over the respective estimated lives. For referral relationships, the range of the estimated lives was 4½ to 13 years, and for non-compete agreements the estimated lives was five to six years. Generally, the values assigned to tradenames are tested annually for impairment, however with regards to one acquisition in 2013, the tradename was being amortized over the term of the six year agreement in which the Company has acquired the rights to use the specific tradename. In 2016, the remaining value of the tradename was charged to earnings as the Company decided to combine two acquired operations in Georgia; therefore, the tradename under this six year agreement will no longer be used. The values assigned to goodwill are tested annually for impairment.
For the 2016, 2015 and 2014 acquisitions, total current assets primarily represent patient accounts receivable. Total non-current assets are fixed assets, primarily equipment, used in the practices.
The consideration paid for each of the acquisitions was derived through arm’s length negotiations. Funding for the cash portions was derived from proceeds from the Company’s revolving credit facility. The results of operations of the acquisitions have been included in the Company’s consolidated financial statements since their respective date of acquisition. Unaudited proforma consolidated financial information for the acquisitions in 2016, 2015 and 2014 acquisitions have not been included as the results, individually and in the aggregate, were not material to current operations.
4. Non-Controlling Interests
During 2016, the Company acquired additional interests in six partnerships included in non-controlling interest.. The interests in the partnerships purchased ranged from 2% to 35%. The aggregate purchase price paid was $0.9 million in cash and $0.4 million in a seller note, that is payable in two principal installments of $194,000 each in February 2017 and 2018. The purchase price included $112,000 of undistributed earnings. The remaining $1.2 million, less future tax benefits of $0.5 million, was recognized as an adjustment to additional paid-in capital.
During 2016, the Company sold a 4% interest in one partnership and 35% in another. The sales prices included aggregate cash of $138,000 plus notes receivable of $148,000 with payments due monthly based on percentages of distributions and bonuses earned by the purchasers. The total sales price of $286,000, less the tax effect of $110,000, was charged to additional paid-in capital.
In 2015, the Company purchased additional interests in six partnerships. The interests in the partnerships purchased ranged from 5% to 35%. The aggregate purchase prices paid were $0.9 million in cash. The purchase prices included an aggregate of $217,000 of undistributed earnings. The remaining $0.7 million, less future tax benefits of $0.3 million, was recognized as an adjustment to additional paid-in capital.
5. Redeemable Non-Controlling Interest
The Company acquires a majority interest (the “Acquisition”) in a physical therapy clinic business (referred to as “Therapy Practice”). These Acquisitions occur in a series of steps which are described below.
| 1. |
Prior to the Acquisition, the Therapy Practice exists as a separate legal entity (the “Seller Entity”). The Seller Entity is owned by one or more individuals (the “Selling Shareholders”) most of whom are physical therapists that work in the Therapy Practice and provide physical therapy services to patients.
|
| 2. |
In conjunction with the Acquisition, the Seller Entity contributes the Therapy Practice into a newly-formed limited partnership (“NewCo”), in exchange for one hundred percent (100%) of the limited and general partnership interests in NewCo. Therefore, in this step, NewCo becomes a wholly-owned subsidiary of the Seller Entity.
|
| 3. |
The Company enters into an agreement (the “Purchase Agreement”) to acquire from the Seller Entity a majority (ranges from 50% to 90%) of the limited partnership interest and in all cases 100% of the general partnership interest in NewCo. The Company does not purchase 100% of the limited partnership interest because the Selling Shareholders, through the Seller Entity, want to maintain an ownership percentage. The consideration for the Acquisition is primarily payable in the form of cash at closing and a small two-year note in lieu of an escrow (the “Purchase Price”). The Purchase Agreement does not contain any future earn-out or other contingent consideration that is payable to the Seller Entity or the Selling Shareholders.
|
| 4. |
The Company and the Seller Entity also execute a partnership agreement (the “Partnership Agreement”) for NewCo that sets forth the rights and obligations of the limited and general partners of NewCo. After the Acquisition, the Company is the general partner of NewCo.
|
| 5. |
As noted above, the Company does not purchase 100% of the limited partnership interests in NewCo and the Seller Entity retains a portion of the limited partnership interest in NewCo (“Seller Entity Interest”).
|
| 6. |
In most cases, some or all of the Selling Shareholders enter into an employment agreement (the “Employment Agreement”) with NewCo with an initial term that ranges from three to five years (the “Employment Term”), with automatic one-year renewals, unless employment is terminated prior to the end of the Employment Term. As a result, a Selling Shareholder becomes an employee (“Employed Selling Shareholder”) of NewCo. The employment of an Employed Selling Shareholder can be terminated by the Employed Selling Shareholder or NewCo, with or without cause, at any time. In a few situations, a Selling Shareholder does not become employed by NewCo and is not involved with NewCo following the closing; in those situations, such Selling Shareholders sell their entire ownership interest in the Seller Entity as of the closing of the Acquisition.
|
| 7. |
The compensation of each Employed Selling Shareholder is specified in the Employment Agreement and is customary and commensurate with his or her responsibilities based on other employees in similar capacities within NewCo, the Company and the industry.
|
| 8. |
The Company and the Selling Shareholder (including both Employed Selling Shareholders and Selling Shareholders not employed by NewCo) execute a non-compete agreement (the “Non-Compete Agreement”) which restricts the Selling Shareholder from engaging in competing business activities for a specified period of time (the “Non-Compete Term”). A Non-Compete Agreement is executed with the Selling Shareholders in all cases. That is, even if the Selling Shareholder does not become an Employed Selling Shareholder, the Selling Shareholder is restricted from engaging in a competing business during the Non-Compete Term.
|
| 9. |
The Non-Compete Term commences as of the date of the Acquisition and expires on the later of :
|
| a. |
Two years after the date an Employed Selling Shareholders’ employment is terminated (if the Selling Shareholder becomes an Employed Selling Shareholder) or
|
| b. |
Five to six years from the date of the Acquisition, as defined in the Non-Compete Agreement, regardless of whether the Selling Shareholder is employed by NewCo.
|
| 10. |
The Non-Compete Agreement applies to a restricted region which is defined as a 15-mile radius from the Therapy Practice. That is, an Employed Selling Shareholder is permitted to engage in competing businesses or activities outside the 15-mile radius (after such Employed Selling Shareholder no longer is employed by NewCo) and a Selling Shareholder who is not employed by NewCo immediately is permitted to engage in the competing business or activities outside the 15-mile radius.
|
| 11. |
The Partnership Agreement contains provisions for the redemption of the Seller Entity Interest, either at the option of the Company (the “Call Option”) or on a required basis (the “Required Redemption”):
|
| a. |
Required Redemption
|
| i. |
Once the Required Redemption is triggered, the Company is obligated to purchase from the Seller Entity and the Seller Entity is obligated to sell to the Company, the allocable portion of the Seller Entity Interest based on the terminated Selling Shareholder’s pro rata ownership interest in the Seller Entity (the “Allocable Portion”). Required Redemption is triggered when both of the following events have occurred:
|
| 1. |
Termination of an Employed Selling Shareholder’s employment with NewCo, regardless of the reason for such termination, and
|
| 2. |
The expiration of an agreed upon period of time, typically three to five years, as set forth in the relevant Partnership Agreement (the “Holding Period”).
|
| ii. |
In the event an Employed Selling Shareholder’s employment terminates prior to the expiration of the Holding Period, the Required Redemption would occur only upon expiration of the Holding Period.
|
| b. |
Call Option
|
| i. |
In the event that an Employed Selling Shareholder’s employment terminates prior to expiration of the Holding Period, the Company has the contractual right, but not the obligation, to acquire the Employed Selling Shareholder’s Allocable Portion of the Seller Entity Interest from the Seller Entity through exercise of the Call Option.
|
| c. |
For the Required Redemption and the Call Option, the purchase price is derived from a formula based on a specified multiple of NewCo’s trailing twelve months of earnings before interest, taxes, depreciation, amortization, and the Company’s internal management fee, plus an Allocable Portion of any undistributed earnings of NewCo (the “Redemption Amount”). NewCo’s earnings are distributed monthly based on available cash within NewCo; therefore the undistributed earnings amount is small, if any.
|
| d. |
The Purchase Price for the initial equity interest purchased by the Company is also based on the same specified multiple of the trailing twelve-month earnings that is used in the Required Redemption noted above.
|
| e. |
Although, the Required Redemption and the Call Option do not have an expiration date, the Seller Entity Interest eventually will be purchased by the Company.
|
| f. |
The Required Redemption and the Call Option never apply to Selling Shareholders who do not become employed by NewCo, since the Company requires that such Selling Shareholders sell their entire ownership interest in the Seller Entity at the closing of the Acquisition.
|
| 12. |
An Employed Selling Shareholder’s ownership of his or her equity interest in the Seller Entity predates the Acquisition and the Company’s purchase of its partnership interest in NewCo. The Employment Agreement and the Non-Compete Agreement do not contain any provision to escrow or “claw back” the equity interest in the Seller Entity held by such Employed Selling Shareholder, nor the Seller Entity Interest in NewCo, in the event of a breach of the employment or non-compete terms. More specifically, even if the Employed Selling Shareholder is terminated for “cause” by NewCo, such Employed Selling Shareholder does not forfeit his or her right to his or her full equity interest in the Seller Entity and the Seller Entity does not forfeit its right to any portion of the Seller Entity Interest. The Company’s only recourse against the Employed Selling Shareholder for breach of either the Employment Agreement or the Non-Compete Agreement is to seek damages and other legal remedies under such agreements. There are no conditions in any of the arrangements with an Employed Selling Shareholder that would result in a forfeiture of the equity interest held in the Seller Entity or of the Seller Entity Interest.
|
The following table details the changes in the carrying amount of the mandatorily redeemable non-controlling interests (in thousands):
|
Year Ended
December 31, 2016 |
Year Ended
December 31, 2015 |
|||||||
|
(as restated)
|
||||||||
|
Beginning balance, as restated
|
$
|
45,974
|
$
|
40,365
|
||||
|
Operating results allocated to mandatorily redeemable non-controlling interest partners
|
4,057
|
3,538
|
||||||
|
Distributions to mandatorily redeemable non-controlling interest partners
|
(4,628
|
)
|
(3,740
|
)
|
||||
|
Changes in the redemption value of mandatorily redeemable non-controlling interest
|
6,169
|
2,670
|
||||||
|
Payments for settlement of mandatorily redeemable non-controlling interest
|
(1,262
|
)
|
(9,192
|
)
|
||||
|
Purchases of businesses - initial liability related to mandatorily redeemable non-controlling interests
|
18,880
|
12,291
|
||||||
|
Other
|
-
|
42
|
||||||
|
Ending balance
|
$
|
69,190
|
$
|
45,974
|
||||
In 2016, as part of the acquisition of a non-controlling interest (classified as mandatorily redeemable non-controlling interests), the Company entered into $0.1 million note payable that is due and payable, with any accrued interest, in January 2018. In 2015, as part of the acquisition of a non-controlling interest (classified as mandatorily redeemable non-controlling interests), the Company entered into several notes payable aggregating $3.1 million. The notes are each payable in two installments plus accrued interest (interest accrues at 3.25%). The first principal installment in an aggregate of $1.2 million is due on December 31, 2018 and the second principal installment in an aggregate of $1.9 million is due on January 31, 2019.
The following table details the carrying amount of the mandatorily redeemable non-controlling interests (in thousands):
|
Year Ended
December 31, 2016 |
Year Ended
December 31, 2015 |
|||||||
|
(as restated)
|
||||||||
|
Contractual time period has lapsed but holder's employment has not been terminated
|
$
|
24,700
|
$
|
19,969
|
||||
|
Contractual time period has not lapsed and holder's employment has not been terminated
|
46,949
|
27,893
|
||||||
|
Holder's employment has terminated and contractual time period has expired
|
-
|
-
|
||||||
|
Holder's employment has terminated and contractual time period has not expired
|
-
|
-
|
||||||
|
Redemption value prior to excess distributed earnings
|
$
|
71,649
|
$
|
47,862
|
||||
|
Excess distributions over earnings and losses
|
(2,459
|
)
|
(1,888
|
)
|
||||
|
$
|
69,190
|
$
|
45,974
|
|||||
6. Goodwill
The changes in the carrying amount of goodwill as of December 31, 2016 and 2015 consisted of the following (in thousands):
|
Year Ended
December 31, 2016
|
Year Ended
December 31, 2015
|
|||||||
|
(as restated)
|
||||||||
|
Beginning balance, as restated
|
$
|
195,373
|
$
|
171,740
|
||||
|
Goodwill acquired during the period
|
31,419
|
23,437
|
||||||
|
Goodwill adjustments for purchase price allocation of business acquired
|
14
|
376
|
||||||
|
Goodwill written-off - closed clinics
|
-
|
(180
|
)
|
|||||
|
Ending balance
|
$
|
226,806
|
$
|
195,373
|
||||
7. Intangible Assets, net
Intangible assets, net as of December 31, 2016 and 2015 consisted of the following (in thousands):
|
December 31, 2016
|
December 31, 2015
|
|||||||
|
Tradenames, net of accumulated amortization of $0 and $170, respectively
|
$
|
21,234
|
$
|
17,660
|
||||
|
Referral relationships, net of accumulated amortization of $5,275 and $3,763, respectively
|
14,859
|
10,866
|
||||||
|
Non-compete agreements, net of accumulated amortization of $3,380 and $2,855, respectively
|
1,967
|
1,770
|
||||||
|
$
|
38,060
|
$
|
30,296
|
|||||
Tradenames, referral relationships and non-compete agreements are related to the businesses acquired. The value assigned to tradenames has an indefinite life and is tested at least annually for impairment using the relief from royalty method in conjunction with the Company’s annual goodwill impairment test. The value assigned to referral relationships is being amortized over their respective estimated useful lives which range from six to 16 years. Non-compete agreements are amortized over the respective term of the agreements which range from five to six years.
The following table details the amount of amortization expense recorded for intangible assets for the years ended December 31, 2016, 2015 and 2014 (in thousands):
|
Year Ended
|
Year Ended
|
Year Ended
|
||||||||||
|
December 31, 2016
|
December 31, 2015
|
December 31, 2014
|
||||||||||
|
Tradenames
|
$
|
330
|
$
|
84
|
$
|
86
|
||||||
|
Referral relationships
|
1,512
|
1,153
|
1,028
|
|||||||||
|
Non-compete agreements
|
525
|
478
|
427
|
|||||||||
|
$
|
2,367
|
$
|
1,715
|
$
|
1,541
|
|||||||
For one acquisition, the value assigned to tradename was being amortized over the term of the six year agreement in which the Company had acquired the right to use the specific tradename. In 2016, the remaining value of this tradename was charged to earnings and included in amortization expense in the above table as the Company decided to combine two acquired operations in Georgia and the tradename under this six year agreement will no longer be used.
The remaining balances of the referral relationships and non-compete agreements is expected to be amortized as follows (in thousands):
|
Referral Relationships
|
Non-Compete Agreements
|
|||||||||||
|
Years
|
Annual Amount
|
Years
|
Annual Amount
|
|||||||||
|
2017
|
1,682
|
2017
|
581
|
|||||||||
|
2018
|
1,636
|
2018
|
525
|
|||||||||
|
2019
|
1,547
|
2019
|
452
|
|||||||||
|
2020
|
1,547
|
2020
|
239
|
|||||||||
|
2021
|
1,547
|
2021
|
162
|
|||||||||
|
2022
|
1,498
|
2022
|
8
|
|||||||||
|
2023
|
1,391
|
|||||||||||
|
2024
|
1,272
|
|||||||||||
|
2025
|
1,166
|
|||||||||||
|
2026
|
704
|
|||||||||||
|
2027
|
544
|
|||||||||||
|
2028
|
281
|
|||||||||||
|
2029
|
44
|
|||||||||||
8. Accrued Expenses
Accrued expenses as of December 31, 2016 and 2015 consisted of the following (in thousands):
|
December 31, 2016
|
December 31, 2015
|
|||||||
|
Salaries and related costs
|
$
|
10,569
|
$
|
9,414
|
||||
|
Credit balances due to patients and payors
|
3,880
|
1,472
|
||||||
|
Group health insurance claims
|
2,499
|
2,276
|
||||||
|
Other
|
4,808
|
3,434
|
||||||
|
Total
|
$
|
21,756
|
$
|
16,596
|
||||
9. Notes Payable
Notes payable as of December 31, 2016 and 2015 consisted of the following (dollars in thousands):
|
December 31, 2016
|
December 31, 2015
|
|||||||
|
Credit Agreement average effective interest rate of 2.5% inclusive of unused fee
|
$
|
46,000
|
$
|
44,000
|
||||
|
Various notes payable with $1,227 plus accrued interest due in the next year interest accrues in the range of 3.25% through 3.5% per annum
|
5,823
|
5,110
|
||||||
|
51,823
|
49,110
|
|||||||
|
Less current portion
|
(1,227
|
)
|
(775
|
)
|
||||
|
Long term portion
|
$
|
50,596
|
$
|
48,335
|
||||
Effective December 5, 2013, we entered into an Amended and Restated Credit Agreement with a commitment for a $125.0 million revolving credit facility with a maturity date of November 30, 2018. This agreement was amended in August 2015 and January 2016 (hereafter referred to as “Amended Credit Agreement”). The Amended Credit Agreement is unsecured and has loan covenants, including requirements that the Company comply with a consolidated fixed charge coverage ratio and consolidated leverage ratio. Proceeds from the Amended Credit Agreement may be used for working capital, acquisitions, purchases of the Company’s common stock, dividend payments to the Company’s common stockholders, capital expenditures and other corporate purposes. The pricing grid which is based on the Company’s consolidated leverage ratio with the applicable spread over LIBOR ranging from 1.5% to 2.5% or the applicable spread over the Base Rate ranging from 0.1% to 1%. Fees under the Amended Credit Agreement include an unused commitment fee ranging from 0.1% to 0.25% depending on the Company’s consolidated leverage ratio and the amount of funds outstanding under the Amended Credit Agreement.
The January 2016 amendment to the Amended Credit Agreement increased the cash and noncash consideration that the Company could pay with respect to acquisitions permitted under the Amended Credit Agreement to $50,000,000 for any fiscal year, and increased the amount the Company may pay in cash dividends to its shareholders in an aggregate amount not to exceed $10,000,000 in any fiscal year.
On December 31, 2016, $46.0 million was outstanding on the Credit Agreement resulting in $79.0 million of availability. As of the date of this report, the Company was in compliance with all of the covenants thereunder.
The Company generally enters into various notes payable as a means of financing a portion of its acquisitions, purchasing of non-controlling interests and paying the settlement of mandatorily redeemable non-controlling interests. In conjunction with the the transactions related to these in 2016, the Company entered into notes payable in the aggregate amount of $1.5 million of which an aggregate principal payment of $694,000 is due in 2017 and $819,000 in 2018. Interest accrues in the range of 3.25% to 3.5% per annum and is payable with each principal installment.
Aggregate annual payments of principal required pursuant to the Credit Agreement and the above notes payable subsequent to December 31, 2016 are as follows (in thousands):
|
During the twelve months ended December 31, 2017
|
$
|
1,227
|
||
|
During the twelve months ended December 31, 2018
|
48,750
|
|||
|
During the twelve months ended December 31, 2019
|
1,846
|
|||
|
$
|
51,823
|
10. Income Taxes
Significant components of deferred tax assets included in the consolidated balance sheets at December 31, 2016 and 2015 were as follows (in thousands):
|
December 31, 2016
|
December 31, 2015
|
|||||||
|
(as restated)
|
||||||||
|
Deferred tax assets:
|
||||||||
|
Compensation
|
$
|
1,914
|
$
|
1,830
|
||||
|
Allowance for doubtful accounts
|
572
|
472
|
||||||
|
Lease obligations - closed clinics
|
57
|
50
|
||||||
|
Deferred tax assets
|
$
|
2,543
|
$
|
2,352
|
||||
|
Deferred tax liabilities:
|
||||||||
|
Depreciation and amortization
|
$
|
(17,896
|
)
|
$
|
(16,142
|
)
|
||
|
Other
|
(383
|
)
|
(1,718
|
)
|
||||
|
Deferred tax liabilities
|
(18,279
|
)
|
(17,860
|
)
|
||||
|
Net deferred tax liability
|
$
|
(15,736
|
)
|
$
|
(15,508
|
)
|
||
During 2016, the Company recorded deferred tax assets of $0.4 million related to acquisitions of non-controlling interests, $2.4 million related to the revaluation of mandatorily redeemable non-controlling interests and $7.4 million related to acquired interests. Also, during 2016, the Company recorded an adjustment to the deferred tax assets of $2.7 million related to acquisitions of non-controlling interests in 2015 based on a detailed reconciliation of its federal and state taxes payable and receivable accounts along with its federal and state deferred tax asset and liability accounts. The offset to this adjustment was a reduction in the previously reported tax receivable of approximately $2.9 million and a charge to additional-paid-in-capital of $0.2 million. At December 31, 2016 and 2015, the Company had a tax receivable of $2.3 million and $3.4 million (prior to adjustment of $2.9 million), respectively, included in other current assets on the accompanying consolidated balance sheets.
The differences between the federal tax rate and the Company’s effective tax rate for results of continuing operations for the years ended December 31, 2016, 2015 and 2014 were as follows (in thousands):
|
December 31, 2016
|
December 31, 2015
|
December 31, 2014
|
||||||||||||||||||||||
|
(as restated)
|
(as restated)
|
|||||||||||||||||||||||
|
U. S. tax at statutory rate
|
$
|
11,351
|
35.0
|
%
|
$
|
11,991
|
35.0
|
%
|
$
|
11,252
|
35.0
|
%
|
||||||||||||
|
State income taxes, net of federal benefit
|
945
|
2.9
|
%
|
1,337
|
3.9
|
%
|
1,474
|
4.6
|
%
|
|||||||||||||||
|
Excess equity compensation deduction
|
(911
|
)
|
-2.8
|
%
|
-
|
0.0
|
%
|
-
|
0.0
|
%
|
||||||||||||||
|
Non-deductible expenses
|
495
|
1.5
|
%
|
319
|
0.9
|
%
|
292
|
0.9
|
%
|
|||||||||||||||
|
$
|
11,880
|
36.6
|
%
|
$
|
13,647
|
39.8
|
%
|
$
|
13,018
|
40.5
|
%
|
|||||||||||||
In March 2016, the FASB issued guidance to simplify some provisions in stock compensation accounting. The Company adopted this guidance in the fourth quarter of 2016. Prior to this guidance, excess tax benefits were recorded in additional paid-in capital, but became a component of the income tax provision/benefit in the period in which they occurred. For 2016, the adoption resulted in a reduction of the income tax provision by $1.0 million. The federal tax portion is shown above as excess equity compensation deduction.
Significant components of the provision for income taxes for continuing operations for the years ended December 31, 2016, 2015 and 2014 were as follows (in thousands):
|
December 31, 2016
|
December 31, 2015
|
December 31, 2014
|
||||||||||
|
(as restated)
|
(as restated)
|
|||||||||||
|
Current:
|
||||||||||||
|
Federal
|
$
|
7,620
|
$
|
6,502
|
$
|
6,972
|
||||||
|
State
|
1,281
|
1,192
|
940
|
|||||||||
|
Total current
|
8,901
|
7,694
|
7,912
|
|||||||||
|
Deferred:
|
||||||||||||
|
Federal
|
2,548
|
5,302
|
4,224
|
|||||||||
|
State
|
431
|
651
|
882
|
|||||||||
|
Total deferred
|
2,979
|
5,953
|
5,106
|
|||||||||
|
Total income tax provision for continuing operations
|
$
|
11,880
|
$
|
13,647
|
$
|
13,018
|
||||||
For 2016, 2015 and 2014, the Company performed a detailed reconciliation of its federal and state taxes payable and receivable accounts along with its federal and state deferred tax asset and liability accounts. As a result of this detailed analysis, the Company recorded an increase in the income tax provision of $34,000, $147,000 and $223,000 for 2016, 2015, and 2014, respectively. The Company considers this reconciliation process to be an annual control.
The Company is required to establish a valuation allowance for deferred tax assets if, based on the weight of available evidence, it is more likely than not that some portion or all of the deferred tax assets will not be realized. The ultimate realization of deferred tax assets is dependent upon the generation of future taxable income during the periods in which those temporary differences become deductible. Management considers the projected future taxable income and tax planning strategies in making this assessment. Based upon the level of historical taxable income and projections for future taxable income in the periods which the deferred tax assets are deductible, management believes that a valuation allowance is not required, as it is more likely than not that the results of future operations will generate sufficient taxable income to realize the deferred tax assets.
The Company’s U.S. federal returns remain open to examination for 2013 through 2015 and U.S. state jurisdictions are open for periods ranging from 2012 through 2015.
The Company does not believe that it has any significant uncertain tax positions at December 31, 2016, nor is this expected to change within the next twelve months due to the settlement and expiration of statutes of limitation.
The Company did not have any accrued interest or penalties associated with any unrecognized tax benefits nor was any interest expense recognized during the years ended December 31, 2016, 2015 and 2014.
11. Equity Based Plans
The Company has the following equity based plans with outstanding equity grants:
The Amended and Restated 1999 Employee Stock Option Plan (the “Amended 1999 Plan”) permits the Company to grant to non-employee directors and employees of the Company up to 600,000 non-qualified options to purchase shares of common stock and restricted stock (subject to proportionate adjustments in the event of stock dividends, splits, and similar corporate transactions). The exercise prices of options granted under the Amended 1999 Plan are determined by the Compensation Committee. The period within which each option will be exercisable is determined by the Compensation Committee. The Amended 1999 Plan was approved by the shareholders of the Company at the 2008 Shareholders Meeting on May 20, 2008.
The Amended and Restated 2003 Stock Option Plan (the “Amended 2003 Plan”) permits the Company to grant to key employees and outside directors of the Company incentive and non-qualified options and shares of restricted stock covering up to 2,100,000 shares of common stock (subject to proportionate adjustments in the event of stock dividends, splits, and similar corporate transactions). The material terms of the Amended 2003 Plan was reapproved by the shareholders of the Company at the 2015 Shareholders Meeting on May 19, 2015 and an increase in the number of shares authorized for issuance from 1,750,000 to 2,100,000 was approved at the 2016 Shareholders Meeting on March 17, 2016.
A cumulative summary of equity plans as of December 31, 2016 follows:
|
Authorized
|
Restricted
Stock Issued |
Outstanding
Stock Options |
Stock Options
Exercised |
Stock Options
Exercisable |
Shares Available
for Grant |
|||||||||||||||||||
|
Equity Plans
|
||||||||||||||||||||||||
|
Amended 1999 Plan
|
600,000
|
416,402
|
-
|
139,791
|
-
|
7,775
|
||||||||||||||||||
|
Amended 2003 Plan
|
2,100,000
|
763,357
|
-
|
778,300
|
-
|
558,343
|
||||||||||||||||||
|
2,700,000
|
1,179,759
|
-
|
918,091
|
-
|
566,118
|
|||||||||||||||||||
During 2016, 2015 and 2014, the Company granted the following shares of restricted stock to directors, officers and employees pursuant to its equity plans as follows:
|
Year Granted
|
Number of Shares
|
Weighted Average Fair
Value Per Share |
||||||
|
2014
|
159,443
|
$
|
33.29
|
|||||
|
2015
|
147,928
|
$
|
41.66
|
|||||
|
2016
|
101,790
|
$
|
51.59
|
|||||
During 2016, 2015 and 2014, the following shares were cancelled due to employee terminations prior to restrictions lapsing:
|
Year Cancelled
|
Number of Shares
|
Weighted Average Fair
Value Per Share |
||||||
|
2014
|
8,120
|
$
|
23.49
|
|||||
|
2015
|
-
|
-
|
||||||
|
2016
|
4,965
|
$
|
35.78
|
|||||
Generally, restrictions on the stock granted to employees lapse in equal annual installments on the following four anniversaries of the date of grant. For those shares granted to directors, the restrictions will lapse in equal quarterly installments during the first year after the date of grant. For those granted to executive officers, the restriction will lapse in equal quarterly installments during the four years following the date of grant.
As of December 31, 2016, there were 232,997 shares outstanding for which restrictions had not lapsed. The restrictions will lapse in 2017 through 2020.
Compensation expense for grants of restricted stock is recognized based on the fair value on the date of grant. Compensation expense for restricted stock grants was $4,962,000, $4,491,000 and $3,363,000, respectively, for 2016, 2015 and 2014. As of December 31, 2016, the remaining $6.7 million of compensation expense will be recognized from 2017 through 2020.
12. Preferred Stock
The Board is empowered, without approval of the shareholders, to cause shares of preferred stock to be issued in one or more series and to establish the number of shares to be included in each such series and the rights, powers, preferences and limitations of each series. There are no provisions in the Company’s Articles of Incorporation specifying the vote required by the holders of preferred stock to take action. All such provisions would be set out in the designation of any series of preferred stock established by the Board. The bylaws of the Company specify that, when a quorum is present at any meeting, the vote of the holders of at least a majority of the outstanding shares entitled to vote who are present, in person or by proxy, shall decide any question brought before the meeting, unless a different vote is required by law or the Company’s Articles of Incorporation.
Because the Board has the power to establish the preferences and rights of each series, it may afford the holders of any series of preferred stock, preferences, powers, and rights, voting or otherwise, senior to the right of holders of common stock. The issuance of the preferred stock could have the effect of delaying or preventing a change in control of the Company.
13. Common Stock
From September 2001 through December 31, 2008, the Board authorized the Company to purchase, in the open market or in privately negotiated transactions, up to 2,250,000 shares of the Company’s common stock. In March 2009, the Board authorized the repurchase of up to 10% or approximately 1,200,000 shares of its common stock (“March 2009 Authorization”). The Amended Credit Agreement permits share repurchases of up to $15,000,000, subject to compliance with covenants. The Company is required to retire shares purchased under the March 2009 Authorization.
Under the March 2009 Authorization, the Company has purchased a total of 859,499 shares. There is no expiration date for the share repurchase program. There are currently an additional estimated 213,675 shares (based on the closing price of $70.20 on December 30, 2016, the last business day in 2016) that may be purchased from time to time in the open market or private transactions depending on price, availability and the Company’s cash position. The Company did not purchase any shares of its common stock during 2016.
14. Defined Contribution Plan
The Company has several 401(k) profit sharing plans covering all employees with three months of service. For certain plans, the Company makes matching contributions. The Company may also make discretionary contributions of up to 50% of employee contributions. The Company did not make any discretionary contributions for the years ended December 31, 2016, 2015 and 2014. The Company matching contributions totaled $1.1 million, $0.9 million and $0.7 million, respectively, for the years ended December 31, 2016, 2015 and 2014.
15. Commitments and Contingencies
Operating Leases
The Company has entered into operating leases for its executive offices and clinic facilities. In connection with these agreements, the Company incurred rent expense of $30.3 million, $28.3 million and $25.6 million for the years ended December 31, 2016, 2015 and 2014, respectively. Several of the leases provide for an annual increase in the rental payment based upon the Consumer Price Index. The majority of the leases provide for renewal periods ranging from one to five years. The agreements to extend the leases typically specify that rental rates would be adjusted to market rates as of each renewal date.
The future minimum operating lease commitments for each of the next five years and thereafter and in the aggregate as of December 31, 2016 are as follows (in thousands):
|
December 31, 2016
|
||||
|
2017
|
$
|
30,376
|
||
|
2018
|
23,907
|
|||
|
2019
|
17,041
|
|||
|
2020
|
15,164
|
|||
|
2021
|
6,850
|
|||
|
Thereafter
|
3,095
|
|||
|
Total
|
$
|
96,433
|
||
Employment Agreements
At December 31, 2016, the Company had outstanding employment agreements with three of its executive officers. These agreements, which presently expire on December 31, 2017, provide for automatic two year renewals at the conclusion of each expiring term or renewal term. All of the agreements contain a provision for annual adjustment of salaries.
In addition, the Company has outstanding employment agreements with most of the managing physical therapist partners of the Company’s physical therapy clinics and with certain other clinic employees which obligate subsidiaries of the Company to pay compensation of $23.2 million in 2017 and $14.8 million in the aggregate from 2018 through 2021. In addition, most of the employment agreements with the managing physical therapists provide for monthly bonus payments calculated as a percentage of each clinic’s net revenues (not in excess of operating profits) or operating profits.
16. Earnings Per Share
The computations of basic and diluted earnings per share for the years ended December 31, 2016, 2015 and 2014 are as follows (in thousands, except per share data):
|
Year Ended
|
Year Ended
|
Year Ended
|
||||||||||
|
December 31, 2016
|
December 31, 2015
|
December 31, 2014
|
||||||||||
|
(as restated)
|
(as restated)
|
|||||||||||
|
Net income attributable to USPh shareholders
|
$
|
20,551
|
$
|
20,615
|
$
|
19,131
|
||||||
|
Basic and diluted net income per share attributable to USPH shareholders
|
$
|
1.64
|
$
|
1.66
|
$
|
1.57
|
||||||
|
Shares used in computation:
|
||||||||||||
|
Basic earnings per share - weighted-average shares
|
12,500
|
12,392
|
12,217
|
|||||||||
|
Effect of dilutive securities - stock options
|
-
|
-
|
4
|
|||||||||
|
Denominator for diluted earnings per share - adjusted weighted-average shares
|
12,500
|
12,392
|
12,221
|
|||||||||
17. Selected Quarterly Financial Data (Unaudited)
|
Q1 2016
(as restated) |
Q2 2016
(as restated) |
Q3 2016
(as restated) |
Q4 2016
|
|||||||||||||
|
Net patient revenues
|
$
|
85,049
|
$
|
88,433
|
$
|
86,411
|
$
|
88,946
|
||||||||
|
Net revenues
|
$
|
86,908
|
$
|
90,430
|
$
|
88,344
|
$
|
90,864
|
||||||||
|
Operating income
|
$
|
11,491
|
$
|
15,033
|
$
|
12,055
|
$
|
10,954
|
||||||||
|
Net income
|
$
|
5,953
|
$
|
7,671
|
$
|
6,134
|
$
|
6,510
|
||||||||
|
Net income attributable to USPH shareholders
|
$
|
4,488
|
$
|
6,012
|
$
|
4,804
|
$
|
5,247
|
||||||||
|
Basic and diluted earnings per share attributable to common shareholders:
|
$
|
0.36
|
$
|
0.48
|
$
|
0.38
|
$
|
0.42
|
||||||||
|
Shares used in computation - basic and diluted
|
12,448
|
12,511
|
12,520
|
12,519
|
||||||||||||
|
Q1 2015
(as restated) |
Q2 2015
(as restated) |
Q3 2015
(as restated) |
Q4 2015
(as restated) |
|||||||||||||
|
Net patient revenues
|
$
|
75,807
|
$
|
81,451
|
$
|
82,154
|
$
|
84,881
|
||||||||
|
Net revenues
|
$
|
77,241
|
$
|
83,288
|
$
|
84,049
|
$
|
86,724
|
||||||||
|
Operating income
|
$
|
9,185
|
$
|
13,549
|
$
|
11,949
|
$
|
12,611
|
||||||||
|
Net income
|
$
|
5,293
|
$
|
7,957
|
$
|
6,974
|
$
|
6,265
|
||||||||
|
Net income attributable to USPH shareholders
|
$
|
4,014
|
$
|
6,334
|
$
|
5,506
|
$
|
4,761
|
||||||||
|
Basic and diluted earnings per share attributable to common shareholders:
|
$
|
0.33
|
$
|
0.51
|
$
|
0.44
|
$
|
0.38
|
||||||||
|
Shares used in computation - basic and diluted
|
12,313
|
12,409
|
12,421
|
12,421
|
||||||||||||
The following schedules present the impact of the correction related to mandatorily redeemable non-controlling interests on the Company’s previously reported quarterly balance sheets, income statements and cash flows included in its Quarterly Reports on Form 10-Q for the quarters ended March 31, June 30, September 30, 2016 and March 31, June 30 and September 30, 2015. In addition, the impact of the early adoption of the treatment of the excess tax benefits related to equity grants on the previously reported quarterly balance sheets and income statements included in its Quarterly Reports on Form 10-Q for the quarters ended March 31, June 30 and September 30, 2016 are included in the respective schedules. See Note 2. – Significant Accounting Policies – Recently Adopted Accounting Guidance. All schedules are in thousands, except share and per share data.
Consolidated Balance Sheet as of September 30, 2016:
|
As Reported
September 30, 2016
|
Adjustments
|
As Restated
September 30, 2016
|
||||||||||
|
ASSETS
|
||||||||||||
|
Current assets:
|
||||||||||||
|
Cash and cash equivalents
|
$
|
15,024
|
$
|
-
|
$
|
15,024
|
||||||
|
Patient accounts receivable, less allowance for doubtful accounts of $1,770
|
38,522
|
-
|
38,522
|
|||||||||
|
Accounts receivable - other
|
2,272
|
-
|
2,272
|
|||||||||
|
Other current assets
|
10,800
|
816
|
11,616
|
|||||||||
|
Total current assets
|
66,618
|
816
|
67,434
|
|||||||||
|
Fixed assets:
|
||||||||||||
|
Furniture and equipment
|
46,996
|
-
|
46,996
|
|||||||||
|
Leasehold improvements
|
26,206
|
-
|
26,206
|
|||||||||
|
Fixed assets, gross
|
73,202
|
-
|
73,202
|
|||||||||
|
Less accumulated depreciation and amortization
|
55,760
|
-
|
55,760
|
|||||||||
|
Fixed assets, net
|
17,442
|
-
|
17,442
|
|||||||||
|
Goodwill
|
191,231
|
23,826
|
215,057
|
|||||||||
|
Other identifiable intangible assets, net
|
33,389
|
-
|
33,389
|
|||||||||
|
Other assets
|
1,221
|
-
|
1,221
|
|||||||||
|
Total assets
|
$
|
309,901
|
$
|
24,642
|
$
|
334,543
|
||||||
|
LIABILITIES AND SHAREHOLDERS’ EQUITY
|
||||||||||||
|
Current liabilities:
|
||||||||||||
|
Accounts payable - trade
|
$
|
2,181
|
$
|
-
|
$
|
2,181
|
||||||
|
Accrued expenses
|
23,216
|
-
|
23,216
|
|||||||||
|
Current portion of notes payable
|
986
|
-
|
986
|
|||||||||
|
Total current liabilities
|
26,383
|
-
|
26,383
|
|||||||||
|
Notes payable
|
4,546
|
-
|
4,546
|
|||||||||
|
Revolving line of credit
|
36,000
|
-
|
36,000
|
|||||||||
|
Mandatorily redeemable non-controlling interests
|
-
|
61,276
|
61,276
|
|||||||||
|
Deferred rent
|
1,313
|
-
|
1,313
|
|||||||||
|
Deferred taxes
|
13,727
|
5,009
|
18,736
|
|||||||||
|
Other long-term liabilities
|
860
|
54
|
914
|
|||||||||
|
Total liabilities
|
82,829
|
66,339
|
149,168
|
|||||||||
|
Commitments and contingencies
|
||||||||||||
|
Redeemable non-controlling interests
|
8,334
|
(8,334
|
)
|
-
|
||||||||
|
U.S. Physical Therapy, Inc. ("USPH") shareholders’ equity:
|
||||||||||||
|
Preferred stock, $.01 par value, 500,000 shares authorized, no shares issued and outstanding
|
-
|
-
|
-
|
|||||||||
|
Common stock, $.01 par value, 20,000,000 shares authorized, 14,734,963 shares issued
|
147
|
-
|
147
|
|||||||||
|
Additional paid-in capital
|
49,506
|
18,987
|
68,493
|
|||||||||
|
Retained earnings
|
160,746
|
(13,523
|
)
|
147,223
|
||||||||
|
Treasury stock at cost, 2,214,737 shares
|
(31,628
|
)
|
-
|
(31,628
|
)
|
|||||||
|
Total USPH shareholders’ equity
|
178,771
|
5,464
|
184,235
|
|||||||||
|
Non-controlling interests
|
39,967
|
(38,827
|
)
|
1,140
|
||||||||
|
Total equity
|
218,738
|
(33,363
|
)
|
185,375
|
||||||||
|
Total liabilities and equity
|
$
|
309,901
|
$
|
24,642
|
$
|
334,543
|
||||||
Consolidated Balance Sheet as of June 30, 2016:
|
As Reported
June 30, 2016
|
Adjustments
|
As Restated
June 30, 2016
|
||||||||||
|
ASSETS
|
||||||||||||
|
Current assets:
|
||||||||||||
|
Cash and cash equivalents
|
$
|
20,453
|
$
|
-
|
$
|
20,453
|
||||||
|
Patient accounts receivable, less allowance for doubtful accounts of $1,672
|
39,356
|
-
|
39,356
|
|||||||||
|
Accounts receivable - other
|
2,335
|
-
|
2,335
|
|||||||||
|
Other current assets
|
8,220
|
574
|
8,794
|
|||||||||
|
Total current assets
|
70,364
|
574
|
70,938
|
|||||||||
|
Fixed assets:
|
||||||||||||
|
Furniture and equipment
|
46,747
|
-
|
46,747
|
|||||||||
|
Leasehold improvements
|
25,733
|
-
|
25,733
|
|||||||||
|
Fixed assets, gross
|
72,480
|
-
|
72,480
|
|||||||||
|
Less accumulated depreciation and amortization
|
55,642
|
-
|
55,642
|
|||||||||
|
Fixed assets, net
|
16,838
|
-
|
16,838
|
|||||||||
|
Goodwill
|
191,268
|
23,826
|
215,094
|
|||||||||
|
Other identifiable intangible assets, net
|
33,909
|
-
|
33,909
|
|||||||||
|
Other assets
|
1,219
|
-
|
1,219
|
|||||||||
|
Total assets
|
$
|
313,598
|
$
|
24,400
|
$
|
337,998
|
||||||
|
LIABILITIES AND SHAREHOLDERS’ EQUITY
|
||||||||||||
|
Current liabilities:
|
||||||||||||
|
Accounts payable - trade
|
$
|
1,668
|
$
|
-
|
$
|
1,668
|
||||||
|
Accrued expenses
|
26,273
|
-
|
26,273
|
|||||||||
|
Current portion of notes payable
|
1,044
|
-
|
1,044
|
|||||||||
|
Total current liabilities
|
28,985
|
-
|
28,985
|
|||||||||
|
Notes payable
|
4,547
|
-
|
4,547
|
|||||||||
|
Revolving line of credit
|
42,500
|
-
|
42,500
|
|||||||||
|
Mandatorily redeemable non-controlling interests
|
-
|
59,932
|
59,932
|
|||||||||
|
Deferred rent
|
1,285
|
-
|
1,285
|
|||||||||
|
Deferred taxes
|
12,361
|
5,792
|
18,153
|
|||||||||
|
Other long-term liabilities
|
869
|
54
|
923
|
|||||||||
|
Total liabilities
|
90,547
|
65,778
|
156,325
|
|||||||||
|
Commitments and contingencies
|
||||||||||||
|
Redeemable non-controlling interests
|
8,641
|
(8,641
|
)
|
-
|
||||||||
|
U.S. Physical Therapy, Inc. ("USPH") shareholders’ equity:
|
||||||||||||
|
Preferred stock, $.01 par value, 500,000 shares authorized, no shares issued and outstanding
|
-
|
-
|
-
|
|||||||||
|
Common stock, $.01 par value, 20,000,000 shares authorized, 14,734,963 shares issued
|
147
|
-
|
147
|
|||||||||
|
Additional paid-in capital
|
48,236
|
18,987
|
67,223
|
|||||||||
|
Retained earnings
|
157,161
|
(12,614
|
)
|
144,547
|
||||||||
|
Treasury stock at cost, 2,214,737 shares
|
(31,628
|
)
|
-
|
(31,628
|
)
|
|||||||
|
Total USPH shareholders’ equity
|
173,916
|
6,373
|
180,289
|
|||||||||
|
Non-controlling interests
|
40,494
|
(39,110
|
)
|
1,384
|
||||||||
|
Total equity
|
214,410
|
(32,737
|
)
|
181,673
|
||||||||
|
Total liabilities and equity
|
$
|
313,598
|
$
|
24,400
|
$
|
337,998
|
||||||
Consolidated Balance Sheet as of March 31, 2016:
|
As Reported
March 31, 2016
|
Adjustments
|
As Restated
March 31, 2016
|
||||||||||
|
ASSETS
|
||||||||||||
|
Current assets:
|
||||||||||||
|
Cash and cash equivalents
|
$
|
19,206
|
$
|
-
|
$
|
19,206
|
||||||
|
Patient accounts receivable, less allowance for doubtful accounts of $1,568
|
38,217
|
-
|
38,217
|
|||||||||
|
Accounts receivable - other
|
2,345
|
-
|
2,345
|
|||||||||
|
Other current assets
|
8,298
|
483
|
8,781
|
|||||||||
|
Total current assets
|
68,066
|
483
|
68,549
|
|||||||||
|
Fixed assets:
|
||||||||||||
|
Furniture and equipment
|
45,654
|
-
|
45,654
|
|||||||||
|
Leasehold improvements
|
25,547
|
-
|
25,547
|
|||||||||
|
Fixed assets, gross
|
71,201
|
-
|
71,201
|
|||||||||
|
Less accumulated depreciation and amortization
|
54,512
|
-
|
54,512
|
|||||||||
|
Fixed assets, net
|
16,689
|
-
|
16,689
|
|||||||||
|
Goodwill
|
191,051
|
23,826
|
214,877
|
|||||||||
|
Other identifiable intangible assets, net
|
34,428
|
-
|
34,428
|
|||||||||
|
Other assets
|
1,200
|
-
|
1,200
|
|||||||||
|
Total assets
|
$
|
311,434
|
$
|
24,309
|
$
|
335,743
|
||||||
|
LIABILITIES AND SHAREHOLDERS’ EQUITY
|
||||||||||||
|
Current liabilities:
|
||||||||||||
|
Accounts payable - trade
|
$
|
2,244
|
$
|
-
|
$
|
2,244
|
||||||
|
Accrued expenses
|
20,684
|
-
|
20,684
|
|||||||||
|
Current portion of notes payable
|
1,253
|
-
|
1,253
|
|||||||||
|
Total current liabilities
|
24,181
|
-
|
24,181
|
|||||||||
|
Notes payable
|
4,621
|
-
|
4,621
|
|||||||||
|
Revolving line of credit
|
52,500
|
-
|
52,500
|
|||||||||
|
Mandatorily redeemable non-controlling interests
|
-
|
58,481
|
58,481
|
|||||||||
|
Deferred rent
|
1,391
|
-
|
1,391
|
|||||||||
|
Deferred taxes
|
10,789
|
6,573
|
17,362
|
|||||||||
|
Other long-term liabilities
|
914
|
54
|
968
|
|||||||||
|
Total liabilities
|
94,396
|
65,108
|
159,504
|
|||||||||
|
Commitments and contingencies
|
||||||||||||
|
Redeemable non-controlling interests
|
7,591
|
(7,591
|
)
|
-
|
||||||||
|
U.S. Physical Therapy, Inc. ("USPH") shareholders’ equity:
|
||||||||||||
|
Preferred stock, $.01 par value, 500,000 shares authorized, no shares issued and outstanding
|
-
|
-
|
-
|
|||||||||
|
Common stock, $.01 par value, 20,000,000 shares authorized, 14,717,463 shares issued
|
147
|
-
|
147
|
|||||||||
|
Additional paid-in capital
|
46,563
|
18,987
|
65,550
|
|||||||||
|
Retained earnings
|
152,219
|
(11,555
|
)
|
140,664
|
||||||||
|
Treasury stock at cost, 2,214,737 shares
|
(31,628
|
)
|
-
|
(31,628
|
)
|
|||||||
|
Total USPH shareholders’ equity
|
167,301
|
7,432
|
174,733
|
|||||||||
|
Non-controlling interests
|
42,146
|
(40,640
|
)
|
1,506
|
||||||||
|
Total equity
|
209,447
|
(33,208
|
)
|
176,239
|
||||||||
|
Total liabilities and equity
|
$
|
311,434
|
$
|
24,309
|
$
|
335,743
|
||||||
Consolidated Balance Sheet as of September 30, 2015:
|
As Reported
September 30, 2015
|
Adjustments
|
As Restated
September 30, 2015
|
||||||||||
|
ASSETS
|
||||||||||||
|
Current assets:
|
||||||||||||
|
Cash and cash equivalents
|
$
|
20,558
|
$
|
-
|
$
|
20,558
|
||||||
|
Patient accounts receivable, less allowance for doubtful accounts of $1,556
|
35,106
|
-
|
35,106
|
|||||||||
|
Accounts receivable - other
|
1,939
|
-
|
1,939
|
|||||||||
|
Other current assets
|
6,058
|
-
|
6,058
|
|||||||||
|
Total current assets
|
63,661
|
-
|
63,661
|
|||||||||
|
Fixed assets:
|
||||||||||||
|
Furniture and equipment
|
44,157
|
-
|
44,157
|
|||||||||
|
Leasehold improvements
|
25,006
|
-
|
25,006
|
|||||||||
|
Fixed assets, gross
|
69,163
|
-
|
69,163
|
|||||||||
|
Less accumulated depreciation and amortization
|
52,501
|
-
|
52,501
|
|||||||||
|
Fixed assets, net
|
16,662
|
-
|
16,662
|
|||||||||
|
Goodwill
|
170,849
|
23,826
|
194,675
|
|||||||||
|
Other identifiable intangible assets, net
|
23,798
|
-
|
23,798
|
|||||||||
|
Other assets
|
1,175
|
-
|
1,175
|
|||||||||
|
Total assets
|
$
|
276,145
|
$
|
23,826
|
$
|
299,971
|
||||||
|
LIABILITIES AND SHAREHOLDERS’ EQUITY
|
||||||||||||
|
Current liabilities:
|
||||||||||||
|
Accounts payable - trade
|
$
|
1,662
|
$
|
-
|
$
|
1,662
|
||||||
|
Accrued expenses
|
18,287
|
-
|
18,287
|
|||||||||
|
Current portion of notes payable
|
1,412
|
-
|
1,412
|
|||||||||
|
Total current liabilities
|
21,361
|
-
|
21,361
|
|||||||||
|
Notes payable
|
1,679
|
-
|
1,679
|
|||||||||
|
Revolving line of credit
|
46,000
|
-
|
46,000
|
|||||||||
|
Mandatorily redeemable non-controlling interests
|
-
|
45,323
|
45,323
|
|||||||||
|
Deferred rent
|
1,192
|
-
|
1,192
|
|||||||||
|
Deferred taxes
|
-
|
13,276
|
13,276
|
|||||||||
|
Other long-term liabilities
|
10,769
|
(7,995
|
)
|
2,774
|
||||||||
|
Total liabilities
|
81,001
|
50,604
|
131,605
|
|||||||||
|
Commitments and contingencies
|
||||||||||||
|
Redeemable non-controlling interests
|
9,024
|
(9,024
|
)
|
-
|
||||||||
|
U.S. Physical Therapy, Inc. ("USPH") shareholders’ equity:
|
||||||||||||
|
Preferred stock, $.01 par value, 500,000 shares authorized, no shares issued and outstanding
|
-
|
-
|
-
|
|||||||||
|
Common stock, $.01 par value, 20,000,000 shares authorized, 14,635,874 shares issued
|
146
|
-
|
146
|
|||||||||
|
Additional paid-in capital
|
45,536
|
17,382
|
62,918
|
|||||||||
|
Retained earnings
|
144,888
|
(9,485
|
)
|
135,403
|
||||||||
|
Treasury stock at cost, 2,214,737 shares
|
(31,628
|
)
|
-
|
(31,628
|
)
|
|||||||
|
Total USPH shareholders’ equity
|
158,942
|
7,897
|
166,839
|
|||||||||
|
Non-controlling interests
|
27,178
|
(25,651
|
)
|
1,527
|
||||||||
|
Total equity
|
186,120
|
(17,754
|
)
|
168,366
|
||||||||
|
Total liabilities and equity
|
$
|
276,145
|
$
|
23,826
|
$
|
299,971
|
||||||
Consolidated Balance Sheet as of June 30, 2015:
|
As Reported
June 30, 2015
|
Adjustments
|
As Restated
June 30, 2015
|
||||||||||
|
ASSETS
|
||||||||||||
|
Current assets:
|
||||||||||||
|
Cash and cash equivalents
|
$
|
12,972
|
$
|
-
|
$
|
12,972
|
||||||
|
Patient accounts receivable, less allowance for doubtful accounts of $1,618
|
34,830
|
-
|
34,830
|
|||||||||
|
Accounts receivable - other
|
1,338
|
-
|
1,338
|
|||||||||
|
Other current assets
|
6,509
|
-
|
6,509
|
|||||||||
|
Total current assets
|
55,649
|
-
|
55,649
|
|||||||||
|
Fixed assets:
|
||||||||||||
|
Furniture and equipment
|
43,495
|
-
|
43,495
|
|||||||||
|
Leasehold improvements
|
24,107
|
-
|
24,107
|
|||||||||
|
Fixed assets, gross
|
67,602
|
-
|
67,602
|
|||||||||
|
Less accumulated depreciation and amortization
|
51,098
|
-
|
51,098
|
|||||||||
|
Fixed assets, net
|
16,504
|
-
|
16,504
|
|||||||||
|
Goodwill
|
170,914
|
23,826
|
194,740
|
|||||||||
|
Other identifiable intangible assets, net
|
24,167
|
-
|
24,167
|
|||||||||
|
Other assets
|
1,086
|
-
|
1,086
|
|||||||||
|
Total assets
|
$
|
268,320
|
$
|
23,826
|
$
|
292,146
|
||||||
|
LIABILITIES AND SHAREHOLDERS’ EQUITY
|
||||||||||||
|
Current liabilities:
|
||||||||||||
|
Accounts payable - trade
|
$
|
1,451
|
$
|
-
|
$
|
1,451
|
||||||
|
Accrued expenses
|
19,446
|
-
|
19,446
|
|||||||||
|
Current portion of notes payable
|
800
|
-
|
800
|
|||||||||
|
Total current liabilities
|
21,697
|
-
|
21,697
|
|||||||||
|
Notes payable
|
1,059
|
-
|
1,059
|
|||||||||
|
Revolving line of credit
|
41,000
|
-
|
41,000
|
|||||||||
|
Mandatorily redeemable non-controlling interests
|
-
|
49,166
|
49,166
|
|||||||||
|
Deferred rent
|
1,040
|
-
|
1,040
|
|||||||||
|
Deferred taxes
|
-
|
12,027
|
12,027
|
|||||||||
|
Other long-term liabilities
|
10,925
|
(7,995
|
)
|
2,930
|
||||||||
|
Total liabilities
|
75,721
|
53,198
|
128,919
|
|||||||||
|
Commitments and contingencies
|
||||||||||||
|
Redeemable non-controlling interests
|
10,585
|
(10,585
|
)
|
-
|
||||||||
|
U.S. Physical Therapy, Inc. ("USPH") shareholders’ equity:
|
||||||||||||
|
Preferred stock, $.01 par value, 500,000 shares authorized, no shares issued and outstanding
|
-
|
-
|
-
|
|||||||||
|
Common stock, $.01 par value, 20,000,000 shares authorized, 14,635,674 shares issued
|
146
|
-
|
146
|
|||||||||
|
Additional paid-in capital
|
45,829
|
15,222
|
61,051
|
|||||||||
|
Retained earnings
|
140,933
|
(9,173
|
)
|
131,760
|
||||||||
|
Treasury stock at cost, 2,214,737 shares
|
(31,628
|
)
|
-
|
(31,628
|
)
|
|||||||
|
Total USPH shareholders’ equity
|
155,280
|
6,049
|
161,329
|
|||||||||
|
Non-controlling interests
|
26,734
|
(24,836
|
)
|
1,898
|
||||||||
|
Total equity
|
182,014
|
(18,787
|
)
|
163,227
|
||||||||
|
Total liabilities and equity
|
$
|
268,320
|
$
|
23,826
|
$
|
292,146
|
||||||
Consolidated Balance Sheet as of March 31, 2015:
|
As Reported
March 31, 2015
|
Adjustments
|
As Restated
March 31, 2015
|
||||||||||
|
ASSETS
|
||||||||||||
|
Current assets:
|
||||||||||||
|
Cash and cash equivalents
|
$
|
14,557
|
$
|
-
|
$
|
14,557
|
||||||
|
Patient accounts receivable, less allowance for doubtful accounts of $1,633
|
34,673
|
-
|
34,673
|
|||||||||
|
Accounts receivable - other
|
1,378
|
-
|
1,378
|
|||||||||
|
Other current assets
|
5,291
|
-
|
5,291
|
|||||||||
|
Total current assets
|
55,899
|
-
|
55,899
|
|||||||||
|
Fixed assets:
|
||||||||||||
|
Furniture and equipment
|
42,542
|
-
|
42,542
|
|||||||||
|
Leasehold improvements
|
23,565
|
-
|
23,565
|
|||||||||
|
Fixed assets, gross
|
66,107
|
-
|
66,107
|
|||||||||
|
Less accumulated depreciation and amortization
|
50,212
|
-
|
50,212
|
|||||||||
|
Fixed assets, net
|
15,895
|
-
|
15,895
|
|||||||||
|
Goodwill
|
159,176
|
23,826
|
183,002
|
|||||||||
|
Other identifiable intangible assets, net
|
24,537
|
-
|
24,537
|
|||||||||
|
Other assets
|
1,916
|
-
|
1,916
|
|||||||||
|
Total assets
|
$
|
257,423
|
$
|
23,826
|
$
|
281,249
|
||||||
|
LIABILITIES AND SHAREHOLDERS’ EQUITY
|
||||||||||||
|
Current liabilities:
|
||||||||||||
|
Accounts payable - trade
|
$
|
2,292
|
$
|
-
|
$
|
2,292
|
||||||
|
Accrued expenses
|
18,178
|
-
|
18,178
|
|||||||||
|
Current portion of notes payable
|
932
|
-
|
932
|
|||||||||
|
Total current liabilities
|
21,402
|
-
|
21,402
|
|||||||||
|
Notes payable
|
483
|
-
|
483
|
|||||||||
|
Revolving line of credit
|
41,500
|
-
|
41,500
|
|||||||||
|
Mandatorily redeemable non-controlling interests
|
-
|
45,578
|
45,578
|
|||||||||
|
Deferred rent
|
984
|
-
|
984
|
|||||||||
|
Deferred taxes
|
-
|
12,009
|
12,009
|
|||||||||
|
Other long-term liabilities
|
9,480
|
(7,995
|
)
|
1,485
|
||||||||
|
Total liabilities
|
73,849
|
49,592
|
123,441
|
|||||||||
|
Commitments and contingencies
|
||||||||||||
|
Redeemable non-controlling interests
|
7,373
|
(7,373
|
)
|
-
|
||||||||
|
U.S. Physical Therapy, Inc. ("USPH") shareholders’ equity:
|
||||||||||||
|
Preferred stock, $.01 par value, 500,000 shares authorized, no shares issued and outstanding
|
-
|
-
|
-
|
|||||||||
|
Common stock, $.01 par value, 20,000,000 shares authorized, 14,613,374 shares issued
|
145
|
-
|
145
|
|||||||||
|
Additional paid-in capital
|
45,080
|
15,222
|
60,302
|
|||||||||
|
Retained earnings
|
136,491
|
(9,203
|
)
|
127,288
|
||||||||
|
Treasury stock at cost, 2,214,737 shares
|
(31,628
|
)
|
-
|
(31,628
|
)
|
|||||||
|
Total USPH shareholders’ equity
|
150,088
|
6,019
|
156,107
|
|||||||||
|
Non-controlling interests
|
26,113
|
(24,412
|
)
|
1,701
|
||||||||
|
Total equity
|
176,201
|
(18,393
|
)
|
157,808
|
||||||||
|
Total liabilities and equity
|
$
|
257,423
|
$
|
23,826
|
$
|
281,249
|
||||||
Consolidated Statement of Net Income as of September 30, 2016:
|
For the Three Months Ended
|
For the Nine Months Ended
|
|||||||||||||||||||||||
|
As Reported
September 30, 2016
|
Adjustments
|
As Restated
September 30, 2016
|
As Reported
September 30, 2016
|
Adjustments
|
As Restated
September 30, 2016
|
|||||||||||||||||||
|
Net patient revenues
|
$
|
86,411
|
$
|
-
|
$
|
86,411
|
$
|
259,893
|
$
|
-
|
$
|
259,893
|
||||||||||||
|
Other revenues
|
1,933
|
-
|
1,933
|
5,789
|
-
|
5,789
|
||||||||||||||||||
|
Net revenues
|
88,344
|
-
|
88,344
|
265,682
|
-
|
265,682
|
||||||||||||||||||
|
Clinic operating costs:
|
||||||||||||||||||||||||
|
Salaries and related costs
|
49,868
|
-
|
49,868
|
146,509
|
-
|
146,509
|
||||||||||||||||||
|
Rent, clinic supplies, contract labor and other
|
17,885
|
-
|
17,885
|
52,938
|
-
|
52,938
|
||||||||||||||||||
|
Provision for doubtful accounts
|
917
|
-
|
917
|
2,962
|
-
|
2,962
|
||||||||||||||||||
|
Closure costs
|
9
|
-
|
9
|
54
|
-
|
54
|
||||||||||||||||||
|
Total clinic operating costs
|
68,679
|
-
|
68,679
|
202,463
|
-
|
202,463
|
||||||||||||||||||
|
Gross margin
|
19,665
|
-
|
19,665
|
63,219
|
-
|
63,219
|
||||||||||||||||||
|
Corporate office costs
|
7,610
|
-
|
7,610
|
24,640
|
-
|
24,640
|
||||||||||||||||||
|
Operating income
|
12,055
|
-
|
12,055
|
38,579
|
-
|
38,579
|
||||||||||||||||||
|
Interest and other income, net
|
21
|
-
|
21
|
62
|
-
|
62
|
||||||||||||||||||
|
Interest expense
|
||||||||||||||||||||||||
|
Mandatorily redeemable non-controlling interests - change in redemption value
|
-
|
(1,934
|
)
|
(1,934
|
)
|
-
|
(6,056
|
)
|
(6,056
|
)
|
||||||||||||||
|
Mandatorily redeemable non-controlling interests - earnings allocable
|
-
|
(929
|
)
|
(929
|
)
|
-
|
(3,146
|
)
|
(3,146
|
)
|
||||||||||||||
|
Debt and other
|
(326
|
)
|
-
|
(326
|
)
|
(954
|
)
|
-
|
(954
|
)
|
||||||||||||||
|
Total interest expense
|
(326
|
)
|
(2,863
|
)
|
(3,189
|
)
|
(954
|
)
|
(9,202
|
)
|
(10,156
|
)
|
||||||||||||
|
Income before taxes
|
11,750
|
(2,863
|
)
|
8,887
|
37,687
|
(9,202
|
)
|
28,485
|
||||||||||||||||
|
Provision for income taxes
|
3,778
|
(1,025
|
)
|
2,753
|
11,975
|
(3,248
|
)
|
8,727
|
||||||||||||||||
|
Net income
|
7,972
|
(1,838
|
)
|
6,134
|
25,712
|
(5,954
|
)
|
19,758
|
||||||||||||||||
|
Less: net income attributable to non-controlling interests
|
(2,259
|
)
|
929
|
(1,330
|
)
|
(7,600
|
)
|
3,146
|
(4,454
|
)
|
||||||||||||||
|
Net income attributable to USPH shareholders
|
$
|
5,713
|
$
|
(909
|
)
|
$
|
4,804
|
$
|
18,112
|
$
|
(2,808
|
)
|
$
|
15,304
|
||||||||||
|
Basic and diluted earnings per share attributable to USPH shareholders
|
$
|
0.46
|
$
|
(0.08
|
)
|
$
|
0.38
|
$
|
1.45
|
$
|
(0.23
|
)
|
$
|
1.22
|
||||||||||
|
Shares used in computation - basic
|
12,520
|
12,520
|
12,494
|
12,494
|
||||||||||||||||||||
|
Shares used in computation - diluted
|
12,520
|
12,520
|
12,494
|
12,494
|
||||||||||||||||||||
|
Dividends declared per common share
|
$
|
0.17
|
$
|
0.17
|
$
|
0.51
|
$
|
0.51
|
||||||||||||||||
Consolidated Statement of Net Income as of June 30, 2016:
|
For the Three Months Ended
|
For the Six Months Ended
|
|||||||||||||||||||||||
|
As Reported
June 30, 2016
|
Adjustments
|
As Restated
June 30, 2016
|
As Reported
June 30, 2016
|
Adjustments
|
As Restated
June 30, 2016
|
|||||||||||||||||||
|
Net patient revenues
|
$
|
88,433
|
$
|
-
|
$
|
88,433
|
$
|
173,482
|
$
|
-
|
$
|
173,482
|
||||||||||||
|
Other revenues
|
1,997
|
-
|
1,997
|
3,856
|
-
|
3,856
|
||||||||||||||||||
|
Net revenues
|
90,430
|
-
|
90,430
|
177,338
|
-
|
177,338
|
||||||||||||||||||
|
Clinic operating costs:
|
||||||||||||||||||||||||
|
Salaries and related costs
|
48,837
|
-
|
48,837
|
96,641
|
-
|
96,641
|
||||||||||||||||||
|
Rent, clinic supplies, contract labor and other
|
17,546
|
-
|
17,546
|
35,053
|
-
|
35,053
|
||||||||||||||||||
|
Provision for doubtful accounts
|
956
|
-
|
956
|
2,045
|
-
|
2,045
|
||||||||||||||||||
|
Closure costs
|
32
|
-
|
32
|
45
|
-
|
45
|
||||||||||||||||||
|
Total clinic operating costs
|
67,371
|
-
|
67,371
|
133,784
|
-
|
133,784
|
||||||||||||||||||
|
Gross margin
|
23,059
|
-
|
23,059
|
43,554
|
-
|
43,554
|
||||||||||||||||||
|
Corporate office costs
|
8,026
|
-
|
8,026
|
17,030
|
-
|
17,030
|
||||||||||||||||||
|
Operating income
|
15,033
|
-
|
15,033
|
26,524
|
-
|
26,524
|
||||||||||||||||||
|
Interest and other income, net
|
21
|
-
|
21
|
41
|
-
|
41
|
||||||||||||||||||
|
Interest expense
|
||||||||||||||||||||||||
|
Mandatorily redeemable non-controlling interests - change in redemption value
|
-
|
(1,931
|
)
|
(1,931
|
)
|
-
|
(4,122
|
)
|
(4,122
|
)
|
||||||||||||||
|
Mandatorily redeemable non-controlling interests - earnings allocable
|
-
|
(1,330
|
)
|
(1,330
|
)
|
-
|
(2,217
|
)
|
(2,217
|
)
|
||||||||||||||
|
Debt and other
|
(320
|
)
|
-
|
(320
|
)
|
(628
|
)
|
-
|
(628
|
)
|
||||||||||||||
|
Total interest expense
|
(320
|
)
|
(3,261
|
)
|
(3,581
|
)
|
(628
|
)
|
(6,339
|
)
|
(6,967
|
)
|
||||||||||||
|
Income before taxes
|
14,734
|
(3,261
|
)
|
11,473
|
25,937
|
(6,339
|
)
|
19,598
|
||||||||||||||||
|
Provision for income taxes
|
4,674
|
(872
|
)
|
3,802
|
8,197
|
(2,223
|
)
|
5,974
|
||||||||||||||||
|
Net income
|
10,060
|
(2,389
|
)
|
7,671
|
17,740
|
(4,116
|
)
|
13,624
|
||||||||||||||||
|
Less: net income attributable to non-controlling interests
|
(2,989
|
)
|
1,330
|
(1,659
|
)
|
(5,341
|
)
|
2,217
|
(3,124
|
)
|
||||||||||||||
|
Net income attributable to USPH shareholders
|
$
|
7,071
|
$
|
(1,059
|
)
|
$
|
6,012
|
$
|
12,399
|
$
|
(1,899
|
)
|
$
|
10,500
|
||||||||||
|
Basic and diluted earnings per share attributable to USPH shareholders
|
$
|
0.57
|
$
|
(0.09
|
)
|
$
|
0.48
|
$
|
0.99
|
$
|
(0.15
|
)
|
$
|
0.84
|
||||||||||
|
Shares used in computation - basic
|
12,511
|
12,511
|
12,480
|
12,480
|
||||||||||||||||||||
|
Shares used in computation - diluted
|
12,511
|
12,511
|
12,480
|
12,480
|
||||||||||||||||||||
|
Dividends declared per common share
|
$
|
0.17
|
$
|
0.17
|
$
|
0.34
|
$
|
0.34
|
||||||||||||||||
Consolidated Statement of Net Income as of March 31, 2016:
|
For the Three Months Ended
|
||||||||||||
|
As Reported
March 31, 2016
|
Adjustments
|
As Restated
March 31, 2016
|
||||||||||
|
Net patient revenues
|
$
|
85,049
|
$
|
-
|
$
|
85,049
|
||||||
|
Other revenues
|
1,859
|
-
|
1,859
|
|||||||||
|
Net revenues
|
86,908
|
-
|
86,908
|
|||||||||
|
Clinic operating costs:
|
||||||||||||
|
Salaries and related costs
|
47,804
|
-
|
47,804
|
|||||||||
|
Rent, clinic supplies, contract labor and other
|
17,507
|
-
|
17,507
|
|||||||||
|
Provision for doubtful accounts
|
1,089
|
-
|
1,089
|
|||||||||
|
Closure costs
|
13
|
-
|
13
|
|||||||||
|
Total clinic operating costs
|
66,413
|
-
|
66,413
|
|||||||||
|
Gross margin
|
20,495
|
-
|
20,495
|
|||||||||
|
Corporate office costs
|
9,004
|
-
|
9,004
|
|||||||||
|
Operating income
|
11,491
|
-
|
11,491
|
|||||||||
|
Interest and other income, net
|
20
|
-
|
20
|
|||||||||
|
Interest expense
|
||||||||||||
|
Mandatorily redeemable non-controlling interests - change in redemption value
|
-
|
(2,191
|
)
|
(2,191
|
)
|
|||||||
|
Mandatorily redeemable non-controlling interests - earnings allocable
|
-
|
(887
|
)
|
(887
|
)
|
|||||||
|
Debt and other
|
(308
|
)
|
-
|
(308
|
)
|
|||||||
|
Total interest expense
|
(308
|
)
|
(3,078
|
)
|
(3,386
|
)
|
||||||
|
Income before taxes
|
11,203
|
(3,078
|
)
|
8,125
|
||||||||
|
Provision for income taxes
|
3,523
|
(1,351
|
)
|
2,172
|
||||||||
|
Net income
|
7,680
|
(1,727
|
)
|
5,953
|
||||||||
|
Less: net income attributable to non-controlling interests
|
(2,352
|
)
|
887
|
(1,465
|
)
|
|||||||
|
Net income attributable to USPH shareholders
|
$
|
5,328
|
$
|
(840
|
)
|
$
|
4,488
|
|||||
|
Basic and diluted earnings per share attributable to USPH shareholders
|
$
|
0.43
|
$
|
(0.07
|
)
|
$
|
0.36
|
|||||
|
Shares used in computation - basic
|
12,448
|
12,448
|
||||||||||
|
Shares used in computation - diluted
|
12,448
|
12,448
|
||||||||||
|
Dividends declared per common share
|
$
|
0.17
|
$
|
0.17
|
||||||||
Consolidated Statement of Net Income as of September 30, 2015:
|
For the Three Months Ended
|
For the Nine Months Ended
|
|||||||||||||||||||||||
|
As Reported
September 30, 2015
|
Adjustments
|
As Restated
September 30, 2015
|
As Reported
September 30, 2015
|
Adjustments
|
As Restated
September 30, 2015
|
|||||||||||||||||||
|
Net patient revenues
|
$
|
82,154
|
$
|
-
|
$
|
82,154
|
$
|
239,412
|
$
|
-
|
$
|
239,412
|
||||||||||||
|
Other revenues
|
1,895
|
-
|
1,895
|
5,166
|
-
|
5,166
|
||||||||||||||||||
|
Net revenues
|
84,049
|
-
|
84,049
|
244,578
|
-
|
244,578
|
||||||||||||||||||
|
Clinic operating costs:
|
||||||||||||||||||||||||
|
Salaries and related costs
|
46,594
|
-
|
46,594
|
134,044
|
-
|
134,044
|
||||||||||||||||||
|
Rent, clinic supplies, contract labor and other
|
17,428
|
-
|
17,428
|
50,434
|
-
|
50,434
|
||||||||||||||||||
|
Provision for doubtful accounts
|
1,067
|
-
|
1,067
|
3,119
|
-
|
3,119
|
||||||||||||||||||
|
Closure costs
|
88
|
-
|
88
|
125
|
-
|
125
|
||||||||||||||||||
|
Total clinic operating costs
|
65,177
|
-
|
65,177
|
187,722
|
-
|
187,722
|
||||||||||||||||||
|
Gross margin
|
18,872
|
-
|
18,872
|
56,856
|
-
|
56,856
|
||||||||||||||||||
|
Corporate office costs
|
6,923
|
-
|
6,923
|
22,173
|
-
|
22,173
|
||||||||||||||||||
|
Operating income
|
11,949
|
-
|
11,949
|
34,683
|
-
|
34,683
|
||||||||||||||||||
|
Interest and other income, net
|
24
|
-
|
24
|
48
|
-
|
48
|
||||||||||||||||||
|
Interest expense
|
||||||||||||||||||||||||
|
Mandatorily redeemable non-controlling interests - change in redemption value
|
-
|
(501
|
)
|
(501
|
)
|
-
|
(697
|
)
|
(697
|
)
|
||||||||||||||
|
Mandatorily redeemable non-controlling interests - earnings allocable
|
-
|
(778
|
)
|
(778
|
)
|
-
|
(2,674
|
)
|
(2,674
|
)
|
||||||||||||||
|
Debt and other
|
(255
|
)
|
-
|
(255
|
)
|
(765
|
)
|
-
|
(765
|
)
|
||||||||||||||
|
Total interest expense
|
(255
|
)
|
(1,279
|
)
|
(1,534
|
)
|
(765
|
)
|
(3,371
|
)
|
(4,136
|
)
|
||||||||||||
|
Income before taxes
|
11,718
|
(1,279
|
)
|
10,439
|
33,966
|
(3,371
|
)
|
30,595
|
||||||||||||||||
|
Provision for income taxes
|
3,654
|
(189
|
)
|
3,465
|
10,634
|
(263
|
)
|
10,371
|
||||||||||||||||
|
Net income
|
8,064
|
(1,090
|
)
|
6,974
|
23,332
|
(3,108
|
)
|
20,224
|
||||||||||||||||
|
Less: net income attributable to non-controlling interests
|
(2,246
|
)
|
778
|
(1,468
|
)
|
(7,044
|
)
|
2,674
|
(4,370
|
)
|
||||||||||||||
|
Net income attributable to USPH shareholders
|
$
|
5,818
|
$
|
(312
|
)
|
$
|
5,506
|
$
|
16,288
|
$
|
(434
|
)
|
$
|
15,854
|
||||||||||
|
Basic and diluted earnings per share attributable to USPH shareholders
|
$
|
0.47
|
$
|
(0.03
|
)
|
$
|
0.44
|
$
|
1.29
|
$
|
(0.01
|
)
|
$
|
1.28
|
||||||||||
|
Shares used in computation - basic
|
12,421
|
12,421
|
12,382
|
12,382
|
||||||||||||||||||||
|
Shares used in computation - diluted
|
12,421
|
12,421
|
12,382
|
12,382
|
||||||||||||||||||||
|
Dividends declared per common share
|
$
|
0.15
|
$
|
0.15
|
$
|
0.45
|
$
|
0.45
|
||||||||||||||||
Consolidated Statement of Net Income as of June 30, 2015:
|
For the Three Months Ended
|
For the Six Months Ended
|
|||||||||||||||||||||||
|
As Reported
June 30, 2015
|
Adjustments
|
As Restated
June 30, 2015
|
As Reported
June 30, 2015
|
Adjustments
|
As Restated
June 30, 2015
|
|||||||||||||||||||
|
Net patient revenues
|
$
|
81,451
|
$
|
-
|
$
|
81,451
|
$
|
157,258
|
$
|
-
|
$
|
157,258
|
||||||||||||
|
Other revenues
|
1,837
|
-
|
1,837
|
3,271
|
-
|
3,271
|
||||||||||||||||||
|
Net revenues
|
83,288
|
-
|
83,288
|
160,529
|
-
|
160,529
|
||||||||||||||||||
|
Clinic operating costs:
|
||||||||||||||||||||||||
|
Salaries and related costs
|
44,398
|
-
|
44,398
|
87,450
|
-
|
87,450
|
||||||||||||||||||
|
Rent, clinic supplies, contract labor and other
|
16,681
|
-
|
16,681
|
33,006
|
-
|
33,006
|
||||||||||||||||||
|
Provision for doubtful accounts
|
1,062
|
-
|
1,062
|
2,052
|
-
|
2,052
|
||||||||||||||||||
|
Closure costs
|
5
|
-
|
5
|
37
|
-
|
37
|
||||||||||||||||||
|
Total clinic operating costs
|
62,146
|
-
|
62,146
|
122,545
|
-
|
122,545
|
||||||||||||||||||
|
Gross margin
|
21,142
|
-
|
21,142
|
37,984
|
-
|
37,984
|
||||||||||||||||||
|
Corporate office costs
|
7,593
|
-
|
7,593
|
15,250
|
-
|
15,250
|
||||||||||||||||||
|
Operating income
|
13,549
|
-
|
13,549
|
22,734
|
-
|
22,734
|
||||||||||||||||||
|
|
||||||||||||||||||||||||
|
Interest and other income, net
|
16
|
-
|
16
|
24
|
-
|
24
|
||||||||||||||||||
|
Interest expense
|
||||||||||||||||||||||||
|
Mandatorily redeemable non-controlling interests - change in redemption value
|
-
|
48
|
48
|
-
|
(196
|
)
|
(196
|
)
|
||||||||||||||||
|
Mandatorily redeemable non-controlling interests - earnings allocable
|
-
|
(1,190
|
)
|
(1,190
|
)
|
-
|
(1,896
|
)
|
(1,896
|
)
|
||||||||||||||
|
Debt and other
|
(245
|
)
|
-
|
(245
|
)
|
(510
|
)
|
-
|
(510
|
)
|
||||||||||||||
|
Total interest expense
|
(245
|
)
|
(1,142
|
)
|
(1,387
|
)
|
(510
|
)
|
(2,092
|
)
|
(2,602
|
)
|
||||||||||||
|
Income before taxes
|
13,320
|
(1,142
|
)
|
12,178
|
22,248
|
(2,092
|
)
|
20,156
|
||||||||||||||||
|
Provision for income taxes
|
4,203
|
18
|
4,221
|
6,980
|
(74
|
)
|
6,906
|
|||||||||||||||||
|
Net income
|
9,117
|
(1,160
|
)
|
7,957
|
15,268
|
(2,018
|
)
|
13,250
|
||||||||||||||||
|
Less: net income attributable to non-controlling interests
|
(2,813
|
)
|
1,190
|
(1,623
|
)
|
(4,798
|
)
|
1,896
|
(2,902
|
)
|
||||||||||||||
|
Net income attributable to USPH shareholders
|
$
|
6,304
|
$
|
30
|
$
|
6,334
|
$
|
10,470
|
$
|
(122
|
)
|
$
|
10,348
|
|||||||||||
|
Basic and diluted earnings per share attributable to USPH shareholders
|
$
|
0.48
|
$
|
0.03
|
$
|
0.51
|
$
|
0.82
|
$
|
0.02
|
$
|
0.84
|
||||||||||||
|
Shares used in computation - basic
|
12,409
|
12,409
|
12,362
|
12,362
|
||||||||||||||||||||
|
Shares used in computation - diluted
|
12,409
|
12,409
|
12,362
|
12,362
|
||||||||||||||||||||
|
Dividends declared per common share
|
$
|
0.15
|
$
|
0.15
|
$
|
0.30
|
$
|
0.30
|
||||||||||||||||
Consolidated Statement of Net Income as of March 31, 2015:
|
For the Three Months Ended
|
||||||||||||
|
As Reported
March 31, 2015
|
Adjustments
|
As Restated
March 31, 2015
|
||||||||||
|
Net patient revenues
|
$
|
75,807
|
$
|
-
|
$
|
75,807
|
||||||
|
Other revenues
|
1,434
|
-
|
1,434
|
|||||||||
|
Net revenues
|
77,241
|
-
|
77,241
|
|||||||||
|
Clinic operating costs:
|
||||||||||||
|
Salaries and related costs
|
43,052
|
-
|
43,052
|
|||||||||
|
Rent, clinic supplies, contract labor and other
|
16,325
|
-
|
16,325
|
|||||||||
|
Provision for doubtful accounts
|
990
|
-
|
990
|
|||||||||
|
Closure costs
|
32
|
-
|
32
|
|||||||||
|
Total clinic operating costs
|
60,399
|
-
|
60,399
|
|||||||||
|
Gross margin
|
16,842
|
-
|
16,842
|
|||||||||
|
Corporate office costs
|
7,657
|
-
|
7,657
|
|||||||||
|
Operating income
|
9,185
|
-
|
9,185
|
|||||||||
|
Interest and other income, net
|
8
|
-
|
8
|
|||||||||
|
Interest expense
|
||||||||||||
|
Mandatorily redeemable non-controlling interests - change in redemption value
|
-
|
(244
|
)
|
(244
|
)
|
|||||||
|
Mandatorily redeemable non-controlling interests - earnings allocable
|
-
|
(706
|
)
|
(706
|
)
|
|||||||
|
Debt and other
|
(265
|
)
|
-
|
(265
|
)
|
|||||||
|
Total interest expense
|
(265
|
)
|
(950
|
)
|
(1,215
|
)
|
||||||
|
Income before taxes
|
8,928
|
(950
|
)
|
7,978
|
||||||||
|
Provision for income taxes
|
2,777
|
(92
|
)
|
2,685
|
||||||||
|
Net income
|
6,151
|
(858
|
)
|
5,293
|
||||||||
|
Less: net income attributable to non-controlling interests
|
(1,985
|
)
|
706
|
(1,279
|
)
|
|||||||
|
Net income attributable to USPH shareholders
|
$
|
4,166
|
$
|
(152
|
)
|
$
|
4,014
|
|||||
|
Basic and diluted earnings per share attributable to USPH shareholders
|
$
|
0.34
|
$
|
(0.01
|
)
|
$
|
0.33
|
|||||
|
Shares used in computation - basic
|
12,313
|
12,313
|
||||||||||
|
Shares used in computation - diluted
|
12,313
|
12,313
|
||||||||||
|
Dividends declared per common share
|
$
|
0.15
|
$
|
0.15
|
||||||||
Consolidated Statement of Cash Flows as of September 30, 2016:
|
For the Nine Months Ended
|
||||||||||||
|
As Reported
|
As Restated
|
|||||||||||
|
September 30, 2016
|
Adjustments
|
September 30, 2016
|
||||||||||
|
OPERATING ACTIVITIES
|
||||||||||||
|
Net income including non-controlling interests
|
$
|
25,712
|
$
|
(5,954
|
)
|
$
|
19,758
|
|||||
|
Adjustments to reconcile net income including non-controlling interests to net cash provided by operating activities:
|
||||||||||||
|
Depreciation and amortization
|
6,210
|
-
|
6,210
|
|||||||||
|
Provision for doubtful accounts
|
2,962
|
-
|
2,962
|
|||||||||
|
Equity-based awards compensation expense
|
3,748
|
-
|
3,748
|
|||||||||
|
Loss (gain) on sale of fixed assets
|
31
|
-
|
31
|
|||||||||
|
Excess tax benefit from equity-based awards
|
(798
|
)
|
798
|
-
|
||||||||
|
Deferred income tax
|
5,688
|
(2,450
|
)
|
3,238
|
||||||||
|
Other
|
-
|
-
|
-
|
|||||||||
|
Changes in operating assets and liabilities:
|
-
|
|||||||||||
|
Increase in patient accounts receivable
|
(2,548
|
)
|
-
|
(2,548
|
)
|
|||||||
|
(Increase) decrease in accounts receivable - other
|
116
|
-
|
116
|
|||||||||
|
Decrease (increase) in other assets
|
(4,979
|
)
|
-
|
(4,979
|
)
|
|||||||
|
Increase (decrease) in accounts payable and accrued expenses
|
5,178
|
(1,596
|
)
|
3,582
|
||||||||
|
Increase (decrease) in mandatorily redeemable non-controlling interests
|
-
|
5,372
|
5,372
|
|||||||||
|
(Decrease) increase in other liabilities
|
708
|
-
|
708
|
|||||||||
|
Net cash provided by operating activities
|
42,028
|
(3,830
|
)
|
38,198
|
||||||||
|
INVESTING ACTIVITIES
|
||||||||||||
|
Purchase of fixed assets
|
(5,620
|
)
|
-
|
(5,620
|
)
|
|||||||
|
Purchase of businesses, net of cash acquired
|
(12,958
|
)
|
-
|
(12,958
|
)
|
|||||||
|
Acquisitions of non-controlling interests
|
(1,800
|
)
|
1,136
|
(664
|
)
|
|||||||
|
Proceeds on sale of fixed assets, net
|
42
|
-
|
42
|
|||||||||
|
Net cash used in investing activities
|
(20,336
|
)
|
1,136
|
(19,200
|
)
|
|||||||
|
FINANCING ACTIVITIES
|
||||||||||||
|
Distributions to non-controlling interests
|
(8,271
|
)
|
3,830
|
(4,441
|
)
|
|||||||
|
Cash dividends to shareholders - funded
|
(6,382
|
)
|
-
|
(6,382
|
)
|
|||||||
|
Proceeds from revolving line of credit
|
128,000
|
-
|
128,000
|
|||||||||
|
Payments on revolving line of credit
|
(136,000
|
)
|
-
|
(136,000
|
)
|
|||||||
|
Payments to settle mandatorily redeemable non-controlling interests
|
-
|
(1,136
|
)
|
(1,136
|
)
|
|||||||
|
Principal payments on notes payable
|
(592
|
)
|
-
|
(592
|
)
|
|||||||
|
Tax benefit from equity-based awards
|
798
|
-
|
798
|
|||||||||
|
Other
|
1
|
-
|
1
|
|||||||||
|
Net cash used in financing activities
|
(22,446
|
)
|
2,694
|
(19,752
|
)
|
|||||||
|
Net increase in cash and cash equivalents
|
(754
|
)
|
-
|
(754
|
)
|
|||||||
|
Cash and cash equivalents - beginning of period
|
15,778
|
-
|
15,778
|
|||||||||
|
Cash and cash equivalents - end of period
|
$
|
15,024
|
$
|
-
|
$
|
15,024
|
||||||
|
SUPPLEMENTAL DISCLOSURES OF CASH FLOW INFORMATION
|
||||||||||||
|
Cash paid during the period for:
|
||||||||||||
|
Income taxes
|
$
|
10,051
|
$
|
10,051
|
||||||||
|
Interest
|
$
|
770
|
$
|
770
|
||||||||
|
Non-cash investing and financing transactions during the period:
|
||||||||||||
|
Purchase of business - seller financing portion
|
$
|
500
|
$
|
500
|
||||||||
|
Acquisition of non-controlling interest - seller financing portion
|
$
|
514
|
$
|
388
|
||||||||
|
Payment to settle redeemable non-controlling interest - financing portion
|
$
|
-
|
$
|
126
|
||||||||
|
Sale of non-controlling interests
|
$
|
(148
|
)
|
$
|
(148
|
)
|
||||||
Consolidated Statement of Cash Flows as of June 30, 2016:
|
For the Six Months Ended
|
||||||||||||
|
As Reported
|
As Restated
|
|||||||||||
|
June 30, 2016
|
Adjustments
|
June 30, 2016
|
||||||||||
|
OPERATING ACTIVITIES
|
||||||||||||
|
Net income including non-controlling interests
|
$
|
17,740
|
$
|
(4,116
|
)
|
$
|
13,624
|
|||||
|
Adjustments to reconcile net income including non-controlling interests to net cash provided by operating activities:
|
||||||||||||
|
Depreciation and amortization
|
4,158
|
-
|
4,158
|
|||||||||
|
Provision for doubtful accounts
|
2,045
|
-
|
2,045
|
|||||||||
|
Equity-based awards compensation expense
|
2,484
|
-
|
2,484
|
|||||||||
|
Loss (gain) on sale of fixed assets
|
-
|
-
|
-
|
|||||||||
|
Excess tax benefit from equity-based awards
|
(556
|
)
|
556
|
-
|
||||||||
|
Deferred income tax
|
4,170
|
(1,667
|
)
|
2,503
|
||||||||
|
Other
|
-
|
-
|
-
|
|||||||||
|
Changes in operating assets and liabilities:
|
-
|
|||||||||||
|
Increase in patient accounts receivable
|
(2,449
|
)
|
-
|
(2,449
|
)
|
|||||||
|
(Increase) decrease in accounts receivable - other
|
53
|
-
|
53
|
|||||||||
|
Decrease (increase) in other assets
|
(2,443
|
)
|
-
|
(2,443
|
)
|
|||||||
|
Increase (decrease) in accounts payable and accrued expenses
|
7,715
|
(1,112
|
)
|
6,603
|
||||||||
|
Increase (decrease) in mandatorily redeemable non-controlling interests
|
-
|
4,028
|
4,028
|
|||||||||
|
(Decrease) increase in other liabilities
|
447
|
-
|
447
|
|||||||||
|
Net cash provided by operating activities
|
33,364
|
(2,311
|
)
|
31,053
|
||||||||
|
INVESTING ACTIVITIES
|
||||||||||||
|
Purchase of fixed assets
|
(3,453
|
)
|
-
|
(3,453
|
)
|
|||||||
|
Purchase of businesses, net of cash acquired
|
(12,958
|
)
|
-
|
(12,958
|
)
|
|||||||
|
Acquisitions of non-controlling interests, net of sales
|
(1,386
|
)
|
1,136
|
(250
|
)
|
|||||||
|
Proceeds on sale of fixed assets, net
|
42
|
-
|
42
|
|||||||||
|
Net cash used in investing activities
|
(17,755
|
)
|
1,136
|
(16,619
|
)
|
|||||||
|
FINANCING ACTIVITIES
|
||||||||||||
|
Distributions to non-controlling interests
|
(5,204
|
)
|
2,311
|
(2,893
|
)
|
|||||||
|
Cash dividends to shareholders - funded
|
(4,254
|
)
|
-
|
(4,254
|
)
|
|||||||
|
Proceeds from revolving line of credit
|
93,000
|
-
|
93,000
|
|||||||||
|
Payments on revolving line of credit
|
(94,500
|
)
|
-
|
(94,500
|
)
|
|||||||
|
Payments to settle mandatorily redeemable non-controlling interests
|
-
|
(1,136
|
)
|
(1,136
|
)
|
|||||||
|
Principal payments on notes payable
|
(533
|
)
|
-
|
(533
|
)
|
|||||||
|
Tax benefit from equity-based awards
|
556
|
-
|
556
|
|||||||||
|
Other
|
1
|
-
|
1
|
|||||||||
|
Net cash used in financing activities
|
(10,934
|
)
|
1,175
|
(9,759
|
)
|
|||||||
|
Net increase in cash and cash equivalents
|
4,675
|
-
|
4,675
|
|||||||||
|
Cash and cash equivalents - beginning of period
|
15,778
|
-
|
15,778
|
|||||||||
|
Cash and cash equivalents - end of period
|
$
|
20,453
|
$
|
-
|
$
|
20,453
|
||||||
|
SUPPLEMENTAL DISCLOSURES OF CASH FLOW INFORMATION
|
||||||||||||
|
Cash paid during the period for:
|
||||||||||||
|
Income taxes
|
$
|
5,513
|
$
|
5,513
|
||||||||
|
Interest
|
$
|
512
|
$
|
512
|
||||||||
|
Non-cash investing and financing transactions during the period:
|
||||||||||||
|
Purchase of business - seller financing portion
|
$
|
500
|
$
|
500
|
||||||||
|
Acquisition of non-controlling interest - seller financing portion
|
$
|
514
|
$
|
388
|
||||||||
|
Payment to settle redeemable non-controlling interest - financing portion
|
$
|
-
|
$
|
126
|
||||||||
|
Sale of non-controlling interests
|
$
|
(148
|
)
|
$
|
(148
|
)
|
||||||
Consolidated Statement of Cash Flows as of March 31, 2016:
|
For the Three Months Ended
|
||||||||||||
|
As Reported
|
As Restated
|
|||||||||||
|
March 31, 2016
|
Adjustments
|
March 31, 2016
|
||||||||||
|
OPERATING ACTIVITIES
|
||||||||||||
|
Net income including non-controlling interests
|
$
|
7,680
|
$
|
(1,727
|
)
|
$
|
5,953
|
|||||
|
Adjustments to reconcile net income including non-controlling interests to net cash provided by operating activities:
|
||||||||||||
|
Depreciation and amortization
|
2,091
|
-
|
2,091
|
|||||||||
|
Provision for doubtful accounts
|
1,089
|
-
|
1,089
|
|||||||||
|
Equity-based awards compensation expense
|
1,221
|
-
|
1,221
|
|||||||||
|
Loss (gain) on sale of fixed assets
|
(19
|
)
|
-
|
(19
|
)
|
|||||||
|
Excess tax benefit from equity-based awards
|
(323
|
)
|
465
|
142
|
||||||||
|
Deferred income tax
|
2,709
|
(886
|
)
|
1,823
|
||||||||
|
Other
|
-
|
-
|
-
|
|||||||||
|
Changes in operating assets and liabilities:
|
-
|
|||||||||||
|
Increase in patient accounts receivable
|
(2,185
|
)
|
-
|
(2,185
|
)
|
|||||||
|
(Increase) decrease in accounts receivable - other
|
43
|
-
|
43
|
|||||||||
|
Decrease (increase) in other assets
|
(2,282
|
)
|
-
|
(2,282
|
)
|
|||||||
|
Increase (decrease) in accounts payable and accrued expenses
|
4,322
|
(930
|
)
|
3,392
|
||||||||
|
Increase (decrease) in mandatorily redeemable non-controlling interests
|
-
|
2,578
|
2,578
|
|||||||||
|
(Decrease) increase in other liabilities
|
365
|
-
|
365
|
|||||||||
|
Net cash provided by operating activities
|
14,711
|
(500
|
)
|
14,211
|
||||||||
|
INVESTING ACTIVITIES
|
||||||||||||
|
Purchase of fixed assets
|
(1,738
|
)
|
-
|
(1,738
|
)
|
|||||||
|
Purchase of businesses, net of cash acquired
|
(12,899
|
)
|
-
|
(12,899
|
)
|
|||||||
|
Acquisitions of non-controlling interests
|
(1,524
|
)
|
1,136
|
(388
|
)
|
|||||||
|
Proceeds on sale of fixed assets, net
|
42
|
-
|
42
|
|||||||||
|
Net cash used in investing activities
|
(16,119
|
)
|
1,136
|
(14,983
|
)
|
|||||||
|
FINANCING ACTIVITIES
|
||||||||||||
|
Distributions to non-controlling interests
|
(1,613
|
)
|
500
|
(1,113
|
)
|
|||||||
|
Cash dividends to shareholders - funded
|
(2,125
|
)
|
-
|
(2,125
|
)
|
|||||||
|
Proceeds from revolving line of credit
|
49,000
|
-
|
49,000
|
|||||||||
|
Payments on revolving line of credit
|
(40,500
|
)
|
-
|
(40,500
|
)
|
|||||||
|
Payments to settle mandatorily redeemable non-controlling interests
|
-
|
(1,136
|
)
|
(1,136
|
)
|
|||||||
|
Principal payments on notes payable
|
(250
|
)
|
-
|
(250
|
)
|
|||||||
|
Tax benefit from equity-based awards
|
323
|
-
|
323
|
|||||||||
|
Other
|
1
|
-
|
1
|
|||||||||
|
Net cash used in financing activities
|
4,836
|
(636
|
)
|
4,200
|
||||||||
|
Net increase in cash and cash equivalents
|
3,428
|
-
|
3,428
|
|||||||||
|
Cash and cash equivalents - beginning of period
|
15,778
|
-
|
15,778
|
|||||||||
|
Cash and cash equivalents - end of period
|
$
|
19,206
|
$
|
-
|
$
|
19,206
|
||||||
|
SUPPLEMENTAL DISCLOSURES OF CASH FLOW INFORMATION
|
||||||||||||
|
Cash paid during the period for:
|
||||||||||||
|
Income taxes
|
$
|
2,265
|
$
|
2,265
|
||||||||
|
Interest
|
$
|
248
|
$
|
248
|
||||||||
|
Non-cash investing and financing transactions during the period:
|
||||||||||||
|
Purchase of business - seller financing portion
|
$
|
500
|
$
|
500
|
||||||||
|
Acquisition of non-controlling interest - seller financing portion
|
$
|
514
|
$
|
388
|
||||||||
|
Payment to settle redeemable non-controlling interest - financing portion
|
$
|
-
|
$
|
126
|
||||||||
Consolidated Statement of Cash Flows as of September 30, 2015:
|
For the Nine Months Ended
|
||||||||||||
|
As Reported
September 30, 2015
|
Adjustments
|
As Restated
September 30, 2015
|
||||||||||
|
OPERATING ACTIVITIES
|
||||||||||||
|
Net income including non-controlling interests
|
$
|
23,332
|
$
|
(3,108
|
)
|
$
|
20,224
|
|||||
|
Adjustments to reconcile net income including non-controlling interests to net cash provided by operating activities:
|
||||||||||||
|
Depreciation and amortization
|
5,656
|
-
|
5,656
|
|||||||||
|
Provision for doubtful accounts
|
3,119
|
-
|
3,119
|
|||||||||
|
Equity-based awards compensation expense
|
3,368
|
-
|
3,368
|
|||||||||
|
Loss (gain) on sale of fixed assets
|
3
|
-
|
3
|
|||||||||
|
Excess tax benefit from equity-based awards
|
(816
|
)
|
-
|
(816
|
)
|
|||||||
|
Deferred income tax
|
3,181
|
(263
|
)
|
2,918
|
||||||||
|
Other
|
180
|
-
|
180
|
|||||||||
|
Changes in operating assets and liabilities:
|
-
|
|||||||||||
|
Increase in patient accounts receivable
|
(4,148
|
)
|
-
|
(4,148
|
)
|
|||||||
|
(Increase) decrease in accounts receivable - other
|
(145
|
)
|
-
|
(145
|
)
|
|||||||
|
Decrease (increase) in other assets
|
(1,485
|
)
|
-
|
(1,485
|
)
|
|||||||
|
Increase (decrease) in accounts payable and accrued expenses
|
(3,766
|
)
|
-
|
(3,766
|
)
|
|||||||
|
Increase (decrease) in mandatorily redeemable non-controlling interests
|
-
|
683
|
683
|
|||||||||
|
(Decrease) increase in other liabilities
|
380
|
-
|
380
|
|||||||||
|
Net cash provided by operating activities
|
28,859
|
(2,688
|
)
|
26,171
|
||||||||
|
INVESTING ACTIVITIES
|
||||||||||||
|
Purchase of fixed assets
|
(4,690
|
)
|
-
|
(4,690
|
)
|
|||||||
|
Purchase of businesses, net of cash acquired
|
(14,434
|
)
|
-
|
(14,434
|
)
|
|||||||
|
Acquisitions of non-controlling interests
|
(2,802
|
)
|
1,860
|
(942
|
)
|
|||||||
|
Proceeds on sale of fixed assets, net
|
71
|
-
|
71
|
|||||||||
|
Net cash used in investing activities
|
(21,855
|
)
|
1,860
|
(19,995
|
)
|
|||||||
|
FINANCING ACTIVITIES
|
||||||||||||
|
Distributions to non-controlling interests
|
(6,836
|
)
|
2,688
|
(4,148
|
)
|
|||||||
|
Cash dividends to shareholders - funded
|
(5,586
|
)
|
-
|
(5,586
|
)
|
|||||||
|
Proceeds from revolving line of credit
|
75,000
|
-
|
75,000
|
|||||||||
|
Payments on revolving line of credit
|
(63,500
|
)
|
-
|
(63,500
|
)
|
|||||||
|
Payments to settle mandatorily redeemable non-controlling interests
|
-
|
(1,860
|
)
|
(1,860
|
)
|
|||||||
|
Principal payments on notes payable
|
(616
|
)
|
-
|
(616
|
)
|
|||||||
|
Tax benefit from equity-based awards
|
816
|
-
|
816
|
|||||||||
|
Other
|
5
|
-
|
5
|
|||||||||
|
Net cash (used) in provided by financing activities
|
(717
|
)
|
828
|
111
|
||||||||
|
Net increase in cash and cash equivalents
|
6,287
|
-
|
6,287
|
|||||||||
|
Cash and cash equivalents - beginning of period
|
14,271
|
-
|
14,271
|
|||||||||
|
Cash and cash equivalents - end of period
|
$
|
20,558
|
$
|
-
|
$
|
20,558
|
||||||
|
SUPPLEMENTAL DISCLOSURES OF CASH FLOW INFORMATION
|
||||||||||||
|
Cash paid during the period for:
|
||||||||||||
|
Income taxes
|
$
|
5,659
|
$
|
5,659
|
||||||||
|
Interest
|
$
|
616
|
$
|
616
|
||||||||
|
Non-cash investing and financing transactions during the period:
|
||||||||||||
|
Purchase of business - seller financing portion
|
$
|
1,350
|
$
|
1,350
|
||||||||
|
Acquisition of non-controlling interest - seller financing portion
|
$
|
1,240
|
$
|
-
|
||||||||
|
Payment to settle redeemable non-controlling interest - financing portion
|
$
|
-
|
$
|
1,240
|
||||||||
|
Revaluation of madatorily redeemable non-controlling interests
|
$ | 627 | $ | 697 | ||||||||
Consolidated Statement of Cash Flows as of June 30, 2015:
|
For the Six Months Ended
|
||||||||||||
|
As Reported
June 30, 2015
|
Adjustments
|
As Restated
June 30, 2015
|
||||||||||
|
OPERATING ACTIVITIES
|
||||||||||||
|
Net income including non-controlling interests
|
$
|
15,268
|
$
|
(2,018
|
)
|
$
|
13,250
|
|||||
|
Adjustments to reconcile net income including non-controlling interests to net cash provided by operating activities:
|
||||||||||||
|
Depreciation and amortization
|
3,674
|
-
|
3,674
|
|||||||||
|
Provision for doubtful accounts
|
2,052
|
-
|
2,052
|
|||||||||
|
Equity-based awards compensation expense
|
2,206
|
-
|
2,206
|
|||||||||
|
Loss (gain) on sale of fixed assets
|
(13
|
)
|
-
|
(13
|
)
|
|||||||
|
Excess tax benefit from equity-based awards
|
(430
|
)
|
-
|
(430
|
)
|
|||||||
|
Deferred income tax
|
2,130
|
(74
|
)
|
2,056
|
||||||||
|
Other
|
111
|
-
|
111
|
|||||||||
|
Changes in operating assets and liabilities:
|
||||||||||||
|
Increase in patient accounts receivable
|
(2,880
|
)
|
-
|
(2,880
|
)
|
|||||||
|
(Increase) decrease in accounts receivable - other
|
165
|
-
|
165
|
|||||||||
|
Decrease (increase) in other assets
|
(13
|
)
|
-
|
(13
|
)
|
|||||||
|
Increase (decrease) in accounts payable and accrued expenses
|
(3,958
|
)
|
-
|
(3,958
|
)
|
|||||||
|
Increase (decrease) in mandatorily redeemable non-controlling interests
|
-
|
90
|
90
|
|||||||||
|
(Decrease) increase in other liabilities
|
927
|
-
|
927
|
|||||||||
|
Net cash provided by operating activities
|
19,239
|
(2,002
|
)
|
17,237
|
||||||||
|
INVESTING ACTIVITIES
|
||||||||||||
|
Purchase of fixed assets
|
(2,873
|
)
|
-
|
(2,873
|
)
|
|||||||
|
Purchase of businesses, net of cash acquired
|
(14,467
|
)
|
-
|
(14,467
|
)
|
|||||||
|
Acquisitions of non-controlling interests
|
(968
|
)
|
-
|
(968
|
)
|
|||||||
|
Proceeds on sale of fixed assets, net
|
72
|
-
|
72
|
|||||||||
|
Net cash used in investing activities
|
(18,236
|
)
|
-
|
(18,236
|
)
|
|||||||
|
FINANCING ACTIVITIES
|
||||||||||||
|
Distributions to non-controlling interests
|
(4,906
|
)
|
2,002
|
(2,904
|
)
|
|||||||
|
Cash dividends to shareholders - funded
|
(3,723
|
)
|
-
|
(3,723
|
)
|
|||||||
|
Proceeds from revolving line of credit
|
51,000
|
-
|
51,000
|
|||||||||
|
Payments on revolving line of credit
|
(44,500
|
)
|
-
|
(44,500
|
)
|
|||||||
|
Principal payments on notes payable
|
(608
|
)
|
-
|
(608
|
)
|
|||||||
|
Tax benefit from equity-based awards
|
430
|
-
|
430
|
|||||||||
|
Other
|
5
|
-
|
5
|
|||||||||
|
Net cash used in financing activities
|
(2,302
|
)
|
2,002
|
(300
|
)
|
|||||||
|
Net increase in cash and cash equivalents
|
(1,299
|
)
|
-
|
(1,299
|
)
|
|||||||
|
Cash and cash equivalents - beginning of period
|
14,271
|
-
|
14,271
|
|||||||||
|
Cash and cash equivalents - end of period
|
$
|
12,972
|
$
|
-
|
$
|
12,972
|
||||||
|
SUPPLEMENTAL DISCLOSURES OF CASH FLOW INFORMATION
|
||||||||||||
|
Cash paid during the period for:
|
||||||||||||
|
Income taxes
|
$
|
3,835
|
$
|
3,835
|
||||||||
|
Interest
|
$
|
460
|
$
|
460
|
||||||||
|
Non-cash investing and financing transactions during the period:
|
||||||||||||
|
Purchase of business - seller financing portion
|
$
|
1,350
|
$
|
1,350
|
||||||||
|
Revaluation of madatorily redeemable non-controlling interests
|
$ | 627 | $ | 196 | ||||||||
Consolidated Statement of Cash Flows as of March 31, 2015:
|
For the Three Months Ended
|
||||||||||||
|
As Reported
March 31, 2015
|
Adjustments
|
As Restated
March 31, 2015
|
||||||||||
|
OPERATING ACTIVITIES
|
||||||||||||
|
Net income including non-controlling interests
|
$
|
6,151
|
$
|
(858
|
)
|
$
|
5,293
|
|||||
|
Adjustments to reconcile net income including non-controlling interests to net cash provided by operating activities:
|
||||||||||||
|
Depreciation and amortization
|
1,807
|
-
|
1,807
|
|||||||||
|
Provision for doubtful accounts
|
990
|
-
|
990
|
|||||||||
|
Equity-based awards compensation expense
|
991
|
-
|
991
|
|||||||||
|
Loss (gain) on sale of fixed assets
|
17
|
-
|
17
|
|||||||||
|
Excess tax benefit from equity-based awards
|
(271
|
)
|
-
|
(271
|
)
|
|||||||
|
Deferred income tax
|
565
|
(92
|
)
|
473
|
||||||||
|
Other
|
34
|
-
|
34
|
|||||||||
|
Changes in operating assets and liabilities:
|
||||||||||||
|
Increase in patient accounts receivable
|
(2,185
|
)
|
-
|
(2,185
|
)
|
|||||||
|
(Increase) decrease in accounts receivable - other
|
125
|
-
|
125
|
|||||||||
|
Decrease (increase) in other assets
|
106
|
-
|
106
|
|||||||||
|
Increase (decrease) in accounts payable and accrued expenses
|
(5,976
|
)
|
-
|
(5,976
|
)
|
|||||||
|
Increase (decrease) in mandatorily redeemable non-controlling interests
|
-
|
406
|
406
|
|||||||||
|
(Decrease) increase in other liabilities
|
665
|
-
|
665
|
|||||||||
|
Net cash provided by operating activities
|
3,019
|
(544
|
)
|
2,475
|
||||||||
|
INVESTING ACTIVITIES
|
||||||||||||
|
Purchase of fixed assets
|
(1,419
|
)
|
-
|
(1,419
|
)
|
|||||||
|
Purchase of businesses, net of cash acquired
|
(6,445
|
)
|
-
|
(6,445
|
)
|
|||||||
|
Acquisitions of non-controlling interests
|
(359
|
)
|
-
|
(359
|
)
|
|||||||
|
Proceeds on sale of fixed assets, net
|
8
|
-
|
8
|
|||||||||
|
Net cash used in investing activities
|
(8,215
|
)
|
-
|
(8,215
|
)
|
|||||||
|
FINANCING ACTIVITIES
|
||||||||||||
|
Distributions to non-controlling interests
|
(1,589
|
)
|
544
|
(1,045
|
)
|
|||||||
|
Proceeds from revolving line of credit
|
34,000
|
-
|
34,000
|
|||||||||
|
Payments on revolving line of credit
|
(27,000
|
)
|
-
|
(27,000
|
)
|
|||||||
|
Principal payments on notes payable
|
(200
|
)
|
-
|
(200
|
)
|
|||||||
|
Tax benefit from equity-based awards
|
271
|
-
|
271
|
|||||||||
|
Net cash used in financing activities
|
5,482
|
544
|
6,026
|
|||||||||
|
Net increase in cash and cash equivalents
|
286
|
-
|
286
|
|||||||||
|
Cash and cash equivalents - beginning of period
|
14,271
|
-
|
14,271
|
|||||||||
|
Cash and cash equivalents - end of period
|
$
|
14,557
|
$
|
-
|
$
|
14,557
|
||||||
|
SUPPLEMENTAL DISCLOSURES OF CASH FLOW INFORMATION
|
||||||||||||
|
Cash paid during the period for:
|
||||||||||||
|
Income taxes
|
$
|
1,275
|
$
|
1,275
|
||||||||
|
Interest
|
$
|
235
|
$
|
235
|
||||||||
|
Non-cash investing and financing transactions during the period:
|
||||||||||||
|
Purchase of business - seller financing portion
|
$
|
500
|
$
|
500
|
||||||||
|
Revaluation of madatorily redeemable non-controlling interests
|
$ | - | $ | 244 | ||||||||
Not applicable.
Evaluation of Disclosure Controls and Procedures
Our management, including our Chief Executive Officer and Chief Financial Officer, has conducted an evaluation of the effectiveness of our disclosure controls and procedures (as defined in Rule 13a-15(e) promulgated under the Exchange Act) as of the end of the fiscal period covered by this report. Based upon that evaluation, our Chief Executive Officer and Chief Financial Officer have concluded that as a result of the material weakness in our internal control over financial reporting discussed below, our disclosure controls and procedures were not effective in ensuring that the information required to be disclosed in the reports we file or submit under the Exchange Act is recorded, processed, summarized and reported, within the time periods specified in the rules and forms of the SEC and that such information is accumulated and communicated to our management, including our Chief Executive Officer and Chief Financial Officer, as appropriate to allow timely decisions regarding disclosure.
Management’s Report on Internal Control over Financial Reporting
Management is responsible for establishing and maintaining adequate internal control over financial reporting, as such term is defined in Rule 13a-15(f) under the Exchange Act. U.S. Physical Therapy, Inc. and subsidiaries’ (the “Company”) internal control over financial reporting is designed to provide reasonable assurance regarding the reliability of financial reporting and the preparation of financial statements for external purposes in accordance with generally accepted accounting principles.
Internal control over financial reporting includes those policies and procedures that:
| • |
Pertain to the maintenance of records that, in reasonable detail, accurately and fairly reflect the transactions and dispositions of the assets of the Company;
|
| • |
Provide reasonable assurance that transactions are recorded as necessary to permit preparation of financial statements in accordance with generally accepted accounting principles, and that our receipts and expenditures are being made only in accordance with authorizations of the Company’s management and directors; and
|
| • |
Provide reasonable assurance regarding prevention or timely detection of unauthorized acquisition, use or disposition of the Company’s assets that could have a material effect on the financial statements.
|
Internal control over financial reporting cannot provide absolute assurance of achieving financial reporting objectives because of its inherent limitations. Internal control over financial reporting is a process that involves human diligence and compliance and is subject to lapses in judgment and breakdowns resulting from human failures. Internal control over financial reporting can also be circumvented by collusion or improper management override. Because of such limitations, there is a risk that material misstatements may not be prevented or detected on a timely basis by internal control over financial reporting. Also, projections of any evaluation of effectiveness to future periods are subject to the risk that controls may become inadequate because of changes in conditions, or that the degree of compliance with the policies or procedures may deteriorate. However, these inherent limitations are known features of the financial reporting process. Therefore, it is possible to design into the process safeguards to reduce, though not eliminate, the risk.
Management conducted an assessment of the effectiveness of our internal control over financial reporting as of December 31, 2016. In making this assessment, management used the criteria described in Internal Control — Integrated Framework (2013) issued by the Committee of Sponsoring Organizations of the Treadway Commission. Based on this assessment, management concluded that our internal control over financial reporting was not effective as of December 31, 2016 as a result of the material weakness discussed below.
| · |
Redeemable non-controlling interests – We did not properly account for redeemable non-controlling interests. The Company’s business combination / purchase accounting controls relating to our accounting for redeemable non-controlling interests were not designed effectively to ensure that we correctly interpreted and applied technical accounting requirements concerning the classification of such interests on our consolidated financial statements.
|
The Company’s internal control over financial reporting has been audited by Grant Thornton LLP, an independent registered public accounting firm, as stated in their report included on page 37.
Changes in Internal Control over Financial Reporting
There have been no changes in our internal control over financial reporting during the quarter ended December 31, 2016 that have materially affected, or are reasonably likely to materially affect, our internal control over financial reporting.
Remediation Plan for Material Weaknesses in Internal Control over Financial Reporting for Implementation in 2017
Management has taken certain action to remediate the material weakness in the Company’s internal control over financial reporting.
Redeemable non-controlling interest evaluation:
We have engaged in a robust review of applicable guidance concerning the manner in which limited partnership interests should be reflected on our consolidated financial statements. In addition, we have developed additional processes and procedures to ensure appropriate consideration of such applicable accounting guidance when we acquire partnership interests in the future. We believe that such processes and procedures will enable management to prevent or detect on a timely basis potential future errors in our financial reporting of such interests.
Not applicable.
PART III
Directors
The current directors of the Company are:
|
Nominees:
|
Age
|
Director
Since
|
Position(s) Held
|
|
Jerald L. Pullins
|
75
|
2003
|
Chairman of the Board
|
|
Christopher J. Reading
|
53
|
2004
|
President, Chief Executive Officer and Director
|
|
Lawrance W. McAfee
|
62
|
2004
|
Executive Vice President, Chief Financial Officer and Director
|
|
Mark J. Brookner
|
72
|
1990
|
Director
|
|
Harry S. Chapman
|
72
|
2010
|
Director
|
|
Dr. Bernard A. Harris, Jr.
|
60
|
2005
|
Director
|
|
Marlin W. Johnston (1)
|
85
|
1992
|
Director
|
|
Edward L. Kuntz
|
72
|
2014
|
Director
|
|
Reginald E. Swanson
|
63
|
2007
|
Director (and an employee of STAR Physical Therapy, LP (2)
|
|
Clayton K. Trier
|
65
|
2005
|
Director
|
| (1) |
Mr. Johnston will serve until the 2017 Annual Meeting and not stand for reelection.
|
| (2) |
STAR Physical Therapy, LP is a subsidiary of the Company
|
Director Biographies:
Jerald L. Pullins has served on our Board since 2003, and was appointed Chairman of the Board on May 17, 2011. He is currently engaged in the development and management of private enterprises in the healthcare field. From October 2007 to the present, Mr. Pullins has been the Managing Member of SeniorCare Homes, LLC, which develops, owns and operates supervised, residential homes for senior citizens with Alzheimers, dementia and other memory impairment conditions. Since January 2013, Mr. Pullins has been Chairman and CEO of Baldwin Brothers Cremation, LLC, which owns and operates facilities providing cremation, funeral and related services. From 2007 to May 2013, he served as Chairman of the Board of Directors of Pet Partners, LLC, a private enterprise involved in the acquisition and management of primary care, small animal veterinary hospitals. Mr. Pullins was elected a director of Live Oak Bank, Inc., a publicly held financial institution, in 2011.
Christopher J. Reading was promoted to President and Chief Executive Officer and elected to our Board effective November 1, 2004. Prior to 2004, Mr. Reading served as our Chief Operating Officer since joining us in 2003. From 1990 to 2003, Mr. Reading served in various executive and management positions with HealthSouth Corporation where most recently he served as Senior Vice President of Operations responsible for over 200 facilities located in 10 states. Mr. Reading is a physical therapist.
(3)
Lawrance W. McAfee was promoted to Executive Vice President and elected to our Board effective November 1, 2004. Mr. McAfee also serves as our Chief Financial Officer, a position he has held since joining us in 2003. Mr. McAfee’s prior experience includes having served as Chief Financial Officer of three public companies and President of two private companies.
Mark J. Brookner has served on our Board since August 1998. Mr. Brookner is currently a private investor. He served as our Chief Financial Officer from 1992 to 1998 and as our Secretary and Treasurer during portions of that period.
Harry S. Chapman has served on our Board since August 30, 2010. Mr. Chapman is the Chairman and Chief Executive Officer of Chapman Schewe, Inc., a healthcare insurance and employee benefits consulting firm, and since January 1, 2013, also serves as Managing Director with Higginbotham, an insurance, risk management and financial services firm. Previously, he served as a Corporate Senior Vice-President and Managed Care Officer of CIGNA’s South Central Region, with responsibility for HMO and PPO plans in several states. Mr. Chapman’s experience also includes having served as head of EQUICOR’s Health Plan and sales operation in Houston and as a Regional Vice-President for Lincoln National Insurance Company’s Central Region.
Dr. Bernard A. Harris, Jr. joined our Board on August 23, 2005. Since 2001, Dr. Harris has been President and Chief Executive Officer of Vesalius Ventures, a venture capital firm that invests in early stage medical informatics and technology. Since 2009, he has served as an independent director of Salient Funds, an asset management firm. From 2006 to 2011, Dr. Harris has served as a Class III director of Sterling Bancshares, Inc., a bank holding company. From 1996 to 2001, he served as Chief Medical Officer and Vice President for Space Hab, an aerospace company. Dr. Harris is a former NASA astronaut, having completed two space shuttle missions. He completed his residency in Internal Medicine at the Mayo Clinic and trained as a flight surgeon at the Aerospace School of Medicine at Brooks Air Force Base.
Edward L. Kuntz has served on our Board since August 26, 2014. Mr. Kuntz is the former Chairman and Chief Executive Officer of Kindred Healthcare, the largest diversified provider of post-acute care services in the United States. From 1998 through May 2014 he served as Chairman of the Board of Directors of Kindred and as Chief Executive Officer from 1998 to 2004. From 2000 through 2016, Mr. Kuntz served as a director of Rotech Healthcare, Inc., one of the largest providers of home medical equipment and related products and services in the United States. Mr. Kuntz also serves as a director of American Electric Technologies, Inc., a provider of power delivery solutions to the energy industry in the U.S. and internationally and is Chairman of its Audit Committee.
Reginald E. Swanson joined our Board on September 6, 2007. Since 2007, Mr. Swanson has been the Managing Director of STAR Physical Therapy, LP, a subsidiary of the Company. Mr. Swanson is founder of STAR Physical Therapy, LLC, and from 1997 to 2007, was its president and managing member. He is a certified athletic trainer and has been involved with sports medicine and physical therapy for over 25 years.
Clayton K. Trier joined our Board on February 23, 2005. Mr. Trier is a private investor. He was a founder and former Chairman and Chief Executive Officer of U.S. Delivery Systems, Inc., from 1993 to 1997, which developed the first national network providing same-day delivery service. Before it was acquired in 1996, U.S. Delivery was listed for two years on the New York Stock Exchange. Mr. Trier was a founder of Digital Music Group, Inc. (“DMGI”) and from September 2005 through May 2008, served as its Chairman of the Board. DMGI, listed on the NASDAQ in 2006, acquired the digital rights to master recordings, converted the recordings to digital format and sold the music through online retailers. Since 2008, Mr. Trier has served as a director of St. Luke’s Health System, an operator of several hospitals in the Houston, Texas metropolitan area where he also serves as Chairman of the Audit & Compliance Committee. Since 2015, Mr. Trier served has a director of Fenix Parts, Inc., a leading recycler and reseller of original equipment manufacturer automotive products, where he also serves as Chairman of the Audit Committee.
Executive Officers
The current executive officers of the Company are:
|
Name
|
Position
|
|
Christopher J. Reading
|
President and Chief Executive Officer
|
|
Lawrance W. McAfee
|
Executive Vice President and Chief Financial Officer
|
|
Glenn D. McDowell
|
Chief Operating Officer
|
For information concerning Messrs. Reading and McAfee see above.
Glenn D. McDowell, 60, was promoted to Chief Operating Officer effective January 24, 2005. Mr. McDowell served as our Vice President of Operations overseeing the west region since joining us in October 2003 until January 2005. From 1996 to 2003, Mr. McDowell was employed by HealthSouth Corporation, a provider of outpatient surgery, diagnostic imaging and rehabilitative healthcare services. His most recent position with HealthSouth Corporation was Vice President of Operations — West Ambulatory Division where he oversaw the operations of more than 165 outpatient rehabilitation and other facilities. Mr. McDowell is a physical therapist.
Codes of Conduct
Our Board has approved and we have adopted a Code of Business Conduct and Ethics for our officers and all employees, an additional Code of Business Conduct and Ethics which is applicable to our directors, and Corporate Governance Guidelines. The Codes and Corporate Governance Guidelines are available on our website at www.usph.com. Our Board, or a committee of its independent members, is responsible for reviewing and approving or rejecting any requested waivers to the Codes, as such waivers may apply to our directors and officers. Neither the Board, nor a committee of its independent members, received any requests for waivers or amendments to the Codes in 2016, and none were granted. Any waivers of these Codes for directors, officers and employees will be disclosed in a Form 8-K filed with the SEC, which will be available on the SEC’s website at www.sec.gov. The Code applicable to directors requires each director to disclose to the Board any interest he or she may have in a potential transaction, arrangement or agreement to which the Company is or will be a party, and refrain from participating directly or indirectly in the transaction unless the Board approves such participation with all interested directors abstaining from the consideration and deliberation of, and any votes concerning, such matter.
Our Board has further approved and we have adopted an additional Code of Business Conduct and Ethics, applicable to our Chief Executive Officer, Chief Financial Officer and senior financial officers, relating to dealings with our auditors and the preparation of our financial statements and other disclosures made to the public under SEC rules and regulations. This Code is available on our website at www.usph.com. The Board, or a committee of its independent members, is responsible for reviewing and approving or rejecting any requested waivers from, and amendments to, this Code. Neither the Board, nor a committee of its independent members, received any requests for waivers or amendments to the Code in 2016, and none were granted. Any waivers from, and amendments to, the Code will be disclosed in a Form 8-K filed with the SEC, which will be available on the SEC’s website at www.sec.gov. The Code requires the officers to disclose directly to the Audit Committee any conflicts of interest, including any material transaction or relationship involving a potential conflict of interest.
Stockholder Nomination Procedures
The Governance and Nominating Committee will consider director candidates recommended by the stockholders. Generally, for a stockholder of the Company to make a nomination to be included in the proxy statement, he or she must give written notice to our Secretary so that such notice is received at least 120 calendar days prior to the first anniversary of the date the Company’s proxy statement is sent to the stockholders in connection with the previous year’s annual meeting of stockholders. If no annual meeting of stockholders was held in the previous year (or if the date of the annual meeting of stockholders was changed by more than 30 calendar days from the date of the previous year’s annual meeting), the notice must be received by the Company within a reasonable period prior to the time the Company begins to print and send its proxy materials for the applicable annual meeting. The stockholder’s notice must set forth as to each nominee: (i) the name, age, business address and residence address of such nominee, (ii) the principal occupation or employment of such nominee, (iii) the number of shares of our common stock which are beneficially owned by such nominee, and (iv) any other information relating to such nominee that may be required under federal securities laws to be disclosed in solicitations of proxies for the election of directors (including the written consent of the person being recommended as a director candidate to being named in the proxy statement as a nominee and to serve as a director if elected). The stockholder’s notice must also set forth as to the stockholder giving notice: (a) the name and address of such stockholder and (b) the number of shares of our common stock which are beneficially owned by such stockholder.
If the information supplied by the stockholder is deficient in any material aspect or if the foregoing procedure is not followed, the chairman of the applicable annual meeting may determine that such stockholder’s nomination should not be brought before the meeting and that such nominee is not eligible for election as a director of the Company. The committee will not alter the manner in which it evaluates candidates, including the minimum criteria set forth above, based on whether or not the candidate was recommended by a stockholder.
Audit Committee
The Audit Committee currently consists of Messrs. Trier (Chairman), Brookner, Harris, Johnston and Pullins. As Mr. Johnston will not stand for reelection, he will no longer be on this committee after the Annual Meeting. Our Board of Directors has determined that Messrs. Brookner, Trier and Pullins are “audit committee financial experts” under the rules of the SEC. As more fully described in the Audit Committee Charter, which can be found on our website at www.usph.com, the committee is responsible for, among other things:
| • |
overseeing our financial reporting processes, including the quarterly reviews and annual audits of our financial statements by the independent auditors;
|
| • |
the appointment, compensation, retention and oversight of the work of the independent auditors;
|
| • |
pre-approving audit and permitted non-audit services, and related fees and terms of engagement, provided by the independent auditors; and
|
| • |
reviewing with management and independent auditors issues relating to disclosure controls and procedures and internal control over financial reporting.
|
The Audit Committee Charter requires that the committee consist of at least three independent members of our Board and that the committee meet at least four times per year on a quarterly basis. At each regular Audit Committee meeting, the committee meets privately with management and with the independent auditors. Each member of the Audit Committee has been determined to be “independent,” as defined in the NYSE listing standards and the rules of the SEC.
Section 16(a) Beneficial Ownership Reporting Compliance
Section 16(a) of the Exchange Act requires our directors and executive officers, and persons who own more than 10% of our equity securities to file with the SEC initial reports of ownership and reports of changes in ownership of our common stock. Officers, directors and greater than 10% stockholders are required by SEC regulation to furnish us with copies of all Section 16(a) reports they file.
To our knowledge, based solely on a review of the copies of those forms furnished to the Company and written representations from the executive officers and directors, we believe that during 2016 all other Section 16(a) filing requirements applicable to our directors and officers were complied with on a timely basis with the exception of three Form 4’s for transactions occurring on different dates in December 2010 by Dr. Harris.
Compensation Committee
The current members of the Compensation Committee are Messrs. Chapman (Chairman), Pullins and Trier, all of whom have been determined to be “independent,” as defined in the NYSE listing standards and the rules of the SEC. As more fully described in the Compensation Committee Charter, which can be found on our website at www.usph.com, the committee is responsible for, among other things:
| • |
establishing goals and objectives relevant to incentive compensation awards (annual and long-term) for the Chief Executive Officer and other senior executive officers of the Company;
|
| • |
evaluating the Chief Executive Officer’s and other senior executive officers’ performance and the overall corporate performance in light of these goals and objectives and approve any incentive compensation for such executives;
|
| • |
determining any periodic adjustments to be made in the Chief Executive Officer’s and other senior executive officers’ base salary level based on the committee’s evaluation thereof;
|
| • |
reviewing, for officers of the Company other than the senior executives, the proposed salary levels and annual adjustments thereto and the incentive compensation plans formulated by senior executive management and the annual bonus payments to be made thereunder, and providing input and advice to senior executive management with respect to these compensation decisions;
|
| • |
approving all executive perquisites and any special benefit plans to be made available to senior executive officers;
|
| • |
advising on compensation of non-employee members of the Board;
|
| • |
administering the Company’s equity compensation plans and approving grants to executive officers, employees, directors, and consultants under such plans; and
|
| • |
reviewing, and approving any amendments to employment agreements for Named Executive Officers.
|
The committee may delegate its responsibilities to subcommittees of one or more directors. The committee meets at least two times a year to carry out its responsibilities. The Named Executive Officers and other senior executives are not permitted to be present during any deliberations or voting with respect to his or her compensation. The committee’s processes and procedures for determining executive compensation are described below under “Compensation Discussion and Analysis.” Each member of the Compensation Committee has been determined to be “independent”, as defined in the NYSE listing standards and the rules of the SEC.
Compensation Discussion and Analysis
The Compensation Committee, composed entirely of independent directors, administers the Company’s executive compensation program. The role of the committee includes establishing and overseeing compensation and benefit programs for our executive officers including the Chief Executive Officer (“CEO”) and the other executive officers listed in the Summary Compensation table below (the “Named Executive Officers”). The committee also evaluates the performance of the CEO and reviews the performance of our other executive officers every year. Based upon these performance evaluations, the committee establishes compensation for the CEO and other executive officers, and executive management consults with the committee with respect to compensation levels and plans for key employees. Elements of our executive compensation program include: base salary; annual cash incentive compensation; long-term equity incentive awards; post-employment benefits; and benefits and perquisites.
In establishing and overseeing the program, the committee’s goal is to ensure that we can attract and retain superior management talent critical to our long-term success. To ensure that executive compensation is aligned with the performance of the Company and the interests of its stockholders, a significant portion of compensation available to executives is linked directly with financial results and other factors that influence stockholder value.
Compensation Support
Our management, our Human Resources department and our outside consultants, from time to time, support the committee in discharging its duties. In performing duties relating to the development and administration of our executive compensation program, our Human Resources department and the committee periodically review matters that relate to the competitive position, value and design of our short-term and long-term incentive compensation plans, performance goals and rewards available at various levels of performance.
Under its charter, the committee also may retain, at the Company’s expense, compensation consultants to provide independent advice and counsel directly to the committee.
Peer Group Compensation
In evaluating appropriate levels of total compensation for the Named Executive Officers, the committee gathers and analyzes data from a variety of sources. While there is not a comparable “peer group” of publicly-traded companies serving the outpatient rehabilitation sector, the committee monitors public information on executive compensation for a number of companies providing various healthcare services which are similar in revenue volume and market capitalization to the Company. The Compensation Committee believes that this information is useful in evaluating the competitiveness of our executive compensation program.
Limitation on Certain Trades of Company Securities
In addition to the various trading restrictions required of Company directors and certain employees under the Exchange Act, Securities Act of 1933, as amended, and SEC rules, the U.S. Physical Therapy, Inc. Insider Trading Policy restricts certain transactions involving company securities. Among other things, directors, officers, employees and other insiders of the Company are prohibited from entering into certain hedging or monetization transactions regarding Company securities (e.g., the purchase of “put” options, short positions, zero-cost collars or forward sale contracts).
Compensation Philosophy and Objectives
Our compensation policies are designed to enable us to attract, motivate and retain experienced and qualified executives. We seek to provide competitive compensation. Historically, our policy has been to provide a significant component of an executive officers’ compensation through the grant of stock options or restricted shares that vest over a number of years. We believe that grants of equity-based incentives to executives and key employees help to align the interests of these persons with the interests of our stockholders.
The committee’s policy is to compensate and reward executive officers and other key employees based on the combination of some or all of the following factors, depending on the person’s responsibilities: corporate performance, business unit performance and individual performance. The committee evaluates corporate performance and business unit performance by reviewing the extent to which the Company has accomplished strategic business objectives such as improved profitability, cash flow, management of working capital, improvements in clinic productivity and efficiency, and the overall quality of patient care. The committee evaluates individual performance by comparing actual accomplishments to the objectives established for the individual under the Company’s management development program. The committee determines increases in base salary and annual cash incentive awards based on actual accomplishments during the performance period and determines long-term incentive awards (as detailed below) on criteria documented in the long-term incentive plans.
The committee believes that compensation to executive officers should be aligned closely with the Company’s performance on both a short-term and long-term basis. As a result, a significant portion of compensation to each executive officer is “at risk” and tied to the achievement of financial performance goals, regulatory compliance, improvements in operating efficiency and the quality of care provided, and other quantitative and qualitative factors. The executive compensation program is also designed to incentivize continuous improvements by providing enhanced compensation as results improve. While a significant portion of compensation to the Company’s executive officers is performance-based, the committee also believes it prudent to provide competitive base salaries and benefits in order to attract and retain the management talent necessary to achieve our long-term strategic objectives. The committee also takes into account the compensation practices of certain comparably-sized healthcare service companies to ensure that the Company is able to attract, retain and reward executive officers whose contributions are critical to our long-term success.
Base Salaries
Other than the base salary of the Named Executive Officers which were initially set by an employment agreement (see “Employment and Consulting Agreements” below), base salaries of executives are initially determined by evaluating the responsibilities of the position, the experience and knowledge of the individual and the competitive marketplace for executive talent. Base salaries for executive officers, including those with employment agreements, are reviewed annually by the committee based on, among other things, individual performance and responsibilities, inflation and competitive market conditions.
Annual Cash Incentive Compensation
Based on individual and Company performance, incentive compensation opportunities are available to a wide range of our employees. We believe that incentive compensation is effective in reinforcing both the overall values of our Company and our specific operating goals.
Incentive compensation programs are designed to focus employees’ attention on our key performance goals, to identify the expected levels of performance and to reward individuals who meet or exceed our expectations. The aggregate amounts available for incentive awards are determined by our overall financial performance. The actual awards paid to individual recipients, other than to executive officers, are formulated by management, generally payable on an annual basis and reviewed by the committee prior to payment. The committee formulates and determines incentive awards for Named Executive Officers. See “Summary Compensation Table” below.
For 2016, the Company’s Chief Executive Officer, Chief Financial Officer and Chief Operating Officer (the “Executive Participants”) were eligible to receive cash bonus awards under the Company’s Objective Cash Bonus Plan and Discretionary Cash Bonus Plan that amounted to a maximum of 125% of their respective base salaries. For a detailed description of these plans, see the Company’s Current Report on Form 8-K filed with the SEC on March 16, 2017. Under the Objective Cash Bonus Plan, the Executive Participants were eligible to earn a cash bonus award of up to 75% of their respective base salaries dependent upon the Company achieving diluted earnings per share in the range of $1.86 to $2.04 or more. Based on the adjusted diluted earnings per share of $1.87 for 2016, the Executive Participants received an Objective Cash Bonus award for 2016 equal to 17% of their respective base salaries. Under the Discretionary Cash Bonus Plan, the Executive Participants were awarded a cash bonus award of 21% of their respective base salaries. The discretionary cash award was based upon a subjective determination of the committee utilizing certain performance criteria as detailed in the plan. However, the committee did not consider it practicable to, nor did it attempt to, quantify, rank or otherwise assign relative weights to the specific performance criteria it considered in reaching its decision. In considering these performance criteria, the individual members of the committee may have given different weights to different performance criteria. The discretionary performance criteria were not intended to be rigid or formulaic but rather served as a framework under which the committee reviews the total compensation. The total cash bonus for the 2016 year, inclusive of the Objective Cash Bonus Plan and Discretionary Cash Bonus Plan, paid to Messrs. Reading, McAfee and McDowell was $230,622, $166,668, and $155,040, respectively. These bonuses were paid in April 2017.
Long-term Equity Incentive Awards
For the 2016 year, the Executive Participants were eligible to receive awards consisting of shares of restricted common stock under the Company’s Objective Long-Term Incentive Plan and Discretionary Long-Term Incentive Plan. For a detailed description of these plans, see the Company’s Current Report Form 8-K filed with the SEC on March 16, 2017. Under the Objective Long-Term Incentive Plan, Messrs. Reading, McAfee and McDowell were eligible to earn up to 15,000, 7,500 and 7,500 shares of restricted common stock, respectively, dependent upon the Company achieving diluted earnings per share in the range of $1.86 to $1.98 or more. Based on the adjusted diluted earnings per share of $1.87 for 2016, Messrs. Reading, McAfee and McDowell were awarded 5,100, 2,550 and 2,550 shares of restricted common stock, respectively. Under the Discretionary Long-Term Incentive Plan, Messrs. Reading, McAfee and McDowell were eligible to earn up to 15,000, 7,500 and 7,500 shares of restricted common stock, respectively, based upon a subjective determination of the committee. The committee utilized certain performance criteria as detailed in the plan but generally did not consider it practicable to, nor did it attempt to, quantify, rank or otherwise assign relative weights to the specific performance criteria it considers in reaching its decision. In considering these performance criteria, the individual members of the committee may have given different weights to different performance criteria. The discretionary performance criteria were not intended to be rigid or formulaic but rather served as a framework under which the committee reviews the total compensation and performance of the Executive Participants to determine what incentive amount is appropriate for any specific year. For 2016, Messrs. Reading, McAfee and McDowell were awarded 11,250, 5,625 and 5,625 shares of restricted common stock, respectively, under the Discretionary Long-Term Incentive Plan. On March 24, 2017, for the 2016 year, Messrs. Reading, McAfee and McDowell were granted an aggregate of 16,350, 8,175 and 8,175 shares of restricted common stock, respectively, representing the total shares awarded under the Objective Long-Term Incentive Plan and Discretionary Long-Term Incentive Plan. The restricted shares vest evenly over 16 quarters with the first vesting occurring on April 1, 2017.
The Objective Cash Bonus Plan, Discretionary Cash Bonus Plan, Objective Long-Term Incentive Plan, and Discretionary Long-Term Incentive Plan collectively are hereinafter referred to as the “2016 Executive Incentive Plan”.
The Amended and Restated 2003 Stock Incentive Plan (the “Stock Incentive Plan”) and our Amended and Restated 1999 Employee Stock Option Plan (“1999 Stock Option Plan”) are intended to align employee and outside director interests with stockholders’ interests, to provide incentives to our key employees by encouraging their ownership of our common stock and to aid us in attracting and retaining key employees, upon whose efforts our success and future growth depends.
Equity grants are made at the discretion of the committee, which administers the Company’s equity compensation plans. The objective of such long-term equity-based awards, which generally vest over three to five years, is primarily to incentivize management and key employees for future performance rather than to reward specific past performance. Individual grant sizes are primarily determined based on the employee’s duties and level of responsibility and his or her ability to exert significant influence and make meaningful contributions to the overall future success of the Company and, to a lesser degree, organizational and individual performance. At the discretion of the committee, and based on the recommendation of management, equity grants may also be used as an incentive for candidates recruited to fill key positions and for existing employees who receive significant promotions with increased responsibilities.
Post-Employment Benefits
We have entered into employment agreements with our Named Executive Officers that provide for the payment of severance and other post-termination benefits depending on the nature of the termination, including severance payments in the event of a termination following a “change in control.” The committee believes that the terms and conditions of these agreements are reasonable and assist us in retaining the executive talent needed to achieve our objectives. In particular, the termination agreements, in the event of a “change in control,” help executives focus their attention on the performance of their duties in the best interests of the stockholders without being concerned about the consequences to them of a change in control and help promote continuity of senior management. Information regarding the specific payments that are applicable to each termination event, as well as the effect on unvested equity awards, is provided under the heading “Executive Compensation — Post Termination/Change-in-Control Benefits” below.
Benefits and Perquisites
Defined Contribution Plan. The Company maintains qualified retirement plans pursuant to Internal Revenue Code of 1986, as amended (the “Code”), Section 401(k) (the “401(k) Plans”) covering substantially all employees subject to certain minimum service requirements. The 401(k) Plans allows employees to make voluntary contributions and provides for discretionary matching contributions by the Company. For certain plans, the Company makes matching contributions. The assets of the 401(k) Plans are held in trust for grantees and are distributed upon the retirement, disability, death or other termination of employment of the grantee. The Board, in its discretion, determines the amount of any Company discretionary contributions. We did not make any discretionary contributions to the 401(k) Plan during 2016. The Company’s matching contributions aggregated $1.1 million in 2016.
Life Insurance. The Company maintains, at its expense, for the benefit of each of its full-time employees, life insurance policies in the amount of one times the employee’s annual salary, up to $200,000.
Health and Welfare Benefits. All executive officers, including the Named Executive Officers, are eligible for welfare benefits from the Company including: medical, dental, vision, life insurance, short-term disability and long-term disability. Named Executive Officers participate in these plans on the same basis and subject to the same costs, terms and conditions as other salaried employees at their work location.
Employment and Consulting Agreements
Effective February 9, 2016, the Company entered into amended and restated Employment Agreements (collectively, the “Employment Agreements”) with each Named Executive Officer. The Employment Agreements were executed in order to (i) extend the term of each of the Employment Agreements for an additional two-year period commencing as of January 1, 2016, along with automatic two-year extensions as of the end of each expiring term; (ii) modify the severence and other benefits to which Executive Officers are entitled in the event of an involuntary termination of employment without cause, a voluntary termination for good reason, or due to death or disability; and (iii) provide for additional benefits in the event of a change in control of the Company. The Employment Agreements presently expire on December 31, 2017.
Each of the Employment Agreements may be terminated by the Company prior to the expiration of their respective terms for cause or without cause, and due to the death or disability of the Executive Officer, as well as by the Executive Officer for good reason or based a disability. In the event of (A) an involuntary termination by the Company without “cause” (as defined in each of the Employment Agreements) or (B) a voluntary termination by the Executive Officer for “good reason” (as defined in each of the Employment Agreements), the affected Executive Officer is entitled to receive (1) salary continuation for two years, based on his base compensation then in effect, (2) the greater of: (a) the bonus paid or payable to the Executive Officer with respect to the last fiscal year completed prior to such termination, or (b) the average of the bonuses paid to the Executive Officer over the last three fiscal years of employment ending with the last fiscal year prior to such termination, (3) the Executive Officer’s accrued but unused vacation days, (4) an immediate acceleration of vesting for all outstanding equity incentive awards, and (5) medical insurance benefits currently in effect for the twenty-four months following such termination. If an Employment Agreement is terminated based on a qualified disability (as described in the Employment Agreements), the terminated Executive Officer is entitled to receive a lump-sum payment equal to two times such Executive Officer’s base compensation then in effect, as well as an immediate acceleration of vesting for all outstanding equity incentive awards. If an Employment Agreement is terminated based on the death of an Executive Officer, the Executive Officers’ estate (or his heirs) will receive a lump-sum payment equal to such Executive Officers base compensation then in effect, and all outstanding equity incentive awards held by such Executive Officer shall immediately vest. Finally, in the event of a “change in control” (as defined in the Employment Agreements), the Executive Officers, as applicable, will be entitled to (A) a change of control benefit of $500,000 for Mr. Reading and McAfee and $283,333 for Mr. McDowell, and (B) the immediate acceleration of vesting for all outstanding equity incentive awards held by the Executive Officers.
Effective January 8, 2017, the annual base salaries under the agreements were increased to $725,000 for Mr. Reading, $470,000 for Mr. McAfee and $470,000 for Mr. McDowell.
Messrs. Reading, McAfee and McDowell’s employment agreements may each be terminated by the Company prior to the expiration of their term. See “Executive Compensation — Post Termination/Change-in-Control Benefits” below for a detailed discussion of the termination and change in control provisions contained in these agreements.
We do not have any executive retention and severance arrangements or change in control agreements with our Named Executive Officers other than those described above.
Compensation of Named Executive Officers
Mr. Reading joined our Company in November 2003 as Chief Operating Officer and, effective November 1, 2004, was promoted to President and Chief Executive Officer. Under his employment agreement with us (see “Employment and Consulting Agreements” above), Mr. Reading’s annual base salary is subject to adjustment by the Compensation Committee. For the last three years, his annual base salary was $577,000 (during 2014), $595,000 (during 2015), $606,900 (during 2016) and further increased to $725,000 effective as of January 8, 2017. During each of 2014, 2015 and 2016, Mr. Reading participated in an executive incentive plan specific to such year that was approved by the Compensation Committee and filed with the SEC on Form 8-K. In accordance with such executive incentive plans, Mr. Reading (i) was granted 40,000 shares of restricted stock and was paid a cash bonus of $721,250 for 2014, and (ii) was granted 22,720 shares of restricted stock and was paid a cash bonus of $124,950 for 2015. As previously disclosed, for 2016, Mr. Reading was paid a cash bonus of $230,622 on April 21, 2017 and was granted 16,350 shares of restricted stock on March 24, 2017.
Mr. McAfee joined our Company in September 2003 as Chief Financial Officer and, effective November 1, 2004, was promoted to Executive Vice President. Under his employment agreement with us (see “Employment and Consulting Agreements” above), Mr. McAfee’s annual base salary is subject to adjustment by the Compensation Committee. For the last three years, his annual base salary was $420,000 (during 2014), $430,000 (during 2015), and $438,600 (during 2016), and further increased to $470,000 effective as of January 8, 2017. During each of 2014, 2015 and 2016, Mr. McAfee participated in an executive incentive plan specific to such year that was approved by the Compensation Committee and filed with the SEC on Form 8-K. In accordance with such executive incentive plans, Mr. McAfee (i) was granted 20,000 shares of restricted stock and was paid a cash bonus of $525,000 for 2014, and (ii) was granted 11,360 shares of restricted stock and was paid a cash bonus of $90,300 for 2015. As previously disclosed, for 2016, Mr. McAfee was paid a cash bonus of $166,668 on April 21, 2017 and was granted 8,175 shares of restricted stock on March 24, 2017.
Mr. McDowell joined our Company in October 2003 as Vice President of Operations overseeing the west region and, effective January 24, 2005, was promoted to Chief Operating Officer. Under his employment agreement with us (see “Employment and Consulting Agreements” above), Mr. McDowell’s annual base salary is subject to adjustment by the Compensation Committee. For the last three years, his annual base salary was $377,000 (during 2014), $400,000 (during 2015) and $408,000 (during 2016), and further increased to $470,000 effective as of January 8, 2017. During each of 2014, 2015 and 2016, Mr. McDowell participated in an executive incentive plan specific to such year that was approved by the Compensation Committee and filed with the SEC on Form 8-K. In accordance with such executive incentive plans, Mr. McDowell (i) was granted 20,000 shares of restricted stock and was paid a cash bonus of $471,250 for 2014, and (ii) was granted 11,360 shares of restricted stock and was paid a cash bonus of $84,000 for 2015. As previously disclosed, for 2016, Mr. McDowell was paid a cash bonus of $155,040 on April 21, 2017 and was granted 8,175 shares of restricted stock on March 24, 2017.
In determining the appropriate compensation for Messrs. Reading, McAfee and McDowell, the Compensation Committee evaluates our overall corporate performance under their leadership, as well as each individual contribution to key strategic, financial and development objectives. The committee utilizes a combination of quantitative measures and qualitative factors in reviewing executive performance and compensation.
Compensation Deductibility Policy
Under Section 162(m) of the Code and applicable Treasury regulations, no deduction is allowed for annual compensation in excess of $1 million paid by a publicly traded corporation to its chief executive officer and the four other most highly compensated officers. Under those provisions, however, there is no limitation on the deductibility of “qualified performance-based compensation.”
In general, our policy is to maximize the extent of tax deductibility of executive compensation under the provisions of Section 162(m) so long as doing so is compatible with the most appropriate methods and approaches for the design and delivery of compensation to our executive officers.
Executive Compensation
Summary Compensation Table
The following table sets forth the compensation paid or accrued for services rendered in all capacities on behalf of the Company during 2016, 2015 and 2014 to Messrs. Reading, McAfee and McDowell.
|
Name and Principal Position
|
Year
|
Salary
($) (1)
|
Bonus
($)
|
Stock
Awards (2)
($)
|
Option
Awards
($)
|
Non-
Equity
Incentive
Plan
Compen-
sation (3)
($)
|
Change in
Pension
Value and
Non-
Qualified
Deferred
Compen-
sation
Earnings
($)
|
All Other
Compen-
sation (4)
($)
|
Total
($)
|
|||||||||||||||
|
Christopher J. Reading
|
2016
|
606,717
|
971,978
|
230,622
|
1,242
|
1,810,559
|
||||||||||||||||||
|
Chief Executive Officer
|
2015
|
616,500
|
1,140,253
|
124,950
|
1,289
|
1,882,992
|
||||||||||||||||||
|
2014
|
575,692
|
1,552,200
|
721,250
|
1,242
|
2,850,384
|
|||||||||||||||||||
|
Lawrance W. McAfee
|
2016
|
438,467
|
485,989
|
166,668
|
3,564
|
1,094,688
|
||||||||||||||||||
|
Chief Financial Officer
|
2015
|
445,769
|
570,126
|
90,300
|
3,701
|
1,109,896
|
||||||||||||||||||
|
2014
|
419,231
|
776,100
|
525,000
|
2,322
|
1,722,653
|
|||||||||||||||||||
|
Glenn D. McDowell
|
2016
|
407,877
|
485,989
|
155,040
|
2,322
|
1,051,228
|
||||||||||||||||||
|
Chief Operating Officer
|
2015
|
413,615
|
570,126
|
84,000
|
2,411
|
1,070,152
|
||||||||||||||||||
|
2014
|
376,077
|
776,100
|
471,250
|
2,322
|
1,625,749
|
|||||||||||||||||||
| 1. |
2015 includes 27 pay periods versus standard of 26.
|
| 2. |
For 2016, stock awards were granted in accordance with the 2016 Executive Incentive Plan as restricted stock under the terms of the Stock Incentive Plan as follows: Mr. Reading was awarded 16,350 shares and Messrs. McAfee and McDowell were awarded 8,175 shares each. For 2015, stock awards were granted in accordance with the 2015 Executive Incentive Plan as restricted stock under the terms of the Stock Incentive Plan as follows: Mr. Reading was awarded 22,720 shares and Messrs. McAfee and McDowell were awarded 11,360 shares each. For 2014, stock awards were granted in accordance with the 2014 Executive Incentive Plan as restricted stock under the terms of the Stock Incentive Plan as follows: Mr. Reading was awarded 40,000 shares and Messrs. McAfee and McDowell were awarded 20,000 shares each. Amounts shown are the grant date fair value of the awards computed in accordance with FASB ASC Topic 718 which amounted to a weighted average of $59.45 per share for 2016, $50.19 per share for 2015 and $38.81 per share for 2014. Assumptions used in the calculation of these amounts are included in “Note 11 — Equity Based Plans” of the Notes to the Consolidated Financial Statements in Item 8 of this Annual Report.
|
| 3. |
For 2016, the amounts represent the cash bonuses earned under the Company’s 2016 Executive Incentive Plan and paid in April 2017. For 2015, the amounts represent the cash bonuses earned under the Company’s 2015 Executive Incentive Plan and paid in March 2016. For 2014, the amounts represent the cash bonuses earned under the Company’s 2014 Executive Incentive Plan and paid in March 2015. See “Compensation Discussion and Analysis — Annual Cash Incentive Compensation” for further details.
|
|
4.
|
Represents the value of life insurance premiums for life insurance coverage provided to the Named Executive Officers.
|
Grants of Plan-Based Awards
The following table sets forth the grants of plan-based awards during 2016 to the Named Executive Officers:
|
Estimated Possible Payouts
Under Non-Equity
Incentive Plan Awards (1) :
|
Estimated Possible Payouts
Under Equity
Incentive Plan Awards (1) :
|
Grant Date
Fair Value
|
|||||||||||||||||||||||||||
|
Name
|
Grant
Date
|
Threshold
($)
|
Target
($)
|
Maximum
($)
|
Threshold
(#)
|
Target
(#)
|
Maximum
(#)
|
of Stock
Awards (2)
|
|||||||||||||||||||||
|
Christopher J. Reading
|
3/10/2016
|
$
|
-
|
$
|
758,625
|
$
|
758,625
|
-
|
30,000
|
30,000
|
$
|
1,512,000
|
|||||||||||||||||
|
Lawrance W. McAfee
|
3/10/2016
|
$
|
-
|
$
|
548,250
|
$
|
548,250
|
-
|
15,000
|
15,000
|
$
|
756,000
|
|||||||||||||||||
|
Glenn D. McDowell
|
3/10/2016
|
$
|
-
|
$
|
510,000
|
$
|
510,000
|
-
|
15,000
|
15,000
|
$
|
756,000
|
|||||||||||||||||
| 1. |
Possible payments and equity grants under the 2016 Executive Incentive Plan. See the Summary Compensation Table above for actual amounts earned for 2016. The cash earned was paid on April 21, 2017 and the shares of restricted common stock were granted on March 24, 2017.
|
| 2. |
Amounts shown are the grant date fair value of the awards computed in accordance with FASB ASC Topic 718 which amounted to a weighted average of $50.40 per share. See “Note 11 — Equity Based Plans” of the Notes to the Consolidated Financial Statements in Item 8 of this Annual Report for a description of the valuations and a description of the equity plans.
|
Narrative Disclosure to Summary Compensation Table and Grants of Plan-Based Awards Table
See “Employment and Consulting Agreements” above and “Post-Termination/Change-in-Control Benefits” below for the material terms of our employment agreements with our Named Executive Officers. See “Compensation Discussion and Analysis” above for an explanation of the amount of salary and bonus in proportion to total compensation. See the footnotes to the Summary Compensation Table above and Grants of Plan-Based Awards table paid to the Named Executive Officers above for narrative disclosure with respect to those tables.
Outstanding Equity Awards at Fiscal Year-End
The following table shows outstanding awards of shares of restricted common stock that have not vested as of December 31, 2016 for each Named Executive Officer. There are no outstanding stock option awards for the Named Executive Officers as of December 31, 2016.
|
Stock Awards
|
||||||||||||
|
Name
|
Number
of Shares
or Units
of Stock
That Have
Not
Vested
(#)
|
Market
Value of
Shares or
Units of
Stock
That Have
Not Vested
($) (1)
|
||||||||||
|
Christopher J. Reading
|
52,635
|
(2)
|
$
|
3,694,977
|
||||||||
|
Lawrance W. McAfee
|
26,323
|
(3)
|
$
|
1,847,875
|
||||||||
|
Glenn D. McDowell
|
26,323
|
(3)
|
$
|
1,847,875
|
||||||||
| 1. |
Calculated based on the closing market price of our common stock on December 31, 2016 of $70.20 per share.
|
2. The restrictions on these shares of common stock granted as restricted stock will lapse as follows:
|
1/1/2017
|
8,095
|
4/1/2018
|
3,920
|
4/1/2019
|
1,420
|
|
4/1/2017
|
5,795
|
7/1/2018
|
3,920
|
7/1/2019
|
1,420
|
|
7/1/2017
|
5,795
|
10/1/2018
|
3,920
|
10/1/2019
|
1,420
|
|
10/1/2017
|
5,795
|
1/1/2019
|
3,920
|
1/1/2020
|
1,420
|
|
1/1/2018
|
5,795
|
3. The restrictions on these shares of common stock granted as restricted stock will lapse as follows:
|
1/1/2017
|
4,047
|
4/1/2018
|
1,960
|
4/1/2019
|
710
|
|
4/1/2017
|
2,897
|
7/1/2018
|
1,960
|
7/1/2019
|
710
|
|
7/1/2017
|
2,897
|
10/1/2018
|
1,960
|
10/1/2019
|
710
|
|
10/1/2017
|
2,897
|
1/1/2019
|
1,960
|
1/1/2020
|
710
|
|
1/1/2018
|
2,905
|
Stock Vested Table
The following table shows the number of shares of our common stock acquired by the Named Executive Officers during 2016 upon the vesting of restricted stock. As of December 31, 2016, there were no outstanding stock options for the Named Executive Officers.
Stock Vested
|
Stock Awards
|
||||||||
|
Name
|
Number of
shares
acquired
on vesting (#)
|
Value
realized on
Vesting
|
||||||
|
Christopher J. Reading
|
30,960
|
$
|
1,755,268
|
|||||
|
Lawrance W. McAfee
|
15,478
|
$
|
877,521
|
|||||
|
Glenn D. McDowell
|
15,478
|
$
|
877,521
|
|||||
The value realized on vesting is computed by multiplying the number of shares of stock by the market value of the underlying shares on the vesting date. The closing price of the stock is used as the market value.
Post Termination/Change-in-Control Benefits
Each of the Employment Agreements of the Named Executive Officers may be terminated by the Company prior to the expiration of their respective terms for cause or without cause, and due to the death or disability of the Executive Officer, as well as by the Executive Officer for good reason or based a disability. In the event of (A) an involuntary termination by the Company without “cause” (as defined in each of the Employment Agreements) or (B) a voluntary termination by the Executive Officer for “good reason” (as defined in each of the Employment Agreements), the affected Executive Officer is entitled to receive (1) salary continuation for two years, based on his base compensation then in effect, (2) the greater of: (a) the bonus paid or payable to the Executive Officer with respect to the last fiscal year completed prior to such termination, or (b) the average of the bonuses paid to the Executive Officer over the last three fiscal years of employment ending with the last fiscal year prior to such termination, (3) the Executive Officer’s accrued but unused vacation days, (4) an immediate acceleration of vesting for all outstanding equity incentive awards, and (5) medical insurance benefits currently in effect for the twenty-four months following such termination. If an Employment Agreement is terminated based on a qualified disability (as described in the Employment Agreements), the terminated Executive Officer is entitled to receive a lump-sum payment equal to two times such Executive Officer’s base compensation then in effect, as well as an immediate acceleration of vesting for all outstanding equity incentive awards. If an Employment Agreement is terminated based on the death of an Executive Officer, the Executive Officers’ estate (or his heirs) will receive a lump-sum payment equal to such Executive Officers base compensation then in effect, and all outstanding equity incentive awards held by such Executive Officer shall immediately vest. Finally, in the event of a “change in control” (as defined in the Employment Agreements), the Executive Officers, as applicable, will be entitled to (A) a change of control benefit of $500,000 for Mr. Reading and McAfee and $283,333 for Mr. McDowell, and (B) the immediate acceleration of vesting for all outstanding equity incentive awards held by the Executive Officers.
The amount of compensation payable to each Named Executive Officer under the agreements is detailed in the tables below:
Christopher Reading
President and Chief Executive Officer
|
Executive Benefits and Payments
Upon Termination (1)
|
Voluntary
Termination
or For
Cause
|
Without
Cause
|
Executive
Resigns
For Good
Reason
|
In
Conjunction
with a
Change In
Control
|
||||||||||||
|
Compensation
|
||||||||||||||||
|
Severance (2)
|
$
|
-
|
$
|
1,450,000
|
$
|
1,450,000
|
$
|
1,450,000
|
||||||||
|
Annual Cash Incentive (3)
|
-
|
387,263
|
387,263
|
387,263
|
||||||||||||
|
Change of Control Benefit (4)
|
-
|
-
|
-
|
500,000
|
||||||||||||
|
Restricted Stock (Unvested and (Accelerated) (5)
|
-
|
3,694,977
|
3,694,977
|
3,694,977
|
||||||||||||
|
Benefits and Perquisities
|
||||||||||||||||
|
Health and Dental Coverage (6)
|
-
|
21,648
|
21,648
|
21,648
|
||||||||||||
|
Total
|
$
|
-
|
$
|
5,553,888
|
$
|
5,553,888
|
$
|
6,053,888
|
||||||||
Lawrance McAfee
Executive Vice President and Chief Financial Officer
|
Executive Benefits and Payments
Upon Termination (1)
|
Voluntary
Termination
or For
Cause
|
Without
Cause
|
Executive
Resigns
For Good
Reason
|
In
Conjunction
with a
Change In
Control
|
||||||||||||
|
Compensation
|
||||||||||||||||
|
Severance (2)
|
$
|
-
|
$
|
940,000
|
$
|
940,000
|
$
|
940,000
|
||||||||
|
Annual Cash Incentive (3)
|
-
|
281,124
|
281,124
|
281,124
|
||||||||||||
|
Change of Control Benefit (4)
|
-
|
-
|
-
|
500,000
|
||||||||||||
|
Restricted Stock (Unvested and (Accelerated) (5)
|
-
|
1,847,875
|
1,847,875
|
1,847,875
|
||||||||||||
|
Benefits and Perquisities
|
||||||||||||||||
|
Health and Dental Coverage (6)
|
-
|
21,648
|
21,648
|
21,648
|
||||||||||||
|
Total
|
$
|
-
|
$
|
3,090,647
|
$
|
3,090,647
|
$
|
3,590,647
|
||||||||
Glenn McDowell
Chief Operating Officer
|
Executive Benefits and Payments
Upon Termination (1)
|
Voluntary
Termination
or For
Cause
|
Without
Cause
|
Executive
Resigns
For Good
Reason
|
In
Conjunction
with a
Change In
Control
|
||||||||||||
|
Compensation
|
||||||||||||||||
|
Severance (2)
|
$
|
-
|
$
|
940,000
|
$
|
940,000
|
$
|
940,000
|
||||||||
|
Annual Cash Incentive (3)
|
-
|
255,803
|
255,803
|
255,803
|
||||||||||||
|
Change of Control Benefit (4)
|
-
|
-
|
-
|
283,333
|
||||||||||||
|
Restricted Stock (Unvested and (Accelerated) (5)
|
-
|
1,847,875
|
1,847,875
|
1,847,875
|
||||||||||||
|
Benefits and Perquisities
|
||||||||||||||||
|
Health and Dental Coverage (6)
|
-
|
21,648
|
21,648
|
21,648
|
||||||||||||
|
Total
|
$
|
-
|
$
|
3,065,326
|
$
|
3,065,326
|
$
|
3,348,659
|
||||||||
| 1. |
For purposes of this analysis, we assumed the price per share of our common stock on the date of termination is $70.20 (the closing price on December 31, 2016) and that the executive’s base salary (as in effect at December 31, 2016) is as follows: Mr. Reading — $725,000; Mr. McAfee — $470,000; and Mr. McDowell — $470,000.
|
| 2. |
Severance is calculated using two times the base salary as in effect at December 31, 2016 as noted in footnote 1 above.
|
| 3. |
Annual cash incentive is based on the greater of (i) the bonus paid or payable to the executive with respect to last fiscal year of the Company completed prior to termination or (ii) the average of the bonuses paid to the executive over the three fiscal years of the Company ending with the last fiscal year completed prior to the termination.
|
| 4. |
Based on amounts stipulated in the respective employment agreements.
|
| 5. |
Pursuant to the Restricted Stock Agreement for each executive, all restrictions and conditions on shares of restricted stock will be deemed satisfied and shares will be fully vested upon a “Change in Control”.
|
| 6. |
Calculated for the remaining term of the agreement which expires on January 1, 2018. In the event of a “Change in Control”, the remaining term of the agreements is one year from such event.
|
COMPENSATION COMMITTEE REPORT
The Compensation Committee was composed of three independent directors during 2016. It acts under a written charter adopted by the Board. The primary function of the Compensation Committee is to determine the compensation for our executive officers, administer incentive stock plans and recommend to the Board the compensation to be paid to our non-employee directors. The committee has reviewed and discussed with management the Compensation Discussion and Analysis set forth herein. Based on its review, the related discussions and such other matters deemed relevant and appropriate by the committee, the committee has recommended to the Board that the Compensation Discussion and Analysis be included in the Company’s Annual Report on Form 10-K for the year ended December 31, 2016 and the Proxy Statement relating to the 2017 Annual Meeting of Stockholders.
|
Respectfully submitted,
|
|
|
The Compensation Committee
|
|
|
Harry S. Chapman, Chairman
|
|
|
Jerald L. Pullins
|
|
|
Clayton K. Trier
|
Director Compensation Table
The following table discloses the cash, equity awards and other compensation earned, paid or awarded, as the case may be, to each of the Company’s directors who are not Named Executive Officers during the fiscal year ended December 31, 2016.
|
Name
|
Fees
Earned
or Paid
in Cash (2)
|
Stock
Awards (3)
|
Option
Awards
|
Non-equity
incentive plan
compensation
|
Change in
Pension
Value and
Nonqualified
Deferred
Compensation
Earnings
|
All Other
Compensation
|
Total
|
|||||||||||||||||||||
|
Daniel C. Arnold (1)
|
$
|
20,000
|
$
|
-
|
$
|
-
|
$
|
-
|
$
|
-
|
$
|
-
|
$
|
20,000
|
||||||||||||||
|
Mark J. Brookner
|
$
|
53,750
|
$
|
140,225
|
$
|
-
|
$
|
-
|
$
|
-
|
$
|
-
|
$
|
193,975
|
||||||||||||||
|
Harry S. Chapman
|
$
|
66,500
|
$
|
140,225
|
$
|
-
|
$
|
-
|
$
|
-
|
$
|
-
|
$
|
206,725
|
||||||||||||||
|
Dr. Bernard A. Harris, Jr
|
$
|
55,000
|
$
|
140,225
|
$
|
-
|
$
|
-
|
$
|
-
|
$
|
-
|
$
|
195,225
|
||||||||||||||
|
Marlin W. Johnston (4)
|
$
|
53,750
|
$
|
140,225
|
$
|
-
|
$
|
-
|
$
|
-
|
$
|
-
|
$
|
193,975
|
||||||||||||||
|
Edward L. Kuntz
|
$
|
55,750
|
$
|
140,225
|
$
|
-
|
$
|
-
|
$
|
-
|
$
|
-
|
$
|
195,975
|
||||||||||||||
|
Jerald L. Pullins
|
$
|
112,500
|
$
|
140,225
|
$
|
-
|
$
|
-
|
$
|
-
|
$
|
-
|
$
|
252,725
|
||||||||||||||
|
Reginald E. Swanson (5)
|
$
|
-
|
$
|
-
|
$
|
-
|
$
|
-
|
$
|
-
|
$
|
111,292
|
$
|
111,292
|
||||||||||||||
|
Clayton K. Trier
|
$
|
76,750
|
$
|
140,225
|
$
|
-
|
$
|
-
|
$
|
-
|
$
|
-
|
$
|
216,975
|
||||||||||||||
| (1) |
Mr. Arnold served as a Board member until May 17, 2016, the date of our last annual meeting of shareholders. He did not stand for reelection.
|
| (2) |
Includes Retainer Fees, Chairman Fees and Meeting Fees.
|
| (3) |
Stock awards were granted as restricted stock under the terms of the Stock Incentive Plan. The restrictions lapsed as to 687 shares on each of July 1, and October 1, 2016 and January 1, and April 1, 2017. Amounts shown are the grant date fair value of the awards computed in accordance with FASB ASC Topic 718, which amounted to $56.09 per share. Assumptions used in the calculation of these amounts are included in “Note 11 — Equity Based Plans” to this Annual Report.
|
| (4) |
Mr. Johnston will not stand for reelection at the 2017 Annual Meeting of Stockholders.
|
| (5) |
Other compensation represents salary and car allowance received by Mr. Swanson in his role as an employee of STAR Physical Therapy, LP, a subsidiary of the Company. During 2016, Mr. Swanson did not receive any additional compensation for being a director.
|
Compensation of Directors
During 2016, each of our non-employee directors received $10,000 per quarter (“Retainer Fee”) for serving as a member of our Board of Directors. In addition, each of our non-employee directors is paid $1,250 for each committee meeting attended in person or telephonically (hereinafter referred to as “Meeting Fees”). In addition to the Retainer Fee, the Chairman of our Board of Directors, who is also the Chairman of our Governance and Nominating Committee, is paid an annual fee of $55,000, the Chairman of the Audit Committee is paid an annual fee of $18,000, the Chairman of the Compensation Committee is paid an annual fee of $14,000, and the Chairman of the Compliance Committee is paid an annual fee of $12,000 (hereinafter all referred to as “Chairman Fees”). Directors are also reimbursed for their out-of-pocket travel and related expenses incurred in attending Board and committee meetings. Directors who are also our employees are not compensated separately for serving on our Board. In addition, in May 2016, each of the non-employee directors elected at the 2016 annual meeting received a grant of 2,500 shares of restricted stock, under the terms of the Company’s Stock Incentive Plan, vesting quarterly through April 1, 2017.
| ITEM 12. |
SECURITY OWNERSHIP OF CERTAIN BENEFICIAL OWNERS AND MANAGEMENT AND RELATED STOCKHOLDER MATTERS.
|
Securities Authorized for Issuance under Equity Compensation Plans
The following table provides information about our common stock that may be issued upon the exercise of options and rights under all of our existing equity compensation plans as of December 31, 2016:
|
Plan Category
|
Number of Securities
to be Issued Upon
Exercise of
Outstanding Options
and Rights
|
Weighted Average
Exercise Price of
Outstanding
Options and Rights
|
Number of Securities
Remaining Available for
Future Issuance Under Equity
Compensation Plans
Excluding Securities
Reflected in 1st Column
|
|||||||||
|
Equity Compensation Plans Approved by Stockholders (1)
|
-
|
$
|
-
|
566,118
|
||||||||
| 1. |
The Stock Incentive Plan permits us to grant stock-based compensation to employees, consultants and outside directors of the Company. The 1999 Stock Option Plan permits us to grant stock-based compensation to employees and non-employee directors. For further descriptions of the Stock Incentive Plan and the 1999 Stock Option Plan, see “Note 11 — Equity Based Plans” of the Notes to the Consolidated Financial Statements in Item 8 of this Annual Report.
|
|
All current Equity Compensation Plans have been approved by stockholders.
|
Stock Owned by Directors, Nominees and Executive Officers
The following table shows the number and percentage of shares of our common stock beneficially owned by our directors, Named Executive Officers and all directors and executive officers as a group as of April 14, 2017. Each person has sole voting and investment power for the shares shown below unless otherwise indicated.
|
Name of Beneficial Owner
|
Number of Shares
Owned (1)
|
Percent of
Common Stock
Outstanding
|
||||||
|
Directors:
|
||||||||
|
Jerald L. Pullins
|
27,096
|
0.2
|
%
|
|||||
|
Chairman of the Board
|
||||||||
|
Christopher J. Reading
|
110,227
|
(2)
|
0.9
|
%
|
||||
|
President, Chief Executive Officer and Director
|
||||||||
|
Lawrance W. McAfee
|
37,387
|
(3)
|
0.3
|
%
|
||||
|
Executive Vice President, Chief Financial Officer and Director
|
||||||||
|
Mark J. Brookner
|
52,500
|
0.4
|
%
|
|||||
|
Harry S. Chapman
|
36,250
|
0.4
|
%
|
|||||
|
Dr. Bernard A. Harris, Jr
|
31,422
|
0.4
|
%
|
|||||
|
Marlin W. Johnston
|
39,349
|
0.3
|
%
|
|||||
|
Edward L. Kuntz
|
5,750
|
0.0
|
%
|
|||||
|
Reginald E. Swanson
|
2,881
|
(4)
|
0.0
|
%
|
||||
|
Clayton K. Trier
|
13,750
|
0.1
|
%
|
|||||
|
Non-Director Executive Officers:
|
||||||||
|
Glenn D. McDowell
|
34,498
|
(3)
|
0.3
|
%
|
||||
|
Chief Operating Officer
|
||||||||
|
All directors and executive officers as a group (12 persons)
|
391,110
|
3.1
|
%
|
|||||
| (1) |
There are no outstanding stock options.
|
| (2) |
Includes 54,074 shares of common stock granted as restricted stock in which the restrictions will lapse as follows:
|
|
7/1/2017
|
6,816
|
4/1/2018
|
4,941
|
4/1/2019
|
2,441
|
4/1/2020
|
1,021
|
|
10/1/2017
|
6,816
|
7/1/2018
|
4,941
|
7/1/2019
|
2,441
|
7/1/2020
|
1,021
|
|
1/1/2018
|
6,816
|
10/1/2018
|
4,941
|
10/1/2019
|
2,441
|
10/1/2020
|
1,021
|
|
1/1/2019
|
4,941
|
1/1/2020
|
2,441
|
1/1/2021
|
1,035
|
| (3) |
Includes 27,044 shares of common stock granted as restricted stock in which the restrictions will lapse as follows:
|
|
7/1/2017
|
3,407
|
4/1/2018
|
2,470
|
4/1/2019
|
1,220
|
4/1/2020
|
510
|
|
10/1/2017
|
3,407
|
7/1/2018
|
2,470
|
7/1/2019
|
1,220
|
7/1/2020
|
510
|
|
1/1/2018
|
3,415
|
10/1/2018
|
2,470
|
10/1/2019
|
1,220
|
10/1/2020
|
510
|
| 1/1/2019 | 2,470 | 1/1/2020 | 1,220 | 1/1/2021 | 525 |
| (4) |
These shares of our common stock are held by the Regg E. Swanson Revocable Trust of which Mr. Swanson is the trustee and beneficiary.
|
Stock Owned by Certain Beneficial Holders
The table below shows the ownership of shares of common stock by persons known to us to beneficially own more than 5% of our common stock. The information is based on the most recent statements filed with the SEC on Schedule 13G, submitted to us by those persons.
|
Name and Address of Beneficial Owner
|
Amount and
Nature of
Beneficial Ownership
|
Percent of
Common Stock
Outstanding
|
||||||
|
BlackRock, Inc
55 East 52nd Street
New York, NY 10055
|
1,495,455
|
(1)
|
12.0
|
%
|
||||
|
Neuberger Berman Group LLC
1290 Avenue of the Americas
New York, NY 10104
|
1,116,179
|
(2)
|
8.9
|
%
|
||||
|
T. Rowe Price Associates, Inc.
100 East Pratt St.
Baltimore, MD 21202
|
1,021,215
|
(3)
|
8.2
|
%
|
||||
| (1) |
BlackRock, Inc. has sole voting power over 1,468,058 of the shares and sole dispositive power over 1,495,455 of the shares as disclosed in a Schedule 13G/A filed on January 17, 2017. Various persons associated with BlackRock, Inc. have the right to receive or the power to direct the receipt of dividends from, or the proceeds from the sale of the Company. No one person’s interest in the common stock of the Company is more than five percent of the total outstanding common stock.
|
| (2) |
Neuberger Berman Group LLC (“NB Group”) and Neuberger Berman Investment Advisers LLC (“NB Advisers”) have shared voting and dispositive power over 1,116,179 shares as disclosed in a Schedule 13G filed on February 15, 2017. NB Group and its affiliates may be deemed to be beneficial owners of securities for purposes of Exchange Act Rule 13d-3 because they or certain affiliated persons have shared power to retain, dispose of or vote the securities of unrelated clients. NB Group or its affiliated persons do not, however, have any economic interest in the securities of those clients. The clients have the sole right to receive and the power to direct the receipt of dividends from or proceeds from the sale of such securities. No one client has an interest of more than five percentof the issuer.
|
With regard to the shared voting power of the 1,116,179 shares, NB Group may be deemed to be the beneficial owner for purposes of Rule 13d-3 because certain affiliated persons have shared power to retain, dispose of and vote the securities. In addition to the holdings of individual advisory clients, NB Advisers serves as investment manager of NB Group’s various registered mutual funds which hold such shares. The holdings belonging to clients of Neuberger Berman Trust Co N.A., Neuberger Berman Trust Co of Delaware N.A., NB Alternatives Advisers LLC, Neuberger Berman LLC and NB Advisers are also aggregated to comprise the holdings referenced herein.
In addition to the shares, Neuberger entities also have shared power to dispose of the shares which includes shares from individual client accounts over which NB Advisers have shared power to dispose but do not have voting power over these shares. The holdings of Neuberger Berman Trust Co N.A., Neuberger Berman Trust Co of Delaware N.A., NB Alternatives Advisers LLC, Neuberger Berman LLC and NB Advisers are also aggregated to comprise the holdings referenced herein.
| (3) |
T. Rowe Price Associates, Inc. (“Price Associates”) has sole voting power over 233,540 of the shares and sole dispositive power over 1,021,215 of the shares as disclosed in a Schedule 13G filed on February 7, 2017. Price Associates does not serve as custodian of the assets of any of its clients accordingly, in each instance only the client or the client’s custodian or trustee bank has the right to receive dividends paid with respect to, and proceeds from the sale of, such securities. The ultimate power to direct the receipt of dividends paid with respect to, and the proceeds from the sale of , such securities, is vested in the individual and institutional clients which Price Associates serves as investment adviser. Any and all discretionary authority which has been delegated to Price Associates may be revoked in whole or in part at any time. Not more than 5% of the shares is owned by any one client subject to the investment advice of Price Associates.
|
Certain Relationships and Related Transactions
The charter of the Audit Committee requires that the Audit Committee review and approve all insider and affiliated party transactions. There were no such transactions during 2016.
Independent Directors
The Board has affirmatively determined the Messrs. Brookner, Chapman, Harris, Kuntz, Pullins, and Trier have no relationship with the Company or its subsidiaries that would interfere with the exercise of independent judgment in carrying out the responsibilities of a director and are independent, as defined in the NYSE listing standards. Specifically, the Board determined that the foregoing six nominees are “independent” as defined in the NYSE listing standards, and that the directors comprising the Company’s Audit Committee are “independent” as defined in Rule 10A-3(b)(1) under the Exchange Act and the directors comprising the Compensation Committee are “independent” as defined in Rule 10C-1 under the Exchange Act.
Attendance at Board Meetings and Board Committees
The Board of Directors conducts its business through its meetings and through meetings of certain committees of the Board of Directors. The Board of Directors is comprised of a majority of independent directors as required by the NYSE listing standards and is required to meet at least four times per year. In addition, the independent directors periodically meet as a group in executive session, with the Chairman of the Board presiding over such meetings.
The Board has the following standing committees: (i) Governance and Nominating, (ii) Compliance, (iii) Compensation, and (iv) Audit. During 2016, the Board of Directors met seven times, the Governance and Nominating Committee met two times, the Compliance Committee met four times, the Compensation Committee met six times and the Audit Committee met six times. Each of our directors participated in at least 75% of the aggregate meetings of the Board of Directors and the committees on which he served.
The following table sets forth the fees billed for services performed by Grant Thornton LLP for fiscal years 2016 and 2015:
|
2016
|
2015
|
|||||||
|
Audit Fees
|
$
|
637,664
|
$
|
440,578
|
||||
|
Audit-Related Fees
|
-
|
-
|
||||||
|
Tax Fees
|
-
|
-
|
||||||
|
All Other Fees
|
-
|
-
|
||||||
|
$
|
637,664
|
$
|
440,578
|
|||||
“Audit Fees” include fees for professional services rendered in connection with the audit of our financial statements and internal controls over financial reporting for the fiscal year as well as reviews of our interim financial statements included in our quarterly reports on Form 10-Q. The Audit Committee is authorized to delegate to one or more of its members the authority to pre-approve any defined audit and permitted non-audit services to be provided by the independent auditors, and related fees and other terms of engagement on these matters, provided that each pre-approval decision is presented to the full Audit Committee at its next scheduled meeting. In 2016 and 2015, 100% of the audit-related services were pre-approved under authority within certain limits granted by the committee to its chairman pursuant to these pre-approval procedures. Grant Thornton LLP has not provided any tax or other non-audit services to the Company.
PART IV
(a) Documents filed as a part of this report:
1. Financial Statements. Reference is made to the Index to Financial Statements and Related Information under Item 8 in Part II hereof, where these documents are listed.
2. Financial Statement Schedules. See page 105 for Schedule II — Valuation and Qualifying Accounts. All other schedules are omitted because of the absence of conditions under which they are required or because the required information is shown in the financial statements or notes thereto.
3. Exhibits. The exhibits listed in List of Exhibits on the next page are filed or incorporated by reference as part of this report.
|
ITEM 16.
|
FORM 10-K SUMMARY
|
None.
EXHIBIT INDEX
LIST OF EXHIBITS
|
Number
|
Description
|
|
|
3.1
|
Articles of Incorporation of the Company [filed as an exhibit to the Company’s Form 10-Q for the quarterly period ended June 30, 2001 and incorporated herein by reference].
|
|
|
3.2
|
Amendment to the Articles of Incorporation of the Company [filed as an exhibit to the Company’s Form 10-Q for the quarterly period ended June 30, 2001 and incorporated herein by reference].
|
|
|
3.3
|
Bylaws of the Company, as amended [filed as an exhibit to the Company’s Form 10-KSB for the year ended December 31, 1993 and incorporated herein by reference—Commission File Number—1-11151].
|
|
|
10.1+
|
1999 Employee Stock Option Plan (as amended and restated May 20, 2008) [incorporated by reference to Appendix A to the Company’s Definitive Proxy Statement on Schedule 14A, filed with the SEC on April 17, 2008].
|
|
|
10.2+
|
U. S. Physical Therapy, Inc. 2003 Stock Incentive Plan, as amended and restated March 26, 2010 [incorporated by reference to Appendix A to the Company’s proxy statement on Schedule 14A filed with the SEC on April 9, 2010].
|
|
|
10.3+
|
Form of Restricted Stock Agreement [incorporated by reference to Exhibit 10.17 to the Company’s Annual Report on Form 10-K filed with the SEC on March 12, 2013.]
|
|
|
10.4+
|
U. S. Physical Therapy, Inc. Long-Term Incentive Plan for Senior Management for 2013, effective March 27, 2013 [incorporated by reference to Exhibit 99.1 to the Company Current Report on Form 8-K filed with the SEC on April 1, 2013].
|
|
|
10.5+
|
U. S. Physical Therapy, Inc. Objective Cash Bonus Plan for 2013, effective March 27, 2013 [incorporated by reference to Exhibit 99.2 to the Company Current Report on Form 8-K filed with the SEC on April 1, 2013].
|
|
Number
|
Description
|
|
|
10.6+
|
U. S. Physical Therapy, Inc. Discretionary Cash Bonus Plan for 2013, effective March 27, 2013 [incorporated by reference to Exhibit 99.3 to the Company Current Report on Form 8-K filed with the SEC on April 1, 2013].
|
|
|
10.7+
|
U. S. Physical Therapy, Inc. Long-Term Incentive Plan for Senior Management for 2014, effective March 21, 2014 [incorporated by reference to Exhibit 99.1 to the Company Current Report on Form 8-K filed with the SEC on March 27, 2014].
|
|
|
10.8+
|
U. S. Physical Therapy, Inc. Discretionary Long-Term Incentive Plan for Senior Management for 2014, effective March 21, 2014 [incorporated by reference to Exhibit 99.2 to the Company Current Report on Form 8-K filed with the SEC on March 27, 2014].
|
|
|
10.9+
|
U. S. Physical Therapy, Inc. Objective Cash Bonus Plan for Senior Management for 2014, effective March 21, 2014 [incorporated by reference to Exhibit 99.3 to the Company Current Report on Form 8-K filed with the SEC on March 27, 2014].
|
|
|
10.10+
|
U. S. Physical Therapy, Inc. Discretionary Cash Bonus Plan for Senior Management for 2014, effective March 21, 2014 [incorporated by reference to Exhibit 99.4 to the Company Current Report on Form 8-K filed with the SEC on March 27, 2014].
|
|
|
10.11+
|
U. S. Physical Therapy, Inc. Long Term Incentive Plan for Senior Management for 2015, effective March 23, 2015 [incorporated by reference to Exhibit 99.1 to the Company’s Current Report on Form 8-K filed with the SEC on March 27, 2015.]
|
|
|
10.12+
|
U. S. Physical Therapy, Inc. Discretionary Long Term Incentive Plan for Senior Management for 2015, effective March 23, 2015 [incorporated by reference to Exhibit 99.2 to the Company’s Current Report on Form 8-K filed with the SEC on March 27, 2015.]
|
|
|
10.13+
|
U. S. Physical Therapy, Inc. Objective Cash Bonus Plan for Senior Management for 2015, effective March 23, 2015 [incorporated by reference to Exhibit 99.3 to the Company’s Current Report on Form 8-K filed with the SEC on March 27, 2015.]
|
|
|
10.14+
|
U. S. Physical Therapy, Inc. Discretionary Cash Bonus Plan for Senior Management for 2015, effective March 23, 2015 [incorporated by reference to Exhibit 99.4 to the Company’s Current Report on Form 8-K filed with the SEC on March 27, 2015.]
|
|
|
10.15+
|
U. S. Physical Therapy, Inc. Long-Term Incentive Plan for Senior Management for 2017, effective March 24, 2017 [incorporated by reference to Exhibit 99.1 to the Company’s Current Report on Form 8-K filed with the SEC on March 30, 2017.]
|
|
|
10.16+
|
U. S. Physical Therapy, Inc. Discretionary Long –Term Incentive Plan for Senior Management for 2017, effective March 24, 2017 [incorporated by reference to Exhibit 99.2 to the Company’s Current Report on Form 8-K filed with the SEC on March 30, 2017.]
|
|
|
10.17+
|
U. S. Physical Therapy, Inc. Objective Cash Bonus Plan for Senior Management for 2017, effective March 24, 2017 [incorporated by reference to Exhibit 99.3 to the Company’s Current Report on Form 8-K filed with the SEC on March 30, 2017.]
|
|
|
10.18+
|
U. S. Physical Therapy, Inc. Discretionary Cash Bonus Plan for Senior Management for 2017, effective March 24, 2017 [incorporated by reference to Exhibit 99.4 to the Company’s Current Report on Form 8-K filed with the SEC on March 30, 2017.]
|
|
|
10.19
|
Amended and Restated Credit Agreement dated as of December 5, 2013, among the Company, as the borrower, and Bank of America, N.A., as Administrative Agent and other lenders party hereto [incorporated by reference to Exhibit 99.2 to the Company’s Current Report on Form 8-K filed with the SEC on December 9, 2013].
|
|
Number
|
Description
|
|
|
10.20
|
First Amendment to Amended and Restated Credit Agreement by and among the Company and the Lenders party hereto, and Bank of America, N.A., as Administrative Agent [incorporated by reference to Exhibit 99.1 to the Company’s Current Report on Form 8-K, filed with the SEC on September 4, 2015].
|
|
|
10.21
|
Second Amendment to Amended and Restated Credit Agreement by and among the Company and the Lenders party hereto, and Bank of America, N.A., as Administrative Agent [incorporated by reference to Exhibit 99.1 to the Company’s Current Report on Form 8-K, filed with the SEC on January 13, 2016].
|
|
|
10.22*
|
Third Amendment to Amended and Restated Credit Agreement and Limited Waiver by and among the Company and the Lenders party hereto, and Bank of America, N.A., as Administrative Agent.
|
|
|
10.23+
|
Second Amended and Restated Employment Agreement by and between the Company and Christopher J. Reading dated effective February 9, 2016 [incorporated by reference to Exhibit 10.1 to the Company’s Current Report on Form 8-K, filed with the SEC on February 12, 2016].
|
|
|
10.24+
|
Second Amended and Restated Employment Agreement by and between the Company and Lawrance W. McAfee dated effective February 9, 2016 [incorporated by reference to Exhibit 10.2 to the Company’s Current Report on Form 8-K, filed with the SEC on February 12, 2016].
|
|
|
10.25+
|
Amended and Restated Employment Agreement by and between the Company and Glenn D. McDowell dated effective February 9, 2016 [incorporated by reference to Exhibit 10.3 to the Company’s Current Report on Form 8-K, filed with the SEC on February 12, 2016].
|
|
|
21.1*
|
Subsidiaries of the Registrant
|
|
|
23.1*
|
Consent of Independent Registered Public Accounting Firm—Grant Thornton LLP
|
|
|
31.1*
|
Certification of Chief Executive Officer pursuant to Rule 13a-14(a) of the Securities Exchange Act of 1934, as amended
|
|
|
31.2*
|
Certification of Chief Financial Officer pursuant to Rule 13a-14(a) of the Securities Exchange Act of 1934, as amended
|
|
|
31.3*
|
Certification of Controller pursuant to Rule 13a-14(a) of the Securities Exchange Act of 1934, as amended
|
|
|
32.1*
|
Certification of Periodic Report of the Chief Executive Officer, Chief Financial Officer and Controller pursuant to Rule 13a-14(b) of the Securities Exchange Act of 1934, as amended, and 18 U.S.C. Section 1350, as adopted pursuant to Section 906 of the Sarbanes-Oxley Act of 2002
|
|
|
101.INS*
|
XBRL Instance Document
|
|
|
101.SCH*
|
XBRL Taxonomy Extension Schema Document
|
|
|
101.CAL*
|
XBRL Taxonomy Extension Calculation Linkbase Document
|
|
|
101.DEF*
|
XBRL Taxonomy Extension Definition Linkbase Document
|
|
|
101.LAB*
|
XBRL Taxonomy Extension Label Linkbase Document
|
|
|
101.PRE*
|
XBRL Taxonomy Extension Presentation Linkbase Document
|
| * |
Filed herewith
|
| + |
Management contract or compensatory plan or arrangement.
|
FINANCIAL STATEMENT SCHEDULE*
SCHEDULE II — VALUATION AND QUALIFYING ACCOUNTS
U.S. PHYSICAL THERAPY, INC. AND SUBSIDIARIES
|
Balance at
Beginning of Period
|
Additions Charged
to Costs and Expenses
|
Additions Charged
to Other Accounts
|
Deductions
|
Balance at
End of Period
|
||||||||||||||||||||
|
YEAR ENDED DECEMBER 31, 2016:
|
||||||||||||||||||||||||
|
Reserves and allowances deducted from asset accounts:
|
||||||||||||||||||||||||
|
Allowance for doubtful accounts(1)
|
$
|
1,642
|
$
|
3,906
|
-
|
$
|
3,756
|
(2)
|
$
|
1,792
|
||||||||||||||
|
YEAR ENDED DECEMBER 31, 2015:
|
||||||||||||||||||||||||
|
Reserves and allowances deducted from asset accounts:
|
||||||||||||||||||||||||
|
Allowance for doubtful accounts
|
$
|
1,867
|
$
|
4,170
|
-
|
$
|
4,395
|
(2)
|
$
|
1,642
|
||||||||||||||
|
YEAR ENDED DECEMBER 31, 2014:
|
||||||||||||||||||||||||
|
Reserves and allowances deducted from asset accounts:
|
||||||||||||||||||||||||
|
Allowance for doubtful accounts
|
$
|
1,628
|
$
|
4,112
|
-
|
$
|
3,873
|
(2)
|
$
|
1,867
|
||||||||||||||
| (1) |
Related to patient accounts receivable and accounts receivable—other.
|
| (2) |
Uncollectible accounts written off, net of recoveries.
|
| * |
All other schedules are omitted because of the absence of conditions under which they are required or because the required information is shown in the financial statements or notes thereto.
|
Pursuant to the requirements of Section 13 or 15(d) of the Securities Exchange Act of 1934, the registrant has duly caused this report to be signed on its behalf by the undersigned, thereunto duly authorized.
|
U.S. PHYSICAL THERAPY, INC.
|
||
|
(Registrant)
|
||
|
By:
|
/S/ LAWRANCE W. MCAFEE
|
|
|
Lawrance W. McAfee
|
||
|
Chief Financial Officer
|
||
|
By:
|
/S/ JON C. BATES
|
|
|
Jon C. Bates
|
||
|
Vice President/Controller
|
||
Date: June 7, 2017
Pursuant to the requirements of the Securities Exchange Act of 1934, this report has been signed below by the following persons on behalf of the registrant and in the capacities indicated as of the date indicated above.
|
By:
|
/S/ CHRISTOPHER J. READING
|
President, Chief Executive Officer and Director
(principal executive officer)
|
|
Christopher J. Reading
|
||
|
By:
|
/S/ LAWRANCE W. MCAFEE
|
Executive Vice President, Chief Financial Officer and Director (principal financial and accounting officer)
|
|
Lawrance W. McAfee
|
||
|
By:
|
/S/ JERALD PULLINS
|
Chairman of the Board
|
|
Jerald Pullins
|
||
|
By:
|
/S/ DANIEL C. ARNOLD
|
Vice Chairman of the Board
|
|
Daniel C. Arnold
|
||
|
By:
|
/S/ MARK J. BROOKNER
|
Director
|
|
Mark J. Brookner
|
||
|
By:
|
/S/ HARRY S. CHAPMAN
|
Director
|
|
Harry S. Chapman
|
||
|
By:
|
/S/ BERNARD A. HARRIS, JR.
|
Director
|
|
Bernard A. Harris, Jr.
|
||
|
By:
|
/S/ MARLIN W. JOHNSTON
|
Director
|
|
Marlin W. Johnston
|
||
|
By:
|
/S/ EDWARD L. KUNTZ
|
Director
|
|
Edward L. Kuntz
|
||
|
By:
|
/S/ REGG SWANSON
|
Director
|
|
Regg Swanson
|
||
|
By:
|
/S/ CLAYTON TRIER
|
Director
|
|
Clayton Trier
|
EXHIBIT INDEX
LIST OF EXHIBITS
|
Number
|
Description
|
|
|
3.1
|
Articles of Incorporation of the Company [filed as an exhibit to the Company’s Form 10-Q for the quarterly period ended June 30, 2001 and incorporated herein by reference].
|
|
|
3.2
|
Amendment to the Articles of Incorporation of the Company [filed as an exhibit to the Company’s Form 10-Q for the quarterly period ended June 30, 2001 and incorporated herein by reference].
|
|
|
3.3
|
Bylaws of the Company, as amended [filed as an exhibit to the Company’s Form 10-KSB for the year ended December 31, 1993 and incorporated herein by reference—Commission File Number—1-11151].
|
|
|
10.1+
|
1999 Employee Stock Option Plan (as amended and restated May 20, 2008) [incorporated by reference to Appendix A to the Company’s Definitive Proxy Statement on Schedule 14A, filed with the SEC on April 17, 2008].
|
|
|
10.2+
|
U. S. Physical Therapy, Inc. 2003 Stock Incentive Plan, as amended and restated March 26, 2010 [incorporated by reference to Appendix A to the Company’s proxy statement on Schedule 14A filed with the SEC on April 9, 2010].
|
|
|
10.3+
|
Form of Restricted Stock Agreement [incorporated by reference to Exhibit 10.17 to the Company’s Annual Report on Form 10-K filed with the SEC on March 12, 2013.]
|
|
|
10.4+
|
U. S. Physical Therapy, Inc. Long-Term Incentive Plan for Senior Management for 2013, effective March 27, 2013 [incorporated by reference to Exhibit 99.1 to the Company Current Report on Form 8-K filed with the SEC on April 1, 2013].
|
|
|
10.5+
|
U. S. Physical Therapy, Inc. Objective Cash Bonus Plan for 2013, effective March 27, 2013 [incorporated by reference to Exhibit 99.2 to the Company Current Report on Form 8-K filed with the SEC on April 1, 2013].
|
|
Number
|
Description
|
|
|
10.6+
|
U. S. Physical Therapy, Inc. Discretionary Cash Bonus Plan for 2013, effective March 27, 2013 [incorporated by reference to Exhibit 99.3 to the Company Current Report on Form 8-K filed with the SEC on April 1, 2013].
|
|
|
10.7+
|
U. S. Physical Therapy, Inc. Long-Term Incentive Plan for Senior Management for 2014, effective March 21, 2014 [incorporated by reference to Exhibit 99.1 to the Company Current Report on Form 8-K filed with the SEC on March 27, 2014].
|
|
|
10.8+
|
U. S. Physical Therapy, Inc. Discretionary Long-Term Incentive Plan for Senior Management for 2014, effective March 21, 2014 [incorporated by reference to Exhibit 99.2 to the Company Current Report on Form 8-K filed with the SEC on March 27, 2014].
|
|
|
10.9+
|
U. S. Physical Therapy, Inc. Objective Cash Bonus Plan for Senior Management for 2014, effective March 21, 2014 [incorporated by reference to Exhibit 99.3 to the Company Current Report on Form 8-K filed with the SEC on March 27, 2014].
|
|
|
10.10+
|
U. S. Physical Therapy, Inc. Discretionary Cash Bonus Plan for Senior Management for 2014, effective March 21, 2014 [incorporated by reference to Exhibit 99.4 to the Company Current Report on Form 8-K filed with the SEC on March 27, 2014].
|
|
|
10.11+
|
U. S. Physical Therapy, Inc. Long Term Incentive Plan for Senior Management for 2015, effective March 23, 2015 [incorporated by reference to Exhibit 99.1 to the Company’s Current Report on Form 8-K filed with the SEC on March 27, 2015.]
|
|
|
10.12+
|
U. S. Physical Therapy, Inc. Discretionary Long Term Incentive Plan for Senior Management for 2015, effective March 23, 2015 [incorporated by reference to Exhibit 99.2 to the Company’s Current Report on Form 8-K filed with the SEC on March 27, 2015.]
|
|
|
10.13+
|
U. S. Physical Therapy, Inc. Objective Cash Bonus Plan for Senior Management for 2015, effective March 23, 2015 [incorporated by reference to Exhibit 99.3 to the Company’s Current Report on Form 8-K filed with the SEC on March 27, 2015.]
|
|
|
10.14+
|
U. S. Physical Therapy, Inc. Discretionary Cash Bonus Plan for Senior Management for 2015, effective March 23, 2015 [incorporated by reference to Exhibit 99.4 to the Company’s Current Report on Form 8-K filed with the SEC on March 27, 2015.]
|
|
|
10.15+
|
U. S. Physical Therapy, Inc. Long-Term Incentive Plan for Senior Management for 2017, effective March 24, 2017 [incorporated by reference to Exhibit 99.1 to the Company’s Current Report on Form 8-K filed with the SEC on March 30, 2017.]
|
|
|
10.16+
|
U. S. Physical Therapy, Inc. Discretionary Long –Term Incentive Plan for Senior Management for 2017, effective March 24, 2017 [incorporated by reference to Exhibit 99.2 to the Company’s Current Report on Form 8-K filed with the SEC on March 30, 2017.]
|
|
|
10.17+
|
U. S. Physical Therapy, Inc. Objective Cash Bonus Plan for Senior Management for 2017, effective March 24, 2017 [incorporated by reference to Exhibit 99.3 to the Company’s Current Report on Form 8-K filed with the SEC on March 30, 2017.]
|
|
|
10.18+
|
U. S. Physical Therapy, Inc. Discretionary Cash Bonus Plan for Senior Management for 2017, effective March 24, 2017 [incorporated by reference to Exhibit 99.4 to the Company’s Current Report on Form 8-K filed with the SEC on March 30, 2017.]
|
|
|
10.19
|
Amended and Restated Credit Agreement dated as of December 5, 2013, among the Company, as the borrower, and Bank of America, N.A., as Administrative Agent and other lenders party hereto [incorporated by reference to Exhibit 99.2 to the Company’s Current Report on Form 8-K filed with the SEC on December 9, 2013].
|
|
Number
|
Description
|
|
|
10.20
|
First Amendment to Amended and Restated Credit Agreement by and among the Company and the Lenders party hereto, and Bank of America, N.A., as Administrative Agent [incorporated by reference to Exhibit 99.1 to the Company’s Current Report on Form 8-K, filed with the SEC on September 4, 2015].
|
|
|
10.21
|
Second Amendment to Amended and Restated Credit Agreement by and among the Company and the Lenders party hereto, and Bank of America, N.A., as Administrative Agent [incorporated by reference to Exhibit 99.1 to the Company’s Current Report on Form 8-K, filed with the SEC on January 13, 2016].
|
|
|
10.22*
|
Third Amendment to Amended and Restated Credit Agreement and Limited Waiver by and among the Company and the Lenders party hereto, and Bank of America, N.A., as Administrative Agent.
|
|
|
10.23+
|
Second Amended and Restated Employment Agreement by and between the Company and Christopher J. Reading dated effective February 9, 2016 [incorporated by reference to Exhibit 10.1 to the Company’s Current Report on Form 8-K, filed with the SEC on February 12, 2016].
|
|
|
10.24+
|
Second Amended and Restated Employment Agreement by and between the Company and Lawrance W. McAfee dated effective February 9, 2016 [incorporated by reference to Exhibit 10.2 to the Company’s Current Report on Form 8-K, filed with the SEC on February 12, 2016].
|
|
|
10.25+
|
Amended and Restated Employment Agreement by and between the Company and Glenn D. McDowell dated effective February 9, 2016 [incorporated by reference to Exhibit 10.3 to the Company’s Current Report on Form 8-K, filed with the SEC on February 12, 2016].
|
|
|
Subsidiaries of the Registrant
|
||
|
Consent of Independent Registered Public Accounting Firm—Grant Thornton LLP
|
||
|
Certification of Chief Executive Officer pursuant to Rule 13a-14(a) of the Securities Exchange Act of 1934, as amended
|
||
|
Certification of Chief Financial Officer pursuant to Rule 13a-14(a) of the Securities Exchange Act of 1934, as amended
|
||
|
Certification of Controller pursuant to Rule 13a-14(a) of the Securities Exchange Act of 1934, as amended
|
||
|
Certification of Periodic Report of the Chief Executive Officer, Chief Financial Officer and Controller pursuant to Rule 13a-14(b) of the Securities Exchange Act of 1934, as amended, and 18 U.S.C. Section 1350, as adopted pursuant to Section 906 of the Sarbanes-Oxley Act of 2002
|
||
|
101.INS*
|
XBRL Instance Document
|
|
|
101.SCH*
|
XBRL Taxonomy Extension Schema Document
|
|
|
101.CAL*
|
XBRL Taxonomy Extension Calculation Linkbase Document
|
|
|
101.DEF*
|
XBRL Taxonomy Extension Definition Linkbase Document
|
|
|
101.LAB*
|
XBRL Taxonomy Extension Label Linkbase Document
|
|
|
101.PRE*
|
XBRL Taxonomy Extension Presentation Linkbase Document
|
| * |
Filed herewith
|
| + |
Management contract or compensatory plan or arrangement.
|
109