Attached files
| file | filename |
|---|---|
| 8-K - 8-K - Canterbury Park Holding Corp | v468630_8-k.htm |
Exhibit 99.1
Shareholder’s Meeting June 7, 2017

CPHC Financial Results Cautionary Statement : From time to time, in reports filed with the SEC, in press releases, and in other communications to shareholders or the investing public, we may make forward - looking statements concerning possible or anticipated future financial performance, business activities or plans which are typically preceded by the words “believes, expects, anticipates, intends” or similar expressions. For such forward - looking statements, we claim the protection of the safe harbor for forward - looking statements contained in federal securities laws . Shareholders and the investing public should understand that such forward - looking statements are subject to risks and uncertainties which could affect our actual results, and cause actual results to differ materially from those indicated in the forward - looking statements.

CPHC Financial Results BALANCE SHEET HIGHLIGHTS (000’s) as of December 31 2016 2015 Cash & Cash Equivalents $6,299 $8,274 Property & Equipment, Net $35,379 $34,118 Total Assets $49,625 $45,341 Stockholders’ Equity $36,551 $33,097

CPHC Financial Results OPERATING HIGHLIGHTS (000’s) Year Ended December 31 2016 2015 Net Revenues $52,460 $52,263 Operating Expenses $45,319 $47,649 Net Income $4,196 $2,804 Diluted Net Income Per Share $0.97 $0.64

CPHC Financial Results EBITDA HIGHLIGHTS (000’s) Year Ended December 31 2016 2015 EBITDA $9,689 $6,911 Gain on Disposals of Assets (23) (347) Gain on Sale of Land (3,846) (660) Gain on Insurance Recoveries (1,465) (495) Adjusted EBITDA $4,355 $5,409

CPHC Financial Results CASH FLOW HIGHLIGHTS (000’s) Year Ended December 31 2016 2015 Cash Provided by Operations $4,941 $4,429 Cash Used in Investing $(3,817) $(4,007) Cash Used by Financing $(3,100) $(910) Net Decrease in Cash and cash equivalents $(1,975) $(488)

CPHC Financial Results OPERATING HIGHLIGHTS (000’s) Quarter Ended March 31 2017 2016 Net Revenues $11,443 $10,393 Operating Expenses $10,581 $9,870 Net Income $513 $311 Diluted Net Income Per Share $0.12 $0.07

CPHC Financial Results EBITDA HIGHLIGHTS (000’s) Quarter Ended March 31 2017 2016 Net Income $ 513 $ 311 Interest Income, net (12) (1) Income Tax Expense 361 213 Depreciation 646 576 EBITDA $1,508 $1,099

Vision: To generate sustainable growth in our core operations while creating new opportunities to expand and broaden our business. Canterbury Park Guiding Principles Mission: To provide our guests with a premier gaming, entertainment and event experience by conducting ourselves #TheCanterburyWay.
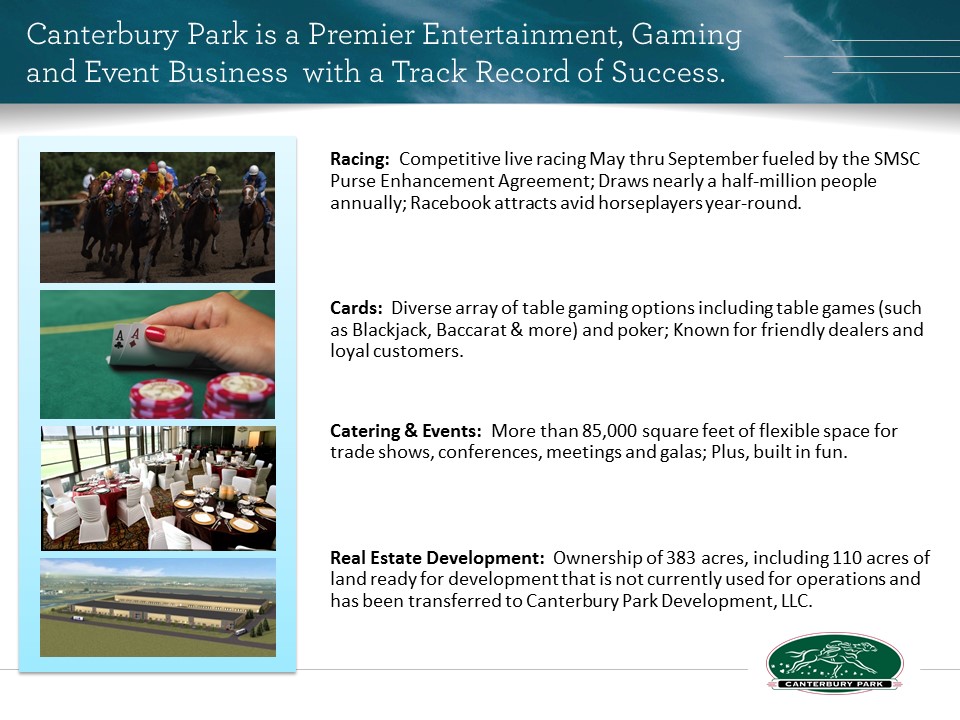
Racing: Competitive live racing May thru September fueled by the SMSC Purse Enhancement Agreement; Draws nearly a half - million people annually; Racebook attracts avid horseplayers year - round. Cards: Diverse array of table gaming options including table games (such as Blackjack, Baccarat & more) and poker; Known for friendly dealers and loyal customers. Catering & Events: More than 85,000 square feet of flexible space for trade shows, conferences, meetings and galas; Plus , built in fun. Real Estate Development: Ownership of 383 acres, including 110 acres of land ready for development that is not currently used for operations and has been transferred to Canterbury Park Development, LLC. Canterbury Park is a Premier Entertainment, Gaming and Event Business with a Track Record of Success.

Strong Brand Reputation & Loyal Fan Base - Over 1 Million annual visitors for racing, cards and events - Respected brand and community member Strong Balance Sheet and Financial Position: - Over $6 million in unrestricted cash and no long term debt - $3 million note receivable from United Properties - Land value has appreciated significantly from book value, which reflects cost not market value Dividend History ‒ Paid special dividends in 12 of the last 17 years totaling almost $12 million ‒ Established dividend policy in 2016 with quarterly dividend of $.05 per share ‒ Dividend increased to $.06 per share in July 2017 Key Investment Highlights

Experienced Executive Management Team - Over 145+ years of experience in the industry - Eight consecutive years of revenue growth; record level of net income in 2016 - Led Canterbury Park to profitability 20 of 21 past years for a total income before taxes of $55.4 million Valuable Real Estate to Drive Long - Term Growth in Shareholder Value - Great facilities that we continue to invest in - Ownership of 383 acres in fast growing county - 110 acres held by Canterbury Development, LLC ready for development as Canterbury Commons Positioned for Continued Success - SMSC Purse Enhancement Agreement solidifies quality racing for years to come. - Positive trend in Table Games business - Catering & Events infrastructure investments showing returns - Potential new revenue streams and customer awareness via land development Key Investment Highlights

STRATEGIC PILLARS Our Track for Success Elevate the Guest Experience Cultivate Greater Customer Intimacy Re - Energized Brand Identity Enhance Employee Engagement Invest in our Property Incorporate Technology in Strategic Development

Elevate the Guest Experience Recent Highlights • Opening of ‘Lil’ Big Thrill Factory • Construction of Bud Light Bar & Party Pit, Enhanced Cabana • Upgrade of ‘Track Snack’ Concession

Cultivate Greater Customer Intimacy Recent Highlights • Revamped top player experiences • Enhanced ‘host’ mentality • Develop new ‘play to win’ promotional capabilities

Recent Highlights • Revamped core website • Launch of Canterbury Commons development brand Re - Energized Brand Identity

Recent Highlights • Rollout of new ticketing solution • Implementation of Human Capital Management System • Implementation of Microsoft Dynamics/Great Plains ERP Incorporate Technology in Strategic Development

Recent Highlights • Expanded PTO offering to part - time employees • Implementation of Ulti - Pro communication portal • C reation of ‘Talent Network’ database Enhance Employee Engagement

Recent Highlights • Completion of infield construction • Roof Replacement Project • Dorm fire prevention sprinkler system Invest in Our Property

Financial Trends

Net Revenue – 5 Year Trend The Company’s growth since 2012 is attributed to the redesign of the Card Casino and significant growth in our table games. Financial Highlights $40,000 $42,000 $44,000 $46,000 $48,000 $50,000 $52,000 $54,000 2012 2013 2014 2015 2016 Net Revenue (In 000's)
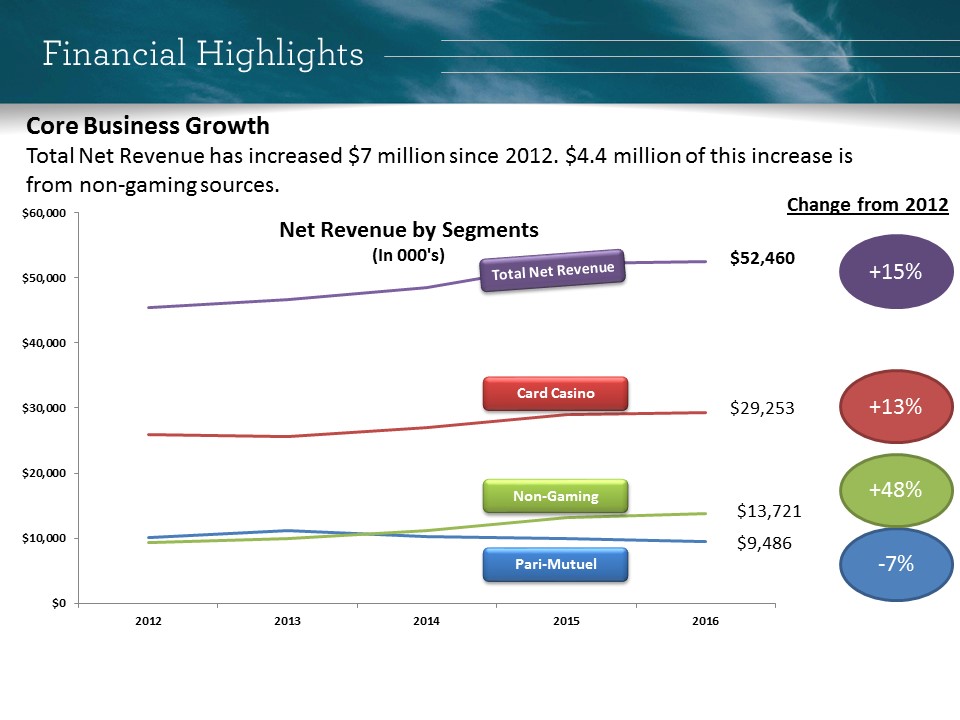
Core Business Growth Total Net Revenue has increased $7 million since 2012. $4.4 million of this increase is from non - gaming sources. +13% - 7% +48% Change from 2012 +15% Financial Highlights $0 $10,000 $20,000 $30,000 $40,000 $50,000 $60,000 2012 2013 2014 2015 2016 Net Revenue by Segments (In 000's) Card Casino Pari - Mutuel Non - Gaming $52,460 $29,253 $9,486 $13,721

Financial Highlights Net revenue by operating segments has shifted slightly from 2015 to 2016. We continue to maintain strong performance in our core business segments as we look to broaden our revenue streams to include property development activities. Net Revenue by Segments Pari - Mutuel 18% Card Casino 56% Non - Gaming 26% 2016 Pari - Mutuel 19% Card Casino 56% Non - Gaming 25% 2015

Continue to Generate Strong Adjusted EBITDA Adjusted EBITDA excludes gains on disposal of fixed assets and insurance recoveries. 2016 and 2015 amounts above exclude gains on sale of fixed assets and insurance recoveries totaling $5.3 million and $1.6 million, respectively. Financial Highlights - 1,000 2,000 3,000 4,000 5,000 6,000 2012 2013 2014 2015 2016 Adjusted EBITDA (In 000's)
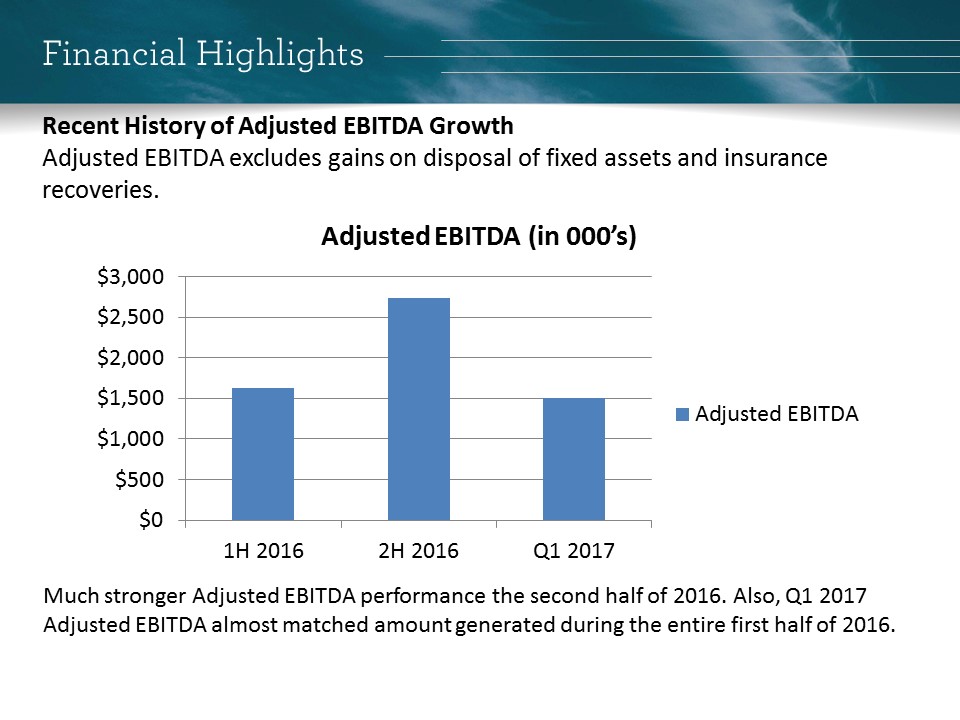
0 500 1000 1500 2000 2500 3000 1H 2016 2H 2016 Q1 2017 Adjusted EBITDA Adjusted EBITDA Recent History of Adjusted EBITDA Growth Adjusted EBITDA excludes gains on disposal of fixed assets and insurance recoveries. Much stronger Adjusted EBITDA performance the second half of 2016. Also, Q1 2017 Adjusted EBITDA almost matched amount generated during the entire first half of 2016. Financial Highlights $0 $500 $1,000 $1,500 $2,000 $2,500 $3,000 1H 2016 2H 2016 Q1 2017 Adjusted EBITDA (in 000’s) Adjusted EBITDA

2012 2013 2014 2015 2016 Cash ($ in ‘000) $ 9,385 $ 8,739 $ 8,762 $ 8,274 $ 6,299 Current Ratio 1.96 1.80 1.89 1.53 1.39 Return on Equity 3.8% 3.6% 7.8% 8.2% 11.5% Cap - Ex ($ in ‘000) $ 1,122 $ 4,311 $ 5,658 $ 9,223 * $ 4,431 Dividends $ 0.50 $ - $ - $ 0.25 $ 0.35 Key Financial Metrics Other Key Financial Metrics Shareholder Value Striving to yield outstanding shareholder value over the past 5 years. Our earnings per share (EPS) - diluted has increased 304% since 2012. $- $0.20 $0.40 $0.60 $0.80 $1.00 $1.20 2012 2013 2014 2015 2016 EPS - Diluted *Includes $4.9 million purchase of Hauer property.

Re - Structured Management Team Name Position Years with Canterbury Park Years in gaming Randy Sampson President, CEO, CFO 23 27 Dan Kennedy Sr. Vice President of Operations <1 24 Mark Erickson Vice President of Facilities 23 30 Mary Fleming Vice President of Human Resources 23 23 John Groen Vice President of Marketing 14 14 Michael Hochman Vice President of C ard Club Operations 17 28 Rob Wolf Vice President of Finance <1 <1 Industry Expertise s Institutional Knowledge s Fresh Thinking Leadership Team

Property Development Update

Property Planning Process • Hauer Property Purchase – Sale: 32 acres (Severs Corn Maze site) – Completed: December 2015 (exchange transaction completed May 2016) – Sale Price: $4,881,000 ($152,000 per acre) • United Property Sale – Sale: 23.8 Acres (Previous Festival Fields site) – Completed: May 2016 – Sale Price: $4,300,000 ($180,000 per acre ) • Laying the Groundwork For Development – Corporate Restructure at 2016 Shareholder Meeting – Platting of Land Completed in 2016 – Canterbury Commons Website and Marketing Materials – Submission to City in May 2017 for Approval of Apartment Project • Canterbury Commons Key Targets – Residential, Entertainment, Restaurant, Hotel, Corporate Office


Property Development Acreage CP total at Jan 1, 2015 381 Hauer Purchase 32 MMPA Sale 6 United Properties Sale 24 Current Land Holding 383 Current Operations Racetrack and parking 170 Barn area 73 Training Track* 30 Currently used for operations 273 Development Opportunities Outlots 110 Training Track 30 Underutilize d land 140 The training track is used for current operations, but is considered underutilized and currently available for development opportunities.

Canterbury Commons EAW

Canterbury Commons Canterbury Commons
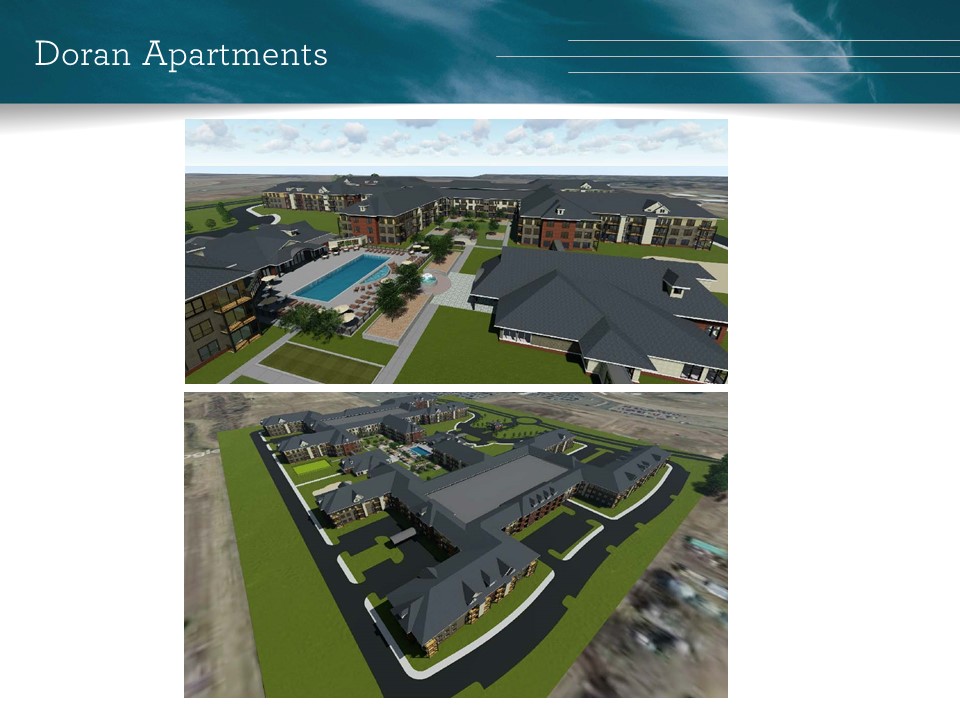
Doran Apartments

Doran Apartments

Thank you!