Attached files
| file | filename |
|---|---|
| 8-K - 8-K - SITE Centers Corp. | d290070d8k.htm |
Exhibit 99.1

Exhibit 99.1
NAREIT
– JUNE 2017DDR CORP.
INVESTOR PRESENTATIONS
DDR considers portions of this information to be forward-looking statements within the meaning of
Section 27A of the Securities Act of 1933 and Section 21E of the Securities Exchange Act of 1934, both as amended, with respect to the Company’s expectations for future periods. Although the Company believes that the expectations
reflected in such forward-looking statements are based upon reasonable assumptions, it can give no assurance that its expectations will be achieved. For this purpose, any statements contained herein that are not historical fact may be deemed to be
forward-looking statements. There are a number of important factors that could cause our results to differ materially from those indicated by such forward-looking statements, including among other factors, local conditions such as supply of space or
a reduction in demand for real estate in the area; competition from other available space; dependence on rental income from real property; the loss of, significant downsizing of or bankruptcy of a major tenant; redevelopment and construction
activities may not achieve a desired return on investment; our ability to buy or sell assets on commercially reasonable terms; our ability to complete acquisitions or dispositions of assets under contract; our ability to secure equity or debt
financing on commercially acceptable terms or at all; our ability to enter into definitive agreements with regard to our financing and joint venture arrangements or our failure to satisfy conditions to the completion of these arrangements; and the
success of our deleveraging strategy; any impact or results from the Company’s portfolio transition or any change in strategy. For additional factors that could cause the results of the Company to differ materially from these indicated in the
forward-looking statements, please refer to the Company’s Form 10-K for the year ended December 31, 2016. The Company undertakes no obligation to publicly revise these forward-looking statements to reflect events or circumstances that
arise after the date hereof.
SAFE HARBOR STATEMENT
2
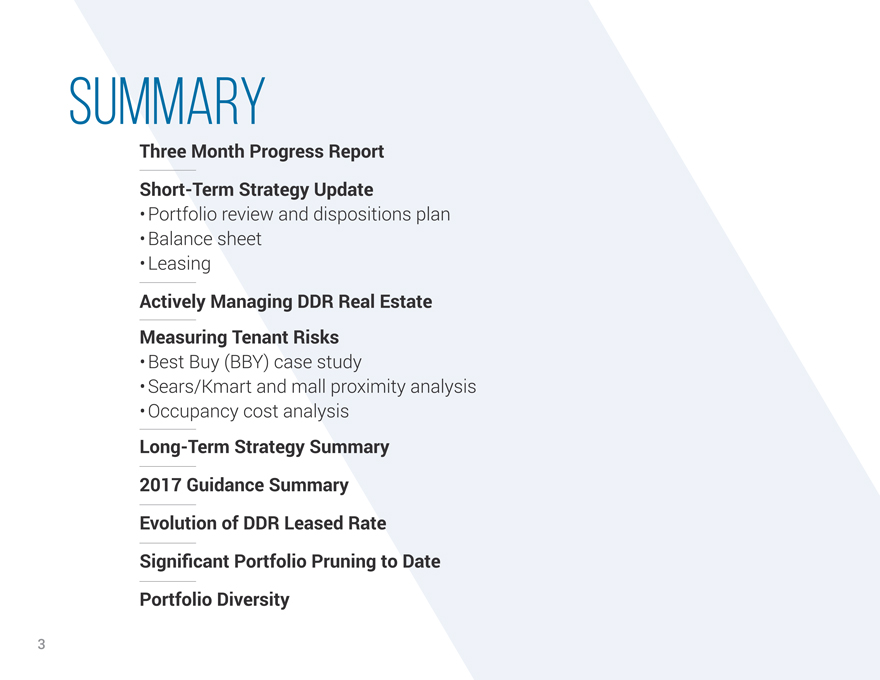
SUMMARY
Three Month
Progress Report
Short-Term Strategy Update
Portfolio review and dispositions
plan
Balance sheet
Leasing
Actively Managing DDR Real Estate
Measuring Tenant Risks
Best Buy (BBY) case study
Sears/Kmart and mall proximity analysis
Occupancy cost analysis
Long-Term Strategy Summary
2017 Guidance Summary
Evolution of DDR Leased Rate
Significant Portfolio Pruning to Date
Portfolio Diversity
3
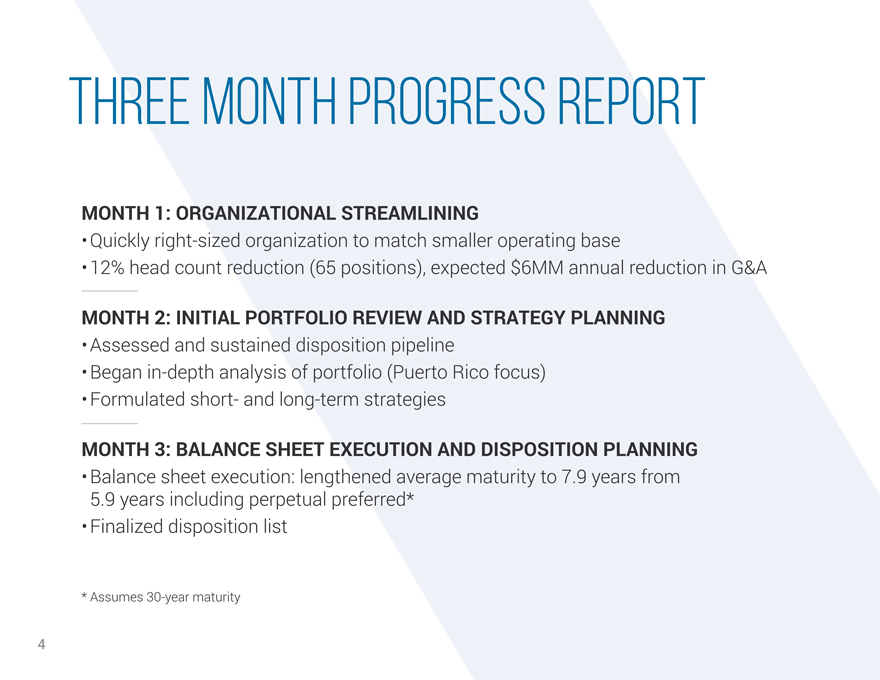
THREE MONTH PROGRESS REPORT
MONTH 1: ORGANIZATIONAL STREAMLINING
Quickly right-sized organization to
match smaller operating base
12% head count reduction (65 positions), expected $6MM annual reduction in G&A
MONTH 2: INITIAL PORTFOLIO REVIEW AND STRATEGY PLANNING
Assessed and sustained disposition
pipeline
Began in-depth analysis of portfolio (Puerto Rico focus)
Formulated
short- and long-term strategies
MONTH 3: BALANCE SHEET EXECUTION AND DISPOSITION PLANNING
Balance sheet execution: lengthened average maturity to 7.9 years from
5.9 years including
perpetual preferred*
Finalized disposition list
* Assumes 30-year maturity
4
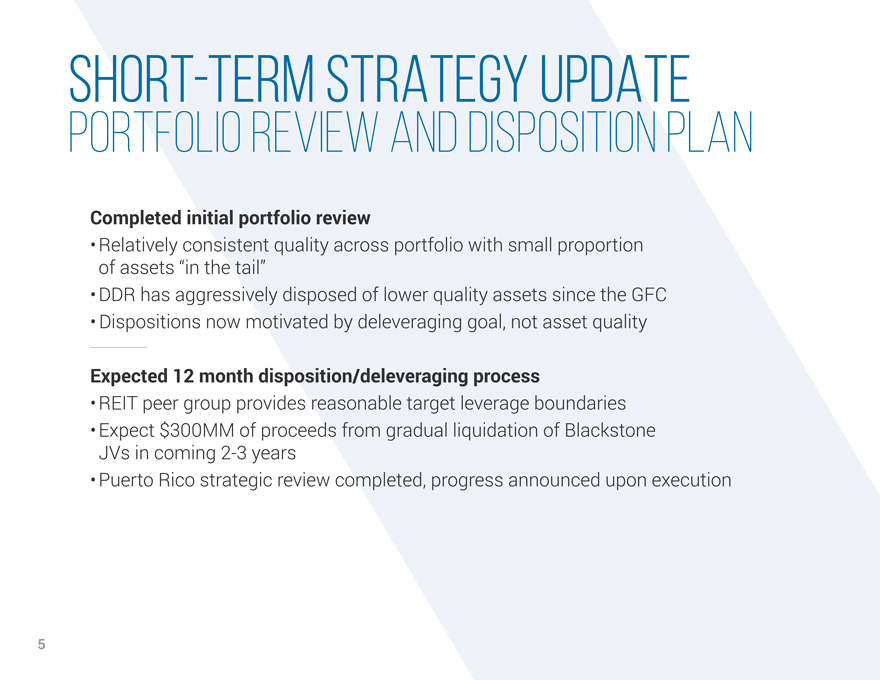
SHORT-TERM STRATEGY UPDATE
PORTFOLIO REVIEW AND DISPOSITION PLAN
Completed initial portfolio review
Relatively consistent quality across portfolio with small proportion
of
assets “in the tail”
DDR has aggressively disposed of lower quality assets since the GFC
Dispositions now motivated by deleveraging goal, not asset quality
Expected 12 month
disposition/deleveraging process
REIT peer group provides reasonable target leverage boundaries
Expect $300MM of proceeds from gradual liquidation of Blackstone
JVs in coming 2-3 years
Puerto Rico strategic review completed, progress announced upon execution
5
SHORT-TERM STRATEGY UPDATE
BALANCE SHEET
Recently completed $625MM of capital markets transactions
10yr Unsecured Notes: $450MM, 4.7% all-in rate, T+245
(minimal new-issue
concession)
Perpetual Preferred: $175MM, 6.375% (negative new-issue concession)
Increase weighted-average maturity
4.0 years as of 1Q17
5.1 years pro forma for 2Q deals, in-line with the peer group, or
7.9 years including
perpetual preferred stock*
Dispositions to move DDR balance sheet to top quartile of peer group
comprehensive leverage
Dispositions to further increase WA maturity
Additional opportunities to increase unencumbered pool via repayment of
secured term loan and
2017/2018 mortgage maturities
* Assumes 30-year maturity
6
SHORT-TERM STRATEGY UPDATE
BALANCE SHEET
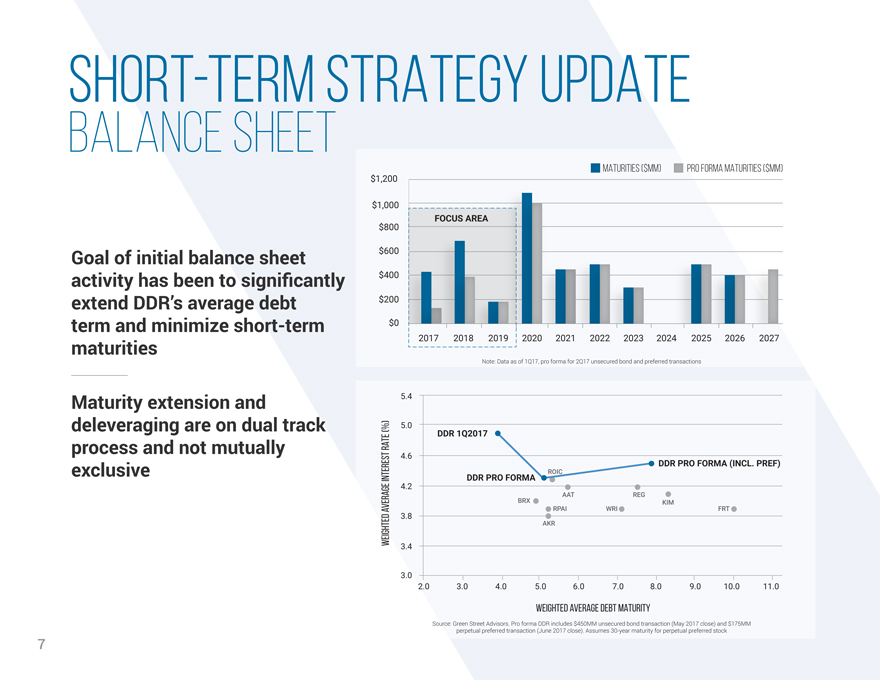
MATURITIES ($MM) PRO FORMA MATURITIES ($MM) $1,200
$1,000
FOCUS AREA $800
Goal of initial balance sheet $600 activity has been to significantly $400 extend DDR’s average debt $200 term and minimize short-term $0 maturities 202
Note: Data as of 1Q17, pro forma for 2Q17 unsecured bond and preferred transactions
Maturity
extension and 5.4 deleveraging are on dual track (%) 5.0
RATE DDR 1Q2017
process and not mutually 4.6
DDR PRO FORMA (INCL. PREF)
exclusive ROIC
INTEREST DDR PRO FORMA
4.2
AAT REG BRX KIM
AVERAGE RPAI WRI FRT
3.8
WEIGHTED AKR
3.4
3.0 2.0 3.0 4.0 5.0 6.0 7.0 8.0 9.0 10.0 11.0 WEIGHTED AVERAGE DEBT MATURITY
Source: Green
Street Advisors. Pro forma DDR includes $450MM unsecured bond transaction (May 2017 close) and $175MM perpetual preferred transaction (June 2017 close). Assumes 30-year maturity for perpetual preferred stock
7
SHORT-TERM STRATEGY UPDATE
LEASING
Currently running ahead of 1Q17 budgeted percentage leased guidance
Expect to sign 475k SF of anchor leases in next 2-3 months vs. 2yr total
quarterly leasing average of 400k SF of new leases
Reaffirming expectation to
complete TSA releasing by mid-2018
Healthy list of high-quality replacement anchors looking for new space
Expect healthy leasing spreads on comparable space
8

ACTIVELY MANAGING DDR REAL ESTATE
9
MEASURING TENANT RISKS
BEST BUY CASE STUDY
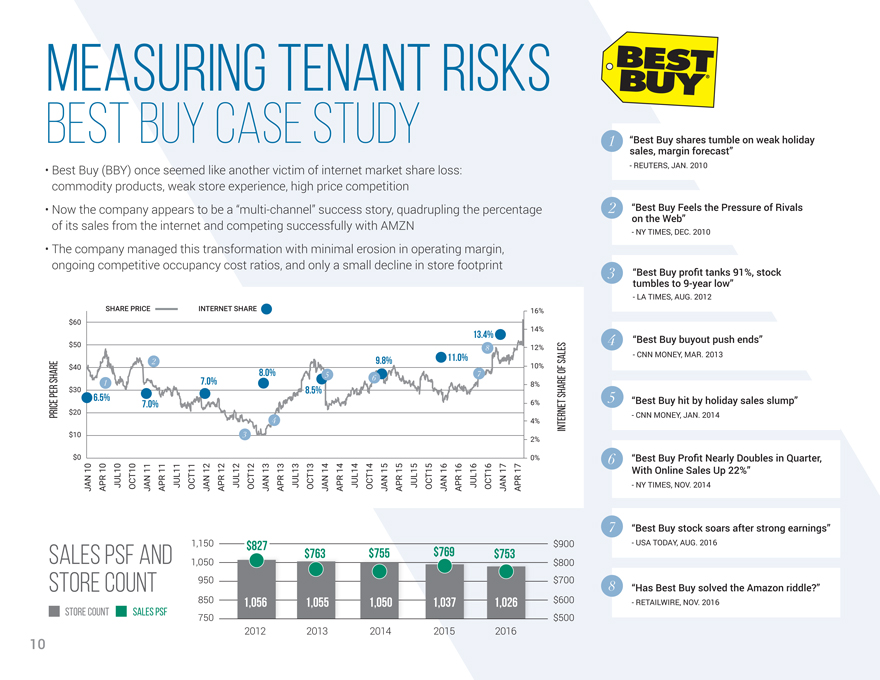
Best Buy (BBY) once seemed like another victim of
internet market share loss:
commodity products, weak store experience, high price competition
Now the company appears to be a “multi-channel” success story, quadrupling the percentage
of its sales from the internet and competing successfully with AMZN
The company managed this
transformation with minimal erosion in operating margin,
ongoing competitive occupancy cost ratios, and only a small decline in store footprint
PRICE PER SHARE
INTERNET SHARE OF SALES
SHARE PRICE INTERNET SHARE 16% $60 14%
13.4%
$50 12%
9.8% 11.0% 10%
$40
8.0%
$30 7.0% 8.5% 8%
6.5%
7.0% 6%
$20
4% $10 2%
$0 0%
JAN 10 APR 10 JUL10 OCT10 JAN 11 APR 11 JUL11 OCT11 JAN 12 APR 12 JUL12 OCT12 JAN 13 APR 13 JUL13 OCT13 JAN 14 APR 14 JUL14 OCT14 JAN 15 APR 15 JUL15 OCT15 JAN 16 APR 16 JUL16
OCT16 JAN 17 APR 17
“Best sales, Buy margin shares forecast” tumble on weak holiday
- REUTERS, JAN. 2010
“Best on the Buy Web” Feels the Pressure of Rivals
- NY TIMES, DEC. 2010
“Best tumbles Buy to profit 9-year tanks low” 91%, stock
- LA TIMES, AUG. 2012
“Best Buy buyout push ends”
- CNN MONEY, MAR. 2013
“Best Buy hit by holiday sales slump”
- CNN MONEY, JAN. 2014
“Best Buy Profit Nearly Doubles in Quarter, With Online Sales Up
22%”
- NY TIMES, NOV. 2014
“Best Buy stock soars after strong
earnings”
- USA TODAY, AUG. 2016
“Has Best Buy solved the Amazon
riddle?”
- RETAILWIRE, NOV. 2016
$827
SALES PSF AND $763 $755 $769 $753
STORE COUNT
1,056 1,055 1,050 1,037 1,026
STORE COUNT SALES PSF
10 2012 2013 2014 2015 2016
1,150, 1,050 950 850 750 $900 $800 $700 $600 $500 10
MEASURING TENANT RISKS
SEARS AND MALL PROXIMITY
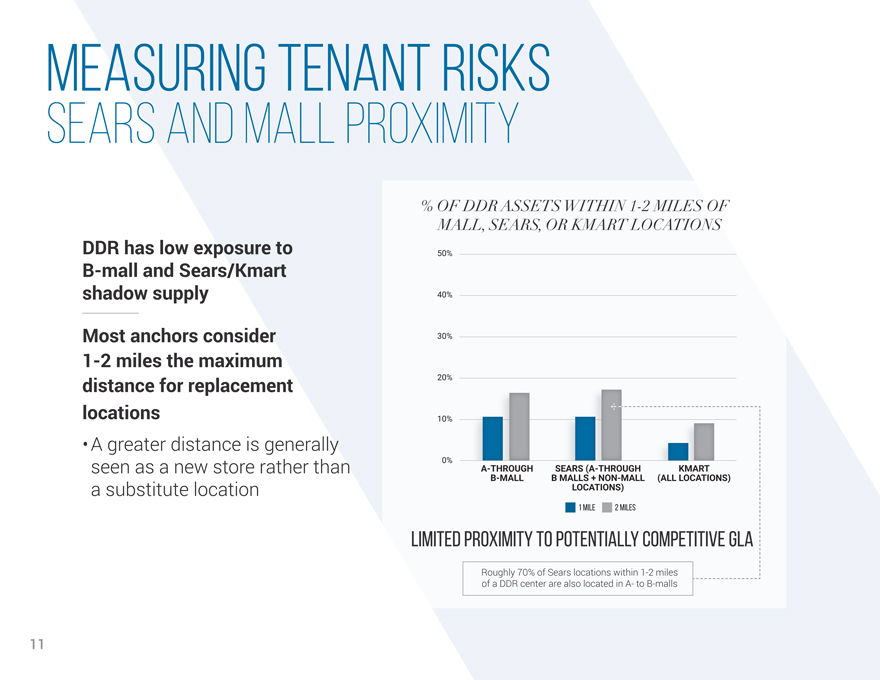
DDR has low exposure to B-mall and Sears/Kmart
shadow supply Most anchors consider
1-2 miles the maximum distance for replacement locations
A greater distance is generally seen as a new store rather than a substitute location
% OF DDR
ASSETS WITHIN 1-2 MILES OF
MALL, SEARS, OR KMART LOCATIONS
50%
40%
30%
20%
10%
0%
A-THROUGH SEARS (A-THROUGH KMART
B-MALL B MALLS + NON-MALL (ALL LOCATIONS)
LOCATIONS)
1 MILE 2 MILES
Limited Proximity to Potentially Competitive GLA
Roughly 70% of Sears locations within 1-2 miles
of a DDR center are also located in A- to
B-malls
11
MEASURING TENANT RISKS
OCCUPANCY COST ANALYSIS
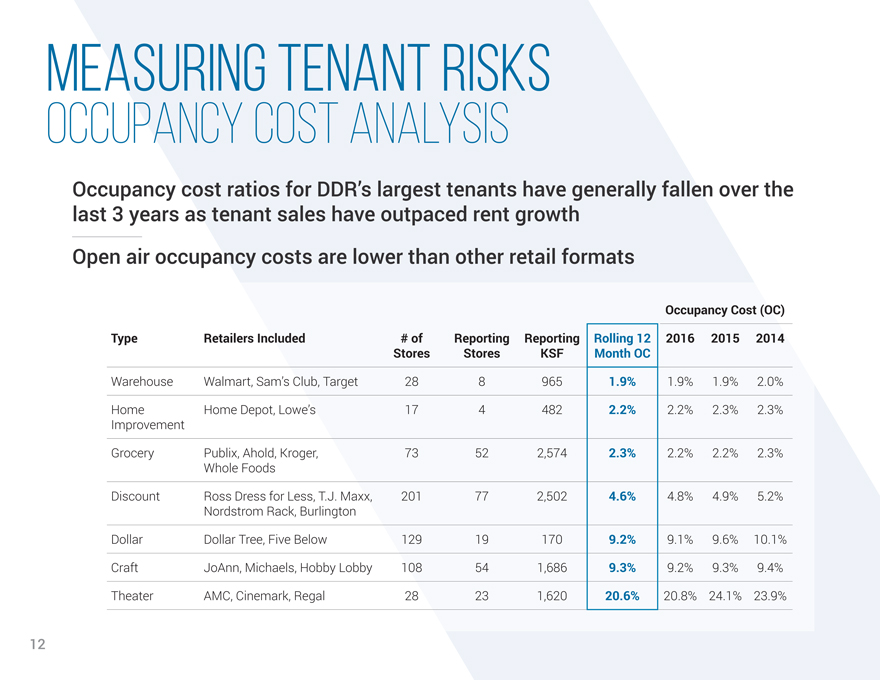
Occupancy cost ratios for DDR’s largest tenants
have generally fallen over the
last 3 years as tenant sales have outpaced rent growth
Open air occupancy costs are lower than other retail formats
Occupancy Cost (OC)
Type Retailers Included # of Reporting Reporting Rolling 12 2016 2015 2014
Stores Stores KSF
Month OC
Warehouse Walmart, Sam’s Club, Target 28 8 965 1.9% 1.9% 1.9% 2.0%
Home Home Depot, Lowe’s 17 4 482 2.2% 2.2% 2.3% 2.3%
Improvement
Grocery Publix, Ahold, Kroger, 73 52 2,574 2.3% 2.2% 2.2% 2.3%
Whole Foods
Discount Ross Dress for Less, T.J. Maxx, 201 77 2,502 4.6% 4.8% 4.9% 5.2%
Nordstrom Rack,
Burlington
Dollar Dollar Tree, Five Below 129 19 170 9.2% 9.1% 9.6% 10.1%
Craft JoAnn, Michaels, Hobby Lobby 108 54 1,686 9.3% 9.2% 9.3% 9.4%
Theater
AMC, Cinemark, Regal 28 23 1,620 20.6% 20.8% 24.1% 23.9%
12
LONG-TERM STRATEGY SUMMARY
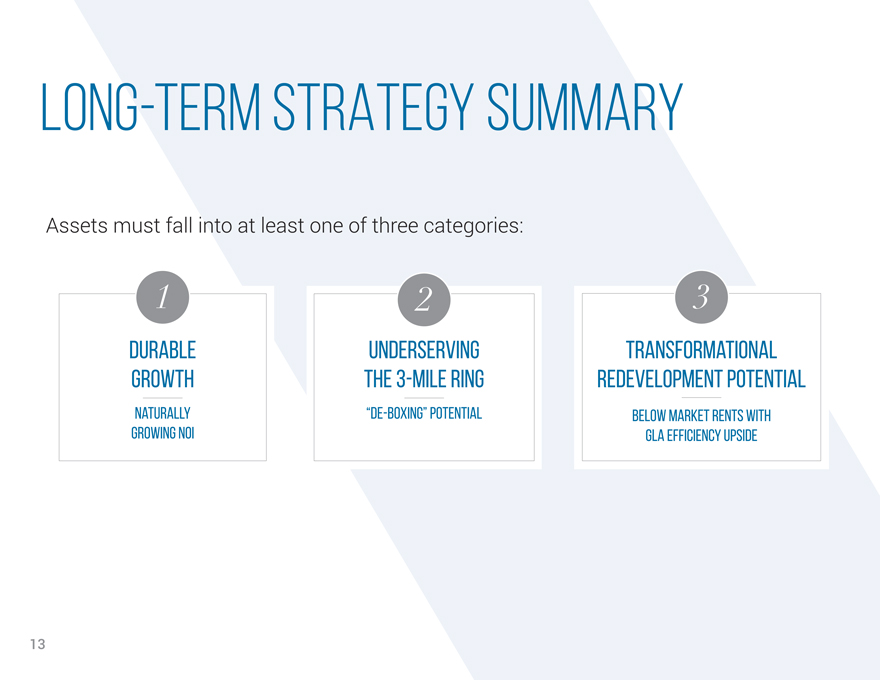
Assets must fall into at least one of three categories:
1 2 3
DURABLE UNDERSERVING TRANSFORMATIONAL GROWTH THE 3-MILE RING REDEVELOPMENT POTENTIAL
NATURALLY
“DE-BOXING” POTENTIAL BELOW MARKET RENTS WITH GROWING NOI GLA EFFICIENCY UPSIDE
13
2017 GUIDANCE SUMMARY
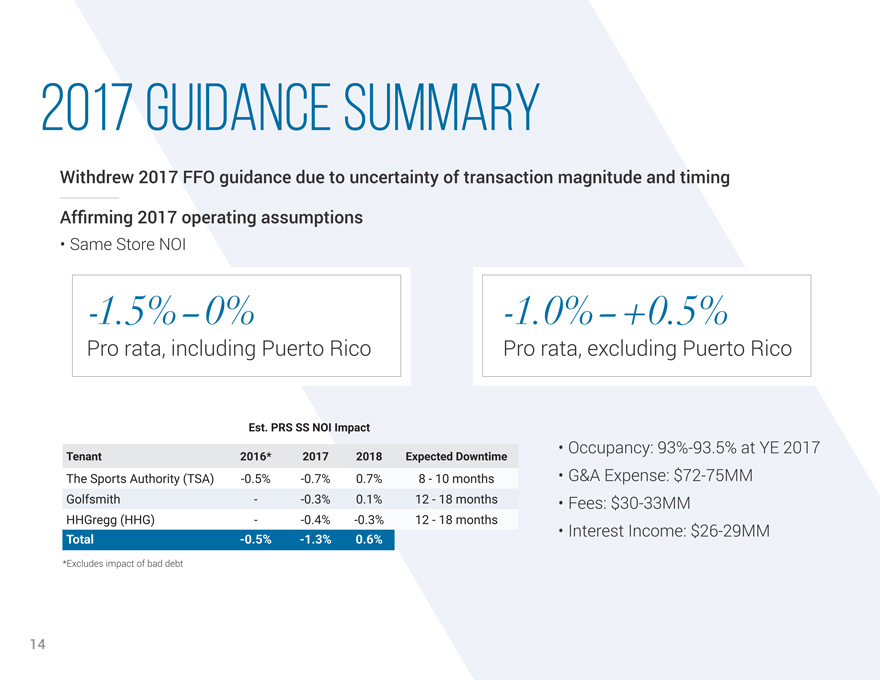
Withdrew 2017 FFO guidance due to uncertainty of transaction magnitude and timing
Affirming 2017 operating assumptions
Same Store NOI
-1.5%-0% -1.0%-+0.5%
Pro rata, including Puerto Rico Pro rata, excluding Puerto Rico
Est. PRS SS NOI Impact
Tenant 2016* 2017 2018 Expected Downtime
The Sports Authority (TSA) -0.5% -0.7% 0.7% 8—10 months
Golfsmith —0.3% 0.1%
12—18 months
HHGregg (HHG) —0.4% -0.3% 12—18 months
Total
-0.5% -1.3% 0.6%
*Excludes impact of bad debt
Occupancy: 93%-93.5% at YE 2017
G&A Expense: $72-75MM
Fees: $30-33MM
Interest Income: $26-29MM
14
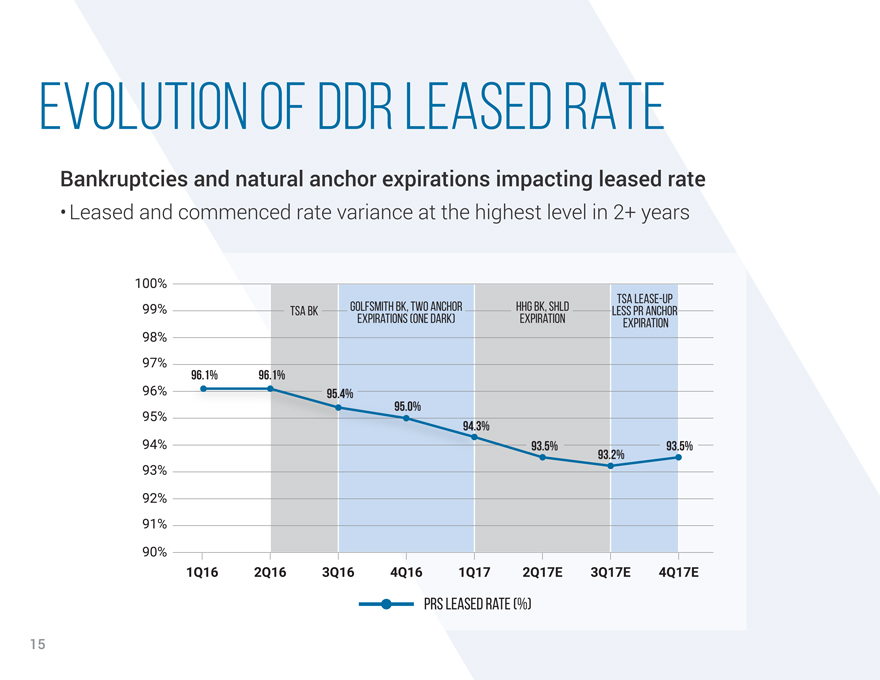
EVOLUTION OF DDR LEASED RATE
Bankruptcies and natural anchor expirations impacting leased rate
Leased and commenced rate
variance at the highest level in 2+ years
100%
TSA lease-up
99% TSA BK Golfsmith BK, two anchor HHG BK, SHLD less PR anchor
Expirations (one Dark)
Expiration expiration
98%
97%
96.1% 96.1%
96% 95.4%
95% 95.0%
94.3%
94% 93.5% 93.5%
93.2%
93%
92%
91%
90%
1Q16 2Q16 3Q16 4Q16 1Q17 2Q17E 3Q17E 4Q17E
Prs Leased Rate (%)
15
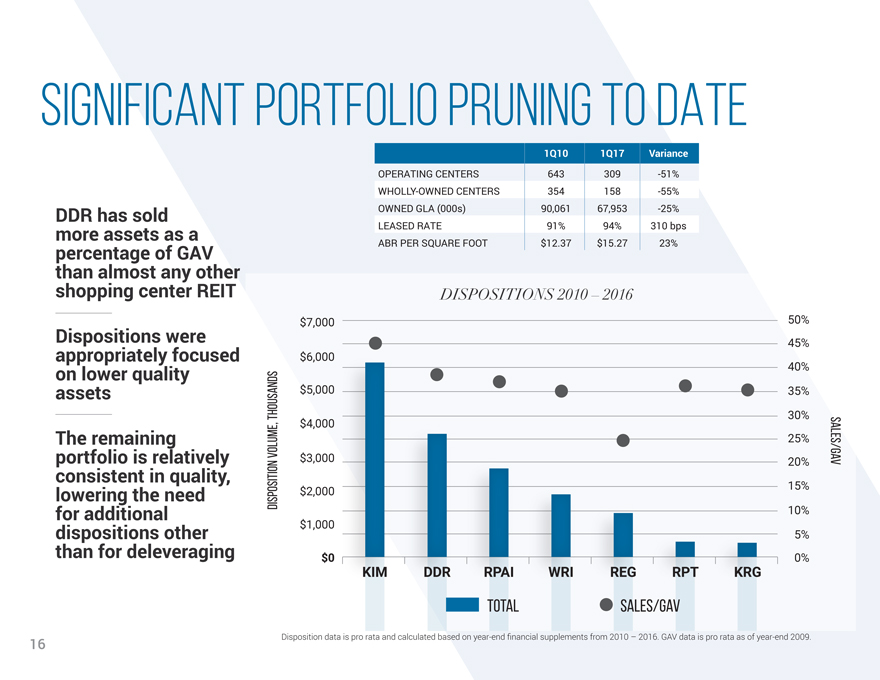
SIGNIFICANT PORTFOLIO PRUNING TO DATE
1Q10 1Q17 Variance
OPERATING CENTERS 643 309 -51%
WHOLLY-OWNED CENTERS 354 158 -55%
OWNED GLA (000s) 90,061 67,953 -25%
LEASED RATE 91% 94% 310 bps
ABR PER SQUARE FOOT $12.37 $15.27 23%
DDR has sold more assets as a percentage of GAV than almost any other shopping center REIT
Dispositions were appropriately focused on lower quality assets
The remaining
portfolio is relatively consistent in quality, lowering the need for additional dispositions other than for deleveraging
DISPOSITION VOLUME, THOUSANDS
SALES/GAV
DISPOSITIONS 2010 – 2016
$7,000 50% 45% $6,000 40% $5,000 35% 30% $4,000 25% $3,000 20% $2,000 15% 10% $1,000 5%
$0 KIM
DDR RPAI WRI REG RPT KRG 0%
TOTAL SALES/GAV
Disposition data is pro rata and
calculated based on year-end financial supplements from 2010 – 2016. GAV data is pro rata as of year-end 2009.
16
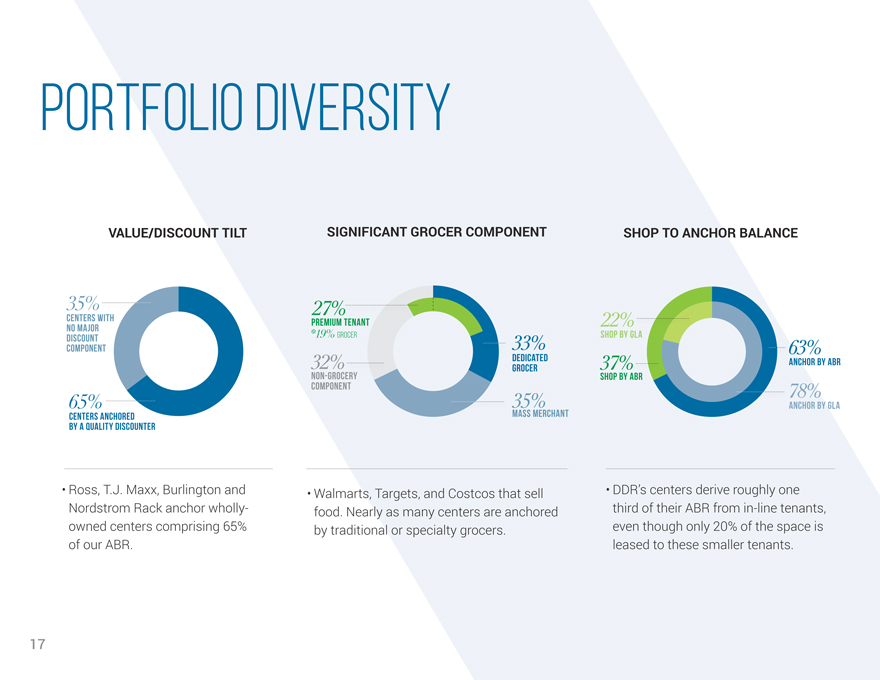
PORTFOLIO DIVERSITY
VALUE/DISCOUNT TILT SIGNIFICANT GROCER COMPONENT SHOP TO ANCHOR BALANCE
35%
CENTERS WITH NO MAJOR DISCOUNT COMPONENT 65% CENTERS ANCHORED BY A QUALITY DISCOUNTER
27% PREMIUM TENANT *19% GROCER 32% NON-GROCERY COMPONENT
33% DEDICATED GROCER 35% MASS MERCHANT
22% SHOP BY GLA 37% SHOP BY ABR
63% ANCHOR BY ABR 78% ANCHOR BY GLA
Ross, T.J. Maxx, Burlington and Nordstrom Rack anchor
wholly-owned centers comprising 65% of our ABR.
Walmarts, targets, and Costcos that sell food. Nearly as many centers are anchored by traditional or specialty
grocers.
DDR’s centers derive roughly one third of their ABR from in-line tenants, even though only 20% of the space is leased to these smaller tenants.17