Attached files
| file | filename |
|---|---|
| 8-K - FORM 8-K - Business Development Corp of America | v468411_8k.htm |
Exhibit 99.1

First Quarter 2017 Investor Presentation
Disclosures 2 This presentation was prepared exclusively for the benefit and use of Business Development Corporation of America (“BDCA”) investors to whom it is directly addressed and delivered and does not carry any right of publication or disclosure, in whole or in part, to any other party. This presen tat ion is for discussion purposes only. Neither this presentation nor any of its contents may be distributed or used for any other purpose without the prior written consent of BD CA Adviser, LLC (“BDCA Adviser ”) and is incomplete without reference to, and should be viewed in conjunction with, the oral briefing provided by BDCA Adviser. BDCA Adviser is an affiliate of Benefit Street Partners L.L.C. (“Benefit Street ”). The sole purpose of this presentation is to provide investors with an update on BDCA. The description of certain aspects of BDCA her ein is a condensed summary only. This summary does not purport to be complete and no obligation to update or otherwise revise such information is being assumed. Th is summary is not an offer to sell securities and is not soliciting an offer to buy securities in any jurisdiction where the offer or sale is not permitted. This summary i s n ot advice, a recommendation or an offer to enter into any transaction with BDCA or any of their affiliated funds. The following slides contain summaries of certain financial information about BDCA. The information contained in this presentatio n i s summary information that is intended to be considered in the context of our SEC filings and other public announcements that we may make, by press release or other wis e, from time to time. We undertake no duty or obligation to publicly update or revise the information contained in this presentation. In addition, information rela ted to past performance, while helpful as an evaluative tool, is not necessarily indicative of future results, the achievement of which cannot be assured. You should not vie w the past performance of BDCA, or information about the market, as indicative of BDCA’s future results. The information contained herein will be superseded by, and is qualified in its entirety by reference to, the BDCA’s Annual Repor t a nd Form 10 - K, which will contain information about the investment objective, terms and conditions of an investment in BDCA. Investors should consider the inve stm ent objectives, risks, and charges and expenses of BDCA carefully before investing. BDCA’s Annual Report and Form 10 - K contain this and other information about the inv estment company. You may obtain a copy of the most recent Annual Report by calling 844 - 785 - 4393 and/or visiting www.bdcofamerica.com. There is no guarantee that any of the estimates, targets or projections illustrated in this summary will be achieved. Any reference s h erein to any of BDCA’s past or present investments, portfolio characteristics, or performance, have been provided for illustrative purposes only. It should not be a ssu med that these investments were or will be profitable or that any future investments will be profitable or will equal the performance of these investments. There can be no guarantee that the investment objective of BDCA will be achieved. Any investment entails a risk of loss. An investor could lose all or substantially all of his or her i nve stment. Please refer to BDCA’s Annual Report on Form 10 - K for a more complete list of risk factors. There can be no assurances that future dividends will match or exceed histor ic ones, or that they will be made at all. It should not be assumed that investments made in the future will be profitable or will equal the performance of investments in thi s document. Net returns give effect to all fees and expenses. Unless otherwise noted, information included herein is presented as of the date indicated on the cover pag e a nd may change at any time without notice. BDCA is subject to certain significant risks relating to its business and investment objective. For more detailed information on risks relating to BDCA, see the latest Form 10 - K and subsequent quarterly reports filed on Form 10 - Q. An affiliate of Benefit Street acquired BDCA Adviser on November 1, 2016. Notwithstanding the acquisition, BDCA Adviser will rem ain the adviser of BDCA. The investments, portfolio characteristics and performance shown for periods prior to this date are for investments, portfolio characteristics an d performance achieved by BDCA Adviser prior to this acquisition. Following the acquisition, all of the members of the investment committee with respect to BDCA cha nge d and while nearly all employees have remained associated with BDCA Adviser as employees of Benefit Street, none of these persons remain on the investment committe e f ollowing the acquisition. As a result, there is no guarantee that the current investment committee would have made similar investments or achieved similar portfolio ch aracteristics or performance as that shown herein.

Disclosures 3 AUM refers to the assets under management for funds and separately managed accounts managed by Providence Equity Partners L.L.C., Pr ovidence Equity Capital Markets L.L.C. (“PECM”), Benefit Street and Merganser Capital Management, LLC (collectively, “Providence”). For private debt funds and other drawdown funds and separately managed accounts, AUM generally represents the sum of the total investments at fair value plus available capital ( und rawn commitments plus distributions subject to recall). For hedge funds and non - drawdown funds and separately managed accounts, AUM represents the NAV (net asset va lue) of each fund or separately managed account. For CLOs, AUM represents the total amount of the debt tranches and subordinated notes (equity) at closing. F or long - only liquid accounts, AUM represents the gross asset value of the investments managed by Providence. AUM amounts are unaudited . Certain amounts are preliminary and remain subject to change. Benefit Street’s private debt/opportunistic credit strategy refers to certain accounts that invest in an opportunistic private debt s tra tegy and are managed by Benefit Street or PECM. BDCA has different investment restrictions, risk tolerances, tax approaches, leverage limitations, regulatory and fund struct ure s than that of the accounts comprising the private debt strategy and was invested under different market conditions than the funds and separately managed ac counts comprising the private debt strategy, and as such, the performance and portfolio characteristics of the accounts comprising these strategies should not b e c onsidered indicative of BDCA’s prospects. Certain information contained herein (including financial information) has been obtained from published sources. Such information has no t been independently verified by BDCA, Benefit Street or their affiliates and BDCA, Benefit Street and their affiliates make no representations concerning and do not assume responsibility for the accuracy of such information. Except where otherwise indicated herein, the information provided herein is based on matters as th ey exist as of the date of preparation and not as of any future date, and will not be updated or otherwise revised to reflect information that subsequently becomes ava ilable, or circumstances existing or changes occurring after the date hereof . The information contained herein is not intended to provide, and should not be relied upon for, accounting, legal, ERISA or tax a dvi ce or investment recommendations. Investors should also seek advice from their own independent tax, accounting, financial, ERISA, investment and legal advisors to properly assess the merits and risks associated with their investment in light of their own financial condition and other circumstances. Forward Looking Statements and Risk Factors This presentation contains “forward looking statements” that are subject to risks and uncertainties. Actual outcomes and results c oul d differ materially from those suggested by this presentation due to the impact of many factors beyond the control of BDCA, including those listed in the “R isk Factors” section of our filings with the Securities and Exchange Commission (“SEC”). Any such forward - looking statements are made pursuant to the safe harbor provisions available under applicable securities laws and BDCA assumes no obligation to update or revise any such forward looking statements. BDCA has based these forward - lookin g statements on its current expectations and projections about future events. BDCA believes that the expectations and assumptions that have been made wit h r espect to these forward - looking statements are reasonable. However, such expectations and assumptions may prove to be incorrect. A number of factors could le ad to results that may differ from those expressed or implied by the forward - looking statements. Given this level of uncertainty, investors should not place undue relian ce on any forward - looking statements.

Today’s Speakers 4 Richard J. Byrne Chief Executive Officer and President of BDCA Richard Byrne is President of Benefit Street Partners and is based in our New York office . Mr . Byrne is also Chief Executive Officer and Chairman of Benefit Street Partners Realty Trust, Inc . Prior to joining BSP in 2013 , Mr . Byrne was Chief Executive O fficer of Deutsche Bank Securities Inc . He was also the Global H ead of Capital M arkets at Deutsche Bank as well as a member of the Global B anking E xecutive Committee and the Global M arkets E xecutive C ommittee . Before joining Deutsche Bank, Mr . Byrne was Global Co - Head of the Leveraged F inance G roup and Global H ead of Credit R esearch at Merrill Lynch . He was also a perennially top - ranked credit analyst . Mr . Byrne earned a Masters of Business Administration from the Kellogg School of Management at Northwestern University and a Bachelor of Arts from Binghamton University . Corinne D. Pankovcin Chief Financial Officer and Treasurer of BDCA Ms . Pankovcin has served as Chief Financial Officer and Treasurer of the Company since December 2015 . Prior to joining BDCA, Ms . Pankovcin was the Chief Financial Officer and Treasurer of BlackRock Capital Investment Corporation (formerly, BlackRock Kelso Capital Corporation) (NASDAQ : BKCC), an externally - managed business development company, and a Managing Director of Finance at BlackRock Investment Management LLC from January 2011 until August 2015 . Prior to that, Ms . Pankovcin was a senior member of Finance & Accounting of Alternative Investments and served as Chief Financial Officer for the Emerging Markets products group at PineBridge Investments (formerly AIG Investments) . Ms . Pankovcin earned her B . S . in Business Administration, with honors, from Dowling College and her M . B . A from Hofstra University . She is a Certified Public Accountant . dddddddddddddddddddddddd
5 Executive Summary Section I Overview of Adviser Section II Overview of BDCA Section III 1Q17 Financial Update Section IV Strategic Initiatives Table of Contents
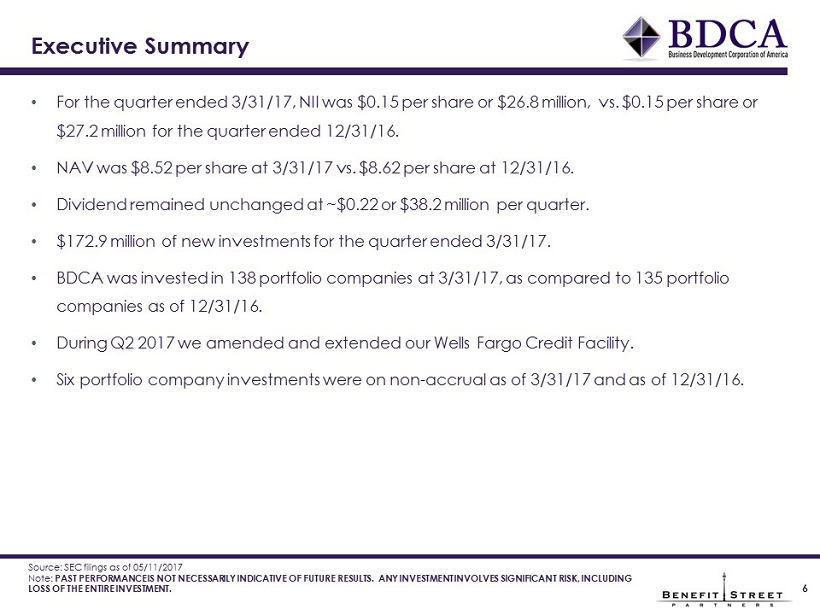
6 Executive Summary • For the quarter ended 3/31/17, NII was $0.15 per share or $26.8 million, vs. $0.15 per share or $27.2 million for the quarter ended 12/31/16. • NAV was $8.52 per share at 3/31/17 vs. $8.62 per share at 12/31/16. • Dividend remained unchanged at ~$ 0.22 or $38.2 million per quarter. • $172.9 million of new investments for the quarter ended 3/31/17 . • BDCA was invested in 138 portfolio companies at 3/31/17 , as compared to 135 portfolio companies as of 12/31/16. • During Q2 2017 we amended and extended our Wells Fargo Credit Facility. • Six portfolio company investments were on non - accrual as of 3/31/17 and as of 12/31/16. Source: SEC filings as of 05/11/2017 Note : PAST PERFORMANCE IS NOT NECESSARILY INDICATIVE OF FUTURE RESULTS. ANY INVESTMENT INVOLVES SIGNIFICANT RISK, INCLUDING LOSS OF THE ENTIRE INVESTMENT.

7 Section I - Overview of Adviser and Benefit Street Partners L.L.C. (“BSP”)
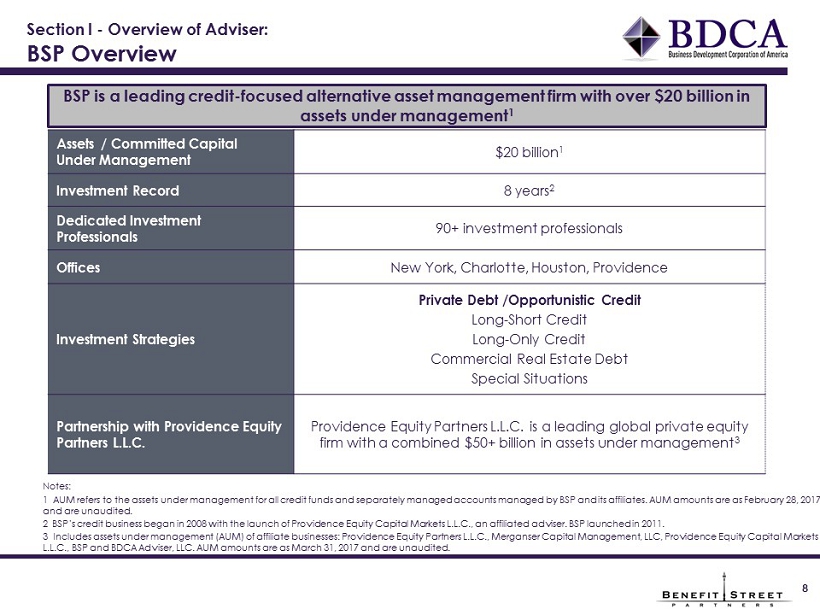
8 Assets / Committed Capital Under Management $20 billion 1 Investment Record 8 years 2 Dedicated Investment Professionals 90+ investment professionals Offices New York, Charlotte, Houston, Providence Investment Strategies Private Debt /Opportunistic Credit Long - Short Credit Long - Only Credit Commercial Real Estate Debt Special Situations Partnership with Providence Equity Partners L.L.C. Providence Equity Partners L.L.C. is a leading global private equity firm with a combined $50+ billion in assets under management 3 Notes: 1 AUM refers to the assets under management for all credit funds and separately managed accounts managed by BSP and its affi lia tes. AUM amounts are as February 28, 2017 and are unaudited. 2 BSP’s credit business began in 2008 with the launch of Providence Equity Capital Markets L.L.C., an affiliated adviser. BSP l aun ched in 2011. 3 Includes assets under management (AUM) of affiliate businesses: Providence Equity Partners L.L.C., Merganser Capital Management, LLC, Pro vidence Equity Capital Markets L.L.C., BSP and BDCA Adviser, LLC. AUM amounts are as March 31, 2017 and are unaudited. BSP is a leading credit - focused alternative asset management firm with over $20 billion in assets under management 1 Section I - Overview of Adviser: BSP Overview
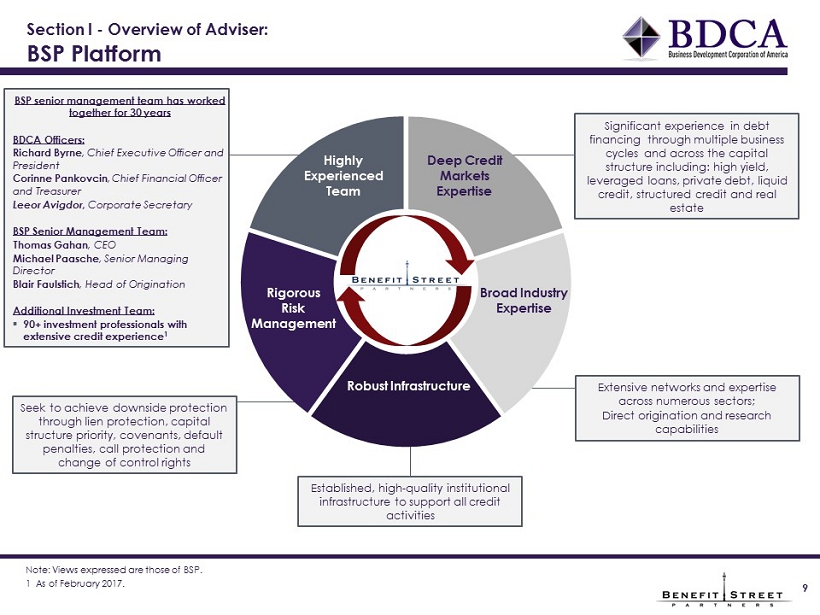
Section I - Overview of Adviser: BSP Platform 9 Established , high - quality institutional infrastructure to support all credit activities Extensive networks and expertise across numerous sectors; Direct origination and research capabilities Seek to achieve downside protection through lien protection, capital structure priority, covenants, default penalties, call protection and change of control rights Highly Experienced Team Deep Credit Markets Expertise Broad Industry Expertise Rigorous Risk Management Robust Infrastructure BSP senior management team has worked together for 30 years BDCA Officers: Richard Byrne , Chief Executive Officer and President Corinne Pankovcin , Chief Financial Officer and Treasurer Leeor Avigdor, Corporate Secretary BSP Senior Management Team: Thomas Gahan , CEO Michael Paasche , Senior Managing Director Blair Faulstich , Head of Origination Additional Investment Team: ▪ 90+ investment professionals with extensive credit experience 1 Significant experience in debt financing through multiple business cycles and across the capital structure including: high yield , leveraged loans, private debt, liquid credit, structured credit and real estate Note: Views expressed are those of BSP. 1 As of February 2017.
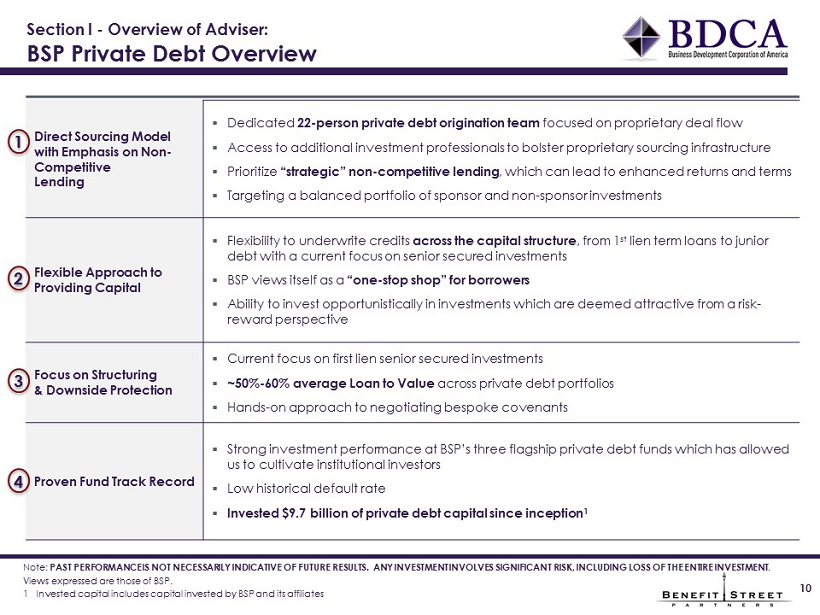
10 Direct Sourcing Model with Emphasis on Non - Competitive Lending ▪ Dedicated 22 - person private debt origination team focused on proprietary deal flow ▪ Access to additional investment professionals to bolster proprietary sourcing infrastructure ▪ Prioritize “strategic” non - competitive lending , which can lead to enhanced returns and terms ▪ Targeting a balanced portfolio of sponsor and non - sponsor investments Flexible Approach to Providing Capital ▪ Flexibility to underwrite credits across the capital structure , from 1 st lien term loans to junior debt with a current focus on senior secured investments ▪ BSP views itself as a “o ne - stop shop” for borrowers ▪ Ability to invest opportunistically in investments which are deemed attractive from a risk - reward perspective Focus on Structuring & Downside Protection ▪ Current focus on first lien senior secured investments ▪ ~50% - 60% average Loan to Value across private debt portfolios ▪ Hands - on approach to negotiating b espoke covenants Proven Fund Track Record ▪ Strong investment performance at BSP’s three flagship private debt funds which has allowed us to cultivate institutional investors ▪ Low historical default rate ▪ Invested $9.7 billion of private debt capital since inception 1 1 2 3 4 Section I - Overview of Adviser: BSP Private Debt Overview Note : PAST PERFORMANCE IS NOT NECESSARILY INDICATIVE OF FUTURE RESULTS. ANY INVESTMENT INVOLVES SIGNIFICANT RISK, INCLUDING LOSS O F T HE ENTIRE INVESTMENT . Views expressed are those of BSP . 1 Invested capital includes capital invested by BSP and its affiliates

11 Section II – Overview of BDCA
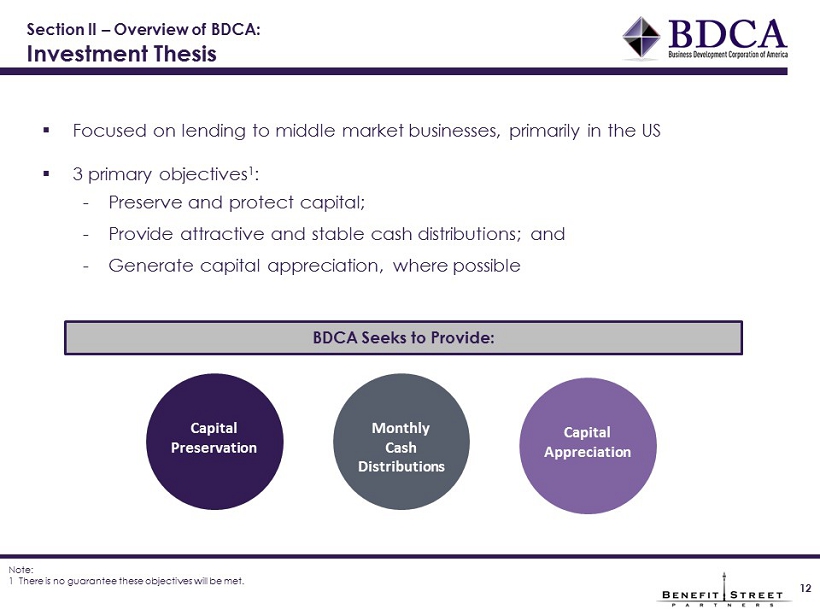
Section II – Overview of BDCA: Investment Thesis 12 ▪ Focused on lending to middle market businesses, primarily in the US ▪ 3 primary objectives 1 : - Preserve and protect capital; - Provide attractive and stable cash distributions; and - Generate capital appreciation, where possible Note: 1 There is no guarantee these objectives will be met. BDCA Seeks to Provide: Capital Preservation Monthly Cash Distributions Capital Appreciation

Section II – Overview of BDCA: Portfolio Snapshot 13 » 138 Portfolio Companies » $2.5 Billion in Assets Under Management (1) » 9.8% Weighted Average Current Yield (2) » 79.6% Senior Secured » 93.3% Floating Rate Source: SEC filings as of 5/11/2017. PAST PERFORMANCE IS NOT NECESSARILY INDICATIVE OF FUTURE RESULTS. ANY INVESTMENT INVOLVES SIGNIFICANT RISK, INCLUDING LOSS OF THE ENTIRE INVESTMENT . Views expressed are those of BSP. 1 AUM represents total assets as of 3/31/2017. 2 Based on fair value and includes annual contractual interest rate and amortization of discounts and fees; excludes equity and non - accrual investments. Security Type Fixed vs. Floating 6.7% 93.3% Fixed Floating 68.3% 11.3% 3.4% 8.9% 8.1% First Lien Second Lien Subordinated Collateralized Securities Equity/Other

Section II – Overview of BDCA: Industry Diversification 14 Source : SEC filings as of 5/11/2017 Diversified Investment Vehicles Aerospace & Defense Health Care Providers & Services Diversified Consumer Services Hotels, Restaurants & Leisure Business Services Internet Software & Services Health Care Diversified Telecommunication Services Commercial Services & Supplies Media Real Estate Management & Development IT Services Food Products Software Professional Services Metals & Mining Machinery Consumer Finance Auto Components Energy Equipment & Services Electronic Equipment, Instruments & Components Transportation Infrastructure Specialty Retail Diversified Financial Services Chemicals Communications Equipment Building Products Insurance Containers & Packaging Life Sciences Tools & Services Household Durables Distributors Health Care Technology Textiles, Apparel & Luxury Goods Industry % of Portfolio CLO Investments, Diversified 8.9% Aerospace & Defense 8.1% Health Care Providers & Services 6.8% Diversified Consumer Services 6.7% Hotels, Restaurants & Leisure 6.3% Business Services 5.3% Fund Investments 4.9% Internet Software & Services 4.7% Health Care 4.1% Diversified Telecommunication Services 3.8% Top 10 Industries 59.6% Remaining Portfolio 40.4% Total Portfolio 100.0%
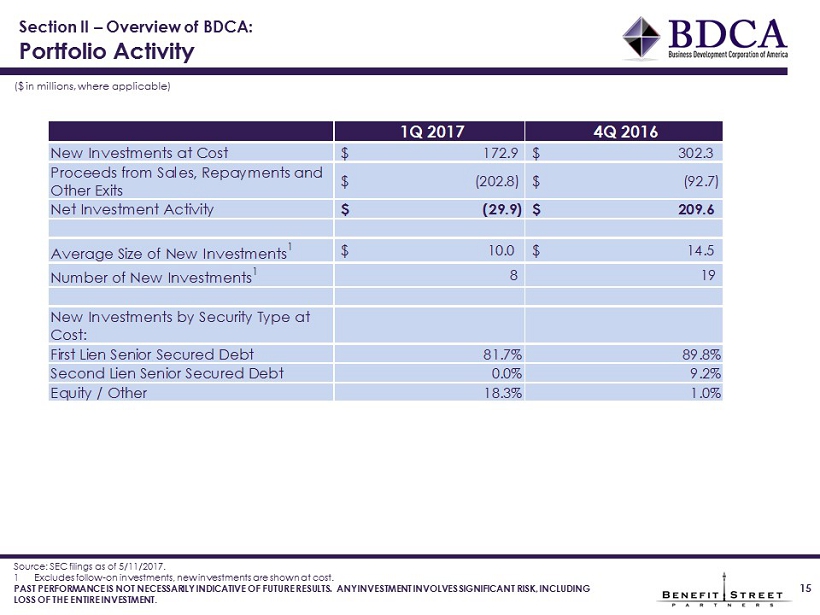
15 ($ in millions, where applicable) Source: SEC filings as of 5/11/2017. 1 Excludes follow - on investments, new investments are shown at cost. PAST PERFORMANCE IS NOT NECESSARILY INDICATIVE OF FUTURE RESULTS. ANY INVESTMENT INVOLVES SIGNIFICANT RISK, INCLUDING LOSS OF THE ENTIRE INVESTMENT . Section II – Overview of BDCA: Portfolio Activity 1Q 2017 4Q 2016 New Investments at Cost $ 172.9 $ 302.3 Proceeds from Sales, Repayments and Other Exits $ (202.8) $ (92.7) Net Investment Activity $ (29.9) $ 209.6 Average Size of New Investments 1 $ 10.0 $ 14.5 Number of New Investments 1 8 19 New Investments by Security Type at Cost: First Lien Senior Secured Debt 81.7% 89.8% Second Lien Senior Secured Debt 0.0% 9.2% Equity / Other 18.3% 1.0%
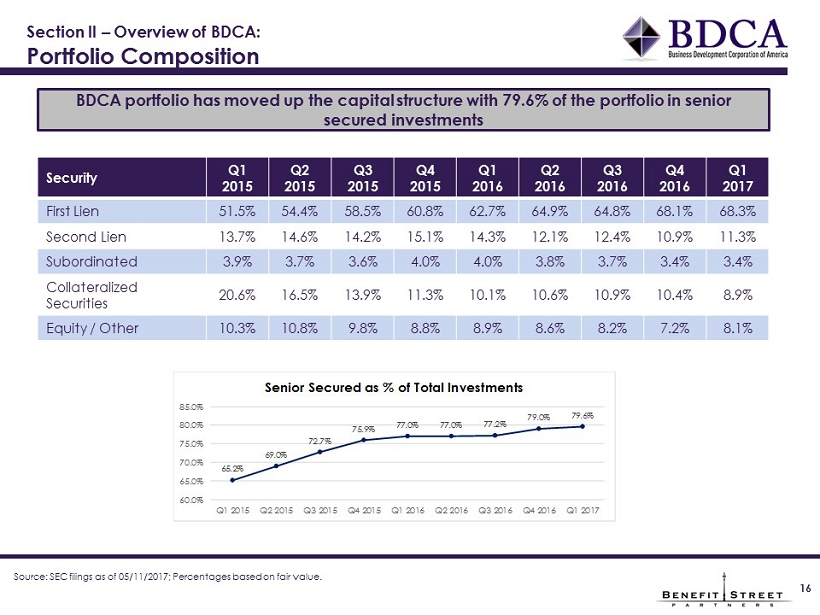
Section II – Overview of BDCA: Portfolio Composition 16 BDCA portfolio has moved up the capital structure with 79.6% of the portfolio in senior secured investments Security Q1 20 15 Q2 20 15 Q3 20 15 Q4 20 15 Q1 2016 Q2 2016 Q3 2016 Q4 2016 Q1 2017 First Lien 51.5% 54.4% 58.5% 60.8% 62.7% 64.9% 64.8% 68.1% 68.3% Second Lien 13.7% 14.6% 14.2% 15.1% 14.3% 12.1% 12.4% 10.9% 11.3% Subordinated 3.9% 3.7% 3.6% 4.0% 4.0% 3.8% 3.7% 3.4% 3.4% Collateralized Securities 20.6% 16.5% 13.9% 11.3% 10.1% 10.6% 10.9% 10.4% 8.9% Equity / Other 10.3% 10.8% 9.8% 8.8% 8.9% 8.6% 8.2% 7.2% 8.1% Source: SEC filings as of 05/11/2017; Percentages based on fair value. 65.2% 69.0% 72.7% 75.9% 77.0% 77.0% 77.2% 79.0% 79.6% 60.0% 65.0% 70.0% 75.0% 80.0% 85.0% Q1 2015 Q2 2015 Q3 2015 Q4 2015 Q1 2016 Q2 2016 Q3 2016 Q4 2016 Q1 2017 Senior Secured as % of Total Investments
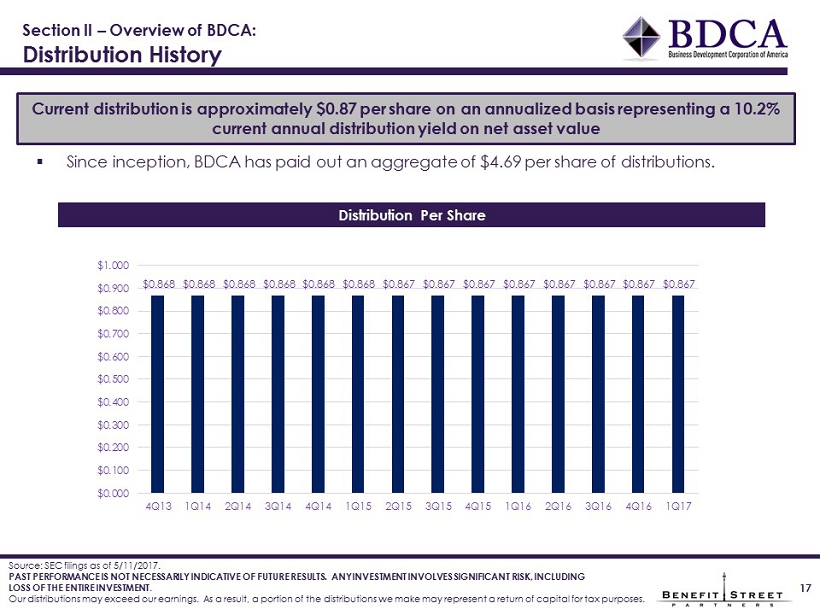
Section II – Overview of BDCA: Distribution History ▪ Since inception, BDCA has paid out an aggregate of $ 4.69 per share of distributions. Source: SEC filings as of 5/11/2017 . PAST PERFORMANCE IS NOT NECESSARILY INDICATIVE OF FUTURE RESULTS. ANY INVESTMENT INVOLVES SIGNIFICANT RISK, INCLUDING LOSS OF THE ENTIRE INVESTMENT . Our distributions may exceed our earnings. As a result, a portion of the distributions we make may represent a return of cap ita l for tax purposes. Current distribution is approximately $0.87 per share on an annualized basis representing a 10.2% current annual distribution yield on net asset value 17 Distribution Per Share $0.868 $0.868 $0.868 $0.868 $0.868 $0.868 $0.867 $0.867 $0.867 $0.867 $0.867 $0.867 $0.867 $0.867 $0.000 $0.100 $0.200 $0.300 $0.400 $0.500 $0.600 $0.700 $0.800 $0.900 $1.000 4Q13 1Q14 2Q14 3Q14 4Q14 1Q15 2Q15 3Q15 4Q15 1Q16 2Q16 3Q16 4Q16 1Q17
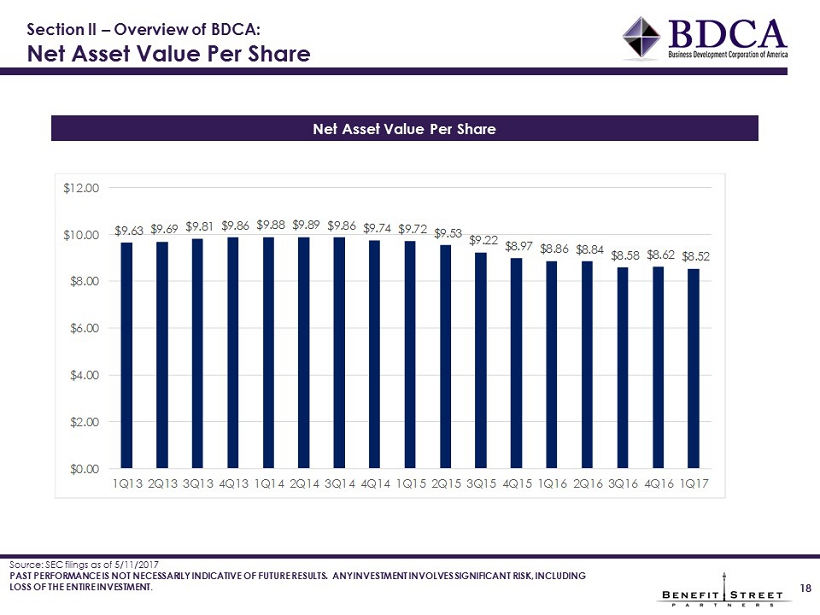
Section II – Overview of BDCA: Net Asset Value Per Share 18 Source: SEC filings as of 5/11/2017 PAST PERFORMANCE IS NOT NECESSARILY INDICATIVE OF FUTURE RESULTS. ANY INVESTMENT INVOLVES SIGNIFICANT RISK, INCLUDING LOSS OF THE ENTIRE INVESTMENT . Net Asset Value Per Share $9.63 $9.69 $9.81 $9.86 $9.88 $9.89 $9.86 $9.74 $9.72 $9.53 $9.22 $8.97 $8.86 $8.84 $8.58 $8.62 $8.52 $0.00 $2.00 $4.00 $6.00 $8.00 $10.00 $12.00 1Q13 2Q13 3Q13 4Q13 1Q14 2Q14 3Q14 4Q14 1Q15 2Q15 3Q15 4Q15 1Q16 2Q16 3Q16 4Q16 1Q17
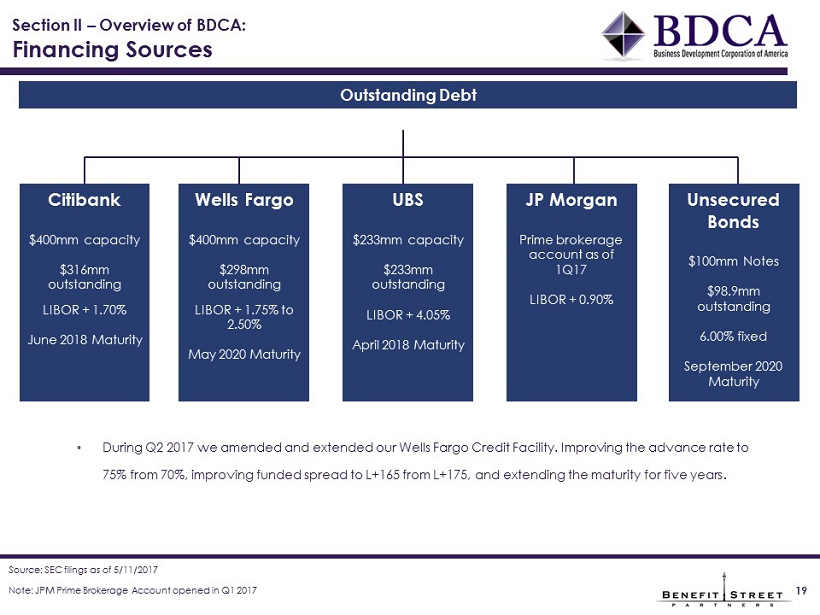
Outstanding Debt Note: JPM Prime Brokerage Account opened in Q1 2017 Section II – Overview of BDCA: Financing Sources 19 Source: SEC filings as of 5/11/2017 Citibank $400mm capacity $316mm outstanding LIBOR + 1.70% June 2018 Maturity Wells Fargo $400mm capacity $298mm outstanding LIBOR + 1.75% to 2.50% May 2020 Maturity UBS $233mm capacity $233mm outstanding LIBOR + 4.05% April 2018 Maturity Unsecured Bonds $100mm Notes $ 98.9mm outstanding 6.00% fixed September 2020 Maturity JP Morgan Prime brokerage account as of 1Q17 LIBOR + 0.90% • During Q2 2017 we amended and extended our Wells Fargo Credit Facility. Improving the advance rate to 75% from 70%, improving funded spread to L+165 from L+175, and extending the maturity for five years .

31 Section II – Overview of BDCA: Board and Management Team Richard J. Byrne Chief Executive Officer and President Richard J. Byrne Chief Executive Officer Ronald J. Kramer Independent Director Leslie D. Michelson Independent Director Randolph C. Read Independent Director Corinne D. Pankovcin Chief Financial Officer and Treasurer BDCA Officers BDCA Board of Directors Edward G. Rendell Independent Director Investment Committee Leeor P. Avigdor Corporate Secretary Guy F. Talarico Chief Compliance Officer Tom Gahan Chief Executive Officer, BSP Michael Paasche, Senior Managing Director, BSP Blair Faulstich Managing Director and Head of Origination, BSP Legacy New Lee S. Hillman Independent Director Dennis M. Schaney Independent Director Board of Directors now includes six independent directors ▪ Two new independent directors added in 1Q17 20

21 Section III – Q1 2017 Financial Update
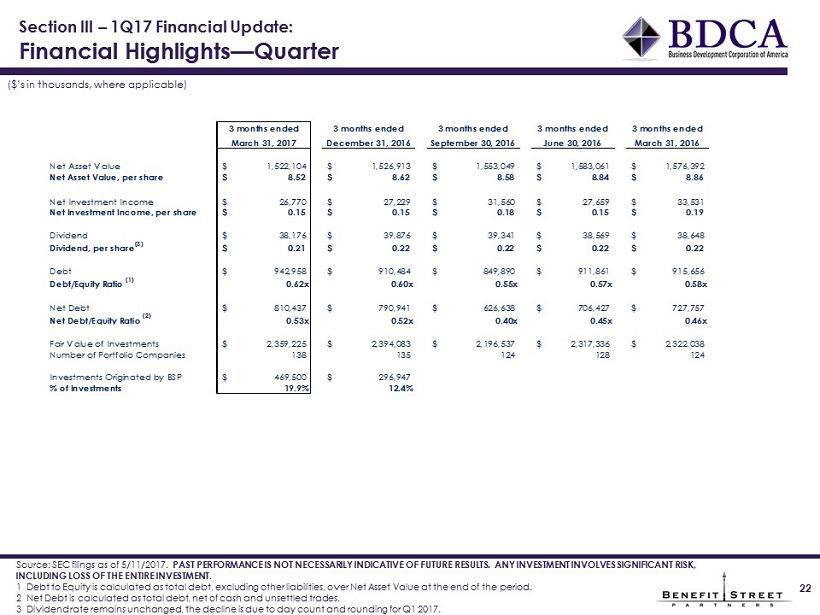
22 Section III – 1Q17 Financial Update: Financial Highlights — Quarter ($’s in thousands, where applicable) Source: SEC filings as of 5/11/2017. PAST PERFORMANCE IS NOT NECESSARILY INDICATIVE OF FUTURE RESULTS. ANY INVESTMENT INVOLVES SIGNIFICANT RISK, INCLUDING LOSS OF THE ENTIRE INVESTMENT . 1 Debt to Equity is calculated as total debt, excluding other liabilities, over Net Asset Value at the end of the period. 2 Net Debt is calculated as total debt, net of cash and unsettled trades . 3 Dividend rate remains unchanged, the decline is due to day count and rounding for Q1 2017. 3 months ended 3 months ended 3 months ended 3 months ended 3 months ended March 31, 2017 December 31, 2016 September 30, 2016 June 30, 2016 March 31, 2016 Net Asset Value 1,522,104$ 1,526,913$ 1,553,049$ 1,583,061$ 1,576,392$ Net Asset Value, per share 8.52$ 8.62$ 8.58$ 8.84$ 8.86$ Net Investment Income 26,770$ 27,229$ 31,560$ 27,659$ 33,531$ Net Investment Income, per share 0.15$ 0.15$ 0.18$ 0.15$ 0.19$ Dividend 38,176$ 39,876$ 39,341$ 38,569$ 38,648$ Dividend, per share (3) 0.21$ 0.22$ 0.22$ 0.22$ 0.22$ Debt 942,958$ 910,484$ 849,890$ 911,861$ 915,656$ Debt/Equity Ratio (1) 0.62x 0.60x 0.55x 0.57x 0.58x Net Debt 810,437$ 790,941$ 626,638$ 706,427$ 727,757$ Net Debt/Equity Ratio (2) 0.53x 0.52x 0.40x 0.45x 0.46x Fair Value of Investments 2,359,225$ 2,394,083$ 2,196,537$ 2,317,336$ 2,322,038$ Number of Portfolio Companies 138 135 124 128 124 Investments Originated by BSP 469,500$ 296,947$ % of Investments 19.9% 12.4%
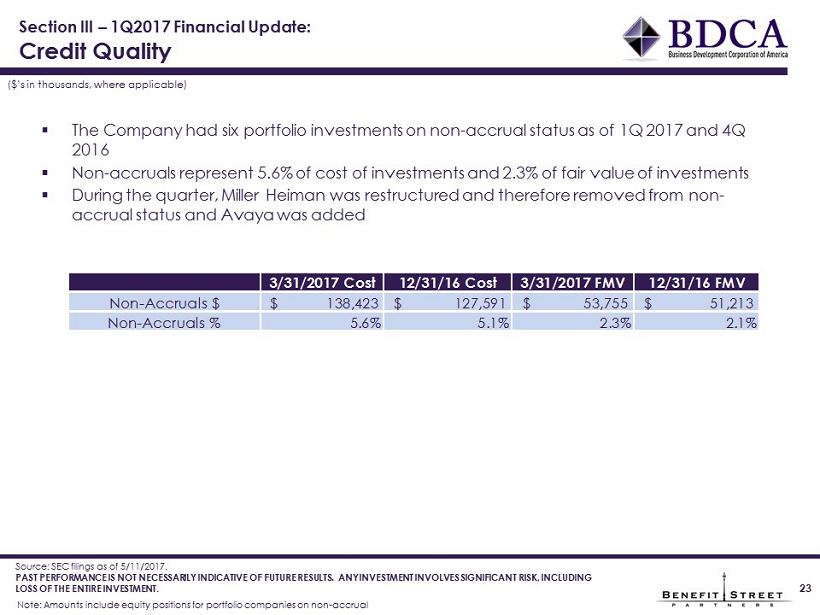
▪ The Company had six portfolio investments on non - accrual status as of 1Q 2017 and 4Q 2016 ▪ Non - accruals represent 5.6% of cost of investments and 2.3% of fair value of investments ▪ During the quarter, Miller Heiman was restructured and therefore removed from non - accrual status and Avaya was added 31 Note: Amounts include equity positions for portfolio companies on non - accrual Section III – 1Q2017 Financial Update: Credit Quality 23 ($’s in thousands, where applicable) Source: SEC filings as of 5/11/2017. PAST PERFORMANCE IS NOT NECESSARILY INDICATIVE OF FUTURE RESULTS. ANY INVESTMENT INVOLVES SIGNIFICANT RISK, INCLUDING LOSS OF THE ENTIRE INVESTMENT . 3/31/2017 Cost 12/31/16 Cost 3/31/2017 FMV 12/31/16 FMV Non-Accruals $ $ 138,423 $ 127,591 $ 53,755 $ 51,213 Non-Accruals % 5.6% 5.1% 2.3% 2.1%

24 Section IV - Strategic Initiatives
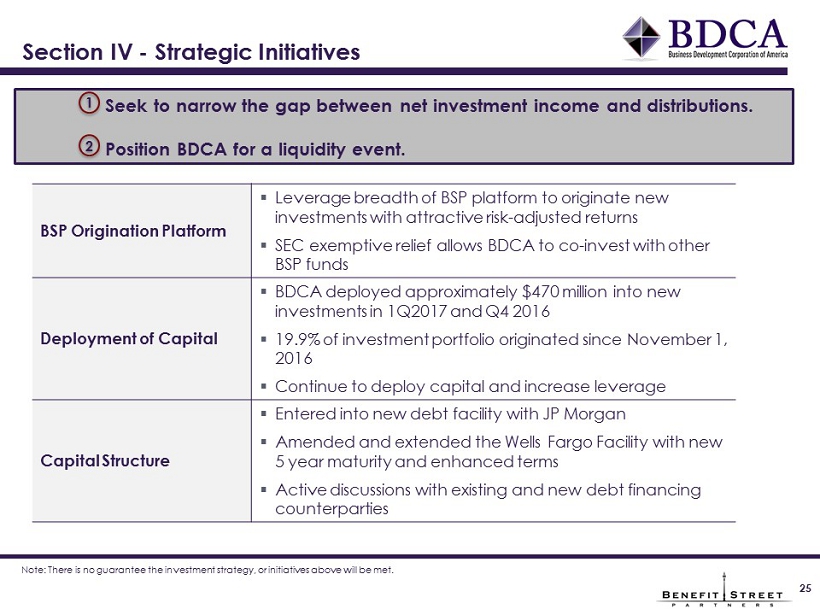
31 Section IV - Strategic Initiatives 25 BSP Origination Platform ▪ Leverage breadth of BSP platform to originate n ew investments with attractive risk - adjusted returns ▪ SEC exemptive relief allows BDCA to co - invest with other BSP funds Deployment of Capital ▪ BDCA deployed approximately $470 million into new investments in 1Q2017 and Q4 2016 ▪ 19.9% of investment portfolio originated since November 1, 2016 ▪ Continue to deploy capital and increase leverage Capital Structure ▪ Entered into new debt facility with JP Morgan ▪ Amended and extended the Wells Fargo Facility with new 5 year maturity and enhanced terms ▪ Active discussions with existing and new debt financing counterparties Seek to narrow the gap between net investment income and distributions . Position BDCA for a liquidity event . 1 2 Note: There is no guarantee the investment strategy, or initiatives above will be met.
The following is a summary of risk factors for Business Development Corporation of America . Risk Factors 26 • You should not expect to be able to sell your shares regardless of how we perform . • If you are able to sell your shares, you will likely receive less than your purchase price . • Our adviser and its affiliates, including our officers and some of our directors, will face conflicts of interest caused by compensation arrangements with us and our affiliates, which could result in actions that are not in the best interests of our stockholders . • We do not intend to list our shares on any securities exchange during or for what may be a significant time after the offering period, and we do not expect a secondary market in the shares to develop . • We may borrow funds to make investments . As a result, we would be exposed to the risks of borrowing, also known as leverage, which may be considered a speculative investment technique . Leverage increases the volatility of investments by magnifying the potential for gain and loss on amounts invested, thereby increasing the risks associated with investing in our securities . Moreover, any assets we may acquire with leverage will be subject to management fees payable to our Adviser ; thus our Adviser may have an incentive to increase portfolio leverage in order to earn higher management fees . • Because you will be unable to sell your shares, you will be unable to reduce your exposure in any market downturn . • Our distributions may be funded from any sources of funds available to us, including offering proceeds and borrowings as well as expense support payments from our Adviser that are subject to reimbursement to it, which may constitute a return of capital and reduce the amount of capital available to us for investment . We have not established limits on the amount of funds we may use from available sources to make distributions . The Adviser has no obligation to make expense support payments in the future . Any capital returned to stockholders through distributions will be distributed after payment of fees and expenses . Our Adviser may also waive reimbursements by us for certain expenses paid by it to fund our distributions . The waived reimbursements may be subject to repayment in the future, reducing future distributions to which our stockholders may be entitled . • For more detailed information on risks relating to BDCA, see the latest Form 10 - K and quarterly reports filed on Form 10 - Q .

27 www.bdcofamerica.com ▪ For account information, including balances and the status of submitted paperwork, please call Investor Relations at (844) 785 - 4393 ▪ Financial Advisors may view client accounts, statements and tax forms at www.dstvision.com ▪ Shareholders may access their accounts at www.bdcofamerica.com