Attached files
| file | filename |
|---|---|
| 8-K - FORM 8-K - FEDERAL SIGNAL CORP /DE/ | form8-k20170531.htm |
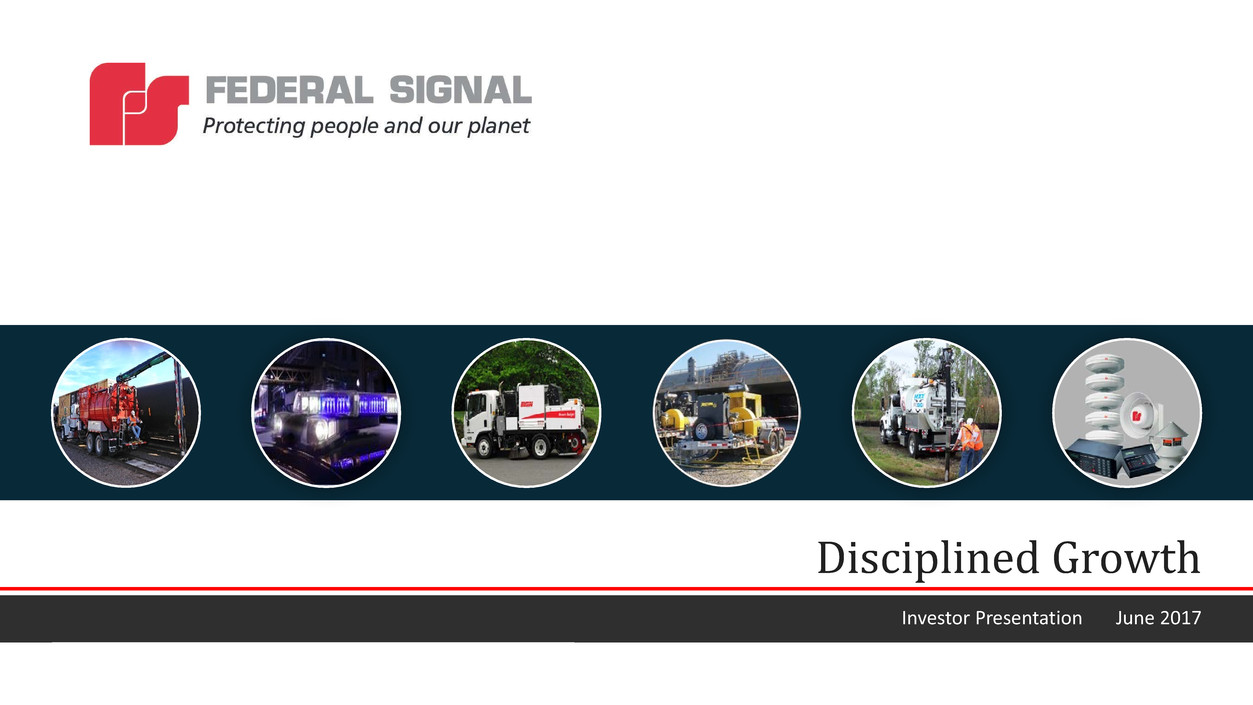
Disciplined Growth
Investor Presentation June 2017
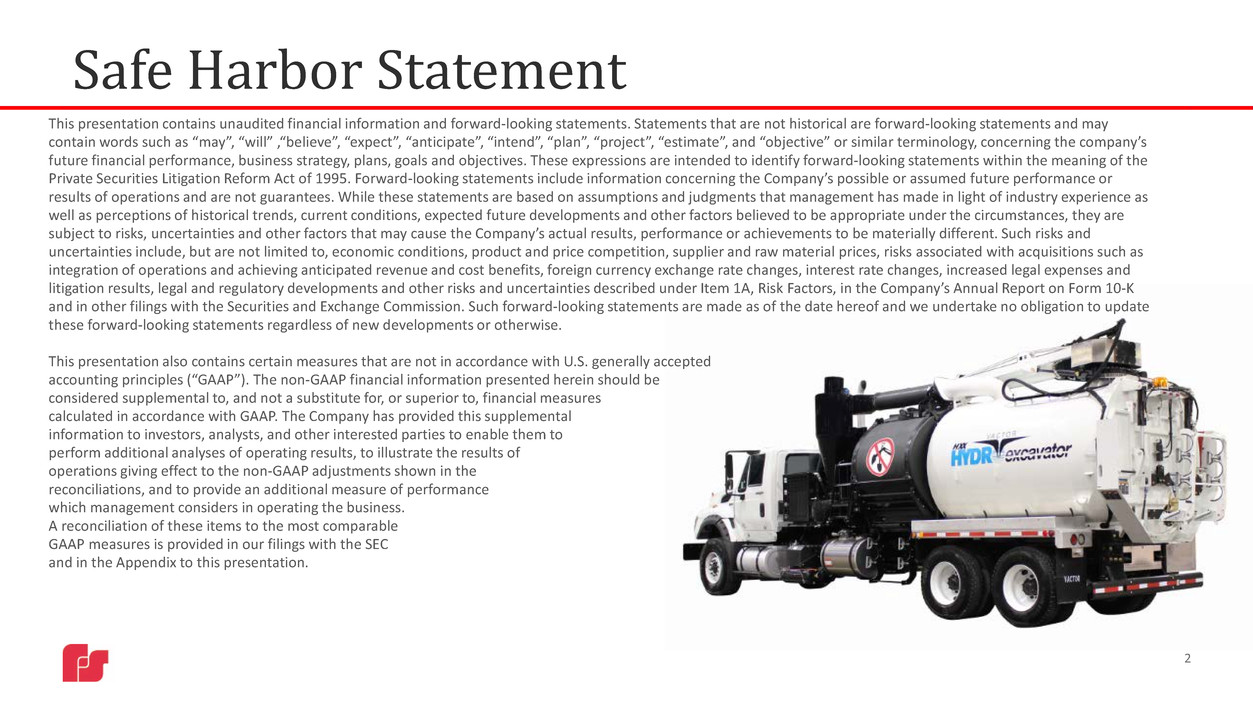
Safe Harbor Statement
2
This presentation contains unaudited financial information and forward-looking statements. Statements that are not historical are forward-looking statements and may
contain words such as “may”, “will” ,“believe”, “expect”, “anticipate”, “intend”, “plan”, “project”, “estimate”, and “objective” or similar terminology, concerning the company’s
future financial performance, business strategy, plans, goals and objectives. These expressions are intended to identify forward-looking statements within the meaning of the
Private Securities Litigation Reform Act of 1995. Forward-looking statements include information concerning the Company’s possible or assumed future performance or
results of operations and are not guarantees. While these statements are based on assumptions and judgments that management has made in light of industry experience as
well as perceptions of historical trends, current conditions, expected future developments and other factors believed to be appropriate under the circumstances, they are
subject to risks, uncertainties and other factors that may cause the Company’s actual results, performance or achievements to be materially different. Such risks and
uncertainties include, but are not limited to, economic conditions, product and price competition, supplier and raw material prices, risks associated with acquisitions such as
integration of operations and achieving anticipated revenue and cost benefits, foreign currency exchange rate changes, interest rate changes, increased legal expenses and
litigation results, legal and regulatory developments and other risks and uncertainties described under Item 1A, Risk Factors, in the Company’s Annual Report on Form 10-K
and in other filings with the Securities and Exchange Commission. Such forward-looking statements are made as of the date hereof and we undertake no obligation to update
these forward-looking statements regardless of new developments or otherwise.
This presentation also contains certain measures that are not in accordance with U.S. generally accepted
accounting principles (“GAAP”). The non-GAAP financial information presented herein should be
considered supplemental to, and not a substitute for, or superior to, financial measures
calculated in accordance with GAAP. The Company has provided this supplemental
information to investors, analysts, and other interested parties to enable them to
perform additional analyses of operating results, to illustrate the results of
operations giving effect to the non-GAAP adjustments shown in the
reconciliations, and to provide an additional measure of performance
which management considers in operating the business.
A reconciliation of these items to the most comparable
GAAP measures is provided in our filings with the SEC
and in the Appendix to this presentation.

About Federal Signal
• Founded in 1901, joined NYSE in 1969
(“FSS”)
• Diversified industrial manufacturer of
specialized environmental cleaning
vehicles such as street sweepers, sewer
cleaners and hydroexcavators; as well as
safety and security products including
audible and visual warning devices
• Headquartered in Oak Brook, Illinois with
10 manufacturing facilities worldwide
• Leading brands of premium,
value-adding products and systems
3

An Experienced Leadership Team
4
Ian Hudson
Vice President and Interim Chief Financial Officer
Appointed March, 2017
Joined Federal Signal in August 2013 as Vice President and
Corporate Controller
Previously served as Director of Accounting – Latin America
and Asia Pacific at Groupon, Inc.
13+ years public accounting experience with Ernst & Young,
LLP
Jennifer Sherman
President and Chief Executive Officer
Appointed January, 2016
Previously Chief Operating Officer, Chief Administrative
Officer, Secretary and General Counsel, with operating
responsibilities for the Company’s Safety and Security
Systems Group
Joined Federal Signal in 1994 as Corporate Counsel
Svetlana Vinokur
Vice President, Treasurer and Corporate Development
Appointed April, 2015
Previously served as Assistant Treasurer for Illinois Tool
Works Inc., Finance Head of M&A Strategy at Mead Johnson
Nutrition Company, and senior associate for Robert W. Baird
& Company’s Consumer and Industrial Investment Banking
group
David Martin
Chief Operating Officer
Appointed April, 2017
Previously served as Managing Director of OPW/Tokheim,
a business unit of Dover Corporation
Additional roles held at Dover include Managing Director,
Chief Financial Officer and Integration Lead of Harbison-
Fischer, and Vice President of Corporate Development

Serves the needs of
municipalities and
industrial verticals for
audible and visual
safety and security
notification devices
and systems
Two Attractive Platforms
5
*TTM 3/31/17
Environmental Solutions
Group
(ESG)
Safety and Security Systems
Group
(SSG)$503 M*
$210 M*Serves municipal,
industrial, and utility
markets for surface
and sub-surface
cleaning, safe-digging
and infrastructure
maintenance
Positioned for Long-Term Growth
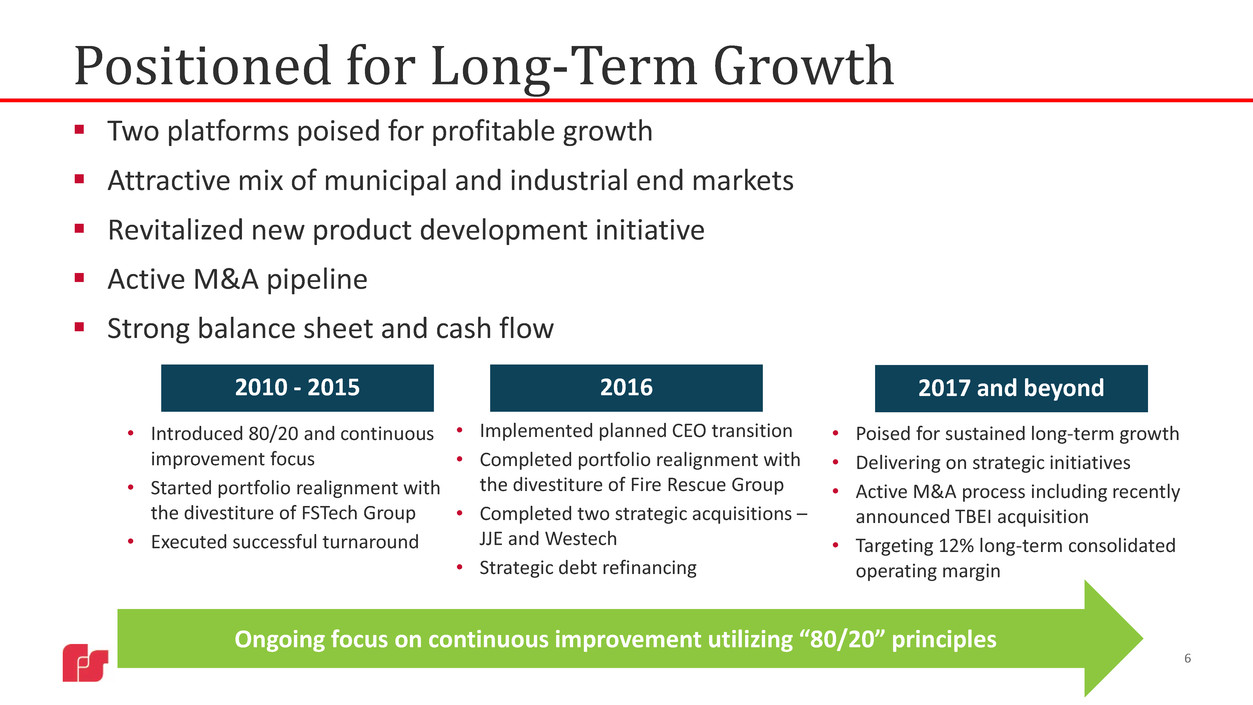
Two platforms poised for profitable growth
Attractive mix of municipal and industrial end markets
Revitalized new product development initiative
Active M&A pipeline
Strong balance sheet and cash flow
Ongoing focus on continuous improvement utilizing “80/20” principles
2010 - 2015 2016 2017 and beyond
• Introduced 80/20 and continuous
improvement focus
• Started portfolio realignment with
the divestiture of FSTech Group
• Executed successful turnaround
• Implemented planned CEO transition
• Completed portfolio realignment with
the divestiture of Fire Rescue Group
• Completed two strategic acquisitions –
JJE and Westech
• Strategic debt refinancing
• Poised for sustained long-term growth
• Delivering on strategic initiatives
• Active M&A process including recently
announced TBEI acquisition
• Targeting 12% long-term consolidated
operating margin
6
Federal Signal Strategic Focus
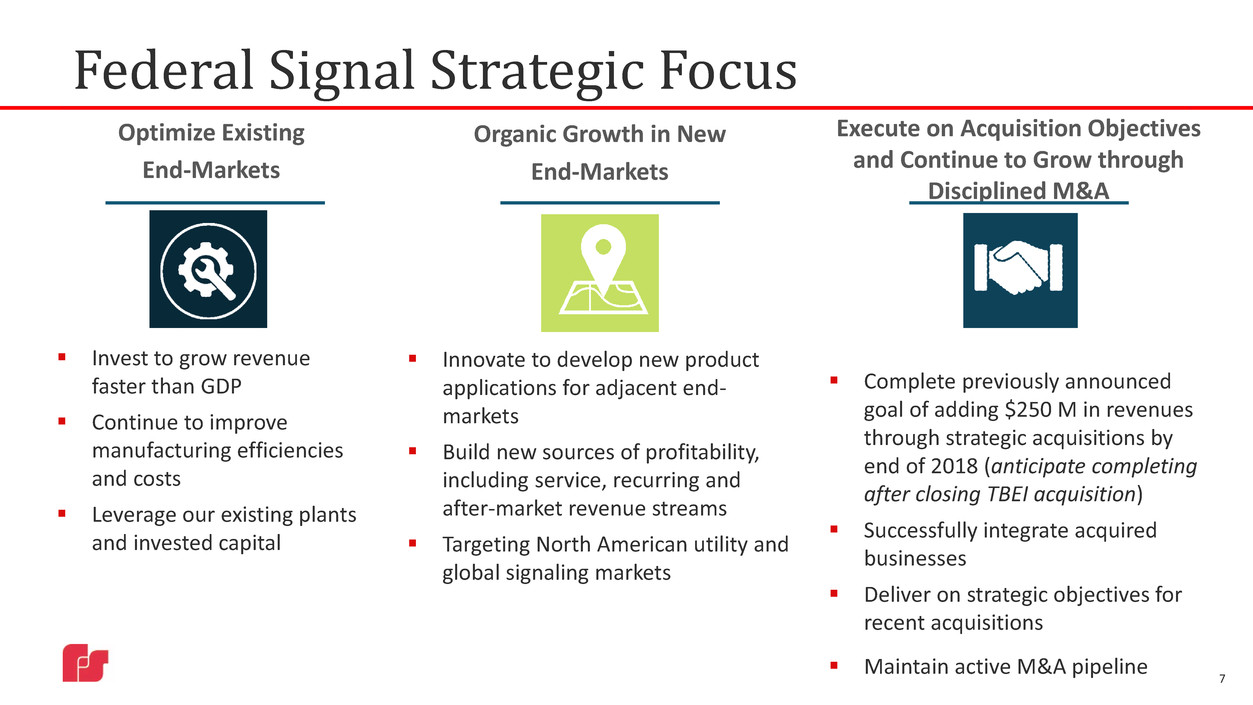
Optimize Existing
End-Markets
Invest to grow revenue
faster than GDP
Continue to improve
manufacturing efficiencies
and costs
Leverage our existing plants
and invested capital
Organic Growth in New
End-Markets
Innovate to develop new product
applications for adjacent end-
markets
Build new sources of profitability,
including service, recurring and
after-market revenue streams
Targeting North American utility and
global signaling markets
Execute on Acquisition Objectives
and Continue to Grow through
Disciplined M&A
Complete previously announced
goal of adding $250 M in revenues
through strategic acquisitions by
end of 2018 (anticipate completing
after closing TBEI acquisition)
Successfully integrate acquired
businesses
Deliver on strategic objectives for
recent acquisitions
Maintain active M&A pipeline
7

2016-2020 CAGR ≥ 9%
Our 2020 Revenue Goal
8
$1.0 B+
$708 M
Key Drivers
• Full-year impact of 2016 completed acquisitions
• In 2016, JJE generated ~$87 M of sales in ~7
months, on a standalone basis
• Modest recovery in our end markets
• GDP growth
• Strategic initiatives that drive growth above
GDP growth rates
• Additional acquisitions, including completion of
our existing $250 M revenue goal by 2018
(expected to be achieved through TBEI)
2020 Goal
TBEI acquisition is expected to accelerate our goal of profitably growing our
revenues in excess of $1.0 B
2016

Safety and Security Systems Group (SSG)
9
Serves the needs of government and industrial verticals for audible and
visual safety and security notification devices
Public Safety and Security Signaling Systems
Brands
Lights and siren products for Police, Fire and
Heavy Duty (HD) end-markets
Audible and visual
signaling devices
Municipal
Distributor
Industrial
Oil & Gas
Commercial
Heavy Industry
Manufacturing
Indirect
Outdoor Warning
Public Address General Alarming (PAGA)
Security Systems
Municipal
Oil & Gas
Commercial
Direct
Application
End Markets
and Channels
Products
* Management estimates
Addressable
Market *
$1.0 B $600 M $1.8 B
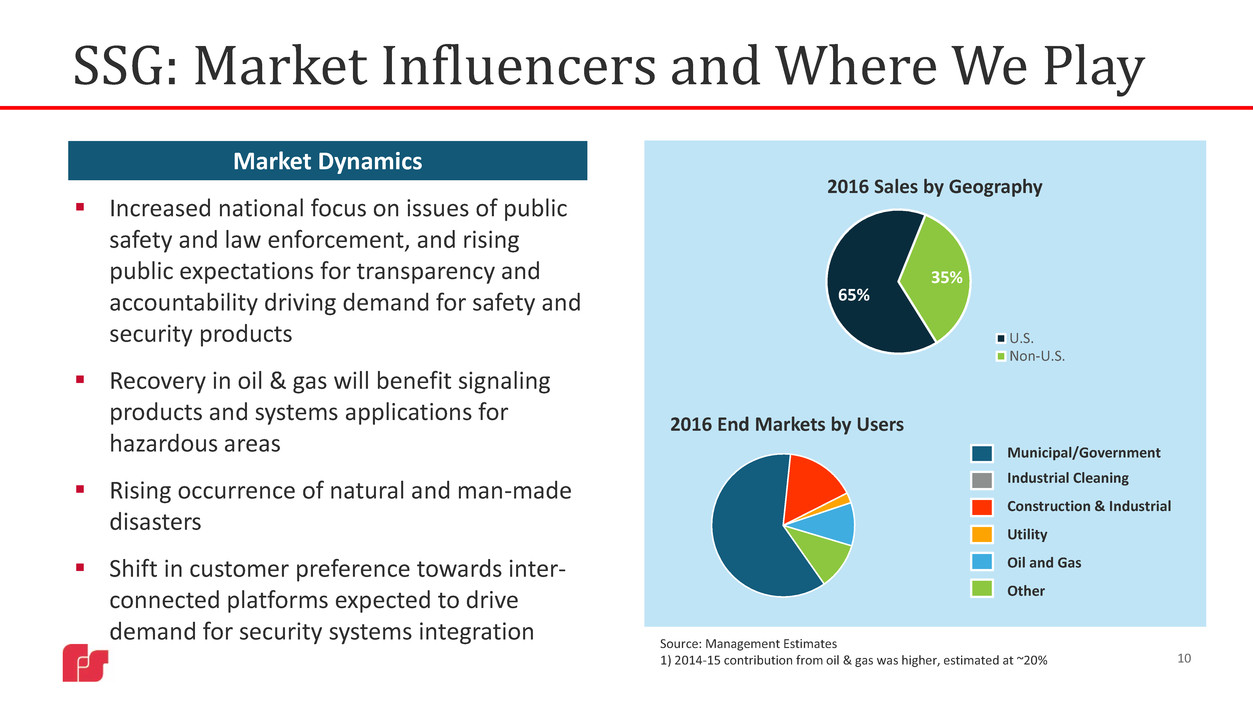
SSG: Market Influencers and Where We Play
10
65%
35%
2016 Sales by Geography
U.S.
Non-U.S.
Municipal/Government
Industrial Cleaning
Construction & Industrial
Utility
Oil and Gas
Other
2016 End Markets by Users
Increased national focus on issues of public
safety and law enforcement, and rising
public expectations for transparency and
accountability driving demand for safety and
security products
Recovery in oil & gas will benefit signaling
products and systems applications for
hazardous areas
Rising occurrence of natural and man-made
disasters
Shift in customer preference towards inter-
connected platforms expected to drive
demand for security systems integration
Market Dynamics
Source: Management Estimates
1) 2014-15 contribution from oil & gas was higher, estimated at ~20%

SSG Strategic Initiatives
11
Defend and expand leading market
share positions in police, signaling
and outdoor warning markets
New products and portfolio
optimization
Grow into heavy duty and fire
adjacencies
“Go to Market” initiatives
Capture higher share of municipal
spending by police departments
Selective expansion into upfitting
Body worn video solutions
Grow security business through
sequential regional roll-out
Chicago focus with subsequent
expansion into select major cities
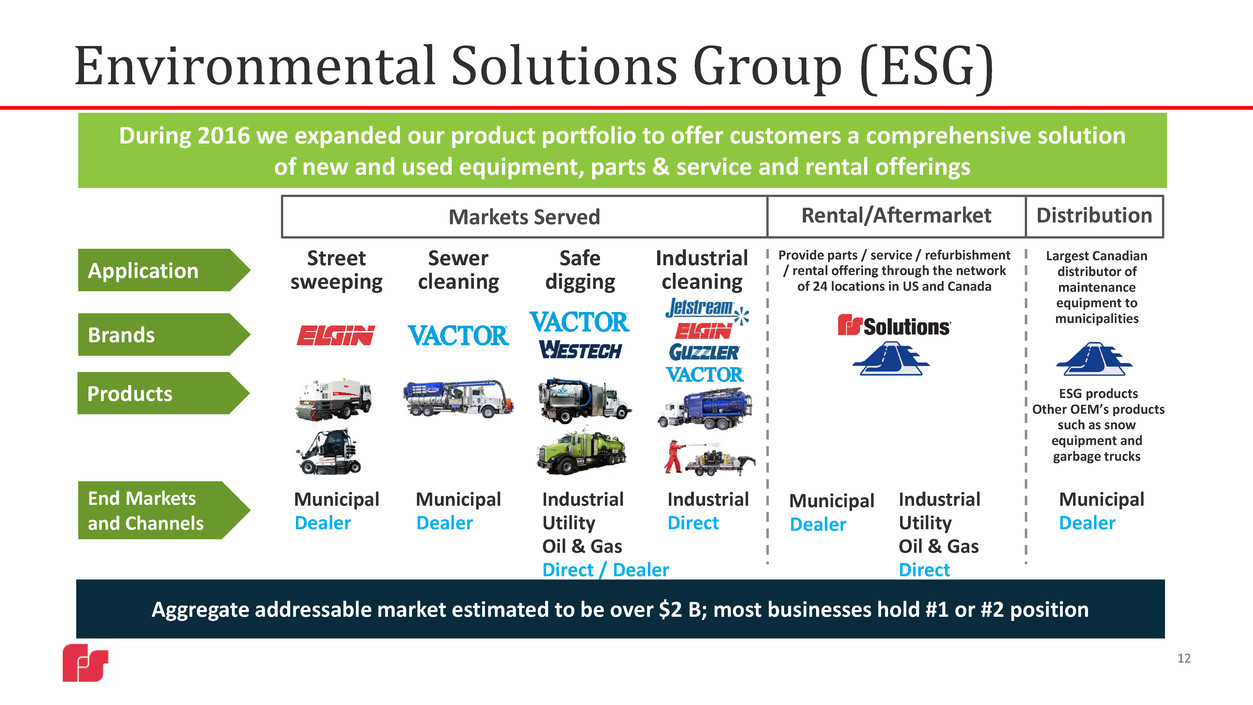
Environmental Solutions Group (ESG)
12
During 2016 we expanded our product portfolio to offer customers a comprehensive solution
of new and used equipment, parts & service and rental offerings
Markets Served Rental/Aftermarket Distribution
Brands
End Markets
and Channels
Aggregate addressable market estimated to be over $2 B; most businesses hold #1 or #2 position
Street
sweeping
Municipal
Dealer
Sewer
cleaning
Municipal
Dealer
Safe
digging
Industrial
Utility
Oil & Gas
Direct / Dealer
Industrial
cleaning
Industrial
Direct
Municipal
Dealer
Application
Municipal
Dealer
Industrial
Utility
Oil & Gas
Direct
Products
Provide parts / service / refurbishment
/ rental offering through the network
of 24 locations in US and Canada
Largest Canadian
distributor of
maintenance
equipment to
municipalities
ESG products
Other OEM’s products
such as snow
equipment and
garbage trucks

ESG Strategic Initiatives
13
Maintain or achieve leading market
position in all product categories for
North American governmental market
Refocus on dealer development
Renewed focus on product development
Increase equipment sales in North
American non-governmental markets
Utility market initiative
Geographic expansion in Canada
Further diversification of end markets
Become a provider of choice for all
customer needs
New rental offering
Used equipment
Parts and service

14
Latest Significant Development: Agreement to Acquire Truck Bodies
and Equipment International (“TBEI”)
Strong strategic fit with ESG businesses and broadens focus on maintenance and
infrastructure markets
Diversifies into non-oil and gas, higher growth end-markets, while balancing municipal
vs. industrial exposure
Provides strong platform to drive future growth, organically and through M&A
Strong cash flows with low capital requirements
Immediately accretive to margins and EPS1
Expands Federal Signal’s operational expertise and depth of talent through the addition
of an experienced management team
Strategic acquisition of TBEI, a leading U.S. based manufacturer of dump
truck bodies and trailers
1) Accretion includes estimated non-cash amortization of acquired intangible assets, but excludes transaction costs and identified synergies

Deal Size and Implied
Valuation
Purchase Price of US$ 270M, subject to customary closing adjustments
7.2x multiple of FY 2016 EBITDA, before synergies
Financial Impact
The transaction is expected to be accretive to earnings in 2017
Expected to be $0.07-0.12 accretive by year 2 and $0.12-0.17 accretive by
year 3
Annual synergies of $3-4M million by year 3
Financing
Fully committed financing in place from existing bank group
Efficient use of Federal Signal’s strong balance sheet
Proforma Leverage estimated at ~2.7x
Closing Timeline
Expect to close within 90 days
Transaction is subject to closing conditions, including regulatory approvals
Transaction Summary
Transaction expected to close within 90 days and is subject to closing
adjustments and regulatory approvals
15

16
Establishing a Maintenance and Infrastructure Vehicle Systems Platform
TBEI expands ESG’s specialty vehicle expertise and is expected to become part of a platform serving maintenance
and infrastructure markets, providing customers with a comprehensive suite of products and services
ESG
Rental/Aftermarket Distribution
Brands
End Markets and
Channels
Street
sweeping
Municipal
Dealer
Sewer
cleaning
Municipal
Dealer
Safe
digging
Industrial
Utility
Oil & Gas
Dealer / Direct
Industrial
cleaning
Industrial
Direct
Application
Products
Provide parts / service / refurbishment / rental
offering through the network of 20+ locations in US
and Canada
Largest Canadian
distributor of
maintenance equipment
to municipalities
For ESG products and
other OEM’s products
such as snow equipment
and garbage trucks
Materials Hauling
Dump Bodies & Trailers
Dealer Network
Municipal, Construction, Industrial,
Landscaping, Waste / Rendering
Dealer / Direct
Addressable
Market ~$2B ~$1.6B
Routes to Market
US Dealer
Network
Dealers and Distributors
Established TBEI network of 600+
dealers / distribution partnerships
across the U.S.
TBEI
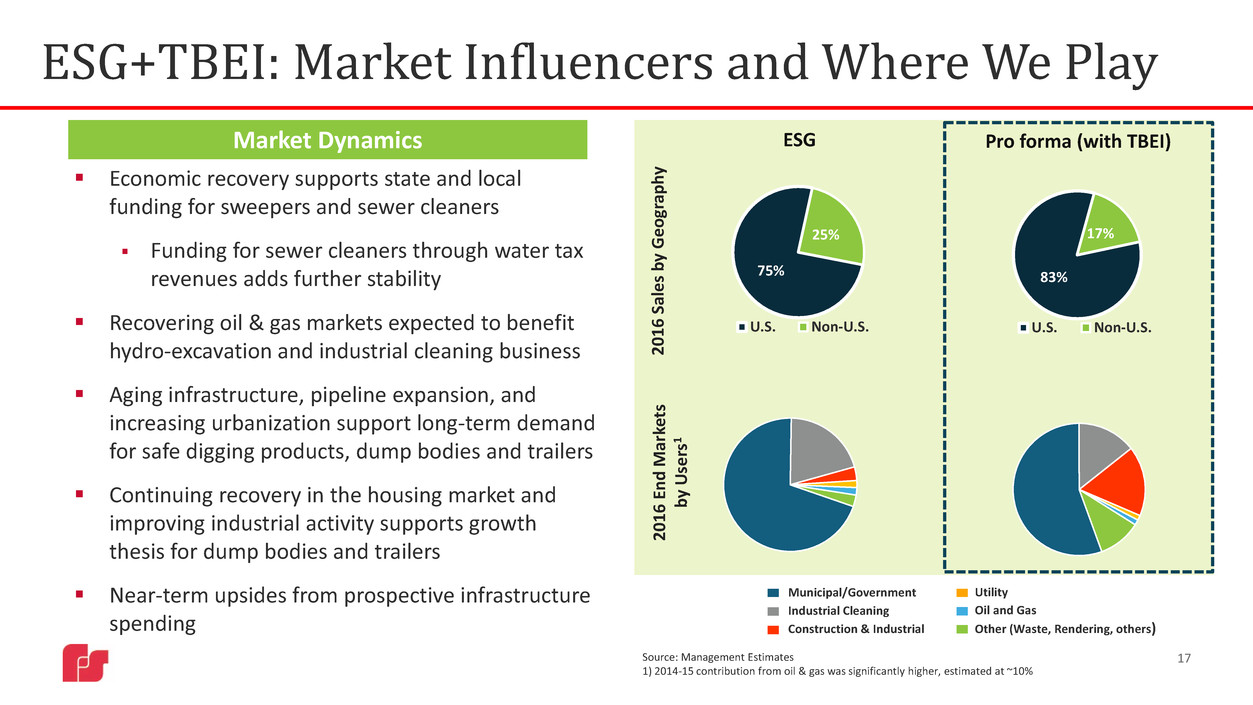
ESG+TBEI: Market Influencers and Where We Play
17
Municipal/Government
Industrial Cleaning
Construction & Industrial
20
16
E
nd
M
ar
ke
ts
by
U
se
rs
1
75%
25%
U.S. Non-U.S.
Economic recovery supports state and local
funding for sweepers and sewer cleaners
Funding for sewer cleaners through water tax
revenues adds further stability
Recovering oil & gas markets expected to benefit
hydro-excavation and industrial cleaning business
Aging infrastructure, pipeline expansion, and
increasing urbanization support long-term demand
for safe digging products, dump bodies and trailers
Continuing recovery in the housing market and
improving industrial activity supports growth
thesis for dump bodies and trailers
Near-term upsides from prospective infrastructure
spending
Market Dynamics
Source: Management Estimates
1) 2014-15 contribution from oil & gas was significantly higher, estimated at ~10%
20
16
S
al
es
b
y
G
eo
gr
ap
hy
83%
17%
U.S. Non-U.S.
Pro forma (with TBEI)
Utility
Oil and Gas
Other (Waste, Rendering, others)
ESG

Balance Sheet and Liquidity Remain Strong
18
Debt Levels
5.9x
2.9x
1.3x
0.5x 0.4x
0.8x
2.7x
0.0x
1.0x
2.0x
3.0x
4.0x
5.0x
6.0x
7.0x
2011 2012 2013 2014 2015 2016 Pro
Forma*
To
ta
l D
eb
t
/
A
dj
us
te
d
EB
IT
D
A
*At TBEI acquisition closing
TBEI acquisition will be financed with cash
on hand and borrowings available under our
existing credit facility
Although increasing our leverage in the
short-term, we expect that the healthy cash
flows generated by combining our existing
businesses with TBEI will facilitate rapid debt
reduction, while maintaining strong liquidity
and continued investment in our businesses
While we are committed to de-levering
quickly, our long-term capital allocation
strategy remains unchanged
Financing and Liquidity

Priority Driven Long-Term Capital Allocation
19
Organic projects leverage existing assets, generally require limited cash
investment
Innovation R&D efforts target new and updated products
Generally, already funded within operating results, cash flow and normal capital
expenditures
Reinvest in the
Business
Opportunistic share buybacks as a return of cash to our shareholders
Spent $37.8 M in 2016 (average price of $12.75/share) vs. $10.6 M in 2015
Remaining repurchase authorization is $31 M
Share
Repurchase
Dividend Policy
Provide a competitive dividend yield while funding business growth
At $0.07 per share, dividend yield is ~2%
Paid dividends of $16.9 M in 2016 compared to $15.6 M in 2015
Acquisitions
Recently announced acquisition of TBEI for $270 M
TBEI acquisition is expected to accelerate our goal of profitably growing our
revenues in excess of $1 B by 2020
Focused primarily on acquisitions that fit closely within our existing products
and services, manufacturing competencies, channels and customers
Capex
12%
Acquisitions
45%
Dividends
17%
Share
Repurchase
26%
Cash Deployment
(2014-16)1
1) Chart depicts use of cash for each category, relative
to the total cash used on all four activities, for the
cumulative period 2014-16; excludes investment in
rental fleet, which are reported as part of operating
cash flows

Q1 2017: In Review
Q1 2017 Highlights:
Significant increases in orders, both sequentially and
compared to Q1 2016.
• $79 M, or 58%, year-over-year order growth, largely
driven by organic order growth within ESG and effects
from the 2016 JJE acquisition
• $49 M, or 30%, sequential order improvement (vs. Q4
2016)
• Q1 2017 orders were the highest reported orders in any
quarter in over a decade
Municipal markets remained steady, overall
Some initial signs of encouragement from industrial markets
Progress made to diversify end markets by expanding into
new markets, such as utility
20
Historical Adjusted EBITDA Margins
(Consolidated)
Revenue
474 537 534 491 503
239 243 234 217 210
713 779 768 708 713
2013 2014 2015 2016 TTM
3/31/17
$
in
m
ill
io
ns
ESG SSG
10.3%
12.9%
15.1%
11.8% 11.4%
2013 2014 2015 2016 TTM
3/31/17
A
dj
us
te
d
EB
IT
D
A
M
ar
gi
n
%
Orders
470 555 449 474 558
236
252
237 200
195
706
807
686 674
753
2013 2014 2015 2016 TTM
3/31/17
in
m
ill
io
ns
ESG SSG

2017 Outlook*
21
+ Stable municipal demand
+ Improving recent order patterns and sales funnels
+ Full year of Paradigm sales into utility and construction
end-markets
+ Full year impact from 2016 acquisitions
Adjustments to include items related to acquisitions
Depreciation to increase by ~$8 M to $10 M
Reflects full year of JJE and depreciation of rental fleet
Nominal increases in capital expenditures vs. 2016 (excluding
investment in rental fleet)
Adjusted EPS ranging from $0.70 to $0.78
– Weak oil & gas demand, which impacts our hydro-
excavation products and signaling business
– Continued strength of US dollar benefiting foreign
competitors and reducing value of overseas earnings
– Entered 2017 with reduced backlog carrying lower gross
margin
Key Assumptions
Tailwinds Headwinds
Additional SEG&A expenses, including R&D, in support of long-
term strategic initiatives. Net reduction of ~$0.02 to $0.03
reflected in 2017 Adjusted EPS outlook
Interest expense reflects no significant change in current debt
levels
Income tax rate of 34-35%
*Not reflecting TBEI acquisition impact
Positioned for Long-Term Growth
Two platforms poised for profitable growth
Attractive mix of municipal and industrial end markets
Revitalized new product development initiative
Active M&A pipeline
Strong balance sheet and cash flow
• Profitably grow revenue in excess of $1.0 B by 2020 – timing expected to be accelerated with TBEI
acquisition
• Focus on organic growth
• Deliver on strategic initiatives
• Maintain active M&A pipeline
22
2017 and Beyond

Appendix
23
I. New Product Development
II. M&A Target Evaluation
III. Company Products
IV. Total Debt to Adjusted EBITDA
V. Adjusted EBITDA Margins
VI. Investor Information
Appendix I: New Product Development
24
Kicked off innovation refocus in late 2013
Re-allocated engineering resources toward innovation
Implemented innovation development processes and project management –
several projects underway that have originated from
customer & market-based needs assessment
Created first ESG Innovation Project Team in 2014
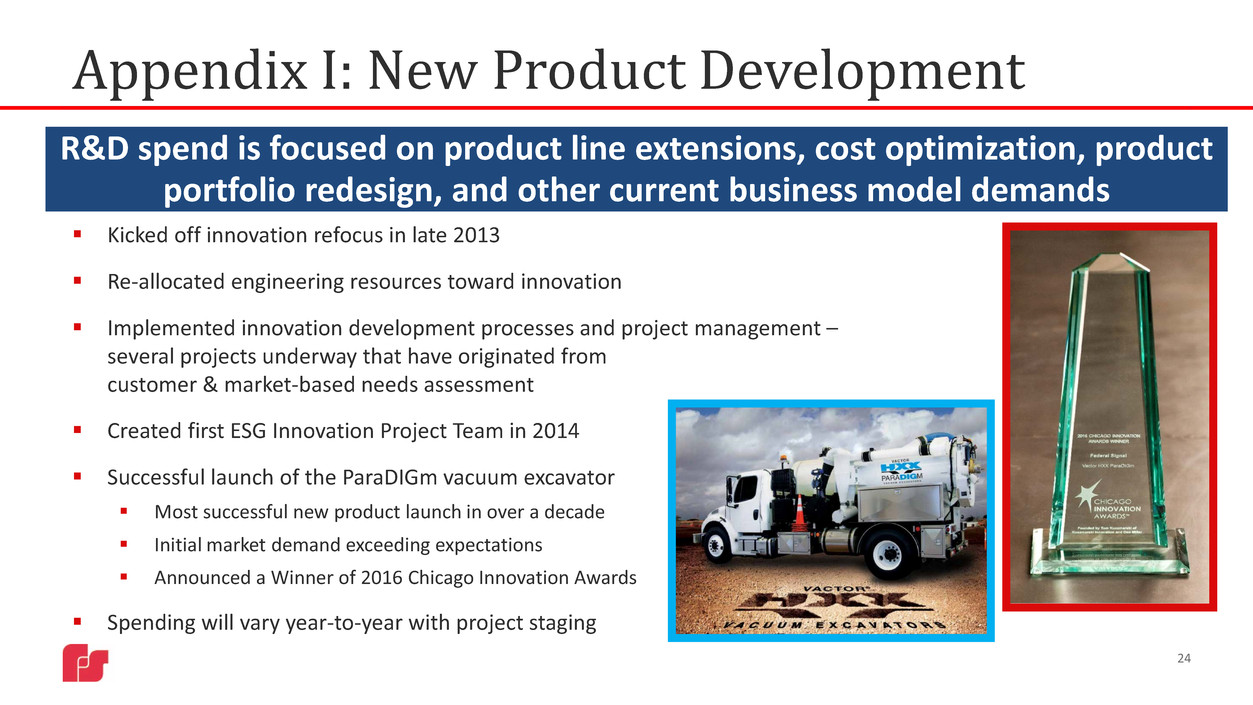
Successful launch of the ParaDIGm vacuum excavator
Most successful new product launch in over a decade
Initial market demand exceeding expectations
Announced a Winner of 2016 Chicago Innovation Awards
Spending will vary year-to-year with project staging
R&D spend is focused on product line extensions, cost optimization, product
portfolio redesign, and other current business model demands

Appendix I: New Product Development
Environmental Solutions Group
(ESG)
Safety and Security Systems Group
(SSG)New Markets
Optimize
Existing
Markets
• Vactor ParaDIGm
• Water recycler
• Vehicle-based monitoring and
reporting solutions
• Trailer-mounted jetter
• Improved air sweeper offerings
• Global Series signaling devices
• Body-worn video solutions
• Smart warning systems capitalizing on
IoT technologies
• Re-architected signaling products to
enhance production and performance
25
• Westech Wolf vacuum truck
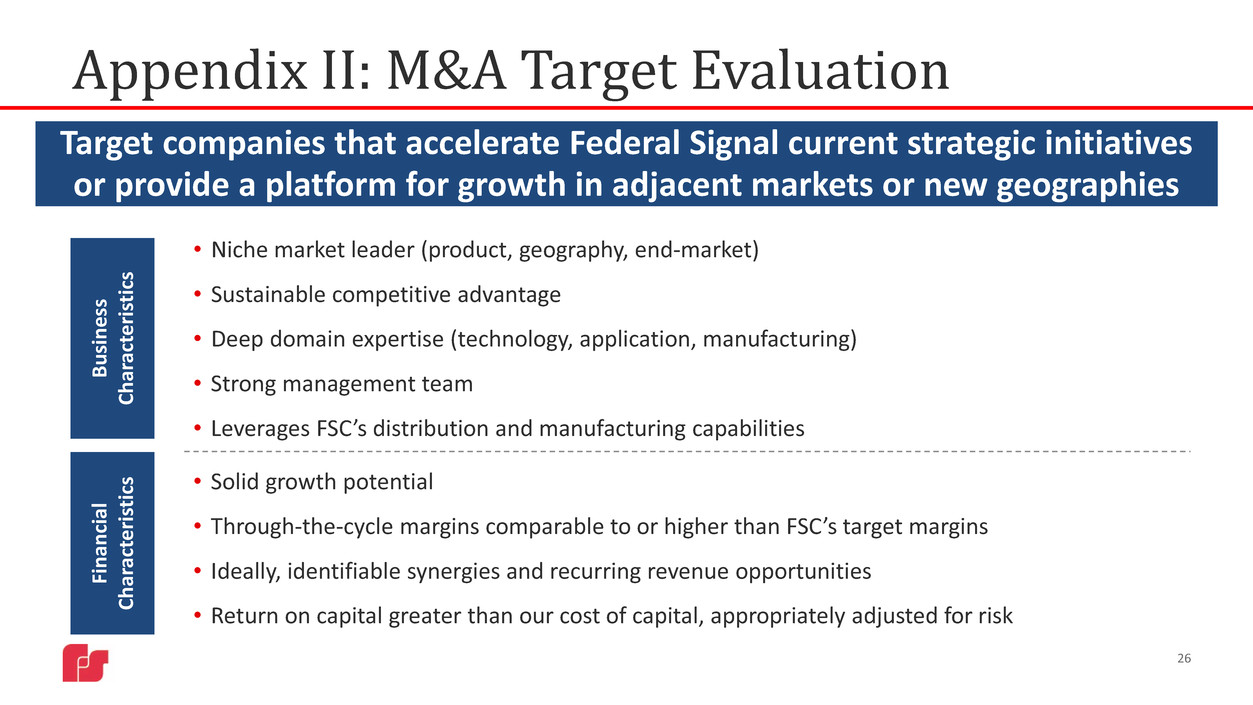
• Niche market leader (product, geography, end-market)
• Sustainable competitive advantage
• Deep domain expertise (technology, application, manufacturing)
• Strong management team
• Leverages FSC’s distribution and manufacturing capabilities
• Solid growth potential
• Through-the-cycle margins comparable to or higher than FSC’s target margins
• Ideally, identifiable synergies and recurring revenue opportunities
• Return on capital greater than our cost of capital, appropriately adjusted for risk
Appendix II: M&A Target Evaluation
B
us
in
es
s
Ch
ar
ac
te
ri
st
ic
s
Fi
na
nc
ia
l
Ch
ar
ac
te
ri
st
ic
s
26
Target companies that accelerate Federal Signal current strategic initiatives
or provide a platform for growth in adjacent markets or new geographies

Appendix III: Environmental Solutions Group
27

28
Key Competitive Strengths
Strong regional brands with leadership positions in distinct
product categories
Operational excellence through unwavering focus on Variable
Cost Productivity philosophy and best-in-class cycle times
Strong distribution network – over 600 dealers & distributors
complemented by direct-to-customer model for bigger fleets
Scale benefits in a highly fragmented market help establish
cost leadership
Appendix III: TBEI
With 5 manufacturing locations in the U.S., nationwide warehousing capacity, and strategic partnerships, TBEI is
strongly positioned to serve the US market and grow its leading market share position
Products
Class 6 – 8
Standard Dump
Bodies
Class 6 – 8 Custom
Dump Bodies
Dump & Transfer
Trailers
Class 3 – 5
Standard Dump
Bodies & Hoists
Class 3 – 8 Custom
Dump Bodies &
Hoists
Class 3 – 8 Custom
Dump Bodies &
Hoists
OxBodies
J-Craft
Rugby Manufacturing
DuraClass
Crysteel
Travis Trailers
Construction /
Aggregates
50%
Landscaping
15%
Agriculture
6%
Municipal
21%
Other
8%
Estimated Sales by End-Market
Primarily
industrial
markets

Appendix III: Public Safety and Security (SSG)
29

Appendix III: Signaling and Systems (SSG)
30
Enterprise Integrated Command Solution
Sensors/Detectors
Control Modules/Nodes
Public Address
Cameras
Intercoms
Visual Signals
Telephony
Audible Devices Outdoor Warning
Sensors/Detectors
SmartMsg
Enabled Systems
Control Modules/Nodes
Control Modules/Nodes
Networked PAGASYS Rack

The Company uses the ratio of total debt to adjusted EBITDA as one measure of its long-term financial stability. The ratio of debt to adjusted EBITDA is a non-GAAP measure that represents total debt divided by the trailing 12-month
total of income from continuing operations before interest expense, debt settlement charges, acquisition and integration-related expenses, restructuring charges, purchase accounting effects, other (income) expense, income tax
expense, and depreciation and amortization expense. The Company uses the ratio to calibrate the magnitude of its debt and its debt capacity against adjusted EBITDA, which is used as an operating performance measure. We believe that
investors use a version of this ratio in a similar manner. In addition, financial institutions (including the Company’s lenders) use the ratio in connection with debt agreements to set pricing and covenant limitations. For these reasons, the
Company believes that the ratio is a meaningful metric to investors in evaluating the Company’s long-term financial performance and stability. Other companies may use different methods to calculate total debt to EBITDA. The
following table summarizes the Company’s ratio of total debt to adjusted EBITDA, and reconciles income from continuing operations to adjusted EBITDA as of and for the trailing twelve month periods ended:
($ in millions) 2011 2012 2013 2014 2015 2016
Total Debt 217.4$ 157.8$ 92.1$ 50.2$ 44.1$ 64.0$
Income from continuing operations 8.1 15.5 152.5 59.7 65.8 39.4
Add:
Interest expense 16.2 21.3 8.9 3.6 2.3 1.9
Debt settlement charges - 3.5 8.7 - - 0.3
Acquisition and integration-related expenses - - - - - 1.4
Restructuring - 1.4 0.7 - 0.4 1.7
Purchase accounting effects - - - - - 3.9
Other (income) expense, net - 0.9 0.1 1.7 1.0 (1.3)
Income tax expense 2.0 1.4 (108.6) 23.7 34.1 17.4
Depreciation and amortization 10.5 10.6 11.0 11.5 12.3 19.1
Adjusted EBITDA 36.8$ 54.6$ 73.3$ 100.2$ 115.9$ 83.8$
Total debt to adjusted EBITDA ratio 5.9 2.9 1.3 0.5 0.4 0.8
Appendix IV: Total Debt to Adjusted EBITDA
31

The Company uses adjusted EBITDA and the ratio of adjusted EBITDA to net sales (“adjusted EBITDA margin”), at both the consolidated and segment level, as additional measures which are representative of its underlying performance
and to improve the comparability of results across reporting periods. We believe that investors use versions of these metrics in a similar manner. For these reasons, the Company believes that adjusted EBITDA and adjusted EBITDA
margin, at both the consolidated and segment level, are meaningful metrics to investors in evaluating the Company’s underlying financial performance. Consolidated adjusted EBITDA is a non-GAAP measure that represents the total of
income from continuing operations, interest expense, debt settlement charges, acquisition and integration-related expenses, restructuring activity, executive severance costs, purchase accounting effects, other income/expense, income
tax expense, and depreciation and amortization expense. Consolidated adjusted EBITDA margin is a non-GAAP measure that represents the total of income from continuing operations, interest expense, debt settlement charges,
acquisition and integration-related expenses, restructuring activity, executive severance costs, purchase accounting effects, other income/expense, income tax expense, and depreciation and amortization expense divided by net sales for
the applicable period(s). The following table summarizes the Company’s consolidated adjusted EBITDA and adjusted EBITDA margin and reconciles the income from continuing operations to consolidated adjusted EBITDA for the trailing
twelve month periods ended:
Appendix V: Adjusted EBITDA Margins
32
($ in millions) 2013 2014 2015 2016
TTM
3/31/17
Total Sales, as reported 712.9$ 779.1$ 768.0$ 707.9$ 712.9$
Income from continuing operations 152.5 59.7 65.8 39.4 36.2
Add:
Interest expense 8.9 3.6 2.3 1.9 2.1
Debt settlement charges 8.7 - - 0.3 -
Acquisition and integration-related expenses - - - 1.4 1.4
Restructuring 0.7 - 0.4 1.7 0.8
Executive Severance Costs - - - - 0.7
Purchase accounting effects - - - 3.9 4.4
Other (income) expense, net 0.1 1.7 1.0 (1.3) (0.9)
Income tax expense (108.6) 23.7 34.1 17.4 15.5
Depreciation and amortization 11.0 11.5 12.3 19.1 21.4
Adjusted EBITDA 73.3$ 100.2$ 115.9$ 83.8$ 81.6$
Adjusted EBITDA Margin 10.3% 12.9% 15.1% 11.8% 11.4%

33
Appendix VI: Investor Information
Stock Ticker - NYSE:FSS
Company website: federalsignal.com/investors
HEADQUARTERS
1415 West 22nd Street, Suite 1100
Oak Brook, IL 60523
INVESTOR RELATIONS CONTACTS
630-954-2000
Ian Hudson
VP, Interim Chief Financial Officer
IHudson@federalsignal.com
Svetlana Vinokur
VP, Treasurer and Corporate Development
SVinokur@federalsignal.com

