Attached files
| file | filename |
|---|---|
| 8-K - 8-K - CITIZENS FINANCIAL GROUP INC/RI | d514461d8k.htm |
 Deutsche Bank Global Financial Services Conference May 31, 2017 Brad Conner Vice Chairman, Head of Consumer Banking Exhibit 99.1 |
 Forward-looking statements and use of key performance metrics and Non-GAAP financial measures
2 This document contains forward-looking statements within the Private Securities Litigation Reform Act of 1995. Any statement that does not describe historical or current facts is a forward-looking statement. These statements often include the words “believes,” “expects,” “anticipates,” “estimates,” “intends,” “plans,” “goals,” “targets,” “initiatives,” “potentially,” “probably,” “projects,” “outlook” or similar expressions or future conditional verbs such as “may,” “will,” “should,” “would,” and “could.” Forward-looking statements are based upon the current beliefs and expectations of management, and on information currently available to management. Our statements speak as of the date hereof, and we do not assume any obligation to update these statements or to update the reasons why actual results could differ from those contained in such statements in light of new information or future events. We caution you, therefore, against relying on any of these forward-looking statements. They are neither statements of historical fact nor guarantees or assurances of future performance. While there is no assurance that any list of risks and uncertainties or risk factors is complete, important factors that could cause actual results to differ materially from those in the forward-looking statements include the following, without limitation: negative economic conditions that adversely affect the general economy, housing prices, the job market, consumer confidence and spending habits which may affect, among other things, the level of nonperforming assets, charge-offs and provision expense; the rate of growth in the economy and employment levels, as well as general business and economic conditions; our ability to implement our strategic plan, including the cost savings and efficiency components, and achieve our indicative performance targets; our ability to remedy regulatory deficiencies and meet supervisory requirements and expectations; liabilities and business restrictions resulting from litigation and regulatory investigations; our capital and liquidity requirements (including under regulatory capital standards, such as the Basel III capital standards) and our ability to generate capital internally or raise capital on favorable terms; the effect of the current low interest rate environment or changes in interest rates on our net interest income, net interest margin and our mortgage originations, mortgage servicing rights and mortgages held for sale; changes in interest rates and market liquidity, as well as the magnitude of such changes, which may reduce interest margins, impact funding sources and affect the ability to originate and distribute financial products in the primary and secondary markets; the effect of changes in the level of checking or savings account deposits on our funding costs and net interest margin; financial services reform and other current, pending or future legislation or regulation that could have a negative effect on our revenue and businesses, including the Dodd-Frank Act and other legislation and regulation relating to bank products and services; a failure in or breach of our operational or security systems or infrastructure, or those of our third party vendors or other service providers, including as a result of cyber attacks; and management’s ability to identify and manage these and other risks. In addition to the above factors, we also caution that the amount and timing of any future common stock dividends or share repurchases will depend on our financial condition, earnings, cash needs, regulatory constraints, capital requirements (including requirements of our subsidiaries), and any other factors that our board of directors deems relevant in making such a determination. Therefore, there can be no assurance that we will pay any dividends to holders of our common stock, or as to the amount of any such dividends. More information about factors that could cause actual results to differ materially from those described in the forward-looking statements can be found under “Risk Factors” in Part I, Item 1A in our Annual Report on Form 10-K for the year ended December 31, 2016, filed with the United States Securities and Exchange Commission on February 24, 2017. Key Performance Metrics and Non-GAAP Financial Measures and Reconciliations Key Performance Metrics: Our management team uses key performance metrics (KPMs) to gauge our performance and progress over time in achieving our strategic and operational goals and also in comparing our performance against our peers. We have established the following financial targets, in addition to others, as KPMs, which are utilized by our management in measuring our progress against financial goals and as a tool in helping assess performance for compensation purposes. These KPMs can largely be found in our periodic reports which are filed with the Securities and Exchange Commission, and are supplemented from time to time with additional information in connection with our quarterly earnings releases. Our key performance metrics include: Return on average tangible common equity (ROTCE); Return on average total tangible assets (ROTA); Efficiency ratio; Operating leverage; and Common equity tier 1 capital ratio (Basel III fully phased-in basis). In establishing goals for these KPMs, we determined that they would be measured on a management-reporting basis, or an operating basis, which we refer to externally as “Adjusted” or “Underlying” results. We believe that these “Adjusted” or “Underlying” results provide the best representation of our financial progress towards these goals as they exclude items that our management does not consider indicative of our on-going financial performance. KPMs that contain “Adjusted” or “Underlying” results are considered non-GAAP financial measures. Non-GAAP Financial Measures: This document contains non-GAAP financial measures. The tables in the appendix present reconciliations of our non-GAAP measures. These reconciliations exclude “Adjusted” or “Underlying” items, which are included, where applicable, in the financial results presented in accordance with GAAP. “Adjusted” or “Underlying” results, which are non-GAAP measures, exclude certain items as applicable, that may occur in a reporting period which management does not consider indicative of on-going financial performance. The non-GAAP measures presented in the following tables include reconciliations to the most directly comparable GAAP measures and are: “noninterest income”, “total revenue”, “ noninterest expense”, “pre-provision profit”, “income before income tax expense”, “income tax expense”, “effective income tax rate”, “net income”, “net income available to common stockholders”, “other income”, “salaries and employee benefits”, “outside services”, “amortization of software expense”, “other operating expense”, “net income per average common share”, “return on average common equity” and “return on average total assets”. We believe these non-GAAP measures provide useful information to investors because these are among the measures used by our management team to evaluate our operating performance and make day-to-day operating decisions. In addition, we believe our “Adjusted” or “Underlying” results in any period reflect our operational performance in that period and, accordingly, it is useful to consider our GAAP results and our “Adjusted” or “Underlying” results together. We believe this presentation also increases comparability of period-to-period results. Other companies may use similarly titled non-GAAP financial measures that are calculated differently from the way we calculate such measures. Accordingly, our non-GAAP financial measures may not be comparable to similar measures used by other companies. We caution investors not to place undue reliance on such non-GAAP measures, but instead to consider them with the most directly comparable GAAP measure. Non-GAAP financial measures have limitations as analytical tools, and should not be considered in isolation, or as a substitute for our results as reported under GAAP. |
 Dimension (1) Rank (2) Assets: $150.3 billion #12 Loans: $108.1 billion (4) #11 Deposits: $112.1 billion #12 nationally; Top 5 rank in 9/10 markets (3) Branches: ~1,200 #11 ATM network: ~3,200 #7 Mortgage: $15.4 billion #13 nationally (5) Education: $7.2 billion Top 4 rank nationally (6) HELOC: $14.0 billion Top 5 rank: 9/9 markets (7) Middle market lead/ joint lead bookrunner #5 (8) Leading deposit market share of 12.0% in top 10 MSAs (3) – #2 deposit market share in New England Relatively diverse economies/affluent demographics Serve 5 million+ individuals, institutions and companies ~17,500 colleagues Retail presence in 11 states Solid franchise with leading positions in attractive markets Source: SNL Financial. Data as of 12/31/2016, unless otherwise noted.
1) CFG data as of March 31, 2017. 2) Ranking based on 03/31/2017 data, unless otherwise noted; excludes non-retail depository institutions, includes U.S.
subsidiaries of foreign banks. 3)
Source: FDIC, June 2016. Excludes “non-retail banks” as
defined by SNL Financial. The scope of “non-retail banks” is subject to the discretion of SNL Financial, but typically includes: industrial bank and non-depository trust charters, institutions with more than 20% brokered deposits (of total deposits), institutions with more than 20% credit card loans (of total loans), institutions deemed not to broadly participate in the banking services market and other non-retail
competitor banks. 4)
Excludes held for sale.
5) Inside Mortgage Finance Publications, Inc. Copyright © 2017. Bank-only origination rank.
6) CFG estimate, based on published company reports, where available; private student loan origination data as of 12/31/2016.
7)
According to Equifax; origination volume as of 4Q16.
8) Thomson Reuters LPC, Loan syndications 4Q16 ranking based on number of deals for Overall Middle Market (defined as Borrower
Revenues < $500MM and Deal Size < $500MM). Buffalo,
NY: #5 Albany, NY: #3
Pittsburgh, PA: #2
Cleveland, OH: #4
Manchester, NH: #1
Boston, MA: #2
Rochester, NY: #5
Philadelphia, PA: #5
Detroit, MI: #8
Providence, RI: #1
3 Top 5 deposit market share in 9 of 10 largest MSAs (3) |
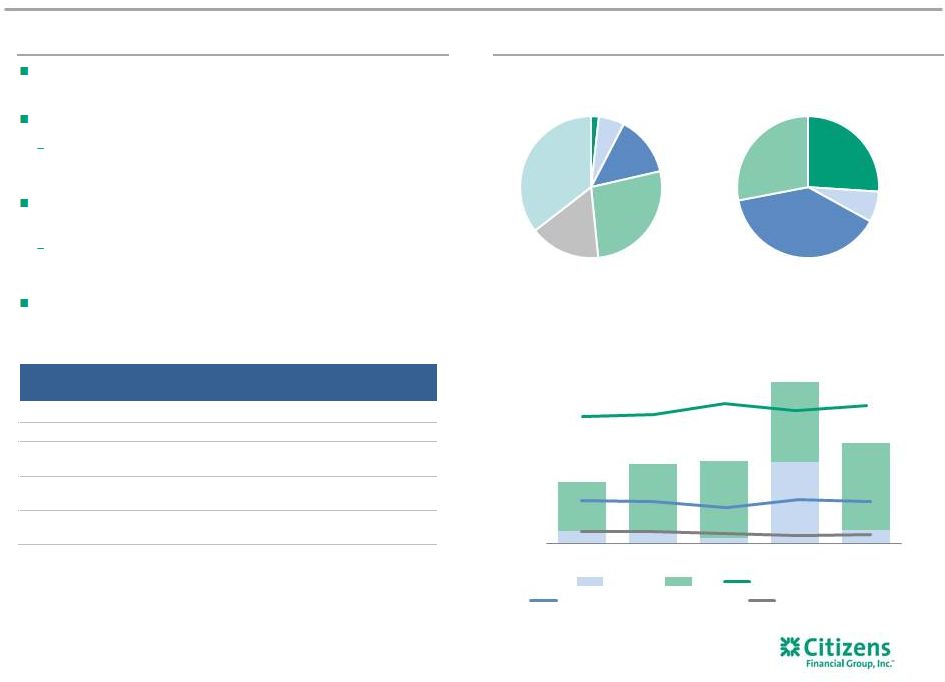
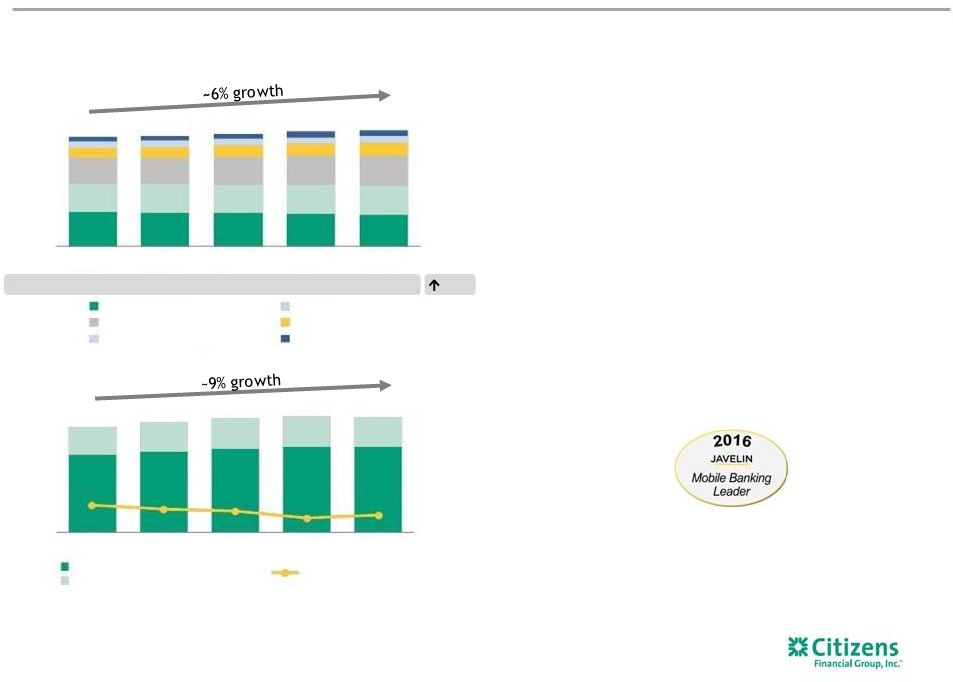 Consumer Banking $s in billions Driving revenue improvement Robust loan growth Results reflect strong loan growth, improving yields, and investment in talent,
infrastructure, product and advisory capabilities
$s in millions
Note: Loan and deposit balances represent average balances.
1) Please see important information on Key Performance Metrics and Non-GAAP Financial Measures at the beginning and end of this
presentation for an explanation of our use of these metrics
and non-GAAP financial measures and their reconciliation to GAAP financial measures, as applicable. “Adjusted” results exclude restructuring charges, special items and/or
notable items, as applicable. “Underlying” results exclude a
$23 million benefit related to the settlement of certain state tax matters in the first quarter 2017. 2) JD Power survey results reflect 2015-2016 assessment period. 3) Greenwich survey period from October 1, 2015 to September 30, 2016.
4) JD Power survey results reflect 2015 – 2016 assessment period and derive from JD Power branch servicing assessment score.
5) Javelin Strategy & Research. (1) Recognition 4 Deposits $70.9 $71.9 $72.1 $73.1 $74.1 ~5% 78.1% 77.0% 76.5% 74.9% 75.4% Efficiency ratio $53.5 $54.0 $55.0 $56.2 $56.9 1Q16 2Q16 3Q16 4Q16 1Q17 Home equity Auto Mortgage Education Business banking Other $789 $821 $850 $866 $858 1Q16 2Q16 3Q16 4Q16 1Q17 Net interest income Noninterest income Top 5 JD Power recognition Mortgage servicing and originations (2) Top 5 Business Banking (3) 10% better than peers Customer branch experience (4) 2016 Javelin Mobile Banking Leader in App Rating category (5) |
 Continued Consumer Banking strength in 1Q17 1) Please see important information on Key Performance Metrics and Non-GAAP Financial Measures at the beginning and end of this
presentation for an explanation of our use of these metrics
and non-GAAP financial measures and their reconciliation to GAAP financial measures, as applicable. 2) Includes held for sale. 3) Operating segments are allocated capital on a risk-adjusted basis considering economic and regulatory capital requirements. We approximate that regulatory capital is equivalent to a sustainable target level for tier 1 common equity and then allocate that approximation to the segments based on economic capital. Highlights Positive operating leverage is driving strong growth in pre- provision profit —
up 22% YoY
Credit costs remain stable as
growth continues in high-credit
quality portfolios
34% YoY
growth in net income,
driving improvement in ROTCE,
efficiency ratio
(1) On track to exceed 9% target ROTCE by 4Q17 5 1Q17 change from $s in millions 1Q17 4Q16 1Q16 4Q16 1Q16 $ % $ % Net interest income 638 $ 639 $ 581 $ (1) $ — % 57 $ 10 % Noninterest income 220 227 208 (7) (3) 12 6 Total revenue 858 866 789 (8) (1) 69 9 Noninterest expense 647 649 616 (2) — 31 5 Pre-provision profit 211 217 173 (6) (3) 38 22 Provision for credit losses 64 74 63 (10) (14) 1 2 Income before income tax expense 147 143 110 4 3 37 34 Income tax expense 52 51 39 1 2 13 33 Net income 95 $ 92 $ 71 $ 3 $ 3 % 24 $ 34 % Average balances $s in billions Total loans and leases (2) 57.3 $ 56.7 $ 53.7 $ 0.6 $ 1 % 3.6 $ 7 % Total deposits 74.1 $ 73.1 $ 70.9 $ 1.0 $ 1 % 3.3 $ 5 % Credit metrics Net charge-offs % 0.46% 0.52% 0.47% (6) bps (1) bps Nonperforming loans % 0.94% 0.96% 1.06% (2) bps (12) bps Key performance metrics ROTCE (1,3) 7.1% 7.0% 5.6% 9 bps 147 bps Efficiency ratio (1) 75% 75% 78% 51 bps (267) bps |
 Consumer Banking — Delivering on a multi-year growth strategy Further enhancing branch network efficiency and effectiveness Evolving distribution to better meet changing consumer preferences and create integrated
multi-channel experience
Focus on becoming trusted advisor and developing deeper customer
relationships Utilize segmentation strategies to drive
primary household growth and attract, retain and deepen
customer relationships Enhancing Mass Affluent and Affluent
offerings Continue to optimize loan portfolio and deposit
funding Grow education refinance and personal unsecured;
expand merchant partnership financing Cost effectively
grow deposit base through improved targeting Leverage
analytics, targeting and fulfillment capabilities Improving
customer acquisition and experience Deliver continued
improvement in fee income Significant investments in Wealth
and Mortgage capabilities showing results Drive continuous
improvement mindset and efficiencies 6
1 2 3 4 5 6 |
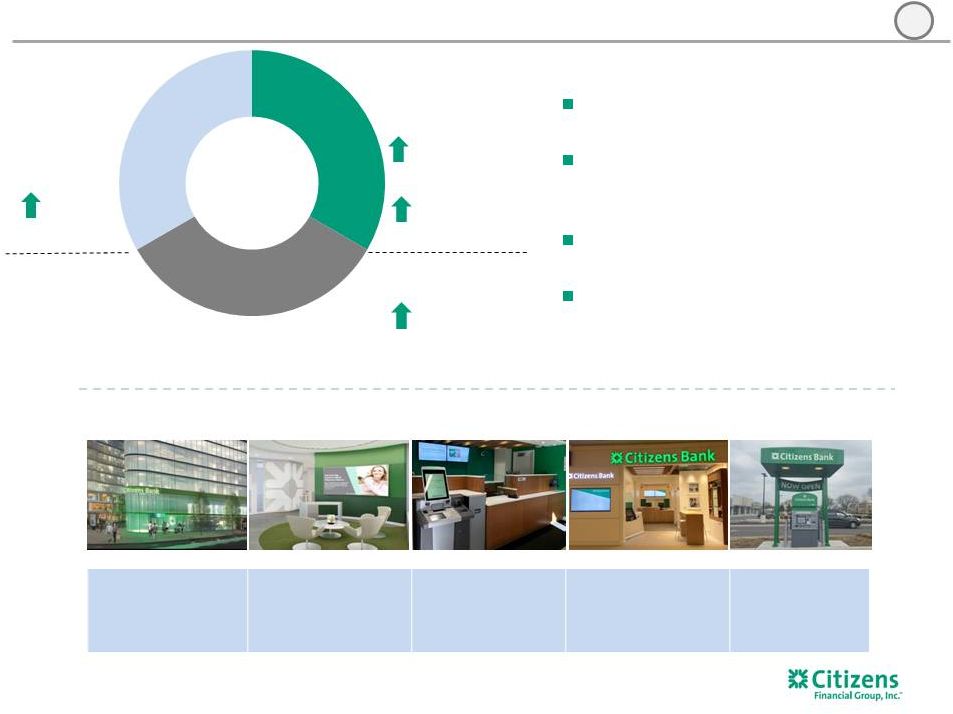 36% non-branch deposits 5% YoY Evolving our integrated distribution and advice model Objectives Focus on end-to-end customer experience Enable needs-based advice and solutions through programs such as Citizens Checkup Migrate routine interactions to lower-cost channels Streamline the physical network and reducing average branch size to ~3,600 from ~4,300 square feet (3) How we are streamlining and transforming the physical network 1) Represents enrolled online and mobile households. 2) IVR defined as interactive voice recognition technology. 3) Expected average branch size in 2021 based upon March 2017 Company estimates.
Retail Network
(Branch & ATM)
Online banking
HHs 2% YoY (1) Mobile HHs 10% YoY (1) IVR calls 3% YoY (2) Digital 7 1 Serve customers where, when & how they want Flagship Branch 2021: 3% Advice Branch 2021: 36% Everyday Banking Branch 2021: 32% In-store Branch 2021: 29% Remote ATMs 2021: 353 |
 Branch experience remains important to success 1) 2017 Temkin Experience Ratings, U.S., March 2017. 2) J.D. Power 2017 U.S. Retail Banking Satisfaction Study, April 2017. Top 5 reflects wait times and in-person best practices for
J.D. Power-surveyed footprint. 3)
UBs are Universal Bankers; LBs are Licensed Bankers; SBs are Small
Business Specialists; Mgmt./other comprises branch managers, assistant branch managers, bankers and other FTE equivalents. 4) As of 1Q17. Based on twelve-trailing month voluntary retail turnover.
External measurement highlights
consistent and significant progress
Top 10% of companies for customer
experience
across
all industries (1) Second highest in customer
experience (79%) among banks and
6.8 points above industry average (1) Most improved bank with an 18
point
increase
2017 vs. 2016 (1) Successful migration to specialist model (3) Turnover continues to trend lower with 16% reduction YoY (4) Organizational Health Index shows strong improvement 57 in 2015; 63 in 2016 Survey results show strong scores around customer alignment, doing the right thing, recommend Citizens as a place to work Internal measures also show steady progress 37 point increase in Branch
satisfaction
2017 vs. 2016 (2) Top 5 rank in key branch
categories
(2) 8 1 1Q14 1Q17 % change Tellers ~2,600 ~1,400 ~-46% UBs ~2,100 ~2,500 ~+19% LBs ~160 ~500 ~+213% SBs ~350 nm Mgmt./ other ~2,900 ~1,600 ~-45% Total ~7,760 ~6,350 ~-18% |

Small Business Maintain steady growth and accelerate shift to digital: Differentiate customer experience through branch, online & mobile channels Provide appropriate suite of products and services Accelerate growth by providing: Targeted products/services (Platinum, Premier) Personalized advisory services Attractive offers, with particular focus on home equity and Education Refinance Augmenting wealth advisory model to align with highest-opportunity clients Maintain steady growth by providing: Specialized products & services Wide range of lending & credit solutions Enhanced digital capabilities Our strategy focuses on customer segment needs Mass Affluent Affluent Approach High Net Worth(2) 1) Household liquid assets: IXI/CFG data. 2) High Net Worth clients also defined as “HNW”. Pre-Mass Market and Mass Market ~$100,000 to <$500,000 ~$500,000 to <$2,000,000 ~$2,000,000+ Segment(1) Revenues ~≤ $25 million per annum ~≤$100,000 2

Target segments represent 49% of our retail households Retail Households 2.6 million Pre-Mass & Mass Market Mass Affluent Affluent HNW They hold ~$600B in assets outside of Citizens Deposit & Investment Off-Us Opportunity $1,088 Mass Affluent Affluent HNW Pre-Mass & Mass Market Deepening remains an opportunity Mass Affluent HH Client Penetration(1) Affluent HH Client Penetration(1) Source: Company data from AMP as of year-end 2016; includes Retail households only. Source also includes data from IXI that estimates total household assets. Primary bank household with lending or investment product. Primary household defined as checking household with checking average balance >=$100 and transactions >1 in each of the prior three months. Transactions include ACH credit, OLBP, ACH debit or checks written. Primary household with loan or investment product defined as primary household that also has a minimum of one loan or investment account. With a heightened focus on the Mass Affluent and Affluent segments 261 267 167 169 1% Need all underlying data, particularly for primary households Need to understand household growth versus prior three years – for QA Pre Mass Market Mass Market Mass Affluent Affluent High Net Worth Total Q4 2015 84,128 144,065 261,281 166,540 35,523 691,537 Q1 2016 82,836 145,290 262,343 166,116 35,364 691,949 Q2 2016 83,240 148,385 273,127 157,244 35,903 697,899 Q3 2016 81,327 149,159 275,674 158,393 36,180 700,733 Q4 2016 83,882 145,883 266,990 168,758 36,964 702,477 $ billions What does 1% growth in these get us to in terms of revenue possibility? What is it about these segments that shows we care? Data for these clients that they are 5x more profitable or attrite at a lower rate? What makes these the right metric versus the SOW in the prior year; what about trailing 12 month? Comments from Jen Crawford on Mass Affluent/Aff Couple thoughts on your question. Again, these are not meant to be included on a slide. Perhaps you have a nicer way to position them with analysts or for talking points? In terms of not showing SOW, I think we have some concerns about the fact that the denominator in the calculation is based on IXI data. IXI data is modeled and has ~80-85% confidence level. We like the primary bank HH metric because it is based on our internal data only; no dependence on a model or third party. Based on some off the shelf profitability data that we have, we have the following directional info: Mass Affluent Primary bank checking households have ~8% greater profitability than the average Mass Affluent checking household. Affluent Primary bank checking households have ~10% greater profitability than the average Affluent checking household. Answer from Jen Crawford: in thousands IR and Consumer working to obtain profitability and/or attrition metrics for these segments 2% 2
 Building lending capabilities Home equity line of credit originations 57% of new-to-bank home equity line of credit households are Mass Affluent or Affluent; up from 53% YOY (1) Focused on continuous customer experience improvement: — Expanding distribution capabilities — Reducing cycle times — Recapturing end-of-draw runoff $ billions Education originations 54% of new-to-bank In-School and/or ERL households are Mass Affluent or Affluent (2) Differentiated product offering attractive to younger demographic – Multi-year loans – Education refinance Consumer unsecured portfolio growth (2) 1) As of 4Q16 and 4Q15, respectively. New-to-bank origination percentage based on households as percentage of total household HELOC originations. Source: AMP and Company data. 2) As of 4Q16. 3) Excludes credit card and education portfolios. Launched merchant partnership financing in 3Q15 with Apple relationship In 2016 and 2017, expanded our unsecured offerings with launches of high FICO score consumer unsecured installment products 11 $0.5 $0.7 Merchant partnerships 13% $0.4 57% 10% 14% HELOC originations New-to-bank HELOC originations 26% 25% 43% 74% 75% Consumer unsecured partnerships $4.2 $4.0 2014 2015 2016 2014 2015 2016 - Education Refinance (ERL) 83% 73% 67% 17% 27% 33% 1Q16 2Q16 3Q16 4Q16 $0.3 In School 3 $5.2 $1.0 $1.5 $1.9 |
 1.03% 0.70% 0.58% 0.53% Retail loan performance Total retail loss rate Consistent loan growth over 2013-2016 of 5.0% CAGR (4) Paced by growth in high-quality mortgage, student, auto
Yields up, return on capital up, charge-off trend favorable, stress
losses down, non-core runoff provides benefit Expect
core loss rates over next three years in ~45–50 bps range; total retail at ~50-55 bps 1) Shown as % of retail assets. 2) FFELP loans are included in InSchool. 3) Unsecured includes PERL, credit card and product financing. 4) Excludes Business Banking. Re-balancing loan mix to drive improved risk-adjusted returns
$ billions 12 2013 2014 2015 2016 Core loan portfolio Non-core loan portfolio Core loan loss rate Non-core loan loss rate 2013 2016 Loan Mix (1) Loss rate Loan Mix (1) Loss rate Auto 19% 0.06% 26% 0.68% Core home equity 44 0.66 30 0.15 Core resi mortgage 18 0.38 25 0.08 Education Core education refi — — 6 0.14 Core Inschool (2) 3 0.51 4 0.77 Unsecured (3) 4 3.70 4 2.34 Core all other 3 4.07 1 5.54 Total core Consumer (4) 91% 0.68% 97% 0.47% Non-core home equity 6% 4.47% 2% 2.18% Non-core education 1 7.85 1 6.52 Non-core other retail 2 2.41 1 (0.22) Total non-core retail 9% 4.63% 3% 2.43% Total retail 100% 1.03% 100% 0.53% |
 Robust deposit growth with continued pricing discipline Continued focus on cost effectively growing deposits – Deposit costs remain well-controlled; up ~1 bp linked quarter and up ~4 bps YOY Launching initiatives to expand deposit-gathering capabilities through improved data analytics – Targeted customer promotional offers Efforts underway to focus to further refine and enhance deposit-gathering strategies $ billions Consumer Banking deposits (1) 1) Average Consumer deposits exclude repurchase agreements. $68.2 $69.7 $72.0 Noninterest bearing deposits Regular savings Term other ~6 bps 13 Deposit costs .19% .27% .25% Checking with interest Money market $13.8 $14.3 $15.3 $11.4 $11.7 $12.5 $7.8 $7.9 $8.6 $27.1 $25.6 $26.0 $8.1 $10.2 $9.6 2014 2015 2016 |
 Using data and analytics to reach customers more effectively Improving Targeting Direct Mail Enabling Sales Intelligence Alerts Expanding Sales Channels Future of Fulfillment Rolling out new targeting
models across all programs/products Centralizing targeting execution
to a single, in-house platform Moving from product silo targeting to holistic and
personalized customer
relationship targeting Shifting to targeted promotional deposit and lending offers; ending the use of “mass promotions” Enabling and empowering front-end colleagues across channels to act as trusted advisors Providing relevant, actionable, and specific intelligence for personalized
customer treatment
Opportunity for increased
branch sales
by enabling
pre-qualification
Leveraging preassembled
data and electronic
documents to streamline
origination fulfillment
Expected to help position us
as an industry leader with
the use of data to deliver
true personalization from
marketing through
origination and fulfillment
New technology will help
enable optimized marketing
spend, reduce operational costs and originations timelines, with a goal of driving improved revenue
growth and profitability
35% increase in marketing response rates in 2016
25% reduction in marketing execution costs in 2016
Expedited home equity fulfillment pilot successfully launched
14 |
 Growing advisory staff (1) 405 362 320 306 2015 2016 2017 target Financial Consultants Premier Bankers 202 177 162 132 Licensed Bankers 550 503 462 331 Aligning sales force to better serve our highest-opportunity wealth clients
Building momentum with investment sales
(2) 1) Data as of year-end for 2014, 2015 and 2016. Headcounts reflect full-time equivalents. 2017 data is estimated for
year-end 2017 as of April 2017. 2)
Investment sales through Citizens Investment Services.
2014 2015 2016 2014 2015 2016 2014 $608 $687 $739 $674 $763 64% 61% 70% 80% 86% 36% 39% 30% 20% 14% $ millions 2017 target 2017 target 15 1Q16 2Q16 3Q16 4Q16 1Q17 Managed Money Transactional |
 1Q16 2Q16 3Q16 4Q16 1Q17 Accelerating Mortgage fee growth Improving origination mix Growing mortgage fees Double digit growth in mortgage banking fees Expansion of sales force and focus on conforming expected to help drive fee growth and improved returns Expect continued market share growth to help mitigate impact of current mortgage market headwinds Multi-faceted approach: sales force expansion, product enhancements, channel optimization, improved operational efficiency $ millions 40% 40% $1.4 $ billions $1.7 $2.0 $2.2 $2.2 1) Period-end Loan Officer count (LO). 412 442 538 Mortgage fees Loan officers (1) 35% 33% 35% 42% Portfolio mortgage originations Secondary mortgage originations 16 $71 $101 $112 2014 2015 2016 |
 A mindset of continuous improvement Example: Using process automation for debit card chargeback processing to deliver
recovery benefits for the bank
Early Results
Reduced time per transaction from ~8 minutes to <2
minutes More than 35,000 chargebacks ($3.5 million) filed
since launch on March 1, 2017 Expect volume and value of
chargebacks processed by end of May 2017 will surpass
total recovered losses for 2016
Continuously improving processes to drive efficiencies
Benefits
Improved customer experience
Increased productivity
Robotics used
to address this
Enhanced risk management
Quicker implementation
Customer
files a
claim Claim reviewed Letter to customer informing them of provisional credit Chargeback processes (attempt to recover funds with merchant) Claim finalized Letter to customer finalizing credit or informing of denial 17 6 |
 Key messages Consumer Banking continues to deliver strong growth and improving performance
Adapting to the changing world of retail banking
Remain focused on a customer-segment strategy
Optimizing lending portfolio and enhancing deposit
capabilities Investing to grow wealth and mortgage
businesses Self-funding investment through continuous
improvement 18 |
 Appendix / Key performance metrics, Non-GAAP financial measures and reconciliations 19 |
 Aspire to be a top-performing regional bank, delivering well for all stakeholders
Colleagues
Regulators
Investors
Communities & Society
Customer-centric culture
20 Customers |
 21 Our vision and credo guide us To help our customers, colleagues and communities reach their potential
To be a top-performing bank distinguished by its
customer-centric culture, mindset of continuous
improvement and excellent capabilities We perform our best
every day so we can do more for our customers, colleagues,
communities and shareholders
We strive to always exceed customer expectations, do the right thing,
think long-term, work together
We are citizens helping citizens reach their potential
Mission Vision Credo |
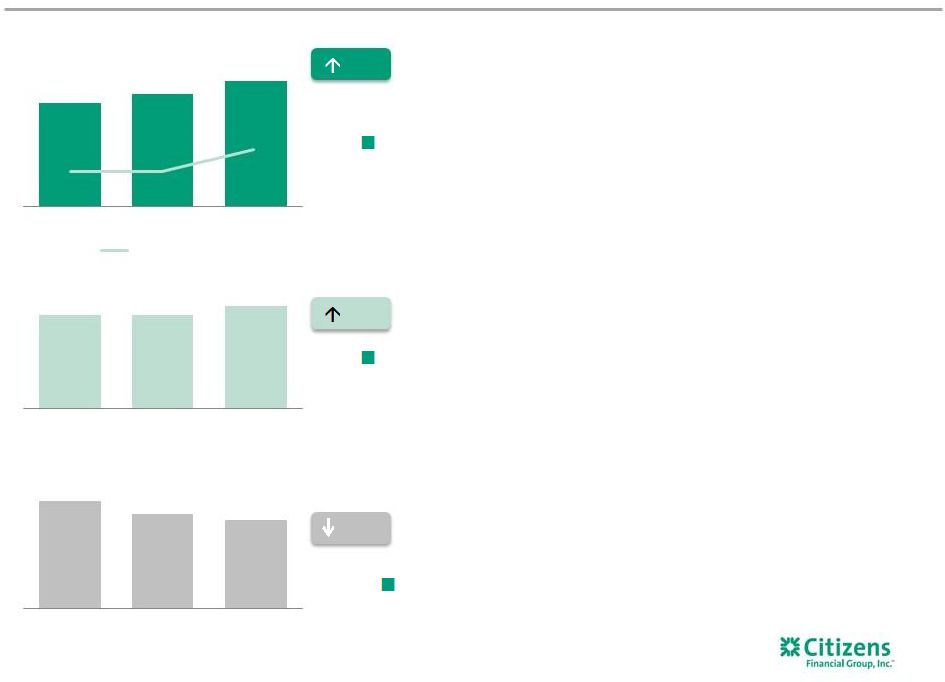 At Citizens, continue to smartly grow our balance sheet 16% 16% Good loan growth with rising yields Return on loan book regulatory capital improving (2) Stress losses as a % of loans declining (3) 17% 17% Total loans $94 $108 (1) $ billions $99 1) Period-end loan balances; includes held-for sale. 2) Reflects after-tax return calculated as loan interest income/regulatory capital assuming a CET1 target of 10.5%.
3) Total loan losses as a percentage of the total loan book based on FRB Severely Adverse Scenario 9-quarter horizon for 2014, 2015 and 2016. 22 10% 10% 5.8% 5.1% 4.8% 2014 2015 2016 Loan yield 3.34% 3.34% 3.58% 2014 2015 2016 21% 21% 23% 2014 2015 2016 |
 Core retail portfolio Highlights Weighted-average core FICO score of 760 63% of the retail portfolio has a FICO score of >750 Core Mortgage – average portfolio FICO of 779 and LTV of 63% 4Q16 originations of $2.2 billion with weighted-average FICO of 767 and yield of 3.28% Auto Finance – Purchase only, no leasing, average portfolio FICO of 730 64% new-car loans 4Q16 originations of $1.4 billion with weighted-average FICO score of 747 and weighted-average yield of 3.29% Education Lending 95% of InSchool loans co-signed with average portfolio FICO of 774 4Q16 InSchool originations of $58 million with average FICO of 762 and 94% co-sign rate 4Q16 organic refinance product originations of $346 million with weighted-average FICO of 783 4Q16 $54.5 billion core retail portfolio Out of Footprint New England Mid-Atlantic Midwest Home Equity Mortgage Auto Cards Education Finance Other 800+ 750-799 700-749 650-699 600-649 <600 Note: excludes $1.5 billion of non-core loans, including $1.1 billion of home equity, $291 million of education and $173 million of residential mortgage. 1) Portfolio balances as of December 31, 2016. Based on most current available FICO scores and collateral value. Loan term, lien
position, risk rating, property type, industry sector and
geographic stratifications current as of September 30, 2016, as applicable. (1) by Product type by Geography by refreshed FICO (1) $s in billions 2013 2014 2015 2016 Period-end loans $43.2 $47.4 $50.7 $54.5 Average loans $42.9 $45.1 $48.9 $52.3 30-Day past due % 2.53% 2.31% 2.13% 1.87% NPL % 2.31% 1.68% 1.53% 1.02% NCO % 0.68% 0.55% 0.50% 0.47% 23 26% 35% 14% 25% 3% 5% 10% 19% 28% 35% 27% 29% 26% 12% 3% 3% |
 $s in billions 2013 2014 2015 2016 Period-end loans $20.1 $18.7 $17.1 $15.9 Average loans $20.7 $19.4 $17.2 $16.5 30-Day past due % 2.53% 2.71% 2.76% 2.53% NPL % 2.93% 2.41% 2.35% 2.13% NCO % 0.66% 0.47% 0.34% 0.15% 1) As of December 31, 2016. Excludes serviced by other portfolio. 2) Portfolio balances as of December 31, 2016. Based on most current available FICO scores and collateral value. Loan term, lien position,
risk rating, property type, industry sector and geographic stratifications current as of December 31, 2016, as applicable. 3) LTV based on refreshed collateral values and assumes that any undrawn borrowing capacity is fully funded
by Lien position
by Lien position
2nd 1st 2nd 1st 53% of the portfolio is secured by 1 st lien Weighted-average FICO of 766 88% has an LTV of less than 80% 4Q16 HELOC originations of $1.3 billion Weighted-average FICO score of 790 and a weighted-average CLTV of 64.1% 59% of originations are first-lien Highlights (2) (2) Core home equity portfolio (1) by Refreshed LTV by Refreshed FICO by Refreshed FICO 649 650-699 700-749 750-799 800+ <70% 90-100% 600-649 650-699 700-749 750-799 800+ <600 71-79% <70% 70-79% 80-89% 100%+ WA FICO 769 WA FICO 746 88% with LTV <80% 90% with LTV <80% (2) (2,3) (2) (2,3) by Refreshed LTV 24 80-89% 90-100% 100%+ 4Q16 $14.1 billion HELOC 4Q16 $1.8 billion HELOAN 34% 66% 7% 9% 13% 16% 19% 36% 82% 8% 5% 3% 2% 49% 51% 6% 9% 17% 27% 41% 67% 21% 9% 2% 1% |
 $14.3 $9.4 ($1.8) ($1.1) ($1.5) ($0.5) Total O/S In repay 2017 2018 2019 2020+ Highlights Between 2017 – 2019, $3.1 billion in drawn balances ($3.0 billion of undrawn balances) are scheduled to mature, or 22%, of the total drawn HELOC balances Weighted average FICO of 762, and CLTV of 64% with 36% secured by 1 st lien In no single year is the maturing population balance greater than $1.5 billion Maturing vintages as of December 31, 2016 HELOC payment shock management 2014 – $899 million 2015 – $1.26 billion 2016 – $916 million Maturity schedule 2017 - 2019 as of December 31, 2016 $s in billions 1) Includes serviced by other portfolio. (1) 25 Proactive mitigation efforts Initiated comprehensive mitigation plan to manage exposure and assist customers through reset by offering alternative financing/forbearance options Begin reaching out two years in advance of maturity dates Policies, procedures and monitoring requirements; guidance on TDR/collateral dependency recognition Enhanced product to maximize customer options – new 30-year, high-LTV HE loan product Proactive assessment of unused lines before maturity to manage higher-risk customers 2017-2019 Maturing Population: 36% Sr. Lien; 79% <80% CLTV; 66% >740 FICO 92% <80% CLTV or >740 FICO Charged-off 30+ Delinquent Loan modification Current without changes Paid off CFG refinance 26% 34% 29% 6% 3% 3% 42% 28% 21% 3% 3% 2% 49% 21% 24% 1% 4% 1% |
 Core mortgage portfolio overview Highlights Jumbo mortgages originated primarily within the Bank’s lending footprint Predominately in-footprint with a weighted-average refreshed portfolio FICO score of 779 and CLTV of 63% 4Q16 originations of $2.2 billion with weighted- average FICO of 767 and yield of 3.28% OREO portfolio of 135 units at $17.0 million 4Q16 $14.9 billion core mortgage portfolio by Refreshed CLTV by Refreshed FICO $s in billions 2013 2014 2015 2016 Period-end loans $9.0 $11.5 $12.6 $14.9 Average loans $8.6 $10.3 $12.0 $13.8 30-Day past due % 4.68% 3.44% 2.58% 1.80% NPL % 3.66% 2.64% 2.30% 0.88% NCO % 0.38% 0.16% 0.07% 0.08% 600-649 650-699 700-749 <600 90-100% 71-79% 80-89% 100%+ Origination detail $s in millions Note: Excludes $173 million of non-core mortgage loans as of December 31, 2016.
1) Portfolio balances as of December 31, 2016. Based on most current available FICO scores and collateral value. Loan term, lien position, risk rating, property type, industry sector and geographic stratifications current as of December 31, 2016, as applicable.
(1) (1) 750-799 <70% 800+ 26 61% 28% 7% 3% 1% 2% 2% 5% 16% 32% 43% 73% 73% 75% 74% 73% WA LTV |
 Auto portfolio credit metrics 27 Auto Finance portfolio – purchase only, no leasing, weighted-average FICO score of 730 4Q16 originations of $1.4 billion with weighted-average FICO score of 747 and weighted-average yield of 3.88% 68% of the portfolio has a FICO score of greater than 700, 54% 72 months and 64% are new-car loans Nearly 70% of the portfolio secured by pickups, SUVs or CUVs with only 13% secured by midsize vehicles (3) 76- to 84-month term originations have a weighted-average FICO score of 767 Highlights 601-649 650-699 700-749 750-799 800 by Refreshed FICO score 36 37-48 49-60 76-84 61-63 64-66 67-72 73-75 by Origination LTV 80-89% 90-99% 100-109% 110-119% 120% 80% 600 1) Assumes that for loans where refreshed FICO score information not available, the balance stratification is consistent with the remainder
of the portfolio. 2)
Portfolio balances as of December 31, 2016. Based on most current available FICO
scores. LTV ratio, loan term, lien position, risk rating, property type, industry sector and geographic stratifications current as of December 31, 2016, as applicable. LTV calculated utilizing actual invoice amount or Kelley Blue
Book value. 3)
Portfolio collateral mix as of April 30, 2017.
(1) (1,2) Auto + SCUSA Originations $s in billions (2) 4Q16 $13.9 billion Auto portfolio % new car 64% $s in billions 2013 2014 2015 2016 Period-end loans $9.4 $12.7 $13.8 $13.9 Average loans $8.9 $11.0 $13.5 $14.0 30-Day past due % 0.52% 0.83% 1.35% 1.74% NPL % 0.18% 0.17% 0.30% 0.36% NCO % 0.07% 0.21% 0.51% 0.68% (2) (2) by Term (2) (months) 5% 9% 18% 24% 23% 21% 15% 15% 20% 22% 16% 12% 1% 1% 13% 2% 1% 36% 25% 21% 99% 99% 99% 97% 97% WA LTV $1.3 $1.4 $1.6 $1.4 $1.2 $1.5 $1.5 $1.8 $1.6 $1.4 748 749 746 746 747 4Q15 1Q16 2Q16 3Q16 4Q16 Organic Auto SCUSA $0.2 $0.1 $0.2 $0.2 $0.2 WA FICO |
 700-739 Core education finance portfolio overview Highlights by Refreshed FICO Note: YoY delinquency and NPL improvement driven by sale of FFELP loans in 3Q 2014.
Previous origination data was based on amounts disbursed to students per quarter
and represented balance sheet loan growth. Current data represents full amounts originated per quarter that have been committed to borrowers. 1) Portfolio balances as of December 31, 2016. Based on most current available FICO scores and collateral value. Loan term, lien position, risk rating, property type, industry sector and geographic stratifications current as of December 31, 2016, as applicable.
Core education finance portfolio average FICO score of 774
and co-sign rate of 49%
95% of InSchool loans co-signed with average FICO of
774 4Q16 InSchool originations of $58 million with average
FICO of 762 and 94% co-sign rate
Total organic refinance portfolio of $2.2 billion with
weighted-average FICO of 780
4Q16 organic refi
product originations of $346 million with
weighted-average FICO of 783
SoFi purchased portfolio balance of $1.6 billion with
average FICO of 773
<650
740-779
650-699
780-799
800-850
by Segment
InSchool
Legacy
run off
Refinance
loan Acquired portfolios (1) $s in billions 2013 2014 2015 2016 Period-end loans $1.8 $1.9 $4.0 $6.3 Average loans $1.5 $1.7 $3.0 $5.3 30-Day past due % 3.77% 1.13% 0.72% 0.53% NPL % 1.80% 0.53% 0.45% 0.25% NCO % 0.53% 0.37% 0.41% 0.40% 4Q16 $6.3 billion core education finance portfolio (1) Origination Detail $s in millions 28 95% 93% 83% 96% 94% 38% 39% 36% 33% 33% In School origination co-sign rate ERL origination co-sign rate $267 $345 $359 $700 $436 777 777 781 778 780 4Q15 1Q16 2Q16 3Q16 4Q16 InSchool ERL WA Origination FICO 2% 6% 14% 27% 16% 35% 26% 7% 39% 28% |
 83% 73% 67% 17% 27% 33% $314 $431 $712 $1,049 1Q16 2Q16 3Q16 4Q16 Consumer unsecured installment Total Consumer unsecured* $s in millions 1Q16 2Q16 3Q16 4Q16 Period-end loans $314 $431 $712 $1,049 Average loans $265 $372 $504 $908 30-Day past due % 1.00% 1.48% 1.16% 0.97% NPL % 0.00% 0.00% 0.00% 0.02% NCO % 0.00% 0.00% 0.03% 0.17% Highlights Launched merchant partnership financing in 3Q15 and in 2016 expanded our unsecured offerings with the launch of our consumer unsecured installment product Originated ~$1.2 billion unsecured loans in 2016 with weighted-average FICO score of 750 Consumer unsecured installment product focuses on super prime and high-prime borrowers Average term 5.5 years with portfolio weighted- average FICO of 765 Developing strategic partnerships designed around high-quality merchant partnership offerings Partnerships utilize loss-sharing arrangements Apple partnership launched mid-2015 Vivint Smart Home and HP partnerships launched in 1Q17 Consumer unsecured portfolio 2016 growth trend $s in millions 4Q16 merchant partnership portfolio by origination FICO score 4Q16 consumer unsecured installment by refreshed FICO score WA FICO 765 *Note: Excludes credit card and education portfolios. 1) Product finance portfolio represents strategic partnerships in which Citizens finances the purchase of a partner’s product. Refreshed
FICO score not available. FICO scores based on origination.
(1) 800+ 780-799 760-779 720-739 700-719 680-699 740-759 WA FICO 749 800+ 750-799 700-749 600-649 <600 650-699 29 <680 1% 6% 16% 24% 27% 26% 4% 4% 7% 11% 14% 17% 17% 25% |
 Key performance metrics, Non-GAAP financial measures and reconciliations
30 $s in millions, except share, per share and ratio data 1Q17 4Q16 3Q16 2Q16 1Q16 $ % $ % Noninterest income, adjusted: Noninterest income (GAAP) $379 $377 $435 $355 $330 $2 1 % $49 15 % Less: Notable items — — 67 — — — — — — Noninterest income, adjusted (non-GAAP) $379 $377 $368 $355 $330 $2 1 % $49 15 % Total revenue, adjusted: Total revenue (GAAP) A $1,384 $1,363 $1,380 $1,278 $1,234 $21 2 % $150 12 % Less: Notable items — — 67 — — — — — — Total revenue, adjusted (non-GAAP) B $1,384 $1,363 $1,313 $1,278 $1,234 $21 2 % $150 12 % Noninterest expense, adjusted: Noninterest expense (GAAP) C $854 $847 $867 $827 $811 $7 1 % $43 5 % Less: Notable items — — 36 — — — — — — Noninterest expense, adjusted (non-GAAP) D $854 $847 $831 $827 $811 $7 1 % $43 5 % Pre-provision profit: Total revenue (GAAP) A $1,384 $1,363 $1,380 $1,278 $1,234 $21 2 % $150 12 % Noninterest expense (GAAP) C 854 847 867 827 811 7 1 43 5 Pre-provision profit (GAAP) $530 $516 $513 $451 $423 $14 3 % $107 25 % Pre-provision profit, adjusted: Total revenue, adjusted (non-GAAP) B $1,384 $1,363 $1,313 $1,278 $1,234 $21 2 % $150 12 % Less: Noninterest expense, adjusted (non-GAAP) D 854 847 831 827 811 7 1 43 5 Pre-provision profit, adjusted (non-GAAP) $530 $516 $482 $451 $423 $14 3 % $107 25 % Income before income tax expense, adjusted: Income before income tax expense (GAAP) $434 $414 $427 $361 $332 $20 5 % $102 31 % Less: Income before income tax expense (benefit) related to notable items
—
—
31 — — — — — — Income before income tax expense, adjusted (non-GAAP) $434 $414 $396 $361 $332 $20 5 % $102 31 % Income tax expense and effective income tax rate, adjusted: Income tax expense (GAAP) $114 $132 $130 $118 $109 ($18) (14%) $5 5 % Less: Income tax expense (benefit) related to notable items — — 12 — — — — — — Income tax expense, adjusted (non-GAAP) $114 $132 $118 $118 $109 ($18) (14%) $5 5 % Net income, adjusted: Net income (GAAP) E $320 $282 $297 $243 $223 $38 13 % $97 43 % Add: Notable items, net of income tax expense (benefit) — — (19) — — — — — — Net income, adjusted (non-GAAP) F $320 $282 $278 $243 $223 $38 13 % $97 43 % Net income available to common stockholders, adjusted: Net income available to common stockholders (GAAP) G $313 $282 $290 $243 $216 $31 11% $97 45 % Add: Notable items, net of income tax expense (benefit) — — (19) — — — — — — Net income available to common stockholders, adjusted (non-GAAP)
H $313 $282 $271 $243 $216 $31 11 % $97 45 % 4Q16 1Q16 QUARTERLY TRENDS 1Q17 Change |
 Key performance metrics, Non-GAAP financial measures and reconciliations
31 $s in millions, except share, per share and ratio data 1Q17 4Q16 3Q16 2Q16 1Q16 $/bps % $/bps % Operating leverage: Total revenue (GAAP) A $1,384 $1,363 $1,380 $1,278 $1,234 $21 1.54 % $150 12.16 % Less: Noninterest expense (GAAP) C 854 847 867 827 811 7 0.83 43 5.30 Operating leverage 0.71 % 6.86 % Operating leverage, adjusted: Total revenue, adjusted (non-GAAP) B $1,384 $1,363 $1,313 $1,278 $1,234 $21 1.54 % $150 12.16 % Less: Noninterest expense, adjusted (non-GAAP) D 854 847 831 827 811 7 0.83 43 5.30 Operating leverage, adjusted (non-GAAP) 0.71 % 6.86 % Efficiency ratio and efficiency ratio, adjusted: Efficiency ratio C/A 61.68 % 62.18 % 62.88 % 64.71 % 65.66 % (50) bps (398) bps Efficiency ratio, adjusted (non-GAAP) D/B 61.68 62.18 63.31 64.71 65.66 (50) bps (398) bps Return on average common equity and return on average common equity, adjusted:
Average common equity (GAAP)
I $19,460 $19,645 $19,810 $19,768 $19,567 ($185) (1%) ($107) (1%) Return on average common equity G/I 6.52 % 5.70 % 5.82 % 4.94 % 4.45 % 82 bps 207 bps Return on average common equity, adjusted (non-GAAP) H/I 6.52 5.70 5.44 4.94 4.45 82 bps 207 bps Return on average tangible common equity and return on average tangible common equity, adjusted:
Average common equity (GAAP)
I $19,460 $19,645 $19,810 $19,768 $19,567 ($185) (1%) ($107) (1%) Less: Average goodwill (GAAP) 6,876 6,876 6,876 6,876 6,876 — — — — Less: Average other intangibles (GAAP) — 1 1 2 3 (1) (100) (3) (100) Add: Average deferred tax liabilities related to goodwill (GAAP) 531 523 509 496 481 8 2 50 10 Average tangible common equity J $13,115 $13,291 $13,442 $13,386 $13,169 ($176) (1%) ($54) —% Return on average tangible common equity G/J 9.68 % 8.43 % 8.58 % 7.30 % 6.61 % 125 bps 307 bps Return on average tangible common equity, adjusted (non-GAAP)
H/J 9.68 8.43 8.02 7.30 6.61 125 bps 307 bps Return on average total assets and return on average total assets, adjusted:
Average total assets (GAAP)
K $148,786 $147,315 $144,399 $142,179 $138,780 $1,471 1 % $10,006 7 % Return on average total assets E/K 0.87 % 0.76 % 0.82 % 0.69 % 0.65 % 11 bps 22 bps Return on average total assets, adjusted (non-GAAP) F/K 0.87 0.76 0.77 0.69 0.65 11 bps 22 bps Return on average total tangible assets and return on average total tangible assets, adjusted:
Average total assets (GAAP)
K $148,786 $147,315 $144,399 $142,179 $138,780 $1,471 1 % $10,006 7 % Less: Average goodwill (GAAP) 6,876 6,876 6,876 6,876 6,876 — — — — Less: Average other intangibles (GAAP) — 1 1 2 3 (1) (100) (3) (100) Add: Average deferred tax liabilities related to goodwill (GAAP) 531 523 509 496 481 8 2 50 10 Average tangible assets L $142,441 $140,961 $138,031 $135,797 $132,382 $1,480 1 % $10,059 8 % Return on average total tangible assets E/L 0.91 % 0.79 % 0.86 % 0.72 % 0.68 % 12 bps 23 bps Return on average total tangible assets, adjusted (non-GAAP) F/L 0.91 0.79 0.80 0.72 0.68 12 bps 23 bps QUARTERLY TRENDS 1Q17 Change 4Q16 1Q16 |
 Key performance metrics, Non-GAAP financial measures and reconciliations
32 $s in millions, except share, per share and ratio data 1Q17 4Q16 3Q16 2Q16 1Q16 $/bps % $/bps % Tangible book value per common share: Common shares - at end of period (GAAP) M 509,515,646 511,954,871 518,148,345 529,094,976 528,933,727 (2,439,225) —% (19,418,081) (4%) Common stockholders' equity (GAAP) $19,600 $19,499 $19,934 $19,979 $19,718 $101 1 ($118) (1) Less: Goodwill (GAAP) 6,876 6,876 6,876 6,876 6,876 — — — — Less: Other intangible assets (GAAP) — 1 1 2 3 (1) (100) (3) (100) Add: Deferred tax liabilities related to goodwill (GAAP) 534 532 519 507 494 2 — 40 8 Tangible common equity N $13,258 $13,154 $13,576 $13,608 $13,333 $104 1 % ($75) (1%) Tangible book value per common share N/M $26.02 $25.69 $26.20 $25.72 $25.21 $0.33 1 % $0.81 3 % Net income per average common share - basic and diluted, adjusted: Average common shares outstanding - basic (GAAP) O 509,451,450 512,015,920 519,458,976 528,968,330 528,070,648 (2,564,470) (1%) (18,619,198) (4%) Average common shares outstanding - diluted (GAAP) P 511,348,200 513,897,085 521,122,466 530,365,203 530,446,188 (2,548,885) — (19,097,988) (4) Net income available to common stockholders (GAAP) G $313 $282 $290 $243 $216 $31 11 $97 45 Net income per average common share - basic (GAAP) G/O 0.61 0.55 0.56 0.46 0.41 0.06 11 0.20 49 Net income per average common share - diluted (GAAP) G/P 0.61 0.55 0.56 0.46 0.41 0.06 11 0.20 49 Net income available to common stockholders, adjusted (non-GAAP)
H 313 282 271 243 216 31 11 97 45 Net income per average common share - basic, adjusted (non-GAAP) H/O 0.61 0.55 0.52 0.46 0.41 0.06 11 0.20 49 Net income per average common share - diluted, adjusted (non-GAAP) H/P 0.61 0.55 0.52 0.46 0.41 0.06 11 0.20 49 Pro forma Basel III fully phased-in common equity tier 1 capital ratio
1 : Common equity tier 1 capital (regulatory) $13,941 $13,822 $13,763 $13,768 $13,570 Less: Change in DTA and other threshold deductions (GAAP) — — — 1 1 Pro forma Basel III fully phased-in common equity tier 1 capital
Q $13,941 $13,822 $13,763 $13,767 $13,569 Risk-weighted assets (regulatory general risk weight approach)
$124,881
$123,857
$121,612
$119,492
$116,591
Add: Net change in credit and other risk-weighted assets
(regulatory) 247
244 228 228 232 Pro forma Basel III standardized approach risk-weighted assets
R $125,128 $124,101 $121,840 $119,720 $116,823 Pro forma Basel III fully phased-in common equity tier 1 capital ratio
1 Q/R 11.1 % 11.1 % 11.3 % 11.5 % 11.6 % QUARTERLY TRENDS 1Q17 Change 4Q16 1Q16 1 Basel III ratios assume certain definitions impacting qualifying Basel III capital, which otherwise will phase in through 2019, are
fully phased-in. Ratios also reflect the required US Standardized methodology for calculating RWAs, effective January 1, 2015. |
 Key performance metrics, Non-GAAP financial measures and reconciliations
33 $s in millions, except share, per share and ratio data 1Q17 4Q16 3Q16 2Q16 1Q16 $ % $ % Other income, adjusted Other income (GAAP) $24 $25 $87 $15 $20 ($1) (4%) $4 20 % Less: Notable items — — 67 — — — — — — Other income, adjusted (non-GAAP) $24 $25 $20 $15 $20 ($1) (4%) $4 20 % Salaries and employee benefits, adjusted: Salaries and employee benefits (GAAP) $444 $420 $432 $432 $425 $24 6 % $19 4 % Less: Notable items — — 11 — — — — — — Salaries and employee benefits, adjusted (non-GAAP) $444 $420 $421 $432 $425 $24 6 % $19 4 % Outside services, adjusted: Outside services (GAAP) $91 $98 $102 $86 $91 ($7) (7%) $— —% Less: Notable items — — 8 — — — — — — Outside services, adjusted (non-GAAP) $91 $98 $94 $86 $91 ($7) (7%) $— —% Occupancy, adjusted: Occupancy (GAAP) $82 $77 $78 $76 $76 $5 6 % $6 8 % Less: Notable items — — — — — — — — — Occupancy, adjusted (non-GAAP) $82 $77 $78 $76 $76 $5 6 % $6 8 % Equipment expense, adjusted: Equipment expense (GAAP) $67 $69 $65 $64 $65 ($2) (3%) $2 3 % Less: Notable items — — — — — — — — — Equipment expense, adjusted (non-GAAP) $67 $69 $65 $64 $65 ($2) (3%) $2 3 % Amortization of software, adjusted: Amortization of software (GAAP) $44 $44 $46 $41 $39 $— —% $5 13 % Less: Notable items — — 3 — — — — — — Amortization of software, adjusted (non-GAAP) $44 $44 $43 $41 $39 $— —% $5 13 % Other operating expense, adjusted: Other operating expense (GAAP) $126 $139 $144 $128 $115 ($13) (9%) $11 10 % Less: Notable items — — 14 — — — — — — Other operating expense, adjusted (non-GAAP) $126 $139 $130 $128 $115 ($13) (9%) $11 10 % 4Q16 1Q16 QUARTERLY TRENDS 1Q17 Change |
 Key performance metrics, Non-GAAP financial measures and reconciliations
34 $s in millions, except share, per share and ratio data 2016 2015 2014 $ % Noninterest income, adjusted: Noninterest income (GAAP) $1,497 $1,422 $1,678 $75 5 % Less: Special items — — 288 — — Less: Notable items 67 — — 67 100 Noninterest income, adjusted (non-GAAP) $1,430 $1,422 $1,390 $8 1 % Total revenue, adjusted: Total revenue (GAAP) A $5,255 $4,824 $4,979 $431 9 % Less: Special items — — 288 — — Less: Notable items 67 — — 67 100 Total revenue, adjusted (non-GAAP) B $5,188 $4,824 $4,691 $364 8 % Noninterest expense, adjusted: Noninterest expense (GAAP) C $3,352 $3,259 $3,392 $93 3 % Less: Restructuring charges and special items — 50 169 (50) (100) Less: Notable items 36 — — 36 100 Noninterest expense, adjusted (non-GAAP) D $3,316 $3,209 $3,223 $107 3 % Pre-provision profit, adjusted: Total revenue, adjusted (non-GAAP) $5,188 $4,824 $4,691 $364 8 % Less: Noninterest expense, adjusted (non-GAAP) 3,316 3,209 3,223 107 3 Pre-provision profit, adjusted (non-GAAP) $1,872 $1,615 $1,468 $257 16 % Income before income tax expense, adjusted: Income before income tax expense (GAAP) E $1,534 $1,263 $1,268 $271 21 % Less: Income before income tax expense (benefit) related to restructuring charges
and special items
—
(50) 119 50 100 Less: Income before income tax expense (benefit) related to notable items
31 — — 31 100 Income before income tax expense, adjusted (non-GAAP) F $1,503 $1,313 $1,149 $190 14 % Income tax expense, adjusted: Income tax expense (GAAP) G $489 $423 $403 $66 16 % Less: Income tax expense (benefit) related to restructuring charges and special
items — (19) 44 19 100 Less: Income tax expense (benefit) related to notable items 12 — — 12 100 Income tax expense, adjusted (non-GAAP) H $477 $442 $359 $35 8 % Net income, adjusted: Net income (GAAP) I $1,045 $840 $865 $205 24 % Add: Restructuring charges and special items, net of income tax expense (benefit)
—
31 (75) (31) (100) Add: Notable items, net of income tax expense (benefit) (19) — — (19) (100) Net income, adjusted (non-GAAP) J $1,026 $871 $790 $155 18 % Net income available to common stockholders, adjusted: Net income available to common stockholders (GAAP) K $1,031 $833 $865 $198 24 % Add: Restructuring charges and special items, net of income tax expense (benefit)
—
31 (75) (31) (100) Add: Notable items, net of income tax expense (benefit) (19) — — (19) (100) Net income available to common stockholders, adjusted (non-GAAP)
L $1,012 $864 $790 $148 17 % Effective income tax rate, adjusted: Effective income tax rate G/E 31.88% 33.52% (164) bps Effective income tax rate, adjusted: H/F 31.74 33.67 (193) bps FULL YEAR 2016 Change 2015 |
 Key performance metrics, Non-GAAP financial measures and reconciliations
35 $s in millions, except share, per share and ratio data 2016 2015 2014 $/bps % Operating leverage: Total revenue (GAAP) A $5,255 $4,824 $431 8.93 % Less: Noninterest expense (GAAP) C 3,352 3,259 93 2.85 Operating leverage 6.08 % Operating leverage, adjusted: Total revenue, adjusted (non-GAAP) B $5,188 $4,824 $364 7.55 % Less: Noninterest expense, adjusted (non-GAAP) D 3,316 3,209 107 3.33 Operating leverage, adjusted (non-GAAP) 4.22 % Efficiency ratio and efficiency ratio, adjusted: Efficiency ratio C/A 63.80 % 67.56 % 68.12 % (376) bps Efficiency ratio, adjusted (non-GAAP) D/B 63.92 66.52 68.70 (260) bps Return on average common equity and return on average common equity,
adjusted:
Average common equity (GAAP)
M $19,698 $19,354 $19,399 $344 2 % Return on average common equity K/M 5.23 % 4.30 % 4.46 % 93 bps Return on average common equity, adjusted (non-GAAP) L/M 5.14 4.46 4.07 68 bps Return on average tangible common equity and return on average tangible
common equity, adjusted:
Average common equity (GAAP)
M $19,698 $19,354 $19,399 $344 2 % Less: Average goodwill (GAAP) 6,876 6,876 6,876 — — Less: Average other intangibles (GAAP) 2 4 7 (2) (50) Add: Average deferred tax liabilities related to goodwill (GAAP) 502 445 377 57 13 Average tangible common equity N $13,322 $12,919 $12,893 $403 3 % Return on average tangible common equity K/N 7.74 % 6.45 % 6.71 % 129 bps Return on average tangible common equity, adjusted (non-GAAP)
L/N 7.60 6.69 6.13 91 bps Return on average total assets and return on average total assets, adjusted:
Average total assets (GAAP)
O $143,183 $135,070 $127,624 $8,113 6 % Return on average total assets I/O 0.73 % 0.62 % 0.68 % 11 bps Return on average total assets, adjusted (non-GAAP) J/O 0.72 0.64 0.62 % 8 bps Return on average total tangible assets and return on average total tangible
assets, adjusted:
Average total assets (GAAP)
O $143,183 $135,070 $127,624 $8,113 6 % Less: Average goodwill (GAAP) 6,876 6,876 6,876 — — Less: Average other intangibles (GAAP) 2 4 7 (2) (50) Add: Average deferred tax liabilities related to goodwill (GAAP) 502 445 377 57 13 Average tangible assets P $136,807 $128,635 $121,118 $8,172 6 % Return on average total tangible assets I/P 0.76 % 0.65 % 0.71 % 11 bps Return on average total tangible assets, adjusted (non-GAAP) J/P 0.75 0.68 0.65 7 bps FULL YEAR 2016 Change 2015 |
 Key performance metrics, Non-GAAP financial measures and reconciliations
36 $s in millions, except share, per share and ratio data 2016 2015 2014 $/bps % Tangible book value per common share: Common shares - at end of period (GAAP) Q 511,954,871 527,774,428 545,884,519 (15,819,557) (3%) Common stockholders' equity (GAAP) $19,499 $19,399 $19,268 $100 1 Less: Goodwill (GAAP) 6,876 6,876 6,876 — — Less: Other intangible assets (GAAP) 1 3 6 (2) (67) Add: Deferred tax liabilities related to goodwill (GAAP) 532 480 420 52 11 Tangible common equity R $13,154 $13,000 $12,806 $154 1 % Tangible book value per common share R/Q $25.69 $24.63 $23.46 $1.06 4 % Net income per average common share - basic and diluted, adjusted:
Average common shares outstanding - basic (GAAP)
S 522,093,545 535,599,731 556,674,146 (13,506,186) (3%) Average common shares outstanding - diluted (GAAP) T 523,930,718 538,220,898 557,724,936 (14,290,180) (3) Net income available to common stockholders (GAAP) K $1,031 $833 $865 $198 24 Net income per average common share - basic (GAAP) K/S 1.97 1.55 1.55 0.42 27 Net income per average common share - diluted (GAAP) K/T 1.97 1.55 1.55 0.42 27 Net income available to common stockholders, adjusted (non-GAAP)
L 1,012 864 790 148 17 Net income per average common share - basic, adjusted (non-GAAP)
L/S 1.94 1.61 1.42 0.33 20 Net income per average common share - diluted, adjusted (non-GAAP)
L/T 1.93 1.61 1.42 0.32 20 FULL YEAR 2016 Change 2015 |
 Key performance metrics, Non-GAAP financial measures and reconciliations
37 $s in millions, except share, per share and ratio data FULL YEAR 2016 2015 2014 Consumer Banking Commercial Banking Total Consumer and Commercial Banking Consumer Banking Commercial Banking Total Consumer and Commercial Banking Consumer Banking Commercial Banking Total Consumer and Commercial Banking Net income (GAAP) A $345 $631 $976 $262 $579 $841 $182 $561 $743 Risk-adjusted regulatory capital B $5,166 $5,071 $10,237 $4,739 $4,666 $9,405 $4,665 $4,174 $8,839 Return on adjusted regulatory capital A/B 6.68 % 12.44 % 9.53 % 5.53 % 12.41 % 8.94 % 3.90 % 13.43 % 8.40 % |
 Key performance metrics, Non-GAAP financial measures and reconciliations
38 $s in millions, except share, per share and ratio data Consumer Commercial Other Consolidated Consumer Commercial Other Consolidated Consumer Commercial Other Consolidated Net income available to common stockholders: Net income (loss) (GAAP) A $95 $180 $45 $320 $92 $172 $18 $282 $92 $162 $43 $297 Less: Preferred stock dividends — — 7 7 — — — — — — 7 7 Net income available to common stockholders B $95 $180 $38 $313 $92 $172 $18 $282 $92 $162 $36 $290 Return on average tangible common equity: Average common equity (GAAP) $5,460 $5,528 $8,472 $19,460 $5,275 $5,278 $9,092 $19,645 $5,190 $5,172 $9,448 $19,810 Less: Average goodwill (GAAP) — — 6,876 6,876 — — 6,876 6,876 — — 6,876 6,876 Average other intangibles (GAAP) — — — — — — 1 1 — — 1 1 Add: Average deferred tax liabilities related to goodwill (GAAP) — — 531 531 — — 523 523 — — 509 509 Average tangible common equity C $5,460 $5,528 $2,127 $13,115 $5,275 $5,278 $2,738 $13,291 $5,190 $5,172 $3,080 $13,442 Return on average tangible common equity B/C 7.06 % 13.18 % NM 9.68 % 6.97 % 12.94 % NM 8.43 % 7.04 % 12.50 % NM 8.58 % Return on average total tangible assets: Average total assets (GAAP) $58,660 $49,243 $40,883 $148,786 $58,066 $48,024 $41,225 $147,315 $56,689 $47,902 $39,808 $144,399 Less: Average goodwill (GAAP) — — 6,876 6,876 — — 6,876 6,876 — — 6,876 6,876 Average other intangibles (GAAP) — — — — — — 1 1 — — 1 1 Add: Average deferred tax liabilities related to goodwill (GAAP) — — 531 531 — — 523 523 — — 509 509 Average tangible assets D $58,660 $49,243 $34,538 $142,441 $58,066 $48,024 $34,871 $140,961 $56,689 $47,902 $33,440 $138,031 Return on average total tangible assets A/D 0.66 % 1.48 % NM 0.91 % 0.63 % 1.42 % NM 0.79 % 0.64 % 1.35 % NM 0.86 % Efficiency ratio: Noninterest expense (GAAP) E $647 $190 $17 $854 $649 $187 $11 $847 $650 $181 $36 $867 Net interest income (GAAP) 638 346 21 1,005 639 347 — 986 621 327 (3) 945 Noninterest income (GAAP) 220 134 25 379 227 122 28 377 229 123 83 435 Total revenue (GAAP) F $858 $480 $46 $1,384 $866 $469 $28 $1,363 $850 $450 $80 $1,380 Efficiency ratio E/F 75.41 % 39.80 % NM 61.68 % 74.90 % 39.83 % NM 62.18 % 76.46 % 40.21 % NM 62.88 % Consumer Commercial Other Consolidated Consumer Commercial Other Consolidated Net income available to common stockholders: Net income (loss) (GAAP) A $90 $164 ($11) $243 $71 $133 $19 $223 Less: Preferred stock dividends — — — — — — 7 7 Net income available to common stockholders B $90 $164 ($11) $243 $71 $133 $12 $216 Return on average tangible common equity: Average common equity (GAAP) $5,110 $5,040 $9,618 $19,768 $5,089 $4,790 $9,688 $19,567 Less: Average goodwill (GAAP) — — 6,876 6,876 — — 6,876 6,876 Average other intangibles (GAAP) — — 2 2 — — 3 3 Add: Average deferred tax liabilities related to goodwill (GAAP) — — 496 496 — — 481 481 Average tangible common equity C $5,110 $5,040 $3,236 $13,386 $5,089 $4,790 $3,290 $13,169 Return on average tangible common equity B/C 7.09 % 13.04 % NM 7.30 % 5.59 % 11.19 % NM 6.61 % Return on average total tangible assets: Average total assets (GAAP) $55,660 $47,388 $39,131 $142,179 $55,116 $45,304 $38,360 $138,780 Less: Average goodwill (GAAP) — — 6,876 6,876 — — 6,876 6,876 Average other intangibles (GAAP) — — 2 2 — — 3 3 Add: Average deferred tax liabilities related to goodwill (GAAP) — — 496 496 — — 481 481 Average tangible assets D $55,660 $47,388 $32,749 $135,797 $55,116 $45,304 $31,962 $132,382 Return on average total tangible assets A/D 0.65 % 1.39 % NM 0.72 % 0.52 % 1.18 % NM 0.68 % Efficiency ratio: Noninterest expense (GAAP) E $632 $186 $9 $827 $616 $187 $8 $811 Net interest income (GAAP) 602 314 7 923 581 300 23 904 Noninterest income (GAAP) 219 122 14 355 208 99 23 330 Total revenue (GAAP) F $821 $436 $21 $1,278 $789 $399 $46 $1,234 Efficiency ratio E/F 76.98 % 42.88 % NM 64.71 % 78.08 % 46.74 % NM 65.66 % 2017 2016 2016 THREE MONTHS ENDED MAR 31, THREE MONTHS ENDED DEC 31, THREE MONTHS ENDED SEPT 30, THREE MONTHS ENDED JUNE 30, THREE MONTHS ENDED MAR 31, 2016 2016 |
 Key performance metrics, Non-GAAP financial measures and reconciliations
39 $s in millions, except share, per share and ratio data 1Q17 4Q16 1Q16 $/bps % $/bps % Income before income tax expense (GAAP) A $434 $414 $332 $20 4.8 % $102 30.7 % Income tax expense and effective income tax rate, underlying: Income tax expense (GAAP) B $114 $132 $109 ($18) (13.6)% $5 4.6 % Less: Settlement of certain state tax matters (23) — — (23) (100.0) (23) (100.0) Income tax expense, underlying C $137 $132 $109 $5 3.8 % $28 25.7 % Effective income tax rate (GAAP) B/A 26.36 % 31.90 % 32.87 % (554) bps (651) bps Effective income tax rate, underlying C/A 31.56 31.90 32.87 (34) bps (131) bps Net income, underlying: Net income (GAAP) D $320 $282 $223 $38 13.5 % $97 43.5 % Less: Settlement of certain state tax matters 23 — — 23 100.0 23 100.0 Net income, underlying E $297 $282 $223 $15 5.3 % $74 33.2 % Net income available to common stockholders, underlying: Net income available to common stockholders (GAAP) F $313 $282 $216 $31 11.0 % $97 44.9 % Less: Settlement of certain state tax matters 23 — — 23 100.0 23 100.0 Net income available to common stockholders, underlying G $290 $282 $216 $8 2.8 % $74 34.3 % Return on average common equity and return on average common equity, underlying:
Average common equity (GAAP)
H $19,460 $19,645 $19,567 ($185) (0.9)% ($107) (0.5)% Return on average common equity F/H 6.52 % 5.70 % 4.45 % 82 bps 207 bps Return on average common equity, underlying G/H 6.05 5.70 4.45 35 bps 160 bps Average common equity (GAAP) H $19,460 $19,645 $19,567 ($185) (0.9)% ($107) (0.5)% Less: Average goodwill (GAAP) 6,876 6,876 6,876 — — — — Less: Average other intangibles (GAAP) — 1 3 (1) (100.0) (3) (100.0) Add: Average deferred tax liabilities related to goodwill (GAAP) 531 523 481 8 1.5 50 10.4 Average tangible common equity I $13,115 $13,291 $13,169 ($176) (1.3)% ($54) (0.4)% Return on average tangible common equity F/I 9.68 % 8.43 % 6.61 % 125 bps 307 bps Return on average tangible common equity, underlying G/I 8.98 8.43 6.61 55 bps 237 bps Return on average total assets and return on average total assets, underlying:
Average total assets (GAAP)
J $148,786 $147,315 $138,780 $1,471 1.0 % $10,006 7.2 % Return on average total assets D/J 0.87 % 0.76 % 0.65 % 11 bps 22 bps Return on average total assets, underlying E/J 0.81 0.76 0.65 5 bps 16 bps Return on average total tangible assets and return on average total tangible assets, underlying:
Average total assets (GAAP)
J $148,786 $147,315 $138,780 $1,471 1.0 % $10,006 7.2 % Less: Average goodwill (GAAP) 6,876 6,876 6,876 — — — — Less: Average other intangibles (GAAP) — 1 3 (1) (100.0) (3) (100.0) Add: Average deferred tax liabilities related to goodwill (GAAP) 531 523 481 8 1.5 50 10.4 Average tangible assets K $142,441 $140,961 $132,382 $1,480 1.0 % $10,059 7.6 % Return on average total tangible assets D/K 0.91 % 0.79 % 0.68 % 12 bps 23 bps Return on average total tangible assets, underlying E/K 0.85 0.79 0.68 6 bps 17 bps Net income per average common share - basic and diluted, underlying: Average common shares outstanding - basic (GAAP) L 509,451,450 512,015,920 528,070,648 (2,564,470) (0.5)% (18,619,198) (3.5)% Average common shares outstanding - diluted (GAAP) M 511,348,200 513,897,085 530,446,188 (2,548,885) (0.5) (19,097,988) (3.6) Net income available to common stockholders (GAAP) F $313 $282 $216 $31 11.0 $97 44.9 Net income per average common share - basic (GAAP) F/L 0.61 0.55 0.41 0.06 10.9 0.20 48.8 Net income per average common share - diluted (GAAP) F/M 0.61 0.55 0.41 0.06 10.9 0.20 48.8 Net income available to common stockholders, underlying G 290 282 216 8 2.8 74 34.3 Net income per average common share - basic, underlying G/L 0.57 0.55 0.41 0.02 3.6 0.16 39.0 Net income per average common share - diluted, underlying G/M 0.57 0.55 0.41 0.02 3.6 0.16 39.0 QUARTERLY TRENDS 1Q17 Change 4Q16 1Q16 Return on average tangible common equity and return on average tangible common equity, underlying: |
 Key performance metrics, Non-GAAP financial measures and reconciliations
40 $s in millions, except share, per share and ratio data MAR. 31, DEC. 31, SEP. 30, JUNE 30, MAR. 31, DEC. 31, SEP. 30, JUNE 30, MAR. 31, DEC. 31, SEP. 30, JUNE 30, MAR. 31, DEC. 31, SEP. 30, 2017 2016 2016 2016 2016 2015 2015 2015 2015 2014 2014 2014 2014 2013 2013 Total revenue, adjusted: Total revenue (GAAP) A $1,384 $1,363 $1,380 $1,278 $1,234 $1,232 $1,209 $1,200 $1,183 $1,179 $1,161 $1,473 $1,166 $1,158 $1,153 Less: Special items — — — — — — — — — — — 288 — — — Less: Notable items — — 67 — — — — — — — — — — — — Total revenues, adjusted (non-GAAP) B $1,384 $1,363 $1,313 $1,278 $1,234 $1,232 $1,209 $1,200 $1,183 $1,179 $1,161 $1,185 $1,166 $1,158 $1,153 Noninterest expense, adjusted: Noninterest expense (GAAP) C $854 $847 $867 $827 $811 $810 $798 $841 $810 $824 $810 $948 $810 $818 $788 Less: Restructuring charges and special items — — — — — — — 40 10 33 21 115 — 26 — Less: Notable items — — 36 — — — — — — — — — — — — Noninterest expense, adjusted (non-GAAP) D $854 $847 $831 $827 $811 $810 $798 $801 $800 $791 $789 $833 $810 $792 $788 Efficiency ratio and efficiency ratio, adjusted: Efficiency ratio C/A 62 % 62 % 63 % 65 % 66 % 66 % 66 % 70 % 68 % 70 % 70 % 64 % 69 % 71 % 68 % Efficiency ratio, adjusted (non-GAAP) D/B 62 Add: Notable items, net of income tax expense (benefit) 62 63 65 66 66 66 67 68 67 68 70 69 68 68 Net income, adjusted: Net income (GAAP) E $320 $282 $297 $243 $223 $221 $220 $190 $209 $197 $189 $313 $166 $152 $144 Add: Restructuring charges and special items, net of income tax expense (benefit)
—
—
—
—
—
—
—
25 6 20 13 (108) — 17 — Add: Notable items, net of income tax expense (benefit) — — (19) — — — — — — — — — — — — Net income, adjusted (non-GAAP) F $320 $282 $278 $243 $223 $221 $220 $215 $215 $217 $202 $205 $166 $169 $144 Net income per average common share - diluted, and net income per average common share - diluted, adjusted Net income available to common stockholders (GAAP) G $313 $282 $290 $243 $216 $221 $213 $190 $209 $197 $189 $313 $166 $152 $144 Add: Restructuring charges and special items, net of income tax expense (benefit)
—
—
—
—
—
—
—
25 6 20 13 (108) — 17 — — — (19) — — — — — — — — — — — — Net income available to common stockholders, adjusted (non-GAAP)
H $313 $282 $271 $243 $216 $221 $213 $215 $215 $217 $202 $205 $166 $169 $144 Average common shares outstanding - diluted (GAAP) P 511,348,200 513,897,085 521,122,466 530,365,203 530,446,188 530,275,673 533,398,158 539,909,366 549,798,717 550,676,298 560,243,747 559,998,324 559,998,324 559,998,324 559,998,324 Net income per average common share - diluted G/P $0.61 $0.55 $0.56 $0.46 $0.41 $0.42 $0.40 $0.35 $0.38 $0.36 $0.34 $0.56 $0.30 $0.27 $0.26 Net income per average common share - diluted, adjusted (non-GAAP) H/P 0.61 0.55 0.52 0.46 0.41 0.42 0.40 0.40 0.39 0.39 0.36 0.37 0.30 0.30 0.26 Return on average tangible common equity and return on average tangible common equity, adjusted:
Average common equity (GAAP) $19,460 $19,645 $19,810 $19,768 $19,567 $19,359 $19,261 $19,391 $19,407 $19,209 $19,411 $19,607 $19,370 $19,364 $19,627 Less: Average goodwill (GAAP) 6,876 6,876 6,876 6,876 6,876 6,876 6,876 6,876 6,876 6,876 6,876 6,876 6,876 6,876 6,876 Less: Average other intangibles (GAAP) — 1 1 2 3 3 4 5 5 6 6 7 7 8 9 Add: Average deferred tax liabilities related to goodwill (GAAP) 531 523 509 496 481 468 453 437 422 403 384 369 351 342 325 Average tangible common equity J $13,115 $13,291 $13,442 $13,386 $13,169 $12,948 $12,834 $12,947 $12,948 $12,730 $12,913 $13,093 $12,838 $12,822 $13,067 Return on average tangible common equity G/J 9.68 % 8.43 % 8.58 % 7.30 % 6.61 % 6.75 % 6.60 % 5.90 % 6.53 % 6.12 % 5.81 % 9.59 % 5.24 % 4.71 % 4.34 % Return on average tangible common equity, adjusted (non-GAAP)
H/J 9.68 8.43 8.02 7.30 6.61 6.75 6.60 6.67 6.73 6.76 6.22 6.28 5.24 5.24 4.34 Return on average total tangible assets and return on average total tangible assets, adjusted:
Average total assets (GAAP)
K $148,786 $147,315 $144,399 $142,179 $138,780 $136,298 $135,103 $135,521 $133,325 $130,671 $128,691 $127,148 $123,904 $120,393 $117,386 Less: Average goodwill (GAAP) 6,876 6,876 6,876 6,876 6,876 6,876 6,876 6,876 6,876 6,876 6,876 6,876 6,876 6,876 6,876 Less: Average other intangibles (GAAP) — 1 1 2 3 3 4 5 5 6 6 7 7 8 9 Add: Average deferred tax liabilities related to goodwill (GAAP) 531 523 509 496 481 468 453 437 422 403 384 369 351 342 325 Average tangible assets L $142,441 $140,961 $138,031 $135,797 $132,382 $129,887 $128,676 $129,077 $126,866 $124,192 $122,193 $120,634 $117,372 $113,851 $110,826 Return on average total tangible assets E/L 0.91 % 0.79 % 0.86 % 0.72 % 0.68 % 0.67 % 0.68 % 0.59 % 0.67 % 0.63 % 0.61 % 1.04 % 0.57 % 0.53 % 0.52 % Return on average total tangible assets, adjusted (non-GAAP) F/L 0.91 0.79 0.80 0.72 0.68 0.67 0.68 0.67 0.69 0.69 0.66 0.68 0.57 0.59 0.52 FOR THE THREE MONTHS ENDED |
 41 |