Attached files
| file | filename |
|---|---|
| 8-K - FORM 8-K - HomeStreet, Inc. | a8-kproxyresults.htm |

Annual Meeting of
Shareholders
Seattle, WA
May 25, 2017
NASDAQ:HMST

Welcome
• Introductory Remarks
• Notice
• Appointment of Inspector of Election &
confirmation of quorum
• Description of proposals
• Proceed to voting
• Report on 2016
• Results of voting
• Adjournment
2

Proposals
I. To elect three (3) Class III directors to serve until the 2020 annual meeting of
shareholders, or until their successors are elected, and qualified
• David A. Ederer
• Thomas E. King
• George “Judd” Kirk
II. To ratify on an advisory basis (non-binding) the appointment of Deloitte &
Touche LLP as the Company’s independent registered public accounting firm for
the fiscal year ending December 31, 2017
III. To approve an amendment to the 2014 Equity Incentive Plan to increase the
number of shares available for issuance by 975,000 shares and approve certain
additional performance measures for purposes of Section 280G of the Internal
Revenue Code
IV. To transact such other business that may properly come before the Annual
Meeting or any adjournment or postponement thereto
Preliminary results will be announced following the vote
3

Presentation by Mark K. Mason
Chairman, President, & CEO
HomeStreet, Inc.
4
Report on 2015
Important Disclosures
Forward-Looking Statements
This presentation includes forward-looking statements, as that term is defined for purposes of applicable securities laws, about our industry, our future financial performance, and our business
plans and expectations. These statements are, in essence, attempts to anticipate or forecast future events, and thus subject to many risks and uncertainties. These forward-looking statements
are based on our management's current expectations, beliefs, projections, future plans and strategies, anticipated events or trends, and similar expressions concerning matters that are not
historical facts, as well as a number of assumptions concerning future events. Forward-looking statements in this release include, among other matters, statements regarding our business plans
and strategies (including our expansion strategies) and the expected effects of those initiatives, general economic trends (particularly those that affect mortgage origination and refinance
activity) and growth scenarios and performance targets. Readers should note, however, that all statements in this presentation other than assertions of historical fact are forward-looking in
nature. These statements are subject to risks, uncertainties, assumptions and other important factors set forth in our SEC filings, including but not limited to our Annual Report on Form 10-K for
the year ended December 31, 2016 and our quarterly report on Form 10-Q for the quarter ended March 31, 2107, which we filed on May 5, 2017. Many of these factors and events that affect
the volatility in our stock price and shareholders’ response to those events and factors are beyond our control. Such factors could cause actual results to differ materially from the results
discussed or implied in the forward-looking statements. These limitations and risks include without limitation changes in general political and economic conditions that impact our markets and
our business, actions by the Federal Reserve Board and financial market conditions that affect monetary and fiscal policy, regulatory and legislative findings or actions that may increase capital
requirements or otherwise constrain our ability to do business, including restrictions that could be imposed by our regulators on certain aspects of our operations or on our growth initiatives and
acquisition activities, risks related to our ability to realize the expected value of our recent acquisitions, continue to expand our banking operations geographically and across market sectors,
grow our franchise and capitalize on market opportunities, manage our growth efforts cost-effectively and attain the desired operational and financial outcomes, manage the losses inherent in
our loan portfolio, and make accurate estimates of the value of our non-cash assets and liabilities, maintain electronic and physical security of customer data, respond to restrictive and complex
regulatory environment, and attract and retain key personnel. In addition, the ratio of loan lock to closed loan volume may fluctuate due to challenges our customers may face in meeting current
underwriting standards, a change in interest rates, an increase in competition for such loans, changes in general economic conditions, including housing prices and inventory levels, the job
market, consumer confidence and spending habits either nationally or in the regional and local market areas in which the Company does business, and legislative or regulatory actions or reform
that may affect our business or the banking or mortgage industries more generally. Actual results may fall materially short of our expectations and projections, and we may change our plans or
take additional actions that differ in material ways from our current intentions. Accordingly, we can give no assurance of future performance, and you should not rely unduly on forward-looking
statements. All forward-looking statements are based on information available to the Company as of the date hereof, and we do not undertake to update or revise any forward-looking
statements, for any reason.
Basis of Presentation of Financial Data
Unless noted otherwise in this presentation, all reported financial data is being presented as of the period ending March 31, 2017, and is unaudited, although certain information related to the
year ended December 31, 2016, has been derived from our audited financial statements. All financial data should be read in conjunction with the notes in our consolidated financial statements.
Non-GAAP Financial Measures
Information on any non-GAAP financial measures such as core measures or tangible measures referenced in this presentation, including a reconciliation of those measures to GAAP measures,
may also be found in the appendix, our SEC filings, and in the earnings release available on our web site.
5

Growing Western U.S. Franchise
• Seattle-based diversified
commercial bank -
company founded in
1921
• Growing commercial &
consumer bank with
concentrations in major
metropolitan areas of the
West Coast and Hawaii
• Leading West Coast
mortgage lender
• 111 primary offices (1) in
the Western United
States and Hawaii
• Total assets $6.4 billion
6
(1) The number of offices listed above does not include satellite offices with a limited number of staff who report to a manager located
in a separate primary office.

2016 Growth Activity
Organic Growth Activity
• Orange County Business Bank
• Branches and related assets and liabilities from The Bank of Oswego
• Two branches from Boston Private Bank & Trust
• Total asset growth – 27%
• Total loans held for investment – 19%
• Commercial real estate and commercial loans – 36%
• Total deposit growth – 37%
• Noninterest bearing checking account growth – 45%
• Total transaction and savings account growth – 31%
• Total business deposit growth – 51%
• Hired California commercial lending market president
• Bay Area market president
• San Diego & Orange Counties market president
• De-Novo openings
• 6 retail deposit branches
• 3 primary home loan centers
• 1 primary commercial lending center
• Opened Bay Area commercial lending center in San Jose, CA – Branch to follow
• Opened 15th California retail deposit branch in Baldwin Park
Strategic Growth Activity
Recent Developments
7

Strategy
Optimize Single Family
Mortgage Banking &
Servicing Segment
• Organic growth opportunities
• Focused on increased Commercial Lending
• Increase density of commercial and consumer deposits via existing market penetration and de-novo branch expansion
• Growth via acquisition of smaller institutions and branches, focus on Washington, Oregon,
and California
• Optimize investments in mortgage banking personnel, offices, and technology
• Focus on full utilization of mortgage banking capacity and geographic footprint
• Drive operating leverage through disciplined expense control
• Target consolidated efficiency ratio of less than 70%
• Commercial and Consumer segment <65% and Mortgage Banking segment <80%
• Target long-term 15%+ ROTE
Expand Commercial &
Consumer Banking
Segment
Disciplined expense
management
Efficient use of capital
Grow and diversify earnings with the goal of becoming a leading West Coast
regional bank
8

Results of Operations
For the three months ended
(1) Includes eleven months of OCBB’s results of operations.
(2) Includes ten months of Simplicity’s results of operations.
(3) Includes two months of OCBB’s results of operations.
(4) Excludes pre-tax acquisition-related expenses and bargain purchase gain. See appendix for reconciliation of non-GAAP financial measures.
For the nine months ended
9
($ in thousands) Dec. 30, 2016
(1)
Dec. 30, 2015
(2) Mar. 31, 2017 Dec. 31, 2016 Mar. 31, 2016
(3)
Net interest income $ 180,049 $ 148,338 $ 45,651 $ 48,074 $ 40,691
Provision for loan losses 4,100 6,100 - 350 1,400
Noninterest income 359,150 281,237 74,461 73,221 71,708
Noninterest expense 444,322 366,568 106,874 117,539 101,353
Net income before taxes 90,777 56,907 13,238 3,406 9,646
Income taxes 32,626 15,588 4,255 1,112 3,239
Net income $ 58,151 $ 41,319 $ 8,983 $ 2,294 $ 6,407
Diluted EPS $ 2.34 $ 1.96 $ 0.33 $ 0.09 $ 0.27
Core net income
(4) $ 62,789 $ 44,337 $ 8,983 $ 2,555 $ 9,785
Core EPS
(4) $ 2.53 $ 2.11 $ 0.33 $ 0.10 $ 0.41
Core ROAA (4) 1.09% 0.97% 0.57% 0.16% 0.78%
Core ROAE (4) 11.09% 10.03% 5.53% 1.67% 7.66%
Core ROATE (4) 11.68% 10.50% 5.81% 1.74% 8.08%
Net Interest Margin 3.45% 3.63% 3.23% 3.42% 3.55%
Core efficiency ratio (4) 81.1% 83.0% 89.0% 96.6% 85.6%
For the year ended For the three months ended

Diversification
Growth in our Commercial & Consumer Banking Segment is diversifying earnings,
and reducing earnings volatility
10
(1) Excludes acquisition-related expenses. See appendix for reconciliation of non-GAAP financial measures.
$8.9
$16.7
$21.0
$35.4
$39.8
33%
69%
47%
56%
64%
0%
10%
20%
30%
40%
50%
60%
70%
80%
$-
$10
$20
$30
$40
$50
$60
2013 2014 2015 2016 3/31/2017
LTM
$ in millions
C&CB Core Net Income (1) C&CB % of Total Core Net Income (1)

Segment Overview
Commercial & Consumer Banking
• Regional Single Family mortgage
origination and servicing platform
• 100% direct retail origination
• Majority of production sold into secondary
market
• Fannie Mae, Freddie Mac, FHA, VA lender
since programs’ inceptions
• Portfolio products: jumbo, HELOC and
custom home construction
• Servicing retained on majority of originated
loans sold to secondary markets
Mortgage Banking
Overview
• Commercial Banking
Commercial lending, including SBA
All CRE property types with multifamily focus
FNMA DUS lender / servicer
Residential and commercial construction
Commercial deposit, treasury and cash
management services
• Consumer Banking
Consumer loan and deposit products
Consumer investment, insurance and private
banking products and services
11
Commercial & Consumer Banking Segment
12
(1) Includes eleven month of OCBB’s results of operations.
(2) Includes ten months of Simplicity’s results of operations.
(3) Includes two months of OCBB’s results of operations.
(4) Excludes pre-tax acquisition-related expenses and bargain purchase gain. See appendix for reconciliation of non-GAAP financial
measures.
($ in thousands)
Dec. 30,
2016
(1)
Dec. 30,
2015
(2)
Mar. 31,
2017
Dec. 31,
2016
Mar. 31,
2016
(3)
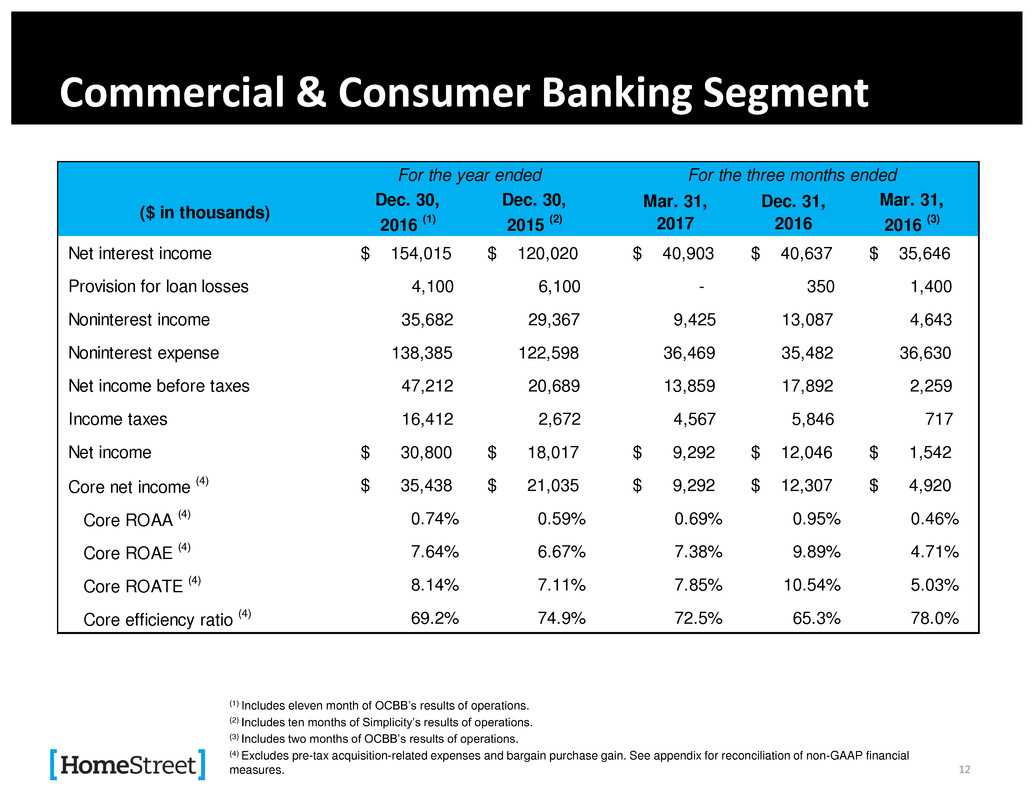
Net interest income $ 154,015 $ 120,020 $ 40,903 $ 40,637 $ 35,646
Provision for loan losses 4,100 6,100 - 350 1,400
Noninterest income 35,682 29,367 9,425 13,087 4,643
Noninterest expense 138,385 122,598 36,469 35,482 36,630
Net income before taxes 47,212 20,689 13,859 17,892 2,259
Income taxes 16,412 2,672 4,567 5,846 717
Net income $ 30,800 $ 18,017 $ 9,292 $ 12,046 $ 1,542
Core net income
(4) $ 35,438 $ 21,035 $ 9,292 $ 12,307 $ 4,920
Core ROAA
(4) 0.74% 0.59% 0.69% 0.95% 0.46%
Core ROAE
(4) 7.64% 6.67% 7.38% 9.89% 4.71%
Core ROATE
(4) 8.14% 7.11% 7.85% 10.54% 5.03%
Core efficiency ratio
(4) 69.2% 74.9% 72.5% 65.3% 78.0%
For the year ended For the three months ended

Mortgage Banking Segment
13
($ in thousands)
Dec. 31,
2016
Dec. 31,
2015
Mar. 31,
2017
Dec. 31,
2016
Mar. 31,
2016
Net interest income $ 26,034 $ 28,318 $ 4,747 $ 7,437 $ 5,045
Noninterest income 323,468 251,870 65,036 60,134 67,065
Noninterest expense 305,937 243,970 70,404 82,057 64,723
Net income before taxes 43,565 36,218 (621) (14,486) 7,387
Income taxes 16,214 12,916 (312) (4,734) 2,522
Net income $ 27,351 $ 23,302 $ (309) $ (9,752) $ 4,865
ROAA 2.79% 2.36% (0.14)% (3.55)% 2.50%
ROAE / ROATE 26.78% 18.81% (0.90)% (31.91)% 21.74%
Efficiency Ratio 87.5% 87.1% 100.9% 121.4% 89.8%
For the year ended For the three months ended
-20%
0%
20%
40%
60%
80%
100%
120%
140%
160%
180%
200%
2/10/2012 8/10/2012 2/10/2013 8/10/2013 2/10/2014 8/10/2014 2/10/2015 8/10/2015 2/10/2016 8/10/2016 2/10/2017
HMST KBW Nasdaq Regional Bank
Historical Stock Price Since IPO
14
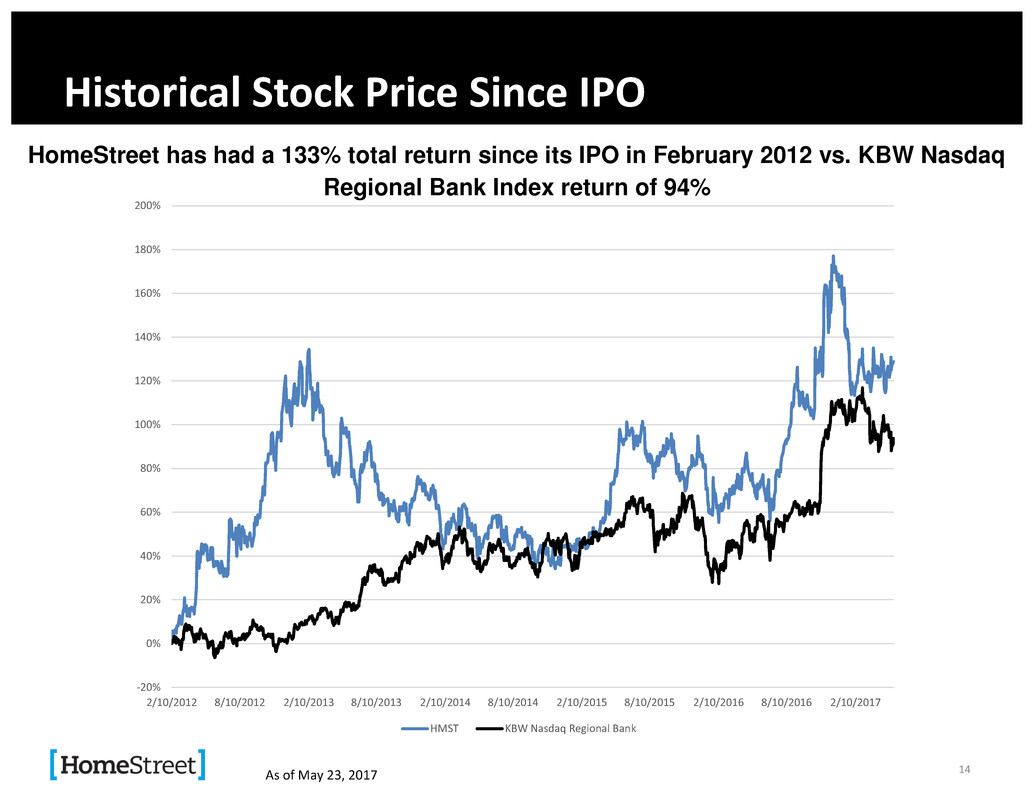
HomeStreet has had a 133% total return since its IPO in February 2012 vs. KBW Nasdaq
Regional Bank Index return of 94%
As of May 23, 2017
Outlook
15
Revenue Growth Outpacing Expense Growth, Driving Operating Efficiencies and Strong Returns
• Locations in the high-growth markets of the Western United States and Hawaii
• Above average loan growth while containing credit risk
• Invest in de-novo branch openings to grow core, relationship-based deposits
• Optimizing existing investment in Mortgage Banking segment
• Augment organic growth with acquisitions in our target markets
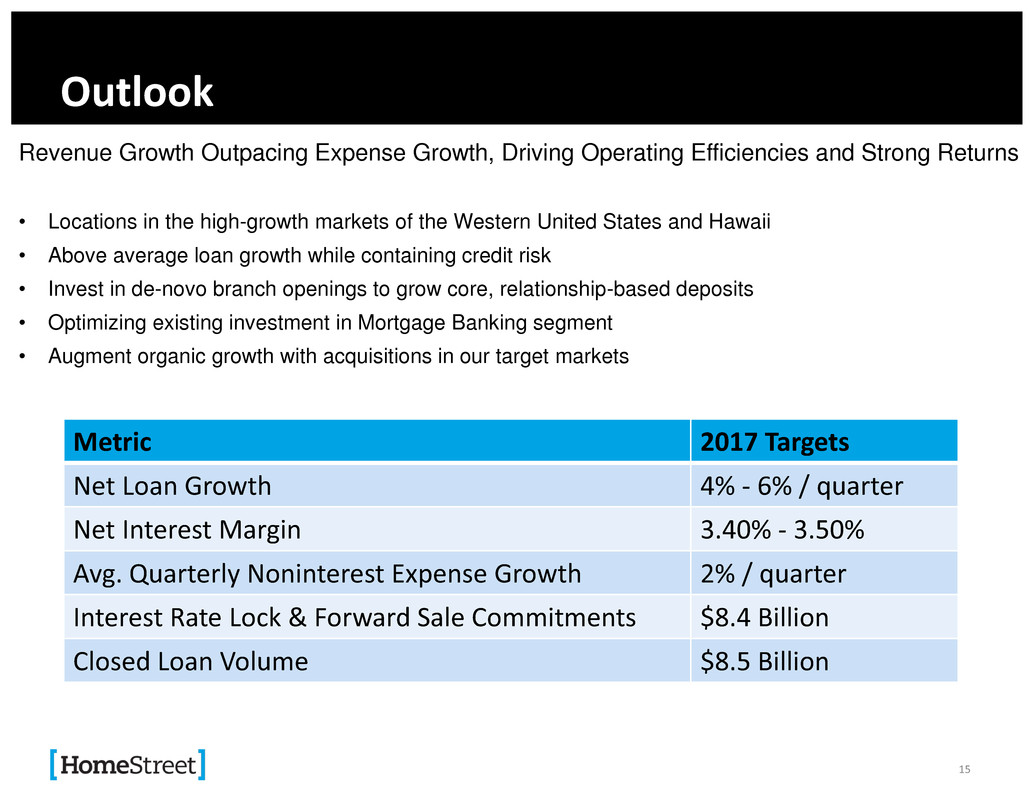
Metric 2017 Targets
Net Loan Growth 4% - 6% / quarter
Net Interest Margin 3.40% - 3.50%
Avg. Quarterly Noninterest Expense Growth 2% / quarter
Interest Rate Lock & Forward Sale Commitments $8.4 Billion
Closed Loan Volume $8.5 Billion

.
Questions?
16

Results of Votes
17
Final Tally of Vote (if available)

.
Thank you for attending
18
HomeStreet, Inc.
NASDAQ:HMST
http://ir.homestreet.com
(Electronic copies of this presentation available upon request)

.
Appendix
19

Non-GAAP Financial Measures
Tangible Book Value:
20
Dec. 31, Dec. 31, Mar. 31, Dec. 31, Mar. 31,
(dollars in thousands, except share data) 2016 2015 2017 2016 2016
Shareholders' equity $629,284 $465,275 $640,919 $629,284 $529,132
Less: Goodwill and other intangibles (30,789) (20,266) (30,275) (30,789) (29,126)
Tangible shareholders' equity $598,495 $445,009 $610,644 $598,495 $500,006
Common shares outstanding 26,800,183 22,076,534 26,862,744 26,800,183 24,550,219
Book value per share $23.48 $21.08 $23.86 $23.48 $21.55
Impact of goodwill and other intangibles (1.15) (0.92) (1.13) (1.15) (1.18)
Tangible book value per share $22.33 $20.16 $22.73 $22.33 $20.37
Average hareholders' equity $566,148 $442,105 $649,439 $616,497 $510,883
Less: Average goodwill and other intangibles (28,580) (19,668) (30,611) (29,943) (26,645)
Average tangible shareholders' equity $537,568 $422,437 $618,828 $586,554 $484,238
Return on average shareholders’ equity 10.27% 9.35% 5.53% 1.49% 5.02%
Impact of goodwill and other intangibles 0.55% 0.43% 0.28% 0.07% 0.27%
Return on average tangible shareholders' equity 10.82% 9.78% 5.81% 1.56% 5.29%
Three Months EndedYear Ended
Non-GAAP Financial Measures
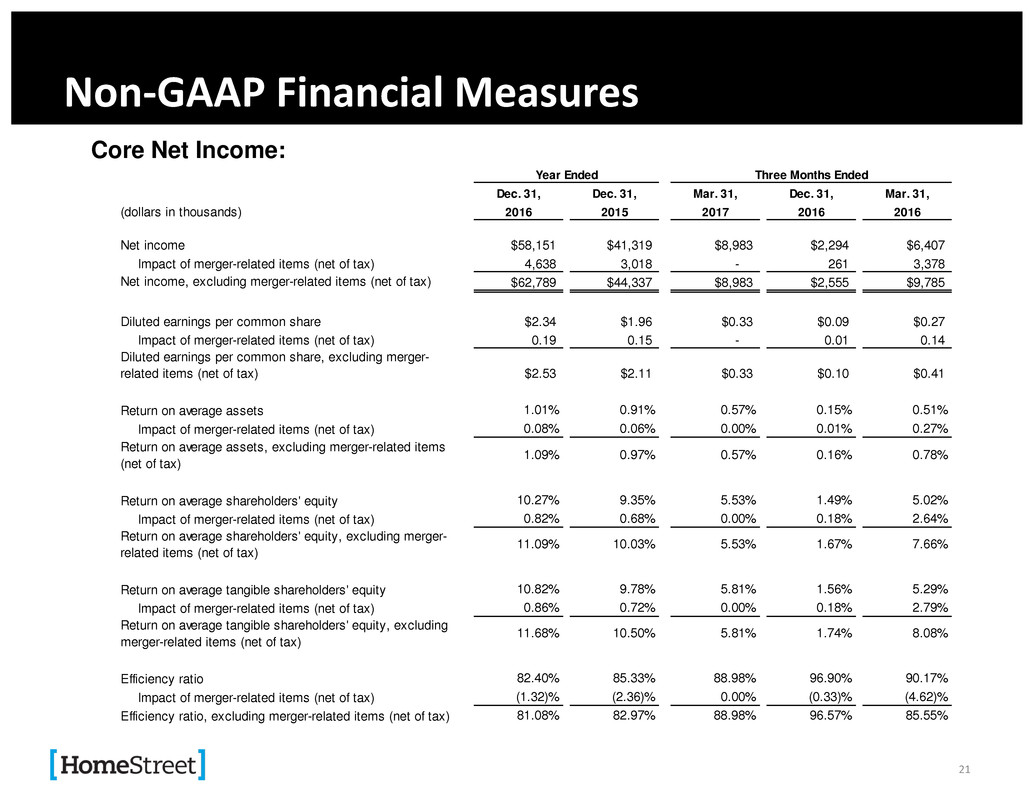
Core Net Income:
21
Dec. 31, Dec. 31, Mar. 31, Dec. 31, Mar. 31,
(dollars in thousands) 2016 2015 2017 2016 2016
Net income $58,151 $41,319 $8,983 $2,294 $6,407
Impact of merger-related items (net of tax) 4,638 3,018 - 261 3,378
Net income, excluding merger-related items (net of tax) $62,789 $44,337 $8,983 $2,555 $9,785
Diluted earnings per common share $2.34 $1.96 $0.33 $0.09 $0.27
Impact of merger-related items (net of tax) 0.19 0.15 - 0.01 0.14
Diluted earnings per common share, excluding merger-
related items (net of tax) $2.53 $2.11 $0.33 $0.10 $0.41
Return on average assets 1.01% 0.91% 0.57% 0.15% 0.51%
Impact of merger-related items (net of tax) 0.08% 0.06% 0.00% 0.01% 0.27%
Return on average assets, excluding merger-related items
(net of tax)
1.09% 0.97% 0.57% 0.16% 0.78%
Return on average shareholders' equity 10.27% 9.35% 5.53% 1.49% 5.02%
Impact of merger-related items (net of tax) 0.82% 0.68% 0.00% 0.18% 2.64%
Return on average shareholders' equity, excluding merger-
related items (net of tax)
11.09% 10.03% 5.53% 1.67% 7.66%
Return on average tangible shareholders' equity 10.82% 9.78% 5.81% 1.56% 5.29%
Impact of merger-related items (net of tax) 0.86% 0.72% 0.00% 0.18% 2.79%
Return on average tangible shareholders' equity, excluding
merger-related items (net of tax)
11.68% 10.50% 5.81% 1.74% 8.08%
Efficiency ratio 82.40% 85.33% 88.98% 96.90% 90.17%
Impact of merger-related items (net of tax) (1.32)% (2.36)% 0.00% (0.33)% (4.62)%
Efficiency ratio, excluding merger-related items (net of tax) 81.08% 82.97% 88.98% 96.57% 85.55%
Three Months EndedYear Ended
Non-GAAP Financial Measures
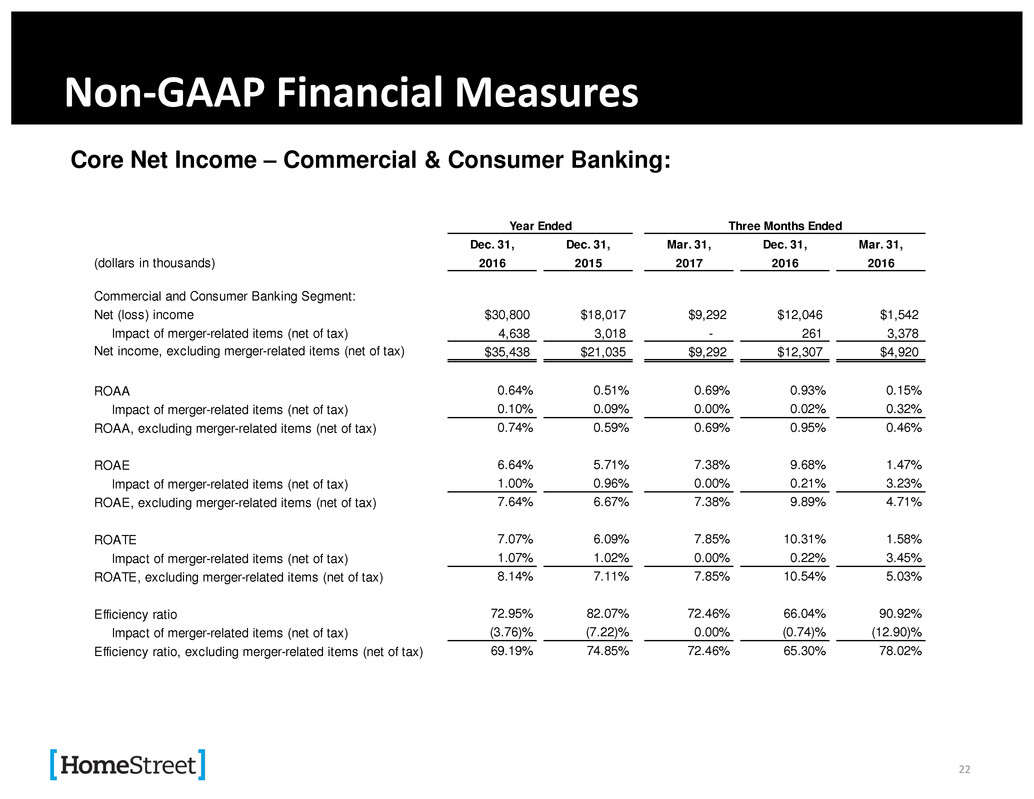
Core Net Income – Commercial & Consumer Banking:
22
Dec. 31, Dec. 31, Mar. 31, Dec. 31, Mar. 31,
(dollars in thousands) 2016 2015 2017 2016 2016
Commercial and Consumer Banking Segment:
Net (loss) income $30,800 $18,017 $9,292 $12,046 $1,542
Impact of merger-related items (net of tax) 4,638 3,018 - 261 3,378
Net income, excluding merger-related items (net of tax) $35,438 $21,035 $9,292 $12,307 $4,920
ROAA 0.64% 0.51% 0.69% 0.93% 0.15%
Impact of merger-related items (net of tax) 0.10% 0.09% 0.00% 0.02% 0.32%
ROAA, excluding merger-related items (net of tax) 0.74% 0.59% 0.69% 0.95% 0.46%
ROAE 6.64% 5.71% 7.38% 9.68% 1.47%
Impact of merger-related items (net of tax) 1.00% 0.96% 0.00% 0.21% 3.23%
ROAE, excluding merger-related items (net of tax) 7.64% 6.67% 7.38% 9.89% 4.71%
ROATE 7.07% 6.09% 7.85% 10.31% 1.58%
Impact of merger-related items (net of tax) 1.07% 1.02% 0.00% 0.22% 3.45%
ROATE, excluding merger-related items (net of tax) 8.14% 7.11% 7.85% 10.54% 5.03%
Efficiency ratio 72.95% 82.07% 72.46% 66.04% 90.92%
Impact of merger-related items (net of tax) (3.76)% (7.22)% 0.00% (0.74)% (12.90)%
Efficiency ratio, excluding merger-related items (net of tax) 69.19% 74.85% 72.46% 65.30% 78.02%
Three Months EndedYear Ended
