Attached files
| file | filename |
|---|---|
| EX-99.1 - EXHIBIT 99.1 - Medtronic plc | exhibit991-fy17q4earningsr.htm |
| 8-K - 8-K - Medtronic plc | fy17q4earningsrelease.htm |

MEDTRONIC PLC
Q4 FY17
EARNINGS PRESENTATION
MAY 25, 2017
• FY17 FINANCIAL HIGHLIGHTS
• Q4 FY17 CONSOLIDATED RESULTS &
GROUP REVENUE HIGHLIGHTS
• REVENUE / EPS GUIDANCE & OTHER
ASSUMPTIONS
Exhibit 99.2
Q4 FY17 Earnings Results | May 25, 2017 | 2
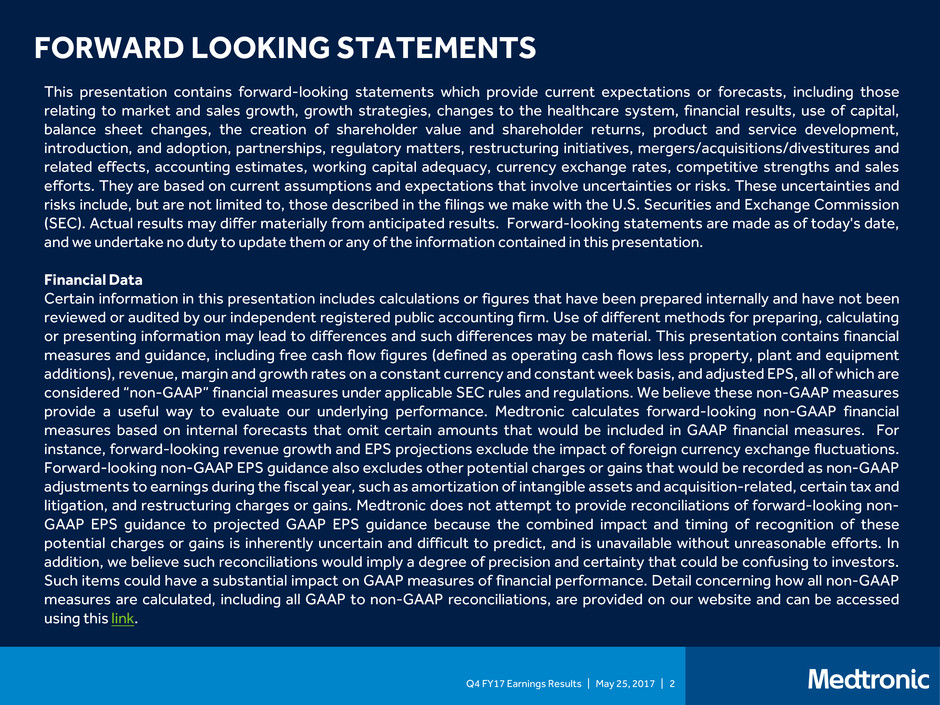
FORWARD LOOKING STATEMENTS
This presentation contains forward-looking statements which provide current expectations or forecasts, including those
relating to market and sales growth, growth strategies, changes to the healthcare system, financial results, use of capital,
balance sheet changes, the creation of shareholder value and shareholder returns, product and service development,
introduction, and adoption, partnerships, regulatory matters, restructuring initiatives, mergers/acquisitions/divestitures and
related effects, accounting estimates, working capital adequacy, currency exchange rates, competitive strengths and sales
efforts. They are based on current assumptions and expectations that involve uncertainties or risks. These uncertainties and
risks include, but are not limited to, those described in the filings we make with the U.S. Securities and Exchange Commission
(SEC). Actual results may differ materially from anticipated results. Forward-looking statements are made as of today's date,
and we undertake no duty to update them or any of the information contained in this presentation.
Financial Data
Certain information in this presentation includes calculations or figures that have been prepared internally and have not been
reviewed or audited by our independent registered public accounting firm. Use of different methods for preparing, calculating
or presenting information may lead to differences and such differences may be material. This presentation contains financial
measures and guidance, including free cash flow figures (defined as operating cash flows less property, plant and equipment
additions), revenue, margin and growth rates on a constant currency and constant week basis, and adjusted EPS, all of which are
considered “non-GAAP” financial measures under applicable SEC rules and regulations. We believe these non-GAAP measures
provide a useful way to evaluate our underlying performance. Medtronic calculates forward-looking non-GAAP financial
measures based on internal forecasts that omit certain amounts that would be included in GAAP financial measures. For
instance, forward-looking revenue growth and EPS projections exclude the impact of foreign currency exchange fluctuations.
Forward-looking non-GAAP EPS guidance also excludes other potential charges or gains that would be recorded as non-GAAP
adjustments to earnings during the fiscal year, such as amortization of intangible assets and acquisition-related, certain tax and
litigation, and restructuring charges or gains. Medtronic does not attempt to provide reconciliations of forward-looking non-
GAAP EPS guidance to projected GAAP EPS guidance because the combined impact and timing of recognition of these
potential charges or gains is inherently uncertain and difficult to predict, and is unavailable without unreasonable efforts. In
addition, we believe such reconciliations would imply a degree of precision and certainty that could be confusing to investors.
Such items could have a substantial impact on GAAP measures of financial performance. Detail concerning how all non-GAAP
measures are calculated, including all GAAP to non-GAAP reconciliations, are provided on our website and can be accessed
using this link.

Q4 FY17 Earnings Results | May 25, 2017 | 3
Executed steady cadence of meaningful product launches,
expanded our global footprint, and extended our leadership in
value-based healthcare offerings
• Mid-Single Digit Organic Growth2: ~4%
• Acquisitions contributed ~100 – 110 bps
• Foreign currency had a negative ~10 – 20 bps impact
• New product launches driving growth:
• Evolut® R 34mm, LigaSure™ instruments, Signia™ powered stapler, Solera®
Voyager®, and MiniMed® 6 series
• Double-digit Emerging Market revenue growth2
Solid operating margin improvement; double-digit EPS2 growth
• EPS: ~11 - 12%2 growth; EPS leverage ~650 bps2
• Operating Margin: ~100 bps improvement Y/Y2; ~140bps improvement Y/Y
on organic basis2; Operating leverage ~400 bps2
• Covidien synergies: on track for a minimum of $850M in cost savings by FY18
• Delivered more than $600M in synergy savings to-date through FY17
Outlook: Reiterate long-term expectation of mid-single digit
revenue growth and double-digit EPS growth2
• FY18 Revenue1 growth: 4 – 5%
• FY18 EPS1 growth: 9 – 10%
Balanced return to shareholders with disciplined reinvestment
• FY17: 86% Payout Ratio4; $2,376M in dividends and $3,116M in net share
repurchases
• Closed five tuck-in acquisitions and several strategic investments, totaling
approximately $1.5B
• Announced strategic sale of a portion of our PMR division to Cardinal Health
MDT
FY17 HIGHLIGHTS
1 Figures represent comparison to prior year on a constant currency basis (non-GAAP).
2 Figures represent comparison to prior year on a constant currency, constant week basis (non-GAAP).
3 Operating cash flows less property, plant and equipment additions (non-GAAP)
4 Dividends plus net share repurchases divided by adjusted net income (non-GAAP)
SOLID YEAR OVERALL; FIFTH CONSECTUTIVE YEAR
OF MID-SINGLE DIGIT REVENUE GROWTH
Revenue:
Other Financial Highlights:
U.S.
56%
Non-
U.S.
Dev
31%
EM
13%
1
Diluted
EPS
Y/Y
CC1
Y/Y%
CCCW2
Y/Y %
GAAP $2.89 17% NC NC
Non-GAAP $4.60 5% 9% ~11 - 12%
Cash Flow
from Ops $6.9B
Free Cash
Flow3 $5.6B
CVG
35%
MITG
33%
RTG
25%
DIAB
7%
Revenue
$M
As Rep
Y/Y %
CC1
Y/Y %
CCCW2
Y/Y %
CVG 10,498 3 3 MSD
MITG 9,919 4 4 MSD
RTG 7,366 2 2 MSD
Diabetes 1,927 3 4 MSD
Total $29,710 3% 3% ~5%
U.S. 16,663 1 1 LSD
Non-U.S. Dev 9,085 4 4 MSD
EM 3,962 7 9 DD
Total $29,710 3% 3% ~5%

Q4 FY17 Earnings Results | May 25, 2017 | 4
MDT
FY17 GAAP SELECT FINANCIAL INFORMATION
FY17
FY16
Y/Y Growth /
Y/Y Change
Net Sales ($M) 29,710 28,833 3%
Cost of Products Sold 9,291 9,142 2%
Gross Margin 68.7% 68.3% 40 bps
SG&A ($M) 9,711 9,469 3%
% of Sales 32.7% 32.8% 10 bps
R&D ($M) 2,193 2,224 (1%)
% of Sales 7.4% 7.7% 30 bps
Other Expense, Net ($M) 222 107 107%
Operating Profit 5,330 5,291 1%
Operating Margin 17.9% 18.4% (50) bps
Diluted EPS ($) 2.89 2.48 17%

Q4 FY17 Earnings Results | May 25, 2017 | 5
MDT
FY17 Y/Y EPS WALK
0.00
1.00
2.00
3.00
4.00
5.00
6.00
FY16,
GAAP
Non-GAAP
Adjustments
FY16,
Non-GAAP
Extra Week
Impact
FY16,
Non-GAAP
Adj.
Performance FY17
CC
FX FY17,
Non-GAAP
Non-GAAP
Adjustments
FY17,
GAAP
EPS Growth1: Double Digits; EPS Leverage1: ~650 bps EPS
$2.48
$1.89 $4.37
~($0.08)-
($0.10)
1 Comparison to FY16 on a constant currency, extra-week adjusted basis
Note: See FY17 Financial Schedules & Non-GAAP Reconciliations tables for additional information on reconciliations of non-GAAP information.
$4.29-
4.27
~$0.48-
$0.50 $4.77 ($0.17) $4.60 ($1.71)
$2.89
~11%-12% Y/Y1
FY16 FY17

Q4 FY17 Earnings Results | May 25, 2017 | 6
MDT
FY17 Y/Y OPERATING MARGIN CHANGES
0.0%
5.0%
10.0%
15.0%
20.0%
25.0%
30.0%
35.0%
FY16,
GAAP
Non-GAAP
Adjustments
FY16,
Non-GAAP
Extra Week
Impact
FY16,
Non-GAAP
Adj.
Performance FY17
CC
FX FY17,
Non-GAAP
Non-GAAP
Adjustments
FY17,
GAAP
~100 bps Operational Improvement1; 140 bps Organic Improvement1 Operating Margin
18.4%
9.8% 28.2% ~(0.2%) 29.0% (0.9%) 28.1% (10.2%)
17.9%
1 Comparison to FY16 on a constant currency, extra-week adjusted basis
Note: See FY17 Financial Schedules & Non-GAAP Reconciliations tables for additional information on reconciliations of non-GAAP information.
~28.0% ~1.0%
FY16 FY17

Q4 FY17 Earnings Results | May 25, 2017 | 7
MDT
FY17 NON-GAAP SELECT FINANCIAL INFORMATION
FY16
FY16
Estimated
Extra week
Impact
FY16
Adj for extra
week
FY17
FX
Impact
$M / Change
FY17
Constant
Currency1
FY17
CC Adj2
Growth
/Change
Net Sales ($M) 28,833 ~($450) -- 29,710 (34) -- ~5%
Gross Margin1 69.1%
~(0)-(20)
bps
~69.0%-
69.2%
68.9% (30) bps 69.2%
~(0)- (20)
bps
SG&A ($M) 9,469 -- -- 9,711 (19) -- --
% of Sales 32.8% ~20-30 bps
33.0%-
33.1%
32.7% Flat 32.7% ~30-40 bps
R&D ($M) 2,224 -- -- 2,193 (4) -- --
% of Sales 7.7% ~0 bps ~7.7% 7.4% Flat 7.4% ~(30) bps
Other Expense, Net
($M)
107 -- -- 222 213 -- --
Operating Profit1 8,126 -- -- 8,351 (289) -- HSD
Operating Margin 1 28.2% ~(20) bps ~28.0% 28.1% (90) bps 29.0% ~100 bps
Diluted EPS1 ($) 4.37
~$0.08 –
0.10
~$4.29–
4.27
4.60 (0.17) -- ~11-12%
1 Non-GAAP measure – see FY17 Financial Schedules & Non-GAAP Reconciliations tables for additional information on reconciliations of non-GAAP information
2 Figures represent comparison to FY16 on a constant currency, extra-week adjusted basis
Operating
Leverage
~+400 bps
EPS
Leverage
~+650 bps

Q4 FY17 CONSOLIDATED
RESULTS & GROUP
REVENUE HIGHLIGHTS

Q4 FY17 Earnings Results | May 25, 2017 | 9
Balanced, diversified growth across groups and geographies
• CVG, MITG, RTG and Diabetes all MSD growth1
• US MSD growth1; Non-US Developed MSD growth1; Emerging Markets DD
growth1
• Korea and Japan: HSD growth1
• Strong DD growth1 in China, Latin America, and Southeast Asia; HSD growth1
in Eastern Europe
• Growth Vector Performance:
• New Therapies: above our 200 to 350 bps goal, contributing ~370 bps
• Emerging Markets: below our 150 to 200 bps goal, contributing ~125 bps
• Services & Solutions: below our 40 to 60 bps goal, contributing ~15 bps
• Mid-Single Digit Organic Growth1: 4%
• Acquisitions contributed 110 bps
• Foreign currency had a negative 50 bps impact
Solid organic operating margin improvement
• Operating Margin: ~40 bps improvement Y/Y1; ~70bps improvement Y/Y1
on organic basis2; Operating leverage ~160 bps1
• Continued to cover dilution from acquisitions while investing in future
product launches
Capital allocation: Strategically deploying capital against priorities
• Q4: 33% Payout Ratio4; $594M in dividends and $16M in net share
repurchases
MDT
Q4 FY17 HIGHLIGHTS
1 Figures represent comparison to Q4 FY16 on a constant currency basis (non-GAAP).
2 Non-GAAP measure
3 Operating cash flows less property, plant and equipment additions (non-GAAP)
4 Dividends plus net share repurchases divided by adjusted net income (non-GAAP)
STRONG FINISH; SOLID YEAR OVERALL
Revenue:
Other Financial Highlights:
U.S.
56%
Non-
U.S.
Dev
31%
EM
13%
1
Diluted
EPS
Y/Y
CC1
Y/Y%
GAAP $0.84 8% NC
Non-GAAP $1.33 5% 6%
Cash Flow
from Ops $1.8B
Free Cash
Flow3 $1.4B
CVG
36%
MITG
33%
RTG
25%
DIAB
6%
Revenue
$M
As Rep
Y/Y %
CC1
Y/Y %
CVG 2,848 4 5
MITG 2,605 6 6
RTG 1,951 4 5
Diabetes 512 3 4
Total $7,916 5% 5%
U.S. 4,403 4 4
Non-U.S. Dev 2,452 2 4
EM 1,061 11 10
Total $7,916 5% 5%
Q4 FY17 Earnings Results | May 25, 2017 | 10
MDT
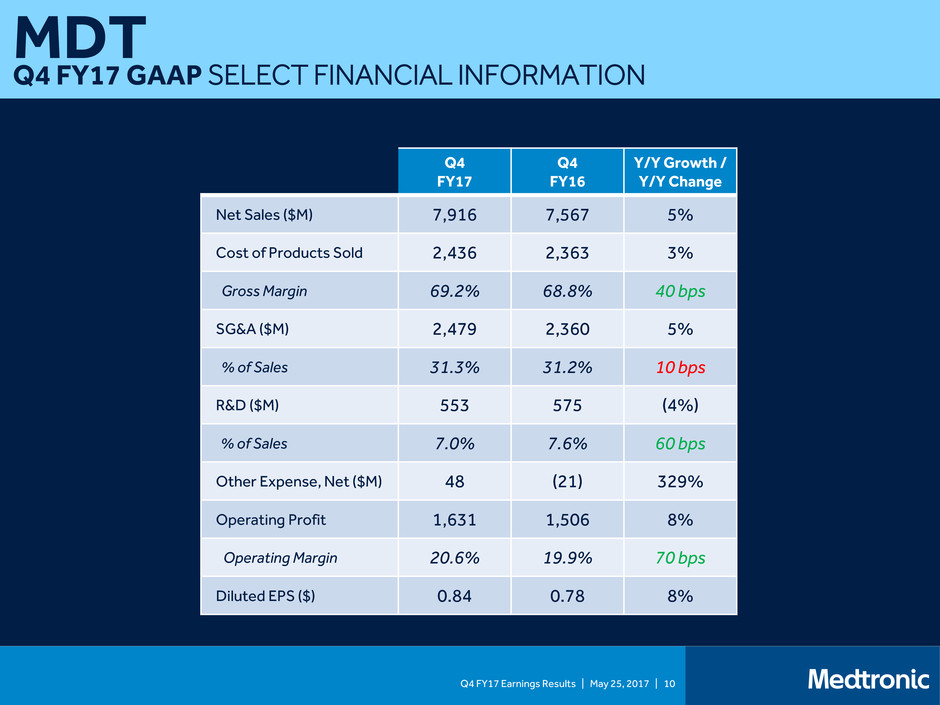
Q4 FY17 GAAP SELECT FINANCIAL INFORMATION
Q4
FY17
Q4
FY16
Y/Y Growth /
Y/Y Change
Net Sales ($M) 7,916 7,567 5%
Cost of Products Sold 2,436 2,363 3%
Gross Margin 69.2% 68.8% 40 bps
SG&A ($M) 2,479 2,360 5%
% of Sales 31.3% 31.2% 10 bps
R&D ($M) 553 575 (4%)
% of Sales 7.0% 7.6% 60 bps
Other Expense, Net ($M) 48 (21) 329%
Operating Profit 1,631 1,506 8%
Operating Margin 20.6% 19.9% 70 bps
Diluted EPS ($) 0.84 0.78 8%

Q4 FY17 Earnings Results | May 25, 2017 | 11
MDT
Q4 FY17 Y/Y EPS WALK
0.00
0.20
0.40
0.60
0.80
1.00
1.20
1.40
1.60
Q4 FY16,
GAAP
Q4 FY16,
Non-GAAP
Adjustments
Q4 FY16,
Non-GAAP
Performance Q4 FY17
CC
FX Q4 FY17,
Non-GAAP
Q4 FY17,
Non-GAAP
Adjustments
Q4 FY17,
GAAP
EPS Growth1: Mid-Single Digit; EPS Leverage1: ~120 bps EPS
$0.78
$0.49 $1.27
1 Figures represent comparison to Q4 FY16 on a constant currency basis (Non-GAAP).
$1.35 ($0.02) $1.33 ($0.49)
$0.84
6% Y/Y1
$0.08
FY16 FY17

Q4 FY17 Earnings Results | May 25, 2017 | 12
MDT
Q4 FY17 Y/Y OPERATING MARGIN CHANGES
0.0%
5.0%
10.0%
15.0%
20.0%
25.0%
30.0%
35.0%
Q4 FY16,
GAAP
Q4 FY16,
Non-GAAP
Adjustments
Q4 FY16,
Non-GAAP
Performance Q4 FY17
CC
FX Q4 FY17,
Non-GAAP
Q4 FY17,
Non-GAAP
Adjustments
Q4 FY17,
GAAP
~40 bps Operational Improvement1; 70 bps Organic Improvement1 Operating Margin
19.9%
10.4% 30.3% 0.4% 30.7% (0.3%) 30.4% (9.8%)
20.6%
FY16 FY17
1 Figures represent comparison to Q4 FY16 on a constant currency basis (Non-GAAP).

Q4 FY17 Earnings Results | May 25, 2017 | 13
MDT
Q4 FY17 NON-GAAP SELECT FINANCIAL INFORMATION
Q4
FY17
Q4
FY16
FX
Impact
$M / Change
Q4 FY17
Constant
Currency1
Q4 FY17
CC Growth /
Change2
Net Sales ($M) 7,916 7,567 (37) -- 5%
Cost of Products Sold1 2,426 2,363 (22) -- 4%
Gross Margin1 69.4% 68.8% 20 bps 69.2% 40 bps
SG&A ($M) 2,479 2,360 (9) -- 5%
% of Sales 31.3% 31.2% Flat 31.3% (10) bps
R&D ($M) 553 575 (3) -- (3%)
% of Sales 7.0% 7.6% Flat 7.0% 60 bps
Other (Income) Expense, Net ($M) 48 (21) 30 -- (186%)
Operating Profit1 2,410 2,290 (33) -- 7%
Operating Margin1 30.4% 30.3% (30) bps 30.7% 40 bps
Diluted EPS1 ($) 1.33 1.27 (0.02) -- 6%
1 Non-GAAP
2 Figures represent comparison to Q4 FY16 on a constant currency basis (Non-GAAP).
Operating
Leverage2
+160bps
EPS
Leverage2
+120bps

Q4 FY17 Earnings Results | May 25, 2017 | 14
CVG
Q4 FY17 HIGHLIGHTS
CRHF
54%
CSH
30%
APV
16%
U.S.
52%
Non-
U.S.
Dev
33%
EM
15%
Cardiac Rhythm & Heart Failure (CRHF)
KEY PERFORMANCE DRIVERS1
Heart Failure: +MSD
• Driven by HeartWare acquisition
• CRT-D: highest CRT-D share in 7
years in the US initial market
• Japan: continued share gains from
Compia MRI™ and Amplia MRI™
• CRT-P: above-market growth from
Quad
Arrhythmia Mgmt: +MSD
• WW Tachy: LSD decline; strength in US
• WW Brady: LSD decline
• Strength across several OUS
geographies offset by US decline
• CMS coverage approval of Micra®
• Diagnostics: Low-20s – Launched Reveal
LINQ® with TruRhythm™ detection
• AF Solutions: High-teens – Continued
share gain WW; strong growth in Japan
Coronary & Structural Heart (CSH)
Aortic & Peripheral Vascular (APV)
Services & Solutions: +MSD
Heart Valve Therapies:
+Low-Twenties
• WW TAVR market growing ~30%; MDT
above WW market growth
•US and EU: continued share gain from
Evolut® R 34mm expanded adoption
•SURTAVI intermediate risk data
submitted to FDA in March; expect H1
FY18 approval
•Evolut® PRO US Launch Q4; CE Mark/EU
launch anticipated late summer
Coronary: -MSD
• DES: LDD decline driven by market
pricing and US share loss
• Received US approval of Resolute
Onyx™ post-Q4 and Japan approval
expected H1 FY18; expected to
drive growth in FY18
Aortic: +MSD
• US: LSD growth led by Endurant® IIs
penetration, stable pricing, and Heli-FX®
EndoAnchor® adoption
• OUS: MSD growth
• AAA: LSD growth with recent Endurant®
ChEVAR CE Mark
• TAA: Above-market WW growth
Peripheral & endoVenous:
+HSD
• DCB: SFA US, EU & WW share leader
• IN.PACT® Admiral® DCB low-20s
• Price uplift from 150mm length
• Maintained market leadership in EU
• Atherectomy: HSD growth on strong
adoption of HawkOne™ 6F
Balanced MSD Growth across
CRHF, CSH and APV
Extracorp. Therapies: -LSD
• Cannulae and Revasc growth offset
by Surgical Ablation decline
Compia
MRI™
SureScan®
CRT-D
CoreValve®
Evolut® R
34mm
Resolute
Onyx™
IN.PACT®
Admiral®
Heli-FX®
EndoAnchor®
Revenue
$M
As Rep
Y/Y %
CC1
Y/Y %
CRHF 1,544 3 4
CSH 847 4 4
APV 457 5 6
Total $2,848 4% 5%
U.S. 1,484 5 5
Non-U.S. Dev 926 2 5
EM 438 4 4
Total $2,848 4% 5%
Arctic Front
Advance®
1 Figures represent comparison to Q4 FY16 on a constant currency basis (Non-GAAP).
FY18 Growth Outlook: 5 - 6%
Q4 FY17 Earnings Results | May 25, 2017 | 15
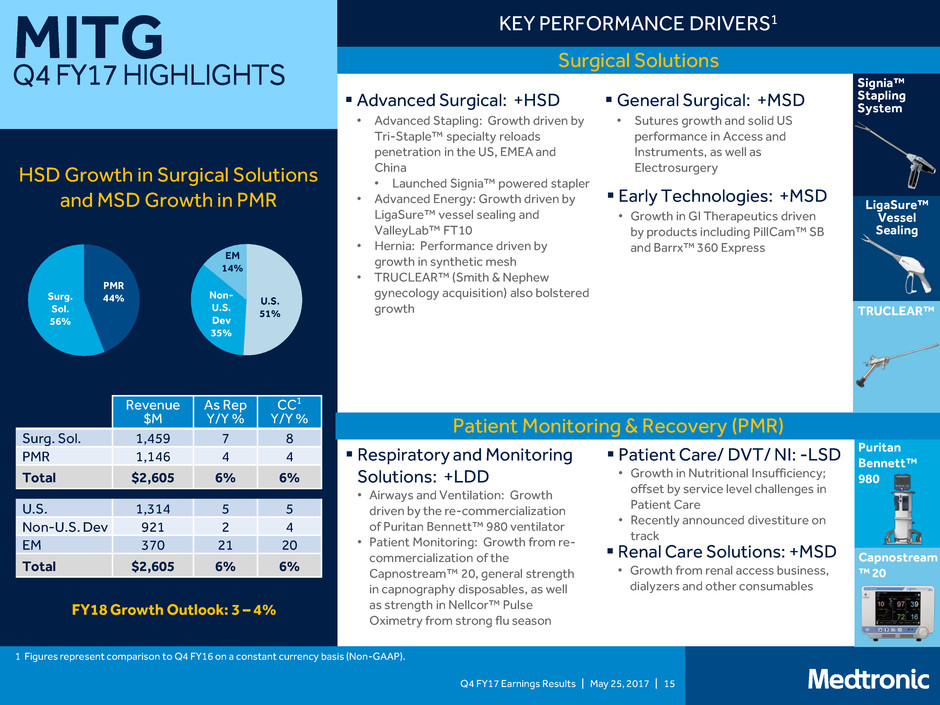
MITG
Q4 FY17 HIGHLIGHTS
Surgical Solutions
KEY PERFORMANCE DRIVERS1
HSD Growth in Surgical Solutions
and MSD Growth in PMR
Patient Monitoring & Recovery (PMR)
Early Technologies: +MSD
• Growth in GI Therapeutics driven
by products including PillCam™ SB
and Barrx™ 360 Express
General Surgical: +MSD
• Sutures growth and solid US
performance in Access and
Instruments, as well as
Electrosurgery
Patient Care/ DVT/ NI: -LSD
• Growth in Nutritional Insufficiency;
offset by service level challenges in
Patient Care
• Recently announced divestiture on
track
Endo GIA™
Renal Care Solutions: +MSD
• Growth from renal access business,
dialyzers and other consumables
Revenue
$M
As Rep
Y/Y %
CC1
Y/Y %
Surg. Sol. 1,459 7 8
PMR 1,146 4 4
Total $2,605 6% 6%
U.S. 1,314 5 5
Non-U.S. Dev 921 2 4
EM 370 21 20
Total $2,605 6% 6%
Signia™
Stapling
System
PMR
44% Surg.
Sol.
56%
U.S.
51%
Non-
U.S.
Dev
35%
EM
14%
Capnostream
™ 20
1 Figures represent comparison to Q4 FY16 on a constant currency basis (Non-GAAP).
LigaSure™
Vessel
Sealing
TRUCLEAR™
Advanced Surgical: +HSD
• Advanced Stapling: Growth driven by
Tri-Staple™ specialty reloads
penetration in the US, EMEA and
China
• Launched Signia™ powered stapler
• Advanced Energy: Growth driven by
LigaSure™ vessel sealing and
ValleyLab™ FT10
• Hernia: Performance driven by
growth in synthetic mesh
• TRUCLEAR™ (Smith & Nephew
gynecology acquisition) also bolstered
growth
Respiratory and Monitoring
Solutions: +LDD
• Airways and Ventilation: Growth
driven by the re-commercialization
of Puritan Bennett™ 980 ventilator
• Patient Monitoring: Growth from re-
commercialization of the
Capnostream™ 20, general strength
in capnography disposables, as well
as strength in Nellcor™ Pulse
Oximetry from strong flu season
FY18 Growth Outlook: 3 – 4%
Puritan
Bennett™
980

Q4 FY17 Earnings Results | May 25, 2017 | 16
RTG
Q4 FY17 HIGHLIGHTS
Spine
35%
Brain
30%
Specialty
20%
Pain
15%
[CATE
GORY
NAME]
[VALU
E]
[CATEG
ORY
NAME]
[VALUE]
[CATEG
ORY
NAME]
[VALUE
]
KEY PERFORMANCE DRIVERS1
Sustained Improvement in Spine;
Solid Brain & Specialty Therapies
Growth Offsets Declines in Pain
Neurosurgery: +LDD
• Growth driven by strong O-arm® O2 sales
• StealthStation® S8 approved late Q4
Core Spine: +LSD
• Continued success of new product
launches: Solera® Voyager® and
Elevate™ from Speed to Scale
initiative
• Strong growth in Other Biologics
• Surgical SynergySM initiative driving
implant growth
BMP: +LDD
• US: Strong growth (+LDD)
• OUS: InductOs™ return to market
expected mid-FY18
Brain Modulation: +LSD
• Growth driven by strength in the US
• Maintaining significant share despite
new competitive entrants
ENT: +MSD
• Continued strong growth in NuVent®
balloons and Fusion® Compact
navigation
Advanced Energy: +LDD
• Ortho / spine penetration driving
Aquamantys® growth
• Strong PEAK PlasmaBlade® growth in
breast oncology market
InterStim® II
StealthStationTM
S8
Infuse®
Bone Graft
Spine
Brain Therapies
Specialty Therapies
Pain Therapies
Pelvic Health: +HSD
• US growth driven by new InterStim® II
implants
Neurovascular: +Mid-Teens
• Strong growth driven by coils (Axium™
Prime) and stents (Solitaire™)
Revenue
$M
As Rep
Y/Y %
CC1
Y/Y %
Spine 676 3 3
Brain 585 9 9
Specialty 396 7 7
Pain 294 (2) (2)
Total $1,951 4% 5%
U.S. 1,302 4 4
Non-U.S. Dev 437 4 5
EM 212 10 8
Total $1,951 4% 5%
Kanghui: +HSD
• Continued market penetration driving
growth in Latin America and SE Asia
SCS/Pumps: -MSD
• EvolveSM Workflow launch in Q4; implant
impact beginning in Q1
• Ongoing SCS competitive pressure
leading to share loss
• Intellis™ approval expected late CY17
Interventional: +LSD
• Strong BKP performance in the US
driven by pull-through from
OsteoCool®
• Double-digit growth in Japan despite
competitive headwinds
OsteoCool®
1 Figures represent comparison to Q4 FY16 on a constant currency basis (Non-GAAP).
FY18 Growth Outlook: ~4%
Q4 FY17 Earnings Results | May 25, 2017 | 17
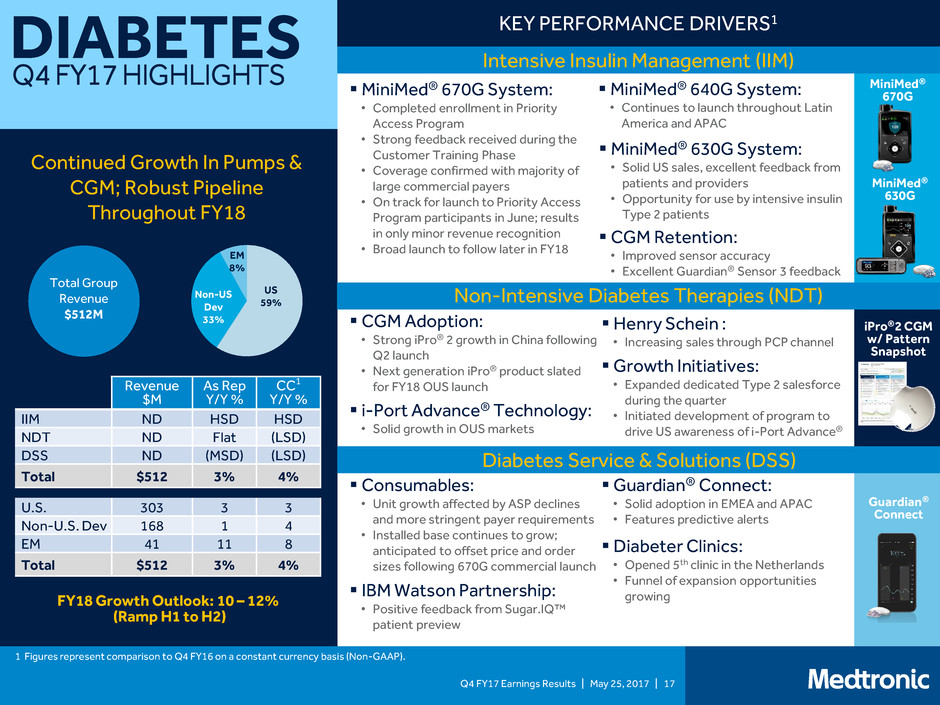
DIABETES
Q4 FY17 HIGHLIGHTS
US
59%
Non-US
Dev
33%
EM
8%
KEY PERFORMANCE DRIVERS1
Intensive Insulin Management (IIM)
Continued Growth In Pumps &
CGM; Robust Pipeline
Throughout FY18
MiniMed®
630G
Guardian®
Connect
17
Total Group
Revenue
$512M
Revenue
$M
As Rep
Y/Y %
CC1
Y/Y %
IIM ND HSD HSD
NDT ND Flat (LSD)
DSS ND (MSD) (LSD)
Total $512 3% 4%
U.S. 303 3 3
Non-U.S. Dev 168 1 4
EM 41 11 8
Total $512 3% 4%
FY18 Growth Outlook: 10 – 12%
(Ramp H1 to H2)
MiniMed®
670G
Non-Intensive Diabetes Therapies (NDT)
iPro®2 CGM
w/ Pattern
Snapshot
Diabetes Service & Solutions (DSS)
CGM Retention:
• Improved sensor accuracy
• Excellent Guardian® Sensor 3 feedback
MiniMed® 640G System:
• Continues to launch throughout Latin
America and APAC
MiniMed® 670G System:
• Completed enrollment in Priority
Access Program
• Strong feedback received during the
Customer Training Phase
• Coverage confirmed with majority of
large commercial payers
• On track for launch to Priority Access
Program participants in June; results
in only minor revenue recognition
• Broad launch to follow later in FY18
CGM Adoption:
• Strong iPro® 2 growth in China following
Q2 launch
• Next generation iPro® product slated
for FY18 OUS launch
i-Port Advance® Technology:
• Solid growth in OUS markets
Consumables:
• Unit growth affected by ASP declines
and more stringent payer requirements
• Installed base continues to grow;
anticipated to offset price and order
sizes following 670G commercial launch
Guardian® Connect:
• Solid adoption in EMEA and APAC
• Features predictive alerts
IBM Watson Partnership:
• Positive feedback from Sugar.IQ™
patient preview
MiniMed® 630G System:
• Solid US sales, excellent feedback from
patients and providers
• Opportunity for use by intensive insulin
Type 2 patients
1 Figures represent comparison to Q4 FY16 on a constant currency basis (Non-GAAP).
Diabeter Clinics:
• Opened 5th clinic in the Netherlands
• Funnel of expansion opportunities
growing
Henry Schein :
• Increasing sales through PCP channel
Growth Initiatives:
• Expanded dedicated Type 2 salesforce
during the quarter
• Initiated development of program to
drive US awareness of i-Port Advance®

FY18 EPS GUIDANCE,
REVENUE OUTLOOK, &
OTHER ASSUMPTIONS

Q4 FY17 Earnings Results | May 25, 2017 | 19
MDT
FY18 REVENUE / EPS GUIDANCE & OTHER ASSUMPTIONS
FY18
Revenue Growth – CC 4 - 5%
CVG Growth – CC 5 - 6%
MITG Growth – CC 3 - 4%
RTG Growth – CC ~4%
Diabetes Growth – CC 10-12% (Ramp H1 to H2)
COV Synergies ~$250 - $275M
EPS Growth1 – CC 9 - 10%
Other than noted, revenue and EPS growth guidance do not include any charges or gains that would be recorded as non-GAAP adjustments to earnings during the fiscal year
1 Figures represent comparison to prior year on a constant currency basis (non-GAAP).
Guidance
FX Assumptions
FY18 Q1FY18
Revenue ~$75M – $175M
(Headwind in H1; Tailwind in H2)
~($10M) – ($60M)
EPS ~($0.05) – ($0.10) ~(0.03) - ($0.05)
Note: While FX rates are fluid, assumptions above are based on current rates.
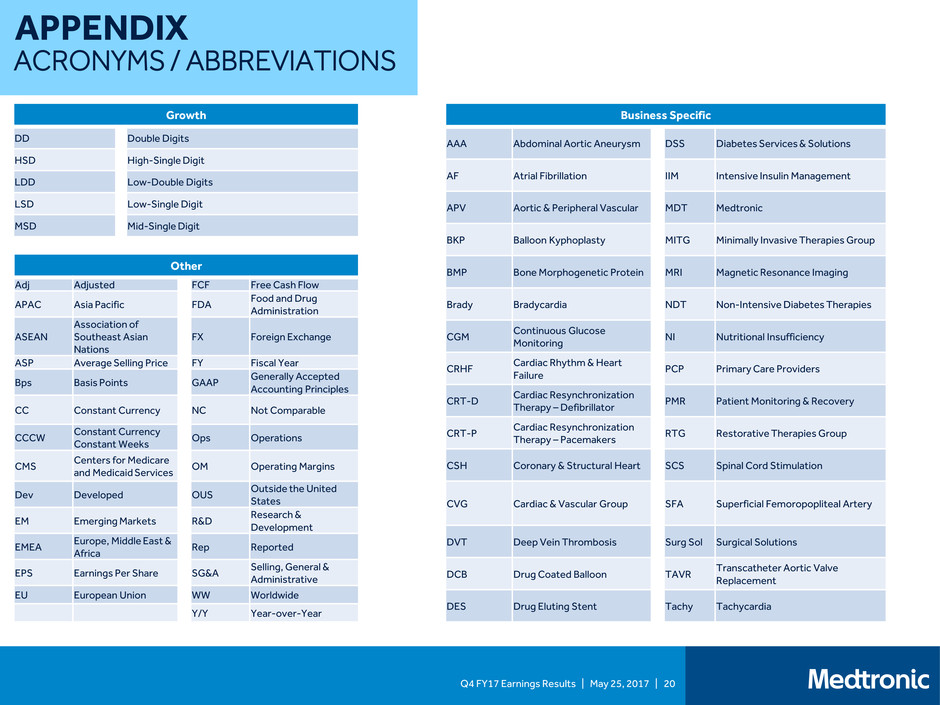
Q4 FY17 Earnings Results | May 25, 2017 | 20
APPENDIX
ACRONYMS / ABBREVIATIONS
1
Other
Adj Adjusted FCF Free Cash Flow
APAC Asia Pacific FDA
Food and Drug
Administration
ASEAN
Association of
Southeast Asian
Nations
FX Foreign Exchange
ASP Average Selling Price FY Fiscal Year
Bps Basis Points GAAP
Generally Accepted
Accounting Principles
CC Constant Currency NC Not Comparable
CCCW
Constant Currency
Constant Weeks
Ops Operations
CMS
Centers for Medicare
and Medicaid Services
OM Operating Margins
Dev Developed OUS
Outside the United
States
EM Emerging Markets R&D
Research &
Development
EMEA
Europe, Middle East &
Africa
Rep Reported
EPS Earnings Per Share SG&A
Selling, General &
Administrative
EU European Union WW Worldwide
Y/Y Year-over-Year
Business Specific
AAA Abdominal Aortic Aneurysm DSS Diabetes Services & Solutions
AF Atrial Fibrillation IIM Intensive Insulin Management
APV Aortic & Peripheral Vascular MDT Medtronic
BKP Balloon Kyphoplasty MITG Minimally Invasive Therapies Group
BMP Bone Morphogenetic Protein MRI Magnetic Resonance Imaging
Brady Bradycardia NDT Non-Intensive Diabetes Therapies
CGM
Continuous Glucose
Monitoring
NI Nutritional Insufficiency
CRHF
Cardiac Rhythm & Heart
Failure PCP Primary Care Providers
CRT-D
Cardiac Resynchronization
Therapy – Defibrillator PMR Patient Monitoring & Recovery
CRT-P
Cardiac Resynchronization
Therapy – Pacemakers RTG Restorative Therapies Group
CSH Coronary & Structural Heart SCS Spinal Cord Stimulation
CVG Cardiac & Vascular Group
SFA Superficial Femoropopliteal Artery
DVT Deep Vein Thrombosis Surg Sol Surgical Solutions
DCB Drug Coated Balloon TAVR
Transcatheter Aortic Valve
Replacement
DES Drug Eluting Stent Tachy Tachycardia
Growth
DD Double Digits
HSD High-Single Digit
LDD Low-Double Digits
LSD Low-Single Digit
MSD Mid-Single Digit
