Attached files
| file | filename |
|---|---|
| 8-K - ANNALY CAPITAL MANAGEMENT, INC. 8-K - ANNALY CAPITAL MANAGEMENT INC | a51564767.htm |
Exhibit 99.1

2017 Annual Meeting May 25, 2017
This presentation, other written or oral communications, and our public documents to which we refer contain or incorporate by reference certain forward-looking statements which are based on various assumptions (some of which are beyond our control) and may be identified by reference to a future period or periods or by the use of forward-looking terminology, such as “may,” “will,” “believe,” “expect,” “anticipate,” “continue,” or similar terms or variations on those terms or the negative of those terms. Actual results could differ materially from those set forth in forward looking statements due to a variety of factors, including, but not limited to, changes in interest rates; changes in the yield curve; changes in prepayment rates; the availability of mortgage-backed securities and other securities for purchase; the availability of financing and, if available, the terms of any financings; changes in the market value of our assets; changes in business conditions and the general economy; our ability to grow our commercial business; our ability to grow our residential mortgage credit business; credit risks related to our investments in credit risk transfer securities, residential mortgage-backed securities and related residential mortgage credit assets, commercial real estate assets and corporate debt; risks related to investments in mortgage servicing rights and ownership of a servicer; our ability to consummate any contemplated investment opportunities; changes in government regulations affecting our business; our ability to maintain our qualification as a REIT for U.S. federal income tax purposes; and our ability to maintain our exemption from registration under the Investment Company Act of 1940, as amended. For a discussion of the risks and uncertainties which could cause actual results to differ from those contained in the forward-looking statements, see “Risk Factors” in our most recent Annual Report on Form 10-K and any subsequent Quarterly Reports on Form 10-Q. We do not undertake, and specifically disclaim any obligation, to publicly release the result of any revisions which may be made to any forward-looking statements to reflect the occurrence of anticipated or unanticipated events or circumstances after the date of such statements, except as required by law. Safe Harbor Notice 2

Overview
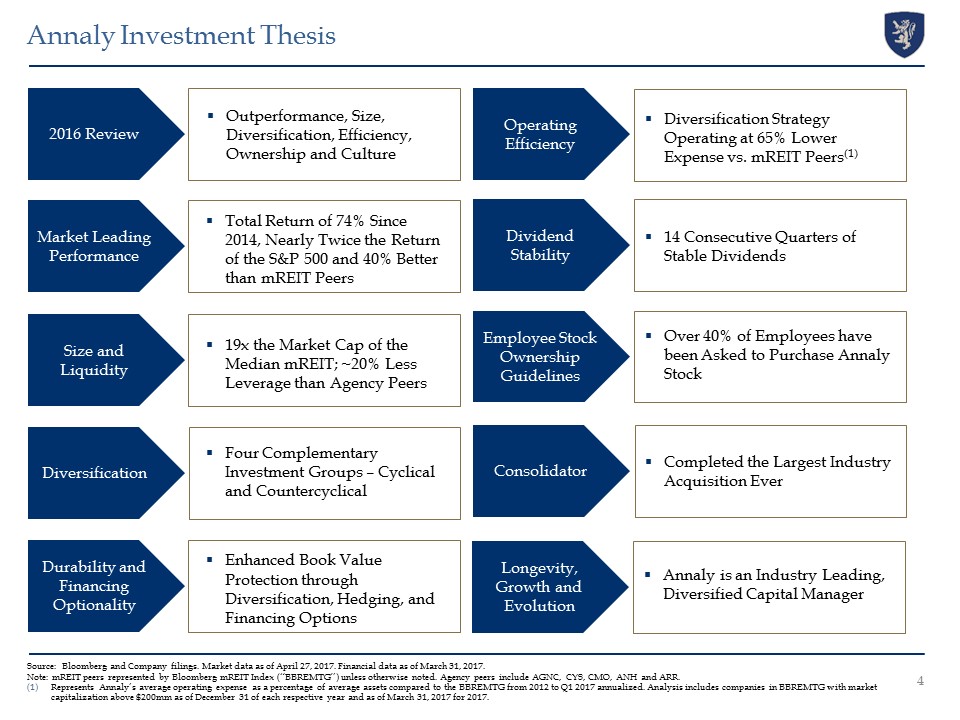
Source: Bloomberg and Company filings. Market data as of April 27, 2017. Financial data as of March 31, 2017. Note: mREIT peers represented by Bloomberg mREIT Index (“BBREMTG”) unless otherwise noted. Agency peers include AGNC, CYS, CMO, ANH and ARR. Represents Annaly’s average operating expense as a percentage of average assets compared to the BBREMTG from 2012 to Q1 2017 annualized. Analysis includes companies in BBREMTG with market capitalization above $200mm as of December 31 of each respective year and as of March 31, 2017 for 2017. Outperformance, Size, Diversification, Efficiency, Ownership and Culture 2016 Review Market Leading Performance Total Return of 74% Since 2014, Nearly Twice the Return of the S&P 500 and 40% Better than mREIT Peers Operating Efficiency Diversification Strategy Operating at 65% Lower Expense vs. mREIT Peers(1) Size and Liquidity Employee Stock Ownership Guidelines 19x the Market Cap of the Median mREIT; ~20% Less Leverage than Agency Peers Over 40% of Employees have been Asked to Purchase Annaly Stock Durability and Financing Optionality Consolidator Enhanced Book Value Protection through Diversification, Hedging, and Financing Options Diversification Four Complementary Investment Groups – Cyclical and Countercyclical Annaly Investment Thesis Dividend Stability 14 Consecutive Quarters of Stable Dividends Longevity, Growth and Evolution Annaly is an Industry Leading, Diversified Capital Manager Completed the Largest Industry Acquisition Ever 4
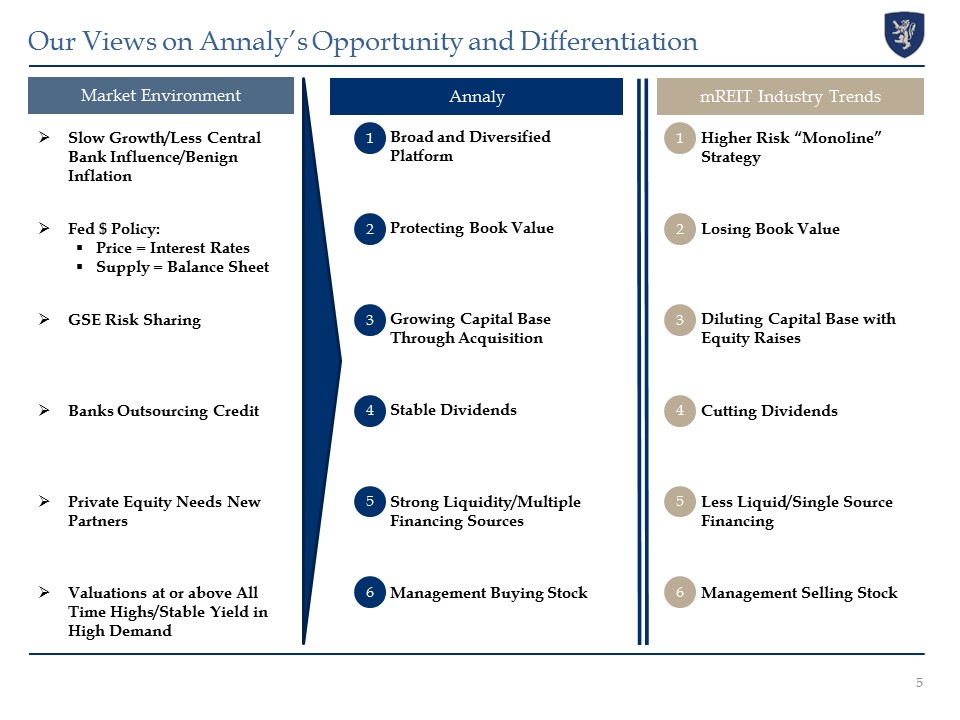
Market Environment 5 Our Views on Annaly’s Opportunity and Differentiation Annaly mREIT Industry Trends 1 1 2 2 3 3 4 4 5 5 6 6 Slow Growth/Less Central Bank Influence/Benign Inflation Fed $ Policy:Price = Interest RatesSupply = Balance Sheet GSE Risk Sharing Banks Outsourcing Credit Valuations at or above All Time Highs/Stable Yield in High Demand Private Equity Needs New Partners Broad and Diversified Platform Protecting Book Value Growing Capital Base Through Acquisition Stable Dividends Management Buying Stock Strong Liquidity/Multiple Financing Sources Higher Risk “Monoline” Strategy Losing Book Value Diluting Capital Base with Equity Raises Cutting Dividends Management Selling Stock Less Liquid/Single Source Financing
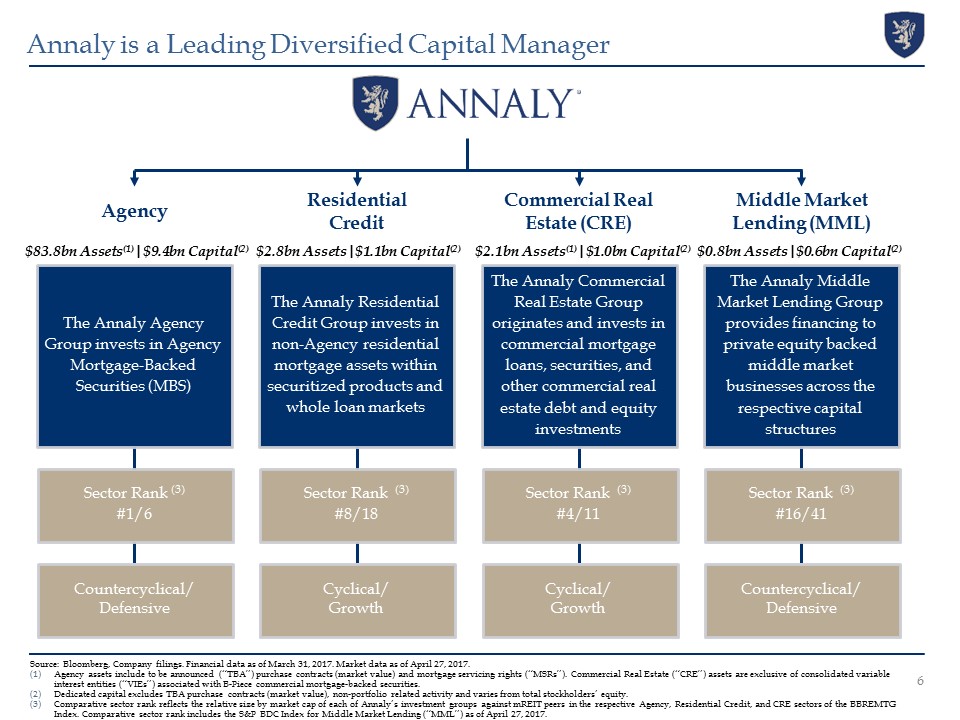
Source: Bloomberg, Company filings. Financial data as of March 31, 2017. Market data as of April 27, 2017.Agency assets include to be announced (“TBA”) purchase contracts (market value) and mortgage servicing rights (“MSRs”). Commercial Real Estate (“CRE”) assets are exclusive of consolidated variable interest entities (“VIEs”) associated with B-Piece commercial mortgage-backed securities.Dedicated capital excludes TBA purchase contracts (market value), non-portfolio related activity and varies from total stockholders’ equity.Comparative sector rank reflects the relative size by market cap of each of Annaly’s investment groups against mREIT peers in the respective Agency, Residential Credit, and CRE sectors of the BBREMTG Index. Comparative sector rank includes the S&P BDC Index for Middle Market Lending (“MML”) as of April 27, 2017. Annaly is a Leading Diversified Capital Manager Agency The Annaly Agency Group invests in Agency Mortgage-Backed Securities (MBS) Residential Credit The Annaly Residential Credit Group invests in non-Agency residential mortgage assets within securitized products and whole loan markets Commercial Real Estate (CRE) The Annaly Commercial Real Estate Group originates and invests in commercial mortgage loans, securities, and other commercial real estate debt and equity investments Middle Market Lending (MML) The Annaly Middle Market Lending Group provides financing to private equity backed middle market businesses across the respective capital structures 6 $83.8bn Assets(1)|$9.4bn Capital(2) $2.8bn Assets|$1.1bn Capital(2) $2.1bn Assets(1)|$1.0bn Capital(2) $0.8bn Assets|$0.6bn Capital(2) Sector Rank (3)#1/6 Sector Rank (3)#8/18 Sector Rank (3)#4/11 Sector Rank (3)#16/41 Countercyclical/Defensive Cyclical/Growth Cyclical/Growth Countercyclical/Defensive
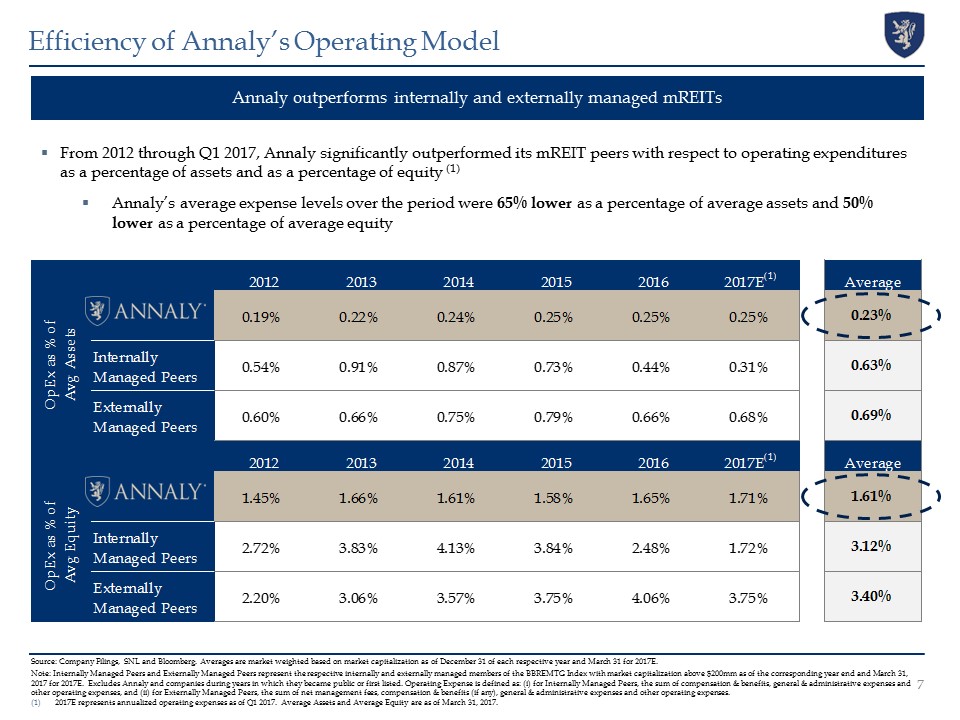
Annaly outperforms internally and externally managed mREITs From 2012 through Q1 2017, Annaly significantly outperformed its mREIT peers with respect to operating expenditures as a percentage of assets and as a percentage of equity (1)Annaly’s average expense levels over the period were 65% lower as a percentage of average assets and 50% lower as a percentage of average equity Efficiency of Annaly’s Operating Model Source: Company Filings, SNL and Bloomberg. Averages are market weighted based on market capitalization as of December 31 of each respective year and March 31 for 2017E.Note: Internally Managed Peers and Externally Managed Peers represent the respective internally and externally managed members of the BBREMTG Index with market capitalization above $200mm as of the corresponding year end and March 31, 2017 for 2017E. Excludes Annaly and companies during years in which they became public or first listed. Operating Expense is defined as: (i) for Internally Managed Peers, the sum of compensation & benefits, general & administrative expenses and other operating expenses, and (ii) for Externally Managed Peers, the sum of net management fees, compensation & benefits (if any), general & administrative expenses and other operating expenses.2017E represents annualized operating expenses as of Q1 2017. Average Assets and Average Equity are as of March 31, 2017. 7

3 Major Questions Have Been Answered
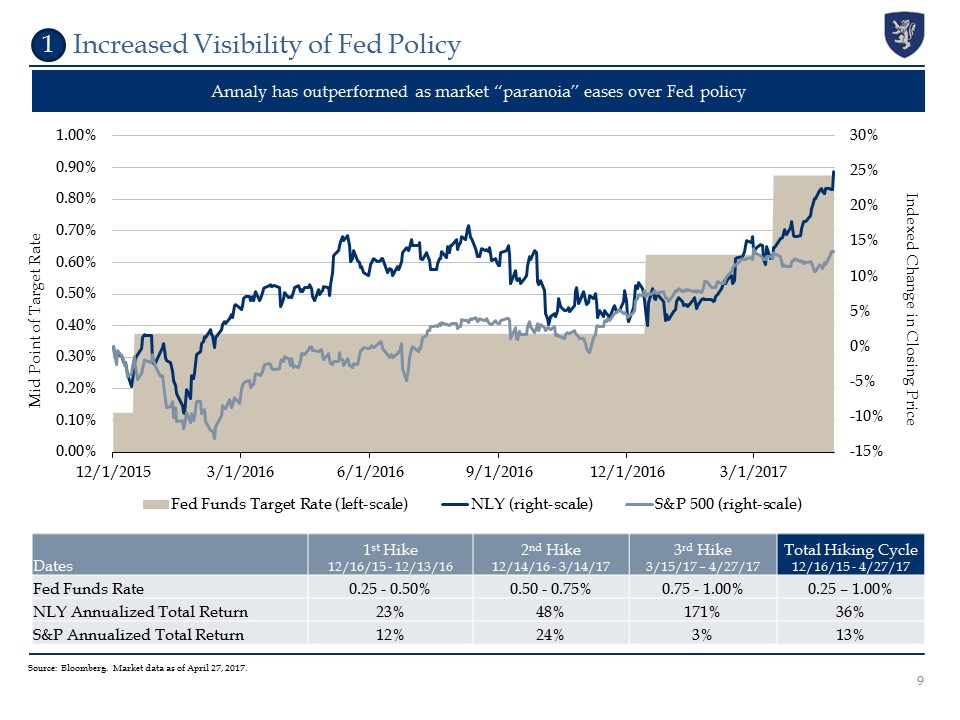
Source: Bloomberg. Market data as of April 27, 2017. Annaly has outperformed as market “paranoia” eases over Fed policy Increased Visibility of Fed Policy Dates 1st Hike12/16/15 - 12/13/16 2nd Hike12/14/16 - 3/14/17 3rd Hike3/15/17 – 4/27/17 Total Hiking Cycle12/16/15 - 4/27/17 Fed Funds Rate 0.25 - 0.50% 0.50 - 0.75% 0.75 - 1.00% 0.25 – 1.00% NLY Annualized Total Return 23% 48% 171% 36% S&P Annualized Total Return 12% 24% 3% 13% Mid Point of Target Rate Indexed Change in Closing Price 9 1
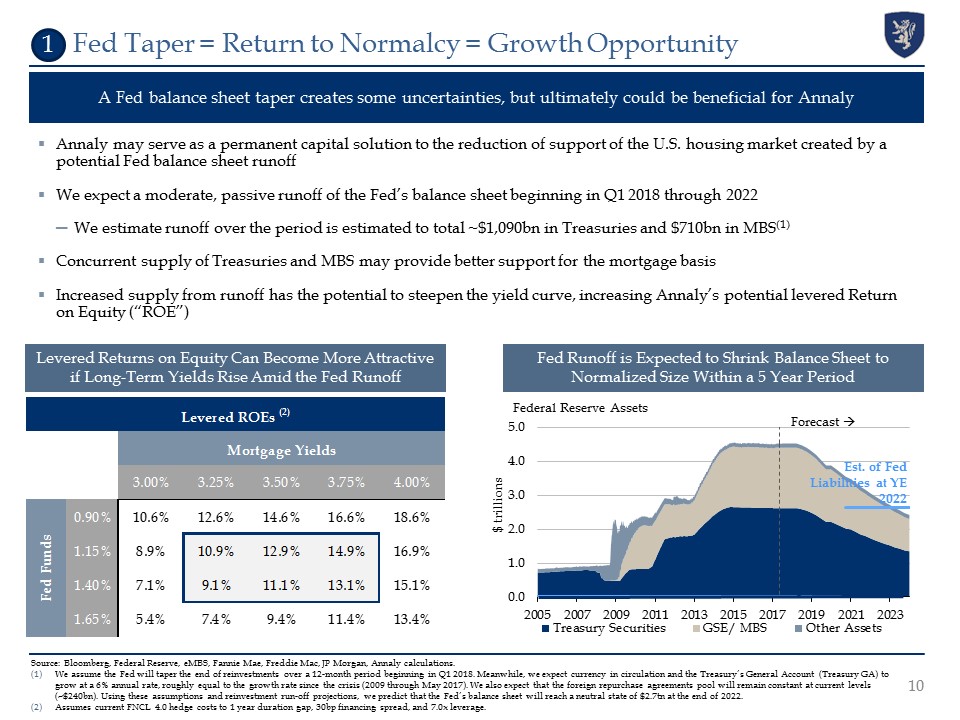
Fed Taper = Return to Normalcy = Growth Opportunity A Fed balance sheet taper creates some uncertainties, but ultimately could be beneficial for Annaly Annaly may serve as a permanent capital solution to the reduction of support of the U.S. housing market created by a potential Fed balance sheet runoffWe expect a moderate, passive runoff of the Fed’s balance sheet beginning in Q1 2018 through 2022We estimate runoff over the period is estimated to total ~$1,090bn in Treasuries and $710bn in MBS(1) Concurrent supply of Treasuries and MBS may provide better support for the mortgage basisIncreased supply from runoff has the potential to steepen the yield curve, increasing Annaly’s potential levered Return on Equity (“ROE”) Source: Bloomberg, Federal Reserve, eMBS, Fannie Mae, Freddie Mac, JP Morgan, Annaly calculations.We assume the Fed will taper the end of reinvestments over a 12-month period beginning in Q1 2018. Meanwhile, we expect currency in circulation and the Treasury’s General Account (Treasury GA) to grow at a 6% annual rate, roughly equal to the growth rate since the crisis (2009 through May 2017). We also expect that the foreign repurchase agreements pool will remain constant at current levels (~$240bn). Using these assumptions and reinvestment run-off projections, we predict that the Fed’s balance sheet will reach a neutral state of $2.7tn at the end of 2022. Assumes current FNCL 4.0 hedge costs to 1 year duration gap, 30bp financing spread, and 7.0x leverage. Levered Returns on Equity Can Become More Attractive if Long-Term Yields Rise Amid the Fed Runoff The Fed’s MBS holdings comprise about 30% of the $5.8 trillion Agency MBS marketOf the $1.7 trillion of Agency MBS owned by the Fed, most are 30yr fixed loans with coupons between 3% and 3.5% (2) Fed Runoff is Expected to Shrink Balance Sheet to Normalized Size Within a 5 Year Period 1 $ trillions
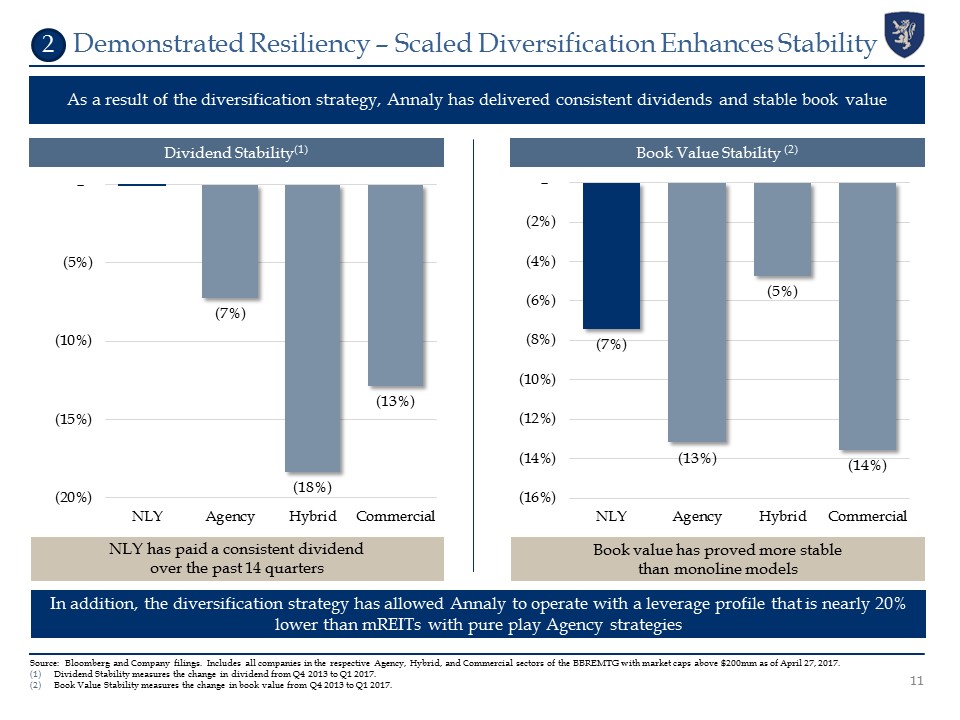
Source: Bloomberg and Company filings. Includes all companies in the respective Agency, Hybrid, and Commercial sectors of the BBREMTG with market caps above $200mm as of April 27, 2017.Dividend Stability measures the change in dividend from Q4 2013 to Q1 2017.Book Value Stability measures the change in book value from Q4 2013 to Q1 2017. Demonstrated Resiliency – Scaled Diversification Enhances Stability As a result of the diversification strategy, Annaly has delivered consistent dividends and stable book value Dividend Stability(1) Book Value Stability (2) In addition, the diversification strategy has allowed Annaly to operate with a leverage profile that is nearly 20% lower than mREITs with pure play Agency strategies NLY has paid a consistent dividend over the past 14 quarters Book value has proved more stable than monoline models 11 2
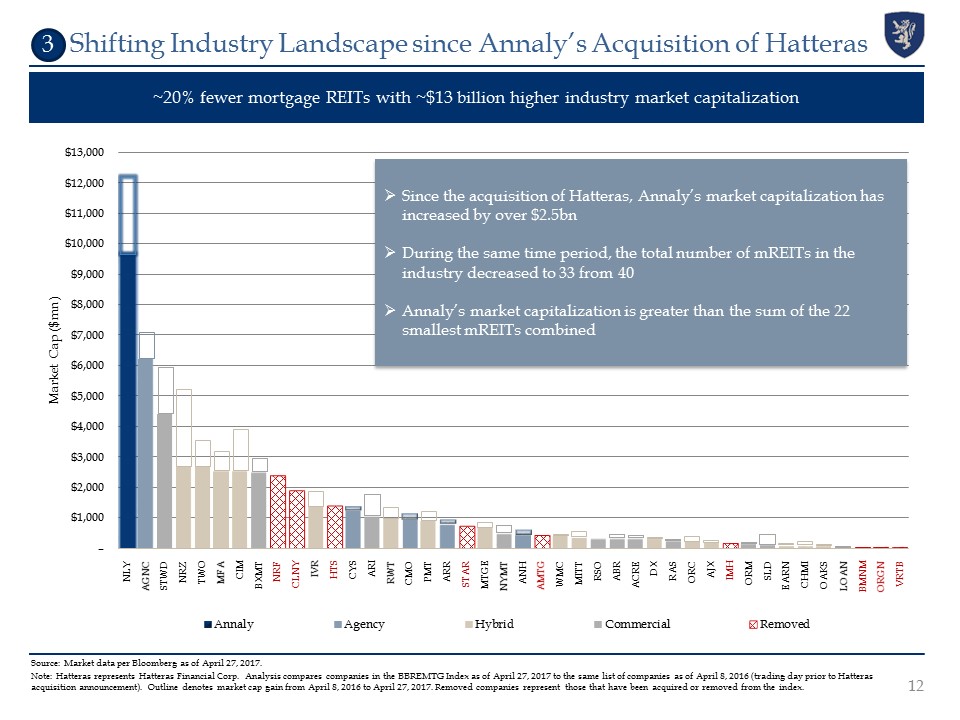
Shifting Industry Landscape since Annaly’s Acquisition of Hatteras ~20% fewer mortgage REITs with ~$13 billion higher industry market capitalization Source: Market data per Bloomberg as of April 27, 2017. Note: Hatteras represents Hatteras Financial Corp. Analysis compares companies in the BBREMTG Index as of April 27, 2017 to the same list of companies as of April 8, 2016 (trading day prior to Hatteras acquisition announcement). Outline denotes market cap gain from April 8, 2016 to April 27, 2017. Removed companies represent those that have been acquired or removed from the index. Total number of mREITs in BBREMTG decreased to 33 from 40Annaly represents ~20% of total mREIT market cap Since the acquisition of Hatteras, Annaly’s market capitalization has increased by over $2.5bnDuring the same time period, the total number of mREITs in the industry decreased to 33 from 40Annaly’s market capitalization is greater than the sum of the 22 smallest mREITs combined NRF CLNY HTS IMH BMNM ORGN VRTB NLY AGNC STWD TWO MFA CIM BXMT IVR CMO MTGE ANH WMC MITT RAS ORC AJX ORM SLD EARN CHMI NRZ CYS ARI RWT PMT ARR STAR NYMT AMTG RSO ABR ACRE DX OAKS LOAN 3
Annaly’s Performance and Market Differentiation
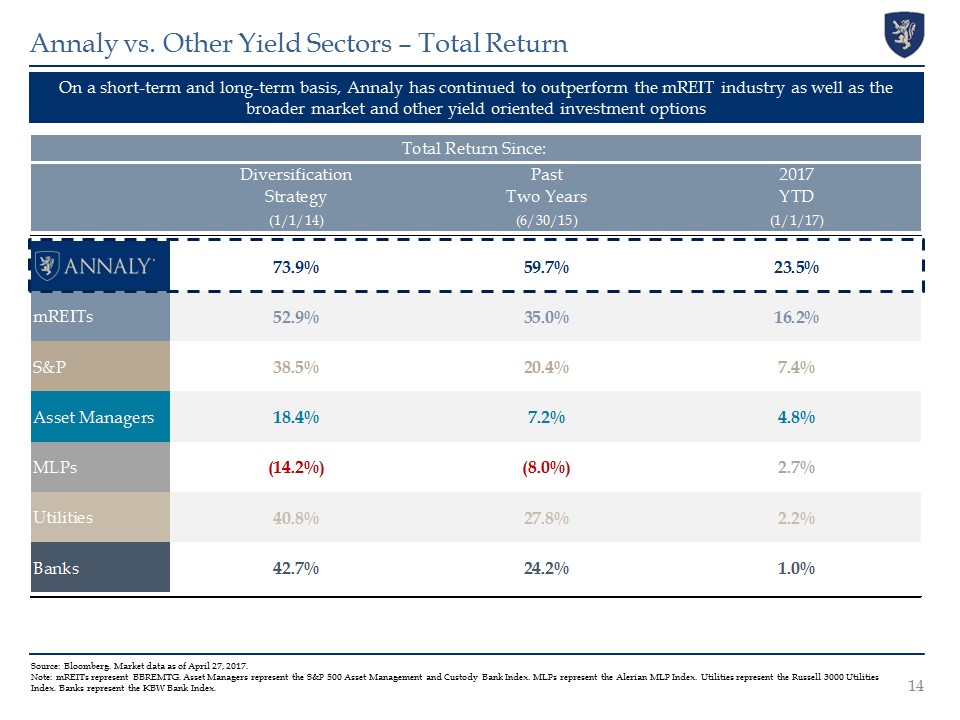
Annaly vs. Other Yield Sectors – Total Return On a short-term and long-term basis, Annaly has continued to outperform the mREIT industry as well as the broader market and other yield oriented investment options Source: Bloomberg. Market data as of April 27, 2017.Note: mREITs represent BBREMTG. Asset Managers represent the S&P 500 Asset Management and Custody Bank Index. MLPs represent the Alerian MLP Index. Utilities represent the Russell 3000 Utilities Index. Banks represent the KBW Bank Index.
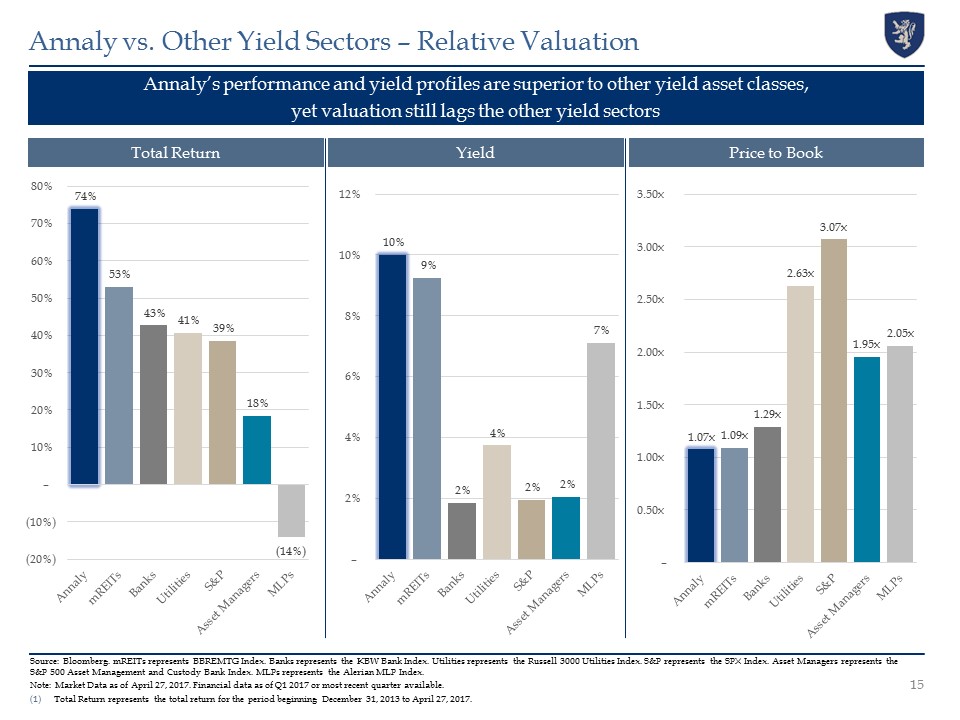
Annaly vs. Other Yield Sectors – Relative Valuation Source: Bloomberg. mREITs represents BBREMTG Index. Banks represents the KBW Bank Index. Utilities represents the Russell 3000 Utilities Index. S&P represents the SPX Index. Asset Managers represents the S&P 500 Asset Management and Custody Bank Index. MLPs represents the Alerian MLP Index. Note: Market Data as of April 27, 2017. Financial data as of Q1 2017 or most recent quarter available.Total Return represents the total return for the period beginning December 31, 2013 to April 27, 2017. Annaly’s performance and yield profiles are superior to other yield asset classes, yet valuation still lags the other yield sectors 15 Total Return Price to Book Yield
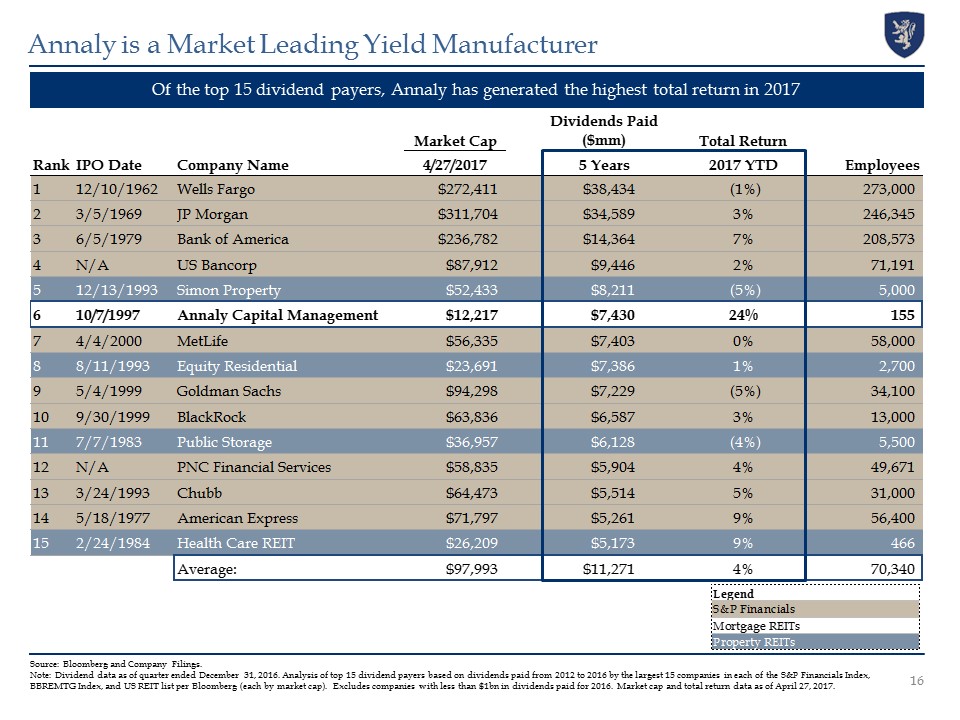
Source: Bloomberg and Company Filings.Note: Dividend data as of quarter ended December 31, 2016. Analysis of top 15 dividend payers based on dividends paid from 2012 to 2016 by the largest 15 companies in each of the S&P Financials Index, BBREMTG Index, and US REIT list per Bloomberg (each by market cap). Excludes companies with less than $1bn in dividends paid for 2016. Market cap and total return data as of April 27, 2017. Annaly is a Market Leading Yield Manufacturer 16 Of the top 15 dividend payers, Annaly has generated the highest total return in 2017
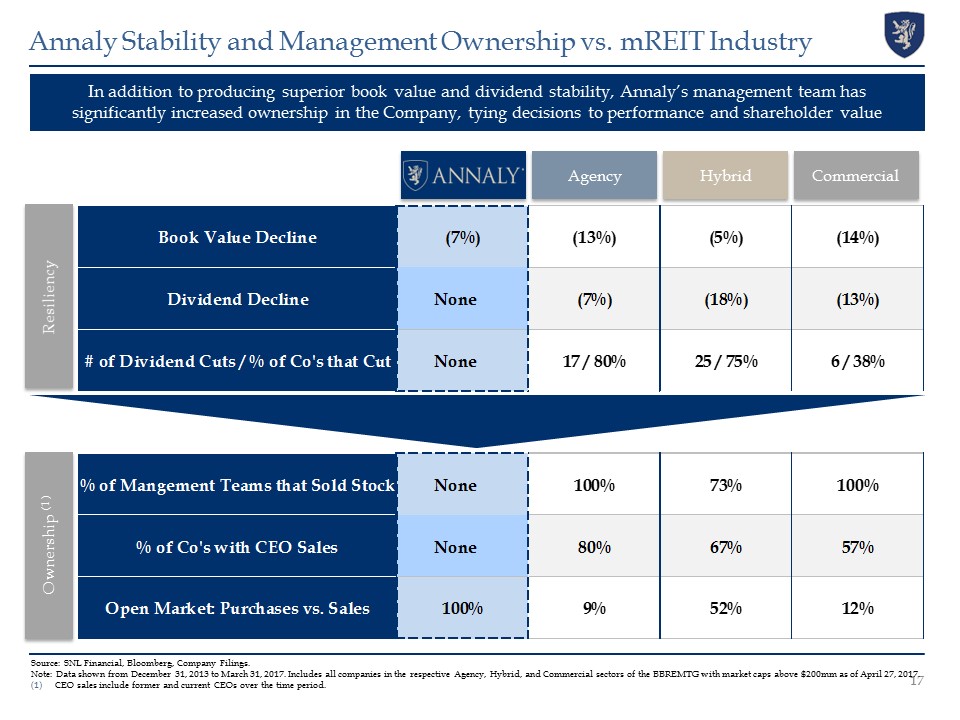
17 In addition to producing superior book value and dividend stability, Annaly’s management team has significantly increased ownership in the Company, tying decisions to performance and shareholder value Annaly Stability and Management Ownership vs. mREIT Industry Hybrid Commercial Agency Source: SNL Financial, Bloomberg, Company Filings.Note: Data shown from December 31, 2013 to March 31, 2017. Includes all companies in the respective Agency, Hybrid, and Commercial sectors of the BBREMTG with market caps above $200mm as of April 27, 2017.CEO sales include former and current CEOs over the time period. Resiliency Ownership (1)
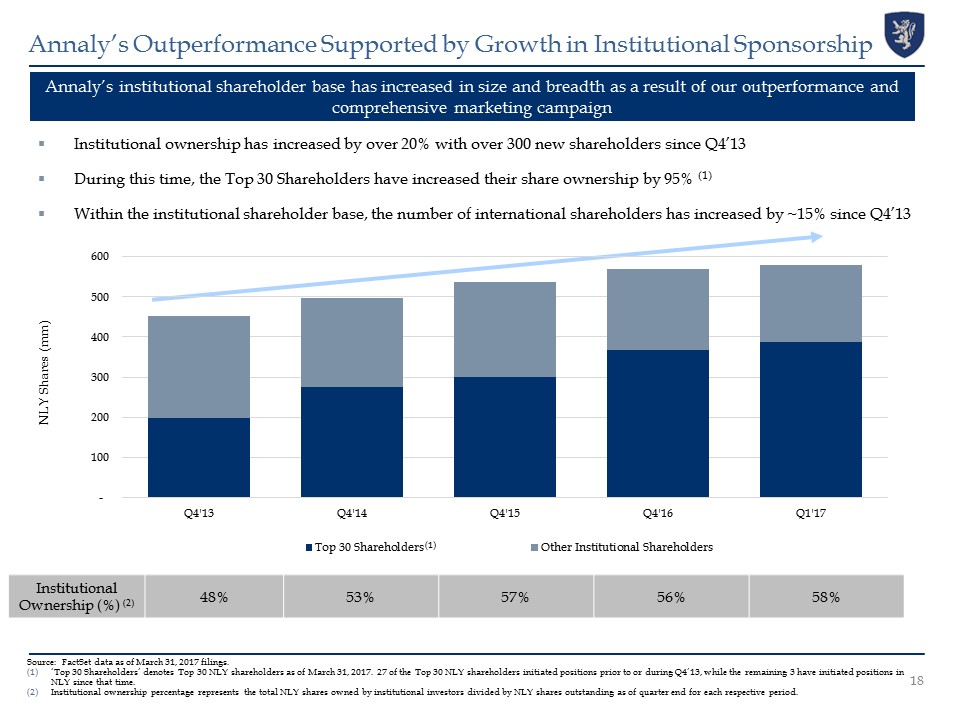
Source: FactSet data as of March 31, 2017 filings. ‘Top 30 Shareholders’ denotes Top 30 NLY shareholders as of March 31, 2017. 27 of the Top 30 NLY shareholders initiated positions prior to or during Q4’13, while the remaining 3 have initiated positions in NLY since that time.Institutional ownership percentage represents the total NLY shares owned by institutional investors divided by NLY shares outstanding as of quarter end for each respective period. Annaly’s Outperformance Supported by Growth in Institutional Sponsorship 18 Annaly’s institutional shareholder base has increased in size and breadth as a result of our outperformance and comprehensive marketing campaign Institutional ownership has increased by over 20% with over 300 new shareholders since Q4’13During this time, the Top 30 Shareholders have increased their share ownership by 95% (1)Within the institutional shareholder base, the number of international shareholders has increased by ~15% since Q4’13 Institutional Ownership (%) (2) 48% 53% 57% 56% 58% (1)
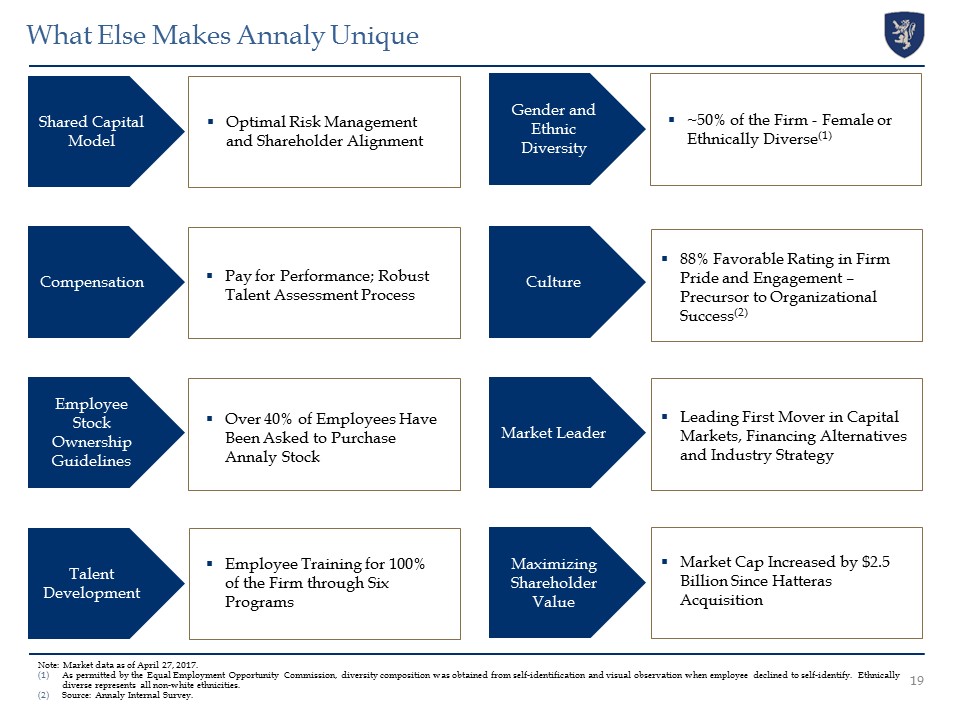
Optimal Risk Management and Shareholder Alignment Shared Capital Model Compensation Pay for Performance; Robust Talent Assessment Process Culture 88% Favorable Rating in Firm Pride and Engagement – Precursor to Organizational Success(2) Employee Stock Ownership Guidelines Maximizing Shareholder Value Over 40% of Employees Have Been Asked to Purchase Annaly Stock Market Cap Increased by $2.5 Billion Since Hatteras Acquisition Talent Development Employee Training for 100% of the Firm through Six Programs What Else Makes Annaly Unique Market Leader Leading First Mover in Capital Markets, Financing Alternatives and Industry Strategy 19 Gender and Ethnic Diversity ~50% of the Firm - Female or Ethnically Diverse(1) Note: Market data as of April 27, 2017. As permitted by the Equal Employment Opportunity Commission, diversity composition was obtained from self-identification and visual observation when employee declined to self-identify. Ethnically diverse represents all non-white ethnicities.Source: Annaly Internal Survey.
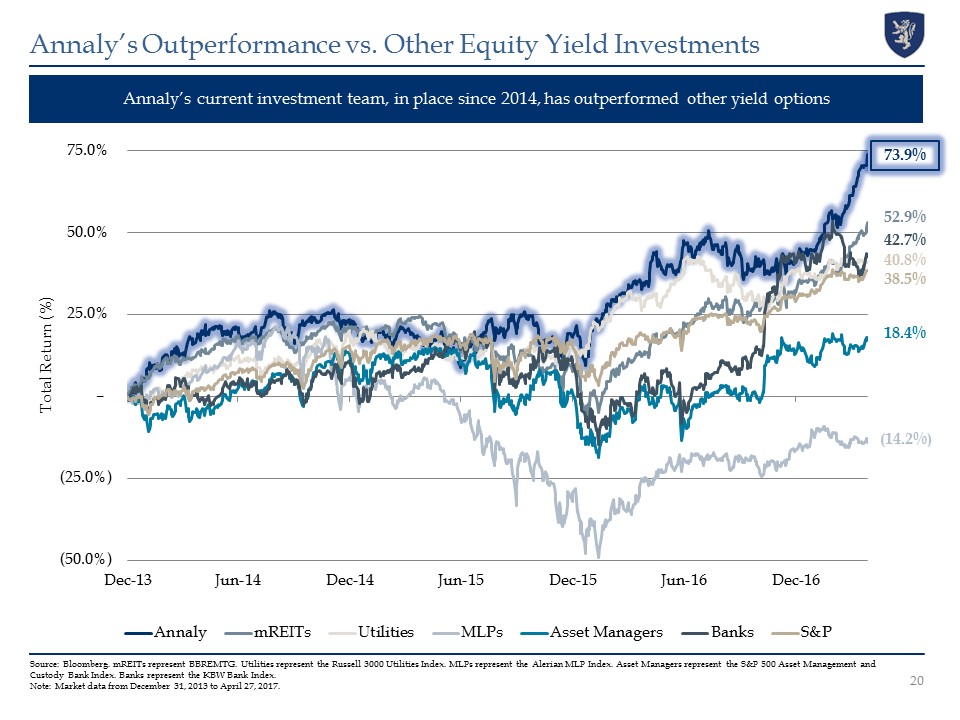
Annaly’s Outperformance vs. Other Equity Yield Investments Source: Bloomberg. mREITs represent BBREMTG. Utilities represent the Russell 3000 Utilities Index. MLPs represent the Alerian MLP Index. Asset Managers represent the S&P 500 Asset Management and Custody Bank Index. Banks represent the KBW Bank Index. Note: Market data from December 31, 2013 to April 27, 2017. Annaly’s current investment team, in place since 2014, has outperformed other yield options 73.9% 52.9% 40.8% 42.7% 38.5% 18.4% (14.2%) 20