Attached files
| file | filename |
|---|---|
| 8-K - 8-K - United Financial Bancorp, Inc. | a8-kannualmeetingpresentat.htm |
Create Your Balance
Annual Shareholders Meeting
NASDAQ: UBNK
This Presentation contains forward-looking statements that are within the meaning of the Private Securities
Litigation Reform Act of 1995. Such statements are based upon the current beliefs and expectations of our
management and are subject to significant risks and uncertainties. These risks and uncertainties could cause
our results to differ materially from those set forth in such forward-looking statements. Forward-looking
statements can be identified by the fact that they do not relate strictly to historical or current facts. Words such
as “believes,” “anticipates,” “expects,” “intends,” “plans,” “estimates,” “targeted” and similar expressions, and
future or conditional verbs, such as “will,” “would,” “should,” “could” or “may” are intended to identify forward-
looking statements but are not the only means to identify these statements. Forward-looking statements
involve risks and uncertainties. Actual conditions, events or results may differ materially from those
contemplated by a forward-looking statement. Factors that could cause this difference — many of which are
beyond our control — include without limitation the following: Any forward-looking statements made by or on
behalf of us in this Presentation speak only as of the date of this Presentation. We do not undertake to update
forward-looking statements to reflect the impact of circumstances or events that arise after the date the
forward-looking statement was made. The reader should; however, consult any further disclosures of a
forward-looking nature we may make in future filings.
Forward Looking Statements
Chief Executive Officer
Presentation of Results
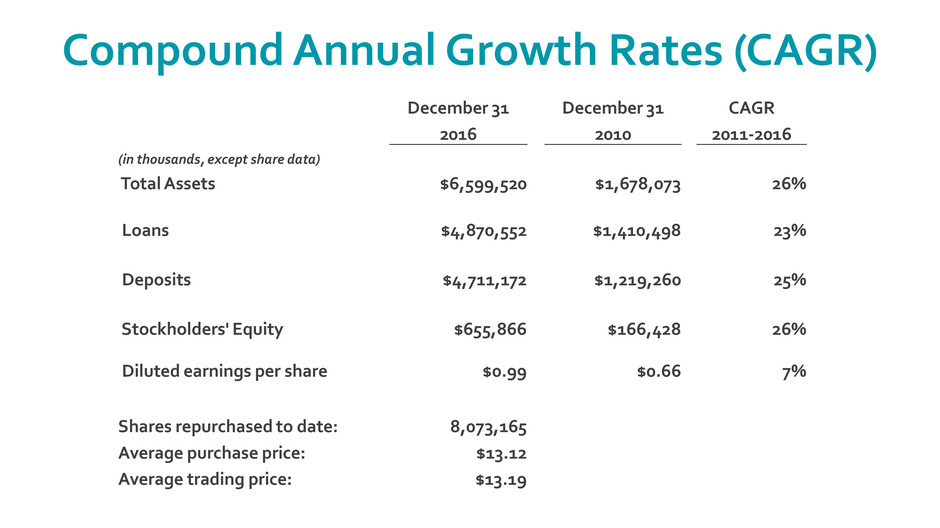
Compound Annual Growth Rates (CAGR)
December 31 December 31 CAGR
2016 2010 2011-2016
(in thousands, except share data)
Total Assets $6,599,520 $1,678,073 26%
Loans $4,870,552 $1,410,498 23%
Deposits $4,711,172 $1,219,260 25%
Stockholders' Equity $655,866 $166,428 26%
Diluted earnings per share $0.99 $0.66 7%
Shares repurchased to date: 8,073,165
Average purchase price: $13.12
Average trading price: $13.19
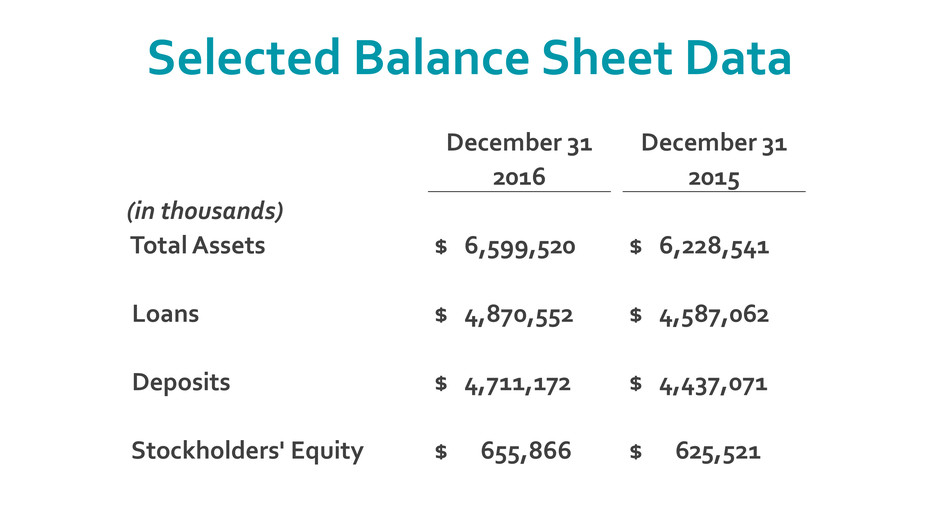
Selected Balance Sheet Data
December 31 December 31
2016 2015
(in thousands)
Total Assets $ 6,599,520 $ 6,228,541
Loans $ 4,870,552 $ 4,587,062
Deposits $ 4,711,172 $ 4,437,071
Stockholders' Equity $ 655,866 $ 625,521
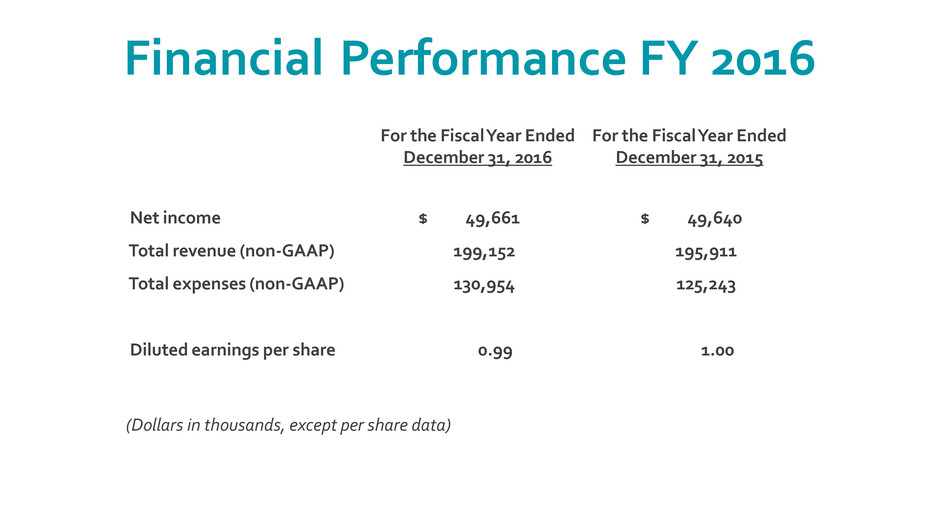
Financial Performance FY 2016
For the Fiscal Year Ended
December 31, 2016
For the Fiscal Year Ended
December 31, 2015
Net income $ 49,661 $ 49,640
Total revenue (non-GAAP) 199,152 195,911
Total expenses (non-GAAP) 130,954 125,243
Diluted earnings per share 0.99 1.00
(Dollars in thousands, except per share data)
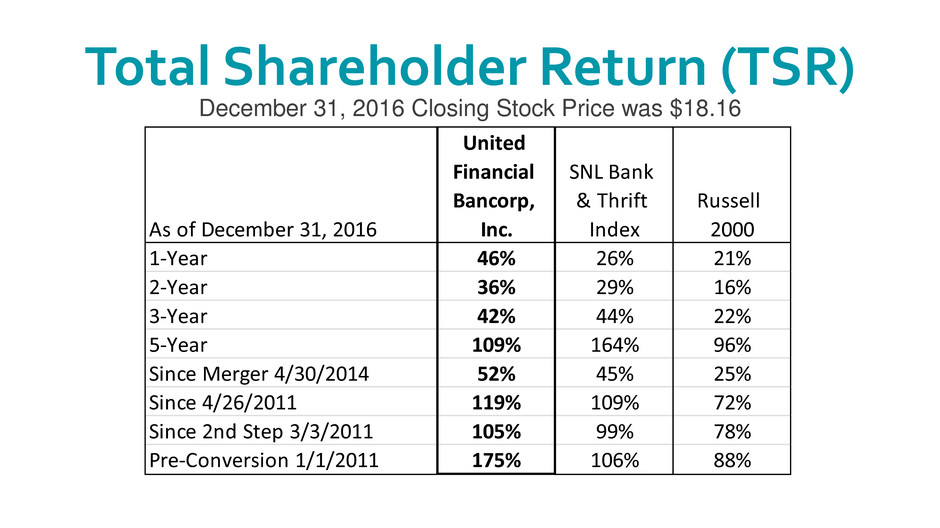
Total Shareholder Return (TSR)
As of December 31, 2016
United
Financial
Bancorp,
Inc.
SNL Bank
& Thrift
Index
Russell
2000
1-Year 46% 26% 21%
2-Year 36% 29% 16%
3-Year 42% 44% 22%
5-Year 109% 164% 96%
Since Merger 4/30/2014 52% 45% 25%
Since 4/26/2011 119% 109% 72%
Since 2nd Step 3/3/2011 105% 99% 78%
Pre-Conversion 1/1/2011 175% 106% 88%
December 31, 2016 Closing Stock Price was $18.16
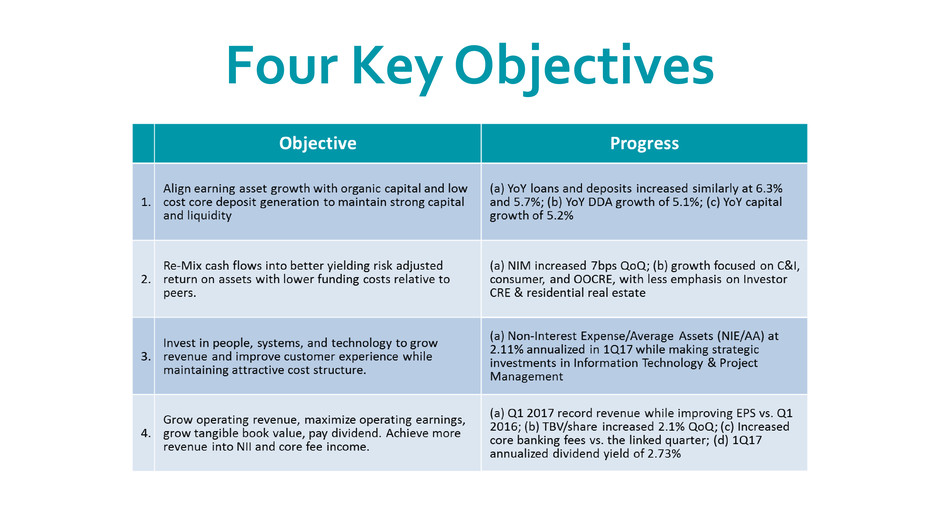
Four Key Objectives
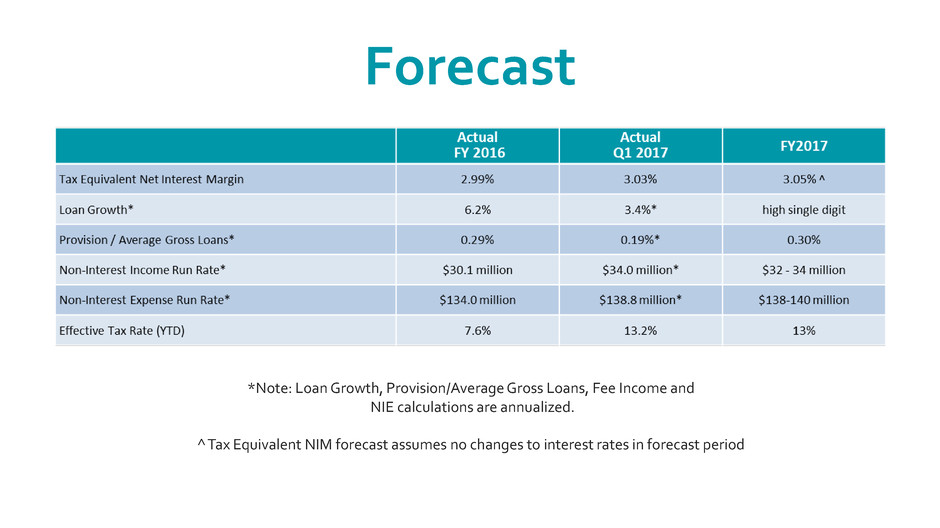
Forecast
*Note: Loan Growth, Provision/Average Gross Loans, Fee Income and
NIE calculations are annualized.
^ Tax Equivalent NIM forecast assumes no changes to interest rates in forecast period

Questions & Answers

Thank you for attending
