Attached files
| file | filename |
|---|---|
| 8-K - HOWARD BANCORP, INC. 8-K - Howard Bancorp Inc | a51564312.htm |
Exhibit 99.1

Annual Shareholder MeetingMay 24, 2017
Forward-Looking Statements This presentation contains statements that are forward-looking, as that term is defined by the Private Securities Litigation Reform Act of 1995 or the Securities and Exchange Commission in its rules, regulations and releases. The Company intends that such forward-looking statements be subject to the safe harbors created thereby. All forward-looking statements are based on current expectations regarding important risk factors, including but not limited to real estate values, local and national economic conditions, the impact of interest rates on financing and the successful completion and deployment of proceeds from the capital raises as well as the successful completion and integration of mergers and acquisitions. Accordingly, actual results may differ from those expressed in the forward-looking statements, and the making of such statements should not be regarded as a representation by the Company or any other person that results expressed therein will be achieved. The Company does not undertake, and specifically disclaims any obligation, to publicly release the result of any revisions that may be made to any forward-looking statements to reflect events or circumstances after the date of such statements or to reflect the occurrence of anticipated or unanticipated events.
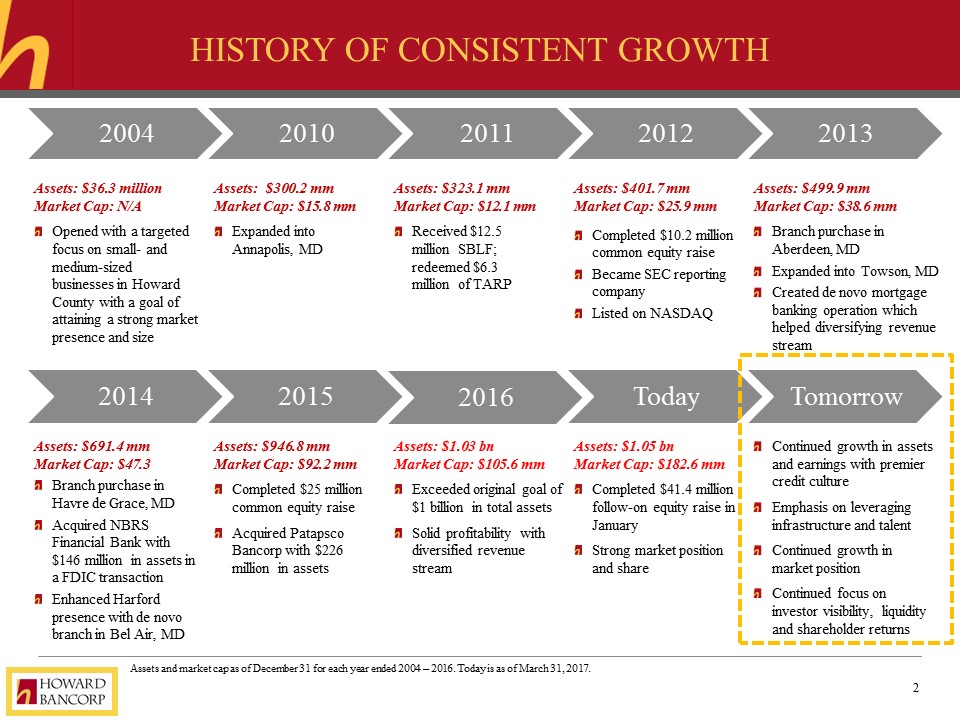
history of Consistent growth 2004 2010 2011 2012 2013 Assets: $36.3 millionMarket Cap: N/AOpened with a targeted focus on small- and medium-sized businesses in Howard County with a goal of attaining a strong market presence and size Assets: $300.2 mmMarket Cap: $15.8 mmExpanded into Annapolis, MD Assets: $323.1 mmMarket Cap: $12.1 mmReceived $12.5 million SBLF; redeemed $6.3 million of TARP Assets: $401.7 mmMarket Cap: $25.9 mmCompleted $10.2 million common equity raiseBecame SEC reporting companyListed on NASDAQ Assets: $499.9 mmMarket Cap: $38.6 mmBranch purchase in Aberdeen, MDExpanded into Towson, MDCreated de novo mortgage banking operation which helped diversifying revenue stream 2014 2015 Today Tomorrow Assets: $691.4 mmMarket Cap: $47.3Branch purchase in Havre de Grace, MDAcquired NBRS Financial Bank with $146 million in assets in a FDIC transactionEnhanced Harford presence with de novo branch in Bel Air, MD Assets: $946.8 mmMarket Cap: $92.2 mmCompleted $25 million common equity raiseAcquired Patapsco Bancorp with $226 million in assets Assets: $1.05 bnMarket Cap: $182.6 mmCompleted $41.4 million follow-on equity raise in JanuaryStrong market position and share Continued growth in assets and earnings with premier credit culture Emphasis on leveraging infrastructure and talentContinued growth in market positionContinued focus on investor visibility, liquidity and shareholder returns Assets and market cap as of December 31 for each year ended 2004 – 2016. Today is as of March 31, 2017. 2016 Assets: $1.03 bnMarket Cap: $105.6 mmExceeded original goal of $1 billion in total assets Solid profitability with diversified revenue stream
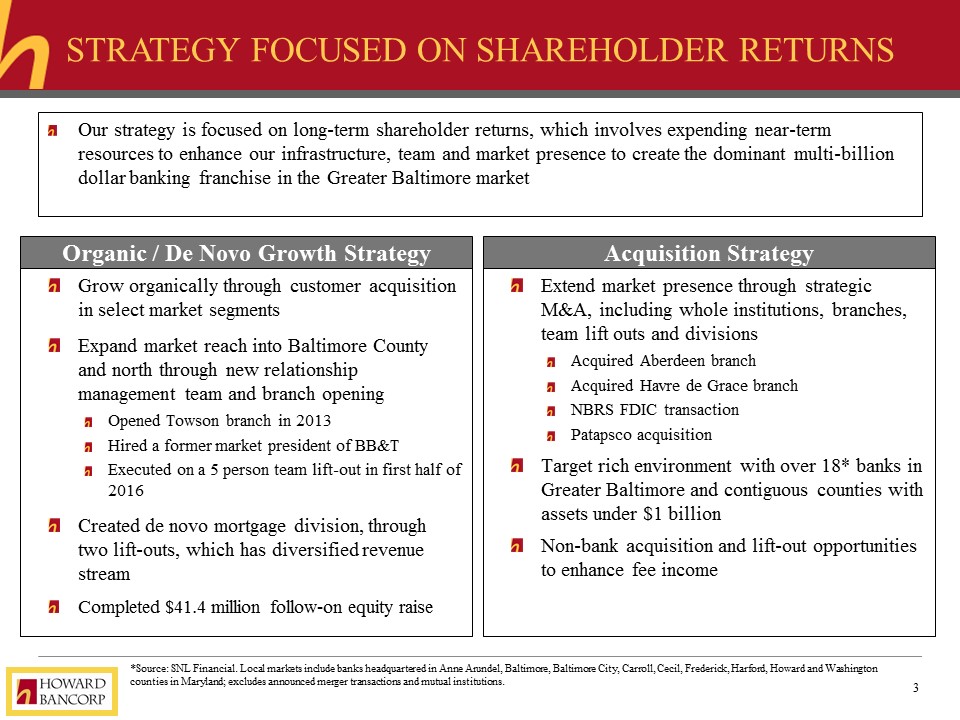
Strategy focused on shareholder returns Grow organically through customer acquisition in select market segmentsExpand market reach into Baltimore County and north through new relationship management team and branch openingOpened Towson branch in 2013Hired a former market president of BB&TExecuted on a 5 person team lift-out in first half of 2016Created de novo mortgage division, through two lift-outs, which has diversified revenue streamCompleted $41.4 million follow-on equity raise Extend market presence through strategic M&A, including whole institutions, branches, team lift outs and divisions Acquired Aberdeen branch Acquired Havre de Grace branchNBRS FDIC transactionPatapsco acquisitionTarget rich environment with over 18* banks in Greater Baltimore and contiguous counties with assets under $1 billionNon-bank acquisition and lift-out opportunities to enhance fee income Organic / De Novo Growth Strategy Acquisition Strategy Our strategy is focused on long-term shareholder returns, which involves expending near-term resources to enhance our infrastructure, team and market presence to create the dominant multi-billion dollar banking franchise in the Greater Baltimore market *Source: SNL Financial. Local markets include banks headquartered in Anne Arundel, Baltimore, Baltimore City, Carroll, Cecil, Frederick, Harford, Howard and Washington counties in Maryland; excludes announced merger transactions and mutual institutions.
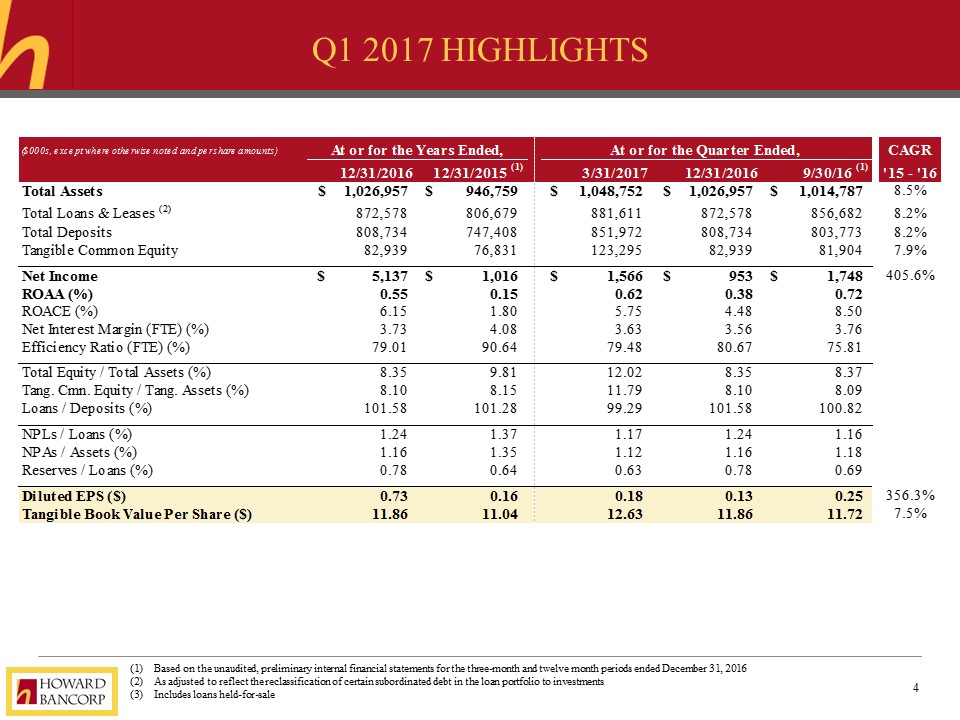
Q1 2017 Highlights Based on the unaudited, preliminary internal financial statements for the three-month and twelve month periods ended December 31, 2016As adjusted to reflect the reclassification of certain subordinated debt in the loan portfolio to investmentsIncludes loans held-for-sale
Q1 2017 Commentary Year-over-year total asset growth of 8.5% fueled by strong loan growthImprovement in year-over-year profitability metrics: 2017 Q1 ROAA of 0.62% vs 2016 ROAA of 0.55%Asset quality remained strong with a non-performing asset to total asset ratio of 1.12%2017 Q1 net interest margin of 3.68% remains strongIn the near term, our net interest margin will continue to be minimally impacted by purchase accounting adjustments from our recent acquisitionsContinued efficiency ratio improvement to under 80% into 2017, as investments in infrastructure and personnel produced positive resultsFirst quarter capital position and ratios positively impacted by the $41.4 million follow-on equity offering
Financial Overview In 2013 we acquired $37.1 million in assets from a branch purchaseIn 2014 we acquired $145.9 million in assets from NBRSIn 2015 we acquired $195.9 million in assets from PatapscoThe remaining $670 million or 64% was all through organic business development activities CAGR: 25.34% Growth: 2.61x
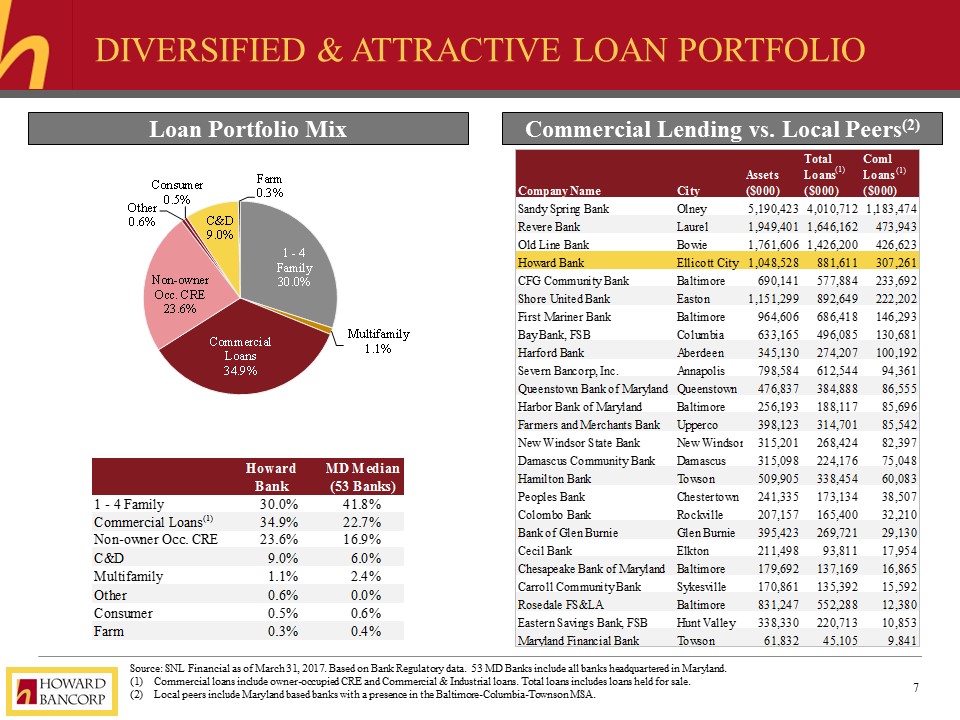
Diversified & Attractive Loan Portfolio Source: SNL Financial as of March 31, 2017. Based on Bank Regulatory data. 53 MD Banks include all banks headquartered in Maryland.Commercial loans include owner-occupied CRE and Commercial & Industrial loans. Total loans includes loans held for sale.Local peers include Maryland based banks with a presence in the Baltimore-Columbia-Townson MSA. Loan Portfolio Mix Commercial Lending vs. Local Peers(2) (1) (1) (1)
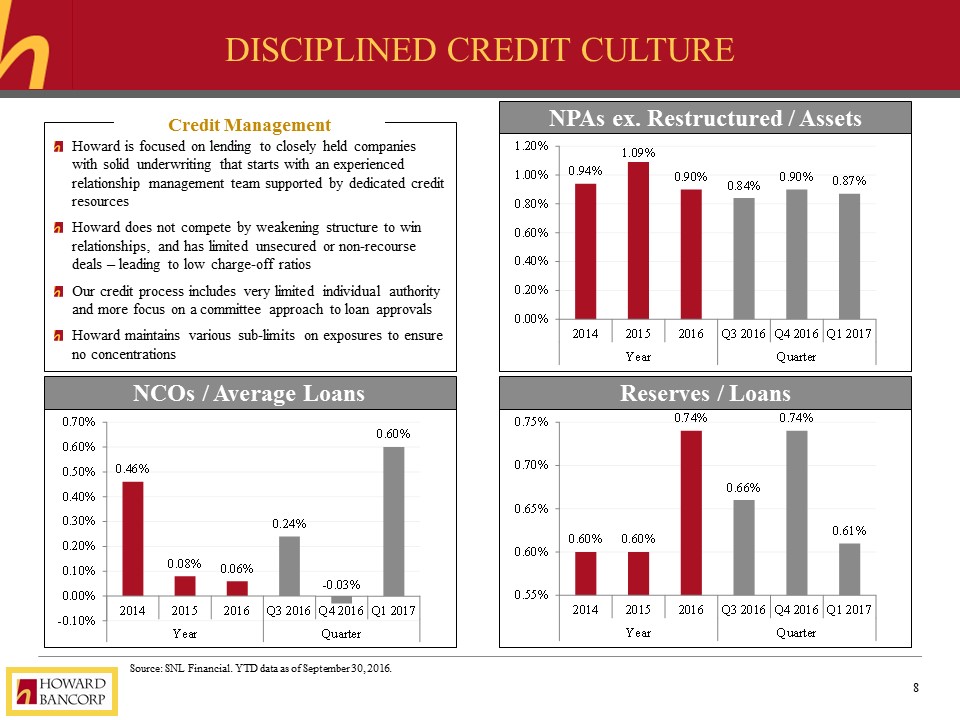
Disciplined credit culture Source: SNL Financial. YTD data as of September 30, 2016. Howard is focused on lending to closely held companies with solid underwriting that starts with an experienced relationship management team supported by dedicated credit resourcesHoward does not compete by weakening structure to win relationships, and has limited unsecured or non-recourse deals – leading to low charge-off ratios Our credit process includes very limited individual authority and more focus on a committee approach to loan approvalsHoward maintains various sub-limits on exposures to ensure no concentrations Credit Management NPAs ex. Restructured / Assets NCOs / Average Loans Reserves / Loans Howard maintains various sub-limits on exposures to ensure no concentrations
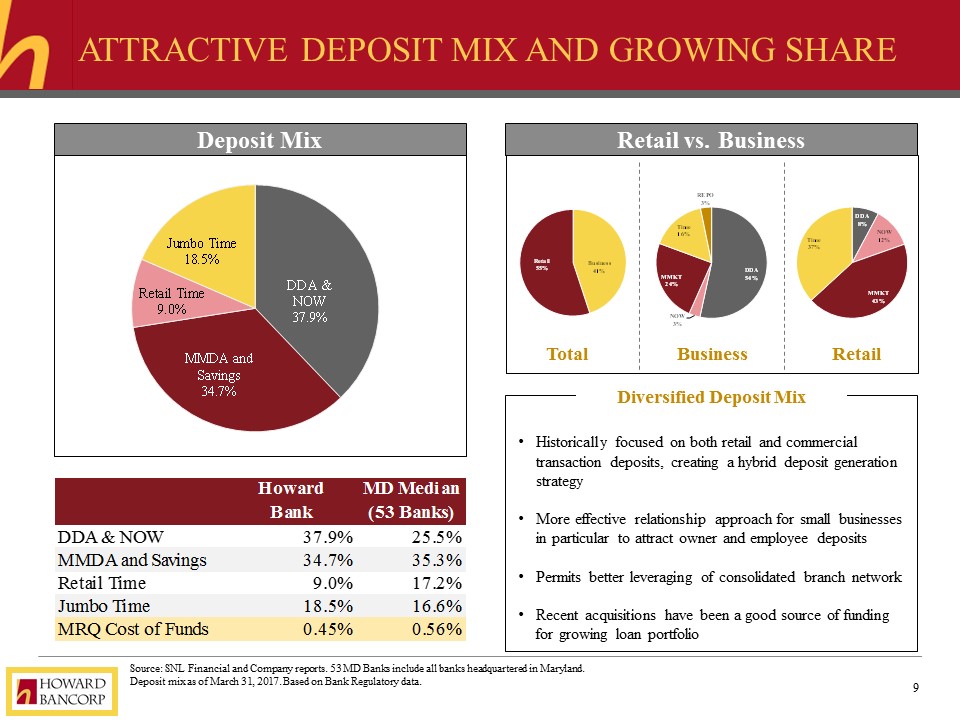
Attractive deposit mix and growing share Deposit Mix Source: SNL Financial and Company reports. 53 MD Banks include all banks headquartered in Maryland.Deposit mix as of March 31, 2017. Based on Bank Regulatory data. Historically focused on both retail and commercial transaction deposits, creating a hybrid deposit generation strategyMore effective relationship approach for small businesses in particular to attract owner and employee depositsPermits better leveraging of consolidated branch networkRecent acquisitions have been a good source of funding for growing loan portfolio Diversified Deposit Mix Retail vs. Business Total Business Retail
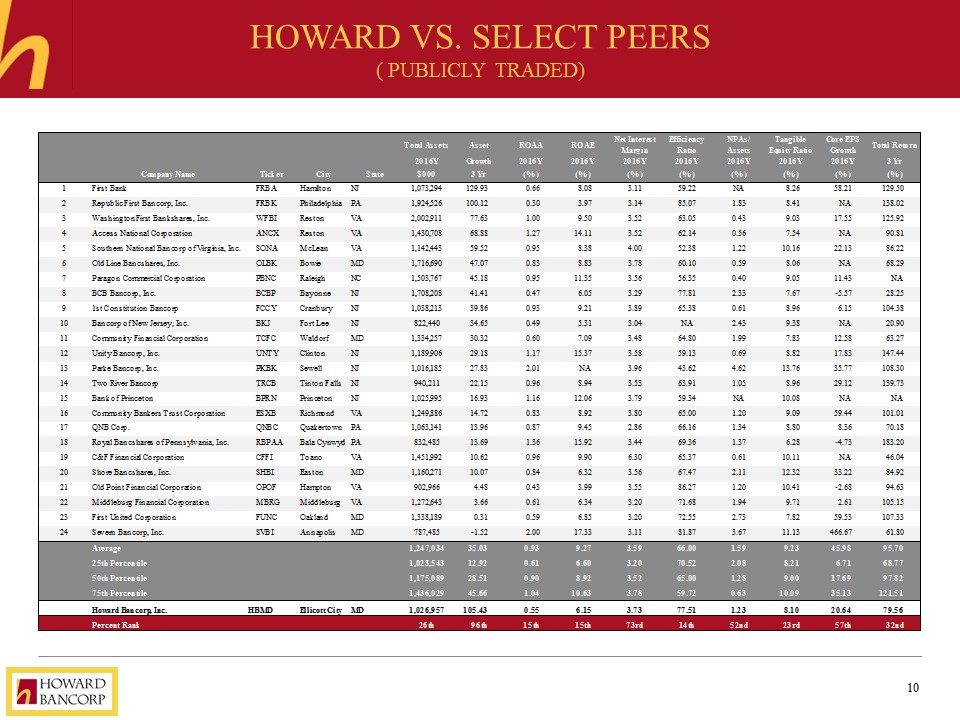
Howard vs. Select Peers( publicly traded)
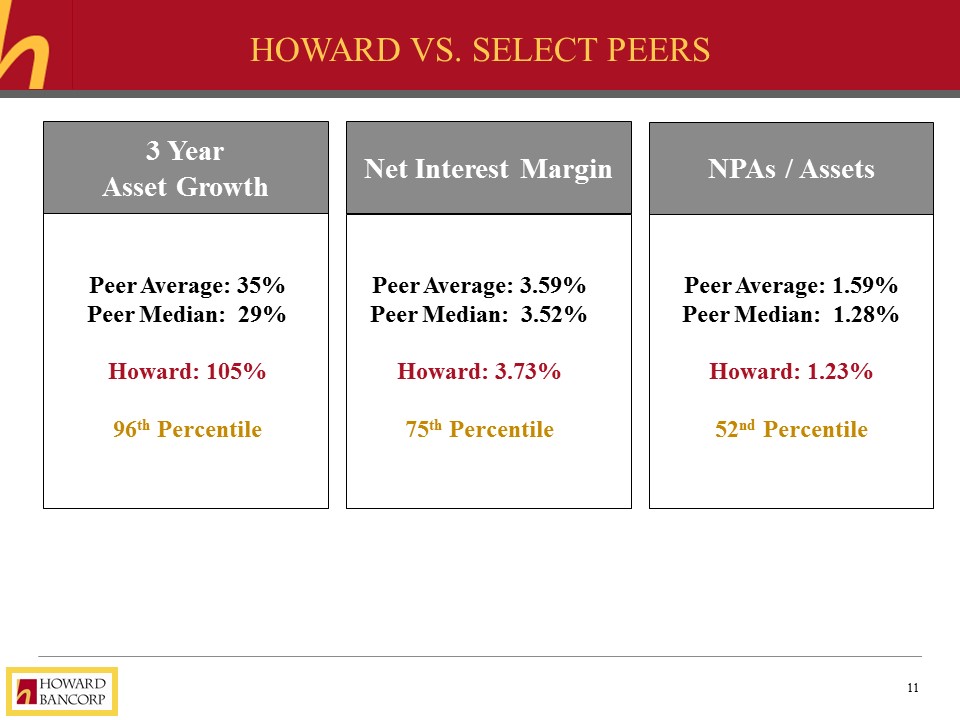
Howard vs. Select Peers Peer Average: 35%Peer Median: 29%Howard: 105%96th Percentile 3 YearAsset Growth Net Interest Margin Peer Average: 3.59%Peer Median: 3.52%Howard: 3.73%75th Percentile NPAs / Assets Peer Average: 1.59%Peer Median: 1.28%Howard: 1.23%52nd Percentile
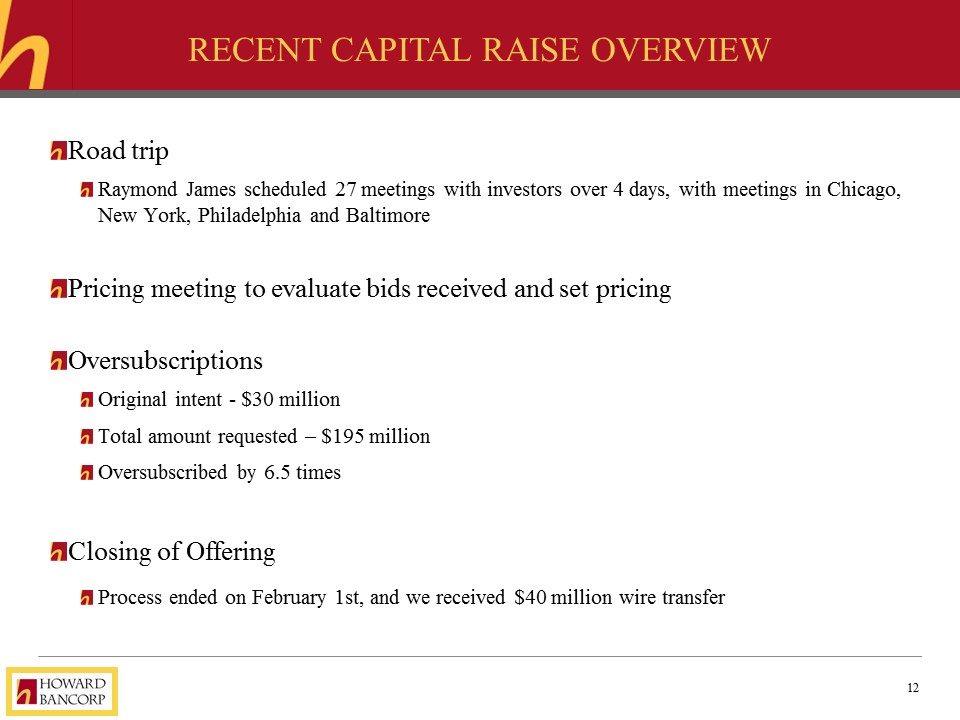
Recent Capital raise Overview Road tripRaymond James scheduled 27 meetings with investors over 4 days, with meetings in Chicago, New York, Philadelphia and BaltimorePricing meeting to evaluate bids received and set pricingOversubscriptionsOriginal intent - $30 millionTotal amount requested – $195 millionOversubscribed by 6.5 timesClosing of OfferingProcess ended on February 1st, and we received $40 million wire transfer
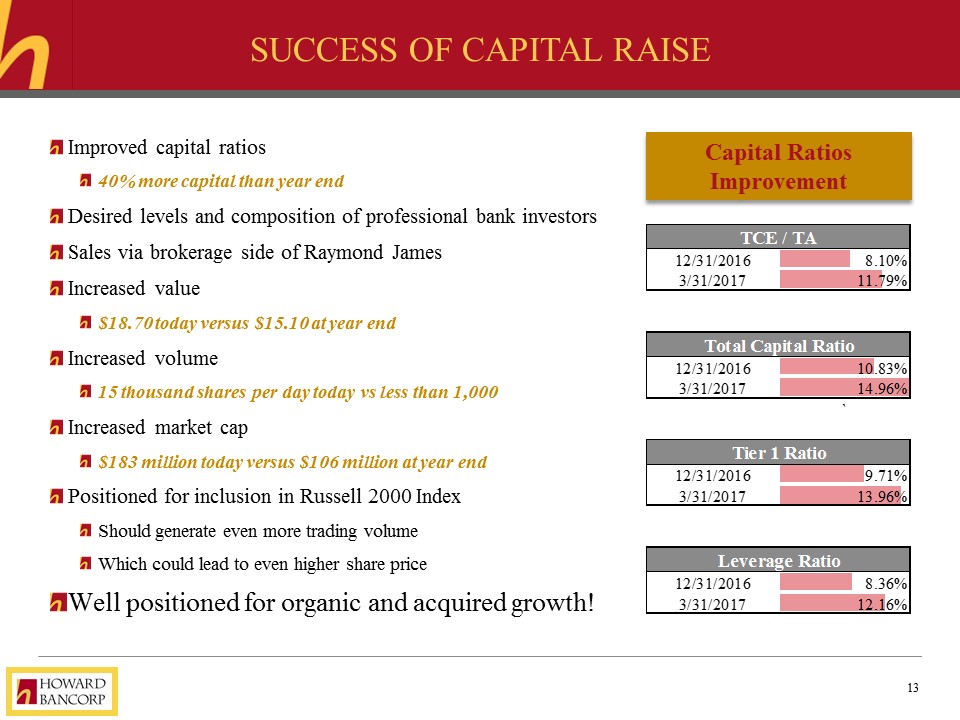
Success of Capital Raise Improved capital ratios40% more capital than year endDesired levels and composition of professional bank investorsSales via brokerage side of Raymond JamesIncreased value$18.70 today versus $15.10 at year end Increased volume15 thousand shares per day today vs less than 1,000Increased market cap$183 million today versus $106 million at year endPositioned for inclusion in Russell 2000 IndexShould generate even more trading volumeWhich could lead to even higher share priceWell positioned for organic and acquired growth! Capital Ratios Improvement
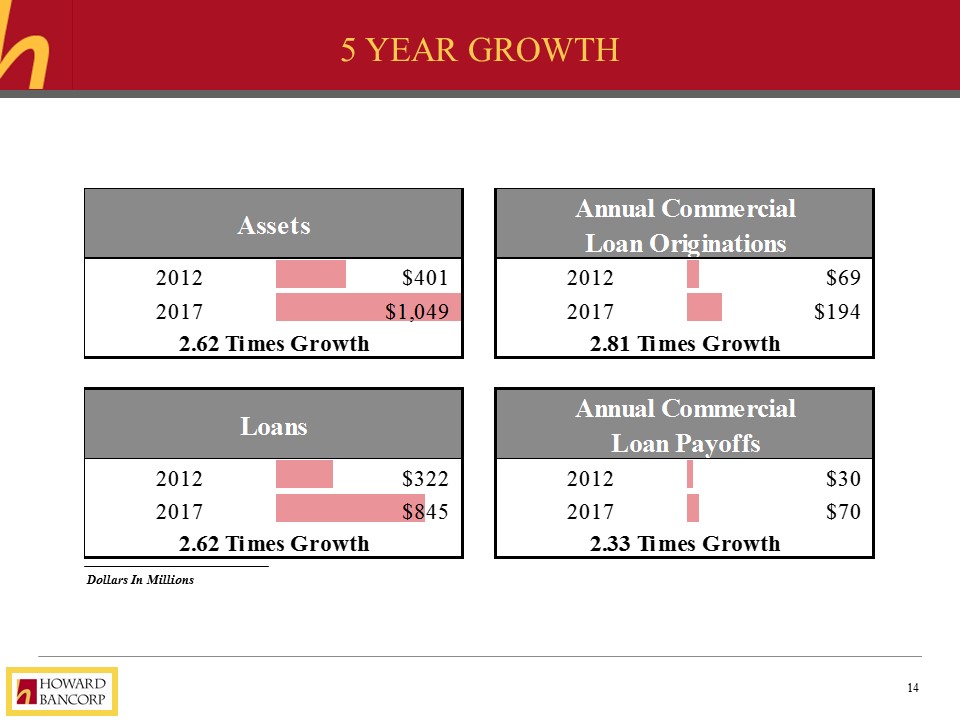
Dollars In Millions 5 Year Growth
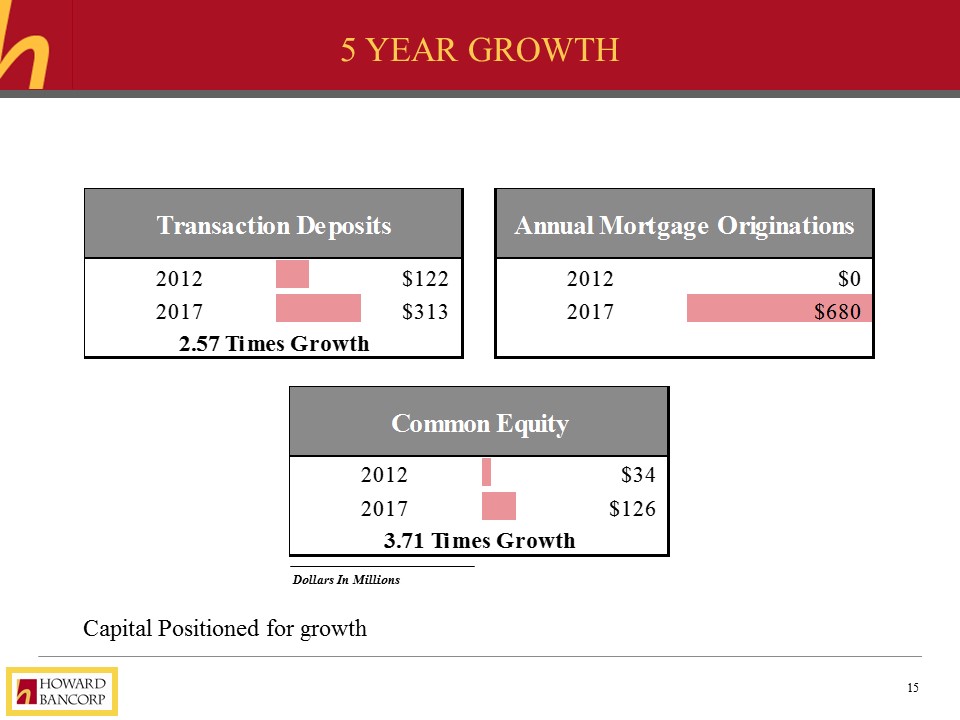
5 Year Growth Dollars In Millions Capital Positioned for growth
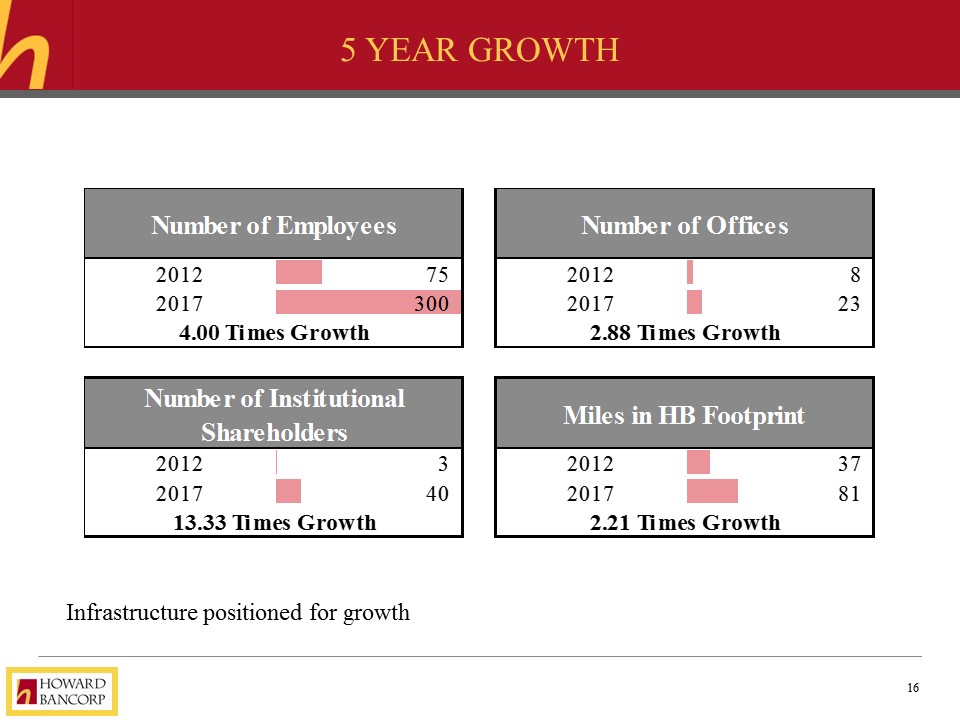
5 Year Growth Infrastructure positioned for growth
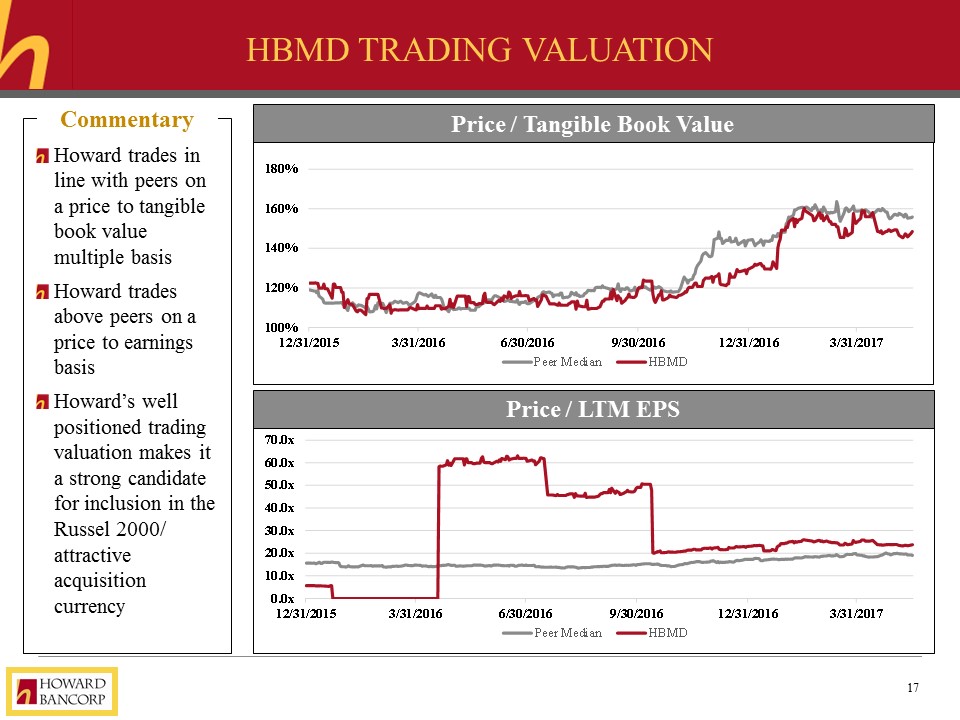
HBMD Trading Valuation Price / Tangible Book Value Price / LTM EPS Howard trades in line with peers on a price to tangible book value multiple basisHoward trades above peers on a price to earnings basisHoward’s well positioned trading valuation makes it a strong candidate for inclusion in the Russel 2000/ attractive acquisition currency Commentary
Thank You Thank you for attending our annual meeting of shareholdersThank you for your continued support