Attached files
| file | filename |
|---|---|
| 8-K - 8-K - FARMER BROTHERS CO | form8-kinvestorpresentatio.htm |

May 2017INVESTOR PRESENTATION

Certain statements contained in this presentation are not based on historical fact and are forward-looking statements within the meaning
of federal securities laws and regulations. These statements are based on management’s current expectations, assumptions, estimates
and observations of future events and include any statements that do not directly relate to any historical or current fact; actual results may
differ materially due in part to the risk factors set forth in our most recent 10-K and 10-Q filings. These forward-looking statements can be
identified by the use of words like “anticipates,” “estimates,” “projects,” “expects,” “plans,” “believes,” “intends,” “will,” “assumes” and other
words of similar meaning. Owing to the uncertainties inherent in forward-looking statements, actual results could differ materially from
those set forth in forward-looking statements. We intend these forward-looking statements to speak only at the time of this presentation
and do not undertake to update or revise these statements as more information becomes available except as required under federal
securities laws and the rules and regulations of the SEC. Factors that could cause actual results to differ materially from those in forward-
looking statements include, but are not limited to, the timing and success of the Company’s Corporate Relocation Plan, the timing and
success of the Company in realizing estimated savings from third party logistics and vendor managed inventory, the realization of the
Company’s cost savings estimates, the relative effectiveness of compensation-based employee incentives in causing improvements in
Company performance, the capacity to meet the demands of the Company’s large national account customers, the extent of execution of
plans for the growth of Company business and achievement of financial metrics related to those plans, the effect of the capital markets as
well as other external factors on stockholder value, fluctuations in availability and cost of green coffee, competition, organizational
changes, our ability to retain employees with specialized knowledge, the effectiveness of our hedging strategies in reducing price risk,
changes in consumer preferences, our ability to provide sustainability in ways that do not materially impair profitability, changes in the
strength of the economy, business conditions in the coffee industry and food industry in general, our continued success in attracting new
customers, variances from budgeted sales mix and growth rates, weather and special or unusual events, changes in the quality or dividend
stream of third parties’ securities and other investment vehicles in which we have invested our assets, as well as other risks described in
this report and other factors described from time to time in our filings with the SEC.
Note: All of the financial information presented herein is unaudited.
2
FORWARD-LOOKING STATEMENTS
* Source : 2016 Nielsen Retail Report
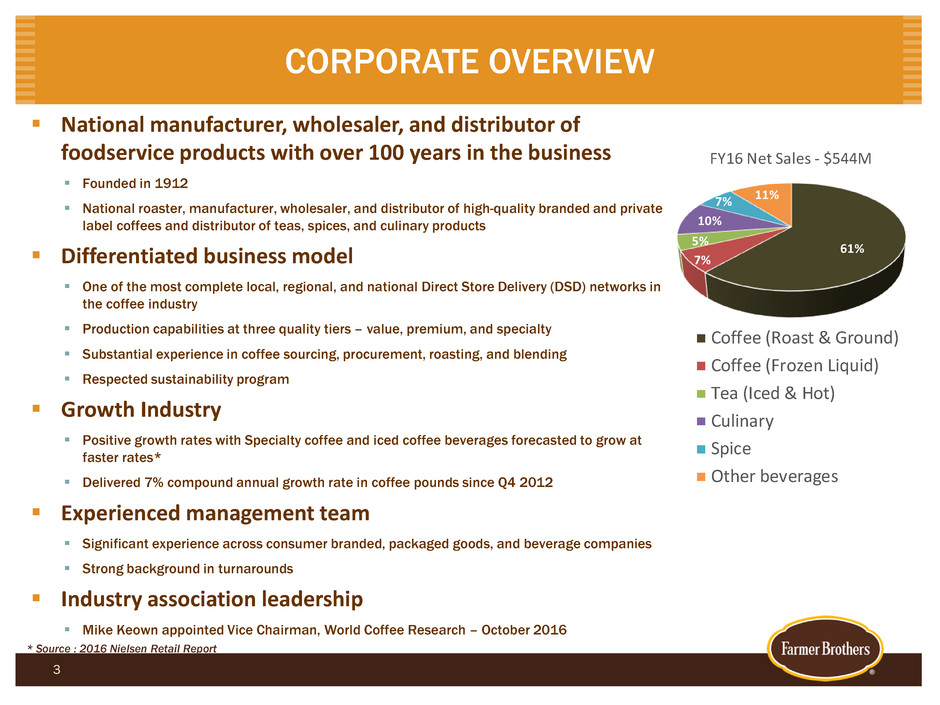
61%
7%
5%
10%
7% 11%
FY16 Net Sales - $544M
Coffee (Roast & Ground)
Coffee (Frozen Liquid)
Tea (Iced & Hot)
Culinary
Spice
Other beverages
National manufacturer, wholesaler, and distributor of
foodservice products with over 100 years in the business
Founded in 1912
National roaster, manufacturer, wholesaler, and distributor of high-quality branded and private
label coffees and distributor of teas, spices, and culinary products
Differentiated business model
One of the most complete local, regional, and national Direct Store Delivery (DSD) networks in
the coffee industry
Production capabilities at three quality tiers – value, premium, and specialty
Substantial experience in coffee sourcing, procurement, roasting, and blending
Respected sustainability program
Growth Industry
Positive growth rates with Specialty coffee and iced coffee beverages forecasted to grow at
faster rates*
Delivered 7% compound annual growth rate in coffee pounds since Q4 2012
Experienced management team
Significant experience across consumer branded, packaged goods, and beverage companies
Strong background in turnarounds
Industry association leadership
Mike Keown appointed Vice Chairman, World Coffee Research – October 2016
3
CORPORATE OVERVIEW

4
COFFEE CONSUMPTION TRENDS
Sources : The Hartman Group, SCAA, Datassential, Mintel
CONSUMPTION & OCCASION
Gourmet penetration has surpassed traditional coffee
among Millennials
Specialty coffee consumption surpassed “traditional”
coffee in 2014 and has remained steady
“SPECIALTY”IZATION COLD BREW
26%
22%
16%
9%
12%
7%
8%
Early Morning
With Breakfast
Mid-Morning
Lunch
Afternoon
Dinner
Evening/Night
Coffee is no longer just a “morning” drink.
% Consuming Any Coffee
B
EV
ER
A
G
E
TY
P
ES
Traditional
Coffee – Not
Gourmet
Gourmet
Coffee
Beverages
18-24 (A)
25-39 (B)
40-59 (C)
60+ (D)
33
43
44
53
56CD
58CD
36
33
$7.9M retail sales
339% growth since 2010
Quality improving; line
extensions hitting the market
(e.g., nitro brew)
115% Growth (All Channels ‘15)

5
2017 MEGA COFFEE TRENDS
Source : Datassential Foodbytes; June 2015; July 2015
Reuse & Upcycle
Farmers use the coffee cherry skins to
produce coffee flour so they can use it
for baking
Consumers enjoyed steeped skins
(Cascara) as an emerging specialty
beverage
Next: Cascara sodas and
adult beverages
According to Mintel research, 57% of consumers say they are adventurous eaters while 82% claim to be open to trying new flavors.
The millennial generation has proven to be the most adventurous, driving the growth of ethnic flavors in retail and foodservice.
Farmer to Consumer Beneficial Cred Processing Protocol
Cold Brew Culinary Elite Flavor(full)
Coffee Reputation gets a healthy
boost
Off the line: Bulletproof Coffee
Media Blitz on healthy benefits
Further support from health Experts
(Webmd, Mayo Clinic)
Focus: Phytochemicals &
Caffeine
Pre-Harvest to Pre-Cup
Coffee houses are beginning to
entice consumers by promoting
“least processed”
This is new-age transparency
that furthers authenticity and
goodwill
Nitro Goes Mainstream
• Small but expanding as early adopters
drive growth
• Reduces need for sweetener due to
creamy mouthful
• RTD options starting to surface.
Will they make the grade?
Coffee as Culinary Star
Coffee becomes a go-to ingredient for
chefs, making an increased
appearance on menus.
Trending: Food & Alcohol pairings,
Season pushes; varietals
Flavor with Purpose
Consumers seeking health benefits
and flavors as a single solution
Coffee & tea offer a viable foundation
Trending: Ethnic spices, seeds, nut
milks, antioxidants, flavanoids

6
MULTI-TIER COFFEE & TEA PORTFOLIO
TRADITIONAL — Traditional coffees for the classic consumer
SPECIALTY — Handcrafted. Fresh. Sustainable.
Product Categories
PREMIUM — Fresh. Contemporary. Diverse.
SPECIALTY — Handcrafted. Fresh. Sustainable.
TRADITIONAL — Traditional coffees for the classic consumer

7
PRIVATE BRAND PROGRAM DEVELOPMENT

8
NATIONWIDE DISTRIBUTION NETWORK
7 Manufacturing Facilities/Distribution Centers and 114 branch warehouses
Manufacturing Facility
Distribution Center
Branch Location
9
OUR SUSTAINABILITY PROGRAMS
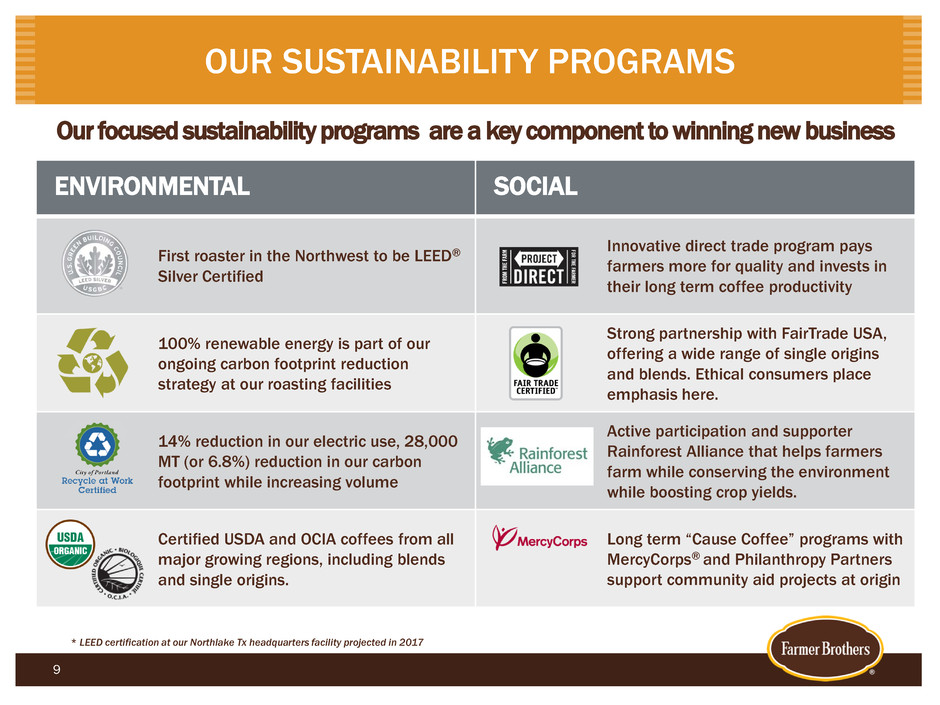
Our focused sustainability programs are a key component to winning new business
ENVIRONMENTAL SOCIAL
First roaster in the Northwest to be LEED®
Silver Certified
Innovative direct trade program pays
farmers more for quality and invests in
their long term coffee productivity
100% renewable energy is part of our
ongoing carbon footprint reduction
strategy at our roasting facilities
Strong partnership with FairTrade USA,
offering a wide range of single origins
and blends. Ethical consumers place
emphasis here.
14% reduction in our electric use, 28,000
MT (or 6.8%) reduction in our carbon
footprint while increasing volume
Active participation and supporter
Rainforest Alliance that helps farmers
farm while conserving the environment
while boosting crop yields.
Certified USDA and OCIA coffees from all
major growing regions, including blends
and single origins.
Long term “Cause Coffee” programs with
MercyCorps® and Philanthropy Partners
support community aid projects at origin
* LEED certification at our Northlake Tx headquarters facility projected in 2017

Name Title Prior Experience
Mike Keown President and Chief Executive Officer
David Robson Treasurer and Chief Financial Officer
Tom Mattei General Counsel and Assistant Secretary
Ellen Iobst Chief Operations Officer
Scott Bixby Senior Vice President/General Manager of DSD
Scott Siers Senior Vice President/General Manager of Direct-Ship
Gerard Bastiaanse Senior Vice President, Marketing
Suzanne Gargis Vice President, Human Resources
EXPERIENCED SENIOR MANAGEMENT TEAM
Note: The marks displayed above are the properties of these companies. Use in this presentation does not imply endorsement of this presentation.
10

World Coffee Research
Mike Keown appointed Vice Chairman of the Board of Directors
Specialty Coffee Association of Sustainability Council
Council Member
Pacific Coast Coffee Association
Board Member
Roasters Guild
Charitable Support
Coalition for Coffee Communities Board Member
FMI Leadership Counsel, Feeding America
11
INDUSTRY ASSOCIATION LEADERSHIP
The marks displayed above are the properties of those organizations.

May 2017MOVING FORWARD

13
CURRENT STRATEGIC OBJECTIVES
Increase production efficiency to improve competitiveness
Completed Corporate Relocation Plan
Implement supply chain cost reduction and efficiency initiatives
Leverage ERP system to reduce unnecessary costs
Maintain quality reputation as a competitive strength
Improve planning, forecasting, and further simplifying the supply chain
Reassess work processes
Drive volume growth from a larger national account base and enhance
teamwork across the National Account and DSD organizations
Redefine the DSD Model
Announced restructuring of the Company’s DSD sales model in February 2017
Leverage mobile sales and fleet routing tools to improve efficiency
Invest in high-growth and profitable markets and consider leaving low-profit markets
Continue to pursue strategies to improve or create profitable scale in targeted markets

Positive industry trends
~3-5% aggregate annual growth rates expected with specialty coffee and iced coffee
beverages growing at higher rates1
Consumption dynamic changing
Large addressable market
Potential market share improvement through new customers and territory objectives
Currently hold small percentage of the addressable market
Less than 1% market share2
Capitalize on consumers increasing interest in sustainability
Market continues to expand with new categories and products
Ice coffee, cold brew, premium coffee channels
Opportunistic M&A activities
Fragmented market with many regional players
Strong balance sheet and equity position
Low debt, with net borrowings net of cash and short term investments of $12.0 million as of
March 31, 2017
Additional borrowing capacity, with a $75.0 million revolving credit facility and a $50.0 million
accordion feature in place
$13.1m in availability as of 3/31/17
14
GROWTH EXPANSION OPPORTUNITIES
Source : (1) 2016 Nielsen Retail Report (2) Specialty Coffee Association of American Dec 2015

Strengthened management team
Adding talent to manage for future growth
Expertise in turnaround stories
Recently announced supply chain rationalization/simplification
DSD restructure targets annual savings of $2.0 million - $2.6 million to be realized fully
by fiscal Q2-18 after incurring 1x costs of $3.7 million - $4.9 million
Better addresses unique needs of customers and quicker response to industry trends
Recent customer wins in fiscal 2017
Examples: Allsup, SSP, Comcast, Skyline Healthcare, Stop N Save convenience stores
Enhanced specialty coffee program and resources
Added new capabilities – i.e., in national account sales, sustainability
Expanded grower sustainability programs at home and abroad
15
RECENT ACCOMPLISHMENTS

New HQ and distribution center in Northlake, Texas up and running
Effectively transitioned all remaining key functions into the new facility
Installed roasters in new state-of-the-art facility
Expect to be fully operational by fiscal year end 2017
Annual savings estimated $18 million - $20 million
Third Party Logistics (3PL) for long-haul deliveries added
Vendor - managed inventories added for select items
Closure of Torrance facility has driven improvement in Gross Margin
Expect to realize full savings by the back half of FY2018
Recently consolidated Oklahoma Distribution Center activity into our Northlake, Texas Distribution
Center
$3 – $5m in savings expected to be realized in FY18
Restructuring costs related to corporate relocation plan estimated at $31.6
million cash costs
$30.7 million of cash costs recognized through Q3 2017
Continue to assess manufacturing, distribution, and supply chain activities for
additional savings
16
CORPORATE RELOCATION PLAN

China Mist Brands, Inc.
Acquired October 2016 for ~$11.2 million including working
capital adjustments (before earnout)
Strong premium tea brand
Fast growing market segment
National distribution in over 20,000 foodservice locations
Strong management team
West Coast Coffee
Acquired in February 2017 for ~$14.7 million including
working capital adjustments (before earnout)
Portland, Oregon-based coffee manufacturer and distributor
Primarily focused on convenience store, grocery and
foodservice channels
Distribution to over 2,000 locations
Broadens Farmer Bros.’ reach in Northwest
17
RECENT ACQUISITIONS

May 2017FINANCIAL OVERVIEW
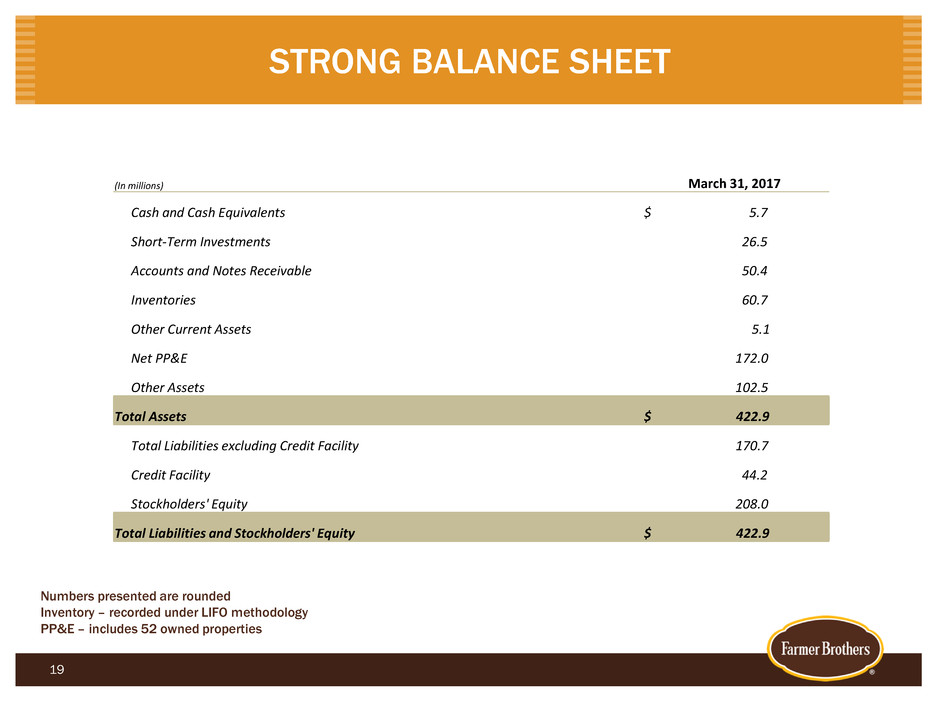
STRONG BALANCE SHEET
Numbers presented are rounded
Inventory – recorded under LIFO methodology
PP&E – includes 52 owned properties
19
(In millions) March 31, 2017
Cash and Cash Equivalents $ 5.7
Short-Term Investments 26.5
Accounts and Notes Receivable 50.4
Inventories 60.7
Other Current Assets 5.1
Net PP&E 172.0
Other Assets 102.5
Total Assets $ 422.9
Total Liabilities excluding Credit Facility 170.7
Credit Facility 44.2
Stockholders' Equity 208.0
Total Liabilities and Stockholders' Equity $ 422.9
20
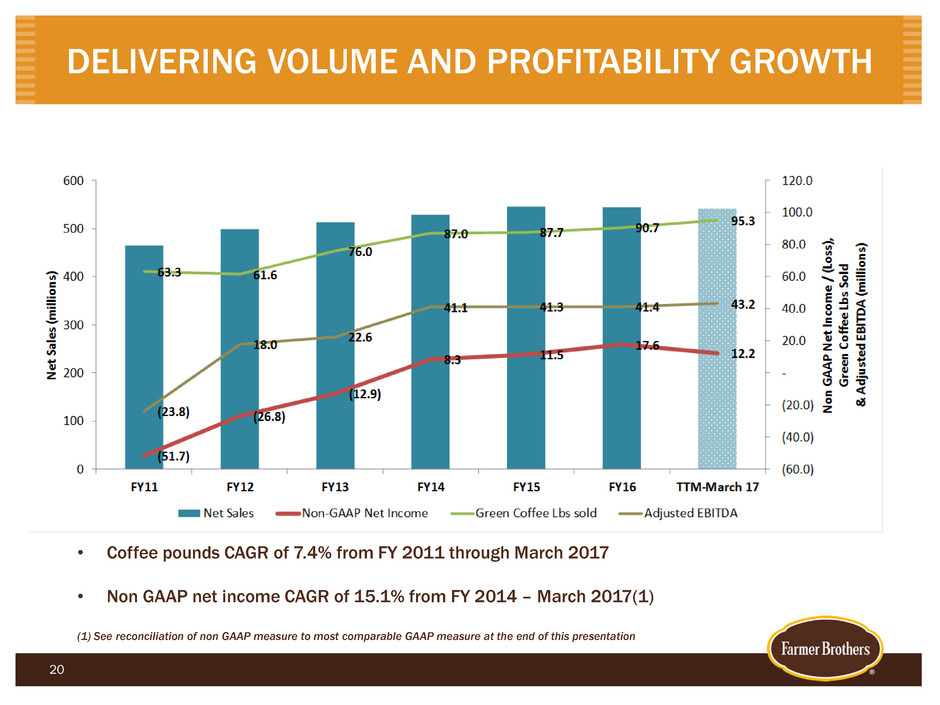
DELIVERING VOLUME AND PROFITABILITY GROWTH
• Coffee pounds CAGR of 7.4% from FY 2011 through March 2017
• Non GAAP net income CAGR of 15.1% from FY 2014 – March 2017(1)
(1) See reconciliation of non GAAP measure to most comparable GAAP measure at the end of this presentation

21
FY 18 OUTLOOK
We believe we can grow coffee pounds at market rates or faster
Our acquisition of China Mist provides new opportunities to expand tea products across our existing
customer base as well as increase coffee penetration within China Mist’s existing customer base
Net revenues outside of tea and coffee are expected to grow at slower rates
We currently believe that gross margins in FY 18 will be impacted by approximately 60 – 80bps from
higher depreciation at our new Northlake, Tx facilities
We currently believe that gross margin dollars are expected to grow approximately in the 2% - 3%
range
We anticipate continued adjusted EBITDA growth, improving 50bps to 100bps in FY 18 over FY 17
Expected cash tax rate of 3% - 4% with $66m in deferred tax assets remaining to utilize
Annual maintenance CapX of $20m - $22m anticipated for FY18
Investment CapX for FY18 still under review
We expect that our strong balance sheet would allow us to pursue opportunistic acquisitions or future
investment in our production facilities

Strong product market with growing categories
Increased coffee and tea consumption
Upgrading manufacturing facilities and distribution practices
New Northlake facility can initially increase system wide roasting capacity by up to 25%
to support increased demand with longer term potential to nearly double capacity
Initiating programs to win new customers
Cost and innovation programs
Coffee sourcing leadership
Sustainability leadership
Strong senior management with experience in turnarounds
Acquiring select capabilities and brands to broaden our reach
China Mist Brands – acquired October 2016
West Coast Coffee – acquired February 2017
KEY ACTIVITIES TO PROPEL FUTURE GROWTH
Positioning Farmer Bros. for Profitable Revenue Growth
22

May 2017INVESTOR PRESENTATION
APPENDIX

25
MOST RECENT RESULTS – Q3 2017 VS Q3 2016
Green coffee pounds increased 6.9%
Revenue increased 2.8%
Solid margins of 38.9%, essentially flat with last year when excluding start up
costs for our new Northlake facility
EBITDA increased 52.7%
Adjusted EBITDA increased 24.0%
Adjusted EBITDA margin increased to 8.8%, or 150 bps, over last year and the
highest EBITDA % performance this year
Adjusted EBITDA dollars reached $12.2m Vs. $9.8M last year

Three Months Ended March 31,
(In thousands, except per share data) 2017 2016 Y-o-Y Change
Income statement data:
Net sales $ 138,187 $ 134,468 2.80%
Gross margin 38.9% 39.1% -20 bps
Income from operations $ 2,058 $ 306 572.50%
Net income $ 1,594 $ 1,192 33.70%
Net income per common share—diluted $ 0.10 $ 0.07 $ 0.03
Operating data:
Coffee pounds 24,395 22,821 6.90%
Non-GAAP net income $ 3,049 $ 4,022 -24.20%
Non-GAAP net income per diluted common share $ 0.17 $ 0.24 $ (0.07)
EBITDA $ 10,049 $ 6,580 52.70%
EBITDA Margin 7.30% 4.90% +240 bps
Adjusted EBITDA $ 12,180 $ 9,820 24.00%
Adjusted EBITDA Margin 8.80% 7.30% +150 bps
Balance sheet and other data:
Total capital expenditures excluding new facility $ 6,421 $ 2,876 123.30%
Total capital expenditures $ 13,503 $ 12,564 7.50%
Depreciation and amortization expense $ 6,527 $ 5,234 24.70%
SELECTED FINANCIAL DATA
26

Q3 FY17 STATEMENTS OF OPERATIONS
Three Months Ended March 31, Nine Months Ended March 31,
($ in thousands, except per share data) 2017 2016 2017 2016
Net sales $ 138,187 $ 134,468 $ 407,700 $ 410,220
Cost of goods sold 84,367 81,908 247,586 254,173
Gross profit 53,820 52,560 160,114 156,047
GM 38.9 % 39.1 % 39.3 % 38.0 %
Selling expenses 40,377 38,447 117,912 112,741
General and administrative expenses 9,196 10,977 31,925 29,951
Restructuring and other transition expenses 2,547 3,169 9,542 13,855
Net gain from sale of Torrance Facility — — (37,449) —
Net gains from sales of Spice Assets (272) (335) (764) (5,441)
Net gains from sales of assets-other (86) (4) (1,525) (163)
Operating expenses 51,762 52,254 119,641 150,943
Income from operations 2,058 306 40,473 5,104
Other income (expense):
Dividend income 273 288 808 840
Interest income 147 139 435 359
Interest expense (517) (111) (1,430) (341)
Other, net 1,044 613 (1,088) 35
Total other income (expense) 947 929 (1,275) 893
Income before taxes 3,005 1,235 39,198 5,997
Income tax expense 1,411 43 15,910 318
Net income $ 1,594 $ 1,192 $23,288 $5,679
Basic net income per common share $ 0.10 $ 0.07 $ 1.40 $ 0.34
Diluted net income per common share $ 0.10 $ 0.07 $ 1.39 $ 0.34
Weighted average common shares outstanding—basic
16,605,754 16,539,479 16,584,125 16,486,469
Weighted average common shares outstanding—diluted
16,721,774 16,647,415 16,704,200 16,614,275
27
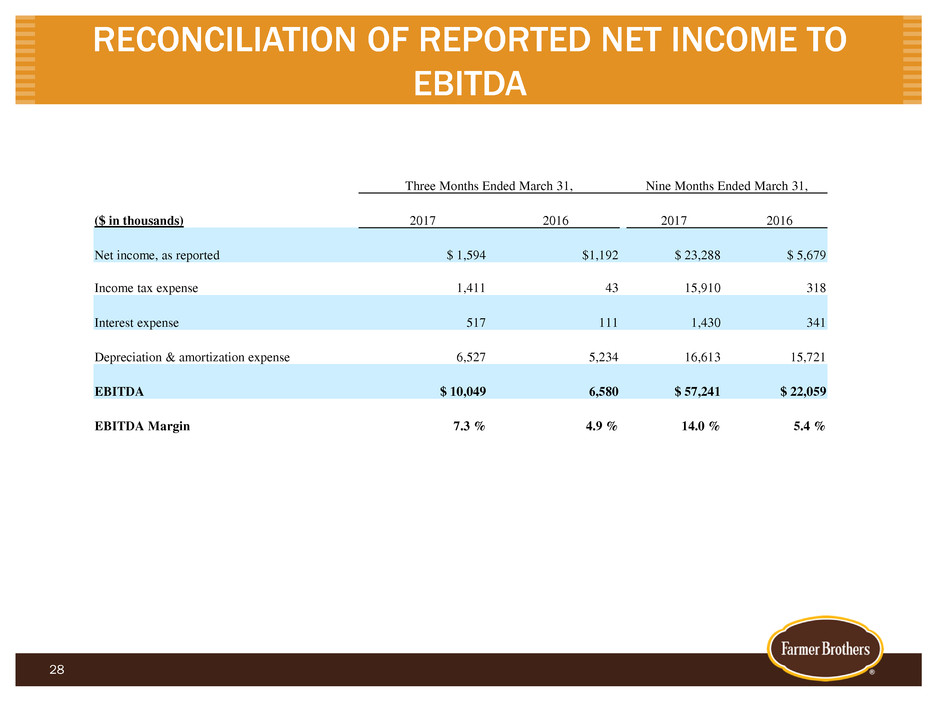
RECONCILIATION OF REPORTED NET INCOME TO
EBITDA
Three Months Ended March 31, Nine Months Ended March 31,
($ in thousands) 2017 2016 2017 2016
Net income, as reported $ 1,594 $1,192 $ 23,288 $ 5,679
Income tax expense 1,411 43 15,910 318
Interest expense 517 111 1,430 341
Depreciation & amortization expense 6,527 5,234 16,613 15,721
EBITDA $ 10,049 6,580 $ 57,241 $ 22,059
EBITDA Margin 7.3 % 4.9 % 14.0 % 5.4 %
28
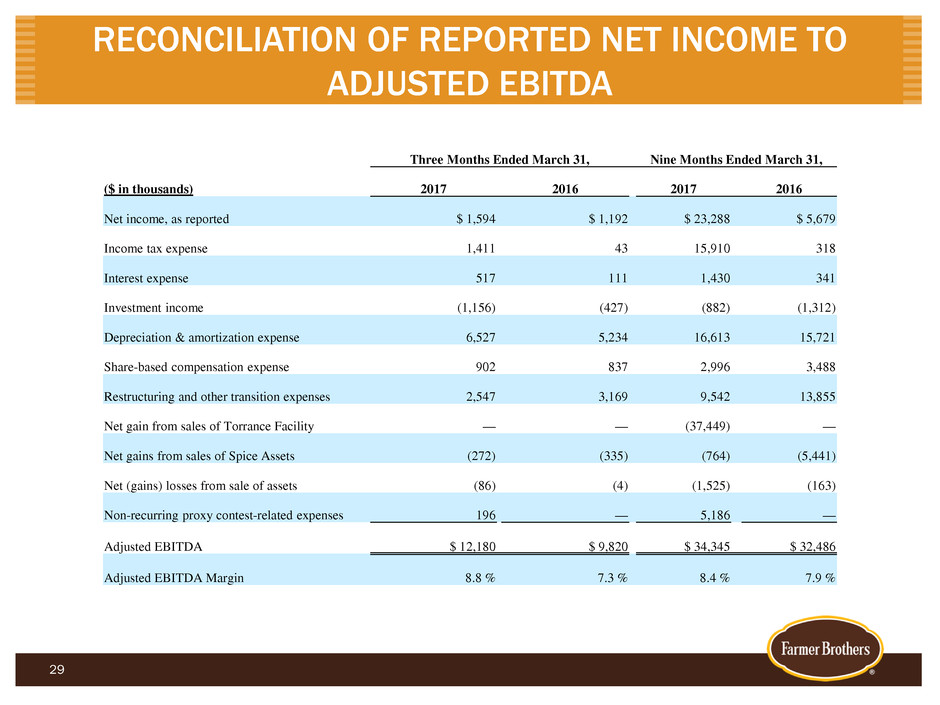
RECONCILIATION OF REPORTED NET INCOME TO
ADJUSTED EBITDA
Three Months Ended March 31, Nine Months Ended March 31,
($ in thousands) 2017 2016 2017 2016
Net income, as reported $ 1,594 $ 1,192 $ 23,288 $ 5,679
Income tax expense 1,411 43 15,910 318
Interest expense 517 111 1,430 341
Investment income (1,156) (427) (882) (1,312)
Depreciation & amortization expense 6,527 5,234 16,613 15,721
Share-based compensation expense 902 837 2,996 3,488
Restructuring and other transition expenses 2,547 3,169 9,542 13,855
Net gain from sales of Torrance Facility — — (37,449) —
Net gains from sales of Spice Assets (272) (335) (764) (5,441)
Net (gains) losses from sale of assets (86) (4) (1,525) (163)
Non-recurring proxy contest-related expenses 196 — 5,186 —
Adjusted EBITDA $ 12,180 $ 9,820 $ 34,345 $ 32,486
Adjusted EBITDA Margin 8.8 % 7.3 % 8.4 % 7.9 %
29

RECONCILIATION OF REPORTED NET INCOME TO
NON-GAAP NET INCOME
30
($ in thousands) 2017 2016 2017 2016
Net income, as reported 1,594$ 1,192$ 23,288$ 5,679$
Non-recurring proxy contest-related expense 196 — 5,186 —
Restructuring and other transition expenses 2,547 3,169 9,542 13,855
Net gain from sales of Torrance Facility — — (37,449) —
Net gains on Spice Assets (272) (335) (764) (5,441)
Net (gains) losses on sale of assets-other (86) (4) (1,525) (163)
Interest expense on sale-leaseback financing
obligations — — 681 —
Tax impact of non-GAAP adjustments (930) — 9,488 —
Non-GAAP net income 3,049$ 4,022$ 8,447$ 13,930$
Weighted average common shares
outstanding—basic 16,605,754 16,539,479 16,584,125 16,486,469
Weighted average common shares
outstanding—diluted 16,721,774 16,647,415 16,704,200 16,614,275
GAAP net income per common share—diluted 0.10$ 0.07$ 1.39$ 0.34$
Impact of expenses related to additional
resources for proxy contest 0.01$ —$ 0.31$ —$
Impact of restructuring and other transition
expenses 0.15$ 0.19$ 0.57$ 0.83$
Impact of gain on sale of Torrance Facility —$ —$ (2.24)$ —$
Impact of gains from sale of Spice Assets (0.02)$ (0.02)$ (0.05)$ (0.33)$
Impact of net (gains) losses on sale of assets (0.01)$ (0.00)$ (0.09)$ (0.01)$
Impact of interest expense on sale-leaseback
financing obligation —$ —$ 0.04$ —$
Impact of income taxes on non-GAAP
adjustments (0.06)$ —$ 0.57$ —$
Non-GAAP net income per common
share—diluted 0.17$ 0.24$ 0.50$ 0.83$
Three Months Ended March 31, Nine Months Ended March 31,

May 2017INVESTOR PRESENTATION
