Attached files
| file | filename |
|---|---|
| 8-K - 8-K - JETBLUE AIRWAYS CORP | form8-kxwolfeconference052.htm |

1
10TH ANNUAL WOLFE RESEARCH
GLOBAL TRANSPORTATION CONFERENCE
MAY 23, 2017
2
SAFE HARBOR
This presentation contains forward-looking statements within the meaning of the Private Securities Litigation Reform Act of 1995, Section 27A of the
Securities Act of 1933, as amended, or the Securities Act, and Section 21E of the Securities Exchange Act of 1934, as amended, or the Exchange Act,
which represent our management's beliefs and assumptions concerning future events. When used in this document and in documents incorporated
herein by reference, the words “expects,” “plans,” “anticipates,” “indicates,” “believes,” “forecast,” “guidance,” “outlook,” “may,” “will,” “should,” “seeks,”
“targets” and similar expressions are intended to identify forward-looking statements. Forward-looking statements involve risks, uncertainties and
assumptions, and are based on information currently available to us. Actual results may differ materially from those expressed in the forward-looking
statements due to many factors, including, without limitation, our extremely competitive industry; volatility in financial and credit markets which could
affect our ability to obtain debt and/or financing or to raise funds through debt or equity issuances; volatility in fuel prices, maintenance costs and interest
rates; our ability to implement our growth strategy; our significant fixed obligations and substantial indebtedness; our ability to attract and retain qualified
personnel and maintain our culture as we grow; our reliance on high daily aircraft utilization; our dependence on the New York and Boston metropolitan
markets and the Northeast Corridor of the United States and the effect of increased congestion in these markets; our reliance on automated systems and
technology; our being subject to potential unionization, work stoppages, slowdowns and/or increased labor costs; our reliance on a limited number of
suppliers; our presence in some international emerging markets that may experience political or economic instability or may subject us to legal risk;
reputational and business risk from information security breaches or cyber-attacks; changes in or additional government regulation; changes in our
industry due to other airlines' financial condition; acts of war or terrorism; global economic conditions or economic downturns leading to a continuing or
accelerated decrease in demand for air travel; the spread of infectious diseases; adverse weather conditions or natural disasters; and external
geopolitical events and conditions. It is routine for our internal projections and expectations to change as the year or each quarter in the year progresses,
and therefore it should be clearly understood that the internal projections, beliefs and assumptions upon which we base our expectations may change
prior to the end of each quarter or year and you should not place undue reliance on these statements. Further information concerning these and other
factors is contained in the Company's Securities and Exchange Commission filings, including but not limited to, the Company's 2016 Annual Report on
Form 10-K and Quarterly Reports on Form 10-Q. In light of these risks and uncertainties, the forward-looking events discussed in this presentation might
not occur. We undertake no obligation to update any forward-looking statements to reflect events or circumstances that may arise after the date of this
presentation.
The following presentation also includes certain “non-GAAP financial measures” as defined in Regulation G under the Securities Exchange Act of 1934.
We refer you to the reconciliations made available in our Quarterly Reports on Form 10-Q and Annual Reports on Form 10-K (available on our website at
jetblue.com and at sec.gov) and in our April 2017 first quarter earnings call, which reconcile the non-GAAP financial measures included in the following
presentation to the most directly comparable financial measures calculated and presented in accordance with U.S. GAAP.

3
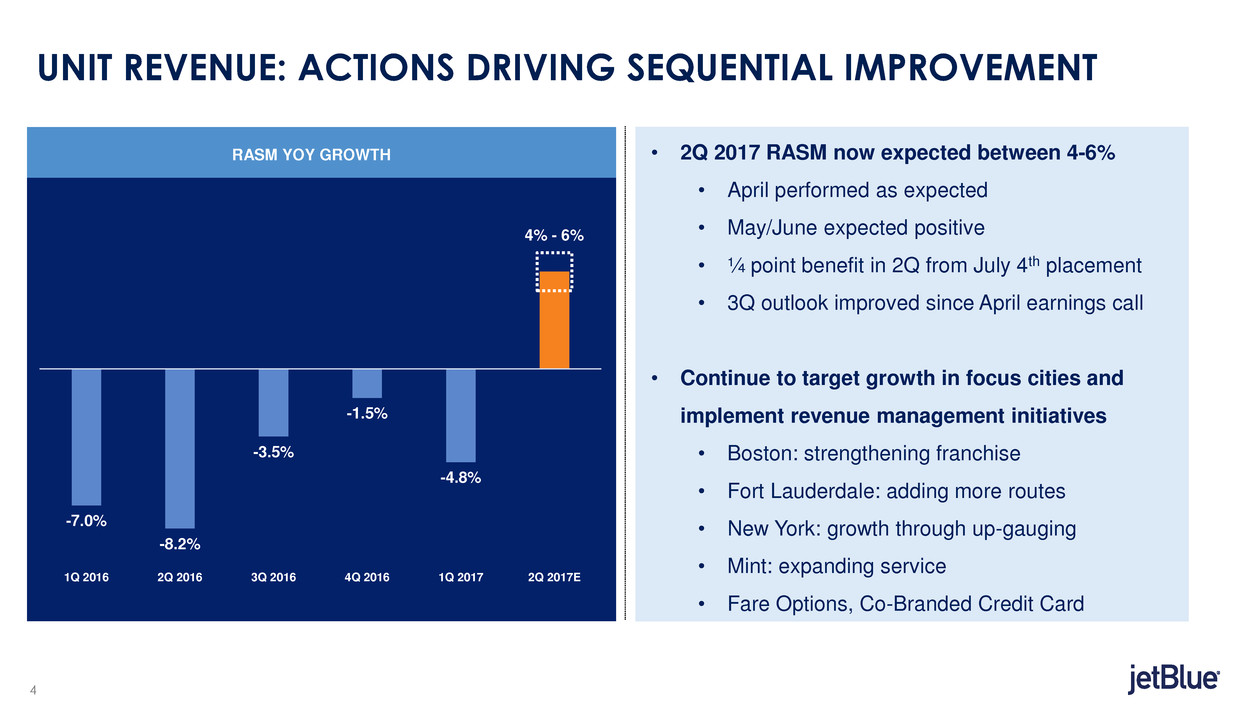
FOCUSED ON CREATING SHAREHOLDER VALUE THROUGH MARGIN
INITIATIVES AND ACCRETIVE GROWTH
• Working towards goal of superior margins
• Revenue initiatives
• Structural cost initiatives
• Cabin restyling & Fleet review
• Targeted growth in 3 focus cities and Mint
• Improved operational performance
PRE-TAX MARGINS JBLU VS PEERS
Average of peer set (AAL, ALK, DAL, LUV, SAVE, UAL)
7.9%
9.7%
18.3%
16.7%
15.4%
14.4%
1Q 2017
JBLU
1Q 2017
Peers
2016
JBLU
2016
Peers
TTM
JBLU
TTM
Peers
4
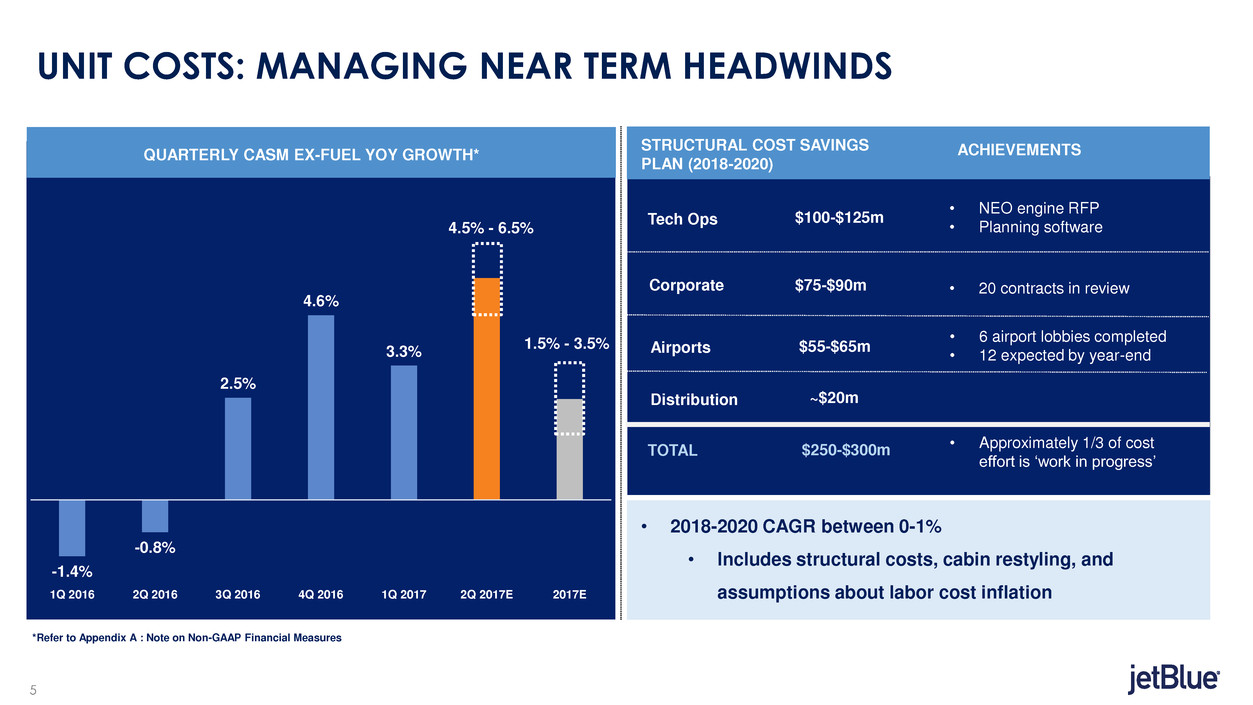
UNIT REVENUE: ACTIONS DRIVING SEQUENTIAL IMPROVEMENT
• 2Q 2017 RASM now expected between 4-6%
• April performed as expected
• May/June expected positive
• ¼ point benefit in 2Q from July 4th placement
• 3Q outlook improved since April earnings call
• Continue to target growth in focus cities and
implement revenue management initiatives
• Boston: strengthening franchise
• Fort Lauderdale: adding more routes
• New York: growth through up-gauging
• Mint: expanding service
• Fare Options, Co-Branded Credit Card
RASM YOY GROWTH
4% - 6%
-7.0%
-8.2%
-3.5%
-1.5%
-4.8%
1Q 2016 2Q 2016 3Q 2016 4Q 2016 1Q 2017 2Q 2017E
5
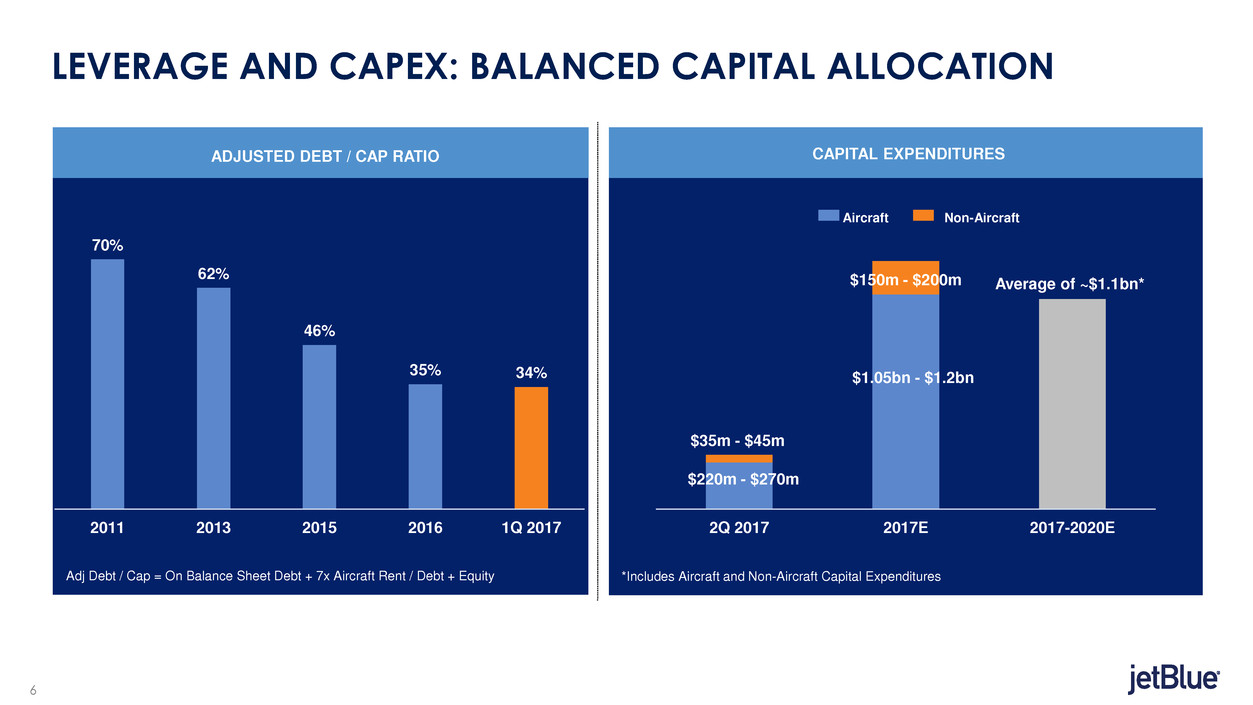
UNIT COSTS: MANAGING NEAR TERM HEADWINDS
QUARTERLY CASM EX-FUEL YOY GROWTH*
-1.4%
-0.8%
2.5%
4.6%
3.3%
1Q 2016 2Q 2016 3Q 2016 4Q 2016 1Q 2017 2Q 2017E 2017E
4.5% - 6.5%
1.5% - 3.5%
**Refer to Appendix A : Note on Non-GAAP Financial Measures
Tech Ops
Airports
Corporate
TOTAL
Distribution
STRUCTURAL COST SAVINGS
PLAN (2018-2020)
ACHIEVEMENTS
$250-$300m
• 6 airport lobbies completed
• 12 expected by year-end
$100-$125m
$75-$90m
$55-$65m
~$20m
• Approximately 1/3 of cost
effort is ‘work in progress’
• 2018-2020 CAGR between 0-1%
• Includes structural costs, cabin restyling, and
assumptions about labor cost inflation
• NEO engine RFP
• Planning software
• 20 contracts in review
6
2Q 2017 2017E 2017-2020E
LEVERAGE AND CAPEX: BALANCED CAPITAL ALLOCATION
ADJUSTED DEBT / CAP RATIO CAPITAL EXPENDITURES
Aircraft Non-Aircraft
70%
62%
46%
35% 34%
2011 2013 2015 2016 1Q 2017
Adj Debt / Cap = On Balance Sheet Debt + 7x Aircraft Rent / Debt + Equity
$150m - $200m
$1.05bn - $1.2bn
$220m - $270m
$35m - $45m
Average of ~$1.1bn*
*Includes Aircraft and Non-Aircraft Capital Expenditures
7
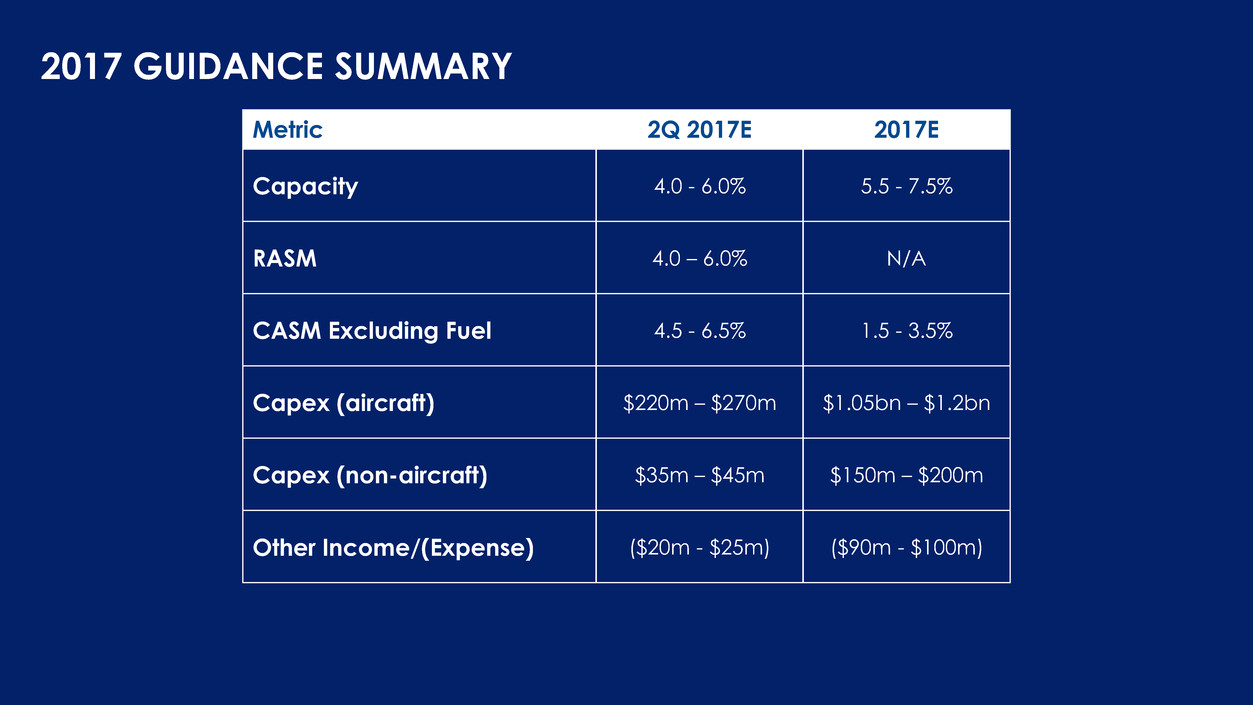
2017 GUIDANCE SUMMARY
Metric 2Q 2017E 2017E
Capacity 4.0 - 6.0% 5.5 - 7.5%
RASM 4.0 – 6.0% N/A
CASM Excluding Fuel 4.5 - 6.5% 1.5 - 3.5%
Capex (aircraft) $220m – $270m $1.05bn – $1.2bn
Capex (non-aircraft) $35m – $45m $150m – $200m
Other Income/(Expense) ($20m - $25m) ($90m - $100m)

QUESTIONS
9
APPENDIX A: NOTE ON NON-GAAP FINANCIAL MEASURES
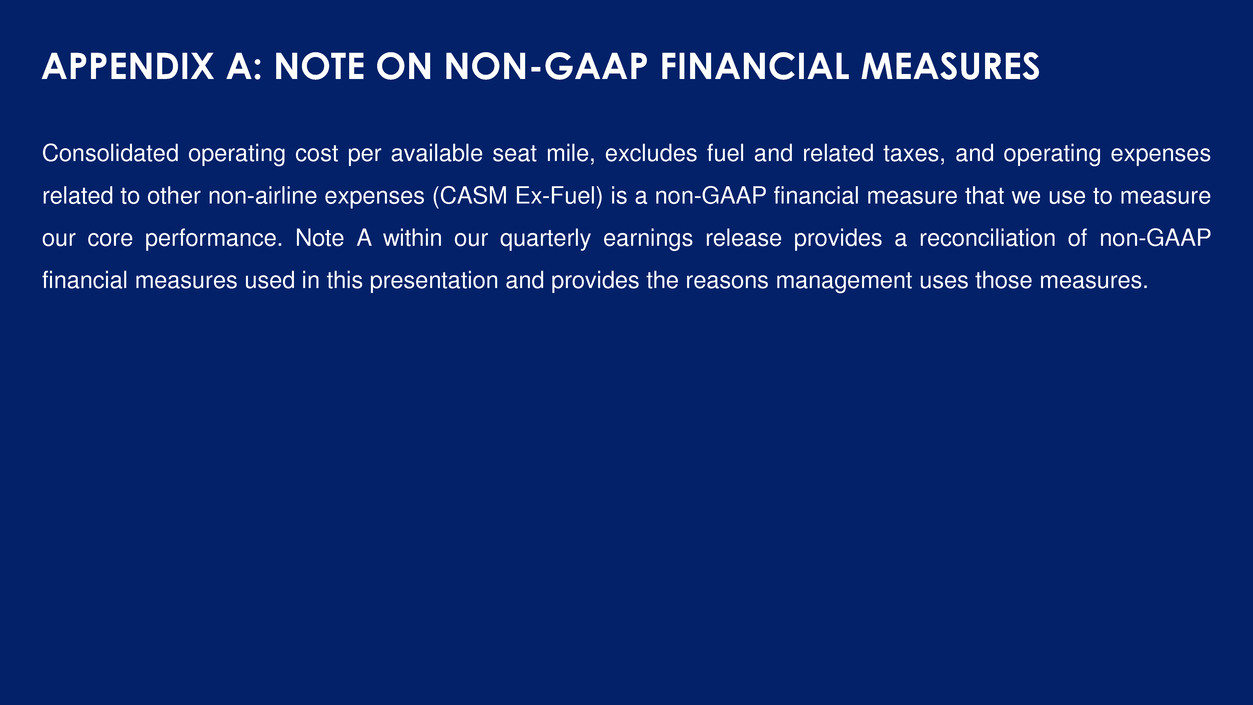
Consolidated operating cost per available seat mile, excludes fuel and related taxes, and operating expenses
related to other non-airline expenses (CASM Ex-Fuel) is a non-GAAP financial measure that we use to measure
our core performance. Note A within our quarterly earnings release provides a reconciliation of non-GAAP
financial measures used in this presentation and provides the reasons management uses those measures.
