Attached files
| file | filename |
|---|---|
| EX-99.2 - EX-99.2 - GenOn Energy, Inc. | a17-12625_2ex99d2.htm |
| EX-10.1 - EX-10.1 - GenOn Energy, Inc. | a17-12625_2ex10d1.htm |
| 8-K - 8-K - GenOn Energy, Inc. | a17-12625_28k.htm |
Exhibit 99.1
Subject to Confidentiality Agreements Contains Material Non-Public Information May 19, 2017 GenOn Energy, Inc. Discussion Materials 1

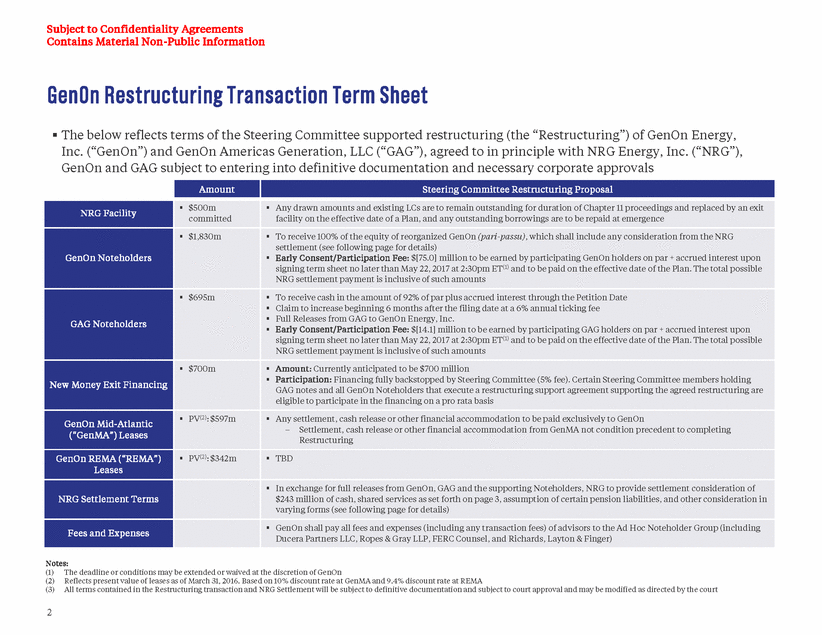
Subject to Confidentiality Agreements Contains Material Non-Public Information GenOn Restructuring Transaction Term Sheet The below reflects terms of the Steering Committee supported restructuring (the “Restructuring”) of GenOn Energy, Inc. (“GenOn”) and GenOn Americas Generation, LLC (“GAG”), agreed to in principle with NRG Energy, Inc. (“NRG”), GenOn and GAG subject to entering into definitive documentation and necessary corporate approvals facility on the effective date of a Plan, and any outstanding borrowings are to be repaid at emergence Early Consent/Participation Fee: $[14.1] million to be earned by participating GAG holders on par + accrued interest upon GAG notes and all GenOn Noteholders that execute a restructuring support agreement supporting the agreed restructuring are – Settlement, cash release or other financial accommodation from GenMA not condition precedent to completing Ducera Partners LLC, Ropes & Gray LLP, FERC Counsel, and Richards, Layton & Finger) Notes: (1) (2) (3) The deadline or conditions may be extended or waived at the discretion of GenOn Reflects present value of leases as of March 31, 2016. Based on 10% discount rate at GenMA and 9.4% discount rate at REMA All terms contained in the Restructuring transaction and NRG Settlement will be subject to definitive documentation and subject to court approval and may be modified as directed by the court 2 Amount Steering Committee Restructuring Proposal NRG Facility $500m committed Any drawn amounts and existing LCs are to remain outstanding for duration of Chapter 11 proceedings and replaced by an exit GenOn Noteholders $1,830m To receive 100% of the equity of reorganized GenOn (pari-passu), which shall include any consideration from the NRG settlement (see following page for details) Early Consent/Participation Fee: $[75.0] million to be earned by participating GenOn holders on par + accrued interest upon signing term sheet no later than May 22, 2017 at 2:30pm ET(1) and to be paid on the effective date of the Plan. The total possible NRG settlement payment is inclusive of such amounts GAG Noteholders $695m To receive cash in the amount of 92% of par plus accrued interest through the Petition Date Claim to increase beginning 6 months after the filing date at a 6% annual ticking fee Full Releases from GAG to GenOn Energy, Inc. signing term sheet no later than May 22, 2017 at 2:30pm ET(1) and to be paid on the effective date of the Plan. The total possible NRG settlement payment is inclusive of such amounts New Money Exit Financing $700m Amount: Currently anticipated to be $700 million Participation: Financing fully backstopped by Steering Committee (5% fee). Certain Steering Committee members holding eligible to participate in the financing on a pro rata basis GenOn Mid-Atlantic (“GenMA”) Leases PV(2): $597m Any settlement, cash release or other financial accommodation to be paid exclusively to GenOn Restructuring GenOn REMA (“REMA”) Leases PV(2): $342m TBD NRG Settlement Terms In exchange for full releases from GenOn, GAG and the supporting Noteholders, NRG to provide settlement consideration of $243 million of cash, shared services as set forth on page 3, assumption of certain pension liabilities, and other consideration in varying forms (see following page for details) Fees and Expenses GenOn shall pay all fees and expenses (including any transaction fees) of advisors to the Ad Hoc Noteholder Group (including
Subject to Confidentiality Agreements Contains Material Non-Public Information NRG Settlement Terms The following highlights key economic terms of the proposed settlement agreed to in principle among the Steering Committee, NRG, GenOn and GAG – Cash: $243.0 million if supported by greater than 50% of GenOn Notes and greater than 50% of GAG Notes, plus an additional $18.3 million if supported by greater than 2/3rd of GenOn Notes and 2/3rd of GAG Notes Pension: NRG to indemnify GenOn for historic pension obligations(1) accrued through the effective date, including satisfaction of $13 million in annual contribution obligations for 2017 plus underfunding liability estimated at approximately $120 million Shared Services Transition: NRG to allow for transition of shared services and during such transition period NRG will continue to provide shared services as follows: Transition services: NRG to provide GenOn with transition services at a rate of $7 million per month during the pendency of the Chapter 11 proceedings NRG to provide free shared services for 2 months post-emergence NRG to provide GenOn with option for up to two, one-month extensions for transition services at a rate of $7 million per month post-emergence Shared Services Credit: NRG to provide a $27 million credit against amounts owed to NRG for Shared Services Other properties: NRG projects on GenOn and GAG property (Canal Unit 3 and Puente) NRG and GenOn to cooperate to maximize value of such assets, including through any potential exit Canal Unit 1 and 2 shall not be materially adversely impacted by the economic implications of Canal Unit 3 Tax Structuring: Transaction to be structured to permit NRG to take a worthless stock deduction, subject to diligence and agreement that such a deduction will not materially adversely impact tax attributes of assets or pro forma tax profile of GenOn Releases: Full releases from GenOn, GAG, Supporting Noteholders and the bankruptcy estates in favor of the NRG parties; mutually agreeable releases or indemnities with respect to GenMA and REMA – – – – – – Notes: (1)The NRG Pension Plan covers the historical pension liability of certain GenOn employees (2) All terms contained in the Restructuring transaction and NRG Settlement will be subject to definitive documentation and subject to court approval and may be modified as directed by the court 3

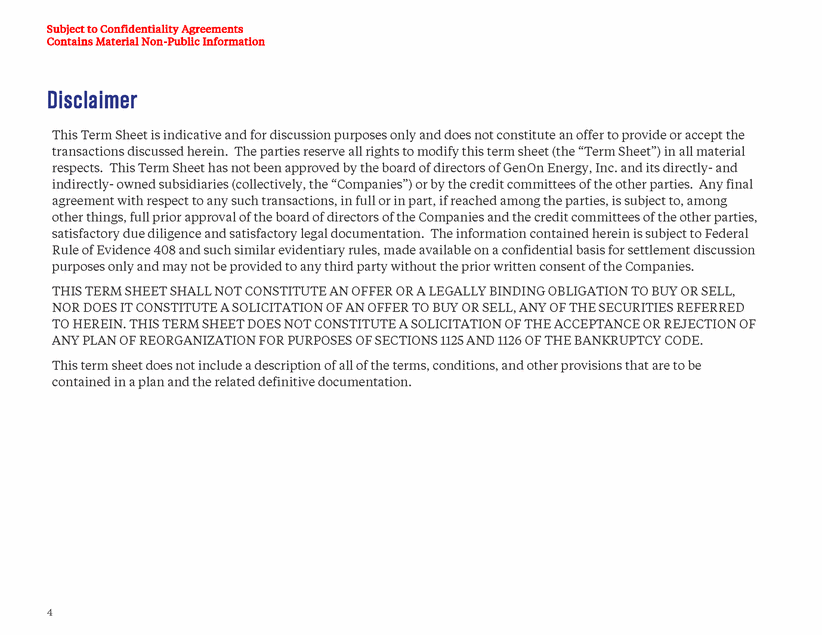
Subject to Confidentiality Agreements Contains Material Non-Public Information Disclaimer This Term Sheet is indicative and for discussion purposes only and does not constitute an offer to provide or accept the transactions discussed herein. The parties reserve all rights to modify this term sheet (the “Term Sheet”) in all material respects. This Term Sheet has not been approved by the board of directors of GenOn Energy, Inc. and its directly-and indirectly-owned subsidiaries (collectively, the “Companies”) or by the credit committees of the other parties. Any final agreement with respect to any such transactions, in full or in part, if reached among the parties, is subject to, among other things, full prior approval of the board of directors of the Companies and the credit committees of the other parties, satisfactory due diligence and satisfactory legal documentation. The information contained herein is subject to Federal Rule of Evidence 408 and such similar evidentiary rules, made available on a confidential basis for settlement discussion purposes only and may not be provided to any third party without the prior written consent of the Companies. THIS TERM SHEET SHALL NOT CONSTITUTE AN OFFER OR A LEGALLY BINDING OBLIGATION TO BUY OR SELL, NOR DOES IT CONSTITUTE A SOLICITATION OF AN OFFER TO BUY OR SELL, ANY OF THE SECURITIES REFERRED TO HEREIN. THIS TERM SHEET DOES NOT CONSTITUTE A SOLICITATION OF THE ACCEPTANCE OR REJECTION OF ANY PLAN OF REORGANIZATION FOR PURPOSES OF SECTIONS 1125 AND 1126 OF THE BANKRUPTCY CODE. This term sheet does not include a description of all of the terms, conditions, and other provisions that are to be contained in a plan and the related definitive documentation. 4
Confidential & Proprietary GenOn Restructuring Materials May 2017 Privileged and confidential; for settlement purposes only
Disclaimer Confidential & Proprietary Any materials included herein that were prepared by the Company or its advisors were prepared as a part of advisory services to the Company only and not undertaken on behalf of or to serve the needs of any third party. These materials provide summary information only and are being delivered solely for informational purposes. No third-party may rely upon these materials for any other purpose. No representation or warranty, express or implied, can be made or is made by the Company or its advisors as to the accuracy or completeness of any information contained herein or the achievability of any forecasts or projections contained herein. These materials and the information contained herein involve numerous significant assumptions and subjective determinations that may or may not be correct. The Company and its advisors have not assumed any responsibility for independent verification of any of such information contained herein, including, but not limited to, any forecasts or projections set forth herein. It should be noted that any valuation contained herein is only an approximation, subject to uncertainties and contingencies, including market conditions, all of which are difficult to predict and beyond the control of the Company or its advisors, and thus, a valuation is not intended to be, and should not be construed in any respect as, a guaranty of value. The accompanying material does not represent an opinion as to the prices at which the Company, or any interests therein, actually would be acquired or sold. Except where otherwise indicated, these materials speak as of the date originally created and are necessarily based upon the information available to the Company or its advisors and financial, stock market and other conditions and circumstances existing and known to the Company or its advisors at that time, all of which are subject to change. Neither the Company nor its advisors have any obligation to update, bring-down, review or reaffirm these materials. Under no circumstances should the delivery of these materials imply that any information or analyses included herein would be the same if originally made as of any other date. Nothing contained herein is, or shall be relied upon as, a promise or representation as to the past, present or future. Neither the Company or its advisors shall have any liability, whether direct or indirect, in contract or tort or otherwise, to any person in connection with these materials. 1 Privileged and confidential; for settlement purposes only
Disclaimer (cont’d) Confidential & Proprietary The summary of intercompany balances included in the following materials relies on the Company’s books and records available at the time of preparation. Although every reasonable effort was made to ensure the accuracy and completeness of the information contained herein, subsequent information or discovery may result in material changes to these schedules. As a result, inadvertent errors or omissions may exist. Receivables and payables among the Company and their affiliates that are reported herein and the listing of any amounts with respect to such receivables and payables is not, and should not be construed as, an admission of the characterization of such balances, as debt, equity, or otherwise. The Company and its agents, attorneys and financial advisors do not guarantee or warrant the accuracy or completeness of the data that is provided herein, and will not be liable for any loss or injury arising out of or caused in whole or in part by the acts, errors, or omissions, whether negligent or otherwise, in procuring, compiling, collecting, interpreting, reporting, communicating, or delivering the information contained herein. While commercially reasonable efforts have been made to provide accurate and complete information herein, inadvertent errors or omissions may exist. The Company and its agents, attorneys and financial advisors expressly do not undertake any obligation to update, modify, revise, or re-categorize the information provided herein, or to notify any third party should the information be updated, modified, revised, or re-categorized. In no event will the Company or its agents, attorneys and financial advisors be liable to any third party for any direct, indirect, incidental, consequential, or special damages (including, but not limited to, damages arising from the disallowance of a potential claim against the Company or damages to business reputation, lost business, or lost profits), whether foreseeable or not and however caused, even if the Company or its agents, attorneys, and financial advisors are advised of the possibility of such damages. 2 Privileged and confidential; for settlement purposes only
Confidential & Proprietary 3 Privileged and confidential; for settlement purposes only Appendix III: Rest of GAG Asset Detail Appendix II: Rest of GenOn Asset Detail Appendix I: Additional Information Transaction Proposal Company Overview
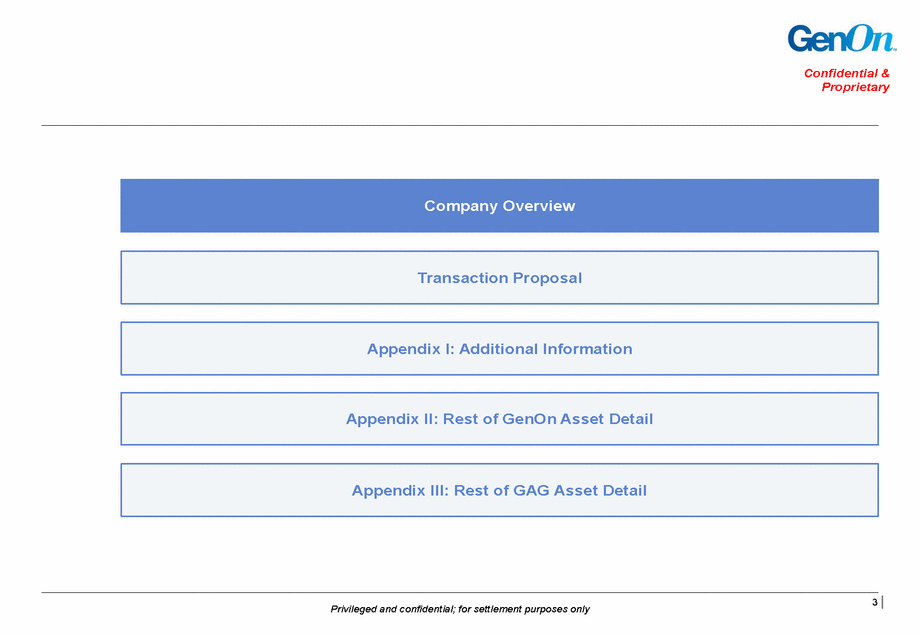
Overview of GenOn Energy Operational Performance and Recent Confidential & Proprietary Company Overview Historical Net Generation (TWh) GenOn Energy is engaged in the ownership and operation of wholesale power generation facilities; the trading of energy, capacity, and related products; and transacting in and trading of fuel and transportation services Generation facilities are comprised of 32 power plants1 across eight states, totaling approximately 15,394 megawatts (“MW”) of electricity generation capacity Scaled generation fleet operates across various fuels and technology types, operating characteristics and regional power markets 35 31 2013A 2014A 2015A 2016A Installed Capacity by Fuel Type Installed Capacity by Region Installed Capacity by Technology MISO 5% NYISO 8% CT 14% Coal 27% ISO-NE 7% T 14% Natural Gas 61% CAISO 18% PJM 62% ST 72% Oil 12% Source: Company filings 1 As of 31-Dec-2016, excluding Pittsburg, which was deactivated on 01-Jan-2017. Company Overview 4 Privileged and confidential; for settlement purposes only Total: 15.4 GW Net GenerationCapacity Revenues as % of Gross Margin 54 % 30 62 % 60 % 26 55 %
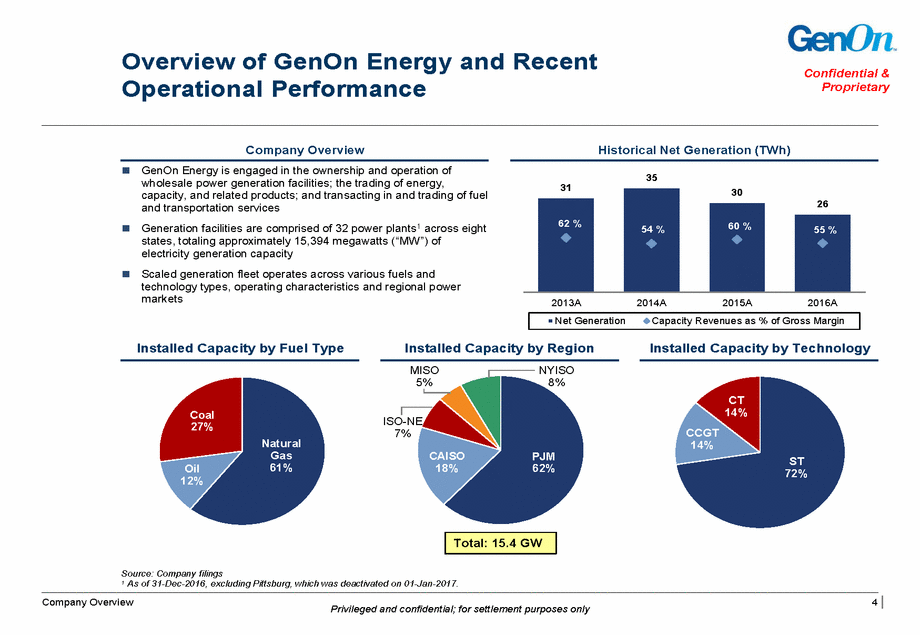
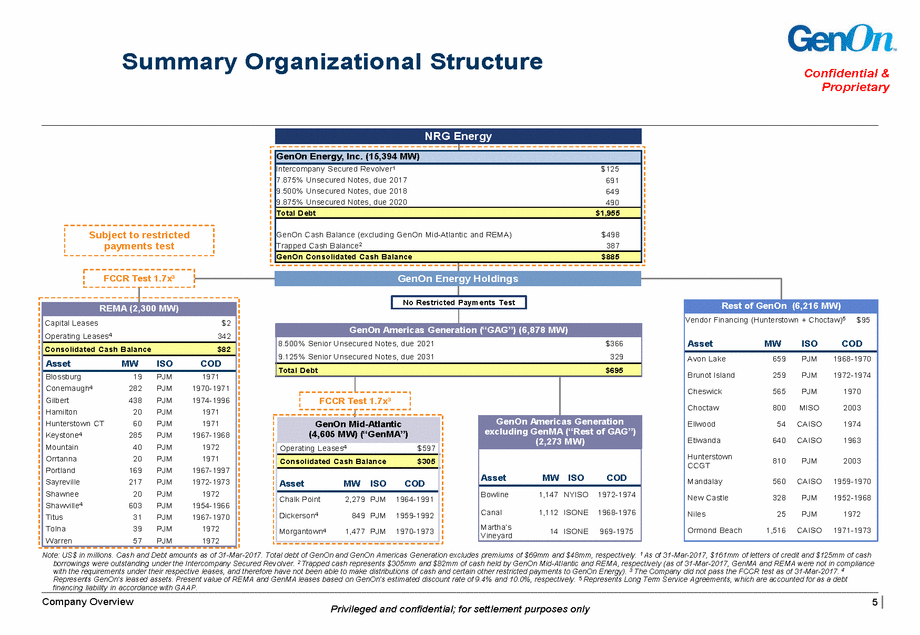
Summary Organizational Structure Confidential & Proprietary FCCR Test 1.7x3 GenOn Energy Holdings Rest of GenOn (6,216 MW) excluding GenMA (“Rest of GAG”) 14 ISONE 969-1975 Vineyard Note: US$ in millions. Cash and Debt amounts as of 31-Mar-2017. Total debt of GenOn and GenOn Americas Generation excludes premiums of $69mm and $48mm, respectively. 1 As of 31-Mar-2017, $161mm of letters of credit and $125mm of cash borrowings were outstanding under the Intercompany Secured Revolver. 2 Trapped cash represents $305mm and $82mm of cash held by GenOn Mid-Atlantic and REMA, respectively (as of 31-Mar-2017, GenMA and REMA were not in compliance with the requirements under their respective leases, and therefore have not been able to make distributions of cash and certain other restricted payments to GenOn Energy). 3 The Company did not pass the FCCR test as of 31-Mar-2017. 4 Represents GenOn’s leased assets. Present value of REMA and GenMA leases based on GenOn’s estimated discount rate of 9.4% and 10.0%, respectively. 5 Represents Long Term Service Agreements, which are accounted for as a debt financing liability in accordance with GAAP. Company Overview 5 Privileged and confidential; for settlement purposes only NRG Energy GenOn Energy, Inc. (15,394 MW) Intercompany Secured Revolver1$125 7.875% Unsecured Notes, due 2017691 9.500% Unsecured Notes, due 2018649 9.875% Unsecured Notes, due 2020490 Total Debt$1,955 GenOn Cash Balance (excluding GenOn Mid-Atlantic and REMA)$498 Trapped Cash Balance2387 GenOn Consolidated Cash Balance$885 No Restricted Payments Test REMA (2,300 MW) Vendor Financing (Hunterstown + Choctaw)5 $95 AssetMWISOCOD Capital Leases$2 Operating Leases4342 GenOn Americas Generation (“GAG”) (6,878 MW) 8.500% Senior Unsecured Notes, due 2021$366 9.125% Senior Unsecured Notes, due 2031329 Consolidated Cash Balance$82 Avon Lake659PJM1968-1970 Brunot Island259PJM1972-1974 Cheswick565PJM1970 Choctaw800MISO2003 Ellwood54 CAISO1974 Etiwanda640 CAISO1963 Hunterstown CCGT810PJM2003 Mandalay560 CAISO 1959-1970 New Castle328PJM1952-1968 Niles25PJM1972 Ormond Beach1,516 CAISO 1971-1973 AssetMWISOCOD Total Debt$695 Blossburg19PJM1971 Conemaugh4282PJM1970-1971 Gilbert438PJM1974-1996 Hamilton20PJM1971 Hunterstown CT60PJM1971 Keystone4285PJM1967-1968 Mountain40PJM1972 Orrtanna20PJM1971 Portland169PJM1967-1997 Sayreville217PJM1972-1973 Shawnee20PJM1972 Shawville4603PJM1954-1966 Titus31PJM1967-1970 Tolna39PJM1972 Warren57PJM1972 FCCR Test 1.7x3 GenOn Mid-Atlantic (4,605 MW) (“GenMA”) GenOn Americas Generation (2,273 MW) Operating Leases4$597 AssetMW ISOCOD Consolidated Cash Balance$305 AssetMW ISOCOD Bowline1,147 NYISO 1972-1974 Canal1,112 ISONE 1968-1976 Martha’s Chalk Point2,279 PJM 1964-1991 Dickerson4849 PJM 1959-1992 Morgantown41,477 PJM 1970-1973 Subject to restricted payments test
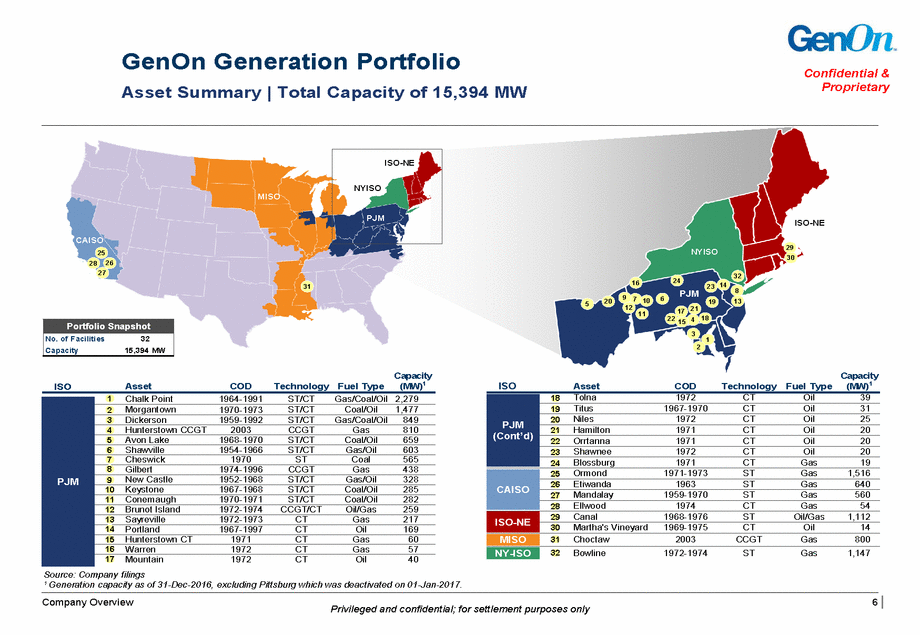
GenOn Generation Portfolio Confidential & Proprietary Asset Summary | Total Capacity of 15,394 MW MISO ISO-NE CAISO 25 28 26 27 29 30 NYISO 32 24 PJM 16 14 31 23 8 13 9 12 6 7 10 11 20 19 5 21 17 18 22 15 4 3 1 2 Capacity (MW)1 Capacity (MW)1 Asset COD Technology Fuel Type ISO Asset COD Technology Fuel Type ISO Source: Company filings 1 Generation capacity as of 31-Dec-2016, excluding Pittsburg which was deactivated on 01-Jan-2017. Company Overview 6 Privileged and confidential; for settlement purposes only CAISO 25Ormond1971-1973STGas1,516 26Etiwanda1963STGas640 27Mandalay1959-1970STGas560 28 Ellwood1974CTGas54 29Canal1968-1976STOil/Gas1,112 ISO-NE 30Martha's Vineyard1969-1975CTOil14 MISO 31Choctaw2003CCGTGas800 NY-ISO 32Bowline1972-1974STGas1,147 PJM 1Chalk Point1964-1991ST/CTGas/Coal/Oil 2,279 2Morgantown1970-1973ST/CTCoal/Oil1,477 3Dickerson1959-1992ST/CTGas/Coal/Oil849 4Hunterstown CCGT2003CCGTGas810 5Avon Lake1968-1970ST/CTCoal/Oil659 6Shawville1954-1966ST/CTGas/Oil603 7Cheswick1970STCoal565 8Gilbert1974-1996CCGTGas438 9New Castle1952-1968ST/CTGas/Oil328 10 Keystone1967-1968ST/CTCoal/Oil285 11 Conemaugh1970-1971ST/CTCoal/Oil282 12 Brunot Island1972-1974CCGT/CTOil/Gas259 13 Sayreville1972-1973CTGas217 14 Portland1967-1997CTOil169 15 Hunterstown CT1971CTGas60 16 Warren1972CTGas57 17 Mountain1972CTOil40 PJM (Cont’d) 18Tolna1972CTOil39 19Titus1967-1970CTOil31 20Niles1972CTOil25 21Hamilton1971CTOil20 22Orrtanna1971CTOil20 23Shawnee1972CTOil20 24 Blossburg1971CTGas19 Portfolio Snapshot No. of Facilities32 Capacity15,394 MW ISO-NE NYISO PJM
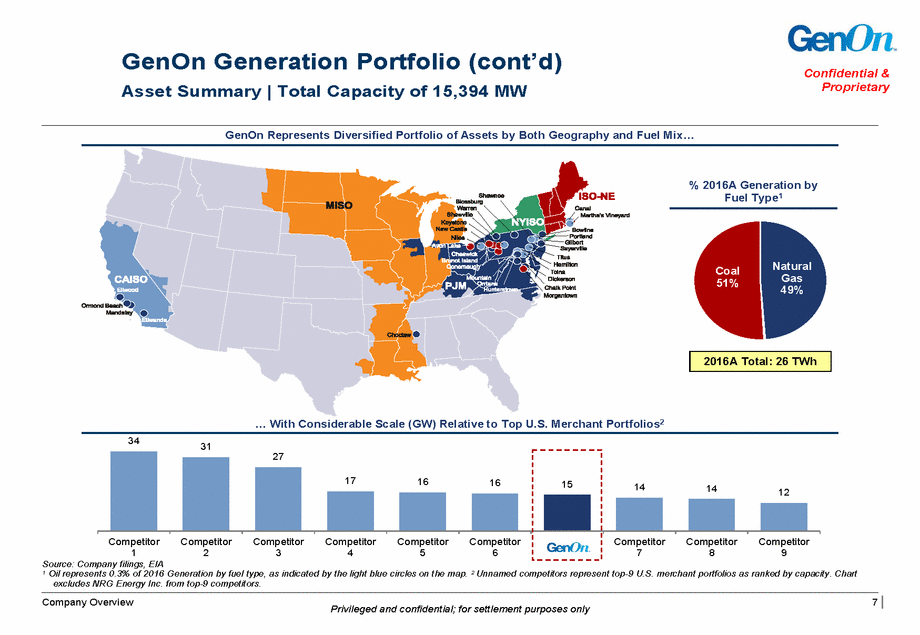
GenOn Generation Portfolio (cont’d) Confidential & Proprietary Asset Summary | Total Capacity of 15,394 MW GenOn Represents Diversified Portfolio of Assets by Both Geography and Fuel Mix… % 2016A Generation by Fuel Type1 Natural Gas 49% Coal 51% … With Considerable Scale (GW) Relative to Top U.S. Merchant Portfolios2 34 31 27 12 Source: Company filings, EIA 1 Oil represents 0.3% of 2016 Generation by fuel type, as indicated by the light blue circles on the map. 2 Unnamed competitors represent top-9 U.S. merchant portfolios as ranked by capacity. Chart excludes NRG Energy Inc. from top-9 competitors. Company Overview 7 Privileged and confidential; for settlement purposes only 15 1414 171616 CompetitorCompetitorCompetitorCompetitorCompetitorCompetitor 123456 CompetitorCompetitorCompetitor 789 2016A Total: 26 TWh
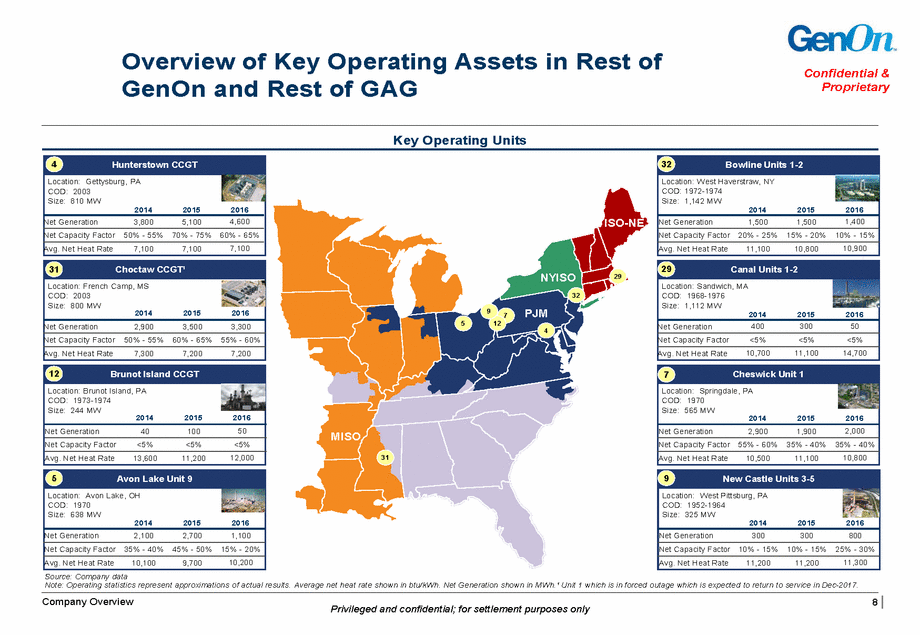
Overview of Key Operating Assets in Rest of Confidential & Proprietary GenOn and Rest of GAG Key Operating Units 29 32 9 7 5 12 4 31 Source: Company data Note: Operating statistics represent approximations of actual results. Average net heat rate shown in btu/kWh. Net Generation shown in MWh.¹ Unit 1 which is in forced outage which is expected to return to service in Dec-2017. Company Overview 8 Privileged and confidential; for settlement purposes only 9New Castle Units 3-5 Location: West Pittsburg, PA COD: 1952-1964 Size: 325 MW 201420152016 Net Generation300300800 Net Capacity Factor 10% - 15% 10% - 15% 25% - 30% Avg. Net Heat Rate11,20011,20011,300 5Avon Lake Unit 9 Location: Avon Lake, OH COD: 1970 Size: 638 MW 201420152016 Net Generation2,1002,7001,100 Net Capacity Factor 35% - 40% 45% - 50% 15% - 20% Avg. Net Heat Rate10,1009,70010,200 7Cheswick Unit 1 Location: Springdale, PA COD: 1970 Size: 565 MW 201420152016 Net Generation2,9001,9002,000 Net Capacity Factor 55% - 60% 35% - 40% 35% - 40% Avg. Net Heat Rate10,50011,10010,800 12Brunot Island CCGT Location: Brunot Island, PA COD: 1973-1974 Size: 244 MW 201420152016 Net Generation4010050 Net Capacity Factor<5%<5%<5% Avg. Net Heat Rate13,60011,20012,000 29Canal Units 1-2 Location: Sandwich, MA COD: 1968-1976 Size: 1,112 MW 201420152016 Net Generation40030050 Net Capacity Factor<5%<5%<5% Avg. Net Heat Rate10,70011,10014,700 31Choctaw CCGT¹ Location: French Camp, MS COD: 2003 Size: 800 MW 201420152016 Net Generation2,9003,5003,300 Net Capacity Factor 50% - 55% 60% - 65% 55% - 60% Avg. Net Heat Rate7,3007,2007,200 32Bowline Units 1-2 Location: West Haverstraw, NY COD: 1972-1974 Size: 1,142 MW 201420152016 Net Generation1,5001,5001,400 Net Capacity Factor 20% - 25% 15% - 20% 10% - 15% Avg. Net Heat Rate11,10010,80010,900 4Hunterstown CCGT Location: Gettysburg, PA COD: 2003 Size: 810 MW 201420152016 Net Generation3,8005,1004,600 Net Capacity Factor 50% - 55% 70% - 75% 60% - 65% Avg. Net Heat Rate7,1007,1007,100
Sustained Focus on GenOn Portfolio Rationalization Confidential & Proprietary Coal-Related Optimization Initiatives Retired Coal Plants Location Capacity Date of Retirement Driver Avon Lake Unit 7 PA 94 Apr-16 MATS Portland Units 1 and 2 PA 401 Dec-15 Cumulative effect of environmental regulations Titus Coal Units PA 245 Sep-13 MATS Niles Unit 1 OH 110 Oct-12 MATS and Market Conditions Elrama Unit 4 PA 170 Oct-12 MATS and Market Conditions Niles Unit 2 OH 110 Jun-12 MATS and Market Conditions Elrama Units 1 and 3 PA 290 Jun-12 MATS and Market Conditions Coal Plants Conversions Location Capacity Return to Service Driver Dec-16 1 Shawville PA 597 Cumulative effect of environmental regulations New Castle PA 328 May-16 MATS Installed Capacity by Fuel Mix (2016A) Commentary GenOn has prioritized optimizing its generation portfolio through a number of coal retirements and conversions to gas-fired generation — Shawville and New Castle conversions extended the useful lives of two plants that were otherwise scheduled to retire Post-asset retirements and conversions, strong natural gas exposure — Resulting portfolio more closely aligned with current environmental trends Coal 27% Natural Gas 61% Oil 12% Source: Company filings Note: Fuel mix excludes Pittsburg, which was deactivated on 01-Jan-2017. ¹ Units 1-3 returned to service in Dec-2016, and Unit 4 returned to service in Jan-2017. Company Overview 9 Privileged and confidential; for settlement purposes only Total 925 Total 1,420 GenOn has rebalanced its portfolio by retiring uneconomic coal plants and converting to gas-fired generation where economical
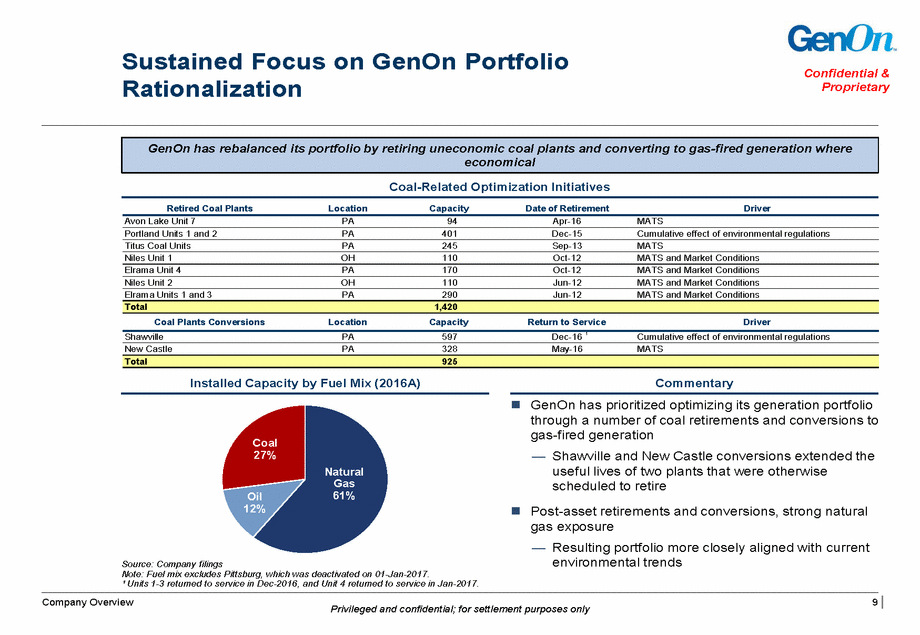
Regional ISO and RTO Capacity Market Update Confidential & Proprietary ISO-NE NYISO MISO P $150 $120 $100 $5.90 $80 Source: Company filings, S&P Global Market Intelligence, FERC 1 EMAAC base capacity clearing price of $99.77 MW-day on capacity of 103 MW for 2019/2020 delivery year. Company Overview 10 Privileged and confidential; for settlement purposes only MISO One-year forward capacity market Constructive capacity auction proposals are under consideration but have thus far been limited to select portions of Northern MISO — FERC rejected MISO’s 3-year forward capacity auction proposal in Feb-2017; MISO continues to explore alternatives for market redesign MISO South Capacity Prices ($ / MW-day) $3.29$2.99$1.50 2015/162016/172017/18 PJM Attractive U.S. market, with 3-year forward auction providing stable revenue stream GenOn cleared approximately 6,766 MW of Capacity Performance (“CP”) product and 305 MW of Base Capacity product in the 2019/2020 base residual auction — Expected capacity revenues from the 2019/2020 auction are approximately $260mm PJM-MAAC Capacity Prices ($ / MW-day) $152$165 1 2017/182018/192019/20 Base ProductCapacity Performance NYISO Short-term capacity market, with pricing set up to six months in advance Bifurcated capacity pricing for downstate markets (LHV, NYC, Long Island) vs. rest-of-state (“ROS”) Upward pressure on future capacity prices due to upcoming retirement of Indian Point Units 2 and 3 in 2021, which will reduce power supply by ~2,000 MW, or 25% of power consumed by NYC and Westchester County NYISO Zone G Prices ($ / kW-month) $9.96$8.50$8.25 $3.73 $3.50 2014/152015/162016/17 SummerWinter ISO-NE Three-year forward capacity market with pay-for-performance rules incentivizing generator reliability; similar to PJM Recent regulation has been supportive of generation resources, including the introduction of a sloping demand curve in the Forward Capacity Auction (“FCA”) GenOn cleared 1,112 MW at $5.297 kW-month in 2020/2021 auction, providing expected annual capacity revenues of $71mm FCA Clearing Price ($ / kW-month) $9.55 2018/192019/202020/21 $7.03 $5.30
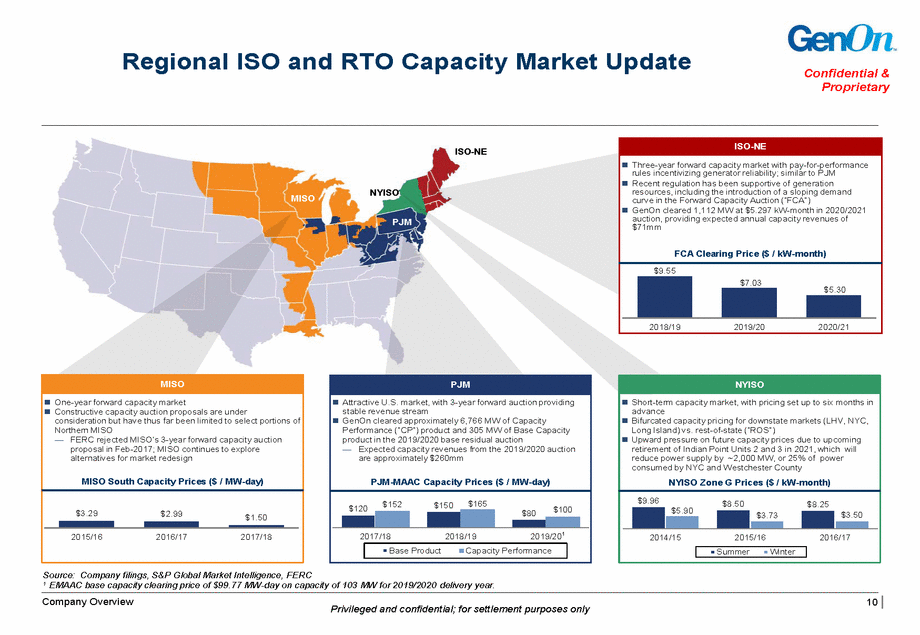
GenOn’s Exposure to Deregulated Power Market Confidential & Proprietary Ten Largest Competitive Generation Portfolios in PJM (GW)1 Tightening Reserve Margins in PJM 35.0% 21.2 30.0% 25.0% 13.5 20.0% 15.0% 10.0% 2016E 2018E 2020E 2022E 2024E 2026E Source: Company filings, PJM, S&P Global Market Intelligence ¹ Unnamed competitors represent top-9 merchant portfolios in PJM as ranked by total capacity. Company Overview 11 Privileged and confidential; for settlement purposes only Target Reserve Margin 16.6% Actual Reserve Margin 19.4% 9.5 7.5 11.611.2 9.8 5.04.9 2.5 Comp. Comp. Comp. Comp. Comp. 12345 Comp. Comp. Comp. Comp. 6789
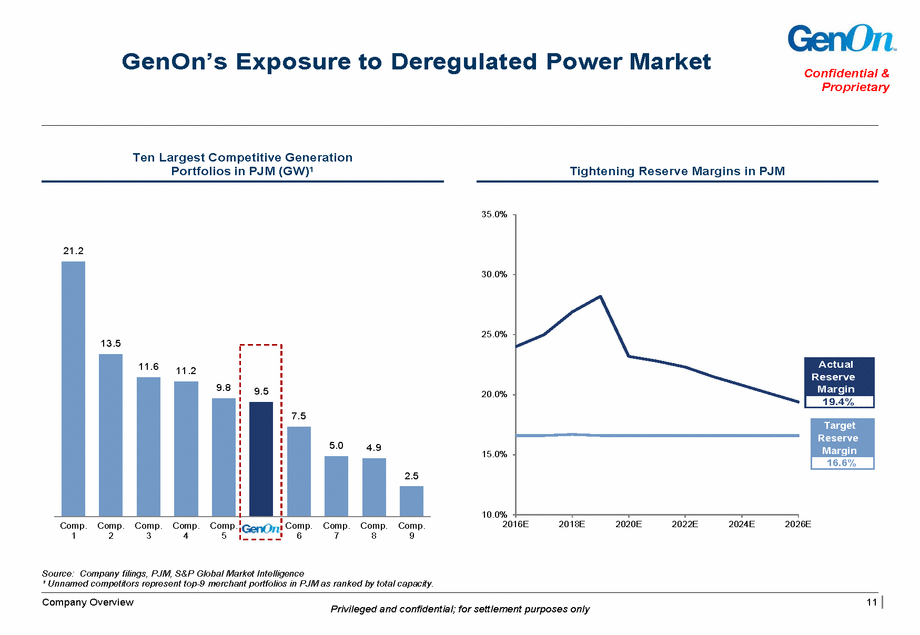
GenOn’s Exposure to (cont’d) Deregulated Power Market Confidential & Proprietary Largest Deregulated Energy and Capacity Market Projected Supply and Demand in PJM 15.0 25% PJM is the nation’s largest electricity market, spanning across the Mid-Atlantic region and extending west out to Illinois — Procures capacity from generation and demand response resources through competitive forward auction process, and also procures energy and ancillary services through day-ahead and real-time markets Fundamentals in PJM are driven by significant capacity retirements (mostly coal) in the last five years, resulting in a shifting supply stack expected to favor existing generation assets Imports into PJM are facing headwinds, which may eliminate some low priced resources from the capacity auction and further support capacity prices 20% 10.0 15% 10% 5.0 5% 0.0 0% 2012 2013 2014 2015 2016 2017 2018 2019 Well Established Medium-Term Capacity Market PJM Auction Results for GenOn Portfolio1 10,000 $250 PJM’s capacity market, called the Reliability Pricing Model (“RPM”), was implemented to ensure long-term grid reliability by procuring the appropriate amount of power supply resources to meet market demand — Consists of Base Residual Auction (“BRA”) and three incremental auctions for a delivery year Forward capacity pricing clears three years in advance allowing for strong, stable cash flow visibility — Next BRA will be 100% Capacity Performance, putting pressure on previously cleared Base Product MWs to include adequate premiums for Base to CP risk 8,000 $200 6,000 $150 4,000 $100 2,000 $50 0 0 2017/18 2018/19 2019/20 Source: Company filings, PJM, Data as of 31-Mar-2017 1 Excludes Aurora and Rockford. 2 Represents capacity performance product clears. Company Overview 12 Privileged and confidential; for settlement purposes only PJM Capacity Revenues$452mm$489mm$260mm Base Product TotalCP Product TotalRTO/MAAC² MW $/MW-Day 8,768 $152 5,439 7,936 $165 7,522 7,071 414 $100 6,766 305 3,329 RetirementsGas Additions BRA Reserve Margin Less DRTarget Reserve Margin BRA Reserve Margin GW PJM is characterized by strong, improving fundamentals and a regulatory framework supportive of competitive generators
Financial Forecast Methodology Confidential & Proprietary 2017 through 2021 based on input from various groups within the Company’s operations and financial planning & analysis functions as well as third party pricing assumptions1 (adjusted where appropriate in order to reflect market and operating specific factors associated with the generation fleet). Plant budgeting process considers a multitude of factors, with adjustments for plant configuration, age, equipment, number of units, service hour forecast and generation forecasts. While working through the budgeting process, plant leadership takes into consideration items including (but not limited to): — Headcount needed to operate the facility — VOM for consumables (water & chemicals), number of start times and running environmental back-end systems control — Base O&M to support forecasted generation — Outage timing (based on prior maintenance cycle and forecasted service hours) — Environmental and regulatory changes The projections presented herein are consistent with the business plan provided to the bondholder advisors 1 As of December 2016. Company Overview 13 Privileged and confidential; for settlement purposes only
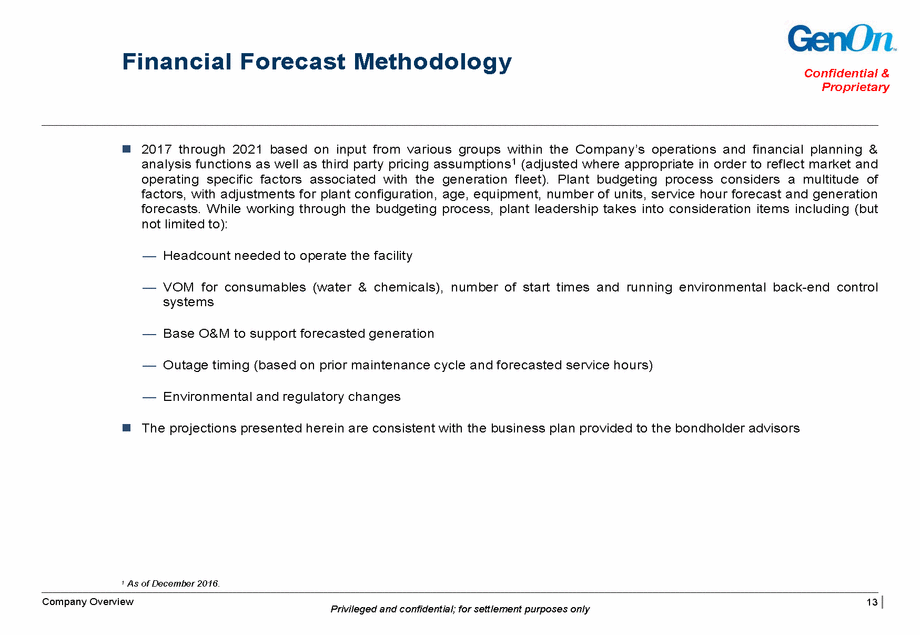
Summary Financial Forecast Rest of GenOn and Rest of GAG (US$ in millions) by Entity Confidential & Proprietary Key Metrics Buildup by Operating Entity $263 $195 $4 $46 $5 $2 Rest of GenOn $48 $32 $49 $31 $41 $3 ¹ Hedge results based on difference between actual hedge price and forward curve. Company Overview 14 Privileged and confidential; for settlement purposes only Capex 2017E2018E2019E2020E2021E $51$48$49 $3 Rest of GAG316––5 Total Capex$51$48$49$31$46 2017E2018E2019E2020E2021E MaintenanceEnvironmentalGrowth $6 $2 $7 $31 $43 $43 $41 $40 $5 $26 Total Adjusted EBITDA$150$263$219$195$300 EBITDA $3002017E2018E2019E2020E2021E Rest of GenOn$89$178$131$135$176 Rest of GAG571019060124 Open EBITDA$146$279$221$195$300 Hedges¹4(16)(2)–– $(16)$(2) 2017E2018E2019E2020E2021E EBITDAHedges $300 $150 $279 $219 $221 $195 $146
Confidential & Proprietary 18 Privileged and confidential; for settlement purposes only Appendix III: Rest of GAG Asset Detail Appendix II: Rest of GenOn Asset Detail Appendix I: Additional Information Transaction Proposal Company Overview
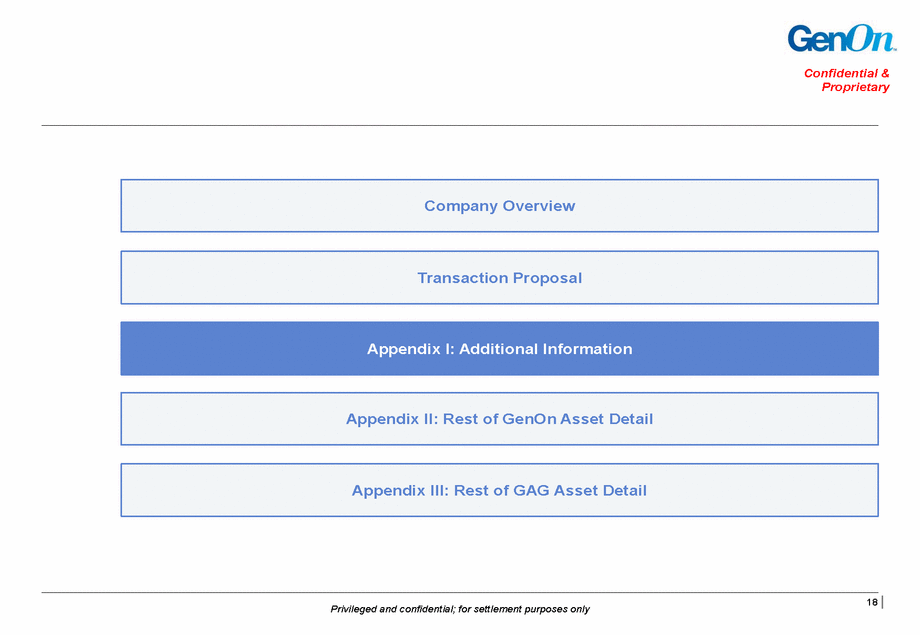
Intercompany Figures As of 31-Mar-2017 | US$ in million Confidential & Proprietary The following tables set forth certain outstanding intercompany balances as of March 31, 2017 — The following information has been derived from the Company’s unaudited condensed consolidated financial statements — Receivable balances are reflected on a gross basis and do not factor in intercompany payables which would be considered an offset for financial reporting purposes in accordance with U.S. GAAP Positive entry indicates the entity in the row owes the entity in the column Negative entry indicates the entity in the column owes the entity in the row Example: Positive $500mm entry in the Note Receivable matrix indicates the RoG “row” owes the GEI “column” $500mm — As a result, GEI has a note receivable from RoG for $500mm Accounts Receivable Accounts Payable RoG GEH GEI REMA GAG GEM GMA RoGAG RoG GEH GEI REMA GAG GEM GMA RoGAG RoG GEH GEI REMA GAG GEM GMA RoGAG RoG GEH GEI REMA GAG GEM GMA RoGAG Cash Mgmt. Receivable Cash Mgmt. Payable RoG GEH GEI REMA GAG GEM GMA RoGAG RoG GEH GEI REMA GAG GEM GMA RoGAG RoG GEH GEI REMA GAG GEM GMA RoGAG RoG GEH GEI REMA GAG GEM GMA RoGAG Notes Receivable Notes Payable RoG GEH GEI REMA GAG GEM GMA RoGAG RoG GEH GEI REMA GAG GEM GMA RoGAG RoG GEH GEI REMA GAG GEM GMA RoGAG RoG GEH GEI REMA GAG GEM GMA RoGAG Interest Receivable Interest Payable RoG GEH GEI REMA GAG GEM GMA RoGAG RoG GEH GEI REMA GAG GEM GMA RoGAG RoG GEH GEI REMA GAG GEM GMA RoGAG RoG GEH GEI REMA GAG GEM GMA RoGAG Note: The $125 million amount for notes receivable owed from GenOn Mid-Atlantic to GenOn Energy Inc. is related to the draw on the Intercompany Secured Revolver and is presented in its own account to the Company’s financial statements. Additional Information 19 Privileged and confidential; for settlement purposes only (30) - (1) (511) - - - - - - - - - - - - (0) - - (0) - - - - (0) - - - - - - - - - - - - - - - - - - (2) - - - - - - - - - - - - - - - - - - - - 31 - 0 0 - - - - - - - - - - - - - - - - - - - - 511 - 0 - - 2 - - - - - - - - - - - - - - - - - - - - - - - - - - - - - - - - - - (2) - (10) (544) - - - - - - - - (11) - - (85) (500) - - - - - (125) - - - - - - - - - - - - - - - - - - (216) - - - - - - - - - - - - - - - (194) - - - - - - 2 - 500 - - - - - - - - - - 216 - 194 10 - - - - - - - 544 - - - - - - - - 11 - - - - - - - - - - - - - - - - 125 - - - - - - 85 - - - - - - (0) (0) (53) - - - - - (49)-(395) - (327) - - (32) (91) - - - - - - - - - - (24) - - - - - - - - - (310) - (48) - (247) - - - - - - - - - - - - (303) - - (137) - - (54) - - - - 49 91 - - - - - 0 - - - - 247 - 137 53 395 - - - - - - - - - 24 - - - - - 327 - - - - - 54 - - - - 310 - - - - - - - - - 303 - - 32 - - 48 - - - Legend: RoG: Rest of GenOn GEH: GenOn Energy Holdings GEI: GenOn Energy Inc. REMA: NRG REMA LLC GAG: GenOn Americas Generation LLC GEM: GenOn Energy Management LLC GMA: GenOn Mid-Atlantic RoGAG: Rest of GenOn Americas Generation (33) (5) (0) (738) - (53) (20) (9) (0) - - - (0) - - (3) (44) - - (9) - (1) (1) (0) - - (1) (792) - (20) (0) (0) - - - - - - (0) (0) (14) (0) - (38) - - (27) (1) (3) - (1) (0) (0) (32) (50) - (1) (2) - - - (58) - (0) 33 0 44 - - 13 3 1 5 - - - - 0 - 0 0 - - 0 - - 1 - 738 - 10 792 - 39 0 - - 0 - - - - - - 53 - 1 20 - - 32 58 20 - 1 0 0 27 50 - 9 5 0 0 0 1 - 0
GenOn Energy Management Confidential & Proprietary GenOn Energy Management Overview GenOn Energy Management (“GEM”) is the primary market facing entity for GenOn portfolio of entities/assets. GEM is a wholly owned subsidiary of GenOn Americas Generation LLC and ultimately GenOn Energy, Inc. In general, GEM transacts on behalf of, and is the commercial operations market facing entity, for most GenOn entities/asset’s congestion products, capacity transactions, and physical power sales into the electricity market’s independent system operators (ISO’s). Historically, GEM has also been the primary market facing entity for futures contracts and financial asset hedges via the various energy exchanges. In general, most fuel purchases (such as oil, natural gas, and coal) are procured through NRG Power Marketing LLC for GenOn assets. For revenue and cost recognition purposes, there are intercompany ledger and commercial trade book transactions between GEM, PML, and the ultimate GenOn asset or reporting entity. These internal transactions are governed by various service agreements (power sale, fuel supply and service agreements etc.). Typically, gross margin and cash activity follows a similar path through GEM (at cost), to the appropriate GenOn entity / asset. Additional Information 20 Privileged and confidential; for settlement purposes only
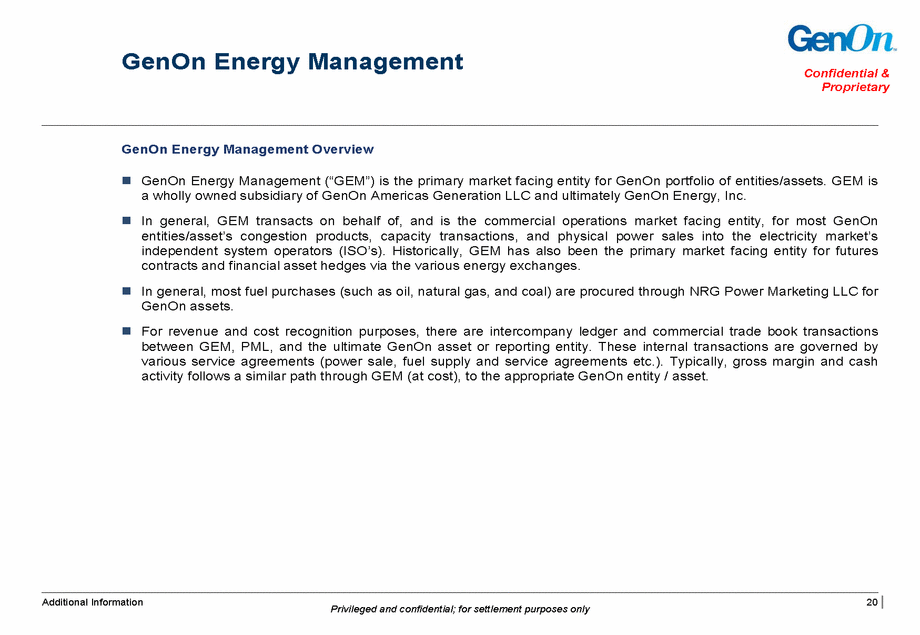
Power Marketing International Gulf Coast East West Other Equipment Supply Company-Corporate Corporate Reporting En Human Resources-Corporate Shared-East Corps/LLCs Trusts Partnerships Holdings, Inc. 51% International LLC York GP, Inc. .8% (LP) .02% (GP) Construction Limited Power Plants: hannelview LP Power LLC Pipeline Company Power Plants: Power Plant: Road LLC Note: NRG ECA Pipeline LLC entity represents pipeline constructed in connection with the Shawville lease facility, a REMA asset. 21 Additional Information Privileged and confidential; for settlement purposes only NRG ENERGY, INC. tity-Corporate and Gulf GenOn Energy, Inc. Energy Corporation of America (not an NRG sub) GenOn Energy RRI Energy Solutions East, LLC RRI Energy Ventures, Inc. RRI Energy Trading Exchange, Inc. RRI Energy Communications, Inc. RRI Energy Broadband, Inc. 49 % NRG ECA Pipeline LLC MC Asset Recovery, LLC Mirant Trust I NRG Americas, Inc. Mirant Intellectual Asset Management and Marketing, LLC Mirant Investments, Inc. GenOn Capital Inc. NRG Power Generation LLC GenOn Energy Services, LLC Mirant Asia-Pacific Ventures, LLC GenOn Fund 2001 NRG Sabine (Delaware), Inc. NRG Sabine (Texas), Inc. NRG Northeast Holdings, Inc. NRG Wholesale Generation GP LLC GenOn Asset Management, LLC NRG Power Generation Assets LLC GenOn Power Operating Services MidWest, Inc. Mirant AP Investments Limited 6.4% Orion Power New York LP, LLC Orion Power New 99 NRG Northeast Generation, Inc. 1% (G P) 99% (LP) NRG Florida GP, LLC NRG California South GP LLC NRG Power Midwest GP LLC NRG Wholesale Generation LP Power Plants: Choctaw (MI) Hunterstown CCGT (PA) Mirant Navotas Corporation Mirant (Navotas II) Corporation Mirant Asia Pacific (Hong Kong) Limited 1% (GP)99% RRI Energy Channelview (Delaware) LLC RRI Energy Channelview (Texas) LLC (LP)1% (GP)99% (LP)1% (GP)99% (LP) 99% (LP) RRI Energy 1% ( NRG Florida LP Power Plant: Osceola (FL) retired NRG Power Midwest LP Power Plants: Avon Lake (OH) Brunot Island (PA) Cheswick (PA) New Castle (PA) Niles (OH) Orion Power New York, L.P. GP) NRG REMA LLC Shawville (PA) Conemaugh (PA) Keystone (PA) Hunterstown CT (PA) Gilbert (NJ) Sayreville (NJ) Warren (PA) Mountain (PA) Tolna (PA) Blossburg (PA) Hamilton (PA) Orrtanna (PA) Shawnee (PA) Titus (PA) Glen Gardner (NJ) Portland (PA) Werner (NJ) C GenOn Key/Con Fuels, LLC GenOn Americas Procurement, Inc. NRG Willow Pass LLC NRG Tank Farm LLC GenOn Americas Generation, LLC Mirant New York Services, LLC GenOn Mid-Atlantic Development, LLC Mirant Power Purchase, LLC Mirant Wrightsville Management, Inc. Mirant Wrightsville Investments, Inc. RRI Energy Services, LLC Keystone (see NRG Domestic Org Chart) 16. 45%16.6 7% NRG North America LLC RRI Energy Services Desert Basin, LLC RRI Energy Services Channelview, LLC 3.7 % GenOn REMA Services, Inc. GenOn Northeast Management Company NRG Clearfield LLC Cone Fuels maughKeystone , LLCFuels, LLC NRG California North LLC MNA Finance Corp. GenOn Energy Management, LLC NRG New York LLC NRG Canal LLC Power Plants: Canal (MA) Martha’s Vineyard (MA) GenOn Special Procurement, Inc. GenOn Mid-Atlantic, LLC Morgantown (MD) Dickerson (MD) NRG Lovett Development I LLC NRG Lovett LLC (Power Plant) NRG Bowline LLC Power Plant: Bowline (NY) Hudson Valley Gas Corporation NRG Potrero LLC (Power Plant) NRG Delta LLC Pittsburg (CA) NRG Piney Point LLC (Power Plant) NRG Chalk Point LLC Power Plant: Chalk Point (MD) NRG MD Ash Management LLC (Power Plant) NRG Gibbons NRG Potomac River LLC (Power Plant) Conemaugh Power LLC (see NRG Domestic Org Chart) 3.7 2% NRG California South LP Power Plants: Ellwood (CA) Ettiwanda (CA) Mandalay (CA) Ormond Beach (CA) Coolwater (CA) retired NRG San Gabriel Power Generation LLC (Power Plant) Cheng Power Systems, Inc. GENON ENERGY, INC. STRUCTURE CONFIDENTIAL-Legal Working File As of 3/31/2017
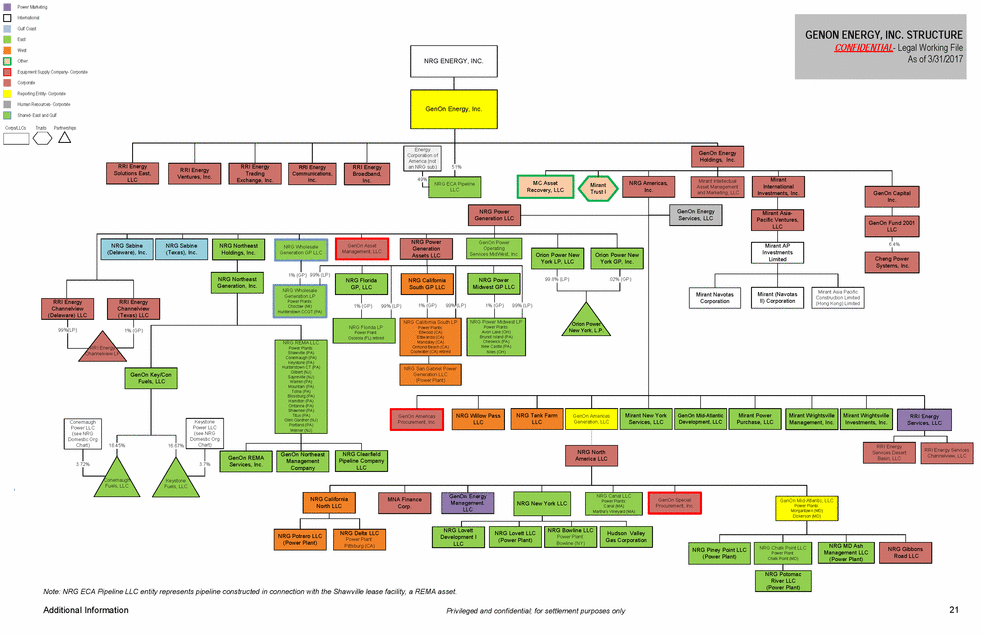
NOLs and Section (US$ in millions) 382 Overview Confidential & Proprietary $ 7,014 ~$5.5bn of NOLs not usable at GenOn due to past and new §382 limits in all scenarios NOL Carryforwards CODI Reduction Gross NOL Unusable Based on §382 Limit Usable NOL Unusable Based New §382 Limit on New §382Under §382(1)(6) Limit 22 Additional Information Privileged and confidential; for settlement purposes only Total GenOn NOL under §382(1)(6) $ 6,297 $ (717) ($62.4 mm x $ 1,248 $ (5,049) $ 756 $ (492) Based on IRC §382 limitation 20 years) Based on IRC §382 limitation (~$1.8bn of debt converted to equity over 20 years at 2.09%)
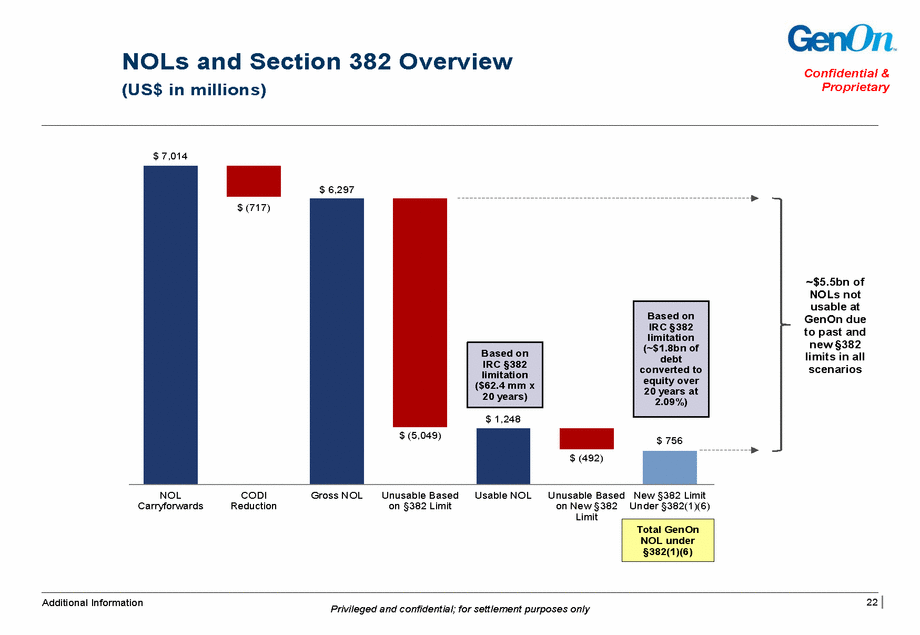
Plant Financial Confidential & Proprietary Emission Credits (actual, not $) Book Value ARO (GAAP) Env. Liab. (GAAP) NBV Land NBV PP&E CA Carbon NOX Ozone CA Carbon NOX Ozone Legal Entity Assets RGGI RGGI NRG California South LP NRG California South LP NRG California South LP Mandalay Coolwater Ellwood (7.07) (15.47) - - (1.65) - 8.59 0.33 0.81 - - 1.30 N/A N/A N/A 197,824 N/A N/A N/A N/A N/A N/A N/A N/A $ 2,577,650 N/A N/A N/A N/A N/A NRG Canal LLC NRG Delta LLC NRG Delta LLC Canal 1 & 2 Pittsburg Contra Costa (4.44) (36.56) (16.37) - - - 3.51 40.02 10.46 38.38 - - 170,170 N/A N/A N/A 171,141 N/A N/A N/A N/A $ 714,437 N/A N/A N/A $ 2,229,977 N/A N/A N/A N/A Consolidated Env. Liability REMA GenMA Rest of GAG Rest of GenOn 6 53 2 13 Additional Information 23 Privileged and confidential; for settlement purposes only Total $ 73 Total Rest of GAG (57.37) - 53.99 38.38 Total Rest of GenOn (22.53) (1.65) 9.73 1.30
Confidential & Proprietary 24 Privileged and confidential; for settlement purposes only Appendix III: Rest of GAG Asset Detail Appendix II: Rest of GenOn Asset Detail Appendix I: Additional Information Transaction Proposal Company Overview
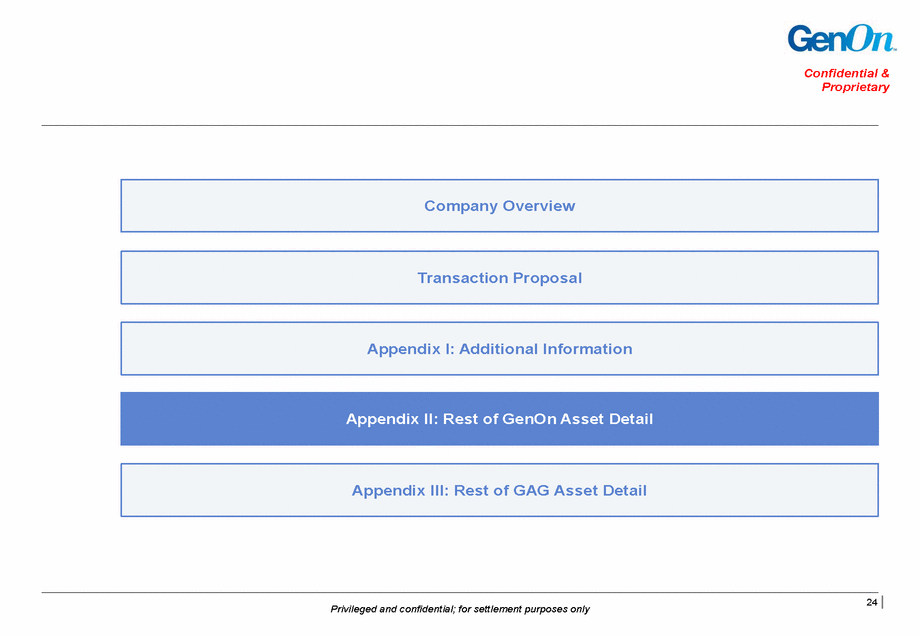
Avon Lake 638 MW Coal-Fired Baseload & 21 MW Oil-Fired Confidential & Proprietary Peaker in Ohio 33570 Lake Road Avon Lake, OH 44012 Unit 9 Unit 10 (Units 7, 10: 138 kV; Unit 9: 345 kV) ¹ Unit 7 retired in April 2016 and converted to Aux Boiler for Unit 9 start-up as part of Coal MATS Compliance project. ² Unit 9 heat rate modeled at lower load level per normal operations. ³ Headcount as of 15-Mar-2017. Rest of GenOn Asset Detail 25 Privileged and confidential; for settlement purposes only Cleveland Electric Illuminating Co.Dominion ResourcesPJM (ATSI) Status1 OperationalOperational COD Jan 1970Jan 1968 ICAP Rating (MW) Summer 63821 61525 Heat Rate (Btu/kWh)2 9,663– 2015 / 2016 Capacity Factor 48.5% / 19.8%0.0% / 0.0% Technology ST / SupercriticalSimple Cycle CT Equipment B&W / WestinghouseWestinghouse (boiler / turbine)(turbine) Fuel Type Western Bituminous CoalDistillate Fuel Oil Fuel Delivery RailTruck Region PJM (ATSI) Electric Interconnection Cleveland Electric Illuminating Co. (FirstEnergy Corp.) Water Supply / Discharge Lake Erie Employees3 71 HCl/SO2 DSI system NOx LNB, OFA, SNCR Mercury ESP, ACI system Particulate ESP Facility Overview Location Avon Lake, OH Property Size 124 acres Plant Capacity 659 MW
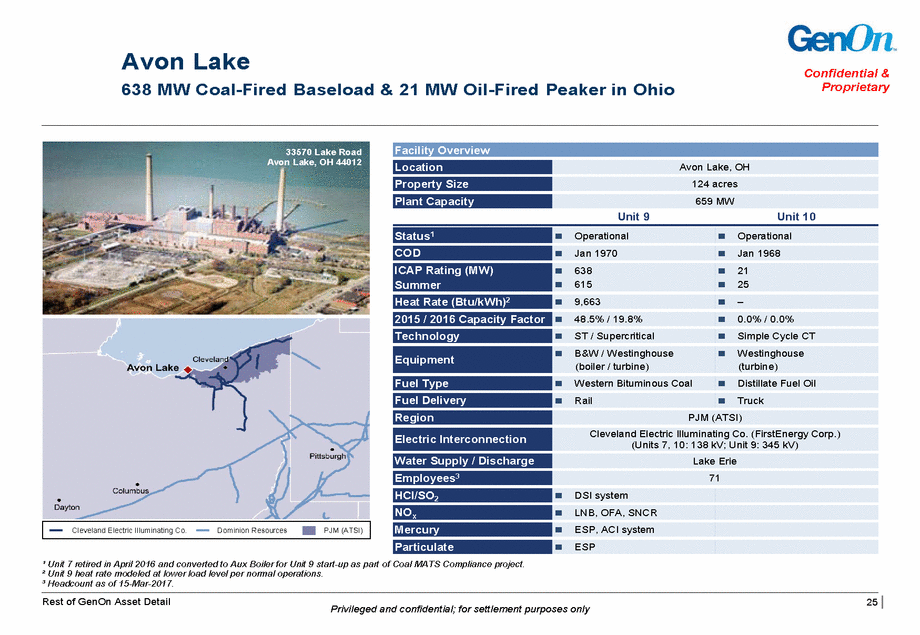
Brunot Island 244 MW Combined Cycle & 15 MW Oil-Fired Confidential & Proprietary Peaker in Pennsylvania ~2 miles from downtown Pittsburgh, PA (also a Duquesne Light substation on island) 3 x 1 CCGT Unit 1A Mar 1972 Jul 1974 (ST) 15 1424 Chateau Street, P.O. Box 99907 Pittsburgh, PA 15233 SCCT on site for blackstart 1 - STG: Unit 4 (Units 1A, 3, 4 at 138 kV; Unit 2A, 2B at 69 kV) Interstate pipeline ¹ SCCT Units 1B & 1C (30 MW in aggregate) retired in May 2014. ² Winter Capacity: 260 MW (CCGT), 210 MW without duct burners; 20 MW (Unit 1A). Seasonal Average Capacity: 250 MW (CCGT), 200 MW without duct burners; 217 MW (Unit 1A). ³ Heat rate at full load. 4 Headcount as of 15-Mar-2017. Rest of GenOn Asset Detail 26 Privileged and confidential; for settlement purposes only Duquesne Light Co.PJM (RTO) Status1 OperationalOperational COD Jun 1973 (CT) Summer Net Capacity (MW)2 Without duct burners 244 195 Heat Rate (Btu/kWh)3 Without duct burners 10,12515,930 9,800 2015 / 2016 Capacity Factor 4.6% / 2.4%0.0% / 0.0% Technology Foster Wheeler (HRSG) GE Frame 7E (turbines)GE Frame 5B GE STG Equipment 3 - CCGT: Units 2A, 2B, 3 Fuel Type Natural GasDistillate Fuel Oil Fuel Delivery LDC lateralGuttman Energy Region PJM (RTO) Electric Interconnection Duquesne Light Co. Gas Interconnection People's Gas LDC connection - lateral ultimately connects to Equitrans Water Supply / Discharge Ohio River Employees4 12 Environmental Controls SCR on CCGTs installed in 2002 Facility Overview Location Brunot Island Property Size 129 acre island in Ohio River owned by GenOn Plant Capacity 259 MW
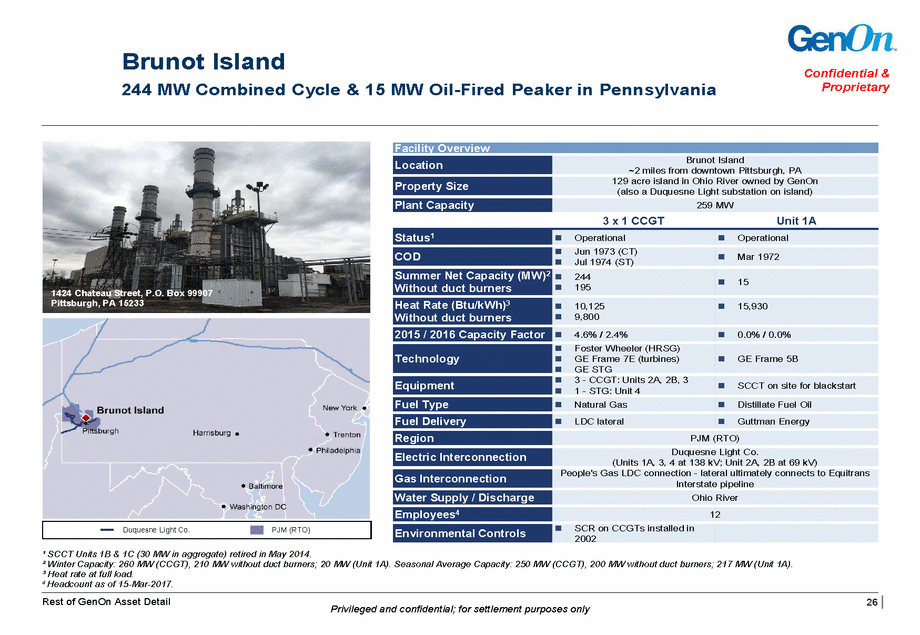
Cheswick 565 MW Coal-Fired Baseload in Pennsylvania Confidential & Proprietary 151 Porter Street Springdale, PA 15144 Unit 1 ¹ Heat rate at full load. ² Headcount as of 15-Mar-2017. Rest of GenOn Asset Detail 27 Privileged and confidential; for settlement purposes only Duquesne Light Co.PJM (RTO) Status Operational COD Jun 1970 ICAP Rating (MW) Summer 565 565 Heat Rate (Btu/kWh)1 10,268 2015 / 2016 Capacity Factor 39.2% / 39.3% Technology ST / Subcritical Equipment CE (boiler) / GE G2 (turbine) Fuel Type Bituminous Coal Fuel Delivery Barge Region PJM (RTO) Electric Interconnection Duquesne Light Co. (138 kV) Gas Interconnection N/A Water Supply / Discharge Allegheny River Employees2 83 SO2 FGD NOx AOFA, LNB, SCR Mercury FGD, ESP Particulate ESP Facility Overview Location Springdale, PA Property Size 82 acres Plant Capacity 565 MW
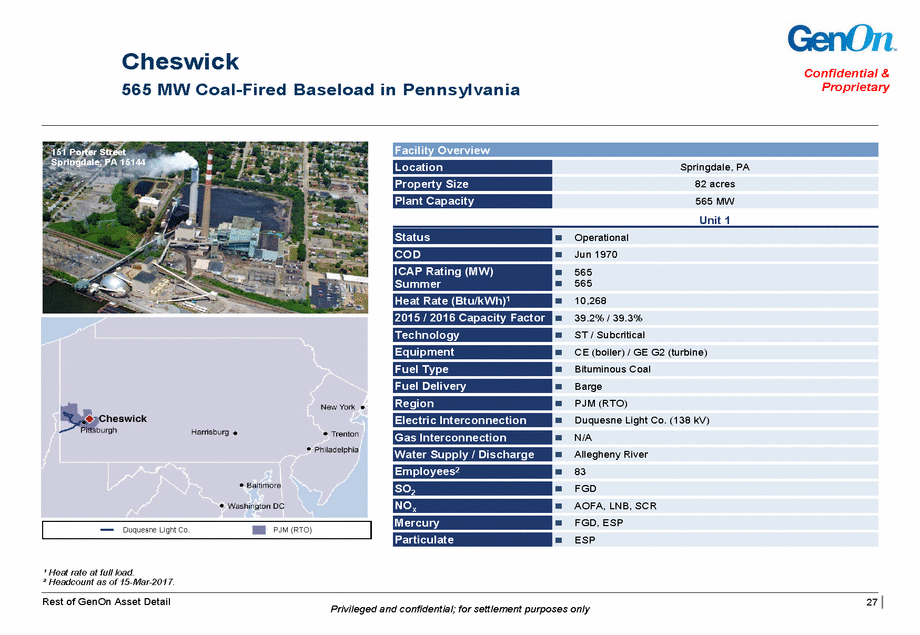
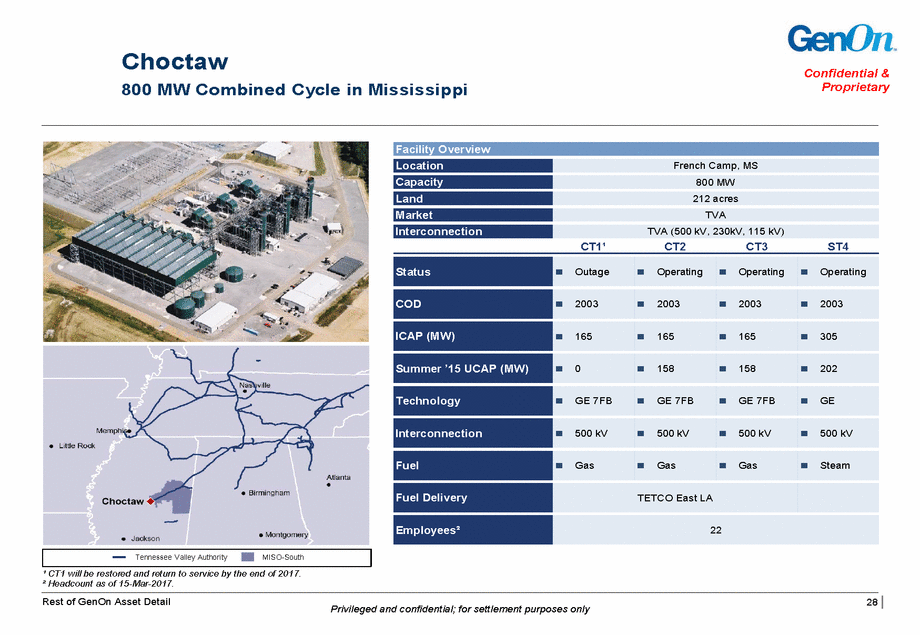
Choctaw 800 MW Combined Cycle in Mississippi Confidential & Proprietary CT1¹ CT2 CT3 ST4 ¹ CT1 will be restored and return to service by the end of 2017. ² Headcount as of 15-Mar-2017. Rest of GenOn Asset Detail 28 Privileged and confidential; for settlement purposes only Tennessee Valley AuthorityMISO-South Status OutageOperatingOperatingOperating COD 2003200320032003 ICAP (MW) 165165165305 Summer ’15 UCAP (MW) 0158158202 Technology GE 7FBGE 7FBGE 7FBGE Interconnection 500 kV500 kV500 kV500 kV Fuel GasGasGasSteam Fuel Delivery TETCO East LA Employees² 22 Facility Overview Location French Camp, MS Capacity 800 MW Land 212 acres Market TVA Interconnection TVA (500 kV, 230kV, 115 kV)
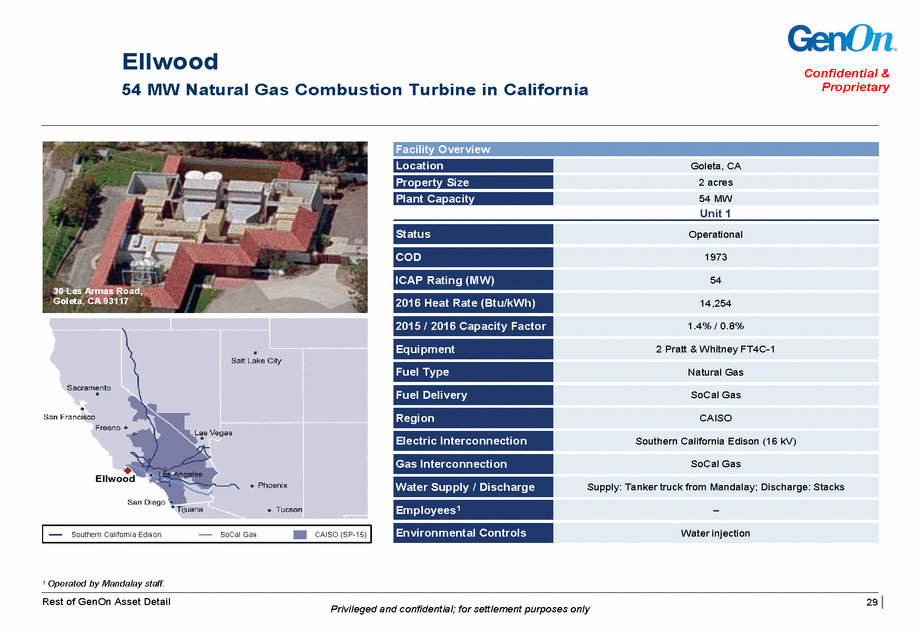
Ellwood 54 MW Natural Gas Combustion Turbine in California Confidential & Proprietary Unit 1 30 Las Armas Road, Goleta, CA 93117 1 Operated by Mandalay staff. Rest of GenOn Asset Detail 29 Privileged and confidential; for settlement purposes only Southern California EdisonSoCal GasCAISO (SP-15) Status Operational COD 1973 ICAP Rating (MW) 54 2016 Heat Rate (Btu/kWh) 14,254 2015 / 2016 Capacity Factor 1.4% / 0.8% Equipment 2 Pratt & Whitney FT4C-1 Fuel Type Natural Gas Fuel Delivery SoCal Gas Region CAISO Electric Interconnection Southern California Edison (16 kV) Gas Interconnection SoCal Gas Water Supply / Discharge Supply: Tanker truck from Mandalay; Discharge: Stacks Employees1 – Environmental Controls Water injection Facility Overview Location Goleta, CA Property Size 2 acres Plant Capacity 54 MW
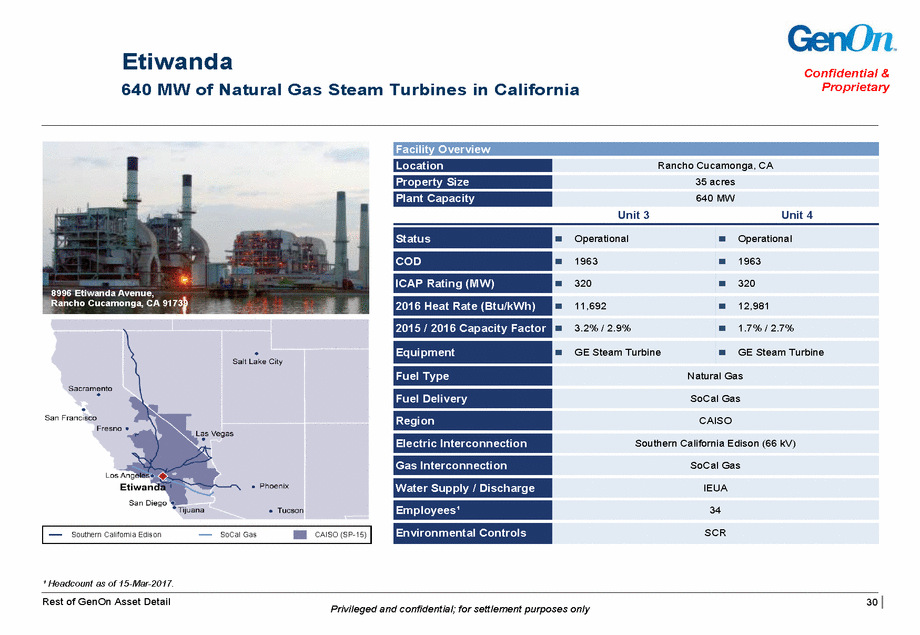
Etiwanda 640 MW of Natural Gas Steam Turbines in California Confidential & Proprietary Unit 3 Unit 4 8996 Etiwanda Avenue, Rancho Cucamonga, CA 91739 ¹ Headcount as of 15-Mar-2017. Rest of GenOn Asset Detail 30 Privileged and confidential; for settlement purposes only Southern California EdisonSoCal GasCAISO (SP-15) Status OperationalOperational COD 19631963 ICAP Rating (MW) 320320 2016 Heat Rate (Btu/kWh) 11,69212,981 2015 / 2016 Capacity Factor 3.2% / 2.9%1.7% / 2.7% Equipment GE Steam TurbineGE Steam Turbine Fuel Type Natural Gas Fuel Delivery SoCal Gas Region CAISO Electric Interconnection Southern California Edison (66 kV) Gas Interconnection SoCal Gas Water Supply / Discharge IEUA Employees¹ 34 Environmental Controls SCR Facility Overview Location Rancho Cucamonga, CA Property Size 35 acres Plant Capacity 640 MW
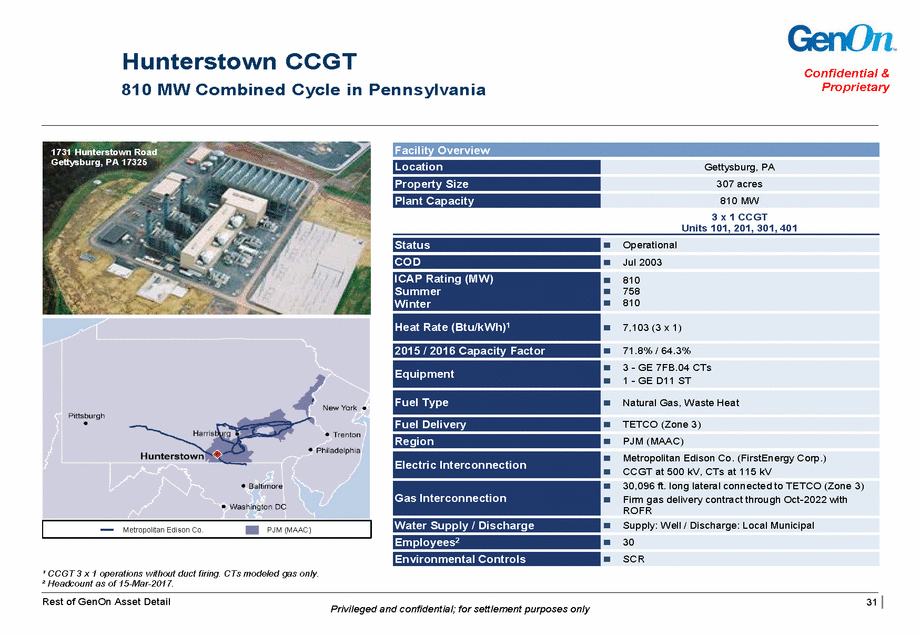
Hunterstown CCGT 810 MW Combined Cycle in Pennsylvania Confidential & Proprietary 1731 Hunterstown Road Gettysburg, PA 17325 3 x 1 CCGT Units 101, 201, 301, 401 ¹ CCGT 3 x 1 operations without duct firing. CTs modeled gas only. ² Headcount as of 15-Mar-2017. Rest of GenOn Asset Detail 31 Privileged and confidential; for settlement purposes only Metropolitan Edison Co.PJM (MAAC) Status Operational COD Jul 2003 ICAP Rating (MW) Summer Winter 810 758 810 Heat Rate (Btu/kWh)1 7,103 (3 x 1) 2015 / 2016 Capacity Factor 71.8% / 64.3% Equipment 3 - GE 7FB.04 CTs 1 - GE D11 ST Fuel Type Natural Gas, Waste Heat Fuel Delivery TETCO (Zone 3) Region PJM (MAAC) Electric Interconnection Metropolitan Edison Co. (FirstEnergy Corp.) CCGT at 500 kV, CTs at 115 kV Gas Interconnection 30,096 ft. long lateral connected to TETCO (Zone 3) Firm gas delivery contract through Oct-2022 with ROFR Water Supply / Discharge Supply: Well / Discharge: Local Municipal Employees2 30 Environmental Controls SCR Facility Overview Location Gettysburg, PA Property Size 307 acres Plant Capacity 810 MW
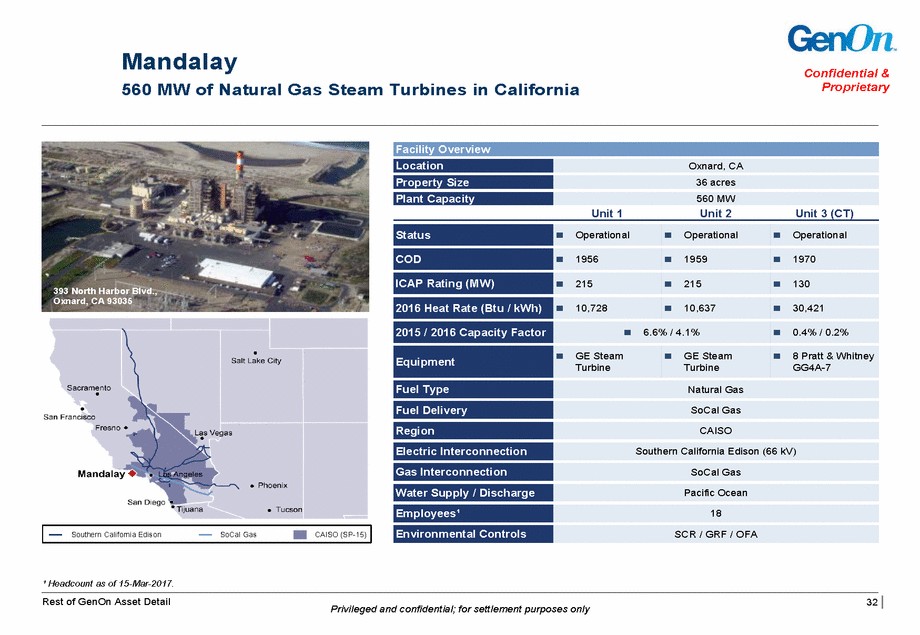
Mandalay 560 MW of Natural Gas Steam Turbines in California Confidential & Proprietary Unit 1 Unit 2 Unit 3 (CT) 393 North Harbor Blvd., Oxnard, CA 93035 Turbine Turbine GG4A-7 ¹ Headcount as of 15-Mar-2017. Rest of GenOn Asset Detail 32 Privileged and confidential; for settlement purposes only Southern California EdisonSoCal GasCAISO (SP-15) Status OperationalOperationalOperational COD 195619591970 ICAP Rating (MW) 215215130 2016 Heat Rate (Btu / kWh) 10,72810,63730,421 2015 / 2016 Capacity Factor 6.6% / 4.1%0.4% / 0.2% Equipment GE SteamGE Steam8 Pratt & Whitney Fuel Type Natural Gas Fuel Delivery SoCal Gas Region CAISO Electric Interconnection Southern California Edison (66 kV) Gas Interconnection SoCal Gas Water Supply / Discharge Pacific Ocean Employees¹ 18 Environmental Controls SCR / GRF / OFA Facility Overview Location Oxnard, CA Property Size 36 acres Plant Capacity 560 MW
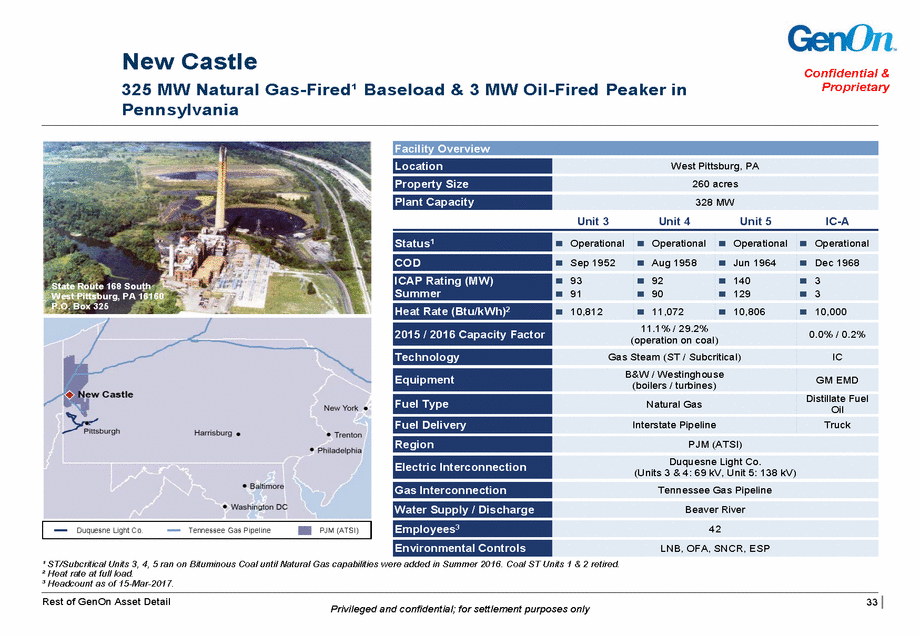
New Castle 325 MW Natural Gas-Fired¹ Baseload & 3 MW Oil-Fired Peaker in Pennsylvania Confidential & Proprietary Unit 3 Unit 4 Unit 5 IC-A State Route 168 South West Pittsburg, PA 16160 P.O. Box 325 (operation on coal) GM EMD (boilers / turbines) Oil (Units 3 & 4: 69 kV, Unit 5: 138 kV) ¹ ST/Subcritical Units 3, 4, 5 ran on Bituminous Coal until Natural Gas capabilities were added in Summer 2016. Coal ST Units 1 & 2 retired. ² Heat rate at full load. ³ Headcount as of 15-Mar-2017. Rest of GenOn Asset Detail 33 Privileged and confidential; for settlement purposes only Duquesne Light Co.Tennessee Gas PipelinePJM (ATSI) Status1 Operational Operational Operational Operational COD Sep 1952 Aug 1958 Jun 1964 Dec 1968 ICAP Rating (MW) Summer 93 92 140 3 91 90 129 3 Heat Rate (Btu/kWh)2 10,812 11,072 10,806 10,000 2015 / 2016 Capacity Factor 11.1% / 29.2%0.0% / 0.2% Technology Gas Steam (ST / Subcritical)IC Equipment B&W / Westinghouse Fuel Type Natural GasDistillate Fuel Fuel Delivery Interstate PipelineTruck Region PJM (ATSI) Electric Interconnection Duquesne Light Co. Gas Interconnection Tennessee Gas Pipeline Water Supply / Discharge Beaver River Employees3 42 Environmental Controls LNB, OFA, SNCR, ESP Facility Overview Location West Pittsburg, PA Property Size 260 acres Plant Capacity 328 MW
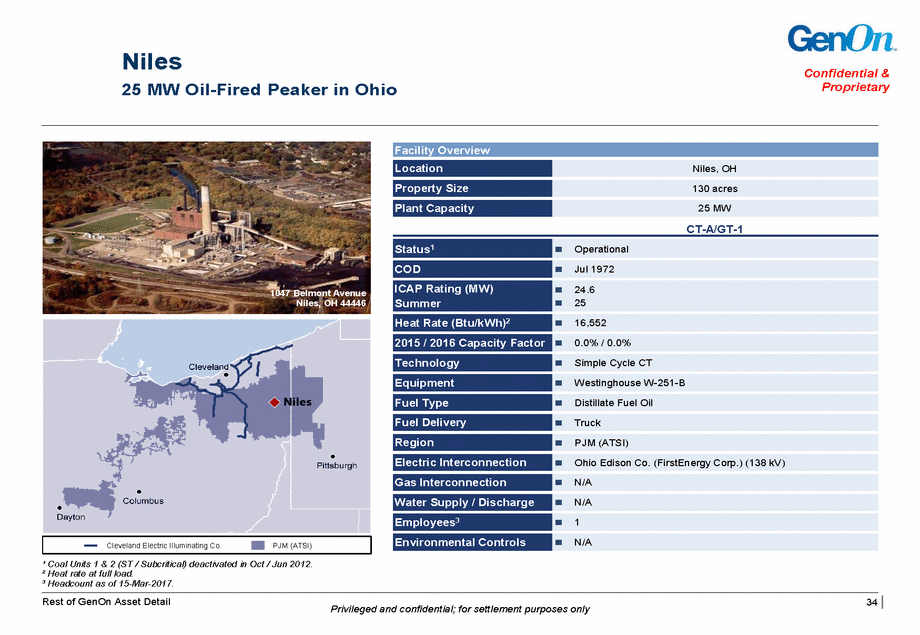
Niles 25 MW Oil-Fired Confidential & Proprietary Peaker in Ohio CT-A/GT-1 1047 Belmont Avenue Niles, OH 44446 ¹ Coal Units 1 & 2 (ST / Subcritical) deactivated in Oct / Jun 2012. ² Heat rate at full load. ³ Headcount as of 15-Mar-2017. Rest of GenOn Asset Detail 34 Privileged and confidential; for settlement purposes only Cleveland Electric Illuminating Co.PJM (ATSI) Status1 Operational COD Jul 1972 ICAP Rating (MW) Summer 24.6 25 Heat Rate (Btu/kWh)2 16,552 2015 / 2016 Capacity Factor 0.0% / 0.0% Technology Simple Cycle CT Equipment Westinghouse W-251-B Fuel Type Distillate Fuel Oil Fuel Delivery Truck Region PJM (ATSI) Electric Interconnection Ohio Edison Co. (FirstEnergy Corp.) (138 kV) Gas Interconnection N/A Water Supply / Discharge N/A Employees3 1 Environmental Controls N/A Facility Overview Location Niles, OH Property Size 130 acres Plant Capacity 25 MW
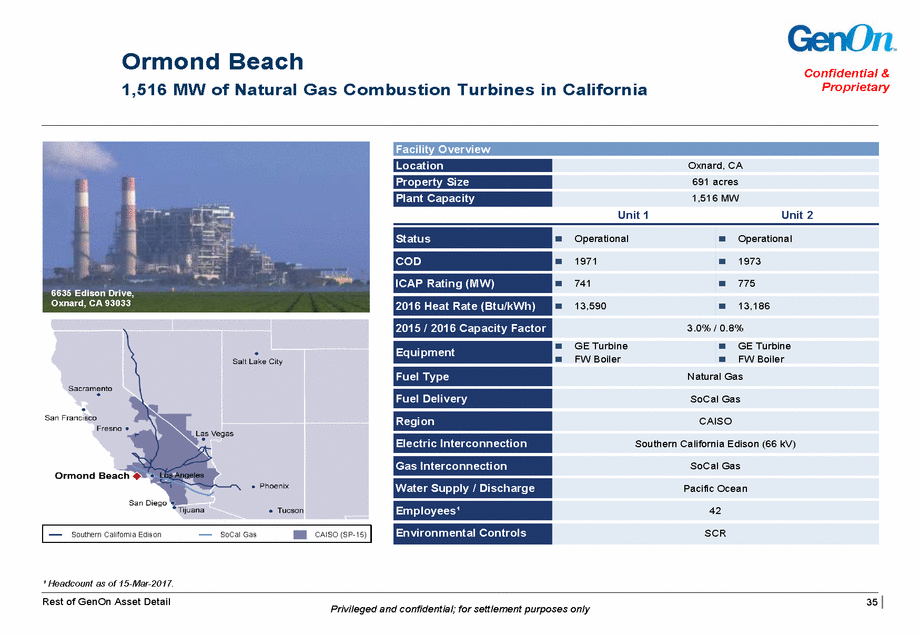
Ormond Beach 1,516 MW of Natural Gas Combustion Turbines in California Confidential & Proprietary Unit 1 Unit 2 6635 Edison Drive, Oxnard, CA 93033 ¹ Headcount as of 15-Mar-2017. Rest of GenOn Asset Detail 35 Privileged and confidential; for settlement purposes only Southern California EdisonSoCal GasCAISO (SP-15) Status OperationalOperational COD 19711973 ICAP Rating (MW) 741775 2016 Heat Rate (Btu/kWh) 13,59013,186 2015 / 2016 Capacity Factor 3.0% / 0.8% Equipment GE TurbineGE Turbine FW BoilerFW Boiler Fuel Type Natural Gas Fuel Delivery SoCal Gas Region CAISO Electric Interconnection Southern California Edison (66 kV) Gas Interconnection SoCal Gas Water Supply / Discharge Pacific Ocean Employees¹ 42 Environmental Controls SCR Facility Overview Location Oxnard, CA Property Size 691 acres Plant Capacity 1,516 MW
Confidential & Proprietary 36 Privileged and confidential; for settlement purposes only Appendix III: Rest of GAG Asset Detail Appendix II: Rest of GenOn Asset Detail Appendix I: Additional Information Transaction Proposal Company Overview
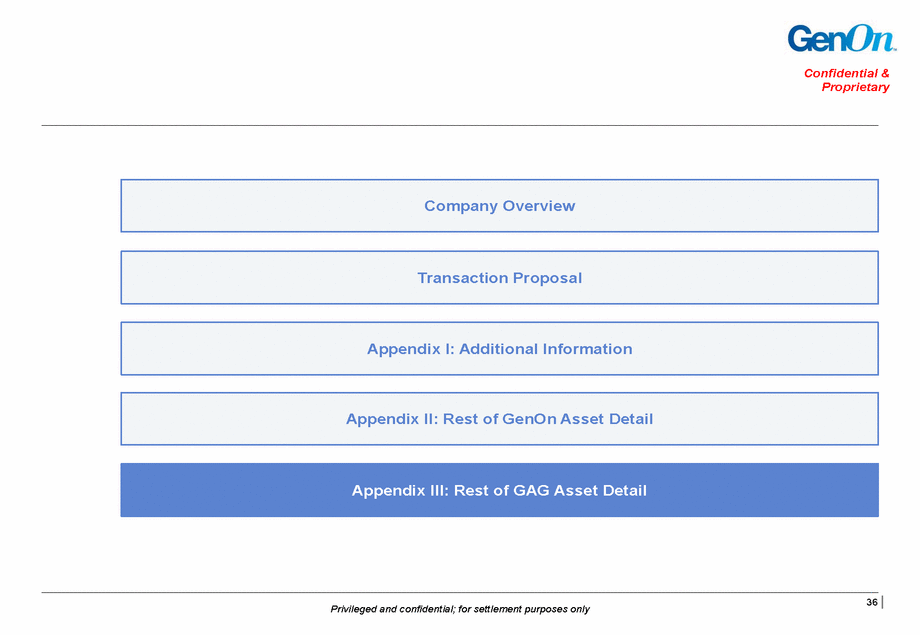
Bowline 1,142 MW Oil / Natural Gas-Fired Steam Turbine in New York Confidential & Proprietary Unit 1 Unit 2 140 Samsondale Avenue West Haverstraw, NY 10993 ¹ Winter 2016/2017 DMNC: 574.6 MW (Unit 1), 560 MW (Unit 2). Currently limited to NYISO CRIS Summer Cap of 577.7 MW (Unit 1) and 557.4 MW (Unit 2) per NYISO’s 2016 Load & Capacity Data Report (“Gold Book”). GenOn Energy Management, LLC’s request to increase Unit 2 CRIS Rights by 10 MW (567.4 MW) has been approved. ² Heat rate at full load. ³ Headcount as of 15-Mar-2017. Rest of GAG Asset Detail 37 Privileged and confidential; for settlement purposes only Orange and Rockland Utilities, Inc.NYISO (Zone G – Hudson Valley) Status OperationalOperational COD Sep 1972May 1974 Net Capacity (MW)1 Summer 2016 Winter 2015/2016 575567 567.1569 576.1561.3 Heat Rate (Btu/kWh)2 10,07810,191 2015 / 2016 Capacity Factor 26.3% / 16.7%3.5% / 11.2% Technology ST / subcriticalST / subcritical Equipment CE boiler / GE turbineB&W boiler / GE turbine Fuel Type Dual Fuel (Natural Gas, Residual FO) Region NYISO (Zone G - Hudson Valley) Electric Interconnection Orange and Rockland Utilities, Inc. (345 kV) Gas Interconnection Millenium / O&R Water Supply / Discharge Hudson River Employees3 55 Environmental Controls LNBLNB, FGR, OFA Facility Overview Location West Haverstraw, NY Property Size 257 acres Plant Capacity 1,142 MW
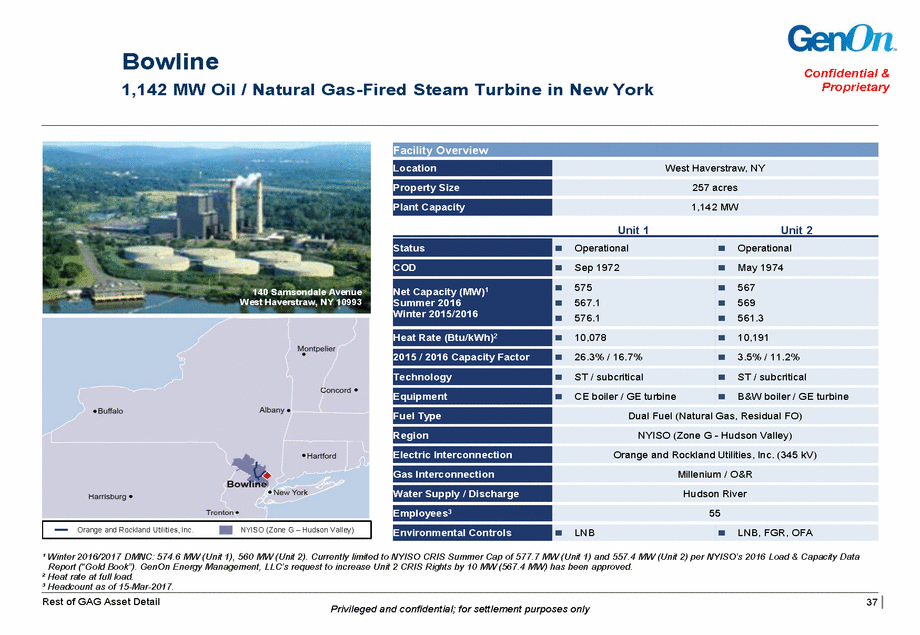
Canal 559 MW Oil-Fired Steam Turbine & 553 MW Oil / Natural Gas-Fired Steam Turbine in Massachusetts Confidential & Proprietary 9 Freezer Road Sandwich, MA 02563 Unit 1 Unit 2 8,891 Natural Gas) ¹ Unit 2 output on natural gas limited to ~341 MW. ² Heat rate at full load. ³ Headcount as of 15-Mar-2017. Rest of GAG Asset Detail 38 Privileged and confidential; for settlement purposes only EversourceAlgonquin Gas Transmission ISO-NE (SENE Capacity Zone) Status OperationalOperational COD 19681976 ICAP Rating (MW)1 Summer Winter 559553 560553 567562 Heat Rate (Btu/kWh)2 10,429 (oil) 9,789 (gas) 2015 / 2016 Capacity Factor 2.8% / 0.2%2.5% / 0.9% Technology STST Equipment B&W / WestinghouseB&W / Westinghouse (boiler / turbine)(boiler / turbine) Fuel Type Residual Fuel OilDual Fuel (Residual FO, Fuel Delivery BargeBarge / Algonquin Region ISO-NE (SENE capacity zone) Electric Interconnection Eversource (f/k/a NSTAR Electric Co.) (345 kV) Gas Interconnection Algonquin Gas Transmission (Spectra Energy) Water Supply / Discharge Municipal & Groundwater / Wastewater Treatment Plant Employees3 55 Environmental Controls FGR, OFA, SCR, ESPFGR, LNB, OFA, SNCR, ESP Facility Overview Location Sandwich, MA Property Size 133 acres Plant Capacity 1,112 MW
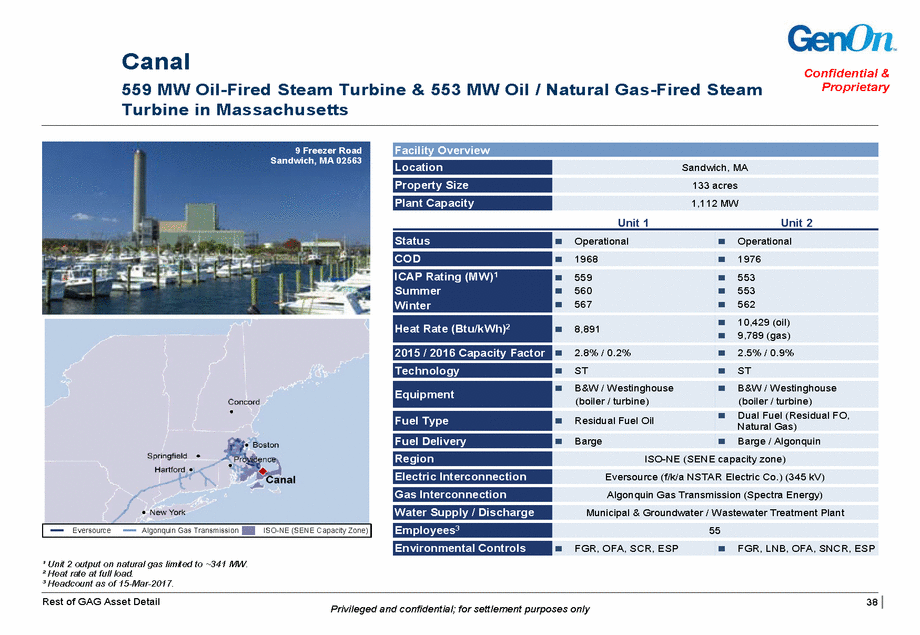
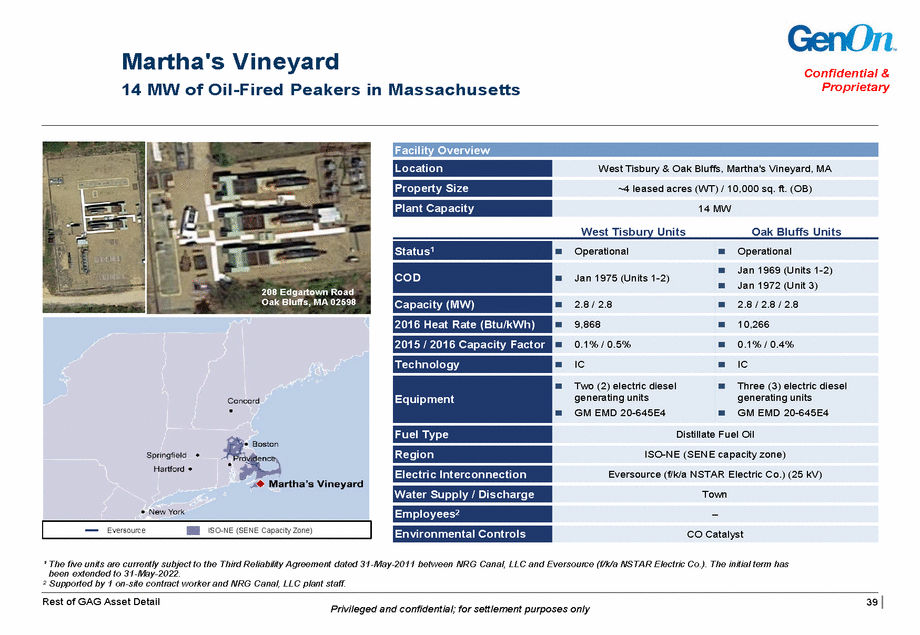
Martha's Vineyard 14 MW of Oil-Fired Peakers in Massachusetts Confidential & Proprietary West Tisbury Units Oak Bluffs Units Jan 1975 (Units 1-2) 208 Edgartown Road Oak Bluffs, MA 02598 ¹ The five units are currently subject to the Third Reliability Agreement dated 31-May-2011 between NRG Canal, LLC and Eversource (f/k/a NSTAR Electric Co.). The initial term has been extended to 31-May-2022. 2 Supported by 1 on-site contract worker and NRG Canal, LLC plant staff. Rest of GAG Asset Detail 39 Privileged and confidential; for settlement purposes only EversourceISO-NE (SENE Capacity Zone) Status1 OperationalOperational COD Jan 1969 (Units 1-2) Jan 1972 (Unit 3) Capacity (MW) 2.8 / 2.82.8 / 2.8 / 2.8 2016 Heat Rate (Btu/kWh) 9,86810,266 2015 / 2016 Capacity Factor 0.1% / 0.5%0.1% / 0.4% Technology ICIC Equipment Two (2) electric dieselThree (3) electric diesel generating unitsgenerating units GM EMD 20-645E4GM EMD 20-645E4 Fuel Type Distillate Fuel Oil Region ISO-NE (SENE capacity zone) Electric Interconnection Eversource (f/k/a NSTAR Electric Co.) (25 kV) Water Supply / Discharge Town Employees2 – Environmental Controls CO Catalyst Facility Overview Location West Tisbury & Oak Bluffs, Martha's Vineyard, MA Property Size ~4 leased acres (WT) / 10,000 sq. ft. (OB) Plant Capacity 14 MW
