Attached files
| file | filename |
|---|---|
| 8-K - 8-K - WILLIAM LYON HOMES | d399524d8k.htm |
 10 th Annual J.P. Morgan 2017 Homebuilding & Building Products Conference May 2017 Exhibit 99.1 |
 Forward
Looking Statements, Non-GAAP Information and Market Data 1
Certain statements contained in this presentation that are not historical information
may constitute “forward-looking statements” as defined by the
Private Securities Litigation Reform Act of 1995, including, but not limited to,
forward-looking statements related to: anticipated new home
deliveries, revenue and pre-tax income, margin performance, operating and financial
results for the 2017 fiscal year, community count growth and project
openings and timing, new home pricing, market and industry trends, the continued housing market recovery, leverage ratios and reduction strategies, debt costs and return and sufficiency of land supply. The forward-looking statements involve risks and uncertainties and actual
results may differ materially from those projected or implied. The
Company makes no commitment, and disclaims any duty, to update or revise any forward-looking statements to reflect future events or changes in these expectations. Further, certain forward-looking statements are
based on assumptions of future events which may not prove to be accurate.
Factors that may impact such forward-looking statements include, among
others: adverse weather conditions; the availability of labor and homebuilding
materials and increased construction cycle times; our financial leverage
and level of indebtedness and any inability to comply with financial and other covenants under our debt instruments; continued volatility and worsening in general economic conditions either internationally, nationally or in regions in which we operate; increased outside broker
costs; increased costs of homebuilding materials; changes in governmental
laws and regulations and increased costs, fees and delays associated
therewith; potential changes to the tax code; worsening in markets for residential
housing; the impact of construction defect, product liability and home
warranty claims, including the adequacy of self-insurance accruals, and the applicability and sufficiency of our insurance coverage; decline in real estate values resulting in impairment of our real estate assets; volatility in the banking industry, credit and capital markets;
terrorism or other hostilities involving the United States; building
moratorium or "slow-growth" or "no-growth" initiatives that could be implemented in states in which we operate; changes in mortgage and other interest rates; conditions in the capital, credit and financial markets, including mortgage lending
standards and the availability of mortgage financing; changes in
generally accepted accounting principles or interpretations of those principles; cancellations and our ability to realize our backlog; limitations on our ability to utilize our tax attributes; the timing of receipt of
regulatory approvals and the opening of projects; the availability and
cost of land for future development; and additional factors discussed under the sections captioned "Risk Factors" included in our annual and quarterly reports filed with the Securities and Exchange Commission. The foregoing list is not
exhaustive. New risk factors may emerge from time to time and it is not
possible for management to predict all such risk factors or to assess the
impact of such risk factors on our business. This presentation contains certain supplemental financial measures that are not calculated pursuant to U.S. GAAP. These non-GAAP measures
are in addition to, not a substitute for or superior to, measures of
financial performance prepared in accordance with GAAP. A reconciliation of
non-GAAP measures to GAAP measures is contained in the Appendix to this
presentation. A copy of the press release reporting the Company’s
financial results for the three months ended March 31, 2017 is available on the
Company's website at www.lyonhomes.com. This presentation contains market data and industry forecasts and projections prepared by independent research providers and consulting
firms. Any forecasts prepared by these sources are based on data
(including third-party data), models and experiences of various professionals, and are based on various assumptions (including the completeness and accuracy of third-party data), all of which are subject to change without
notice. We have not independently verified the data obtained from
these sources. Forecasts and other forward-looking information obtained from these sources are subject to the same qualifications and additional uncertainties regarding other forward-looking statements in this presentation,
as set forth above.
|
 Management
Presenters Matthew R. Zaist
– President and Chief Executive Officer Colin T. Severn – Senior Vice President and Chief Financial Officer 2 |
 California 34% Oregon 22% Washington 12% Nevada 14% Colorado 9% Arizona 9% California 25% Oregon 26% Washington 11% Nevada 11% Colorado 9% Arizona 18% William Lyon Homes “At-a-Glance” One of the largest Western U.S. regional homebuilders with operations in California, Arizona, Nevada, Colorado, Washington and Oregon – More than 60 year operating history with 100,000+ homes sold Provide a wide range of high-quality homes and product to entry-level, first and second-time move-up buyers, as well as luxury product. Leading market share positions in attractive housing markets Consistent growth expected to continue in 2017 More than 17,600 lots owned or controlled as of March 31, 2017 90 average selling communities in April 2017 3 High growth Western U.S. market focus LTM Q1’17 Homebuilding Revenue and Deliveries Revenue Deliveries (Units) $1.4 billion $1.4 billion 2,737 homes 2,737 homes Seattle Washington East Bay California Nevada Phoenix Las Vegas Arizona Los Angeles South Bay Orange County Colorado Fort Collins Denver Oregon Inland Empire San Diego |
 $364 $532 $731 $1,586 Entry 1st time move-up 2nd time move-up Luxury 4 We employ a diversified product strategy, even within the same project footprint, allowing us to serve a wide range of buyers and to adapt quickly to strengthening or weakening market conditions Breadth of product and price point allows flexibility to pursue a broader array of land acquisition opportunities Entry Level product represented 41% of units closed in Q1’17, up from 35% in the same period of prior year, demonstrating our continued focus on that buyer segment. ASP by Buyer Type ($ in ‘000s) Units by Buyer Type High Quality, Diverse Product Offerings Buyer Type – Q1 2017 Homes Closed Price Range – Q1 2017 Home Closings and Backlog Home Closings - Units Backlog - Units ASP: $519k ASP: $577k Buyer Type – Q1 2017 Ending Backlog $423 $571 $892 $1,495 Entry 1st time move-up 2nd time move-up Luxury ASP by Buyer Type ($ in ‘000s) Units by Buyer Type Entry 42% 1st time move-up 45% 2nd time move-up 9% Luxury 4% $300k 20% $301k - $450k 25% > $600k 32% $451k - $600k 23% > $600k
22% $301k - $450k 32% $451k - $600k 27% $300k 19% Entry 41% 2nd time move-up 16% Luxury 2% 1st time move-up 41% |
 2017: Strong Orders Growth and Demand |
 Jan Feb Mar Apr May Jun Jul Aug Sep Oct Nov Dec 202 230 257 291 255 325 225 223 203 207 176 181 227 283 355 432 6 2017 Sales Volume – Actual vs. Prior Year Total Net Orders by Month (Units) % y-o-y change: +12% +23%
+38% +48%
2016
2017 Avg. Sales Locations:
72 81
67 83 67 83 68 90
72
77
79
78
76
78
79
81
Monthly Absorption Rate:
2.8 2.8
3.4 3.4 3.8 4.3 4.3 4.8
3.5
4.2
2.8
2.9
2.7
2.7
2.2
2.2
Avg. Sales Locations:
72 81
67 83 67 83 68 90
72
77
79
78
76
78
79
81
Monthly Absorption Rate:
2.8 2.8
3.4 3.4 3.8 4.3 4.3 4.8
3.5
4.2
2.8
2.9
2.7
2.7
2.2
2.2 |
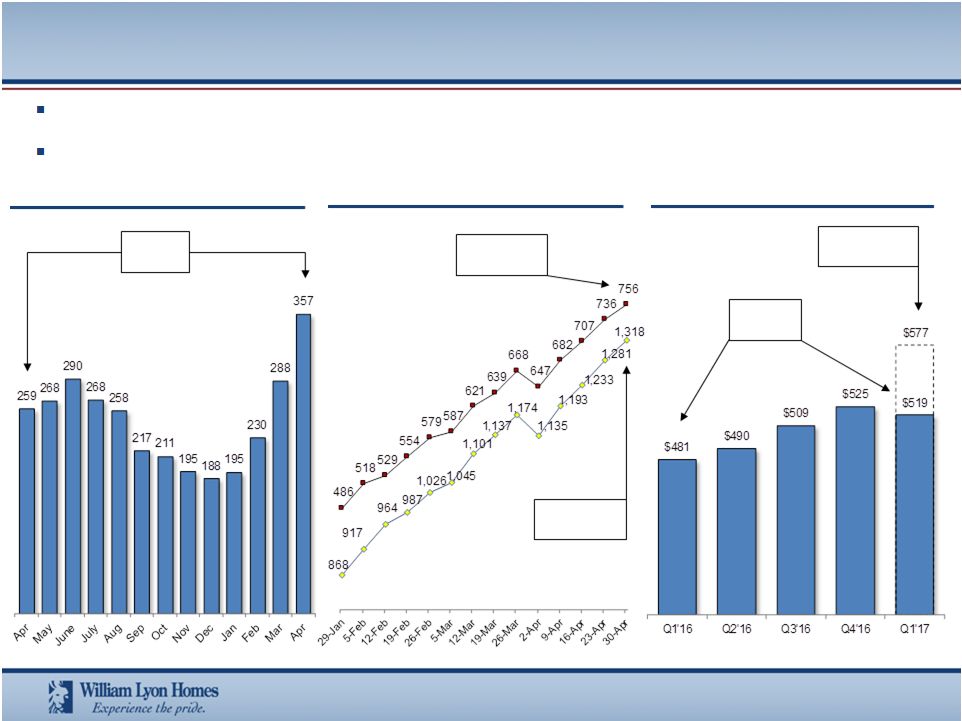 Average net sales activity, on a trailing 3 months basis, has improved 38% Y-o-Y primarily due to an increase in absorption rate by community as well as an increase in the overall community count. ASP for homes in backlog at 3/31/17 is 11% higher than deliveries ASP in Q1’2017. Total Units Net Sales – Rolling 3-Month Average Total Backlog Last 13 Weeks Quarterly - $ Thousands Total Value: $756 Million Sales Trends Sales Activity Backlog ASP (Homes Closed) 7 Total Units: 1,318 Up 8% Y-o-Y Q1’17 Backlog ASP Up 38% Y-o-Y |
 CA $167 CA $296 CA $328 AZ $62 AZ $71 AZ $71 NV $87 NV $65 NV $77 CO $53 CO $52 CO $61 WA $35 WA $81 WA $109 OR $68 OR $69 OR $110 8 Backlog Growth Value $472M Homes 885 ASP $533k Q1 2016 Q1 2017 Value $634M Homes 1,099 ASP $577k Variance $ Value +34% Units +24% ASP +8% 4/30/2017 Value $756M Homes 1,318 ASP $574k Backlog Growth by Region Variance $ Value +19% Units +20% ASP (1%) Current Gross Margin in Backlog = 18% |
 Year over
Year Comparisons 9
% y-o-y change:
+3%
+4%
+9% +26% % y-o-y change: +7%
+7% +7% +19%
% y-o-y change:
(4%)
(3%)
+2% +6%
Net New Orders (Units) Order Value (In Millions) Average Community Count Monthly Order Absorption Rate/Avg. Community % y-o-y change: +13%
+17% +17% +35%
67
73
74
69
72
78
79
82
Q2 Q3 Q4 Q1 4.2 2.9 2.3 3.3 4.0 2.8 2.4 3.5 Q2 Q3 Q4 Q1 $374 $298 $244 $335 $424 $349 $284 $453 Q2 Q3 Q4 Q1 843 628 516 689 871 651 564 865 Q2 Q3 Q4 Q1 Order ASP ($ In Thousands) $444 $486 $475
$536 $473 $504 $486 $523
Order ASP ($ In Thousands)
$444
$486 $475 $536 $473
$504 $486 $523 2015 2016 2017 |
 %
y-o-y change:
+31%
+40% +19%
(1%) Year over Year Comparisons (continued) 10 % y-o-y change: +20%
+19% +11%
(8%) Homes Closed Homebuilding Revenue ($ Million) Bps y-o-y change: (200bps)
(250bps) (260bps) (360bps) Bps y-o-y change: (180bps)
(140bps) (130bps) (210bps)
Adjusted Gross Margin Gross Margin (GAAP) $248 $244 $397 $261 $325 $343 $473 $259 Q2 Q3 Q4 Q1 26.0% 24.7% 24.2% 24.7% 24.0% 22.2% 21.6% 21.1% Q2 Q3 Q4 Q1 19.2% 18.0% 18.3% 17.7% 17.4% 16.6% 17.0% 15.6% Q2 Q3 Q4 Q1 553 564 809 543 663 673 902 499 Q2 Q3 Q4 Q1 Closings ASP ($ In Thousands) $448 $490 $433
$509 $491 $525 $481 $519 Closings ASP ($ In Thousands) $448 $490 $433
$509 $491 $525 $481 $519 2015 2016 2017 |
 Significant Growth in Revenues and Closings 11 $573 $897 $1,104 $1,406 $1,650 - $1,750 $55 $78 $87 $103 $135 - $150 1,360 1,753 2,314 2,781 3,000 – 3,250 2013 2014 2015 2016 2017 Guidance Expectations Total Revenue ($ Millions) Pre-Tax Income ($ Millions) Home Closings Totals by Year (1) Represents guidance ranges for full year 2017. (2) Represents guidance expectations for home sales revenue for full year 2017. (1) (2) |
 $150 $350 $450 2017 2018 2019 2020 2021 2022 2023 2024 2025 12 Senior Notes Refinance and Maturity Dates 5.75% Sr. Notes 5.875% Sr. Notes 7.0% Sr. Notes Note: The 5.75%, 7.0% and 5.875% Senior Notes are callable beginning in April 2016, August 2017
and February 2020, respectively.
($ in millions)
New notes description: $450 million 5.875% Senior
Notes due 2025. Interest savings of approximately $10 million annually. Net tax effected cost associated with refinance is approximately $14.1 million, which will return with interest savings in approximately 17 months. |
 13 Drive revenue growth and profitability through community count growth and monetization of existing land supply
We own or control all of our expected 2017 and 2018 selling communities.
Maintain strict operating discipline focused on earnings and cash flow
Optimize balance between opportunistic price increases with homebuyer
demand Continue focus on entry level buyer and grow on 55+ target
demographic with the Ovation Active Lifestyle Communities Enhance our
leading positions in current high growth Western U.S. markets
Decentralized management approach allows for detailed knowledge of local market
conditions Maximize our long-term and strong reputation for superior
quality and customer service Prudent focus on investor returns and balance
sheet optimization Substantial cash flow and earnings growth to reduce net
leverage Remain disciplined in land acquisitions to support future
growth Utilize long-standing local relationships with land sellers,
master planned community developers and other builders Employ land
strategy that is dynamic, nimble and responsive to prevailing and projected future market conditions Continued Execution of Our Tested Strategy |
 Divisional Market Summaries |
 15 Southern California – Active and Future Communities The Southern California Division comprises 1,682 owned and controlled lots at March 31, 2017.
WLH Headquarters Current Projects Future Projects Lyon Perspective • Sales: YOY sales increase of 74% • Pricing Power – 2.5% increase in the first four months of 2017 • Key Drivers • Markets with limited supply of new homes • Driving affordability • Coastal ASP in Backlog at $776,000 vs. Market ASP of $840,000 • Inland Empire – 43% attached with an ASP of $371,000 • Diverse offering with ASP in Backlog Range: $341,000 - $4,050,000 Third Party Market Data – JBREC and Ryness • Employment Growth to Permit Ratio at 3.3 (Past 7 year annual average of 4.2) • New and Resale Supply at 3 months vs. normal at 6 months • YOY New Home Sales up 6% • Pricing forecasted to be 5.3% for 2017 |
 16 Northern California – Active and Future Communities The Northern California Division comprises 894 owned and controlled lots at March 31, 2017.
Lyon Perspective
Core Bay Area
• Sales: YOY sales and rates of sales increase of 86% • Pricing Power – 2.5% increase in the first four months of 2017 • Key Drivers • Markets with limited supply of new homes • Bayshores – Driving Affordability: • ASP in Backlog of $843,000 • South Bay Area Existing Median Home Price of $924,000 • Access to transportation and job centers Third Party Market Data – JBREC Bay Area • Employment Growth to Permit Ratio at 4 (Past 7 year annual average
of 4.2)
• New and Resale Supply at 0.76 and 0.9 months, respectively • Existing Median Home Price is $924,400 • Pricing forecasted to be 4.9% for 2017 Future Projects Current Projects |
 17 Arizona – Active and Future Communities The Arizona Division comprises 4,838 owned and controlled lots at March 31, 2017. Lyon Perspective • Sales: YOY sales and rates of sales increase of 23% • Pricing Power – 2% increase in the first four months of 2017 • Key Drivers • Affordability – ASP in Backlog of $298,000 vs. MSA average of $312,600 • Quality Land Supply and Master Planned Driven: • Total Lots Owned of 4,932 • Meridian – 2,247 lots with 4 actively selling communities and 4 in planning • Rancho Mercado – 1,928 lots available in products opening for sale in 2018 • Currently planning for 6 product types Third Party Market Data – JBREC • Employment Growth to Permit Ratio at 1.9 (Past 7 year average
of 2.6)
• Supply constrained: • 18,746 forecasted permits vs. 37 year average of 24,000 • Existing Home Supply shrinking. Currently at 2.7 months • Pricing forecasted to be 5.8% for 2017 Current Projects Future Projects |
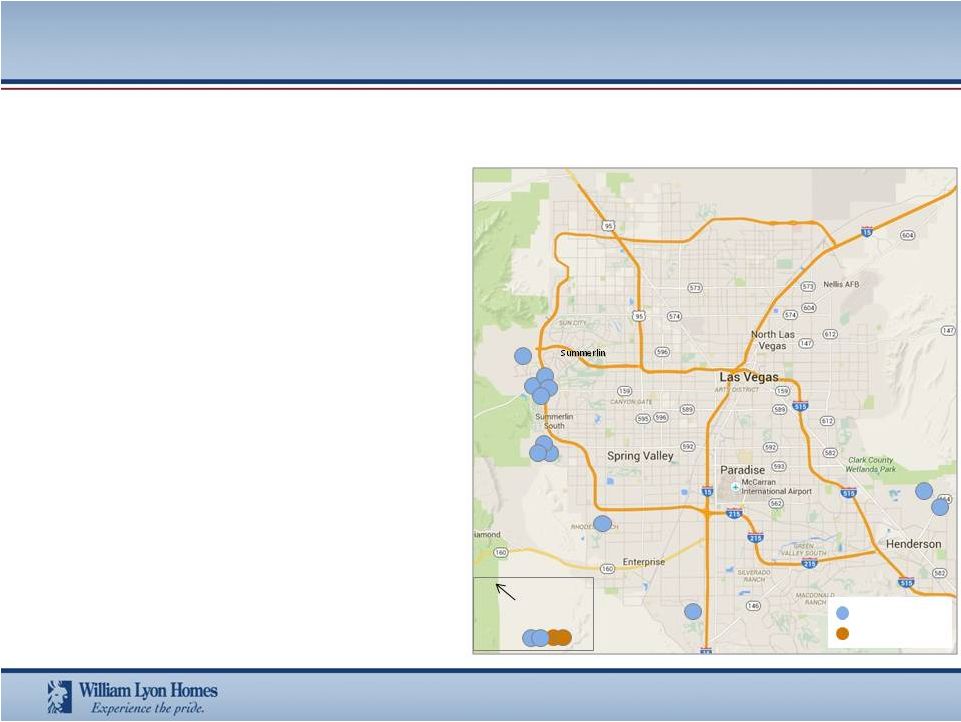 18 Nevada – Active and Future Communities The Nevada Division comprises 3,023 owned and controlled lots at March 31, 2017. 30 miles Pahrump Lyon Perspective • Sales: YOY sales and rates of sales up 10% • Pricing Power – 4% increase in the first four months of 2017 • Key Drivers • Diverse offering appealing to broad buyer base •ASP
in
Backlog
Range:
$220,000
-
$1,641,000
• The Future – Focused on two large groups of the population - Millennials and Boomers • Affinity – The Millennials: • 485 attached homes, 4 product types in Summerlin with an ASP of $390,000 • Ovation at Mountain Falls – The Boomers • 500 SFD homes, 3 product types with an ASP of $325,000 Third Party Market Data – JBREC • Employment Growth to Permit Ratio at 1.8 (Past 7 year average of 2.4) • Supply constrained: • 9,000 forecasted permits vs. 30 year average of 15,000 • Existing Home Supply shrinking. Currently at 3 months • Our most affordable market with affordability at its historical
median
• Pricing forecasted to be 6.7% for 2017 Current Projects Future Projects |
 19 Colorado – Active and Future Communities The Colorado Division comprises 1,519 owned and controlled lots at March 31, 2017.
Lyon Perspective
• Q1 – Product repositioning 60% of existing communities • Sales: YOY sales down 8% due to product repositioning • April Sales up 3% YOY • Pricing Power – 3% increase in the first four months of 2017 • Key Drivers • The Future – High Quality MSA focus and Driving for greater Affordability • Avion at Denver Connection: • 694 attached and detached homes, 4 product types in Denver with ASP in backlog of $309,000 • High Quality MSA’s – Main and Main • Denver, Aurora, Erie Third Party Market Data – JBREC • Employment Growth to Permit Ratio forecasted for 2017 to be 1.2 (Past
7 year average of 2.5)
• Job Creation continues to grow 28,600 jobs projected in Denver in 2017
• Supply constrained: • 10,190 forecasted permits vs. 20 year average of 13,000 • Existing Home Supply at 0.9 months • Pricing forecasted to be 7.5% for 2017 Current Projects Future Projects |
 20 Oregon – Active and Future Communities The Oregon Division comprises 3,351 owned and controlled lots at March 31, 2017. Nike Xerox FLIR Mentor Graphics Oregon Health & Science Foundation Intel Intel Hawthorne Kaiser Key Employers Downtown Current Projects Future Projects Lyon Perspective • #1 in Market Share in Portland • Sales: YOY sales increase of 9.4% • Pricing Power – 3.1% increase in the first four months of 2017 • Key Drivers • Strong Key Assets in 3 West Side Portland Masterplans • Villebois – 626 owned/controlled lots • Bethany – 694 owned/controlled lots • River Terrace – 1,754 owned/controlled lots • Creating value through community vs. neighborhood • Diverse offering with 4 – 6 product types per community • 25% Attached, 75% detached Third Party Market Data – JBREC • Employment Growth to Permit Ratio at 1.4 (Past 7 year average
of 2.5)
• Income growth continues to be strong at 4.4% forecasted for 2017 and up 21.6% since 2010 • New and Resale Supply at 1.2 months • Pricing forecasted to be 7.4% for 2017 |
 21 Washington – Active and Future Communities The Washington Division comprises 2,333 owned and controlled lots at March 31, 2017.
Key Employers Downtown Boeing Amazon Boeing Costco Microsoft Current Projects Future Projects Lyon Perspective • Sales: YOY sales increase of 100% • Pricing Power – 3.6% increase in the first four months of 2017 • Key Drivers • Outstanding High Quality Markets with limited supply • Driving affordability – ASP in Backlog at $614,000 vs. Market ASP of $651,000 • Diverse offering with ASP in Backlog Range: $274,990 - $1,234,990 • Diverse Product Type with 40% Attached and 60% Detached • Key Assets coming to market in the back half of the year: • Crossroads – Bellevue • Westridge Single Family – Issaquah Highlands • High Point – Seattle • Ovation at Oak Tree Preserve – Lacey Third Party Market Data – JBREC • Employment Growth to Permit Ratio at 2.4 – consistent with past 5 years • New and Resale Supply at 0.6 months • 2017 Forecasted New Home Permits to be 7,800, while New Home
Sales at 6,900
• Pricing forecasted to be 6.5% for 2017 Starbucks |
 Appendix |
 23 William Lyon Homes’ business has continued to deliver across a number of financial and operating metrics
– Dollar value of orders up 35% y-o-y and new home orders up 26% y-o-y.
– Average Sales Price of homes closed up 8% y-o-y. – New home deliveries are down 8% y-o-y and home sales revenues down 1% y-o-y.
– Adjusted EBITDA of $22.5 million in Q1, down 33% y-o-y. Note: See reconciliation of non-GAAP measures in the appendix section of this presentation.
Summary of 2017 Q1 Results
3/31/2017 3/31/2016 Change Select operating statistics New home orders 865 689 26% Dollar value of orders ($mm) $452.7 $334.5 35% New home deliveries 499 543 (8%) ASP (homes closed, $000s) $518.7 $481.2 8% Summary financial information ($mm) Home sales revenue $258.9 $261.3 (1%) Homebuilding gross profit $40.4 $46.1 (12%) Operating income $6.3 $13.3 (53%) Adj. Net income to common stockholders $4.1 $9.0 (54%) Adjusted diluted EPS ($) $0.11 $0.24 (54%) Adjusted EBITDA $22.5 $33.5 (33%) Select margins bps Gross margin 15.6% 17.7% (210) Adjusted gross margin 21.1% 24.7% (360) SG&A margin 13.0% 12.5% (50) Three months ended |
 Strong
New Order Growth – Dollars Trailing Twelve Months
Dollar value of new home orders of $1.5 billion TTM Q1, an increase of 21% over the
prior year and up 71% over a two year period.
Q1’17 dollar value of new orders was $453 million, up 35% over the prior
year. 24 $880 $1,058 $1,158 $1,185 $1,251 $1,300 $1,351 $1,391 $1,509 $0 $200 $400 $600 $800 $1,000 $1,200 $1,400 $1,600 $1,800 Q1'15 Q2'15 Q3'15 Q4'15 Q1'16 Q2'16 Q3'16 Q4'16 Q1'17 TTM Dollar Value of Orders ($ Millions) TTM Ending: Up 21% Y-o-Y |
 Continued
Growth and Diversification Through Monetization of High Quality Land
Positions 25
Total lots owned and controlled vs. years of land supply
LTM Deliveries - Units Continued diversification across markets Lots Inventory Summary as of 3/31/17 We own 13,404 lots (76% of total) and control 4,236 lots (24% of total) as of March 31, 2017 in some of
the most dynamic and land constrained markets in the Western U.S.
LTM Home Revenue - $ Owned - Active Projects Owned - Future Projects Controlled Total Lots Lots Inventory California 1,183 309 1,084 2,576 Arizona 1,793 3,045 -
4,838
Nevada
1,052
1,933
38 3,023
Colorado 461 981 77
1,519
Oregon 890 532 1,929 3,351 Washington 942 283 1,108 2,333 Total 6,321 7,083 4,236 17,640 18,035 18,835 18,149 17,858 17,640 5.7 5.7 5.2 5.3 5.3 0 2 4 6 8 10 0 5,000 10,000 15,000 20,000 Q1 2016 Q2 2016 Q3 2016 Q4 2016 Q1 2017 Years of supply Total lots years California 25% Oregon 26% Washington 11% Nevada 11% Colorado 9% Arizona 18% California 34% Oregon 22% Washington 12% Nevada 14% Colorado 9% Arizona 9% |
 26 Backlog Conversion Rate Backlog Conversion Rate - Quarterly 82% 73% 73% 75% 68% 78% 98% 81% 82% 58% 78% 73% 75% 62% 84% 68% Annually (Wtd. Avg.) Quarterly |
 Adjusted
EBITDA Reconciliation 27
Adjusted EBITDA is not a financial measure prepared in accordance
with U.S. GAAP. Adjusted EBITDA is presented herein because management believes the presentation of adjusted EBITDA provides useful information to the Company’s investors regarding the Company’s
financial condition and results of operations because
adjusted EBITDA is a widely utilized indicator of a company's operating performance. 2017 2016 (dollars in thousands) Net (loss) income to common stockholders $ (10,000) $ 9,014 (Benefit from) provision for income taxes (5,630) 5,045 Interest expense aaInterest
incurred 19,424
20,261 aaInterest
capitalized (19,424)
(20,261) Amortization of capitalized interest included in cost of sales 11,608 11,747 Stock-based compensation 1,676 1,492 Depreciation and amortization 449 498 Non-cash purchase accounting adjustments 2,501 6,593 Cash distributions of income from unconsolidated joint ventures 359 324 Equity in income of unconsolidated joint ventures (249) (1,181) Loss on extinguishment of debt 21,828 - Adjusted EBITDA $ 22,542 $ 33,532 Three Months Ended March 31, Adjusted EBITDA |
 Adjusted
Homebuilding Gross Margin Reconciliation 28
(1) Cost of sales excluding interest and purchase accounting adjustments.
Adjusted homebuilding gross margin is a financial measure that is
not prepared in accordance with U.S. GAAP. It is used by management in evaluating operating performance and in making strategic decisions regarding sales pricing, construction and development pace, product mix and
other operating decisions. We believe this information
is meaningful as it isolates the impact that interest and purchase accounting adjustments have on homebuilding gross margin and allows investors to make better comparisons with our competitors. 2017 2016 (dollars in thousands) Homes closed 499 543 Home sales revenue $ 258,854 $ 261,295 Adjusted cost of sales (1) (204,346) (196,831) Adjusted gross margin $ 54,508 $ 64,464 Adjusted gross margin percentage 21.1% 24.7% Interest in cost of sales (11,608) (11,747) Purchase accounting adjustments (2,501) (6,593) Gross margin $ 40,399 $ 46,124 Gross margin percentage 15.6% 17.7% Three Months Ended March 31, Selected Financial Information |
 Adjusted
Net Income and Adjusted Diluted EPS Reconciliation 29
Three Months Ended March 31, Adjusted Net Income and Adjusted EPS 2017 (dollars in thousands, except share data) Net loss available to common stockholders (10,000) $ Add: Loss on extinguishment of debt 21,828 (7,752) 4,076 $ Diluted weighted average common shares outstanding 38,360,335 0.11 $ Net income, adjusted for loss on extinghishment of debt, net of tax benefit Less: Income tax benefit applicable to loss on extinguishment of debt Adjusted net income excluding noncontrolling interest per diluted share Adjusted net income is not a financial measure prepared in accordance with U.S. GAAP. Adjusted net income is presented
herein because management believes the presentation of
adjusted net income provides useful information to the Company’s investors regarding the Company’s results of operations because adjusted net income isolates the impact of the infrequent extinguishment fees.
Diluted weighted average common shares outstanding as presented on
the Consolidated Statement of Operations excludes any potentially issuable anti-dilutive shares due to the net loss reported for the period presented. Additional dilutive shares have been included in this
calculation. |