Attached files
| file | filename |
|---|---|
| 8-K - 8-K - BUCKEYE PARTNERS, L.P. | a17-13816_18k.htm |
Exhibit 99.1
Wells Fargo Kick the Tires Houston, TX May 18, 2017

© Copyright 2017 Buckeye Partners, L.P. 2 This presentation contains “forward-looking statements” that we believe to be reasonable as of the date of this presentation. These statements, which include any statement that does not relate strictly to historical facts, use terms such as “anticipate,” “assume,” “believe,” “estimate,” “expect,” “forecast,” “intend,” “plan,” “position,” “potential,” “predict,” “project,” or “strategy” or the negative connotation or other variations of such terms or other similar terminology. In particular, statements, expressed or implied, regarding future results of operations or ability to generate sales, income or cash flow, to make acquisitions, or to make distributions to unitholders are forward-looking statements. These forward-looking statements are based on management’s current plans, expectations, estimates, assumptions and beliefs concerning future events impacting Buckeye Partners, L.P. (the “Partnership”, “Buckeye” or “BPL”) and therefore involve a number of risks and uncertainties, many of which are beyond management’s control. Although the Partnership believes that its expectations stated in this presentation are based on reasonable assumptions, actual results may differ materially from those expressed or implied in the forward-looking statements. The factors listed in the “Risk Factors” sections of, as well as any other cautionary language in, the Partnership’s public filings with the Securities and Exchange Commission, provide examples of risks, uncertainties and events that may cause the Partnership’s actual results to differ materially from the expectations it describes in its forward-looking statements. Each forward-looking statement speaks only as of the date of this presentation, and the Partnership undertakes no obligation to update or revise any forward-looking statement. LEGAL NOTICE / FORWARD-LOOKING STATEMENTS
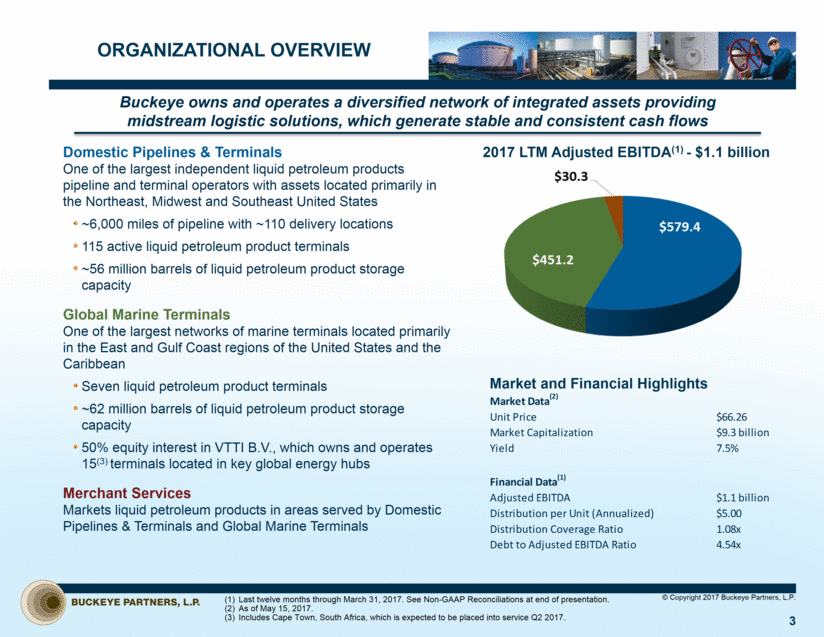
Last twelve months through March 31, 2017. See Non-GAAP Reconciliations at end of presentation. As of May 15, 2017. Includes Cape Town, South Africa, which is expected to be placed into service Q2 2017. ORGANIZATIONAL OVERVIEW Domestic Pipelines & Terminals One of the largest independent liquid petroleum products pipeline and terminal operators with assets located primarily in the Northeast, Midwest and Southeast United States ~6,000 miles of pipeline with ~110 delivery locations 115 active liquid petroleum product terminals ~56 million barrels of liquid petroleum product storage capacity Global Marine Terminals One of the largest networks of marine terminals located primarily in the East and Gulf Coast regions of the United States and the Caribbean Seven liquid petroleum product terminals ~62 million barrels of liquid petroleum product storage capacity 50% equity interest in VTTI B.V., which owns and operates 15(3) terminals located in key global energy hubs Merchant Services Markets liquid petroleum products in areas served by Domestic Pipelines & Terminals and Global Marine Terminals Buckeye owns and operates a diversified network of integrated assets providing midstream logistic solutions, which generate stable and consistent cash flows 2017 LTM Adjusted EBITDA(1) - $1.1 billion Market and Financial Highlights © Copyright 2017 Buckeye Partners, L.P. 3 Market Data (2) Unit Price $66.26 Market Capitalization $9.3 billion Yield 7.5% Financial Data (1) Adjusted EBITDA $1.1 billion Distribution per Unit (Annualized) $5.00 Distribution Coverage Ratio 1.08x Debt to Adjusted EBITDA Ratio 4.54x
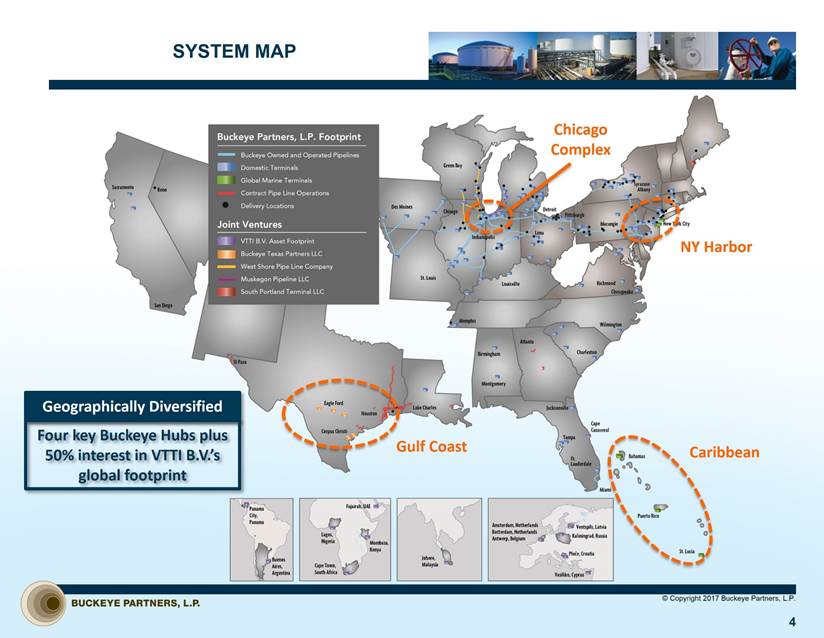
SYSTEM MAP 4 © Copyright 2017 Buckeye Partners, L.P. Chicago Complex NY Harbor Caribbean Gulf Coast Geographically Diversified Four key Buckeye Hubs plus 50% interest in VTTI B.V.’s global footprint
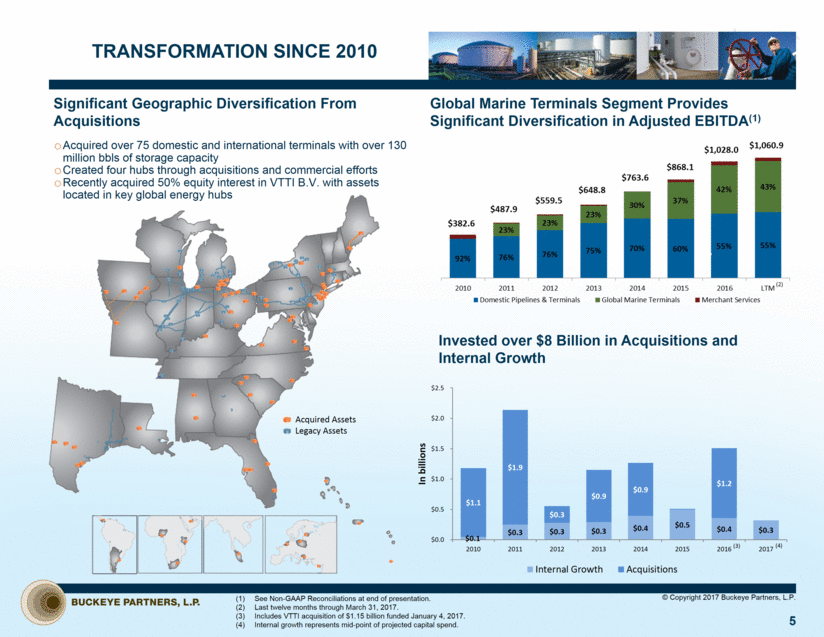
TRANSFORMATION SINCE 2010 5 Global Marine Terminals Segment Provides Significant Diversification in Adjusted EBITDA(1) Invested over $8 Billion in Acquisitions and Internal Growth See Non-GAAP Reconciliations at end of presentation. Last twelve months through March 31, 2017. Includes VTTI acquisition of $1.15 billion funded January 4, 2017. Internal growth represents mid-point of projected capital spend. Significant Geographic Diversification From Acquisitions Acquired over 75 domestic and international terminals with over 130 million bbls of storage capacity Created four hubs through acquisitions and commercial efforts Recently acquired 50% equity interest in VTTI B.V. with assets located in key global energy hubs © Copyright 2017 Buckeye Partners, L.P. (4) Acquired Assets Legacy Assets (2) (3) $0.1 $0.3 $0.3 $0.3 $0.4 $0.5 $0.4 $0.3 $1.1 $1.9 $0.3 $0.9 $0.9 $1.2 $0.0 $0.5 $1.0 $1.5 $2.0 $2.5 2010 2011 2012 2013 2014 2015 2016 2017 In billions Internal Growth Acquisitions
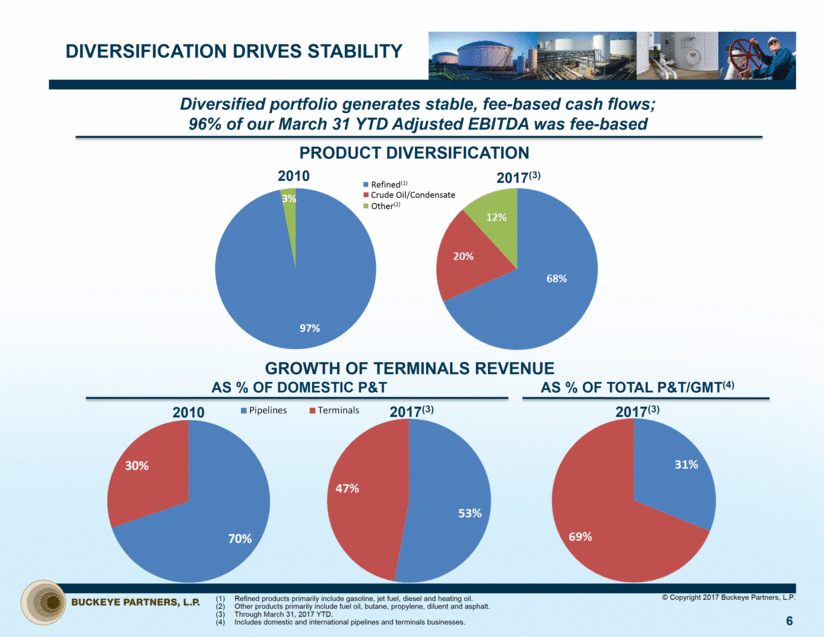
0% 3% Refined(1) Crude Oil/Condensate Other(2) Diversified portfolio generates stable, fee-based cash flows; 96% of our March 31 YTD Adjusted EBITDA was fee-based DIVERSIFICATION DRIVES STABILITY 6 2010 2017(3) Refined products primarily include gasoline, jet fuel, diesel and heating oil. Other products primarily include fuel oil, butane, propylene, diluent and asphalt. Through March 31, 2017 YTD. Includes domestic and international pipelines and terminals businesses. PRODUCT DIVERSIFICATION GROWTH OF TERMINALS REVENUE 2010 2017(3) 2017(3) AS % OF TOTAL P&T/GMT(4) AS % OF DOMESTIC P&T © Copyright 2017 Buckeye Partners, L.P. 97% 3% 35% 65% Pipelines Terminals 70% 30%
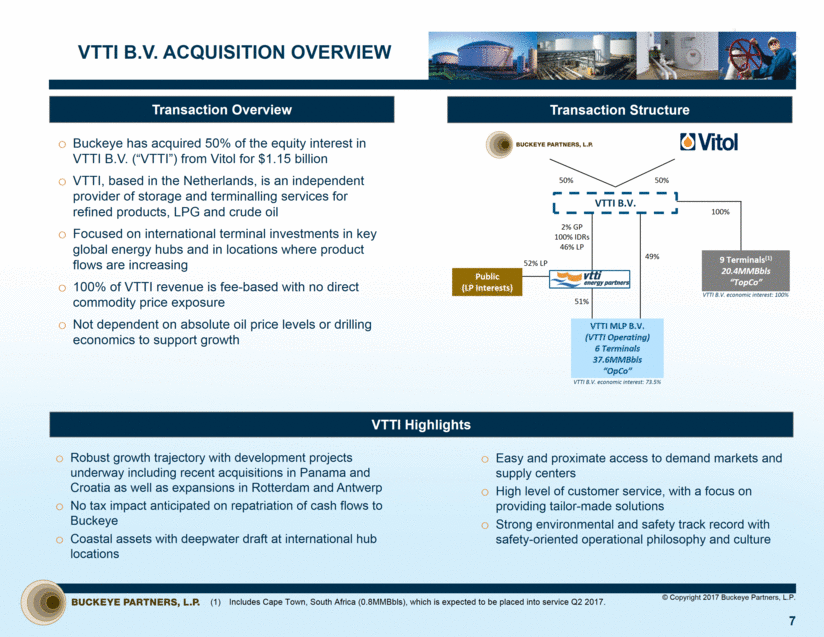
Buckeye has acquired 50% of the equity interest in VTTI B.V. (“VTTI”) from Vitol for $1.15 billion VTTI, based in the Netherlands, is an independent provider of storage and terminalling services for refined products, LPG and crude oil Focused on international terminal investments in key global energy hubs and in locations where product flows are increasing 100% of VTTI revenue is fee-based with no direct commodity price exposure Not dependent on absolute oil price levels or drilling economics to support growth © Copyright 2017 Buckeye Partners, L.P. 7 Transaction Overview VTTI B.V. ACQUISITION OVERVIEW Easy and proximate access to demand markets and supply centers High level of customer service, with a focus on providing tailor-made solutions Strong environmental and safety track record with safety-oriented operational philosophy and culture VTTI Highlights Transaction Structure VTTI B.V. Public (LP Interests) 50% 52% LP VTTI MLP B.V. (VTTI Operating) 6 Terminals 37.6MMBbls “OpCo” 9 Terminals(1) 20.4MMBbls “TopCo” 100% 50% 51% 2% GP 100% IDRs 46% LP 49% VTTI B.V. economic interest: 73.5% VTTI B.V. economic interest: 100% Robust growth trajectory with development projects underway including recent acquisitions in Panama and Croatia as well as expansions in Rotterdam and Antwerp No tax impact anticipated on repatriation of cash flows to Buckeye Coastal assets with deepwater draft at international hub locations Includes Cape Town, South Africa (0.8MMBbls), which is expected to be placed into service Q2 2017.
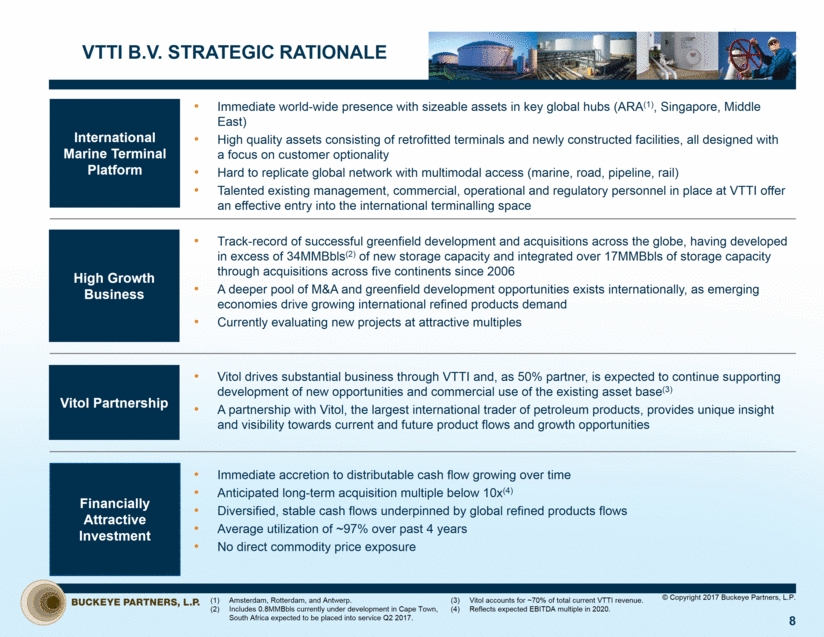
© Copyright 2017 Buckeye Partners, L.P. 8 International Marine Terminal Platform High Growth Business Vitol Partnership Financially Attractive Investment Immediate world-wide presence with sizeable assets in key global hubs (ARA(1), Singapore, Middle East) High quality assets consisting of retrofitted terminals and newly constructed facilities, all designed with a focus on customer optionality Hard to replicate global network with multimodal access (marine, road, pipeline, rail) Talented existing management, commercial, operational and regulatory personnel in place at VTTI offer an effective entry into the international terminalling space Track-record of successful greenfield development and acquisitions across the globe, having developed in excess of 34MMBbls(2) of new storage capacity and integrated over 17MMBbls of storage capacity through acquisitions across five continents since 2006 A deeper pool of M&A and greenfield development opportunities exists internationally, as emerging economies drive growing international refined products demand Currently evaluating new projects at attractive multiples Vitol drives substantial business through VTTI and, as 50% partner, is expected to continue supporting development of new opportunities and commercial use of the existing asset base(3) A partnership with Vitol, the largest international trader of petroleum products, provides unique insight and visibility towards current and future product flows and growth opportunities Immediate accretion to distributable cash flow growing over time Anticipated long-term acquisition multiple below 10x(4) Diversified, stable cash flows underpinned by global refined products flows Average utilization of ~97% over past 4 years No direct commodity price exposure Amsterdam, Rotterdam, and Antwerp. Includes 0.8MMBbls currently under development in Cape Town, South Africa expected to be placed into service Q2 2017. VTTI B.V. STRATEGIC RATIONALE Vitol accounts for ~70% of total current VTTI revenue. Reflects expected EBITDA multiple in 2020.
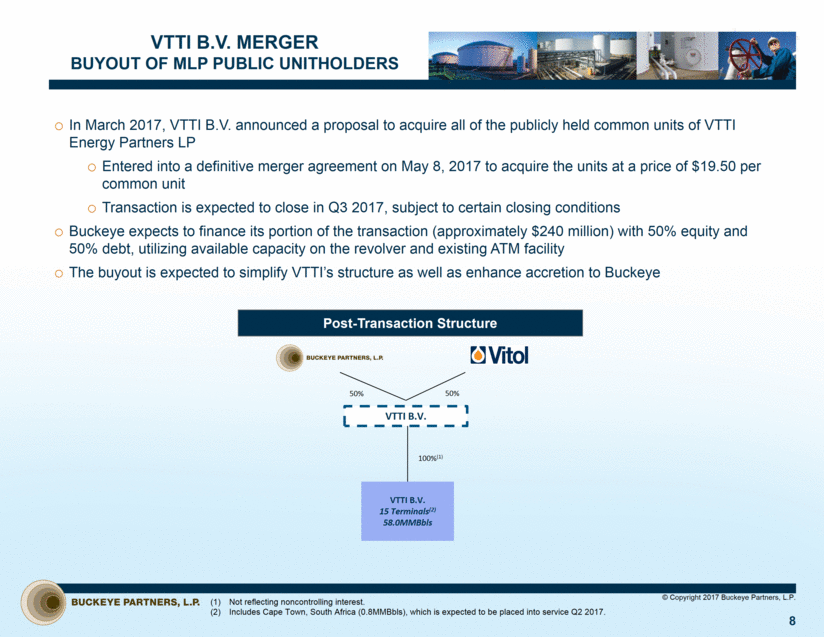
© Copyright 2017 Buckeye Partners, L.P. VTTI B.V. MERGER BUYOUT OF MLP PUBLIC UNITHOLDERS Post-Transaction Structure VTTI B.V. 50% VTTI B.V. 15 Terminals(2) 58.0MMBbls 50% 100%(1) In March 2017, VTTI B.V. announced a proposal to acquire all of the publicly held common units of VTTI Energy Partners LP Entered into a definitive merger agreement on May 8, 2017 to acquire the units at a price of $19.50 per common unit Transaction is expected to close in Q3 2017, subject to certain closing conditions Buckeye expects to finance its portion of the transaction (approximately $240 million) with 50% equity and 50% debt, utilizing available capacity on the revolver and existing ATM facility The buyout is expected to simplify VTTI’s structure as well as enhance accretion to Buckeye 8 Not reflecting noncontrolling interest. Includes Cape Town, South Africa (0.8MMBbls), which is expected to be placed into service Q2 2017.
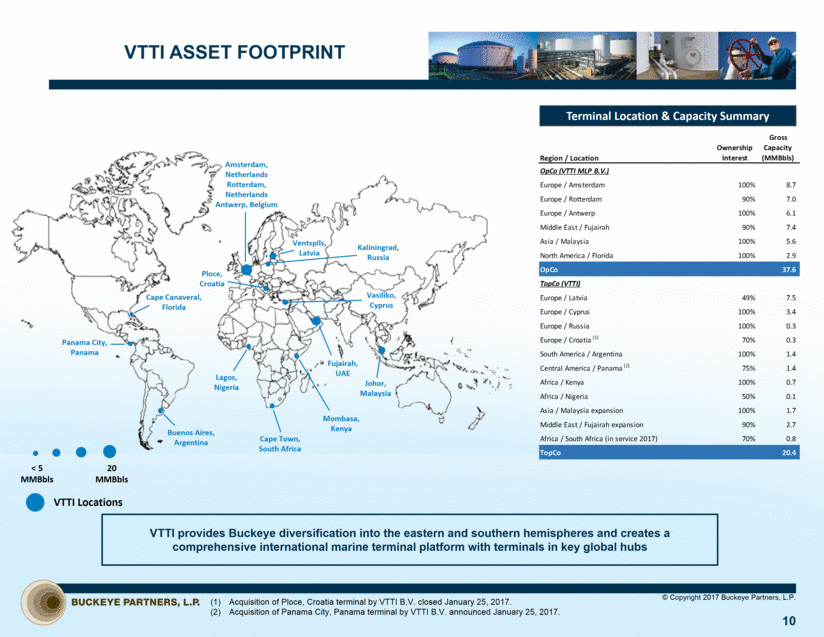
© Copyright 2017 Buckeye Partners, L.P. 10 20 MMBbls < 5 MMBbls VTTI ASSET FOOTPRINT VTTI Locations Amsterdam, Netherlands Rotterdam, Netherlands Antwerp, Belgium Fujairah, UAE Johor, Malaysia Buenos Aires, Argentina Cape Canaveral, Florida Ventspils, Latvia Kaliningrad, Russia Lagos, Nigeria Cape Town, South Africa Vasiliko, Cyprus VTTI provides Buckeye diversification into the eastern and southern hemispheres and creates a comprehensive international marine terminal platform with terminals in key global hubs Terminal Location & Capacity Summary Mombasa, Kenya Ploce, Croatia (1) Acquisition of Ploce, Croatia terminal by VTTI B.V. closed January 25, 2017. Acquisition of Panama City, Panama terminal by VTTI B.V. announced January 25, 2017. Panama City, Panama (2) Region / Location Ownership Interest Gross Capacity (MMBbls) OpCo (VTTI MLP B.V.) Europe / Amsterdam 100% 8.7 Europe / Rotterdam 90% 7.0 Europe / Antwerp 100% 6.1 Middle East / Fujairah 90% 7.4 Asia / Malaysia 100% 5.6 North America / Florida 100% 2.9 OpCo 37.6 TopCo (VTTI) Europe / Latvia 49% 7.5 Europe / Cyprus 100% 3.4 Europe / Russia 100% 0.3 Europe / Croatia 70% 0.3 South America / Argentina 100% 1.4 Central America / Panama 75% 1.4 Africa / Kenya 100% 0.7 Africa / Nigeria 50% 0.1 Asia / Malaysia expansion 100% 1.7 Middle East / Fujairah expansion 90% 2.7 Africa / South Africa (in service 2017) 70% 0.8 TopCo 20.4
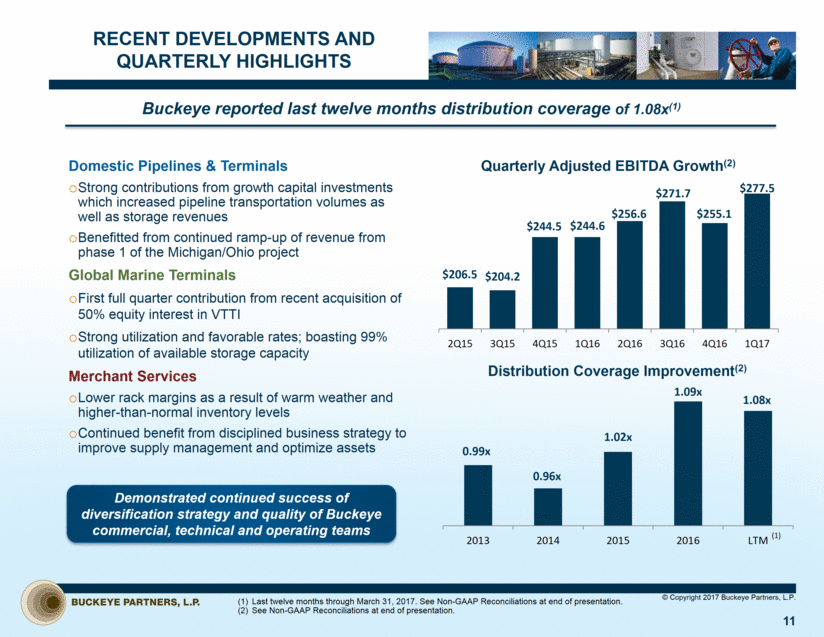
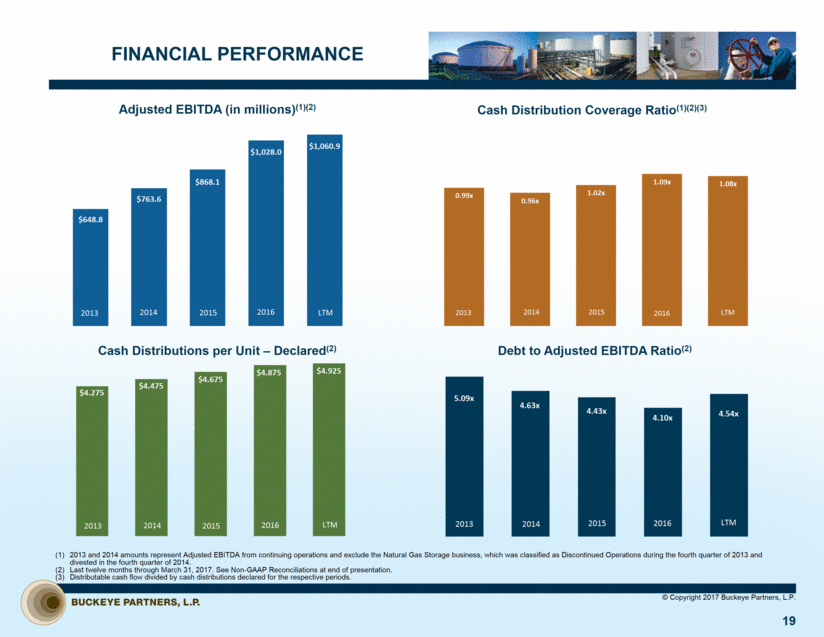
RECENT DEVELOPMENTS AND QUARTERLY HIGHLIGHTS 11 Domestic Pipelines & Terminals Strong contributions from growth capital investments which increased pipeline transportation volumes as well as storage revenues Benefitted from continued ramp-up of revenue from phase 1 of the Michigan/Ohio project Global Marine Terminals First full quarter contribution from recent acquisition of 50% equity interest in VTTI Strong utilization and favorable rates; boasting 99% utilization of available storage capacity Merchant Services Lower rack margins as a result of warm weather and higher-than-normal inventory levels Continued benefit from disciplined business strategy to improve supply management and optimize assets Demonstrated continued success of diversification strategy and quality of Buckeye commercial, technical and operating teams Buckeye reported last twelve months distribution coverage of 1.08x(1) Quarterly Adjusted EBITDA Growth(2) Last twelve months through March 31, 2017. See Non-GAAP Reconciliations at end of presentation. See Non-GAAP Reconciliations at end of presentation. Distribution Coverage Improvement(2) © Copyright 2017 Buckeye Partners, L.P. (1) 0.99x 0.96x 1.02x 1.09x 1.08x 2013 2014 2015 2016 LTM $206.5 $204.2 $244.5 $244.6 $256.6 $271.7 $255.1 $277.5 2Q15 3Q15 4Q15 1Q16 2Q16 3Q16 4Q16 1Q17
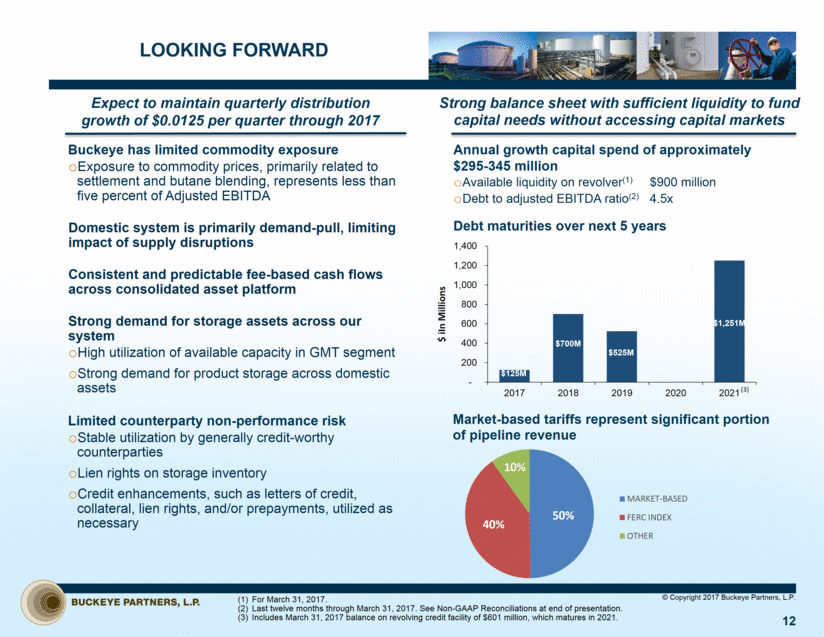
Annual growth capital spend of approximately $295-345 million Available liquidity on revolver(1) $900 million Debt to adjusted EBITDA ratio(2) 4.5x Debt maturities over next 5 years LOOKING FORWARD 12 Strong balance sheet with sufficient liquidity to fund capital needs without accessing capital markets Buckeye has limited commodity exposure Exposure to commodity prices, primarily related to settlement and butane blending, represents less than five percent of Adjusted EBITDA Domestic system is primarily demand-pull, limiting impact of supply disruptions Consistent and predictable fee-based cash flows across consolidated asset platform Strong demand for storage assets across our system High utilization of available capacity in GMT segment Strong demand for product storage across domestic assets Limited counterparty non-performance risk Stable utilization by generally credit-worthy counterparties Lien rights on storage inventory Credit enhancements, such as letters of credit, collateral, lien rights, and/or prepayments, utilized as necessary For March 31, 2017. Last twelve months through March 31, 2017. See Non-GAAP Reconciliations at end of presentation. Includes March 31, 2017 balance on revolving credit facility of $601 million, which matures in 2021. Expect to maintain quarterly distribution growth of $0.0125 per quarter through 2017 Market-based tariffs represent significant portion of pipeline revenue © Copyright 2017 Buckeye Partners, L.P. (3) 50% 40% 10% MARKET-BASED FERC INDEX OTHER $125M $700M $525M $1,251M - 200 400 600 800 1,000 1,200 1,400 2017 2018 2019 2020 2021 $ iIn Millions
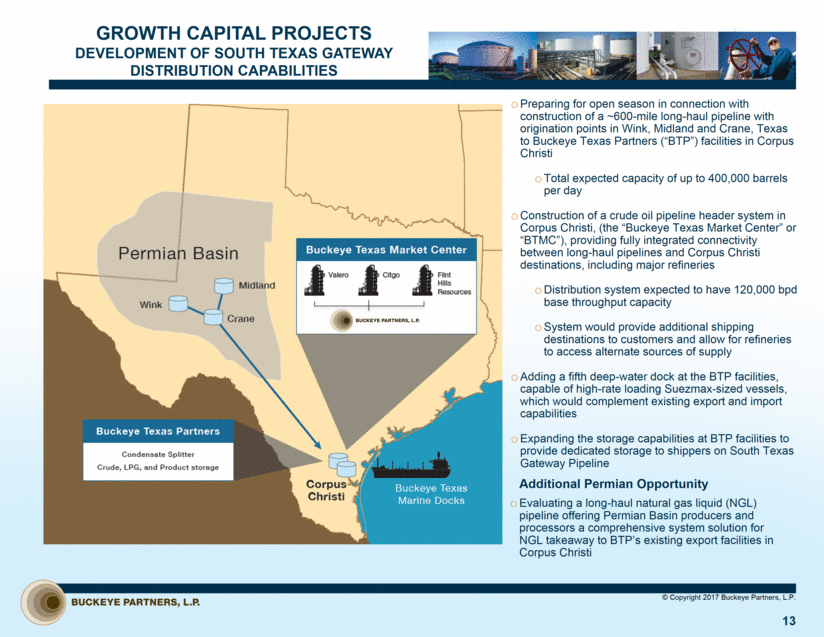
13 © Copyright 2017 Buckeye Partners, L.P. Preparing for open season in connection with construction of a ~600-mile long-haul pipeline with origination points in Wink, Midland and Crane, Texas to Buckeye Texas Partners (“BTP”) facilities in Corpus Christi Total expected capacity of up to 400,000 barrels per day Construction of a crude oil pipeline header system in Corpus Christi, (the “Buckeye Texas Market Center” or “BTMC”), providing fully integrated connectivity between long-haul pipelines and Corpus Christi destinations, including major refineries Distribution system expected to have 120,000 bpd base throughput capacity System would provide additional shipping destinations to customers and allow for refineries to access alternate sources of supply Adding a fifth deep-water dock at the BTP facilities, capable of high-rate loading Suezmax-sized vessels, which would complement existing export and import capabilities Expanding the storage capabilities at BTP facilities to provide dedicated storage to shippers on South Texas Gateway Pipeline GROWTH CAPITAL PROJECTS DEVELOPMENT OF SOUTH TEXAS GATEWAY DISTRIBUTION CAPABILITIES Additional Permian Opportunity Evaluating a long-haul natural gas liquid (NGL) pipeline offering Permian Basin producers and processors a comprehensive system solution for NGL takeaway to BTP’s existing export facilities in Corpus Christi
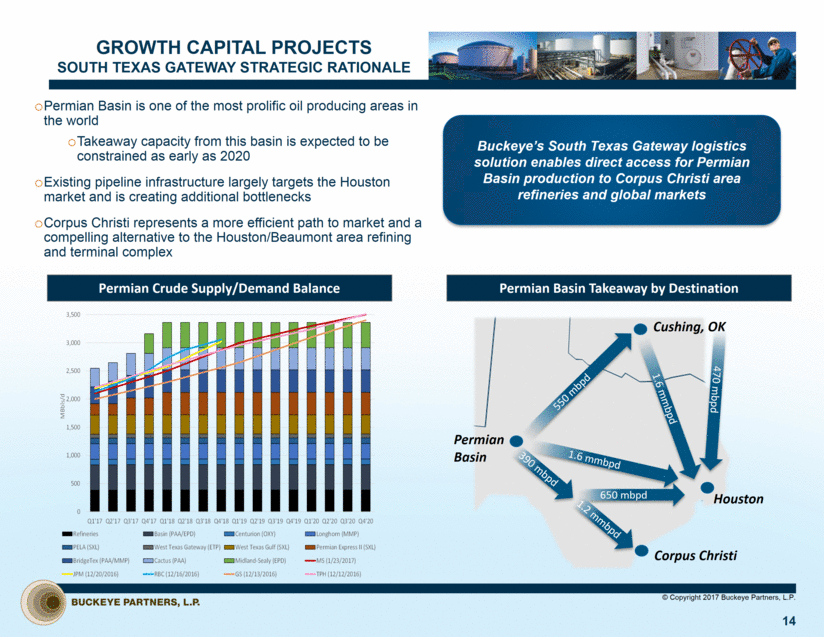
14 © Copyright 2017 Buckeye Partners, L.P. Permian Basin is one of the most prolific oil producing areas in the world Takeaway capacity from this basin is expected to be constrained as early as 2020 Existing pipeline infrastructure largely targets the Houston market and is creating additional bottlenecks Corpus Christi represents a more efficient path to market and a compelling alternative to the Houston/Beaumont area refining and terminal complex Permian Crude Supply/Demand Balance Permian Basin Takeaway by Destination Cushing, OK Houston Corpus Christi 1.6 mmbpd 550 mbpd 1.6 mmbpd 470 mbpd 390 mbpd 650 mbpd 1.2 mmbpd GROWTH CAPITAL PROJECTS SOUTH TEXAS GATEWAY STRATEGIC RATIONALE Buckeye’s South Texas Gateway logistics solution enables direct access for Permian Basin production to Corpus Christi area refineries and global markets Permian Basin 0 500 1,000 1,500 2,000 2,500 3,000 3,500 Q1'17 Q2'17 Q3'17 Q4'17 Q1'18 Q2'18 Q3'18 Q4'18 Q1'19 Q2'19 Q3'19 Q4'19 Q1'20 Q2'20 Q3'20 Q4'20 MBbls/d Refineries Basin (PAA/EPD) Centurion (OXY) Longhorn (MMP) PELA (SXL) West Texas Gateway (ETP) West Texas Gulf (SXL) Permian Express II (SXL) BridgeTex (PAA/MMP) Cactus (PAA) Midland-Sealy (EPD) MS (1/23/2017) JPM (12/20/2016) RBC (12/16/2016) GS (12/13/2016) TPH (12/12/2016)
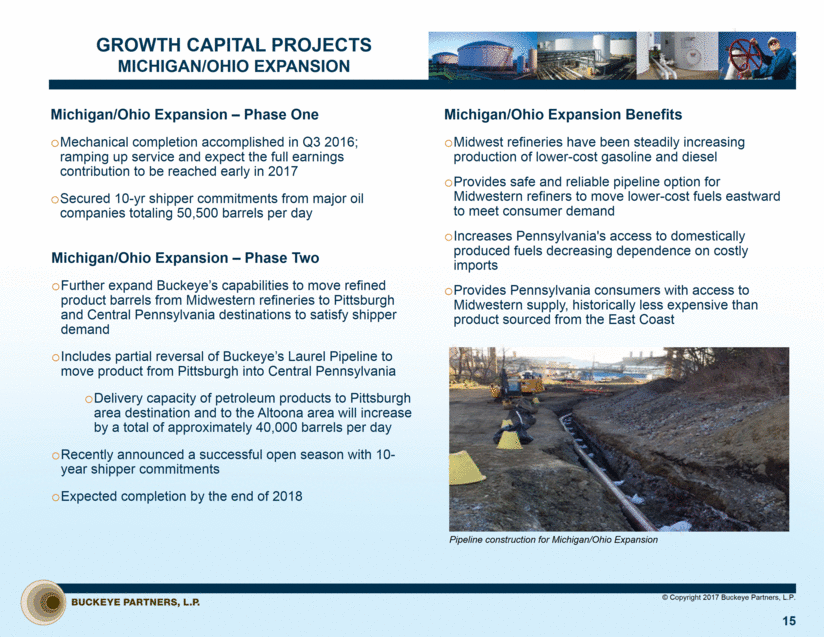
GROWTH CAPITAL PROJECTS MICHIGAN/OHIO EXPANSION 15 Michigan/Ohio Expansion Benefits Midwest refineries have been steadily increasing production of lower-cost gasoline and diesel Provides safe and reliable pipeline option for Midwestern refiners to move lower-cost fuels eastward to meet consumer demand Increases Pennsylvania's access to domestically produced fuels decreasing dependence on costly imports Provides Pennsylvania consumers with access to Midwestern supply, historically less expensive than product sourced from the East Coast © Copyright 2017 Buckeye Partners, L.P. Michigan/Ohio Expansion – Phase One Mechanical completion accomplished in Q3 2016; ramping up service and expect the full earnings contribution to be reached early in 2017 Secured 10-yr shipper commitments from major oil companies totaling 50,500 barrels per day Michigan/Ohio Expansion – Phase Two Further expand Buckeye’s capabilities to move refined product barrels from Midwestern refineries to Pittsburgh and Central Pennsylvania destinations to satisfy shipper demand Includes partial reversal of Buckeye’s Laurel Pipeline to move product from Pittsburgh into Central Pennsylvania Delivery capacity of petroleum products to Pittsburgh area destination and to the Altoona area will increase by a total of approximately 40,000 barrels per day Recently announced a successful open season with 10-year shipper commitments Expected completion by the end of 2018 Pipeline construction for Michigan/Ohio Expansion
GROWTH CAPITAL PROJECTS 16 © Copyright 2017 Buckeye Partners, L.P. GLOBAL MARINE TERMINALS New York Harbor Further enhance competitive position by improving the facilities’ interconnectivity, marine handling, blending and pipeline takeaway capabilities along with incremental storage capacity Multiple storage, distribution, processing and export projects under evaluation to support long-term growth Caribbean Butane blending services and onshore storage at Buckeye Bahamas Hub Projects to further capability to handle specialty crude products VTTI VTTI is progressing with assessments of various acquisition and expansion options in the Americas, Europe, and Asia Corpus Christi Projects under assessment to optimize splitter performance DOMESTIC PIPELINES & TERMINALS Expansion of Jacksonville, FL terminal to increase throughput capacity and provide ethanol by rail capabilities Further expand storage, throughput capacity and service capabilities in the Chicago Complex to support growing needs of major Midwestern refinery customers Increasing ethanol and butane blending capabilities at the Southeast terminals Expanding and creating an integrated Pittsburgh Complex between our Pittsburgh, Coraopolis and recently acquired Indianola terminal Reconfiguring the Albany, NY terminal to support a refined products rail and truck rack business Expanding Cincinnati terminal to facilitate access to pipeline-sourced products Assessing opportunities for LPG storage across Buckeye’s footprint Over $2 billion pipeline of potential future projects under assessment, including growth capital and acquisitions Anticipated to generate long-term value for our unitholders
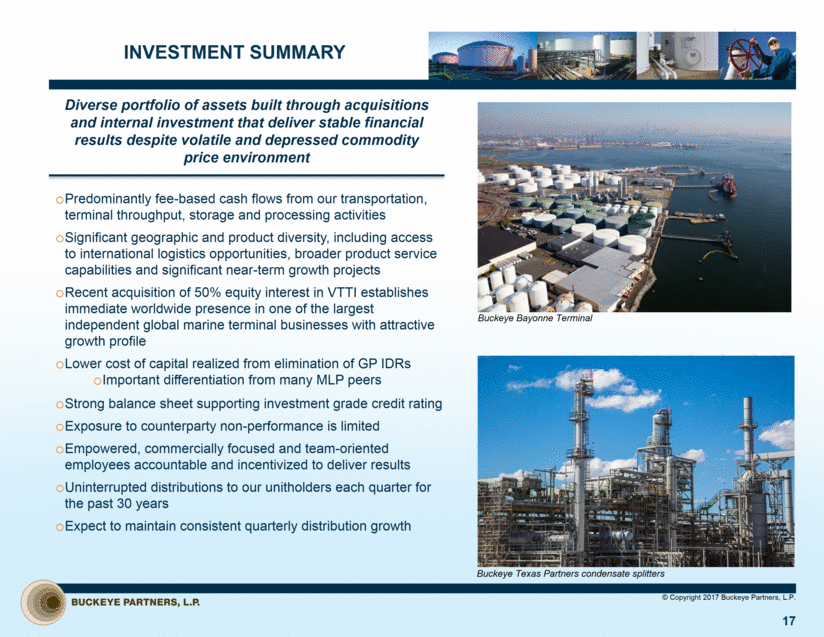
INVESTMENT SUMMARY 17 Buckeye Texas Partners condensate splitters Buckeye Bayonne Terminal Diverse portfolio of assets built through acquisitions and internal investment that deliver stable financial results despite volatile and depressed commodity price environment Predominantly fee-based cash flows from our transportation, terminal throughput, storage and processing activities Significant geographic and product diversity, including access to international logistics opportunities, broader product service capabilities and significant near-term growth projects Recent acquisition of 50% equity interest in VTTI establishes immediate worldwide presence in one of the largest independent global marine terminal businesses with attractive growth profile Lower cost of capital realized from elimination of GP IDRs Important differentiation from many MLP peers Strong balance sheet supporting investment grade credit rating Exposure to counterparty non-performance is limited Empowered, commercially focused and team-oriented employees accountable and incentivized to deliver results Uninterrupted distributions to our unitholders each quarter for the past 30 years Expect to maintain consistent quarterly distribution growth © Copyright 2017 Buckeye Partners, L.P.
FINANCIAL OVERVIEW

Cash Distributions per Unit – Declared(2) FINANCIAL PERFORMANCE 19 Adjusted EBITDA (in millions)(1)(2) Cash Distribution Coverage Ratio(1)(2)(3) 2013 and 2014 amounts represent Adjusted EBITDA from continuing operations and exclude the Natural Gas Storage business, which was classified as Discontinued Operations during the fourth quarter of 2013 and divested in the fourth quarter of 2014. Last twelve months through March 31, 2017. See Non-GAAP Reconciliations at end of presentation. Distributable cash flow divided by cash distributions declared for the respective periods. Debt to Adjusted EBITDA Ratio(2) © Copyright 2017 Buckeye Partners, L.P.
NON-GAAP RECONCILIATIONS
Adjusted EBITDA and distributable cash flow are measures not defined by accounting principles generally accepted in the United States of America (“GAAP”). We define Adjusted EBITDA as earnings before interest expense, income taxes, depreciation and amortization, further adjusted to exclude certain non-cash items, such as non-cash compensation expense; transaction, transition, and integration costs associated with acquisitions; gains and losses on foreign currency transactions and foreign currency derivative financial instruments; and certain other operating expense or income items, reflected in net income, that we do not believe are indicative of our core operating performance results and business outlook, such as hurricane-related costs, gains and losses on property damage recoveries, and gains and losses on asset sales. We define distributable cash flow as Adjusted EBITDA less cash interest expense, cash income tax expense, and maintenance capital expenditures, that are incurred to maintain the operating, safety, and/or earnings capacity of our existing assets. These definitions of Adjusted EBITDA and distributable cash flow are also applied to our proportionate share in the Adjusted EBITDA and distributable cash flow of significant equity method investments, such as that in VTTI, B.V. (“VTTI”), and are not applied to our less significant equity method investments. The calculation of our proportionate share of the reconciling items used to derive these VTTI performance metrics is based upon our 50% equity interest in VTTI, prior to adjustments related to noncontrolling interests in several of its subsidiaries and partnerships, which are immaterial. Adjusted EBITDA and distributable cash flow are non-GAAP financial measures that are used by our senior management, including our Chief Executive Officer, to assess the operating performance of our business and optimize resource allocation. We use Adjusted EBITDA as a primary measure to: (i) evaluate our consolidated operating performance and the operating performance of our business segments; (ii) allocate resources and capital to business segments; (iii) evaluate the viability of proposed projects; and (iv) determine overall rates of return on alternative investment opportunities. We use distributable cash flow as a performance metric to compare cash-generating performance of Buckeye from period to period and to compare the cash-generating performance for specific periods to the cash distributions (if any) that are expected to be paid to our unitholders. Distributable cash flow is not intended to be a liquidity measure. Buckeye believes that investors benefit from having access to the same financial measures used by senior management and that these measures are useful to investors because they aid in comparing Buckeye’s operating performance with that of other companies with similar operations. The Adjusted EBITDA and distributable cash flow data presented by Buckeye may not be comparable to similarly titled measures at other companies because these items may be defined differently by other companies. This presentation references forward-looking estimates of Adjusted EBITDA investment multiples projected, to be generated by the investment in VTTI. A reconciliation of estimated Adjusted EBITDA to GAAP net income is not provided because GAAP net income generated by the investment for the applicable periods is not accessible. In addition, interest and debt expense is a corporate-level expense that is not allocated among Buckeye’s segments and could not be allocated to the operations of the partnership with VTTI without unreasonable effort. Accordingly, the amount of depreciation and amortization and interest and debt expense that will be included in the additional net income generated as a result of the acquisition of the 50 percent interest in the partnership with Vitol is not accessible or estimable at this time. The amount of such additional resulting depreciation and amortization and applicable interest and debt expense could be significant, such that the amount of additional net income would vary substantially from the amount of projected Adjusted EBITDA. © Copyright 2017 Buckeye Partners, L.P. 21 NON-GAAP FINANCIAL MEASURES
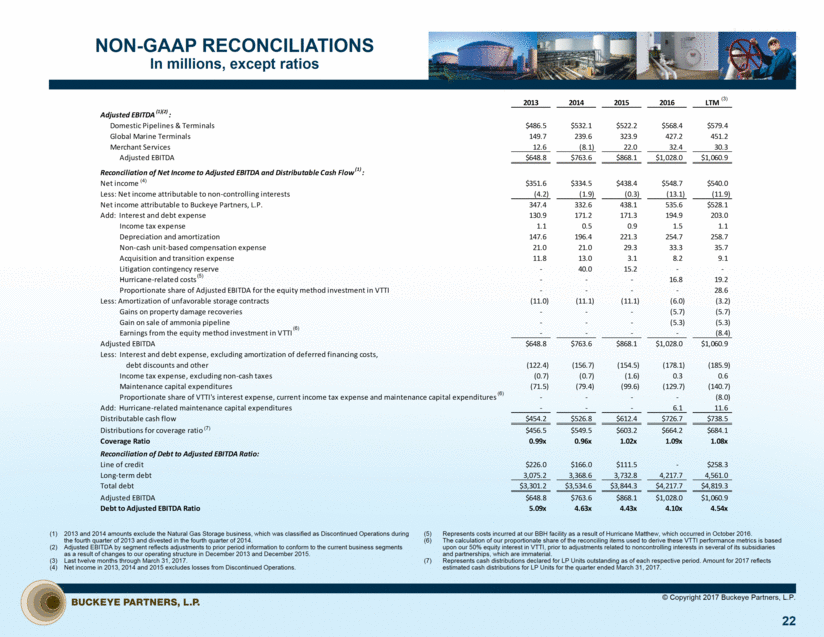
NON-GAAP RECONCILIATIONS In millions, except ratios 22 2013 and 2014 amounts exclude the Natural Gas Storage business, which was classified as Discontinued Operations during the fourth quarter of 2013 and divested in the fourth quarter of 2014. Adjusted EBITDA by segment reflects adjustments to prior period information to conform to the current business segments as a result of changes to our operating structure in December 2013 and December 2015. Last twelve months through March 31, 2017. Net income in 2013, 2014 and 2015 excludes losses from Discontinued Operations. Represents costs incurred at our BBH facility as a result of Hurricane Matthew, which occurred in October 2016. The calculation of our proportionate share of the reconciling items used to derive these VTTI performance metrics is based upon our 50% equity interest in VTTI, prior to adjustments related to noncontrolling interests in several of its subsidiaries and partnerships, which are immaterial. Represents cash distributions declared for LP Units outstanding as of each respective period. Amount for 2017 reflects estimated cash distributions for LP Units for the quarter ended March 31, 2017. © Copyright 2017 Buckeye Partners, L.P. (3) (4) (5) (6) (7) (6) 2013 2014 2015 2016 LTM Adjusted EBITDA (1)(2) : Domestic Pipelines & Terminals $486.5 $532.1 $522.2 $568.4 $579.4 Global Marine Terminals 149.7 239.6 323.9 427.2 451.2 Merchant Services 12.6 (8.1) 22.0 32.4 30.3 Adjusted EBITDA $648.8 $763.6 $868.1 $1,028.0 $1,060.9 Reconciliation of Net Income to Adjusted EBITDA and Distributable Cash Flow (1) : Net income $351.6 $334.5 $438.4 $548.7 $540.0 Less: Net income attributable to non-controlling interests (4.2) (1.9) (0.3) (13.1) (11.9) Net income attributable to Buckeye Partners, L.P. 347.4 332.6 438.1 535.6 $528.1 Add: Interest and debt expense 130.9 171.2 171.3 194.9 203.0 Income tax expense 1.1 0.5 0.9 1.5 1.1 Depreciation and amortization 147.6 196.4 221.3 254.7 258.7 Non-cash unit-based compensation expense 21.0 21.0 29.3 33.3 35.7 Acquisition and transition expense 11.8 13.0 3.1 8.2 9.1 Litigation contingency reserve - 40.0 15.2 - - Hurricane-related costs - - - 16.8 19.2 Proportionate share of Adjusted EBITDA for the equity method investment in VTTI - - - - 28.6 Less: Amortization of unfavorable storage contracts (11.0) (11.1) (11.1) (6.0) (3.2) Gains on property damage recoveries - - - (5.7) (5.7) Gain on sale of ammonia pipeline - - - (5.3) (5.3) Earnings from the equity method investment in VTTI - - - - (8.4) Adjusted EBITDA $648.8 $763.6 $868.1 $1,028.0 $1,060.9 Less: Interest and debt expense, excluding amortization of deferred financing costs, debt discounts and other (122.4) (156.7) (154.5) (178.1) (185.9) Income tax expense, excluding non-cash taxes (0.7) (0.7) (1.6) 0.3 0.6 Maintenance capital expenditures (71.5) (79.4) (99.6) (129.7) (140.7) Proportionate share of VTTI's interest expense, current income tax expense and maintenance capital expenditures - - - - (8.0) Add: Hurricane-related maintenance capital expenditures - - - 6.1 11.6 Distributable cash flow $454.2 $526.8 $612.4 $726.7 $738.5 Distributions for coverage ratio $456.5 $549.5 $603.2 $664.2 $684.1 Coverage Ratio 0.99x 0.96x 1.02x 1.09x 1.08x Reconciliation of Debt to Adjusted EBITDA Ratio: Line of credit $226.0 $166.0 $111.5 - $258.3 Long-term debt 3,075.2 3,368.6 3,732.8 4,217.7 4,561.0 Total debt $3,301.2 $3,534.6 $3,844.3 $4,217.7 $4,819.3 Adjusted EBITDA $648.8 $763.6 $868.1 $1,028.0 $1,060.9 Debt to Adjusted EBITDA Ratio 5.09x 4.63x 4.43x 4.10x 4.54x