Attached files
| file | filename |
|---|---|
| 8-K - 8-K - MVC CAPITAL, INC. | form8k.htm |
Exhibit 99.1

May 2017 MERGER TRANSACTION OVERVIEW

This presentation is for informational purposes only. It does not constitute an offer to sell, or a solicitation of an offer to purchase, securities of MVC Capital, Inc. (MVC), Equus Total Return, Inc. (Equus), or U.S. Gas & Electric, Inc. (USG&E), or the solicitation of a proxy with respect to, or a recommendation to vote, the shares of MVC, Equus or USG&E on any matter. This presentation contains certain factual information provided by the management of Equus and USG&E and by others. While MVC has no reason to believe that this information is not accurate, MVC does not make any representations with respect to this information. The presentation also contains certain projections and forecasts, which are inherently subject to risks and uncertainties, and which are based on various assumptions that are not necessarily set forth in the presentation. Statements with respect to valuation are for illustrative purposes only, and are not intended as a prediction of actual future values.Certain statements made herein including, but not limited to, projections of future trends, results and performance of any of MVC, Equus, or USG&E, or the markets in which they operate, constitute “forward-looking statements” within the meaning of applicable U.S. federal securities laws. The forward-looking statements contained in this presentation include statements about: the anticipated timing and benefits of the USG&E/Equus transaction; the ability to close and consummate the transaction, including the ability to obtain regulatory, stock exchange or other approvals and the anticipated tax treatment of the transaction; the expected effects on MVC, Equus and USG&E of the transaction, including the future performance of the combined company and its impact on MVC; the price or trading volume of Equus’s common stock, which can fluctuate and is subject to volatility risk; MVC’s, Equus’s and USG&E’s anticipated financial results; the ability of Equus, USG&E and the combined company to pay any dividends in the future to stockholders, which is uncertain; Equus's ability to successfully monetize its existing portfolio investments; and also include all other statements in this communication that are not historical facts. Readers should not place undue reliance on these forward looking statements.This presentation speaks only as of its date, and MVC assumes no obligation to update the presentation to reflect changes in circumstances, the terms of the transaction or otherwise. The information contained in this presentation is not complete. Readers should consider the information contained in this presentation in conjunction with the information contained in the Preliminary Information Statement on Schedule 14C filed publicly by Equus with the Securities and Exchange Commission on May 4, 2017, including, in particular, under the heading “Risk Factors”. The Preliminary Information Statement is subject to change, and readers should review the final Information Statement when it becomes available. Readers should also consider relevant information contained in other publicly available filings made by MVC and Equus with the SEC. Safe Harbor Statement

Summary of Stock Purchase and Merger Transaction On April 24, 2017, Equus Total Return, Inc. (“Equus”) signed a definitive agreement to acquire U.S. Gas & Electric, Inc. (“USG&E”) in exchange for Equus common shares and convertible preferred sharesCompletion of transaction cements transformation of Equus into an operating company, instead of a closed-end fundAcquisition of 90.3% of outstanding USG&E stock followed by a short-form merger to acquire remaining USG&E share interests intended to qualify as a tax-free reorganizationTransaction represents the final step in Equus’ stated goal to pursue a merger or consolidation with MVC Capital, Inc. (“MVC”) or one of MVC’s portfolio companiesFollowing the closing of the first stage of the acquisition (the “Initial Closing”), Equus will pursue selling its existing portfolio investments to focus solely on USG&E’s commercial and residential energy marketing business, changing its name to USG&E, Inc.Initial Closing is expected to be completed between Q2 2017 and Q3 2017Final merger closing is subject to effectiveness of a registration statement

Merger Transaction Structure Acquisition of 90.3% of outstanding USG&E stockShort-form merger to acquire remaining 9.7% Intended to be tax-free to USG&E shareholders Merger Consideration to USG&E Shareholders 32.6 million shares of Equus common stock and $40 million of Equus mandatory convertible preferred stock Total Value of Merger Consideration Based on the deemed transaction stock price of $3.28 per share of Equus common stock, the transaction has an implied:USG&E Enterprise value of $167.5 million, including debt and excluding estimated cash at closingEquity value of $150.5 million, including the fair value of the mandatory convertible preferred stock at the deemed transaction stock price of $3.28 Total Value of Merger Consideration to MVC Based on the deemed transaction price of $3.28 per share of Equus common stock and MVC’s 76.4% ownership in USG&E, its share of the equity value is $115.1 million, compared to the estimated fair value for MVC’s equity investment in USG&E of $89.4 million, as of 1/31/17 Terms of Convertible Preferred Stock 5 year mandatory convertible preferred (December 2022)7.5% dividend per annum, payable quarterlyConvertible to common stock at any timeConversion prices ranging from $3.28 - $4.10 per share Reverse Stock Split Equus board and majority of stockholders have approved 1-for-3 reverse split of Equus common shares to satisfy NYSE minimum share trading price threshold, to occur following the Initial Closing Expected Timeline to Merger Transaction Closing Initial Closing is expected to be completed between Q2 2017 and Q3 2017Final merger closing is subject to effectiveness of a registration statement Key Terms of Stock Purchase and Merger Agreement

Overview of Equus Company Description Key Market & Financial Data (1) Cash and Investment Portfolio (2) Management Headquartered in Houston, Texas, and founded in 1991, Equus is currently an internally-managed BDC that has received authorization to cease operation as a BDC and be an operating company. Equus had provided long-term equity capital to fund growth, acquisitions and recapitalizations of small and middle-market companies. As of December 31, 2016, the reported fair value of Equus’s portfolio was approximately $30 million, excluding temporary cash investments, and total net assets were approximately $43 million, or $3.37 per share. Board of Directors ($ in millions, except per share amounts) As of December 31, 2016, except as otherwise noted.Excludes temporary cash investments.Sources: SEC filings, SNL Financial. Share Price (05/05/17): $2.78 Market Capitalization (05/05/17): $37.6 Dividend Yield: - % NAV per Share (As Reported): $3.37 Share Price/NAV (As Reported): 0.82x Total Cash (Excluding Temporary Cash Investments): $12.0 Total Investments in Portfolio Securities: $29.7 Total Assets: $73.1 Total Net Assets: $42.7 Name Title Age John A. Hardy Chief Executive Officer 65 L'Sheryl D. Hudson Chief Financial Officer 52 Kenneth I. Denos Secretary and Chief Compliance Officer 49 Name Title Age Robert L. Knauss Chairman 86 John A. Hardy Director 65 Fraser Atkinson Director 59 Richard F. Bergner Director 86 Kenneth I. Denos Director 49 Bertrand des Pallieres Director 50 Henry W. Hankinson Director 75
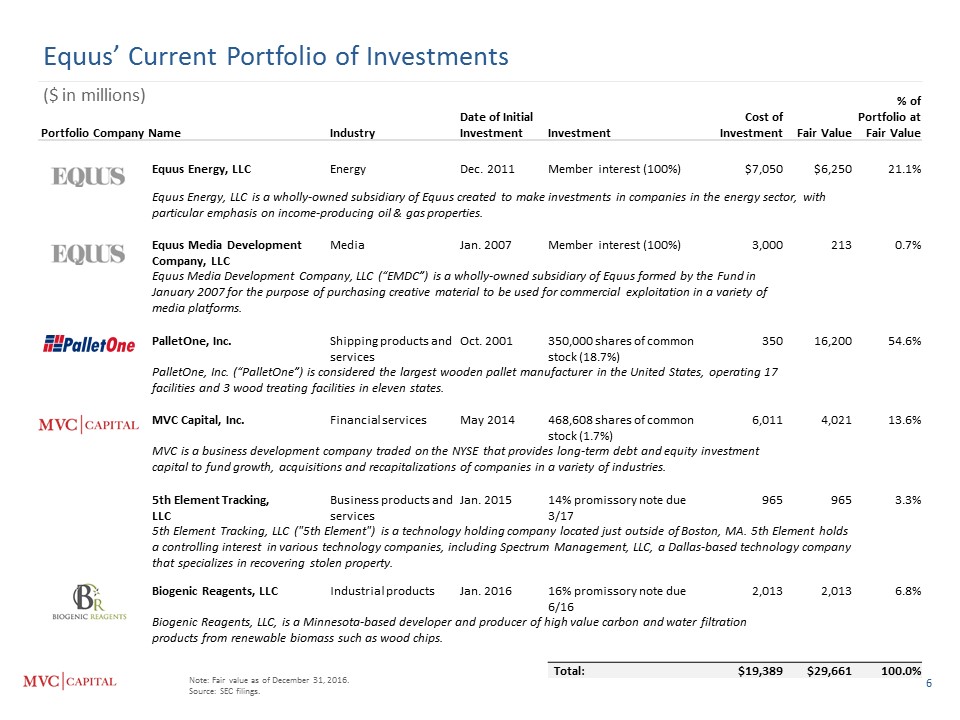
Equus’ Current Portfolio of Investments Note: Fair value as of December 31, 2016.Source: SEC filings. ($ in millions) Portfolio Company Name Industry Date of Initial Investment Investment Cost of Investment Fair Value % of Portfolio at Fair Value Equus Energy, LLC Energy Dec. 2011 Member interest (100%) $7,050 $6,250 21.1% Equus Energy, LLC is a wholly-owned subsidiary of Equus created to make investments in companies in the energy sector, with particular emphasis on income-producing oil & gas properties. Equus Media Development Company, LLC Media Jan. 2007 Member interest (100%) 3,000 213 0.7% Equus Media Development Company, LLC (“EMDC”) is a wholly-owned subsidiary of Equus formed by the Fund in January 2007 for the purpose of purchasing creative material to be used for commercial exploitation in a variety of media platforms. PalletOne, Inc. Shipping products and services Oct. 2001 350,000 shares of common stock (18.7%) 350 16,200 54.6% PalletOne, Inc. (“PalletOne”) is considered the largest wooden pallet manufacturer in the United States, operating 17 facilities and 3 wood treating facilities in eleven states. MVC Capital, Inc. Financial services May 2014 468,608 shares of common stock (1.7%) 6,011 4,021 13.6% MVC is a business development company traded on the NYSE that provides long-term debt and equity investment capital to fund growth, acquisitions and recapitalizations of companies in a variety of industries. 5th Element Tracking, LLC Business products and services Jan. 2015 14% promissory note due 3/17 965 965 3.3% 5th Element Tracking, LLC ("5th Element") is a technology holding company located just outside of Boston, MA. 5th Element holds a controlling interest in various technology companies, including Spectrum Management, LLC, a Dallas-based technology company that specializes in recovering stolen property. Biogenic Reagents, LLC Industrial products Jan. 2016 16% promissory note due 6/16 2,013 2,013 6.8% Biogenic Reagents, LLC, is a Minnesota-based developer and producer of high value carbon and water filtration products from renewable biomass such as wood chips. Total: $19,389 $29,661 100.0%
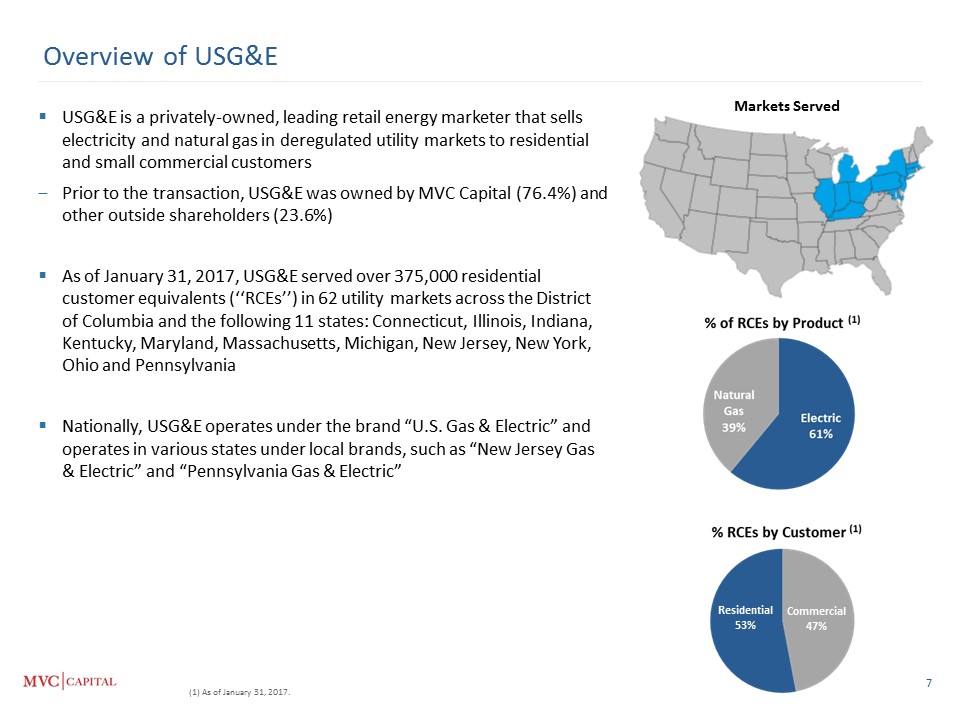
Residential 53% Commercial 47% Overview of USG&E USG&E is a privately-owned, leading retail energy marketer that sells electricity and natural gas in deregulated utility markets to residential and small commercial customersPrior to the transaction, USG&E was owned by MVC Capital (76.4%) and other outside shareholders (23.6%)As of January 31, 2017, USG&E served over 375,000 residential customer equivalents (‘‘RCEs’’) in 62 utility markets across the District of Columbia and the following 11 states: Connecticut, Illinois, Indiana, Kentucky, Maryland, Massachusetts, Michigan, New Jersey, New York, Ohio and PennsylvaniaNationally, USG&E operates under the brand “U.S. Gas & Electric” and operates in various states under local brands, such as “New Jersey Gas & Electric” and “Pennsylvania Gas & Electric” Markets Served (1) As of January 31, 2017.

Leader in Development of Deregulated Energy Markets USG&E is a leading retail energy company with one of the strongest national and local brands in the industry and has taken active leadership roles in the development of the deregulated retail energy markets since the commencement of its current operations in 2003 High Profitability USG&E has been consistently able to achieve high unit gross margins, low customer acquisition costs and low attrition, which collectively results in high profitability Attractive Geographic, Customer, Product, and Commodity Diversification USG&E operates in 62 natural gas and electric utility markets across 11 states and Washington DC, offering both fixed and variable-rate products, serving over 375,000 RCEs, as of January 31, 2017 Sales-Driven Culture USG&E has cultivated a sales-driven culture that incentivizes its internal and external sales force to maximize customer acquisitionsTeam of approximately 25 internal telemarketing sales representatives as well as third-party marketing vendors Proprietary Demand Forecasting System Leads to Purchasing Advantages Proprietary bottoms-up electricity forecasting model that utilizes historical consumption patterns to forecast future electricity demand at the customer level adjusted for season, location and weatherCurrently achieving an accuracy rate of approximately 95% High-Quality Customer Service USG&E provides exceptional customer service that it believes differentiates USG&E from local utilities and other competitorsJ.D. Power awarded highest rankings to two companies under the USG&E umbrella in its 2016 Retail Electric Provider Residential Customer Satisfaction Study. New Jersey Gas & Electric (“NJG&E”) and Maryland Gas & Electric (“MDG&E”) were both awarded. Experienced Management Team USG&E’s senior management team has significant industry and retail consumer business knowledge, with an average of over 24 years of relevant experience in retail energy sales, marketing, finance, operations, information technology and supplyUSG&E’s executive team has been together since 2008, has a proven track record in the industry and grew the company organically and through acquisitions through multiple economic cycles USG&E Business Strengths

Net Revenues Gross Profit / Margin Adjusted EBITDA Key USG&E Financial Metrics ($ in millions) Note:* Proforma for polar vortex adjustment.Source: Equus SEC Filings.

MVC Capital Better positions MVC stake for future monetization event Fulfills commitment to reorganize Equus Can benefit employees to be part of larger, potentially stronger, and more competitive company; access to broader range of career opportunities Increased visibility into USG&E’s performance for MVC shareholders Ownership of a leading retail energy company Flexibility to deliver greatest value to all individual shareholders Public market valuation of largest investment Provides Equus with opportunity to simplify business – single industry focus Opportunity to operate as a public company with full access to capital markets; opportunities for growth and acquisitions Accelerate evolution toward yielding strategy – receiving yielding assets as consideration Platform from which to achieve organic and inorganic growth Can benefit customers to be serviced by a larger company with potentially deeper financial strength Merits of Transaction for Individual Stakeholders
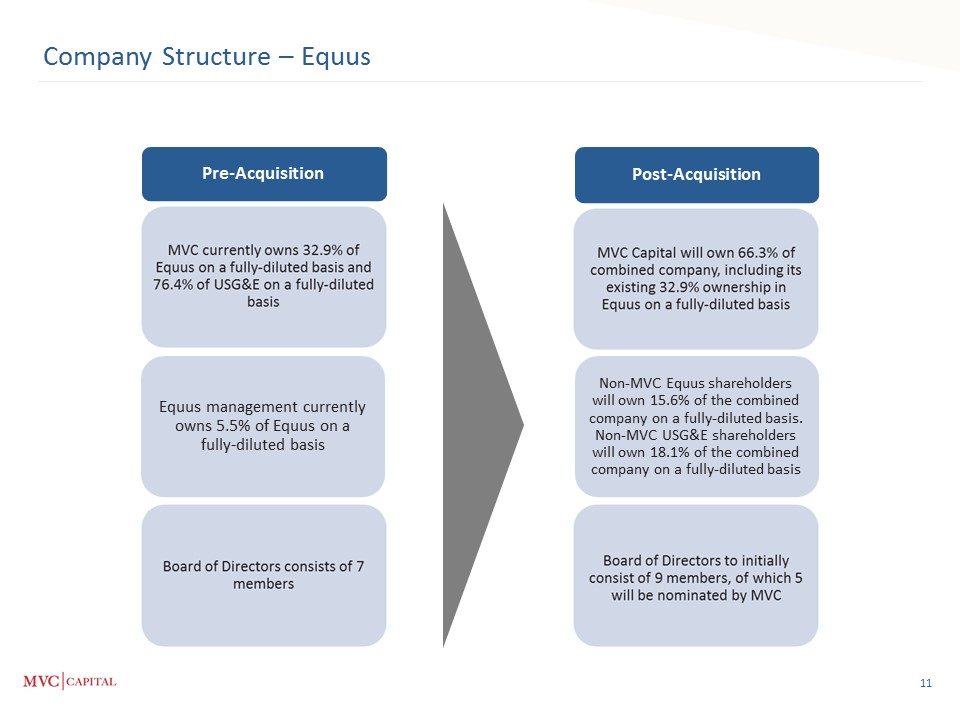
Pre-Acquisition Non-MVC Equus shareholders will own 15.6% of the combined company on a fully-diluted basis. Non-MVC USG&E shareholders will own 18.1% of the combined company on a fully-diluted basis Post-Acquisition Company Structure – Equus Equus management currently owns 5.5% of Equus on a fully-diluted basis
Addendum

Summary Financials – USG&E For and as of the Year Ended December 31, 2016 2015 2014 (in thousands, except percent data) Statement of Operations Data: Net sales: Electricity $ 190,624 $ 189,832 $ 242,303 Gas 64,759 66,643 105,551 Other 12 47 - Total net sales 255,395 256,522 347,854 Operating costs and expenses: Retail electricity 138,750 139,226 220,123 Retail gas 40,960 49,578 87,479 Other operating costs 76 12 35 Unrealized (gain) loss on derivatives (10,167) 508 11,645 Depreciation, amortization, and depletion 2,861 2,871 3,070 Selling, general and administrative 44,733 39,046 39,591 Total operating costs and expenses 217,213 231,241 361,943 Operating income (loss) 38,182 25,281 (14,089) Other expense: Settlement and other losses (7,730) (974) (4,872) Interest & financing expense, net of interest income (3,692) (3,620) (2,946) Transaction expenses (1,012) (55) (994) Total other expense (12,434) (4,649) (8,812) Income before taxes 25,748 20,632 (22,901) Income tax expense (benefit) 11,504 9,338 (8,478) Net income (loss) 14,244 11,294 (14,423) Loss attributable to noncontrolling interest 82 39 32 Net income (loss) attributable to USG&E $ 14,326 $ 11,333 $ (14,390) Balance Sheet Data: Cash and cash equivalents $ 5,602 $ 15,975 Working capital (deficit) $ 5,090 $ 374 Total assets $ 104,814 $ 107,967 Net derivative asset (liability) $ 300 $ (9,998) Subordinated debt, stockholder $ 10,832 $ 10,700 Total liabilities $ 76,889 $ 78,682 Total owner's equity $ 27,925 $ 29,285 Source: Equus SEC Filings.

Additional Financial Information – USG&E Year Ended December 31, 2016 2015 2014 (in thousands) Reconciliation of Net Income (Loss) to Adjusted EBITDA: Net income (loss) $ 14,244 $ 11,293 $ (14,423) Interest and financing expense, net of interest income 3,692 3,620 2,946 Income tax expense (benefit) 11,504 9,338 (8,478) Depreciation, amortization and depletion 2,861 2,871 3,070 EBITDA 32,301 27,122 (16,885) Other EBITDA adjustments: Unrealized (gain) loss on derivatives (10,167) 508 11,645 Settlement and other losses 7,798 974 3,380 Information systems implementation expenses 1,390 42 33 Transaction expenses 1,012 55 994 MVC management and debt service fees 958 700 700 Polar vortex related expenses 816 1,136 2,372 Impact of polar vortex (1) - - 24,152 Consolidation of position compensation and legal expenses 722 1,189 2,533 Share based and deferred compensation 637 616 (109) Loss from shutdown of subsidiary - - 1,492 Adjusted EBITDA $ 35,467 $ 32,342 $ 30,307 Management used historical costs, refunds, increased commodity prices and volumes to estimate the proforma impact of the polar vortex on its operations.Source: Equus SEC Filings.

Additional Financial Information – Pro Forma Combined Year Ended December 31, 2016 (in thousands) Unaudited Pro Forma Condensed Combined Statement of Operations Data: Net sales $ 256,078 Operating costs and expenses 220,954 Operating income 35,124 Other expense 3,603 Income before taxes 31,521 Income tax expense (benefit) 11,526 Net income (loss) 19,995 Income attributable to noncontrolling interests, net (1,300) Net income attributable to controlling interest $ 18,695 As of December 31, 2016 (in thousands) Unaudited Pro Forma Combined Balance Sheet Data: Cash and cash equivalents $ 18,366 Working capital (deficit) $ (671) Total assets $ 148,224 Net derivative asset (liability) $ 300 Subordinated debt, stockholder $ 10,832 Total liabilities $ 95,182 Total owner's equity $ 53,042 Source: Equus SEC Filings.

Crius Energy (TSE:KWH.UN) Spark Energy (NASDAQ:SPKE) Just Energy (TSX:JE) Comparable Peer Analysis for Energy Marketers Market data as of 5/5/2017.Source: Capital IQ.

Risks Past performance of MVC, USG&E and Equus is not indicative of any future results or performance.MVC is subject to certain significant risks relating to its shares, business and investment objectives, including, for example, the volatility of its common stock price, the illiquidity of its investments in portfolio companies, and its shares currently trading at a discount to their net asset value. There can be no assurance that MVC, USG&E and Equus or any other MVC portfolio company will achieve its investment objective or favorable financial results/performance. For a detailed description of the risk factors impacting MVC, please read the Risk Factors section of our recent SEC filings. Please see the Schedule 14C filed by Equus on May 4, 2017 for detailed risks associated with the transaction and USG&E.

For additional information, please contact: Jackie Rothchild Jeffrey Goldberger / Allison SossMVC Capital KCSA Strategic Communications914.510.9400 212.896.1249 / 212.896.1267jackie@ttga.com jgoldberger@kcsa.com / asoss@kcsa.com