Attached files
| file | filename |
|---|---|
| 8-K - 8-K - CITIZENS FIRST CORP | f8-k.htm |
Exhibit 99.1
|
|
Citizens First Corporate Overview May 17, 2017 |
|
|
|

|
|
We may from time to time make written or oral statements, including statements contained in this presentation, which may constitute forward-looking statements within the meaning of Section 27A of the Securities Act of 1933 and Section 21E of the Securities Exchange Act of 1934. The words “may”, “expect”, “anticipate”, “intend”, “consider”, “plan”, “believe”, “seek”, “should”, “estimate”, and similar expressions are intended to identify such forward-looking statements, but other statements may constitute forward-looking statements. These statements should be considered subject to various risks and uncertainties. Such forward-looking statements are based on many assumptions and estimates and are not guarantees of future performance. Such statements are made pursuant to “safe harbor” provisions of the Private Securities Litigation Reform Act of 1995. You should consider the areas of risk described under the headings “Forward-Looking Statements” and “Risk Factors” in our periodic reports filed with the Securities and Exchange Commission under the Securities Exchange Act of 1934 in connection with any forward-looking statements that may be made by us and our business generally. Except to the extent required by applicable law or regulations, we undertake no obligation to release publicly any updates or revisions to any forward-looking statements, to report events or to report the occurrence of unanticipated events. Forward-Looking Statements 2 |
|
|
This presentation includes non-GAAP financial measures determined by methods other than in accordance with generally accepted accounting principles (“GAAP”). Such non-GAAP financial measures include the tangible book value per share. The most comparable GAAP measure to this is book value per share. We use non-GAAP financial measures because we believe they are useful for evaluating our financial condition, operations and performance over periods of time, as well as in managing and evaluating our business and in discussions about our operations and performance. We also believe these non-GAAP financial measures provide users of our financial information with a meaningful measure for assessing our financial condition and financial results, as well as comparison to financial results for prior periods. These disclosures should not be viewed as a substitute for results determined in accordance with GAAP, and are not necessarily comparable to non-GAAP performance measures that other companies may use. A reconciliation of these non-GAAP measures to the most directly comparable GAAP measure is included as an appendix to this presentation. Non-GAAP Financial Measures 3 |
|
|
Established February 1999 8 branches in four South Central KY counties and loan production office in Williamson Co TN Administrative headquarters in Bowling Green 94 full-time equivalent employees Located in one of the fastest growing areas in Kentucky and Tennessee 2016 third consecutive year of record earnings Company Overview 4 |
|
|
CZFC Geographic Footprint Deposit Market Share(1) Source: FDIC Deposit Summary as of June 30, 2016. (1) Includes the counties of: Barren, Hart, Simpson, and Warren. 5 Rank Institution Branches Deposits Mkt. Share 1 BB&T Corp. (NC) 10 516,490 14.7% 2 U.S. Bancorp (OH) 11 480,132 13.7% 3 South Central Bcshs of KY Inc. (KY) 12 400,638 11.4% 4 Citizens First Corp. (KY) 8 354,009 10.1% 5 Franklin Bancorp Inc. (KY) 5 346,796 9.9% 6 American Bank & Trust, Inc. (KY) 5 262,388 7.5% 7 Porter Bancorp Inc. (KY) 4 154,865 4.4% 8 Edmonton Bancshares Inc. (KY) 4 151,768 4.3% 9 Independence Bancshares Inc. (KY) 3 164,625 4.7% 10 PNC Financial Services Group (DE) 3 153,874 4.4% 11 First Security Inc. (KY) 4 142,274 4.1% 12 FNB Financial Corp. (KY) 4 78,488 2.2% 13 Monticello Bankshares Inc. (KY) 4 61,940 1.8% 14 Regions Bank (AL) 1 44,048 1.3% 15 Edmonson Bancshares Inc (KY) 2 42,763 1.2% 16 JPMorgan Chase & Co. (OH) 1 40,849 1.2% 17 Morgantown Deposit Bncp Inc (KY) 2 32,511 0.9% 18 Citizens Bank (KY) 1 21,931 0.6% 19 Hart County Bank and Trust Co. (KY) 1 21,892 0.6% 20 Hancock Bancorp Inc. (KY) 1 17,685 0.5% 21 First Southern Bancorp Inc. (KY) 1 9,333 0.3% 22 The Peoples Bank (KY) 1 2,632 0.1% 23 Woodforest Financial Grp Inc. (TX) 1 1,183 0.0% Total For Institutions In Market 89 3,503,114 |
|
|
Market Share Only community bank with headquarters in Warren Co., KY 22 bank competitors in core deposit market Banking Industry Reduction of 7,700 US bank branches since 2009 to approx. 90,500 Reduction in 1,900 US banks since 2009 to approx. 5,100 Local Economy Credit quality improved with little to no provision expense required Expansion of quality loan growth in core market Interest Rate Environment Pressures on net interest margin Pace of interest rate increases Regulatory/Legislative Issues Possible regulatory relief Possible reduction of corporate tax rate Competitive Landscape 6 |
|
|
Balance Sheet Overview 7 2013 2014 2015 2016 Mar-17 Capital $ 38,347 $ 38,448 $ 39,524 $ 42,364 $ 43,387 Loans 295,068 318,477 330,782 359,391 365,562 Deposits 342,951 341,784 370,388 370,439 373,396 Assets 410,175 412,814 432,181 455,422 464,454 $- $100,000 $200,000 $300,000 $400,000 $500,000 |
|
|
Deposit Portfolio Composition Source: Call Report data as of March 31, 2017. 8 Transaction Accounts $36,614 10% MMDA & Savings $187,405 50% <$250K Time $132,578 35% >$250K Time $17,494 5% |
|
|
Loan Portfolio Composition Source: Call Report data as of March 31, 2017. 9 Commercial & Industrial $50,066 14% Construction & Land Dev (except 1 - 4 family) $29,257 8% Commercial RE $136,244 37% 1 - 4 family RE $75,981 21% Multifamily $16,487 5% Consumer, HE & Other $23,557 6% Agriculture & Farmland $34,191 9% |
|
|
Non-Performing Loans/Loans Source: Uniform Bank Performance Reports 10 Dec. 2013 Dec. 2014 Dec. 2015 Dec. 2016 Mar-17 CFB 0.40% 0.37% 0.16% 0.01% 0.83% Peers 1.47% 1.06% 0.87% 0.80% 0.80% 0.00% 0.20% 0.40% 0.60% 0.80% 1.00% 1.20% 1.40% 1.60% |
|
|
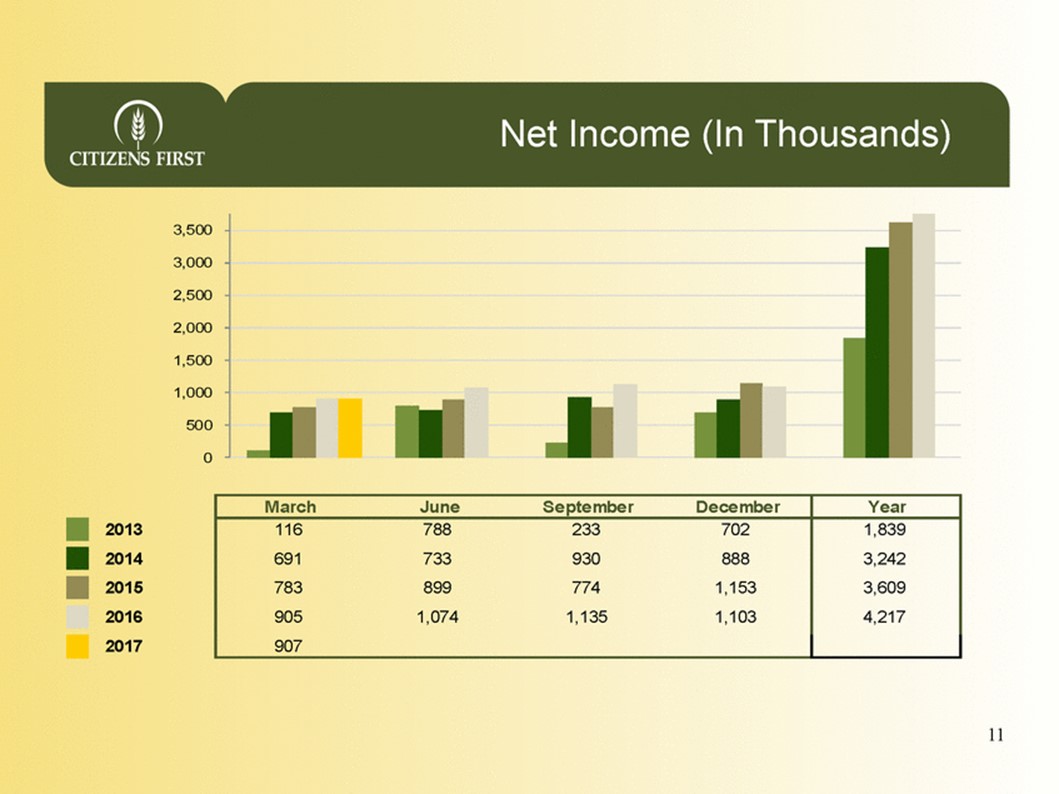
Net Income (In Thousands) 3,500 3,000 2,500 2,000 1,500 1,000 500 0 2013 2014 2015 2016 2017 11 March June September December Year 116 788 233 702 691 733 930 888 783 899 774 1,153 905 1,074 1,135 1,103 907 1,839 3,242 3,609 4,217 |
|
|
Diluted Earnings Per Share 12 March June September December Year 2013 $0.05 $0.30 $0.02 $0.25 $0.62 2014 0.27 0.29 0.38 0.35 $1.29 2015 0.29 0.35 0.31 0.45 $1.40 2016 0.36 0.42 0.45 0.43 $1.66 2017 0.36 $0.00 $0.20 $0.40 $0.60 $0.80 $1.00 $1.20 $1.40 $1.60 $1.80 |
|
|
Tangible Book Value/ Share Price CZFC + 45.7%* SNL US Bank < $500M + 31.6%* S&P 500 + 15.6%* Source SNL Financial. *Market statistics May, 2016 to May, 2017 13 Dec. 2012 Dec. 2013 Dec. 2014 Dec. 2015 Dec. 2016 Mar-17 TBV $ 11.32 $ 11.51 $ 13.39 $ 13.97 $ 15.40 $ 15.90 Share Price 8.73 9.80 11.90 13.74 18.00 18.05 Price % tanglible book 77% 85% 89% 98% 117% 114% $- $2.00 $4.00 $6.00 $8.00 $10.00 $12.00 $14.00 $16.00 $18.00 $20.00 |
|
|
Engaged nationally recognized investment banking firm Redemption of remaining 229 shares of cumulative preferred stock approved by Board of Directors on May 15, 2017 Preferred shareholders permitted to convert each preferred share to 2,275 common shares prior to redemption date Improvement of the tangible common equity ratio from 6.97% to 8.61% and change in tangible book value per common share from $15.90 to $15.69 assuming full conversion Increases common shares outstanding to approximately 2,540,000; dilution already calculated in earnings per share Paid $.08 semi-annual common dividend since fall of 2015 Focus on maximizing shareholder value Strategic Considerations 14 |
|
|
Appendix |

|
|
March 31, 2017 December 31, 2016 December 31, 2015 Total shareholders’ equity (a) $43,387 $42,364 $39,524 Less: Preferred stock (7,016) (7,261) (7,659) Common equity (b) 36,371 35,103 31,865 Goodwill (4,097) (4,097) (4,097) Intangible assets (177) (194) (265) Tangible common equity (c) 32,097 30,812 27,503 Add: Preferred stock 7,016 7,261 7,659 Tangible equity (d) $39,113 $38,073 $35,162 Total assets (e) $464,454 $455,422 $432,181 Less: Goodwill (4,097) (4,097) (4,097) Intangible assets (177) (194) (265) Tangible assets (f) $460,180 $451,131 $427,819 Shares outstanding (in thousands) (g) 2,019 2,001 1,969 Book value per common share (b/g) $18.01 $17.54 $16.18 Tangible book value per common share (c/g) $15.90 $15.40 $13.97 Total shareholders’ equity to total assets ratio (a/e) 9.34% 9.30% 9.15% Tangible equity ratio (d/f) 8.50% 8.44% 8.22% Tangible common equity ratio (c/f) 6.97% 6.83% 6.43% Non-GAAP Capital Measures |