Attached files
| file | filename |
|---|---|
| 8-K - FORM 8-K - QCR HOLDINGS INC | f8k_051617.htm |
EXHIBIT 99.1

APRIL 2017


This presentation contains certain forward - looking statements within the meaning of Section 27A of the Securities Act of 1933, and Section 21E of the Securities Exchange Act of 1934. These statements include, but are not limited to, descriptions of the financial condition, results of operations, asset and credit quality trends, profitability, projected earnings, future plans, strategies and expectations of QCR Holdings Inc. (the “Company”). The Company intends such forward - looking statements to be covered by the safe harbor provisions for forward - looking statements contained in the Private Securities Litigation Reform Act of 1995 and is including this statement for purposes of complying with those safe harbor provisions. Forward - looking statements, which are based on certain assumptions of the Company, are generally identifiable by use of the words “believe,” “expect,” “intend,” “anticipate,” “estimate,” “project,” “seek,” “target,” “potential,” “focus,” “may,” “could,” “should” or similar expressions. These forward - looking statements express management’s current expectations or forecasts of future events, and by their nature, are subject to risks and uncertainties. Therefore, there are a number of factors that might cause actual results to differ materially from those in such statements. Factors that might cause such a difference include, but are not limited to: (i) the effects of future economic, business and market conditions and changes, domestic and foreign, including seasonality; (ii) governmental monetary and fiscal policies; (iii) legislative and regulatory changes, including changes in banking, securities and tax laws and regulations such as the recently enacted Dodd - Frank Wall Street Reform and Consumer Protection Act and the recently adopted Basel III regulatory capital reforms and their application by the Company’s regulators, and changes in the scope and cost of Federal Deposit Insurance Corporation insurance and other coverages; (iv) changes in accounting policies, rules and practices; (v) the risks of changes in interest rates on the levels, composition and costs of deposits, loan demand, and the values and liquidity of loan collateral, securities, and other interest sensitive assets and liabilities; (vi) the failure of assumptions and estimates underlying the establishment of reserves for possible loan losses and other estimates; (vii) changes in borrowers’ credit risks and payment behaviors; (viii) changes in the availability and cost of credit and capital in the financial markets; 3 FORWARD - LOOKING STATEMENTS

(ix) changes in the prices, values and sales volumes of residential and commercial real estate; (x) the effects of competition from a wide variety of local, regional, national and other providers of financial, investment and insurance services; (xi) the risks of mergers, acquisitions and divestitures, including, without limitation, the related time and costs of implementing such transactions, integrating operations as part of these transactions and possible failures to achieve expected gains, revenue growth and/or expense savings from such transactions; (xii) changes in technology or products that may be more difficult, costly, or less effective than anticipated; (xiii) the effects of war or other conflicts, acts of terrorism or other catastrophic events, including hurricanes, storms, droughts, tornados and flooding, that may affect economic conditions generally and in the Company’s markets; (xiv) the failure of assumptions and estimates used in the Company’s reviews of its loan portfolio, the review of its credit grading methods by an independent firm and the Company’s analysis of its capital position; and (xv) such other matters as discussed in this presentation or identified in the Company’s periodic filings with the Securities and Exchange Commission, particularly those matters described under the heading “Risk Factors” in its Annual Report on Form 10 - K for the year ended December 31, 2016. You are cautioned not to place undue reliance on forward - looking statements, which reflect the Company’s outlook only and speak only as of the date of this presentation or the dates indicated in the statements. The Company assumes no obligation to update or supplement forward - looking statements. For further information on these and other factors that could impact the Company and the statements contained herein, reference should be made to the Company’s filings with the Securities and Exchange Commission. This presentation is a summary only. The Company is not making any implied or express representation or warranty as to the accuracy or completeness of the information contained herein. This presentation is neither an offer to sell nor a solicitation of an offer to purchase any securities of the Company. 4 FORWARD - LOOKING STATEMENTS - Continued
These slides contain non - GAAP financial measures. For purposes of Regulation G, a non - GAAP financial measure is a numerical measure of the registrant’s historical or future financial performance, financial position or cash flows that excludes amounts, or is subject to adjustments that have the effect of excluding amounts, that are included in the most directly comparable measure calculated and presented in accordance with GAAP in the statement of income, balance sheet or statement of cash flows (or equivalent statements) of the issuer; or includes amounts, or is subject to adjustments that have the effect of including amounts, that are excluded from the most directly comparable measure so calculated and presented. In this regard, GAAP refers to generally accepted accounting principles in the United States. Pursuant to the requirement of Regulation G, QCR Holdings, Inc. has provided reconciliations within the slides, as necessary, of the non - GAAP financial measure to the most directly comparable GAAP financial measure. (For more details on the Company’s non - GAAP measures refer to the applicable 10 - K filing) 5 NON - GAAP FINANCIAL MEASURES

6 a relationship driven organization. ® CORPORATE OVERVIEW QCR Holdings, Inc. - Founded in 1993 Headquartered in Moline, IL Source: Company documents and SNL Financial. Financial data as 3/31/17. Ownership data as of 12/31/16. NASDAQ – QCRH Russell 2000 ® Index Member as of June 30, 2015 $3.4 BILLION IN ASSETS $2.4 BILLION IN LOANS $2.8 BILLION IN DEPOSITS 23 FACILITIES A. Quad City Bank & Trust (5) B. Cedar Rapids Bank & Trust (2) C. Rockford Bank & Trust (2) D. m2 Lease Funds LLC (1) E. Community Bank & Trust (3) F. Community State Bank (10) SHARES OUTSTANDING: 13.2 Million OWNERSHIP: Insiders & Benefit Plans 12.8 % Institutional & Mutual Funds 73.5%
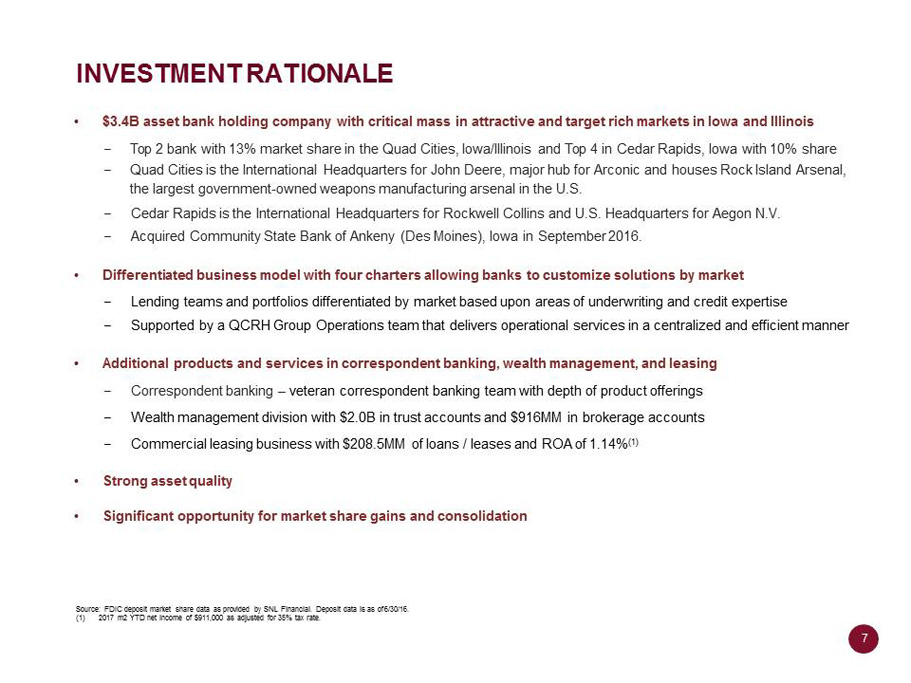
INVESTMENT RATIONALE 7 • $3.4B asset bank holding company with critical mass in attractive and target rich markets in Iowa and Illinois - Top 2 bank with 13% market share in the Quad Cities, Iowa/Illinois and Top 4 in Cedar Rapids, Iowa with 10% share - Quad Cities is the International Headquarters for John Deere, major hub for Arconic and houses Rock Island Arsenal, the largest government - owned weapons manufacturing arsenal in the U.S. - Cedar Rapids is the International Headquarters for Rockwell Collins and U.S. Headquarters for Aegon N.V. - Acquired Community State Bank of Ankeny (Des Moines), Iowa in September 2016. • Differentiated business model with four charters allowing banks to customize solutions by market - Lending teams and portfolios differentiated by market based upon areas of underwriting and credit expertise - Supported by a QCRH Group Operations team that delivers operational services in a centralized and efficient manner • Additional products and services in correspondent banking, wealth management, and leasing - Correspondent banking – veteran correspondent banking team with depth of product offerings - Wealth management division with $2.0B in trust accounts and $916MM in brokerage accounts - Commercial leasing business with $208.5MM of loans / leases and ROA of 1.14% (1) • Strong asset quality • Significant opportunity for market share gains and consolidation Source: FDIC deposit market share data as provided by SNL Financial. Deposit data is as of 6/30/16. (1) 2017 m2 YTD net income of $911,000 as adjusted for 35% tax rate.

UNIQUE PRODUCTS AND SERVICES 8 CORRESPONDENT BANKING • Competitively positioned with veteran staff, software, systems and processes • More than 183 relationships to date with $321 million in average non - interest bearing deposits and $109 million in average interest - bearing deposits at 3/31/17 • Approximately a $68 million portfolio of correspondent bank loans • Provides strong source of non - interest bearing deposits, fee income and high - quality loan participations WEALTH MANAGEMENT SBA - USDA LENDING m2 LEASE FUNDS, LLC • $2.0B in Trust (and related) accounts and $916MM in Brokerage (and related) accounts as of 3/31/17 • Full range of product offerings including Trust Services, Brokerage and RIA, Asset Management, Estate Planning and Financial Planning • Added 117 new relationships in Q1 2017 • One of the leading SBA loan originators in two of the Company’s primary markets – ramping up in the third • USDA loan origination focus is on the Business & Industry Program providing guarantees to loans originated to communities with populations < 50,000 - Cedar Rapids Bank & Trust ranks 1st in the state of Iowa for dollar volume of USDA lending and 5th in the nation by dollar volume • Quad City Bank & Trust acquired 80% ownership August of 2005 and in September 2012 acquired the remaining 20% ownership • Income has grown at a 14% CAGR since 2006 (through 12/31/16) • Historically strong asset quality • Key niches with lease specialists located in IA, WI, MN, SC, NC, FL, CA, TX, and PA - Marine Equipment, Machinery/Machine Tools, Office Technology, Printing, Telecom, Bakery, Building & Construction Equipment, and Health Care.

9 QCR HOLDINGS, INC. - MARKET OVERVIEW Source: SNL Financial. Deposit data as of June 30, 2016. Dollars in millions. • Meaningful market share position in each MSA served, with room for continued growth • Each MSA falls within the top 15 largest MSAs in IL and IA by total deposits Deposit Market Share Overview ($M) Market Rank $1,049 $297 $6,936 $4,969 $566 $5,550 $3,172 $125 $16,212 $481 2 4 8 10 8 $0 $6,000 $12,000 $18,000 Quad Ci4es, IA - IL Cedar Rapids, IA Rockford, IL Waterloo Cedar Falls, IA Des Moines/Ankeny, IA QCR Holdings Deposits Compe4tors Deposits

10 “CAPITALIZING” ON OPPORTUNITIES IN OUR MARKET Distribution of Institutions in Targeted Markets (1) Source: SNL Financial. (1) Target area includes top 25 MSAs listed in the Appendix to this presentation excluding Chicago, St. Louis and Omaha MSAs. Southern Wisconsin (defined as Milwaukee MSA and south).Excludes mutual institutions. • Leverage renewed capital strength and relationship driven approach to capture greater organic market and relationship share • Selectively pursue accretive acquisition opportunities • Operating markets are highly fragmented: - 907 community banks are headquartered in Illinois, Iowa and Wisconsin (59% are between $100 million and $1.0 billion in assets) - 264 community banks are headquartered in top selected MSAs (1) in Illinois, Iowa and Southern Wisconsin (60% are between $100 million and $1.0 billion in assets) - Heavy fragmentation provides a wealth of opportunities from which to selectively pursue targets • Targets will meet rigorous evaluation standards: - Cultural and strategic fit - Enhances competitive position - Drives market share - Enhances shareholder value • QCRH operating structure attractive to targets 48 8 6 7 32 9 4 21 10 5 3 5 101 27 14 16 0 40 80 120 $100M - $300M $300M - $500M $500M - $700M $700M - $1B Southern WI Iowa Illinois

TOP 25 MSAS / IOWA AND ILLINOIS 11 a relationship driven organization. ® Source: SNL Financial. Deposit data as of June 30, 2016. Growth CAGR figures based on 2016 - 2022 projected figures. MSA Deposits ($M) Number of Institutions Number of Branches T otal Population Projected Population Growt h Median Household Income Projected Median HHI Growth Chicago - Naperville - Elgin, IL - IN - WI $ 389,974 198 4,402 9,563,680 0.15 % $ 65,458 1.30 % St. Louis, MO - IL 95,134 129 1,306 2,819,371 0.23 59,287 1.39 Omaha - Council Bluffs, NE - IA 31,002 72 451 930,004 0.94 61,538 1.34 Des Moines - West Des Moines, IA 16,693 50 304 639,120 1.23 67,336 1.63 Bloomington, IL 14,145 32 106 189,251 0.12 61,374 0.28 Davenport - Moline - Rock Island, IA - IL 7,985 35 204 383,950 0.19 53,729 0.66 Peoria, IL 7,244 38 222 376,539 (0.09) 58,128 0.75 Rockford, IL 5,847 25 134 338,034 (0.32) 51,423 1.20 Springfield, IL 5,687 29 123 210,900 0.04 58,400 0.92 Cedar Rapids, IA 5,535 38 146 268,537 0.62 65,370 1.81 Champaign - Urbana, IL 5,455 34 136 241,149 0.46 50,137 1.24 Sioux City, IA - NE - SD 4,171 35 1 1 2 169,272 0.27 51,953 1.17 Iowa City, IA 3,817 22 79 170,199 1.16 62,298 1.90 Ottawa - Peru, IL 3,609 30 1 1 0 149,121 (0.39) 51,085 0.25 Waterloo - Cedar Falls, IA 3,297 24 95 171,484 0.44 55,256 1.76 Dubuque, IA 2,770 8 54 98,040 0.66 57,168 1.44 Ames, IA 2,253 19 51 97,731 1.01 49,974 0.66 Carbondale - Marion, IL 2,057 19 84 126,976 0.09 42,283 0.95 Cape Girardeau, MO - IL 1,966 17 66 97,818 0.32 46,291 1.69 Paducah, KY - IL 1,926 15 56 96,787 (0. 1 1) 43,296 0.72 Decatur, IL 1,917 14 67 105,924 (0.51) 48,628 0.57 Kankakee, IL 1,886 17 56 109,952 (0.33) 59,224 2.04 Quincy, IL - MO 1,856 18 60 77,234 0.06 48,263 1.80 Effingham, IL 1,584 11 25 34,413 0. 1 1 56,071 1.00 Fort Madison - Keokuk, IA - IL - MO 1,566 18 54 60,003 (0.22) 48,500 1.62 High $389,974 198 4,402 9,563,680 1.23 % $67,336 2.04 % Low $1,566 8 25 34,413 (0.51) $42,283 0.25 Medium $3,817 25 106 170,199 0.15 $55,256 1.24

Financial Highlights
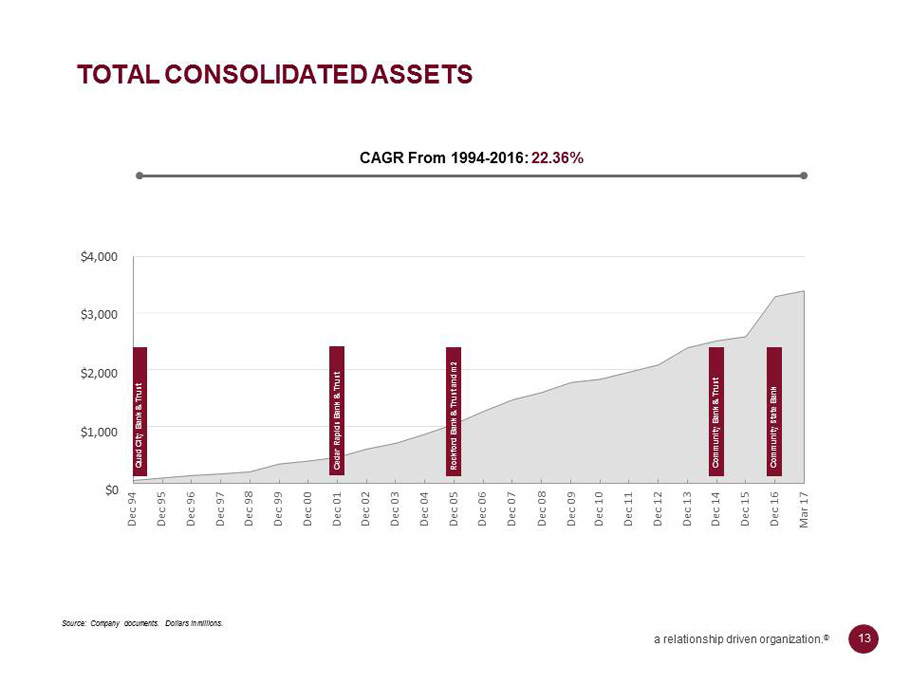
$4,000 $3,000 $2,000 $1,000 $0 De c 94 De c 95 De c 96 De c 97 De c 98 De c 99 De c 00 De c 01 De c 02 De c 03 De c 04 De c 05 De c 06 De c 07 De c 08 De c 09 De c 10 De c 11 De c 12 De c 13 De c 14 De c 15 De c 16 Mar 17 TOTAL CONSOLIDATED ASSETS CAGR From 1994 - 2016: 22.36% Source: Company documents. Dollars in millions. Quad Cit y Ban k & T rust Ceda r Rapid s Ban k & T rust Rockfor d Ban k & T rus t an d m2 Communit y Ban k & T rust Communit y State Bank 13 a relationship driven organization. ®

INCOME STATEMENT RESULTS & KEY EARNINGS METRICS C ommo n 14 a relationship driven organization. ® (Non - GAAP) Reported Reported Reported Reported Core Reported Core Reported 12/31/12 12/31/13 12/31/14 12/31/15 12/31/15 12/31/16 12/31/16 3/31/17 Net Income Available to $9.1 $11.8 $13.9 $16.9 $20.9 $27.7 $29.4 $9.2 NIM (%)(TEY)(Non - GAAP) 3.14% 3.03% 3.15% 3.37% 3.37% 3.75% 3.75% 3.90% ROAA (%) 0.62% 0.64% 0.61% 0.66% 0.82% 0.97% 1.03% 1.12% Efficiency RaNo (%) 71.59% 71.98% 72 .55% 72.71% 66.27% 64.90% 61.56% 60.86% Diluted EPS $1.85 $2.08 $1.72 $1.61 $1.99 $2.17 $2.31 $0.68 ($ millions except per share)

15 Loan Growth Trend (1) STRONG COMMERCIAL LOAN GROWTH Source: Company documents. Dollars in millions. (1) Loan composition excludes deferred loan/lease origination costs, net of fees. (2) Includes Commercial & Industrial, Commercial RE and Direct Financing Leases. • 35% organic loan growth from 2013 to 2016 (excludes Community State Bank) • Commercial lending (2) represents more than 87% of the portfolio • 2013 loan growth supplemented by acquisition of Community National Bancorporation - Waterloo • 2016 loan growth supplemented by acquisition of Community State Bank - Ankeny $432 $524 $648 $828 $852 $672 $702 $724 $1,093 $1,107 $129 $166 $174 $165 $159 $147 $159 $170 $229 $231 $76 $73 $74 $82 $79 $0 $500 $1,000 $1,500 $2,000 $2,500 2013 Commercial & Industrial 2014 Commercial RE 2015 Direct Fin. Leases 2016 Residen4al RE 2017 Q1 Consumer & Other $1,456 $1,623 $1,790 $2,397 $2,428

Lease Asset Generation m2 LEASE FUNDS LLC OVERVIEW Source: Company documents. Dollars in millions. • National equipment leasing platform • Focus includes commercial equipment/ building and construction machinery and assets, medical equipment, office equipment (computer hardware and software), and vehicles classified as heavy equipment • High yield portfolio; average gross yield for first - quarter was approximately 8.0% • Historically strong asset quality • Targeting a lease portfolio of $250MM $108 $134 $177 $201 $211 $208 $53 $74 $105 $101 $97 $20 $0 $50 $100 $150 $200 $250 2012 2015 2016 2017 Q1 2013 2014 Leases Outstanding New Leases Originated 16 a relationship driven organization. ®

21 .65% 52 .03% 22 .82% 3 .50% Other Real Estate Owned & Rep. Assets - 21.65% Nonaccrual Loans/Leases - 52.03% Troubled Debt Restructures - Accruing - 22.82% Accruing Loans/Leases 90+ Days PD - 3.50% Source: Company documents. Dollars in millions. ASSET QUALITY OVERVIEW Management continues to focus on maintaining excellent asset quality and resolving problem assets $27.3M Classified Loans ($M) & NPAs / Assets Nonperforming Assets Composition – 2017 Q1 2 .06% 1 .41% 1 .28% 1 .31% 0 .74% 0 .82% 0 .81% 0 .5% 1 .0% 1 .5% 2 .0% 2 .5% $30 $40 $50 $60 $70 $62.7 $48.2 $43.5 $35.7 $28.0 $49.0 $50.8 $20 0 .0% 2011 2012 2013 2014 2015 2016 2017 Q1 Classified Loans ($M) NPA's / Assets (%) 17 a relationship driven organization. ®
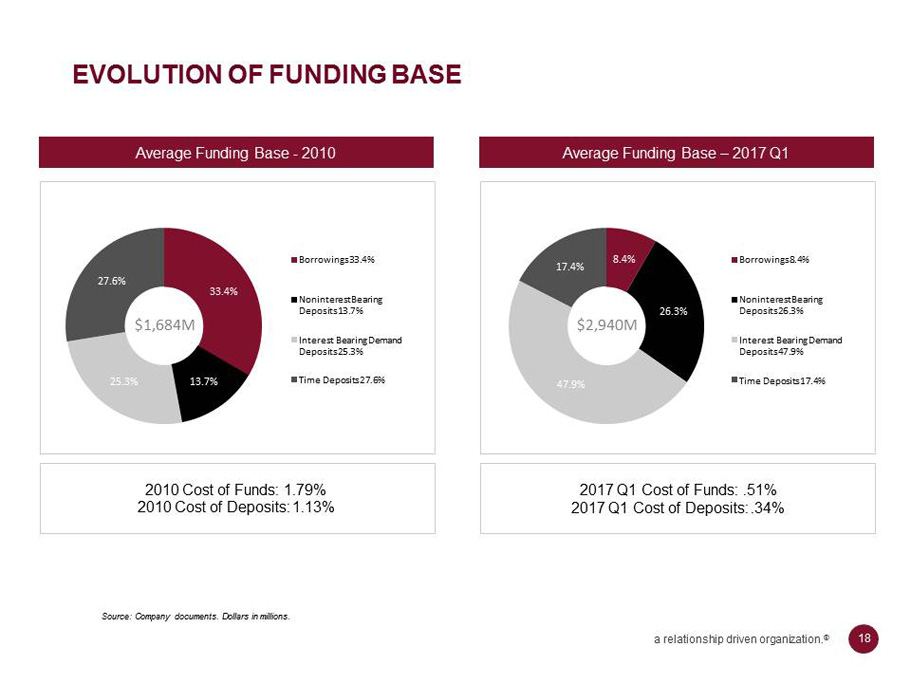
Average Funding Base - 2010 EVOLUTION OF FUNDING BASE Source: Company documents. Dollars in millions. Average Funding Base – 2017 Q1 2010 Cost of Funds: 1.79% 2010 Cost of Deposits: 1.13% 33 .4% 13 .7% 25 .3% 27 .6% Borrowings 33.4% Noninterest Bearing Deposits 13.7% Interest Bearing Demand Deposits 25.3% Time Deposits 27.6% $1,684M 8 .4% 26 .3% 47 .9% 17 .4% Borrowings 8.4% Noninterest Bearing Deposits 26.3% Interest Bearing Demand Deposits 47.9% Time Deposits 17.4% $2,940M 2017 Q1 Cost of Funds: .51% 2017 Q1 Cost of Deposits: .34% 18 a relationship driven organization. ®
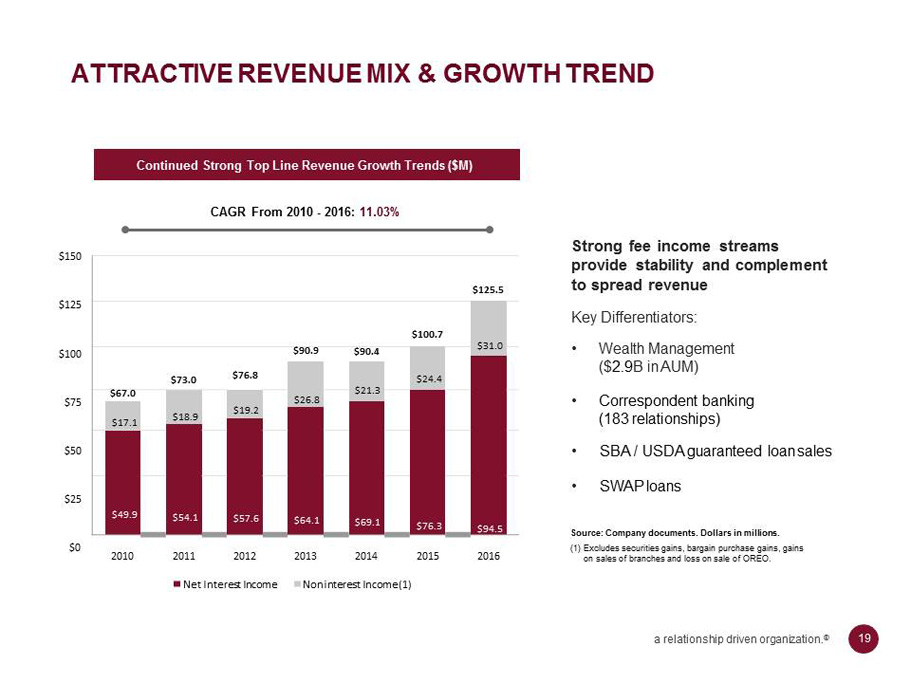
Continued Strong Top Line Revenue Growth Trends ($M) ATTRACTIVE REVENUE MIX & GROWTH TREND Strong fee income streams provide stability and complement to spread revenue Key Differentiators: • Wealth Management ($ 2.9 B in AUM) • Correspondent banking (183 relationships) • SBA / USDA guaranteed loan sales • SWAP loans Source: Company documents. Dollars in millions. (1) Excludes securities gains, bargain purchase gains, gains on sales of branches and loss on sale of OREO. $125.5 $100.7 $31.0 $90.9 $90.4 $24.4 $94.5 $73.0 $76.8 $26.8 $21.3 $67.0 $18.9 $19.2 $76.3 $17.1 $69.1 $64.1 $57.6 $54.1 $49.9 $150 $125 $100 $75 $50 $25 $0 2010 2015 2016 2011 2012 Net Interest Income 2013 2014 Noninterest Income (1) CAGR From 2010 - 2016: 11.03% 19 a relationship driven organization. ®

Net Income to Common Shareholders ($M) IMPROVING RETURNS FOR COMMON SHAREHOLDERS Source: Company documents. Dollars in millions. Approximately ~44.48% Net Income to Common CAGR From 2011 – 2016 $4.4 $9.1 $11.8 $13.9 $16.9 $27 .7 $0 .0 $5 .0 $10 .0 $15 .0 $20 .0 $25 .0 $30 .0 2011 2012 2013 2014 2015 2016 20 a relationship driven organization. ®

STRATEGIES TO CONTINUE TO DRIVE SHAREHOLDER VALUE 21 a relationship driven organization. ® • Continue strong organic loan and lease growth to maintain loans and leases to total assets ratio in the range of 70 - 75% (72% as of 3/31/17) • Continued focus on growing core deposits to maintain reliance on wholesale funding to less than 15% of assets (30% as of 12/31/14, now 9% as of 3/31/17) • Continue to focus on maintaining gains on sale of USDA and SBA loans, and fee income on SWAPS, as a more significant and consistent component of core revenue • Grow wealth management net income by 10% annually • Carefully manage noninterest expenses growth • Maintain asset quality metrics to better than peer levels • Participate as an acquirer in the consolidation taking place in our markets to further boost ROAA, improve efficiency ratio, and increase EPS

CONCLUDING REMARKS 22 a relationship driven organization. ® • Critical mass in attractive and target rich markets in Iowa and Illinois • 4 charter model allows subsidiary banks to customize solutions by market • Differentiated product offering includes correspondent banking, wealth management, leasing and SBA/USDA lending • Strong asset quality • Significant opportunity for market share gains and consolidation • Attractively valued relative to peer institutions

Appendix

HISTORY OF QCR HOLDINGS, INC. 24 a relationship driven organization. ® 1993 - Founded by Mike Bauer and Doug Hultquist - $14 Million IPO 1994 - Quad City Bank & Trust (De Novo) – Currently $1.44 Billion in Assets 1995 - Quad City Bancard Formed 2001 - Cedar Rapids Bank & Trust (De Novo) – Currently $929 Million in Assets (includes Community Bank & Trust branches) 2005 2005 - Rockford Bank & Trust (De Novo) – Currently $398 Million in Assets - Quad City Bank & Trust acquires 80% ownership of m2 Lease Funds, LLC 2007 - First Wisconsin Bank & Trust (De Novo) – Milwaukee, WI 2008 2008 - Quad City Bancard sells Merchant Acquiring Business - Sale of First Wisconsin Bank & Trust – Milwaukee, WI 2012 - Quad City Bank & Trust acquires remaining 20% ownership of m2 Lease Funds, LLC – Currently $210 Million in Assets 2013 2013 2013 - Quad City Bank & Trust Sells its credit card portfolio & servicing to Fifth Third Bank – January 31, 2013 - QCR Holdings acquires Community National Bancorporation and Community National Bank (CNB) on May 13, 2013 - Community National Bank merges with Cedar Rapids Bank & Trust on October 26, 2013 and begins operating as a division of Cedar Rapids Bank & Trust under the name Community Bank & Trust. (QCR Holdings sells Mason City, IA branches of CNB to Clear Lake Bank & Trust on October 4, 2013 and Austin, MN branches of CNB to Eastwood Bank on October 11, 2013.) (Assets included with Cedar Rapids Bank & Trust – above) 2015 - $65MM capital raise 2016 2016 - $30MM capital raise in connection with acquisition of Community State Bank - QCR Holdings acquires Community State Bank of Ankeny (Des Moines), Iowa on September 1, 2016 – Currently $608 Million in Assets Source: Company documents. Subsidiary assets as of 3/31/17.

25 a relationship driven organization. ® EXECUTIVE MANAGEMENT TEAM DANA L. NICHOLS Executive Vice President, Chief Credit Officer, 34 Years in Banking / Financial Services JOHN R. OAKES, CPA 1st Vice President, Treasurer 15 Years in Banking / Financial Ser vices JOHN A. RODRIGUEZ, CCM Executive Vice President, Deposit Operations / Information Services 34 Years in Banking / Financial Ser vices M. RANDOLPH WESTLUND, CFA Executive Vice President, Chief Investment Officer 31 Years in Banking / Financial Services CATHIE S. WHITESIDE, MBA Executive Vice President, Corporate Strategy, Human Resources, Branding 9 Years in Banking / Financial Services 22 Years in Broadcast Media MICHAEL J. WYFFELS Senior Vice President, Chief Information Officer 27 Years in Banking / Financial Services DOUGLAS M. HULTQUIST, CPA President and Chief Executive Officer 39 Years in Banking / Financial Services TODD A. GIPPLE, CPA Executive Vice President, Chief Operating Officer and Chief Financial Officer 31 Years in Banking / Financial Services JOHN H. ANDERSON President and Chief Executive Officer, Quad City Bank and Trust Company Chief Deposit Officer, QCR Holdings, Inc. 30 Years in Banking / Financial Services PETER J. BENSON, JD Executive Vice President, Chief Legal Counsel and Trust Officer 34 years in Corporate and Personal Legal Services STACEY J. BENTLEY President and Chief Executive Officer, Community Bank & Trust 36 Years in Banking / Financial Services THOMAS D. BUDD President and Chief Executive Officer, Rockford Bank and Trust Company 30 Years in Banking / Financial Services CYNTHIA M. CARLSON Executive Vice President, Wealth Management Group 36 Years in Banking / Financial Services RICHARD W. COUCH President and Chief Operating Officer, m2 Lease Funds, LLC 29 Years in Banking / Financial Services JOHN R. ENGELBRECHT, MBA Chief Executive Officer, m2 Lease Funds, LLC 42 Years in Banking / Financial Services ELIZABETH A. GRABIN, CPA First Vice President, Controller, and Director of Financial Reporting 15 Years in Banking / Financial Services SHAWNA M. GRAHAM, CBA, CIA, CISA, CRP, MBA, CCBCO Senior Vice President, Director of Risk Management 28 Years in Banking / Financial Services LARRY J. HELLING President and Chief Executive Officer, Cedar Rapids Bank and Trust Company Executive Vice President and Chief Lending Officer, QCR Holdings, Inc. 37 Years in Banking / Financial Services ANNE E. HOWARD, SHRM - SCP Vice President, Director of Human Resources 16 Years in Banking / Financial Services 14 Years in Human Resources JOHN R. M c EVOY, JR. Executive Vice President, Chief Operations Officer & Cashier Quad City Bank and Trust Company 40 Years in Banking / Financial Services RONALD R. NAGEL President and Chief Executive Officer Community State Bank 40 Years in Banking / Financial Services
26 • 4 distinct (yet similar) operating charters – able to customize solutions by market • Managed by local veteran bankers, governed by local Board of Directors, local decisions, local solutions, enhanced market specific knowledge • 4 charters supported by QCRH Group Operations team that delivers operational services in a centralized and efficient manner • Credit quality historically better than peers • Historic deposit growth better than peers • Historic loan growth better than peers • Top 5 Deposit market share in Quad Cities and Cedar Rapids • Top 10 Deposit market share in Rockford, Waterloo/Cedar Falls, and Des Moines (Ankeny) • High touch service delivered locally by knowledgeable advisors • Opportunities in Correspondent Banking, Wealth Management, SBA/USDA lending, and m2 Leasing THE STRATEGIC VALUE OF OUR SEPARATE CHARTERS

27 QUAD CITY BANK & TRUST John H. Anderson, President & CEO Assets: $1.44 Billion (as of 3/31/17 ) Population: 383,950 Market Deposits: $8.0 Billion Ranked 2 nd with 13.1% market share and over $1,049 Million in deposits in Davenport - Moline - Rock Island MSA Finalist 2013 and 2014 – Quad Cities Best Place to Work Finalist 2015 ABA Volunteer Finalist Award Finalist 2015 Be Healthy QC Award Major Employers Rock Island Arsenal Deere & Company Genesis Health Systems HNI Corporation / The Hon Company / Allsteel Unity Point Health - Trinity Tyson Fresh Meats Arconic (formerly Alcoa) Kraft 3M Excelon HyVee Quad Cities Highlights The Rock Island Arsenal is the largest government - owned military weapons manufacturing arsenal in the United States Arconic (formerly Alcoa) (Quad Cities) is the world’s premier aerospace supply plant – the hub of Alcoa’s $3B aerospace business. Announced $1B, multi - year contract with Airbus in Nov 2016 International Headquarters for Deere & Company Kraft - Heinz constructing $203MM state - of - the - art production facility in northwest Davenport Material Control Systems (MATCON) completed a new $10MM logistics facility and added 150 new jobs Ranked 16th in the nation for high - tech job growth Ranked as a Top 50 Military Friendly Community Top 5 Defense Community Top 10 Advanced Manufacturing Community Ranked #1 Minor - League Sports Market in the Nation for 2015 Top 10 Community for Raising a Family 2nd Best Riverfront along the Mississippi River What They’re Saying About the Quad Cities Quad City Chamber: June 2016 “The Quad Cities offers unparalleled access to major Midwestern and global markets, making it a prime location for logistics, distribution and warehousing companies. With over 37 million people living within a 300 mile radius, businesses have easy and efficient access to a strong network of suppliers and customers.” Source: FDIC deposit market share data as provided by SNL Financial. Deposit data is as of 6/30/16 as adjusted for acquisitions to the extent discernable.

CEDAR RAPIDS BANK & TRUST Larry J. Helling, President & CEO Assets: $929 Million* (as of 3/31/17 ) Population: 268,537 Market Deposits: $5.5 Billion Top 4 bank with 10.23% market share and over $566 million in deposits in Cedar Rapids MSA 2014 & 2015 Finalist – Coolest Place to Work in Cedar Rapids Top 3 - 2016 Corridor Business Journal Worksite Wellness Award Top 200 Healthiest Banks in America (Deposit Accounts 2016) Major Employers Rockwell Collins Aegon USA Unity Point Health - St. Luke’s Hospital Mercy Medical Center Whirlpool Corporation Kirkwood Community College Quaker Food and Snacks Cedar Rapids Community Schools Amana Refrigeration MCI General Mills Archer Daniels Midland Transamerica Cedar Rapids Highlights International Headquarters for Rockwell Collins U.S. Headquarters for Aegon USA Downtown Revitalization – Double Tree by Hilton Cedar Rapids Convention Complex $144MM, 2 year project resulted in 100,000 sq/ft convention center and 267 room Double Tree Hotel CRST International constructing 11 - story, 113,000 sq/ft, $37MM world headquarters building in downtown, completed in 2016 Other downtown projects: PCI Medical Mall, Mercy Cancer Center, Kingston Commons Condominiums, Public Library, City Hall, Fire Station Top 10 Best Affordable Places to Live (2016) Top 10 Best Places for Starting a Small Business (2015) Ranked 6th Healthiest Bank in Iowa by DepositAccounts.com The largest corn - processing city in the world The second largest producer of wind energy in the United States Top 100 Places to Live (Livability 2016) Top 10 Most Liveable Medium - Sized Cities (2015) Ranked #1 in the Best Cities for Children (SmartAsset 2015) What They’re Saying About Cedar Rapids Cedar Rapids Metro Economic Alliance: June 2016 “Cedar Rapids is the second largest city in Iowa and is considered an economic hub of the state, located in the core of the Interstate 380 Technology Corridor. Relatively low cost of living expenses and high income levels give residents 10% more purchasing power than other Iowans and 13% more than the average U.S. resident.” 28 * Includes the assets of Community Bank & Trust Source: FDIC deposit market share data as provided by SNL Financial. Deposit data is as of 6/30/16 as adjusted for acquisitions to the extent discernable.

ROCKFORD BANK & TRUST Thomas D. Budd, President & CEO Assets: $398 Million (as of 3/31/17 ) Population: 338,034 Market Deposits: $5.8 Billion Ranked 8 th with 5.1% market share and over $297 Million in deposits in Rockford MSA Major Employers Rockford Public School District Swedish American Health Systems Chrysler (Belvidere Assembly Plant) Mercy Health System Hamilton Sundstrand Wal - Mart Stores OSF St. Anthony Medical Center Winnebago County Woodward, Inc. UPS Rockford Highlights Mercy Health System constructing a $485MM ‘destination’ medical center scheduled to open in 2019 AAR (largest aircraft maintenance company in North America, and third largest in the world) opened a new $41MM facility at Chicago Rockford Airport generating jobs for 500 people Rock Valley College partnering with St. Anthony College of Nursing to build a $32MM Health Science Center – opening Jan. 2017 Fiat Chrysler Belvidere plant to invest $350MM to retool for Jeep Cherokee production generating new jobs for 300 people OSF St. Anthony Medical Center constructing $85MM expansion of Rockford campus to open in early 2018 Logistical Operations Hub – Current home to large - scale UPS and Con - way Freight, recent ground breaking for FedEx facility generating 150 new jobs Downtown revitalization – 150 room, $54MM hotel and convention center developed by Gorman & Co. Riverfront sports complex, $25MM, 115,000 sq/ft to be one of the largest in the Midwest Considered Illinois’ third largest city Voted “Best Midwest City for Sports Venues” (Sports Illustrated) Top 40 “Best Mid - Sized Cities for Manufacturing Jobs” What They’re Saying About Rockford Rockford Chamber of Commerce: June 2016 “ Rockford, as part of the greater Chicago region, is part of the third largest multi - modal system in the world and largest in the United States. From the Rockford area, businesses can reach 80% of U.S. households within a 24 - hour truck drive. The Rockford Region is within a one hour drive of O’Hare International Airport, one of three truly global airports in the U.S.”. Source: FDIC deposit market share data as provided by SNL Financial. Deposit data is as of 6/30/16 as adjusted for acquisitions to the extent discernable. 2 9

COMMUNITY BANK & TRUST Stacey J. Bentley, President & CEO Deposits: $128 Million (as of 3/31/17 ) Population: 171,484 Market Deposits: $3.3 Billion Ranked 10 th with 3.8% market share and over $125 Million in deposits in Waterloo - Cedar Falls MSA 2016 Employer Choice Award – Courier Communications Major Employers John Deere Hy - Vee Foods Store Wheaton Franciscan Healthcare The VGM Group Tyson Fresh Meats Allen Memorial Hospital University of Northern Iowa Target Regional Distribution Center Area Education Agency 267 Omega Cabinetry Ltd. CBE Companies, Inc. Bertch Cabinets Waterloo/Cedar Falls Highlights John Deere investing $40MM in its tractor testing labs, adding 62,000 sq/ft of additional space John Deere completed $150MM modernization of John Deere Foundry – total investment by Deere in Waterloo in the last decade equals $1B ConAgra Foods announced a $50MM expansion of the plant located in the Waterloo Midport Industrial Park The city of Waterloo approved for $12MM in funding for the Techworks Campus Reinvestment District. The District projects a capital investment of $74.1MM to include a John Deere training center and hotel VGM announced the expansion of their Waterloo campus, which includes approx. $20MM in capital investment and the potential for 200 new jobs First Gigabit city in Iowa and one of eight in the U.S. Cost of living is 8% below the national average Waterloo - Cedar Falls is a Blue Zones Demonstration Community. Community Bank & Trust became the 1st Iowa bank designated as a Blue Zone Worksite Waterloo named a 2015 All - Star Community by the Iowa League of Cities What They’re Saying About Waterloo - Cedar Falls Greater Cedar Valley Chamber of Commerce: June 2016 “The Cedar Valley Economy - Strong and Growing! The strong and growing Cedar Valley economy contains the right conditions for business and career success. Current economic growth and it’s demand for quality talent is benefiting manufacturing, business services, retail, housing, education, healthcare, and other enterprises that contribute to the vitality of the region.” Source: FDIC deposit market share data as provided by SNL Financial. Deposit data is as of 6/30/16 as adjusted for acquisitions to the extent discernable. 3 9
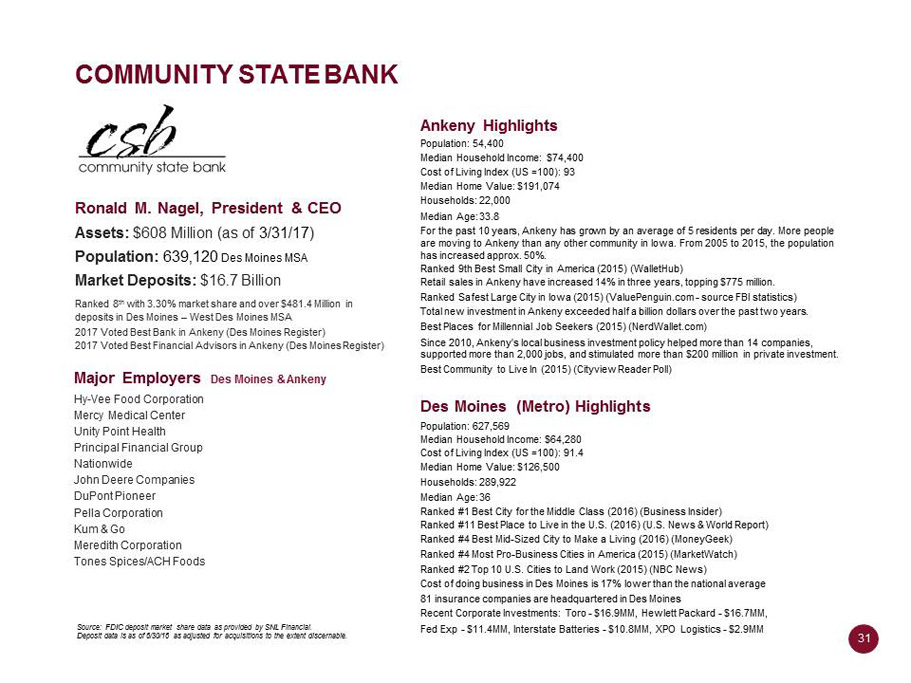
COMMUNITY STATE BANK Ronald M. Nagel, President & CEO Assets: $608 Million (as of 3/31/17 ) Population: 639,120 Des Moines MSA Market Deposits: $16.7 Billion Ranked 8 th with 3.30% market share and over $481.4 Million in deposits in Des Moines – West Des Moines MSA 2017 Voted Best Bank in Ankeny (Des Moines Register) 2017 Voted Best Financial Advisors in Ankeny (Des Moines Register) Major Employers Des Moines & Ankeny Hy - Vee Food Corporation Mercy Medical Center Unity Point Health Principal Financial Group Nationwide John Deere Companies DuPont Pioneer Pella Corporation Kum & Go Meredith Corporation Tones Spices/ACH Foods Ankeny Highlights Population: 54,400 Median Household Income: $74,400 Cost of Living Index (US =100): 93 Median Home Value: $191,074 Households: 22,000 Median Age: 33.8 For the past 10 years, Ankeny has grown by an average of 5 residents per day . More people are moving to Ankeny than any other community in Iowa . From 2005 to 2015 , the population has increased approx . 50 % . Ranked 9th Best Small City in America (2015) (WalletHub) Retail sales in Ankeny have increased 14% in three years, topping $775 million. Ranked Safest Large City in Iowa (2015) (ValuePenguin.com - source FBI statistics) Total new investment in Ankeny exceeded half a billion dollars over the past two years. Best Places for Millennial Job Seekers (2015) (NerdWallet.com) Since 2010, Ankeny’s local business investment policy helped more than 14 companies, supported more than 2,000 jobs, and stimulated more than $200 million in private investment. Best Community to Live In (2015) (Cityview Reader Poll) Des Moines (Metro) Highlights Population: 627,569 Median Household Income: $64,280 Cost of Living Index (US =100): 91.4 Median Home Value: $126,500 Households: 289,922 Median Age: 36 Ranked #1 Best City for the Middle Class (2016) (Business Insider) Ranked #11 Best Place to Live in the U.S. (2016) (U.S. News & World Report) Ranked #4 Best Mid - Sized City to Make a Living (2016) (MoneyGeek) Ranked #4 Most Pro - Business Cities in America (2015) (MarketWatch) Ranked #2 Top 10 U.S. Cities to Land Work (2015) (NBC News) Cost of doing business in Des Moines is 17% lower than the national average 81 insurance companies are headquartered in Des Moines Recent Corporate Investments: Toro - $16.9MM, Hewlett Packard - $16.7MM, Source: FDIC deposit market share data as provided by SNL Financial. Deposit data is as of 6/30/16 as adjusted for acquisitions to the extent discernable. Fed Exp - $11.4MM, Interstate Batteries - $10.8MM, XPO Logistics - $2.9MM 31
Group Operations 32 a relationship driven organization. ® • Accounting and Treasury – Beth Grabin and John Oakes • Compliance – Peggy Bishop • Customer Service/Item Processing – Kathy Francque • Deposit Operations – Beth Easterla and John Rodriguez • Funds Management – John McEvoy • Human Resources – Anne Howard and Shellee Showalter • Information Technology – Michael Wyffels and John Rodriguez • Internal Audit – Tim Harding • Loan Operations – Pam Goodwin • Risk Management – Shawna Graham

Tangible Common Equity to Tangible Assets and Tangible Book Value Per Share 33 a relationship driven organization. ® NON - GAAP RECONCILIATIONS As of and for the Year ended December 31, ($ in thousands, except per share data) Tangible Common Equity Total equity Less: Preferred Equity Less: Noncontrolling interests Less: Goodwill and intangible assets Tangible common equity Tangible book value per share Tangible Assets Total assets Less: Goodwill and intangible assets Tangible assets Tangible common equity to tangible assets Source: Company documents. Dollars in thousands. 2011 2012 2013 2014 2015 2016 As of and for quarter ended March 31, 2017 $ 144,433 $ 140,434 $ 147,577 $ 144,079 $ 225,886 $ 286,041 $ 295,840 63,386 53,163 29,824 - - - - 2,052 - - - - - - 3,262 3,252 5,107 4,894 4,694 22,522 20,261 $ 75,733 $ 84,019 $ 112,646 $ 139,185 $ 221,192 $ 263,519 $ 275,579 $ 15 .92 $ 17 .08 $ 14 .29 $ 17 .50 $ 18 .81 $ 20 .11 $ 20 .94 $ 1,966,610 $ 2,093,730 $ 2,394,953 $ 2,524,958 $ 2,593,198 $ 3,301,944 $ 3,381,013 3,262 3,252 5,107 4,894 4,694 22,522 20,261 $ 1,963,348 $ 2,090,478 $ 2,389,846 $ 2,520,064 $ 2,588,504 $ 3,279,422 $ 3,360,752 3.86 % 4.02 % 4.71 % 5.52 % 8.55 % 8.04 % 8.20 %

Deposit Market Share - Quad City Bank & Trust Institution Name Offices in MSA Deposits* Market Share 1. Wells Fargo Bank 16 $ 1,112.3 13.93 % 2. Quad City Bank & Trust 5 1,049.0 13.14 % 3. Blackhawk Bank & Trust 19 966.7 12.11 % 4. U.S. Bank 11 760.1 9.52 % 5. Triumph 10 545.4 6.83 % 6. First Midwest Bank 6 426.7 5.34 % 7. BankOrion 8 370.7 4.64 % 8. Central Bank 3 242.1 3.03 % 9. American Bank & Trust 6 237.0 2.97 % 10. Modern Woodmen Bank 1 218.9 2.74 % 34 a relationship driven organization. ® * Millions of dollars, as of 6/30/16

Deposit Market Share - Cedar Rapids Bank & Trust Institution Name Offices in MSA Deposits* Market Share 1. U.S. Bank 10 $ 933.7 16.87 % 2. Wells Fargo Bank 11 601.3 10.87 % 3. Farmers State Bank 8 586.2 10.59 % 4. Cedar Rapids Bank & Trust 2 565.9 10.23 % 5. Hills Bank & Trust 6 369.8 6.68 % 6. Bankers Trust Co. 3 264.2 4.77 % 7. Guaranty Bank & Trust 6 200.4 3.62 % 8. Farmers & Merchants Savings Bank 4 188.4 3.41 % 9. NXT Bank 3 151.9 2.74 % 10. Bank of the West 3 124.9 2.26 % 35 a relationship driven organization. ® * Millions of dollars, as of 6/30/16

Deposit Market Share - Rockford Bank & Trust * Millions of dollars, as of 6/30/16 36 a relationship driven organization. ® Institution Name Offices in MSA Deposits* Market Share 1. Alpine Bank & Trust 17 $ 1,080.4 18.48 % 2. BMO Harris 10 723.7 12.38 % 3. JP Morgan Chase 7 639.8 10.94 % 4. Associated Bank 6 607.0 10.38 % 5. Illinois Bank & Trust 4 386.6 6.61 % 6. Blackhawk Bank 5 371.6 6.36 % 7. PNC Bank 7 343.2 5.87 % 8. Rockford Bank & Trust 2 296.6 5.07 % 9. Northwest Bank of Rockford 5 225.2 3.85 % 10. First National Bank 3 217.1 3.71 %

Deposit Market Share - Community Bank & Trust * Millions of dollars, as of 6/30/16 37 a relationship driven organization. ® Institution Name Offices in MSA Deposits* Market Share 1. Farmers State Bank 8 $ 587.9 17.56 % 2. U.S. Bank 6 365.7 11.09 % 3. Lincoln Savings Bank 5 308.7 9.36 % 4. Wells Fargo Bank 4 286.6 8.69 % 5. First National Bank 6 283.2 8.59 % 6. Regions Bank 5 180.9 5.49 % 7. GNB Bank 3 164.2 4.98 % 8. State Bank 4 133.7 4.06 % 9. Denver Savings Bank 2 131.0 3.97 % 10.Community Bank & Trust 3 124.5 3.78 %

Deposit Market Share - Community State Bank * Millions of dollars, as of 6/30/16 38 a relationship driven organization. ® Institution Name Offices in MSA Deposits* Market Share 1. Wells Fargo Bank 19 $ 3,117.0 21.39 % 2. Bankers Trust 19 2,292.2 15.73 % 3. West Bank 8 1,254.9 8.61 % 4. U.S. Bank 15 1,062.3 7.29 % 5. Bank of America 4 866.1 5.94 % 6. Great Western Bank 8 831.9 5.71 % 7. Bank of the West 11 538.8 3.70 % 8. Community State Bank 10 481.4 3.30 % 9. First American Bank 6 371.2 2.55 % 10. Iowa State Bank 5 293.6 2.01 %


3551 7 th Street Moline, Illinois 61265 www.qcrh.com