Attached files
| file | filename |
|---|---|
| 8-K - FORM 8-K - ORRSTOWN FINANCIAL SERVICES INC | a8-kinvestorrelationsmay20.htm |

1
Investor Presentation: Driving Shareholder Value
May 2017
NASDAQ: ORRF
Thomas R. Quinn, Jr.
President & CEO
David P. Boyle
EVP / Chief Financial Officer

2 WWW.ORRSTOWN.COM
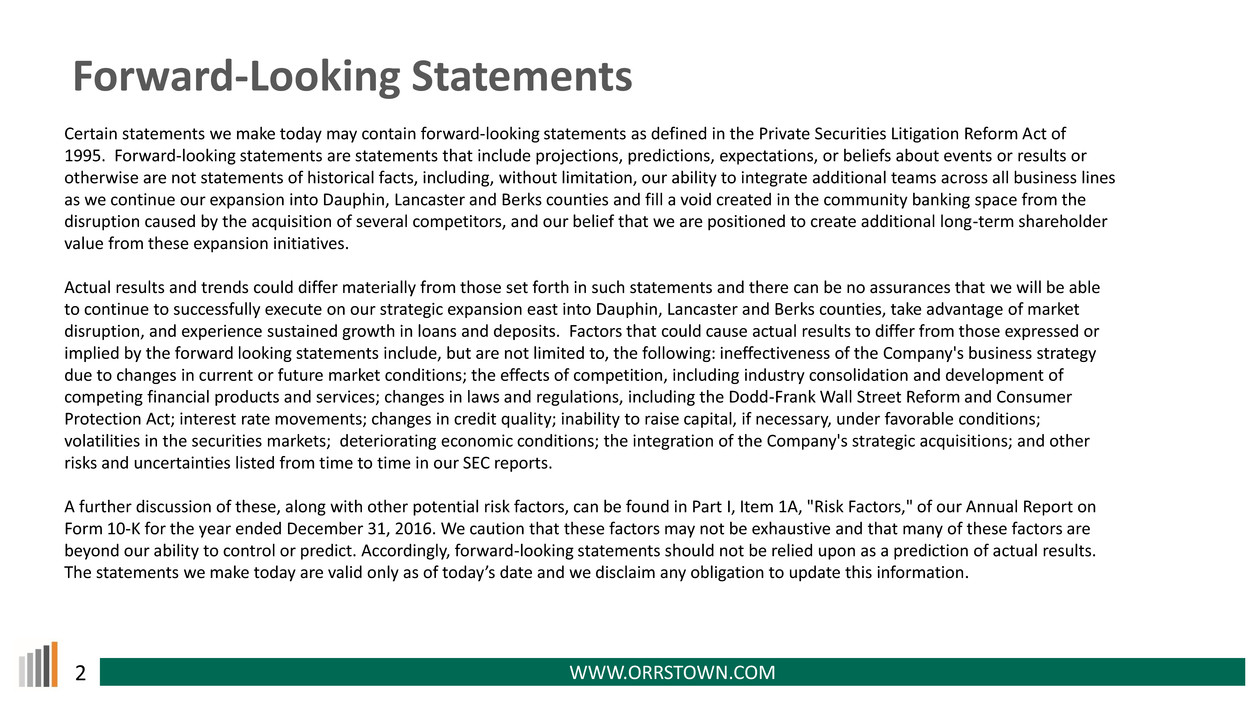
Forward-Looking Statements
Certain statements we make today may contain forward-looking statements as defined in the Private Securities Litigation Reform Act of
1995. Forward-looking statements are statements that include projections, predictions, expectations, or beliefs about events or results or
otherwise are not statements of historical facts, including, without limitation, our ability to integrate additional teams across all business lines
as we continue our expansion into Dauphin, Lancaster and Berks counties and fill a void created in the community banking space from the
disruption caused by the acquisition of several competitors, and our belief that we are positioned to create additional long-term shareholder
value from these expansion initiatives.
Actual results and trends could differ materially from those set forth in such statements and there can be no assurances that we will be able
to continue to successfully execute on our strategic expansion east into Dauphin, Lancaster and Berks counties, take advantage of market
disruption, and experience sustained growth in loans and deposits. Factors that could cause actual results to differ from those expressed or
implied by the forward looking statements include, but are not limited to, the following: ineffectiveness of the Company's business strategy
due to changes in current or future market conditions; the effects of competition, including industry consolidation and development of
competing financial products and services; changes in laws and regulations, including the Dodd-Frank Wall Street Reform and Consumer
Protection Act; interest rate movements; changes in credit quality; inability to raise capital, if necessary, under favorable conditions;
volatilities in the securities markets; deteriorating economic conditions; the integration of the Company's strategic acquisitions; and other
risks and uncertainties listed from time to time in our SEC reports.
A further discussion of these, along with other potential risk factors, can be found in Part I, Item 1A, "Risk Factors," of our Annual Report on
Form 10-K for the year ended December 31, 2016. We caution that these factors may not be exhaustive and that many of these factors are
beyond our ability to control or predict. Accordingly, forward-looking statements should not be relied upon as a prediction of actual results.
The statements we make today are valid only as of today’s date and we disclaim any obligation to update this information.

3 WWW.ORRSTOWN.COM
Corporate Profile
• $1.4 billion community bank based in south-
central Pennsylvania
• Seasoned commercial lending, trust & wealth
management, and mortgage lending
disciplines with 26 retail locations in seven
contiguous counties
• Company has entered phase 3 of transition:
1. Credit turnaround story
2. Investment in future (infrastructure, technology,
risk management)
3. Solid growth in attractive markets affected by
market disruption
• Strong management team and “employer of
choice”

4 WWW.ORRSTOWN.COM
Corporate Profile
Financial Summary and Highlights (3/31/17)
Total Assets $1.45 billion
Total Gross Loans $901 million
Total Deposits $1.18 billion
Loans / Deposits 76%
NPAs / Total Assets 0.51%
Common Shareholders’ Equity $137.5 million
Net Interest Margin 3.35%
Total Assets Under Management $1.26 billion
Listed on Russell 2000
Market Cap of $183 million*
29% year-over-year stock appreciation
Increasing liquidity in stock 2015 2016
(average daily volume)** 6,973 16,679
$17.00
$18.00
$19.00
$20.00
$21.00
$22.00
$23.00
$24.00
*at 4/27/17
**Source: NASDAQ volume average for respective years

5 WWW.ORRSTOWN.COM
Experienced Leadership Team
Name/Title Experience Joined ORRF Disciplines Prior Experience
Thomas R. Quinn, Jr.
President & CEO
27 years 2009
CEO | Strategy |
Sales | Executive
Citi, Fifth Third
David P. Boyle
EVP/Chief Financial Officer
26 years 2012
Finance | Treasury |
Strategy | Executive
PNC/Natl. City, Wayne Bancorp
Barbara E. Brobst
EVP/Chief Human Resources Officer
35 years 1997
HR | Training | Trust |
Executive
Financial Trust
Robert G. Coradi
EVP/Chief Risk Officer
29 years 2012
Credit | Operations |
Executive
Susquehanna
Philip E. Fague
EVP/Trust and Wealth Management
29 years 1988
Mortgage | Trust |
Lending | Executive
Orrstown Bank
Jeffrey S. Gayman
EVP/Market President
21 years 1996
Lending | Retail |
Executive
Orrstown Bank
David T. Hornberger
EVP/Market President
31 years 2016 Lending | Executive Susquehanna, Graystone/Tower
Adam L. Metz
EVP/Chief Lending Officer
22 years 2016 Lending | Executive Metro, M&T
Benjamin W. Wallace, J.D.
EVP/Operations & Technology
14 years 2013
Technology | Legal |
Operations | Executive
JPM/Chase

6 WWW.ORRSTOWN.COM
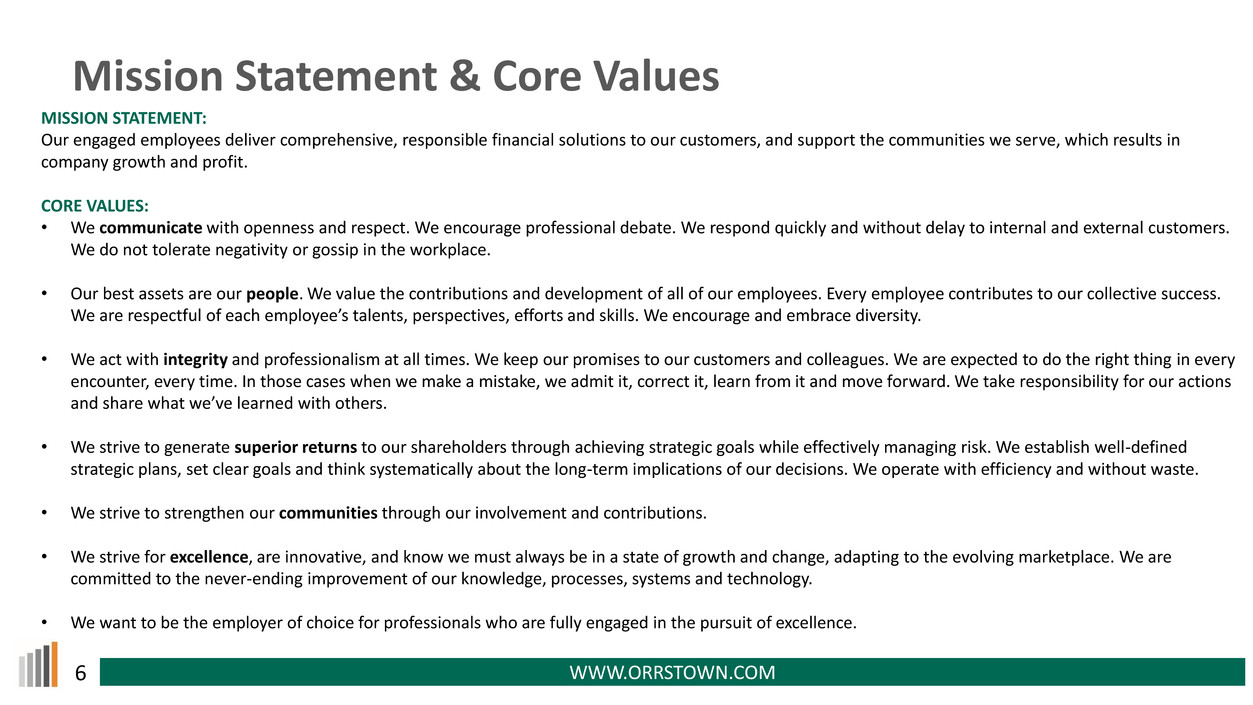
Mission Statement & Core Values
MISSION STATEMENT:
Our engaged employees deliver comprehensive, responsible financial solutions to our customers, and support the communities we serve, which results in
company growth and profit.
CORE VALUES:
• We communicate with openness and respect. We encourage professional debate. We respond quickly and without delay to internal and external customers.
We do not tolerate negativity or gossip in the workplace.
• Our best assets are our people. We value the contributions and development of all of our employees. Every employee contributes to our collective success.
We are respectful of each employee’s talents, perspectives, efforts and skills. We encourage and embrace diversity.
• We act with integrity and professionalism at all times. We keep our promises to our customers and colleagues. We are expected to do the right thing in every
encounter, every time. In those cases when we make a mistake, we admit it, correct it, learn from it and move forward. We take responsibility for our actions
and share what we’ve learned with others.
• We strive to generate superior returns to our shareholders through achieving strategic goals while effectively managing risk. We establish well-defined
strategic plans, set clear goals and think systematically about the long-term implications of our decisions. We operate with efficiency and without waste.
• We strive to strengthen our communities through our involvement and contributions.
• We strive for excellence, are innovative, and know we must always be in a state of growth and change, adapting to the evolving marketplace. We are
committed to the never-ending improvement of our knowledge, processes, systems and technology.
• We want to be the employer of choice for professionals who are fully engaged in the pursuit of excellence.

7 WWW.ORRSTOWN.COM
Three Phase Transition: 1. Credit Turnaround> 2. Building for Future> 3. Growth Company
2012 2013 2014 2015 2016 2017
March 2012
Enforcement
action
June 2012
Loan sale
(65 - $28.6MM*)
December 2012
Loan sale
(172 - $45.6MM*)
July 2012-February 2013
Key executives join Bank
January 2013-December 2014
Building infrastructure for $3-$5 billion bank through investments in enterprise
risk management, credit administration, technology, process and procedure
May 2015
Quarterly dividend
restored
April 2015
Enforcement action
terminated
December 31, 2013
Return to full year
profitability
2015-2016
Key hires of high performing customer-facing talent
June 2015- December 2016
Significant infrastructure build out in key
markets to east
2017>>>
Continue to
leverage market
disruption via
talent acquisition
and geographic
expansion
*Carrying value of assets

8 WWW.ORRSTOWN.COM
Looking Back: Key Milestones
*At 4/30/2017
** Assets under management at 3/31/17
• May 2015: Quarterly dividend restored
• June 2015: Opened first Lancaster County branch*
• $132.2 million net loans
• $43.6 million in deposits
• May 2016: Opened LPO in Lancaster County
• Base of operations for region for commercial lending, OFA, mortgage lending
• Lancaster market has funded $143.8 million in commercial loans in less than two years
• July 2016: Opened LPO in Berks County
• Three person OFA team has generated $37.7 million in AUM**
• Exceeded initial forecasts

9 WWW.ORRSTOWN.COM
Looking Back: Key Milestones
(1) FDIC June 2016 and system generated April 30, 2017
(2) Core system loan data July 31, 2016 and April 30, 2017
(3) Branch opened April 17, 2017, deposit data as of May 8, 2017
• August 2016: Relocated Camp Hill Regional Office
• Hub office for all business lines
• Superior location
• Total Deposits grew from $31.0 million to $49.9 million(1)
• Total Loans grew from $50.4 million to $62.3 million(2)
• October 2016: Opened Harrisburg Regional Office (Swatara Township)
• Houses regional lending teams and fee based business lines
• Full service retail branch
• March 2017: Closed two underperforming branches
• April 2017: Opened second branch in Lancaster County
• $10.74 million in deposits; 74 new accounts in first three weeks(3)
• April 2017: Declared dividend of $0.10/share
• 43% increase since dividend restored in May 2015

10 WWW.ORRSTOWN.COM
1,802 businesses(1)
$11.1 billion in deposits(2)
6,789 businesses(1)
$40.6 billion in deposits(2)
Geographic Expansion in Favorable Markets
(1) Dun & Bradstreet-Businesses with annual sales between $1-$50 million, April 2017; (2) FDIC, June 2016
* Includes full service branches, LPOs, and Wheatland Advisors, Inc.; ** Approved full service branches to begin construction in 2017-2018
1
14
9
6
4
#
#
Legend
Current Locations*
Proposed New Locations**
#
#

11 WWW.ORRSTOWN.COM
2016-2019 Execution of Strategic Plan: Drive Shareholder Value
• Continue core earnings improvement
• Balance sheet leverage
• Strategic growth of fee-based businesses
• Expense control
• Disciplined enterprise risk management
• Consideration of strategic bank and non-bank acquisitions
• Organic expansion to the East
• Technology leader in community bank space

12 WWW.ORRSTOWN.COM
2016 -2019: Strategic Investments in Customer-Facing Talent
2016 Hires
• Commercial Lending 9 new business bankers
• Orrstown Financial Advisors 4 new sales representatives
• Registered Investment Advisor Acquisition of Wheatland Advisors, Inc.
• Mortgage Lending 4 new mortgage lenders
• Cash Management 4 member team*
We are establishing Orrstown Bank as the employer of choice in the region
*Joined November 2015

13 WWW.ORRSTOWN.COM
Early Look – 2016 to 2019
2016 + Q1 2017 Results
• Continued strength in core markets
• Successful entrance into new markets
• Favor quality relationships vs. “deal flow”
• Focus on operating businesses with core deposits
• Cash management team execution
• Relationship banking strategy is working
• New teams began to make impact in second half of 2016
• Loan and deposit growth exceeded expectations
800,000
820,000
840,000
860,000
880,000
900,000
920,000
13.0%
2016
GROWTH
Q2 2016Q1 2016 Q3 2016 Q4 2016 Q1 2017
TOTAL LOANS
($000s)
1,040,000
1,060,000
1,080,000
1,100,000
1,120,000
1,140,000
1,160,000
1,180,000
1,200,000
11.7%
2016
GROWTH
Q2 2016Q1 2016 Q3 2016 Q4 2016 Q1 2017
TOTAL DEPOSITS
($000s)

14 WWW.ORRSTOWN.COM
Early Look – 2016 to 2019
2016 Results: Focus on noninterest income ($ in 000s): 2015 2016 Change
Orrstown Financial Advisors(1) $6,623 $7,024 +6.1%
Mortgage Banking Activities $2,747 $3,412 +24.2%
Service Charges on Deposit Accounts $5,226 $5,445 +4.2%
Total noninterest income before securities gains $17,254 $18,319 +6.2%
(1) Comprised of trust and investment management income and brokerage income; Wheatland Advisors acquisition had nominal impact as the acquisition occurred in December 2016; *Census Bureau; Millennials defined as born
between 1982 and 2000, currently ages 17-35. Surpassed Baby Boomers as largest group in US workforce in 2015; **includes mortgages and consumer loans
• Optimizing and monetizing digital channels : 83.1 million millennials in the U.S., more than ¼ of the total population and the largest group
in the work force*
• Digital consumer loan growth: 69 new customers and $7.6 million in new loans funded; complete sales cycle entirely online**
• Digital consumer deposit growth: 118 new customers and 308 new accounts
• State-of-the-art mobile banking applications
• E-bank established as standalone profit center

15 WWW.ORRSTOWN.COM
Year Ended ($ in 000s) 12/31/2011 12/31/2012 12/31/2013 12/31/2014 12/31/2015 12/31/2016
% Change
(2015-2016)
Total Assets $1,444,097 $1,232,668 $1,177,812 $1,190,443 $1,292,816 $1,414,504 9.4%
Total Loans $965,440 $703,739 $671,037 $704,946 $781,713 $883,391 13.0%
Total Deposits $1,216,902 $1,085,039 $1,000,390 $949,704 $1,032,167 $1,152,452 11.7%
Total Shareholders' Equity $128,197 $87,694 $91,439 $127,265 $133,061 $134,859 1.4%
Assets Under Management $947,273 $992,378 $1,085,216 $1,017,013 $966,362 $1,174,143 21.5%
Summary of Operations
Net Interest Income $49,607 $37,888 $32,087 $34,024 $34,334 $36,545 6.4%
Noninterest Income $26,620 $23,262 $17,808 $18,854 $19,178 $19,739 2.9%
Total Noninterest Expense $60,479 $43,349 $43,247 $43,768 $44,607 $48,140 7.9%
Net Income ($31,964) ($38,454) $10,004 $29,142 $7,874 $6,628
ROAA (%) (2.11) (2.84) 0.84 2.48 0.64 0.50
ROAE (%) (20.33) (35.22) 11.30 28.78 5.99 4.80
Asset Quality Ratios
NPAs/ Assets (%) 5.95 1.61 1.73 1.29 1.34 0.52
LLR/ Gross Loans (%) 4.53 3.29 3.12 2.09 1.74 1.45
Financial Recap: Year-Over-Year Results

16 WWW.ORRSTOWN.COM
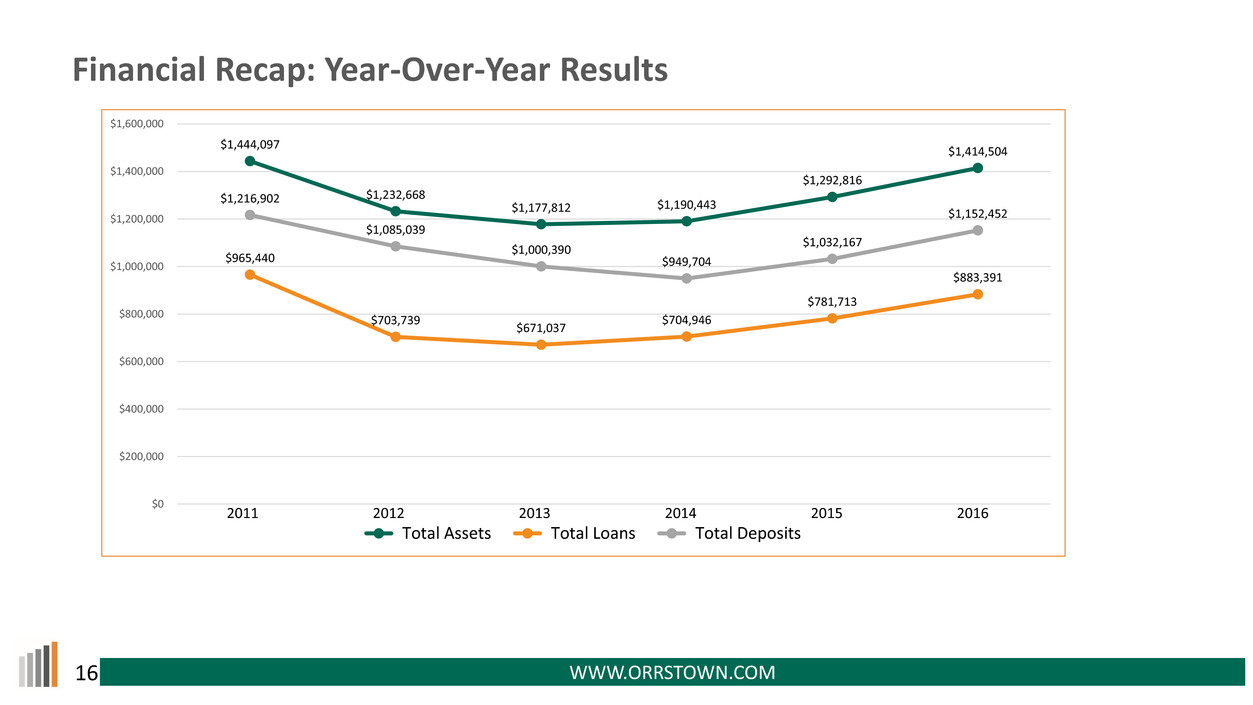
Financial Recap: Year-Over-Year Results
$1,444,097
$1,232,668
$1,177,812 $1,190,443
$1,292,816
$1,414,504
$965,440
$703,739
$671,037
$704,946
$781,713
$883,391
$1,216,902
$1,085,039
$1,000,390
$949,704
$1,032,167
$1,152,452
$0
$200,000
$400,000
$600,000
$800,000
$1,000,000
$1,200,000
$1,400,000
$1,600,000
Total Assets Total Loans Total Deposits
2011 2012 2013 2014 2015 2016

17 WWW.ORRSTOWN.COM
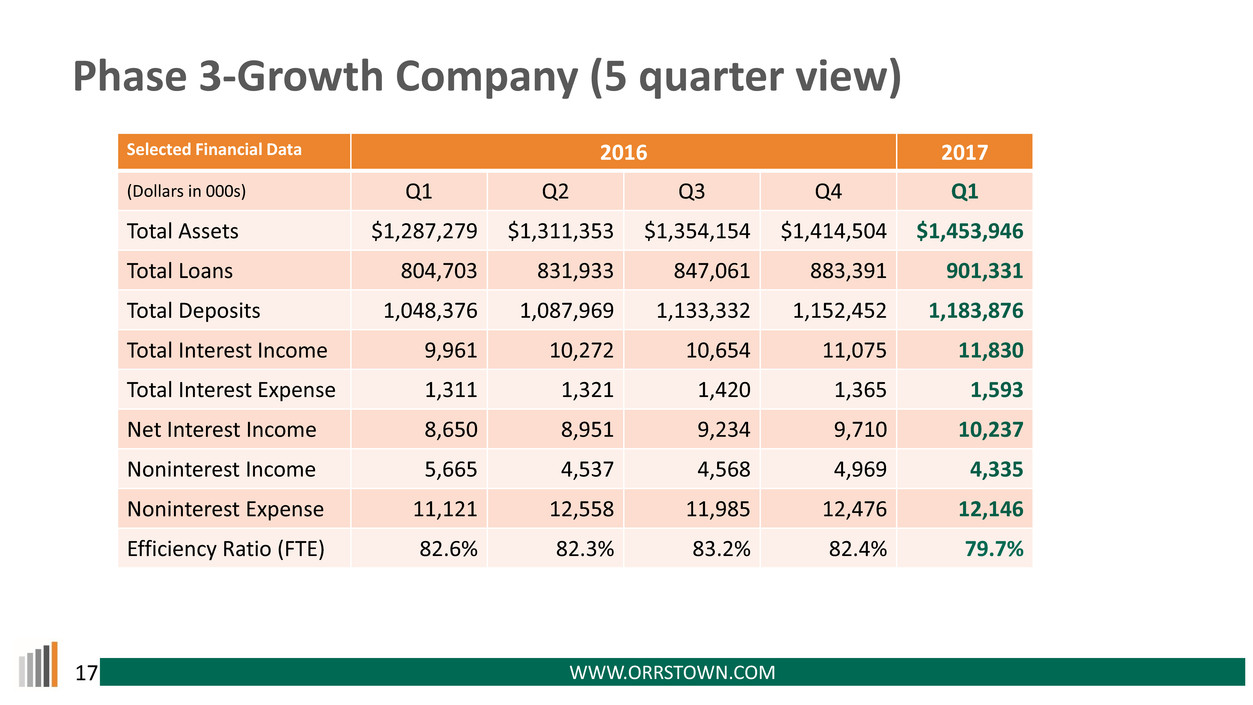
Phase 3-Growth Company (5 quarter view)
Selected Financial Data 2016 2017
(Dollars in 000s) Q1 Q2 Q3 Q4 Q1
Total Assets $1,287,279 $1,311,353 $1,354,154 $1,414,504 $1,453,946
Total Loans 804,703 831,933 847,061 883,391 901,331
Total Deposits 1,048,376 1,087,969 1,133,332 1,152,452 1,183,876
Total Interest Income 9,961 10,272 10,654 11,075 11,830
Total Interest Expense 1,311 1,321 1,420 1,365 1,593
Net Interest Income 8,650 8,951 9,234 9,710 10,237
Noninterest Income 5,665 4,537 4,568 4,969 4,335
Noninterest Expense 11,121 12,558 11,985 12,476 12,146
Efficiency Ratio (FTE) 82.6% 82.3% 83.2% 82.4% 79.7%

18 WWW.ORRSTOWN.COM
Consistent Upward Trend in Key Metrics
$1,287,279
$1,311,353
$1,354,154
$1,414,504
$1,453,946
$804,703
$831,933
$847,061
$883,391
$901,331
$1,048,376
$1,087,969
$1,133,332
$1,152,452
$1,183,876
$800,000
$900,000
$1,000,000
$1,100,000
$1,200,000
$1,300,000
$1,400,000
$1,500,000
Total Assets Total Loans Total Deposits
Q1 2016 Q2 2016 Q3 2016 Q4 2016 Q1 2017

19 WWW.ORRSTOWN.COM
Loan Composition
CRE: Owner-occupied
13%
CRE: Non-owner
occupied
36%
Acquisition &
Development
3%
Commercial &
Industrial
10%
Municipal
6%
Residential mortgage
31%
Installment and other
1%CRE: Owner-occupied
13%
CRE: Non-owner
occupied
30%
Acquisition &
Development
7%
Commercial &
Industrial
9%
Municipal
7%
Residential mortgage
33%
Installment and other
1%
2015 2016
Loan Composition at 12/31/2015 and 12/31/2016, respectively

20 WWW.ORRSTOWN.COM
Deposit Composition
2015 2016
Noninterest-bearing
13%
NOW and money
market
53%
Savings
8%
Time - less than
$100,000
17%
Time - greater than
$100,000
9%
Noninterest-bearing
13%
NOW and money
market
49%
Savings
8%
Time - less than
$100,000
18%
Time - greater than
$100,000
12%
(30% CD Funding) (26% CD Funding)
Deposit Composition at 12/31/2015 and 12/31/2016, respectively

21 WWW.ORRSTOWN.COM
Diversified and Growing Revenue Streams
Margin business revenue includes interest and fees on loans, interest and dividends on investment securities and short term investments; Deposits includes service charges on deposit accounts, other services
charges, commissions, and fees; Wealth Management/Trust includes trust and investment management income and brokerage income; Other includes earnings on life insurance, securities gains, and other income
2014 2015 2016
Other $3,362 $3,359 $2,864
Mortgage $2,207 $2,747 $3,412
Wealth Management/Trust $6,837 $6,623 $7,024
Deposits $6,448 $6,449 $6,439
Revenue-Margin Businesses $38,183 $38,635 $41,962
$0
$10,000
$20,000
$30,000
$40,000
$50,000
$60,000
$70,000
67%
MARGIN
BUSINESSES
REVENUE
67%
MARGIN
BUSINESSES
REVENUE
68%
MARGIN
BUSINESSES
REVENUE
33%
FEE INCOME
33%
FEE INCOME
32%
FEE INCOME

22 WWW.ORRSTOWN.COM
$43,349 $43,247 $43,768
$44,607
$48,140
$30,000
$35,000
$40,000
$45,000
$50,000
$55,000
$60,000
Noninterest Expense Review
2012 2013 2014 2015 2016
• 2015 and 2016 expenses influenced by increased costs related to litigation and
investment in growth of company (sales team and geographic expansion)*
• “core” noninterest expense relatively flat over past five years
*2015: $750,000 litigation and $75,000 growth related; 2016: $1.45 million litigation and $1.74 million growth related
$43,782
$44,951
(Dollars in 000s)

23 WWW.ORRSTOWN.COM
Regulatory Capital Ratios
8.1%
13.7%
15.0%
9.5%
15.6%
16.8%
9.8%
14.6%
15.8%
9.3%
13.3%
14.6%
0.0%
2.0%
4.0%
6.0%
8.0%
10.0%
12.0%
14.0%
16.0%
18.0%
Tier 1 Leverage Tier 1 Risk Based Total Risk Based
2013 2014 2015 2016

24 WWW.ORRSTOWN.COM
Looking Forward: Keys to Executing Plan and Improving Earnings
• Continue to take advantage of market disruption
• Use of technology to attract and retain customers
• Continue to leverage balance sheet and improve earnings through loan, deposit, and fee income growth
• Continue to focus on enterprise risk management
• Allow our investments in people, process, technology and new markets to mature

25 WWW.ORRSTOWN.COM
Why Invest in Orrstown Financial Services, Inc.
• Successful turnaround by current management team
• Invested and stable leadership
• Already invested for the future: enterprise risk management, technology, infrastructure
• New entry into attractive markets with continuing disruption
• Diverse earnings stream: Commercial, Retail, Mortgage, Trust & Wealth Management
• Capital available for growth, acquisitions, dividends
• Strategic M&A can generate meaningful up-side
• Early stage of successfully executing our strategic plan

26
Investor Presentation: Driving Shareholder Value
May 2017
NASDAQ: ORRF
5/17f
